Q3FY22 - Motherson Sumi Systems Limited
27
Motherson Sumi Systems Limited Head Office: C-14 A & B, Sector 1, Noida – 201301 Distt. Gautam Budh Nagar, U.P. India Tel: +91-120-6752100, 6752278, Fax: +91-120-2521866, 2521966, Website: www.motherson.com Regd Office: Unit – 705, C Wing, ONE BKC G Block Bandra Kurla Complex Bandra East Mumbai – 400051 Maharashtra (India) Email: [email protected] CIN No.: L34300MH1986PLC284510 February 11, 2022 National Stock Exchange of India Limited Exchange Plaza, 5 th Floor Plot No.C/1, G-Block Bandra-Kurla Complex Bandra (E) MUMBAI – 400051, India BSE Limited 1 st Floor, New Trading Ring Rotunda Building P.J. Towers, Dalal Street Fort MUMBAI – 400001, India Scrip Code : MOTHERSUMI Scrip Code : 517334 Ref. : Unaudited Financial Results for the third quarter and nine months ended December 31, 2021 Dear Sir(s) / Madam(s), The Board of Directors of the Company in its meeting held on Friday, February 11, 2022, inter-alia, have discussed and approved unaudited Standalone and Consolidated Financial Results of the Company for the third quarter and nine months ended December 31, 2021. Pursuant to Regulation 33 and Regulation 52 of SEBI (Listing Obligations and Disclosure Requirements) Regulations, 2015, please find enclosed the following: 1. Unaudited Standalone and Consolidated Financial Results for the third quarter and nine months ended December 31, 2021; 2. Limited Review Reports on the Standalone and Consolidated Financial Results for the third quarter and nine months ended December 31, 2021; 3. Presentation on the performance of the Company for the third quarter and nine months ended December 31, 2021; and 4. Copy of the Press Release issued by the Company. The Board Meeting of the Company commenced at 1000 hours and concluded at 1205 hours. The results will be uploaded on Company’s website at www.motherson.com in compliance with Regulation 46(2)(l)(ii) and will be published in the newspapers in terms of Regulation 47(1)(b) of SEBI (Listing Obligations and Disclosure Requirements) Regulations, 2015. The above is for your information and records. Thanking you, Yours truly, For Motherson Sumi Systems Limited Alok Goel Company Secretary Encl(s). : As above
-
Upload
khangminh22 -
Category
Documents
-
view
1 -
download
0
Transcript of Q3FY22 - Motherson Sumi Systems Limited
Motherson Sumi Systems Limited Head Office: C-14 A & B, Sector 1, Noida – 201301 Distt. Gautam Budh Nagar, U.P. India Tel: +91-120-6752100, 6752278, Fax: +91-120-2521866, 2521966, Website: www.motherson.com
Regd Office: Unit – 705, C Wing, ONE BKC G Block Bandra Kurla Complex Bandra East Mumbai – 400051 Maharashtra (India) Email: [email protected] CIN No.: L34300MH1986PLC284510
February 11, 2022 National Stock Exchange of India Limited Exchange Plaza, 5th Floor Plot No.C/1, G-Block Bandra-Kurla Complex Bandra (E) MUMBAI – 400051, India
BSE Limited 1st Floor, New Trading Ring Rotunda Building P.J. Towers, Dalal Street Fort MUMBAI – 400001, India
Scrip Code : MOTHERSUMI Scrip Code : 517334
Ref. : Unaudited Financial Results for the third quarter and nine months ended December 31, 2021
Dear Sir(s) / Madam(s),
The Board of Directors of the Company in its meeting held on Friday, February 11, 2022, inter-alia, have discussed and approved unaudited Standalone and Consolidated Financial Results of the Company for the third quarter and nine months ended December 31, 2021. Pursuant to Regulation 33 and Regulation 52 of SEBI (Listing Obligations and Disclosure Requirements) Regulations, 2015, please find enclosed the following:
1. Unaudited Standalone and Consolidated Financial Results for the third quarter and nine months ended
December 31, 2021;
2. Limited Review Reports on the Standalone and Consolidated Financial Results for the third quarter and nine months ended December 31, 2021;
3. Presentation on the performance of the Company for the third quarter and nine months ended December
31, 2021; and 4. Copy of the Press Release issued by the Company.
The Board Meeting of the Company commenced at 1000 hours and concluded at 1205 hours. The results will be uploaded on Company’s website at www.motherson.com in compliance with Regulation 46(2)(l)(ii) and will be published in the newspapers in terms of Regulation 47(1)(b) of SEBI (Listing Obligations and Disclosure Requirements) Regulations, 2015. The above is for your information and records. Thanking you, Yours truly, For Motherson Sumi Systems Limited
Alok Goel Company Secretary Encl(s). : As above
Motherson Sumi Systems Ltd. (MSSL) Financial PerformanceQ3 FY 2021-22
Proud to be part of.
• Key Highlights• Results Q2 FY22 vs Q3 FY22• Appendix-
• Proforma Financials Combined Entity & MSWIL
33
Key Highlights.
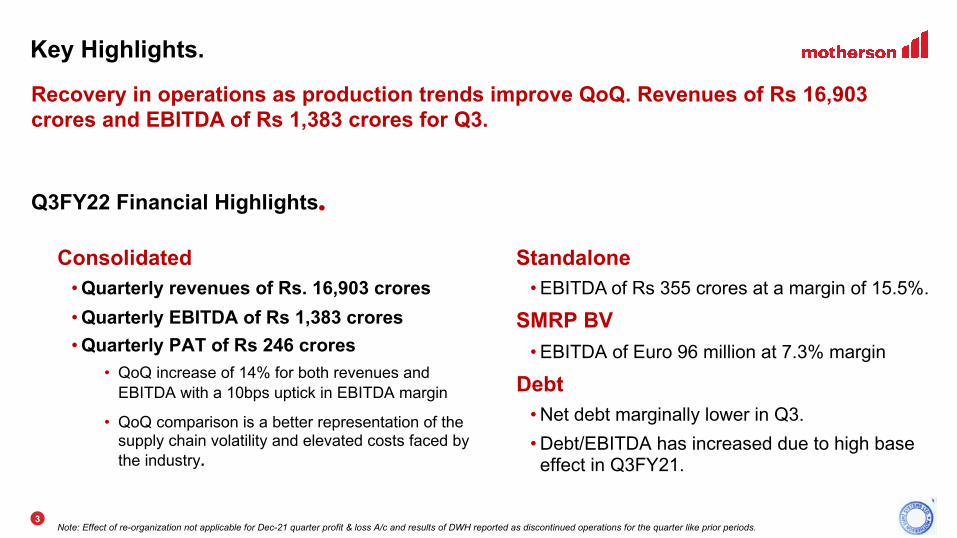
Consolidated• Quarterly revenues of Rs. 16,903 crores• Quarterly EBITDA of Rs 1,383 crores • Quarterly PAT of Rs 246 crores
• QoQ increase of 14% for both revenues and EBITDA with a 10bps uptick in EBITDA margin
• QoQ comparison is a better representation of the supply chain volatility and elevated costs faced by the industry.
Recovery in operations as production trends improve QoQ. Revenues of Rs 16,903 crores and EBITDA of Rs 1,383 crores for Q3.
Note: Effect of re-organization not applicable for Dec-21 quarter profit & loss A/c and results of DWH reported as discontinued operations for the quarter like prior periods.
Q3FY22 Financial Highlights.
Standalone • EBITDA of Rs 355 crores at a margin of 15.5%.
SMRP BV • EBITDA of Euro 96 million at 7.3% margin
Debt • Net debt marginally lower in Q3. • Debt/EBITDA has increased due to high base effect in Q3FY21.

44
Achieved key milestones for Motherson 2.0 with EPS accretion.
23rd December, 2021
Receipt of final NCLT approval
19th January, 2022
Allotment date of MSWIL shares to MSSL shareholders
28th January, 2022
Allotment of shares in exchange to SAMIL shareholders
March2022
Expected listing of MSWIL on stock exchanges
Important milestones for Re-organisation
Note: The final NCLT approval was received towards end Dec- 21. The segment assets and liabilities have been reported after the effect of the scheme. However, this has no impact on the on profit & loss A/c for the quarter.
Proforma Financials (Q3FY22)
Samvardhana Motherson International Limited (SAMIL) (Combined entity post re-organisation)
Motherson Sumi Wiring India Limited (MSWIL)
• Revenue is INR 16,435 crores,
• EBITDA is INR 1,232 crores,
• PAT is INR 227 crores
Achieved 9% EPS accretion for 9MFY22 at SAMIL
14% QoQ14% QoQ
61% QoQ
• Revenue is INR 1,460 crores,
• EBITDA is INR 208 crores,
• PAT is INR 132 crores
4% QoQ12% QoQ
16% QoQ
MSWIL - Note: Proforma numbers of MSWIL give effect of the lease rentals and management fees. SAMIL – Note: Proforma financials of SAMIL post re-organization have been prepared using historical costs. Please see note 9 on page 19 regarding accounting treatment of purchase price allocation of merger.
Note: Change of name from Motherson Sumi Systems Ltd (MSSL) to Samvardhana Motherson International Limited (SAMIL) is in process.
55
Business Highlights.
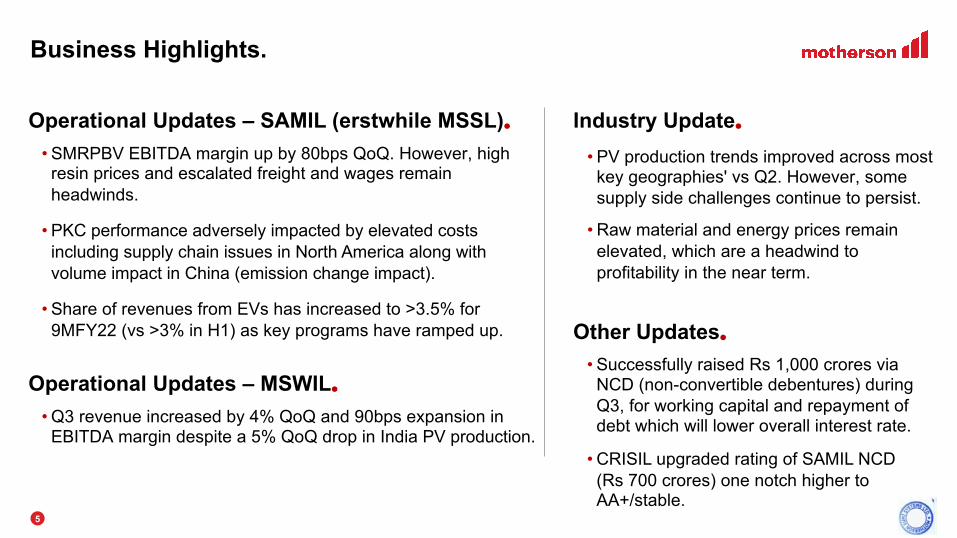
• Successfully raised Rs 1,000 crores via NCD (non-convertible debentures) during Q3, for working capital and repayment of debt which will lower overall interest rate.
• CRISIL upgraded rating of SAMIL NCD (Rs 700 crores) one notch higher to AA+/stable.
• SMRPBV EBITDA margin up by 80bps QoQ. However, high resin prices and escalated freight and wages remain headwinds.
• PKC performance adversely impacted by elevated costs including supply chain issues in North America along with volume impact in China (emission change impact).
• Share of revenues from EVs has increased to >3.5% for 9MFY22 (vs >3% in H1) as key programs have ramped up.
• PV production trends improved across most key geographies' vs Q2. However, some supply side challenges continue to persist.
• Raw material and energy prices remain elevated, which are a headwind to profitability in the near term.
Operational Updates – SAMIL (erstwhile MSSL).
Other Updates.
Industry Update.
• Q3 revenue increased by 4% QoQ and 90bps expansion in EBITDA margin despite a 5% QoQ drop in India PV production.
Operational Updates – MSWIL.
66
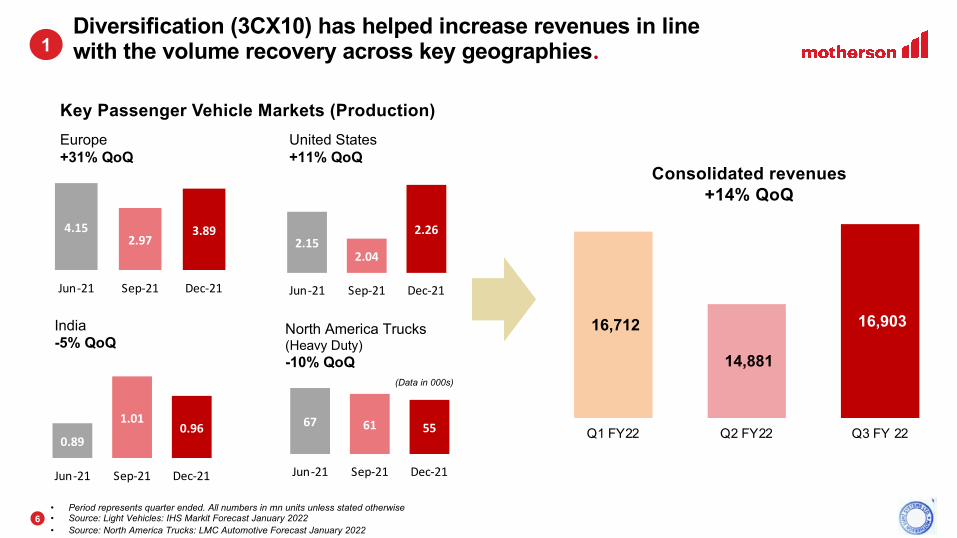
4.152.97
3.89
Jun-21 Sep-21 Dec-21
2.152.04
2.26
Jun-21 Sep-21 Dec-21
Europe +31% QoQ
United States +11% QoQ
North America Trucks (Heavy Duty)-10% QoQ
• Period represents quarter ended. All numbers in mn units unless stated otherwise• Source: Light Vehicles: IHS Markit Forecast January 2022• Source: North America Trucks: LMC Automotive Forecast January 2022
Key Passenger Vehicle Markets (Production)
0.89
1.010.96
Jun-21 Sep-21 Dec-21
India-5% QoQ
16,712
14,881
16,903
Q1 FY22 Q2 FY22 Q3 FY 22
Consolidated revenues+14% QoQ
67 61 55
Jun-21 Sep-21 Dec-21
(Data in 000s)
Diversification (3CX10) has helped increase revenues in line with the volume recovery across key geographies.1
77
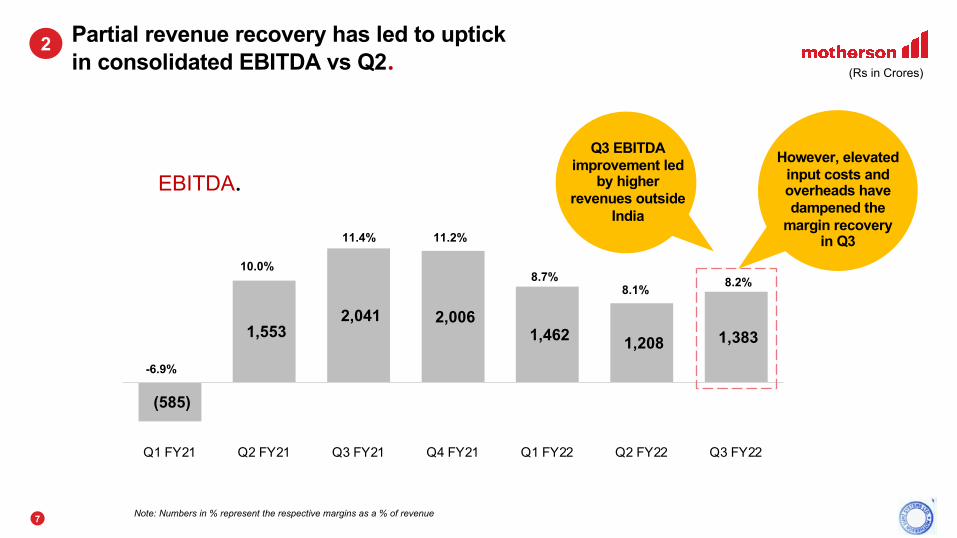
(585)
1,553 2,041 2,006
1,462 1,208 1,383
-6.9%
10.0%
11.4% 11.2%
8.7%8.1% 8.2%
(0)
0
0
0
0
0
1
Q1 FY21 Q2 FY21 Q3 FY21 Q4 FY21 Q1 FY22 Q2 FY22 Q3 FY22
Partial revenue recovery has led to uptick in consolidated EBITDA vs Q2.
EBITDA.
2
Note: Numbers in % represent the respective margins as a % of revenue
(Rs in Crores)
Q3 EBITDA improvement led
by higher revenues outside
India
However, elevated input costs and overheads have dampened the
margin recovery in Q3

88
€ 11 € 9
3.9% 3.1%
Q2 FY 2021-22 Q3 FY 2021-22
€ 283 € 2934%
€ 0Q2 FY 2021-22 Q3 FY 2021-22
Sequential improvement across most businesses in Q3.
Standalone (Rs in Crores) SMRP BV (In Million Euros) PKC (In Million Euros)Consolidated (Rs in Crores)
Revenue.
EBITDA.
1,208 1,383
8.1%8.2%
Q2 FY 2021-22 Q3 FY 2021-22
Standalone (Rs in Crores) SMRP BV (In Million Euros) PKC (In Million Euros)Consolidated (Rs in Crores)
2,207 2,2944%
Q2 FY 2021-22 Q3 FY 2021-22
€ 71 € 96
6.5%7.3%
-35%- 40.0 %
- 35.0 %
- 30.0 %
- 25.0 %
- 20.0 %
- 15.0 %
- 10.0 %
- 5.0%
0. 0%
5. 0%
10. 0%
Q2 FY 2021-22 Q3 FY 2021-22
332 355
15.0% 15.5%
Q2 FY 2021-22 Q3 FY 2021-22
20%€ 1,089€ 1,311
Q2 FY 2021-22 Q3 FY 2021-22
14,88116,903
14%
Q2 FY 2021-22 Q3 FY 2021-22
Note: Consolidated and standalone numbers are pre re-organization for a like-for-like comparison
3

99
Leverage levels remain under control in Q3.4
• Debt as of end of period mentioned. Debt to EBITDA ratio calculation includes lease liabilities. Finance lease liabilities is classified as lease liabilities• Dividend of Rs 1.5 per share for FY21 was paid in Sep -21, which is also reflected in the closing debt levels above. • Dec-21 is excluding the impact of SAMIL merger and MSWIL de-merger to provide a like for like comparison. Total reported debt as of Dec-21 end is Rs 8,739 crores and lease liability of
Rs 1,292 crores.
Debt levels for Dec-21 exclude
SAMIL merger for a like-for-like comparison.
Net Debt to EBITDA (LTM)
due to higher base effect of
Q3FY21
(Rs in Crores)
8,768 7,496
4,807 6,158
7,627 7,255
1,251 1,341
1,281 1,306
1,270 1,199
1.8
1.5
1.21.1
1.3 1.4
0. 0
0. 2
0. 4
0. 6
0. 8
1. 0
1. 2
1. 4
1. 6
1. 8
-
2,000
4,000
6,000
8,000
10,000
12,000
14,000
Sep-19 Sep-20 Mar-21 Jun-21 Sep-21 Dec-21*
Net Debt Lease liability Debt to EBITDA
• Key Highlights
• Results Q2 FY22 vs Q3 FY22
• Appendix-• Proforma Financials Combined
Entity & MSWIL
1111
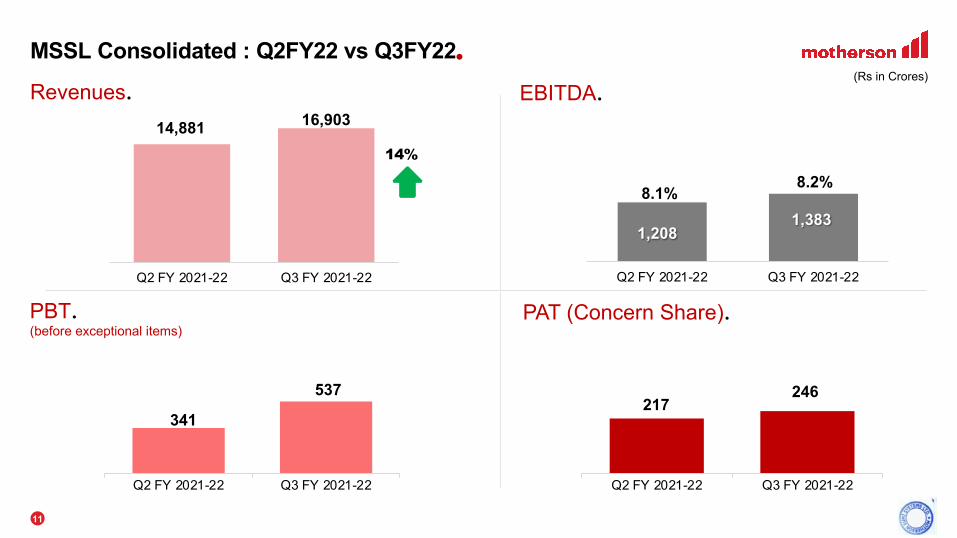
MSSL Consolidated : Q2FY22 vs Q3FY22.
Revenues.14,881 16,903
14%
Q2 FY 2021-22 Q3 FY 2021-22
1,208 1,383
8.1%8.2%
Q2 FY 2021-22 Q3 FY 2021-22
PBT.(before exceptional items)
(Rs in Crores)EBITDA.
PAT (Concern Share).
341
537
Q2 FY 2021-22 Q3 FY 2021-22
217 246
Q2 FY 2021-22 Q3 FY 2021-22
1212
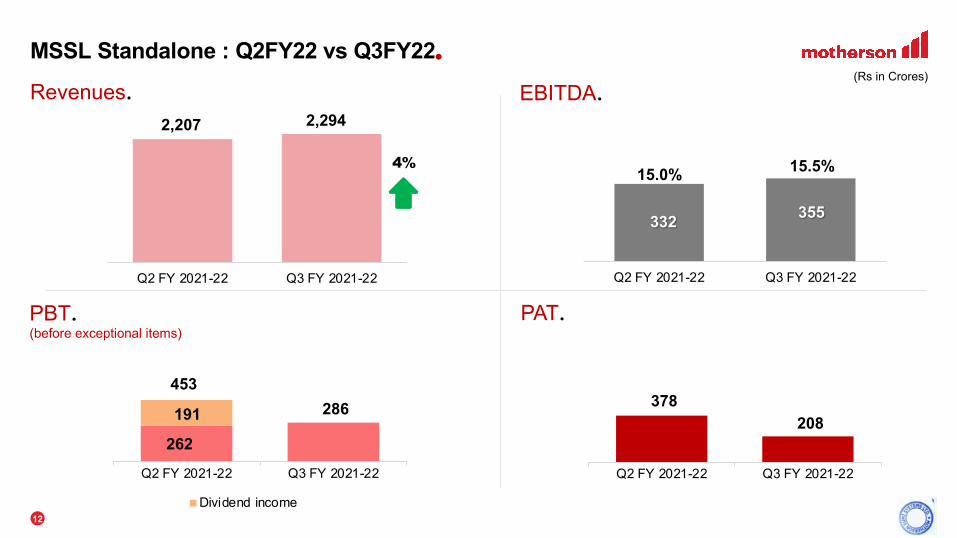
MSSL Standalone : Q2FY22 vs Q3FY22.
Revenues.2,207 2,294
4%
Q2 FY 2021-22 Q3 FY 2021-22
332 355
15.0% 15.5%
Q2 FY 2021-22 Q3 FY 2021-22
PAT.
(Rs in Crores)EBITDA.
PBT.(before exceptional items)
378
378 208
45%
Q2 FY 2021-22 Q3 FY 2021-22
262
286 191 -453 37%
Q2 FY 2021-22 Q3 FY 2021-22
Dividend income
1313
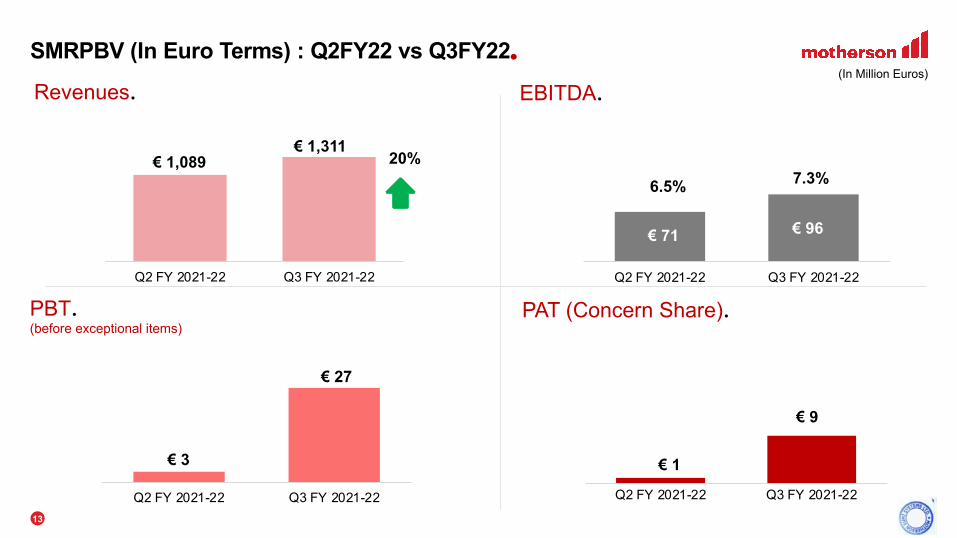
SMRPBV (In Euro Terms) : Q2FY22 vs Q3FY22.
Revenues. EBITDA.
€ 71 € 96
6.5% 7.3%
35%
0. 0%
5. 0%
10. 0%
15. 0%
20. 0%
25. 0%
30. 0%
35. 0%
40. 0%
Q2 FY 2021-22 Q3 FY 2021-22
(In Million Euros)
PAT (Concern Share).
€ 3
€ 27
Q2 FY 2021-22 Q3 FY 2021-22
€ 1
€ 9
Q2 FY 2021-22 Q3 FY 2021-22
PBT.(before exceptional items)
20%€ 1,089€ 1,311
Q2 FY 2021-22 Q3 FY 2021-22
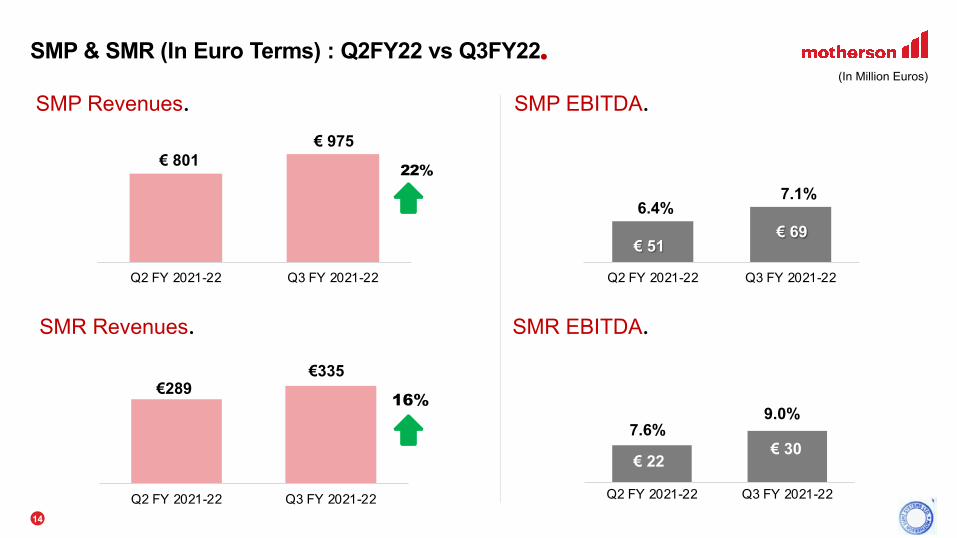
1414
SMP Revenues.
SMP & SMR (In Euro Terms) : Q2FY22 vs Q3FY22.(In Million Euros)
22%€ 801 € 975
Q2 FY 2021-22 Q3 FY 2021-22
€ 51 € 69
6.4%7.1%
Q2 FY 2021-22 Q3 FY 2021-22
SMP EBITDA.
SMR Revenues. SMR EBITDA.
€ 22 € 30
7.6%9.0%
- 39.0 %- 38.0 %- 37.0 %- 36.0 %- 35.0 %- 34.0 %- 33.0 %- 32.0 %- 31.0 %- 30.0 %- 29.0 %- 28.0 %- 27.0 %- 26.0 %- 25.0 %- 24.0 %- 23.0 %- 22.0 %- 21.0 %- 20.0 %- 19.0 %- 18.0 %- 17.0 %- 16.0 %- 15.0 %- 14.0 %- 13.0 %- 12.0 %- 11.0 %- 10.0 %- 9.0%- 8.0%- 7.0%- 6.0%- 5.0%- 4.0%- 3.0%- 2.0%- 1.0%0. 0%1. 0%2. 0%3. 0%4. 0%5. 0%6. 0%7. 0%8. 0%9. 0%10. 0%11. 0%12. 0%
Q2 FY 2021-22 Q3 FY 2021-22
€289€335
16%
Q2 FY 2021-22 Q3 FY 2021-22
16%

1515
PKC (In Euro Terms) : Q2FY22 vs Q3FY22.
Revenues. EBITDA.
€ 283 € 2934%
Q2 FY 2021-22 Q3 FY 2021-22
(In Million Euros)
(€ 5) (€ 4)
20%
Q2 FY 2021-22 Q3 FY 2021-22
PAT (Concern Share).PBT.
(€ 3) (€ 4)100%
Q2 FY 2021-22 Q3 FY 2021-22
€ 11 € 9
3.9%3.1%
286%
Q2 FY 2021-22 Q3 FY 2021-22
1616
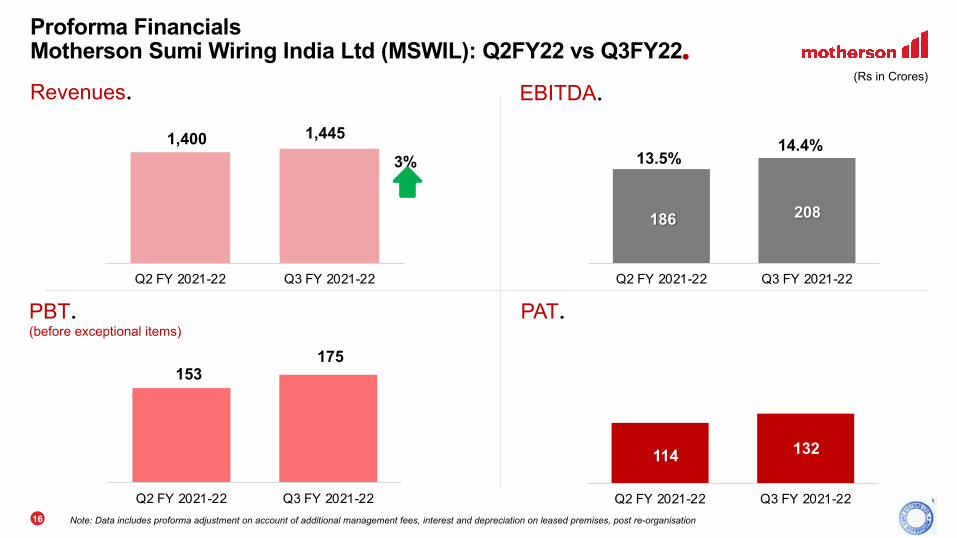
114 132
-
50
10 0
15 0
20 0
25 0
30 0
Q2 FY 2021-22 Q3 FY 2021-22
Proforma Financials Motherson Sumi Wiring India Ltd (MSWIL): Q2FY22 vs Q3FY22.
Revenues.
1,400 1,445
3%
Q2 FY 2021-22 Q3 FY 2021-22
PAT.
(Rs in Crores)EBITDA.
153 175
- 50 100 150 200 250 300
Q2 FY 2021-22 Q3 FY 2021-22
186 208
13.5%14.4%
Q2 FY 2021-22 Q3 FY 2021-22
Note: Data includes proforma adjustment on account of additional management fees, interest and depreciation on leased premises, post re-organisation
PBT.(before exceptional items)
1717
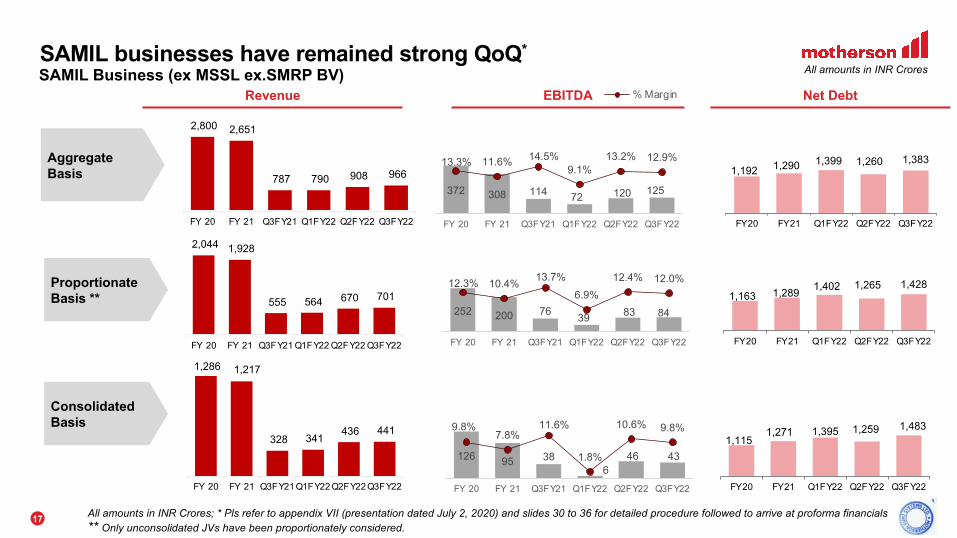
SAMIL businesses have remained strong QoQ* 3
Aggregate Basis
Proportionate Basis **
Consolidated Basis
2,800 2,651
787 790 908 966
FY 20 FY 21 Q3FY21 Q1FY22 Q2FY22 Q3FY22
All amounts in INR Crores; * Pls refer to appendix VII (presentation dated July 2, 2020) and slides 30 to 36 for detailed procedure followed to arrive at proforma financials** Only unconsolidated JVs have been proportionately considered.
1,192 1,290 1,399 1,260 1,383
FY20 FY21 Q1FY22 Q2FY22 Q3FY22
1,163 1,289 1,402 1,265 1,428
FY20 FY21 Q1FY22 Q2FY22 Q3FY22
1,1151,271 1,395 1,259 1,483
FY20 FY21 Q1FY22 Q2FY22 Q3FY22
1,286 1,217
328 341 436 441
FY 20 FY 21 Q3FY21 Q1FY22 Q2FY22 Q3FY22
Revenue Net Debt
All amounts in INR CroresSAMIL Business (ex MSSL ex.SMRP BV)
372 308 114 72 120 125
13.3% 11.6% 14.5%9.1%
13.2% 12.9%
0. 0%
2. 0%
4. 0%
6. 0%
8. 0%
10. 0%
12. 0%
14. 0%
16. 0%
0
50
100
150
200
250
300
350
400
FY 20 FY 21 Q3FY21 Q1FY22 Q2FY22 Q3FY22
13.3%11.6%
13.2%
9.1%
14.1%
0. 0%
2. 0%
4. 0%
6. 0%
8. 0%
10. 0%
12. 0%
14. 0%
16. 0%
0
50
100
150
200
250
300
350
400
FY 20 FY 21 Q2FY21 Q1FY22 Q2FY22
EBITDA % MarginEBITDA
252 200 76 39 83 84
12.3% 10.4% 13.7%6.9%
12.4% 12.0%
0. 0%
2. 0%
4. 0%
6. 0%
8. 0%
10. 0%
12. 0%
14. 0%
16. 0%
0
50
100
150
200
250
300
FY 20 FY 21 Q3FY21 Q1FY22 Q2FY22 Q3FY22
126 95 386
46 43
9.8%7.8%
11.6%
1.8%
10.6% 9.8%
0. 0%
2. 0%
4. 0%
6. 0%
8. 0%
10. 0%
12. 0%
14. 0%
0
20
40
60
80
100
120
140
FY 20 FY 21 Q3FY21 Q1FY22 Q2FY22 Q3FY22
2,044 1,928
555 564 670 701
FY 20 FY 21 Q3FY21 Q1FY22 Q2FY22 Q3FY22
1818
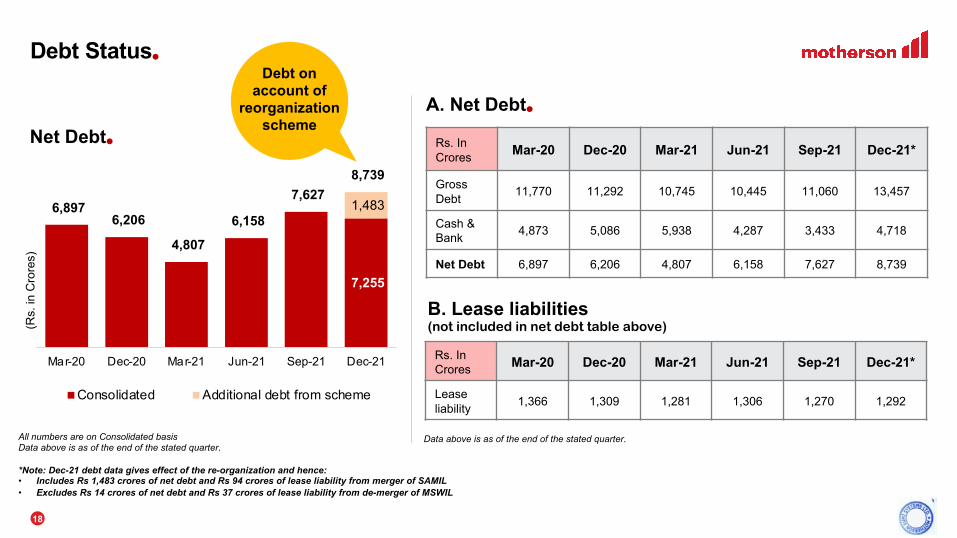
Debt Status.
Rs. In Crores Mar-20 Dec-20 Mar-21 Jun-21 Sep-21 Dec-21*
Gross Debt 11,770 11,292 10,745 10,445 11,060 13,457
Cash & Bank 4,873 5,086 5,938 4,287 3,433 4,718
Net Debt 6,897 6,206 4,807 6,158 7,627 8,739
(Rs.
in C
rore
s)
B. Lease liabilities(not included in net debt table above)
Rs. In Crores Mar-20 Dec-20 Mar-21 Jun-21 Sep-21 Dec-21*
Lease liability 1,366 1,309 1,281 1,306 1,270 1,292
7,255
--
-
--
1,483 6,897 6,206
4,807
6,158
7,627 8,739
Mar-20 Dec-20 Mar-21 Jun-21 Sep-21 Dec-21
Consolidated Additional debt from scheme
All numbers are on Consolidated basisData above is as of the end of the stated quarter.
*Note: Dec-21 debt data gives effect of the re-organization and hence:• Includes Rs 1,483 crores of net debt and Rs 94 crores of lease liability from merger of SAMIL• Excludes Rs 14 crores of net debt and Rs 37 crores of lease liability from de-merger of MSWIL
A. Net Debt.Net Debt.
Data above is as of the end of the stated quarter.
Debt on account of
reorganization scheme
1919
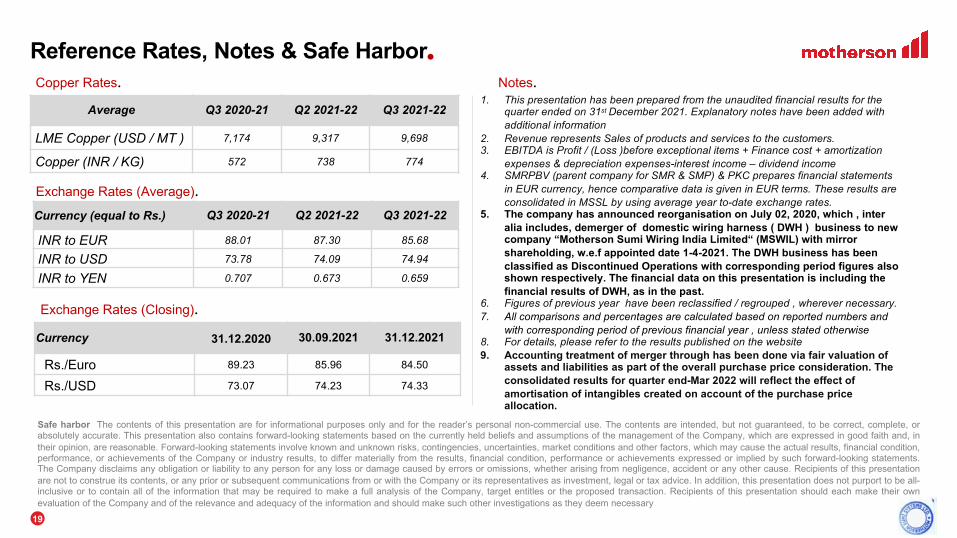
Reference Rates, Notes & Safe Harbor.Copper Rates.
Average Q3 2020-21 Q2 2021-22 Q3 2021-22
LME Copper (USD / MT ) 7,174 9,317 9,698
Copper (INR / KG) 572 738 774
Exchange Rates (Average).
Currency (equal to Rs.) Q3 2020-21 Q2 2021-22 Q3 2021-22
INR to EUR 88.01 87.30 85.68
INR to USD 73.78 74.09 74.94
INR to YEN 0.707 0.673 0.659
Notes.
Exchange Rates (Closing).
Currency 31.12.2020 30.09.2021 31.12.2021
Rs./Euro 89.23 85.96 84.50
Rs./USD 73.07 74.23 74.33
1. This presentation has been prepared from the unaudited financial results for the quarter ended on 31st December 2021. Explanatory notes have been added with additional information
2. Revenue represents Sales of products and services to the customers.3. EBITDA is Profit / (Loss )before exceptional items + Finance cost + amortization
expenses & depreciation expenses-interest income – dividend income4. SMRPBV (parent company for SMR & SMP) & PKC prepares financial statements
in EUR currency, hence comparative data is given in EUR terms. These results are consolidated in MSSL by using average year to-date exchange rates.
5. The company has announced reorganisation on July 02, 2020, which , inter alia includes, demerger of domestic wiring harness ( DWH ) business to new company “Motherson Sumi Wiring India Limited“ (MSWIL) with mirror shareholding, w.e.f appointed date 1-4-2021. The DWH business has been classified as Discontinued Operations with corresponding period figures also shown respectively. The financial data on this presentation is including the financial results of DWH, as in the past.
6. Figures of previous year have been reclassified / regrouped , wherever necessary.7. All comparisons and percentages are calculated based on reported numbers and
with corresponding period of previous financial year , unless stated otherwise8. For details, please refer to the results published on the website9. Accounting treatment of merger through has been done via fair valuation of
assets and liabilities as part of the overall purchase price consideration. The consolidated results for quarter end-Mar 2022 will reflect the effect of amortisation of intangibles created on account of the purchase price allocation.
Safe harbor The contents of this presentation are for informational purposes only and for the reader’s personal non-commercial use. The contents are intended, but not guaranteed, to be correct, complete, orabsolutely accurate. This presentation also contains forward-looking statements based on the currently held beliefs and assumptions of the management of the Company, which are expressed in good faith and, intheir opinion, are reasonable. Forward-looking statements involve known and unknown risks, contingencies, uncertainties, market conditions and other factors, which may cause the actual results, financial condition,performance, or achievements of the Company or industry results, to differ materially from the results, financial condition, performance or achievements expressed or implied by such forward-looking statements.The Company disclaims any obligation or liability to any person for any loss or damage caused by errors or omissions, whether arising from negligence, accident or any other cause. Recipients of this presentationare not to construe its contents, or any prior or subsequent communications from or with the Company or its representatives as investment, legal or tax advice. In addition, this presentation does not purport to be all-inclusive or to contain all of the information that may be required to make a full analysis of the Company, target entitles or the proposed transaction. Recipients of this presentation should each make their ownevaluation of the Company and of the relevance and adequacy of the information and should make such other investigations as they deem necessary

• Key Highlights• Results Q2 FY22 vs Q3 FY22
• Appendix-• Proforma Financials
Combined Entity & MSWIL

2121
Proforma Financials Combined Entity (SAMIL) - Summary(Erstwhile Motherson Sumi Systems Ltd.)
(Rs in Crores)
Financials FY21 Q1 FY22 Q2 FY22 Q3 FY22 9M FY22Revenue from operation 58,225 16,408 14,415 16,435 47,258EBITDA 4,688 1,367 1,082 1,232 3,681
EBITDA Margin (%) 8.1% 8.3% 7.5% 7.5% 7.8%EBIT 1,662 589 318 472 1,379
EBIT Margin (%) 2.9% 3.6% 2.2% 2.9% 2.9%Profit of associates 226 57 73 56 186Less: Minority Interest -270 -64 -10 -64 -138PAT (concern share) 1,059 314 141 227 683
PAT Margin (%) 1.8% 1.9% 1.0% 1.4% 1.4%Gross Debt (excl. lease liability) 12,246 12,003 12,591 13,457 13,457Cash 6,219 4,529 3,797 4,718 4,718Net Debt 6,027 7,474 8,794 8,739 8,739
Lease liability (under Ind AS116) 1,376 1,395 1,356 1,292 1,292
1
2222
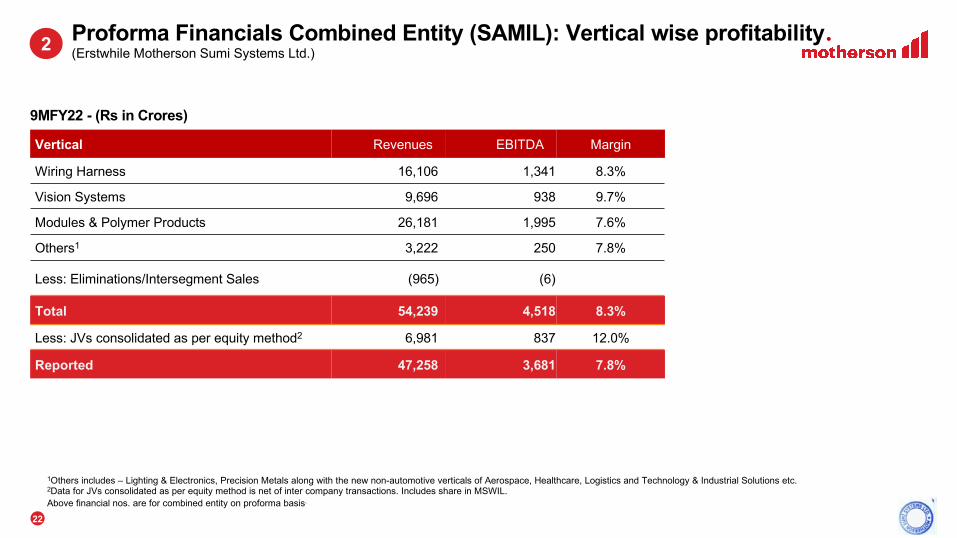
Proforma Financials Combined Entity (SAMIL): Vertical wise profitability.(Erstwhile Motherson Sumi Systems Ltd.)
Vertical Revenues EBITDA Margin
Wiring Harness 16,106 1,341 8.3%
Vision Systems 9,696 938 9.7%
Modules & Polymer Products 26,181 1,995 7.6%
Others1 3,222 250 7.8%
Less: Eliminations/Intersegment Sales (965) (6)
Total 54,239 4,518 8.3%
Less: JVs consolidated as per equity method2 6,981 837 12.0%
Reported 47,258 3,681 7.8%
9MFY22 - (Rs in Crores)
1Others includes – Lighting & Electronics, Precision Metals along with the new non-automotive verticals of Aerospace, Healthcare, Logistics and Technology & Industrial Solutions etc.2Data for JVs consolidated as per equity method is net of inter company transactions. Includes share in MSWIL. Above financial nos. are for combined entity on proforma basis.
2

2323
1,489 1,904 1,795
1,367 1,082 1,232
9.8%11.0% 10.4%
8.3%7.5% 7.5%
(0)
0
0
0
0
0
1
Q2 FY21 Q3 FY21 Q4 FY21 Q1 FY22 Q2 FY22 Q3 FY22
Proforma Financials Combined Entity (SAMIL): Quarterly EBITDA trend.(Erstwhile Motherson Sumi Systems Ltd.)
EBITDA.
Note: Numbers in % represent the respective margins as a % of revenue
(Rs in Crores)
EBITDA improvement in Q3 led by higher
revenues outside India
However, elevated input
prices and overheads have dampened the
margin recoveryin Q3
3

2424
Proforma Financials Combined Entity (SAMIL): Quarterly leverage levels.(Erstwhile Motherson Sumi Systems Ltd.)
• Debt as of end of period mentioned. Debt to EBITDA ratio calculation includes lease liabilities. Finance lease liabilities is classified as lease liabilities
(Rs in Crores)
9,293 8,001
6,027 7,474
8,794 8,739
1,422 1,440
1,376
1,395 1,356 1,292
2.0 1.9
1.6
1.4
1.71.8
0. 0
0. 5
1. 0
1. 5
2. 0
-
2,000
4,000
6,000
8,000
10,000
12,000
14,000
Mar-19 Mar-20 Mar-21 Jun-21 Sep-21 Dec-21
Net Debt Lease liability Debt to EBITDA
4
Higher Net Debt
to EBITDA (LTM) due to high base
effect in Q3FY21
2525
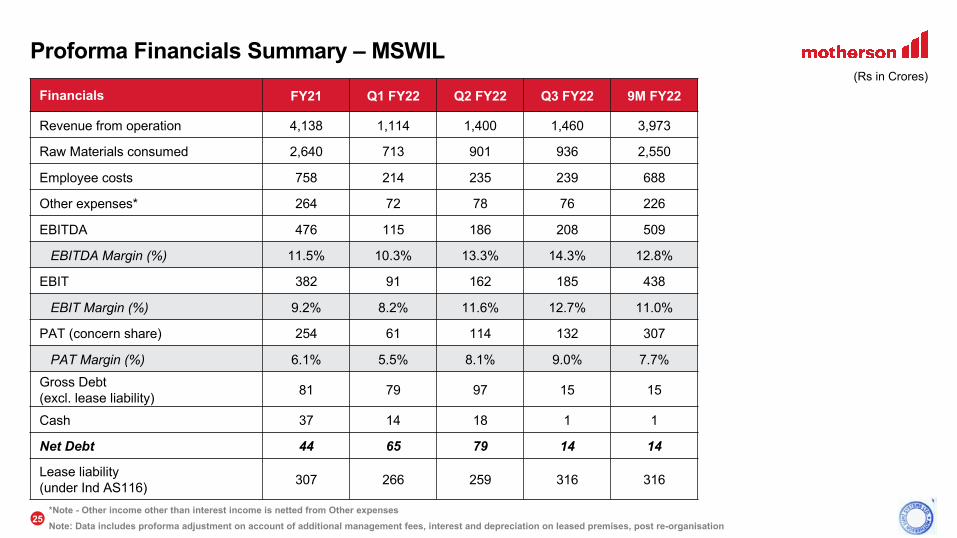
Proforma Financials Summary – MSWIL
*Note - Other income other than interest income is netted from Other expensesNote: Data includes proforma adjustment on account of additional management fees, interest and depreciation on leased premises, post re-organisation
Financials FY21 Q1 FY22 Q2 FY22 Q3 FY22 9M FY22
Revenue from operation 4,138 1,114 1,400 1,460 3,973
Raw Materials consumed 2,640 713 901 936 2,550
Employee costs 758 214 235 239 688
Other expenses* 264 72 78 76 226
EBITDA 476 115 186 208 509
EBITDA Margin (%) 11.5% 10.3% 13.3% 14.3% 12.8%
EBIT 382 91 162 185 438
EBIT Margin (%) 9.2% 8.2% 11.6% 12.7% 11.0%
PAT (concern share) 254 61 114 132 307
PAT Margin (%) 6.1% 5.5% 8.1% 9.0% 7.7%Gross Debt (excl. lease liability) 81 79 97 15 15
Cash 37 14 18 1 1
Net Debt 44 65 79 14 14
Lease liability (under Ind AS116) 307 266 259 316 316
(Rs in Crores)

Thank you.