Pyramidal Groups and the Separation between Ownership and Control in Italy
52
PYRAMIDAL GROUPS AND THE SEPARATION BETWEEN OWNERSHIP AND CONTROL IN ITALY Marcello Bianchi* Magda Bianco** Luca Enriques** Abstract The paper provides an overview of the Italian corporate governance system, focusing mainly on the ownership of Italian firms and on the legal and institutional framework. Like those of most other continental European countries, the Italian corporate governance system features a high concentration of direct ownership, for both unlisted and listed companies; at first glance this suggests a very limited degree of separation between ownership and control. The analysis of direct ownership and of the identity of owners reveals that a major role is played by families, coalitions, the State, and above all by other companies: the largest stake in listed and unlisted companies is held by other non-financial or holding companies. In fact, more than 50 percent of all Italian industrial companies belong to pyramidal groups. Taking the pyramidal structure into account, one can identify ultimate owners and evaluate the actual degree of separation between ownership and control. Measuring separation as the amount of capital controlled per unit of capital owned, we find that in 1996 the average figure was 2.4 for listed companies; it was higher for private non-banking groups (4.5) and lower for State-controlled groups (1.6); for the ten largest private groups, the ratio was approximately 5. In Italy, then, pyramidal groups headed by families, coalitions, or the State have supplanted other forms of separation, whereas financial institutions have played a very limited role in fostering separation. This structure, reinforced by cross-ownership, circular ownership, and interlocking directorates, has allowed stable control over both small and large companies, with few control changes, especially hostile takeovers. The paper first provides a brief description of the legal and institutional framework and in particular of the provisions affecting corporate governance mechanisms (shareholders’ rights, directors’ liability etc.), and of disclosure rules. Next comes a quantitative description for listed and unlisted companies: ownership structure, taking account of groups; the control structure; the diffusion of pyramidal groups; and an evaluation of the separation between ownership and control. This is followed by a discussion of changes and trends: the simplification of the pyramidal structure due to privatization and to the financial difficulties of private groups; the increasing role of financial institutions; the debate that has led to reform of some corporate governance mechanisms and to a new law for listed companies, in force since July 1998. * Consob ** Banca d’Italia
Transcript of Pyramidal Groups and the Separation between Ownership and Control in Italy

PYRAMIDAL GROUPS AND THE SEPARATION BETWEEN
OWNERSHIP AND CONTROL IN ITALY
Marcello Bianchi* Magda Bianco** Luca Enriques**
Abstract
The paper provides an overview of the Italian corporate governance system, focusing mainly on theownership of Italian firms and on the legal and institutional framework.Like those of most other continental European countries, the Italian corporate governance system features ahigh concentration of direct ownership, for both unlisted and listed companies; at first glance this suggests avery limited degree of separation between ownership and control.The analysis of direct ownership and of the identity of owners reveals that a major role is played by families,coalitions, the State, and above all by other companies: the largest stake in listed and unlisted companies isheld by other non-financial or holding companies. In fact, more than 50 percent of all Italian industrialcompanies belong to pyramidal groups.Taking the pyramidal structure into account, one can identify ultimate owners and evaluate the actual degreeof separation between ownership and control. Measuring separation as the amount of capital controlled perunit of capital owned, we find that in 1996 the average figure was 2.4 for listed companies; it was higher forprivate non-banking groups (4.5) and lower for State-controlled groups (1.6); for the ten largest privategroups, the ratio was approximately 5.In Italy, then, pyramidal groups headed by families, coalitions, or the State have supplanted other forms ofseparation, whereas financial institutions have played a very limited role in fostering separation. Thisstructure, reinforced by cross-ownership, circular ownership, and interlocking directorates, has allowedstable control over both small and large companies, with few control changes, especially hostile takeovers.The paper first provides a brief description of the legal and institutional framework and in particular of theprovisions affecting corporate governance mechanisms (shareholders’ rights, directors’ liability etc.), and ofdisclosure rules. Next comes a quantitative description for listed and unlisted companies: ownershipstructure, taking account of groups; the control structure; the diffusion of pyramidal groups; and anevaluation of the separation between ownership and control. This is followed by a discussion of changes andtrends: the simplification of the pyramidal structure due to privatization and to the financial difficulties ofprivate groups; the increasing role of financial institutions; the debate that has led to reform of somecorporate governance mechanisms and to a new law for listed companies, in force since July 1998.
* Consob
** Banca d’Italia

1. Introduction and summary1
Like those of most other continental European countries, the Italian corporate governance
system features a high concentration of direct ownership, for both unlisted and listed companies; at
first glance this suggests a very limited degree of separation between ownership and control.
The analysis of direct ownership and of the identity of owners reveals that a major role is
played by families, coalitions, the State, and above all by other companies. The largest stake in
listed and unlisted companies is held by other non-financial or holding companies. Contrary to
other European countries, the amount held by financial institutions is limited. In order to evaluate
the degree of separation correctly, the shareholdings of non-financial companies have to be taken
into account. In fact, more than 50 percent of all Italian industrial companies belong to pyramidal
groups. The main reason for this structure, especially among listed companies, is the possibility of
controlling vast resources with a limited amount of capital. That is, it is a means of separating
ownership and control. Just how complex the network of links can be is illustrated in Figure 1 for
the Fiat group.
Taking the pyramidal structure into account one can identify ultimate owners and evaluate
the actual degree of separation between ownership and control. Measuring separation as the amount
of capital controlled per unit of capital owned, we find that in 1996 the average figure was 2.4 for
listed companies; it was higher for private non-banking groups (4.5) and lower for State-controlled
groups (1.6); for the ten largest private groups, the ratio was approximately 5.
In Italy, then, pyramidal groups headed by families, coalitions, or the State have supplanted
other forms of separation, whereas financial institutions have played a very limited role in fostering
separation. The established banking supervisory policy prevented banks from owning shares in
industrial companies (with a single important exception, Mediobanca). Nor have other financial
institutions such as pension funds or investment funds owned substantial blocks of shares in non-
financial companies, owing part to a generous public pension system financed through government
bonds. This structure, reinforced by cross-ownership, circular ownership, and interlocking

2
directorates, has allowed stable control over both small and large companies, with few control
changes, especially hostile takeovers.
The institutional framework underlying this structure of corporate governance has been
characterized by quite limited safeguards for minority shareholders. It is hard to enforce the
fiduciary duties of company directors, especially as regards intra-group transactions; proxy fights
have been discouraged by a very strict regime for proxies that was in force until July 1998; the
takeover rules in force from 1992 until July 1998 were deemed inefficient and quite ineffective in
terms of minority shareholder protection.2 Interestingly, however, ownership disclosure rules are
relatively satisfactory: the law sets a 2 percent threshold for the disclosure of holdings in listed
companies, the lowest in Europe; for unlisted companies the identity of each shareholder must be
disclosed, by notification to the company register.
In what follows we first provide a brief description of the legal and institutional framework
and in particular of the provisions affecting corporate governance mechanisms (shareholders’
rights, directors’ liability etc.), and of disclosure rules. Next comes a quantitative description for
listed and unlisted companies: ownership structure, taking account of groups; the control structure;
the diffusion of pyramidal groups; and an evaluation of the separation between ownership and
control. This is followed by a discussion of changes and trends: the simplification of the pyramidal
structure due to privatization and to the financial difficulties of private groups; the increasing role
of financial institutions; the debate that has led to reform of some corporate governance
mechanisms and to a new law for listed companies, in force since July 1998.
2. Separation of ownership and control: the institutional framework
La Porta et al. (1997) suggest that civil code countries such as Italy are characterized by a
limited protection of minority shareholders and creditors and that this explains the high degree of
ownership concentration. Important characteristics of any corporate governance system are the
degree of separation between ownership and control and the devices used to achieve it. Separation

3
allows the growth and diversification of portfolios, but it requires monitoring to guarantee that the
interests of those in control are not too distant from those of the owners. Depending on institutional
structure and legally usable instruments, separation will differ in form, in extent and in impact on
efficiency and performance.
The method of separation typical of such countries as Britain and the United States is
widely dispersed ownership with powerful directors or managers, counterbalanced by takeovers,
independent directors, fiduciary duties, and supervision by financial institutions. This form of
separation is uncommon in Italy, mainly because of the lack of instruments to safeguard minority
shareholders’ interests.3 Also uncommon is separation via financial supervision by banks or other
intermediaries, partly owing to institutional limitations on their shareholdings in non-financial
companies and their voting proxies at shareholders’ meetings.
«Legal» sources of separation are deviations from one-share-one-vote. These allow
separation at a limited cost, in that law or regulation may directly provide guarantees and
compensation for non-controlling shareholders. When such means are not available or are
considered too costly by controlling agents, alternatives such as pyramiding, voting pacts, and
interlocking directorates may be resorted to. In the absence of strong minority protections, these
means could be less efficient than others.
In this section we discuss the characteristics of the institutional framework that are most
important for corporate governance in Italy, assessing the extent to which the thesis of La Porta et
al. (1997) correctly represents the system. We first describe the main legal forms available to
companies, as they are the primary instrument of separation. We then discuss the tools available,
legal and other, by which separation can be achieved. Finally, we examine how the instruments that
allow separation to emerge elsewhere, particularly in the Anglo-Saxon system, work in Italy: e.g.
such minority shareholder safeguards as rights in meetings, representation on boards, transparency
and market disclosure or the possibility of monitoring by financial institutions.
In closing it must be observed that in July 1998, in accordance with the consensus view that
4
Italian corporate governance was excessively biased towards certainty of control at the expense of
shareholders’ protection,4 a sweeping reform was enacted.5 These changes shall also be reported
here.
2.1 Main legal instruments of separation
Legal forms available. - In Italy the key legal distinction is between società di persone6
(partnerships), where liability is unlimited for at least some of the owners, and società di capitali7
(limited liability companies), where liability is, normally, limited. For the former the legal regime is
quite basic and more room is left to private arrangements between the parties. For the latter, the law
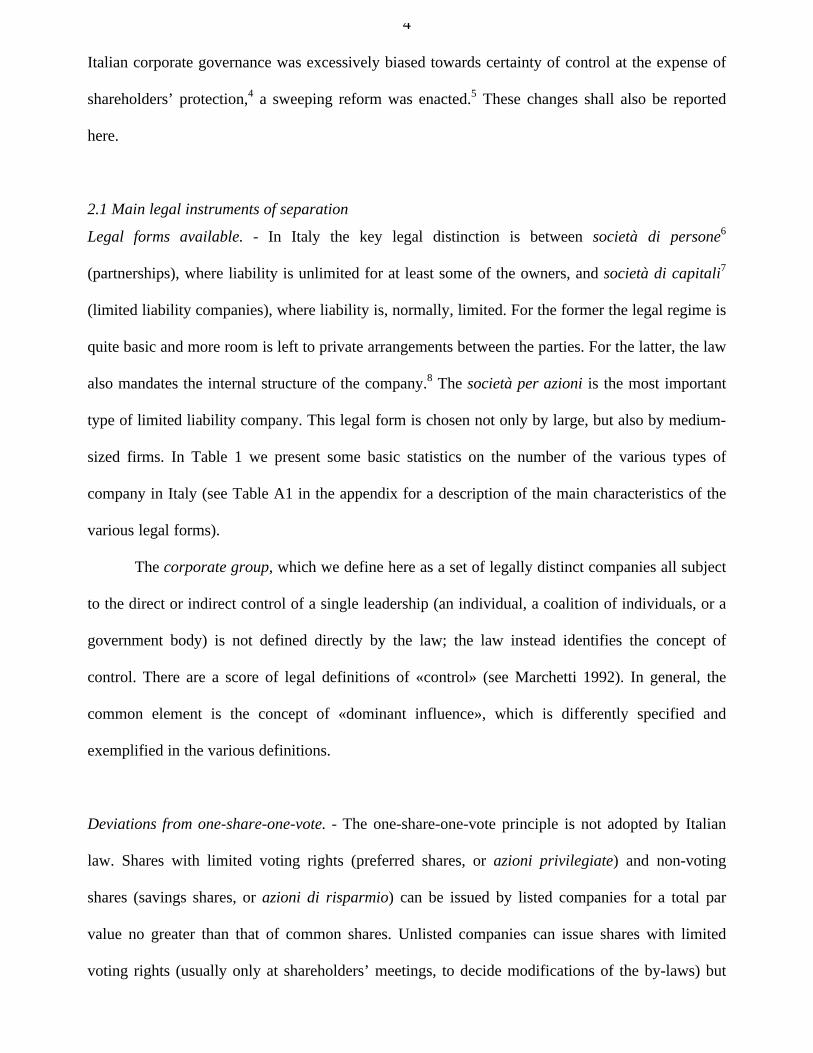
also mandates the internal structure of the company.8 The società per azioni is the most important
type of limited liability company. This legal form is chosen not only by large, but also by medium-
sized firms. In Table 1 we present some basic statistics on the number of the various types of
company in Italy (see Table A1 in the appendix for a description of the main characteristics of the
various legal forms).
The corporate group, which we define here as a set of legally distinct companies all subject
to the direct or indirect control of a single leadership (an individual, a coalition of individuals, or a
government body) is not defined directly by the law; the law instead identifies the concept of
control. There are a score of legal definitions of «control» (see Marchetti 1992). In general, the
common element is the concept of «dominant influence», which is differently specified and
exemplified in the various definitions.
Deviations from one-share-one-vote. - The one-share-one-vote principle is not adopted by Italian
law. Shares with limited voting rights (preferred shares, or azioni privilegiate) and non-voting
shares (savings shares, or azioni di risparmio) can be issued by listed companies for a total par
value no greater than that of common shares. Unlisted companies can issue shares with limited
voting rights (usually only at shareholders’ meetings, to decide modifications of the by-laws) but

5
only for par value no higher than the total par value of common shares.
In any case, the technique is not common. At the end of 1997, limited and non-voting shares
constituted only 8.4 percent of the total Milan Stock Exchange capitalization (non-voting shares,
7.1 percent; shares with limited voting rights, 1.3 percent).9 10
The cash-flow rights and control rights attaching to such shares, especially after the 1998
corporate law reform, depend on the company’s by-laws.11 12
Multiple voting shares have been outlawed since 1942, but voting caps are legal for unlisted
as well as for listed companies. They are uncommon among the unlisted companies, given the
availability of more effective tools for preventing outsiders from acquiring an influential stake,
such as pre-emption agreements and the discretionary power of the board of directors to refuse
transfers of shares. Among listed companies, voting caps are imposed by law for cooperative banks
and are very common among privatized companies: before the placement of its shares, the
Government used its powers to introduce voting caps in the by-laws of most of the companies to be
privatized, ranging from 3 to 10 percent. The 1994 law on privatization provided that voting caps
could not be repealed by the general meeting for three years after their enactment, but also that they
would be automatically annulled if a single person held more than 50 percent of the full-voting
shares following a tender offer.13
Shareholders’ agreements. - Another source of separation is shareholders’ agreements. Before the
corporate law reform, agreements involving listed companies had to be notified within five days to
Consob (Commissione Nazionale per le Società e la Borsa: the Italian Securities and Exchange
Commission) and their essential content published in the press.
The 1998 reform institutes new rules for shareholder agreements involving listed companies
and companies that control them. Not only must they be notified to Consob within five days and
their content published in the press, but they must also be deposited with the company register (a
consortium of chambers of commerce, whose data are available to the public). Shareholder

6
agreements may be be for a limited period (no more than three years) or else have no time limit; in
this case, however, the parties may withdraw from them at any time. And in any case they may
withdraw when a takeover bid for at least 60 percent of the voting shares has been made.
Cross shareholdings. - A further source of separation is reciprocal shareholding. For unlisted
limited companies, there are no limits to reciprocal holdings, when the two companies are not in a
control relationship with one another. If they are, the controlled company may not hold more than
10 percent of the other’s shares.
The rules for listed companies are more restrictive. The ordinary limit on cross-holdings
(including shares held indirectly, as by controlled companies) is 2 percent if both companies are
listed. This means that if one listed company holds more than 2 percent of another’s voting shares,
the latter may not exercise the voting rights attaching to shares exceeding two percent of the voting
shares in the former and must sell such shares within twelve months. If a listed company holds
more than 10 percent of an unlisted company’s shares, the latter may not hold more than 2 percent
of the former’s shares; conversely, if an unlisted company holds more than 2 percent of a listed
company’s shares, the latter may not hold more than 10 percent of the former’s shares.
After the 1998 reform, the limit on cross-holdings between listed companies is raised to 5
percent on condition that the two general meetings give their consent on the basis of an agreement
between the two companies neither already owning more than 2 percent the other. The new law
also takes connections among groups into account,14 and specifies that if one company gains
control of the other through a takeover bid, it is the votes attaching to the shares held by the
acquired company that cannot be exercised.
The separation between ownership and control may also stem from circular holdings, as
when company A holds shares in company B, which holds shares in company C, which in turn
holds shares in A.15 These devices are neither prohibited nor limited by the Italian law, and a recent
study finds that they are a significant factor of the ownership structure of Italian listed companies.16

7
2.2 Other means of separation: pyramiding, interlocking directorates
Another device to separate ownership and control is the pyramidal group. This structure is
common among listed companies in Italy (as we shall see). This ownership structure has been
recognized by the Italian regulator since the late ‘40s but no measures were taken until recently to
limit its growth or to attenuate the problems associated with it. On the contrary, pyramidal groups
have been favoured by a neutral tax policy (i.e., dividends are taxed only once, no matter how many
levels the control chain has) and by the absence of any legal provisions to prevent conflicts of
interests between the controlling agent and minority shareholders in the subsidiaries.17 In the past,
the State itself in the past used pyramiding for its own industrial activities. The stock exchange
(publicly owned and managed until 1997) accepted the listing of so-called «scatole cinesi»
(Chinese boxes), companies whose sole assets are controlling blocks in other listed companies, and
the listing of companies at various levels of the groups (see the Fiat group in Fig. 1).
There is no legal restriction on interlocking directorates. Per se, they are not even relevant
for antitrust purposes.
2.3 Minority protection
Shareholder meeting. - Shareholders representing at least 20 percent of the equity issued may
convene the shareholder meeting. For listed companies, the 1998 reform lowers the threshold to 10
percent (or less, if so provided by the by-laws), but specifies that directors may choose not to
convene the meeting if they deem that doing so would not be in the interest of the company. The
same percentage of equity and the same procedure are required for shareholders’ proposals.
Board of directors and internal auditing. - By law, Italian companies may have either a board of
directors or a single director. However, listed companies (in practice) and banks (by regulation)
have boards. An internal board of auditors with three or five members (three or more for listed

8
companies) oversees the management of the company. The civil code leaves companies free to
determine the election system for directors and auditors; the most common system is winner-takes-
all.18 The 1998 corporate law provides that at least one out of three or two out of the higher number
of auditors in listed companies must be named by minority shareholders.
Since July 1998, according to Consob regulations the compensation of each board member
and by auditors must be reported in the annual accounts. This is a significant change; previously, no
such information was released; now Italian regulations are among the strictest in Europe.
Derivative suits. - Until July 1998, individual shareholders and minority shareholders were not
allowed to sue directors for damages suffered by the company. Only the company, after a resolution
by the shareholders’ meeting, could do so. Shareholders representing at least 10 percent of the
issued shares19 could ask a Court to order an inspection of the company, alleging serious
irregularities; if such irregularities are verified, the Court may nominate an officer to direct the
company; the latter can take legal action against directors.
The 1998 reform provides that a minority representing 5 percent of issued equity in a listed
company (or a lower percentage, if specified by the by-laws) may start a derivative suit against
directors. Although this is a significant innovation, the 5 percent threshold still seems too high for
the major listed companies.
2.4 Transparency and information
For unlisted companies - except for partnerships - a 1993 law provides that the identity of
each shareholder be disclosed, by way of notification to the company register.20 Ownership data are
collected by the company register but they are made available only at a relatively high cost.21
For listed companies there are various statutory requirements concerning ownership
information. Since 1974 holdings of more than 2 percent of listed companies have had to be
reported to Consob. Since 1992, Consob has been obliged to inform the public immediately (in

9
practice, the same day or the day after). Until December 1998, significant changes had to be
reported within thirty days; that is, if the holding percentage went below the 2 percent threshold or
if a variation exceeded 1 percent.
The 1998 reform confirmed the 2 percent threshold, leaving Consob to issue a regulation defining
significant changes, setting the criteria for the calculation of holdings and the timing for disclosure.
The regulation provides that a declaration is due when the holding crosses the thresholds of 5
percent, 7.5 percent, and all multiples of 5 percent; the definition of "holding" includes all the
criteria laid down in Directive 88/627/EEC, also taking account of potential holdings, via options
(both call and put), convertible instruments and warrants; if holdings belong to investors linked by
a formal agreement that aggregates more than 5 percent of the voting capital, a specific disclosure
rule is provided, even for individual holdings that are less than 2 percent. The deadline for
disclosure is 5 working days, both for the initial declaration and for the announcement of
significant changes.
The law further requires disclosure of listed companies significant shareholdings (larger
than 10 percent) in unlisted companies.
The Milan Stock Exchange does not impose additional ownership data reporting
requirements.
2.5 Monitoring by financial institutions
We discuss here some of the regulations regarding financial institutions that directly affect
their ability and their incentive to conduct incisive monitoring.
Proxy Voting. - Financial institutions’ activism in corporate governance is strongly influenced by
the possibility and by the cost of proxy voting. From 1974 to 1998, banks were forbidden to act as
proxy in shareholders’ meetings of both listed and unlisted companies. Only in 1996 were they
allowed to offer proxy voting services to customers of their portfolio management departments. In
general, no one can act as a proxy agent for more than 50, 100 or 200 shareholders of a listed

10
company (10 for an unlisted company), depending on the par value of its issued shares. The limits
do not apply to proxy solicitations in listed companies; the 1998 reform allows any shareholder
holding more than 1 percent to solicit proxies, but under a complex procedure.
Banks. - From 1936 to 1993, banks accepting demand or short-term deposits were precluded from
acquiring significant shareholdings in non-financial companies by the supervisory policy of
enforcing separation between banking and industry. The policy did not apply to «special credit
institutions», banks not accepting short-term liabilities, such as IMI and Mediobanca. Mediobanca
appears to have been the only credit institution to play a central role in Italian corporate governance
in recent decades. Other banks have not adequately supported or advised industrial firms in
securing resources or developing strategies for growth.22 The very strict separation between banks
and commercial firms, together with the regulation separating long- and short-term lending, limited
the development of long-term relationships and monitoring by banks.
Following EC banking harmonization the limits on equity investments by banks are now
less stringent, but it is still too soon to observe more active involvement in corporate governance by
Italian banks. In keeping with their primary role as lenders, they seem to have made little use of the
new opportunities, except for debt-for-equity swaps in connection with the reorganization of
troubled firms.
In fact, the ownership and governance structure of banks is itself an issue. Until recently the
banking system was mostly public. In 1990, the government began a privatization program that is
still under way. Many banks that were held directly by government or by IRI (the public holding
company founded in the ‘30s), have been privatized. Yet a good number are still controlled by
banking «foundations», non-profit institutions having a hybrid nature, neither public nor private.
They were created by a 1990 law23 to facilitate privatization, but they have proven most reluctant to
divest themselves of their control stakes.
Insurance Companies, Pension Funds, Investment Funds. - Insurance companies may use both their
technical reserves and their net equity capital, within limits, to buy shares; they have done so only

11
to a limited extent, however.
So far, owing to Italy’s very generous public pension system, there have been very few
private pension funds, and those few have played no active role in corporate governance. A 1993
law, amended in 1995, regulates private pension plans and seeks to foster them by more generous
tax treatment.24 Pension funds may hold shares (with some limits) in any listed or unlisted
company, but never such as to give the fund control of a company.
Open-end investment funds have to abide by some minimal diversification rules laid down
by the Bank of Italy. Closed-end funds were first allowed and regulated by a 1993 law imposing
very strict and pervasive rules, that in fact discouraged such funds; in September 1997 there were
only four active closed-end investment funds in Italy. The 1993 law was repealed by the 1998
corporate law reform, which delegates to the Government the regulation of such institutions.25
3. The data
Our empirical study is based on two samples (see Table 3).
1) The first is all listed companies. The source is the administrative data on shareholdings collected
by Consob.26 Within this dataset, groups were identified by the information on control relationships
reported to Consob and by means of algorithms based on shareholders’ stakes, that detect control
relations even when they are not explicitly stated.27 Data have been analysed with reference mainly
to 1996; some evidence is also reported for 1993. The 1993 dataset includes 263 listed companies
(including the secondary market).28 The 1996 data refer to 214 listed companies and their identified
shareholders (approximately 1,100 direct and 800 ultimate shareholders). Values are presented both
unweighted and weighted according to market capitalization.29
2) The second is based on a survey of manufacturing companies. A random sample of about a
thousand manufacturing companies with more than 50 employees was surveyed both in 1993 and in
1996 as part of the Bank of Italy’s survey of firms’ investments (called INVIND). The survey
includes data on ownership and control structure and control transfers.30 31

12
4. Voting power
4.1 Direct Stakes
Given that the transparency directive does not require the disclosure of ownership data but
only of voting power, the former are not available for listed companies. Here we consider first the
distribution of direct stakes (i.e., those owned by each independent shareholder), since the Italian
transparency law requires the disclosure of these as well as of voting blocks. The next section
concentrates on voting blocks, i.e., stakes in a company held directly by different agents but subject
to a single controlling entity.
In Italy, direct voting rights are heavily concentrated. Their concentration in manufacturing
companies (both unweighted and weighted by the size) for the years 1992 and 1996 is shown in
Tables 4 and 5. In 1992 the top shareholder of manufacturing companies owned on average 67
percent of a company (the median value being 89 percent), and the top three owned more than 90
percent. Concentration increases with firm size: in firms with fewer than 100 employees the largest
stake is 60 percent, on average, while in those with more than 1000 employees it is 82 percent.
Thus weighting firms according to their size yields even higher values: the average top share, when
weighted, is 77 percent. This depends largely on the fact that the biggest shareholder is often
another company with a majority stake, and this is more common for large companies. In 1996,
concentration appears to be slightly higher.
The largest shareholder of listed companies in 1993 owned on average 51.4 percent. For the
whole set of companies belonging to listed groups, the largest shareholder owned on average 70.6
percent, the top three 73.7 percent (for companies with identified control, the respective values are
86.6 and 89.9 percent).32 In 1996 concentration is slightly lower but still very high: the top
shareholder averages a 48 percent stake (with a median of 51; Table 6). For smaller firms (the
bottom quartile in terms of market capitalization) the largest shareholder has the absolute majority.
Associated with the majority owner there are usually other significant shareholders with average
shares of 10 and 4 percent. On average the top three shareholders own a 62 percent stake. In 1996,

13
in more than 10 percent of the companies the top shareholder had a stake larger than 75 percent,
while only in 15 percent of the cases was ownership fairly dispersed (i.e. the largest shareholder
had less than 20 percent). Figure 2 shows that the distribution of the largest stake has a mass point
around 50 percent33 and that about half the companies have a top stake of over 50 percent. We do
not observe other mass points, even at the 20 or 33 percent thresholds, although these used to be the
quorums for the extraordinary shareholder meetings. For listed companies alone, as opposed to the
sample of manufacturing companies, ownership concentration is not correlated with size. Except
for the lowest percentiles (where values may be biased, because we include companies suspended
from trading for financial difficulties) and the highest percentile we observe, as expected, an
inverse correlation between concentration and capitalization.34 The greater a company’s market
capitalization, the smaller the stake owned by the top shareholder and also by minority shareholders
(from the second to the tenth largest) and the larger the share held by the «market», which we
define as the sum of all holdings smaller than 2 percent.
The difference between listed and unlisted companies reflects the fact that in many cases
listed companies are at the top of pyramidal groups (and hence are not owned by other companies),
which maximize the resources controlled with the minimum amount of capital allowing control;
and the latter decreases as the company increases in size.
For recently listed companies (in 1995 and 1996) concentration is, on average, lower: the
top direct shareholder owns 40 percent, the second 7.3 percent, the third 4 percent, and the share of
the 4th to 10th shareholders is larger than in listed companies earlier (where it amounts to 8.2).
4.1.1 Identity of owners
The first step in understanding the concentration of ownership and the mechanisms whereby
control is exercised is the analysis of who the shareholders are. We classify shareholders into six
categories: individuals, holding companies, other non-financial companies (these two cannot be
distinguished for listed companies), state-owned companies, foreign companies, and financial

14
companies (for listed companies we can distinguish between banks, insurance companies, mutual
funds and others).
Considering the top ten shareholders in each firm, ownership of the average manufacturing
firm is shared almost equally between individuals and companies (48.0 vs. 49.7 percent; Table 7).
As expected, individuals own a larger share in smaller companies (in those with under 100
employees they have the absolute majority) and a very small one in the largest. In larger firms, the
main shareholder tends to be a holding company. But other companies, and in particular holding
companies and other private domestic non financial companies have a role in small and medium-
size firms as well. The larger the company, the greater the presence among major shareholders of
foreign companies, the state and holding companies. Even when they are present, financial
companies have a minimal share in manufacturing companies.
The main shareholders in listed companies in 1993 were non-financial companies (21.6
percent on weighted data), the state (19.3 percent) and individuals (28.7 percent, measured as the
sum of reported shares of individuals and the difference between 100 and all the reported shares).
Financial companies (banks, insurance companies, mutual funds and other) had approximately 25
percent.
In 1996, among direct owners of listed companies we observe a very large weight of non-
financial companies, including holding companies (on unweighted data they represent nearly 40
percent), again reflecting the diffusion of pyramidal groups (Table 8). Individuals do not own
significant shares in any single large company. The weight of the state is similar to that found in
1993, owing to the listing of some large state-owned companies.35 Banks hold approximately 8
percent of total market capitalization, mainly in other banks and insurance companies, but also,
recently, in non-financial companies. The role of other financial institutions (such as investment
funds and pension funds) is still very limited, even though in our figures it is certainly
underestimated, because of the 2 percent disclosure threshold. Estimates to correct for this bias
indicate that at the end of 1996 institutional investors owned about 14 percent of the total market

15
capitalization. This leads to an estimate of individuals’ holdings of 29 percent.
The weighted share of foreign investors is quite modest: they hold about 2.5 percent of total
capitalization, mainly in small companies (their unweighted share is 10 percent). Again, however,
only blocks larger than 2 percent are reported, and hence they usually represent a stake in control
coalitions. Investment by foreign institutional investors are underestimated like those of their
domestic counterparts.
4.1.2 Diffusion and role of groups
The evidence on the identity of owners points to the diffusion of pyramidal groups. The
results of the survey for 1992 showed that more than half (56 percent) of Italian industrial firms
belonged to a hierarchical group; by 1996 this value had edged down to 53 percent. The
phenomenon is more common, the larger the companies; virtually all those with 1,000 employees
or more adopt this structure. The percentage is also high among small and medium size companies,
however; 40 percent of companies with more 50-99 employees belonged to a pyramidal group. In
short, this is the fundamental form of organization and control in Italian industry.
The main reason for the pyramidal group structure is that it enables one or several
individuals to control a wide range of assets and activities with a limited amount of own assets
owned (mainly among listed companies). Spreading the voting rights of minority shareholders over
a large number of firms and concentrating his own in the company at the top of the pyramid, an
entrepreneur can «obtain control over the greatest possible amount of other people’s capital with
the smallest possible amount of his own».36 This phenomenon is analysed in more detail in the
section on separation.37
The next step in the analysis of voting rights in listed companies’ (the only ones for which
the necessary information is available) is to evaluate voting blocks, which in Italy are mainly group
blocks.

16
4.2 Voting blocks
Most voting blocks in Italy are those of groups. Shareholders’ pacts account for most of the
rest. Interlocking directorates are also briefly discussed, in the next section. Given the data
available, only group blocks can be analysed for all listed companies; overall voting block data are
restricted to the largest 30 listed companies.
A group block is the total share held by an ultimate owner both directly and through
controlled companies.38 Naturally, the value for group block ownership shows a higher
concentration than direct ownership (Table 9 and Figure 3). The difference between the top direct
and group holding is particularly large for listed companies between the 50th and the 90th percentile
in size. This suggests that these are the companies for which the group structure is most complex,
with the controlling shareholders participating in the listed companies through various channels.
On average the second, third and other group block stakes are smaller than the
corresponding direct stakes, evidence that part of the direct stakes themselves belong to groups
through indirect channels. However, they do not disappear: this can be seen as evidence of the
presence of shareholders’ agreements, very often informal.
The other main source of voting blocks, especially among the largest companies, is
shareholders’ agreements. In Table 10 the voting blocks of the MIB30 companies are broken down
by the reason for notification: apart from indirect control (the most common), the only two that are
used in practice are explicit voting pacts (3 cases only) and guarantees, used only by some banks.
4.2.1 Identity of blocks
When we consider blocks held by groups (Table 11), the weights of individuals, foreign
investors and the state, as the typical ultimate owners, obviously increase, and that of non-financial
companies decreases. A significant portion of group block holdings (about one third of declared
holdings), however, is held by what we call «apparent» ultimate shareholders, whose ownership
structure does not allow identification of a controlling agent according to Italian law. Some of these

17
are bank foundations, whose ownership and control structures are poorly defined. The others are
partnerships or limited liability companies (with 15 percent of declared holdings) mostly controlled
by coalitions, which are considered «not significant» for the Italian law on transparency.
5. Separation of ownership and control
5.1 Unlisted companies: families, coalitions, groups
To evaluate the degree of separation between ownership and control in this context, where
ownership is extremely concentrated, we need to go a step further; that is, we need to consider
«ultimate» owners. For listed companies this is done in Section 5.2. However, since we do not have
sufficient information for the sample of manufacturing companies, we proxy by grouping firms
according to «control models» (Figure 4).39 We define as absolute control the case where there is
nearly no separation between ownership and control: control is exercised by an individual with a
majority of voting rights. In 1992, this model accounted for 9 percent of total employment (used as
a proxy for size) of manufacturing firms with more than 50 employees. As expected, it is more
common among small firms and extremely rare among the largest ones. The most frequent
corporate governance model is hierarchical group control, which accounted for 52 percent of
manufacturing firms total employment and was more frequent among larger firms. However, as
noted, for this model we are unable to evaluate the degree of separation. The second most important
model is what we call family control, where there are family links among the individuals in control
or between them and non-controlling shareholders. This can be seen as another device that allows
separation between ownership and control. A fourth model is coalition control: this model is
similar to the family model but slightly more complex. The bond of trust between entrepreneurs
and investors is based on common values (being in the same industrial district, belonging to the
same political party etc.) and may be strengthened by formal agreements. Empirically, we proxy
this as cases with joint control or individual control without a majority of votes, except when there
are family links. It accounts for 9 percent of manufacturing firms total employment and is more

18
common among small firms. The financial supervision model, in which financial guarantees to
non-controlling shareholders are represented by monitoring on the part of financial companies with
privileged information (banks, merchant banks, institutional investors, etc.), is proxied by cases in
which an independent financial company has a significant share (larger than 20 percent). This
model was basically absent among Italian manufacturing firms in 1992. State ownership can be
interpreted as a model in which the state raises capital directly from savers and finances
entrepreneurs by mandating the political authorities to safeguard the interests of investors. This
model accounts for approximately 13 percent of the manufacturing firms total employment and is
more frequent among larger companies. Finally we proxied public companies (i.e., companies with
diffuse ownership) as those in which control is exerted without ownership of shares or where
ownership is extremely dispersed. A few such firms were identified. In all these cases, however, the
market for corporate control was not active and no real takeover threat existed. Hence we have
termed this model, which accounts for 1 percent of manufacturing firms employment, the «pseudo-
public» company.
5.2 Listed companies: the separation between ownership and control
The final step in measuring the success of pyramidal groups in obtaining separation between
ownership and control is the evaluation of «integrated ownership», i.e. the amount of capital the
controlling agent has actually supplied. Integrated ownership is computed for each listed company
with an identified controlling agent, moving from the latter’s direct shareholding along the control
chain. If agent A controls company B with a 50 percent share and B controls company C with a 50
percent share, the integrated ownership of A in C is 25 percent.40
In 1996 integrated ownership of controlling agents in the set of all listed companies with an
identified controlling agent was 51 percent. More than half of all such integrated ownership was
accounted for by the State.41
This high degree of integrated ownership reflects the limited separation between ownership

19
and control. In 1993, on average, ownership of one unit of capital allowed ultimate control of 2.7
units; in 1996 for listed firms the figure was 1.95 (Table 12); It was below average for the State
(1.6), and above average for individuals (3.62) and non-financial companies (4.48).42 43 In private
groups headed by a non-financial company, the degree of separation increases with size.
The degree of separation of ownership and control found may appear modest, especially
compared to the absolute separation realized in the pure «public company». Considering, however,
that control is generally not contestable and that there is a very little effective outside monitoring,
the separation may not be considered so small. Indeed, separation between ownership and control
in private groups, especially where the head of the group is not a financial company, is much
greater than in State-controlled groups. For the private groups, in fact, the pyramidal structure is
exploited to maximize external finance.
For the top 30 groups by market capitalization, the difference between private and State-
controlled groups is even more evident (Table 13). In 1996, for the Fiat group, the third-largest, the
capital controlled with one unit of own capital was about 9; for the De Benedetti group this control
ratio was is about 1044; and it is above 4 for the Compart, Radici Pesenti, Ligresti, Pininfarina and
Falck groups. For State controlled groups, the value was 1.2 for those controlled by the Treasury
Ministry, and 2.4 for the IRI group, which are were first and second largest groups. For many
private groups, moreover, it was impossible to identify the true head of the group, owing to the
presence of coalitions controlling the holding company that are not relevant according to the
disclosure rules. Were it possible to identify the true head of these groups, the separation would
appear to be considerably greater.
6. Recent developments
Some changes are perceptible of late in the Italian corporate governance structure, some of
which cannot yet be traced in the data, at least not for 1996.
As far as the group structure is concerned, there is a tendency towards a simplification of

20
pyramidal private groups: this trend seems to be driven primarily by financial difficulties of some
groups and it has involved mostly listed companies at the lower levels. In some cases, the
simplification reflects a concentration on the group’s «core business» and the consequent sale of
non-strategic assets. For example, in the last two years the Agnelli group, whose structure in 1996
is shown in the Figure 1, has disposed of companies operating in chemicals (a sub-group headed by
SNIA and including four listed companies) and in cement (a sub-group headed by UNICEM and
including three listed companies).
The reduction of the role of pyramidal groups is diluting ownership and more generally
producing a greater instability of ownership and control structure. Voting block concentration has
diminished substantially since 1996, especially for the largest companies. The average top stake,
calculated for voting blocks and weighted by market capitalization, has fallen from over 50 percent
to 35 percent at the end of 1998; the unweighted value has decreased much less (only from 51
percent to 48 percent).
In this framework, financial institutions (both banks and institutional investors) are playing a
larger role. The growing role of banks is notable most particularly in companies involved in
bankruptcy proceedings, while the presence of institutional investors is more widespread, with a
leading role of foreign asset management institutions. The number of listed companies in which an
institutional investor held more than 2 percent of the equity rose from 33 at the end 1996 to 84 at
the end of 1998.
Securities market regulations are another factor affecting the ownership structure. The 1998
corporate governance laws reform makes a bid for 100 percent of the shares mandatory for anyone
who acquires more than 30 percent of the full-voting shares of a listed company. Since this rule
came into force, the ownership structure of some listed companies has begun to change, with a
trend towards establishing the controlling stake around the 30 percent threshold. For example, in
Pirelli Spa, the controlling stake has come down from about 50 percent to just over 30 percent. In
other cases, such as Olivetti and SNIA-BPD, which had dispersed ownership, coalitions of

21
shareholders have put together controlling stakes lower than 30 percent.
The privatization process is increasing stock market capitalization, notably reducing the
weight of the State in the ownership of listed companies which has dropped from about 30 percent
in 1996 to under 10 percent in 1998, although the process is neither linear nor unambiguous. In
some instances ownership has been transferred from the state to banks controlled by foundations
and can hardly be considered private. In other cases the State still controls companies that have
been only partially privatized. In general, the control structure of privatized companies is an
intricate puzzle: even when the privatization has been fully realized, a mix of regulatory measures
(such as the «golden share») and by-law provisions (such as voting caps) reduces the role of the
market for corporate control.
Thanks in part to fiscal incentives, since 1995, a fair number of medium-sized companies
have gone listed, most commonly those with venture capital participation. Most of the new listed
companies do not belong to listed groups, as had usually been the case in the past, when very often
new listings involved spin-offs of listed companies, to broaden the structure of the group and
lengthen the control chain.
7. Conclusions
In short, the Italian case is peculiar, in that regulation and corporate culture did not favour
the development of the kind of relations between banks and companies that emerged in Germany,
while the more typically Anglo-Saxon corporate governance devices, acquisitions, fiduciary duties
and other financial institutions, also failed to develop. We have not presented data on transfers of
control but there is evidence that they are not very common and are rarely hostile in any case. The
problem of financing and growth has been solved through the State, families, or coalitions, often
organized into pyramidal groups. Banks or other financial institutions have not exercised

22
monitoring or played an active role as advisors or intermediaries in the transfer of control.
Takeovers have never worked as a monitoring device. Company and securities laws have not laid
down enforceable fiduciary duties, nor have they ever ensured that adequate information was made
available to shareholders. A large number of companies are organized into pyramidal groups,
notwithstanding the lack of adequate guarantees for minority shareholders. The State has played a
central, direct role via ownership and via financial transfers to private companies. There has been
widespread reliance on implicit rules, such as family relations and coalitions among owners
sharing common interests or values, which has further impeded the exit mechanism from working.
The separation between ownership and control has been limited.
References
1 We would like to thank F. Barca, M. Becht, M. Morvillo, M. Perassi, G. Ronzani for providing
us information and useful suggestions, and I. Longhi and C. Ortenzi for assistance with the
editing. The usual disclaimers apply. Opinions expressed do not necessarily reflect our
institutions’ point of view.
2 See Brescia Morra, Martiny, and Salleo (1997).
3 Instruments of this kind have been introduced with the recent reform and will be discussed
below.
4 See, for example, Barca (1996) and Costi (1995); but, for a different view, see Ciocca (1997).
5 Decreto Legislativo 24 febbraio 1998, n. 58.
6 Società semplici, società in nome collettivo, società in accomandita semplice.
7 Società per azioni, società in accomandita per azioni and società a responsabilità limitata.
8 Especially for società per azioni and società in accomandita per azioni. The legal regime fo
società cooperative, i.e., co-operatives, is similar to that of società di capitali.

23
9 Source: Consob.
10 Taking into account only companies which both have ordinary shares listed on the Stock
Exchange and also issue shares with limited vote and/or non-voting shares, non-voting shares
account for 13.8 percent of the total market capitalisation of these companies and shares with
limited vote account for 1.2 percent.
11 It is to mention here that the take-over law provides that the mandatory bid to be promoted by
whoever takes over a listed company does not have to be extended to holders of limited voting
or nonvoting shares.
12 For co-operatives the deviation from one share - one vote takes the form of the one shareholder
- one vote rule, according to which each shareholder has only one vote, whatever share of
capital she holds.
13 See now Section 212 of Decreto Legislativo 58/1998, which modified the 1994 law by
providing that voting caps become ineffective if the company is taken over by way of a tender
offer on more than 60 per cent of the shares.
14 If a person or entity A holds more than 2 percent of the shares in a listed company B, B or the
person controlling it may not hold more than 2 percent of the shares in listed companies
controlled by A.
15 See Ascarelli (1955).
16 Circular holdings larger than 2% each have been found to connect 20 groups of companies,
representing 63% of the total capitalisation of non-State-controlled companies and 36% of the
Milan Stock Exchange capitalisation: 16 groups were connected by “triangular” holdings and
4 groups were connected by “square” or “pentagonal” holdings. See Bianchi, Fabrizio, and
Siciliano (1998).
17 See Enriques (1997).
18 Since 1994, the Law on privatisation has imposed on privatised companies whose statutes
contain voting caps, an election system based on lists of candidates, which should allow

24
minority shareholders to have one fifth of the board seats and to elect one of the internal
auditors.
19 The 1998 reform has lowered this limit to 5% (or the lower percentage specified by the
company’s statute) for listed companies.
20 The rationale for this Law is not to be found in any business reason: the Law was in fact aimed
at preventing money laundering.
21 As a consequence, for our quantitative analysis on such companies we resort to sample
information based on surveys. See table 2 for an account on whether and how ownership data
are available to the public.
22 See De Cecco and Ferri (1996).
23 In fact, “fondazioni bancarie” used to be banks themselves: with the 1990 Law, their banking
assets were spun off in “società per azioni”, which, in the intention of the government, would
then be privatised.
24 Decreto legislativo 1993/124.
25 As of today, the Government has not yet adopted such regulations.
26 It has to be noticed that some critical issues in disclosure regulation have an impact on the
possibility to identify true shareholders and controlling agents in Italy and hence on the
completeness of information in the dataset. The first has to do with joint control: in the
Transparency Directive (see Article 8) and in the Italian Law implementing it, the definition of
control covers exclusively those cases in which a single person or entity is in control. Joint
control (e.g., 50/50 control) is not taken into account. The second concerns informal
coalitions: in order to identify a controlling agent in a company, data on control, as defined by
the Law on take-overs, had to be used. This law, in force until July 1998, did not take into
account informal coalitions and shareholders’ agreements concerning issues other than voting
rights. A final issue refers to the increasing role of asset managers: asset managers on behalf
of their clients often hold major holdings. Formally, shares are in the name of clients, each of

25
them holding a percentage lower than that for which disclosure has to be made. Therefore, no
disclosure requirement applies in principle to asset managers.
27 For all the details, see Barca et al. (1994a) and Bianchi and Casavola (1996).
28 Values referring to this dataset are weighted with an indicator which combines the firm’s net
worth and the “consolidated” number of employees. Consolidated employees are the sum of
those of the company itself and of all those of companies owned directly or indirectly in
proportion to the stake owned by the company.
29 Or with what we define market capitalisation “deintegrated”, i.e., the difference between the
company market capitalisation and the market value of shares held by the company in other
listed companies belonging to the same group (integrated ownership and controlled shares).
30 For details, see Bianchi, Bianco and Enriques (1997).
31 Some further information is also drawn from a random sample of approximately 4,400
manufacturing companies with more than 10 employees surveyed in 1995 by Mediocredito
Centrale. The information available is similar (but slightly less detailed) to the previous
sample.
32 See Barca et al. (1994a).
33 It would be interesting to analyse this picture in the future, since it might be expected that the
introduction, in 1998, of a mandatory bid rule at the 30 per cent threshold will modify the
distribution.
34 The fact that the positive relationship disappears in the highest percentile is partly due to the
presence of the oil company ENI, which was in the process of being privatised and has been
listed in 1995, thus becoming the largest listed company (15 per cent of total market
capitalisation). In June 1996 the State still owned 85 per cent of the company and this strongly
affects the results.
35 Currently (September 1998) the stake of the state in ENI, the largest company on the stock
market, has decreased to 15 %; hence the data today would show a larger role for institutional

26
investors (Italian and foreign) and for the market.
36 See Hilferding (1910).
37 Other reasons have been identified for the adoption of the group structure in Italy. See Barca et
al. (1994b), Bianco, Gola, and Signorini (1996).
38 I.e., if the agent controls company A and has a share b1 in company B and company B has a
share b2 in B, the group block ownership in B is given by the sum of b1 and b2.
39 See Barca (1996); Barca et al. (1994b); Bianco, Gola, and Signorini (1996).
40 See Brioschi et al. (1990) and Barca et al. (1994a) for a description of the algorithm that
allows to compute it.
41 If however ENI is excluded, integrated ownership goes down to 42% and the share of the State
to about one third of total value.
42 In many instances it is not possible to move up along the control chain above non financial
companies (often partnerships).
43 If ENI is excluded, the value increases to 2.4 for all companies, and is higher also for the State
(2.3).
44 Notice that since the end of 1995 Olivetti is not controlled by the De Benedetti group any
more.

27
References
Ascarelli, T. (1955). Saggi di diritto commerciale. Milano: Giuffrè.
Barca, F. (1996). ‘On Corporate Governance in Italy: Issues, Facts and Agenda’. Fondazione ENI
Enrico Mattei Nota di Lavoro n. 10.
Barca, F., Bianchi, M., Brioschi, F., Buzzacchi, L., Casavola, P., Filippa, L., and Pagnini, M.
(1994a). Gruppo, proprietà e controllo nelle imprese italiane medio-grandi. Bologna: Il
Mulino.
Barca, F., Bianco, M., Cannari, L., Cesari, R., Gola, C., Manitta, G., Salvo, G., and Signorini, L.F.
(1994). Proprietà, modelli di controllo e riallocazione nelle imprese industriali italiane.
Bologna: Il Mulino.
Bianchi, M., and Casavola, P. (1996). ‘Piercing the Corporate Veil: Truth and Appearance in
Italian Listed Pyramidal Groups’. Fondazione ENI Enrico Mattei Nota di Lavoro n. 6
Fondazione ENI Enrico Mattei Nota di Lavoro n. 6.
Bianchi, M., Fabrizio S., and Siciliano, G. (1998). La proprietà “circolare” nei gruppi quotati
italiani, in Rapporto IRS sul mercato azionario 1998. Milano: Il Sole 24 Ore.
Bianchi, M., Bianco, M., and Enriques, L. (1997), Ownership, pyramidal groups and separation
between ownership and control in Italy, European Corporate Governance Network, mimeo.
Bianco, M., Gola, C., and Signorini, L.F. (1996). ‘Dealing with Separation Between Ownership and
Control: State, Family, Coalitions in Italian Corporate Governance’, Fondazione ENI Enrico
Mattei Nota di Lavoro n. 5.
Brescia Morra, C., Martiny, M., and Salleo,C. (1997). Il trasferimento del controllo societario:
profili di efficienza ed equità. Roma: Banca d’Italia, mimeo.
Brioschi, F., Buzzacchi, L., and Colombo, M. (1990), Gruppi di imprese e mercato finanziario.
Roma: La Nuova Italia Scientifica.
Ciocca, P. (1997). ‘Notes on Firms, Banks, Company Law’. Moneta e Credito, March.

28
Costi, R. (1995). ‘Privatizzazione e diritto delle società per azioni’, Giurisprudenza Commerciale,
I.
De Cecco, M., and Ferri, G. (1996). Le banche d’affari in Italia. Bologna: il Mulino.
Enriques, L. (1997). ‘Gruppi piramidali, operazioni intragruppo e tutela degli azionisti esterni:
appunti per un’analisi economica’. Giurisprudenza commerciale, I.
Ferri, G., and Pesaresi, N. (1996). ‘The Missing Link: Banking and Non Banking Financial
Institutions in Italian Corporate Governance’, Fondazione ENI Enrico Mattei Nota di Lavoro n.
4.
Hilferding, R. (1910). Das Finanzkapital. Frankfurt a.M.: Europäische Verlagsansstalt.
La Porta, F., Lopez de Silanes, F., Shleifer, A. and Vishny, R. (1998), Law and Finance, Journal of
Political Economy, December.
Marchetti, P. (1992), Nota sulla nozione di controllo nella legislazione speciale, Rivista delle
Societa’.
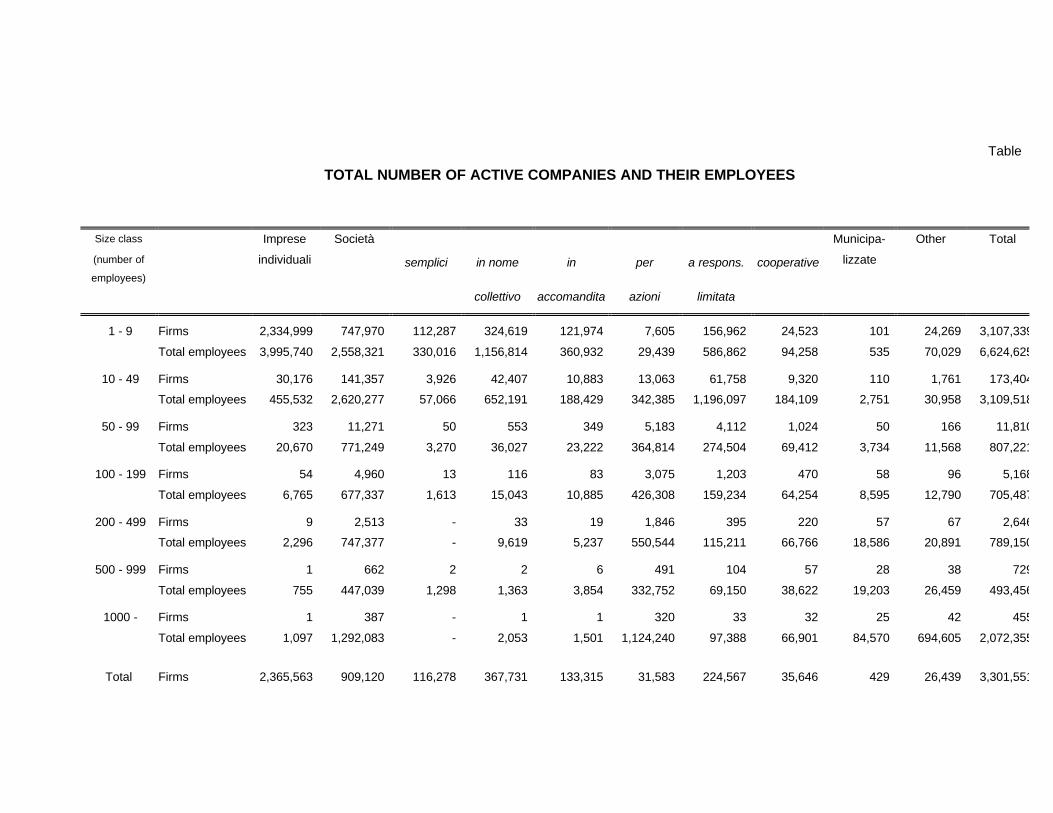
Table 1
TOTAL NUMBER OF ACTIVE COMPANIES AND THEIR EMPLOYEES
Size class Imprese Società Municipa- Other Total
(number of
employees)
individuali semplici in nome in per a respons. cooperative lizzate
collettivo accomandita azioni limitata
1 - 9 Firms 2,334,999 747,970 112,287 324,619 121,974 7,605 156,962 24,523 101 24,269 3,107,339
Total employees 3,995,740 2,558,321 330,016 1,156,814 360,932 29,439 586,862 94,258 535 70,029 6,624,625
10 - 49 Firms 30,176 141,357 3,926 42,407 10,883 13,063 61,758 9,320 110 1,761 173,404
Total employees 455,532 2,620,277 57,066 652,191 188,429 342,385 1,196,097 184,109 2,751 30,958 3,109,518
50 - 99 Firms 323 11,271 50 553 349 5,183 4,112 1,024 50 166 11,810
Total employees 20,670 771,249 3,270 36,027 23,222 364,814 274,504 69,412 3,734 11,568 807,221
100 - 199 Firms 54 4,960 13 116 83 3,075 1,203 470 58 96 5,168
Total employees 6,765 677,337 1,613 15,043 10,885 426,308 159,234 64,254 8,595 12,790 705,487
200 - 499 Firms 9 2,513 - 33 19 1,846 395 220 57 67 2,646
Total employees 2,296 747,377 - 9,619 5,237 550,544 115,211 66,766 18,586 20,891 789,150
500 - 999 Firms 1 662 2 2 6 491 104 57 28 38 729
Total employees 755 447,039 1,298 1,363 3,854 332,752 69,150 38,622 19,203 26,459 493,456
1000 - Firms 1 387 - 1 1 320 33 32 25 42 455
Total employees 1,097 1,292,083 - 2,053 1,501 1,124,240 97,388 66,901 84,570 694,605 2,072,355
Total Firms 2,365,563 909,120 116,278 367,731 133,315 31,583 224,567 35,646 429 26,439 3,301,551

2
Total employees 4,482,855 9,113,683 393,263 1,873,110 594,060 3,170,482 2,498,446 584,322 137,974 867,300 14,601,812
Source: ISTAT – 1991 Census.

3
Table 2
ACCESSIBILITY AND AVAILABILITY OF OWNERSHIP DATA
Accessibility of
data
Availability of
data on computer
Company register Yes Yes
Market Supervision Authority (Consob) Yes Yes
Banking Supervision Authority (Bank of
Italy)
No No
Insurance Industry Supervision Authority
(Isvap)
Yes No
Competition Authorities Yes No

4
Table 3
DATASET USED
INVIND (1) INVIND (1)
Size class LISTED FIRMS (2)
Size class (year 1992) (year 1996) (market (year 1996)
(number of
employees)
Number of
firms
Percentages Number of
firms
Percentages capitalization) Number of
firms
Percentages
5 percentile 19 8.9
10 percentile 10 4.7
50 - 99 196 20.1 211 20.0 25 percentile 31 14.5
100 - 199 200 20.6 255 24.2 50 percentile 51 23.8
200 - 499 291 29.9 307 29.1 75 percentile 51 23.8
500 - 999 143 14.7 133 12.6 90 percentile 31 14.5
1000 - 143 14.7 149 14.1 95 percentile 10 4.7
>95 percentile 11 5.1
Total 973 100.0 1055 100.0 Total 214 100.0
(1) Yearly survey of the Bank of Italy on manufacturing firms’ investments, based on a representative sample of manufacturing firms with more than 50employees. - (2) All listed firms in June 1996.

5
Table 4
VOTING RIGHTS CONCENTRATION OFMANUFACTURING COMPANIES
(1992)
This table shows mean, median, minimum, maximum values of direct stakes held by thelargest shareholders in manufacturing companies. The values are weighted in order to takeinto account the different coverage of the sample by size, sector and geographical area.
Voting rights distribution
Largest stake 2nd 3rd 4-10th
Mean
Size class
(number ofemployees)
50 - 99 59.20 20.19 9.90 8.14
100 - 199 71.95 14.62 6.54 5.46
200 - 499 78.07 12.99 3.41 3.30
500 - 999 82.58 10.36 2.62 1.75
1000 - 82.48 8.52 1.99 2.12
Total 66.51 17.11 7.69 6.41
Weighted Total (1) 76.77 12.11 4.24 3.79
Median 89.00 5.00 0.00 0.00
St. dev. 102.34 56.21 36.43 43.28
Min 0.40 0.00 0.00 0.00
Max 100.00 50.00 33.33 62.50
N. companies 971 971 971 971
(1) By employees.Source: Indagine sugli investimenti della Banca d'Italia (1993) on a representative sample ofmanufacturing companies with more than 50 employees.

6
Table 5
VOTING RIGHTS CONCENTRATION OF MANUFACTURING COMPANIES
(1996)
This table shows mean, median, minimum, maximum values of direct stakes held bythe largest shareholders in manufacturing companies. The values are weighted inorder to take into account the different coverage of the sample by size, sector andgeographical area.
Size class Voting rights distribution
(number of employees) Largest stake 2nd and 3rd other
Mean
Size classes
(employees)
50 – 99 63.56 27.81 8.63
100 - 199 68.44 23.66 7.89
200 - 499 76.69 16.75 6.55
500 - 999 80.05 13.76 6.19
1000 - 82.55 10.50 6.95
Total 67.69 21.29 8.01
Weighted Total (1) 77.78 17.24 6.97
Median 80.00 12.00 0.00
St. dev. 89.88 68.85 49.40
Min 9.00 0.00 0.00
Max 100.00 80.00 82.00
N. companies 952 952 952
(1) By employees.Source: Indagine sugli investimenti della Banca d'Italia (1997) on a representativesample of manufacturing companies with more than 50 employees.

7
Table 6
VOTING RIGHTS CONCENTRATION OF LISTED COMPANIES(1996)
This table shows mean, median, minimum, maximum values of direct stakes held by thelargest relevant shareholders in listed companies. Relevan shareholders are defined as thoseholding at least 2 per cent. The “market” is defined as the sum of all holding smaller than 2per cent.
Voting rights distribution
Largest stake 2nd 3rd 4-10th Market(1)
Mean
Size class (market
capitalization)
5 percentile 50.54 14.18 4.19 4.20 26.78
10 percentile 51.40 11.07 6.24 5.86 25.42
25 percentile 53.27 8.90 4.92 10.87 20.89
50 percentile 47.56 11.95 5.17 7.01 27.59
75 percentile 49.11 10.11 3.50 6.32 30.74
90 percentile 42.42 9.36 2.95 3.54 41.65
95 percentile 37.02 7.00 3.17 2.23 50.54
>95 percentile 48.63 2.55 2.03 2.31 49.10
Total 48.02 10.13 4.12 6.13 31.50
Weighted Total (1) 50.01 4.62 2.16 2.23 40.88
Median 50.97 7.55 3.01 2.01
St. dev. 22.20 9.13 4.54 9.15
Min 2.11 0.00 0.00 0.00
Max 100.00 43.58 26.43 45.37
N. companies 214 214 214 214
(1) By market capitalization.
Source: Consob. Information is based on all the communications to Consob reporting holdingsin listed companies larger than 2% of capital.

8
Table 7
VOTING RIGHTS BY TYPE OF INVESTOR(1992)
In the table voting rights for a representative sample of companies with more than 50 employees are attributed to
the different categories of investor. The values are weighted in order to take into account the different coverage of
the sample by size, sector and geographical area. Row sums do not add up 100 per cent because in the survey
only information regarding the 10 largest shareholders was requested.
Size class
(number of
employees)
IndividualForeign
company
State-owned
company
Holding
company
Other non-
financial
company
Financial
companyTotal
Mean
50 - 99 62.86 5.30 1.99 13.65 13.64 0.00 97.43
100 - 199 37.71 7.69 6.33 28.01 18.64 0.20 98.57
200 - 499 25.12 14.13 6.84 33.62 17.52 0.53 97.76
500 - 999 14.37 20.13 15.59 34.04 12.27 0.91 97.32
1000 - 6.10 22.98 14.55 42.63 8.16 0.58 94.99
Total 48.03 8.05 4.59 21.57 15.33 0.17 97.72
Weighted Total (1) 24.35 15.89 12.23 32.14 11.81 0.47 96.89
Median 0.00 0.00 0.00 0.00 0.00 0.00
St. dev. 159.69 85.89 65.43 132.15 115.47 10.01
Min 0.00 0.00 0.00 0.00 0.00 0.00
Max 100.00 100.00 100.00 100.00 100.00 100.00
(1) By employees.
Source: Indagine sugli investimenti della Banca d'Italia (1993) on a representive sample of companies with more than 50employees.

9
Table 8
VOTING RIGHTS OF LISTED COMPANIES BY TYPE OF INVESTOR(1996)
In the table voting rights for listed companies are attributed to the different categories of investors. Data are based on all thecommunications to Consob reporting holdings in listed companies larger than 2% of capital. This is the reason why row sums do notadd up to 100 per cent. Therefore the difference between 100 and the row sums is dispersed ownership.
Size class
(market
capitalization)
Individuals Foreign StateNon-
Financial
Company
Banks InsuranceMutual
Funds
Other
FinancialTotal
Mean
5 percentile 9.00 17.02 0.00 38.98 6.36 0.07 0.44 1.35 73.22
10 percentile 17.18 13.30 0.00 29.96 10.62 3.52 0.00 0.00 74.58
25 percentile 6.00 11.15 0.00 46.68 12.18 0.47 0.47 2.16 79.11
50 percentile 5.45 9.39 0.60 44.17 8.19 1.13 1.54 1.94 72.41
75 percentile 3.55 10.97 5.87 36.70 8.02 2.88 0.85 0.42 69.26
90 percentile 2.74 4.05 0.70 34.31 10.22 5.61 0.53 0.19 58.35
95 percentile 0.00 1.77 1.38 26.74 17.68 1.05 0.20 0.62 49.44
>95 percentile 0.00 0.43 16.42 17.22 10.40 5.66 0.00 0.77 50.90
Total 4.99 9.25 2.62 37.90 9.53 2.36 0.76 1.09 68.50
Weighted Total (1) 0.82 2.52 20.16 23.79 8.42 2.60 0.20 0.66 59.12
Median 0.00 0.00 0.00 44.51 0.00 0.00 0.00 0.00
St. dev. 13.47 20.27 13.04 29.95 20.46 10.64 1.76 6.92
Min 0.00 0.00 0.00 0.00 0.00 0.00 0.00 0.00
Max 74.30 99.39 97.36 100.00 100.00 93.91 8.90 66.86
(1) By market capitalization.
Source: Consob.

10
Table 10DISAGGREGATION OF VOTING BLOCKS ACCORDING TO THE TRANSPARENCY DIRECTIVE
In the table total voting blocks for the main listed companies are disaggregated according to the reason for the notification as listed in the Large Holdings Directive (88/627/EEC), also referred to as the
"Transparency Directive". The reasons, from 1 to 8, correspond to those listed in Article 7 of the Directive. Stakes listed under the motivation 9 are direct stakes.
COMPANY BLOCK HOLDER TOTAL DISAGGREGATION OF BLOCK BY MOTIVATION
VOTING BLOCK 1 2 3 4 5 6 7 8
ALLEANZA ASSICURAZIONI SPA Banca d'Italia 2.02 2.02
ALLEANZA ASSICURAZIONI SPA Generali spa 65.27 0.01 65.26
BANCA COMMERCIALE ITALIANA Cartiere Burgo spa 2.03 2.03 0.00
BANCA COMMERCIALE ITALIANA Compagnie financière 2.96 2.96 0.00
BANCA COMMERCIALE ITALIANA Generali spa 2.98 1.86 1.12
BANCA COMMERCIALE ITALIANA Commerzbank 2.99 2.99 0.00
BANCA DI ROMA SPA Banco di Napoli 3.83 3.83 0.00
BANCA DI ROMA SPA IRI 13.77 0.01 13.76
BANCA DI ROMA SPA Cassa Risparmio di Roma 74.29 64.66 9.63
BANCA FIDEURAM SPA IMI 74.90 74.90
BANCO AMBROSIANO VENETO Patto Banco Ambroveneto 69.49 69.49 0.00
BENETTON GROUP SPA Ragione 71.28 71.28 0.00
COMPART SPA Banco di Napoli 2.46 2.46 0.00
COMPART SPA Ministero del Tesoro 2.99 2.99 0.00
COMPART SPA Banca Commerciale Italiana 3.25 0.71 0.44 2.10
COMPART SPA Monte dei Paschi di Siena 3.38 3.38 0.00
COMPART SPA Compagnia di San Paolo 8.43 8.43 0.00
COMPART SPA Cassa Risparmio di Roma 10.14 10.14 0.00
COMPART SPA Credito Italiano 11.01 2.98 0.89 7.14
COMPART SPA Mediobanca spa 15.26 15.26
CREDITO ITALIANO SPA Commercial Union 2.02 2.02 0.00
CREDITO ITALIANO SPA Allianz Holding ag 3.00 3.00 0.00
CREDITO ITALIANO SPA Radici Pesenti Rosalia 3.00 3.00 0.00
EDISON SPA Compart spa 61.33 61.33 0.00

11
ENI SPA ENTE NAZ.LE IDROCARBURI Ministero del Tesoro 85.00 85.00
FIAT SPA Patto FIAT 33.38 33.38 0.00
GENERALI SPA Euralux spa 4.78 4.78
GENERALI SPA Banca d'Italia 4.88 4.88
GENERALI SPA Mediobanca spa 12.67 6.66 0.13 5.88
IFIL SPA Pictet % Cie Banchieri 2.10 2.10
IFIL SPA Findim finanziaria 4.78 4.78
IFIL SPA Bankers Trust International plc 6.23 6.23
IFIL SPA The public institution 6.90 6.90
IFIL SPA Giovanni Agnelli & C. - SAPA 52.51 52.51 0.00
IMI - ISTITUTO MOBILIARE ITALIANO Allianz Holding ag 2.51 2.51
IMI - ISTITUTO MOBILIARE ITALIANO Ministero del Tesoro 8.07 8.07 0.00
IMI - ISTITUTO MOBILIARE ITALIANO Fondazione Cassa 9.89 9.89 0.00

12
Table 10
COMPANY BLOCK HOLDER TOTAL DISAGGREGATION OF BLOCK BY MOTIVATION
VOTING BLOCK 1 2 3 4 5 6 7 8
IMI - ISTITUTO MOBILIARE ITALIANO Compagnia di San Paolo 9.91 9.91 0.00
IMI - ISTITUTO MOBILIARE ITALIANO Monte dei Paschi di Siena 9.91 9.91 0.00
INA - ISTIT. NAZ.LE ASSICURAZIONI Banca d'Italia 2.54 2.54
INA - ISTIT. NAZ.LE ASSICURAZIONI IMI 3.00 3.00
INA - ISTIT. NAZ.LE ASSICURAZIONI Fondazione Cassa 3.01 3.01 0.00
INA - ISTIT. NAZ.LE ASSICURAZIONI Compagnia di San Paolo 3.10 3.10 0.00
INA - ISTIT. NAZ.LE ASSICURAZIONI Ministero del Tesoro 34.38 34.38
ISTIT. BANCARIO S. PAOLO DI TORINO IMI 2.21 0.39 1.82
ISTIT. BANCARIO S. PAOLO DI TORINO Ente Banca Nazionale 2.52 2.52
ISTIT. BANCARIO S. PAOLO DI TORINO Ferrovie dello Stato 2.90 2.90
ISTIT. BANCARIO S. PAOLO DI TORINO Ministero del Tesoro 3.36 3.36
ISTIT. BANCARIO S. PAOLO DI TORINO Compagnia di San Paolo 65.04 65.04 0.00
ITALCEMENTI SPA FABBRICHE Finanza & Futuro 2.28 2.28
ITALCEMENTI SPA FABBRICHE Radici Pesenti Rosalia 54.51 54.43 0.08
ITALGAS SPA Banca d'Italia 6.22 6.22
ITALGAS SPA Ministero del Tesoro 41.93 41.93 0.00
LA FONDIARIA ASSICURAZIONI Banca d'italia 2.32 2.32
LA FONDIARIA ASSICURAZIONI Generali 6.56 6.56
LA FONDIARIA ASSICURAZIONI Mediobanca spa 13.78 13.78
LA FONDIARIA ASSICURAZIONI Compart spa 31.84 0.13 31.71
MEDIOBANCA SPA Patto Mediobanca 50.00 50.00 0.00
MONTEDISON SPA Mediobanca spa 3.77 3.77
MONTEDISON SPA Merrill Lynch & C. 3.88 3.88 0.00
MONTEDISON SPA The codelouf trust 3.92 3.92 0.00
MONTEDISON SPA Compart spa 32.27 3.36 28.91
OLIVETTI SPA - ING. C. OLIVETTI & C. Mediobanca spa 2.21 2.21
OLIVETTI SPA - ING. C. OLIVETTI & C. Pdfm limited 2.96 2.96
OLIVETTI SPA - ING. C. OLIVETTI & C. Deutscher 4.12 4.12
OLIVETTI SPA - ING. C. OLIVETTI & C. De Benedetti Carlo 14.44 14.44 0.00

13
PARMALAT FINANZIARIA SPA Janus Capital corporation 2.17 2.17
PARMALAT FINANZIARIA SPA Schroder investiment 3.87 3.87
PARMALAT FINANZIARIA SPA Tanzi Calisto 50.93 50.93 0.00
PIRELLI SPA Finanza & Futuro 2.01 2.01
PIRELLI SPA Pirelli & C. accomandita 2.57 2.57
PIRELLI SPA Societè Internationale 51.21 51.21 0.00
RAS SPA - RIUNIONE Allianz Holding ag 56.13 56.13 0.00
ROLO BANCA 1473 SPA Fondazione Cassa 3.96 3.96
ROLO BANCA 1473 SPA Allianz Holding ag 4.16 4.16 0.00
ROLO BANCA 1473 SPA Credito Italiano 64.83 45.11 19.72
SAIPEM SPA Ministero del Tesoro 76.10 76.10 0.00
STET SPA - SOCIETA' IRI 63.27 63.27
TELECOM ITALIA MOBILE SPA IRI 61.33 61.33 0.00
TELECOM ITALIA SPA IRI 64.59 64.59 0.00

14
Table 9
VOTING BLOCK CONCENTRATION(1996)
This table shows mean, median, minimum, maximum values of
voting blocks, defined as the sum of shares directly owned and
those owned through other companies by the same agent, held by
relevant shareholders, i.e., those owning at least 2 per cent. In Panel
A all listed companies are included. In Panel B, for comparability
with other countries we consider only shareholdings larger than 5
per cent. In Panel C we also exclude all financial companies.
Size classOwnership Distribution
(market capitalization) Largest 2nd 3rd 4-10th
stake
PANEL A: WHOLE SAMPLE – ALL INFORMATION
Mean
Size classes
(market capitalization)
5 percentile 54.21 12.53 3.45 3.01
10 percentile 51.21 9.29 3.52 8.51
25 percentile 52.25 8.35 4.89 9.82
50 percentile 53.40 8.39 4.12 5.65
75 percentile 55.47 6.48 3.09 4.81
90 percentile 46.06 7.54 2.38 2.27
95 percentile 41.25 4.58 2.62 0.98
>95 percentile 49.36 2.32 1.87 1.89
Total 51.86 7.73 3.46 5.05
Weighted Total (1) 52.26 3.45 1.84 1.57
Median 54.53 5.04 2.67 0.00
St. dev. 23.34 7.93 4.29 9.08
Min 2.11 0.00 0.00 0.00
Max 100.00 34.00 26.43 45.40
N. of companies 214 214 214 214

15
PANLE B: WHOLE SAMPLE - EXCLUDING INFORMATION ON HOLDINGS SMALLER THAN 5%
Mean 52.26 6.88 2.42 2.15
Median 54.54 5.04 0.00 0.00
St. dev. 23.50 8.51 4.57 6.44
Min 0.00 0.00 0.00 0.00
Max 100.00 34.00 26.43 43.49
N. companies 214 214 214 214
PANEL C: NON-FINANCIAL COMPANIES - EXCLUDING INFORMATION ON HOLDINGS SMALLER
THAN 5%
Mean 52.85 7.08 2.56 2.63
Median 54.53 5.89 0.00 0.00
St. dev. 21.70 8.38 4.49 7.12
Min 9.34 0.00 0.00 0.00
Max 99.39 34.00 23.76 43.49
N. companies 170 170 170 170
(1) By market capitalization.Source: Consob.

Table 11
VOTING BLOCKS IN LISTED COMPANIES BY TYPE OF INVESTOR(1996)
In the table voting blocks in listed companies are attributed to the different categories of investors. A voting block is the sum of sharesdirectly owned and those owned through other companies by the same agent.Data are based on all the communications to Consobreporting holdings in listed companies larger than 2% of capital. This is the reason why row sums do not add up to 100 per cent.Therefore the difference between 100 and the row sums is dispersed ownership.
Individuals Foreign StateNon –
Financial
Firms
Banks InsuranceMutual
Funds
Other
FinancialTotal
Mean
Size class (market
capitalization)
5 percentile 35.81 10.03 0.00 22.39 2.87 0.00 0.63 1.47 73.20
10 percentile 19.88 14.51 0.51 27.11 11.04 0.00 0.44 0.00 73.49
25 percentile 21.90 8.55 7.25 26.47 11.89 0.40 0.55 2.16 79.17
50 percentile 23.48 7.99 4.33 23.34 9.29 0.00 1.41 1.94 71.78
75 percentile 22.13 12.84 8.13 16.80 8.16 0.54 0.85 0.42 69.87
90 percentile 13.76 4.79 6.95 17.82 10.11 3.96 0.53 0.34 58.26
95 percentile 0.50 7.41 5.57 17.15 17.69 0.30 0.20 0.62 49.44
>95 percentile 0.00 5.29 26.91 2.12 10.29 5.44 0.00 0.79 50.84
Total 20.07 9.07 6.79 20.06 9.48 1.07 0.78 1.12 68.44
Weighted Total (1) 4.66 4.10 30.81 8.26 8.40 2.01 0.20 0.68 59.12
Median 0.00 0.00 0.00 2.02 0.00 0.00 0.00 0.00
St. dev. 28.02 21.75 20.47 28.04 19.95 7.99 1.74 6.94
Min 0.00 0.00 0.00 0.00 0.00 0.00 0.00 0.00
Max 95.41 99.98 97.36 100.00 95.55 93.91 8.90 66.86
(1) By market capitalization.Source: Consob..

2
Table 12
SEPARATION BETWEEN OWNERSHIP AND CONTROL(1996, weighted)
In the table separation is defined as the ratio between the amount of capital under control and the amount of capital owned
(integrated ownership). Only companies with identifyed controlling agent are considered. Values in parenthesis are computed
excluding ENI, the largest listed company where the State in 1996 still had 85%. Values are weighted by "un-integrated" market
capitalization, defined as the difference between the company’s market capitalization and the market value of the shares held
by the company in other listed firms belonging to the same group.
Size class
(market
capitalization)
Individuals Foreign State Non –
Financial
Firms
Banks Insurance Other
Financial
Through
Formal
Agreements
Total
5 percentile 3.00 1.37 0.00 (0.00) 2.52 0.00 0.00 0.00 1.37 1.97
10 percentile 2.03 2.23 0.00 (0.00) 2.77 3.85 0.00 0.00 0.00 2.52
25 percentile 5.28 1.48 2.23 (2.23) 3.00 1.29 0.00 1.61 2.18 2.53
50 percentile 2.78 1.90 1.95 (1.95) 2.44 1.82 0.00 1.71 1.71 2.22
75 percentile 3.07 1.50 1.40 (1.40) 2.86 1.72 0.00 0.00 1.77 2.05
90 percentile 4.38 1.76 1.71 (1.71) 6.25 1.30 1.06 0.00 1.84 2.42
95 percentile 0.00 1.95 2.81 (2.81) 2.65 2.11 0.00 0.00 2.00 2.30
>95 percentile 0.00 1.78 1.58 (2.51) 9.72 1.54 1.53 0.00 0.00 1.77 (2.55)
Total 3.62 1.74 1.60 (2.33) 4.48 1.67 1.45 1.68 1.86 1.95 (2.40)
Source: Consob. Information is based on all the communications to Consob reporting holdings in listed companies larger than 2% of capital.
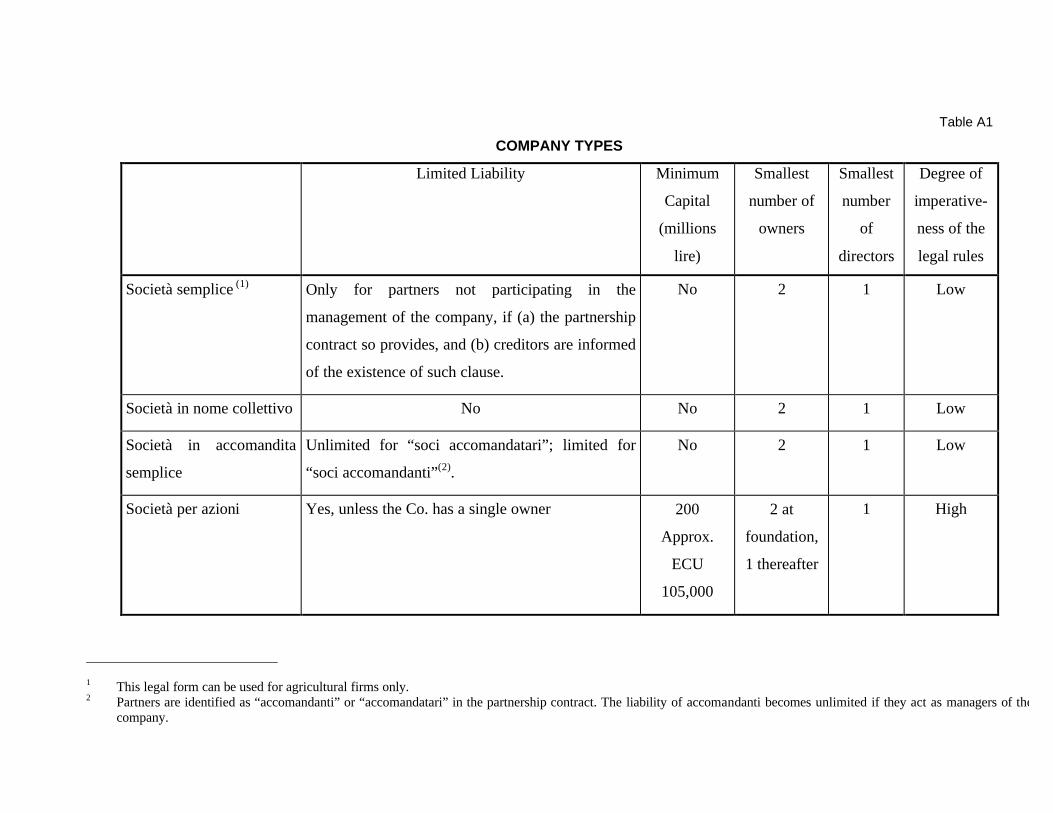
Table A1
COMPANY TYPES
Limited Liability Minimum
Capital
(millions
lire)
Smallest
number of
owners
Smallest
number
of
directors
Degree of
imperative-
ness of the
legal rules
Società semplice (1) Only for partners not participating in the
management of the company, if (a) the partnership
contract so provides, and (b) creditors are informed
of the existence of such clause.
No 2 1 Low
Società in nome collettivo No No 2 1 Low
Società in accomandita
semplice
Unlimited for “soci accomandatari”; limited for
“soci accomandanti”(2).
No 2 1 Low
Società per azioni Yes, unless the Co. has a single owner 200
Approx.
ECU
105,000
2 at
foundation,
1 thereafter
1 High
1 This legal form can be used for agricultural firms only.2 Partners are identified as “accomandanti” or “accomandatari” in the partnership contract. The liability of accomandanti becomes unlimited if they act as managers of the
company.

2
Società in accomandita
per azioni
Unlimited for “soci accomandatari” and limited for
“soci accomandanti”.
200 2 at
foundation,
1 thereafter
1 High
Società a responsabilità
limitata
Yes 20
Approx.
ECU 10,500
1(3) 1 Medium
Società cooperative Co-operatives can be founded either as companies
with limited liability or as companies with
unlimited liability.
No 3 1 High
3 The 12th Company Law Directive on single owner companies was transposed with Decreto legislativo 3 marzo 1993 n. 88, which provides that whenever the company
falls into the hands of (or is founded by) a single owner, the directors or the single owner shall deposit at the company register (“registro delle imprese”) a statementindicating the identity of the owner, his date and place of birth, his domicile and his citizenship.

3
GIOVANNI AGNELLI & C. S.a.p.a.
I F I *
UNICEMFIAT IFIL Exor Group
82,5%
50,5%24,8%
15,3%
28,2%
97,2%
56,5%
49%51%
41%
88,89%
50,0122,2%12,3%
Mediobanca* 2,8%
Deutsche Bank*
2,4%
Figure 1
(*) Linked by a voting
Listed
Cementeriedi Augusta
68,8%Cementeriedi Barletta
62,9%
Fiat
ImpresitITEDITeksidFiat AvioFidisComau
Toro
AssicurazSnia BPD
Fiat
Ferroviari
Magneti
Marelli
New
HollandFiat AutoIveco
Berto
Lamet
100%100%100%100%55,3%69,1%59,4%48,3%100%64,0%70,0%100%100%
Snia
Fibre
Sorin
Biomedica
Caffaro
Euroind
La
EUFIN AUCHA
Worms
AGF Somal

Figure 2
Concentration of direct shares
Larg
est direct share
per
com
pany %
Fraction of the data0 .25 .5 .75 1
0
25
50
75
100

2
Figure 3
Concentration of voting blocks
Larg
est blo
ck p
er
com
pany %
Fraction of the data0 .25 .5 .75 1
0
25
50
75
100

3
Figure 4
Models of corporate control in Italian industry
(percentages)
Absolutecontrol
Family control Coalitioncontrol
Financialsupervision
Hierarchicalgroup control
Stateownership
Pseudo-publiccompany
0
10
20
30
40
50
60
70
Absolutecontrol
Family control Coalitioncontrol
Financialsupervision
Hierarchicalgroup control
Stateownership
Pseudo-publiccompany
<200 200-499
500-999 >1000