puzzles and policies - World Bank Documents
180
WORLD BANK DISCUSSION PAPER NO. 354 work in progress for public discussion Saving across the WVorld PuzZles iiiHd P,licies Klaus tSth ii ii,,] b lchik 'I ILis kSelY-.. Public Disclosure Authorized Public Disclosure Authorized Public Disclosure Authorized Public Disclosure Authorized Public Disclosure Authorized Public Disclosure Authorized Public Disclosure Authorized Public Disclosure Authorized
-
Upload
khangminh22 -
Category
Documents
-
view
4 -
download
0
Transcript of puzzles and policies - World Bank Documents

WORLD BANK DISCUSSION PAPER NO. 354
work in progress
for public discussion
Saving across the WVorldPuzZles iiiHd P,licies
Klaus tSth ii ii,,] b lchik 'IILis kSelY-..
Pub
lic D
iscl
osur
e A
utho
rized
Pub
lic D
iscl
osur
e A
utho
rized
Pub
lic D
iscl
osur
e A
utho
rized
Pub
lic D
iscl
osur
e A
utho
rized
Pub
lic D
iscl
osur
e A
utho
rized
Pub
lic D
iscl
osur
e A
utho
rized
Pub
lic D
iscl
osur
e A
utho
rized
Pub
lic D
iscl
osur
e A
utho
rized

Recent World Bank Discussion Papers
No. 286 Credit Policies and the Industrialization of Korea. Yoon Je Cho and Joon-Kyung Kim
No. 287 East Asia's Environment: Principles and Prioritiesfor Action. Jeffrey S. Hammer and Sudhir Shetty
No. 288 Africa's Experience with Structural Adjustment: Proceedings of the Harare Seminar, May 23-24, 1994. Edited by KapilKapoor I ,,
No. 289 Rethinking Research on Land Degradation in Developing Countries. Yvan Biot, Piers Macleod Blaikie, Cecile Jackson,and Richard Palmer-Jones
No. 290 Decentralizing Infrastructure: Advantages and Limitations. Edited by Antonio Estache
No. 291 Transforming Payment Systems: Meeting the Needs of Emerging Market Economies. Setsuya Sato and David BurrasHumphrey
No. 292 Regulated Deregulation of the Financial System in Korea. Ismail Dalla and Deena Khatkhate
No. 293 Design Issues in Rural Finance. Orlando J. Sacay and Bikki K. Randhawa
No. 294 Finantcing Health Services Throughi User Fees and Insurance: Case Studiesfrom Sub-Saharan Africa. R. Paul Shaw andMartha Ainsworth
No. 295 The Participation of Nongovernmental Organizations in Poverty Alleviation: The Case Study of the Honduras SocialInvestment Fund Project. Anna Kathryn Vandever Webb, Kye Woo Lee, and Anna Maria Sant'Anna
No. 296 Reforming the Energy Sector in Transition Economies: Selected Experience and Lessons. Dale Gray
No. 297 Assessing Sector Institutions: Lessons of Experiencefrom Zambia's Education Sector. Rogerio F. Pinto and Angelous J.Mrope
No. 298 Uganda's AIDS Crisis: Its Implicationsfor Development. Jill Armstrong
No. 299 Towards a Payments System Lawfor Developing and Transition Economies. Raj Bhala
No. 300 Africa Can Compete! Export Opportunities and Challengesfor Garments and Home Products in the European Market.Tyler Biggs, Margaret Miller, Caroline Otto, and Gerald Tyler
No. 301 Review and Outlookfor the World Oil Market. Shane S. Streifel
No. 302 The Broad Sector Approach to Investment Lending: Sector Investment Programs. Peter Harrold and Associates
No. 303 Institutional Adjustment and Adjusting to Institutions. Robert Klitgaard
No. 304 Putting Institutional Economics to Work: From Participation to Governance. Robert Picciotto
No. 305 Pakistan's Public Agricultural Enterprises: Inefficiencies, Market Distortions, and Proposalsfor Reform. Rashid Faruqee,Ridwan Ali, and Yusuf Choudhry
No. 306 Grameen Bank: Performance and Stability. Shahidur R. Khandker, Baqui Khalily, and Zahed Khan
No. 307 The Uruguay Round and the Developing Economies. Edited by Will Martin and L. Alan Winters
No. 308 Bank Governance Contracts: Establishing Goals and Accountability in Bank Restructuring. Richard P. Roulier
No. 309 Public and Private Secondary Education in Developing Countries: A Comparative Study. Emmanuel Jimenez andMarlaine E. Lockheed with contributions by Donald Cox, Eduardo Luna, Vicente Paqueo, M. L. de Vera, andNongnuch Wattanawaha
No. 310 Practical Lessonsfor Africafrom East Asia in Industrial and Trade Policies. Peter Harrold, Malathi Jayawickrama, andDeepak Bhattasali
No. 311 The Impact of the Uruguay Round on Africa. Peter Harrold
No. 312 Procurement and Disbursement Manualfor Projects with Community Participation. Gita Gopal
No. 313 Harnessing Informationfor Development: A Proposalfor a World Bank Group Strategy. Eduardo Talero and PhilipGaudette
No. 314 Colombia's Pension Reform: Fiscal and Macroeconomic Effects. Klaus Schmidt-Hebbel
No. 315 Land Quality Indicators. Christian Pieri, Julian Dumanski, Ann Hamblin, and Anthony Young
No. 316 Sustainability of a Government Targeted Credit Program: Evidencefrom Bangladesh. Shahidur R. Khandker, ZahedKhan, and Baqui Khalily
No. 317 Selected Social Safety Net Programs in the Philippines: Targeting, Cost-Effectiveness, and Optionsfor Reform. KalanidhiSubbarao, Akhter U. Ahmed, and Tesfaye Teklu
No. 318 Private Sector Development During Transition: The Visegrad Countries. Michael S. Borish and Michel Noel
No. 319 Education Achievements and School Efficiency in Rural Bangladesh. Shahidur R. Khandker
No. 320 Household and Intrahouseliold Impacts of the Grameen Bank and Similar Targeted Credit Programs in Bangladesh. MarkM. Pitt and Shahidur R. Khandker
(Continued on the inside back cover)

WORLD BANK DISCUSSION PAPER NO. 354
Saving across the WorldPuzzles and Policies
Klaus Schmidt-HebbelLuis Serve'n
The World BankWashington, D.C.

Copyright i 1997The International Bank for Reconstructionand Development/THE WORLD BANK1818 H Street, N.W.Washington, D.C. 20433, U.S.A.
All rights reservedManufactured in the United States of AmericaFirst printing January 1997
Discussion Papers present results of country analysis or research that are circulated to encouragediscussion and comment within the development community. To present these results with the leastpossible delay, the typescript of this paper has not been prepared in accordance with the proceduresappropriate to formal printed texts, and the World Bank accepts no responsibility for errors. Some sourcescited in this paper may be informal documents that are not readily available.
The findings, interpretations, and conclusions expressed in this paper are entirely those of the author(s)and should not be attributed in any manner to the World Bank, to its affiliated organizations, or tomembers of its Board of Executive Directors or the countries they represent. The World Bank does notguarantee the accuracy of the data included in this publication and accepts no responsibility whatsoeverfor any consequence of their use. The boundaries, colors, denominations, and other information shown onany map in this volume do not imply on the part of the World Bank Group any judgment on the legalstatus of any territory or the endorsement or acceptance of such boundaries.
The material in this publication is copyrighted. Requests for permission to reproduce portions of itshould be sent to the Office of the Publisher at the address shown in the copyright notice above. TheWorld Bank encourages dissemination of its work and will normally give permission promptly and, whenthe reproduction is for noncommercial purposes, without asking a fee. Permission to copy portions forclassroom use is granted through the Copyright Clearance Center, Inc., Suite 910, 222 Rosewood Drive,Danvers, Massachusetts 01923, U.S.A.
For a copy of Update describing new publications, contact the Distribution Unit, Office of the Publisher,The World Bank, 1818 H Street, N.W., Washington, D.C. 20433, U.S.A., or Publications, The World Bank,66, avenue d'Iena, 75116 Paris, France. A catalog and ordering information are also available on theInternet at http: / /www.worldbank.org.
ISSN: 0259-210X
Klaus Schmidt-Hebbel is gerente de investigation, Central Bank of Chile, Santiago. Luis Serven is senioreconomist in the Macroecomonics and Growth Division of the World Bank's Policy Research Department.
Library of Congress Cataloging-in-Publication Data
Schmidt-Hebbel, Klaus.Saving across the world: puzzles and policies / Klaus Schmidt-
Hebbel, Luis Serven.p. cm.
Includes bibliographical references.ISBN 0-8213-3852-81. Saving and investment-Case studies. 2. Consumption
(Economics)-Case studies. 3. Fiscal policy-Case studies.I. Serven, Luis. 11. Title.HC79.S3S353 1997339.4'3-dc2l 96-37903
CIP

iii
CONTENTS
FOREWORD .................................... ............ v
ABSTRACT ............................................................. vi
ACKNOWLEDGMENTS ................................................. vii
SUMMARY AND OVERVIEW ............................................... ix
PART I: FACTS, THEORIES, AND RESEARCH ISSUES ....... .................... 1
1. Saving: World Trends ................................................. 12. Saving/Consumption Theories . .......................................... 143. Research Issues . ................................................ 21
PART Il: PROPOSED RESEARCH . .......................................... 27
A. DATA BASE AND PANEL ESTIMATION MODELS ....... .................... 28Al. A World Data Base of Aggregate Country Time Series ...... ............. 28A2. Estimating Panel Data Models ............. ........................ 46
B. SAVING ACROSS THE WORLD ............ ............................. 55B1. Saving and Policies across the World .59B2. Does Income Distribution Affect Saving? . 60B3. Saving, Investment and Growth in the World: Correlation and Causality . 65B4. Saving-Investment-Growth Links .73B5. What Determnines Saving at the Household Level? . 81
C. POLICY ISSUES OF WORLDWIDE IMPORTANCE . .91Cl. How Effective is Fiscal Policy in Raising National Saving? .91C2. What Drives Consumption Booms? . 101C3. Do Tax Incentives Raise Private Saving? .106C,4. Does Financial Reform Raise or Reduce Saving? .108C5. Is Pension System Reform Conducive to Higher Saving? .112
D. LESSONS FROM INTERNATIONAL SAVING EXPERIENCES .. 119DI. How Does Saving Behave under Systemic Transition ? .119D2. Saving and Growth Take-off What Breeds Success ? .123D3. Can Africa's Saving Collapse Be Reverted ? .128D4. Methodology for Country Case Studies .134
REFERENCES ............ 147

iv
Charts, Figures, and Tables
Chart 1: Saving across the World: Puzzles and Policies (Project Organization) ... .... xiii
Figure 1: World Saving and Real Interest Rates ............................. 2Figure 2: Saving Rates in World Regions (unweighted averages) ... 3Figure 2a: Saving Rates in World Regions (averages weighted by GNP) .... ........ 5Figure 2b: Saving Rates in World Regions (averages weighted by population) .... ..... 6Figure 3: Saving Rates by Developing Regions ........................... 7Figure 4: Saving Rates in Transition Economies . . .......................... 8Figure 5: Long-Term World Saving and Growth Rates ....................... 10Figure 6: Long-Tern World Saving and Income Levels ........................ 11Figure 7: Long-Term World Saving and Investment Rates ..................... 12Figure 8: Long-Term World Saving Rates and Income Distribution ............... 15Figure 9: Saving, Investment, and Growth in Sub-Saharan Africa ............... 129Figure 10: Saving and Growth Rates in Five Case-Study Countries .............. 140
Table 1: Cross-Country Correlations between Long-Term Saving Ratesand Other Variables ........................ ........................... 13
Table Al: Measures Applied to Revise Final Consumption Expenditure .39Table A2: Saving and Income Measures ....................................... 42Table A3: Main Variables included in World Data Base .. .. . ........................ 45Table Dl: Gross Domestic Saving in Selected Transition Economies .... ......... 120Table D2: Ranking of Take-off Countries by Changes in Saving,
Investment, and Growth Rates .................................. 126

v
FOREWORD
World saving rates have been falling and the gap between industrial-country anddeveloping-country saving has widened since the 1 970s. Within the developing world, thesaving divergence has been dramatic: saving rates have doubled in East Asia, stagnated inLatin America, and collapsed in Sub-Saharan Africa. Saving disparities have been closelymirrored by growth performances: across countries, higher saving rates have been matchedby higher income growth.
The coexistence of virtuous cycles of saving and prosperity in some developingcountries with poverty traps of under-saving and stagnation in many others is a powerfulreason for a closer look at the behavior of saving and its relation to growth. In addition toits direct growth impact, however, an adequate supply of saving is also a major policy concernbecause it contributes to reduce country vulnerability to unexpected shifts in internationalcapital flows. In this way, high national saving helps ensure macroeconomic stability, itselfa powerful growth factor.
Understanding the forces behind saving disparities across different countries and timeperiods, and identifying the role of specific policies that can contribute to a saving-growthtake-off, are high on the World Bank's research agenda. This World Bank Discussion Paperis based on the research proposal on Saving Across the World: Puzzles and Policies that wasrecently approved by the World Bank Research Committee. The paper surveys broad savingtrends in the world, summarizes current knowledge about saving and consumption, identifiesmajor unresolved issues, and lays out the main policy-related questions to be addressed by theresearch. It also spells out the analytical and methodological framework of the differentresearch components.
We expect that this research project will make a major contribution to improve ourunderstanding of why people and institutions save -- and why they do not -- and to identifythe policies that can get virtuous saving-growth cycles under way.
Lyn De, irectorPolicy Research Department

vi
ABSTRACT
Over the last three decades the developing world has witnessed a large and increasingdivergence in saving rates: they have doubled in East Asia, stagnated in Latin America, andcollapsed in Sub-Saharan Africa. These regional saving disparities have been closely reflected inthe respective growth performances: across world regions, higher saving rates have come withhigher income growth. Against such background, this paper lays out a research agenda to addressthree broad questions of direct policy relevance. First, why do saving rates differ so much acrosscountries and time periods ? Second, how much do higher saving rates contribute to raisinggrowth ? And third, what policy measures are the most effective to raise national saving ? Thepaper surveys broad saving trends across the world, reviews the current knowledge aboutconsumption and saving, and identifies the main unresolved questions to be addressed by theresearch. The proposed agenda starts from the construction of an international database on savingand related macroeconomic variables, and includes work focused on specific policy issues that cutacross a broad range of countries as well as research focused on regional and country experiences.The paper spells out in detail the analytical and methodological framework to be used by thedifferent research components.

vii
ACKNOWLEDGMENTS
This paper originated from the research proposal Saving in the World: Puzzles andPolicies, presented to the World Bank Research Committee in 1996. The Committee generouslyagreed to fund virtually all of the research described here.
The paper is organized in two parts. Part I contains the general motivation and overviewof the research, divided into three sections. The first one describes the broad stylized factsregarding saving in the world. The second summarizes the current theoretical knowledge aboutconsumption and saving, focusing on their ability to explain the empirical facts. The third sectionlays out the main policy-relevant questions to be addressed by the research work. In turn, Part Icontains a more detailed description of the analytical and methodological framework of thedifferent components of the research.
We thank Sebastian Edwards and Lyn Squire for initial discussions when starting to thinkabout this project and for subsequent comments on earlier drafts. The research proposal wasprepared in close collaboration with the project's participants: Orazio Attanasio, Gerard Caprio,Angus Deaton, Cevdet Denizer, Ibrahim Elbadawi, Mark Gersovitz, Patrick Honohan, AartKraay, Norman Loayza, Alejandro Lopez, Ernesto May, Peter Montiel, Francis Mwega, IjazNabi, Jonathan Ostry, Christina Paxson, Lucio Picci, Carmen Reinhart, Dani Rodrik, AndrewSamwick, Fabio Schiantarelli,Antonello Scorcu, Jonathan Skinner and Holger Wolf. Theirrespective contributions are acknowledged in Part II.
This paper has also benefitted from the collaboration of many individuals from within andoutside the World Bank. We are particularly grateful to David Dollar, Bill Easterly, PeterHarrold, Ross Levine, Joanne Salop, Michael Walton, and participants at World Bank seminarsand at the 1996 Latin American Meeting of the Econometric Society for comments on earlierdrafts.We are also indebted to the members of the World Bank Research Committee and especiallyto four anonymous referees who provided extensive detailed comments and suggestions on theoriginal research proposal.
Financial support from the Bank's Policy and Research Department (PRDDR) for fourbackground studies by Angus Deaton, Patrick Honohan, Maurice Obstfeld and Philippe Weil, aswell as for research assistance, is gratefully acknowledged. Finally, we thank Wanhong Hu andBo Wang for their outstanding research assistance.


ix
SLUMMNVARY AND OVERVIEW
Over the last three decades the world has witnessed a large and increasing divergence insaving rates. World saving rates have been falling since the early 1970s and the gap betweenindustrial-country and developing-country saving rates has widened since the mid-1970s. Withinthe developing world, the saving divergence has been dramatic: saving rates have doubled in EastAsia, stagnated in Latin America, and collapsed in Sub-Saharan Africa. These saving disparitieshave been closely reflected in the respective growth performances: across world regions, highersaving rates have come with higher income growth.
From a theoretical viewpoint, there is in principle litt'e reason to expect saving rates tobehave similarly across countries. In an ideal first-best world, different saving rates could justbe the result of optimal intertemporal consumption decisions when tastes, technology and/or otherfactors vary across countries. In the real second-best world, however, intertemporal choices aresubject to a host of externalities, market failures and policy-induced distortions that in manycountries are likely to cause saving to differ from its welfare-maximizing levels. Of course, theresult need not be too low a level of saving. While some distortions -- such as too low governmentsaving in a non-Ricardian world, or moral hazard leading to inadequate private savings forretirement in anticipation of public bailout of the old-age poor -- can result in socially insufficientsaving, other types of market imperfection such as the absence of risk-sharing instruments, orpolicy-induced distortions such as forced saving schemes, can conceivably lead to saving abovesocially optimal levels.
Yet the very low saving ratios of many developing countries, particularly among poorercountries, strongly suggest that the prevailing situation is one of socially insufficient saving.Indeed, the direct association between saving ratios and growth rates across countries noted abovehints at the existence of virtuous cycles of saving and prosperity along with poverty traps of under-saving and stagnation. In these circumstances, addressing the distortions that are at the root ofunder-saving can be key to higher long-run growth and welfare. In practice, however, theinterpretation and policy implications of the saving-growth link still remain controversial.
Ensuring an adequate supply of saving is also a central policy objective for reasons otherthan its direct growth impact. A national saving ratio broadly in line with the economy'sinvestment needs is a key ingredient to reduce countries' vulnerability to unexpected shifts ininternational capital flows. As illustrated by Mexico's recent experience, low domestic saving canexacerbate the likelihood and negative consequences of sudden capital outflows that may be drivenby factors such as herd behavior or self-fulfilling expectations on the part of internationalinvestors. Under increasing international financial integration, high domestic saving contributesto ensure macroeconomic stability, itself a powerful growth factor.
However, a firm analytical and empirical basis to ground the choice of policy levers aimedat saving is still lacking. Little is known about the relative effectiveness of alternative policies in

x
encouraging saving. And this is so even in the case of policy measures that are often advocatedon the basis of their positive saving impact -- like nowadays pension system reform or, in the past,financial sector liberalization.
Against this background, the purpose of this research project is to address three broadquestions:
(1) Why do saving rates differ so much across countries and time periods ?
(2) How much do higher saving rates contribute to raising growth ?
(3) What policy measures are the most effective to raise national saving?
These questions are of direct policy relevance but correspond to different levels of thepolicy design process. The first question seeks to explain the massive and increasing differencesin saving performance across countries and over time. Having a better understanding of thespecific role of structural, external, and policy determinants in the behavior of savers is a first stepin identifying the possible contributions of specific policy levers to saving. This requires goingbeyond the behavior of national saving, focusing specifically on the private sector and, to theextent possible, analyzing separately the saving decisions of households and firms.
Addressing the second question will improve our understanding of the saving-growth nexusand shed light on the role of saving vis-a-vis other factors in promoting higher sustainable growth.There is little doubt that saving, to the extent that it translates into physical capital accumulation,is a central ingredient for growth. However, recent research has underscored the reverse causationfrom growth to saving, with the implication that saving ratios themselves are in part a reflectionof the economy's growth performance. In this context, disentangling and identifying quantitativelythe relative importance of these two forces is a task of central relevance to the choice of target forgrowth-enhancing macroeconomic policy. If saving is a major growth determinant, the removalof distortions causing under-saving should be a central aspect of a policy framework aimed toovercome poverty traps. If, on the contrary, saving ratios are largely a consequence of the growthprocess, such a framework should target primarily the distortions hampering physical investment,human capital accumulation and/or technological advancement -- that is, the variables drivinggrowth.
In turn, the third question refers to the optimal choice of saving policy instruments. Therange of tools capable of affecting national saving levels is in principle quite broad: from changesin overall public saving, to specific tax and financial incentives to private saving, to broaderinstitutional reforms such as the introduction of fully-funded pension systems. However,instrument selection should be governed by a systematic assessment of their respectiveeffectiveness, which at present remains far from settled. In some cases, like pension reform, thelack of a conclusive evaluation reflects mostly the scarcity of empirical studies. By contrast, theeffectiveness of specific tax incentives to private saving has attracted considerable empirical

xi
attention in OECD countries although its results are still not conclusive, while no evidence isavailable for developing countries. In turn, the predominant view on the saving impact offinancial system liberalization has been partially reversed in recent years, from the positive effectpredicated in the past according to the 'financial repression' paradigm, to a possibly negative one-- although empirical support for the latter is still limited and confined to a few industrialcountries. Finaly, while few doubt the ability of public saving to affect national saving, empiricalassessments of its impact in developing countries are scarce and quantitatively very different.
These three broad questions wil be divided into specific researchable issues tackled by thisproject in individual papers. In order to address these issues effectively, the research project isstructured into five complementary components:
A. DataB. Saving across the worldC. Policy issues of worldwide importanceD. Lessons from international saving experiencesE. Project findings and policy implications
Chart 1 summarizes the project's five components and identifies specific issues that willbe addressed in each component. Each issue in the chart will be analyzed in an individual paperwithin the project.
The first project component wiUl tackle the construction of an international macroeconomicdata base on saving and related variables. Availability of a large cross-country data set built withconsistent criteria is an essential pre-requisite for conducting the research. The second componentfocuses on understanding both saving differences across space and time (the first broad questionidentified above) and the saving-growth link (the second broad question). Using new informationfrom both national accounts and household surveys, the empirical research will shed light on thefactors that drive (and inhibit) saving in the world, and on the relationship between saving andgrowth. The third component will focus on the effects of specific policies on saving (the thirdbroad question), using a cross-country comparative approach. To complement the issue-orientedresearch of the second and third components, the fourth will assess in depth the savingperformance of specific countries, country groups and world regions, to draw lessons from actualpolicy experiences. Finally, the fifth and last component will provide a policy-oriented synthesisof the main results and lessons from the research.
The research methodology will be based both on relatively narrow analytical frameworksexplicitly derived from intertemporal optimization, and on broader models not derived from firstprinciples but encompassing a number of alternative consumption/saving motives. Empiricalimplementation of the analytical models will make use of both micro and macroeconomic data.For the project's cross-country studies, the aggregate data will be drawn from the saving database. The precise empirical models and the coverage of the data they use will vary across studies,depending on data availability and the need to tailor the samples to the specific questions under

xii
investigation. Part I discusses the research content and organization of this proposal. Part IIprovides extensive details on the methodology to be used by each of the papers that will beprepared within the project.
The research project will have a direct impact on World Bank Operations in fourdimensions. First, clarification of what drives saving and how saving relates to growth will beof direct assistance in policy diagnosis and the selection of policy targets -- that is, to determinethe relative priorities in the overall country policy and lending strategy between saving-enhancingmeasures and measures targeted at investment (physical or human) or technological innovation.Second, the quantitative assessment of the relative effectiveness of saving-promoting policies willfacilitate the rational selection of policy tools, clarifying which instruments are likely to have thebiggest impact under what circumstances. Third, this in turn will help to determnine the priorityand sequencing of specific reform measures, providing analytical support to overall and sectoraladjustment operations, particularly in the areas of public expenditure and taxation, financial-sectorreform, and pension-system reform. Finally, the development of empirically-validated savingfunctions with firm analytical foundations will enhance the formulation of country analyses,projections and strategies in operational work.
The timing of this research should also enhance its operational impact. The World Bankhas not devoted a major research effort to the issue of saving in over a decade. In addition,several themes closely related to saving -- like the general trend towards fiscal orthodoxy or,more recently, the reform of pension systems -- have acquired a prominent role in its operationalwork. At the same time, concern with the causes and remedies of insufficient saving hasresurfaced with the massive shifts in capital flows during the 1990s, and especially in theaftermath of the Mexico crisis. By improving our understanding of the determinants of privatesaving and bringing together the lessons from the international experience, the proposed researchwill help identify the saving consequences of alternative reform strategies, providing a furmerground for the design of analytically-sound reform programs and the assessment of thesustamability of their overall macroeconomic framework.

CHART I
--SAVING ACROSS T WORLD: PUZZLES AN POLICIES|§ ~ ~~~~~~~~~~ ------ .............. ,, .
- - --- -s aa S -f f f- - fy,f ,,- ,- ',,,' s, .. f,~~~~~~~~~~~~~~~~~~~~~~~~~~~~ - -- ------- - - - ---
~~~~~~~~~~----------- ---- -- -- ----:,.':~~~~~- f- -f- ----f- f : :- -: -f --- - --- -;-:S-- --- f::-Sff ' ~~~~~~~~~~~~ ~ ~~~~~......... -- ----' {f- --- -.. .. f -':--:'---
- - --' -''---S -' - '-D ---- -f - ---- - - ---- --- -- - - ---: SB Sl: ''5 '5: 5 - ' -S : :S f'-'f- } --- : S-' a ' -a: ff fS --ff' f- ,: --' --:-.. . . .. .... .:.. . .- - ------
- f - f-> = f -Sf ys -- f -w | --Tid 9s f ' f f Y ; -- f f -,:~~~~~~~~~~~~~~- -- - - -- - -- -
-f -.f---f -- -::--:.----- . . . .. ...... ... .-,,,- ...... --- :-- ------------' . 5--.-f - . '' - - .r ~~~~~~~~~~~~~~~~~~~~~~~~~~- - ---- -a -, -s,S-ff- -;-
-- - - :ff-- :-Y - ---:-- - f- ::-ff- f-s- - -- -- .:: :.':.'t.Ss:-. ..:. - --- -- ff----- f-fa---fff -f -: -- - ... ..... ... - --:--- --S -a . Y a --: -f- - -- f -- ------ -- - -- - -- ------- -- ---;-:
--- --: : - :; f- :----:f-fff:f :f: :-- -:ff --- : : ::-Y ----: : : --; -ES , ; AT-;NA:. :.-- ,. -- --- -.-- ---;- gS- -- ----- f-f- --f-- - --- -fY-:-:- 5- ---- --- .. ...... ::- .---:f-f--f----sff- f----ff---- -f ------ --- ---- - -- --'- - -- -:-:f.-a.-- f-f- f-f----g -- :Y:',: -.-:-B-e: m ff.-::-:.f : : -- :-r:: - - - f- ffff -- - - -- - --- - - _ - -: f-:-.:: .- ..... :-: --. - ............... ---- --- ---::.:-.:: :-|--:S :.--. :-:-: -a-.-:::-: J __. ---_------------- --....-........._.._.._....-------
. .f: Yif lf f, fff Y f f: ;: a; f.f :f,Y'- -:..:f ''Y'.::- --- a --- --ff,f -' ' : -' -- ---- -'- - ---f .. ..-.f-- -: --f-. -- -f , , -f , -Y -: -f -:~~~~~~~~~~~~~. .. .. .. . . .. . -- -- -- -- --.- - --- . . ., . . . . . .- --
:~~~~~~~~~~~~~~~~~~~~~~~~~~~~~~~~~~~~~~~~~~~~~~~~~~~~~~~- - ---- - - -- . . . . .
- - - , .:: 6 , = ? f .~~~~~~~~~~~~~~~~~~~~~~~~~~~~~~~~~~~~~~~~~~~~~~~~~~~~~~~~~~~~~~~~- -- ---- ---:- f --'f: f ?':::-:::: -;f: ---; : .::: .f: :: ._ --- ---------f - ---------- --f---::: .-- : : - - - :-. : - .';:- - --f--:---::- ------- - -- - -:'- --- -- ---f'-''--::-':-- ' :::-::- :- -- -- - - f--f -. ,:.: --. ---::-:-
4 6 f- ---- - -- - ---- -ff-- - - --- fSS,::f -z m-,,,f
-; -- - --- --- --e --------- ~ -- --- ---- Lo--- -- -f - - ----:: ~ ~ ~ ~ ~ ~ ~ ~ ~ ~ ~ ~ ~ ~ ~ ~ ~ ~ ~ ~ ~ ~ ~ ~ ~ ~ ~ ~ ~ ~ ~ ~~ ~~ ~~ ~~ ~~ ~~ ~~ ~ ~~ ~ ~~~ ~~~~~~~~~~~~~~~~~~~~~~~~~~~~~~~~~~~~~-----
---w -K - ---------~~~~~~~~~,
..... - .... -- - - - ---- - -- -- - -- - - - - ------................. .:.............~~~~~~~~~~~~~~~~~~~~~~~~~~~~~~~~~~~~~~~~~~~~~--- --- --- --- -- ---------


1
PART I: FACTS, THEORIES, AND RESEARCH ISSUES
This part places the proposed research in the context of the stylized facts concerning savingand the theories that attempt to explain them. It concludes with a detailed summary of the issuesthat will be addressed by the project.
1. Saving: World Trends
The performance of saving in the world at large and in developing countries in particularhas been characterized by a number of salient features during the last three decades. We lookbriefly at the evolution of world and regional saving rates and their correlation with selectedeconomic variables. Unless specified otherwise, below we use regional unweighted averages ofgross national saving rates, but the qualitative features described next also hold for alternativemeasures such as gross domestic saving rates and regional averages weighted by income levels.The data is from the World Bank BESD data base, based on U.N. and national sources fornational-accounts information.
The world saving rate has been declining and the world real interest rate has increasedsince the 1970s
The weighted average world saving rate rose slightly during the 1960s and early 1970s toa peak level of 25% in 1973 (see Figure 1). Subsequently world saving started decliningcontinuously, to reach 19% in 1993-94. The average (ex-post) long-term real interest rate showsthe opposite pattern: from a range of 2-3 % in the 1960s it plunged briefly to negative levels afterthe 1973 oil shock, then quickly rose to high positive levels in the early 1980s and has remainedclose to 4% in recent years. According to the Group of Ten (1995), this reflects a trend increasein the real interest rate of around 100 basis points over the last 35 years.
The contemporaneous correlation between the average world saving rate (the average G- 10saving rate) and the long-term real interest rate is -0.61 (-0.56). The predominant interpretationof this empirical association is that the secular rise in the interest rate is due to lower worldsaving, which has outweighed a parallel reduction in desired world investment levels (Group ofTen 1995, IMF 1995).
* Saving rates show divergent patterns across regions during the last three decades
The trend decline in the world saving rate since 1974 conceals widely diverging regionalsaving patterns (Figure 2). OECD saving rates have been falling since the early 1970s, duemainly to lower public-sector saving (Group of Ten 1995, IMF 1995). Within developing

Figure 1
WORLD SAVING AND REAL INTEREST RATES(Gross National Saving Rate Including Net Current Transfers, Ten-YearGovernment Bond Real Rates for G-10; Weighted Averages, 1965-1993)
27 8
256
~234
E 21
40
> 19
17 -2 "f
15 -4
1965 1967 1969 1971 1973 1975 1977 1979 1981 1983 1985 1987 1989 1991 1993
|- Gross National Saving Rate 0 Real Long-Term Interest Rat

Figure 2
SAVING RATES BY WORLD REGIONS(Gross National Saving Rate Including Net Current Transfers,
Unweighted Averages, 1965-1993)40
35 hina
?30
}20
15
10
1965 1967 1969 1971 1973 1975 1977 1979 1981 1983 1985 1987 1989 1991 1993

4
countries it is useful to distinguish between 11 take-off countries' (defined as those that haveachieved high and sustained saving and growth rates during the last two decades) and all otherdeveloping countries, excluding former socialist economies (henceforth referred to as transitioncountries). The latter group shows a pattern of declining saving rates since the mid-1970s, similarto that observed in the OECD, but reaching a much lower average 10% since 1983. The take-offcountries have been able to break through their historically low level of saving (and growth) sincethe 1970s. The ten market-economy take-off countries and territories have more than doubledtheir saving rates since the late 1960s, to reach an average 32 % in the early 1990s. In turn, Chinastarted at rates close to 25% in the late 1960s, and has continuously raised its saving rate untilbecoming the world record-saver at 40% in the early 1990s.
Similar world and regional trends in national saving ratios to GNP are observed whenregional averages are weighted by annual GNP levels (Figure 2a). The same is true whencountry populations are used as weights for regional averages -- with the obvious exception ofthe world saving rate which now, because of China's large share in world population, shows nodownward trend from the 23 % level reached in the late 1970s (Figure 2b). These results allowto return to unweighted averages in the following.
A large and increasing divergence of saving rates arnong developing country groups is alsoapparent when focusing on the World Bank's classification of developing regions (Figure 3).Saving ratios to GNP have risen from 18.3% during 1965-73 to 27.6% during 1984-93 in EastAsia and the Pacific (denoted by EAP in Figure 3; all countries other than China), and from25.3 % to 36.8% in China. South Asia (SA) has been the only other developing region wheresaving rates have shown an increasing trend -- but from a very low 9.5 % in 1965-73 to a stillmodest 15.3% in 1984-93. The Middle East and North Africa's (MENA) very high 29.0% savingrate during the period of high oil prices fell to 19.8% during 1984-93. In Latin American and theCaribbean (LAC), the modest saving rates of the 1960s and 1970s fell even further during the "lostdecade" of the 1980s, to reach 13.6% in 1984-93. The most dramatic regional development isSub-Saharan Africa's (SSA), where saving rates have been declining steadily from 10.5 % in 1965-73 to reach an abysmally low level of 6.4% in 1984-93.
Saving rates also show a wide dispersion across countries and over time within any givendeveloping-country region. In the case of LAC, for instance, while gross national saving ratesshrunk in Mexico from 23 % in 1980-87 to 19 % in 1988-94 (thus contributing to Mexico's 1994-95 crisis), they grew in Chile from 13% in 1974-87 to 25% in 1988-94 (thus contributing toChile's success).
Saving rates in transition economies have followed a declining trend since the onset ofsystemic transformation in the late 1980s (see Figure 4). In Russia saving rates have fallen to
I This group includes China and ten market economies: Hong Kong, Indonesia, Korea, Malaysia, Singapore,Taiwan (China) and Thailand in East Asia; Botswana and Mauritius in Africa; and Chile in Latin America.

Figure 2a
SAVING RATES BY WORLD REGIONS(Gross National Saving Rate Including Net Current Transfers,
Averages Weighted by GNP, 1965-1993)40
35 Xhn
0 25 OECD
20
LDC (excl. Take-off Countries)<15
10 1
1965 1967 1969 1971 1973 1975 1977 1979 1981 1983 1985 1987 1989 1991 1993

Fifure 2b
SAVING RATES BY WORLD REGIONS(Gross National Saving Rate Including Net Current Transfers,
Averages Weighted by Population, 1965-1993)40
35
~25Wol
620
> 15
10 1
1965 1967 1969 1971 1973 1975 1977 1979 1981 1983 1985 1987 1989 1991 1993

Figure 3
SAVING RATES BY DEVELOPING REGIONS(Gross National Saving Rate Including Net Current
Transfers, Unweighted Averages, 1965-1993)
4 -
3 25 L-
20
o 15 .
, 10
XL~/ 84-935 ::
O .. 74-83
ChaEAP MENA 65-73
SA LACSSA

Fieure 4
SAVING RATES IN TRANSITION ECONOMIES(Gross Domestic Saving Rate, Unweighted Averages, 1989-1994)
40
35 Rsi
Q3 0 -
25
20
15-1989 1990 1991 1992 1993 1994

9
25 %, while in Eastern European and other FSU countries average saving rates have declined tolevels close to 20% *2 The end of forced saving, declining income, higher expected future income,and stock-adjustment of consumer durables are among the possible explanations behind lowersaving during systemic transition. However, the transition economies' 1993-94 saving rates arestill remarkably high in comparison to the very depressed saving ratios often observed indeveloping market economies undergoing deep recessions.
Long-term saving rates and growth rates are positively correlated
Low long-term saving and growth rates in many countries coexist with high saving andgrowth levels in a few others. The three country groups depicted in Figure 5 (take-off developingcountries, other developing countries, OECD economies) reflect distinct patterns. The take-offcountries exhibit relatively high saving and growth rates during 1965-1994, while OECDeconomies show comparable long-term saving rates but much lower growth rates. The remaining(non-take-off and non-transition) developing countries show a wide dispersion but their averagesaving and growth record is much worse than that of the two preceding country groups. Acrossmarket economies, long-term saving and growth rates are positively related. The correlationcoefficient is 0.47 for the world at large, and somewhat higher in developing than in OECDcountries (see Table 1).
Long-term saving rates and income levels are positively correlated
Long-term saving and income levels are also positively related across countries. But thisseems to happen only up to an average per-capita income level of $ 17,000 (in 1987 US$) --beyond that point, long-term saving rates tend to fall (Figure 6). The overall correlationcoefficient between saving rates and per capita income levels is 0.51 for the (non-transition) worldat large, and again somewhat higher in developing than in OECD countries (Table 1).
Long-tenn saving and investment ratios are strongly positively correlated
This empirical fact, acknowledged since the work by Feldstein and Horioka (1980), is arobust finding for long-term saving and investment rates, and is also present in our data. InFigure 7, OECD and take-off countries are clustered closely together, and typically located abovethe 45 degree line in the figure (along which average national saving and domestic investment
2 Seven Eastern European countries (Bulgaria, Czech Republic, Hungary, Poland, Romania, Slovakia, andSlovenia) and nine other FSU countries (Belarus, Estonia, Kazakhstan, Kyrgyzstan, Latvia, Lithuania, Turkmenistan,Ukraine, and Uzbekistan) are included in the unweighted regional averages depicted in Figure 4. Source: World Bankdata.

Fi5ure 5
LONG-TERM WORLD SAVING AND GROWTH RATES
(Gross National Saving Rates Including Net Current Transfersand Real Per Capita GNP Growth Rates, 1965-1994 Averages
by Countries)40
40 -
A
z &A A~~~
I- A ~ AA
< 1h ^ O ^ ^ ~ ~ ~ ~ ~~~~~~~~~~~~~~~~~~~~~~~~~~~~~~~~~~~~~~~~~~~~~~~~I I I
-4 .2 i <2 4 6 8 1 0
y = 2.9528x + 11.028
R2= 0.321
20
Average Growth Rate of Real Per Capia GNP
e Take-Off Countries a OECD A LDC (excl. Take-Off Countries and Outliers) x LDC Outliers]

Fii-ure 6
LONG-TERM WORLD SAVING AND INCOME LEVELS(Gross National Saving Rates Including Net Current Transfers and Real
Per Capita GNP, 1965-94 Averages by Countries)50
A~~~~~~~~~~~~~~~~~~~~~
40 A A
30-.
zv 10
(& F5000 10000 15000 20000 25 00
-10 Ay = -5E-08x2 + 0.0018x + 11.706
R2= 0.2816
-20-
Average Real Per Capita GNP (1987 Dollars)
Take-Off Countries | OECD A LDC (excl. Take-Off Countries)

Fii-ure 7
LONG-TERM SAVING AND INVESTMENT RATES(Gross National Saving Rates Including Net Current Transfers and Gross
Domestic Investment Ratios, 1965-1994 Averages by Countries)45
35
5 D 15 2 25 ~ ~~ ~ ~~ ~ ~~ ~ ~ 30 35404
A ^ X y = 1.1092x - 8.4003~000 t
-15
A~~~~~~
a ~~~~~~~~~~~~~~~~y =1. I092x -8.4003
-15 ~~~~~~~~~~~~~~~~~~~~~~~~~~~~R' = 0.4049
Average GDI/GNP (%)
| Take-Off Countries * OECD a LDC (excl. Take-Off Countries and Outliers) x LDC Outliers

13
Table 1
CROSS-COUNTRY CORRELATION BETWEEN LONG-TERM SAVING RATESAND OTHER VARIABLES
(1965-1994 Country Averages)
World OECD Countries Developing Countries
Correlation Coefficient betweenthe Gross National Saving Rateand the following variables:
Real GNP Growth Rate 0.47 0.33 0.45
Per Capita Real GNP Level 0.51 0.41 0.47
Gross Domestic Investment/GNP 0.42 0.55 0.40
Income Inequality (Gini Coeff.) -0.34 -0.05 -0.20
Note: The standard errors of the correlations (except those involving the Gini coefficient) are 0.09(0.14) for the world sample, 0.21 (0.22) for the OECD subsample, and 0. 10 (0.18) for the developingcountry subsample.
Source: Calculations using World Bank data and data from Deininger and Squire (1995).
rates are equal), reflecting the fact that they typically export capital to LDCs -- most of the latterare located below the 45 degree line. The correlation coefficient between the long-term nationalsaving ratio and the gross domestic investment ratio is 0.42 for the (non-transition) world at large-- in this case larger in OECD countries than in LDCs (Table 1).
* There is no robust association between long-term saving rates and income inequality
The pattern of correlation between long-term saving rates and income inequality is lessclear-cut. The correlation between long-term saving rates and income concentration (measured bythe Gini coefficient) is -0.34 at the world level, significantly different from zero. However, theassociation becomes weaker and statistically insignificant if industrial and developing countries

14
are considered separately (Figure 8 and Table 1).3 Nevertheless, income inequality is on averagehigher in developing than in OECD economies, and income is typically less concentrated in thetake-off countries.
2. Saving/Consumption Theories
To provide an analytical background for the proposed research, we now summarize brieflystandard theories of consumption and saving and recent developments in this area, focusing ontheir consistency with the stylized facts and their ability to explain them.4
The point of departure for most modem research on consumption and saving is one of twodominant paradigms: the permanent-income hypothesis, focused on a representative infmitely-lived consumer (henceforth PIH) and the life-cycle hypothesis (LCH), derived from theaggregation of finitely-lived overlapping generations. We start by reviewing briefly the mainaccomplishments and shortcomings of these two polar theories and related sub-theories, and turnsubsequently to other models that have taken recent research in new directions.
PIH abstracts from consumer heterogeneity by focusing on consumption of an infinitely-lived consumer or, equivalently, an infinite sequence of finitely-lived generations linked throughinter-generational transfers (including bequests). Consumption is equal to permanent income --the annuity value of the sum of non-human assets and human capital (the discounted value oflabor income), net of the discounted value of taxes (see Friedman 1957, Hall 1978, and Flavin1981 for the most popular formulations of PIH). As a variant of PIH, the Ricardian-equivalencehypothesis (REH), by making use of both the consumer's and the government's budget constraint,derives permanent income as net of the discounted value of government spending (Barro 1974).
While under the simple Keynesian hypothesis (KH) consumption is determined by currentincome, the forward-looking PIH consumer distinguishes between temporary and permanentincome. PIH consumption is smoother than income: current temporary income gains are mostlysaved while permanent income gains are consumed. In other words, if desired consumption is flatover the entire future horizon, current saving is equal to the discounted value of anticipated futurereductions in income -- that is, saving is determined by future "rainy days" (Campbell 1987).
3 Similar results apply to the correlation between long-teirmil saving rates and the other measures of incomedistribution, such as the ratio between the income shares of the bottom 40 and the top 20 percent of the population.
4 This section draws on recent sunvevs of consiniption theory and evidence, in particular Deaton (1992, 1995),Honohan (1995), and Obstfeld (1995), and on su'veys of the saving literature for developing countries, includingMikesell and Zinser (1973), Sn,der (I 974), rersovitz (1988), Deaton (1990), Schmidt-Hebbel, Webb and Corsetti(1992), Srinivasan (1993), and SchDiidt-llekhh el Servmn and SoliDano (1996).

Figure 8
LONG-TERM WORLD SAVING RATES AND INCOME DISTRIBUTION(Gross National Saving Rates Including Net Current Transfers and Gini
Coefficient, 1965-94 Averages by Countries)35
30
A~~~
* A~~~~~
125
2~ ~~ 20 * ;A a,
A~~~~~~ Q 15 A ; ,,AX ^v^
. 10 A
5AA
0
25 30 35 40 45 50 55 60
Average Gini Coefficient
|- Take-Off Countries a OECD A LDC (excl. Take-Off Countries)

16
The rate of consumption growth -- or the intertemporal consumption profile -- reflectsboth consumer preferences for intertemporal consumption smoothing and the difference betweenthe market interest rate and the consumer's subjective discount rate. A higher interest rate -- alarger reward for postponing current consumption -- tilts the consumption profile toward thefuture. But the effect of a higher interest rate on the level of current consumption (and hence onthe level of current saving) is ambiguous, depending on the relative size of offsetting substitution,income, and human-wealth effects caused by an interest rate hike.
An important implication of PIH is that the change in consumption should beunpredictable, i.e., uncorrelated with any information known to consumers when the change takesplace. Since the innovative papers by Hall (1978) and Flavin (1981), a large body of empiricalwork has shown that consumption exhibits "excess sensitivity", i.e., its change is correlated withpredictable changes in other variables, typically contemporaneous or lagged income changes. Thisrejection of the standard PIH model was found initially in U.S. data, but has been extended toother OECD and developing economies. What are the reasons for excess sensitivity ofconsumption? The presence of either durable goods (Caballero 1990) or consumption habits (seebelow) makes consumption changes at least partly predictable. The same is true for borrowingconstraints, that limit the ability of consumers to borrow against future income, as discussedbelow.
The PIH predicts that income growth -- i.e., the anticipated increase of future incomerelative to current income levels -- reduces current saving, as consumers raise currentconsumption in anticipation of higher future income. This prediction contradicts the positivesaving-growth correlation documented in the previous section. Moreover, the assumption ofhomogeneous consumers portrayed by a representative agent who is closely linked to all futuregenerations is a feature that makes PIH an implausible candidate to deal with real-world featuresthat reflect consumer diversity along various dimensions, including age, income levels, and accessto borrowing.
The LCH fathered by Modigliani and Brumberg (1954, 1979) -- the main competitor ofPIH-REH theories -- introduces age-related consumer (or household) heterogeneity., Aggregatesaving results from the addition of saving by different age-specific cohorts. Each cohort smoothsconsumption over a finite horizon, given lifetime resources that -- in the simple version of theLCH -- are not transferred across generations. Over the life cycle, saving and consumptionfollow hump-shaped patterns, with dissaving until early adult age, the peak of saving at mid-life,and dissaving during retirement as households run down their retirement assets. Saving is drivenonly by retirement needs. Hence saving propensities depend on age and differ systematicallyacross cohorts.
A change in interest rates entails transfers among cohorts. Hence the net impact of ahigher interest rate on aggregate consumption and saving -- already ambiguous at the level ofeach individual household -- is also ambiguous at the aggregate level, depending on the behaviorand size of each cohort. Similarly ambiguous is the effect of growth on saving in the LCH

17
framework. Only in the particular case when growth takes place across generations (i.e., theyounger cohorts' income levels are increased by more than those of the older generations) isaggregate saving likely to rise with income growth, because the mid-life saving of the activegenerations induced by growth is larger than the dissaving of the very young and the old retiredcohorts.
However, LCH is not problem-free either when it comes to interpreting real-world savingbehavior. First, there is not enough hump saving to account for the high level of aggregatewealth in modem economies (see Kotlikoff and Summers 1981). Second, household surveyevidence for OECD countries suggests that changes in growth do not cause the cohort-specificdifferences in saving levels (see e.g. Bosworth, Burtless, and Sabelhaus 1991 for the U.S.) or inintertemporal consumption patterns (see Carroll and Summers 1991 and Deaton 1991b) predictedby the LCH. Third, a growing body of microeconomic evidence for OECD countries shows thatold people save or at least do not dissave as much as predicted by the LCH (Deaton and Paxson1994, and Poterba 1995), a finding which suggests that inter-generational bequests may be animportant saving motive.
Bequests tend to undermine the distinction between the PIH and LCH, as the latter theoryis based on the absence of close intergenerational links among households. One popular way todiscriminate empirically between these two competing theories -- and hence to infer indirectlyabout the importance of bequests -- is to include population dependency measures (the ratios ofthe old and the young to the overall population) among other saving determinants in empiricalsaving equations. While many studies show that the proportion of old-age people reduces saving-- a finding that supports the LCH -- the evidence is controversial (see Gersovitz 1988 for acritical review) and may not be inconsistent with the micro evidence in support of bequests (Weil1994).
More direct empirical evidence favoring the importance of the bequest motive is providedby both the older PIH literature and more recent household survey and aggregate cross-countrystudies. The older PIH literature concludes that bequests are a luxury good, reflected in elasticitiesof consumption to permanent income that are well below one. Menchik and David (1983) useU.S. household data to test directly whether the elasticity of bequests to lifetime resources is largeror smaller for the rich than for the other income groups and find that the marginal propensity tobequeath is unambiguously higher for the wealthy. Other household survey studies similarly findthat saving rates are higher for lifetime richer consumers (e.g., Paxson 1992 for Thailand, andDeaton and Paxson 1994 for Taiwan). At the aggregate level, saving rates increase with the levelof income (not its rate of growth) in cross-section or panel studies of developing countries (seeCollins 1991 and Schmidt-Hebbel, Webb and Corsetti 1992), while growth (not income levels)contributes to raise saving in OECD countries (Modigliani 1992). These findings are consistentwith the stylized fact on the positive correlation between saving ratios and income levels discussedin the previous section. The apparent implication is that bequests are a luxury good at low andmiddle levels of income but a normal good at high levels of income.

18
Uncertainty about the future leads to precautionary saving by risk-averse consumers:people set aside a certain amount of resources to face possible future changes in income levels,taxes, interest rates, or any other consumption determinant (Skinner 1988, Zeldes 1989). Higheruncertainty about the future reduces current consumption and hence raises saving. If very highconsumer risk aversion is paired with high income uncertainty, consumption will follow closelyincome, so that aggregate consumption appears as if it were consistent with the simple KH. Thegeneral implication of uncertainty is that it raises saving beyond the level predicted by the standardPIH or LCH models without uncertainty. Uncertainty can explain in part why consumptionfollows income so closely (contradicting the simple PIH) in the case of young households thatexpect positive but uncertain future income growth: their risk aversion is at war with theirimpatience (Carroll 1991). Uncertainty can also explain in part why the retired save a positiveamount or dissave little, as they face large uncertainty about their life length and health costs. Itis also one of the reasons why the REH might fail, as a substitution of lower current taxes forhigher future taxes reduces uncertainty of future income and hence lowers precautionary saving(Barsky, Mankiw and Zeldes 1986 and Kimball and Mankiw 1989).
One popular way to introduce risk aversion is by considering consumer preferencesconsistent with a marginal utility of consumption that declines with the level of consumption. Forinstance, under consumer preferences that satisfy constant relative risk aversion, the intertemporalelasticity of consumption substitution is equal to the inverse of the risk-aversion coefficient; bothreflect the curvature of consumer preferences. This feature makes this model analytically tractablebut conceptually and empirically somewhat limited. At the cost of additional complication,Epstein and Zin (1989) and Weil (1989, 1990) have proposed different ways to separate riskaversion from intertemporal substitution. A second noteworthy extension is Kimball's (1990)distinction between risk aversion (the concavity of the utility function) and prudence (theconvexity of the marginal utility function). While both generalizations open promising avenues,little empirical research has been done to support their relevance.
Empirical tests of the representative-agent PIH model under uncertainty have focusedmostly on the Euler equation (the first-order optimality condition for intertemporal allocation ofconsumption) relating the anticipated growth rate of consumption to the expected differencebetween interest and subjective discount rates, the covariance between consumption and interestrate, and the consumer's risk-aversion coefficient. Most tests for the U.S. economy, starting withHansen and Singleton (1982), reject this version of PIH with uncertainty for reasonable values ofrisk-aversion coefficients; similar rejections are found for other OECD and developing countries.A variant of the Euler equation relates the expected consumption growth to the difference inexpected yields of different assets, covariances between yield differences and consumption growth,and risk aversion. Large differences in yields (say, between stocks and treasury bills) are shownto be inconsistent with the rather smooth behavior of consumption -- another rejection of PIHunder uncertainty termed the equity premium puzzle (Mehra and Prescott 1985, Hansen andJagannathan 1991). These results, closely related to the excess-sensitivity of consumptiondiscussed above, point toward the need of extending the PIH and LCH models to consider real-world features such as borrowing constraints and consumption habits.

19
Direct empirical tests of the precautionary saving motive have been hampered by thedifficulty of obtaining estimable closed-form solutions to theoretically-plausible models ofprecautionary saving. As a consequence, its actual importance remains controversial.Nevertheless, some recent empirical estimates suggest that it may account for a substantial fractionof households' wealth (Carroll and Samwick, 1995b).
Borrowing constraints, that prevent consumers from borrowing for current consumptionat going interest rates in financial markets, have been traditionally held against the predictions ofthe standard PIH or LCH. Borrowing constraints are a result of real-world financial marketfeatures, such as the fact that interest rates on loans cannot be expected to rise to clear financialmarkets because they raise default risks (Stiglitz and Weiss 1981), or the impossibility of usinghuman capital (i.e. future labor income) as collateral (see Hayashi 1987).
One popular way to model the effect of borrowing constraints on consumption (introducedby Hall and Mishkin 1982) is by simply assuming that an exogenous fraction of consumers spendtheir entire income. But this hardly qualifies for a theory of borrowing constraints and does notapply symmetrically to an inability to save. In fact, when precautionary saving and borrowingconstraints are taken together, it has been shown that risk-averse and forward-looking consumersraise their saving when they anticipate tighter constraints (Schechtman 1976, Bewley 1977,Schechtman and Escudero 1977, and Deaton 1991b, 1992). Consumers accumulate assets duringgood times in order to buffer consumption in bad times, when they will be unable to borrowfrom financial markets. These buffer-stock savings are not a form of long-term or retirementassets but are increased and run down over short periods. While income and consumption areseparated by buffer saving at high-frequency observations (say, a few years), they still matchclosely each other at longer horizons.
The buffer-stock saving model offers insights into the behavior of many lower-income andrural households that use cash and durables to smoothen their consumption levels over the shortrun but accumulate little over the long term. Hence the approach is relevant for poor and ruralhouseholds and countries (see Deaton 1991a, 1992) but appears to explain little of aggregatesaving and asset-to-income ratios in middle and higher-income economies. In fact, simulationsof buffer-stock models suggest that the buffer asset to output ratio is well below 1, possibly as lowas 10% (Deaton 1995).
Saving for house purchases is analogous to saving for retirement, only that the former takesplace at an earlier point in life. In the framework of the standard LCH model, housing savingcan be considered as part of overall retirement saving, with asset build-up during active life andasset run-down during retirement. However, both preferences and financial-market features seemto be at odds with this simple prediction. There is very limited evidence that the elderly run downtheir housing assets during retirement through reverse-annuity mortgages or other schemes.Second, restrictions on mortgage availability (such as high down payments for mortgage loans)raise required levels of pre-purchase saving. Japelli and Pagano (1994) provide empiricalevidence for OECD countries showing that down payment ratios raise aggregate saving rates. This

20
is exactly the opposite of the "financial repression" view (McKinnon 1973, 1991 and Shaw 1973),that predicted that financial liberalization would raise saving.
All models reviewed to this point share the assumption that intertemporal consumptiondecisions reflect preferences that are intertemporally separable, i.e., that the marginal rate ofsubstitution of consumption between any two periods is independent of what happens in any otherperiod. This assumption is lifted by consumption habit models, that allow for intertemporaldependencies by specifying consumer utility in any given period as a function of both consumptionin that period and a "stock" of consumption habits. One form of habit is external habit formation(Abel 1990, Campbell and Cochrane 1994), where utility depends positively on the differencebetween each individual's consumption level and (possibly lagged) average per-capita consumptionlevels -- a preference structure in the spirit of Duesenberry's (1949) relative-income theory of"keeping up with the Joneses". An alternative specification is internal-habit formation (see Fersonand Constantinides 1991 for the U.S.), where utility depends on the difference between eachindividual's consumption level and her own lagged consumption level(s). In both cases, habits actas a drag on consumption levels.
Habit models seem to be consistent with various facts that are hard to explain in theirabsence. As opposed to the PIH and LCH models, habits imply that future consumption changesare partly predictable, because they reflect in part past consumption changes. This is consistentwith the excess-sensitivity findings discussed above. Also, habits make consumption costlier forthe young, because habits have to be fed for life, hence they tip consumption profiles away fromthe young and toward the old. Another implication of habits is that even anticipated increases inincome growth can have a positive effect on saving -- which lasts as long as the drag of pastconsumption on current consumption holds; thereafter saving rates should fall to the levelspredicted by models without habits. Nevertheless, habits are mentioned as one possible sourceof growth-to-saving causality that can contribute to explain the saving-growth correlation (Carrolland Weil 1994, Deaton and Paxson 1994).
An alternative preference hypothesis is that both consumption and wealth (or capital) arevalued by consumers -- an idea advanced in different ways by "classical" economists from Smithand Marx to Keynes and Schumpeter, and that is resurfacing in recent literature (Cole, Mailathand Postlewaite 1992, Fershtman and Weiss 1993, Zou 1993). In this "capitalist spirit" modelwealth is accumulated for its own sake, and higher wealth prompts further accumulation -- becauseconsumption and wealth are gross substitutes in the agent's utility function.
A final question of interest is the impact of poverty and income inequality on aggregatesaving. One way to model the consequences of poverty is through the use of consumer preferencesembodying a subsistence level of consumption. Along the lines of the Stone-Geary specification,utility is a positive function of the difference between current consumption and an exogenously-given subsistence consumption level, below which no saving takes place (see Christiano 1989,Rebelo 1992). This notion has an old tradition in economics, exemplified in the "autonomousconsumption" coefficient of conventional KH models. The key implication is that saving ratios rise

21
with income (or wealth) levels, in accordance with the positive correlation observed in the data.A variant of this model specifies the intertemporal elasticity of consumption substitution as anincreasing function of wealth (Atkeson and Ogaki 1993) or of the distance between permanentincome and subsistence consumption (Ogaki, Ostry and Reinhart 1995), so that theresponsiveness of consumption substitution to the interest rate grows with the level of income.These latter studies present household and aggregate evidence, for both OECD and developingcountries, in support of this view.
In turn, income inequality is another potentially important form of consumer heterogeneityignored by representative-agent models. It played a prominent role in Post-Keynesian models ofsaving and growth (Lewis 1954, Kaldor 1957, and Pasinetti 1962), which focused on thefinctional distribution of income. These models stressed the notion that capitalists have lowerpropensities to consume than workers, so that income redistribution from wages to profits raisesaggregate saving. This approach, however, does not say much about the links between saving andincome inequality, because the association between the functional and personal distributions ofincome is empirically rather weak (Atkinson 1994). This explains the more recent resurgence ofinterest in the links between saving and the personal distribution of income. Empirical studiesfocusing on this issue typically use reduced-form (a-theoretical) consumption or savingspecifications. For the most part, however, they find either no effects or, at best, a weak positiveimpact of inequality on aggregate saving (see Schmidt-Hebbel and Serven 1995b).
3. Research Issues
Public policies have potentially significant effects on private and overall saving. Recentresearch on saving in OECD and developing countries has thrown light on some issues but manyareas of disagreement remain. In some cases, the disagreement is rooted in the existence ofcompeting theories; for instance, the Ricardian equivalence and life-cycle hypotheses offerstrikingly different predictions about the effectiveness of fiscal policy. In other cases there is alack of a well-established conceptual body to analyze the overall saving implications of certainstructural reforms, such as financial liberalization and pension system reform. Finally, still inother cases a well-understood analytical framework does not prevent strong disagreements on thesize of real-world effects; for instance, in the discussion of the saving effects of specific taxincentives in the U.S.
The general objective of all these policy interventions should be to counteract distortionsthat result in socially inefficient levels of saving. While there is a presumption that in many LDCssaving falls short of its welfare-maximizing level, this is by no means a necessary result, and anyassessment of the positive effectiveness of saving-enhancing policies should keep in mind theirwelfare implications. Indeed, saving can surely exceed levels consistent with economic and socialoptimality. Recent economic history provides many examples of countries that saved and investedin excess, up to a point where rates of return on investment where close to zero or even negative.This was the case of many socialist countries where forced saving was the result of central plans

22
aimed at output targets and not consumer preferences -- the FSU during the Brezhnev eraprovides an extreme example. Excessive saving could also result in decentralized marketeconomies, from binding regulations imposing forced saving or government policies encouragingover-saving. A mandatory fully-funded pension system is an example of a policy instrument thatunder the wrong conditions can lead to excessive saving, but under the right ones can raise it tooptimal levels. It may contribute to higher saving by forcing certain population groups to save inexcess of what they would voluntarily save, at the cost of reducing their welfare. But it may bean efficient second-best tool if, for instance, it mitigates existing distortions against saving, suchas the expectation of government hand-outs to the old-age poor.
Nevertheless, the very low saving ratios of many LDCs, particularly among poorercountries, strongly suggest that the prevailing situation is one of socially insufficient saving. Thismay result from distorting policies, such as too low a level of government saving -- which in aworld not characterized by Ricardian equivalence would lead to reduced national saving -- and/orfrom distortions due to other factors -- e.g., asymmetric information leading to imperfect policycredibility, under which reforms such as trade opening can distort consumers' intertemporaldecisions leading to a saving collapse. In either case, saving-enhancing policies would be calledfor to offset the distortions.
Next we identify a limited number of policy-relevant research issues that are at the coreof the saving experience and the policy discussion in developing, transition, and OECDeconomies. We state 12 policy questions that form the core of this research proposal -- butpostpone a detailed discussion of each of them and how they will be tackled to Part H of thepaper. Some of these questions -- like the first one on the list below -- are broad and cut acrossseveral of the proposed research components, while others are narrower and will be addressed byone specific component.
(1) Does saving drive growth or does growth spur higher saving ?
While the world-wide experience shows a strong and positive correlation between savingrates and growth rates, what drives what is hotly debated. As already mentioned, this is not anabstract academic question, but rather has an enormous policy importance because its answer willdetermine the policy priorities for achieving high growth. If it is concluded that saving drivesgrowth (through physical capital investment) or if causality runs in both directions, policies thatencourage saving are called for. If instead investment drives growth and the latter determinessaving, growth-oriented policies should primarily aim at raising investment. Finally, if the maincausality runs from growth to saving and investment -- because human capital, technology andideas, not physical investment, are the main growth determinants -- growth-promoting policiesshould focus on those three factors. Hence a closer look at the saving-investment-growth link andthe pattern of causality in developing and OECD countries is warranted.

23
(2) How does foreign saving -- and foreign aid in particular -- affect domestic saving ?
Foreign resource inflows involve both an external financing source and, in the case ofgrants and concessional loans, a unilateral transfer. In theory, their effects on investment andconsumption (saving) depend on several factors: the relative importance of the grant element vis-a-vis the financing element, the recipient economy's access to world financial markets, the degreeto which the inflows are permanent in time, and the extent to which they are fungible. For themost part, empirical studies analyzing whether foreign inflows crowd domestic saving in or outignore these distinctions, and therefore the question remains largely unsettled.
(3) Who does the saving -- and does it matter who saves?
While most consumption theory is developed for the individual consumer or household,a large share of aggregate saving is done by governments and firms. This opens up two issues.First, how large is saving by these three groups in developing countries? While for OECDcountries there is reasonable data showing the sectoral breakdown of aggregate saving, there existslittle data for developing countries -- and the little that exists is fairly unknown and unexploited.Putting together this data in a consistent way is an important first step. Second, does it matterwho does the saving? It would not matter if households both "pierce the corporate veil" and behaveaccording to the Ricardian equivalence hypotheses; in either case households would simply undowith their saving any change in saving undertaken by corporations and governments, respectively.That this offsetting by households is far from complete has been supported by much empiricalresearch. With regard to the corporate-household saving dimension, this raises the question ofhow different corporate saving behavior (driven mostly by corporate investment) is fromhousehold saving. With regard to the public sector-private sector saving dimension, this leads tothe next policy question.
(4) How effective is public saving in raising national saving?
Fiscal adjustment is typically the centerpiece of stabilization programs. While there is ageneral trend in developing countries towards greater fiscal orthodoxy, its likely impact onnational saving remains controversial. Not only the theories are split about the overall savingeffects of raising public-sector saving; the existing empirical evidence is much too inconclusiveto offer good policy advice. But a more accurate answer to this question is essential to assess theeffectiveness of fiscal policy in raising aggregate saving, contributing to the economy's externalequilibrium, and reducing its vulnerability to shocks such as abrupt changes in capital flows.Likewise, the effectiveness of alternative fiscal instruments (transfers, taxes, governmentconsumption) -- is still poorly understood.

24
(5) Do tax incentives raise private saving?
The previous question refers to the issue of how overall taxation affects saving. But howeffective are specific tax incentives in raising saving, and how do they compare to each other?This question is relevant at a time when tax reforms in many industrial, developing and transitioncountries are changing the composition of taxation. Three main policy questions arise on savingand the structure of taxation. First, does a shift from corporate profit taxes to household incometaxes affect overall private saving? Second, does a shift toward consumption taxation raise privatesaving? Finally, do specific saving incentives -- such as tax exemptions on retirement savingsaccounts -- encourage national saving, or do they simply induce a change in the composition ofthe private sector's savings portfolio?
(6) What drives temporary consumption booms -- those that prove ex-post to beunsustainable -- in the wake of domestic liberalization, capital inflows, or terms-of-tradegains?
Recurrent episodes of high private consumption growth that prove unsustainable and leadto busts and painful corrections have been common throughout the world. Unsustainable over-spending associated to anple access to foreign borrowing was observed in the late 1970s and early1980s in many developing countries and recurred in Mexico recently again. Commodity-ledconsumption booms were observed in Nigeria, Venezuela, Cote d'Ivoire and many other countriesduring the 1970s and 1980s. Spain and the U.K. showed large declines in private saving rates inthe aftermath of financial liberalization during the 1980s. There has been ample speculation aboutthe possible causes of these booms -- ranging from policy mistakes to lack of policy credibility,and from financial-sector problems to consumer myopia. However, a general understanding ofthe roots of private consumption booms is still lacking. In particular, a clear identification of therole played by policy mistakes and distortions in consumption booms under conditions of structuralchange and foreign resource inflows would help design macroeconomic policies able to reduce thefrequency of recurrent cycles of boom and bust.
(7) Does domestic financial liberalization raise or reduce private saving?
Since the 1970s and especially the 1980s, many industrial and developing countries havereforned their financial systems, allowing market forces more scope in determining interest rates,the allocation of credit, and the structure of private-sector asset portfolios. While financialliberalization has surely brought about microeconomic benefits, it has also been often associatedto reductions in private saving rates. This decline in saving contrasts with earlier predictions ofa positive saving flow response to deregulated (typically higher) interest rates and financialdeepening. In particular, deregulation of consumer and housing mortgage lending has often led-- for instance in the U.K. during the 1980s and Mexico since the late 1980s -- to a significantexpansion in these types of loans. In regard to interest liberalization, the world-wide empirical

25
evidence tends to show that saving is not very responsive to higher interest rates. But otherquestions are still waiting for answers. For instance, which are the features of domestic financialliberalization responsible for the frequently negative saving response -- and is this saving declineonly temporary? Are market imperfections or policy mistakes to blame for the decline in privatesaving?
(8) Is pension system reform conducive to higher saving?
Analysts and governments are becoming increasingly aware of the efficiency, distributiveand fiscal-macroeconomic pitfalls of conventional pension systems based on pay-as-you-gotransfers and state management. Since Chile's radical 1981 pension system reform, four LatinAmerican countries, and Australia and Switzerland within the OECD, have adopted pensionsystems that provide a larger role to fully-funded and decentralized pension institutions. Manyother developing, transition, and OECD countries are currently considering adoption of such areform -- including Mexico in the aftermath of its crisis. Some of them -- including Mexico-- aim to raise their saving rates. Under certain conditions a shift from a pay-as-you-go to a fully-funded pension scheme could indeed contribute to higher saving. But both theory and theempirical evidence gathered to date are weak in predicting the magnitude and timing of sucheffects. While pension reform is justified on many grounds other than saving, reformers aroundthe world would benefit significantly from a better understanding of the saving impact of thepension reforms they are considering.
(9) Do poverty and income inequality affect saving?
One of the stylized facts of development is that saving rates tend to increase with livingstandards and per capita income levels. However, the evidence is much less conclusive regardingthe association between aggregate saving and income inequality (for a given level of average percapita income). Yet a deeper understanding of that link is essential to assess the overall savingimplications of government redistribution and transfer programs.
(10) What drives saving in transition economies?
The depth and scale of the reforms involved in the systemic transformation of the so-calledtransition economies dwarf those undertaken in any other world region. Since 1981 in EasternEurope, and 1991 in the FSU republics, structural reform and stabilization efforts have reacheda scale unprecedented in modern economic history. In these economies, however, saving rateshave fallen well below pre-reform levels, often in tandem with output levels. Does the declinein saving reflect the end of forced saving during socialism, the management of the transitionprocess, or other standard factors such as fiscal imbalances, growing poverty, or consumptionsmoothing in the face of a transitional output drop and higher expected future income ? The

26
answer to this question will shed light on how permanent or temporary the saving decline is, andhelp elucidate if policy action is needed for to restore saving to levels more consistent withtransition economies' investment needs.
(11) What explains sustained saving-growth takeoffs?
Sustained saving and growth takeoffs have been the exception rather than the norm duringthe last four decades of development experience. A good understanding of how the saving-investment-growth process got started in these episodes, and what policies helped them (as wellas what policy mistakes were avoided) is still missing. On the one hand, this requires revisitingthe questions posed under issue No. 1, about the role of capital accumulation in growth and thecausalities between saving, investment, and growth. On the other, a closer look at these successepisodes is most important from the policy viewpoint, to identify the role of initial conditions andspecific policy levers in getting a successful transition underway.
(12) Why have saving and growth collapsed in Sub-Saharan Africa ?
Over the last three decades, Sub-Saharan Africa's has had both the lowest saving rates andthe poorest growth performance among world regions. National saving rates have been decliningsteadily since the early 1970s -- in tandem with growth. The rising gap between domesticinvestment and national saving has been filled by foreign saving in general and foreign aid inparticular. Low investment with poor productivity and abysmally low saving are at the core ofAfrica's growth collapse. While bad luck -- droughts, wars, and declining terms of trade -- hashad its share in the region's dismal performance, inappropriate policies have certainly alsocontributed to this outcome. Which policy reforms would be the most effective in raising Africa'sdomestic saving levels and therefore make the region less dependent on foreign aid ?
Ultimately, the above policy-relevant issues all relate analytically to a broader, all-encompassing task that will not be undertaken in this project: a thorough characterization of thewelfare analytics of saving involving an exhaustive description of the types of policy-induced andother distortions that lead to under-(or over-) saving. Tackling this issue in an analytically rigorousmanner would require the construction of a general equilibrium model, encompassing alternativetypes of market failures and externalities, and possibly allowing for multiple equilibria, tocharacterize the equilibrium saving outcomes under different configurations of distortions. Suchrather formidable task will not be attempted in this project.

27
PART II: PROPOSED RESEARCH
The main objective of this project is to explain differences in saving performance acrosscountries and over time in order to identify policies that impact on saving. The researchcomponents, hypotheses and methods draw generlly from the recent literature and, morespecifically, from four background papers (Deaton 1995, Honohan 1995, Obstfeld 1995, Weil1995) prepared for the project.
The research is structured into five major, closely inter-related, components:
A. Data base and panel estimation modelsB. Saving across the worldC. Policy issues of worldwide importanceD. Lessons from international saving experiencesE. Project findings and policy implications
Chart 1 summarizes the project's five components and identifies the specific issues that willbe addressed in each component. The first component addresses data and methodological aspectsrequired for carrying out subsequent research. The construction of an international macroeconomicdata base for saving and related variables built with consistent criteria is an essential pre-requisite forconducting the research. Part of the empirical research will be based on estimating relations basedon combined cross-country time-series data -- hence recently developed panel data estimationtechniques are summarized next. The second component of the research project focuses onunderstanding both saving differences across space and over time and the saving-growth link. Usingnew inforrnation from both National Accounts and household surveys, the research will shed light onthe factors that drive saving in the world and on the relationship between saving and growth. Thethird component will focus on the effects of specific policies on saving, using a cross-countrycomparative approach. To complement the issue-oriented research of the second and thirdcomponents, the fourth will assess in depth the saving performance of specific countries, countrygroups and world regions, to draw lessons from actual policy experiences. Finally, the fifth and lastcomponent will provide a policy-oriented synthesis of the main results and lessons from the research.
The research will be based both on relatively narrow analytical frameworks explicitly derivedfrom intertemporal optimization, and on broader models not derived from first principles butencompassing a number of alternative consumption/saving motives. Empirical implementation of theanalytical models will make use of both micro and macroeconomic data. For the project's cross-country studies, the aggregate data will be drawn from the saving data base. The precise empiricalmodels and the coverage of the data they use will vary across studies, depending on data availabilityand the need to tailor the samples to the specific questions under investigation. The subsequenttechnical annexes, discussed within each research component, provide extensive details on themethodology to be used by each of the papers that will be prepared within the project.

28
A. DATA BASE AND PANEL ESTIMATION MODELS
In order to adequately carry out the subsequent research based on macroeconomic data, thefirst part of the project addresses important data and econometric estimation issues that arise inempirical cross-country work on saving.
Section Al below describes the shortcomings of conventional macroeconomic saving data andproposes construction of a world data base that will overcome some of these limitations. Section A2summarizes recently developed panel data estimation techniques that will be applied in estimatingeconometric relations based on combined cross-country time-series data.
Al. A World Data Base of Aggregate Country Time Series
"The distinction between current consumption and saving, or puttingaside for the future, has been with us for ages. It was the basis forJoseph's solution to the seven lean years he foresaw (Gen. 41: 34-36)and for Aesop's fable of the ant and the grasshopper. Yet we still donot seem to have got it right, conceptually or empirically" (Lipseyand Tice, 1989, p. 1).
The purpose of this research component is to assemble a large and more adequateinternational data base on saving and related macroeconomic variables. Empirical consumptionand saving studies for both industrial and developing countries are often criticized because of theirreliance on inadequate aggregate data. The criticisms stem partly from conceptual and empiricalshortcomings of existing aggregate data and partly from inadequate use of the data by appliedresearchers.
Data on income, consumption, saving, and related aggregate variables from SNA (Systemof National Accounts) sources are maintained by various international organizations, including theUN, IMF, OECD, and the World Bank. These data suffer from inadequacies, inconsistencies andbiases that have undoubtedly affected the quality of existing empirical work. The problems rangefrom inadequate sector coverage, incomplete measurement and variable misclassification, toexclusion of capital gains and other sources of mismatches between saving flows and wealthchanges. Other data related to saving, including public-finance and rate-of-return information,are also subject to measurement problems and are widely dispersed in different sources.
The implication of these data problems surely should not be to stop empirical research.The right inference is to correct some of the problems -- subject to reasonable cost limits -- andraise awareness of the remaining problems that could cause biases in future empirical work.
Therefore assembling a world data base of adequate aggregate time-series data for a

29
consistent set of variables and a large number of countries is a first priority for carrying outempirical research on saving. The construction of a world data base of country time series forconsumption/saving flows and their main determinants, in the framework of this proposal, isjustified on three grounds. First, it will extend sample coverage to a broader set of developingand industrial economies. Second, it will correct some of the main shortcomings of existingaggregate SNA data used in most empirical studies undertaken to date. Third, it will extendcoverage to a significant number of saving/consumption determinants.
We focus subsequently on three data issues that are of fundamental importance for theconstruction of a world data base for this research project. First we survey briefly the existing databases on saving and saving-related variables. Then we describe the main shortcomings of existingdata and of their use in empirical research. Finally we discuss the main features and methodologicalimprovements of the world data base for aggregate country time series that will be assembled toconduct much of the proposed research.
Brief Survey of Main Data Bases
SNA data from national sources are maintained at various data bases of internationalorganizations. Four SNA data bases are accessible through the World Bank's BESD data base --those of the United Nations, IMF, OECD, and the World Bank itself -- that differ in coverage (theUN's is the most detailed data base) and reported values.5 Across countries there are majordifferences in the quality and coverage of data In addition, accounting practices reflected in thehistorical data bases differ from the revised standards set recently by the Inter-Secretariat WorkingGroup on National Accounts (1993).
Government flow data at aggregate level are reported as part of the national-accounts dataof the data bases mentioned above. More disaggregate government data are reported in "GovernmentFinancial Statistics" published by the IMF' 6 The latter source publishes data for the central or generalgovernment, relying on country sources that vary widely in accounting practices and data quality.Public investment levels are typically underestimated here and in the national-accounts data becausemuch of investment by public corporations is excluded. Alternative data bases that correct publicsector investment (as well as private investment) country data are Pfeffermann and Madarassy (1993)and Easterly and Rebelo (1993), covering a smaller number of countries.
5A summary table on the availability of time-series data in the U.N. and World Bankl data bases on income,consumption, saving, and related flow variables for all developing and OECD countries is available on request from theauthors.
6A summary table on the availability of time-series data in the IMF's GFS on govermment budgetary flowvariables for all developing and OECD countries is available on request from the authors.
30
As an altemative to the limited public sector coverage of the standard national-accounts andIFS data -- limited to the central or general government -- a recent research project at the WorldBank has started to compile a data base for the consolidated non-financial public sector deficit. Usingdata from country sources, these data consolidate general-government deficit measures with thoseof the non-financial public-enterprise sector for 58 developing and OECD countries and the 1970-1990 period (Easterly and Schmidt-Hebbel 1994, Table Al).
External debt, disaggregated by public and private, are put together by the World Bank'sannual "World Debt Tables". For public domestic debt stocks there is no systematic data base fordeveloping countries but time series exist for individual countries in specialized country publications.
Time-series data on various rates of interest (bank deposit and loan rates, discount rates,money market rates, treasury bill rates, and government bond yields, by maturities) are compiled inthe IMF's "International Financial Statistics".7 IFC compiles a data base for stock market priceindices and yields for a sample of emerging markets. The World Bank's PRDFP division hascompiled time-series data on interest rates for a selected number of countries.
Other data on saving or consumption determinants -- including variables on demography,income distribution, financial-sector structure -- are gathered and/or published by the U.N., theWorld Bank, and the BIS.
Inadequacies of Existing Aggregate Data and their Use in Empirical Studies
Existing data and their use in applied research are affected by a host of inadequacies. Weidentify 17 limitations that affect income, consumption, saving and related flow variables, and 3problems that affect rates of interest and return.
Available data and their use by applied researchers suffer from inadequacies, inconsistencies,and biases that undoubtedly have affected the quality of existing empirical work. Many of theseproblems have been identified in the sections on data discussion in Visaria (1980), Berry (1985), Fry(1988), Gersovitz (1988), Deaton (1989), Srinivasan (1993, 1994), OECD (1994), Schmidt-Hebbel,Serven, and Solimano (1995), and in the NBER volume on the measurement of saving, investment,and wealth edited by Lipsey and Tice (1989). For the purpose of this research project we summarizethe following 17 major problems in the data and/or their use. Some of these difficulties reflectconceptual shortcomings (because of the gap between theoretical concepts and their empiricalcounterparts), others are due to inadequate measurement efforts, and a few reflect inadequate use ofexisting data by applied researchers.
7A summary table on the availability of time-series data in the IMF's IFS on interest rates for all developingand OECD countries is available on request from the authors.
31
Problems of Income, Inivestment, and Consumption Data
(i) Income exclusionMuch of income and production is excluded from NIPA, in particular that of informal and
illegal sectors, (subsistence) agriculture, and households. The omission of non-cash (more generally,non-recorded) components from both income and consumption overstates saving and investmentratios but not their levels, while the omission of non-cash investment from income understates bothsaving and investment ratios but not their levels.
(ii) Unrecorded capital flightThis particular form of income exclusion (involving under-reporting of net exports) implies
an over-estimation of external saving. It implies either an over-estimation of gross domestic savingor an over-estimation of gross domestic investment.
(iii) International comparability of income levels (corrected by Summers and Heston)Due to the lack of an international currency, income and consumption measures are only
comparable across time within any given country. Summers and Heston (1990) denominated incomeand several expenditure categories in a common set of prices in a common currency, using thepurchasing power adjusted conversion factors. The publicly-available Summers-Heston data basemakes possible the comparison of income levels across countries and over time. However, it is alsobelieved that the uniform valuation of national accounts ignores the systematic differences in the pricestructures of economies at different development stages, therefore narrowing excessively the incomedistances between richer and poorer countries. The purchasing-power-adjusted conversion factorsare believed to include observed prices without adjustments for the large differences in productquality across countries. The gaps in Summers-Heston's coverage, quality, and timeliness of the basicsurvey data used in the calculation of conversion factors are also of concern.
(iv) Misclassification of consumer durablesSaving and investment are under-measured because purchases of consumer durables are
misrecorded as consumption instead of investment. Theory suggests that a more adequateconsumption measure should be based on the flow of services of currently-owned consumer durablesand, possibly, part of the services rendered by human capital. Reclassifying private consumer durablespending as investment could raise saving ratios by 2 to 8 percentage points of GDP in OECDcountries (OECD 1994).
(v) Misclassification of spending on human capitalSaving and investment are under-measured because expenditure on human-capital formation
(education, health, training) is misrecorded as consumption or intermediate production instead ofinvestment. For instance, reclassification of all education expenditures would raise saving ratios inOECD countries by 4-5 percentage points of GDP (OECD 1994). However, the difficulty in makingthis adjustment -- and similar adjustments for health and training spending -- is to identify the trueinvestment and consumption shares of each of these spending categories.

32
(vi) Misclassification of spending on research and development (R&D)Saving and investment are under-measured because expenditure on R&D is misrecorded as
intermediate production instead of investment. For instance, reclassification of all R&D expenditureas investment would raise saving ratios in OECD countries by 1-2 percentage points of GDP (OECD1994).
Problems of Investment Data
(vii) Estimation of aggregate and sector investmentGross domestic investment (GDI) is often obtained as the additions to overall capital by
capital categories: machinery and equipment, construction, and inventories. Gross investment in thepublic and private corporate sectors are independently estimated based on their reported accounts.However, public investment is typically underestimated by excluding all or significant parts ofinvestment undertaken by decentralized public corporations, in particular those projects not financedwith central or general government funds. Gross investment of the rest of the economy (householdsand unincorporated business) is a residual between GDI and corporate-sector investment.
(viii) Measurement of depreciation of physical assetsDepreciation of physical capital is subtracted from gross investment (and gross saving) to
obtain net investment (and net saving). The world-wide average depreciation ratio is roughly 10percent of GDP but shows significant country variation. Unfortunately, part of country differencesare due to varying depreciation methods. Depreciation measures based on accounting principles (thatvary across countries) often bear little resemblance to economic depreciation concepts. In addition,the distinction between inputs and capital goods in production sectors is often arbitrary.
(ix) Misrecording of maintenance expenditures on public capitalMaintenance of public-sector capital is typically misrecorded as recurrent expenditure, that
is, government consumption. In the United States both public recurrent maintenance and publicinvestment expenditures are misclassified as current spending.
(x) Measurement of environmental resources and misclassification of gross outputConventional national-accounts measures do not account for the depletion of environmental
capital and hence over-estimate true investment and output and income measures. Whilecomprehensive SNA methods are being started in many OECD and some developing countries, nohistorical corrected time-series are available for most developing countries.
(xi) Capital heterogeneityIntertemporal comparison of investment data is difficult because it involves comparing capital
goods of different vintages and quality. This applies also to consumption, particularly durables(Berndt and Triplett 1990). In the spatial dimension it is difficult to compare and aggregateinvestment from different sectors of origin because of capital heterogeneity.
33
Problems of Consumption Data
(xii) Varying methods in computing private consumptionSNA estimates of public consumption of central and local governments are obtained from
government sources. SNA estimates of private final consumption are based on three methods: (a)the expenditure method is based on direct informnation from household budget or expenditure surveys,(b) the commodity-flow method is based on direct information for prices and quantities of consumergoods, and (c) the residual approach that obtains private consumption as the residual balancing itemof the income-expenditure identity.
A combination of the first and second approaches is the most satisfactory as it is based ondirect household information, supplemented by production and foreign-trade information to allow forconsistency checks. The third approach is the least satisfactory because private consumption reflectsthe measurement errors and biases in estimating output and all other expenditure variables.
Table Al summarizes how countries are divided in applying the three methods to computeprivate consumption expenditure in their SNA data as compiled by the UN (Source: United Nations1979). As shown there, OECD countries typically rely on a combination of the first and secondmethods, while the residual method is applied by a large number of Sub-African and Latin Americancountries.
Problems of Saving Data
(xiii) Computation of saving as a residual: inconsistencies between current and capital-account savingmeasures.
When private consumption is not obtained as a residual (i.e., not based on method (c) above),private (and national) saving is still measured as the residual difference between private (and national)income and consumption. Then saving reflects the measurement errors and biases of income and allexpenditure variables. In addition, this current-account measure of saving is conceptually differentfrom the capital-account measure of saving. The latter computes saving as the change in net wealthderived from flow of funds accounts (FFA) or each sector. Consumption theory is based on incomeand saving measures consistent with net wealth changes, that is, saving consistent with FFAs.Changes in net wealth differ conceptually from current-account saving by both net capital gains onasset and liability holdings resulting from revaluations (see point xv below) and capital transfers.Statistical differences between current and capital-account saving measures are due to net capitalgains and measurement errors in both current and capital accounts. Empirical differences betweenthe saving measures derived from the two accounts are often large and sometimes huge, even inOECD countries (Lipsey and Tice, 1989).
The conceptual consolidation of current-account and capital-account (or FFA) measures ofsaving is straightforward (see for instance Host-Madsen 1979, Lipsey and Tice 1989, Holloway(1989), Wilson et al. (1989), World Bank RMSM-X references, Inter-Secretariat Working Group1993). FFA measures of saving and their integration into national accounts are pursued in many

34
OECD countries. For the U.S. in particular, there is a long literature on saving measures from bothmethods and their differences (see for instance Holloway 1989, Wilson et al. 1989, Hendershot andPeek 1989, and Boskin et al. 1989).
Few developing countries have pursued comparison and reconciliation of saving measuresfrom the two methods, due to the absence of systematically constructed FFAs and their integrationinto national accounts. FFAs impose significant data requirements and costs, including detailedinformation on balance sheets of households, non-financial corporations, financial corporations,general government, and the rest of the world (the five sectors considered by the SNA). Reynoldsand Camard (1989) compare saving measures from both methods for 5 Latin American countries,concluding that current-account measures typically underestimate FFA measures of saving.Unfortunately only one of the five countries -- Colombia -- continues to integrate its FFA into itsnational-accounts estimates (at both aggregate and sector levels, including households andcorporations), and hence is the only Latin America country with continuous integrated savingmeasures from 1970 to date. A recent paper by Honohan and Attiyas (1989) presents saving datafor 20 developing countries based on FFAs, but only for 8 countries the data on both the capital andfinancial accounts was available (see Honohan 1995 for additional discussion).
(xiv) Computation of saving as a double residual from the current accountWhen private consumption is obtained as a residual (method (c) in point (xi)), private (and
national) saving is the ultimate, double residual and reflects all inaccuracies incurred in estimatingincome and expenditure.
(xv) Exclusion of net capital gains from current-account savingAs noted in point xii above, one of the differences between current and capital-account
estimates of saving is due to the omission of revaluations from the former. Table A2 derives a simplereconciliation of current and capital-account saving measures by focusing on one importantconceptual difference: net capital gains from revaluations of assets and liabilities due to inflation andchanges in the real exchange rate. Other sources of capital gains -- such as changes in relative pricesof equity and housing -- are not considered in Table A2 because of the lack of systematic data toengage in these corrections.
(xvi) Exclusion of changes in contingent and implicit sector liabilities from saving measuresCurrent-account measures of sector saving exclude typically -- and FFA measures of sector
saving exclude often -- changes in implicit and in contingent sector liabilities, including pensionrights issued by the government to households (through state-managed and typically pay-as-you-gopension systems) and government guarantees issued by the government to private institutions (suchas loan guarantees and deposit insurance). Within the OECD, only for the U.S. there are consistenttime series of sector saving and net worth levels that include household pension wealth (seeHolloway 1989, Wilson et al. 1989, Henderson and Peek 1989, and McDermed et al. 1989). Fordeveloping countries no time series for private net worth and saving are available that comprisecontingent and implicit public liabilities such as pension rights.

35
(xvii) Mismeasurement of sector income and saving data due to inadequate public sector coveragePublic and private saving and disposable income measures are distorted when they are based
on a too narrow coverage of the public sector. The bias stemming from using general government(or, worse, central government) data is particularly significant in countries where large amounts ofcurrent and capital-account transactions occur between non-financial and financial public enterprises(including the central bank), one hand, and the domestic private or the external sectors, on the other.Examples of such transactions include loans by private domestic or foreign banks to public enterprisesand subsidies to and bailouts of domestic private firms and households by the central bank.
(xviii) Inadequate use of income and saving dataA large number of empirical saving studies are based on inadequate saving data. They rely
on to aggregate measures of saving -- ranging from gross domestic to national to private-sectorsaving -- when the relevant decision unit is the household or the individual. The problem of using atoo aggregate saving measure is that it assumes that households offset exactly any (permanent)change in government saving and/or in corporate saving by a change in household saving in oppositedirection and the same magnitude. However, such a perfect offsetting can only occur in a world ofperfect Ricardian equivalence (for public-household saving offsets) and perfect household piercingof the corporate veil (for corporate-household offsets), that requires empirically implausibleassumptions regarding capital-market efficiency and interdependence of current and futuregenerations. Hence a wider use of more disaggregate saving data, particularly for households, shouldbe given more weight.
Problems of Rate of Return Data
Most consumption and saving studies rely on interest rates paid on short-term deposits inbanking institutions as the rate of return relevant for saving decisions. Exclusive reliance on theserates are inappropriate due to the following reasons.
(i) Official deposit rates are not relevant under financial repressionWhen interest rates are fixed by governments -- a feature that was widespread in developing
countries during much of the historical 1960-94 period -- they are almost irrelevant as a measureof the alternative cost of consumption. Better proxies for the latter include (typically unrecorded)interest rates charged in unofficial financial markets, (typically unrecorded) rates of return oninvestment, or the rates on foreign deposits corrected for the expected rate of exchange ratedepreciation.
(ii) Deposit rates are not relevant for marginal saving decisionsWhen consumers face an array of financial savings alternatives, deposits are only one of the
choices. Hence rates of return on alternative instruments -- including government and private bonds,foreign- currency deposits on or off-shore, and stock market returns -- or a weighted average of therelevant returns are better measures of the cost of future consumption.

36
(iii) Gross rates of return are not relevant for marginal saving decisions.Few studies use net rates of return (gross rates minus relevant marginal capital income taxes).
But changes in marginal tax rates -- due to changes in legislation or enforcement of tax compliance-- are frequent and hence the use of gross rates introduces a potentially serious measurement biaswhen estimating marginal saving decisions.
Construction of a World Data Base
Objectives
The implication of the preceding list of data problems surely should not be to stopempirical research. The right inference is to correct some of the problems -- subject to areasonable cost limitation imposed on these corrections -- and raise awareness of the remainingproblems that could cause irrelevance and biases in future empirical work.
The construction of a world data base of country time series for consumption/saving dataand their determinants is justified on two grounds. First, it will extend coverage to a muchbroader sample of developing and industrial countries, both in space and in time. Second, it willcorrect some of the shortcomings of existing data and their use in most empirical studies.
Methodology
The sample will comprise annual data for all industrial (OECD) and developing countriesfor the 1960-1994 period. Saving and disposable income data will be disaggregated by sectors(public and private, and the latter between household and corporate sectors) according to dataavailability and the alternative definitions discussed below. The disaggregation of private savingand income by households and corporations will be possible for at least 19 OECD and 19developing countries. The complete sample will be divided into smaller sub-samples accordingto data availability.
The world data base will not correct for problems that are inherent to the methodology ofcomputing SNA data as this would involve a complete remaking of historical SNA data -- animpossible task in the framework of this project. This implies that most methodologicalshortcomings listed above will not be addressed here. Instead the focus will be in providing acomprehensive data base that will include alternative measures for those variables where they arerecommended and feasible to be derived (particularly for saving and disposable income). Thealternative series will present a few corrections that can both make a substantial improvement ofexisting data and be tackled at a realistic cost level.

37
Corrections of Income, Consumption, Saving, and Related Flow Data at National and SectorLevels
(a) Data inconsistencies in country time series in existing data basesThe data bases used as the basic sources for the world data base (United Nations, IMF.,
World Bank, and OECD) suffer from frequent inconsistencies and discontinuities in annualcountry time series data. Hence the first task will be to double-check the data bases with nationalsources and make appropriate corrections.
(b) Correction of public investment dataTo correct for the narrow public sector coverage embedded in conventional sources for
public investment (problem vii above), broad public sector investment data from Pfeffermann andMadarassy (1993) and Easterly and Rebelo (1993) will be used to derive adjusted public andprivate investment series.
(c) Correction of data for public saving, private saving, and private disposable income due towider public sector coverage
To avoid the mismeasurement derived from using a too narrow government data coverage(problem xvii above), the consolidated non-financial public sector deficit data base of Easterly andSchmidt-Hebbel (1994) will be double-checked and expanded in time and in space. Making useof an adequate broad measure of public investment, this allows to derive public saving for theconsolidated non-financial public sector. Given the latter, it is possible to derive residually acorrected measured for private saving and private disposable income (see equations (1) and (2),table A2).
(d) Correction of saving for capital gains and losses from inflation and real exchange ratedevaluation
Revaluation of private (and household) net assets is one of the conceptual differencesbetween FFA and current-account measures of saving (problems xii and xiv discussed above).The world data base will include both raw saving and disposable income measures derived fromthe current account and adjusted measures that add to the former the net capital gains due torevaluations of a limited number of net assets, leaving out other sources of FFA and current-account saving discrepancies.
The revaluations to be considered are reflected by the simple accounting framework inTable A2, that identifies three major categories of financial assets (domestic currency, domesticpublic debt held by the private sector, and net foreign debt issued by both public and privatesectors). As shown there, adjusted private saving (and adjusted private disposable income) levelscan be derived as the sum of conventional saving (and conventional disposable income) levelsderived from the current account and net capital gains from inflation and real exchange ratedepreciation (see equations (7) and (9) in Table A2). Analogous expressions can be derivc(i t,adjusted public and external saving levels.

38
While it is not anticipated that adjusted disposable income and saving levels will be derivedfor every developing country due to lack of data in some countries (particularly in regard to publicdomestic debt stocks), it is anticipated that available data will enable to derive these measures formost industrial countries and a large number of developing economies.
Rates of Return
The world data base will include appropriate information to deal with the three limitationsof most previous studies discussed above. This information includes data series on interest ratecaps (and floors), a broader set of rates of return on different financial instruments, and proxiesfor marginal capital income tax rates.
Coverage of Variables
The data base will be selective in terms of variable coverage by including only variables thateither represent directly or are required to build final variables used as dependent variables(consumption, saving) or as regressors (income and wealth variables, government flow and debtvariables, rates of return, and other regressors). In addition , the data base will include data for grossdomestic investment and GDP growth rates, as well as the two latter main determinants.
Table A3 provides a summary of the core variables in the world data base. Income,consumption, investment, saving, and related flow variables will be corrected (C) for datainconsistencies and errors in the original sources. In addition, all saving, disposable income, andtransfer and interest-payment components of foreign and public saving data will be presented in threeversions: corrected (C), corrected and adjusted for public sector coverage (CAC), and corrected andadjusted for public sector coverage and revaluations of net assets (CACR), as discussed above.Finally, more complete information on rates of return will be included to address the shortcomingsof previous studies discussed above.
Data Accessibility
The World Data Set will be stored on disk files and made accessible to outside users.

39
TABLE Al
MEASURES APPLIED TO DERIVE PRIVATE FINAL CONSUMPTION EXPENDITURE
Private Final Consumption Approach
Argentina Residual
Australia Expenditure approach and commodity-flow approach
Austria Commodity-flow and expenditure approach
Bolivia Residual
Botswana Residual
Brazil Residual
Canada Expenditure approach
Chile Residual
Colombia Residual
Cyprus Commodity-flow approach
Denmark Commodity-flow and expenditure approach
Dominican Republic Residual
Egypt Expenditure approach
El Salvador Commodity-flow and expenditure approach
Ethiopia Residual
Fiji Commodity-flow approach
France Expenditure approach and commodity-flow approach
Germany Expenditure approach
Ghana Residual
Greece Expenditure approach and commodity-flow approach
Honduras Residual
Hong Kong Commodity-flow approach
India Commodity-flow approach
Indonesia Expenditure approach and commodity-flow approach

40
Table A.1 (continuation)
Iran Expenditure approach and commodity-flow approach
Iraq Commodity-flow approach
Ireland Commodity-flow approach
Israel Commodity-flow approach and expenditure approach
Italy Expenditure approach and commodity-flow approach
Japan Expenditure approach
Jordan Commodity-flow approach
Kenya Residual
Lesotho Expenditure approach
Liberia Commodity-flow approach
Libyan Arab Jamahiriya Commodity-flow approach & other
Malawi Residual
Malaysia Expenditure approach
Malta Expenditure approach and commodity-flow approach
Mauritius Commodity-flow approach and expenditure approach
Mexico Residual
Netherlands Commodity-flow approach and expenditure approach
Nigeria Residual
Norway Expenditure approach
Pakistan Residual
Panama Commodity-flow approach
Papua New Guinea Expenditure approach
Paraguay Residual
Philippines Commodity-flow approach and income-elasticity approach
Portugal Expenditure approach and commodity-flow approach
Puerto Rico Expenditure approach and commodity-flow approach
Korea Expenditure approach and commodity-flow approach

41
Table A.1 (concluded)
Saudi Arabia Commodity-flow appreach
Sierra Leone Expenditure approach and commodity-flow approach
Singapore Expenditure approach and commodity-flow approach
South Africa Expenditure approach
Southern Rhodesia Residual
Spain Expenditure approach and commodity-flow approach
Sri Lanka Expenditure approach and commodity-flow approach
Sudan Expenditure approach
Sweden Expenditure approach and commodity-flow approach
Syria Commodity-flow approach
Thailand Commodity-flow approach supplemented by expenditure approach
Uganda Residual
United Kingdom Expenditure approach and commodity-flow approach
Tanzania Expenditure approach and commodity-flow approach
The United States Expenditure approach and commodity-flow approach
Uruguay Commodity-flow approach
Venezuela Commnodity-flow approach
Zaire Expenditure approach and commodity-flow approach
Zambia Residual
Source: United Nations, 1979.
Note: country-specific details on the application of each approach to derive private final consumption expenditure(PFCE) are not provided in the above mentioned publication. However, the three approaches are generallyapplied as follows:Expenditure Approach: PFCE is estimated directly from household budget or expenditure surveys, and other
sources.Commodity Approach: PFCE is estimated by: (i) adding distributive margins and indirect taxes to the value
of goods produced domestically or imported, and (ii) multiplying estimatedquantities purchased by consumers by appropriate average retail prices.
Residual approach: PFCE is estimated residually by deducting from GDP all other aggregate-demandcomponents.

42
TABLE A2
SAVING ANM INCOME MEASURES
Starting from the basic income-expenditure equation in current prices, the sum of private,public and foreign gross saving (in parentheses) is equal to the sum of private and public grossdomestic investment:
(Yp - Cp) + (TA - TR - i B -E i Fg) (1)
+ (-NX -E TR* + E i * Fpl + E it FgI + E ONFP= Ip + Ig)
where Yp is private disposable income, Cp is private disposable income, TA is taxes paid by theprivate sector, TR is net transfers received by the private from the public sector, i is the nominalinterest rate paid on public domestic debt B held by the private sector, E is the nominal exchangerate, i* is the foreign interest rate paid on foreign debt, F* is the net foreign debt of the publicsector, NX is net exports, TR* is net transfers from the foreign to the domestic private sector,ONFP is other (non-interest) factor payments from the private to the foreign sector, and I is grossinvestment. Superscript * denotes foreign-currency values and superscripts p, g, and -1 denotethe private sector, the public sector, and the preceding period, respectively. All stocks refer tothe end of the corresponding period. Price variables, however, are average-period variablesconsistent with flow variables.8
Consistent with equation (1), private disposable income is defined as:
Yp = Y + i B, + TR + E TR* - TA - E i* Fp - E ONFPv (2)
where Y is GDP.
Gross private saving is equal to the net (cash) accumulation of private assets, and the latteris equal to the increase in private sector wealth minus net capital gains:
Sp = Yp - Cp = (B -B 1 ) - E (Fp - F + (H - H)(3P Awp - P ncgp
S A more complete derivation would distinguish between average-period price variables for flow variables andend-of-period price variables relevant for stock variables, as in Khadr and Schmidt-Hebbel (1989).

43
TABLE A2 (continued)
where H is domestic base money held by the private sector, P is the private-consumption deflator,wp is real net private wealth, and ncg p is real net capital gains of the private sector. Real netprivate wealth -- the ratio of current-price net private wealth and the private consumptiondeflator -- is defined by its components as:
wp = b -f+ h (4)
Real net capital gains of the private sector -- the ratio of current-price net capital gains of theprivate sector and the private consumption deflator -- is defined as:where small-case letters denote constant-price flows or stocks in domestic currency units (forinstance f,- (E.J/P_1) F 1l), and Greek letters denote rate of change of prices as follows: it is(P-P 1)/P 1 , 7r* is (P*-Pl*p)/P *1 and e is (EP*/P -E 1 P_l7IP_1 )/(E,P l*/ P1 ).
- ncgp - 7r ) b b - (uE )fp l + (T 11) hl (5)
Note that similar equations for saving, wealth, and net capital gains can be derived forthe public and foreign sectors.
Substituting Fisher equations for domestic and foreign interest rates and after simpletransformation, substitution of (2) into (3) yields the following equation for private grosssaving:
Sp P y + TR + E TR*- TA - E ONFP* - Pcp
+ P [r + ] b, - P [r + _] (I+e)f,
=P (b -bl) -P(f - + P (h - h-) (6)
weP Ti) b l _ p Pn* ie the d P and ) h G
where Py is the GDP deflator and y is real GDP.

44
TABLE A2 (concluded)
Dividing (5) by P allows obtaining "real" gross private saving defined as current-pricegross private saving deflated by the private consumption deflator.
Adding private net capital gains (eq. (5)) to private saving (equation (6)) yields adjustedgross saving, i.e., a measure of saving that is consistent with wealth accumulation of theprivate sector:
Sp _ Pyy + TR + E TR* - TA - E ONFP* - P
+ P r b - P [r *(l+E) + E] fp*-l - P ( ' ) hl (7)
= P (b - b 1) - P (f* - fp -) + P (h - h,)
Similarly, adding net capital gains to private disposable income yields Yp, the adjustedmeasure of Yp.
Summarizing:A A
A constant-price measure of adjusted private disposable income is:
A Py +TR +E R TA E *yp--y+ +T - -- OFP P P P (9)
+ r b_1 -[r*(l+E)+E]fp l ( ) h,
Similar expressions can be derived for adjusted saving and adjusted disposable income(in constant and current prices) for the public and external sectors.
Source: Authors' calculations.

45
TABLE A3
MAIN VARIABLES INCLUDED IN WORLD DATA BASE
1. Income, Consumption. Investment, and Saving Flows (includungiGovernment Variables)9
Gross Domestic Product and Gross National Product (C)Total, Private (Corporate and Household), and Public Consumption Expenditure (C)Gross Domestic, Gross Private, and Gross Public Investment Expenditure (CAC)Net Exports (C)Gross Domestic Saving (C)Gross National Saving and Gross Foreign Saving (C, CACR)Gross Public and Gross Government Saving (C, CAC, CACR)Gross Household and Gross Corporate Saving (C, CAC, CACR)Private Disposable Income and Household Disposable Income (C, CAC, CACR)
Deflators for GDP, public and private consumption, public and private investment, exports, and imports
Transfer (taxes, transfers to households) and Interest Payment Components of Foreign Saving (C, CACR)and Public Saving (C, CAC, CACR)
2. Wealth and Debt Stocks
Base money held by the private and household sectorsNet domestic public debt held by the private and household sectorsNet foreign debt issued by the private and public sectorsPrivate and public net worth
3. Rates of Return
Bank deposit and lending ratesDiscount and money market ratesGovernment bond yields and Treasury bill ratesStock market yieldsCaps and floors on interest ratesMarginal tax rates on capital income
4. Other Consumption/Savingz Determinants
Demographic indicatorsFinancial-sector structure and flow variablesIncome-distribution measures
9 C is corrected, CAC is corrected and adjusted for coverage, CACR is corrected and adjusted for coverage andrevaluations.

46
A2. Estimating Panel Data Models'"
Advantages of Panel Data Analysis
A panel data set consists of multiple time series observations for a given sample of cross-sectional units. Compared to purely cross-sectional or time-series data sets, panel data sets haveseveral major advantages. First, panel data sets provide researchers a larger number of data pointsthan cross-sectional and time-series data do, thus increasing the degrees of freedom of the regressionand improving the efficiency of econometric estimates.
Second, working with panel data allows us to control for unobserved individual-specificeffects and/or time-specific effects. Cross-sectional modeling imposes quite restrictive assumptionson the model specification in the sense that although group-specific effects can be analyzed,unobserved individual-specific effects have to be ignored. Since individual-specific effects arecorrelated with other explanatory variables in most cases, the omission violates the orthogonalitycondition of the errors to the included explanatory variables. It thus results in biased least squaresestimates unless instruments are available. If panel data are used, we can get rid of the individual-specific effects by first differencing the equation. By the same token, we can get rid of the time-specific effects by taking the deviation from the mean across individuals at a given time.
Third, working with panel data allows us the use of previous observations as instruments forthe explanatory variables that are not strictly exogenous.
Fourth, for time-series data, multicollinearity among explanatory variables may be a seriousproblem. For example, in the estimation of a distributed-lag model:
h
Yt= E tt,-I+Ut1=0
where x, is an exogenous variable and u, is a random disturbance term. In general, x, is highlycorrelated with x,, and 2xt, - x,-2. So very serious multicollinearity problem appears among theexplanatory variables. Hence, there is not sufficient information to obtain precise estimates of anyof the lag coefficients without specifying restrictions. If a panel data set is available, thedifferences in x across cross-sectional units can be used to reduce the collinearity and severalrestrictions can be dropped.
With these advantages of panel data in mind, we are now ready to discuss several estimationmethods of panel data.
10 Prepared by Wanhong Hu and Norman Loayza.

47
GMM Procedure for Dynamic Panel Data Models
Advantages:- Accounts for individual-specific and time-specific effects.- Relaxes the assumption of strict exogeneity of explanatory variables.
Disadvantages: Because it is based on time differencing, it- Reduces the "signal" variance and may increase the "noise" variance.- Eliminates purely cross-sectional information from the regression.
Consider the dynamic panel data model
Y,itaY, 1t -+PIXt+ ee, +111+t,r+, (1)
where x is a set of explanatory variables, e is the set of explanatory variables for which only cross-sectional data are available, pij and i, are individual- and time-specific effects respectively. The dataconsist of N individual time series, each of them has T time periods.
To account for unobserved individual-specific effects, all variables in equation (1) are first-differenced. This eiiminates not only the unobserved individual-specific effects but also all variablesfor which only cross-sectional information is available. After first-differencing, regression equation(1) becomes:
Y. Yij.,l °0t(Y,, -Yjl 2+(,-,tl+i--)(i-i (2)
Note that first-differencing introduces a correlation between the new error term and the differencedlagged dependent variable. Therefore, OLS estimation of equation (2) produces biased results, evenwhen the set of variables x is strictly exogenous. Assuming that the ei, are serially uncorrelated, thatis, E(ej, e,)=O for t•s, values of y lagged two periods or more are valid instruments in equation (2).Therefore, for T>3, the model implies the following linear moment restrictions:
E[(,t-Ci,t-,)Yi,t] = 0 (1=2,...,-1; t=3,...,7) (3)
In the case that the problem of reverse causation applies to most variables in the set x,assuming that they are strictly exogenous would lead to inconsistent estimation. Assume, rather, thatx are only weakly exogenous in the sense that E(x,, j)*O for s-t and E(x.1 ej5)=O otherwise. Valuesof x lagged two periods or more are valid instruments in equation (2). ForTŽ3, the model impliesthe following additional linear moment restrictions:

48
= 0 (j=2,.. ,t-1; t= ,.., ) (4)
Hensen (1982) and White (1982) propose an optimal estimator, the Generalized Method ofMoments (GMM) estimator, based only on moment restrictions, that is, in the absence of any otherknowledge concerning initial conditions or the distributions of the error term and individual-specificeffects. The moment restrictions equations in (3) and (4) can be written in vector form as E[Z'ivi]=O,where v, = ((Ei,3 - El2) ... (EiT - ELT-1))' and Zp, is the instrument matrix of the form Z1 = diag (yi, . .yi,x l ... x,S ), (s = 1, ..., T-2). Note that the number of columns of Z1, say M, is equal to the numberof available instruments. Following Hansen (1982), the form of the GMM estimator of the k x Icoefficient vector 0 = (ax 1')' is given by
0 = (ZA N Z 't'ZA,ZNZY
where a bar above a variable denotes first differences. X is a stacked (T-2)N x k matrix ofobservations on x'ijt and y',; y is a stacked (T-2)N x I vector of y'it, Z = (Zi' ZN')' is a (T-2)N x M matrix; and AN is any M x M, symmetric, positive semi-definite matrix. Given the momentconditions being used, the estimated coefficients are the most efficient when AN = E[Zi'v1 vi' ZJ, thatis, when the matrix AN is equal to the variance-covariance matrix of the moment conditions. A two-step procedure has been suggested by Arellano and Bond ( 1 991) to obtain the most efficient GMMestimator. The first step estimator is obtained by assuming
A N = [N A I ZHZH 1
where H is a (T-2) square matrix which has twos in the diagonal, negative ones in the firstsubdiagonals and zeros otherwise. Therefore AN is positive semi-definite and the GMM estimatoris consistent. In the second step, the residuals from the first step regression, vi, are used to constructthe variance-covariance matrix of the moment conditions. The weight matrix is then
AN = [N -': Z§3'f^^jZ1]i
Hence, the GMM estimator is the most efficient.
Chamberlain's II-Matrix Estimation Procedure
Advantages:- Accounts for individual-specific and time-specific effects.- Does not reduce the "signal variance"

49
- Makes use of purely cross-sectional information.- Eliminates the biases when the lagged dependent variable suffers from
measurement error.
Disadvantages:- Assumes that explanatory variables are strictly exogenous.
Consider the dynamic panel data model
Y t = PIx,,+(1+Y)Y,, 1 +z +,+Ci +E, (5)
The possibility of errors in variables is allowed regarding the dependent variable, y. To account forthe time effects the data are processed by removing the time means from each variable. Thus the i,'scan be ignored and the regression can be fit without a constant.
Least squares estimation ignoring the individual-specific effects and the errors-in-variablesproblem produces biased estimators. In particular the estimate of (I+y) is biased in an unknowndirection: the measurement error biases the estimate downwards, and the individual-specific effecttends to bias it upwards.
Using the within estimator (or any other panel-data estimator based on time-differencing) tocorrect for the individual-specific effects bias is inappropriate. The specific-effects bias disappears,but the measurement-error downward bias tends to worsen. This is due to the reduction in "signal"variance brought about by time-differencing. Furthermore, given the presence of a lagged dependentvariable, time-difference estimators by construction create an additional downward bias. Therefore,in general the within and other time-difference methods underestimate (I+y).
Chamberlain (1984) proposes the HI-matrix estimation procedure which allows us to correctfor both measurement-error and specific-effects biases. The procedure consists of writing both thelag dependent variable and the individual-specific effect in terms of the independent regressors andthus obtaining reduced-form regressions from which to obtain the coefficient estimates of interest.More specifically, the HI-matrix procedure consists of two steps. First, the parameters of the reduced-form regressions of the endogenous variable in each period in terms of the exogenous variables areestimated in all periods. Thus, we estimate a multivariate regression system with as many regressionsas periods for the endogenous variables are available. Since group-wise heteroskedasticity andcorrelation between the errors of all regressions are allowed, the seemingly unrelated regression(SUR) estimator is used. As a result of this first step, we obtain estimates of the parameters of thereduced-form regressions (these are the elements of the II matrix) and the robust (White'sheteroskedasticity-consistent) variance-covariance matrix of such parameters.
Our working model may imply some restrictions on the elements of the II matrix; or in otherwords, the parameters we are interested in are functions of the elements of the II matrix. Then, inthe second step of the procedure, the parameters of interest are estimated by means of a minimum

50
distance estimator, using the estimated robust variance-covariance of the estimated II as the weightmatrix:
Min(VeclI-ft*)) Q (Vecll -ft))
where j is the set of parameters of interest, and Q is the robust estimated variance-covariance of theII matrix. Chamberlain (1982) shows that this procedure obtains asymptotically efficient estimates.
In order to use this method, we need to make explicit the restrictions that the working modelimposes on the 11 matrix. After removing the time means, equation (5) can be written as
Yi't =: pIxi',+(I +y)Y,t- I+ pu + Ei,
(6)
Ee 1i,Jt , l -IX>,T=Z] for i =, .,T
By recursive substitution of the y,, term in each regression equation, it is obtained
yi,o = Yi,O
Yi,l = Pxj,, + (1 +y)yi,O + 11 + W"I
yi22 ( ±Y)f'X,1 +'X 1.2 +(1 +Y)2y, 0 + [1 +(1 +Y)gi +2
yj 3 (I +y)2plX I, +(1 +Y)P'Xj,2+ P'Xj*3+ (}+Y)3y'i,0 + 11+(l +Y)+(l +y)2][1 + Wj,3
y, (I (+y)T Ip/Xi +...+ +PX'T + +Y)Tyi,O [ I +(I y) +.+(IyT-pi
E *[wi,jtxI,.,1- j =0 for t== ,T and i= i,..,N
Chamberlain (1984) proposes to deal with the correlated individual-specific effect, ki, and theinitial condition, yi, , by replacing them by their respective linear predictors (given in terms of theexogenous variables) and error terms, which by construction are uncorrelated with the exogenousvariables. The linear predictors are given by

5 1
E (y,O| I * X,,X, 2, .T) X, X + 2 * 2 + *-+ +X,,T
X / / x +.. /
E I 2Xll 2Xw .XT)1X,,lI + 2 x 2 +T 7Xi,T
As Chamberlain points out, assuming that the variances are finite and that the distribution of(x;i,..., X4T, A) does not depend on i, using the linear predictors does not impose any additionalrestrictions.
Next we write the II matrix implied by the working model. For instance, if the panel dataconsists of 5 cross section units for the exogenous variables x and 6 cross section units for thevariable y, the additional cross section for y is given by the initial condition yo. Thus, the multivariateregression implied by the working model is
Y1'O~~~~~~~~.
1,1~~~X,
2~~~
"3~~~~~X
(.4~~~~~~~1'
"5~~~~X,
fl= [B + +
where
0 0 0 0 0
13' 0 0 0 0
O O OY)P, PI 0 0 0
B = (1 +y)1' BOO O(1+y) 2p' (1+y)pl' p' O
(1 +Y)3 p (I y)2 'P (I +y)P' P' 0
(1+Y) 4 j' (1 ±y) 3+ P' (I +y)1P' (I+y)' I p1 I

52
O1+Y)
X/= (1+y)3'1 24 243 4 24]
(l+y) 4
(1+y)5
0
1
1+(I +Y)+(I +y)2 1 / / /4
1 +(1 +y)+(l +y) 2 +(1 +y) 3
1 +(I +y)+(I +y) 2 +(1 +y) 3 +(1 +y) 4
If we also consider the case in which some information as to one of the elements of theindividual-specific factors is given, rewrite equation (6) as
y,t = P'x±,+(1 +y)y, -1 +Oee, +V, +E,
(7)
teij Xi, ... xi,T, e3] =° for I = 1,_.., T
where ,Ai = O¢e1 + v;. In this case, the associated multivariate regression is very similar to the onewhere no information as to the individual-specific effects is available. Working with recursivesubstitution and the appropriate linear predictors, as in the previous case, the multivariate regressionassociated with equation (7) is the following

53
Yi,o 'I
yi,2 X',3
x 4
4 xI,5
II = [B + +
where
0 0 0 0 0 0
O +Y),P, O +Y)P/ P/ 0 0 0
(1-i-y)2p' (1 +y)13' 0 0 0
(I+y)3
g' (I+y)2
p/ (I+y)pl P3/ 0 0
(I+y)4
pl (1 +y)3
pl (1 +y)2
p/ (1 +y)p/ 3' 0
(l+y)4(l+y)2
(+y)4
(+Y)5 ]

54
0
I
f T = |~ +(0 +y)+(l +Y)2 [TX I/2 3 T4 5 (e o)
+(I( +y)+(I +y)2 +(1 +y)3
I +(1 +y) +(I +y) 2 +(I +y) 3 +(I +y)4
From the implied restrictions on the 11 matrix (in particular those related to the coefficientson ei ), note that T:e cannot be separated from Q : only (; + p ) is identified. Therefore, eventhough this elements of the individual-specific effects help condition for the individual-specific factor,its precise effect on the dependent variable is not identified without further restrictions.
Panel Data Estimation using the Bayesian Shrinkage Estimator
Advantages:- Accounts for parameter heterogeneity and homogeneity.- Increases efficiency of estimation when the true model has parameter
heterogeneity.
Disadvantages:- Complicates the calculation by iteration.
The most common approach to the analysis of panel data is to pool the observations, with orwithout separate intercept terms, and assume that the slope coefficients do not vary across cross-sectional units or over time. The separate intercepts are either fixed or random. Therefore thesemodels account for heterogeneity in the intercept term only. But there are cases in which there arechanging economic structures or different socioeconomic and demographic background factors thatimply that the slope coefficients may be varying over time and/or may be different for different cross-sectional units. For the purpose here, we shall focus on the cross-sectional heterogeneity. In thatcase a separate time series model may be chosen to estimate the parameters for each cross-sectionunits. But this ignores any similarities among individual units. Instead of choosing between thepooled model and the unpooled model as two exclusive alternatives, one could consider acompromise between the two, by assuming that the parameters in the different cross-sectional unitsare not aDl the same but not all completely different either. One model that can achieve such purposeis the random coefficient model.
Several estimation methods are proposed for the random coefficient model. Among them,the iterative Bayesian estimator is the most efficient one, as demonstrated by simulation studies. Thefunctional form of the iterative Bayesian estimator is

55
I~½( ~x1 x+ -' ' j
where
N
N1=
N-k-i
This iterative Bayesian estimator is the weighted average of the estimates of the individualcross-section parameters and their overall mean with the weights equal to the inverse of theirvariances. When the parameter heterogeneity is true, the variance of the overall mean is large, so thata larger weight is given to the estimates of the individual cross-sectional parameters. Therefore itemphasizes the parameter heterogeneity. On the other hand, if the individual parameters arehomogenous in the true model, a larger weight is given to the overall mean. So parameterhomogeneity is emphasized. It is called the shrinkage estimator because the estimates of theindividual cross-sectional parameters are shrunk towards their weighted average.
When the true model incorporates parameter heterogeneity, it is not appropriate to estimatethe panel data model using fixed or random effects models. It is shown in simulation studies that theabove Bayesian shrinkage estimator outperforms the estimator for the time series model for individualcross-sections, the estimator for the fixed effect model, the estimator for aggregate time series model,the estimator for aggregate cross-section model, the within-group estimator and the Stein-ruleestimator by having the smallest root mean squared errors.
B. SAVING ACROSS THE WORLD
Saving rates display considerable variation across countries and, in addition, they are stronglyassociated with growth performance. The objective of this part of the research is to improve ourunderstanding of these two phenomena, by addressing two main questions: first, why do saving ratiosdiverge so much across countries ? Second, what are the analytical underpinnings and the quantitativeimportance of the saving-growth link ?

56
This part of the research will consist of three components. First, the implementation ofempirical aggregate models of saving using the world data base Second, an empirical analysis of thelinks between saving, investment and growth in a general-equilibrium setting. Third, an empiricalinvestigation of household saving behavior using an international set of time-series of householdsurveys. We provide here a brief overview of the proposed research, and then turn to the detaileddescription of each component.
To assess the chief forces behind saving, the first component will implement empiricalaggregate models of saving based on a partial-equilibrium setting. There is a substantial literatureestimating the behavior of consumption (or saving), including its responsiveness to growth, in areduced-form framework. For the most part, however, it is quite uneven in data and econometricquality. Further, it says little about whether the main factors behind saving are similar for industrialand developing countries, and, perhaps most important, for households and firms.
The proposed research will address these issues. Using the best available cross-country time-series data (from the project's saving data base already described) and applying adequate econometrictechniques, it will provide a systematic account of what the international data say on savingdeterminants, paying close attention to the estimated magnitude of the impact of key savingdeterminants, such as income growth -- both over time, across countries, and in LDCs compared toindustrial countries -- to check their consistency with the effects predicted by the theoretical modelsreviewed in Part I above. By separating (for a smaller sample) firm and household data, it will analyzethe extent to which firm decisions differ from household behavior. This distinction is central in manycountries: corporate saving is a large fraction of aggregate saving and, since it is mostly geared tofinance firms' investment, it could account for the bulk of the observed saving-growth correlation(under the plausible assumption that households fail to pierce the 'corporate veil').
The empirical work will be reflected in two papers devoted to the estimation of consumptionand saving equations based on mutually complementary approaches. The first one, described in detailin section B 1 below, will implement standard reduced-form saving/consumption equations,investigating the empirical determinants of private saving/consumption rates and the differencesbetween aggregate household and firm saving behavior, as well as the differences between industrialand developing countries. The second paper, summarized in section B2 below, will focus onidentifying the effects of income inequality on aggregate saving, using a structural approach.
The second research component will focus on improving our analytical understanding andquantitative assessment of the relationship between saving and growth. Clarifying the reasons thatexplain the strong empirical association between saving ratios and growth rates is a task withextremely important policy implications. If the observed correlation reflects the fact that saving is amajor cause of growth, the consequence is that overcoming poverty requires a policy frameworkoriented to encouraging saving. If, on the contrary, the positive correlation is primarily due to the factthat higher saving rates are the result of faster income growth, the policy framework should targetinstead the forces driving growth -- investment in physical and human capital and/or technologicaladvancement. Of course, these two explanations are not mutually exclusive (or even exhaustive).
57
The recent literature has shed some light, and raised new questions, on the saving-growth link.Work by Carroll and Weil (1994) presents empirical evidence that saving appears to follow growth,rather than preceding it; they conclude that the observed correlation reflects, at least in part, reversecausation from growth to saving. In fact, this direction of causation is implicit in the large number ofcross-country empirical studies of saving that, since Modigliani (1970), include income growth amongsaving determinants. Most find a positive and highly significant effect of growth on saving rates (seeMasson et. al. 1995 and Edwards 1995a for recent examples), a result -- as noted above -- hard toexplain in the framework of conventional consumption theory.
The alternative, saving-to-growth view has a long tradition in development economics. It isgrounded on two key propositions (see Schmidt-Hebbel, Serven and Solimano 1996 for an extensivediscussion): first, national saving is fully reflected in domestic physical investment. Second,investment is a (or the) centerpiece of the growth process. In theory, the first proposition need nothold in the open economy, where national saving can be devoted to financing investment abroad. Inpractice, however, the well-known finding by Feldstein and Horioka (1980) -- recently corroboratedby Feldstein and Bacchetta (1991) -- indicates that national saving and domestic investment ratiosmove closely together also in the open economy.
While this has been argued (by Feldstein and Horioka 1980, Feldstein 1994) to be proof ofcapital immobility, with the implication that saving increases crowd-in domestic investment (albeitthrough unspecified mechanisms), a number of alternative interpretations have underscored variouscommon factors that can move saving and investment in the same direction (see Obstfeld 1994 foran overview): restrictions on countries' current account imbalances, imposed explicitly by worldfinancial markets, or implicitly by governments' current account targeting (Summers 1988);11 theeconomy's long-run budget constraint, which also prevents long-run saving and investment fromshowing large divergences;12 relative price and demographic variables affecting both saving andinvestment (Taylor 1994); and, finally, domestic capital immobility reflected by the importance ofretained earnings (i.e., firm saving) as a source of investment financing in most countries -- ahypothesis especially relevant for LDCs, where capital market imperfections are widespread andborrowing constraints are the norm.
Consider now the investment-growth link. While in the conventional neoclassical growthmodel physical investment only affects growth in the transition to the steady state -- in which growthis driven by exogenous technical progress --, the 'new' growth literature attaches a more prominentrole to capital accumulation as a determinant of long-run growth, in particular by emphasizing theclose links between physical investment and technical progress (e.g., Romer 1986, 1987, among many
I I Some empirical support for this view has been recently provided by Argimon and Roldan (1994), who showin particular that in countries enforcing capital controls saving appears to precede investment, according to CTrangercausality tests.
12 Coakley et. al. ( 1995) provide some empirical evidence in support of this argument. They argue thatsolvency requires the current account balance to follow a stationary process. This in turn requires saving and investmentto co-integrate with a unit coefficient, a requirement which is validated in their data.

58
others), a notion that dates back to the "vintage capital" extension of the neoclassical model (Phelps1962, Bliss 1968). In any case, the strong correlation between investment and growth rates is a well-established empirical fact (see e.g. Levine and Renelt 1992), and recent work by Alwyn Young (1994,1995) has underscored the central role of capital accumulation in East Asia's stellar growthperformance. In turn, the correlation between investment and technical progress has also beendocumented (e.g., DeLong and Summers 1993).
An extreme, albeit popular, interpretation of these empirical facts is the 'capitalfundamentalism' view, according to which physical investment is the only prerequisite for growth (seeKing and Levine 1994 for a critical discussion). This notion contrasts with the increasing attentionpaid by the recent growth literature to the role of human capital and technological innovation in thegrowth process. Indeed, it has been argued that the co-movement of investment ratios and growthrates may largely reflect the action of third factors -- such as technological innovation -- driving bothcapital accumulation and output expansion (Benhabib and Jovanovic 1991, King and Levine 1994).In an extreme view, physical investment would just be a consequence, rather than a cause, of thegrowth process, itself driven by human capital, technology and ideas. In this vein, Blomstrom et. al.(1993) argue that empirically growth Granger-causes investment, and not conversely.
From the policy viewpoint, the upshot of all this literature is that, in spite of the closeempirical association between saving and growth, the extent to which saving-enhancing policies cancontribute to raise growth remains unsettled. Thus, the objective of the second research componentis to help clarify the empirical relevance and the analytical underpinnings of the saving-investment-growth link, to assist in the overall design of growth-enhancing policies. The component includes twopapers. The first one, described in Section B3 below, is essentially empirical, and its purpose is toprovide a systematic account of the observed regularities concerning the saving-investment-growthlinks, which at present is unavailable in the literature. By contrast, the second paper (summarized inSection B4) will focus on the analytical foundations of those links, by constructing and simulating astructural model of saving, investment, and growth derived from first principles.
Finally, to complement the above research based on macroeconomic data, the thirdcomponent of this part of the research will investigate the determinants of household saving usingtime-series of cross-section household surveys from a set of diverse countries. It will focus on twoissues: the role of life-cycle patterns in household saving rates, and the role of habits, the acquisitionof durable goods and other non-life-cycle determinants of saving behavior. As discussed in Part I,these two types of factors are capable of generating a positive effect of growth on saving, althoughthrough rather different channels. The life-cycle effect of growth on saving (Modigliani 1970) is anaggregation phenomenon that comes from changing the "weights" of different age groups within thepopulation in favor of the young, who (according to the theory) save more than the old, with theimplication that aggregate saving rates rise. By contrast, the habit effect operates at the level of theindividual household. As stated above, the basic idea of the consumption habit model (Carroll andWeil 1994; Carroll, Overland and Weil 1994; Deaton 1995) is that the marginal value of consumptiondepends on a stock of habits (perhaps embodied in a stock of durable goods) accumulated in the past;consumption responds to earnings innovations more slowly than in the standard permanent income

59
model, and therefore the result of earnings growth is higher saving, at least temporarily -- i.e., untilstocks of habits adjust to higher levels.
The research will consist of two separate papers respectively exploring these two sets ofissues. As described in more detail in Section B5 below, both papers will use a common data base,which will consist of time series of cross-sectional household income and expenditure surveys froma range of countries. These data can be used to track the earnings, income, consumption and savingexperiences of birth cohorts over time.
B1. Saving and Policies across the World
This study will identify the empirical regularities of saving/consumption and their sensitivityto their main determinants over time and across countries. The paper will make use of a reduced-form set-up for consumption/saving in the vein of the empirical saving studies by Schmidt-Hebbel,Webb and Corsetti (1992), Masson, Bayoumi and Samiei (1995), and Edwards (1995a). However,this paper will aggregate value on the existing literature in five dimensions, by allowing for:
A larger set of dependent variables. The equations will be specified and estimated separatelyfor constant-price private consumption ratios and current-price national, private, household,and corporate saving ratios. Alternative definitions and measures for saving, as discussed inSection Al and reflected in the project's saving data base, will be considered.
* A broader set of consumption/saving determinants. The specification will include a broadset of categories of regressors: income measures (in levels and rates of growth), consumerasset levels, rates of return, public-finance variables, demographic variables, income inequalityindexes, consumer uncertainty measures, etc.
* More flexible specifications. Functional specifications will allow for nonlinear effects (forexample, in real per-capita income and interest rates) and interaction terms (e.g., betweeninequality indicators and income levels).
a Use of the project 's large Saving Data Base.
* Adequate treatment of econometrics issues. The empirical study of saving and itsdeterminants will be based on panel-data econometrics techniques (see Section A2 fordetails). Estimation based on panel data (which consists of multiple time-series observationsfor a sample of cross-sectional units) offers several major advantages. First, given that paneldata have a larger number of observations than either cross-sectional or time-series data do,their econometrics estimates are more efficient, that is, their associated standard errors aresmaller. Second, working with panel data allows to control for unobserved individual (e.g.,country) and time heterogeneity. Since individual-specific and time-specific effects arecorrelated with other explanatory variables in most cases, omitting them results in biasedordinary-least-squares estimates. Using panel data, the time-specific effects can be eliminated

60
by taking the deviation from the mean across individuals at a given point in time. By the sametoken, individual-specific effects can be eliminated by time-differencing the regressionequation (Anderson and Hsiao 1982). Given that we will, in all likelihood, estimate dynamicmodels (e.g., with lagged-dependent variables), time-differencing introduces a correlationbetween the error term and the differenced explanatory variables. In this case ordinary leastsquares is inappropriate, and instruments, usually based on previous observations of thedependent variable, must be used (Chamberlain 1984.) Third, panel-data estimation allowsto solve, at least partially, the problem of joint endogeneity of the explanatory variables.Searching for appropriate instruments is difficult, particularly when the dependent variableis a multi-faceted variable such as the saving rate or the growth rate. Panel-data provides asimple way to obtain such instruments, namely, instruments based on previous observationsof each of the jointly endogenous explanatory variables (Arellano and Bond 1991 and Holtz-Eakin, Newey, and Rosen 1988). And, fourth, given that the time dimension of the availablesample for this project is large (at least 35 annual data points), panel-data estimation canaccommodate heterogenous parameters not only across time periods but also across cross-sectional units (e.g., countries) without ignoring the similarities among individual units. Thiscan be accomplished by implementing a random coefficients model through an iterativeBayesian estimator (Maddala 1991 and Hu and Maddala 1995). On the other hand, the largetime dimension of the sample will force to also consider the question of stationarity andcointegration among the variables of interest (Pesaran and Smith 1995), an issue safelyignored when dealing with the usual panels of short time series.
B2. Does Income Distribution Affect Saving? 13
The relationship between income distribution and saving has received comparatively littleattention in the theoretical and empirical literature. While age-related heterogeneity among savers hasbeen stressed in life-cycle models, income inequality is another real-world dimension of heterogeneitythat until recently has remained relatively unexplored. In theory, there are a number of scenarios inwhich income distribution can have an effect on aggregate consumption and saving -- for example,if rich and poor consumers possess different preferences, have differential access to borrowing orto insurance against idiosyncratic risks, or if the elasticity of lifetime consumption to lifetimeresources differs from unity.
Whether inequality matters for saving has obvious policy implications. For example, budget-neutral fiscal policies that redistribute resources from rich to poor consumers can raise or loweraggregate saving depending on the sign of the saving-inequality link. While most empirical studiesusing microeconomic data suggest that saving propensities are higher for richer consumers (e.g.,Menchik and David 1983, Bunting 1991), the link between inequality measures and aggregate savingappears empirically rather weak, at least on the basis of reduced-form empirical saving equations (seeSchmidt-Hebbel and Serven 1995b).
13 Prepared in collaboration with Jonathan Ostry and Carmen Reinhart.

61
An alternative, structural approach recently employed by Ogaki, Ostry and Reinhart (1995)conjectures that the neglect of income inequality may be responsible for the failure of empiricalstudies to identify any significant effects of interest rate changes on saving (e.g., Giovannini 1985).As is well known, the sensitivity of private saving to changes in real interest rates is crucial todetermine the likely effects of a broad range of exogenous and policy-induced shocks that affectinterest rates and/or the price of consumption in the future relative to its current level -- e.g., financialliberalization, fiscal policy changes, changes in the intertemporal profile of tariffs and taxes, and soon. Under the plausible assumption that intertemporal considerations only play a role in consumptionbehavior once a "subsistence" level of consumption has been achieved (in the spirit of Stone-Gearypreferences), Ogaki, Ostry and Reinhart argue that the intertemporal elasticity of substitution, andtherefore the interest sensitivity of saving, would be close to zero for poorer consumers, and higherfor richer ones.
The empirical support for this hypothesis in Ogaki, Ostry, and Reinhart is based onmacroeconomic data for a sample of countries with diverse income levels to estimate a structuralmodel allowing the intertemporal elasticity of substitution to vary with the level of "permanentincome". The model can explain quite well the marked differences in saving and the interest ratesensitivity of saving among low- and middle-income countries, but it is less satisfactory in accountingfor the large observed differences among countries with similar income levels. One likely reason isthat the model does not take into account that income distribution varies markedly across countriesand that, despite similar income levels, the country with the more skewed distribution has a greaterproportion of its population at or near subsistence levels.
The proposed research will explore the role of income distribution in determining the interest-rate sensitivity of saving. It will build on the previous work by Ogaki, Ostry, and Reinhart ( 1995) byaccommodating the cross-country diversity in income distribution through disaggregation of eachcountry's households across income categories, allowing their preferences to differ accordingly. Theaggregate parameters for the country will then be a weighted average of the parameters of the variousgroups. Such a specification will capture behavioral differences for countries with similar incomelevels but dissimilar income distribution. For example, the country with the more skewed distributionwould have a lower aggregate intertemporal elasticity of substitution (IES), since the aggregationattaches a higher weight to the near-zero IES of the population at or near subsistence levels. Theestimated parameters will be used to calculate, in the context of a simple endogenous growth model,the elasticity of saving with respect to changes in the real rate of interest, and to assess if incomedistribution can account in some measure for the differences in saving rates between the rapidly-growing economies of South-East Asia and lower-saving economies, such as those of Latin America,with similar per capita income levels.
Analytical Framework
We begin by describing the maximization problem faced by a representative household in agiven country. As in Ostry and Reinhart (1992), we adopt a two-good framework that distinguishesbetween traded and nontraded goods. As argued in that paper, it is important to estimate theintertemporal elasticity of substitution with a two-good model in order to avoid bias when the relative

62
price of traded and nontraded goods (the real exchange rate) varies considerably through time. Weallow for cross-country variation in both the intratemporal elasticity of substitution between tradedand nontraded goods and the intertemporal elasticity of substitution. The assumption is that the lattervaries systematically with the level of wealth. We begin by describing, in equations (1)-(7) below,the optimization problem at the national level."4
There is an infinitely-lived representative household whose objective is to choose aconsumption stream that maximizes:
I1-1/a
[o/(o-1)]Eo St = o PW [am,} -1/ + nlI-/E] 1-1/E,
(1)
a, , e, o > O, p < 1,
subject to the series of budget constraints:
pt m, + qt n, = pt Mt + qt nt + xt + Bt - (1/RtIl )B,-l, Vt Ž 0, (2)
and the transversality condition:
lim ]t o (l/Ri*)Bt = 0, (3)
where Eo is the expectations operator conditional on information available at time 0; Bt denotes thereal level of debt carried from period t to period t+1 with B,_1 given; (1/Rt*)- 1 = rt* is the real interestrate (in terms of the numeraire) on the debt so R1 is the associated world real discount factor; m (n)denotes consumption of importables (nontradables) and p (q) denoted the relative price of m (n) interms of the numeraire; bars over m, n, and x denote the fixed endowments of imports, nontradedgoods, and exports, respectively; P is the subjective discount factor; and E (() denotes theintratemporal (intertemporal) elasticity of substitution.15 An intratemporal elasticity of substitutiongreater (less) than one implies gross substitutability (complementarity) between traded and nontradedgoods; a value of unity corresponds to the logarithmic utility case. The intertemporal elasticity ofsubstitution reflects the sensitivity of consumption (and therefore saving) to changes in intertemporalprices (i.e. the consumption rates of interest), with higher values indicating greater sensitivity.
The problem of the representative consumer in a given country is to choose an optimalsequence {m1, nt, BJ} that maximizes (1) subject to (2) and (3). The first order necessary conditionsfor an optimum are:
14 For a fuller discussion of the underlying model at the national level, see Ostry and Reinhart (1992).
Is Notice that the estimation allows for differences in o across households.

63
Et { Pt amt+, + nt s(1-)[ Mt1- l e4 -
R Pt+, am,I + n, m
E qt [a tf ttC +a ni_ - =/ ,-
a(ntlm,X/E = Ptlqt (6 )
Equation (4) is the intertemporal Euler equation associated with importables consumption intwo consecutive periods; it states that the marginal utility cost of giving up one unit of m at time tshould be equated to the expected utility gain from consuming one more unit of m at t+1. Equation(5) is the analogous condition relating the marginal rate of substitution between consumption of goodn at t and t+1 to the relevant intertemporal relative price. Finally, equation (6) is the nonstochasticfirst order condition equating the intratemporal marginal rate of substitution between importables andnontradables to the corresponding relative price ratio. It can be verified that equations (4)-(6) arenot independent. Specifically, combining equation (6) with either of the two remaining equationsyields the third. Therefore, given that the nonstochastic first order condition holds, equations (4) and(5) do not provide independent restrictions on the evolution of consumption through time.
Given time series data on importables and nontradables consumption, and on interest rates,and import, export, and nontradables prices, it is possible to estimate the system consisting of (4)-(6)and recover the main parameters of interest. Since (6) must hold identically (in the absence ofmeasurement error), and since (4) and (5) are not independent given that (6) holds, we can eliminate(4) or (5) from the estimation. The restrictions on the joint behavior of consumption of importablesand nontradables, the terms of trade, and the relevant rate of return, implied by the maximization ofthe expected utility function given by (1) subject to the constraints given in (2) and (3), aresummarized in equation (4). In addition, given the assumption of rational expectations, we can useequation (4) to define the disturbance:
I1-1/Ec 1-1/c ___E
Pt amt', +n 1 1 ]nt i-l)[i] E} ] (7)R*+ am,1 -/ + n,IIC Mt
where u, must be uncorrelated with any variable that is in the information set of agents at time t.
With the optimization problem of a representative household in a given country fullydescribed, it remains to be specified how intertemporal parameters governing saving behavior varysystematically across countries. In what follows, we take a particularly simple approach motivated

64
by a Stone-Geary preference specification (as described, for example, by Rebelo (1992)). We adopta specification in which the intertemporal elasticity of substitution is an increasing function of the gapbetween permanent income and the subsistence level of consumption, viz:
cxk = a(](- Y ) (8)YikP
where ok denotes the intertemporal elasticity of substitution in country i for income class k; y1 is ameasure of permanent income in country i for that income group, and y is a constant which reflectssubsistence consumption. Clearly, equation (8) is similar to the Stone-Geary preference specificationbut with permanent income replacing consumption. Conceptually, we focus on income rather thanconsumption in order to make transparent the connection between the intertemporal elasticity ofsubstitution and the level of development (i.e., income per capita). There are five income groups percountry. Equation (8) shows that, with this specification of preferences, saving will be zero untilsubsistence is achieved. In addition, the interest sensitivity of aggregate consumption will be loweras the ratio, y/yi, approaches unity and wealth is only sufficient to support a subsistence level ofconsumption.
Parameter Estimates and Numerical Exercises
The model will be implemented on cross country data using the largest available sample,which in practice will be determined by the existence of suitable income distribution data. Empiricalestimates of e and a will be obtained from Ogaki, Ostry, and Reinhart (1995), Atkeson and Ogaki(1994), and econometric estimates for those countries where consumption data by income level areavailable. The intertemporal elasticity of substitution for each income group ok.in each country canthen be calculated using its average income level. The aggregate EES for each country, oi, will beconstructed as a weighted sum of the elasticities of the different income groups, for a broad spectrumof countries with different per capita incomes. The results will then compared to the Ogaki, Ostry,and Reinhart benchmark to assess to what extent income distribution can play a role in alteringaggregate consumption/saving patterns and the responsiveness of saving to changes in the rate ofreturn.
The estimates will also be used, in the context of a simple general equilibrium model, to assessif income distribution can account in some measure for the differences in saving rates between therapidly growing economies of southeast Asia and Latin American countries with similar per capitaincome levels.

65
B3. Saving, Investment and Growth in the World: Correlation and Causality 16
A number of recent empirical studies have analyzed the relationship between saving andgrowth, saving and investment and capital formation and growth. Particular attention has beendevoted to the dynamic relationships that link these variables (Carroll and Weil 1994, King andLevine 1994, Blomstrom etal. 1993). The more or less explicit aim of most exercises is to establishcausal links in an attempt to discriminate among different models. While the answers to the questionsposed are obviously important, both from the scientific and the policy points of view, no consensushas emerged. The interrelations between saving, investment and growth are far from beingestablished, and are believed to change over time and across countries. Several methodologies havebeen employed and different, at times contradictory, results have been found, sometimes at odds withthe established theoretical model, so that they are often referred to as puzzles. An accurate study ofa consistent data set spanning a large number of countries and a long time period can therefore bevery useful, if nothing else to establish which are the facts that theoretical models need to explain.
The main aim of this paper is to describe with a variety of econometric techniques a large dataset containing data on consumption, income, investment and saving from a large number of countriesand a relatively long time period. While the thrust of the paper is empirical and descriptive, somebasic economic models will loom on the background and inform the analysis at several levels. Thescope of the paper, however, is not to discriminate among different and sometimes conflicting models(even though some insights in this direction can be gained) but rather to use them as a framework toorganize and analyze the data.
The study will focus on measuring the correlations between saving, investment and growth.It will consider simultaneously the relationships between the three variables both in the long and inthe short run. To study the long run relationships, it will use both cross sectional regressions of longrun averages and the estimation of multivariate error correction models. From the estimates of thelatter models, the short run dynamics can also be inferred.
The paper has two components. The main goal of the first part is to review and establish themain correlations among saving, growth and investment and determine how they vary in different timeperiods, at different frequencies, in different groups of countries, with the introduction of severalcontrols and at different levels of disaggregation. The second part of the analysis will focus on timeprecedence and, loosely speaking, on causation; more generally, it will examine the dynamics of therelationships between the relevant variables. Particular care will be devoted to the choice of theappropriate econometric technique.
The analysis is obviously not original. The study of the cross-country correlation betweensaving and growth can be traced to the work of Modigliani (1970), while analysis of the co-movementof investment and saving was pioneered by Feldstein and Horioka (1980). More recent papers thathave looked at these problems are those by Carroll and Weil (1994), King and Levine (1994),
16 Prepared by Orazio Attanasio, Luclo Picci and Antonello Scorcu.

66
Blomstrom, Lipsey and Zejan (1993), Obstfeld (1994), Deaton (1995), Schmidt-Hebbel, Serven andSolimano (1996).
The paper will build on the existing literature to extend it in three directions. First, therigorous analysis of a comprehensive and consistent data set should provide a definitive descriptionof the main correlations present in the data and of their changes in recent years. A systematic accountof what the international data do and do not say, which now is not available in the literature, shouldbe very useful, if nothing else to establish the stylized facts that theoretical models need to explain.The availability of data on a large number of countries should also allow exploring differences acrossgroups of countries characterized by different observable features, such as economic development,population, development of financial markets and so on. In addition, to the extent the data permit,the analysis will be performed at several levels of disaggregation, with saving, for example, dividedamong the household, corporate and government sectors.
Second, the analysis will consider simultaneously the relationships between the three variablesof interest (saving, investment and growth) both in the long and in the short run. This trivariate settingprovides an encompassing framework in which the findings of earlier literature focusing on a subsetof these variables in a bivariate framework can be assessed and reinterpreted.
Third, the study of the dynamic relations between saving, investment and growth will take intoconsideration a number of methodological issues that arise in earlier studies, devoting particular careto the choice of the appropriate econometric techniques (we return to this below). Further, unlikemost of the previous literature, the analysis will not be limited to the study of the cross-sectiondimension of the available data, or its representation in terms of long-term time averages. Theavailability of a relatively long panel allows the use of more powerful and efficient techniques whichexploit both the cross sectional and the time series variability. An empirical analysis of saving andgrowth that wants to go beyond the long run relationships identified by studies of cross sections oflong run averages, should use statistical models that allow for differences between short run and longrun coefficients.
Theoretical Considerations
(i) The relationship between saving and growth: life cycle and other models
Most of the cross section analysis of the relation between growth and saving has focused onlong-run relations. Modigliani's classic discussion of the relationship between (productivity andpopulation) growth and saving implied by the life cycle model is based on steady state considerations.According to a simple version of the life cycle model,an optimizing individual accumulates wealthduring the first part of her life and decumulates in the last in order to keep consumption constantwhen income drops after retirement. If there is either population and/or productivity growth, in thesteady state the saving of the young will exceed the dissaving of the old, therefore implying thepresence of aggregate saving. An increase in productivity growth will then cause aggregate savingto rise in the steady state, as it increases the difference in lifetime resources between old and younggenerations.

67
In more realistic and sophisticated versions of the model, the relationship between aggregatesaving and growth is not that straightforward. In principle, one has to consider how growth isdistributed among individuals of different ages and among factors of production, the shape of theutility function, the relationship between interest rates and discount factors, the possibility thatoptimal consumption is hump-shaped because of changing needs linked to changes in familycomposition, the strength of the precautionary saving motive, general equilibrium effects that willmodify, at least for large closed economies, the equilibrium interest rate, and so on. Even though forsome of these factors it is possible to sign the direction in which they push the relationship, theirweight and their interplay is essentially an empirical matter. For instance, if labor income profiles arequite steep, young consumers will want to borrow, and then repay their debts and accumulate wealthfor retirement during middle age. Strong productivity growth across generations might imply, in thiscase, a negative relationship between saving and growth as the dissaving of the young might morethan compensate the saving of the middle aged.'7 The complexity of the problem implies that, evenin the long run, the relationship between saving rates and growth is ambiguous. Which of the variousfactors will prevail is essentially an empirical issue. While some idea about their relative importancecan be obtained from simulation exercises, the matter can be solved only empirically.
In the short run, the relationship between saving growth is much more complicated. Even inthe simplest version of the model, the short run dynamics can be quite involved. Essentially, toestablish the effect that a change in growth has on saving rates, one has to be precise about the natureof the short run movements. Unexpected shifts to the rate of productivity growth that are perceivedto be permanent can easily have negative effects on aggregate saving as all individuals alive at thetime the shock occurs adjust their consumption plans upwards. Younger individuals, who will enjoythe increased productivity growth for a longer period, increase their consumption more. While theexact pattern of aggregate saving depends on the way the aggregate productivity shock is distributedamong generations and among factors of production, it is likely that in the short run aggregate savingdeclines to recover on the transition path to a new (higher) steady state."8
Simple simulation models that have this property can be easily constructed. Attanasio andWeber (1994), for instance, calibrate a simple overlapping-generations model with severalgenerations, where an unexpected increase in productivity growth causes aggregate saving to declinein the short run, as all generations, but especially younger cohorts, adjust their consumption plans.
These considerations should make clear that simple correlations between saving and growthwill not be able to establish whether the life-cycle model is empirically rejected. The life-cycle model,however, can constitute a useful framework within which one can interpret these correlations. In
7 Here we are ignoring general equilibrium effects on the interest rate, which is likely to change in such a situation.
18 As stressed above, even the long run effect can be negative

68
addition, one can single out the most important modifications that have to be made to the textbookversion of the model to make it fit the data.
The two questions that need to be answered are the following: first, is the life cycle model,in a more or less sophisticated version which might include substantial modifications of the simpletextbook model, an adequate representation of reality ? Second, does the life cycle model explain theobserved correlation between saving and growth or does this require other factors (liquidityconstraints, habit formation, bequests, irrational behavior) ? Of course the answers to the twoquestions are related. The modifications needed for the life cycle model to fit observed consumptionand saving behavior will have implications for the relationship between saving and growth. Whilethe paper will not address these problems explicitly, it can be useful to gain insights especially to thesecond of these questions.
(ii) The relationship between investment and growth: the neoclassical growth model and recentdevelopments
The empirical finding of a positive correlation between saving and growth can be justified bya mechanism quite different from the one suggested by the life cycle model and its refinements,namely through a mechanism in which saving crucially affects growth via investment. This approach,that can be tracked back to "capital fundamentalism", 19 stresses the role of investment in promotingsustained growth. According to some of its proponents, capital accumulation is the main factor thatignites growth.
Even though the strong causal link between (fixed) capital accumulation20 and growth is notalways accepted,21 physical capital remains crucial in most growth models. Even in Solow'sneoclassical growth model, only in the steady state is growth independent of the rate of capitalaccumulation. During transition periods the former is affected by the latter. Moreover, some recentversions of the traditional (exogenous) growth model (Mankiw, Romer, Weil, 1992) stress the factthat physical capital accumulation might approximate also the accumulation of the stock of humancapital, which is more difficult to measure.
The relationship between investment and growth is even stronger in many recent endogenousgrowth models (originated from Romer, 1986). These models and some related empirical evidencesuggest the presence of a strong link between investment and the equilibrium rate of growth not only
'9 See the discussion and the evaluation of capital fundamentalism in the recent paper by King and Levine (I 994).
20 Either through total fixed investment or, more specifically, by means of equipment investment, as suggested by DeLong and Summers (1991).
21 An opposite view would hold that growth precedes investment While this seems a bit extreme (although in theshort run boomning output could boost investment via the accelerator mechanism), some empirical evidence supportingsuch view has been presented by Blomstrom, Lipsey and Zejan (1993).

69
in the short but also in the long run. Capital accumulation complements and proxies for otherimportant sources of growth, such as human capital accumulation and technological innovationembodied in new investment. These elements are likely to have a strong external effect on the growthprocess, even though they are not easily observable, especially with aggregate data.
From a theoretical point of view, a further level of analysis should also consider the effectsthat changes in aggregate saving have on the marginal product of capital and on the equilibriumreturns of available assets. The analysis should obviously distinguish between small open economiesand large closed ones. It is therefore worthwhile to have another look at these correlations and, inparticular, at their dynamic dimension. This further step would link the traditional analysis thatfocuses on the relationship between growth and saving rates, to that of the relationship betweensaving and investment and that between investment and growth. Once again, we stress theimportance of analyzing the three main variable of interest simultaneously.
(iii) Savintg atnid inivestment
An important piece of the empirical evidence available on the relationship between saving,investment and growth, is the positive correlation between saving and investment. Feldstein andHorioka ( 1980) were the first to present this result and interpreted it as an indication of a low degreeof international capital mobility. They, and the related literature, use cross-country regressions of thefollowing type:
(I Y), - a e b (S, Y),
in which country variables are averaged over long time periods in order to eliminate short runvariability. If investment depends only upon the interest rate differential (zero in the case of perfectmobility) and other factors not related to saving, any association between the investment rate and thesaving rate is due to lack of capital mobility. With immobile capital the correlation between savingand growth should be perfect. The coefficient b could then be interpreted as a measure of the degreeof capital mobility. It is likely that the degree of mobility and integration of actual capital marketsis somewhere in the middle between the two extreme of perfect mobility and immobility. Empirically,this coefficient turns out positive and slightly less than one.
An extensive body of literature scrutinizes this result, that has proven to be robust toinstrumental variable estimation (which allows for the simultaneity problems caused by the presenceof common shocks, when S and I are part of a larger model - see Feldstein, 1983, Dooley, Frankel,Mathieson, 1987) or to omitted variables problems (see Amirkhalkhali, Dar, 1993, who estimated arandom coefficient model).
Feldstein and Horioka's interpretation, however, remains controversial. From an empiricalpoint of view, it contrasts with other pieces of evidence (for instance those derived from the analysisof interest rate differentials) that point out to the existence of fairly integrated capital markets. Froma theoretical point of view, several explanations of the observed correlations have been supplied that

70
are not necessarily in conflict with integrated capital markets. (See, for instance, Frankel, 1992 andObsfeld, 1994).
The saving investment-correlation poses some interesting questions for the understanding ofthe growth process, with important policy implications: if growth is promoted by capital accumulationand capital is internationally immobile, saving-enhancing measures are an important part of a growth-oriented policy framework. On the other hand, in the case of a highly integrated international capitalmarket, saving policies would be powerless to promote investment and thereby growth.
Our large data set will allow to analyze several aspects of the correlation between saving andinvestment. One, for instance, is the possibility of differences in the correlations between privatesaving and private investment, and the corresponding variables at the national level. The differencesmight be due to the stabilizing behavior of the public sector, whose policy goal is to avoid currentimbalances. If this is the case, the cross section correlation between saving and investment should bestronger for the private sector variables than for the national ones.
Related to this, one of the explanations that have been suggested for the observed correlationbetween saving and investment is the fact that, in many countries, the bulk of investment is financedthrough retained earnings. If household 'fail to pierce the corporate veil' , one could conceivablyobserve a correlation between saving and investment due to the association between corporate savingand investment alone. Saving data disaggregated between the corporate and household sectors,available in this study's database, will be useful to test this hypothesis. Likewise, the correlationbetween saving and investment is likely to be different among various groups of countries (e.g.,LDCs are likely to have a significantly lower degree of capital market integration than OECDcountries). Therefore, the analysis will be performed for different groups of countries, according forexample to their per capita income levels.
Another relevant issue concerns the appropriate definition of saving and investment. If theonly component of investment crucial for growth is fixed investment, one could run "approximate"Feldstein and Horioka regressions, to evaluate different sectoral correlations (see Bayoumi, 1990).Definitional issues might also arise for savings, since national accounting saving measures do notcorrect for capital gain/losses. Alternative saving measures will be tried in the empirical experiments,in order to check the robustness of the results.
Finally, the appropriateness of the time aggregation procedure used by Feldstein-Horioka andthe related literature has been recently challenged by Sinn (1992). Sinn argues that the intertemporalnational budget constraint implies per se a strong link between I and S over long periods of time.Therefore it seems possible to gain some insights considering the temporal dimension explicitly.
Empirical Considerations
As stressed in the introduction, the paper will start with a description of the main correlationsin the dataset, with particular reference to output growth, savings, investments and consumption.

71
Unlike most of the literature, which has looked only at pairwise correlations, the paper will considerthe three relevant variables and their interactions simultaneously.
The analysis will start with static models and explore both short run relations, estimated usingdata at relatively high frequency, and long run ones, studied by cross sectional regressions ofaverages over long periods. Different sets of conditioning variables will be considered. Particularemphasis will be given to the issue of structural breaks and robustness (relative to controls, level ofdisaggregation and definitions) of the results. Structural breaks are likely to be extremely important,given the widespread view that financial markets have become much more interdependent andconnected after the process of financial liberalization which took place in many countries during the1980s (and that is bound to be important in itself for the relationships between saving, growth andinvestment). Different testing techniques will be used for this purpose, possibly also trying to assessthe presence of structural breaks without imposing their dates.
Next, the paper will turn to dynamic models. It will use VAR systems, which will allow toexplicitly analyze and link the short run and long run dynamics of the relevant variables. Once again,the analysis will allow for the presence of several controls and consider the possibility of structuralbreaks. However, the methodology traditionally used to estimate VARs has to be modified to takeinto account both the time and the cross section dimension of the dataset at hand. The starting pointof the analysis will be the techniques proposed by Holtz-Eakin, Newey and Rosen (1988), Arellanoand Bond (1991) and Arellano and Bover (1995). These methods yield consistent and efficientestimates even when the T dimension of the panel is relatively small. Exploiting only the crosssectional variation in the data (and some identification assumptions) this approach has the advantageof being able to safely ignore the issue of non-stationarity in the time series dimension.
The availability of a relatively long panel, however, allows the use of more powerful andefficient techniques which exploit both the cross sectional and the time series variability. In principle,for instance, one could estimate a single process for each of the countries considered.22 Moregenerally, a long panel allows estimation of models that would be unidentified in a shorter one. Justto give an example, it is well known that the presence of autocorrelation in the residuals inducesbiases that cannot be eliminated when only a short T is available. When T is large enough, however,one can condition on enough lags, so to make autocorrelation a negligible problem. Anotherimportant example, that of coefficient heterogeneity across countries, is discussed below. In general,however, dynamic models to be estimated with panel data should be approached with care. Pesaranand Smith (1995) show that several commonly used pooling techniques yield inconsistent results andpropose some useful techniques.
The consideration of dynamic models will lead to the analysis of the issue of causation. In arecent paper, Carroll and Weil (1994) run Granger causality tests between growth and saving. Thebasic regressions they use to test the hypothesis of Granger causality are the following:
22In this context, however, non stationarity in the time series dimension obviously becomes an issue to consider.

72
st, ia'i + b'st - i,i+ g'gt -] +u, (1)
gt,i ai +b'st -i,1+ gggt - ,+ugti (2)
Carroll and Weil estimate equations (1) and (2) by OLS, and because of the biases causedby the presence of fixed effects in short panels,23 in first differences using twice lagged instruments.They run their tests on five-year non overlapping averages so that the time dimension of their sampleis quite short. They find that growth Granger-causes saving (with a positive sign) but not viceversa.
The proposed analysis will improve on Carroll and Weil's in four dimensions. First, it willconsider Granger causality tests not only between saving and growth, but also between growth andinvestment, as in Blomstrom, Lipsey and Zejan (1993) and investment and saving as in Argimon andRoldan (1994),24 using all three variables simultaneously.
Second, in the short-panel context, it will employ more efficient techniques to test for Grangercausality, in particular the GMM techniques described in Holtz-Eakin, Newey and Rosen (1988,1989) and, more recently, in Arellano and Bover (1995). The latter paper, in particular, stresses theadvantages of considering explicitly all the orthogonality conditions implied by the statisticalassumptions and using them to construct an efficient GMM estimator which allows forheteroscedasticity of unknown form. Given the nature of the problem, believe efficiency is crucialto identify any relationship with relatively small samples.
Third, the analysis will not be confined to the 5-year or 10-year averages popular in theliterature. It will use a long panel and analyze the data at the highest frequency available. The shortrun dynamics can be quite useful in uncovering relationships between the variables under study. Anissue that the large T of our sample allows to tackle is that of the possible presence of parameterheterogeneity across countries, that is, heterogeneity that cannot be dealt with with (semi)differencing the data. Again, Pesaran and Smith (1995) give useful indications about how to dealwith this problem in the context of dynamic panel data. Considering and estimating country specificcoefficients, besides being appropriate from a methodological point of view, can provide usefulinsights about the plausibility of different theoretical models, and therefore prove extremely valuable.
Fourth, the data set used in these tests will contain quality information on a variety ofvariables which allow controlling for other factors likely to be important for the relationship betweensaving and growth and saving and investment -- countries' overall level of development, financial
2 Given the presence of country specific fixed effects, using OLS in levels is equivalent to running the equations asdeviations from the mean. This procedure is well known to cause biases.
24 These authors do not use panel and perform only single country causality tests.

73
openness, and so on. Any conclusion regarding the issue of causation should be explicit about theinformation set upon which it is drawn.
Of course, tests of Granger causality should always be interpreted with caution, especiallywhen they involve variables which are likely to be determined by forward-looking behavior, such assaving and investment. Obviously, one would not want to conclude that Christmas cards causeChristmas! Yet such procedures can be informative if carefully used, and are likely to be particularlyuseful here given that they very directly confront the key issue of interest -- the direction of causationbetween saving, investment and growth.
Several methods have been proposed in the literature to discriminate between the long- andthe short-run components of the data. One technique that could be useful to discriminate between thetwo dynamic dimensions of the data is the "common trends-common cycle" approach of Vahid andEngle (1993). In that paper, the authors combine cointegration techniques with the concept of'common features analysis' The two concepts together allow a rigorous distinction between short andlong run dynamics in a multivariate dataset. It would be interesting to see whether their contributioncould be used in the present context where, instead of a simple VAR, we have a panel-VAR. ThePesaran and Smith paper, by explicitly considering cointegration in dynamic models for panel-data,could also be relevant for this purpose.
In general, the identification of the permanent and cyclical components of the data, and oftheir reciprocal interplay, could provide useful insights for the descriptive purposes of this paper, bysimply adding more information on the nature of the stochastic processes generating the data. Thestudy of the relationship between the different (permanent or transitory) factors that generate the datacould provide useful insights on the relevance of the theoretical models discussed above.
B4. Saving-Investment-Growth Links
The objective of this research component is to provide an analytical framework, derived fromfirst principles, capable of addressing three major stylized facts: the correlation between saving andgrowth (documented, for example, by Carroll and Weil 1994), the saving-investment correlation(Feldstein and Horioka 1980, Feldstein and Bacchetta 1991), and the physical investment-growthcorrelation (sometimes referred to as "capital fundamentalism"). The purpose of the exercise is toassess the co-movement between those three variables under alterative assumptions about thestructure of the economy and the nature of the shocks affecting it.
In order to do this, the research will be guided by a formal model. The model needs to be bothanalytically rich, in the sense of generating well-defined short-run, transition, and steady-staterelationships between variables, and empirically relevant, in the sense of encompassing real-worlddeterminants of saving, investment, and growth. To achieve these two requirements, a two-stageapproach is followed for deriving structural equations for the three fundamental variables(consumption/output ratio, investment/output ratio, and real GDP growth rate):

74
(i) Derivation of a "core" model with well-specified dynamic equilibrium paths and transitionequations that depend on relevant initial conditions and the paths of pre-determined variables.
(ii) Model extensions.
The Core Model
The proposed core model is based on the Lucas-Uzawa two-sector growth model (Uzawa1965, Lucas 1988), encompassing both physical and human capital. The latter can also be interpretedmore broadly as "non-physical" capital, an aggregate of human capital and knowledge. The basicmodel uses a two-sector framework in which production of the single final output uses both kindsof capital, while the accumulation of human (or non-physical) capital is carried out by the educationsector and requires no physical capital. On the consumption side, preferences are time-separable anddisplay a constant elasticity of intertemporal substitution and a constant rate of discount. Finally,population grows at an exogenously given rate. Under the assumption of constant returns to scalein both sectors of production, in a closed-economy setting the model displays endogenous balancedgrowth.
The core model extends this basic framework in three respects: (i) consumption inertia isadded through the introduction of "consumption habits", in order to allow the model to generate apositive association between saving and growth due to consumption inertia; (ii) the model is adaptedto a small open-economy setting; and (iii) convex adjustment costs to physical investment areassumed, to rule out unrealistic transition paths involving instantaneous jumps in the physical capitalstock (matched by jumps in the opposite direction in the foreign asset stock). In turn, jumps in thehuman capital stock are automatically ruled out by the assumption that its production technology usesonly human capital.
The analytics of the basic model, in a closed-economy setting, have been examined by Barroand Sala-i-Martin (1995) and Caballe and Santos (1993). Below we outline the derivation of theextended model's equilibrium. For simplicity, we can assume that households own the firms and makeall production, consumption, and capital accumulation decisions. At every instant, the representativehousehold must decide how to divide the use of its human capital between final goods production andhuman capital accumulation. In addition, it must also decide on the levels of consumption andphysical capital accumulation. We assume that accumulation of physical capital at a rate differentfrom that of human capital incurs convex adjustment costs; this formulation is particularly convenientbecause adjustment costs vanish in the steady-state, when both kinds of capital grow at the same rate.
Letting n denote the exogenous rate of population growth and p the rate of time preference,and expressing all variables in per-capita terms, the representative household's objective is tomaximize the utility functional:

75
1-0e-(p -n) s (z dst 1
subject to
y s A k' (uh)'- (2a)
0 r, B( - u)h -(h + n)h] 2f •Y-I--k !- -(8k +fl h nJ- -C+tr+(r-n)f (2b)
SI -(Sk +n)k (2c)
nS B(-u)h-(8h +n)h (2d)
lim e (,O-)r f 2a 0a -. (2e)
Here z denotes the stock of consumption habits, and the parameter 0s y s 1 measures (the reciprocalof) its importance in the instantaneous utility function. If y equals 1, only current consumptionmatters, while if y equals zero utility depends only on consumption relative to the habit stock. In turn,u is the fraction of human capital used in goods production, 5j is the depreciation rate of type-jcapital, A, B and 4 are positive parameters, f denotes the foreign asset stock, tr are foreign transfers(assumed to equal an exogenously given fraction of output y), and r is the real interest rate on foreignlending and borrowing. Equation (2a) describes the production technology for final goods, while (2b)describes the household's current account balance, with adjustment costs assumed quadratic foranalytical simplicity. (2c) and (2d) describe the accumulation of the two kinds of capital, while (2e)has to be imposed to avoid Ponzi schemes of unbounded foreign borrowing.

76
Consumption habits are assumed to be "external" -- i.e., the habit stock z reflects past per-capita consumption levels of all households in the economy, and the representative household viewsthe evolution of z as exogenous. Its time path is given by
z = 7(c -z) (2f)
where the parameter rl measures the persistence of habits -- the smaller rl, the lesser the influence ofcurrent consumption on the habit stock (see Carroll, Overland and Weil 1994, and Ryder and Heal1973).
The household's control variables are c, u and I. It is convenient to let X, Xq and Xprespectively denote the shadow values of foreign assets, physical and human capital. Then, ignoringfor the moment (2f), and replacing (2a) into (2b), after some manipulation the first-order conditionsof this problem can be shown to include:
= - (r-p)+(1-Y) (I- )- (3a)cOz
(I-a) A[ k ]a = pB + k (q-l) (3b)uh n
q-1?¢ +B(1-u)-(8 + n) (3 c)k FD
- = B (I -u) - (h + n) (3 d)h h
____ ~~~~~~~~(q- 1)2 3ef -(r-n)f =Ak'(uh) 1 '- - k [q- +6 - 6h+ B(I -u)] - k -C + tr (e
2,4

77
q (r + ) q - ) + K ) |h + B((u}j (3u
p [r + O1 - B] p + u k (q-1) (3g)h
Using (3b) to replace u into the other equations, and taking into consideration (2f), themodel's equilibrium dynamics can be summarized by seven differential equations describing the timepaths of c, k, h, f, z and the shadow prices q and p. Forward integration of the arbitrage equation (3f),subject to the transversality condition preventing q from exploding, would show that q equals thepresent value of the marginal product of physical capital, augmented by the contribution of capitalto reducing marginal adjustment costs, and discounted at the rate r+6 k.
Steady state - It may be useful to consider first the closed-economy case, which is the one commonlyexplored in the literature. If the economy is closed, then the left-hand side of (3e) must equal zero atall times, and this in turn determines the equilibrium real interest rate.
At the steady state, the ratio of physical to human capital, and the fraction of the latterallocated to each activity, must both be constant. It can be seen that (3c) and (3d) imply that the ratioof physical to human capital will be changing as long as q is different from unity. Thus, at the steadystate q = 1, which from (3D implies that the marginal product of physical capital, net of depreciation,must equal the real interest rate. To prevent p from exploding, (3g) then requires that B= r+±h, or,in words, that the marginal product of human capital (net of depreciation) in the production of humancapital equal the real interest rate. Since B and °h are given, this in fact determines the steady-statereal interest rate. From (2f) and (3a) we can then obtain the common steady-state growth rate of c,z, k, h and y, which equals
[9y -+-yI-' (B -p- p-
If y = 1, so that habits are irrelevant, this is the standard result derived, for example, by Barroand Sala-i-Martin (1995). Otherwise, if y < 1, consumption habits affect the long-run growth rate(note, however, that the latter is independent of the degree of habit persistence as measured by il).Finally, (2f) and (3e) can be used to determine the steady-state consumption/habit stock andconsumption/output ratios,
Consider now the small open economy case, in which the domestic good is a perfect substitutefor foreign goods, the economy can borrow and lend at the world real interest rate r*, and the foreignasset stock f is endogenously determined. Under perfect capital mobility and perfect assetsubstitutability, r* is given by world asset markets. It follows from the above discussion that abalanced-growth steady-state can exist only if r* = B-6 h, the closed-economy equilibrium interest

78
rate. [This is analogous to the requirement that r* equals the rate of time preference p for a steadystate to exist in open-economy exogenous-growth models].
Thus, balanced growth rules out permanent deviations of the real interest rate from B-5 h, buttemporaly deviations can be allowed for by suitable extension of the model. The simplest way to doso is to rule out either perfect capital mobility or perfect asset substitutability (an alternative wouldbe to allow for a time-varying technology, involving a changing B). The consequences of removingthe first assumption have been explored by Barro, Mankiw and Sala-i-Martin (1992) in the contextof an exogenous-growth model with borrowing constraints. With a binding foreign borrowingconstraint (in the form of a floor for the foreign asset/output ratio, for example), the model eventuallyreverts to the closed-economy case, albeit with a non-zero foreign asset stock. An obvious alternativeis to impose imperfect asset substitutability by assuming that the relevant interest rate for thecountry's aggregate borrowing and lending abroad is a negative function of the foreign asset/GDPratio:
r = r* - V k (4)
where (p'>O and r* now denotes a "base" international interest rate. The model consisting of (3)-(4)is, in principle, capable of generating balanced long-run growth: if the f/y ratio is changing, as itwould under unbalanced growth, the real interest rate would also be changing over time, therebyaltering the growth rates of the endogenous variables. A steady state would again be characterizedby r = B-bh; from (4), this would yield the equilibrium foreign asset/output ratio, and the steady statec/y ratio could be then derived from (3e).
Model Extensions
Although the core model extends in several respects the existing literature, it still remainshighly stylized. To enhance its realism, some further extensions can be introduced.
Heterogeneity - A key extension is to remove the assumption of identical intertemporally-optimizingagents, to allow for some heterogeneity in consumption and investment behavior. This can be donealong the lines of Schmidt-Hebbel and Serven (1994, 1995). In the case of consumption, assume thatonly a fraction O<u<l of households base their consumption decisions on intertemporal optimization;the remaining households are either myopic or impatient and liquidity-constrained, and devote theirentire income to consumption:
c = y cU + ( -)[y + tr] (5)
where c. is consumption by unconstrained, intertemporally-optimizing households, and its rate ofgrowth is given by (3a) above. This extended formulation allows the model to replicate the "excess

79
sensitivity" of consumption to income encountered in empirical studies (see e.g. Campbell andMankiw 1991).
A similar specification can be used to introduce liquidity constraints or myopia in investmentdecisions. Empirically, investment has been found to be significantly affected by firms' current cashflows, a likely indication of liquidity constraints (see e.g. Fazzari, Hubbard and Petersen, 1988). Totake account of this fact, we can again assume that only a fraction O<p<I1 of investment is geared tointertemporal optimization, with the remainder being determined by current profits, in turn given bythe marginal product of physical capital times the capital stock:
I = g IU + ( - p) ( - a) y (6)
where Iu is the intertemporally-optimizing investment rule derived earlier. Equations (5) and (6) donot alter the model's capability to generate endogenous steady-state growth, but will generally affectthe economy's steady-state configuration as well as its dynamics outside the steady state.
Adjustment costs of human capital accumulation - In reality, the accumulation of human capital isarguably much slower than that of physical capital. In order to replicate this fact, the aboveformulation involving adjustment costs of changing the physical/human capital ratio could be replacedwith the assumption of convex adjustment costs to changes in k and h, separately. However, unlesssuch costs are specified so that they vanish in the steady state, the model's long-run solution will begreatly complicated. A perhaps preferable option to achieve the same objective would be to retainthe above formulation and add convex costs of labor reallocation -- i.e., costs of changing u.
Relative prices - The formulation above assumes implicitly that the final good produced by thedomestic economy is a perfect substitute for foreign goods, and the relative price of investment goodsin terms of consumption goods is unity. It would be straightforward to modify this specification toallow for imperfect substitutability between domestic goods and imports (retaining, however, thesmall country assumption that their relative price is exogenously determined), and for different importcontents of consumption and investment (a highly realistic feature for LDCs). Adequate considerationof the relative prices of the latter has been shown by Taylor (1994) to be an important element inhelping explain the Feldstein-Horioka puzzle.
Implementing the Model
To implement the model it is useful to keep in mind the relationship of its aggregates withthose in the National Accounts. The latter record only a limited portion of human capitalaccumulation (excluding, for example, the value of the time foregone by students), so that measuredGDP is probably broader than the model's y but falls short of the theoretically correct aggregate thatwould include also human capital investment. Moreover, recorded expenditures on human capitalformation are typically classified as consumption rather than investment, so that the consumptionaggregate of the National Accounts includes not only the theoretically correct c in the model, but also

80
some fraction of human capital investment. Thus the National Accounts understate output, saving andinvestment, and overstate consumption expenditures.
The model brings out different channels of transmission between consumption (or saving),investment and growth. The latter is determined by "broad" investment, i.e., the accumulation of bothphysical and human capital. Since correctly-measured saving includes human capital accumulation,growth is in fact driven by "broad" saving, but the co-movement of the latter with "broad"investment depends on the extemal financing regime and on the type of shocks affecting the economy-- and the same applies to conventionally-measured saving and investment. In turn, with consumptionhabits, consumption of goods depends on its past history and on current and future anticipatedincome. Depending on the force of consumption habits, anticipated output growth may raise orreduce conventionally-measured saving. Finally, anticipated output growth -- brought about, forexample, by exogenous productivity improvements -- raises the profitability of investment andencourages capital accumulation -- human, physical, or both.
Model Simulation
An analytical solution to equations (3)-(6) is in general not available. Instead, the model willbe simulated to explore its properties, focusing on the co-movement of saving, investment and growthalong the adjustment path to the steady-state and, in particular, on their response to disturbances. Thesimulations will investigate the consequences of alternative assumptions regarding the externalfinancing regime, the degree of consumption inertia, and the proportion of myopic agents in theeconomy, along the lines of Schrnidt-Hebbel and Serven (1994, 1995). This framework allowsexploring, for example, the degree of consumption inertia necessary to replicate a persistent co-movement between saving ratios and growth rates of the magnitude observed in East Asian countriesover the last two decades.
Parameterization - The model will be parameterized for a "representative" developing economy.Estimates of the parameters of the goods production function are widely available in the literature.In turn, estimates of the parameters of the utility function with consumption habits are more scarce,and different values will be explored. Estimates of B, the technology parameter in the production ofhuman capital, are not directly available. However, a rough estimate can be obtained from the steady-state condition r = B - ah, using a plausible value for °h. Likewise, estimates of the adjustment costparameter Q are also available, although they are based on the standard specification of adjustmentcosts involving only physical investment and would need to be transformed to fit our framework.
Capital stock estimates are available for a number of developing economies. In turn, the stockof human capital will be obtained from the data base recently developed by Nehru et. al. (1995), orapproximated by measures of educational attainment. From these estimates we will derive initialvalues for the k and h ratios.
Simulation method - The simulations will explore the impact of disturbances, distinguishing betweentheir instantaneous, transition, and steady-state effects on the endogenous variables. In simulating

81
the model it is important to keep in mind that f, k, h and z are state variables, while c, p and q are not.The latter can jump at a point in time in response to new information about the current and/or futurepaths of the exogenous variables. Given initial conditions for f, k and h, solving the model essentiallyamounts to finding initial values for the jumpers so that the model will converge to its steady-stateequilibrium.
Since the simulations will be concerned with dynamic trajectories originating possibly veryfar from the steady-state, a linearized solution procedure can be inaccurate and provide misleadingresults. To prevent this, the full non-linear model will be solved. This will also allow the identificationof any significant non-linearities arising in the model's response to disturbances (see below). To solvethe model we will use the method outlined in Schmidt-Hebbel and Serven (1994), which combinesmultiple shooting (see Lipton et. al., 1982) with Fair and Taylor's (1983) extended-path approach.
Simulation scenarios - Three main types of simulation exercises will be undertaken. Under alternativeassumptions about the external borrowing regime and the extent of liquidity constraints inconsumption and investment, the simulations will respectively explore:
(i) the economy's adjustment path starting from alternative initial values of the physical/human capitalratio. In the closed-economy model without adjustment costs and habits, the patterns of consumption,investment and growth along the transition path depend only on whether this ratio is above or belowits steady-state level. The simulations will examine if this continues to be the case once consumptionhabits, adjustment costs and external borrowing are brought in, and will focus also on their effectson the speed of adjustment and on the saving-investment-growth co-movement along the transitionpath.
(ii) the response to changes in foreign transfers (as a fraction of GDP). As noted earlier, in the aboveformulation these are equivalent to terms-of-trade changes. Their impact on consumption, saving andgrowth will be examined, distinguishing between permanent and transitory, anticipated andunanticipated disturbances.
(iii) the response to productivity changes in the production of goods (as measured by the parameterA above).
B5. What Determines Saving at the Household Level?25
This research component will investigate the determinants of household saving using time-series of cross-section household surveys from a set of diverse countries. It will focus on two issues:the role of life-cycle patterns in household saving rates, and the role of habits, the acquisition ofdurable goods and other non-life-cycle determinants of saving behavior.
25 Prepared by Angus Deaton and Christina Paxson.

82
As already discussed, there is a large body of cross-country evidence that economic growthrates and aggregate saving rates are positively correlated, see for example Modigliani (1970),Maddison (1992), Bosworth (1993), and Carroll and Weil (1993). However, as we noted above, thedirection of causality -- from growth to saving, or from saving to growth--is not well-understood.There are several economic theories that predict a correlation between saving and growth, but withvery different implications for causality. First, growth models imply that an increase in a country'saggregate saving rate will increase the rate of economic growth, either in the short-run as the countrymoves to a new steady state, as in neoclassical growth models, or in the long-run, as in manyendogenous growth models such as Romer (1986) and Lucas (1988). Second, Modigliani's classiclife-cycle model predicts a correlation between savings and growth, but with the direction of causalityreversed. As economic growth increases, the life-time resources of the young increase relative to theold, and since (according to the theory) the young save more than the old, aggregate savings ratesincrease. Third, models of habit formation imply that individuals who experience unexpected growthin incomes will save more in current and future periods. The basic idea of these models is that themarginal value of consumption depends on a stock of habits (perhaps embodied in a stock of durablegoods) accumulated in the past. Habit stocks cause consumption to respond more slowly to earningsinnovations than is implied by standard permanent income models, see Carroll and Weil (1993) andDeaton (1995). The result of earnings growth is therefore higher saving, at least in the short run, untilstocks of habits adjust to higher levels.
Note that although the second and third of these mechanisms have similar implications for theeffect of growth on saving, they operate quite differently. The life-cycle effect of growth on savingis an aggregation phenomenon that comes from changing the "weights" of different age groups withinthe population. By contrast, the habit effect, whereby consumption drags behind income changes,operates for individual households over time.
These three explanations of the link between saving and growth have quite different policyimplications. The first implies that policies designed to increase aggregate saving rates, such asmandatory retirement saving plans or the introduction of tax-free savings vehicles, will result in highergrowth at least in the short run, and higher standards of living. The second and third explanations donot have this implication, since higher saving is the result rather than the cause of growth. Of course,these three explanations for the link between saving and growth are not mutually exclusive (or evenexhaustive), and few would argue that a link from saving to growth does not exist. However, tobetter assess the usefulness of policies that promote saving, it is desirable to know how much of thecorrelation between saving to growth can be accounted for by life-cycle theory and models of habitformation.
We propose to investigate the effects of growth on saving using time-series of cross-sectionsof household surveys from a set of diverse countries. The plan is to write two papers, one thatexamines life-cycle patterns in saving rates, and a second that examines non-life-cycle determinantsof saving, including the role of habits and the acquisition of durable goods in saving behavior. Bothof these papers will use a common data base, which will consist of time-series of cross-sectionalhousehold income and expenditure surveys from a range of countries. These data can be used to trackthe earnings, income, consumption and saving experiences of birth cohorts over time. For example,

83
if a country has conducted income and expenditure surveys annually since 1980, these can be usedto construct averages (and medians) of income, consumption, and saving in each survey year for eachgroup of people born in the same year. It is then possible to examine the evolution of income,consumption and saving for each birth cohort. Birth cohorts can be defined over individuals, or overhouseholds, using the age of the head of the household to determine cohort membership.
There are several advantages to working with cohort data. First, they are much richer thanstandard aggregate time series, since they follow a large number of aggregates, and they can be usedto better understand the underlying sources of time-series fluctuations in national aggregates. Second,cohort data are well-suited to the analysis of the life-cycle and habit formation models discussedabove. Since the cohort data are more dissaggregated than national time series, they can be used toanalyze what are essentially micro theories of household behavior. At the same time, the use of cohortmeans (or medians) reduces the amount of measurement error and noise that characterize micro andpanel data. Third, cohort techniques can be used to track other features of the data, such as mediansor other percentiles, as well as higher moments. In general, the cohort data can be tailored to theanalysis. For example, it is as easy to compute the averages or medians of logs as of levels, and wecan control the selection criteria for inclusion, so that the aggregates correspond as closely as possibleto the theoretical magnitudes.
A good deal of this data assembly has already been done, at least for some countries. Fundedby the National Institute of Aging to look at saving and inequality among the elderly, Deaton andPaxson have assembled (or are assembling) time-series of cross-sections of data from Taiwan ( 17surveys), Britain (21 surveys), the US (12 surveys), Thailand (6 surveys), Indonesia (4 surveys),Malaysia (4 surveys), and Singapore (2 surveys). We would like to expand the list of countries toinclude Korea, Colombia and the Philippines, and are in the process of gathering information on thecharacteristics and accessibility of data from these countries.
The analysis of the cohort data will be broken into two separate papers. The first paper willexamine life-cycle patterns in income, consumption, and saving, and will focus on the effect of growthon saving via the life-cycle mechanism. It will contain the following components:
* The first step will be to identify age and cohort effects in income, consumption, and savingprofiles. This is essentially done by regressing the variables of interest on sets of age andcohort dummy variables, with the possible inclusion of controls for household size andcomposition that may affect both preferences for consumption as well as the earningspotential of households.
* The estimates of the age profiles of consumption and income will be compared within andacross countries. As is pointed out by CarroUl and Summers (1991), life-cycle theory indicatesthat the age profile of consumption is determined solely by tastes and interest rates. If thesefactors do not vary greatly across countries, and provided that differences across countriesin household size and composition have been controlled for, then the estimated age profilesin consumption should be similar. Preliminary work on the US, Britain, Taiwan, and Thailandin Paxson (1995) suggests that age profiles differ substantially across countries. An alternative

84
to standard life-cycle theory, that consumption tracks income over time within cohorts, canbe assessed by examining the coherence of the age profiles of income and consumption. Afinding of "tracking" supports the idea that people buffer their consumption from incomefluctuations over the short-run but not the long-term, as is predicted by buffering models (seeDeaton, 1992, for a review.)
The decomposition analysis described above will be done for medians, means, and otherpercentiles of the variables of interest. For magnitudes that are positively skewed, like incomeand saving, means may be heavily influenced by a few large observations. Medians providea useful alternative. In addition, if wealthy people are life-cycle smoothers, and poorer peopleare not, consumption and income profiles should show greater synchronization for lower thanhigher quantiles. The data can also be used to assess the relationship between bequests andwealth. Bequests imply that life-time consumption is less than life-time income, and ifbequests are a luxury good than the share of life-time resources that are unspent will increasewith wealth. This can be addressed by comparing the saving behavior of wealthy and less-wealthy members of the same cohort, as well as comparing saving behavior across wealthyand less-wealthy cohorts.
- TThe last part of the analysis will use the estimates of age profiles of income, consumption, andsaving to quantify the effect of growth on aggregate saving rates. These calculations will beprovided for a variety of specific assumptions about the effects of growth on age-incomeprofiles. For example, given age-specific saving rates, the effects on the aggregate saving rateof growth that shifts up age-income profiles without changing their shapes can be computed.Of course, it is also possible that growth will steepen age-income profiles, with differentimplications for aggregate saving. For countries with time-series of data long enough to spana "high growth" and "low-growth" period, the actual effect of growth on age-income profilescan be assessed, and this will give us a handle on which of the estimated effects of growth onsaving is most reliable. A major aim of this section will be to see how much of the observedcross-country correlation between saving and growth can be accounted for by the effects ofgrowth on saving predicted by life-cycle theory.
The second paper will examine non-life-cycle determinants of saving within cohorts, and willfocus on the role of habits and the acquisition of durable goods in saving behavior. There are threemajor components to the analysis. The third of these is large enough so that it may be split off intoa separate paper.
* The first section will use the cohort data to estimate the effect that the past earnings growthof a cohort has on its current savings rate. The basic method will be to regress savings rateson lags of earnings growth rates, including controls for age and cohort effects as well as otherfactors (such as family size and composition) that may affect saving rates. This has been donefor Taiwan (Deaton and Paxson, 1994) and the US, the UK, and Thailand (Paxson, 1995),with the finding that although cohorts that have experienced faster earnings growth havehigher subsequent saving rates, the effect of growth on saving is small relative to the

85
correlation between growth and saving observed in cross-country data. This analysis will berepeated for the other countries for which we have data.
Models of habit formation imply that expected versus unexpected earnings growth will havedifferent effects on savings. Earnings growth over the life-cycle that is predicted byconsumers need not produce higher savings, unless consumers are myopic. Unexpectedearnings growth will, however, result in higher current and subsequent saving, since habitsslow the adjustment of consumption to earnings innovations. Testing these ideas formallyrequires that one distinguish between expected and unexpected income growth, somethingthat is quite difficult to do. However, useful information on this issue may be gleaned bycomparing the response of saving to growth across countries with different growth histories,and across time periods within countries. For example, the theory predicts that, all else equal,the effects of growth on saving will be larger in countries whose higher growth rates are morerecent phenomena. Comparisons of countries such as Thailand and Indonesia with countrieslike Taiwan and Korea, whose high growth rates have persisted over longer periods of time,will provide information on whether higher savings rates are likely to be a short-run or long-run response to increases in growth rates.
* The third section will examine other non-life-cycle reasons why saving may respond toeconomic growth. One possible reason concerns liquidity constraints. Consumers who cannotborrow against future income to acquire durables (including housing) may "save up" for thesepurchases. This process can produce a link between growth and saving that is similar to thestandard life-cycle mechanism: growth increases the demand for durable goods and housingamong younger consumers (with higher life-time wealth), and therefore leads to more"saving-up" behavior. A policy-relevant implication is that credit market imperfections thatprevent individuals from borrowing against future income may actually increase saving,especially in high growth economies. Support for the hypothesis comes from Jappelli andPagano (1994), who show that countries with higher minimum down-payment requirementsfor house purchases have, other things equal, higher saving rates.
* The relationships between liquidity constraints, durable goods, and growth will beinvestigated in the following ways. First, differential restrictions on the availability of homemortgages will distort the age profile of consumption in predictable ways that are differentacross countries. With cohort data from several countries with different restrictions, and withsome idea of the ratio of house prices to income, these propositions can be readily tested.Second, many household income and expenditure surveys have information on the ownershipof specific durable goods, such as vehicles, major appliances, and homes. These can be usedto determine age and cohort effects in ownership, and the relationship between ownership andsaving behavior. Similar work has been done by Besley and Levenson (1994) in the contextof Taiwan, and can be done in other countries, such as Thailand, where suitable data areavailable. It will be of particular interest to compare patterns of saving and housing purchasesacross countries with different compulsory saving plans in place. In Singapore, for example,funds from compulsory saving accounts can be used to finance the housing purchases,

86
whereas in Malaysia the funds are not available for this purpose, and these differentinstitutional features have different implications for age profiles of household saving.
Data
The raw data used for these analyses will consist of time-series of cross-sections of householdincome and expenditure data. Our goal is to obtain data from as diverse a group of developingcountries as is possible. Suitable data sets exist for Taiwan, Thailand, Malaysia, Singapore, Korea,and possibly for Colombia and the Philippines. Unfortunately, we have been unable to identify suitabledata from any African country. Data from the United States and Britain will also be used, so that wecan examine differences and similarities across more and less developed countries. The following fourdata sets are currently available at Princeton, and have been used by Deaton and Paxson to dopreliminary work on several of the topics discussed above:
(1) Taiwan
The Personal Income Distribution Surveys of Taiwan have been conducted annually since1976. We have all surveys up to and including 1992; the 1993 survey should be available shortly.These are large surveys, covering between 11,000 and 15,000 households per year. They containinformation on earnings from employment and self-employment both at the household level and atthe level of the individual, information on property income and transfers, and detailed information onconsumption expenditures in the year before the survey. There is also information on ownership ofdurable goods, housing characteristics, and very limited information on wealth changes during thesurvey year. In addition, the surveys contain basic socio-demographic information, such as thenumbers, ages, sexes, and education levels of household members.
(2) 7hailand
The Socio-Economic Surveys of Thailand have been conducted in 1975/6, 1981, 1986, 1988,1990 and 1992, and each of these data sets is available at Princeton. Like the Taiwanese surveys,these are large cross-sectional income and expenditure surveys, with between 11,000 and 13,500households surveyed per year. The Thai surveys are quite detailed. Because a large fraction ofhousehold income is from farming, the survey asked details about farm revenues and costs, and thisinformation is used to measure farm profits. Information is on earnings, rents received (both in cashand in-kind), and income from financial assets was also collected. Consumption includes both home-produced and purchased items. The reference period for income is a year. The reference period forconsumption items differs across items. Food consumption had a reference period of a week, othersmall expenditure items (such as clothing, personal supplies, and entertainment) had a referenceperiod of a month, and major expenditure items (such as bicycles and major appliances) had an annualreference period. Information on standard socio-economic variables, household ownership of durablegoods and housing, and changes in real and financial assets in the month before the survey areincluded.

87
(3) United States
The US data are from the Consumer Expenditure Surveys (CEX) from 1980 to 1992. TheCEX is a "rolling panel" that interviews approximately 7000 households per year. Each householdis interviewed 5 times, once each quarter, with different households beginning their series ofinterviews in different quarters. The results of the 2nd through 5th interviews are made available. Notall household complete the full series of surveys, however, and the number of quarterly observationsranges from 15,613 to 20,716 per year. The information on each household in each quarter consistsof detailed expenditure measures in the 4 months preceding the interview. Information on income wascollected only at the 2nd and 5th survey (unless a job change was experienced between the 2nd and4th survey), and refers to income in the previous year. The income figures for households in their 3rdand 4th interview refer to the 2nd-interview income figure. The US data are perhaps of lower qualitythan the Taiwanese and Thai data, and several researchers have questioned its accuracy andcomparability to National Accounts figures (see Bosworth et. al., 1991, and Attanasio, 1994.) Topcoding is a problem, particularly for income. The upper limit on specific income categories (e.g. self-employment income, salary income, etc.) was $100,000 by 1992, but was more severe in the early1980's. Top coding may affect the accuracy of cohort averages, but should not affect the calculationsof medians and all but the highest quantiles of income.
(4) Britain
Britain conducts an annual Family Expenditure Survey (FES), and data from 1969 to 1992are available at Princeton. The survey was begun in 1954, and it may be possible to extend our seriesback to this date. The sample is representative of Great Britain, which is the United Kingdomexcluding Northern Ireland. Approximately 7000 households are surveyed per year. Like the CEX,the FES is done on a quarterly basis, but households are not interviewed more than once, so that thereare fewer observations over which to compute cohort means and medians. The FES's questionsregarding income and expenditure are somewhat different than those from other surveys. Theearnings measure (which is used when constructing income) is based on a question about "normalweekly earnings." Consumption also has a weekly reference period.
In addition to these four surveys, we are in the process of assembling data from Indonesia,Malaysia and Singapore. Of these countries, the Indonesian data are most complete. We havepermission to use the SUSENAS surveys, provided we can obtain the data from researchers withinthe US who have already obtained it. We have already assembled files for income, expenditure, andbasic household demographic information from 1980, 1984 and 1990 (provided to us by Mark Pittof Brown University.) Income and expenditure surveys were also conducted in 1987 and 1992, andthese data sets can be purchased from Biro Pusat Statistik.
We currently have data from Malaysian Household Income Surveys conducted in 1973, 1984,1987 and 1989. Unfortunately, only the 1973 survey collected information on the expenditure itemsnecessary for our work, and the consumption items are not included in the data which we have accessto. The 1973 consumption information was used by Pravin Visaria at the World Bank, and we aretrying to locate this data set (which we have permission to use). The Malaysians conducted an

88
expenditure survey in 1993/4, which has just recently been processed. Although our discussions withpeople in the Economic Planning Unit indicate that these data will not be released from the countryfor some time, they have agreed to construct cohort data for us. Data from Singapore will beavailable with similar restrictions: information from the two household income and expendituresurveys are not publicly available, but researchers within the Statistical Office will process cohort datasets. We are also in the process of identifying other countries with suitable data. Korea has conductedFamily Income and Expenditure Surveys since 1983, and it may be possible to either obtain thesurveys or have researchers within Korea process them for us. Colombia and the Philippines are twoother possible countries, but we currently have very little information on whether these data sets aresuitable or accessible.
Methods
Similar methods will be used to construct and analyze cohort data for each of the availabledata sources. For each country, two data sets will be constructed. The first will consist of cohortmeans, medians, and other summary statistics of variables of interest, where "cohort membership"is defined according to the year of birth of the head of household. The second will be similar to thefirst, except cohort membership will be defined according to the birth year of each individual. Thesetwo types of data sets are complementary. The first can be used to track the evolution of totalhousehold income, consumption, and saving over time; the second can be used to examine the effectsof growth on age-earnings profiles of individuals. A basic problem with the use of cohort data toanalyze household behavior is selection into and out of household headship. The implicit assumptionmade when tracking cohorts defined according to the age of the household head is that the underlyingpopulation of household heads is constant over time. This will not be true if there is selection into andout of headship, caused by household formation and dissolution, marriage, divorce, and death. Thisis a special problem in economies such as Taiwan and Thailand, where elderly adults often co-residewith adult children. Selection into and out of headship may result in biased estimates of age profilesof income, consumption, and saving if, for example, poorer elderly individuals are more likely tomove in with children (thereby ceasing to be household heads.) The cohort data sets based onindividuals can be used to some extent to cross-check our results on households, although selectionproblems must be continually kept in mind when interpreting the results.
The first paper, on the life-cycle effects of growth on aggregate saving rates, will make useof extremely simple and flexible nonparametric methods. The starting point of this work is a simpleversion of the life-cycle model with no uncertainty. Consumption for a consumer i aged a and bornin year b is a function of life-time wealth Wjb and preferences f,.(a)is specified as:
Ciab = f,(a) Wib - (I)
The function f (a)determines how fixed life-time resources W,, are allocated to consumption overthe life-cycle, and in the "textbook" life-cycle model would be a constant. There is no reason,however, to believe that tastes for consumption do not vary with age, especially when (1) is appliedto household rather than individual consumption . The advantage of specifying consumption as theproduct of life-time wealth and a "preference" function f; (a) is that the logarithm of consumption

89
can be expressed as the sum of an age-specific component and a fixed life-time wealth component.This linear expression can be averaged over all individuals aged a and born in year b, to obtain:
ln(c,b) =f(a) + In( W,), (2)
which can be estimated by regressing the average logarithm of consumption for each cohort-age cellon a set of age and birth-year dummy variables. Life-cycle theory implies that the estimated ageeffects measure life-cycle preferences for consumption, and the cohort effects reflect the effects ofeconomic growth of the life-time wealth of each cohort. Equation (3) can be further modified toinclude cohort-age averages of other variables, such as the numbers of children and adults in thehousehold, that may affect consumption regardless of age. Additionally, year effects can be includedto account for common macro shocks to consumption, although the colinearity of age, year of birth,and time necessitates that restrictions be imposed on year effects, see Deaton and Paxson (1994) fordetails. Equations similar to (2) can be estimated for the average logarithm of income and averagesaving rates, as well as for medians and other percentiles of these variables. As discussed in Section1, the estimates of age effects in these variables will be compared across countries and withincountries, and will also be used to quantify the effects of growth on saving.
To illustrate how these calculations can be done, consider the exercise of computing the effectof growth on the aggregate saving rate, when growth has the effect of shifting up age-income profileswithout changing their age profiles. The income of a cohort aged a in year t can then be expressedas:
Yat = e ( Ig), (3)
where the function h(a) measures age effects in the logarithm of income, and the term (1+g)"ameasures the effect of growth on income on cohorts born in year t-a. The fraction of aggregateincome earned by those aged a can be expressed as:
where 1la is the fraction of households aged a. Notice that the assumption that growth does not
- e h(a) ( 1 +g)-a
Yat A h g)a) (4)E eh(a) +g) a,qL ( aC=l
change the shape of age-income profiles implies that the share of income earned by each age groupis independent of time. Likewise, the aggregate saving rate (s/y) is independent of time, and can beexpressed as:

90
where s(a) is the age-specific saving rate. Equation (5) can be used to derive the partial effect ofchanges in the growth rate g on the aggregate saving rate.
A1: s(a)e h(a) +g) a TI,
(s/y) a=A (5)
a=l
A
/) (sly - s(a))e(a)( l +g) rl,aE (sly) i a=1 I6
ag +g) A~S h( a )( I +g ) -a 1
a=l
Information on the age profiles of income and savings rates can be used to fill in for s(a) and h(a) in(5) and (6) for various growth rates. Similar calculations can be done for growth that affects both thelevels and shapes of age-income profiles, although for these calculations the age effects inconsumption rather than saving rates must be used in the formulae (since age-specific saving rateswill change with growth.)
The second paper, that examine non-life-cycle effects of growth on saving, will make use ofsimilar methods. The first part of the analysis, which examine the effects of previous growth oncurrent saving, will consist of regressions of the following form:
K
(S/)At = PO+ E f3 AIn(edr j) + eat' (7)
where (s/y) is the saving rate of cohorts aged a in year t. The term Aln(ea,,t) is the change in earningsbetween t-j and t-j-1. Controls for age and cohort effects, as well as variables that measure householdsize and composition, will be also be included. Equation (7) will be estimated for each countryseparately, and for different time periods within countries. The second part of the analysis, whichexamines saving, growth, and the acquisition of durable goods and housing, will make use of cohort-level data on ownership of durables and housing, and will use nonparametric methods to identify ageand cohort effects in these variables. These will then be related to age and cohort patterns in savingrates of each country, to examine whether the "saving up"models is plausible, and will also becompared across countries with different credit market characteristics.

91
C. POLICY ISSUES OF WORLDWIDE IMPORTANCE
This component of the research will focus on the consequences of specific governmentpolicies and reforms on private and national saving levels This will provide a much-needed set ofempirical results to assess the relative importance of policies that intendedly or unintendedly affectsaving levels. The focus below is on both stabilization and structural reform measures, includingfiscal policies, trade and financial liberalization, tax and financial saving incentive schemes, andpension system reform. In addition, the response of private saving to foreign capital flows and terms-of-trade shocks will be identified.
Cl. How Effective is Fiscal Policy in Raising National Saving?
While fiscal deficits have been rising since the late 1980s in OECD countries and transitioneconomies, the opposite trend -- towards greater fiscal orthodoxy -- is observed in developingcountries (UMF 1995). Fiscal adjustment is the cornerstone of macroeconomic stabilization -- butthe impact of lower public deficits on national saving and the current account remains boththeoretically and empirically controversial. However, responding to this question is essential forassessing the effectiveness of fiscal policy in raising aggregate saving, contributing to theeconomy's external equilibrium, and reducing its vulnerability to external shocks such as abruptchanges in terns of trade and capital inflows. Likewise, the effectiveness of alternative fiscalinstruments (taxes, government consumption, transfers) is still poorly understood.
An inference from the review of consumption theories in Part I is that the most popularconsumption models offer strikingly different predictions on the effects of fiscal policy on nationalsaving. While only current levels of taxation matter for consumption under the simple Keynesianhypothesis, both current and future taxes -- over an infinite horizon -- matter for consumptionunder the permanent-income hypothesis. This, in turn, is rejected by the Ricardian equivalenceproposition, that states that only permanent (non-capital26 ) government expenditure matters forprivate consumption decisions, implying that alternative ways of financing a given level ofgovernment spending -- taxation, inflation, or debt -- affect neither private consumption nornational saving. According to the no-bequest life-cycle hypothesis, fiscal policy affects nationalsaving as long as it shifts income across different generations -- which it typically does. Ifconsumers face binding borrowing constraints, they will react to higher current taxes by cuttingconsumption, as if they were Keynesian or myopic. Finally, private consumers will reactdifferently when they perceive public consumption or transfers payments as substitutes orcomplements to their own consumption spending (Bailey 1971). In sum, theoretical predictions
26 Whether only current public expenditure, or also public investment, is relevant in this regard depends on theperceived productivity of the latter. If public and private investment are indistinguishable, the assertion in the text iscorrect. At the other extreme, if public investment is viewed as essentially identical to public current expenditure, thevariable relevant for private consumption decisions in a Ricardian world would be total public expenditure.

92
on the effectiveness of public saving in raising national saving range between nil and high,depending on the underlying framework. In addition, the quantitative impact of fiscal policy wifldepend on the type of fiscal instrument, its horizon of application, its inter-generational impact,and the extent of binding borrowing constraints among consumers.
What does the empirical evidence show on the effectiveness of fiscal policy in raisingnational saving? Most surveys of the evidence for OECD countries reject the Ricardianineffectiveness proposition (Hayashi 1985, Hubbard and Judd 1986, Bernheim 1987, Leidermanand Blejer 1988; the notable exception is Seater 1993 who concludes that Ricardian equivalenceholds approximately). Recent studies for developing countries also reject the Ricardian notion inits pure form but conclude that some offsetting of public saving by private savers does occur(Haque and Montiel 1989, Corbo and Schmidt-Hebbel 1991, Easterly, Rodriguez and Schmidt-Hebbel 1994, Edwards 1995a, Masson, Bayoumi and Samiei 1995).
Existing estimates of offset coefficients for developing countries are few, differ from eachother, and are based on widely differing saving definitions, model specifications and empiricalsamples. For example, Corbo and Schmidt-Hebbel (1991) develop a nested-hypothesis frameworkthat distinguishes between Keynesian, permanent-income and Ricardian consumption hypothesesand apply it to a panel data sample of 13 developing countries, rejecting each of these three simplehypotheses in their pure forms. In the overall sample, they find a public-private saving offsetcoefficient of 0.47; this result, however, conceals a large variation in individual-country offsetcoefficients. For two larger samples of LDCs, Edwards (1995a) obtains offset coefficients thatvary between 0.36 and 0.65, and Masson, Bayoumi and Samiei (1995) report an offset coefficientof 0.62. The implication is that public saving is a useful tool in raising national saving -- butresearchers and policy makers are still far from sure of how effective are specific fiscal tools.
To contribute to a more precise and systematic understanding of the effects of fiscal policyon national saving, a new framework will be applied to developing-country and OECD data toassess the quantitative effects of specific fiscal instruments on private consumption, and hence onnational saving. This study will aggregate value on the existing literature by allowing for:
Use of a new encompassing model. In order to consider the different mechanisms throughwhich public expenditure and revenue affect private consumption and saving, a model thataggregates over heterogeneous consumer groups is derived from first principles. Threedistinct consumer groups share common preferences but differ in the restrictions they facein solving their intertemporal optimization problem. The first group is unable to optimizeintertemporally because of a binding borrowing constraint, the second is comprised bypermnanent-income optimizers who do not face borrowing constraints, and the third group isRicardian in the sense that it takes into account the government's intertemporal budgetconstraint. Consumer preferences embody the possibility of finite lifetimes (as in Blanchard1985) and public/private consumption substitutability or complementarity (as in Bailey 1971).Therefore the aggregate consumption model nests five hypotheses that can be tested againsteach other and imply strikingly different policy implications: Keynesian or binding borrowing

93
constraints, permanent-income over infinite lives, permanent income over finite lives,Ricardian equivalence, and private/public consumption substitutability. This set-upgeneralizes previous consumption estimations for developing countries, that nest some ofthese hypotheses, such as Haque and Montiel 1989 (for the first, third and fourth hypothesis),Corbo and Schmidt-Hebbel 1991 (for the first, second and fourth), and Karras 1994 (for thefifth hypothesis).
Flexible model application. In order to identify the effectiveness of specific fiscalinstruments, the model application will distinguish between broad categories of fiscal revenue(taxes, non-tax revenue) and current government spending (government consumption,transfers). In addition, alternative forms of the model will be applied to deal with unobservedvariables that are discounted sums over the future horizon, including expressions involvinglagged terms and long-term moving averages.
* Use of the project's Saving Data Base. One of the main strengths of the saving data base isits inclusion of raw and adjusted data for public sector revenue and expenditure, and forprivate-sector disposable income (see Section Al). This makes it ideally suited for anempirical implementation of the model to the cross-country time-series sample of OECD and(non-transition) developing economies.
* Adequate treatment of econiometrics issues. In order to deal adequately with laggeddependent and independent variables in a panel data context, the estimation will be based ondynamic-panel techniques, as discussed in Section A2 above.
The Model
The objective of this model is to provide a framework, derived from first principles, to addressthe effects of fiscal policy on private saving and hence on national saving. In doing this, we will allowfor different mechanisms through which public expenditure and revenue decisions may affect privateconsumption or saving levels. The only tractable way to allow simultaneously for the operation ofdifferent mechanisms is by introducing heterogeneous consumer groups that differ in their reactionto fiscal policy, as considered previously by Haque and Montiel (1989) and Corbo and Schmidt-Hebbel (1992). As opposed to the latter, however, the heterogeneous consumer groups sharecommon preferences but differ in the restrictions they face in solving their intertemporal optimizationproblem.
Intertemporal preferences over are given by a standard constant-elasticity function whileintratemporal preferences allow for substitutability (or complementarity) between privateconsumption and public consumption expenditure. Consumer utility is maximized over an infinitehorizon but lives are finite as each individual faces a constant probability of death in each period.Three consumer groups are considered here, each of them represented by a "representative"consumer. Consumer I is unable to optimize intertemporally because of a binding borrowingconstraint that forces him to save a fixed share of her current disposable income. Consumer 2 is a

94
permanent-income life-cycle (PILC) optimizer who does not face borrowing constraints (BC) butdoes not either take into account the government's intertemporal budget constraint. Consumer 3 isan intertemporal Ricardian (R) optimizer who does not face borrowing constraints but substitutesthe government's intertemporal budget constraint into her own.
This set-up combines therefore finite lifetimes (as in Blanchard 1985 and applied to LDCconsumption function estimations by Haque and Montiel 1989) with a distinction between BC andR consumers (as in Haque and Montiel 1989 and Corbo and Schmidt-Hebbel 1992), with a distinctionbetween PILC and R consumers (as in Corbo and Schnidt-Hebbel 1992), and with private/publicconsumption substitutability (as in Bailey 1971 and applied to LDC and OECD consumptionfunctions by Karras 1994).
The optimization problem for consumer i (i= 1,2,3) will be performed for an open economywith constant domestic interest rates (equal to long-term external interest rates) and no uncertainty.Consumer i maximizes lifetime happiness given by the following standard time-separableintertemporal utility function:
Uih = E )j (1)
where U is the present discounted value of current and future utility streams, u is a concave utilityfunction of effective consumption c*, p is the subjective discount rate, subindex i denotes consumeri, and sunindeces s, t denote time periods.
Maximization of (1) is subject to the following five constraints:
Plyn + rbi,1l + e,tr,, tta + li
[,( + £, ) + , * )]f (2)
= (h,, - h,-1 ) + (b,i - hit-) - e,f, -e,l f,il
Wit - it-i
-1 (3)
C,; = Cit +,5. t(4

95
Wit - WitlI ~_ dyi, - ci, > (I -,#) dyi 5
Jrm (rR)s (-wS) = 0 (6)
where p is the relative price of output (GDP) in units of private consumption, y is GDP, r is thedomestic real interest rate, b is the domestic public debt held by the domestic private sector, e is thereal exchange rate (the domestic nominal exchange rate times the foreign price level divided by thedomestic price level), tr is foreign unrequited transfers to the private sector, tt is total tax and non-tax payments by the private to the public sector net of public transfers to the private sector, 7c isdomestic inflation (percentage rate of change of the deflator of private consumption expenditure), his domestic base money held by the private sector, r' is the foreign interest rate, c is the real exchangerate depreciation (percentage rate of change of e), f* is the foreign debt of the private sector, c isprivate consumption, w is total private wealth, g is public consumption, dy is private disposableincome as defined in the left-hand side of equation (2), and R is the gross discount factor defined as(1+r)0'
Equation (2) represents the intra-period budget constraint written such that adjusted saving(the left-hand side in 2) is equal to the change in real private wealth. This formulation is consistentwith the definition for adjusted saving that will be used in constructing the project's macroeconomicdata base as discussed in Section Al above. Equation (3) defines the standard utility functioncharacterized by constant relative risk-aversion with risk aversion coefficient 0, that isundistinguishable from the inverse of the constant intertemporal elasticity of substitution (1/0).
Equation (4) defines effective consumption as an aggregate of private consumption and publicconsumption, similar to the equation defined in Bailey (1971) and Barro (1981), and a particular formofthe slightly more general formulation by Christiano and Eichenbaum (1988) and Barro (1989). Theformulation here is also very similar to that used in the empirical studies by Kormendi (1983) andAschauer (1985) for the U.S., Ahmed (1986) for the UK, and Karras (1994) for a large sample ofcountries. The only difference of our formulation with those found in the preceding literature is thatwe specify a relation between private consumption of individual i and a part of overall governmentconsumption (gj) that corresponds to public goods enjoyed by consumer i (the relation of the latterto overall g is defined below). This formulation -- as the ones in the preceding literature -- assumesperfect substitutability (or complementarity) between private and public consumption. If thesubstitution parameter 6 is negative (positive) government consumption substitutes for(complements) private consumption.2 7
Equation (5) reflects the borrowing constraint, that will be binding when private consumptionreaches a share , of private disposable income. Finally, equation (6) defines the condition that rulesout a Ponzi scheme of unlimited net debt accumulation by the private sector. Note that this condition
27 Substitutability and complementarity are used here in the sense of rivalry, not in the Hicks-Allen sense. (Fora fuirther discussion see Karras 1994, footnote 1.)

96
requires that in the long term the gross rate of growth of net debt can not exceed the gross rate ofinterest (1+r) divided by the rate of survival, y. The latter is equal to I (the rate of survival underinfinite lifetime) minus the time and age-independent probability of death faced by each consumer inevery period (Blanchard 1985). Hence an increase in the probability of death raises the consumer'seffective discount factor yR.
Consumer I faces a binding borrowing constraint. Hence equation (5) holds with equality,implying that her consumption level is simply equal to:
C It =- /4dy it 7
For borrowing-unconstrained consumers 2 and 3 equation (5) is not binding. Theintertemporal budget constraint of consumer 2 is derived by combining equations (2), (3), (4), and(6):
E(yR) 2 CR s 12 P + EY2 - tt2 s + estr)S=1 s=1 (8)
- pvihb21 + , (yR)s 9g25s=t
Maximization of (1) subject to (8) yields the standard Euler equation for the ratio of futureand current effective consumption levels:
C2r+I = 1-+r J0 (9)
Using equations (4), (6), (8), and (9) it is possible to derive the following expression forcurrent-period consumption of consumer 2:
C2: = [r, p,r]{ w 2, + Z(rR)S-' (PY2s - 112s + e,tr2 )S=t (10)
- pvihb2t + (r R) - g5 92 - a2gs=t
where pvihb is the present value of interest costs incurred by holding base money (see Schmidt-Hebbel and Serven 1995) and the equilibrium discount factor [y, p, r] is defined as:

97
I 1
[r,,r (1+p)9(1+r) °-r (11)
(I+ +p) (I+ r) 0
Note that (10) reflects that consumption is equal to permanent income, and the latter is theproduct of the equilibrium discount factor defined above and consumer net wealth. The equilibriumdiscount factor collapses to the simplified form p/(l+p) when both the intertemporal elasticity ofsubstitution is 1 and the survival probability are unitary.
The flow budget constraint of the consolidated public sector is given by:
tt + hl- rbtl - [r*(1+e,)+,V9 *g - (1(12)
= - (h, - h1 1) - (b - bt1l) - (e,fg, - e,, fg, 1 )
where fg* is net foreign public debt.
Now turn to consumer 3 who internalizes the government budget constraint. Define Xi(i=1,2,3; the sum of the X, is 1) as the share of consumer i in public-private flows and stock holdings(assumed constant across different flows and stocks for each consumer i). Let's replace each public-private flow or stock holding related to consumer i, say xj, by consumer i's share in overall x, thatis Xi x. Then the intertemporal budget constraint of consumer 3 can be derived by combiningequations (2), (3), (4), (6) and the intertemporal version of the government budget constraint (12),as given by:
R() C35 = e(f 3t +.sfg;)+ (_yR) (PsY3s -estr3s)s=J =
co s-t x0 s-t (13)- E(rR) , 3 gs + E (R) 9g3,
S=1 I =1
Maximization of (1) subject to (13) yields an analogous expression to the Euler equationderived for consumer 2 in (9). Using equations (4), (6), (13), and (9) it is possible to derive thefollowing expression for current-period consumption of consumer 3:
C3, = [y,p,r] e, (f3 +A,fg,) + (yR)R'(p,y 3U -e,tr,,)(Ft ( 14)
-,(yR)" (-3 gi - '593,) t -tS3,st
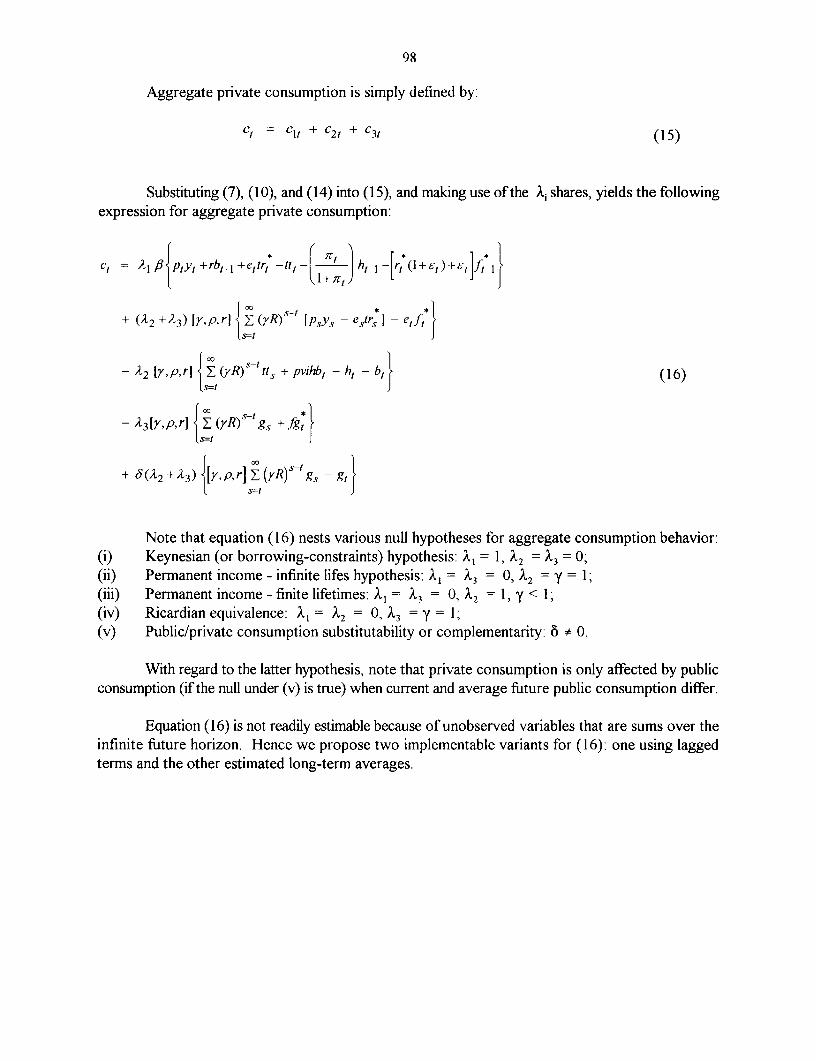
98
Aggregate private consumption is simply defined by:
C1 = C + C2 + C31 (15)
Substituting (7), (10), and (14) into (15), and making use of the Xi shares, yields the followingexpression for aggregate private consumption:
ct = Al flptly +rb,.. +e 1tr1 -tt, -h (I h, 1 - r (l+t)-f,-
+ (A2 +2 3) Iy,p,rl {XE (rR)sI [P - - ef, }
- A2 Y,, p,r {E (yR) stts + pvihb, - hi - bi} (16)
- A3 [Y, p,r] { (yR) sgs + fgJ}
+ a5(A2 +A3) [y,p,r] E (yR)sIgs - g,}
Note that equation (16) nests various null hypotheses for aggregate consumption behavior:(i) Keynesian (or borrowing-constraints) hypothesis: Ai 1, A2 = I3 = 0;(ii) Permanent income - infinite lifes hypothesis: A1 =A 3 , A2 = Y = 1;(iii) Permanent income - finite lifetimes: Xi A3 0 °, 2 =1, y < 1;
(iv) Ricardian equivalence: A1 = A2 = 0, 3 =y 1;(v) Public/private consumption substitutability or complementarity: 8 # 0.
With regard to the latter hypothesis, note that private consumption is only affected by publicconsumption (if the null under (v) is true) when current and average future public consumption differ.
Equation (16) is not readily estimable because of unobserved variables that are sums over theinfinite future horizon. Hence we propose two implementable variants for (16): one using laggedterms and the other estimated long-term averages.

99
Model Application
Consumption using Lagged Terms
First we go back to the individual consumer's optimal consumption equations (7), (10) and(14). Exploiting a relation between current and past expectations of future variables and subtracting(I+r)/y ci.. (for i=2,3) from equations (10) and (14), and adding two the latter transformationsequation (7), it is possible to derive the following expression for aggregate private consumptioninvolving lagged terms:
C1X 1lP [ Pt yt+rbt l +e, tr, -ttt-( I htl -[ rtt]f
+(A2+A3) +[y,p,r] |Ct-
1 i[y,p,r]l |[PtY r ( y rp, lYt] + le 1tr - r ) trj j(17)
2+[y1p,r] ( Y ) ]
2A 7P~ 3 ] ypr] It (r y) t- l ]t rg-
I[ [il t[y,p,r] ( gy ) I +[y,p,r] I t ( y)g t
Consumption using Estimated Long-term Averages
Define gy, , gross consumer income, and gp , gross payments of the private sector to thegovernment, and ifg, , interest payments on the foreign debt of the government as:
gys PsYs + estrs - [rS (I + -s) + s]fLi (18)
gp s tt l + h, - rbsl -l (19)

100
tfgs [rS ( + If ) s (20)
Note the appropriately defined estimated long-term average for any variable by a bar symbolover the corresponding variable. Then the aggregation of equation (7) and appropriately modifiedforms of equations (10) and (14) yield the following expression for aggregate private consumptioninvolving estimated long-term averages:
ct = xj3kyt-gpt)
+ (A2 +X 3 ) [y,p,rl] ( I+r y I
2 3v 1 ( +r-y) klt (1F 1~~I+r -
-A3 [y,p,r] ( gZiy ) ] (J t )( + r
+ 8(A2 +X3 ) [ [y,p,r] |l+r )|
Further Issues on the Empirical Application of the Model
In order to identify the effectiveness of specific fiscal instruments, the model application willdistinguish between broad categories of fiscal revenue (taxes, non-tax revenue) and currentgovernment spending (government consumption, transfers).
The model will be applied to the data of the Saving Project's World Data Base. One of themain strengths of the World Data Base is its inclusion of raw and adjusted data for public sectorrevenue and expenditure, and for private-sector disposable income. This makes it ideally suited foran empirical implementation of the model to the cross-country time-series sample of OECD and (non-transition) developing economies.
In order to deal adequately with lagged dependent and independent variables, the estimationwill be based on dynamic-panel techniques, as discussed in Section A2 above.

10l
C2. What Drives Consumption Booms ?28
Consumption booms are sustained periods of rapid growth in private consumption, duringwhich the share of private consumption in GDP increases. Consumption boom episodes have beencommon in developing countries, and have been associated with a variety of exogenous events,including episodes of stabilization from high inflation, surges in capital inflows, the implementationof market-oriented structural reforms (especially including trade and financial liberalization), andfavorable movements in the external terms of trade. The emergence of a consumption boom is oftenperceived as a policy problem due to its effects on demand for home and traded goods, and on theresources available for investment. In the case of inflation stabilizations, for example, the emergenceof a consumption boom puts upward pressure on the prices of home goods and tends to underminethe stabilization objective. Brazil's Cruzado plan is perhaps the best-known example. Consumptionbooms that have emerged in the context of capital-inflow episodes have resulted in current accountdeficits that have undermined the credibility of the prevailing exchange rate and contributed to capital-flow reversals. The recent example of Mexico has now become notorious, but similar, if somewhatmuted, boom episodes have characterized several other capital-importing countries in LatinAmerica.29
Causes of Consumption Booms
In spite of the episodic importance of consumption booms in developing countries and theirimplications for short-run macroeconomic management, systematic study of the factors that explainthe emergence of booms has only recently been undertaken. By and large, analysis of the causes ofconsumption booms has been confined to speculation based on casual empiricism in descriptivestudies focusing on other issues (e.g., stabilization episodes, surges in capital inflows, etc.). In thesecontexts, several competing hypotheses have been offered to explain the emergence of booms,attributing the phenomenon to changes in alternative determinants of aggregate consumptionexpenditure. The leading ones are:
a. A redistribution of income from capital to labor in the form of increases in the real wage. Sincewage earners as a group are more likely to be liquidity-constrained than recipients of capital income,aggregate consumption may rise in response. This mechanism has been cited, for example, as anexplanation of the short-term booms that were associated with the populist economic programs ofSalvador Allende in Chile in the early seventies, as well as of Alan Garcia in Peru during the lateeighties.
28 Prepared by Peter Montiel.
29 Another aspect of consumption booms that has recently become of concern is that, in the context of taxsystems that emphasize expenditure taxes, the emergence of a consumption boom may cause recorded data to overstatethe sustainable extent of fiscal adjustment, due to the favorable effect of the boom on government revenues (see Talvi(1994) and Calvo (1995).

102
b. A reduction in real interest rates associated with exchange-rate based stabilization programs. Withhigh capital mobility, using the exchange rate as a nominal anchor reduces domestic nominal interestrates. If expectations of inflation remain high, however, the domestic real interest rate falls, triggeringan increase in consumption expenditure. Rodriguez (1982) used such a model to interpret themacroeconomic dynamics associated with the Argentine "tablita" experiment in the late seventies.
c. A generalized easing of credit conditions in the context of financial liberalization. An easing ofterms and increase in availability of funds to finance consumer expenditure may trigger a boom. Thiscan be given a positive interpretation if artificial liquidity constraints are removed when financialrepression is eliminated, facilitating consumer borrowing on secured terms (e.g., housing mortgagecredit), or a negative one if financial liberalization takes place without adequate prudential supervisionof banks, creating moral hazard problems for bank stockholders and their agents, the bank managers.Such a situation could promote high-risk lending at high real interest rates. Several observers haverecently emphasized this phenomenon as a potential trigger for the recent Mexican consumptionboom.
d. Lack of credibility in the sustainability of reforms. In the context of inflation stabilization, forexample, a stabilization which is temporarily effective, but not expected to last, will lower the nominalinterest rate for a short period. If money reduces the costs of economic transactions, currentconsumption will be cheap relative to future consumption, because low current nominal interest rateswill lower the opportunity cost of holding the money balances required to effect current transactions.As a result, households will shift consumption to the present. In the context of a trade liberalization,an "incredible reform" (Calvo 1987) will generate the expectation of a future tariff increase, makingimported durables temporarily cheap and causing an increase in consumer expenditure on such items.Argentina under the Austral plan, and Brazil under the Cruzado plan, are likely examples of thismechanism (Reinhart and Vegh (1995)).
e. Finally, booms may be triggered by a "euphoria" factor. If there are favorable movements in theexternal terms of trade, or structural reforms take place and are perceived to be so productive as tosubstantially increase the permanent incomes of households, then a boom in consumption representsan optimizing response on their part. Alternatively, if households are Ricardian and they anticipatea reduction in permanent future taxes (perhaps because of a permanent reduction in governmentconsumption) the perceived increase in private wealth may arise from an intersectoral transfer, ratherthan an improvement in aggregate productivity. This story has been told in a variety of settings. Ithas been applied to the Chilean "tablita" during the late seventies, as well as to Argentina, Mexico,and other large recipients of foreign capital inflows during the early nineties.
It is clear that consumption booms arising from each of these disparate factors will havedifferent policy implications, so identifying the causes of consumption booms in specific episodesbecomes a matter of policy interest. Obviously, different consumption boom episodes may havedifferent causes, and more than one of the driving factors listed above may be operative in anyparticular boom episode.

103
Research Methodology
Stylized Facts
The research proposed here will have two different objectives. The first objective is toattempt to narrow the scope of potential explanations for the emergence of boom episodes byestablishing a set of stylized facts. This will be done by examining a broad range (across countriesand over time) of both developing and industrial country data to obtain the broadest possible sampleof consumption boom episodes. The identification of episodes will rely on an objective set of criteriabased on the definition given above. For each identified episode, the potential roles of each of thefactors identified above will be examined, through what amounts to a correlation analysis. Thequestion to be addressed in this part of the work is whether macroeconomic phenomena associatedwith the boom were such as to allow scope for each of the hypotheses proposed above to explain theemergence of the boom during the period identified. In particular:
a. Was the boom accompanied by a major functional redistribution of income? Is there evidence forthe country in question that aggregate consumption is affected by the functional distribution ofincome?
b. Did domestic real interest rates fall at the inception of the boom? Is there evidence thatconsumption expenditure is sensitive to changes in the real interest rate in the country in question?What light can the behavior of other components of absorption shed on the potential role of thisvariable?
c. Were there changes in the domestic financial system or in household access to external financialmarkets consistent with a finance-induced boom? This would involve not just financial liberalizationbut, as indicated above, an approach to liberalization which may have encouraged imprudent behavioron the part of lenders.
d. If the boom accompanied a stabilization effort, was the stabilization strategy the same acrosscountries -- i.e., did booms tend to be associated only with exchange-rate based stabilizations, or havemoney-based stabilizations also produced booms? If the stabilization strategy has indeed beenimportant, was the emergence of the boom associated with a fall in the nominal exchange rate? Isthere independent evidence that the change in the nominal exchange rate was expected to betransitory?
e. Did the boom accompany a major program of structural reform, a large change in the terms oftrade, or some other event that could plausibly be related to a revision of expectations of futureincome on the part of households? Is there independent evidence, say from the behavior of assetprices or from external capital flows, that future income prospects in the country looked morefavorable?
If booms tend to be associated with one or more of the macroeconomic factors listed above,then other episodes in which similar changes in these macroeconomic factors were observed, but in

104
which a boom did not materialize, will be examined to identify possible reasons for the emergenceof booms in some cases and not in others. The results of this phase of the research should be a setof stylized facts about consumption booms in developing countries, as well as a narrowing andsharpening of the hypotheses listed above about the causes of booms.
Analysis of Specific Episodes
The second phase of the research will present a more rigorous analysis of the determinantsof one or more important recent consumption booms. The experience of Mexico during 1989-94 isthe prime candidate if a single episode is considered. If more than one, then the contemporaneousconsumption booms in Argentina and Brazil could also be examined. An alternative criterion forchoosing other episodes to study in detail would be the availability of data on the components ofconsumption expenditures -- i.e., durables and non-durables (including services). The weight givento this criterion would depend on whether evidence emerges from the stylized facts of systematicdifferences in the behavior of durables and nondurables during booms. If this distinction appears tobe important in the episodes reviewed, then countries that publish data on the composition of privateconsumption would be prime candidates for the more in-depth analysis.
Methodologically, the most straightforward way of approaching the second part of theresearch would consist in the estimation of decision rules for consumer expenditure and theconstruction of counterfactual simulations. Since all of the potential explanations of consumptionbooms involve the effects of major changes in policy regimes, however, Lucas critique considerationsrender this approach problematic.
Instead, a more promising approach involves simulations of optimal consumer behavior basedon "deep" parameters. The parameters required depend on the specification of the model. While theliterature offers a number of options, the precise form of the model to be simulated cannot bedetermined until the first part of the research is complete. The reason is that the specification chosenmust be able to encompass the subset of the hypotheses listed above that appear, at least in principle,capable of explaining the behavior of consumption during the episode in question. Thus the preciseform of the model must be determined after this subset of hypotheses has been determined in the lightof the data.
In broad terms, however, it is likely that a model that will prove useful for the purpose at handwill feature two goods (domestic and foreign), a transactions-cost motivation for the holding ofmoney, and binding liquidity constraints affecting some subset of consumers. In this case, theparameters estimates required are for both the intertemporal and intratemporal elasticities ofsubstitution, the parameters of the transactions technology, and the incidence of liquidity constraints.Ideally, these parameters would be estimated within a consistent framework based on data drawnfrom the consumption boom to be studied. Alternatively, some subset of them would be imposedbased on results already in the literature. The question posed would be whether, given realistic valuesof such parameters, observed changes in relevant variables exogenous to households are capable ofgenerating the observed pattern of consumer behavior.

105
Work along these lines has recently been undertaken by Reinhart and Vegh (1995), as wellas by Rebelo and Vegh (1995). Reinhart and Vegh adopted a partial-equilibrium approach toassessing the potential relevance of the "credibility" hypothesis in explaining the time path ofconsumption expenditure in several episodes of exchange-rate based stabilization. Using a standardconstant relative risk aversion specification of utility, they derived a closed-form solution forconsumption and simulated the effects on consumption of temporary reductions in the nominalinterest rate of the magnitude observed in the stabilization episodes. Their work focused specificallyon whether movements in nominal interest rates in these episodes were of sufficient magnitude as toexplain movements in private consumption, given the estimated values of intertemporal substitutionelasticities and parameters of the money demand function, holding constant the other determinantsof consumption. They found that the "credibility" hypothesis was more successful in the case of the"heterodox" stabilization programs of the mid-eighties than in that of the "tablita" programs of thelate seventies.
Rebelo and Vegh (1995), on the other hand, applied the simulation methodology at theopposite extreme of generality. They specified and calibrated a general-equilibrium model, subjectingit to alternative "stabilization shocks" meant to capture competing hypotheses attempting to explainthe macroeconomic dynamics associated with exchange-rate based stabilizations, includingconsumption booms. They found that nominal wage rigidity, combined with the supply-side effectsof disinflation, proved best able to generate a configuration of outcomes consistent with the stylizedfacts.
The research proposed here adopts a methodology that is less ambitious than that of Rebeloand Vegh, but more general than that of Reinhart and Vegh. Since the focus is on accounting forconsumption booms only (not the other stylized facts associated with exchange-rate basedstabilization), and doing so in contexts that may be more general than just that of exchange-rate basedstabilization, general-equilibrium simulation will not be adopted, and the variables that affecthousehold consumption choices will be taken as exogenous. In that sense, the approach is morepartial-equilibrium in nature than that of Rebelo and Vegh. On the other hand, it can be viewed asa generalization of Reinhart and Vegh.
To clarify the distinction between the proposed research and what was done by Reinhart andVegh, consider, for example, the potential role of the "euphoria" hypothesis in the Reinhart-Veghanalysis. Their simulations are based on an analytical closed-form consumption equation of the form:
I ' t r/(1 +r)
c,=y I +r [p(It)y'
where c is real private consumption, ybar is permanent income (consisting of the annuity value offinancial assets and capitalized labor income), r is the real interest rate, I is the opportunity cost ofholding money (I = i/l+i), with i denoting the nominal interest rate), p is the effective price of

106
consumption (including transactions costs), and p is the intertemporal elasticity of substitution.Reinhart and Vegh simulate changes in ct as I changes, holding ybar constant, and compare actual topredicted extreme values of ct , their objective being to establish the empirical plausibility of the"credibility" hypothesis.
While their procedure is well suited for that purpose, if the purpose is instead that whichmotivates the research proposed here -- i.e., to explain what has driven a particular consumptionboom -- it is necessary to go further. Without knowing how well the equation above tracksconsumption using actual values of all the right-hand side variables, we cannot draw conclusionsabout the extent to which the boom in question can be explained by each one of the candidates listedabove. Consider the potential role of 'euphoria", for example. Changes in household wealth arisingfrom revised expectations of future income can be estimated from observed changes in stock marketand real estate price indices, together with VARs for labor income. In the Reinhart-Vegh model,such changes would be reflected in ybar -- holding other variables constant -- may well also explaina substantial part of the variation in consumption expenditure. If so, then the "credibility" hypothesismay have explained too much, since the combined effects of changes in ybar and I may conceivablyoverpredict the boom In this case, the original specification of the consumption function abovewould be called into question.
To avoid this potential problem, the work on specific booms proposed here would extend theReinhart-Vegh analysis in two directions:
a. First, the model used in the simulations of private consumption will encompass the differenthypotheses listed earlier, with the objective of identifying the relative contributions made by therelevant subset of them in a particular application.
b. Second, the model's parameters will be chosen so as to track the actual behavior of privateconsumption, to ensure that the simulations yield decompositions that are consistent.
Thus, rather than asking whether any single hypothesis is capable of explaining the facts in the contextof a maintained consumption theory, the objective would is to develop an encompassing structuralconsumption model for the episode in question which fits the facts, and then assess the roles of thedifferent hypotheses in the context of that model. This will, for example, permit simulations ofconsumption behavior based on models derived from first principles to assess the extent to which anobserved "boom" reflects consumption tilting toward the present (perhaps attributable to the"credibility" hypothesis), as opposed to a level change in the path of consumption (which would ariseunder the "euphoria" hypothesis).
C3. Do Tax Incentives Raise Private Saving?
There is a long-standing debate about the impact of taxation on saving and capitalaccumulation. In one view, taxes are a serious impediment to saving and investment both becausehigh statutory tax rates imply high tax rates in practice and because savers respond to these

107
disincentives. In turn, taxes reduce capital and output growth, with potentially serious long-termconsequences for living standards and economic development. In another view, taxes have littleimpact on saving and investment decisions. Aggregate saving and investment are determinedprimarily by other factors such as the riskiness of returns to saving, the sophistication of the financialsystem, and life-cycle factors such as social security and retirement income. In this alternative view,financially savvy savers are able to avoid paying the statutory tax rate through careful tax planningand because tax enforcement is lax. Attempts to increase saving through government tax incentivescould be frustrated by high-income taxpayers shuffling assets from taxable to non-taxable forms,leading to windfall tax breaks to these taxpayers with no corresponding impact on aggregate saving.
Disentangling which of these views is correct is clearly crucial for determining public policytoward saving in developing countries. This paper will consider both the theoretical and empiricalevidence on these two divergent views. For example, recent theoretical models of endogenousgrowth suggest a strong role for taxation in affecting long-term income growth. By contrast, otherresearch using U.S. tax data have considered how the tax code affects saving behavior, and foundlittle or no evidence that taxes affect aggregate saving behavior. Understanding where there isagreement about the effect of taxation on saving and where disagreement still exists is one of the firstpriorities of any survey of saving and taxation.
The paper will rely on existing empirical and theoretical studies, and sets as its goalsproviding:
(i) a framework for evaluating taxation and saving in developing countries,(ii) an evaluation of the existing body of literature within that framework, and(iii) policy lessons on taxes and tax incentives for developing countries.
The paper will begin with a discussion of the main theoretical determinants of saving and thenproceed to consider the theoretical effects of taxation implied by the different models. For instance,if people save primarily to guard against future income downturns such as crop failures, tax policycould have much different effects on their saving behavior than if the primary motive for saving isretirement income. In developing countries, further institutional issues need consideration, such asthe role of the extended family, owner-operated businesses, imperfections in financial marketsincluding such prominent institutions as tontines (ROSCAS), and emigrant remittances.
A distinction between saving at the individual and at the national level is crucial. Whileunderstanding the saving behavior of, say, the bottom four quintiles of the income distribution isimportant in assessing their own financial security, the level of aggregate saving will be determinedlargely by individual saving of the top quintile of the income distribution and joint saving-investmentdecisions of businesses. For wealthy individuals, issues of legal tax avoidance and illegal tax evasionshould play an important role, especially in developing countries where tax codes may contain manyloopholes and enforcement is lax. Because businesses often make saving and investment decisionsjointly, understanding how the tax code affects investment decisions is of importance as well. Herethe study will rely on a number of studies (Auerbach 1993, Mintz 1993) for developing countries thatcalculate effective tax rates and illustrate the many and varied investment incentives and tax holidays

108
available in developing countries. This will be complemented by primary material from the authors'own participation in tax missions to Cameroon, Egypt, Ghana, and Guyana and elsewhere.
Beyond assessing the different theoretical models in terms of their implications, especiallythose for tax policy, the paper will examine how they fare relative to the empirical findings, especiallythose on developing countries. Here there has been much recent work including that associated withDeaton (1990, 1991b), Paxson (1988) and Udry (1994), among others. One natural division in thestudies is between those that report only on the determinants of saving, with the effects of taxationto be inferred, and those that report directly on the effects of taxation usually based on time series.For the latter type there will be relatively more reliance on the OECD countries. To the extentpossible, however, evidence will also be drawn from both middle-income countries, such as SouthKorea and Chile, and low-income countries, such as African or South Asian ones. These groups ofcountries will face different issues attendant on their different degrees of development. For instance,the better-off countries with longer life spans and perhaps a less family-oriented social structureshould evidence a more important role for retirement saving. This observation is just one exampleof a general principle, namely that it is less a question of a contest between theories of saving foruniversal applicability than one of relative importance in different contexts.
Analysis of theoretical issues should illuminate a more difficult question: for the purpose ofpolicy, what is the social value of encouraging more saving? Is the social value of increased capitalaccumulation sufficiently high to justify the loss in revenue that could be used for other worthypurposes or the diversion of resources from the private sector (and perhaps private saving)?Furthermore, how does one evaluate this hypothetical saving program if the benefits are received bydifferent groups in the income distribution? These are thorny theoretical issues that must beconsidered in the design of any government program to encourage saving.
Another important theoretical and policy question is, if the government seeks to encouragesaving, how to do it? There are two basic approaches: global incentives and targeted incentives.Global incentives include sweeping changes in the tax code, such as a switch from an income-basedto a consumption-based individual tax, a business cash-flow tax, or greater reliance on a value-addedtax. Such reforms require many changes in the tax code, including transitional provisions.Alternatively, targeted saving incentives, such as individual retirement accounts or salary reductionplans, cause less disruption to the existing tax code but may also encourage large-scale tax avoidancethrough such methods as transferring assets from taxable forms to tax-sheltered forms without anyoverall change in saving.
C4. Does Financial Reform Raise or Reduce Saving?30
Since the 1970s and especially in the 1 980s, many industrial and developing countries havereformed their financial systems and have allowed market forces more scope in determining interest
3 0 Prepared by Gerard Caprio and Fabio Schiantarelli.

109
rates and in allocating credit (Caprio, Atiyas, and Hanson 1994). At the same time, there has beena notable decline in saving rates, in particular in those countries, such as the United States, wherefinancial markets appear to be least regulated. Following McKinnon (1973) and Shaw (1973), someobservers had expected that higher real interest rates, a likely feature of the post-reform environment,would yield an increase in saving, notwithstanding the possibility that income and substitution effectswould offset one another.
However, a variety of studies suggest that any effects on interest rate changes on saving willbe quite small. Yet little systematic investigation of a second channel, namely the extent to which arelaxation of credit constraints on consumers is part of reform and negatively affects saving, hasoccurred. More specifically, higher access to consumer credit, consumer durables and housingmortgage credit may reduce saving as it relaxes a binding credit constraint (Jappelli and Pagano 1994,Muellbauer and Murphy 1990, Attanasio and Weber 1994; see also Rossi 1988 on cross-countryevidence on interest rates, credit constraints and consumption). Finally, improved access to financialmarkets may reduce precautionary or buffer-stock saving under conditions of uncertainty. (SeeDeaton 1990, 1995; see also Honohan 1995 for a comprehensive survey of these and other channels).
This paper will address these issues by examining several financial reform efforts in LDCs,drawn from cases such as Korea, Malaysia, Indonesia, Chile, Mexico, Ghana, Turkey, and Zimbabwe,in order to analyze how saving evolved in the aftermath of reforms. The study will also consider, forpurpose of comparison, the impact on saving of financial reforms in a few OECD countries such asItaly, the UK, and Norway).
In each of the cases a dynamic model of saving will be estimated using pre- and post-reformaggregate data, with the explicit goal of testing for structural breaks. Empirical tests will start withthe appropriate Euler equation for consumption (or saving) derived from first principles, allowing forborrowing constraints of different forms (exogenous ceiling on borrowing, borrowing related toincome, wealth or other macroeconomic or structural variables) and test whether the degree ofmisspecification of the equation changes over time. This could result from the share of constrainedconsumers changing over the years in relation to business cycle conditions, structural changes infinancial markets (the focus of our investigation), and other policy changes.
One way to test for misspecification is to add to the Euler equation for consumption thatwould hold under the assumption of perfect capital markets a set of additional variables that shouldonly matter in the presence of financial constraints (past income, income volatility, etc.) and checkwhether they are significant or not and whether their significance changes between the pre-reformand post reform period. Different measures of financial liberalization will be developed, and theirsignificance will be assessed as additional explanatory variables in the consumption (saving) equation.
The study will also try to document the extent to which any changes in saving were linked toprecise features of reform. For example, discussing the Italian experience, where saving rates remainhigh and consumer credit -- especially for mortgages -- remains in relatively short supply, Jappelli andPagano (1994) and others have speculated that the practice of requiring a 50% down payment for

110
housing finance provides a boost to saving.3" Thus it would be useful to see if those countries withsome degree of financial reform and still high saving (such as Korea, Indonesia, Malaysia, andrecently Chile) also feature continuing constraints of consumer credit, and whether those countrieswith a post-reform decline saw a greater response in consumer lending.
In order to pursue this investigation, reform experiences will have to be analyzed and theircommencement points dated. Fortunately, Caprio, Atiyas, and Hanson (1994) have analyzed manyof the above episodes. That analysis could be pushed further by measuring the degree of reform bycomparing average pre-reform interest rates with those generated by uncovered interest parity, and/orby estimating the percent of their portfolio over which banks have full control (i.e., that portion notpreempted by reserve requirements, portfolio requirements, or directed credit).
This analysis requires only standard (mainly aggregate) data sources and some familiarity withthe historical experiences. The team will augment their knowledge by drawing on Bank and countrycollaborators. An attempt will be made to analyze deviations in saving rates to see if other countrycharacteristics, such as the level of development or history of inflation stability, influence the responseof savings to reform dynamics. Also, to the extent that panel data sets or even surveys of consumerscan be obtained for reforming countries, the investigation would also include an attempt to assessfrom micro data if there was a change in the proportion of consumers who were constrained by thelack of credit availability pre-and post-reform. In terms of econometrics implementation, both single-country and panel-data estimation techniques will be used.
This research will prove beneficial in advising on financial reform, in particular when post-reform programs are dependent on domestic saving.
The Approach
In analyzing the linkage between financial reform and saving, the analysis will focus on asubset of mostly developing economies (and potentially some industrial economies, such as Italy), forwhich significant information is available on the process by which the financial system was liberalized.The analysis will begin with a largely descriptive exercise, reviewing briefly the reform process basedon published studies (Caprio et. al. 1994) and various Bank sources for up to 8 countries. This partof the study will also include an estimation of pooled cross-country, time-series saving equationsalong the lines proposed for the wide cross-country empirical studies in the project, but with financialvariables spelled out in greater detail. The relatively concentrated country focus will permit thegathering of more variables related to financial reform, such as a wider array of rates of return(including interest rates on loans and stock market returns), the degree to which government
31 Interestingly, despite financial reforms there, greater competition has not changed this constraint, and it appears tobe linked to the inefficiency of the judicial process: since foreclosure is so difficult, mortgage lenders require a signifi-cant down payment to reduce the inclination of borrowers to walk away from their obligation.

illl
involvement in credit decisions has changed, and the share of credit going to consumer and mortgagefinance. The purpose of this part of the exercise is largely descriptive.
Next, we derive and illustrate a formal test of the effect of financial reform on consumption,through its impact on the extent of liquidity constraints. The basic idea is that financial reformdetermines the fraction of consumers that are liquidity constrained. This can be seen as an extensionof Campbell and Mankiw (1991).
Aggregate consumption, c, is the sum of consumption by financially unconstrained consumers,cU', out by financially constrained consumers, c:,:
Ct CU +Cc (1)
Under quadratic utility, the Euler equation for consumption implies that for unconstrainedconsumers
c = c , + ± (2)
Where E, is a forecast error. Assume that constrained consumers consume a proportion yof income, y, (o< y<l):
6, = yyCt+ , (3)
Denote the fraction of aggregate income that goes to constrained consumers by A1,
y, 1 ,y (4)
Substituting (2), (3) and (4) into(1) we obtain:
C, = cl U + y± tY, + 'El+ (5)
Using (1) and (4) lagged once in order to replace the unobservable value of cv,- , we obtain,after adding and subtracting it y~
Ac,= y A,,Ay 1 + Y(A,-itdy 1 +v, (6)
where vt = [IC, + &) - kJ
We well assume that 1, is a function of a set of variablles x that capture financialliberalization:
i,= a±+ 6x, (7)

112
Then (6) can be written as:
AC,c= razY, + r&'X_, AYy + ry'yJx 4- v, (8)
The simplest option for estimation is to assume that x, is a dummy variable that equals onein the post reform period and zero otherwise. In this case a test for the (lack of) effect of reform onconsumption, through its effect on the proportion of consumers that are liquidity constrained, issimply a test on the hypothesis that 6 equals zero. This implies that the coefficient on the change inincome is constant through time.
In order to account for the presence of the third regressor in (8), the easiest option, althoughnot necessarily the most efficient, is to include an additive dummy variable for the year in whichfinancial reform was introduced (in all the other periods the dummy is zero).
This framework can be further developed by allowing for more complicated versions of theutility function for unconstrained consumers, for a more complex consumption rule for theconstrained consumers, and for a more detailed modeling of financial reform.
C5. Is Pension System Reform Conducive to Higher Saving?.2
Over the last fifteen years, many countries at various stages of economic development haveimplemented or proposed substantial reforms to their public pension systems. As discussed in WorldBank (1994) and Arrau and Schmidt-Hebbel (1994), recent reforms involve a transition from anunfunded pay-as-you-go (PAYG) system to a mandatory contribution scheme that is by design fully-funded (FF). Because the public pension system within a country may have important effects oncapital formation and welfare, and because these reform proposals have become so widespread, aconsiderable literature has developed that simulates the effect of reforms on saving and welfare. Thepost-reform economic performance of Chile, which began its privatization in 1981 and is the onlycountry for which there are many post-reform years to observe, has also generated a sizableliterature.33
The approach taken in this study complements the existing literatures by providing empiricalevidence on the actual importance of the benefit and tax features of mandatory PAYG and FF pensionsystems on aggregate private consumption. Below we develop the theoretical and empiricalframework that will be used to ascertain the degree to which features of the public pension systemaccount for the variation of consumption levels and growth in a panel of countries.
32 Prepared by Andrew Samwick.
33 Corsetti and Schmidt-Hebbel (1995) (and others cited therein) discuss the simulation methods, andDiamond (1994) provides a recent overview of the Chilean reforms.

113
The Model
The standard intertemporal consumption problem under uncertainty posits a consumermaximizing the expected present discounted utility subject to a budget constraint:
Ct .i p,E(1 UCt
S. t.(1)
AtV+j = E +r tty + Ytt - CtJ
A, given
AT+l S °
where Ct, A, and Y, are consumption, assets, and income in year t, respectively; r is the interest rate;and o is the rate of time preference. The main source of uncertainty in the model is assumed to belabor income uncertainty. The first-order condition for consumption in adjacent periods (with j = 0)is given by the Euler equation:
( +r ) EJ U/0 C +± C = UOCtE (2)
As in Dynan (1993), a second-order Taylor approximation of U'(C,+1) around C, allows theEuler equation to be rewritten as:
Et[' C,] = i1( r-b) + C, )2]
where i = -C, (U'/U) is the coefficient of relative risk aversion and p = -Ct (UY"/U") is the coefficientof relative prudence.34 The Euler equation shows that expected consumption growth is the result oftwo primary motivations. The first term represents the consumer's desire to intertemporally smoothconsumption when confronted by an interest rate that need not equal his rate of time preference. Ifthe interest rate is higher (lower) than the rate of time preference, then the consumer will want to shift
34 Kimball (1990) introduces the concept of "prudence" to characterize economic behavior under uncertainty.

114
consumption into later (earlier) periods, which will increase (decrease) expected consumption growth.The higher is the consumer's intertemporal elasticity of substitution, i', the stronger this effect willbe. The second term represents the consumer's desire to buffer his consumption against uncertainincome shocks. The larger the impact of income uncertainty on the variance of consumption growthand the larger the consumer's coefficient of relative prudence, p, the stronger this effect will be.
Rewritten as an econometric specification, the approximation in Equation (3) is:
Aln(C,,,) = I ( r-) + Pvar(Aln(Ctd)) + Ertl (4)
Note that equation (4) simplifies to Hall's (1978) specification of C,+, = Ct + ertl under theassumptions that utility is quadratic (i.e. certainty equivalent) and that the interest rate is equal to therate of time preference. In general, however, we should expect that both intertemporal substitutionand precautionary saving should play a role in consumption growth.3 5
Because pension reforms typically involve transitions to steady-states in which the tax burdenon current income is changed, accounting for liquidity constraints is important in this analysis.Equation (4) accounts for the potential effects of future, but not current, liquidity constraints onexpected consumption growth because such constraints will amplify the variance of futureconsumption growth. If liquidity constraints in the current period are binding, then consumption willequal the amount of resources that are currently available rather than the value specified by equation(4). The model shows that the impact of any pension reform on consumption growth will occur byaffecting the market rates of interest, the variability of consumption growth, or the degree to whichconsumers are liquidity constrained. The consumer's response to those changes will be determinedby the values of his underlying preference parameters (o, i, and p).
The consumer's optimization problem specified in equation (4) also has a first-order conditionthat if the shadow value of current assets is positive, then the intertemporal budget constraint mustbe satisfied. One of the most important consequences of a pension reform is that it changes theamount of resources that will be available to current generations of consumers over their life-time.In the theoretical framework of equation (1), such a shift in available resources is analogous tochanging A,. Because equation (4) describes only the growth of consumption given a fixed budgetconstraint, an additional equation must be specified to identify the initial level of consumption thatresults after the pension reform is implemented. This second equation may be specified with the level
35 Dynan (1993) estimated p in household level data and found it to be economically small. Carroll (1994)provides other evidence that future income uncertainty does affect current consumption in a manner consistent with thisframework. Carroll and Samwick (I 995a, b) estimate that households that face more income uncertainty hold morewealth and summarize the empirical literature on precautionary saving.

115
of consumption or the ratio of consumption to income as the dependent variable and will be discussedfurther below.
Estimation
The model in the previous section applies directly to consumption decisions made at thehousehold level. Ideally, the model would be estimated on individual consumers over a time periodthat included a pension reform. The effect of the reform could then be inferred from the consumptionresponses of individuals whose budget sets were differentially affected by the reform.36 In reality,such data ao not exist, and as a result, the primary source of identifying information must come atthe aggregate level by comparing the consumption patterns of countries that have different degreesof pension liability funding and institutional frameworks in their public systems.
The data for this project will be drawn from the World Data Base discussed in Section Al.and ongoing World Bank studies of pension reform in many countries.3" Consistent with dataavailability, the sample of countries will be chosen to include a wide variety of country experiencesand pension regimes in order to more precisely identify the effect of the public pension system onsaving. At a minimum, the selected countries will include those with a large degree of pension-liability funding, such as Chile, Malaysia, Singapore, and Trinidad and Tobago; those with mature ornearly-mature PAYG systems, such as Mexico, Uruguay, and the United States; and those with nomandatory pensions, such as Australia and South Korea.38 The sample will consist of both OECDand LDC countries, including those such as Argentina, Peru, and Colombia that have recentlyreformed their systems and countries such as Bolivia, Costa Rica, Hungary, France, and Italy that areactively considering reform. It is anticipated that data availability and quality will be better in theOECD than the LDC countries in the sample.
One complication that arises when equation (4) is not estimated using household level datais that the population must be sorted into a few representative groups. Because country-level datasetsdo not typically contain separate measures of consumption and other variables disaggregated bygroups, special assumptions are necessary to relate the (unobserved) group consumption amounts intothe aggregate consumption value.39
36 There is a vast literature on the effects of Social Security and private pensions on household saving. SeeGale (1995) for a recent review.
37 See, for example, Schmidt-Hebbel (1995) on Colombia's recent reforms and World Bank (1994) for a moregeneral overview.
38 Both of these countries did introduce public pensions toward the end of the probable sample period, Koreain 1988 and Australia in 1986-1992.
39 Corbo and Schmidt-Hebbel (1991 ) aggregate over constrained and unconstrained consumers in derivingtheir econometric specification.

116
Recent research on precautionary saving suggests that consumers be classified into twogroups based on a criterion that determines whether they are actively saving for retirement. Carroll[1992] shows that in an infinite horizon model, consumers whose expected consumption growth rate(the right-hand side of equation (3)) is exceeded by their income growth rate will seek to maintaina target wealth-to-income ratio. Consumers' prudence will prevent wealth from falling too low, andtheir impatience (a high value of 8 relative to r) will prevent it from rising too high. Carroll andSamwick [1995a] show that in a life-cycle model with an income drop at retirement, this "buffer-stock" behavior will persist until retirement is about fifteen years away. Samwick [1995] furthershows that while consumers are engaged in buffer-stock behavior, they do not offset changes in theirexpected retirement wealth by adjusting their discretionary wealth holdings.i' Consumers who arenot engaged in buffer-stock behavior (i.e. those whose expected consumption growth rate exceedstheir income growth rate) are actively saving for retirement in this model and, therefore, will have asavings response to pension reform. For completeness, these consumers will be described asengaging in "life-cycle" behavior.
Based on the theoretical framework, the fraction of the population engaged in life-cyclebehavior will be an important determinant of the effect of pension reform on saving. Aggregateconsumption growth is equal to:
Aln(C14 1) = XL Avln(C+L ) + lABAn(CB 1+)(5
= XA ln(CL',,) (5)
where A denotes the share of the respective groups of consumers in total consumption and the groupsare denoted by L (life-cycle) and B (buffer-stock). Since the consumption of the latter group is onaverage constant, aggregate consumption growth is the product of two factors: the share ofconsumption accounted for by life-cycle group and the consumption growth rate for that group. Theproper specification for equation (5) is to specify consumption (and all other aggregate flows thatappear as exogenous variables) in per-capita terms.
Equation (5) suggests two categories of variables that will be relevant in a reduced-formspecification for aggregate consumption growth. The first category is comprised of variables thatdetermine the consumption growth rate for those engaged in life-cycle behavior. The intertemporalsubstitution motive (the first term in equation (4)) requires the inclusion of an interest rate thatreflects the opportunity cost consumption for these consumers. That is more likely to a home-equityloan or savings account rate than a credit card rate for those who are actively saving for retirement.The precautionary saving motive requires the inclusion of variables that affect the degree of incomeuncertainty and the extent to which capital markets can efficiently insure individuals against that risk.Carroll and Samwick (1995a, b) show that approximately 15 percent of the variation in incomeuncertainty at the household level is attributable to demographic variables such as age, education, and
40 Gourinchas and Parker (1995) extend Carroll's (1992) theoretical framework in a similar fashion.

117
family composition and characteristics of employment such as self-employment, occupation, andindustry. The reduced form should therefore include the variables describing the distribution of thesecharacteristics across the population. King and Levine (1993) examine the relationship betweenmeasures of financial market development and economic growth in a cross-country study thatincludes all of the countries that have proposed pension reform. These measures should also beincluded as independent variables.41 Denote all of these variables in country i at time t by Xt.
The second category is comprised of variables that determine the fraction of the populationengaged in life-cycle behavior. Since this ratio is just the fraction for whom expected consumptiongrowth exceeds income growth, all of the variables from the first category are potentially relevanthere, too. Additionally, variables relevant to the growth rate of income facing both buffer-stock andlife-cycle consumers must be included. One important variable will be the average retirement agefrom full-time and part-time work, since the transition from buffer-stock to life-cycle saving isdetermined largely by how close the consumer is to retirement. Additionally, measures of opennessto international trade and productivity growth across sectors should be included to proxy for pre-retirement income growth. Denote all of these variables in country i at time t by Zi.
Since X is constrained to be between 0 and 1, an econometric specification of the form:
Aln(C,,,,) e Z r + , + Vt + El,1) (6)
will be used to estimate the parameters of the reduced-form model, where p, and u, are country andtime dummies, respectively.
As discussed above, the consumption growth equation holds only for a given pension regimeand must therefore be complemented by an equation that determines the level of initial consumptionas a function of the characteristics of the pension regime. The most naturally starting point for sucha specification is Feldstein's (1974, 1995) study of the effects of social security on aggregateconsumption for the United States in which an aggregate measure of Social Security Wealth (SSW)was constructed for each year in the sample period. SSW is simply the expected present value of allpromised benefits to workers and retirees covered by the system in a given year.
Although calculating SSW for every country in every sample year may be infeasible due todata limitations, there are several characteristics of the public pension system that are important to
41 The measures used in their study are: 1) the ratio of liquid liabilities to GDP, 2) the ratio of deposit moneybank domestic assets to deposit money bank assets plus central bank domestic assets, 3) the ratio of claims on thenonfinancial private sector to total domestic credit, and 4) the ratio of claims on the nonfinancial private sector to GDP.Levine and Renelt (1992) consider a broader array of financial development indicators.

118
the determination of SSW that can be included as proxies. Regardless of the type of public pension(FF, PAYG, or mixed), the average retirement date, life expectancy at retirement, fraction of thepopulation in the workforce, and dependency-ratio will be important determinants of expectedpension benefits. For PAYG systems that promise benefits according to a formula, the legislatedearly and normal retirement dates, historical and legislated retirement income replacement rates,provisions for post-retirement indexation of benefits, and political or legal guarantees of pensionbenefit payments will be important. For systems that are structured as defined contribution pensions(including all FF systems), expected pension wealth will depend on average cumulative savings atretirement, minimum and maximum contribution rates, provisions for lump sum withdrawal and pre-retirement borrowing, restrictions on portfolio allocation (including requirements that funds beallocated to government liabilities) and government guarantees to supplement contributions for lowincome workers. The extent to which the pension liabilities have been funded should also be includedas a continuous variable to allow for different effects of funded versus unfunded systems onconsumption.
Denoting all of the pension variables by Pi,, the specification of the consumption equation is:
Ci 1t = ao + a] HWP, + a 2Wge, + P +,r0 + Ti + ft + (7)
where C1, is consumption, HWi, is the expected present value of after-tax labor income, \, is theaggregate stock of household wealth, and all three are measured in real, per-capita terms. Since someof the variables are likely to be missing for some countries over the sample period, a variety ofspecifications of equation (7) will be estimated with different subsets of variables comprising Pi,. Thisbasic specification may also be augmented to allow for direct liquidity constraints as in Corbo andSchmidt-Hebbel (1991) by including measures of aggregate consumer credit or to allow for buffer-stock behavior by introducing a factor analogous to A in equations (5) and (6).
As they are written, equations (6) and (7) constitute a system of equations that must beestimated jointly (to allow for potentially correlated errors) using panel data techniques, includingnon-linear methods to account for the need to predict the share of life-cycle savers in (6). Themethods employed will be based on the three estimation procedures for panel data developed inSection A2 above.
Prediction
The estimates of the parameters from equations (6) and (7) will then be used to simulate theaggregate consumption response to various types of pension reforms. The explanatory variables inthese equations can be classified into four groups based on how they will change during the pensionreform. The first group will be directly affected by the reform, such as those included in Pi, thatcharacterize the public system. The second group will be largely unaffected by the pension reform.The age distribution and life expectancy of the population are examples of this group. The third
119
group includes variables such as per-capita disposable income that will change differentially accordingto how the transition is financed. The magnitude of these changes will be based on simulations ofOLG models of pension reform found elsewhere in the literature.42 The fourth group consists ofvariables such as labor force participation that may also change directly as part of the reform in a waythat has been omitted from the model presented above. Because little is known about otherbehavioral responses to pension reform, a broad range of possible responses will be simulated.
D. LESSONS FROM INTERNATIONAL SAVING EXPERIENCES
The preceding research component follows an issue-oriented approach that focuses on specificpolicy instruments and cuts across developing regions. To complement that approach, this componentwill examine the overall saving experiences of specific countries and country groups. Its objective isto assess their saving record and saving-related policy framework as a whole, in order to learn formcountries' actual experiences to draw lessons for the design and implementation of saving policies.
This component will include four tasks. First, an analysis of saving patterns in economiesundergoing systemic transition, focusing on the causes of the sharp decline in their saving rates sincethe onset of transition. Second, a study of the policies that were instrumental for the success of take-off countries across the world in jumping to a path of high saving and rapid growth. Third, an analysisof the causes of the collapse of saving in Sub-Saharan Africa, with an assessment of the policiesneeded to reverse it. And finally, a set of five country studies sharing a common methodologicalframework, analyzing in depth consumption/saving behavior and saving policies in selected countries.
DI. How Does Saving Behave under Systemic Transition ?43
The scope for recovery and growth in the transition economies (TE) depends crucially onadequate volumes of efficient investment. While net international capital flows to those economiesare increasing, the evidence is unambiguous that in the near future their investment will have to beprimarily financed by national savings. However, one striking aspect of the transition from socialismto capitalism has been the marked decline in saving rates, from levels above 30 -- and in some casesabove 40 -- percent to levels around 20 percent (see Table D. 1). Of course, there is ample reason toplace wider than usual confidence intervals around saving rate estimates in transition economies,reflecting data problems affecting both the measurement of the saving level and the measurement ofincome -- in particular unrecorded income from the emerging private (or informal) sector.Nevertheless, the generalized saving decline across a broad cross section of transition countriesclearly has the status of a stylized fact.
42 See, for example, Arrau and Schmidt-Hebbel (1993).
43 Prepared in collaboration with Cevdet Denizer and Holger Wolf

120
The decline in saving can be conceptually decomposed into two parts, roughly correspondingto the disequilibrium and equilibrium components. Under central planning, saving was residuallydetermined given the investment demands implied by the plan's growth targets and assumed ICORs.There is some evidence that the implied saving rates -- averaging around 33 percent during the 1970sand 1980s -- amply exceeded desired saving, until the onset of liberalization loosened the rigidity ofbinding consumption constraints (Kornai 1959, 1980, 1992, Welfe 1989; Quandt 1989). To thedegree that consumption indeed was below its desired level, the transition caused a welfare-increasingdecline in saving from disequilibrium to equilibrium levels.
Table D.1
Gross Domestic Saving in Selected Transition Countries(percent of GDP)
1989 1990 1991 1992 1993 1994
Bulgaria 31.4 22.0 35.8 22.9 16.7 20Czech Republic 30.6 29.9 36.7 25.3 20.1 22Hungary 29.9 28.0 19.4 15.7 10.7 12Poland 42.7 36.0 21.9 16.5 15.9 17Romania 29.5 20.8 24.1 23.4 21.7 21Slovakia 28.5 24.2 28.2 19.8 22.4 23Slovenia 33.0 32.6 27.4 26.2 25.0 25
Belarus 37.4 30.2 32.9 32.7 33.2 29Estonia 25.9 22.3 30.1 17.1 25.0 25Kazakhstan 22.3 25.9 9.5 23.7 14.0 16Kyrgyzstan 13.2 12.9 14.0 12.0 10.0 11Latvia 37.9 38.8 27.0 24.0 24.4 25Lithuania 25.8 25.5 31.5 20.4 10.6 12Russia 34.7 29.5 40.2 35.8 32.7 25Turkmenistan 26.0 27.2 33.4 25.0 20.0 18Ukraine 27.3 25.5 16.5 11.8 7.9 10Uzbekistan 17.8 16.7 25.9 30.5 25.0 20
Vietnam 4.7 6.1 16.5 20.2 16.0 17Mongolia 13.1 15.2 8.0 7.6 16.1 18
Source: World Bank data.
121
The second component of the decline reflects changes in equilibrium saving largely broughtabout by the impact of transition on standard determinants of saving. The latter can in turn be dividedinto a component common to the collapse of central planning and the transition itself, and anothercomponent reflecting the particular implementation of the transition process in each country --including the choice between big bang and gradualism and the choice of reform sequencing, whichhave been shown to be major determinants of inflation and output performance in transitioneconomies (De Melo et al 1995).
The objective of this paper is to assess the relative empirical importance of these three factors-- the move towards equilibrium saving and the impact of common versus idiosyncratic elements onequilibrium saving -- in the observed evolution of saving rates in transition economies. Until recently,a systematic assessment has been hampered by the limited number of observations available toresearchers.
For this purpose, the paper will first compute a rough estimate of the pre-reform level ofdisequilibrium saving by calculating the level of saving in the year immediately preceding the initiationof reforms (1989 for most of Eastern Europe, and 1991 for the former Soviet Union) that would havebeen observed if the (then socialist) economies had behaved like market economies. The calculationwill be based on the predicted values from cross-country saving regressions on a standard set ofdeterminants. This procedure will be checked against other cross-country saving regressionsestimated for market economies in the context of the Saving Project. This will yield a range ofestimates of pre-reform "equilibrium" saving rates and, by extension, of the empirical relevance ofthe shift from disequilibrium to equilibrium saving in explaining the observed decline in saving rates.
Next, the paper will turn to the estimation of the impact of the transition itself on equilibriumsaving, using standard intertemporal consumption models as an organizing framework. Such modelspredict that the evolution of saving depends on three major factors. First, on the disaggregated level,the unconstrained optimal consumption path is a function of the expected income profile. Second,whether this optimal consumption profile can be attained depends on the ability of consumers tosmooth consumption and thus on the development of the financial sector. Finally, the demographiccomposition of the population determines aggregate saving rates given individual constrained choices.
While demographics arguably are -- at least to a first approximation -- exogenous to thetransition process, both the evolution of incomne, as well as consumers' ability to borrow againstunexpected current declines and expected future rises in income, are directly affected by the transitionprocess. Thus, the impact of transition can be conceptually decomposed in two parts. The first,"quasi-exogenous"', component reflects the shocks to income profiles (such as terms of trade shocks)and demographic developments which are, to a first approximation, independent of the particulartransition strategy selected by each country. The second component captures the effects of deliberatepolicy choices about the nature and speed of the transition, which vary across the different countries.
Policy choices involve multiple dimensions, which renders an exhaustive analysis impossiblegiven the limited degrees of freedom available. Following Balcerowiz and Gelb (1994) and De Meloet al (1995), transition policies will instead be grouped into three core categonies: macroeconomic

122
stabilization (proxied by inflation), microeconomic liberalization, and institutional restructuring. Thelatter two categories are proxied by a set of annual liberalization indices developed by de Melo et al.(1995) as well as a set of indices for institutional reform developed by European Bank forReconstruction and Development (EBRD 1995). This allows both comparisons across countries andover time of the progress of individual countries along the three core dimensions of reform.
To implement empirically this approach, the paper will use panel regressions of saving rateson a set of determinants, including both the familiar set of saving determinants -- dependency ratios,income controls, terms of trade, and so on -- henceforth labeled X --, and the liberalization indices,henceforth labeled L. Depending upon the issue of interest, the regressions will be run in levels or firstdifferences. The data on transition economies will predominantly come from the World Bank'sANDREX and World Debt Tables databases, and the 1996 World Development Report, augmentedby terms of trade variables from Tarr (1994) and the liberalization indices from De Melo et al. (1995)and EBRD (1995).
As a first step, the analysis will examine to what extent the variables in X can be explained bythe variables in L, taking account of both linear and non-linear relations. By projecting the Xvariables onto the L variables, the former can be split into a component orthogonal to L, say Xl, anda component dependent on L, say X2.
The second step will involve the estimation of empirical saving equations with XI, X2 andL as regressors. This will allow to isolate and quantify separately the direct (i.e., acting through theL variables) and indirect (through X2) impacts of transition policies on the observed evolution ofsaving rates, distinguishing it from that of the policy-invariant saving determinants XI.
Thus, these regressions will allow us to examine a range of questions, including:
* the importance of linear and non-linear policy actions captured by changes in the standarddeterminants of saving;
* the importance of linear and non-linear policy actions not captured by changes in the standarddeterminants of saving;
a the differential importance of policy changes in different areas on saving behavior;
* the overall importance of policy-induced versus policy-invariant features of the transition indetermining changes in equilibrium saving rates.
The data used in the study will cover 27 transition economies and span the years 1985 to1994. The sample includes the following countries:
Eastern and Central Europe: Slovenia, Poland, Hungary, Czech Republic, Slovak Republic,Bulgaria, Croatia, FYR Macedonia, Romania, and Albania.

123
e Baltics: Estonia, Lithuania, and Latvia.
e Former Soviet Union: Russia, Kyrgyz Republic, Moldova, Kazakhstan, Uzbekistan, Belarus,Ukraine, Turkmenistan, Armenia, Georgia, Azerbaijan, andTajikistan.
* Asia: Mongolia, Vietnam.
D2. Saving and Growth Take-off: What Breeds Success ?4
Sustained saving and growth takeoffs have been the exception rather than the norm duringthe last four decades of development experience. Only a small (but significant) group of LDCs hasaccomplished the transition from a low saving-investment-growth trap to a high saving-investment-growth path in recent decades. Most of these 11 countries are in East Asia: Korea, Singapore,Taiwan, Hong Kong, China, Thailand, Malaysia, and Indonesia. The other three countries are Chile,Botswana, and Mauritius (see Table D.2).45
A good understanding of how the saving-investment-growth processes got started in theseexceptional experiences, and the policies that helped them (as well as the policy mistakes that wereavoided) is still missing. This requires revisiting in part the role of capital accumulation in growth andthe causalities between saving, investment, and growth. For observers and policy makers alike it ismost important to identify the role of specific structural conditions and policy levers in getting starteda successful transition. Hence the objective of this study is to identify analytically and empirically thepolicy and structural triggers that caused the structural break in the small group of countries that"have made it".
Issues
The study will address two sets of issues that are crucial in understanding the take-offexperiences. One refers to the causality between saving, investment, and growth; the second set isabout the role of specific policies and structural features in contributing to the structural break ofsaving, investment, and growth.
Causality
* Does saving drive growth (through investment) or is higher saving mostly a consequence ofhigher growth (either directly or as a reflection of expanding investment) in take-off
44 Prepared in collaboration with Dani Rodrik.
45 There are other countries that have achieved large increases in their saving rates between the 1960s and thelate 1 980s and early 1 990s, such as Congo, Papua New Guinea, Malta, Pakistan, and Turkey. But none of them hasachieved both high investment rates and high per capita growth rates, as opposed to all II sample countries.

124
experiences? This issue is hotly debated both world wide and within the context of the take-off countries (see Deaton 1995 and Schmidt-Hebbel, Serven and Solimano 1996 for recentreviews of the discussion). On one side of the controversy are those that argue that savingdrives growth or, more directly, that investment drives growth ("capital fundamentalism")while on the other side are those that argue that growth (based on factors other than physicalcapital accumulation, such as education or technological progress) drives saving (Carroll andWeil 1994) or investment (King and Levine 1994). For the case of two East-Asian take-offcountries (Korea and Taiwan), Rodrik (1994) argues that investment is the force behindgrowth. Sorting out the main causality is essential for discriminating between policy leverstargeted at saving, investment, or productivity growth.
* Does foreign saving play an important role in the take-off experiences? Is foreign savingendogenous or exogenous to national saving and domestic investment decisions?
There are two dimensions to causality: the time precedence (Granger-causality) of onevariable regarding the other(s), and the identification of the role played by the mainindependent determinants that have contributed to the take-off of saving, investment, andgrowth. To this second dimension we turn next.
Role of Policies in Saving, Investment, and Growth
* How much have policies contributed to the take-off experiences? Addressing this questionrequires understanding and modeling the behavior of saving, investment, and growth, andhow this behavior changes during take-off, This allows identifying the relative weight ofpolicy instruments as compared to structural/initial conditions and external (non-policy)shocks.
* Potential policy levers affecting saving, investment, and growth range from directinterventions and incentives (such as mandatory pensions, public investment, tax incentivesfor saving, investment, education, R&D) to providing an enabling environment (a stablemacroeconomic framework, stable and low government-induced distortions, adequateprotection of property rights, adequate regulation) and, lastly, to the choice of a specificdevelopment mode. Regarding the latter, interestingly the take-off sample includes countrieswhere government policy has been more active (as in Korea, Singapore, Taiwan; see Rodrik1994) and others where it has been more passive (as in Hong Kong, Chile), as well as acountry that is transiting from rigid central planning to a market economy with strong stateintervention (China).
Methodology
In order to disentangle time-precedence from causal determination, it seems sensible to followa two-stage strategy to understand the interrelations between saving, investment, and growth duringtake-off.

125
Time Precedence
Understanding "what comes first" is a useful first indication of causality. One way to do thisis by performing Granger-causality tests between national saving, domestic investment, and growth.These tests will be performed at the country level and for the whole sample. But time precedence isnot identical to causation -- hence the central next step.
Assessing the role ofpolicies: modeling and estimating behavioral equations for saving, investment,and growth
Functional forms for saving, investment and growth will be derived in a two-stage way. First,a set of core equations will be derived or taken from a standard stylized dynamic new-growth model(see e.g. Section B4 above, Caballe and Santos 1993 or Barro and Sala-i-Martin 1995). Second, themodel will be extended by adding a vector of additional relevant regressors (as in the reduced-formsaving equations used, for instance, by Edwards 1995 and Masson, Bayoumi and Samiei 1995).
For the specification of private saving, and in addition to standard consumption determinants,the following policy determinants will be considered: public saving (to test for Ricardian crowding-out), tax incentives for and mandatory saving requirements imposed on corporations and households,the degree of financial liberalization (measured for example by consumer and housing credit flows),and the extent of mandatory fully-funded or pay-as-you-go pension systems.
Estimation will be performed for individual country time series or for a panel of cross-countryand time-series observations.
Data
The core data for the dependent variables (gross domestic, national, and private saving;private consumption, gross domestic and private investment; GDP, GNP and private disposableincome), and for some regressors, for the time series (1960-94) and I I countries will be provided bythe central data base of the Saving Project. Data for additional independent variables will be collectedby the study author.
Inference and Policy Conclusions
Shedding light on both the interrelations between saving, investment, and growth and theirultimate determinants -- foremost policy levers -- in the small sample of LDCs who "are making it"will make a significant contribution to the understanding of development. In particular, it will behelpful to disentangle which policy changes may help, which are irrelevant, and which may hurt theprospects of take-off in the large majority of developing countries that have not yet made it. Suchinference will be based on the empirical findings proposed above, allowing for a quantification of thecontribution of specific policies to take-offs.

126
Table D.2
Ranking of Take-off Countries by Changes in Saving, Investment, and Growth Rates(Levels by Sub-Periods, in Percent)
Gross Domestic SavingJGDP 1960-73 1974-83 1984-93More Than 30% IncreaseBotswana 12.49 20.73 39.76Singapore 12.40 36.28 43.8720 to 30% IncreaseIndonesia 10.62 29.60 31.63Korea 10.93 25.20 35.1010 to 20% IncreaseChina 24.25 30.44 36.65Mauritius 13.63 19.83 24.07Malaysia 24.44 31.62 34.67Thailand 19.67 22.77 31.075 to 10% IncreaseChile 16.44 17.08 25.19HongKong 24.90 31.69 34.51Taiwan 21.80 31.99 31.57
Gross National Savyng/GNP 1965-73 1974-83 1984-93More than 30% IncreaseBotswana -2.49 17.15 33.8520 to 30% IncreaseSingapore 18.76 34.51 43.4810 to 20% IncreaseChina 25.26 30.59 36.82Indonesia 13.34 27.37 28.55Korea 16.77 24.14 34.39Mauritius 13.87 19.61 25.355 to 10% IncreaseChile 12.45 13.84 18.96Hong Kong 27.26 31.69 34.60Malaysia 22.09 28.34 30.71Thailand 21.73 22.53 30.12Taiwan 25.81 31.69 32.91
Gross Domestic Investment/GDP 1960-73 1974-83 1984-93More Than 15% IncreaseIndonesia 12.45 25.14 28.6810 to 15% IncreaseChina 23.42 30.11 36.27Korea 20.07 29.78 32.94Mauritius 15.69 25.68 27.10

127
Table D.2 (Concluded)
Gross Domestic Investment/GDP 1960-73 1974-83 1984-93Singapore 25.40 43.31 40.16Thailand 21.69 27.49 34.195 to 10% IncreaseChile 17.17 18.95 22.66Malaysia 20.37 30.16 30.20Less Than 5% IncreaseBotswana 25.91 38.56 29.77Hong Kong 25.25 29.02 26.23Taiwan 22.84 30.17 22.00
GNP Growth Rate 1960-73 1974-83 1984-93More Than 3%Chile 1.33 -1.45 5.95China 2.26 5.41 8.23Mauritius 1.96 1.58 6.16More Than 0%Botswana 5.22 6.72 5.37Indonesia 2.28 4.63 4.43Korea 6.99 11.90 7.73Thailand 4.64 4.10 7.18Less Than 0%HongKong 7.01 6.20 5.17Malaysia 4.20 4.20 4.05Singapore 6.80 6.77 5.50Taiwan 7.43 6.60 4.73
GDP Growth Rate 1960-73 1974-83 1984-93More Than 3%Chile 1.28 -0.16 5.31China 2.26 5.41 8.25Mauritius 1.95 2.03 5.84More Than 0%Indonesia 2.27 4.37 4.16Korea 6.93 6.51 7.52Thailand 4.61 4.37 7.23Less Than 0%Botswana 6.24 6.78 4.58HongKong 7.01 6.20 5.17Malaysia 4.14 4.46 3.76Singapore 7.13 6.49 5.56Taiwan 7.44 6.60 4.74
Source: World Bank data.

128
D3. Can Africa's Saving Collapse Be Reverted ?46
Sub-Saharan Africa's growth performance during the last three decades has beendescribed as a tragedy (Easterly and Levine 1994, Schmidt-Hebbel 1994, Hadjimichael and Ghura1995). Africa's per capita real GNP growth rate has declined steadily since the 1960s, reachingon average negative valuest since the early 1980s (see Figure 9). Declining growth combinedwith low investment reflects Africa's serious trend decline in investment productivity.
National saving rates have been falling steadily since the early 1970s -- in tandem withgrowth. Africa's average gross national saving ratio to GNP fell from 10.5% during 1965-73 toan abysmally low 6.4% in 1984-93. The rising gap between domestic investment and nationalsaving has been filled by foreign saving in general and foreign aid in particular. Overall foreignsaving ratios have doubled, from 6% of GNP in the late 1960s to more than 12% of GNP sincethe late 1970s.
Hence declining investment productivity and low saving are at the core of Africa's growthcollapse. While bad luck -- droughts, wars, and declining terms of trade -- has had its share inthe region's dismal performance, inappropriate policies have certainly also contributed to thisoutcome.
In a recent paper, Mwega (1995) has investigated empirically the factors that influence theprivate saving rate in a sample of less developed and OECD countries, with particular emphasison Sub-Saharan African countries. From cross-country time-series regressions, he found thatAfrica shift dummies are negative and highly significant, suggesting that Sub-Saharan Africa has alower private saving rate than other regions even after controlling for a wide range of economicfactors. Research shall be undertaken to unravel the factors behind this differential behavior.
The purpose of this paper is to shed light on Sub-Saharan Africa's dismal saving behaviorwith the ultimate aim to identify specific policies that could contribute to reversing the region'ssaving decline. While raising saving is not sufficient for achieving sustained growth, it doesappear to be a necessary condition for higher growth. In fact, identifying the policies that supportsaving (and the policy distortions that inhibit saving) is essential in times as these, when seriouscutbacks in foreign aid -- of which the region is the one that benefits most at a global scale --can be anticipated.
Issues
This study will address two inter-related sets of issues. The first set refers to the linksbetween national saving, foreign saving (particularly aid), investment, and growth in Sub-Saharan
46 Prepared in collaboration with Ibrahim Elbadawi and Francis Mwega.

Average GNSIVGNP and Average GDI/GNP (%)
1965
1966
1967
1968
1969
1970
4 1W 1971
1972CD~~~~~~~~~~~~~~~~~~~~~~~~~~~,
1973
0. 1974
1975
1976
1977
< 1978
1979
'' 1980
C)~ 1981
1982
1983
OQ 1984
1985 ' M
1986
1987
1990
19891
1993
Average real per capita GNP growth rate(%

130
Africa. The second concerns the impact of key behavioral determinants and government policies onsaving. Among the main issues for Africa that will be covered in this study are the following:
1. Links and time precedence between saving, investment and growth
Are national saving and domestic investment strongly correlated? (See Feldstein and Horioka1980 and the subsequent literature surveyed in Schmidt-Hebbel, Serven and Solimano 1996).The growing gap between both variables observed in Africa since the 1960s suggests that --as opposed to other regions -- have not been closely associated during the last three decades.
* Does growth follow investment or does investment follow growth? (See King and Levine1994)
* Does saving follow income per capita -- or its rate of growth -- or is the opposite patternobserved? (See Deaton 1995, Carroll and Weil 1994).
* Does foreign saving in general (and foreign aid in particular) crows or domestic saving or isforeign saving endogenous to domestic saving and investment decisions?
2. Saving and foreign aid
* A recently resurgent literature on the macroeconomic effects of foreign aid has found thathigher aid is translated mostly into consumption, not investment (Boone 1994, Obstfeld1995). For Africa, as the world's main aid recipient relative to GNP, addressing this issue isof utmost importance to both the donor community and African policy makers. Hence whenforeign aid is adequately measured (comprising transfers, grants, and the grant component ofconcessional lending), does Boone's (1994) result -- that aid mostly finances consumption-- still hold for Sub-Saharan Africa?
3. Terms of trade, cyclical income, and overall uncertainty
a How does saving respond to terms of trade shocks? Have temporary commodity boomsfinanced public and private consumption in similar magnitudes?
* How strongly pro-cyclical is saving?* Does macroeconomic instability in particular affect saving, as shown for the case of Africa's
growth decline? (Schmidt-Hebbel 1994).* How important is overall uncertainty in inducing precautionary or buffer-stock saving in
Africa?
4. Fiscal policy and saving
* By how much does private saving offset changes in public saving? More specifically, howmuch does private consumption (or saving) respond to temporary and permanent reductionsin public consumption and transfers, and to temporary and permanent increases in overalltaxation? (Corbo and Schmidt-Hebbel 1992, Edwards 1995).

131
5. Financial repression and liberalization
* How sensitive is saving to the real interest rate and to marginal tax rates? Are specific taxincentives (on retirement saving and/or other special saving accounts) effective in raisingoverall private saving or do they affect only the composition of private asset portfolios?
* What is the effect of domestic financial liberalization -- through reduction in intermediationspreads, changes in deposit interest rates, financial deepening, and enhanced access to housingand consumer loans -- on private saving? (See Honohan 1995, Jappelli and Pagano 1994).
* Does liberalization of the external capital account raise or lower national saving ?* What is the role of special financial institutions (savings banks, postal savings accounts, etc.)
in mobilizing private saving ?
6. Demographic transition
* Many Sub-Saharan Africa countries are still at early stages of the demographic transition.How does Africa's young population structure affect its saving rates? (Mason 1988, Massonet al. 1995, Edwards 1995).
7. Income distribution and poverty
* Do income (or wealth) distribution and the incidence of absolute poverty affect saving -- andby how much? (Ogaki, Ostry and Reinhart 1995, Schmidt-Hebbel and Serven 1995).
Methodology
In order to address the above listed issues, a methodology is proposed that focusessubsequently on data, overview of the region's performance, econometric estimation, and counter-factual simulations.
1. Data
The empirical part of this paper will rely on three data bases that have been recently completedor are under construction:
(a) The core data base for saving-consumption-investment-income data of aggregate (nationalaccounts) annual time series for all (most) Sub-Saharan African countries, preferably covering 1960-1994, will be extracted from the Saving Project's World Data Base.
(b) Data on foreign aid will be extracted from a World Aid Data Base under construction(Fernandez-Arias et al. 1996). This source includes both conventional foreign aid flows -- as

132
reflected by the OECD's ODA (Official Development Aid) flows (and as used by Boone 1994) --and more relevant, adjusted foreign aid flows (comprising grants, transfers, and the grant element offoreign loans).
(c) Data on income distribution variables will be extracted from the recently completed worlddata base (that includes 22 Sub-Saharan African countries) constructed by Deininger and Squire(1995).
Data from the latter three sources will be complemented by additional information requiredfor this study.
2. Initial Overview of the Region 's Experience
Making use of the above data, an overview and summary assessment of Africa's savingperformance will be provided, highlighting the main trends and changes in saving and its composition-- as well as in investment and growth -- during the sample period, discussing the evolution of themain saving determinants from both qualitative and quantitative dimensions, and identifying the mainissues to be addressed by the analysis.
A comparative evaluation of the saving record of the region will be performed, based on thecross-country regression results from the world studies of the Saving Project. This comprisesassessing how similar the region is to other major regions in its saving and growth behavior and interms of the main saving-related variables. (As the cross-country results will be available only at alater stage of the Saving Project, this comparative evaluation, which can proceed independently ofthe region-specific work, could be performed after the latter has been completed). The tests forassessing if the average saving behavior in Sub-Saharan Africa differs from that in other regions willbe made possible by including shift and interaction dummies for African countries in the broaderworld sample.
3. Testing of main hypotheses through econometric analysis
The statistical analysis will investigate:
(i) The inter-linkages between saving, investment, foreign saving (foreign aid), and economicgrowth in Sub-Sahara Africa, based on VARs, correlation, and causality analyses. The explicit aimis to establish the causal links between the above mentioned variables in Sub-Saharan Africa.Particular attention will be devoted to the dynamic relations between these variables (see Blomstromet al. 1993, Carroll and Weil 1994), as discussed of this proposal in more detail in Section B3.
(ii) The behavior of private saving (and consumption)and its responsiveness to policies. For thispurpose general functional forms (not derived from first principles) will be econometrically estimatedfor the levels of current-price national saving, private saving, and household saving and/or for their

133
ratios to current-price national or private (as applicable) disposable income, and for the levels ofconstant-price private consumption and/or its ratio to constant-price private disposable income,encompassing the above mentioned set of issues. The specification will broadly follow similar wide-encompassing equations as applied recently by Edwards (1995), Masson, Bayoumi and Samiei(1995), and Mwega (1995). A range of estimators -- from fixed-effect static panels to dynamicGMM panels, as discussed in Section A2 of this proposal -- will be applied and subsequently testedfor robustness. Particular importance will be attached to relevant policy instruments as regressors.The study will examine for the presence and significance of feedback effects from the private savingrate to potentially endogenous variables (including real the real interest rate, capital inflows, andincome). If feedback effects are important, the models will be estimated using instrumental-variabletechniques.
As part of the econometric analysis, and provided an acceptable number of time-seriesobservations are available, the time-series properties of the country data (unit root and co-integrationtests) could be assessed, following standard techniques and procedures (see Hamilton 1995 andHendry 1995).
In the frame of the time-series cross-country econometric analysis, particular care should beattached to identifying the presence and importance of specific country outliers (among the latter arepossibly the two African take-off countries, Botswana and Mauritius) in inferring regional trends andresults.
4. Counter-factual simulations and policy analysis
Making using of the estimated equations, counter-factual simulations of shocks and relevantpolicy changes will be performed and their qualitative and quantitative impact on consumption andsaving will be evaluated.
Assessment of Policies and Saving Incentives and Derivation of Policy Lessons
Finally, the effects of actual and potential policies and incentives on private and nationalsaving will be assessed, based on:
(i) the regressions and policy simulations carried out above,(ii) the region's policy experience assessed from a qualitative perspective, and(iii) the international experience.
This will provide the underpinnings for the study's derivation of policy lessons andrecommendations for the region.

134
D4. Methodology for Country Case Studies
The purpose of the country case studies is to complement the cross-country research onsaving by focusing in depth on consumption/saving behavior and policies in selected countries thatsatisfy at least two conditions: they should encompass relevant policy and consumption/savingexperiences, and they should highlight policy issues relevant to World Bank country economic workand operations.
Below we spell out the common issues, proposed methodology, and prospective policylessons that should be addressed by each country case study. We also list country-specific issues tobe addressed separately by each of the five selected case studies: China, Colombia, India, Mexico,and Pakistan. Application of a common set of issues and methodologies across countries will allowcross-country comparisons of results and policy implications.
Common Issues
The country studies should address two inter-related sets of issues. The first refers to therelationship between saving and other key macroeconomic variables. The second concerns the impactof shifts in policies closely linked to saving (tax policies, financial reform, etc). Among the latter, therelevant questions may differ across countries depending on their specific policy experiences. Acomprehensive list is given below:
1. Income per capita, income growth, and saving interactions
* Does saving follow income per capita (or its growth rate growth), or is the opposite patternobserved? (See Deaton 1995, Carroll and Weil 1994).
* How strongly pro-cyclical is saving?
2. International financial integration, foreign inflows, domestic investment, and national saving
* Did the country have -- and does it have now -- continuous access to voluntary privatecapital inflows -- i.e., is foreign saving (the current account deficit) endogenous or exogenousto domestic investment and national saving decisions ? If there were regime changes in thisregard, how was national saving affected ?
* Are national saving and investment strongly correlated? (See Feldstein and Horioka 1980 andthe subsequent literature surveyed for example in Schmidt-Hebbel, Serven and Solimano1996).
* How does saving respond to temporary and permanent foreign-aid inflows ? (Boone 1994,Obstfeld 1995). What is the saving impact of terms-of-trade changes ?

135
3. Fiscal policy and saving
By how much does private saving offset changes in public saving? More specifically, howmuch does private consumption (or saving) respond to temporary and permanent reductionsin public consumption and transfers, and to temporary and permanent increases in overalltaxation? (See Corbo and Schmidt-Hebbel 1992, Edwards 1995, Schmidt-Hebbel and Serven1995a and other studies/surveys on Ricardian equivalence).
4. Private corporate and household saving
* By how much does household saving offset changes in corporate saving -- i.e., are householdsable to "pierce the corporate veil" ? (See OECD 1994).
* What are the key determinants of corporate saving as opposed to household saving ? Doesa shift of private sector taxation from firms to households raise saving?
5. Interest rate and tax incentives
* How sensitive is the intertemporal allocation of private consumption (i.e., its rate of growth)to the real interest rate and to marginal tax rates? (See literature on consumption Eulerequations; for LDCs see for instance Burnside 1995, Ogaki, Ostry, and Reinhart 1995). Areprivate consumption and saving levels sensitive to the real interest rates and to marginal taxrates?
* Are specific tax incentives (on retirement saving and/or other special saving accounts)effective in raising overall private saving or do they affect only the composition of privateasset portfolios? (For OECD countries see OECD 1994; for a discussion on specific taxincentives in the U.S. see Engen, Gale and Scholz 1994).
6. Financial reform
a What is the effect of domestic financial liberalization -- through reduction in intermediationspreads, changes in deposit interest rates, financial deepening, and enhanced access to housingand consumer loans -- on private saving? (See Honohan 1995, Jappelli and Pagano 1994).
* Does liberalization of the external capital account raise or lower national saving ?* What is the role of special financial institutions (savings banks, postal savings accounts, etc.)
in mobilizing private saving ?
7. Aging population and pension system
* How much do demographic factors affect saving? (Mason 1988, Masson et al. 1995,Edwards 1995)
* What type of mandatory pension system, if any, is in place (pay-as-you-go or fully-funded,low or high population coverage, mature or immature system) and how does it affect saving
136
(World Bank 1994, Arrau and Schmidt-Hebbel 1993, 1994, Feldstein 1995). What has beenthe impact on saving of reforms in the pension system?
8. Income Distribution and Poverty
Do income (or wealth) distribution and the incidence of absolute poverty affect saving -- andby how much? (Ogaki, Ostry and Reinhart 1995, Schmidt-Hebbel and Serven 1995b).
Methodologr
In order to address the above listed issues, a four-step methodology is proposed, focusing ondata, overview of the country's performance, econometric estimation, and counter-factualsimulations.
1. Data
The construction of a saving-consumption- income data base using aggregate (nationalaccounts) data is a top priority. Preferably it should make use of published sources. However,typically additional data is required for disaggregating national account aggregates into public-sectorand private-sector saving and income, introducing necessary measurement adjustments (see SectionAl above) and, data permitting, breaking down private saving into corporate and household saving(see Schmidt-Hebbel, Webb and Corsetti 1992). The frequency of the sample should be annual and,if available, quarterly, with a sample extension extending as far into the past as possible (preferablybefore 1960). The variables should comprise current-price saving and both current and constant-priceconsumption and income, as well as measures of each of the relevant causal determinants of saving(taxes, interest rates, fiscal stance, and so on) listed above and corresponding references. Adisaggregation of private consumption expenditure into durables and non-durables, if available, isdesirable.
If possible, this data base should be complemented by making use of existing microeconomic(household and firm survey) data.
2. Overview and evaluation of the country's experience
Making use of the above data, an overview and summary assessment of the country's savingperformance should be provided, highlighting the main trends and changes in saving and itscomposition during the sample period, discussing the evolution of the main saving determinants formboth qualitative and quantitative dimensions, and identifying the country-specific issues to beaddresses by the analysis, in addition to those listed above.
In addition, a comparative evaluation of the saving/consumption/growth performance of thecountry should be provided, based on the cross-country regression results from other studies of the

137
Saving Project. This comprises assessing how similar the country is to other economies in its savingand growth behavior and in terms of the main saving-related variables. (As the cross-country resultswill be available only at a later stage of the Saving Project, this comparative evaluation, which canproceed independently of the country-specific work, should be performed after the latter has beencompleted).
3. Testing of main hypotheses through econometric analysis
3.1 UJsing aggregate data
In order to make efficient use of the available aggregate data, the econometric analysis shouldrely on both consumption/saving models with firm theoretical foundations but somewhat narrowcharacterizations of saving behavior, and broader models with less solid analytical grounding butproviding a more encompassing view of saving. The following three types of equations are proposedfor empirical implementation:
(i) An Euler equation for the rate of real private consumption growth, derived from consumeroptimization in a permanent income framework, extended to include elements such as habit formation(Burnside 1995), separation of risk aversion and intertemporal utility (Weil 1995, Epstein-Zin 1989),Stone-Geary preferences (Bumside 1995), and/or wealth-dependent intertemporal consumptionsubstitution (Ogaki, Ostry and Reinhart 1995).
(ii) A general equation for the level of private constant-price consumption and for its ratio toconstant-price private disposable income, not derived from first principles, but capable of addressingthe 8 issues listed earlier.
(iii) A general equation for the levels of current price national saving, private saving, and householdsaving and for their ratios to current-price national or private (as applicable) disposable income, notderived from first principles, but encompassing the above mentioned 8 issues.
The equations implemented under (ii) and (iii) would generalize recent consumption andsaving specifications, such as those by Masson et al. (1995) and Edwards (1995). Particularimportance should be given to include all relevant general and specific policy instruments asregressors.
As part of the econometric analysis, the time series properties of the data (including unit-rootand co-integration tests) should be assessed, following standard techniques and procedures (forgeneral reference see Hamilton 1995 and Hendry 1995).

138
3.2 Using microeconomic data
If a series of household surveys is available, it should be used to complement the analysisbased on macro aggregates. Depending on the variables included in the survey data, the followingissues should be addressed through the empirical implementation of equations similar to (ii) and (iii)but describing individual (or household) consumption and saving (see Section 135):
- saving and growth: are saving rates higher for those groups of households experiencingfaster income growth ?
- liquidity constraints (or excess sensitivity): is household consumption 'too sensitive' tocurrent disposable income (after controlling for past consumption and permanent income)?
- demographic factors: after controlling for income (or wealth), does consumption/savingbehavior differ systematically across households depending on age composition ?
- distributive factors: do marginal propensities to consume/save differ systematically acrossincome groups ?
4. C(ounter-factual simulations and policy analysis
Making using of the estimated equations, counter-factual simulations of shocks and relevantpolicy changes should be performed and their qualitative and quantitative impact on consumption andsaving should be evaluated.
Assessment of Policies and Saving Incentives and Derivation of Policy Lessons
In order to maximize the policy usefulness of the country study, it is proposed to assess theeffects of actual and potential policies and incentives on private and national saving, based on:
(i) the regressions and policy simulations carried out above,(ii) the country's policy experience assessed from a qualitative perspective,(iii) the international experience.
This will provide the underpinnings for the country study's derivation of policy lessons andrecommendations.
Country-Specific Issues
The countries selected for case studies are China, Colombia, India, Mexico, and Pakistan.These countries represent currently 55% of the population in the (non-transition) developing world,and 25% of its GDP. They encompass a rich diversity of saving and policy experiences. (See

139
Figure 10 with 1965-1993 saving and growth rates in the five countries). Saving rates are at worldrecord-high levels in China and exceed the typical levels of low-income countries in India, but reachonly moderate levels in the other three countries. In Colombia and Mexico (and also in India to amore limited extent) private saving rates have fallen significantly in recent years -- in the case ofMexico contributing to the occurrence of the 1994-95 crisis. Policies that directly and indirectlyaffect saving also differ significantly across each country, as discussed next.
(a) China "4
China, the world's largest country population-wise and in a foreseeable future the world'slargest country income-wise, is also currently the world's record saver, with a 40% national savingratio to GNP in 1994. During 1983-93 China's national saving rate has averaged 36.8%, while percapita real GNP growth has averaged 8.7% per year. Such outstanding performance stands inparticular contrast to the output loss and saving decline observed in most other transition economies.While certain initial conditions (China's initial low income and rural dominance) and differences insystemic transformation modes can explain part of the difference between the performance of Chinaand that of other transition economies, it remains both a puzzle and a policy challenge to assess thecauses of China's performance and the likelihood of its future continuation.
Some of the key issues to be addressed in the proposed country study on saving in China arethe following:
IData measurement problems. It is likely that China's saving rate is over-stated due to thecombination of two factors: the distortion of relative prices and inadequate measurement ofthe contribution of services (that could lead to a proportionately larger under-estimation ofoutput than consumption) and the peculiarly large inventory component in gross investment(that could partly represent unsaleable output of state-owned enterprises).
.Saving composition. Decomposition of national saving into its three main contributingsectors (public sector, enterprises, households) is complicated by the large extent of the extra-budgetary fiscal sector and the significance of concessional non-recoverable centralgovernment lending through the banking system, the sizable "grey" market through whichhousehold savings are unofficially channeled to private investment projects, and inadequateaccounting practices that complicate corporate saving measures. One of the objectives of thepaper will be to attempt to estimate residual saving bv relying on direct estimates of sectorsaving flows.
* Effects of financial reforms on saving. Although there have been some financial-sectorreforms during the 1980s, China's financial sector remains highly restricted and distorted, as
47 Prepared in collaboration with Aart Kraay.

Fi2ure 10
SAVING AND GROWTH RATES IN FIVE CASE-STUDY COUNTRIES
45 -
40
35
'30
~25
20
15
10
1965 1967 1969 1971 1973 1975 1977 1979 1981 1983 1985 1987 1989 1991 1993
--CHNA -a COLOMBIA -&- INDIA -- MEX[CO -e-PAKISTAN

141
reflected by widespread interest controls, lack of variety of financial instruments, and bindingcredit allocation guidelines. This suggests that borrowing constraints on households and non-state firms are the norm. Thus an understanding of the likely effects of financial liberalizationhinges on three questions: How will the expansion of the set of available assets (and,particularly, household access to credit) affect saving? What is the interest rate elasticity ofprivate and household saving (and, more narrowly, of household deposits)? What is theextent of precautionary balances/buffer stocks currently held by households and enterprises?
* Increasing uncertainty. China's transition toward a market economy has introduced bothlarger economic opportunities and uncertainties to most of its population. Higher uncertaintyin expected wage income, rates of return, and social services provided by the government leadto higher precautionary saving.
* Demographics and social security reforn. China's one-child policy has significantly reduceddependency ratios, which could explain part of its saving increase. Coverage of the currentpension system -- based on a enterprise-based pay-as-you-go (PAYG) scheme -- is verylimited, covering mostly urban public-sector workers. However, the erosion in state pensionbenefits observed during the last decade could raise private retirement saving. In rural areas,where state pensions are limited or non-existent and intergenerational links are strong, thelatter are weakening as a result of urban migration by the young, raising saving by the middle-aged parents who stay behind. Further extension of the existing pay-as-you-go scheme couldreduce saving, while adoption of a fully-funded system could encourage saving.
* Saving and growth. China's currently record saving and growth rates pose various questionsthat are important from a policy perspective. Do they reflect a "virtuous cycle" as observedin other market-based take-off countries or are they high because of China's special mode ofsystemic transformation? Does causation run mainly from saving to growth (and/or incomelevels) or does it mainly run in the opposite direction? Are these rates sustainable or do theyrepresent a unsustainable combination of remaining state controls, financial repression, andtemporary consumption habits?
(b) Colombia 48
In recent years Colombia has experienced a sharp decline in its saving rate, from 21.3% ofGDP in 1990 to 15.0% in 1994. Private saving fell even more, from 14.1% in 1990 to 6.2% in 1994.The private consumption boom was partly financed by higher foreign saving, reflected in a shift in thecurrent account balance from a surplus of 1.6% of GDP in 1990 to a deficit of 4.2% in 1994.
48 Prepared in collaboration with Alejandro Lopez and Ernesto May.

142
From the policy perspective, it is essential to disentangle the factors behind this evolution ofsaving, to assess if policy action is needed and, if so, to identify the measures most effective to restoresaving levels. The recent evolution of the policy and external framework in Colombia indicates thatthe following issues should be addressed, and their impact on consumption and saving levels shouldbe quantitatively assessed:
The resource boom: have the oil and coffee bonanzas caused an upward reassessment ofpermanent income ? How much has this contributed to the consumption boom ?
Financial reform: in recent years, mandatory portfolio allocation requirements on the bankingsystem have been eased, and it is likely that borrowing constraints on the private sector havebeen somewhat relaxed. How has the availability and cost of consumer credit evolved inrecent years ? How much has it contributed to the consumption boom ?
Fiscalpolicy: how much of the decline in private saving is just an offsetting response to therise in public saving ? Has the offsetting response been amplified by the fact that the higherpublic saving is partly temporary (as reflected by the termporary nature of tax surchargescurrently in place) ?
Trade reform: tariffs have been reduced and most non-tariff barriers (excluding agriculture)have been removed. Has this triggered off (i) a process of stock adjustment, particularly ofimported durables, and/or (ii) intertemporal speculation on the possible reversal of thereforms, leading to anticipation of the purchases of (consumer) imports ?
Capitalflaws: restrictions on capital inflows until 1992 may have diverted them to the currentaccount, leading to an overestimation of foreign saving and underestimation of private saving(the residual). What is the likely magnitude of this factor ? More generally, which are themain directions of causality between saving and investment, and between saving and growth?
Pension reform: the ongoing reform of the pension system could contribute to higher savingin the long term (Schmidt-Hebbel 1995). What is its likely impact on saving over the next fewyears? How much can it contribute to restore overall saving levels?
(c) India 4
Among developing countries, India stands out for her high saving, which exceeds by far thelevels typically encountered in low-income countries. Historically, however, these high saving rateshave not translated into fast growth, a problem that has been traced to India's distorted incentivestructure in general and, more specifically, to the obstacles to investment posed by a comprehensive
49 Prepared in collaboration with Norman Loayza.

143
licensing regime and high barriers to capital goods imports, which resulted in abnormally highinvestment costs (DeLong and Summers, 1993).
Among the relevant policy issues concerning saving in India, three stand out:
Declining saving ratios and measurement problems: Following the initiation of structuralreforms in 1991, SNA data reveal a steady decline in private saving ratios in recent years.However, it is unclear whether this portrays accurately the evolution of saving or is just astatistical artifact. On the one hand, there are reasons why private saving could fall inresponse to reform: increased economic efficiency might have led to an upward reassessmentof permanent income; the ongoing reduction of trade barriers could have triggered off a stockadjustment process in the demand for imported goods, or its permanence might be viewed asuncertain, leading to intertemporal reallocation of consumption towards the present; theincipient financial liberalization might have eased consumers' access to credit. Any one ofthese factors (or all of them simultaneously) could have resulted in a consumption boom, anexperience witnessed by other reforming countries. At the same time, however, each of theseexplanations has drawbacks: in the first place, notwithstanding the financial reform measures,consumer access to credit is still very limited and liquidity constraints are likely to be thenorm, so there is probably little scope for borrowing against future income; in addition,imports of consumer goods remain severely restricted.
An alternative view attributes the saving decline to measurement error. A particular sourceof measurement error that has been pointed out could be the apparent boom in unrecorded(or under-recorded) purchases of new housing. Closer inspection of the data reveals thathousehold saving (an aggregate which includes saving by the unincorporated private sector)is the component responsible for the observed decline in overall private saving rates. Inpractice, household saving is primarily derived from household investment in physical assets,itself derived as the difference between aggregate gross investment and gross investment bythe public sector and private corporations. Therefore, underestimation of total investment oroverestimation of investment by private corporations could have resulted in theunderstatement of household investment and saving.
* Public saving and aggregate saving: Continuing large public deficits pose a major threat tothe Indian economy. While public investment has declined somewhat relative to GDP inrecent years, saving of the consolidated non-financial public sector has also been falling, andis close to zero at present. Restoring public saving levels is therefore regarded as a centralpolicy priority. However, little is known about the impact that such policy would have onprivate saving and thereby on the economy's national saving levels. In particular, it is unclearwhat type of adjustment in public saving would maximize the impact on national saving:would tax hikes be preferable to cuts in public expenditure ?

144
Private saving determinants: Notwithstanding India's comparatively high saving rates vis-a-vis other low-income countries, they still fall far short of those in East-Asian economies, andfurther increases in the saving rate are likely to be necessary to speed up growth in real percapita income. To guide policies aimed at this objective, a better understanding of the keydeterminants of private saving in India is necessary. For example, what is the sensitivity ofsaving to interest rates ? What is the effect of India's changing demographics on its savingrate ? Does foreign saving crowd-out domestic saving -- a question that acquires specialrelevance with the ongoing opening-up of the capital account ? Also, is it likely that as partof the development process households could shift their accumulation towards human capital(in education and health) and away from conventionally measured saving ?
(d) Mexico
Mexico's national saving rate has declined steadily over the last dozen years, from a peak of26.4% in 1983 to a trough of 16.9% in 1993. This evolution has coincided since 1988 with Mexico'ssignificant efforts in pursuance of macroeconomic stabilization and structural reforms. The country'sinvestment rate rose slightly during the reform period, which, combined with declining saving,required massive capital inflows that financed a current account deficit of up to 7% of GDP in 1993-94. Growth has been sluggish since the early 1980s.
Certain policy mistakes (including exchange-rate based stabilization, inadequate public debtmanagement, inadequate bank supervision/regulation and, in 1994, a lax monetary policy) contributedto Mexico's low growth and deteriorating external condition. The latter combination was deemedunsustainable by market participants, as reflected by their massive speculative attack on Mexico'sforeign reserves in late 1994 and early 1995, which led to the subsequent and still unfolding financialand economic crisis (see Leiderman and Thorne 1996).
Mexico's low saving performance has certainly contributed to its external fragility. In thisrespect -- as well as in regard the policy mistakes and subsequent crisis -- Mexico's recentexperience replicates to a large extent Chile's boom-and-bust episode of the late 1970s and early1980s. As in Chile in 1983-84, among Mexico's main current challenges is the need to raisesubstantially its national saving rate (see for instance Feldstein 1995d). This requires addressing,among others, the following issues:
Identifying the causes of Mexico 's low saving performance. Fiscal stabilization (reflected inrising public-sector saving rates) has contributed to higher national saving -- but the extentof this contribution is unclear. Private saving may have declined in response to fiscalcontraction, financial reform leading to excessive consumer debt, intertemporal consumptionspeculation as a result of incomplete credibility in exchange-rate based stabilization and/ortrade reform, and higher perceived permanent income associated to the reforms and NAFTAaccession. By redressing the policy mistakes of the recent past, it should be possible to revertthe private saving decline observed during recent years.

145
Saving effects ofpension reform. The Mexican government has identified pension reform andtax reform as the two main levers to raise long-term saving. With regard to its pensionsystem, Mexico adopted in 1991 a partial pension reform based on a mixed scheme ofcontributions to both a dominating PAYG pension pillar and a small fully-funded pillar. Nowthe government has proposed to Congress a more comprehensive reform project, that givesa much larger role to a decentralized and fully-funded pension pillar. It is essential todisentangle the short and long-term contributions of such a reform to saving in Mexico.
* Saving effects of tax reform. Shifting taxation from direct to indirect taxation (and toconsumption taxation in particular), and providing tax incentives to certain private savingsinstruments, could have positive effects on private and national saving.
The Mexico case study will assess quantitatively these and related issues following thecommon research questions and methods proposed for all country case studies above.
(e) Pakistan 50
Although Pakistan's saving rate has been rising in recent years, it remains among the lowestin Asia. The ratio of gross domestic saving to GDP has increased from about 9% in the mid- 1 980sto 14% in recent years, mainly reflecting a steady rise in household saving. Throughout the 1980's,Pakistan enjoyed high GDP growth (averaging 6.1 percent per annum) with low domestic savingsrates (9.4 percent on average). During that period, high levels of workers' remittances (about 7% ofGDP) and abundant bilateral and multilateral credit at concessional terms helped bridge the saving-investment gap. In recent years, however, the situation has changed: workers' remittances have fallensharply (to 3% of GDP) and Pakistan is having to rely more on non-concessionary borrowing. Theimplication is that higher saving will be needed in the future to support the trend growth rate withoutadverse spillovers to the current account. In addition, in the coming years it will be necessary tofinance an increase in public infrastructure expenditures to reverse the deterioration in the socialinfrastructure stock, which has resulted in poor welfare outcomes and poses a constraint to futuregrowth. The need to increase domestic saving is thus high on the government's policy agenda.
Against this background, the Pakistan study will address several important policy issues:
Reconciling the evidence on saving: It is often argued that Pakistan's saving rate is considerablyhigher than National Accounts estimates. A relatively large and dynamic informal economy (whosesize is estimated at about 25 to 30% of the formal economy) could lead to a serious underestimationof the private saving rate in Pakistan. It is important to determine whether the low measured savingrate is an accurate portrayal of the facts or is due to measurement error.
50 Prepared in collaboration with Ijaz Nabi.

146
Household saving performance: The household saving rate has risen considerably in recent years.An important policy question concerns the identification of the factors responsible for this trend. Isthe rise in household saving due to changes in saving patterns of rural or urban households ? Howhas rural saving been affected by the decline in workers' remittances ? How has it responded to theperformance of the agricultural sector, in view of the apparently close association between growthin agriculture and the overall saving rate ? To answer these questions, the proposed work will gobeyond the use of aggregate data and will employ information from household surveys, which arereadily available for Pakistan. The Federal Bureau of Statistics conducts periodically (lately on anannual basis) nation-wide Household Income and Expenditure Surveys (HIES). In addition, twoIntegrated Household Surveys (PIHS), which include also information on items such as borrowingand lending by households, have been conducted in recent years with World Bank support. Surveysof rural saving have also been carried out in recent years.
Financial sector reform and saving: Since 1990, Pakistan has embarked on a program of financialliberalization, that includes privatization of Banks, allowing new private commercial and investmentbanks (local and international), elimination of interest rate ceilings on bank credit, floating new debtinstruments, deepening the stock market and introducing a more liberal foreign exchange regime.Nevertheless, interest rates on bank deposits have remained negative in real terms, reflectingcontinued mandatory and concessional credit schemes as well as the weakness of bank portfolios.How has private saving been affected by these reforms ? Will improved private sector access to creditaffect saving performance ? How does private saving respond to interest rate changes ?
Public saving: Pakistan's high growth in the 1980s was accompanied by large fiscal deficits, whichresulted in an increasing burden of public debt service, and large defense outlays. In addition,insufficient infrastructure expenditures lead to a dramatic deterioration of the physical infrastructurestock, whose reversal will now necessitate a heavy investment effort. The dismal levels of publicsaving (around 1% of GDP) is a major impediment for this task, and raising public saving is thereforea major policy concern. The program outlined to improve public saving consists of measures tostreamline government expenditures as well as increase tax revenues. In designing the strategy toincrease public savings it is important to select fiscal instruments that succeed in raising aggregatesaving. This requires assessing the relationship between alternative fiscal instruments (publicexpenditure and tax measures) and private saving. For example, it is often argued that shiftingtaxation towards consumption taxes could have a positive effect on private saving. The key questionin this area is to identify the policy measures that raise public saving while having a maximum impacton aggregate saving.
Contractual saving: Pakistan has had limited experience with contractual saving. The civil-serviceand military pension schemes are overly generous and will have adverse fiscal implications over themedium term. However, private pension schemes are still largely undeveloped. Increasing awarenessof the importance of contractual savings in many successful countries of Southeast and East Asia isprompting policy makers to take a closer look at such savings schemes. Several questions arise indesigning contractual saving schemes for Pakistan: should Provident Funds and Pension Plans be fully

147
funded or pay-as-you-go type? What implications do they have for private (household and firm)saving behavior ? How should such funds be managed ?
REFERENCES
Abel, A. (1990): "Asset Prices Under Habit Formation and Catching Up with the Joneses,"American Economic Review, 80, pp 38-42.
Amirkhalkhali, S. and A.A. Dar (1993): "Testing for Capital Mobility: A Random CoefficientApproach," Empirical Economics, vol. 18, pp. 523-541.
Andersen, T.W. and C. Hsiao (1982): "Fornulation and Estimation of Dynamic Models Using PanelData," Journal of Econometrics, 18, 47-82.
Arellano, M. and S. Bond (1991): "Some Tests of Specification for Panel Data: Monte CarloEvidence and an Application to Employment Equations," Review of Economic Studies, 58,277-297.
and 0. Bover (1995): "Another Look at the Instrumental Variable Estimation of Error-Components Models," Journal of Econometrics, 68, 29-51.
Argimon, I. and J.M. Roldan (1994): "Saving, Investment And International Capital Mobility In ECCountries," European Economic Review, 38, 59-67.
Arrau, P. and K. Schmidt-Hebbel (1993): "Macroeconomic and Intergenerational Welfare Effects ofa Transition from Pay-As You-Go to Fully-Funded Pension Systems," manuscript, WorldBank, June.
_ and K. Schmidt-Hebbel (1994): "Pension Systems and Reforms: Country Experiences andResearch Issues," Revista de Analisis Economico 9 (1): 3-20.
Atkeson, A. and M. Ogaki (1994): "Wealth-varying Intertemporal Elasticities of Substitution:Evidence from Panel and Aggregate Data," manuscript.
Atkinson, A. (1994): "Seeking to Explain the distribution of Income," Discussion Paper WSP 106,London School of Economics.
Attanasio, O.P. and G. Weber (1994): "The UK Consumption Boom of the Late 1980s: AggregateImplications of Microeconomic Evidence," Economic Journal, vol. 104, pp. 1269-1302.
Auerbach, A. (1993): "The Cost of Capital and Investment in Developing Countries," in A. Shah, ed.,Fiscal Incentives for Investment and Innovation. Washington DC: The World Bank.
and L. Kotlikoff (1987): Dynamic fiscal Policy, Cambridge University Press.Bailey, M. (1971): National Income and the Price Level. McGraw-Hill.Barro, R. (1974): "Are government Bonds Net Wealth?," Journal of Political Economy, 82: 1095-
1117.Barro, R.J. (1989): "The Neoclassical Approach to Fiscal Policy", in R.J. Barro (ed.): Modern
Business Cycle Theory. Cambridge, Mass.: Harvard University Press._______. N. Mankiw and X. Sala-i-Martin (1992): "Capital Mobility n Neoclassical Models of
Growth," NBER Working Paper 4206.and X. Sala-i-Martin (1995): Economic Growth, McGraw-Hill.

148
Barsky, R., N. Mankiw and S. Zeldes (1986): "Ricardian Consumers with Keynesian Propensities,"American Economic Review 76, 676-691.
Bayourni, T. (1990): "Saving-Investment Correlations. Immobile Capital, Government Policy orEndogenous Behavior?," IMF Staff Papers, vol. 37, pp. 360-387.
Benhabib, J. and B. Jovanovic (1991): "Externalities and Growth Accounting," American EconomicReview, 81: 82-113.
Berndt, E., and J. Triplett (1990): (eds.) Fifty Years of Economic Measurement. NBER Studies inIncome and Wealth, vol. 54. NBER, Washington, DC.
Bernheim, B. (1987): "Ricardian Equivalence: An Evaluation of Theory and Evidence," NBERMacroeconomics Annual 1987. Cambridge, Mass.: MIT Press.
Berry, A. (1985): "On Trends in the Gap between Rich and Poor in Less Developed Countries: Whywe know so little," Review of Income and Wealth 31: 337-354.
Bewley, Y. (1977): "The Permnanent Income Hypothesis: a Theoretical Formulation," Journal ofEconomic Theory 16, 252-92.
Blanchard, 0. (1985): "Debt, Deficits and Finite Horizons," Journal of Political Economy 93, 223-247.
Bliss, C. (1968): "On Putty-Clay," Review of Economic Studies, 35: 105-132.Blomstrom M., R.E. Lipsey and M. Zejan (1993): "Is Fixed Investment the Key to Economic
Growth?," NBER Working Paper No. 4436.Boone, P. (1994): "The Impact of Foreign Aid on Savings and Growth," manuscript, London
School of Economics, June.Boskin, M.J., M.S. Robinson, and A.M. Huber (1989): "Government Saving, Capital Formation, and
Wealth in the United States, 1947-85," in R.E. Lipsey and H.S. Tice: op.cit.Bosworth, B. (1993): Saving and investment in a global economy, The Brookings Institution.
Washington, D.C._ B. Burtless, and J. Sabelhaus (1991): "The Decline in Savings: Some Microeconomic
Evidence," Brookings Papers on Economic Activity, 183-241.Braun, P.., G. Constantinides and W. Ferson (1993): "Time Nonseparability in Aggregate
Consumption," European Economic Review 37, 897-920.Bunting, D. (1 991): "Savings and the distribution of Income," Journal of Post Keynesian Economics,
14, 3-22.Bumside, C. (1995) :Intertemporal Substitution, Growth, and Habit Formation," manuscript, World
Bank.Caballe, J. and M. Santos (1993): "On Endogenous Growth with Physical and Human Capital,"
Journal of Political Economy 101, 1042-1067.Caballero, R. (1990): "Consumption Puzzles and Precautionary Saving," Journal of Monetary
Economics 25, 113-136.Calvo, G. (1989): "Incredible Reforms," in G. Calvo, ed., Debt, Stabilization and Development:
Essays in Memory of Carlos Diaz-Alejandro. Oxford: Blackwell.
149
Campbell, J. (1987): "Does Saving Anticipate Declining Labor Income? An Alternative Test of thePermanent Income Hypothesis," Econometrica 55, 1249-73.
and J. Cochrane (1994): "By Force of Habit: A Consumption-Based Explanation ofAggregate Stock Market Behavior," NBER Working Paper 4995.
and N. Mankiw (1991): "The Response of Consumption to Income: A Cross-CountryInvestigation," European Economic Review 35, 715-721.
Caprio, G., I. Atiyas, and J. Hanson, eds. (1994): Financial Reform: 7heory and Experience.Cambridge University Press.
Carroll, C. (1991): "Buffer-stock Saving and the Permanent Income Hypothesis," manuscript.(1992): "The Buffer-Stock Theory of Saving: Some Macroeconomic Evidence,"
Brookings Papers on Economic Activity 2:1992, 61-13 5.and D.N. Weil (1994): "Saving and Growth: A Reinterpretation," Carnegie-Rochester
Conference Series on Public Policy, vol. 40, pp. 133-192.and A.A. Samwick (1995a): "The Nature of Precautionary Wealth," NBER Working
Paper 5193.and A.A. Samwick (1995b): "How Important Is Precautionary Saving?," NBER Working
Paper 5194._and L. Summers (1991): "Consumption Growth Parallels Income Growth: Some New
Evidence," in B.D. Douglas and J.B. Shoven, (eds.): National Saving and EconomicPerformance, National Bureau of Economic Research, University of Chicago Press.
and D. Weil (1994): "Saving and Growth: A Reinterpretation," Carnegie-RochesterConference Series on Public Policy 40, pp. 133- 192, North Holland.
J. Overland and D. Weil (1994): "Saving and Growth with Habit Formation," manuscript.Chamberlain, G. (1982): "Multivariate Regression Models for Panel Data," Journal of Econometrics,
18, 5-46.(1984): "Panel Data," Handbook of Econometrics, Vol. 2, Z. Griliches and M. D.
Intriligator (ed).Christiano, L. (1989): "Coniment on 'Consumption, Income and Interest Rates: Reinterpreting the
Time-Series Evidence," NBER Macroeconomics Annual 1989.and M. Eichenbaum (1988): "Is Theory Really Ahead of Measurement? Current Real
Business Cycle Theories and Aggregate Labor Market Fluctuations," Working paper 412,Federal Reserve Bank of Minneapolis.
Coakley, J., F. Kulasi and R. Smith: "Current Account Solvency and the Feldstein-Horioka Puzzle,"Discussion Paper 8/95, Birbeck College.
Cole, H.L., G.J. Mailath and A. Postlewaite (1992): "Social Norms, Savings Behavior, and Growth,"Journal of Political Economy, 100 (6): 1092-1125.
Collins, S.M. (1991): "Saving Behavior in Ten Developing Countries," in B.D. Douglas and J.B.Shoven, (eds.): National Saving and Economic Performance, National Bureau of EconomicResearch, University of Chicago Press.
Constantinides, G. (1990): "Habit Formation: A Resolution of the Equity Premium Puzzle," Journalof Political Economy 98, pp 519-543.

150
Corbo, V. (1995): "Economic Policies, Saving, Investment and Growth in Latin America," presentedat the OECD Workshop on Public Finances and the Evolution of Saving and InvestmentBalances, Paris, October 11-12.
and K. Schmidt-Hebbel (1991): "Public Policies and Saving in Developing countries,"Journal of Development Economics, 36: 89-115, July.
Corsetti, G. and K. Schmidt-Hebbel (1996): "Pension Reform and Growth," in S. Valdes-Prieto(ed.): Pensions: Funding, Privatization, and Macroeconomic Policy, Cambridge UniversityPress, forthcoming.
Cumby, R. (1990): "Consumption Risk and International Equity Returns," Journal of InternationalMoney and Finance, 9, pp 182-192.
De Long and Summers (1993): "How Dstrongly Do Developing Economies Benefit from EquipmentInvestment?," Journal of Monetary Economics 32, 395-416.
De Melo, M., C. Denizer and A. Gelb (1995): "From Plan to Market: Patterns of Transition,"manuscript.
Deaton, A. (1990): "Saving in Developing Countries: Theory and Review," World Bank EconomicReview, Special Issue: Proceedings of the First Annual World Bank Conference onDevelopment Economics, 61-96.
(1991a): "Saving and Liquidity Constraints," Econometrica 59, 1221-48.(1991b): "Household Saving in LDC's: Credit Markets, Insurance, and Welfare,"
Discussion Paper #153, Princeton University.( 1992): Understanding Consumption. Clarendon Press, Oxford.(1995): "Growth and Saving: what do we know, what do we need to know, and what
might we learn?," manuscript, The World Bank, March.and C. Paxson (1994): "Saving, Growth and Aging in Taiwan," in D. Wise, ed., Studies
in the Economics ofAging. Chicago: Chicago University Press.Deininger, K. and L. Squire (1995): "Measuring Income Inequelity: A New Data-Base," manuscript,
The World Bank, December.DeLong, J.B. and L. H. Summers (1991): "Equipment Investment and Economic Growth," Quarterly
Journal of Economics, vol. 106, pp. 445-502.Diamond, P. (1965): "National debt in a Neoclassical Growth Model," American Ecoomic Review
55, 1126-50.(1994): "Privatization of Social Security: Lessons from Chile," Revista de Analisis
Economico, Vol. 9, No. 1, 21-34.Dooley M., J. Frankel and D.J. Mathieson (1987): "International Capital Mobility. What Do Saving-
Investment Correlations Tell Us?," IMF Staff Papers, vol. 34, pp. 503-530.Duesenberry, James S. (1949): Income, Saving, and the Theory of Consumer Behavior. Harvard
University Press, Cambridge, Mass.Dynan, K. (1993): "How Prudent Are Consumers?," Journal of Political Economy, Vol. 101, No.
6, 1104-1113.Easterly, W. (1994): "Economic Stagnation, Fixed Factors and Policy Thresholds," Journal of
MonetaryEconomics, 33, pp 525-558.

151
and Schmidt-Hebbel (1994): Statistical Appendix, in Easterly, W., C.A. Rodriguez, andK. Schmidt-Hebbel (eds.) (1994): Public Sector Deficits and Macroeconomic Performance,Oxford University Press.
and R. Levine (1994): "Africa's Growth Tragedy," paper presented at the AERC Plenary,Nairobi, May.
and S. Rebelo (1993): "Fiscal Policy and Economic Growth: An Empirical Investigation,"Journal of Monetary Economics 32:417-458.
, C.A. Rodriguez and K. Schmidt-Hebbel (eds.) (1994): Public Sector Deficits andMacroeconomic Performance, Oxford University Press.
Edwards, S. (1994): "Why are Latin America's Saving rates so low?," presented at the Conferenceon Geowth Prospects in Latin America, Bogota, Colombia, June 27-28.
(1995a): "Why are Saving Rates so Different Across Countries? An InternationalComparative Analysis," NBER Working Paper No. 5097.
(1995b): Crisis and Reform in Lafin America: From Despair to Hope. Oxford UniversityPress, Oxford.
Epstein, L. (1991): "Substitution, Risk Aversion and the Temporal Behavior of Consumption andAsset Returns: an Empirical Analysis," Journal of Political Economy, 99, pp 263-286.
and S. Zin (1989): "Substitution, Risk Aversion and the Temporal Behavior ofConsumption and Asset Returns: A Theoretical Framework," Econometrica, 57, pp 937-969.
European Bank for Reconstruction and Development (EBRD) Transition Report, 1994 and 1995.Fair, R. and J. Taylor (1983): "Solution and Maximum Likelihood Estimation of Dynamic Nonlinear
Rational Expectations Models," Econometrica 51, p. 1169-1185.Fazzari, S., R. Hubbard and B. Petersen (1988): "Financial Constraints and Corporate Investment,"
Brookings Papers on Economic Activity 1, 141-195.Feldstein, M. (1974): "Social Security, Induced Retirement and Aggregate Capital Accumulation,"
Journal of Political Economy, 82 (5): 905-926.________ (1983): "Domestic Saving and International Capital Movements in the Long Run and the
Short Run," European Economic Review, vol. 21, pp. 129-151.(1994): "Tax Policy and International Capital Flows," NBER Working Paper No. 4851.(1995a): "Behavioral Responses to Tax Rates: Evidence From TRA86," NBER Working
Paper No.(1995b): "Social Security and Saving: New Time Series Evidence," NBER Working Paper
No. 5054.________ (1995c): "Tax Avoidance and the Deadweight Loss of the Income Tax," NBER Working
Paper No. 5055.(1995d): "Public Policies to Increase the Private Saving rate in Mexico," manuscript,
National Bureau of Economic Research, Cambridge, Mass.and P. Bacchetta (1991): "National Saving and International Investment," in B. Douglas
Bernheim and J. Shoven (eds.), National Saving and Economic Performance, Chicago:University of Chicago Press.

152
and C. Horioka (1980): "Domestic Savings and International Capital Flows," EconomicJournal, vol. 90, pp. 314-329.
Fernandez-Arias, E., K. Schmidt-Hebbel, L. Serven, A. Basci, and T. Edstrand (1996): "World Aid:A New Data Base," manuscript, The World Bank, forthcoming, 1996.
Fershtman, C. and Y. Weiss (1993): "Social Status, Culture and Economic Performance," TheEconomic Journal, 103 (July): 946-959.
Ferson, W. and G. Constantinides (1991): "Habit Persistence and Durability in AggregateConsumption," Journal of Financial Economics, 29, pp 199-240.
Flavin, M. (1981): "The Adjustment of Consumption to Changing Expectations about FutureIncome," Journal ofPolitical Economy, 89, 974-1009.
Frankel, J. (1992): "Measuring International Capital Mobility: A Review," American EconomicReview 82, pp. 197-202.
Friedman, M. (1957): A Theory of the Consumption Function, Princeton: Princeton University Press.Fry, M. (1988:) Money, Interest and Banking in Economic Development. Johns Hopkins
University, Baltimore, Maryland.Gale, W.G. (1995): "The Effects of Pensions on Wealth: A Re-evaluation of Theory and Evidence,"
manuscript, Brookings Institution, June.Gersovitz, M. (1988): "Saving and Development," in H. Chenery and T.N. Srinivasan (eds.):
Handbook of Development Economics, North Holland.Giovannini, A. (1985): "Saving and the Rate of Interest in LDCs," Journal of Development
Economics, Vol. 18, 197-217.Gourinchas, P. and J. Parker (1995): "Consumption Over the Lifecycle," manuscript, Massachusetts
Institute of Technology, November.Group of Ten (1995): "Saving, Investment, and Real Interest Rates," Group of Deputies, October,
1995.Hadjimichael and Ghura (1995): "Public Policies and Private Savings and Investment in Sub-Sahara
Africa: An Empirical Investigation." IMF Working Paper WP/95/19.Hall, R.E. (1978): "Stochastic Implications of the Life-Cycle Hypothesis," Journal of Political
Economy 96, 971-987. (which one)and F. Mishkin (1982): "The Sensitivity of Consumption to Transitory Income: Estimates
from Panel Data on Households," Econometrica 50: 461-8 1.Hamilton, J.D. (1995): Time Series Analysis, Princeton University Press.Hansen, L. (1982): "Large Sample Properties of Generalized Method of Moments Estimators,"
Econometrica, 50, pp 1029-1054.(1983): "Stochastic Consumption, Risk Aversion, and the Temporal Behavior of Asset
Returns," Journal of Political Economy, 91, pp 249-265.and K. Singleton (1982): "Generalized Instrumental Variables Estimation of Nonlinear
Rational Expectations Models," Econometrica, 50, pp 1269-1286.and R. Jagannathan (1991): "Implications of Security Market Data for Models of Dynamic
Economies," Journal of Political Economy, 99 (2) 225-62.

153
and K. Singleton (1983): "Stochastic Consumption, Risk Aversion and the TemporalBehavior of Asset Returns," Journal of Political Economy 91, 249-265.
Haque, N.V. and P. Montiel (1989): "Consumption in Developing Countries: Tests for LiquidityConstraints and Finite Horizons," Review of Economics and Statistics, 71 (3): 408-15.
Hausmann, R. and M. Gavin (1995): "Overcoming Volatility in Latin America," in Inter-AmericanDevelopment Bank: Economic and Social Progress in Latin America, Part Two. JohnsHopkins University Press, Washington, D.C.
Hayashi, F. (1985): "Tests for Liquidity Constraints: A Critical Survey," NBER Working Paper No.1720.
(1987): "Tests for Liquidity Constraints: A Critical Survey and Some New Observations,"in T. Newley (ed.): Advances in Econometrics: Fifth World Congress, vol. 2: 91-120.
Heaton, J. (1993): "The Interaction Between Time-Nonseparable Preferences and TimeAggregation," Econometrica 61, pp 353-386.
Hendershott, P.H. and J. Peek (1989): "Aggregate U.S. Private Saving: Conceptual Measures," inR.E. Lipsey and H.S. Tice: op.cit.
Holloway, T.M. (1989): "Present NIPA Saving Measures: Their Characteristics and Limitations," inR.E. Lipsey and H.S. Tice: op.cit.
Holtz-Eakin, D., W. Newey, and H. Rosen, (1988): "Estimating Vector Autoregressions with PanelData," Econometrica, 56, 1371-95.
(1989): "The Revenues-Expenditures Nexus: Evidence from Local Government Data,"International Economic Review, 30, 415-29.
Honohan, P. (1995) "The Impact of Financial and Fiscal Policies on Saving," manuscript, The WorldBank, April.
and I. Atiyas (1989): "Intersectoral Financial Flows in Developing Countries." PolicyResearch Working Paper 164. The World Bank.
Host-Madsen, P. (1979): "Macroeconomic Accounts: An Overview," IMF Pamphlet Series No. 29,Washington, D.C.
Hsiao, C. (1986): Analysis of Panel Data, (Cambridge: Cambridge University Press).Hu, W. And G.S. Maddala (1995): "Estimation and Prediction Problems in Dynamic Heterogeneous
Panel Data Models," mimeo, The Ohio State University.Hubbard, R.G. and K.L. Judd (1986) "Liquidity Constraints, Fiscal Policy and Consumption,"
Brookings Papers on Economic Activity, 1.IMF (1995): World Economic Outlook 1995. Washington DC: International Monetary Fund.Inter-Secretariat Working Group on National Accounts (1993): System of National Accounts 1993.
Brussels.Jappelli, T. and M. Pagano (1994): "Saving, Growth, and Liquidity Constraints," Quarterly Journal
of Economics 109, 83-109.Kaldor, N. (1957): "A Model of Economic Growth," Economic Journal 57.Karras, G. (1994): "Macroeconomics Effects of Budget Deficits: Further International Evidence,"
Journal of International Money and Finance 13 (2) 190-210.

154
Khadr, A. and K. Schmidt-Hebbel (1989): "A Method for macroeconomic Consistency in Currentand Constant Prices," PRD Working Paper No. 306, The World Bank, Washington, DC.
King, R. G. and R. Levine (1993): "Finance and Growth: Schumpeter Might Be Right," QuarterlyJournal of Economics, Vol. 108, No. 3, 717-738.
(1994): "Capital Fundamentalism, Economic Development, and Economic Growth,"Carnegie-Rochester Conference Series on Public Policy, vol. 40, pp. 259-292.
Kormendi. R.C. (1983): "Government Debt, Government Spending, and Private Sector Behavior,"American Economic Review 73: 994-1010.
Komai, J. (1959): Overcentralization in Economic Administration. Oxford: Oxford University Press.(1980): Economics of Shortage. Amsterdam: North Holland.(1992): The Socialist System. Princeton: Princeton University Press.
Kirnball, M.S. (1990): "Precautionary Saving in the Small and the Large", Econometrica 58: 53-73.and N.G. Mankiw (1994): "Precautionary Saving and the Timing of Taxes," Journal of
Political Economy 97: 863-79.Kotlikoff, L. and L. Summers (1981): "The Role of Intergenerational Transfers in Aggreagte Capital
Accumulation," Journal of Political Economy, 90, 706-3 2.Kreps, D. (1979a): "Dynamic Choice Theory and Dynamic Programming," Econometrica, 47, pp
91-100.(1979b): "Temporal Von Neumann-Morgenstern and Induced Preferences," Journal of
Economic Theory, 20, pp 81-109.Kreps, D. and E. Porteus (1978): "Temporal Resolution of Uncertainty and Dynamic Choice
Theory," Econometrica, 46, pp 185-200._and D. Porteus (1979a): "Dynamic Choice Theory and Dynamic Programiing",
Econometrica 47, 9 1-100.Leiderman, L. and A. Thorne (1996): "The Mexican 1994 Crisis and its Aftermnath: What are the
main Lessons?," presented at the Conference on Private Capital Flows to Emerging Marketsafter the Mexican Crisis, Institute for International Economics and OesterreichischeNationalbank, Vienna.
and M. Blejer (1988) "Modeling and Testing Ricardian Equivalence: A Survey," IMFStaff Papers 35 (1), March.
Levine, R. and D. Renelt (1992): "A Sensitivity Analysis of Cross-Country Growth Regressions,"American Economic Review, 82, 942-63.
Lewis, W.A. (1954): "Economic Development with Unlimited Supplies of Labor," The ManchesterSchool, 22, 139-91.
Lipsey, R.E. and H.S. Tice (eds.) (1989): The Measurement of Saving, Investment, qnd Wealth,NBER Studies in Income and Wealth, vol. 52. NBER, Washington, DC.
Lipton, D., et. al. (1982): "Multiple Shooting in Rational Expectations Models," Econometrica 50,p. 1329-1333.
Lucas, R. (1988): "On the Mechanics of Development Planning," Journal of Monetary Economics22, 3-42.

155
Maddala, G.S. (1991): "To Pool or Not to Pool: That is the Question," Journal of QuantitativeEconomics, 7, 255-264.
Maddison, A. (1992): "A Long-Run Perspective on Saving," Scandinavian Journal of Economics,94, 181-96.
Mankiw N.G., D. Romer and D.N. Weil (1992): "A Contribution to the Empiricis of the EconomicGrowth," Quarterly Journal of Economics, vol. 107, pp. 407-43 7.
Mason, A. (1988): "Saving, Economic Growth, and Demographic Change," Population andDevelopment Review, Vol. 14, No. 1, pp. 113-144.
Masson, P., T. Bayoumi, and H. Samiei (1995): "Saving Behavior in Industrial and DevelopingCountries," manuscript, IMF.
Mc Dermed, A., R.L. Clark, and S.G. Allen (1989): "Pension Wealth, Age-Wealth Profiles, and theDistribution of Net Worth," in R.E. Lipsey and H.S. Tice: op.cit,
McKinnon, R.I. (1973): Money and Capital in Economic Development. Brookings, Washington,D.C.
(1991): The Order of Economic Liberalization: Financial Capital in the Transition to a
Market Economy. Johns Hopkins University Press, Baltimore.Mehra, R. and E. Prescott (1985), "The Equity Premium: A Puzzle," Journal of Monetary
Economics, 10, pp 335-359.Menchik, P. and M. David (1983): "Income Distribution, Lifetime Savings, and Bequests," American
Economic Review, 73, 672-690.Mikesell, R.F. and J.E. Zinser (1973): "The Nature of the Savings Function in Developing Countries:
A Survey of the Theoretical and Empirical Literature," Journal of Economic Literature, 1 1:1-26.
Mintz, J. (1993): "Tax Holidays and Investment," in A. Shah, ed., Fiscal Incentivesfor Investmentand Innovation. Washington DC: The World Bank.
Modigliani, F. (1970): "The Life-Cycle Hypothesis of Saving and Intercountry Differences in theSaving Ratio," in W. Eltis et. al., eds., Induction, Trade and Growth: Essays in Honor of SirRoy Harrod. Oxford: Clarendon Press.
(1992): "Saving in Developing Countries: Income, Growth and Other Factors," PacificBasin Capital Markets Research 3, 23 -3 5.
Modigliani, F. and R. Brumberg (1954): "Utility Analysis and the Consumption Function: anInterpretation of Cross-Section Data," in K.K. Kurihara (ed.): Post-Keynesian Economics,New Brunswick, N.J.: Rutgers University Press.
(1979): "Utility Analysis and the Consumption Function: an Attempt at Integration," inA. Abel (ed.): The Collected Papers of Franco Modigliani, Vol.2, Carnbridge, M.A.; MITPress.
Muellbauer, J. and Murphy (1990): "Is the UK Balance of Payments sustainable?," Economic Policy11: 345-83.
Mwega, F. M. (1995) "Private Saving Behaviour in Less Developed Countries and Beyond: Is Sub-Sahara Africa Different?" Paper presented at the International Economic Association WorldCongress, Tunis, December 18-22.

156
Nehru, V., E. Swanson and V. Dubey (1995): "A New Database on Human Capital Stock inDeveloping and Industrial Countries: Sources, Methodology and Results," Journal ofDevelopment Economics 46(2), 379-401.
Obstfeld, M. (1986): "Capital Mobility in the World Economy: Theory and Measurement," Carnegie-Rochester conference Series on Public Policy, Amsterdam: North-Holland.
(1994): "International Capital Mobility in the 1990s," in Understanding Independence:The Macroeconomics of the Open Economy, Princeton Unversity Press.
(1995): "Effects of Foreign Resource Inflows on Saving: A Methodological Overview,"manuscript, The World Bank.
OECD (1994): "Taxation and Household Savings," (Organization for Economic Cooperation andDevelopment, Paris,).
Ogaki, M., J. Ostry, and C. M. Reinhart (1995): "Saving Behavior in Low- and Middle-IncomeDeveloping Countries: A Comparison," forthcoming in IMF Staff Papers.
Ostry, J. and C. Reinhart (1992): "Private saving and Terms of Trade Shocks: Evidence fromDeveloping Countries," IMF Staff Papers 39, 495-517.
Pasinetti, L. (1962): "Rate of Profit and Income Distribution in Relation to the Rate of EconomicGrowth," Review of Economic Studies, 29, 267-79.
Paxson, C. (1988): "Household Savings in Thailand: Responses to Income Shocks," DiscussionPaper No. 137, Princeton University.
(1992): "Using Weather Variability to estimate the Response of Saving to TransitoryIncome in Thailand," American Economic Review 82, 15-33.
(1995): "Saving and Growth: Evidence from Micro Data," manuscript.Pesaran, M.H. and R. Smith (1995): "Estimating Long-Run Relationships From Dynamic
Heterogeneous Panels," Journal of Econometrics 68, 79-113.Pfeffermann,G., and A. Madarassy (1993): "Trends in Private Investment in Developing Countries,"
IFC Discussion Papers No. 16, Washington, DC.Phelps, E. (1962): "The New View of Investment: A Neoclassical Analysis," Quarterly Journal of
Economics, 76, 548-567.Poterba, J. (1995): International Comparisons of Household Saving. Chicago: Chicago University
Press.Quandt, R. E. (1989): "Disequilibrium econometrics for centrally planned economies," in Davis and
Charemza (eds.), Models ofDisequilibrium and Shortage in Centrally Planned Economies,London and New York: Chapman and Hall.
Rebelo, S. (1992): "Growth in Open Economies," Carnegie-Rochester Conference Series on PublicPolicy, 36, pp 5-56.
, and C. Vegh (1995aa): "Real Effects of Exchange-Rate-Based Stabilization: An Analysisof Competing Theories," manuscript.
Reinhart, C., and C. Vegh (1995b): "Nominal Interest Rates, Consumption Booms, and Lack ofCredibility: a Quantitative Examination", Journal of Development Economics 46, 357-378.
Reynolds, C.W. and W. Camard (1989): "Flow-of-Funds and National Income and Product AccountSavings Estimates in Latin America," in R.E. Lipsey and H.S. Tice: op.cit.

157
Rodriguez, C.A. (1982): "The Argentine Stabilization Plan of December 20th," World Development10, pp. 801-811.
Rodrik, D. (1994): "Getting Interventions Right: How South Korea and Taiwan Grew Rich," NBERWorking Paper 4964.
Romer, P. (1986): "Increasing Returns and Long-Run Growth," Journal of Political Economy, 4,1002-17.
(1987): "Crazy Explanations for the Productivity Slowdown," NBER MacroeconomicsAnnual.
Rossi, N. (1988): "Government Spending, the Real Interest Rate, and the Behavior of Liquidity-Constrained Consumers in Developing Countries," IMF Staff Papers, pp. 104-140.
Ryder, H. and G. Heal (1973): "Optimal Growth with Intertemporally Dependent Preferences,"Review of Economic Studies 50, p. 1-32.
Samwick, A. A. (1995): "The Limited Offset Between Pension Wealth and Other Private Wealth:Implications of Buffer-Stock Saving," manuscript, Dartmouth College, November.
Schechtman, J. (1976): "An Income Fluctuation Problem," Journal of Economic Theory 12, 218-41.Schectman, J. and V. Escudero (1977): "Some Results on 'An Income Fluctuation Problem ,"
Journal of Economic Theory 16, 151-66.Schmidt-Hebbel, K. (1994): "Fiscal Adjustment and Growth: In and Out of Africa," paper presented
at the AERC Plenary, Nairobi, May.(1995): "Colombia's Pension Reform: Fiscal and Macroeconomic Effects," World Bank
Discussion Papers 314.and L. Serven (1994): "Fiscal Policy in Classical and Keynesian Open Economies," WPS
Working Paper 1299. The World Bank.and L. Serven (1995a): "Dynamic Response to External Shocks in Classical and Keynesian
Open Economies," in D. Currie and D. Vines, eds., North-South Linkages and InternationalMacroeconomic Policy. Cambridge University Press.
and L. Serven (1995b): "Saving and Income Distribution," manuscript, The World Bank., L. Serven and A. Solimano (1996): "Saving and Investment: Paradigms, Puzzles,
Policies," World BankResearch Observer, forthcoming.________ ,S. B. Webb and G. Corsetti(1992): "Household Saving in Developing Countries: First
Cross-Country Evidence," The World Bank Economic Review, Vol. 6, 529-47.Seater, J. (1993): "Ricardian Equivalence," Journal of Economic Literature 31, 142-190.Shaw, E.S. (1973): Financial Deepening in Economic Development. Oxkford University Press,
Oxford.Skinner, J. (1988): "Risky Income, Life-Cycle Consumption, and Precautionary Saving," Journal of
Monetary Economics 22, 237-55.Snyder, D. (1974): "Econometric Studies on Household Saving Behavior in Developing Countries:
A Survey," The Journal of Development Studies, Vol. 10, No. 2, pp. 139-153.Srinivasan, T.N. (1993): "Saving in the Development Process," in J.H. Gapinski (ed.): The
Economics of Saving, Kluwer Academic Publishers, Boston.

158
(1994): "Data Base for Development Analysis: An Overview," Journal of DevelopmentAnalysis, 44 (1): 3-27.
Stiglitz, J., and A. Weiss (1981): "Credit Rationing in Markets with Imperfect Information," TheAmerican Economic Review, Vol. 71, No. 3, pp. 393-410.
Summers, R. and A. Heston (1990): "The Penn World Table (Mark 5): An Expanded Set ofInternational Comparisons, 1950-1988," Quarterly Journal of Economics, 327-68, May.
Talvi, E. (1994): "Exchange-Rate Based Stabilization with Endogenous Fiscal Response," mimeo(University of Chicago).
Tarr, D. (1994): "The Terms of Trade Effects of Moving to World Prices on Countries of the FormerSoviet Union," Journal of Comparative Economics, Vol. 18, No. 1.
Taylor, A. (1994): "Domestic Saving and Capital Flows Reconsidered," NBER Working Paper 4892.Udry, C. (1994): "Risk and Insurance in a Rural Credit Market: An Empirical Investigation in
Northern Nigeria," Review of Economic Studies 61, 495-526.United Nations (1979): NationalAccountingPractices in Seventy Countries. New York.Uzawa, H. (1965): "Optimal Technical Change in an Aggregative Model of Economic Growth,"
International Economic Review 6, p. 18-31.Vahid F. and R.F. Engle (1993): "Common Trends and Common Cycles," Journal of Applied
Econometrics, vol. 8, pp. 341-360.Visaria, P. (1980): "Poverty and Living Standards in Asia: An Overview of the Main Results and
Lessons of Selected Household Surveys," Living Standards Measurement Study WorkingPaper 2, The World Bank.
Weil, P. (1989): "Equity Premium and Risk Free Rate Puzzles," Journal of Monetary Economics,24, pp 401-421.
_ (1990): "Nonexpected Utility in Macroeconomics," Quarterly Journal of Economics,105, pp 29-42._ (1994): "The Saving of the Elderly in Micro and Macro Data," The Quarterly Journal of
Economics, 55-81.(1995): "Prudence, Heterogeneity and Borrowing Constraints," manuscript, The World
Bank, November.Welfe, A. (1989): "Saving and Consumption in the Centrally Planned Economy," in C. Davis and W.
Charemza (eds). Models of Disequilibrium and Shortage In Centrally Planned Economies,Chapman and Hall Publishers, London and New York.
White, H. (1982): "Instrumental Variables Regression with Independent Observations,"Econometrica, 50, 483-499.
Wilson, J.F., J.L. Freund, F.O. Yohn, and W. Lederer (1989): "Measuring Household Saving: RecentExperience from the Flow-of-Funds Perspective," in R.E. Lipsey and H.S. Tice: op.cit.
World Bank (1994): Averting the Old Age Crisis: Policies to Protect the Old and Promote Growth.Oxford University Press.
Young, A. (1994): "Lessons from the East-Asian NICs: a Contrarian View," European EconomicReview 38, 964-73.

159
(1995): "The Tyranny of Numbers: Confronting the Statistical Realities of the East AsianGrowth Experience," Quarterly Journal of Economics 110: 641-80.
Zeldes, S. (1989): "Consumption and Liquidity Constraints: an Empirical Investigation,' Journal ofPolitical Economy 97, 305-346.
Zou, H. (1993): "The Spirit of Capitalism, Savings, and Growth," manuscript. The World Bank.


lDistributors of ChINA GnEECE ITALY NORWAY SINGAPORE, TAIWAN, VanOie-oenEdrhtnrTechniqChina Financial A Econornic PapasohiouiS.A. Licosa ComrnrmssionaSansoni SPA laroesrn Information Center MtYANIIAR. BRUNEI Ch. de Lacueu 41W orld Bank PlibshrnHouse 35, Stowrnara SI, Via Dunca Di Calabria. ltl BRnk Derarment Analgte Pubishing Asia CH19O7 Bte4ay
B..8 Da Fo Si Dong Je 106 82 Athens Casolta Poslale 552 PO. Box 6125 Eleerslad PAsIc FIP Lld Tel (021) 943 2673Publicationis Beq,ng Tel It) 364-1826 50125 Firenze N 0602 0slo6 41 Kallang Pudding [head N04-03 Fax: (021) 943 3605Pri,-rssnlid, cfrdit tc? itJIIIvJly Tel (1) 333 8257 Fax: (1) 364 8254 Tel- (55) 645-415 Tel (22)57-3300 Golden heel Buildingfromic coll)lt I to r ttistry Fax, (1( 4017365 Faa: (55) 641-257 Fax (22) 68-1901 Singapore 349316 TANZANIA
frnrlll COlllIfIy frI cottIIfI-y. N~~~~~~~~ONG KONG, MACAO Tel (65) 741-5166 Oxord Universidy PrasnCoanstit yoti loctal distrilbiltor COLOMBIA Asia 213000Ld JAMAICA PAKISTAN Fax (65) 742-9386 Maitaba Streetbrforc rplacintg ana oi-ldr. Inloenlace tIda Sales 6 Circutation Deparlmnt tan radle Publishers Ltd Mrza ook Agecy e-mal Ashgale@asianconnrctom PO Box 5299
Apadadno Aero34270 Seabird H-ouse, ued 1101-07 206 Old Hope Flnad 65, Shahrah-e-tuaid-e-Azam DaresSataamBogc D E 22 28 Wiyrrharn Strele Cenlral Kingston 6 PO Box No. 729 SLOVAK REPUBLIC Tel (SI)29209
ALBANIA Tel t1)285-2798 HnrorKong Tel 809-q27-2005 Lahore 54000 S-vard GTG Ltd Fax (51)46822Adrion Ltd Fax (1j2852798 Tel 852 2530-1409 ran 809-977-0243 Tel (42) 7353601 Krupinska 4Pedat nexhrhpl St, Fax 852 2526-t107 Fax: (42) 7585283 PO Box 152 THAILANDPafl 9. Shk l Ap. 4 COTE 0100D0REURL hlpYw,,owsatesoliasia2000comhk JAPAN 8529 9BrahslavaS Cenlral Bnoks DistributixnFrana tCentre d Eddion el de Diffusir Eastern Baoot Semice Oxtord University Ponss Tel (7) 839472 306 SCeom RoadTel (42) 274 t9. 221 72 Alhicaines (CEDA) HUNGARY Hongo 3-Chomne, 51Bangatore Ton Fax (7)839485 BangkokFax (42) 274 19 04 8 P 541 Foundation for Markel Burkyo-ku t13 Sharae Faisal Tel 2) 235-540D
Abidjan 04 Ftaleau Economy Tokyo PO Box 13033 SOUTH AFRICA, BOTSWANA Fax: (2)237-8321ARGENTINA Tel 225-24-6510 Domova Ult 17-t19 Tel (03)3018-0086 Karach,-75350 Forsnngie titsOtina delLibron lemadonal Fax 225-25-0567 H-til7 Budapest Fax (03) 38t8-0864 Tel (21) 446307 Oxford Universty Prness TRINIDAD 8 TOBAGO, JAM.Av Cordota 1877 Tel 36 1 2042951 or UnL hdtritwwleiaekkoameorgpl-sn-ehs Fax (21)454-7640 SouthernAtrca Systemaics Sludies Urndtt20 BrenosAirrs CYPRUS 3612042948 PO Boo 1141 #9 Was StreetTel (t(8l5-8156 Center ot Appied Research Fan 361 2042953 KENYA PERU CapyTown 000 CarepeFan (I) 8S 8354 Cyprus College Alnca Book Senice ( A ) Ltd Editmiat1 Desnrmlto SA Tel- (21) 45-7266 Trinioard West Indies
6. Diogees Street.Engrmi INDIA Ouraran horse Mtarrgn Street Apadado 3024 Fax: (21)457265 Tel: 809-662 5654AUSTRALIA, nil, PArUA NEW GUtNEA, PO Box 2006 Altied Pubtishers Lid PO Box 45245 Limo 1 Fax 909-662 5654SOLOMON ISLANDS, VANUATU, AND Nicksia 751 Mouirn nnad Nairobi TPl (I4)785380 For subscrplon ordersoWESTERN SAMOA Tel 244-1730 Madras- 600002 Tel (2)23641 Fax: (1t4)286628 1toernarioal SubscrtprionSeg rce UGANDAD A oloromation Services Faa 246 205t Tel 144) 852-3938 Far. (2) 330272 Po Box 41095 Gusoro Ltd648 Whilehorse Road Fax: (44)852-0049 PHILIPPINES Craighat Madhvan BuikrlgMitcham 3132 CZECH REPUBLIC KOREA, REPUBLIC OF International Booksnoure Cenler tom. Johannentbrurg 2024 PO Boo 9997Viclon"a Nalional tnlomiation Center INDONERtA Dae(on Trading Co. LId Sorle 720, Cdyland to Tel (11) 880-1448 Plot 16t4 Jinja RdTel. (6t) 39210 7777 pnde)mna, Kon.iktska 5 Pt Indcra Limited P.O. Boa 34 Condomirnium Tower 2 Fax. (t) 880 6248 KampataFax (61) 392107788 CS - 113 57 Prague t Jalan Boroudur 20 Yeoeida H V dela Costa. comer TedFax: (41) 254763URL htlpJlwwwedairdecrom anu Tel: (2)2422-9433 PO Boxo ot Seonul Valero St SPAIN
Fax (2) 2422-1484 Jakarta 10320 Tel (2) 785 1631/4 Makalt, Metro Manila Mund -Prenna Lbwms, S.A. UMTED KINGDOMAUSTRIA URLt tinpYwa.nisrcz Tel (21)390-4290 Fax (2) 784-0315 Tel (2) 8179676 CasIello37 Microinfo LidGerold and Co Fax (21)421-4289 rax (2) 817-t741 28001 Madrid PO Box 3Graben 31 DENMARK MALAYSIA Tel (1)431-3399 Allon, Hampshire GU34 2PGA ttOl Wien Samlundsiteratlur IRAN Univerilty of Malaya Cooperatie POLAND Fax (t)5753998 EnglandTel. (I) 533 50 14 0 nosenoems AId 11 Kowkah Pubitshoes Bokshop, Lmoded toternalronal Publishing Service hpTy wwwasai esltmprensa Tel (1420) B6848lax (t) 512-47-31-29 DK1-970 Fredenrksberg C PO Box 19575511 PO Box 1127 Ul Peksa 31037 Fax (1420)698B3
Tel. (31) 351942 Tetiran Jalan Parudi Banu 00-577 Waroawa Miindi Preiisa BarcelonaBANGLADESH Fax (31)357822 Tel (2t1) 2 3723 59700 Kuala Lumpur Tel (2) 628-6089 Cosel deCenlt 391 ZAMBIAWfm Iundosnes Developmeno FaR 98 (21) 258-3723 Tel (3) 756-5060 Fax- (7) 621-7255 09009 Barceoena Urrversniy Irkshop
Assislance Society (MIDAS) EGYPT. ARAB REPUBLIC OF Forx (3) 755-4424 T t3o 4RF 30Sl Great ERst Road CempusHouse 5, Road 16 AC Ahram Ketab Saia Co Prtrhfshers PORTUGAL Fax (3) 487-7659 PO Box 32379Duanionnd PVArpa AJ Galaa Sheel Kialed Eslamboli Ane MEXICO L,,rnna Porrrgal LusakaDhaka 1209 Cairt 61h Sheet INIOTEC nua Do Canno 70-74 SRI LANKA, TIlE MALDIVES Tel. (1) 213221 Ext 482Tel 12) 126427 Tel (2) 578 6083 Kusheh Delnsrorz No 8 Apartado Postal 22 860 1200 Lis-on Lnke House BookstopFaa (2(811198 Far: (2)578-6833 Tehran 14060 Tlalpan, Tel (t) 347-4982 PO Box 244 ZIMBABWE
Tel- 8717B19orB7t6t04 MexicoDF Far (1)347 0264 100, Sir ChillampylamA Langman Ziaebre (PIe )LtdBELGIUM The Middle East Obsener Fax 8962479 Tel (5)606-001t Gardner Mawalha Tourie Road, ArctbennirJean De Lannny 4 tl Shere Street Far (50 606-0306 ROMANIA Colombo 2 PO. Box ST125Av du Roa 202 Cairo IRELAND Comprani De Librarn Bucuesi S A Tel (I) 32t05 Southelon1060 Bnussels Tel. (2) 393-9732 Govemmenot SirpplesAgency NETHERLANDS Str LipscArino 26, sector 3 Fax: (I) 432104 HarareTel (2) 538-5169 Fax (2) 393-9732 oirg an ISoalhatir De Lrndeboorm/tnOr-Pubtikahles Buicharest Tel (4)62t66t7Fax (2) 538-0841 4-5 Harcne Road PO. Box 202 Tel (1t6139645 SWEDEN Fax: (4) 621870
FINLAND Dublin 2 7400 AE Haaksbergen Fax (1) 3t2 4000 Fritbes Customer SererceBRAZIL Akateerinen Kir)akauppa Tel (t) 461-3111 Tel (53) 574-r004 Regenenggalon 12Publicacoes Tecnicas Internacionais PO Box 23 Fax (1) 475-2670 Fax (53) 572-0296 RUSSIAN FEDERATION S 106 47 Sltckholm
Lida FIN-00371 Helsinki tsdatelislo Ves Mir Tel. (8)6900090Rua Peixoo Gomide, 209 Tel. (0)12141 ISRAEL NEW ZEALAND 9a. Kolpachniy Pereulok Fax (8)2ti477701409 Sno Pauto SP Fax (0) 121-4441 Yoznool Literaoure Ltd E8SCO NZ LId Moscow 101831Tel (tt)259-6644 UnL hnpliboolketcuineltfilakal PO Boa 56055 Pnvate Mal Bag 99914 Tel (95)9t78749 WeennrgrensWilams ABFax (l1)2586990 Tel Aviv 61560 New Market Fax (95) 917 0259 P 0. Box 1305
FRANCE Tel. (3) 5285-397 Auckland S 171 25 SolnaCANADA World Bank Pubticarions Fax (3) 5285-3q7 Tel (9) 524-8119 SAUDI ARABIA, QATAR Tel (80 705-97-50Renoul Pubisir gCo Lld 66. aventle dIna Fax (90) 524-8607 Jar/ Book Store Fax (8)27-00-711294 Algoma Road 75116 Pads R O.Y Internalional PO Box 3196OMaws, Ontario K6B 3W8 Tel. (t) 40-69-30-56E57 PO Boo 13056 NtGERIA Riyadh 11471 SWITZERLANDTel 6t3-741-4333 Fax ()I409-6930-68 Tel Avr 61t130 Urivernsity Press Linited Tel (1) 477-3140 Librarde PayrFax 613-741-5439 Tel: (3) 5461423 Three Crowns Building Jedcho Fan (t) 477-2940 Service Insltutionnel
GERMANY Fax (3) 5461442 Pr/nate Mau Bag 5095 Cotes-de Monlbenon 30UNO-Vertag tbadan 1002 LausannePoppednler CAee 55 Palestinian Authodly/MiddIc East Tel (22) 41-1356 Tel. (021)-341-322953115 Bonn ndex lntormalionSenmces Fax (22)412056 Fax (021)341-3235Tel (228)212940 POB 19502JerusalemFax. t228) 217492 Tel. (2) 271219


Recent World Bank Discussion Papers (continued)
No. 321 Clearance and Settlement Systemsfor Securities: Critical Designt Choices in Emerging Market Economies. Jeff Stehm.
No. 322 Selecting Development Projectsfor the World Bank. Jean Baneth
No. 323 Evaluating Public Spending: A Frameworkfor Public Expeniditure Reviews. Sanjay Pradhan
No. 324 The Bangladesh Rural Advancement Committee's Credit Programs: Performance and Sustainability. Shahidur R.Khandker and Baqui Khali]y
No. 325 Institutional and Entrepreneu{rial Leadership in the Brazilian Science and Technology Sector:Setting a New AgendaEdited by Lauritz Holm-Nielsen, Michael Crawford, and Alcyone Saliba
No. 326 The East Asian Miracle anid Information Technology: Strategic Management of Technological Learning. Nagy Hanna,Sandor Boyson, and Shakuntala Gunaratne
No. 327 Agricultural Reform in Russia: A Viewfrom the Farm Level. Karen Brooks, Elmira Krylatykh, Zvi Lerman,Aleksandr Petrikov, and Vasilii Uzun
No. 328 Insuring Sovereign Debt Againist Default. David F. Babbel
No. 329 Managing Transboundary Stocks of Small Pelagic Fish: Problems and Options. Max Aguero and Exequiel Gonzalez
No. 330 China: Issues and Options itn Greenhouse Gas Emissionts Control. Edited by Todd M. Johnson, Junfeng Li,Zhongxiao Jiang, and Robert P. Taylor
No. 331 Case Studies in War-to-Peace Tranisition: The Demobilization and Reintegration of Ex-Combatants in Ethiopia, Namibia,and Uganda. Nat J. Colletta, Markus Kostner, Ingo Wiederhofer, with the assistance of Emilio Mondo, TaimiSitari, and Tadesse A. Woldu
No. 332 Power Supply in Developing Counttries: Will Reform Work? Edited by John E. Besant-Jones
No. 333 Participation in Practice: The Experience of the World Bank and Other Stakehiolders. Edited by Jennifer Rietbergen-McCracken
No. 334 Managing Price Risk in the Pakistan Wheat Market. Rashid Faruqee and Jonathan R. Coleman
No. 335 Policy Optionsfor Reformt of Chiinese State-Owned Enterprises. Edited by Harry G. Broadman
No. 336 Targeted Credit Programis and Rural Poverty in Bangladesh. Shahidur Khandker and Osman H. Chowdhury
No. 337 The Role of Family Planniing and Targeted Credit Programs in Demographic Clhange in Bangladesh. Shahidur R.Khandker and M. Abdul Latif
No. 338 Cost Shiaring in the Social Sectors of Sub-Saharan Africa: Impact on the Poor. Arvil Van Adams and TeresaHartnett
No. 339 Puiblic and Private Roles in HealthI: Tlheory and Financing Patterns. 17hilip Musgrove
No. 340 Developing the Nonfarm Sector in BangladeshI: Lessonsfrom Othier Asian Countries. Shahid Yusuf and PraveenKumar
No. 341 Beyond Privatization: Thze Second Wave of Telecommunicationis Reforms in Mexwco. Bjorn Wellenius and GregoryStaple
No. 342 Ecoionomic Integrationi and Trade Liberalizationi in Southzerni Africa: 1b There a Rolefor South Africa? Merle Holden
No. 343 Finianicing Private Inifrastructure in Developing Counltries. David Ferreira and Karman Khatami
No. 344 Transport and tIte Village: Findingsfrom Africani Village-Level Travcl and Transport Survleys and Related Studies. lanBarwell
No. 345 Ont the Road to EU Accession: Finaincial Sector Development in Central Euirope. Michael S. Borish, Wei Ding, andMichel Noel
No. 346 Struictural Aspects of Manufacturing in Suib-Salharai Africa: Findin,lsfirorn a Seven Country Enterprise Survey.Tyler Biggs and Pradeep Srivastava
No. 347 HealthI Reform in Africa: Lessons from Sierra Leonte. Bruce Siegel, David Peters, and Sheku Kamara
No. 348 Did External Barriers Cauise thze Marginalization of Sub-Saharani Africa in World Trade? Azita AmjadiUlrich Reincke, and Alexander J. Yeats
No. 349 Surveillanec of Agricultuiral Price and Trade Policy in Latin American dutring Major Policy Reforms. Alberto Valdes
No. 350 Wlho Benefits from Puiblic Eduication Spending in Malawi: Results f.om the Recent Education Reform. FlorenciaCastro-Leal
No. 351 From Universal Food Subsidies to a Self-Targeted Program: A Case Stuidy in Tuinisiant Reform. Laura Tuck and KathyLindert
No. 352 Chiina's Urban Transport Development Strategy: Proccedinigs of a Symposium in Beijitg, November 8-10, 1995.Stephen Stares and Liu Zhi
No. 353 Telecommtunications Policies for Suib-Sahlaran Africa, Mohammad .\. Mustafa, Bruce Laidlaw, and Mark Brand

THE WORLD BANK
HEADQUARTERS
1818 H Street, N.W.\,'ashington, D.C. 20433 USA
Telephone: 202.477.1234
Facsimile: 202.477.6391
Telex: MCI 64145 WORLDBANKMCI 248423 WORLDBANK
Cable Address: INTBAFRAD)WUASHINGTONDC
World Wide Web: ttp://wNwwv.worldbank.org/
F-mail: [email protected]
EUROPEAN OFFICE
66, avenue d'1ena75116 Paris, France
Telephone: 1. 40.69.30.00
Facsimile: 1. 40.69.30.66
Telex: 640651
TOKYO OFFICE
F'ukoku Seimei Bldg., IOF2-2-2, Uchisaiwai-choChivoda-ku,Tokyo 100,Japan
Telephone: 3. 3597.6650
Facsimile: 3. 3597.6695
Telex: 26838
ISBN 0-8213-3852-8