published43.pdf - GSU Physics & Astronomy
26
The Solar Neighborhood. XLIII. Discovery of New Nearby Stars with μ<0 18 yr -1 (TINYMO Sample) Adric R. Riedel 1 , Michele L. Silverstein 2 , Todd J. Henry 3 , Wei-Chun Jao 2 , Jennifer G. Winters 4 , John P. Subasavage 5 , Lison Malo 6 , and Nigel C. Hambly 7 1 Space Telescope Science Institute, Baltimore, MD 21218, USA; [email protected] 2 Physics and Astronomy Department, Georgia State University, Atlanta, GA 30302, USA 3 RECONS Institute, Chambersburg, PA, USA 4 Harvard-Smithsonian Center for Astrophysics, Cambridge, MA 02138, USA 5 US Naval Observatory Flagstaff Station, Flagstaff, AZ 86005, USA 6 Canada–France–Hawaii Telescope, Kamuela, HI 96743, USA 7 Institute for Astronomy, University of Edinburgh, Blackford Hill, Edinburgh, EH9 3HJ, Scotland, UK Received 2018 April 23; accepted 2018 May 22; published 2018 July 12 Abstract We have conducted a novel search of most of the southern sky for nearby red dwarfs having low proper motions, with specific emphasis on those with μ<0 18 yr −1 , the lower cutoff of Luyten’s classic proper-motion catalog. We used a tightly constrained search of the SuperCOSMOS database and a suite of photometric distance relations for photographic BRI and 2MASS JHK s magnitudes to estimate distances to more than 14 million red dwarf candidates. Here we discuss 29 stars in 26 systems estimated to be within 25 pc, all of which have μ<0 18 yr −1 , that we have investigated using milliarcsecond astrometry, VRI photometry, and low-resolution spectroscopy. In total, we present the first parallaxes of 20 star systems, 9 of which are within 25 pc. We have additionally identified 14 young M dwarfs, of which 3 are new members of the nearby young moving groups, and 72 new giants, including two new carbon stars. We also present the entire catalog of 1215 sources we have identified by this means. Key words: astrometry – stars: distances – stars: low-mass – stars: pre-main sequence – surveys – techniques: spectroscopic Supporting material: machine-readable table 1. Introduction The solar neighborhood is the best laboratory for studying the Galaxy in which we live. The optimal place to make a volume-limited study of stars is nearby, where the very faintest stellar and substellar objects are easiest to detect and measure. Nearby binary systems are excellent targets for dynamical mass determination; they are resolvable with smaller orbits and shorter orbital periods than their more distant counterparts. Planetary-mass objects are brighter and have larger angular separations for the same linear separation when they are closer. Most surveys to reveal the Sun’s nearest neighbors focus on detecting stars exhibiting high proper motions, μ. Such surveys identify two categories of stars: disk stars that are close enough that their modest Galactic orbital motion yields an apparent angular motion above the search threshold, and more distant stars with much higher intrinsic motions, e.g., subdwarfs and halo stars. This property of large proper motion has served nearby star research well from the very beginning, forming at least part of the decisions of Bessel (1838) and Henderson (1839) to observe 61 Cygni and Alpha Centauri (respectively) for the first parallaxes. These searches have continued on into the present day, encompassing everything from historical efforts like the Luyten Half Second catalog (Luyten 1957, 1979) to recent efforts like LSPM-North (Lépine & Shara 2005) and the Research Consortium On Nearby Stars (RECONS) group’s own work (e.g., Henry et al. 2004; Subasavage et al. 2005a, 2005b; Finch et al. 2007; Boyd et al. 2011a, 2011b). These searches have yielded thousands of stars that are candidates for stars within 25 pc, the horizon adopted by the Catalog of Nearby Stars (Gliese & Jahreiß, 1991) and NStars (Backman et al. 2001) compendia. Nearly all known nearby stars have high proper motions. An analysis of the current RECONS 10 pc sample 8 to explore the realm of low-μ nearby stars is revealing. Of the 259 systems (not including the Sun) within 10 pc as of 2012 January 01, 133 (52%) have μ1 00 yr −1 , 88 (35%) have 1 00 yr −1 >μ0 50 yr −1 , and 32 (13%) have 0 50 yr −1 >μ0 18 yr −1 . Only two stars, less than 1% of the total sample, have μ<0 18 yr −1 : GJ 566 AB (spectral type G8V, V=4.67 (Høg et al. 2000), μ=0 169 yr −1 ) and LSPMJ0330+5413 (an M dwarf with V∼16, μ= 0 150 yr −1 ; Lépine & Shara 2005). There are reasons to suspect that a small but significant population of nearby, very low-proper-motion stars have been overlooked. The limits of the proper-motion samples set above are based on historical precedent. In particular, the value of 0 18 yr −1 as the lowest interesting proper motion, used by RECONS’s other survey samples (e.g., Winters et al. 2017) as its lower limit, comes from the influential surveys of Luyten (Luyten Palomar, Luyten Bruce, Luyten Two Tenths, New Luyten Two Tenths) and Giclas (Southern survey). Those studies were themselves influenced by the work of the Royal Greenwich Observatory, particularly Thackeray (1917) and Dyson (1917), the latter of which suggests that Greenwich set their 0 2 yr −1 limit based on calculations that suggested only one-eighth of all nearby stars (<20 pc) should have lower The Astronomical Journal, 156:49 (26pp), 2018 August https://doi.org/10.3847/1538-3881/aaca33 © 2018. The American Astronomical Society. All rights reserved. 8 See Henry et al. (2006) for discussion of the definition of a RECONS 10 pc system and http://www.recons.org for updated statistics. 1
-
Upload
khangminh22 -
Category
Documents
-
view
1 -
download
0
Transcript of published43.pdf - GSU Physics & Astronomy
The Solar Neighborhood. XLIII. Discovery of New Nearby Stars with μ<0 18yr−1
(TINYMO Sample)
Adric R. Riedel1 , Michele L. Silverstein2 , Todd J. Henry3, Wei-Chun Jao2 , Jennifer G. Winters4 , John P. Subasavage5 ,Lison Malo6, and Nigel C. Hambly7
1 Space Telescope Science Institute, Baltimore, MD 21218, USA; [email protected] Physics and Astronomy Department, Georgia State University, Atlanta, GA 30302, USA
3 RECONS Institute, Chambersburg, PA, USA4 Harvard-Smithsonian Center for Astrophysics, Cambridge, MA 02138, USA
5 US Naval Observatory Flagstaff Station, Flagstaff, AZ 86005, USA6 Canada–France–Hawaii Telescope, Kamuela, HI 96743, USA
7 Institute for Astronomy, University of Edinburgh, Blackford Hill, Edinburgh, EH9 3HJ, Scotland, UKReceived 2018 April 23; accepted 2018 May 22; published 2018 July 12
Abstract
We have conducted a novel search of most of the southern sky for nearby red dwarfs having low proper motions,with specific emphasis on those with μ<0 18 yr−1, the lower cutoff of Luyten’s classic proper-motion catalog.We used a tightly constrained search of the SuperCOSMOS database and a suite of photometric distance relationsfor photographic BRI and 2MASS JHKs magnitudes to estimate distances to more than 14 million red dwarfcandidates. Here we discuss 29 stars in 26 systems estimated to be within 25 pc, all of which have μ<0 18 yr−1,that we have investigated using milliarcsecond astrometry, VRI photometry, and low-resolution spectroscopy. Intotal, we present the first parallaxes of 20 star systems, 9 of which are within 25 pc. We have additionally identified14 young M dwarfs, of which 3 are new members of the nearby young moving groups, and 72 new giants,including two new carbon stars. We also present the entire catalog of 1215 sources we have identified by thismeans.
Key words: astrometry – stars: distances – stars: low-mass – stars: pre-main sequence – surveys – techniques:spectroscopic
Supporting material: machine-readable table
1. Introduction
The solar neighborhood is the best laboratory for studyingthe Galaxy in which we live. The optimal place to make avolume-limited study of stars is nearby, where the very fainteststellar and substellar objects are easiest to detect and measure.Nearby binary systems are excellent targets for dynamical massdetermination; they are resolvable with smaller orbits andshorter orbital periods than their more distant counterparts.Planetary-mass objects are brighter and have larger angularseparations for the same linear separation when they are closer.
Most surveys to reveal the Sun’s nearest neighbors focus ondetecting stars exhibiting high proper motions, μ. Such surveysidentify two categories of stars: disk stars that are close enoughthat their modest Galactic orbital motion yields an apparentangular motion above the search threshold, and more distantstars with much higher intrinsic motions, e.g., subdwarfs andhalo stars. This property of large proper motion has servednearby star research well from the very beginning, forming atleast part of the decisions of Bessel (1838) and Henderson(1839) to observe 61 Cygni and Alpha Centauri (respectively)for the first parallaxes. These searches have continued on into thepresent day, encompassing everything from historical efforts likethe Luyten Half Second catalog (Luyten 1957, 1979) to recentefforts like LSPM-North (Lépine & Shara 2005) and theResearch Consortium On Nearby Stars (RECONS) group’s ownwork (e.g., Henry et al. 2004; Subasavage et al. 2005a, 2005b;Finch et al. 2007; Boyd et al. 2011a, 2011b). These searcheshave yielded thousands of stars that are candidates for starswithin 25 pc, the horizon adopted by the Catalog of Nearby
Stars (Gliese & Jahreiß, 1991) and NStars (Backman et al. 2001)compendia.Nearly all known nearby stars have high proper motions. An
analysis of the current RECONS 10 pc sample8 to explore therealm of low-μ nearby stars is revealing. Of the 259 systems (notincluding the Sun) within 10 pc as of 2012 January 01, 133 (52%)have μ�1 00 yr−1, 88 (35%) have 1 00 yr−1>μ�0 50 yr−1,and 32 (13%) have 0 50 yr−1>μ�0 18 yr−1. Only two stars,less than 1% of the total sample, have μ<0 18 yr−1: GJ 566 AB(spectral type G8V, V=4.67 (Høg et al. 2000), μ=0 169 yr−1)and LSPMJ0330+5413 (an M dwarf with V∼16, μ=0 150 yr−1; Lépine & Shara 2005).There are reasons to suspect that a small but significant
population of nearby, very low-proper-motion stars have beenoverlooked. The limits of the proper-motion samples set aboveare based on historical precedent. In particular, the value of0 18 yr−1 as the lowest interesting proper motion, used byRECONS’s other survey samples (e.g., Winters et al. 2017) asits lower limit, comes from the influential surveys of Luyten(Luyten Palomar, Luyten Bruce, Luyten Two Tenths, NewLuyten Two Tenths) and Giclas (Southern survey). Thosestudies were themselves influenced by the work of the RoyalGreenwich Observatory, particularly Thackeray (1917) andDyson (1917), the latter of which suggests that Greenwich settheir 0 2 yr−1 limit based on calculations that suggested onlyone-eighth of all nearby stars (<20 pc) should have lower
The Astronomical Journal, 156:49 (26pp), 2018 August https://doi.org/10.3847/1538-3881/aaca33© 2018. The American Astronomical Society. All rights reserved.
8 See Henry et al. (2006) for discussion of the definition of a RECONS 10 pcsystem and http://www.recons.org for updated statistics.
1
proper motions. Thus, from the outset, it was understood thatsome population of nearby stars would be overlooked.
In this paper, we present a survey of those very low-proper-motion stars, along with astrometric, photometric, and spectro-scopic follow-up observations for selected high-priority starsand other additional targets of interest from the Cerro TololoInter-american Observatory Parallax Investigation (CTIOPI)parallax program. In Section 2, we lay out the backgroundwork done on these “TINYMO” systems that haveμ<0 18 yr−1. In Section 3, we discuss the design andmethodology of the TINYMO survey itself. In Section 4, wediscuss further target characterization, which results in the finalcatalog of targets presented in Section 5. We then discuss theimplications of the TINYMO survey in detail in Section 6 andthe results of the observational follow-up of our targets inSection 7.
2. Expected Distribution of TINYMOs
A few surveys have delved into searches for stars withsmaller proper motions, most notably Wroblewski–Torres–Costa (Wroblewski & Torres 1989 and subsequent; 0 15 yr−1),the LSPM survey (Lépine & Shara 2005; 0 15 yr−1), the “Meetthe Cool Neighbors” group (Reid et al. 2007; limit 0 11 yr−1
northern hemisphere, 0 28 yr−1 southern hemisphere), Deacon& Hambly (2007; 0 1 yr−1), and Deacon et al. (2009;0 08 yr−1). Apart from the anticipated but currently unreleasedLepine SUPERBLINK catalogs (0 04 yr−1 and larger), noefforts are searching for stars with proper motions smaller than0 1 yr−1 or down to truly zero proper motions. Thesecomprehensive searches have not been done because, withoutthe telltale marker of motion on photographic plates (or, morerecently, CCD images), the investigator looking for nearbystars is inundated by huge numbers of candidates that comepouring out of automated searches (UCAC, Zacharias et al.2013; PPMXL, Röser et al. 2011).
2.1. Incompleteness of the 25 pc Sample
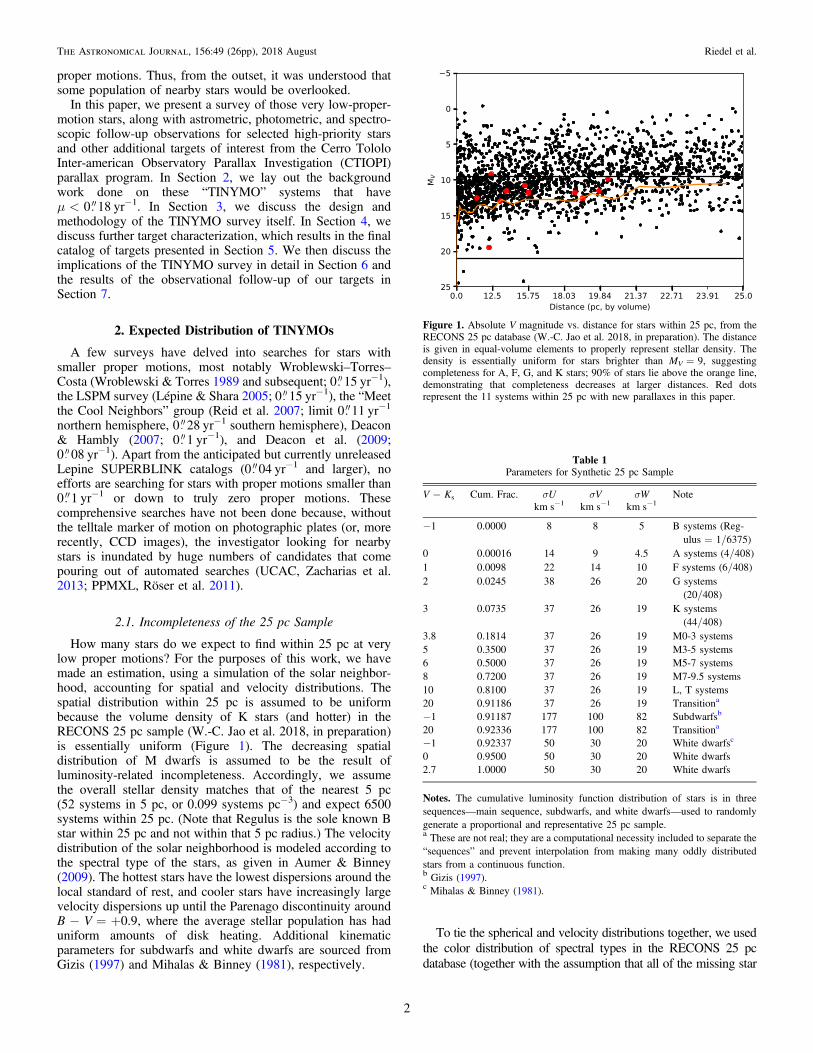
How many stars do we expect to find within 25 pc at verylow proper motions? For the purposes of this work, we havemade an estimation, using a simulation of the solar neighbor-hood, accounting for spatial and velocity distributions. Thespatial distribution within 25 pc is assumed to be uniformbecause the volume density of K stars (and hotter) in theRECONS 25 pc sample (W.-C. Jao et al. 2018, in preparation)is essentially uniform (Figure 1). The decreasing spatialdistribution of M dwarfs is assumed to be the result ofluminosity-related incompleteness. Accordingly, we assumethe overall stellar density matches that of the nearest 5 pc(52 systems in 5 pc, or 0.099 systems pc−3) and expect 6500systems within 25 pc. (Note that Regulus is the sole known Bstar within 25 pc and not within that 5 pc radius.) The velocitydistribution of the solar neighborhood is modeled according tothe spectral type of the stars, as given in Aumer & Binney(2009). The hottest stars have the lowest dispersions around thelocal standard of rest, and cooler stars have increasingly largevelocity dispersions up until the Parenago discontinuity aroundB−V=+0.9, where the average stellar population has haduniform amounts of disk heating. Additional kinematicparameters for subdwarfs and white dwarfs are sourced fromGizis (1997) and Mihalas & Binney (1981), respectively.
To tie the spherical and velocity distributions together, we usedthe color distribution of spectral types in the RECONS 25 pcdatabase (together with the assumption that all of the missing star
Figure 1. Absolute V magnitude vs. distance for stars within 25 pc, from theRECONS 25 pc database (W.-C. Jao et al. 2018, in preparation). The distanceis given in equal-volume elements to properly represent stellar density. Thedensity is essentially uniform for stars brighter than MV=9, suggestingcompleteness for A, F, G, and K stars; 90% of stars lie above the orange line,demonstrating that completeness decreases at larger distances. Red dotsrepresent the 11 systems within 25 pc with new parallaxes in this paper.
Table 1Parameters for Synthetic 25 pc Sample
V−Ks Cum. Frac. σU σV σW Notekm s−1 km s−1 km s−1
−1 0.0000 8 8 5 B systems (Reg-ulus=1/6375)
0 0.00016 14 9 4.5 A systems (4/408)1 0.0098 22 14 10 F systems (6/408)2 0.0245 38 26 20 G systems
(20/408)3 0.0735 37 26 19 K systems
(44/408)3.8 0.1814 37 26 19 M0-3 systems5 0.3500 37 26 19 M3-5 systems6 0.5000 37 26 19 M5-7 systems8 0.7200 37 26 19 M7-9.5 systems10 0.8100 37 26 19 L, T systems20 0.91186 37 26 19 Transitiona
−1 0.91187 177 100 82 Subdwarfsb
20 0.92336 177 100 82 Transitiona
−1 0.92337 50 30 20 White dwarfsc
0 0.9500 50 30 20 White dwarfs2.7 1.0000 50 30 20 White dwarfs
Notes. The cumulative luminosity function distribution of stars is in threesequences—main sequence, subdwarfs, and white dwarfs—used to randomlygenerate a proportional and representative 25 pc sample.a These are not real; they are a computational necessity included to separate the“sequences” and prevent interpolation from making many oddly distributedstars from a continuous function.b Gizis (1997).c Mihalas & Binney (1981).
2
The Astronomical Journal, 156:49 (26pp), 2018 August Riedel et al.
systems would be K, M, L, or T dwarfs with the same velocitydispersion) and generated a cumulative luminosity distribution(Table 1) out of which a random number generator can provideappropriately distributed stars of different spectral types, lumin-osities, and dispersions. These randomly generated stars wereplaced in a uniform spatial distribution with a radius of 25 pc.Strömberg’s asymmetric drift equation (á ñ = = V k, 74 5;U
k
2
Aumer & Binney 2009) was added to the stars, and the UVWvelocity of the Sun relative to the local standard of rest(U=11.10, V=12.24, W=7.25 km s−1; Schönrich et al.2010) was subtracted. We then derived the observationalproperties (R.A., decl., proper motion, radial velocity) from thesesynthetic stars. The distribution of proper motions, as derivedfrom 10 million synthetic stars, is shown in Figure 2.
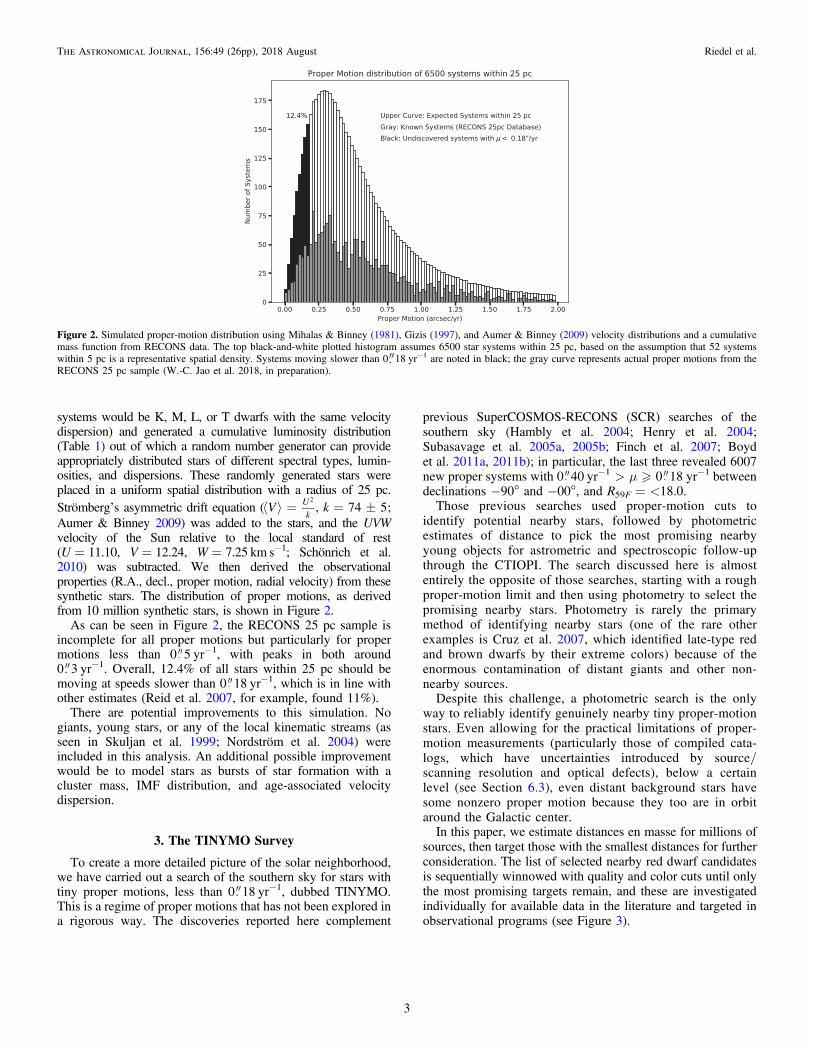
As can be seen in Figure 2, the RECONS 25 pc sample isincomplete for all proper motions but particularly for propermotions less than 0 5 yr−1, with peaks in both around0 3 yr−1. Overall, 12.4% of all stars within 25 pc should bemoving at speeds slower than 0 18 yr−1, which is in line withother estimates (Reid et al. 2007, for example, found 11%).
There are potential improvements to this simulation. Nogiants, young stars, or any of the local kinematic streams (asseen in Skuljan et al. 1999; Nordström et al. 2004) wereincluded in this analysis. An additional possible improvementwould be to model stars as bursts of star formation with acluster mass, IMF distribution, and age-associated velocitydispersion.
3. The TINYMO Survey
To create a more detailed picture of the solar neighborhood,we have carried out a search of the southern sky for stars withtiny proper motions, less than 0 18 yr−1, dubbed TINYMO.This is a regime of proper motions that has not been explored ina rigorous way. The discoveries reported here complement
previous SuperCOSMOS-RECONS (SCR) searches of thesouthern sky (Hambly et al. 2004; Henry et al. 2004;Subasavage et al. 2005a, 2005b; Finch et al. 2007; Boydet al. 2011a, 2011b); in particular, the last three revealed 6007new proper systems with 0 40 yr−1>μ�0 18 yr−1 betweendeclinations −90° and −00°, and R59F=<18.0.Those previous searches used proper-motion cuts to
identify potential nearby stars, followed by photometricestimates of distance to pick the most promising nearbyyoung objects for astrometric and spectroscopic follow-upthrough the CTIOPI. The search discussed here is almostentirely the opposite of those searches, starting with a roughproper-motion limit and then using photometry to select thepromising nearby stars. Photometry is rarely the primarymethod of identifying nearby stars (one of the rare otherexamples is Cruz et al. 2007, which identified late-type redand brown dwarfs by their extreme colors) because of theenormous contamination of distant giants and other non-nearby sources.Despite this challenge, a photometric search is the only
way to reliably identify genuinely nearby tiny proper-motionstars. Even allowing for the practical limitations of proper-motion measurements (particularly those of compiled cata-logs, which have uncertainties introduced by source/scanning resolution and optical defects), below a certainlevel (see Section 6.3), even distant background stars havesome nonzero proper motion because they too are in orbitaround the Galactic center.In this paper, we estimate distances en masse for millions of
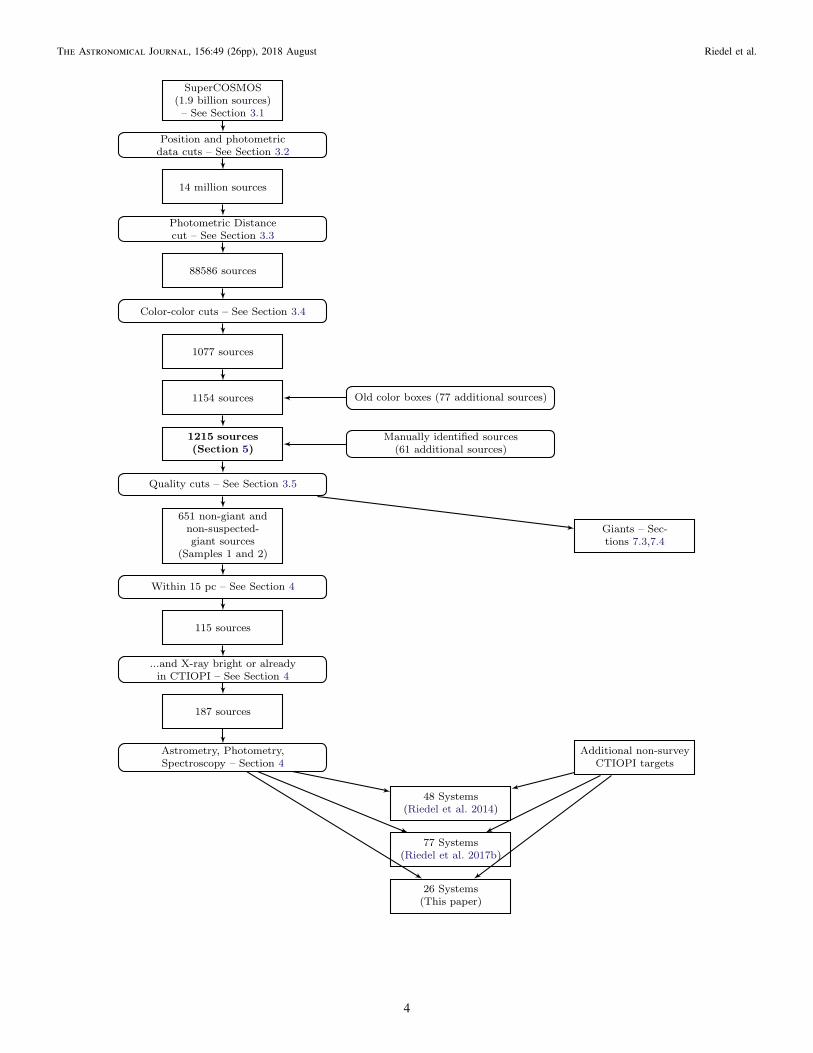
sources, then target those with the smallest distances for furtherconsideration. The list of selected nearby red dwarf candidatesis sequentially winnowed with quality and color cuts until onlythe most promising targets remain, and these are investigatedindividually for available data in the literature and targeted inobservational programs (see Figure 3).
Figure 2. Simulated proper-motion distribution using Mihalas & Binney (1981), Gizis (1997), and Aumer & Binney (2009) velocity distributions and a cumulativemass function from RECONS data. The top black-and-white plotted histogram assumes 6500 star systems within 25 pc, based on the assumption that 52 systemswithin 5 pc is a representative spatial density. Systems moving slower than 0 18 yr−1 are noted in black; the gray curve represents actual proper motions from theRECONS 25 pc sample (W.-C. Jao et al. 2018, in preparation).
3
The Astronomical Journal, 156:49 (26pp), 2018 August Riedel et al.
4
The Astronomical Journal, 156:49 (26pp), 2018 August Riedel et al.
3.1. SuperCOSMOS (1.9 Billion Sources)
SuperCOSMOS was a machine that scanned glass photo-graphic plates for more than a decade at the Royal Observatoryin Edinburgh (ROE), Scotland. The SuperCOSMOS ScienceArchive (SSA) database (Hambly et al. 2001b) is built fromscans the machine made of primarily Palomar Observatory SkySurvey (POSS) and Science and Engineering Research Council(SERC) sky survey plates. The survey covers the entire sky atfour different epochs and in four different passbands, derivingpositions, proper motions, and (up to) four-color photometryfor 1.9 billion sources. SuperCOSMOS magnitude limits varyby field but are generally equivalent to B=22, R=20, I=19in the plate photographic magnitude system of, e.g., Bessell(1986). The 2MASS JHKs photometry has been cross-matchedto sources where available. SuperCOSMOS is not a source ofabsolute positions or proper motions, though attempts weremade to force the mean Galaxy proper motions (field by field)to zero in fields where galaxies were available (Hamblyet al. 2001a). The overall reference frame was shifted to ICRSvia cross-matching with 2MASS (which is linked toTYCHO-2).
Of interest to TINYMO, the plates were aligned by cross-matching stars out to distances of 6″ (in a spiral search pattern)between two plates. This matching constraint actually providesa variable upper limit on measurable proper motions. For thesouthern hemisphere, where epoch spreads are 30–40 yr, themaximum proper motion detectable is around 0 2–0 3 yr−1,above which an object would move more than 6″ in that time.This represents a trade-off: a few higher-proper-motion stars—perhaps 100,000 out of two billion—will be identified asmultiple transient objects. Previous RECONS proper-motionsearches have been carried out using additional softwaredesigned to match up otherwise unmatched sources in the SSA.Other surveys using the SuperCOSMOS database (and their
own special software) include Scholz & Meusinger (2002 andsubsequent), the Liverpool–Edinburgh High Proper MotionSurvey (Pokorny et al. 2003), and the Southern Infrared ProperMotion Survey (Deacon et al. 2005).For the purposes of TINYMO, the main catalog is sufficient,
provided we limit ourselves to sources identified on all fourplates. The catalog contains proper motions up to 0 3 yr−1 forsources of interest, except in regions north of decl.=−18°,where far older POSS-I E red plates were used. In those areas,the larger epoch spread means that the highest proper motionthat can be reliably extracted from the 6″ cross-match isroughly 0 12 yr−1; it is also incomplete for a 25 deg2 regionaround R.A.=16 hr, decl.=−12° where POSS-I E field1038 is missing (and thus no four-color detections arepossible).
3.2. SQL Query (14 Million Sources)
The initial sift of the TINYMO survey was an SQL query,meant to identify meaningful targets in the southern hemi-sphere. To avoid overloading the server, the queries wereconducted in tiles of R.A. and decl. The selection criteria wereas follows.
3.2.1. Location Cuts
1. Regions in the southern hemisphere.2. More than 20° from the Galactic center.3. More than 10° from the Galactic plane.
These positional cuts were designed to limit the survey to thesouthern hemisphere and remove extremely dense areas (full ofhighly reddened stars that would contaminate the sample) fromconsideration. After the fact, additional cuts were made to theextracted data to remove regions near the north Galacticspur: 15 hr�R.A.�16 hr, −30�decl.�+00; 15 hr�
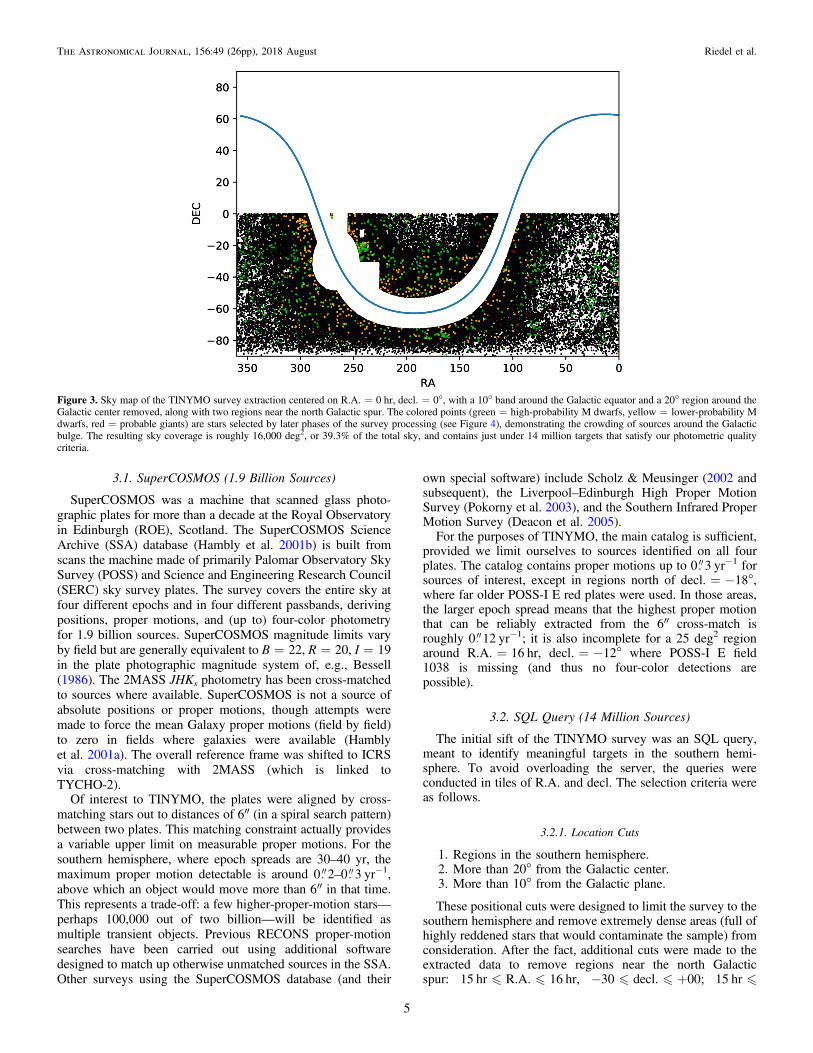
Figure 3. Sky map of the TINYMO survey extraction centered on R.A.=0 hr, decl.=0°, with a 10° band around the Galactic equator and a 20° region around theGalactic center removed, along with two regions near the north Galactic spur. The colored points (green=high-probability M dwarfs, yellow=lower-probability Mdwarfs, red=probable giants) are stars selected by later phases of the survey processing (see Figure 4), demonstrating the crowding of sources around the Galacticbulge. The resulting sky coverage is roughly 16,000 deg2, or 39.3% of the total sky, and contains just under 14 million targets that satisfy our photometric qualitycriteria.
5
The Astronomical Journal, 156:49 (26pp), 2018 August Riedel et al.
R.A. �16 hr, −60�decl.�−30; 17 hr�R.A.�18 hr,−30�decl.�+00. Within those regions, there were asmany stars with apparent photometric distances within 25 pc,all most likely giants at far greater distances, as there were inthe rest of the sample (see Figure 3). The Large and SmallMagellanic Cloud regions were not removed. This cut definesour coverage of 16,214 deg2, or 39.3% of the sky.
3.2.2. Plate Detection Cuts
1. Detected on all four plates.
This criterion sets an upper proper-motion limit as describedabove, as well as limits on color; the star could not be so redthat it did not appear in the BJ plate, which cuts out a number ofcool and faint stars. As mentioned earlier, this also cut outa small region of sky (roughly 16 hr�R.A.�16:20, −15�decl.�−10) where there is no R1 plate.
3.2.3. Quality Cuts
a. Internal quality measure >128 on all plates.b. Ellipticity less than 0.2 on all plates.
These cuts removed a large number of extragalactic sources,unresolved binaries, and spurious sources, including platedefects.
3.2.4. Luminosity Cuts
1. Brighter than R2=16.5.
The R2 magnitude limit allows for detection of stars withBJ=21 and BJ−R2 colors as red as 4.5 (a brown dwarf) andmatches the Giclas surveys (Giclas et al. 1979), as well asprevious SCR proper-motion surveys, not including Boyd et al.(2011a).
3.2.5. Offset Cuts
1. Detected in 2MASS within 5″ of the weighted mean plateposition.
The mean plate position recorded by SuperCOSMOS isweighted by the positional accuracy of each of the detections;the epoch of this effective plate position is usually around1985, while the mean epoch of 2MASS is around 2000. Thus,any star moving slower than μ<0 333 yr−1 (less than∼5″motion over 15 yr) will be matched to its 2MASS entry.This, in concert with the four-plate detection requirement,makes the most stringent cut.
The photometric limits chosen influence the kinds of starswe expect to find. The limit of 2MASS is effectivelyJHK≈15. SuperCOSMOS contains sources as faint asBJ=21, so with a magnitude cutoff of R2=16.5, the limitingmagnitudes for M dwarfs are all therefore set by the R2 filter.The magnitudes of an M0V star (MBJ=10, BJ−R2=2.3,BJ−K=4.5) corresponding to our cutoff at R2=16.5 areBJ=18.8, R2=16.5, and K=14.3. This implies a limitingdistance of 630 pc. For an M9.0V star (MBJ=20.4,BJ−R2=3.0, BJ−K=10.2), the magnitude limit isBJ=19.5, R2=16.5, and K=9.3, which implies a limitingdistance of 6.6 pc. Within 25 pc, we should be able to detectevery M dwarf bluer than BJ−R2=2.6 (M7V).
Ultimately, the search identified just short of 14 million starsin the covered 16,214 deg2 region seen in Figure 3.
3.3. Photometric Sift (88,586 Sources)
The next phase of the search for low-proper-motion nearbystars was the computation of photometric distance estimates(Hambly et al. 2004) for all stars. This method uses the plateBR2I and 2MASS JHK colors to produce up to 11 distanceestimates (out of a total possible 15 colors; B−R2, J−H,J−K, and H−K do not provide useful discriminants for reddwarfs) that are then combined into a weighted mean with atypical uncertainty of 26%. These color–magnitude relation-ships, described by fourth-order fits to the main sequence, areonly valid for K and M dwarfs, which removes all hotter starsfrom our consideration. We expect that no stars hotter than Kremain undiscovered within 25 pc thanks to the work ofHipparcos. Of the 14 million point sources from the first step,slightly fewer than 89,000 (see Figure 3) were estimated to bewithin 25 pc by those relations.As there are only roughly 6,500 systems expected within 25
pc (Section 2.1), the ≈89,000 figure suggests massivecontamination. This is as expected: apart from subdwarfs and(theoretically) stars with unresolved white dwarf companions,contaminants with the colors of main-sequence stars are muchbrighter objects that will land in a magnitude-limited surveysuch as ours and include
1. giants that mimic main-sequence colors or were caught atfortuitous times in their light curves, particularly Miravariables due to their intrinsic luminosity;
2. metal-rich stars just beyond 25 pc;3. unresolved multiple stars, where there is extra luminosity
and therefore a smaller expected distance;4. pre-main-sequence stars, where the extra luminosity is
due to the enlarged radius of the gravitationallycontracting protostar;
5. reddened (and extincted) objects in molecular cloudregions; and
6. redshifted active galactic nuclei.
The 11 plate relations were calibrated to colors typical of K andM main-sequence stars; if a star has unusual colors outside thevalid color ranges, it is less likely to be a main-sequence star.We therefore flagged all objects with fewer than nine validdistance relations (out of 11 total). It should be noted that thislimit is different from that used in other publications in thisseries, where as few as seven relations were accepted toaccommodate the possibility that a single Bj or R2 filtermagnitude might be erroneous.
3.4. Color–color Cuts (1154 Sources)
To identify specifically main-sequence stars, we applied acolor–color cut in J−K versus v−K space, where v is anestimated V magnitude formed by taking the average of Band R2.There are, among the BR2IJHK color combinations, two
particular colors in which M dwarfs are distinguishable fromred giants: J−H and J−K (Figure 4). In these colors (andonly these), mid-M dwarfs are bluer than mid-M giants of thesame v−K color. This property does not appear in any othercombination of colors, including H–K, but it shows up when
6
The Astronomical Journal, 156:49 (26pp), 2018 August Riedel et al.
J−H or J−K is plotted against any other color. Thisbehavior is most likely due to gravity-sensitive absorptionfeatures in all three bands: the J-band feature decreases instrength as gravity increases, and the H- and K-band featuresboth increase in strength as gravity increases. Allers et al.(2007) identified a number of potentially gravity-sensitivefeatures that may fit those requirements: VO and TiO weakenwith increasing gravity (and are predominantly found in theJ band), and CO (which dominates in the K band), K I, and Na Iall strengthen with increasing gravity. This would explain whydwarfs are bluer in J−H and J−K (increased J flux,decreased H or K flux) and yet there is no effect on H−K(correlated loss of flux). This behavior does not appear in otherJohnson/Kron–Cousins/2MASS filter combinations, though Rand I are also dominated by TiO; it may have to do with therate at which the band strengths change.
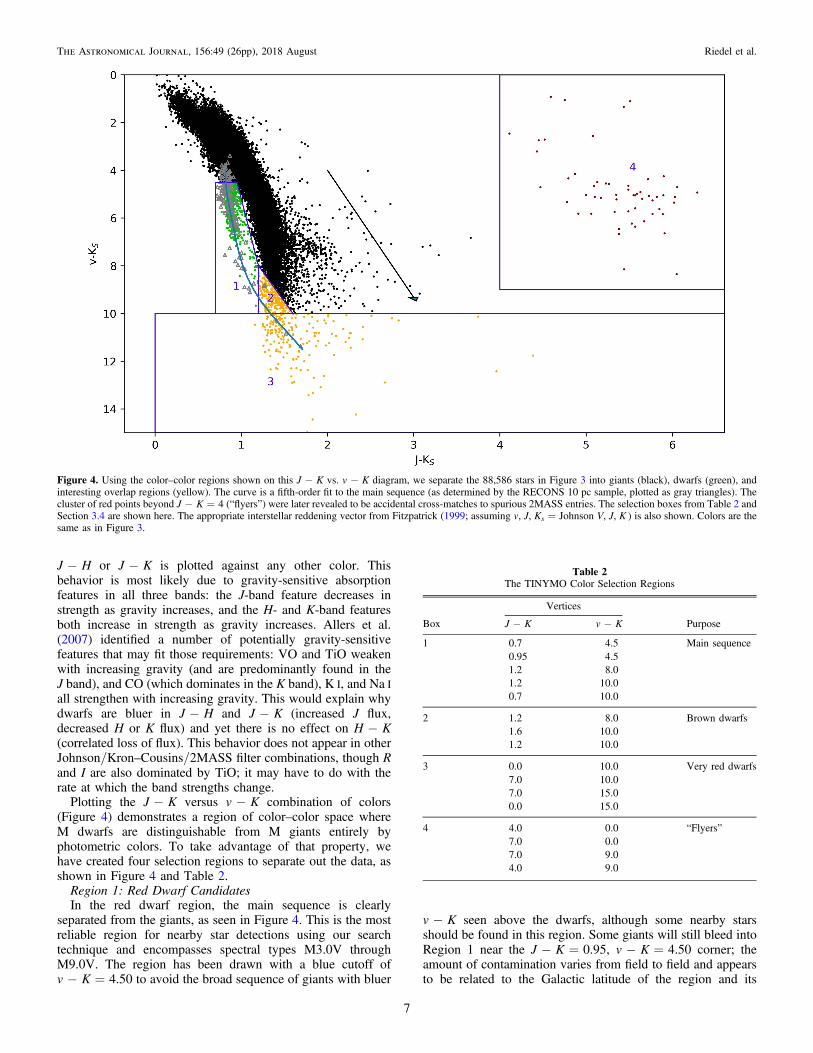
Plotting the J−K versus v−K combination of colors(Figure 4) demonstrates a region of color–color space whereM dwarfs are distinguishable from M giants entirely byphotometric colors. To take advantage of that property, wehave created four selection regions to separate out the data, asshown in Figure 4 and Table 2.
Region 1: Red Dwarf CandidatesIn the red dwarf region, the main sequence is clearly
separated from the giants, as seen in Figure 4. This is the mostreliable region for nearby star detections using our searchtechnique and encompasses spectral types M3.0V throughM9.0V. The region has been drawn with a blue cutoff ofv−K=4.50 to avoid the broad sequence of giants with bluer
v−K seen above the dwarfs, although some nearby starsshould be found in this region. Some giants will still bleed intoRegion 1 near the J−K=0.95, v−K=4.50 corner; theamount of contamination varies from field to field and appearsto be related to the Galactic latitude of the region and its
Table 2The TINYMO Color Selection Regions
Vertices
Box J−K v−K Purpose
1 0.7 4.5 Main sequence0.95 4.51.2 8.01.2 10.00.7 10.0
2 1.2 8.0 Brown dwarfs1.6 10.01.2 10.0
3 0.0 10.0 Very red dwarfs7.0 10.07.0 15.00.0 15.0
4 4.0 0.0 “Flyers”7.0 0.07.0 9.04.0 9.0
Figure 4. Using the color–color regions shown on this J−K vs. v−K diagram, we separate the 88,586 stars in Figure 3 into giants (black), dwarfs (green), andinteresting overlap regions (yellow). The curve is a fifth-order fit to the main sequence (as determined by the RECONS 10 pc sample, plotted as gray triangles). Thecluster of red points beyond J−K=4 (“flyers”) were later revealed to be accidental cross-matches to spurious 2MASS entries. The selection boxes from Table 2 andSection 3.4 are shown here. The appropriate interstellar reddening vector from Fitzpatrick (1999; assuming v, J, Ks=Johnson V, J, K ) is also shown. Colors are thesame as in Figure 3.
7
The Astronomical Journal, 156:49 (26pp), 2018 August Riedel et al.

particular reddening. The red edge of the sample is cut atJ−K=1.2, beyond which the giant and brown dwarf colorsoverlap.
Region 2: Giants’ TailThe tail of the giant sequence crosses the dwarf sequence in
Region 2, but we have retained these targets because one ormore may be a very nearby late-type red or brown dwarf.
Region 3: Very Red CandidatesRegion 3 includes extremely red objects (v−K>10) that
are also likely giants or highly reddened distant stars but couldbe interesting unusually red sources.
Region 4: FlyersA small group of extremely red sources (called “flyers”)
were found to have v−K=0–7 and J−K=4–7. Invest-igation showed that all were bright targets on the Super-COSMOS plates, with erroneous matches to 2MASS sources.All checked objects were later determined to be giants fallingwithin the giant locus once their photometry was corrected.
The result of accepting only the objects in these four regionswas a reduction of 88,586 candidates to 1077 promising nearbyobjects. An early selection attempt used different boxes thatincluded 77 stars9 not in the final set of boxes (see Figure 3),which we retain in our final catalog for bookkeeping reasons.This brings the total to 1154 stars.
3.5. Further Quality Cuts
In the fourth and final phase of the winnowing, more qualitycuts were made to improve the nearby star recovery rate.
1. Visual inspection (“blinking”) of SuperCOSMOS platescans in the Aladin Skyview Desktop applet with the2MASS Point Source Catalog loaded as an overlay toensure detected stars were (a) real objects, (b) moving(proper motions larger than 0 08 yr−1 were identifiableunder visual examination), and (c) matched to the proper2MASS point (mistakes in the 2MASS identificationaccount for the “flyers” mentioned in Section 3.4). At thispoint, an additional 61 proper-motion objects (generallycompanions) were nonexhaustively identified by eye tobring the total candidate list to 1215 objects.
2. Comparisons of the two R-band SuperCOSMOSmagnitudesfor consistency. Values differing by more than 1.00 magwere likely variable giants and were discarded. This isadmittedly imperfect: low-amplitude Mira variables or Mirascaught at two similar points in their light curve will not beflagged by their R1−R2 magnitudes, while stars with badR1 or R2 photometry will be unfairly excluded.
3. Elimination of sources with J−K�2.00, which arepresumed giants or stars with poor JHK magnitudes thatcorrupt the distance estimates.
4. Searches of the SIMBAD database to determine whetheror not sources are previously documented nearby stars,giants, Mira stars, carbon stars, and/or pulsating orvariable stars.
5. Searches of the ROSAT All-Sky Survey (RASS) brightsource (Voges et al. 1999) and faint source (Vogeset al. 2000) catalogs for stars with X-ray detections,which are most likely dwarfs or young stars.
We thus arrive at a sample of 651 stars that pass all tests,while the remaining 564 of the 1215 objects were flagged forany number of the above quality reasons.We developed five classifications for stars based on the
above quality cuts, which we use to reclassify the sourcesidentified in the four-color boxes defined above and will referto from this point on as follows.
1. X-ray: Stars that had X-ray counterparts in the RASS-BSC and RASS-FSC catalogs were highest priority, asthey were most likely to be nearby dwarfs.
2. Good: Stars that passed all quality cuts but did not haveX-ray detections.
3. Probable: Stars that either failed the R1−R2 test, hadfewer than nine valid photometric plate distance relations,or J−K�2.00 but were not already known to be giants(as of 2012; Riedel 2012).
4. Giants: Stars known to be giants according to the GeneralCatalog of Variable Stars (Samus et al. 2012; in VizieR asb/GCVS), the Catalog of Galactic Carbon Stars (Alksniset al. 2001), or SIMBAD.
5. Flyers: Stars from Region 4 of the color–color boxes, theolder boxes, or spuriously identified by eye.
Proper motions from the survey ranged from 0 000 to0 397 yr−1; additional targets found by eye were found to bemoving as fast as 0 444 yr−1. Overall, 1016 of the stars foundin the survey were moving slower than 0 18 yr−1
In practice, all but one of the flagged stars in the “Probable”group were revealed to be giants after a literature search or low-resolution spectroscopy (Section 4.3). The one potential nearbystar is SCR1931-1757 (19:31:39.88–17:57:36.0, μ=0.028,P.A.=188°.2), a spectroscopically confirmed M2.0Ve star withall 11 valid plate relations and R1−R2=−3.03 (Super-COSMOS colors are apparently erroneous); its predicteddistance was too far (17.67 pc by the average of 12 CCDdistance estimates) to earn astrometric follow-up (Section 4).
4. Follow-up Observations
Given limited observing resources, it was decided to define ahigher-priority sample of stars for follow-up. This sampleincluded the 115 tiny proper-motion (<0 18 yr−1) candidateswith an estimated distance within 15 pc that had not alreadybeen identified as giants in the literature (Regions 1, 2, and 3, ifthey had more than nine valid plate relations, of Figure 4), plusall 55 of the targets within 25 pc found to be X-ray bright(Section 4.1). Additional tiny proper-motion targets from thesurvey that were already on the observing programs werefolded into our observational list, bringing it to 187 total targetsof interest.For the purpose of providing a larger selection of tiny
proper-motion objects for analysis in this paper, we added anadditional 12 targets from the CTIOPI program that were notfound in the TINYMO survey. These additional 12 targets donot appear in the master catalog (Section 5) or discussionthereof and are marked as such in tables where they do appear.Their astrometry, photometry, and spectroscopy (whereapplicable) were obtained in the same way as our surveyfollow-up described below.Analysis of some stars found in the TINYMO sample also
appears in Riedel et al. (2014) and Riedel et al. (2017b), andobjects with proper motions higher than 0 18 yr−1 were foldedinto the study published in Winters et al. (2017).9 None of the 77 objects show signs of being main-sequence stars.
8
The Astronomical Journal, 156:49 (26pp), 2018 August Riedel et al.
4.1. Literature Search
There are useful bodies of work in the literature that can beused to further characterize the remaining stars of interest.Apart from SIMBAD, the General Catalog of Variable Stars(Samus et al. 2012; in VizieR as b/GCVS) maintains a list ofall known variable stars and can be used to identify Miravariables, carbon stars, and other semi-regular and irregulargiant stars. The Catalog of Galactic Carbon Stars (Alksnis et al.2001) also furnished some carbon star identifications. Finally,the entire list was checked against the VizieR versions of theLSPM (Lépine & Shara 2005) and NLTT (Luyten 1979)catalogs to identify previously known proper-motion objects.Identifications from these catalogs appear in the catalog(Table 5).
We searched the ROSAT (Voges et al. 1999, 2000) catalogfor cross-matches to our objects, as giants are not generallyexpected to be strong X-ray emitters (I. Song 2018, privatecommunication). Voges et al. (1999) defined the 90% limit ondetections as being sources within 25″ of the optical source,with less than 25% uncertainty on the count rate; thoseguidelines were followed when identifying X-ray sourcesprioritized for photometry, spectroscopy, and astrometry. Mostof these X-ray-bright objects were identified as objects ofinterest by Riaz et al. (2006). Because the ROSAT observationswere carried out in the early 1990s, we applied our propermotions to move the targets back to their epoch 1991 positionsusing the SuperCOSMOS proper motions before carrying outthe X-ray search.
4.2. Photometry
Through the existing CTIOPI program (operating since 1999on the CTIO 0.9 m; Jao et al. 2005; Henry et al. 2006), we haveobtained Johnson–Kron–Cousins VRI photometry (Jaoet al. 2003; Winters et al. 2015) for all 187 targets. Targetfields are observed in each filter on photometric nights and thentransformed to Johnson–Kron–Cousins VRI through the use ofstandards from Landolt (1992, 2007). Stars were observed on atleast two nights to check for consistent VRI photometry.
The faintest star in our sample is 2MASS 0936–2610B, withV=19.92. The brightest star is the unresolved binary GJ2122AB (V=9.68), which is a well-known M1.0V star.
Accurate VRI photometric data increase our confidence thatthe candidate stars are truly nearby dwarfs because (a) thederived distance estimate uncertainties drop from 26% for theplate photometry– (and 2MASS-) based BR2IJHK relations to15% for the CCD photometry– (and 2MASS-) based VRIJHKrelations (Henry et al. 2004), and (b) many giants can beeliminated from the candidate pool based on photometricvariability revealed by comparing their new CCD Kron–Cousins R magnitudes to existing SuperCOSMOS plate R1
and R2.The vast majority of this photometry can be found in
Table 5. Photometry for all the astrometric targets reported inthis paper (including the tiny proper-motion systems not foundas part of the TINYMO survey) is given in Table 3.
4.3. Spectroscopy
For the stars of interest, we obtained high-S/N, low-resolution long-slit spectroscopy. The primary purpose of thisspectroscopy was to identify (and remove) giant stars from ourastrometric sample. The data were also intended for spectral
typing and used for measuring gravity-sensitive spectralfeatures.
4.3.1. CTIO 1.5 m/RCSpec
Most of the spectroscopy was collected on the CTIO/SMARTS 1.5 m telescope with the Ritchie–Crétchien (RC)spectrograph using the 32/Ia first-order grating (15°.13 tilt,5994–9600Å, R=500, OG570 blocking filter) and a 2″ slit tomaximize the stellar flux. The RC spectrograph uses arelatively old 1200×800 Loral CCD with few bad columnsand no back-thinning, which minimizes fringing in the red endof the spectrum. Two distinct epochs of observations wereconducted, from 2003 to 2006 for some of the additionalCTIOPI targets now being presented here and from 2009 to2011 specifically for the TINYMO survey targets. In bothcases, the regular operation was two exposures of the targetobject, followed by one neon-argon (NeAr) lamp exposure forwavelength solution, with one flux standard taken per night.From 2003 to 2006, observing was done in person on nine
user runs. From 2009 to 2011, observing was done inSMARTS queue mode. At that time, the 32/Ia setting wasno longer a common setup, so for the most part, data forTINYMO stars were also collected in single-night blocks. Theflux standard was chosen by the queue manager from a smallsubset of stars, all of which are in IRAF’s standard onedstds$iidscal/ctionewcal directory. Spectra were reduced usingstandard IRAF onedspec, ccdred, and ctioslit packages.
4.3.2. Lowell 1.8 m/DeVeny
Additional spectra were gathered at Lowell Observatory’sPerkins 1.8 m telescope with the DeVeny spectrograph and its400 g mm−1 grating tilted at 17°, with the OG570 blockingfilter, for coverage from 5800 to 9200Åat a spectral resolutionof roughly R=1500. Spectra were obtained on five runs from2009 to 2010. Owing to the observatory’s northern latitude,only targets north of decl.=−36° were observed from Lowell.The process of obtaining spectra changed considerably over
the course of the project, partly owing to the fact that theDeVeny was not regularly used and rarely in the red end of thespectral range. For the first run (2009 February), only onespectrum was taken of each target and standard IRAF fluxstandard, with NeAr calibration lamp spectra taken at fourdifferent times throughout the night. Subsequent runs (2009May and December) included lamps taken after each exposureand a large catalog of flat fields, and finally (2010 March andMay), flat lamps were taken after every exposure. Spectra werereduced using standard IRAF onedspec, ccdred, and kpnoslitpackages.
4.3.3. CTIO 4.0 m/RCSpec
Ten objects were observed with the CTIO 4.0 m RCSpec on2008 September 18 and 19 using the KPGLF-1 grating(632 g mm−1) and an unknown blocking filter (S. Kafka2018, private communication). The spectra are higher resolu-tion than our CTIO 1.5 m spectra (Δλ=1.90Å, R≈3000)and cover 4900–8050Å. These spectra do not have the Na Idoublet or Ca II triplet used for gravity and luminosity classdetection but do contain Hα and the K I doublet. For somestars, this is the only spectrum available.
9
The Astronomical Journal, 156:49 (26pp), 2018 August Riedel et al.
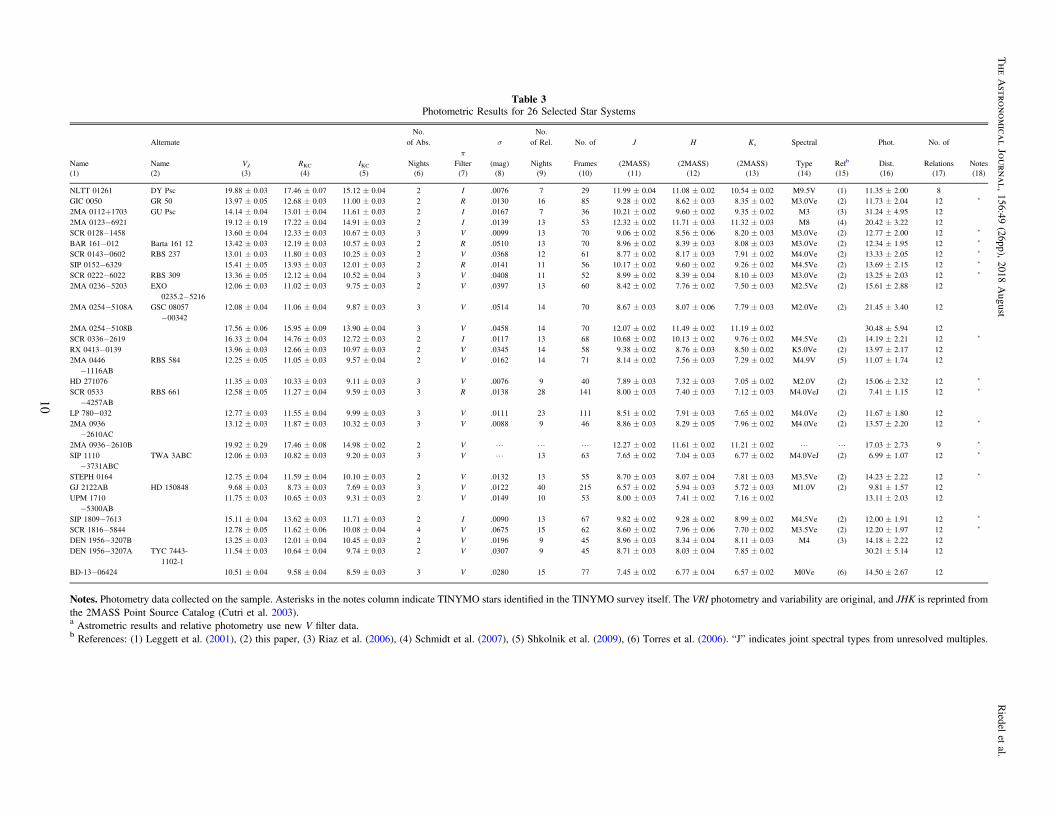
Table 3Photometric Results for 26 Selected Star Systems
AlternateNo.
of Abs. σ
No.of Rel. No. of J H Ks Spectral Phot. No. of
Name Name VJ RKC IKC Nightsπ
Filter (mag) Nights Frames (2MASS) (2MASS) (2MASS) Type Refb Dist. Relations Notes(1) (2) (3) (4) (5) (6) (7) (8) (9) (10) (11) (12) (13) (14) (15) (16) (17) (18)
NLTT 01261 DY Psc 19.88±0.03 17.46±0.07 15.12±0.04 2 I .0076 7 29 11.99±0.04 11.08±0.02 10.54±0.02 M9.5V (1) 11.35±2.00 8GIC 0050 GR 50 13.97±0.05 12.68±0.03 11.00±0.03 2 R .0130 16 85 9.28±0.02 8.62±0.03 8.35±0.02 M3.0Ve (2) 11.73±2.04 12 *
2MA 0112+1703 GU Psc 14.14±0.04 13.01±0.04 11.61±0.03 2 I .0167 7 36 10.21±0.02 9.60±0.02 9.35±0.02 M3 (3) 31.24±4.95 122MA 0123−6921 19.12±0.19 17.22±0.04 14.91±0.03 2 I .0139 13 53 12.32±0.02 11.71±0.03 11.32±0.03 M8 (4) 20.42±3.22 12SCR 0128−1458 13.60±0.04 12.33±0.03 10.67±0.03 3 V .0099 13 70 9.06±0.02 8.56±0.06 8.20±0.03 M3.0Ve (2) 12.77±2.00 12 *
BAR 161−012 Barta 161 12 13.42±0.03 12.19±0.03 10.57±0.03 2 R .0510 13 70 8.96±0.02 8.39±0.03 8.08±0.03 M3.0Ve (2) 12.34±1.95 12 *
SCR 0143−0602 RBS 237 13.01±0.03 11.80±0.03 10.25±0.03 2 V .0368 12 61 8.77±0.02 8.17±0.03 7.91±0.02 M4.0Ve (2) 13.33±2.05 12 *
SIP 0152−6329 15.41±0.05 13.93±0.03 12.01±0.03 2 R .0141 11 56 10.17±0.02 9.60±0.02 9.26±0.02 M4.5Ve (2) 13.69±2.15 12 *
SCR 0222−6022 RBS 309 13.36±0.05 12.12±0.04 10.52±0.04 3 V .0408 11 52 8.99±0.02 8.39±0.04 8.10±0.03 M3.0Ve (2) 13.25±2.03 12 *
2MA 0236−5203 EXO0235.2−5216
12.06±0.03 11.02±0.03 9.75±0.03 2 V .0397 13 60 8.42±0.02 7.76±0.02 7.50±0.03 M2.5Ve (2) 15.61±2.88 12
2MA 0254−5108A GSC 08057−00342
12.08±0.04 11.06±0.04 9.87±0.03 3 V .0514 14 70 8.67±0.03 8.07±0.06 7.79±0.03 M2.0Ve (2) 21.45±3.40 12
2MA 0254−5108B 17.56±0.06 15.95±0.09 13.90±0.04 3 V .0458 14 70 12.07±0.02 11.49±0.02 11.19±0.02 30.48±5.94 12SCR 0336−2619 16.33±0.04 14.76±0.03 12.72±0.03 2 I .0117 13 68 10.68±0.02 10.13±0.02 9.76±0.02 M4.5Ve (2) 14.19±2.21 12 *
RX 0413−0139 13.96±0.03 12.66±0.03 10.97±0.03 2 V .0345 14 58 9.38±0.02 8.76±0.03 8.50±0.02 K5.0Ve (2) 13.97±2.17 122MA 0446
−1116ABRBS 584 12.25±0.05 11.05±0.03 9.57±0.04 2 V .0162 14 71 8.14±0.02 7.56±0.03 7.29±0.02 M4.9V (5) 11.07±1.74 12
HD 271076 11.35±0.03 10.33±0.03 9.11±0.03 3 V .0076 9 40 7.89±0.03 7.32±0.03 7.05±0.02 M2.0V (2) 15.06±2.32 12 *
SCR 0533−4257AB
RBS 661 12.58±0.05 11.27±0.04 9.59±0.03 3 R .0138 28 141 8.00±0.03 7.40±0.03 7.12±0.03 M4.0VeJ (2) 7.41±1.15 12 *
LP 780−032 12.77±0.03 11.55±0.04 9.99±0.03 3 V .0111 23 111 8.51±0.02 7.91±0.03 7.65±0.02 M4.0Ve (2) 11.67±1.80 122MA 0936
−2610AC13.12±0.03 11.87±0.03 10.32±0.03 3 V .0088 9 46 8.86±0.03 8.29±0.05 7.96±0.02 M4.0Ve (2) 13.57±2.20 12 *
2MA 0936−2610B 19.92±0.29 17.46±0.08 14.98±0.02 2 V L L L 12.27±0.02 11.61±0.02 11.21±0.02 L L 17.03±2.73 9 *
SIP 1110−3731ABC
TWA 3ABC 12.06±0.03 10.82±0.03 9.20±0.03 3 V L 13 63 7.65±0.02 7.04±0.03 6.77±0.02 M4.0VeJ (2) 6.99±1.07 12 *
STEPH 0164 12.75±0.04 11.59±0.04 10.10±0.03 2 V .0132 13 55 8.70±0.03 8.07±0.04 7.81±0.03 M3.5Ve (2) 14.23±2.22 12 *
GJ 2122AB HD 150848 9.68±0.03 8.73±0.03 7.69±0.03 3 V .0122 40 215 6.57±0.02 5.94±0.03 5.72±0.03 M1.0V (2) 9.81±1.57 12UPM 1710
−5300AB11.75±0.03 10.65±0.03 9.31±0.03 2 V .0149 10 53 8.00±0.03 7.41±0.02 7.16±0.02 13.11±2.03 12
SIP 1809−7613 15.11±0.04 13.62±0.03 11.71±0.03 2 I .0090 13 67 9.82±0.02 9.28±0.02 8.99±0.02 M4.5Ve (2) 12.00±1.91 12 *
SCR 1816−5844 12.78±0.05 11.62±0.06 10.08±0.04 4 V .0675 15 62 8.60±0.02 7.96±0.06 7.70±0.02 M3.5Ve (2) 12.20±1.97 12 *
DEN 1956−3207B 13.25±0.03 12.01±0.04 10.45±0.03 2 V .0196 9 45 8.96±0.03 8.34±0.04 8.11±0.03 M4 (3) 14.18±2.22 12DEN 1956−3207A TYC 7443-
1102-111.54±0.03 10.64±0.04 9.74±0.03 2 V .0307 9 45 8.71±0.03 8.03±0.04 7.85±0.02 30.21±5.14 12
BD-13−06424 10.51±0.04 9.58±0.04 8.59±0.03 3 V .0280 15 77 7.45±0.02 6.77±0.04 6.57±0.02 M0Ve (6) 14.50±2.67 12
Notes. Photometry data collected on the sample. Asterisks in the notes column indicate TINYMO stars identified in the TINYMO survey itself. The VRI photometry and variability are original, and JHK is reprinted fromthe 2MASS Point Source Catalog (Cutri et al. 2003).a Astrometric results and relative photometry use new V filter data.b References: (1) Leggett et al. (2001), (2) this paper, (3) Riaz et al. (2006), (4) Schmidt et al. (2007), (5) Shkolnik et al. (2009), (6) Torres et al. (2006). “J” indicates joint spectral types from unresolved multiples.
10
TheAstro
nomica
lJourn
al,
156:49(26pp),
2018August
Riedel
etal.
4.3.4. CFHT/ESPaDONs
LP 780–032 was observed with ESPaDONs on CFHT on2016 January 28. This spectrum is much higher resolution thanour CTIO 1.5 m spectra and covers 3730–10290Åat aresolving power of R=75000. Spectra were processed andflat-fielded through standard methods, and barycentric velocitywas removed. LP 780–032 was determined to have a radialvelocity of −7 km s−1 and rotational velocity of 2 km s−1.
4.4. Astrometry
4.4.1. CTIOPI
TINYMO targets that were spectroscopically identified asdwarfs and within 15 pc according to VRIJHK photometricdistance estimates were placed on the CTIOPI astrometricprogram.
The RECONS group has been conducting the CTIOPI at theCTIO 0.9 m since 1999, until 2003 as an NOAO survey andfrom 2003 to the present through the SMARTS Consortium.CTIOPI uses the facility Tek #2 VRI filters for observations.For a period of time between 2005 and 2009, the Tek #1 Vfilter was used instead (see Subasavage et al. 2007 for moreinformation). The filter had different astrometric (though notphotometric) properties, and all results incorporating data takenin that filter are marked as such in Tables 3 and 4.
For astrometric observations, target fields are observedusually three times a year within 2 hr of transit for at least 2 yrin a single filter, chosen out of the VRI set to provide theoptimal balance between exposure time and brightness of thereference field. Photometric frames in the appropriate filter thatmeet image quality and hour angle requirements may be usedfor astrometry. Data are reduced using the pipeline described inJao et al. (2005) and as used in all subsequent CTIOPIpublications.10
The parallax results (Table 4) indicate that 15 of the 26systems presented here are between 25 and 50 pc away, counterto the expectations of the TINYMO selection process, while 11systems were within the expected 25 pc.
4.4.2. FGS
One additional opportunity occurred in 2008 when theHubble Space Telescope’s data bus developed a fault. As aresult, the only available instruments for Cycle 16B were thefine guidance sensors (FGSs), which communicate via thetelemetry subsystems.
The FGS system on HST can be used as an interferometer,where two of the three onboard Koesters prisms are used, withone fixed on the target, another scanning around the source tosample the interference pattern, and the third maintainingobservatory pointing. The output of the interference is twoS-shaped curves along orthogonal axes, from which binarystars with separations on the order of tens of milliarcsecondscan be resolved by either visually identifying a secondoverlapping S curve or, for close-in objects, deviations fromthe S curves of a single star.
We took advantage of this opportunity to observe 66 starsfrom our X-ray-bright sample as part of HST program#11943/11944, “Binaries at the Extremes of the H–RDiagram,” PI: Douglas Gies. Roughly half of the intended list
was observed, and results of newly discovered binaries arementioned where appropriate in Section 8.
5. The Complete Catalog (1215 Sources)
The catalog is divided into our five subsamples ofdescending quality, as described in Section 3.5.
1. Good targets with X-ray detections in the RASS—88stars, of which 68 have less than 0 18 yr−1 (tiny) propermotion.
2. Good targets without X-ray detection—563 stars, ofwhich 394 have tiny proper motion.
3. Probable giants ( - > - >∣ ∣J K R R1.2, 11 2 )—222 stars,of which all are tiny proper motion.
4. Known giants (from SIMBAD, the General Catalog ofVariable Stars (Samus et al. 2012), and the Catalog ofGalactic Carbon Stars (Alksnis et al. 2001))—223 stars,of which all are tiny proper motion.
5. Discarded objects not within 25 pc or the color-selectionboxes. These were the “flyers,” or objects found by eye,but are included for completeness—119 stars, of which109 are tiny proper motion.
The final catalog is presented in Table 5. All told, 114 of thestars in the catalog of 1215 targets now have publishedparallaxes (66 from CTIOPI efforts and 48 from vanLeeuwen 2007 and Gaia Collaboration et al. 2016). Also,251 stars have new VRI photometry, and 229 have new spectraltypes from red-optical spectra.
6. Survey Discussion
6.1. Analysis of the Photometric Cuts
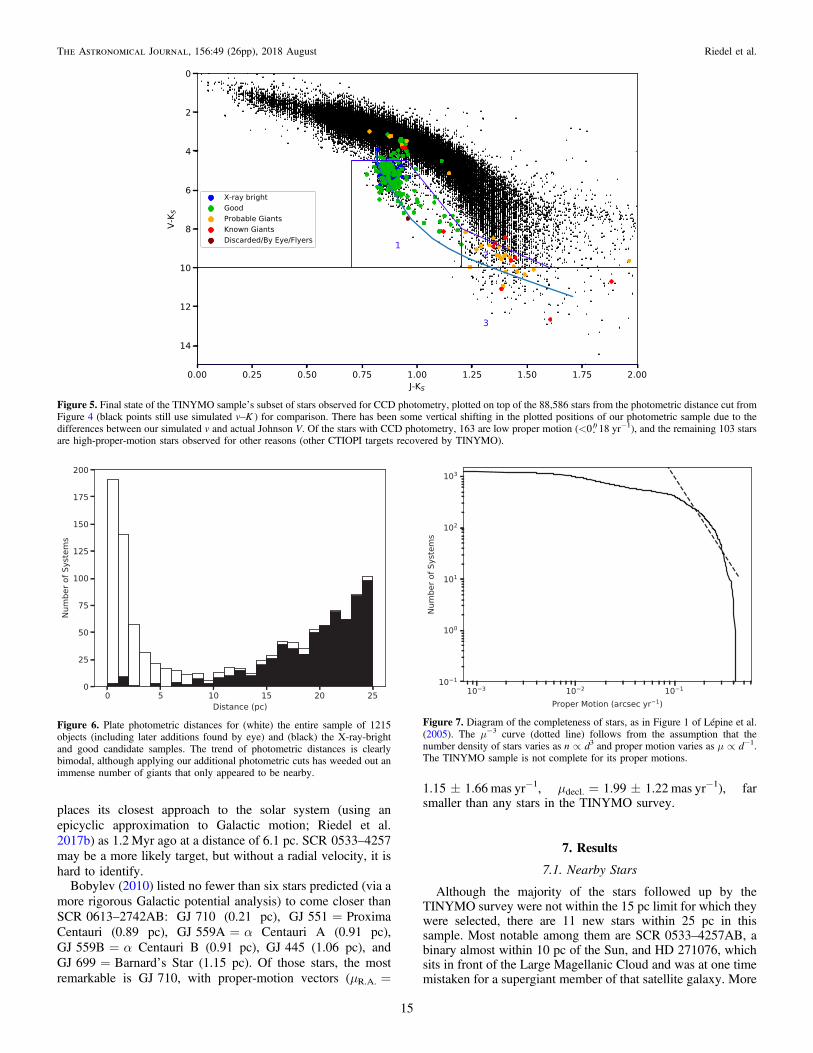
Figure 5 shows the true V−K colors for all targets actuallyobserved for VRI photometry by CTIOPI. This displaces thetargets from where they appeared in Figure 4, which was basedon the simulated v−K colors. It is apparent from Figure 5 thatnot all of our “good” (green) targets are actually dwarfs; someof them now lie in the giant locus (which is still drawn withv−K color as in Figure 4). This is unsurprising, as we arrivedat our “good” sample by process of elimination, and we did nothave the resources to completely vet the sample.Plotting a histogram of distance estimates from plate BRI and
2MASS JHK photometry (Figure 6) shows that the originalsample was bimodal, with peaks at 25 and 1 pc. The giant-sensitive photometric cuts remove most of the stars withpredicted distances less than 2 pc. As expected, all potentialnearby stars with distances less than 2 pc were confirmed withspectroscopy to be giants. All of the 462 nearby low-proper-motion stars (Categories 1 and 2) can be found among the restof the sample in the complete table described in Section 5.
6.2. Completion of TINYMO Sample
TINYMO is not complete in terms of proper motions(Figure 7), but this is not surprising, as TINYMO usesphotometric cuts with no lower proper-motion limit and is not atraditional proper-motion survey. TINYMO is probing therange of proper motions more common for giants, which meanswe also cannot make use of reduced proper-motion diagramsthat operate under the assumption that lower proper-motionobjects are farther away; we are specifically looking for nearby10 See http://www.recons.org for a list of publications.
11
The Astronomical Journal, 156:49 (26pp), 2018 August Riedel et al.

Table 4Astrometric Results for 26 Selected Star Systems
R.A. Decl. π(Rel) π(Corr) π(Abs) μ P.A. Vtan
Name (J2000) (J2000) Filter Nsea Nfrm Coveragea Years Nref (mas) (mas) (mas) (mas yr−1) (deg) (km s−1) Notes(1) (2) (3) (4) (5) (6) (7) (8) (9) (10) (11) (12) (13) (14) (15) (16)
NLTT 01261 00 24 24.63 −01 58 20.0 I 7s 29 2008.70–2015.82 7.12 6 81.58±2.22 0.85±0.07 82.43±2.22 157.1±0.8 336.4±0.54 9.0GIC 0050 00 32 53.14 −04 34 07.0 R 7s 85 2007.82–2015.83 8.01 7 51.89±1.05 0.72±0.07 52.61±1.05 167.2±0.5 156.4±0.32 15.1 *
2MA0112+1703
01 12 35.06 +17 03 55.5 I 3s 36 2013.67–2015.96 2.29 6 18.75±2.15 1.85±0.18 20.60±2.16 134.1±2.6 135.1±2.19 30.8
2MA0123−6921
01 23 11.27 −69 21 38.0 I 7s 53 2008.70–2014.92 6.22 10 22.14±1.37 0.78±0.07 22.92±1.37 87.4±0.7 107.4±0.83 18.1
SCR0128−1458
01 28 39.53 −14 58 04.2 V 7s 70 2009.93–2015.97 6.04 5 71.84±1.35 3.01±0.23 74.85±1.37 71.9±0.8 226.0±1.30 4.6 *
BAR161−012
01 35 13.94 −07 12 51.8 R 6s 70 2009.94–2014.93 4.99 7 26.11±1.78 1.56±0.27 27.67±1.80 93.3±1.2 114.1±1.38 16.0 *
SCR0143−0602
01 43 45.13 −06 02 40.1 V 6s 61 2009.74–2014.91 5.18 7 49.59±1.48 0.93±0.13 50.52±1.49 47.3±0.9 104.5±1.96 4.4 *
SIP0152−6329
01 52 55.35 −63 29 30.2 R 8s 56 2007.82–2014.93 7.11 7 25.14±1.17 1.39±0.23 26.53±1.19 127.0±0.5 95.7±0.38 22.7 *
SCR0222−6022
02 22 44.17 −60 22 47.6 V 6s 52 2009.75–2014.65 4.90 8 31.76±1.66 0.94±0.13 32.70±1.67 126.2±1.3 98.0±0.92 18.3 *
2MA0236−5203
02 36 51.71 −52 03 03.7 V 6s 63 2009.92–2014.93 5.00 6 25.80±1.24 1.90±0.25 27.70±1.26 80.4±0.8 96.5±0.93 13.8
2MA 0254−5108A
02 54 33.17 −51 08 31.4 V 6c 70 2009.92–2014.91 4.99 6 25.10±1.64 1.95±0.24 27.05±1.66 85.9±1.0 94.6±1.04 15.0
2MA 0254−5108B
02 54 34.77 −51 08 28.8 V 6c 70 2009.92–2014.91 4.99 6 20.52±2.04 1.95±0.25 22.47±2.06 88.2±1.3 92.1±1.20 18.6
SCR0336−2619
03 36 31.46 −26 19 57.9 I 7s 68 2008.70–2015.08 6.38 9 21.12±1.09 0.68±0.07 21.80±1.09 76.4±0.5 107.9±0.73 16.6 *
RX0413−0139
04 13 26.64 −01 39 21.2 V 6s 58 2009.94–2015.08 5.14 10 35.68±1.90 0.74±0.17 36.42±1.91 127.0±1.5 93.2±0.99 16.5
2MA 0446−1116AB
04 46 51.74 −11 16 47.7 V 5c 71 2011.73–2016.04 4.31 8 70.77±3.41 0.91±0.23 71.68±3.42 149.1±2.1 249.2±1.48 9.9 *
HD 271076 05 10 09.69 −72 36 27.9 Vb 5c 40 2007.81–2011.74 3.93 7 46.73±2.75 2.78±0.46 49.51±2.79 130.7±2.6 80.3±1.81 12.5 *
SCR 0533−4257AB
05 33 28.03 −42 57 20.5 R 9c 141 2007.81–2016.05 8.24 9 95.46±1.32 0.98±0.21 96.44±1.34 38.8±0.5 328.8±1.48 1.9 *
LP 780−032 06 39 37.41 −21 01 33.3 Vb 8c 111 2008.70–2016.04 7.34 13 62.26±0.58 1.17±0.11 63.43±0.59 179.2±0.3 294.9±0.17 13.4 *
2MA 0936−2610AC
09 36 57.83 −26 10 11.2 V 4c 46 2010.16–2013.38 3.22 9 52.74±1.41 1.01±0.15 53.75±1.42 44.1±1.2 137.7±2.99 3.9 *
SIP 1110−3731AC
11 10 27.88 −37 31 52.0 V 6s 63 2009.32–2014.17 4.85 8 28.41±3.97 0.98±0.12 29.39±3.97 91.8±2.5 263.8±2.42 14.8 *
11 10 27.88 −37 31 52.0 V 6s 46 2009.32–2014.17 4.85 8 30.31±6.82 0.98±0.12 31.29±6.82 114.6±4.4 246.9±4.06 17.4 *
12
TheAstro
nomica
lJourn
al,
156:49(26pp),
2018August
Riedel
etal.
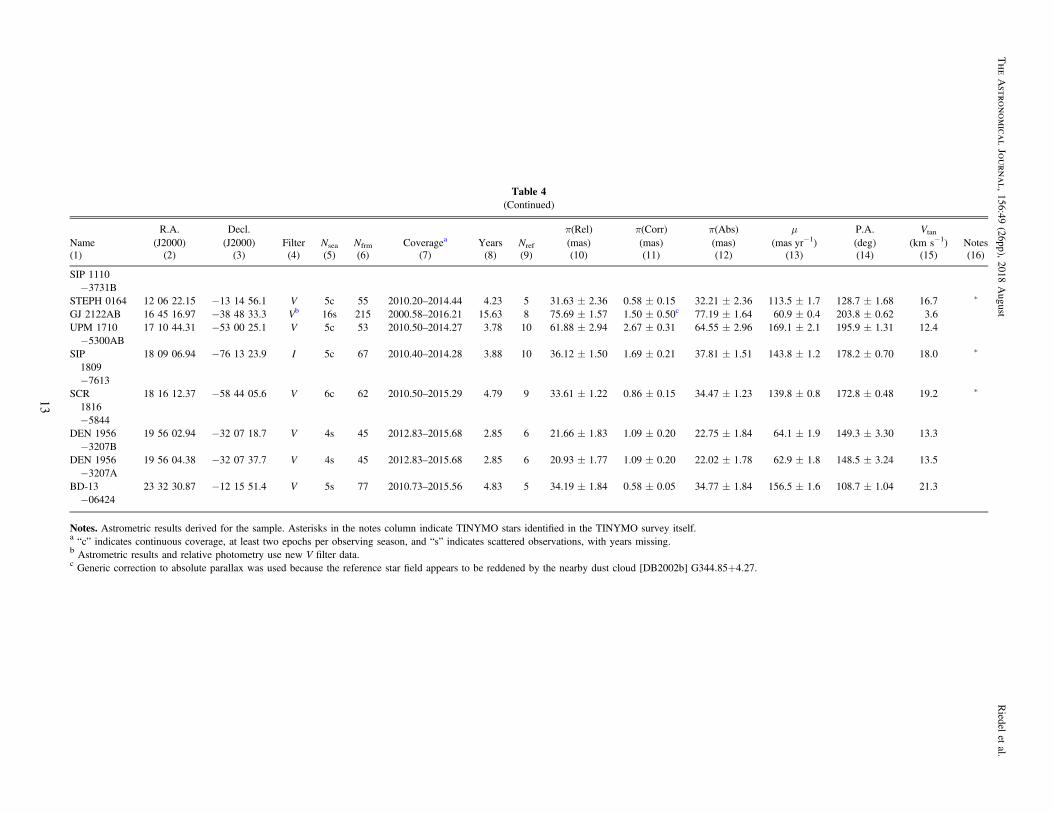
Table 4(Continued)
R.A. Decl. π(Rel) π(Corr) π(Abs) μ P.A. Vtan
Name (J2000) (J2000) Filter Nsea Nfrm Coveragea Years Nref (mas) (mas) (mas) (mas yr−1) (deg) (km s−1) Notes(1) (2) (3) (4) (5) (6) (7) (8) (9) (10) (11) (12) (13) (14) (15) (16)
SIP 1110−3731B
STEPH 0164 12 06 22.15 −13 14 56.1 V 5c 55 2010.20–2014.44 4.23 5 31.63±2.36 0.58±0.15 32.21±2.36 113.5±1.7 128.7±1.68 16.7 *
GJ 2122AB 16 45 16.97 −38 48 33.3 Vb 16s 215 2000.58–2016.21 15.63 8 75.69±1.57 1.50±0.50c 77.19±1.64 60.9±0.4 203.8±0.62 3.6UPM 1710−5300AB
17 10 44.31 −53 00 25.1 V 5c 53 2010.50–2014.27 3.78 10 61.88±2.94 2.67±0.31 64.55±2.96 169.1±2.1 195.9±1.31 12.4
SIP1809−7613
18 09 06.94 −76 13 23.9 I 5c 67 2010.40–2014.28 3.88 10 36.12±1.50 1.69±0.21 37.81±1.51 143.8±1.2 178.2±0.70 18.0 *
SCR1816−5844
18 16 12.37 −58 44 05.6 V 6c 62 2010.50–2015.29 4.79 9 33.61±1.22 0.86±0.15 34.47±1.23 139.8±0.8 172.8±0.48 19.2 *
DEN 1956−3207B
19 56 02.94 −32 07 18.7 V 4s 45 2012.83–2015.68 2.85 6 21.66±1.83 1.09±0.20 22.75±1.84 64.1±1.9 149.3±3.30 13.3
DEN 1956−3207A
19 56 04.38 −32 07 37.7 V 4s 45 2012.83–2015.68 2.85 6 20.93±1.77 1.09±0.20 22.02±1.78 62.9±1.8 148.5±3.24 13.5
BD-13−06424
23 32 30.87 −12 15 51.4 V 5s 77 2010.73–2015.56 4.83 5 34.19±1.84 0.58±0.05 34.77±1.84 156.5±1.6 108.7±1.04 21.3
Notes. Astrometric results derived for the sample. Asterisks in the notes column indicate TINYMO stars identified in the TINYMO survey itself.a“c” indicates continuous coverage, at least two epochs per observing season, and “s” indicates scattered observations, with years missing.
b Astrometric results and relative photometry use new V filter data.c Generic correction to absolute parallax was used because the reference star field appears to be reddened by the nearby dust cloud [DB2002b] G344.85+4.27.
13
TheAstro
nomica
lJourn
al,
156:49(26pp),
2018August
Riedel
etal.
stars that move like distant giants, and as Figure 8 shows, thesurvey contains several such targets.
6.3. The Limit of Meaningful Proper Motion
TINYMO offers a rough idea of the point at which a proper-motion search (even if the proper motions are accurate) will beoverwhelmed by giants. This limit (seen in Figure 9) appears tobe around 0 035 yr−1, which is not coincidentally near thelower limit of Lepine’s SUPERBLINK surveys (Lepine &Gaidos 2013), 0 04 yr−1.
6.4. Why So Many Young Stars?
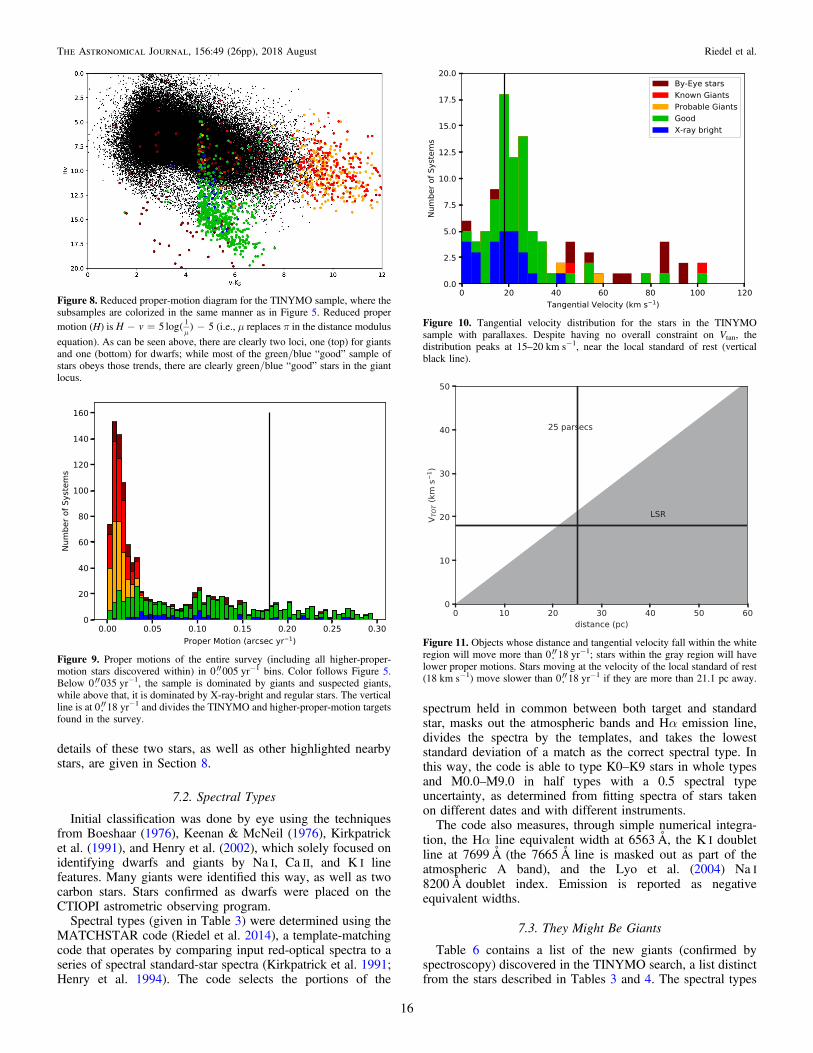
The TINYMO survey contains a large number of nearbyyoung stars (55, counting Riedel et al. 2014, 2017a and thispaper), where they make up perhaps 4% of all stars (Riedelet al. 2017b). There are two primary reasons for this. First, theTINYMO search was carried out using photometric distanceestimates, which assumed every star was a single main-sequence star. Pre-main-sequence M dwarfs are brighter andtherefore appear closer when estimating distances photome-trically, and thus preferentially appear in the sample. Second,the space velocities of nearby stars are clustered around thelocal standard of rest (Figure 10) because they are still largelyfollowing the paths of the gas clouds from which they formed,and the velocity of the local standard of rest falls below0 18 yr−1 beyond 21 pc (Figure 11).The velocity peak at 15–20 km s−1 is only partially a result
of the 0 18 yr−1 proper-motion limit. While it is true that starsmoving at 0 18 yr−1 could have at most 21 km s−1 tangentialvelocities if they were within 25 pc, nearly half of the sample oflow-proper-motion stars was not within 25 pc, and thus the Vtan
was not constrained to 21 km s−1.
6.5. Close Passes to the Solar System
Without radial velocities, it is difficult to determine which,if any, of our objects have made close passes to the solarsystem. As an educated guess, however, we can take the starswith the lowest Vtan velocities as being the most likely tohave purely radial motion. The most obvious contender isSCR0613–2742AB, the β Pic member published in Malo et al.(2013) and Riedel et al. (2014). It does have a published radialvelocity (+22.54±1.16 km s−1; Riedel et al. 2014), which
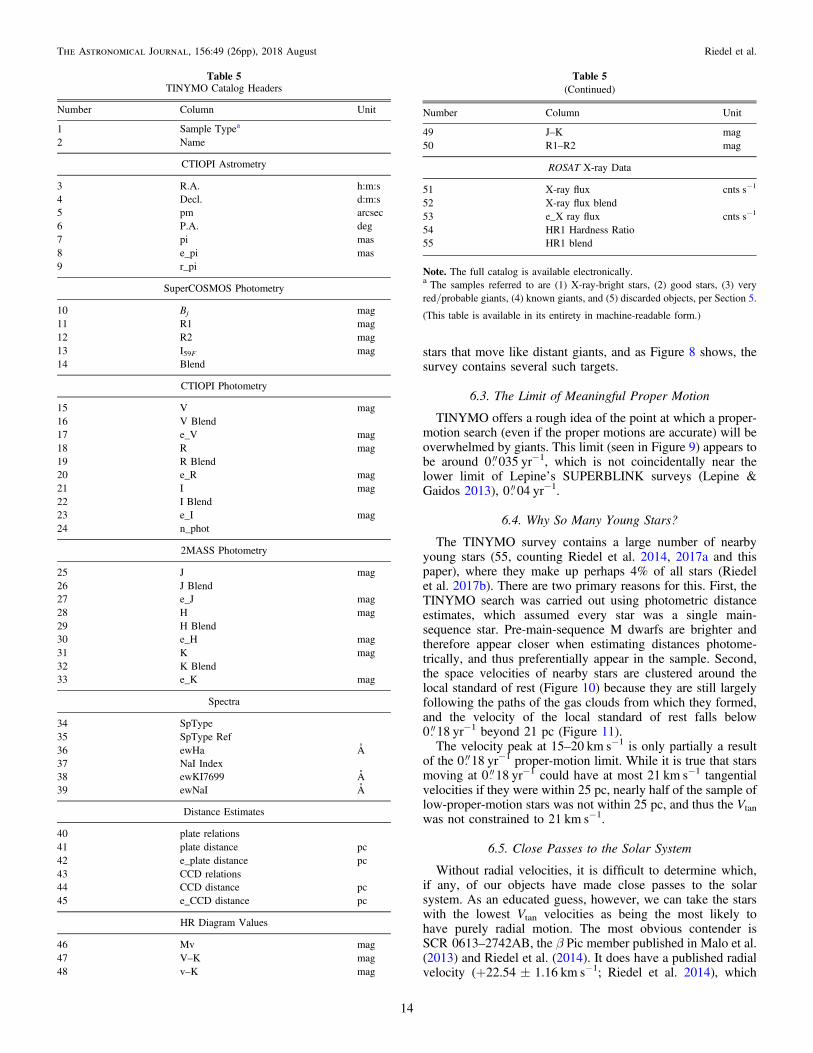
Table 5TINYMO Catalog Headers
Number Column Unit
1 Sample Typea
2 Name
CTIOPI Astrometry
3 R.A. h:m:s4 Decl. d:m:s5 pm arcsec6 P.A. deg7 pi mas8 e_pi mas9 r_pi
SuperCOSMOS Photometry
10 Bj mag11 R1 mag12 R2 mag13 I59F mag14 Blend
CTIOPI Photometry
15 V mag16 V Blend17 e_V mag18 R mag19 R Blend20 e_R mag21 I mag22 I Blend23 e_I mag24 n_phot
2MASS Photometry
25 J mag26 J Blend27 e_J mag28 H mag29 H Blend30 e_H mag31 K mag32 K Blend33 e_K mag
Spectra
34 SpType35 SpType Ref36 ewHa Å37 NaI Index38 ewKI7699 Å39 ewNaI Å
Distance Estimates
40 plate relations41 plate distance pc42 e_plate distance pc43 CCD relations44 CCD distance pc45 e_CCD distance pc
HR Diagram Values
46 Mv mag47 V–K mag48 v–K mag
Table 5(Continued)
Number Column Unit
49 J–K mag50 R1–R2 mag
ROSAT X-ray Data
51 X-ray flux cnts s−1
52 X-ray flux blend53 e_X ray flux cnts s−1
54 HR1 Hardness Ratio55 HR1 blend
Note. The full catalog is available electronically.a The samples referred to are (1) X-ray-bright stars, (2) good stars, (3) veryred/probable giants, (4) known giants, and (5) discarded objects, per Section 5.
(This table is available in its entirety in machine-readable form.)
14
The Astronomical Journal, 156:49 (26pp), 2018 August Riedel et al.
places its closest approach to the solar system (using anepicyclic approximation to Galactic motion; Riedel et al.2017b) as 1.2Myr ago at a distance of 6.1 pc. SCR0533–4257may be a more likely target, but without a radial velocity, it ishard to identify.
Bobylev (2010) listed no fewer than six stars predicted (via amore rigorous Galactic potential analysis) to come closer thanSCR0613–2742AB: GJ710 (0.21 pc), GJ551=ProximaCentauri (0.89 pc), GJ559A=α Centauri A (0.91 pc),GJ559B=α Centauri B (0.91 pc), GJ445 (1.06 pc), andGJ699=Barnard’s Star (1.15 pc). Of those stars, the mostremarkable is GJ710, with proper-motion vectors (μR.A.=
1.15±1.66 mas yr−1, μdecl.=1.99±1.22 mas yr−1), farsmaller than any stars in the TINYMO survey.
7. Results
7.1. Nearby Stars
Although the majority of the stars followed up by theTINYMO survey were not within the 15 pc limit for which theywere selected, there are 11 new stars within 25 pc in thissample. Most notable among them are SCR0533–4257AB, abinary almost within 10 pc of the Sun, and HD 271076, whichsits in front of the Large Magellanic Cloud and was at one timemistaken for a supergiant member of that satellite galaxy. More
Figure 5. Final state of the TINYMO sample’s subset of stars observed for CCD photometry, plotted on top of the 88,586 stars from the photometric distance cut fromFigure 4 (black points still use simulated v–K ) for comparison. There has been some vertical shifting in the plotted positions of our photometric sample due to thedifferences between our simulated v and actual Johnson V. Of the stars with CCD photometry, 163 are low proper motion (<0 18 yr−1), and the remaining 103 starsare high-proper-motion stars observed for other reasons (other CTIOPI targets recovered by TINYMO).
Figure 6. Plate photometric distances for (white) the entire sample of 1215objects (including later additions found by eye) and (black) the X-ray-brightand good candidate samples. The trend of photometric distances is clearlybimodal, although applying our additional photometric cuts has weeded out animmense number of giants that only appeared to be nearby.
Figure 7. Diagram of the completeness of stars, as in Figure 1 of Lépine et al.(2005). The μ−3 curve (dotted line) follows from the assumption that thenumber density of stars varies as n∝d3 and proper motion varies as μ∝d−1.The TINYMO sample is not complete for its proper motions.
15
The Astronomical Journal, 156:49 (26pp), 2018 August Riedel et al.
details of these two stars, as well as other highlighted nearbystars, are given in Section 8.
7.2. Spectral Types
Initial classification was done by eye using the techniquesfrom Boeshaar (1976), Keenan & McNeil (1976), Kirkpatricket al. (1991), and Henry et al. (2002), which solely focused onidentifying dwarfs and giants by Na I, Ca II, and K I linefeatures. Many giants were identified this way, as well as twocarbon stars. Stars confirmed as dwarfs were placed on theCTIOPI astrometric observing program.
Spectral types (given in Table 3) were determined using theMATCHSTAR code (Riedel et al. 2014), a template-matchingcode that operates by comparing input red-optical spectra to aseries of spectral standard-star spectra (Kirkpatrick et al. 1991;Henry et al. 1994). The code selects the portions of the
spectrum held in common between both target and standardstar, masks out the atmospheric bands and Hα emission line,divides the spectra by the templates, and takes the loweststandard deviation of a match as the correct spectral type. Inthis way, the code is able to type K0–K9 stars in whole typesand M0.0–M9.0 in half types with a 0.5 spectral typeuncertainty, as determined from fitting spectra of stars takenon different dates and with different instruments.The code also measures, through simple numerical integra-
tion, the Hα line equivalent width at 6563Å, the K I doubletline at 7699Å(the 7665Åline is masked out as part of theatmospheric A band), and the Lyo et al. (2004) Na I8200Ådoublet index. Emission is reported as negativeequivalent widths.
7.3. They Might Be Giants
Table 6 contains a list of the new giants (confirmed byspectroscopy) discovered in the TINYMO search, a list distinctfrom the stars described in Tables 3 and 4. The spectral types
Figure 8. Reduced proper-motion diagram for the TINYMO sample, where thesubsamples are colorized in the same manner as in Figure 5. Reduced propermotion (H) is - = -
m( )H v 5 log 51 (i.e., μ replaces π in the distance modulus
equation). As can be seen above, there are clearly two loci, one (top) for giantsand one (bottom) for dwarfs; while most of the green/blue “good” sample ofstars obeys those trends, there are clearly green/blue “good” stars in the giantlocus.
Figure 9. Proper motions of the entire survey (including all higher-proper-motion stars discovered within) in 0 005 yr−1 bins. Color follows Figure 5.Below 0 035 yr−1, the sample is dominated by giants and suspected giants,while above that, it is dominated by X-ray-bright and regular stars. The verticalline is at 0 18 yr−1 and divides the TINYMO and higher-proper-motion targetsfound in the survey.
Figure 10. Tangential velocity distribution for the stars in the TINYMOsample with parallaxes. Despite having no overall constraint on Vtan, thedistribution peaks at 15–20 km s−1, near the local standard of rest (verticalblack line).
Figure 11. Objects whose distance and tangential velocity fall within the whiteregion will move more than 0 18 yr−1; stars within the gray region will havelower proper motions. Stars moving at the velocity of the local standard of rest(18 km s−1) move slower than 0 18 yr−1 if they are more than 21.1 pc away.
16
The Astronomical Journal, 156:49 (26pp), 2018 August Riedel et al.

given in the table were assigned by matching to M-dwarfspectra and identified as giants by Na I index measures of lessthan 1.02. Accordingly, not much stock should be placed in theactual spectral types of the giants in Table 6, as M-dwarf typesdo not correspond directly to giant or supergiant classifications;we also do not provide luminosity classes. The Hα emission(denoted by “e” in Table 6) reported for three stars does appearto be genuine. Samus et al. (2012) mentioned “characteristiclate-type emission spectra” in their description of Miravariables, which implies that this is a known phenomenon inat least Mira-type giants.This sample contains 13 new large-amplitude photometric
variables (denoted by “var” in Table 6) based on either muchlarger than typical uncertainties on their CCD photometry(>0.1 mag mean uncertainty, which matches that of knownMiras observed by CTIOPI) or >1 mag discrepancy betweentheir R magnitudes (SuperCOSMOS and our CCD photo-metry). These may be Mira variables, but we lack sufficientevidence of periodicity or the required 2.5 mag amplitude forthe formal definition of Miras. Photometry and other details forthese stars can be found in Table 5.
7.4. Carbon Stars
Three carbon stars were observed during data collection. One,IYHya, was observed as a comparison object; the other two arenew discoveries. Figure 12 shows the spectra of the new starsand a normal M giant for comparison. Based on comparisonswith spectra in Turnshek et al. (1985), they appear to be genuineC-type stars with CN bands at 6900, 7100, 7500, 7900,and 8100Å.
7.5. Reddened Stars
Several reddened stars were picked up in TINYMO; thesemostly appear to be members of various subsets of the Sco-Censtar-forming region. The stars, BD-19–04371 (16:26:23.37–19:31:35.7), SCR1627–1925 (16:27:14.03–19:25:46.7), andSCR1627–1924 (16:27:14.79–19:24:16.3), are all in the
Table 6New Giants and Supergiants in the TINYMO Sample
Name R.A. Decl. SpTypea
(1) (2) (3) (4)
HD 270965 05 00 40.38 −71 57 52.9 K7.0varb
SCR 0659–5954 06 59 10.94 −59 54 58.6 M6.5var,ec
SCR 0703–3507 07 03 49.64 −35 07 44.3 M6.5SCR 0705–3534 07 05 47.36 −35 34 25.8 M6.5SCR 0711–3600 07 11 03.53 −36 00 59.7 CARBONSCR 0747–5412 07 47 14.27 −54 12 02.5 CARBONSCR 0747–6355 07 47 25.60 −63 55 42.3 K7.0SCR 0749–6502 07 49 05.69 −65 02 40.0 K8.0SCR 0753–5150 07 53 24.57 −51 50 22.0 M9.0SCR 0753–6641 07 53 49.77 −66 41 38.3 K9.0SCR 0805–0743 08 05 52.81 −07 43 05.7 M9.0STEPH 0097 08 14 24.82 −13 02 22.6 M6.5SCR 0833–6107 08 33 27.67 −61 07 58.4 M4.5varb
SCR 0857–6734 08 57 38.21 −67 34 10.5 M5.0IRA 08583–2531 09 00 32.06 −25 43 14.1 M8.0SCR 0902–7823 09 02 35.97 −78 23 14.7 M7.5SCR 0910–7214 09 10 57.71 −72 14 52.9 M5.0SCR 0927–8105 09 27 04.18 −81 05 00.7 M4.5var,ec
SCR 0932–2806 09 32 03.32 −28 06 27.0 M9.0SCR 0938–3748 09 38 20.24 −37 48 44.6 M6.5SCR 0945–3430 09 45 43.54 −34 30 18.1 M4.5varc
SCR 1044–7543 10 44 06.77 −75 43 42.2 M2.5SCR 1044–4330 10 44 40.73 −43 30 44.2 M6.5SCR 1048–7739 10 48 26.67 −77 39 19.1 M0.0SCR 1058–4218 10 58 44.39 −42 18 12.3 M6.5SCR 1111–4856 11 11 28.25 −48 56 14.3 M2.5SCR 1138–4338 11 38 13.34 −43 38 04.6 M9.0SCR 1228–4949 12 28 06.16 −49 49 34.5 M5.0STEPH 0172 12 34 41.61 −00 14 14.1 M9.0SCR 1306–4745 13 06 42.81 −47 45 25.7 M6.5varc
SCR 1316–5206 13 16 42.18 −52 06 38.3 M6.5SCR 1317–4643 13 17 56.50 −46 43 54.0 M9.0vard
SCR 1321–4913 13 21 31.72 −49 13 09.6 M7.5SCR 1349–7417 13 49 16.98 −74 17 15.4 M9.0SCR 1358–4910 13 58 43.58 −49 10 52.0 M7.0SCR 1408–3506 14 08 36.51 −35 06 02.3 M6.5SCR 1424–4427 14 24 36.78 −44 27 05.6 M7.5SCR 1427–4731 14 27 43.90 −47 31 13.2 M4.0SCR 1431–4823 14 31 28.46 −48 23 12.1 M7.0SCR 1439–4506 14 39 33.26 −45 06 42.3 M4.5SCR 1440–7837 14 40 37.43 −78 37 11.4 K8.0SCR 1458–4102 14 58 23.80 −41 02 27.9 M7.0vare
CD-81–00572 15 32 44.68 −81 43 53.0 K8.0SCR 1534–7237 15 34 02.51 −72 37 11.1 M6.5SCR 1544–1805 15 44 44.97 −18 05 07.1 M9.0SCR 1551–8047 15 51 10.25 −80 47 51.5 M3.0STEPH 0257 15 58 20.04 −06 03 37.4 M7.0SCR 1604–7009 16 04 23.14 −70 09 03.1 M5.0SCR 1612–6858 16 12 30.09 −68 58 52.7 M6.5SCR 1621–6843 16 21 18.53 −68 43 58.4 M6.5SCR 1647–6436 16 47 48.35 −64 36 43.6 M5.0SCR 1654–0055 16 54 08.17 −00 55 04.9 M9.0SCR 1658–6350 16 58 12.94 −63 50 49.3 M7.5SCR 1706–6426 17 06 39.02 −64 26 23.3 M7.5varc
SCR 1719–6151 17 19 09.42 −61 51 55.7 M9.0SCR 1738–6844 17 38 14.51 −68 44 52.8 M5.0varc
SCR 1743–4959 17 43 35.28 −49 59 10.6 M9.0SCR 1803–7807 18 03 30.88 −78 07 21.7 M4.5SCR 1807–5839 18 07 22.90 −58 39 59.9 M4.5SCR 1919–2943 19 19 23.11 −29 43 15.0 M9.0CD-35–13495 19 27 08.18 −35 15 09.6 M7.5SCR 1943–0138 19 43 43.06 −01 38 31.6 M6.5SCR 1944–3414 19 44 45.52 −34 14 41.2 M9.0
Table 6(Continued)
Name R.A. Decl. SpTypea
(1) (2) (3) (4)
CD-45–13476 19 53 08.97 −45 15 15.5 M7.5SCR 1959–1639 19 59 35.79 −16 39 20.3 M8.0SCR 2000–0837 20 00 58.33 −08 37 27.5 M9.0eSCR 2024–2500 20 24 15.40 −25 00 56.8 M6.5SCR 2038–0409 20 38 45.49 −04 09 27.0 M5.0SCR 2107–5734 21 07 58.01 −57 34 17.5 M7.0vard
SCR 2138–4308 21 38 15.11 −43 08 40.6 M6.5varf
CD-24–17228 22 34 29.69 −24 15 17.7 M6.5SCR 2305–3054 23 05 14.88 −30 54 37.1 M5.0varg
Notes.a Spectral types are derived from comparisons to dwarfs and may not beaccurate. ‘e’ indicates that Hα was found in emission in the spectra.b Variable status inferred from >1 mag R2 and Rkc magnitude mismatch.c Variable status inferred from >1 mag R1 and R2 plate magnitude mismatch.d Variable status inferred from >1 mag R1 and Rkc magnitude mismatch.e Rkc filter variability 0.18 mag.f Rkc filter variability 0.31 mag.g Rkc filter variability 0.54 mag.
17
The Astronomical Journal, 156:49 (26pp), 2018 August Riedel et al.
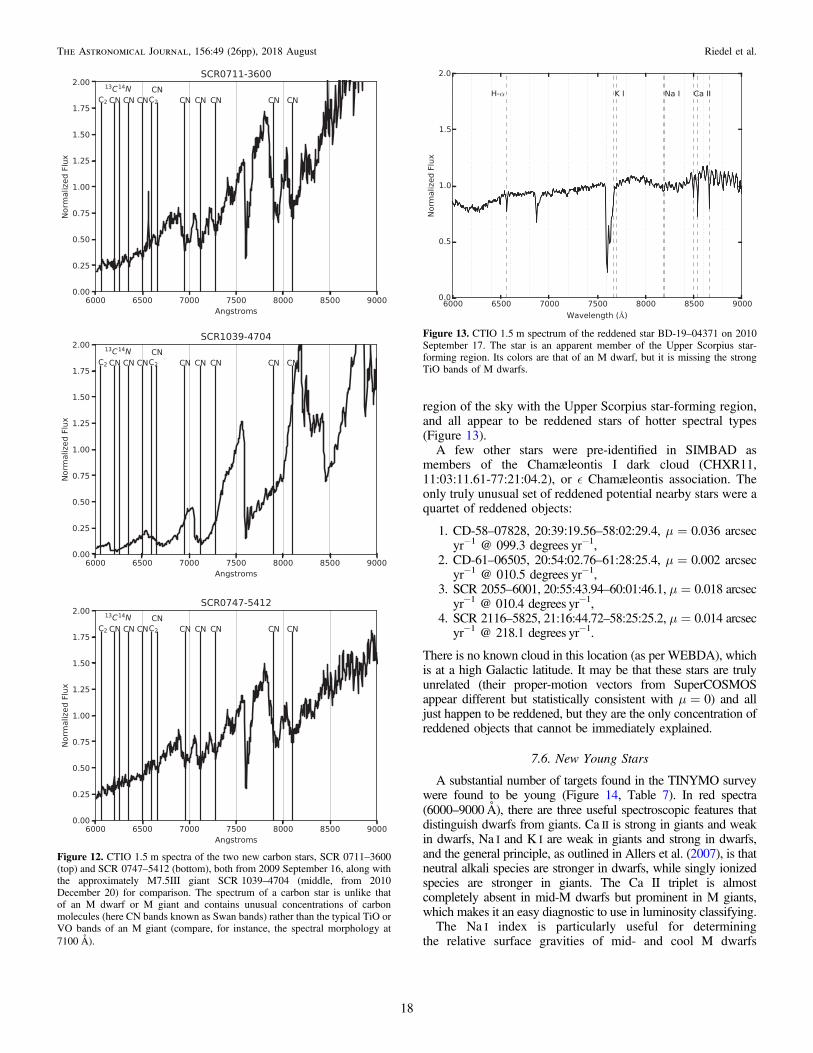
region of the sky with the Upper Scorpius star-forming region,and all appear to be reddened stars of hotter spectral types(Figure 13).A few other stars were pre-identified in SIMBAD as
members of the Chamæleontis I dark cloud (CHXR11,11:03:11.61-77:21:04.2), or ò Chamæleontis association. Theonly truly unusual set of reddened potential nearby stars were aquartet of reddened objects:
1. CD-58–07828, 20:39:19.56–58:02:29.4, μ=0.036 arcsecyr−1 @ 099.3 degrees yr−1,
2. CD-61–06505, 20:54:02.76–61:28:25.4, μ=0.002 arcsecyr−1 @ 010.5 degrees yr−1,
3. SCR2055–6001, 20:55:43.94–60:01:46.1, μ=0.018 arcsecyr−1 @ 010.4 degrees yr−1,
4. SCR2116–5825, 21:16:44.72–58:25:25.2, μ=0.014 arcsecyr−1 @ 218.1 degrees yr−1.
There is no known cloud in this location (as per WEBDA), whichis at a high Galactic latitude. It may be that these stars are trulyunrelated (their proper-motion vectors from SuperCOSMOSappear different but statistically consistent with μ=0) and alljust happen to be reddened, but they are the only concentration ofreddened objects that cannot be immediately explained.
7.6. New Young Stars
A substantial number of targets found in the TINYMO surveywere found to be young (Figure 14, Table 7). In red spectra(6000–9000Å), there are three useful spectroscopic features thatdistinguish dwarfs from giants. Ca II is strong in giants and weakin dwarfs, Na I and K I are weak in giants and strong in dwarfs,and the general principle, as outlined in Allers et al. (2007), is thatneutral alkali species are stronger in dwarfs, while singly ionizedspecies are stronger in giants. The Ca II triplet is almostcompletely absent in mid-M dwarfs but prominent in M giants,which makes it an easy diagnostic to use in luminosity classifying.The Na I index is particularly useful for determining
the relative surface gravities of mid- and cool M dwarfs
Figure 12. CTIO 1.5 m spectra of the two new carbon stars, SCR0711–3600(top) and SCR0747–5412 (bottom), both from 2009 September 16, along withthe approximately M7.5III giant SCR1039–4704 (middle, from 2010December 20) for comparison. The spectrum of a carbon star is unlike thatof an M dwarf or M giant and contains unusual concentrations of carbonmolecules (here CN bands known as Swan bands) rather than the typical TiO orVO bands of an M giant (compare, for instance, the spectral morphology at7100 Å).
Figure 13. CTIO 1.5 m spectrum of the reddened star BD-19–04371 on 2010September 17. The star is an apparent member of the Upper Scorpius star-forming region. Its colors are that of an M dwarf, but it is missing the strongTiO bands of M dwarfs.
18
The Astronomical Journal, 156:49 (26pp), 2018 August Riedel et al.

(Schlieder et al. 2012). For our purposes, we use the Lyo et al.(2004) index constructed from a 24Åwide region redward ofthe Na I 8200Ådoublet divided by a 24Åwide regioncontaining the Na I 8200Ådoublet, as used in Murphy et al.(2010, 2013), Riedel et al. (2011), Rodriguez et al. (2013), andRiedel et al. (2014). Empirically, we have found that an indexof 1.02 or less indicates a giant, and intermediate index valuesbetween dwarfs (which increase to lower temperatures) andgiants (which remain flat at 1.02) indicate a low-surface-gravitypre-main-sequence star. The results for the astrometric sampleof stars are shown in Figure 15.
Unfortunately, giants and dwarfs overlap at colors bluerthan V−Ks=5. Alkali metal lines such as Na I can also beaffected by stellar activity, where emission fills in theabsorption-line cores, leading to lower EWs (Reid & Hawley1999). Slesnick et al. (2006) noted that the Na I doublet can beaffected by telluric absorption over the region 8161–8282Å,leading to artificially low Na I index values for stars observed atlarge airmasses. Our results have large systematic errorsbecause of this uncorrected telluric absorption.
We also use the K I 7699Ådoublet line (though not itscompanion at 7665Å, because that portion of the spectrum iscontaminated by the atmospheric A band) equivalent width asan independent indicator of surface gravity. Results inFigure 16 demonstrate again that several of the TINYMO starsare young because they lie below the envelope of field stars.
Many of the stars in this sample have Hα in emission (seeFigure 17). As noted by Zuckerman & Song (2004) and Westet al. (2008), Hα activity persists in M dwarfs for long periodsof time, which means that Hα itself is not a suitable source ofyouth. Strong Hα emission has been linked to accretion and TTauri status, but none of these stars comes close to the White &Basri (2003) limit.
The other available means for judging the youth of the starsstudied here is kinematics, through which stars can be matchedto nearby young moving groups (NYMGs) like β Pictoris(Song et al. 2002) and Tucana-Horologium (Zuckermanet al. 2001). The CTIOPI astrometry provides accurate valuesof five of the six kinematic elements (R.A., decl., μR.A., μdecl.,and parallax; missing only RV) necessary to fully describe a
star’s position and motion. The LACEwING code (Riedelet al. 2017b) can accommodate partial information andcalculate the probability of membership in 13 NYMGs andthree nearby open clusters.LACEwING has two modes of operation: field and young
star mode. In field star mode, the probabilities are calculatedallowing for the possibility that the star is a field star withcoincidentally similar space velocities to those of a youngmoving group (where field stars outnumber moving groupmembers 50:1). In young star mode, the probabilities arecalculated assuming that the star is known to be spectro-scopically or photometrically young, and young field stars areevenly matched with young moving group members, 1:1. Weconsider LACEwING membership probabilities of 20%–50%to be low, 50%–75% to be medium, and 75%–100% to be high.For objects with low surface gravity (below the gray lines in
either Figure 15 or Figure 16), we have used LACEwING’syoung star mode. For all other objects, we have used field starmode. We are accordingly biased against identifying membersof AB Doradus (125 Myr) and older groups, where M-dwarfsurface gravities are indistinguishable from field stars. Theresults of this study and spectroscopic measurements are givenin Table 7.
8. System Notes
Here we describe each of the 26 systems for whichparallaxes are published in this paper in Table 4. See alsoTable 8 for details on the various multiple systems.(0024–0158) NLTT1261—BRI0021–0214 (MV=19.46,
V−Ks=9.34) has V=19.88, making it the faintest star inthe optical VRI bandpasses in this survey. Our parallax(82.4±2.2 mas) is consistent with that of Tinney et al.(1995; 86.6±4.0 mas) and represents a factor of twoimprovement in the uncertainty.(0032–0434) GIC50—(MV=12.75, V−Ks=5.62) exhi-
bits a perturbation due to an unseen companion spanning thefull 8 yr of our data, as shown in Figure 18. A fit has been madeto the data and the perturbation removed to derive theastrometry results given in Table 4. The system was resolvedwith AstraLux by Janson et al. (2014), who found it to be atriple with companions at 0 508 and 0 213.(0112+1703) 2MA0112+1703—(MV=10.71, V−Ks=
4.79) was identified by Malo et al. (2013) as a potentialmember of AB Dor, but the identification was less certainbecause the star had no measured parallax or radial velocity.While Malo et al. (2014) furnished a radial velocity, this is thefirst parallax. With all available information, the system is stilla high-probability member of AB Dor. We do not have aspectrum of 2MA0112+1703, but AB Dor members are tooold to distinguish from field stars by Na I or K I surface gravity,so a spectrum would not be expected to show any of the signsof youth we are looking for.(0123–6921) 2MA0123–6921—(MV=15.92, V−Ks=
7.80) is a color–magnitude diagram match (we haveno spectrum to measure its Hα or gravity features) for theTW Hydra association, but like SCR0103–5515 andSCR0336–2610 in Riedel et al. (2014), this system is on thewrong side of the sky from all known members. It iskinematically consistent with Tuc-Hor and to a lesser extentAB Dor but would have to be a higher-order multiple to alignwith other members of those groups on the HR diagram. Weconclude that the system must be young and assign it to
Figure 14. Color–absolute-magnitude diagram for the stars with follow-upastrometry and photometry from this paper, plotted against the RECONS 10 pcsample. A substantial number of stars lie beyond 25 pc of the Sun and are morethan a magnitude overluminous compared to the mostly main-sequence stars inthe RECONS 10 pc sample.
19
The Astronomical Journal, 156:49 (26pp), 2018 August Riedel et al.

Tuc-Hor; we note that it is likely to be a triple or quadruple inthat case but find no evidence in our astrometric data.(0128–1458) SCR0128–1458—(MV=12.97, V−Ks=
5.40) shows a possible perturbation in the 6 yr of data
Table 7Youth Criteria of Parallax Targets
Name LACEwING Kinematic Hα Na Index KI EW Youth NoteGroup Prob. (%) RV (km s−1) Å idx. Å Flagsa
(1) (2) (3) (4) (5) (6) (7) (8) (9)
NLTT 1261 (None) LGIC 50 (None) −1.83 1.22 2.05 *
2MA 0112+1703 AB Dor 73 −1.4±1.9 L2MA 0123−6921 Tuc-Hor 85 +9.9±3.4 LSCR 0128−1458 (None) −3.49 1.22 2.23 *
BAR 161−012 (None) −10.51 1.15 1.43 h N K *
SCR 0143−0602 (None) −5.32 1.20 1.76 *
SIPS 0152−6329 Tuc-Hor 80 +10.4±3.4 −9.72 1.19 2.52 N *
SCR 0222−6022 Tuc-Hor 88 +11.5±3.3 −11.56 1.18 1.07 h N K *
2MA 0236−5203 Tuc-Hor 86 +11.7±3.1 −5.53 1.09 0.54 N2MA 0254−5108A Tuc-Hor 33 +12.7±3.1 −2.08 1.09 0.662MA 0254−5108B Tuc-Hor 63 +12.6±3.1 LSCR 0336−2619 Tuc-Hor 67 +13.5±2.6 −10.19 1.25 2.47 h N K *
RX 0413−0139 (None) −10.54 1.18 1.11 h N K2MA 0446−1116AB (None) LHD 271076 (None) +0.20 1.11 0.82 *
SCR 0533−4257AB (None) −4.63 1.20 1.95 *
LP 780−032 Argus 38 +23.8±1.8 −0.26 1.21 1.692MA 0936−2610AC (None) −2.36 1.26 2.45 *
SIPS 1110−3731AC TW Hya 72 +12.7±2.2 −9.21 1.10 0.51 N K *
SIPS 1110−3731B TW Hya 62 +12.7±2.2 −9.21 1.10 0.51 N K *
STEPH 164 (None) −4.25 1.15 1.38 *
GJ 2122AB (None) +0.28 1.08 0.82UPM 1710−5300AB (None) LSIPS 1809−7613 β Pic 31 +6.4±2.6 −8.31 1.17 1.98 N K *
SCR 1816−5844 Argus 69 −13.0±1.9 −6.50 1.15 1.09 N *
DEN 1956−3207B (None) LDEN 1956−3207A (None) LBD-13–6424 β Pic 30 +0.9±1.6 L
Notes. Youth properties are of stars in Tables 3 and 4.a Youth flags are “h”: Hα stronger than −10 Å; “N”: low surface gravity by sodium index; “K”: low surface gravity by potassium EW. In all cases, these stars appearsbelow the curves in Figures 15, 16, and 17.
Figure 15. The Na I index from Lyo et al. (2004) vs. V−Ks. TINYMOobjects measured spectroscopically are shown as large black points with errorbars; the smaller points are young stars from Riedel et al. (2017b) and otherRECONS spectral holdings measured with MATCHSTAR. A 25-point movingaverage (thick black line) and standard deviation (gray line) show theboundaries of inactive stars and demonstrate that many of our targets havelower surface gravities than typical field stars, though many are consistent withor even higher than the field locus.
Figure 16. Same as Figure 15 but for the K I equivalent width.
20
The Astronomical Journal, 156:49 (26pp), 2018 August Riedel et al.
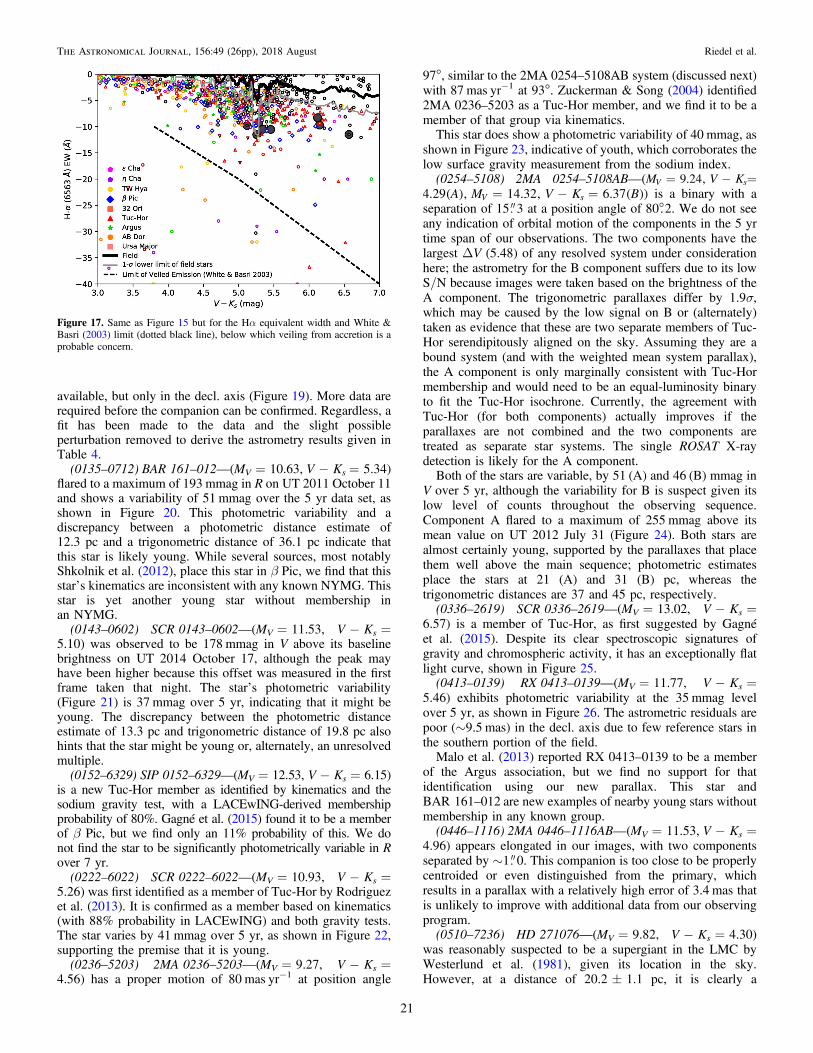
available, but only in the decl. axis (Figure 19). More data arerequired before the companion can be confirmed. Regardless, afit has been made to the data and the slight possibleperturbation removed to derive the astrometry results given inTable 4.
(0135–0712) BAR161–012—(MV=10.63, V−Ks =5.34)flared to a maximum of 193 mmag in R on UT 2011 October 11and shows a variability of 51 mmag over the 5 yr data set, asshown in Figure 20. This photometric variability and adiscrepancy between a photometric distance estimate of12.3 pc and a trigonometric distance of 36.1 pc indicate thatthis star is likely young. While several sources, most notablyShkolnik et al. (2012), place this star in β Pic, we find that thisstar’s kinematics are inconsistent with any known NYMG. Thisstar is yet another young star without membership inan NYMG.
(0143–0602) SCR0143–0602—(MV=11.53, V−Ks=5.10) was observed to be 178 mmag in V above its baselinebrightness on UT 2014 October 17, although the peak mayhave been higher because this offset was measured in the firstframe taken that night. The star’s photometric variability(Figure 21) is 37 mmag over 5 yr, indicating that it might beyoung. The discrepancy between the photometric distanceestimate of 13.3 pc and trigonometric distance of 19.8 pc alsohints that the star might be young or, alternately, an unresolvedmultiple.
(0152–6329) SIP0152–6329—(MV=12.53, V−Ks=6.15)is a new Tuc-Hor member as identified by kinematics and thesodium gravity test, with a LACEwING-derived membershipprobability of 80%. Gagné et al. (2015) found it to be a memberof β Pic, but we find only an 11% probability of this. We donot find the star to be significantly photometrically variable in Rover 7 yr.
(0222–6022) SCR0222–6022—(MV=10.93, V−Ks=5.26) was first identified as a member of Tuc-Hor by Rodriguezet al. (2013). It is confirmed as a member based on kinematics(with 88% probability in LACEwING) and both gravity tests.The star varies by 41 mmag over 5 yr, as shown in Figure 22,supporting the premise that it is young.
(0236–5203) 2MA0236–5203—(MV=9.27, V−Ks=4.56) has a proper motion of 80 mas yr−1 at position angle
97°, similar to the 2MA 0254–5108AB system (discussed next)with 87 mas yr−1 at 93°. Zuckerman & Song (2004) identified2MA 0236–5203 as a Tuc-Hor member, and we find it to be amember of that group via kinematics.This star does show a photometric variability of 40 mmag, as
shown in Figure 23, indicative of youth, which corroborates thelow surface gravity measurement from the sodium index.(0254–5108) 2MA 0254–5108AB—( = - =M V K9.24,V s
= - =( ) ( )A M V K B4.29 , 14.32, 6.37V s ) is a binary with aseparation of 15 3 at a position angle of 80°.2. We do not seeany indication of orbital motion of the components in the 5 yrtime span of our observations. The two components have thelargest ΔV (5.48) of any resolved system under considerationhere; the astrometry for the B component suffers due to its lowS/N because images were taken based on the brightness of theA component. The trigonometric parallaxes differ by 1.9σ,which may be caused by the low signal on B or (alternately)taken as evidence that these are two separate members of Tuc-Hor serendipitously aligned on the sky. Assuming they are abound system (and with the weighted mean system parallax),the A component is only marginally consistent with Tuc-Hormembership and would need to be an equal-luminosity binaryto fit the Tuc-Hor isochrone. Currently, the agreement withTuc-Hor (for both components) actually improves if theparallaxes are not combined and the two components aretreated as separate star systems. The single ROSAT X-raydetection is likely for the A component.Both of the stars are variable, by 51 (A) and 46 (B) mmag in
V over 5 yr, although the variability for B is suspect given itslow level of counts throughout the observing sequence.Component A flared to a maximum of 255 mmag above itsmean value on UT 2012 July 31 (Figure 24). Both stars arealmost certainly young, supported by the parallaxes that placethem well above the main sequence; photometric estimatesplace the stars at 21 (A) and 31 (B) pc, whereas thetrigonometric distances are 37 and 45 pc, respectively.(0336–2619) SCR0336–2619—(MV=13.02, V−Ks=
6.57) is a member of Tuc-Hor, as first suggested by Gagnéet al. (2015). Despite its clear spectroscopic signatures ofgravity and chromospheric activity, it has an exceptionally flatlight curve, shown in Figure 25.(0413–0139) RX0413–0139—(MV=11.77, V−Ks=
5.46) exhibits photometric variability at the 35 mmag levelover 5 yr, as shown in Figure 26. The astrometric residuals arepoor (∼9.5 mas) in the decl. axis due to few reference stars inthe southern portion of the field.Malo et al. (2013) reported RX 0413–0139 to be a member
of the Argus association, but we find no support for thatidentification using our new parallax. This star andBAR161–012 are new examples of nearby young stars withoutmembership in any known group.(0446–1116) 2MA0446–1116AB—(MV=11.53, V−Ks=
4.96) appears elongated in our images, with two componentsseparated by ∼1 0. This companion is too close to be properlycentroided or even distinguished from the primary, whichresults in a parallax with a relatively high error of 3.4 mas thatis unlikely to improve with additional data from our observingprogram.(0510–7236) HD271076—(MV=9.82, V−Ks=4.30)
was reasonably suspected to be a supergiant in the LMC byWesterlund et al. (1981), given its location in the sky.However, at a distance of 20.2±1.1 pc, it is clearly a
Figure 17. Same as Figure 15 but for the Hα equivalent width and White &Basri (2003) limit (dotted black line), below which veiling from accretion is aprobable concern.
21
The Astronomical Journal, 156:49 (26pp), 2018 August Riedel et al.
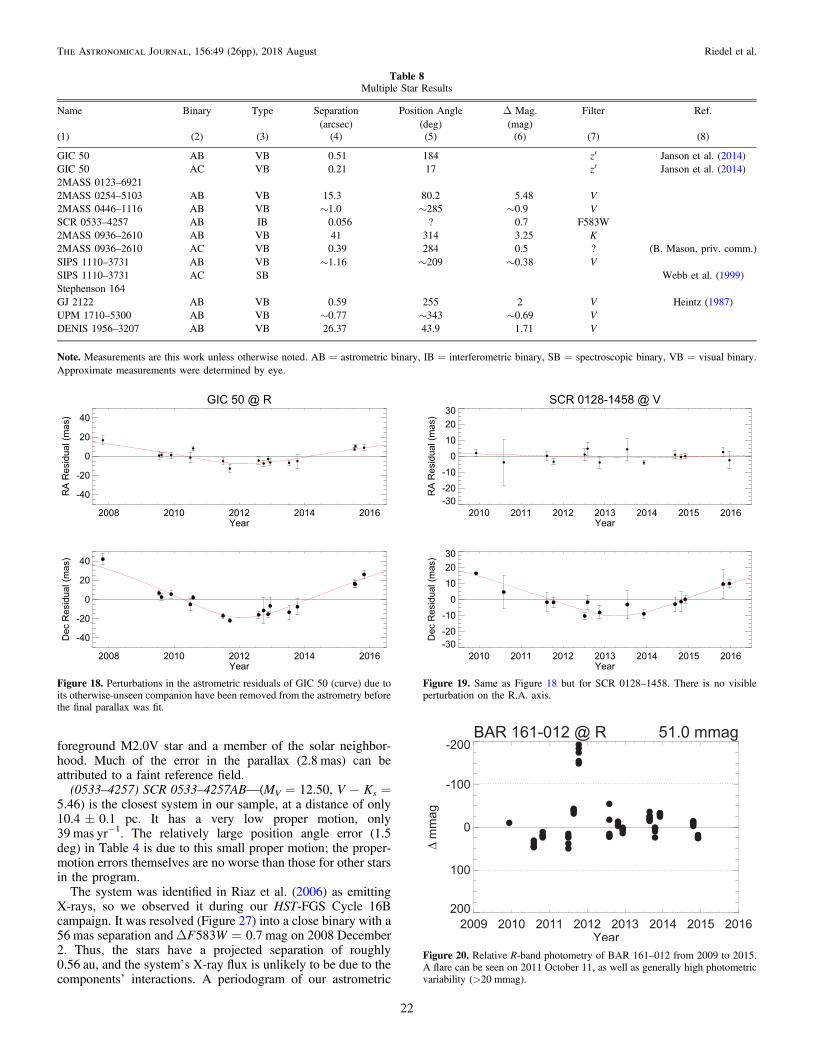
foreground M2.0V star and a member of the solar neighbor-hood. Much of the error in the parallax (2.8 mas) can beattributed to a faint reference field.
(0533–4257) SCR0533–4257AB—(MV=12.50, V−Ks =5.46) is the closest system in our sample, at a distance of only10.4±0.1 pc. It has a very low proper motion, only39 mas yr−1. The relatively large position angle error (1.5deg) in Table 4 is due to this small proper motion; the proper-motion errors themselves are no worse than those for other starsin the program.
The system was identified in Riaz et al. (2006) as emittingX-rays, so we observed it during our HST-FGS Cycle 16Bcampaign. It was resolved (Figure 27) into a close binary with a56 mas separation andD =F W583 0.7 mag on 2008 December2. Thus, the stars have a projected separation of roughly0.56 au, and the system’s X-ray flux is unlikely to be due to thecomponents’ interactions. A periodogram of our astrometric
Table 8Multiple Star Results
Name Binary Type Separation Position Angle Δ Mag. Filter Ref.(arcsec) (deg) (mag)
(1) (2) (3) (4) (5) (6) (7) (8)
GIC 50 AB VB 0.51 184 z′ Janson et al. (2014)GIC 50 AC VB 0.21 17 z′ Janson et al. (2014)2MASS 0123–69212MASS 0254–5103 AB VB 15.3 80.2 5.48 V2MASS 0446–1116 AB VB ∼1.0 ∼285 ∼0.9 VSCR 0533–4257 AB IB 0.056 ? 0.7 F583W2MASS 0936–2610 AB VB 41 314 3.25 K2MASS 0936–2610 AC VB 0.39 284 0.5 ? (B. Mason, priv. comm.)SIPS 1110–3731 AB VB ∼1.16 ∼209 ∼0.38 VSIPS 1110–3731 AC SB Webb et al. (1999)Stephenson 164GJ 2122 AB VB 0.59 255 2 V Heintz (1987)UPM 1710–5300 AB VB ∼0.77 ∼343 ∼0.69 VDENIS 1956–3207 AB VB 26.37 43.9 1.71 V
Note. Measurements are this work unless otherwise noted. AB=astrometric binary, IB=interferometric binary, SB=spectroscopic binary, VB=visual binary.Approximate measurements were determined by eye.
Figure 18. Perturbations in the astrometric residuals of GIC50 (curve) due toits otherwise-unseen companion have been removed from the astrometry beforethe final parallax was fit.
Figure 19. Same as Figure 18 but for SCR 0128–1458. There is no visibleperturbation on the R.A. axis.
Figure 20. Relative R-band photometry of BAR161–012 from 2009 to 2015.A flare can be seen on 2011 October 11, as well as generally high photometricvariability (>20 mmag).
22
The Astronomical Journal, 156:49 (26pp), 2018 August Riedel et al.
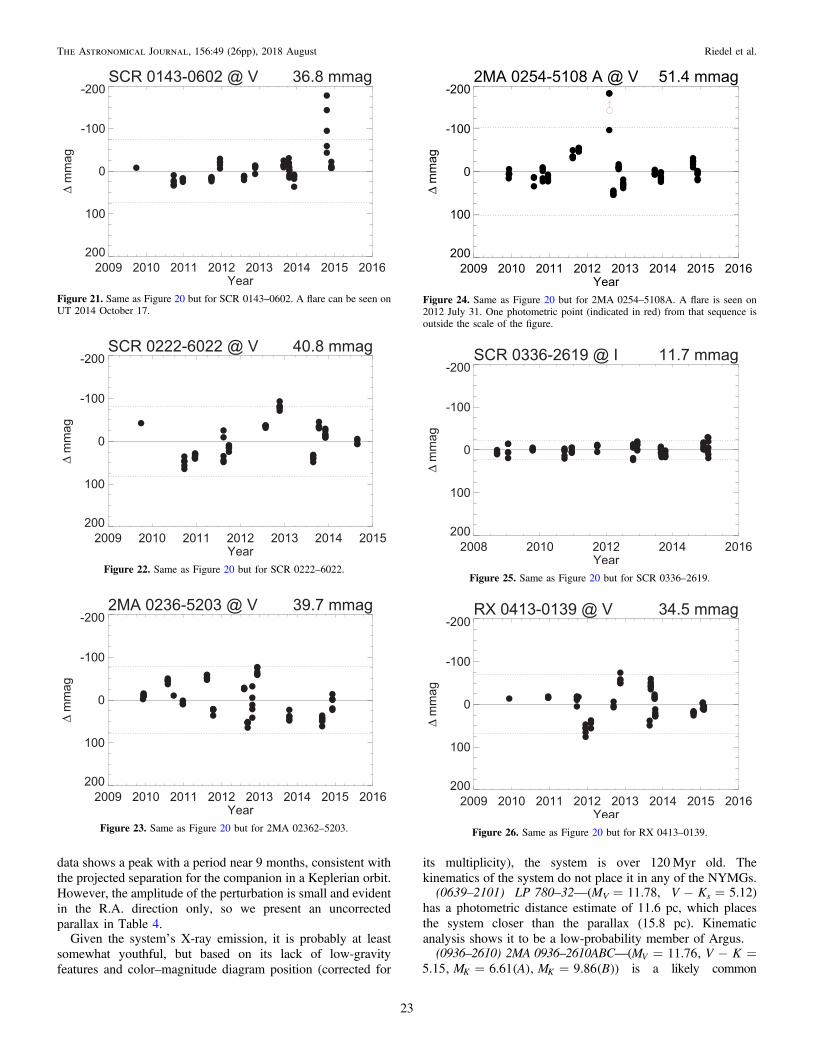
data shows a peak with a period near 9 months, consistent withthe projected separation for the companion in a Keplerian orbit.However, the amplitude of the perturbation is small and evidentin the R.A. direction only, so we present an uncorrectedparallax in Table 4.
Given the system’s X-ray emission, it is probably at leastsomewhat youthful, but based on its lack of low-gravityfeatures and color–magnitude diagram position (corrected for
its multiplicity), the system is over 120Myr old. Thekinematics of the system do not place it in any of the NYMGs.(0639–2101) LP780–32—(MV=11.78, V−Ks=5.12)
has a photometric distance estimate of 11.6 pc, which placesthe system closer than the parallax (15.8 pc). Kinematicanalysis shows it to be a low-probability member of Argus.(0936–2610) 2MA0936–2610ABC—( = - =M V K11.76,V
= =( ) ( )M A M B5.15, 6.61 , 9.86K K ) is a likely common
Figure 21. Same as Figure 20 but for SCR0143–0602. A flare can be seen onUT 2014 October 17.
Figure 22. Same as Figure 20 but for SCR0222–6022.
Figure 23. Same as Figure 20 but for 2MA02362–5203.
Figure 24. Same as Figure 20 but for 2MA0254–5108A. A flare is seen on2012 July 31. One photometric point (indicated in red) from that sequence isoutside the scale of the figure.
Figure 25. Same as Figure 20 but for SCR0336–2619.
Figure 26. Same as Figure 20 but for RX0413–0139.
23
The Astronomical Journal, 156:49 (26pp), 2018 August Riedel et al.
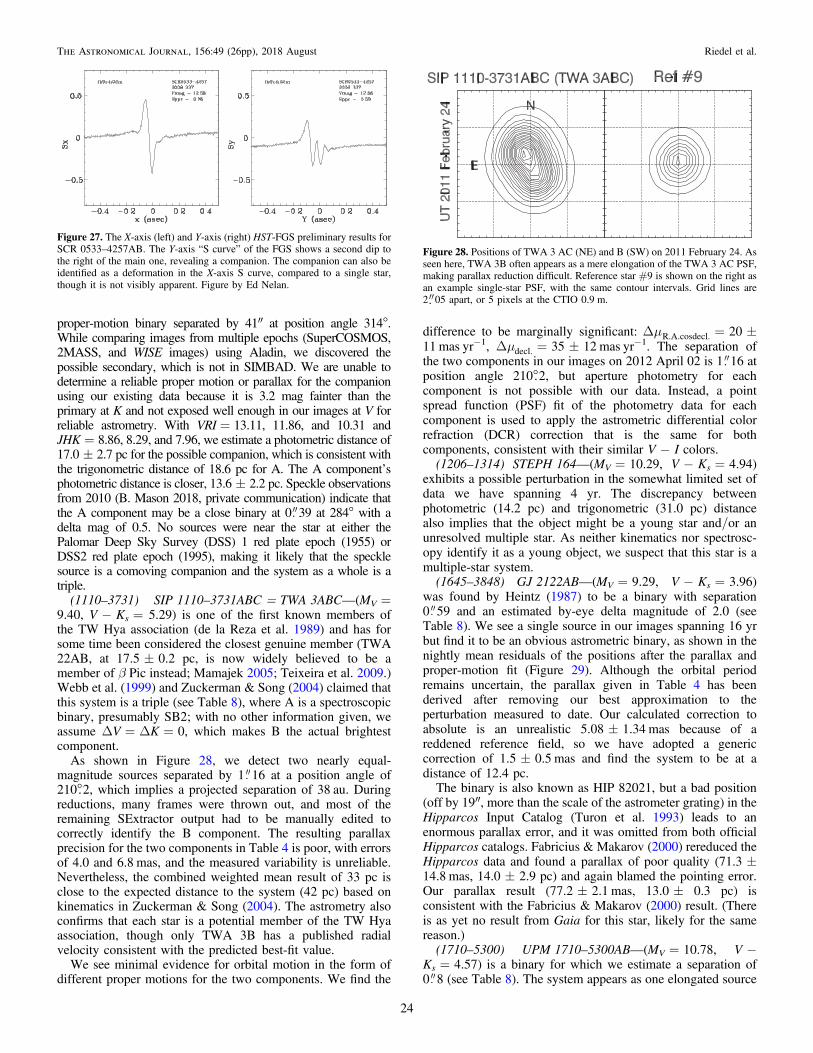
proper-motion binary separated by 41″ at position angle 314°.While comparing images from multiple epochs (SuperCOSMOS,2MASS, and WISE images) using Aladin, we discovered thepossible secondary, which is not in SIMBAD. We are unable todetermine a reliable proper motion or parallax for the companionusing our existing data because it is 3.2 mag fainter than theprimary at K and not exposed well enough in our images at V forreliable astrometry. With VRI=13.11, 11.86, and 10.31 andJHK=8.86, 8.29, and 7.96, we estimate a photometric distance of17.0±2.7 pc for the possible companion, which is consistent withthe trigonometric distance of 18.6 pc for A. The A component’sphotometric distance is closer, 13.6±2.2 pc. Speckle observationsfrom 2010 (B. Mason 2018, private communication) indicate thatthe A component may be a close binary at 0 39 at 284° with adelta mag of 0.5. No sources were near the star at either thePalomar Deep Sky Survey (DSS) 1 red plate epoch (1955) orDSS2 red plate epoch (1995), making it likely that the specklesource is a comoving companion and the system as a whole is atriple.
(1110–3731) SIP1110–3731ABC=TWA3ABC—(MV=9.40, V−Ks= 5.29) is one of the first known members ofthe TW Hya association (de la Reza et al. 1989) and has forsome time been considered the closest genuine member (TWA22AB, at 17.5±0.2 pc, is now widely believed to be amember of β Pic instead; Mamajek 2005; Teixeira et al. 2009.)Webb et al. (1999) and Zuckerman & Song (2004) claimed thatthis system is a triple (see Table 8), where A is a spectroscopicbinary, presumably SB2; with no other information given, weassume ΔV=ΔK=0, which makes B the actual brightestcomponent.
As shown in Figure 28, we detect two nearly equal-magnitude sources separated by 1 16 at a position angle of210°.2, which implies a projected separation of 38 au. Duringreductions, many frames were thrown out, and most of theremaining SExtractor output had to be manually edited tocorrectly identify the B component. The resulting parallaxprecision for the two components in Table 4 is poor, with errorsof 4.0 and 6.8 mas, and the measured variability is unreliable.Nevertheless, the combined weighted mean result of 33 pc isclose to the expected distance to the system (42 pc) based onkinematics in Zuckerman & Song (2004). The astrometry alsoconfirms that each star is a potential member of the TW Hyaassociation, though only TWA 3B has a published radialvelocity consistent with the predicted best-fit value.
We see minimal evidence for orbital motion in the form ofdifferent proper motions for the two components. We find the
difference to be marginally significant: mD R.A.cosdecl.=20±11 mas yr−1, mD decl.=35±12 mas yr−1. The separation ofthe two components in our images on 2012 April 02 is 1 16 atposition angle 210°.2, but aperture photometry for eachcomponent is not possible with our data. Instead, a pointspread function (PSF) fit of the photometry data for eachcomponent is used to apply the astrometric differential colorrefraction (DCR) correction that is the same for bothcomponents, consistent with their similar V−I colors.(1206–1314) STEPH164—(MV=10.29, V−Ks=4.94)
exhibits a possible perturbation in the somewhat limited set ofdata we have spanning 4 yr. The discrepancy betweenphotometric (14.2 pc) and trigonometric (31.0 pc) distancealso implies that the object might be a young star and/or anunresolved multiple star. As neither kinematics nor spectrosc-opy identify it as a young object, we suspect that this star is amultiple-star system.(1645–3848) GJ2122AB—(MV=9.29, V−Ks=3.96)
was found by Heintz (1987) to be a binary with separation0 59 and an estimated by-eye delta magnitude of 2.0 (seeTable 8). We see a single source in our images spanning 16 yrbut find it to be an obvious astrometric binary, as shown in thenightly mean residuals of the positions after the parallax andproper-motion fit (Figure 29). Although the orbital periodremains uncertain, the parallax given in Table 4 has beenderived after removing our best approximation to theperturbation measured to date. Our calculated correction toabsolute is an unrealistic 5.08±1.34 mas because of areddened reference field, so we have adopted a genericcorrection of 1.5±0.5 mas and find the system to be at adistance of 12.4 pc.The binary is also known as HIP82021, but a bad position
(off by 19″, more than the scale of the astrometer grating) in theHipparcos Input Catalog (Turon et al. 1993) leads to anenormous parallax error, and it was omitted from both officialHipparcos catalogs. Fabricius & Makarov (2000) rereduced theHipparcos data and found a parallax of poor quality (71.3±14.8 mas, 14.0±2.9 pc) and again blamed the pointing error.Our parallax result (77.2±2.1 mas, 13.0± 0.3 pc) isconsistent with the Fabricius & Makarov (2000) result. (Thereis as yet no result from Gaia for this star, likely for the samereason.)(1710–5300) UPM1710–5300AB—(MV=10.78, V−
Ks=4.57) is a binary for which we estimate a separation of0 8 (see Table 8). The system appears as one elongated source
Figure 27. The X-axis (left) and Y-axis (right) HST-FGS preliminary results forSCR0533–4257AB. The Y-axis “S curve” of the FGS shows a second dip tothe right of the main one, revealing a companion. The companion can also beidentified as a deformation in the X-axis S curve, compared to a single star,though it is not visibly apparent. Figure by Ed Nelan.
Figure 28. Positions of TWA 3 AC (NE) and B (SW) on 2011 February 24. Asseen here, TWA 3B often appears as a mere elongation of the TWA 3 AC PSF,making parallax reduction difficult. Reference star #9 is shown on the right asan example single-star PSF, with the same contour intervals. Grid lines are2 05 apart, or 5 pixels at the CTIO 0.9 m.
24
The Astronomical Journal, 156:49 (26pp), 2018 August Riedel et al.

in our data, and we determine a single parallax for thecombined system with relatively high error (3.0 mas).
(1809–7613) SIPS1809–7613—(MV=13.00, V−Ks=6.12) is a possible member of β Pictoris, as determined by alow-probability LACEwING membership of 31%, supportedby low-gravity features in both sodium and potassium. Thephotometric variability is measured to be very low at 9 mmag,but frames were taken in the I filter, where variability is lowerthan in V or R.
(1816–5844) SCR1816–5844—(MV=10.47, V−Ks=5.08) is a new member of Argus, according to kinematics,corroborated by the sodium and potassium line strengthsindicative of low surface gravity. This star exhibits the highestlevel of photometric variability of any star reported here:68 mmag at V over 5 yr, as shown in Figure 30. This youthindicator is supported by the discrepancy between a photo-metric distance of 12.2 pc and a trigonometric distance of 29.0pc, placing the star well above the main sequence in the HRdiagram.
(1956–3207) DEN1956–3207AB—( = - =M V K8.254,V s= - =( ) ( )A M V K B3.69 , 10.04, 5.14V s ) is a binary separated
by 26″ for which we determine separate but entirely consistentparallaxes placing the system at 45 pc. We do not havespectroscopy of either member of this system with which tocomment on its age, but kinematic analysis with LACEwINGshows no probability of membership in any known NYMG. TheA component shows significant photometric variability of31mmag at V, while B’s variability of 20 mmag is more muted.This system does not seem to be young.
(2332–1215) BD-13–06424—(MV=8.22, V−Ks=3.94)is a known member of β Pic (Torres et al. 2006), which weconfirm with our astrometric results (Table 4). We find the starto be photometrically variable at V at a level of 28 mmagduring the 5 yr of data in hand.
9. Conclusions
The effort described in this paper was an experiment todetermine whether or not we might reveal nearby stars via acompletely photometric search, rather than via the traditionalroute of assuming high proper motions. The combination of
optical photometry from SuperCOSMOS and infrared photo-metry from 2MASS proved to be a powerful method to findnearby stars with minimal proper motions. In this paper, wereport the following.
1. Twenty-nine parallaxes for 26 stellar systems, including 11systems within 25 pc and 15 between 25 and 50 pc. Theclosest two systems are SCR 0533-4257AB at 10.4 pcand NLTT 1261 at 12.1 pc. All of the systems haveμ=38–179mas yr−1, which is slower moving than the180mas yr−1 threshold used by Luyten for his compendiaof proper-motion stars. Thus, the experiment to find nearby,slow-moving stars was successful.
2. Fourteen pre-main-sequence stellar systems, which areidentified as part of the AB Doradus (one system),Argus (two systems), Tucana-Horologium (six systems),β Pictoris (two systems), and TW Hydra (one system)moving groups. Two additional stars that do not appear tobe associated with any group have been identified. Theunassociated stars (along with other young nonmembersidentified in Riedel et al. 2014, 2017a) hint at a complexoutcome to the star formation process that yieldsrelatively young stars that cannot be straightforwardlylinked to known associations or moving groups.
3. Among those stars is LP780–032, another possible newmember of the Argus moving group at a distance of only15 pc. This system would rank as the fifth closest youngstar system.
The RECONS effort has been supported by the NationalScience Foundation through grants AST 05-07711, AST 09-08402, and AST 14-12026. We also thank the members of theSMARTS Consortium and the CTIO staff, who enable theoperations of the small telescopes at CTIO. This research hasmade use of results from the SAO/NASA Astrophysics DataSystem Bibliographic Services, as well as the SIMBAD andVizieR databases, operated at CDS, Strasbourg, France, and theTwo Micron All Sky Survey, which is a joint project of theUniversity of Massachusetts and the Infrared Processing andAnalysis Center, funded by NASA and NSF. The authors wouldlike to thank the HST and Lowell Observatory staff and EdNelan for their assistance with data collection and processing.Facilities: CTIO:0.9m, CTIO:1.5m (RCSpec), Blanco
(RCSpec), Perkins (DeVeny Spectrograph), CFHT (ESPaDONs),HST (FGS).
Figure 30. Same as Figure 20 but for SCR 1816–5844.
Figure 29. Same as Figure 18 but for GJ 2122AB. Large astrometricperturbations are seen in both axes.
25
The Astronomical Journal, 156:49 (26pp), 2018 August Riedel et al.
Software: Astropy (Astropy Collaboration et al. 2013),Numpy (Walt et al. 2011), Matplotlib (Hunter 2007), IRAF,MATCHSTAR (Riedel et al. 2014), LACEwING (Riedelet al. 2017b).
ORCID iDs
Adric R. Riedel https://orcid.org/0000-0003-1645-8596Michele L. Silverstein https://orcid.org/0000-0003-2565-7909Wei-Chun Jao https://orcid.org/0000-0003-0193-2187Jennifer G. Winters https://orcid.org/0000-0001-6031-9513John P. Subasavage https://orcid.org/0000-0001-5912-6191
References
Alksnis, A., Balklavs, A., Dzervitis, U., et al. 2001, BaltA, 10, 1Allers, K. N., Jaffe, D. T., Luhman, K. L., et al. 2007, ApJ, 657, 511Astropy Collaboration, Robitaille, T. P., Tollerud, E. J., et al. 2013, A&A,
558, A33Aumer, M., & Binney, J. J. 2009, MNRAS, 397, 1286Backman, D. E., Burgh, S. J., & Henry, T. J. 2001, in Nearby Stars (NStars)
Workshop (Moffet View, CA: NASA Ames Research Center), 1Bessel, F. W. 1838, MNRAS, 4, 152Bessell, M. S. 1986, PASP, 98, 1303Bobylev, V. V. 2010, AstL, 36, 220Boeshaar, P. C. 1976, The Spectral Classification of m-dwarf Stars (Columbus:
Ohio State Univ.)Boyd, M. R., Henry, T. J., Jao, W.-C., Subasavage, J. P., & Hambly, N. C.
2011a, AJ, 142, 92Boyd, M. R., Winters, J. G., Henry, T. J., et al. 2011b, AJ, 142, 10Gaia Collaboration, Brown, A. G. A., Vallenari, A., et al. 2016, A&A, 595, A2Cruz, K. L., Reid, I. N., Kirkpatrick, J. D., et al. 2007, AJ, 133, 439Cutri, R. M., Skrutskie, M. F., van Dyk, S., et al. 2003, 2MASS All Sky
Catalog of Point Sources, (NASA/IPAC Infrared Science Archive, http://irsa.ipac.caltech.edu/applications/Gator/)
de la Reza, R., Torres, C. A. O., Quast, G., Castilho, B. V., & Vieira, G. L.1989, ApJL, 343, L61
Deacon, N. R., & Hambly, N. C. 2007, A&A, 468, 163Deacon, N. R., Hambly, N. C., & Cooke, J. A. 2005, A&A, 435, 363Deacon, N. R., Hambly, N. C., King, R. R., & McCaughrean, M. J. 2009,
MNRAS, 394, 857Dyson, Sir F. W. 1917, MNRAS, 77, 212Fabricius, C., & Makarov, V. V. 2000, A&AS, 144, 45Finch, C. T., Henry, T. J., Subasavage, J. P., Jao, W., & Hambly, N. C. 2007,
AJ, 133, 2898Fitzpatrick, E. L. 1999, PASP, 111, 63Gagné, J., Lafrenière, D., Doyon, R., Malo, L., & Artigau, É. 2015, ApJ,
798, 73Giclas, H. L., Burnham, R., Jr., & Thomas, N. G. 1979, LowOB, 8, 145Gizis, J. E. 1997, AJ, 113, 806Gliese, W., & Jahreiß, H. 1991, Preliminary Version of the Third Catalogue of
Nearby Stars, Tech. Rep. (Greenbelt, MD: NASA Goddard)Hambly, N. C., Davenhall, A. C., Irwin, M. J., & MacGillivray, H. T. 2001a,
MNRAS, 326, 1315Hambly, N. C., Henry, T. J., Subasavage, J. P., Brown, M. A., & Jao, W. 2004,
AJ, 128, 437Hambly, N. C., MacGillivray, H. T., Read, M. A., et al. 2001b, MNRAS,
326, 1279Heintz, W. D. 1987, ApJS, 65, 161Henderson, T. 1839, MNRAS, 4, 168Henry, T. J., Jao, W., Subasavage, J. P., et al. 2006, AJ, 132, 2360Henry, T. J., Kirkpatrick, J. D., & Simons, D. A. 1994, AJ, 108, 1437Henry, T. J., Subasavage, J. P., Brown, M. A., et al. 2004, AJ, 128, 2460Henry, T. J., Walkowicz, L. M., Barto, T. C., & Golimowski, D. A. 2002, AJ,
123, 2002Høg, E., Fabricius, C., Makarov, V. V., et al. 2000, A&A, 355, L27Hunter, J. D. 2007, CSE, 9, 90Janson, M., Bergfors, C., Brandner, W., et al. 2014, ApJS, 214, 17Jao, W., Henry, T. J., Subasavage, J. P., et al. 2005, AJ, 129, 1954Jao, W.-C., Henry, T. J., Subasavage, J. P., et al. 2003, AJ, 125, 332
Keenan, P. C., & McNeil, R. C. 1976, An Atlas of Spectra of the Cooler Stars:Types G, K, M, S, and C. Part 1: Introduction and Tables (Columbus: OhioState Univ. Press)
Kirkpatrick, J. D., Henry, T. J., & McCarthy, D. W., Jr. 1991, ApJS, 77, 417Landolt, A. U. 1992, AJ, 104, 340Landolt, A. U. 2007, AJ, 133, 2502Leggett, S. K., Allard, F., Geballe, T. R., Hauschildt, P. H., & Schweitzer, A.
2001, ApJ, 548, 908Lepine, S., & Gaidos, E. 2013, AAS Meeting 221, 423.01Lépine, S., Rich, R. M., & Shara, M. M. 2005, ApJL, 633, L121Lépine, S., & Shara, M. M. 2005, AJ, 129, 1483Luyten, W. J. 1957, A Catalogue of 9867 Stars in the Southern Hemisphere with
Proper Motions Exceeding 0 2 Annually (Minneapolis, MN: Lund Press)Luyten, W. J. 1979, NLTT Catalogue (Minneapolis, MN: Univ. Minnesota), 286Lyo, A.-R., Lawson, W. A., & Bessell, M. S. 2004, MNRAS, 355, 363Malo, L., Artigau, É., Doyon, R., et al. 2014, ApJ, 788, 81Malo, L., Doyon, R., Lafrenière, D., et al. 2013, ApJ, 762, 88Mamajek, E. E. 2005, ApJ, 634, 1385Mihalas, D., & Binney, J. 1981, Galactic Astronomy: Structure and Kinematics
(2nd ed.; San Francisco, CA: Freeman), 608Murphy, S. J., Lawson, W. A., & Bessell, M. S. 2010, MNRAS, 406, L50Murphy, S. J., Lawson, W. A., & Bessell, M. S. 2013, MNRAS, 435, 1325Nordström, B., Mayor, M., Andersen, J., et al. 2004, A&A, 418, 989Pokorny, R. S., Jones, H. R. A., & Hambly, N. C. 2003, A&A, 397, 575Reid, I. N., Cruz, K. L., & Allen, P. R. 2007, AJ, 133, 2825Reid, I. N., & Hawley, S. L. 1999, AJ, 117, 343Riaz, B., Gizis, J. E., & Harvin, J. 2006, AJ, 132, 866Riedel, A. R. 2012, PhD thesis, Georgia State Univ.Riedel, A. R., Alam, M. K., Rice, E. L., Cruz, K. L., & Henry, T. J. 2017a,
ApJ, 840, 87Riedel, A. R., Blunt, S. C., Lambrides, E. L., et al. 2017b, AJ, 153, 95Riedel, A. R., Finch, C. T., Henry, T. J., et al. 2014, AJ, 147, 85Riedel, A. R., Murphy, S. J., Henry, T. J., et al. 2011, AJ, 142, 104Rodriguez, D. R., Zuckerman, B., Kastner, J. H., et al. 2013, ApJ, 774, 101Röser, S., Schilbach, E., Piskunov, A. E., Kharchenko, N. V., & Scholz, R.-D.
2011, A&A, 531, A92Samus, N. N., Durlevich, O. V., et al. 2012, yCat, 1, 2025Schlieder, J. E., Lépine, S., Rice, E., et al. 2012, AJ, 143, 114Schmidt, S. J., Cruz, K. L., Bongiorno, B. J., Liebert, J., & Reid, I. N. 2007,
AJ, 133, 2258Scholz, R.-D., & Meusinger, H. 2002, MNRAS, 336, L49Schönrich, R., Binney, J., & Dehnen, W. 2010, MNRAS, 403, 1829Shkolnik, E., Liu, M. C., & Reid, I. N. 2009, ApJ, 699, 649Shkolnik, E. L., Anglada-Escudé, G., Liu, M. C., et al. 2012, ApJ, 758, 56Skuljan, J., Hearnshaw, J. B., & Cottrell, P. L. 1999, MNRAS, 308, 731Slesnick, C. L., Carpenter, J. M., Hillenbrand, L. A., & Mamajek, E. E. 2006,
AJ, 132, 2665Song, I., Bessell, M. S., & Zuckerman, B. 2002, ApJL, 581, L43Subasavage, J. P., Henry, T. J., Bergeron, P., et al. 2007, AJ, 134, 252Subasavage, J. P., Henry, T. J., Hambly, N. C., et al. 2005a, AJ, 130, 1658Subasavage, J. P., Henry, T. J., Hambly, N. C., Brown, M. A., & Jao, W.
2005b, AJ, 129, 413Teixeira, R., Ducourant, C., Chauvin, G., et al. 2009, A&A, 503, 281Thackeray, W. G. 1917, MNRAS, 77, 204Tinney, C. G., Reid, I. N., Gizis, J., & Mould, J. R. 1995, AJ, 110, 3014Torres, C. A. O., Quast, G. R., da Silva, L., et al. 2006, A&A, 460, 695Turnshek, D. E., Turnshek, D. A., Craine, E. R., & Boeshaar, P. C. 1985, An
Atlas of Digital Spectra of Cool Stars (Types G, K, M, S and C) (Tucson,Arizona: Western Research Company), 75
Turon, C., Creze, M., Egret, D., et al. 1993, BICDS, 43, 5van Leeuwen, F. (ed.) 2007, Hipparcos the New Reduction of the Raw Data
(Berin: Springer)Voges, W., Aschenbach, B., Boller, T., et al. 1999, A&A, 349, 389Voges, W., Aschenbach, B., Boller, T., et al. 2000, IAUC, 7432, 1Walt, S. v. d., Colbert, S. C., & Varoquaux, G. 2011, CSE, 13, 22Webb, R. A., Zuckerman, B., Platais, I., et al. 1999, ApJL, 512, L63West, A. A., Hawley, S. L., Bochanski, J. J., et al. 2008, AJ, 135, 785Westerlund, B. E., Olander, N., & Hedin, B. 1981, A&AS, 43, 267White, R. J., & Basri, G. 2003, ApJ, 582, 1109Winters, J. G., Henry, T. J., Lurie, J. C., et al. 2015, AJ, 149, 5Winters, J. G., Sevrinsky, R. A., Jao, W.-C., et al. 2017, AJ, 153, 14Wroblewski, H., & Torres, C. 1989, A&AS, 78, 231Zacharias, N., Finch, C. T., Girard, T. M., et al. 2013, AJ, 145, 44Zuckerman, B., & Song, I. 2004, ARA&A, 42, 685Zuckerman, B., Song, I., & Webb, R. A. 2001, ApJ, 559, 388
26
The Astronomical Journal, 156:49 (26pp), 2018 August Riedel et al.