Published by the Integrated Ocean Drilling Program with the ICDP
62
Published by the Integrated Ocean Drilling Program with the International Continental Scientific Drilling Program No. 12, September 2011 Scientific Drilling ISSN: 1816-8957 Canterbury Basin Sequence Stratigraphy 4 Drilling off Antarctica 15 Formation of Shatsky Rise 24 Great Barrier Reef Drilling 32 Workshop Reports 49 Reports on Deep Earth Sampling and Monitoring
Transcript of Published by the Integrated Ocean Drilling Program with the ICDP
NU
MB
ER
1,
20
05
Published by the Integrated Ocean Drilling Program with the International Continental Scientific Drilling Program
No
. 1
2,
Se
pte
mb
er
20
11
Scientific DrillingISSN: 1816-8957
Canterbury Basin Sequence Stratigraphy 4
Drilling off Antarctica 15
Formation of Shatsky Rise 24
Great Barrier Reef Drilling 32
Workshop Reports 49
Reports on Deep Earth Sampling and Monitoring
Editorial Preface Dear Reader:
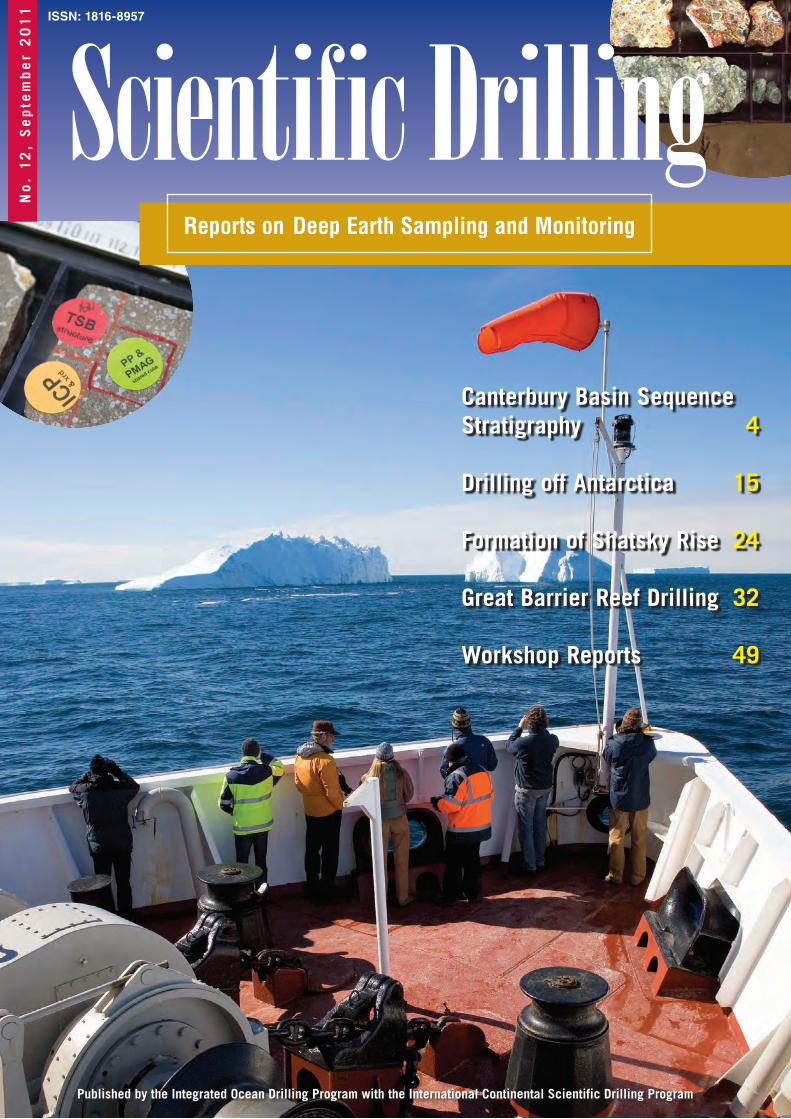
Front cover: Enjoying the sun while it lasts during the IODP Expedition 318. (Photo: John Beck, IODP-TAMU) Left inset: Labels placed on core pieces to identify samples from the IODP Expedition 324. (Photo: John Beck, IODP-TAMU)
Earth in Motion is one of the four main topics of the new science plan for scientific ocean
drilling 2013–2023 (see p. 55). Shortly before the plan’s completion, a mega-earthquake and
related tsunami hit eastern Japan on 11 March 2011. The effects were devastating to infra-
structure and the Japanese people, and the event calls for increased efforts to understand the
mechanisms and potential locations and magnitudes of such geohazards. Sampling seismo-
genic faults and installing observatories in boreholes in their vicinity is therefore a long-term
and high priority for scientific ocean drilling. IODP is also preparing a rapid effort (see p. 61)
to get a glimpse of the ephemeral properties at the east Japan earthquake fault zone as close
as possible to conditions during rupture.
Other research topics of high societal importance include how climate and environment
have changed over time and under conditions that vastly differ from those of the present time.
These issues offer two unique research perspectives on climate history with the high latitude
expedition to investigate Antarctic glaciation (p. 15) and the expedition to study environ-
mental change through coring already fossilized coral from the Great Barrier Reef (p. 32).
IODP research provides access to sampling of marine sediments that record ocean and
climate change reaching back 100 million years or more, and it allows present-day climate
change to be seen in a geologically significant context. Scientists are realizing that the high
rate of anthropogenic forcing of some fundamental climate regulating factors, such as the
amount of carbon and other greenhouse gases in the atmosphere, could push the ‘climate
clock’ millions to tens of millions of years back to times of radically different climate. The new
IODP science plan therefore seeks to provide long-term records of the past that will augment
predictive modeling of the climate for future generations. It also targets to improvements in
the public’s understanding of Earth’s dynamic climate and ocean system by reaching out to
both the public and new generations of scientists about vital research findings made possible
only by scientific ocean drilling.
The discovery during past scientific drilling of living microbes deep below the seafloor,
and in environments that fundamentally differ from those of surface life fueled by photosyn-
thesis, is still in an exploratory stage of trying to understand the distribution, genomics,
metabolic processes, and, if possible, greater implications for possible life in the universe. All
of these critical scientific questions will be examined on the basis of the fundamental
planetary dynamics that form the integrated framework for understanding our planet. One
highly ambitious goal in this regard is to finally penetrate the entire ocean crust and reach
into Earth’s mantle. To achieve this once elusive goal, IODP has started to assess its techno-
logical feasibility (p.46).
The new IODP 2013–2023 will continue to partner with other research programs, not the
least being the International Scientific Continental Program. In this volume ICDP reports on
geohazards including anthropogenic earthquakes (see p. 53) and natural arsenic water
contamination (see p. 49) that will be addressed by future continental drilling projects,
proving that both scientific drilling programs are solidly connected to the problems facing
global society, now and in the future.
Scientific DrillingISSN 1816-8957 (printed version) 1816-3459 (electronic version)
Scientific Drilling is a semiannual journal published by the Integrated Ocean Drilling Program ( IODP) with the Internat ional Cont inental Scient i f ic Dri l l ing Program (ICDP). The editors welcome contributions on any aspect of scientific drilling, including borehole instruments, observatories, and monitor ing exper iments. T he journal is produced and distributed by the Integrated Ocea n Dr i l l i ng P rog r a m Ma na gement International (IODP-MI) for the IODP under the sponsorship of the U.S. National Science Foundat ion, the Minist r y of Educat ion, Culture, Sports, Science and Technology of Japan, and other participating countries. T he j ou r na l ’s c ont ent i s p a r t l y ba s e d upon research supported under Contract OCE- 0432224 from the National Science Foundation.
Electronic versions of this publication and informat ion for authors can be found at ht tp://www.iodp.org/scient i f ic -dr i l l ing/ and http://www.icdp-online.org/scientific-drilling/. Printed copies can be requested from the publication office.
IODP is an international marine research dril l ing program dedicated to advancing s c ient i f ic u nder s t a nd i ng of t he E a r t h b y m o n i t o r i n g a n d s a m p l i n g s ub s e a -f loor env i ronments . T hrough mult ip le drill ing plat forms, IODP scientists explore the program’s pr incipal themes: the deep biosphere, environmental change, and solid Earth cycles.
ICDP is a multi-national program designed to promote and coordinate continental drilling projects with a variety of scientific targets at drilling sites of global significance.
Publication Office IODP-MI, Tokyo University of Marine Science and Technology, Office of Liaison and Cooperative Research 3rd Floor,2-1-6, Etchujima, Koto-ku, Tokyo 135-8533, JAPAN Tel: +81-3-6701-3180Fax: +81-3-6701-3189 e-mail: [email protected]: www.iodp.org/scientific-drilling/
Editorial BoardEditor-in-Chief Hans Christian LarsenEditors Ulrich Harms, Jamus Collier, and Kevin Johnson
Send comments to:[email protected]
Editorial Review BoardGilbert Camoin, Keir Becker, Hiroyuki Yamamoto, Naohiko Ohkouchi, Stephen Hickman, Christian Koeberl, Julie Brigham-Grette, and Maarten DeWit
Copy Editing Glen Hill, Obihiro, Japan
Layout, Production and Printing Mika Saido (IODP-MI), andSOHOKKAI, Co. Ltd., Tokyo, Japan
IODP-MI Tokyo, Japanwww.iodp.org
Program Contact: Miyuki [email protected]
ICDPGFZ German Research Center For Geoscienceswww.icdp-online.org
Program Contact: Ulrich [email protected]
All figures and photographs courtesy of the IODP or ICDP, unless otherwise specified.
Hans Christian LarsenEditor-in-Chief
Ulrich HarmsEditor
Jamus CollierManaging Editor
Kevin JohnsonEditor
2 Scientific Drilling, No. 12, September 2011
IODP Expedition 318: From Greenhouse to Icehouse at the Wilkes Land Antarctic Marginby Carlota Escutia, Henk Brinkhuis, Adam Klaus, and
the IODP Expedition 318 Scientists
15
IODP Expedition 324: Ocean Drilling at Shatsky Rise Gives Clues about Oceanic Plateau Formationby William W. Sager, Takahashi Sano, Jörg Geldmacher, and
the IODP Expedition 318 Scientists
24
IODP Expedition 325: The Great Barrier Reefs Reveal Past Sea-Level, Climate and Environmental Changes Since the Last Ice Ageby Yusuke Yokoyama, Jody M. Webster, Carol Cotterill, Juan Carlos Braga,
Luigi Jovane, Heath Mills, Sally Morgan, Atsushi Suzuki, and
the IODP Exepedition 325 Scientists
32
Scientific Drilling, No. 12, September 2011 3
IODP Expedition 317: Exploring the Record of Sea-Level Change off New Zealandby Craig S. Fulthorpe, Koichi Hoyanagi, Peter Blum, and
the IODP Expedition 317 Scientists
4
46 Initial Feasibility Study to Drill and Core the Ocean Mantle
49 International Drilling to Recover Aquifer Sands (IDRAs) and Arsenic Contaminated Groundwater in Asia
53 DeepScientificDrillingtoStudyReservoir-Triggered Earthquakes in Koyna, Western India
News and Views
55 News and Views
Schedules
back cover IODP and ICDP Expedition Schedules
Science Reports
Progress Report
Workshop Reports

Science Reports
IODP Expedition 317: Exploring the Record of Sea-Level Change Off New Zealand
by Craig S. Fulthorpe, Koichi Hoyanagi, Peter Blum, and IODP Expedition 317 Scientists
doi:10.2204/iodp.sd.12.01.2011
4 Scientific Drilling, No. 12, September 2011
Science Reports
Abstract
Expedition 317 investigated the record of global sea-level change (eustasy) within continental margin sedimentary sequences and how eustasy interacts with local forcing to produce preserved sedimentary architectures. The Canterbury Basin, on the eastern margin of the South Island of New Zealand, was selected to study these complex interac-tions because of high rates of Neogene sediment supply from the uplifting Southern Alps. This sediment input results in a high-frequency (~0.1–0.5 My periods) record of depositional cyclicity that is modulated by the presence of strong ocean currents. The expedition recovered sediments as old as
Eocene but focused on the sequence stratigraphy of the late Miocene to Recent, when global sea-level change was domi-nated by glacioeustasy. A transect of three sites was drilled on the continental shelf (Sites U1353, U1354, and U1351), plus one on the continental slope (Site U1352). The transect samples the shallow-water environment most directly affected by relative sea-level change. Lithologic boundaries, provisionally correlative with seismic sequence boundaries, have been identified in cores from each site. Continental slope Site U1352 provides a record of ocean circulation and fronts during the last ~35 My. The early Oligocene (~30 Ma) Marshall Paraconformity was the deepest target of Expedition 317 and is hypothesized to represent intensified current erosion or non-deposition associated with the initia-
tion of thermohaline circulation in the region. Expedition 317 involved opera-tional challenges for JOIDES Resolution, including shallow-water, continental-shelf drilling and deep penetrations. Despite these challenges, Expedition 317 set a number of records for scientific ocean drilling penetration and water-depth.
Introduction and Goals
In order to evaluate predictions of future changes in global sea level and shoreline location, it is vital to constrain the range of past variability. Throughout the “Icehouse” period of the last ~30–40 million years, the changing volume of continental ice has been the principal driver of high-amplitude and high-frequency (~1 My and less) global sea-level change (eustasy). The last ~1 million years have been dominated by ~100,000-year glacial/interglacial cycles, and the sea-level rise since the last glacial maximum provides particularly valuable constraints on potential future rates of rise. However, earlier periods—notably the early Pliocene (~5.3–3.0 Ma) when CO2 levels were similar to today’s, but tempera-tures were ~3°C warmer and sea level ~25 m higher—provide glimpses of the possible future state of the Earth system. In addition, the geological record shows that climate and sea level do not always
Science Reports Science ReportsScience Reports
Figure 1. The Canterbury Basin underlies the present-day onshore Canterbury Plains and offshore continental shelf. It is bounded by the Miocene volcanic centers of the Banks Peninsula (BP) to the northeast and the Otago Peninsula (OP) to the southwest, and faces the Bounty Trough to the southeast. The Alpine Fault is the boundary between the Australasian and Pacific plates. Locations of the modern Southland Front and Subantarctic Front, together with local gyre within the Bounty Trough, are shown (Chiswell, 1996; Shipboard Scientific Party, 1999; Morris et al., 2001). Also shown are exploration wells in the offshore basin (Resolution, R; Clipper, C; Endeavour, E; and Galleon, G) as well as ODP Site 1119. The red line marks the approximate location of the schematic cross-section in Fig. 3. Bathymetric contours are in meters.
Scientific Drilling, No. 12, September 2011 5
Science ReportsScience Reports
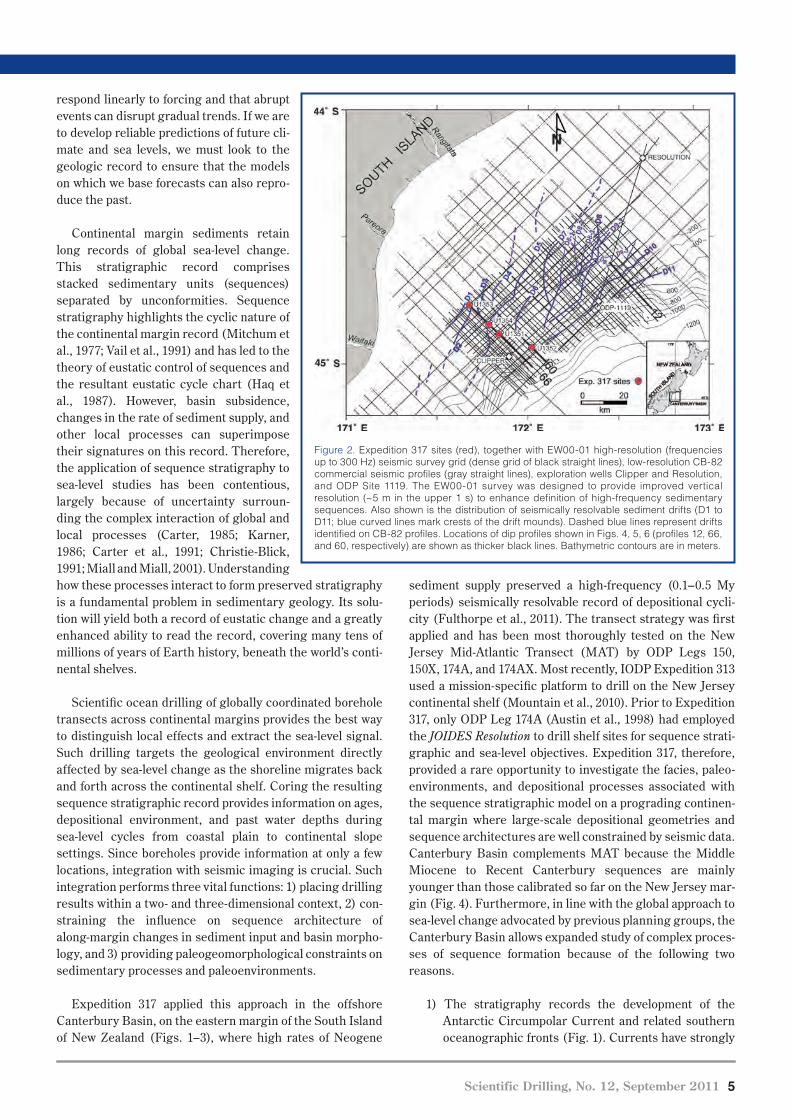
sediment supply preserved a high-frequency (0.1–0.5 My periods) seismically resolvable record of depositional cycli-city (Fulthorpe et al., 2011). The transect strategy was first applied and has been most thoroughly tested on the New Jersey Mid-Atlantic Transect (MAT) by ODP Legs 150, 150X, 174A, and 174AX. Most recently, IODP Expedition 313 used a mission-specific platform to drill on the New Jersey continental shelf (Mountain et al., 2010). Prior to Expedition 317, only ODP Leg 174A (Austin et al., 1998) had employed the JOIDES Resolution to drill shelf sites for sequence strati-graphic and sea-level objectives. Expedition 317, therefore, provided a rare opportunity to investigate the facies, paleo-environments, and depositional processes associated with the sequence stratigraphic model on a prograding continen-tal margin where large-scale depositional geometries and sequence architectures are well constrained by seismic data. Canterbury Basin complements MAT because the Middle Miocene to Recent Canterbury sequences are mainly younger than those calibrated so far on the New Jersey mar-gin (Fig. 4). Furthermore, in line with the global approach to sea-level change advocated by previous planning groups, the Canterbury Basin allows expanded study of complex proces-ses of sequence formation because of the following two reasons.
1) The stratigraphy records the development of the Antarctic Circumpolar Current and related southern oceanographic fronts (Fig. 1). Currents have strongly
respond linearly to forcing and that abrupt events can disrupt gradual trends. If we are to develop reliable predictions of future cli-mate and sea levels, we must look to the geologic record to ensure that the models on which we base forecasts can also repro-duce the past.
Continental margin sediments retain long records of global sea-level change. This stratigraphic record comprises stacked sedimentary units (sequences) separated by unconformities. Sequence stratigraphy highlights the cyclic nature of the continental margin record (Mitchum et al., 1977; Vail et al., 1991) and has led to the theory of eustatic control of sequences and the resultant eustatic cycle chart (Haq et al., 1987). However, basin subsidence, changes in the rate of sediment supply, and other local processes can superimpose their signatures on this record. Therefore, the application of sequence stratigraphy to sea-level studies has been contentious, largely because of uncertainty surroun-ding the complex interaction of global and local processes (Carter, 1985; Karner, 1986; Carter et al., 1991; Christie-Blick, 1991; Miall and Miall, 2001). Understanding how these processes interact to form preserved stratigraphy is a fundamental problem in sedimentary geology. Its solu-tion will yield both a record of eustatic change and a greatly enhanced ability to read the record, covering many tens of millions of years of Earth history, beneath the world’s conti-nental shelves.
Scientific ocean drilling of globally coordinated borehole transects across continental margins provides the best way to distinguish local effects and extract the sea-level signal. Such drilling targets the geological environment directly affected by sea-level change as the shoreline migrates back and forth across the continental shelf. Coring the resulting sequence stratigraphic record provides information on ages, depositional environment, and past water depths during sea-level cycles from coastal plain to continental slope settings. Since boreholes provide information at only a few locations, integration with seismic imaging is crucial. Such integration performs three vital functions: 1) placing drilling results within a two- and three-dimensional context, 2) con-straining the influence on sequence architecture of along-margin changes in sediment input and basin morpho-logy, and 3) providing paleogeomorphological constraints on sedimentary processes and paleoenvironments.
Expedition 317 applied this approach in the offshore Canterbury Basin, on the eastern margin of the South Island of New Zealand (Figs. 1–3), where high rates of Neogene
Science Reports Science Reports
Figure 2. Expedition 317 sites (red), together with EW00-01 high-resolution (frequencies up to 300 Hz) seismic survey grid (dense grid of black straight lines), low-resolution CB-82 commercial seismic profiles (gray straight lines), exploration wells Clipper and Resolution, and ODP Site 1119. The EW00-01 survey was designed to provide improved vertical resolution (~5 m in the upper 1 s) to enhance definition of high-frequency sedimentary sequences. Also shown is the distribution of seismically resolvable sediment drifts (D1 to D11; blue curved lines mark crests of the drift mounds). Dashed blue lines represent drifts identified on CB-82 profiles. Locations of dip profiles shown in Figs. 4, 5, 6 (profiles 12, 66, and 60, respectively) are shown as thicker black lines. Bathymetric contours are in meters.
6 Scientific Drilling, No. 12, September 2011
Science Reports
influenced deposition, modifying sequence architec-ture and locally leading to the deposition of large sedi-ment drifts, which aggraded to near shelf depths, within the prograding Neogene section.
2) Rifting is younger (Cretaceous) than the New Jersey margin (Jurassic), and from the earliest Miocene copi-ous terrigenous sediment was supplied from a rapidly uplifting, nearby mountain range (the Southern Alps). Regional tectonic and geological histories have been intensively studied, allowing evaluation of the influ-ence of sediment supply on sequence formation and of the tectonic evolution of the Alpine Fault plate boundary.
The principal scientific objective of Expedition 317 was to date clinoformal seismic sequence boundaries and sample associated facies to provide information (e.g., paleo-water depths, porosities) necessary for estimation of eustatic amplitudes using backstripping. A proper test of sequence stratigraphy necessitates drilling in shallow water (~100 m or less) on continental shelves. A related objective was to understand the interplay of along-strike and downslope sedi-mentary processes on this strongly current-influenced mar-gin. Accordingly, our deepest drilling target was the Marshall Paraconformity, a regional unconformity thought to represent the mid-Oligocene initiation of ocean circula-tion on this margin. The final objective was to expand our knowledge of the erosion history of the Southern Alps using
provenance studies and offshore sediment accumulation rates.
The Canterbury Basin is part of the Eastern New Zealand Oceanic Sedimentary System (ENZOSS; Carter et al., 1996). The distal (up to 4460 m water depth) component of ENZOSS was targeted by ODP Leg 181, which focused on drift devel-opment in the Southwest Pacific Gateway, principally under the influence of the evolving Antarctic Circumpolar Current and the Deep Western Boundary Current (Shipboard Scientific Party, 1999). Expedition 317 complements Leg 181 drilling by focusing on the landward part of ENZOSS.
Geological Setting
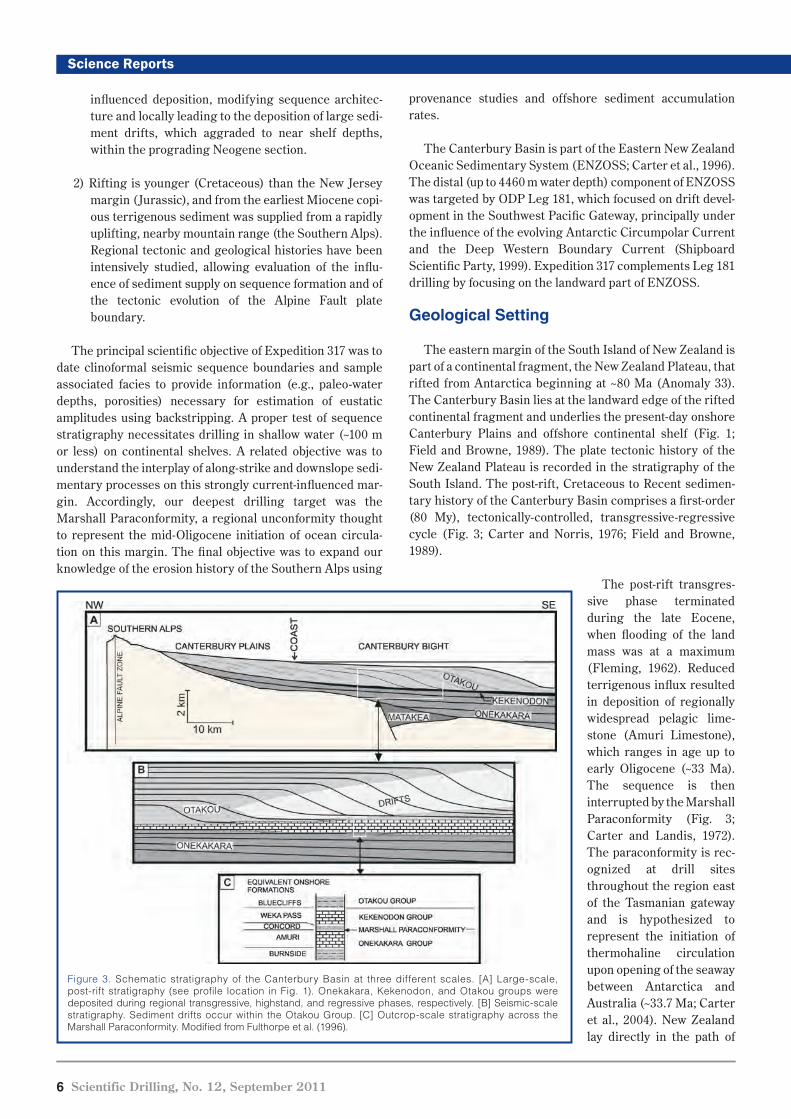
The eastern margin of the South Island of New Zealand is part of a continental fragment, the New Zealand Plateau, that rifted from Antarctica beginning at ~80 Ma (Anomaly 33). The Canterbury Basin lies at the landward edge of the rifted continental fragment and underlies the present-day onshore Canterbury Plains and offshore continental shelf (Fig. 1; Field and Browne, 1989). The plate tectonic history of the New Zealand Plateau is recorded in the stratigraphy of the South Island. The post-rift, Cretaceous to Recent sedimen-tary history of the Canterbury Basin comprises a first-order (80 My), tectonically-controlled, transgressive-regressive cycle (Fig. 3; Carter and Norris, 1976; Field and Browne, 1989).
The post-rift transgres-sive phase terminated during the late Eocene, when flooding of the land mass was at a maximum (Fleming, 1962). Reduced terrigenous influx resulted in deposition of regionally widespread pelagic lime-stone (Amuri Limestone), which ranges in age up to early Oligocene (~33 Ma). The sequence is then interrupted by the Marshall Paraconformity (Fig. 3; Carter and Landis, 1972). The paraconformity is rec-ognized at drill sites throughout the region east of the Tasmanian gateway and is hypothesized to represent the initiation of thermohaline circulation upon opening of the seaway between Antarctica and Australia (~33.7 Ma; Carter et al., 2004). New Zealand lay directly in the path of
Science Reports
Figure 3. Schematic stratigraphy of the Canterbury Basin at three different scales. [A] Large-scale, post-rift stratigraphy (see profile location in Fig. 1). Onekakara, Kekenodon, and Otakou groups were deposited during regional transgressive, highstand, and regressive phases, respectively. [B] Seismic-scale stratigraphy. Sediment drifts occur within the Otakou Group. [C] Outcrop-scale stratigraphy across the Marshall Paraconformity. Modified from Fulthorpe et al. (1996).
Scientific Drilling, No. 12, September 2011 7
Science Reports
Site U1351 at the deep-water end (121 m) of the shelf transect (Figs. 2, 6). This provided experience in shelf sediment drill-ing before moving to sites in even shallower water. The ship then moved ~15 km to slope site U1352, designed to provide age control for sequences drilled at site U1351 (Figs. 2, 7). An additional target at Site U1352 was penetration and re-covery of the Marshall Paraconformity. On completion of slope drilling, the ship moved back to the shelf to drill the two additional shelf sites U1353 and U1354 (Fig. 6) to pro-vide spatial control of facies within sequences and to recover the lowermost unconformities landward of their rollovers.
Because of the requirements to drill in shallow water and to achieve deep penetrations, a number of scientific ocean drilling records were set.
• Deepest hole drilled in a single expedition (Hole U1352C; 1927 m), also the second deepest hole in DSDP/ODP/IODP history
• Deepest hole drilled by JOIDES Resolution on the con-tinental shelf (Hole 1351B; 1030 m) and also the sec-ond deepest (Hole 1353B; 614 m)
the developing current system. Regression commenced in the late Oligocene or early Miocene in response to an increase in sediment supply provided by the initiation of Alpine Fault movement (Carter and Norris, 1976; Kamp, 1987). The Alpine Fault formed as a dextral transpressive zone with 500-km lateral displacement since the earliest Miocene (~23 Ma; Wellman, 1971; Kamp, 1987; King, 2000). The sediment influx following fault initia-tion is distinct from the later pulse related to uplift that culminated in the present-day Southern Alps. Uplift of the Southern Alps accelerated at ~8–5 Ma (Tippett and Kamp, 1993a; Batt et al., 2000) or ~10–8 Ma (Carter and Norris, 1976; Norris et al., 1978; Adams, 1979; Tippett and Kamp, 1993b), indicating an increased compo-nent of convergence along the fault and leading to further increase in the rate of sediment supply to the offshore Canterbury Basin (Lu et al., 2005).
This sediment influx was deposited as prograding clinoforms (Otakou Group; Fig. 3). However, currents continued to influence deposition. At present, the core of the northward-flowing Southland Current, inboard of the Southland Front (part of the Subtropical Front; STF) is over the ~300-m isobath (Chiswell, 1996). In deeper water, to at least 900 m, a local gyre of the Antarctic Circumpolar Current circulates clock-wise within the head of Bounty Trough parallel to the Southland Current (Fig. 1; Morris et al., 2001). Large sedi-ment drifts within the prograding section (Fig. 5) show that similar currents, probably strengthened during glacial peri-ods, existed throughout much of the Neogene (Fulthorpe and Carter, 1991; Lu et al., 2003; Carter et al., 2004).
Drilling and Coring
Expedition 317 cored upper Miocene to Recent sedimen-tary sequences in a transect of three sites on the continental shelf (landward to basinward: Sites U1353, U1354, and U1351) and one on the continental slope (Site U1352; Fulthorpe et al., 2011). A transect of sites is required because of the need to drill each of the multiple target sequences in at least two locations: 1) landward of clinoform breaks or rollovers, presumed to represent paleo-shelf edges, where paleo-depth indicators are most reliable; and 2) drilling on the slope where increased abundance of pe-lagic microfossils provides the best age control.
Favorable weather conditions on arrival allowed us to follow the planned drilling strategy by drilling first at shelf
Science Reports
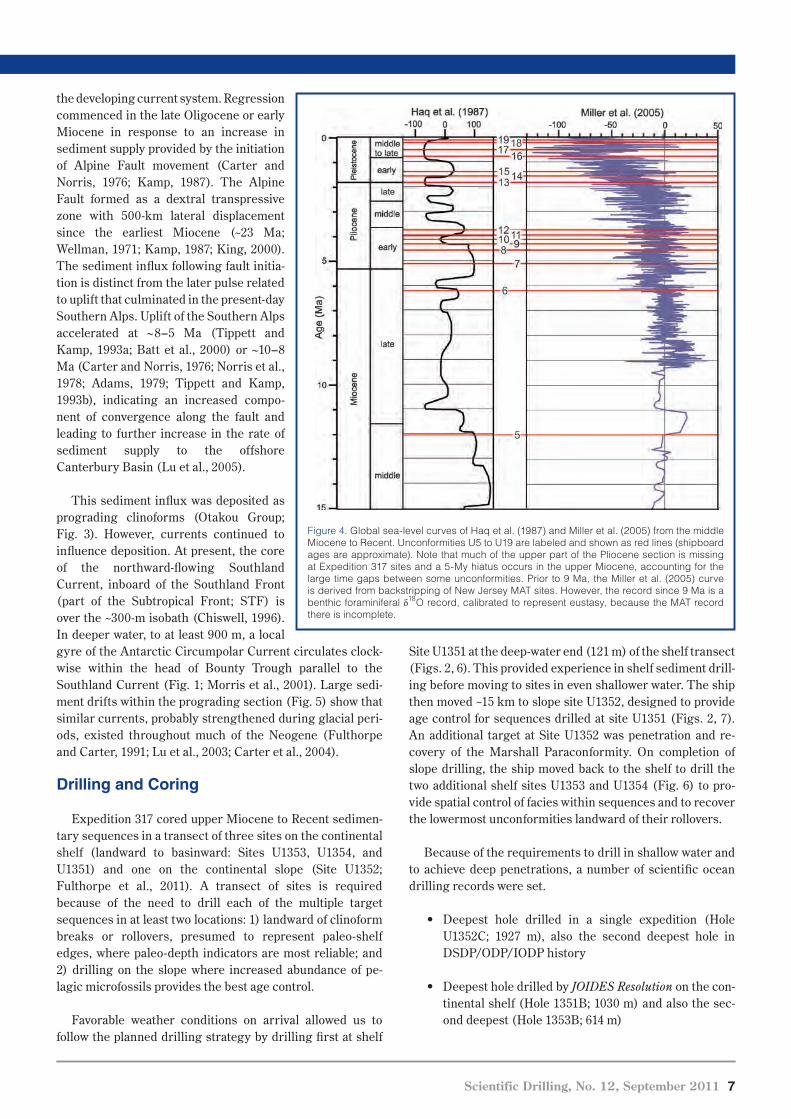
Figure 4. Global sea-level curves of Haq et al. (1987) and Miller et al. (2005) from the middle Miocene to Recent. Unconformities U5 to U19 are labeled and shown as red lines (shipboard ages are approximate). Note that much of the upper part of the Pliocene section is missing at Expedition 317 sites and a 5-My hiatus occurs in the upper Miocene, accounting for the large time gaps between some unconformities. Prior to 9 Ma, the Miller et al. (2005) curve is derived from backstripping of New Jersey MAT sites. However, the record since 9 Ma is a benthic foraminiferal δ18O record, calibrated to represent eustasy, because the MAT record there is incomplete.
8 Scientific Drilling, No. 12, September 2011
Science ReportsScience Reports
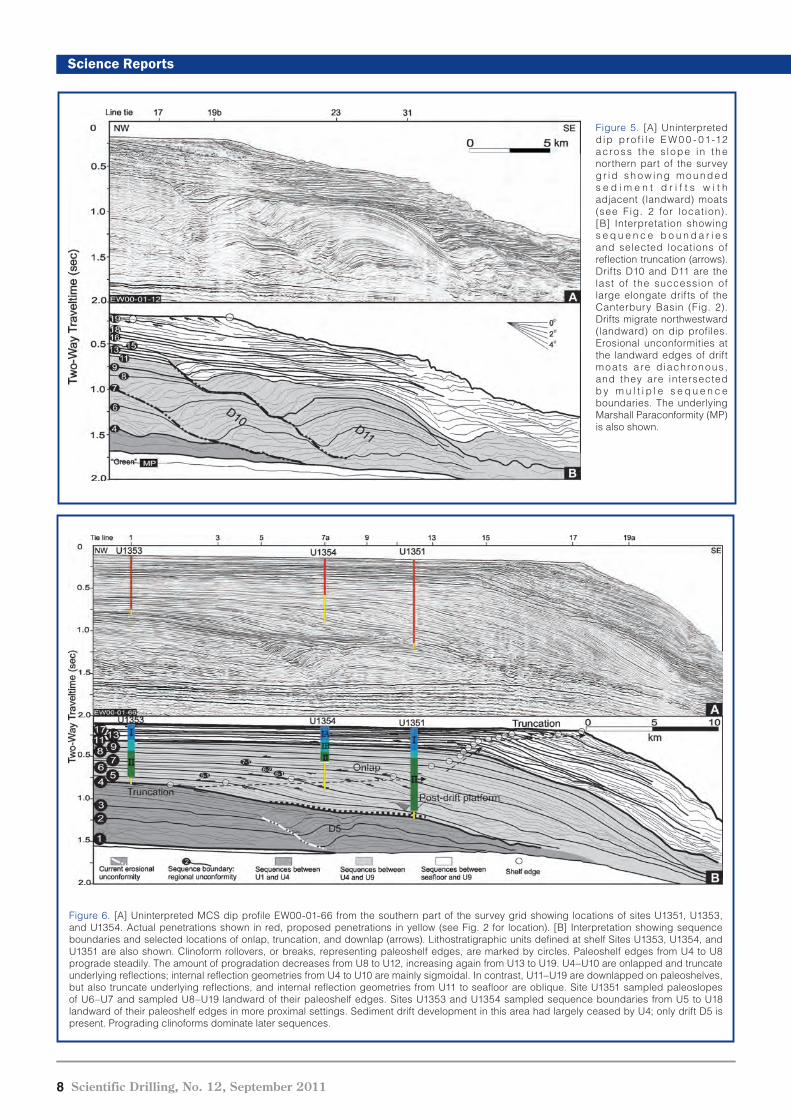
Figure 6. [A] Uninterpreted MCS dip profile EW00-01-66 from the southern part of the survey grid showing locations of sites U1351, U1353, and U1354. Actual penetrations shown in red, proposed penetrations in yellow (see Fig. 2 for location). [B] Interpretation showing sequence boundaries and selected locations of onlap, truncation, and downlap (arrows). Lithostratigraphic units defined at shelf Sites U1353, U1354, and U1351 are also shown. Clinoform rollovers, or breaks, representing paleoshelf edges, are marked by circles. Paleoshelf edges from U4 to U8 prograde steadily. The amount of progradation decreases from U8 to U12, increasing again from U13 to U19. U4–U10 are onlapped and truncate underlying reflections; internal reflection geometries from U4 to U10 are mainly sigmoidal. In contrast, U11–U19 are downlapped on paleoshelves, but also truncate underlying reflections, and internal reflection geometries from U11 to seafloor are oblique. Site U1351 sampled paleoslopes of U6–U7 and sampled U8–U19 landward of their paleoshelf edges. Sites U1353 and U1354 sampled sequence boundaries from U5 to U18 landward of their paleoshelf edges in more proximal settings. Sediment drift development in this area had largely ceased by U4; only drift D5 is present. Prograding clinoforms dominate later sequences.
Figure 5. [A] Uninterpreted d ip p ro f i l e E W 0 0 - 01-12 across the s lope in the northern part of the survey g r id s h o w i n g m o u n d e d s e d i m e n t d r i f t s w i t h adjacent (landward) moats (see F ig. 2 for locat ion). [B] Interpretation showing s e q u e n c e b o u n d a r i e s and selected locations of reflection truncation (arrows). Drifts D10 and D11 are the last of the succession of large elongate drifts of the Canterbury Basin (Fig. 2). Drifts migrate northwestward (landward) on dip profiles. Erosional unconformities at the landward edges of drift moats a re d iachronous, and they are intersected b y m u l t i p l e s e q u e n c e boundaries. The underlying Marshall Paraconformity (MP) is also shown.
Scientific Drilling, No. 12, September 2011 9
Science Reports
tries are oblique and U- and V-shaped channels that incise paleoshelves indicate exposure during sea-level lowstands.
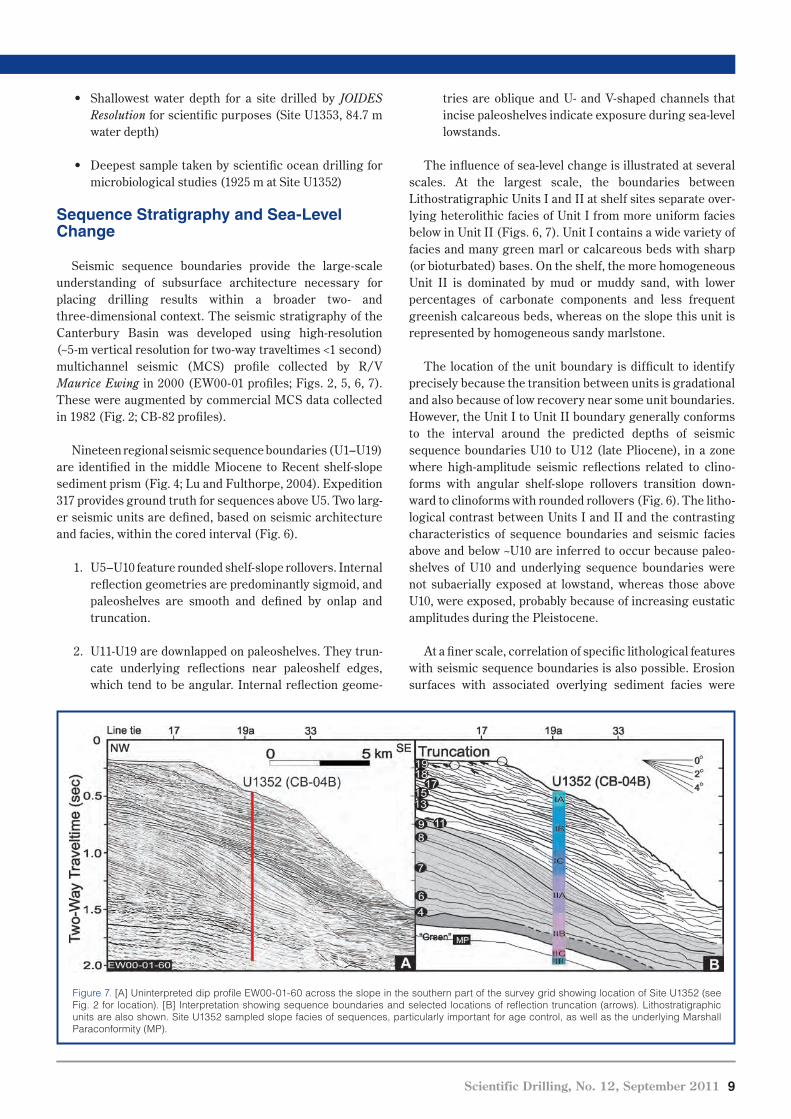
The influence of sea-level change is illustrated at several scales. At the largest scale, the boundaries between Lithostratigraphic Units I and II at shelf sites separate over-lying heterolithic facies of Unit I from more uniform facies below in Unit II (Figs. 6, 7). Unit I contains a wide variety of facies and many green marl or calcareous beds with sharp (or bioturbated) bases. On the shelf, the more homogeneous Unit II is dominated by mud or muddy sand, with lower percentages of carbonate components and less frequent greenish calcareous beds, whereas on the slope this unit is represented by homogeneous sandy marlstone.
The location of the unit boundary is difficult to identify precisely because the transition between units is gradational and also because of low recovery near some unit boundaries. However, the Unit I to Unit II boundary generally conforms to the interval around the predicted depths of seismic sequence boundaries U10 to U12 (late Pliocene), in a zone where high-amplitude seismic reflections related to clino-forms with angular shelf-slope rollovers transition down-ward to clinoforms with rounded rollovers (Fig. 6). The litho-logical contrast between Units I and II and the contrasting characteristics of sequence boundaries and seismic facies above and below ~U10 are inferred to occur because paleo-shelves of U10 and underlying sequence boundaries were not subaerially exposed at lowstand, whereas those above U10, were exposed, probably because of increasing eustatic amplitudes during the Pleistocene.
At a finer scale, correlation of specific lithological features with seismic sequence boundaries is also possible. Erosion surfaces with associated overlying sediment facies were
• Shallowest water depth for a site drilled by JOIDES Resolution for scientific purposes (Site U1353, 84.7 m water depth)
• Deepest sample taken by scientific ocean drilling for microbiological studies (1925 m at Site U1352)
Sequence Stratigraphy and Sea-Level Change
Seismic sequence boundaries provide the large-scale understanding of subsurface architecture necessary for placing drilling results within a broader two- and three-dimensional context. The seismic stratigraphy of the Canterbury Basin was developed using high-resolution (~5-m vertical resolution for two-way traveltimes <1 second) multichannel seismic (MCS) profile collected by R/V Maurice Ewing in 2000 (EW00-01 profiles; Figs. 2, 5, 6, 7). These were augmented by commercial MCS data collected in 1982 (Fig. 2; CB-82 profiles).
Nineteen regional seismic sequence boundaries (U1–U19) are identified in the middle Miocene to Recent shelf-slope sediment prism (Fig. 4; Lu and Fulthorpe, 2004). Expedition 317 provides ground truth for sequences above U5. Two larg-er seismic units are defined, based on seismic architecture and facies, within the cored interval (Fig. 6).
1. U5–U10 feature rounded shelf-slope rollovers. Internal reflection geometries are predominantly sigmoid, and paleoshelves are smooth and defined by onlap and truncation.
2. U11-U19 are downlapped on paleoshelves. They trun-cate underlying reflections near paleoshelf edges, which tend to be angular. Internal reflection geome-
Science Reports
Figure 7. [A] Uninterpreted dip profile EW00-01-60 across the slope in the southern part of the survey grid showing location of Site U1352 (see Fig. 2 for location). [B] Interpretation showing sequence boundaries and selected locations of reflection truncation (arrows). Lithostratigraphic units are also shown. Site U1352 sampled slope facies of sequences, particularly important for age control, as well as the underlying Marshall Paraconformity (MP).
10 Scientific Drilling, No. 12, September 2011
Science Reports
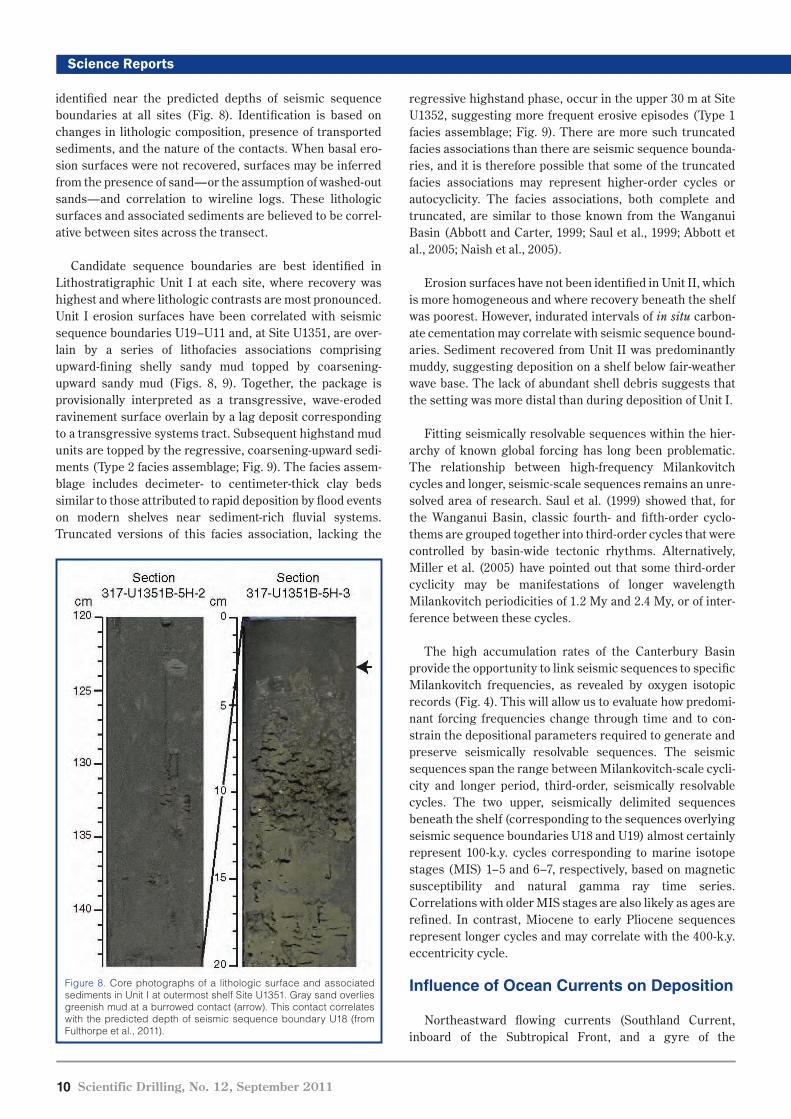
identified near the predicted depths of seismic sequence boundaries at all sites (Fig. 8). Identification is based on changes in lithologic composition, presence of transported sediments, and the nature of the contacts. When basal ero-sion surfaces were not recovered, surfaces may be inferred from the presence of sand—or the assumption of washed-out sands—and correlation to wireline logs. These lithologic surfaces and associated sediments are believed to be correl-ative between sites across the transect.
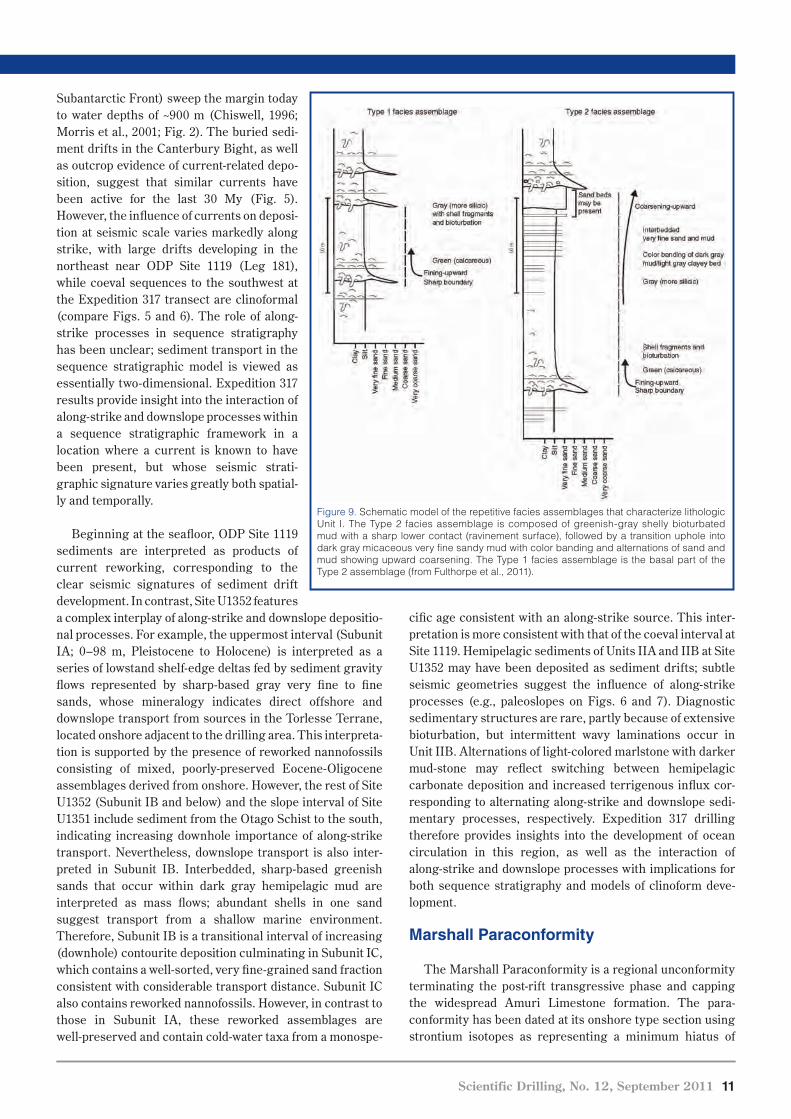
Candidate sequence boundaries are best identified in Lithostratigraphic Unit I at each site, where recovery was highest and where lithologic contrasts are most pronounced. Unit I erosion surfaces have been correlated with seismic sequence boundaries U19–U11 and, at Site U1351, are over-lain by a series of lithofacies associations comprising upward-fining shelly sandy mud topped by coarsening-upward sandy mud (Figs. 8, 9). Together, the package is provisionally interpreted as a transgressive, wave-eroded ravinement surface overlain by a lag deposit corresponding to a transgressive systems tract. Subsequent highstand mud units are topped by the regressive, coarsening-upward sedi-ments (Type 2 facies assemblage; Fig. 9). The facies assem-blage includes decimeter- to centimeter-thick clay beds similar to those attributed to rapid deposition by flood events on modern shelves near sediment-rich fluvial systems. Truncated versions of this facies association, lacking the
regressive highstand phase, occur in the upper 30 m at Site U1352, suggesting more frequent erosive episodes (Type 1 facies assemblage; Fig. 9). There are more such truncated facies associations than there are seismic sequence bounda-ries, and it is therefore possible that some of the truncated facies associations may represent higher-order cycles or autocyclicity. The facies associations, both complete and truncated, are similar to those known from the Wanganui Basin (Abbott and Carter, 1999; Saul et al., 1999; Abbott et al., 2005; Naish et al., 2005).
Erosion surfaces have not been identified in Unit II, which is more homogeneous and where recovery beneath the shelf was poorest. However, indurated intervals of in situ carbon-ate cementation may correlate with seismic sequence bound-aries. Sediment recovered from Unit II was predominantly muddy, suggesting deposition on a shelf below fair-weather wave base. The lack of abundant shell debris suggests that the setting was more distal than during deposition of Unit I.
Fitting seismically resolvable sequences within the hier-archy of known global forcing has long been problematic. The relationship between high-frequency Milankovitch cycles and longer, seismic-scale sequences remains an unre-solved area of research. Saul et al. (1999) showed that, for the Wanganui Basin, classic fourth- and fifth-order cyclo-thems are grouped together into third-order cycles that were controlled by basin-wide tectonic rhythms. Alternatively, Miller et al. (2005) have pointed out that some third-order cyclicity may be manifestations of longer wavelength Milankovitch periodicities of 1.2 My and 2.4 My, or of inter-ference between these cycles.
The high accumulation rates of the Canterbury Basin provide the opportunity to link seismic sequences to specific Milankovitch frequencies, as revealed by oxygen isotopic records (Fig. 4). This will allow us to evaluate how predomi-nant forcing frequencies change through time and to con-strain the depositional parameters required to generate and preserve seismically resolvable sequences. The seismic sequences span the range between Milankovitch-scale cycli-city and longer period, third-order, seismically resolvable cycles. The two upper, seismically delimited sequences beneath the shelf (corresponding to the sequences overlying seismic sequence boundaries U18 and U19) almost certainly represent 100-k.y. cycles corresponding to marine isotope stages (MIS) 1–5 and 6–7, respectively, based on magnetic susceptibility and natural gamma ray time series. Correlations with older MIS stages are also likely as ages are refined. In contrast, Miocene to early Pliocene sequences represent longer cycles and may correlate with the 400-k.y. eccentricity cycle.
Influence of Ocean Currents on Deposition
Northeastward flowing currents (Southland Current, inboard of the Subtropical Front, and a gyre of the
Science Reports
Figure 8. Core photographs of a lithologic surface and associated sediments in Unit I at outermost shelf Site U1351. Gray sand overlies greenish mud at a burrowed contact (arrow). This contact correlates with the predicted depth of seismic sequence boundary U18 (from Fulthorpe et al., 2011).
Scientific Drilling, No. 12, September 2011 11
Science Reports
cific age consistent with an along-strike source. This inter-pretation is more consistent with that of the coeval interval at Site 1119. Hemipelagic sediments of Units IIA and IIB at Site U1352 may have been deposited as sediment drifts; subtle seismic geometries suggest the influence of along-strike processes (e.g., paleoslopes on Figs. 6 and 7). Diagnostic sedimentary structures are rare, partly because of extensive bioturbation, but intermittent wavy laminations occur in Unit IIB. Alternations of light-colored marlstone with darker mud-stone may reflect switching between hemipelagic carbonate deposition and increased terrigenous influx cor-responding to alternating along-strike and downslope sedi-mentary processes, respectively. Expedition 317 drilling therefore provides insights into the development of ocean circulation in this region, as well as the interaction of along-strike and downslope processes with implications for both sequence stratigraphy and models of clinoform deve-lopment.
Marshall Paraconformity
The Marshall Paraconformity is a regional unconformity terminating the post-rift transgressive phase and capping the widespread Amuri Limestone formation. The para-conformity has been dated at its onshore type section using strontium isotopes as representing a minimum hiatus of
Subantarctic Front) sweep the margin today to water depths of ~900 m (Chiswell, 1996; Morris et al., 2001; Fig. 2). The buried sedi-ment drifts in the Canterbury Bight, as well as outcrop evidence of current-related depo-sition, suggest that similar currents have been active for the last 30 My (Fig. 5). However, the influence of currents on deposi-tion at seismic scale varies markedly along strike, with large drifts developing in the northeast near ODP Site 1119 (Leg 181), while coeval sequences to the southwest at the Expedition 317 transect are clinoformal (compare Figs. 5 and 6). The role of along-strike processes in sequence stratigraphy has been unclear; sediment transport in the sequence stratigraphic model is viewed as essentially two-dimensional. Expedition 317 results provide insight into the interaction of along-strike and downslope processes within a sequence stratigraphic framework in a location where a current is known to have been present, but whose seismic strati- graphic signature varies greatly both spatial-ly and temporally.
Beginning at the seafloor, ODP Site 1119 sediments are interpreted as products of current reworking, corresponding to the clear seismic signatures of sediment drift development. In contrast, Site U1352 features a complex interplay of along-strike and downslope depositio-nal processes. For example, the uppermost interval (Subunit IA; 0–98 m, Pleistocene to Holocene) is interpreted as a series of lowstand shelf-edge deltas fed by sediment gravity flows represented by sharp-based gray very fine to fine sands, whose mineralogy indicates direct offshore and downslope transport from sources in the Torlesse Terrane, located onshore adjacent to the drilling area. This interpreta-tion is supported by the presence of reworked nannofossils consisting of mixed, poorly-preserved Eocene-Oligocene assemblages derived from onshore. However, the rest of Site U1352 (Subunit IB and below) and the slope interval of Site U1351 include sediment from the Otago Schist to the south, indicating increasing downhole importance of along-strike transport. Nevertheless, downslope transport is also inter-preted in Subunit IB. Interbedded, sharp-based greenish sands that occur within dark gray hemipelagic mud are interpreted as mass flows; abundant shells in one sand suggest transport from a shallow marine environment. Therefore, Subunit IB is a transitional interval of increasing (downhole) contourite deposition culminating in Subunit IC, which contains a well-sorted, very fine-grained sand fraction consistent with considerable transport distance. Subunit IC also contains reworked nannofossils. However, in contrast to those in Subunit IA, these reworked assemblages are well-preserved and contain cold-water taxa from a monospe-
Science Reports
Figure 9. Schematic model of the repetitive facies assemblages that characterize lithologic Unit I. The Type 2 facies assemblage is composed of greenish-gray shelly bioturbated mud with a sharp lower contact (ravinement surface), followed by a transition uphole into dark gray micaceous very fine sandy mud with color banding and alternations of sand and mud showing upward coarsening. The Type 1 facies assemblage is the basal part of the Type 2 assemblage (from Fulthorpe et al., 2011).
12 Scientific Drilling, No. 12, September 2011
Science ReportsScience ReportsScience ReportsScience Reports
32.4–29 Ma (Fulthorpe et al., 1996). There, it is overlain by mid-late Oligocene cross-bedded glauconitic sand (Concord Formation) and calcarenite limestone (Weka Pass Formation). The paraconformity was the deepest target of Expedition 317 drilling and is hypothesized to represent intensified current erosion or non-deposition associated with the initiation of thermohaline circulation upon opening of the seaway between Antarctica and Australia (~33.7 Ma), prior to opening of the Drake passage (Carter, 1985; Fulthorpe et al., 1996; Carter et al., 2004).
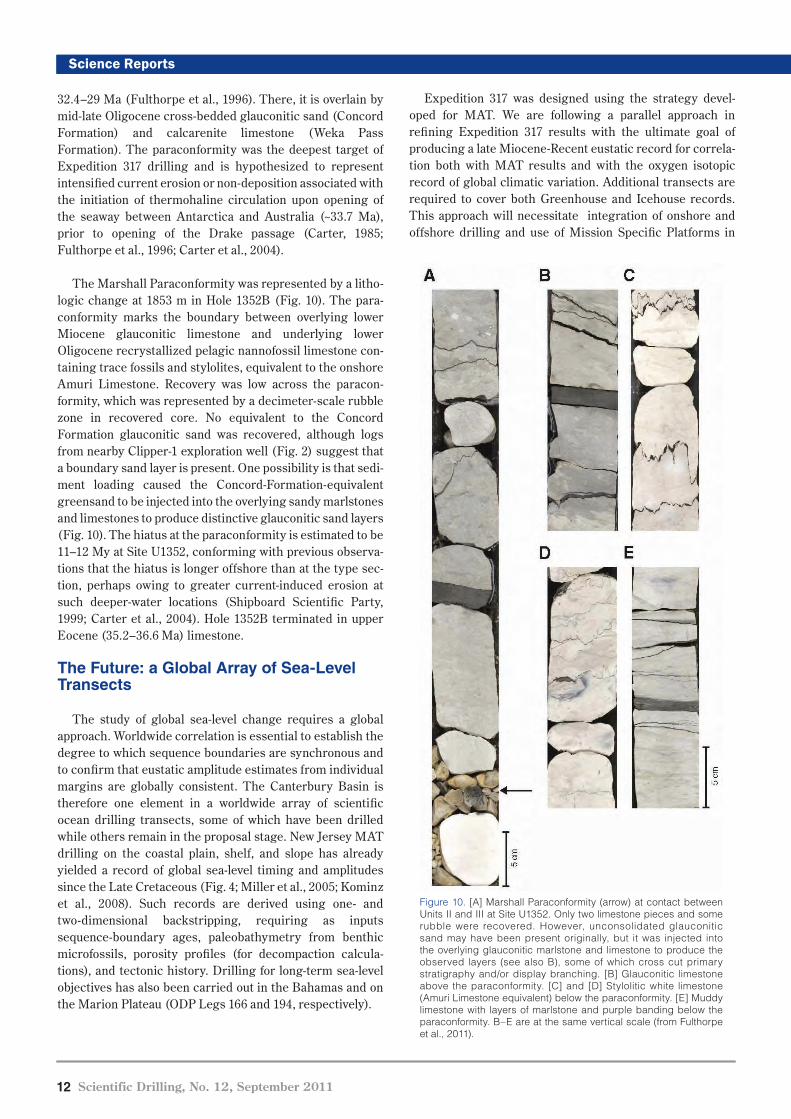
The Marshall Paraconformity was represented by a litho-logic change at 1853 m in Hole 1352B (Fig. 10). The para-conformity marks the boundary between overlying lower Miocene glauconitic limestone and underlying lower Oligocene recrystallized pelagic nannofossil limestone con-taining trace fossils and stylolites, equivalent to the onshore Amuri Limestone. Recovery was low across the paracon- formity, which was represented by a decimeter-scale rubble zone in recovered core. No equivalent to the Concord Formation glauconitic sand was recovered, although logs from nearby Clipper-1 exploration well (Fig. 2) suggest that a boundary sand layer is present. One possibility is that sedi-ment loading caused the Concord-Formation-equivalent greensand to be injected into the overlying sandy marlstones and limestones to produce distinctive glauconitic sand layers (Fig. 10). The hiatus at the paraconformity is estimated to be 11–12 My at Site U1352, conforming with previous observa-tions that the hiatus is longer offshore than at the type sec-tion, perhaps owing to greater current-induced erosion at such deeper-water locations (Shipboard Scientific Party, 1999; Carter et al., 2004). Hole 1352B terminated in upper Eocene (35.2–36.6 Ma) limestone.
The Future: a Global Array of Sea-Level Transects
The study of global sea-level change requires a global approach. Worldwide correlation is essential to establish the degree to which sequence boundaries are synchronous and to confirm that eustatic amplitude estimates from individual margins are globally consistent. The Canterbury Basin is therefore one element in a worldwide array of scientific ocean drilling transects, some of which have been drilled while others remain in the proposal stage. New Jersey MAT drilling on the coastal plain, shelf, and slope has already yielded a record of global sea-level timing and amplitudes since the Late Cretaceous (Fig. 4; Miller et al., 2005; Kominz et al., 2008). Such records are derived using one- and two-dimensional backstripping, requiring as inputs sequence-boundary ages, paleobathymetry from benthic microfossils, porosity profiles (for decompaction calcula-tions), and tectonic history. Drilling for long-term sea-level objectives has also been carried out in the Bahamas and on the Marion Plateau (ODP Legs 166 and 194, respectively).
Expedition 317 was designed using the strategy devel-oped for MAT. We are following a parallel approach in refining Expedition 317 results with the ultimate goal of producing a late Miocene-Recent eustatic record for correla-tion both with MAT results and with the oxygen isotopic record of global climatic variation. Additional transects are required to cover both Greenhouse and Icehouse records. This approach will necessitate integration of onshore and offshore drilling and use of Mission Specific Platforms in
Figure 10. [A] Marshall Paraconformity (arrow) at contact between Units II and III at Site U1352. Only two limestone pieces and some rubble were recovered. However, unconsolidated glauconitic sand may have been present originally, but it was injected into the overlying glauconitic marlstone and limestone to produce the observed layers (see also B), some of which cross cut primary stratigraphy and/or display branching. [B] Glauconitic limestone above the paraconformity. [C] and [D] Stylolitic white limestone (Amuri Limestone equivalent) below the paraconformity. [E] Muddy limestone with layers of marlstone and purple banding below the paraconformity. B–E are at the same vertical scale (from Fulthorpe et al., 2011).
Scientific Drilling, No. 12, September 2011 13
Science ReportsScience ReportsScience ReportsScience Reports
shallow-water settings, as has been done off New Jersey, Tahiti, and the Great Barrier Reef (IODP Expeditions 313, 310, and 325, respectively). Additional drilling of carbonate clinoforms is also required to evaluate how the response of such systems to sea-level change differs from that of silici-clastic systems. Finally, drilling on active margins should be explored to take advantage of very high rates of sediment supply that create expanded sections and allow study of eustatic cycles at orbital forcing frequencies, as well as illuminating the interplay of eustatic and tectonic forcing.
Acknowledgements
We thank the crew of the D/V JOIDES Resolution and all drilling operations personnel, who overcame the consider-able difficulties associated with drilling deep boreholes in shallow water to ensure the success of Expedition 317. Many thanks are also due to the U.S. Implementing Organization technicians who are such a vital part of the drilling program. The authors also thank three anonymous reviewers for their helpful and insightful input.
IODP Expedition 317 Scientists
Craig Fulthorpe (Co-Chief Scientist), Koichi Hoyanagi (Co-Chief Scientist), Peter Blum (Staff Scientist), Stacie Blair, Gregory Browne, Robert Carter, Maria-Cristina Ciobanu, George Claypool, Martin Crundwell, Jaime Dinarès-Turrell, Xuan Ding, Simon George, Gilles Guèrin, Daniel Hepp, John Jaeger, Shungo Kawagata, David Kemp, Young-Gyun Kim, Michelle Kominz, Helen Lever, Julius Lipp, Kathleen Marsaglia, Cecilia McHugh, Naomi Murakoshi, Takeshi Ohi, Laura Pea, Julie Pollard, Mathieu Richaud, Angela Slagle, Itsuki Suto, Susumu Tanabe, Kirsteen Tinto, Goichiro Uramoto, and Toshihiro Yoshimura
References
Abbott, S.T., and Carter, R.M., 1999. Stratigraphy of the Castlecliffian
type section: Ten mid-Pleistocene sequences from the
Wanganui coast, New Zeal. J. Geol. Geop., 42:91–111, doi:10.
1080/00288306.1999.9514834.
Abbott, S.T., Naish, T.R., Carter, R.M., and Pillans, B.J., 2005.
Sequence stratigraphy of the Nukumaru stratotype
(Pliocene-Pleistocene, c. 2.08–1.63 Ma) Wanganui Basin,
New Zealand. J. Roy. Soc. New Zeal., 35:123–150, doi:10.108
0/03014223.2005.9517779.
Adams, C.J.D., 1979. Age and origin of the Southern Alps. In Walcott,
R.I., and Cresswell, M.M. (Eds.), The Origin of the Southern
Alps, Royal Society of New Zealand Bulletin, 18:73–78.
Austin, J.A., Jr., Christie-Blick, N., Malone, M.J., Mountain, G.S., and
the Leg 174A Shipboard Party, 1998. Proc. ODP, Init. Repts.,
174A: College Station, TX (Ocean Drilling Program).
Batt, G.E., Braun, J., Kohn, B.P., and McDougall, I., 2000.
Thermochronological analysis of the dynamics of the
Southern Alps, New Zealand. Geol. Soc. Am. Bull.,
112:250–266, doi:10.1130/0016-7606(2000)112<250:TAOT
DO>2.0.CO;2.Carter, L., Carter, R.M., McCave, N.I., and Gamble, J., 1996. Regional
sediment recycling in the abyssal Southwest Pacific Ocean. Geology, 24:735–738, doi:10.1130/0091-7613(1996)024< 0735:RSRITA>2.3.CO;2.
Carter, R.M., 1985. The mid-Oligocene Marshall Paraconformity, New Zealand: Coincidence with global eustatic fall or rise? J. Geol., 93:359–371, doi:10.1086/628957.
Carter, R.M., and Landis, C.A., 1972. Correlative Oligocene uncon-formities in southern Australasia. Nature, 237:12–13.
Carter, R.M., and Norris, R.J., 1976. Cainozoic history of southern New Zealand: An accord between geological observations and plate-tectonic predictions. Earth Planet. Sci. Lett., 31:85–94, doi:10.1016/0012-821X(76)90099-6.
Carter, R.M., Abbott, S.T., Fulthorpe, C.S., Haywick, D.W., and Henderson, R.A., 1991. Application of global sea-level and sequence stratigraphic models in southern hemisphere Neogene strata from New Zealand. In MacDonald, D. (Ed.), Sea-level and Active Plate Margins. International Association of Sedimentologists Spec. Pub., 12:41–65.
Carter, R.M., McCave, I.N., and Carter, L., 2004. Leg 181 synthesis: Fronts, flows, drifts, volcanoes, and the evolution of the southwestern gateway to the Pacific Ocean, Eastern New Zealand. In Richter, C. (Ed.), Proc. ODP Scientific Results, 181, College Station, TX (Ocean Drilling Program), 1–111.
Chiswell, S.M., 1996. Variability in the Southland Current, New Zealand. New Zeal. J. Mar. Fresh. Res., 30:1–17, doi:10.1080/00288330.1996.9516693.
Christie-Blick, N., 1991. Onlap, offlap, and the origin of unconformity-bounded depositional sequences. Mar. Geol., 97:35–56, doi:10.1016/0025-3227(91)90018-Y.
Field, B.D., and Browne, G.H., 1989. Cretaceous and Cenozoic sedimentary basins and geological evolution of the Canterbury Region, South Island, New Zealand. New Zeal. Geol. Surv. Bull., 2, 94 p.
Fleming, C.A., 1962. New Zealand biogeography: A paleontologist's approach. Tuatara, 10:53–108.
Fulthorpe, C.S., and Carter, R.M., 1991. Continental shelf prograda-tion by sediment drift accretion. Geol. Soc. Am,. Bull., 103:300–309, doi:10.1130/0016-7606(1991)103<0300:CSPBSD>2.3.CO;2.
Fulthorpe, C.S., Carter, R.M., Miller, K.G., and Wilson, J., 1996. Marshall Paraconformity: A mid-Oligocene record of incep-tion of the Antarctic Circumpolar Current and coeval glacio-eustatic lowstand? Mar. Petrol. Geol., 13:61–77, doi:10.1016/0264-8172(95)00033-X.
Fulthorpe, C.S., Hoyanagi, K., Blum, P., and the Expedition 317 Scientists, 2011. Proc. IODP, 317: Tokyo (Integrated Ocean Drilling Program Management International, Inc.), doi:10.2204/ iodp.proc.317.2011.
Haq, B.U., Hardenbol, J., and Vail, P.R., 1987. Chronology of fluctuat-ing sea levels since the Triassic. Science, 235:1156–1167, doi:10.1126/science.235.4793.1156.
Kamp, P.J.J., 1987. Age and origin of the New Zealand orocline in rela-tion to Alpine Fault movement. J. Geol. Soc. London, 144:641–652, doi:10.1144/gsjgs.144.4.0641.
Karner, G.D., 1986. Effects of lithospheric in-plane stress on sedimen-tary basin stratigraphy. Tectonics, 5:573–588, doi:10.1029/TC005i004p00573.
14 Scientific Drilling, No. 12, September 2011
Science Reports
King, P.R., 2000. Tectonic reconstructions of New Zealand: 40 Ma to the Present. New Zeal. J. Geol. Geop., 43:611–638, doi:10.1080/00288306.2000.9514913.
Kominz, M.A., Browning, J.V., Miller, K.G., Sugarman, P.J., Mizintseva, S., and Scotese, C.R., 2008. Late Cretaceous to Miocene sea-level estimates from the New Jersey and Delaware coastal plain coreholes: An error analysis. Basin Res., 20:211–226, doi:10.1111/j.1365-2117.2008.00354.x.
Lu, H., and Fulthorpe, C.S., 2004. Controls on sequence stratigraphy of a middle-Miocene to Recent, current-swept, passive mar-gin: Offshore Canterbury Basin, New Zealand. Geol. Soc. Am. Bull., 116:1345–1366, doi:10.1130/B2525401.1.
Lu, H., Fulthorpe, C.S., and Mann, P., 2003. Three-dimensional archi-tecture of shelf-building sediment drifts in the offshore Canterbury Basin, New Zealand. Mar. Geol., 193:19–47, doi:10.1016/S0025-3227(02)00612-6.
Lu, H., Fulthorpe, C.S., Mann, P., and Kominz, M., 2005. Miocene-Recent tectonic controls on sediment supply and sequence stratigraphy: Canterbury Basin, New Zealand. Basin Res., 17:311–328, doi:10.1111/j.1365-2117.2005.00266.x.
Miall, A.D, and Miall, C.E., 2001. Sequence stratigraphy as a scien-tific enterprise: The evolution and persistence of conflicting paradigms. Earth Sci. Rev. 54:321–348, doi:10.1016/S0012-8252(00)00041-6.
Miller, K.G., Kominz, M.A., Browning, J.V., Wright, J.D., Mountain, G.S., Katz, M.E., Sugarman, P.J., Cramer, B.S., Christie-Blick, N., and Pekar, S.F., 2005. The Phanerozoic record of global sea-level change. Science, 310:1293–1298, doi:10.1126/science.1116412.
Mitchum, R.M., Vail, P.R., and Thompson, S., 1977. Seismic stratigra-phy and global changes of sea level, part 2: The depositional sequence as a basic unit for stratigraphic analysis. In Payton, C.E. (Ed.), Seismic Stratigraphy - Applications to Hydrocarbon Exploration, AAPG Memoir, 26:53–62.
Morris, M., Stanton, B., and Neil, H., 2001. Subantarctic oceanogra-phy around New Zealand: Preliminary results from an ongo-ing survey. New Zeal. J. Mar. Fresh. Res., 35:499–519, doi:10.1080/00288330.2001.9517018.
Mountain, G., Proust, J.-N., and the Expedition 313 Science Party, 2010. The New Jersey margin scientific drilling project (IODP Expedition 313): Untangling the record of global and local sea-level changes. Sci. Drill., 10:26–34, doi:10.2204/iodp.sd.10.03.2010.
Naish, T.M., Wehland, F., Wilson, G.S., Browne, G.H., Cook, R.A., Morgans, H.E., Rosenberg, M., King, P.R., Smale, D., Nelson, C.S., Kamp, P.J.J., and Ricketts, B., 2005. An inte-grated sequence stratigraphic, paleonenvironmental, and chronostratigraphic analysis of the Tangahoe Formation, southern Taranaki coast, with implications for mid-Pliocene (c. 3.4-3.0 Ma) glacio-eustatic sea-level changes. J. Roy. Soc. New Zeal., 35:151–196, doi:10.1080/03014223.2005.9517780.
Norris, R.J., Carter, R.M., and Turnbull, I.M., 1978. Cainozoic sedi-mentation in basins adjacent to a major continental trans-form boundary in southern New Zealand. J. Geol. Soc. London, 135:191–205, doi:10.1144/gsjgs.135.2.0191.
Saul, G., Naish, T.R., Abbott, S.T., and Carter, R.M., 1999. Sedimentary cyclicity in the marine Plio-Pleistocene of Wanganui Basin (N.Z.): Sequence stratigraphic motifs characteristic of the last 2.5 Ma. Geol. Soc. Am. Bull., 111:524–537, doi:10.1130/0016-7606(1999)111<0524:SCITMP>2.3.CO;2.
Shipboard Scientific Party, 1999. Leg 181 summary: Southwest Pacific paleoceanography. In Carter, R.M., McCave, I.N., Richter, C., Carter, L., et al., Proc. ODP Init. Repts., 181, College Station, TX (Ocean Drilling Program), 1–80.
Tippett, J.M., and Kamp, P.J.J., 1993a. Fission track analysis of the Late Cenozoic vertical kinematics of continental Pacific crust, South Island, New Zealand. J. Geophys. Res., 98:16119–16148, doi:10.1029/92JB02115.
Tippett, J.M., and Kamp, P.J.J., 1993b. The role of faulting in rock uplift in the Southern Alps, New Zealand. New Zeal. J. Geol. Geop. 36:497–504, doi:10.1080/00288306.1993.9514595.
Vail, P.R., Audemard, F., Bowman, S.A., Eisner, P.N., and Perez-Cruz, C., 1991. The stratigraphic signatures of tectonics, eustasy and sedimentology—an overview. In Einsele, G., Ricken, W., and Seilacher, A. (Eds.), Cycles and Events in Stratigraphy: Berlin (Springer-Verlag), 617–659.
Wellman, H.W., 1971. Age of the Alpine Fault, New Zealand. Proc. 22nd Int. Geol. Congr., 4:148–162.
Authors
Craig S. Fulthorpe, Institute for Geophysics, John A. and Katherine G. Jackson School of Geosciences, University of Texas at Austin, 10100 Burnet Road (R2200), Building 196 (ROC), Austin, TX 78758-4445, U.S.A., E-mail: [email protected] Hoyanagi, Department of Geology, Faculty of Science, Shinshu University, 3-1-1 Asahi, Matsumoto 390-8621, Japan, E-mail: [email protected] Blum, United States Implementing Organization, Integrated Ocean Drilling Program, Texas A&M University, 1000 Discovery Drive, College Station, TX 77845, U.S.A., E-mail: [email protected] the IODP Expedition 317 Scientists

Scientific Drilling, No. 12, September 2011 15
Science Reports
IODP Expedition 318: From Greenhouse to Icehouse at the Wilkes Land Antarctic Margin
by Carlota Escutia, Henk Brinkhuis, Adam Klaus, and the IODP Expedition 318 Scientists
doi: 10.2204/iodp.sd.12.02.2011
Science Reports
Abstract
Integrated Ocean Drilling Program (IODP) Expedition 318, Wilkes Land Glacial History, drilled a transect of sites across the Wilkes Land margin of Antarctica to provide a long-term record of the sedimentary archives of Cenozoic Antarctic glaciation and its intimate relationships with global climatic and oceanographic change. The Wilkes Land drill-ing program was undertaken to constrain the age, nature, and paleoenvironment of the previously only seismically inferred glacial sequences. The expedition (January–March 2010) recovered ~2000 meters of high-quality middle Eocene–Holocene sediments from water depths between 400 m and 4000 m at four sites on the Wilkes Land rise (U1355,
U1356, U1359, and U1361) and three sites on the Wilkes Land shelf (U1357, U1358, and U1360).
These records span ~53 million years of Antarctic history, and the various seismic units (WL-S4–WL-S9) have been successfully dated. The cores reveal the history of the Wilkes Land Antarctic margin from an ice-free “green-house” Antarctica, to the first cooling, to the onset and ero-sional consequences of the first glaciation and the subse-quent dynamics of the waxing and waning ice sheets, all the way to thick, unprecedented “tree ring style” records with seasonal resolution of the last deglaciation that began ~10,000 y ago. The cores also reveal details of the tectonic history of the Australo-Antarctic Gulf from 53 Ma, por-
traying the onset of the second phase of rifting between Australia and Antarctica, to ever-subsiding margins and deepening, to the present continental and ever-wide-ning ocean/continent configuration.
Introduction
Polar ice is an important component of the modern climate system, affecting among other things global sea level, ocean circulation and heat transport, marine pro-ductivity, air-sea gas exchange, and plane-tary albedo. The modern ice caps are, geo-logically speaking, a relatively young phenomenon. Since mid-Permian times (~270 Ma), parts of Antarctica became reglaciated only ~34 m.y. ago, whereas full-scale, permanent Northern Hemisphere continental ice began only ~3 m.y. ago (Zachos et al., 2008; Fig. 1). The record of Antarctic glaciation, from the time of first ice-sheet inception through the significant periods of climate change during the Cenozoic, is not only of scientific interest but also is of great importance for society. State-of-the-art climate models (DeConto and Pollard, 2003a, 2003b; Huber et al., 2004; DeConto et al., 2007; Pollard and DeConto, 2009) combined with paleocli-matic proxy data (Pagani et al., 2005) sug-gest that the main triggering mechanism for inception and development of the
Science Reports
Figure 1. Updated Cenozoic pCO2 and stacked deep-sea benthic foraminifer oxygen isotope curve for 0 Ma to 65 Ma. NB: Updated from Zachos et al. (2008) and converted to the “Gradstein timescale” (Gradstein et al., 2004). Mi-1 = Miocene isotope Event 1, Oi-1 = Oligocene isotope Event 1, ETM2 = Eocene Thermal Maximum 2, PETM = Paleocene/Eocene Thermal Maximum, ETM1 = Eocene Thermal Maximum 1.
-1
0
1
2
3
4
5
0 10 20 30 40 50 60
Miocene OligocenePlio.Plt.
4°
0°
8°
12°
Ice-
free
tem
pera
ture
(°C)
Full-scale and permanentPartial or ephemeral
PETM
(ETM
1)
Atm
osph
eric
CO
2 (p
pmv)
4000
0
1000
2000
3000
5000
Age (Ma)
CO 2 proxies
Boron
Alkenones
0 10 20 30 40 50 60
Anthropogenic peak
early Eoceneminimum
PaleoceneEocene
Early EoceneClimatic Optimum
Nahcolite
Trona
Cret.
ETM
2
Antarctic ice sheets
N. Hemisphere ice sheets?
N. Hemisphere sea ice??Episodic perennial
Seasonal
?
Mid
-Mio
cene
Clim
atic
O
ptim
um
Mid
-Eoc
ene
Clim
atic
O
ptim
um
δ18O
(‰)
Oi-1M
i-1
16 Scientific Drilling, No. 12, September 2011
Science Reports
estimates have not been experienced since before the ice sheets in Antarctica formed.
Since their inception, the Antarctic ice sheets appear to have been very dynamic, waxing and waning in response to global climate change over intermediate and even short (orbital) timescales (Wise et al., 1991; Zachos et al., 1997; Pollard and DeConto, 2009). However, not much is known about the nature, cause, timing, and rate of processes invol-ved. Of the two main ice sheets, the West Antarctic Ice Sheet (WAIS) is mainly marine based and is considered less stable (Florindo and Siegert, 2009). The East Antarctic Ice Sheet (EAIS), which overlies continental terrains that are largely above sea level, is considered stable and is believed to respond only slowly to changes in climate (Florindo and
Antarctic ice sheet was the decreasing levels of CO2 (and other greenhouse gases) concentrations in the atmosphere (DeConto and Pollard, 2003a, 2003b; Figs 1, 2). The opening of critical Southern Ocean gateways played only a second-ary role (Kennett, 1977; DeConto and Pollard, 2003a; Huber et al., 2004). With current rising atmospheric greenhouse gases resulting in rapidly increasing global temperatures (Intergovernmental Panel on Climate Change [IPCC], 2007; www.ipcc.ch/), studies of polar climates are prominent on the research agenda. Understanding Antarctic ice-sheet dynamics and stability is of special relevance because, based on IPCC (2007) forecasts, atmospheric CO2 doubling and a 1.8°C–4.2°C temperature rise is expected by the end of this century. The lower values of these estimates have not been experienced on our planet since 10–15 Ma, and the higher
Ice-
shee
t thi
ckne
ss (
m)
40003500
30002500
200015001000
5000
∆ Sea level (m)
0 20 40 60
∆ δ18 O0.0 0.2 0.4 0.6
Ice volume (106 km 3)
0 10 20
Tim
e (1
06
mod
ely)
2
4
6
8
10 2.0
2.2
2.4
2.6
3.0
3.2
3.4
3.6
2.8
CO2
(PA
L)
60°S
70°
80°
PB
WL
LG
0E
0E
0E
0E
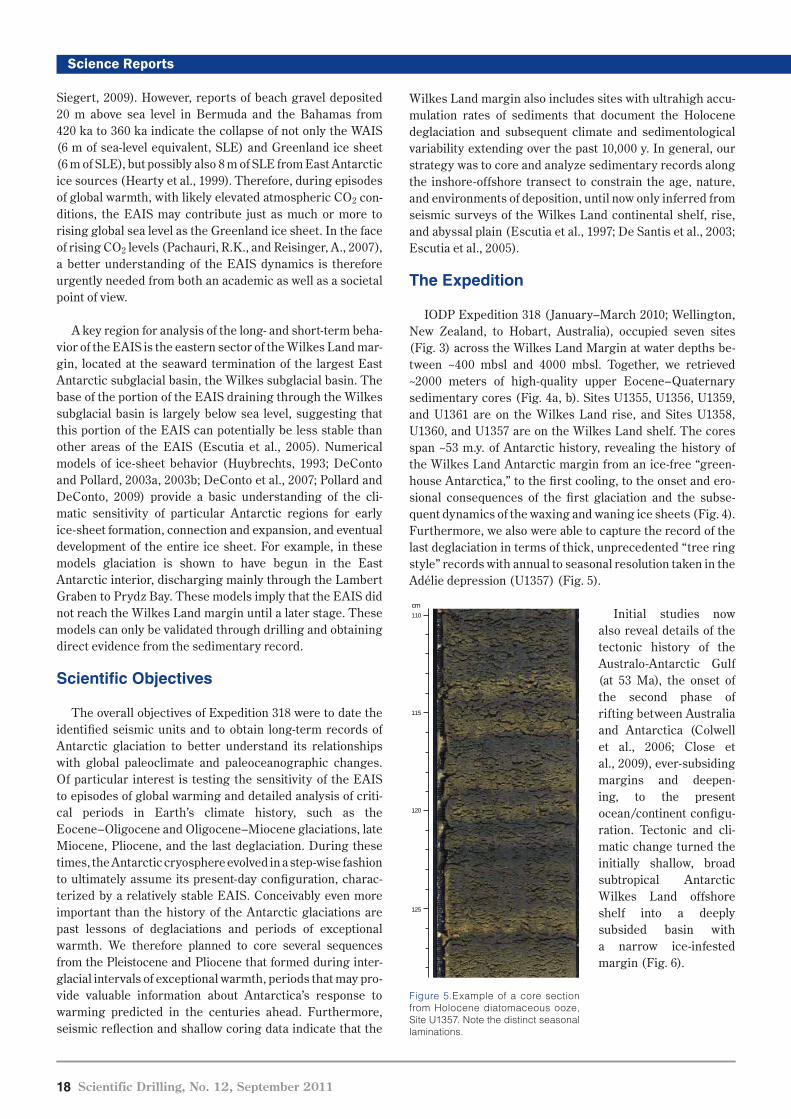
Figure 3. Combined IODP Expedition 318 transit and drill sites.
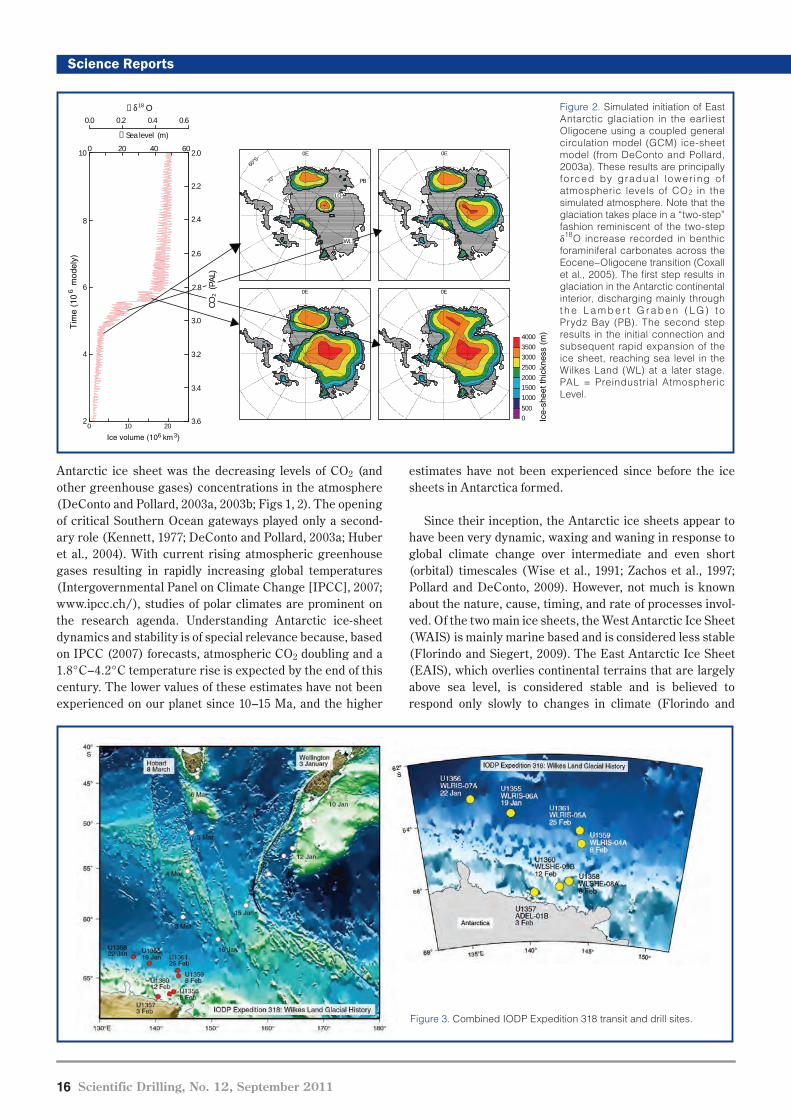
Figure 2. Simulated initiation of East Antarctic glaciation in the earliest Oligocene using a coupled general circulation model (GCM) ice-sheet model (from DeConto and Pollard, 2003a). These results are principally fo rced by gradual lower ing of atmospheric levels of CO2 in the simulated atmosphere. Note that the glaciation takes place in a “two-step” fashion reminiscent of the two-step δ18O increase recorded in benthic foraminiferal carbonates across the Eocene–Oligocene transition (Coxall et al., 2005). The first step results in glaciation in the Antarctic continental interior, discharging mainly through t h e L a m b e r t G ra b e n ( LG) t o Prydz Bay (PB). The second step results in the initial connection and subsequent rapid expansion of the ice sheet, reaching sea level in the Wilkes Land (WL) at a later stage. PAL = Preindustrial Atmospheric Level.

Scientific Drilling, No. 12, September 2011 17
Science Reports
-10123450
10
20
30
40
50
60
Mio
cene
Olig
ocen
ePl
io.
Plt.
δ18O (‰)
U13
59
4°0° 8° 12°
Ice-free temperature (°C)
Full-scale and permanent
Partial or ephemeral
PETM (ETM1)
Age
(Ma)
Pale
ocen
eEo
cene
Early
Eoc
ene
Clim
atic
Opt
imum
Cret
.
ETM2
Ant
arct
ic ic
e sh
eets
N. H
emis
pher
e ic
e sh
eets
?N
. Hem
isph
ere
sea
ice
?
?
Epis
odic
per
enni
al
?
Mid-Miocene Climatic Optimum
U13
55
U13
57
U13
60
U13
58
U13
56
U13
61
Shelf sites Rise sites
Seas
onal
WL-U8?
Iceh
ouse
Gre
enho
use
WL-U5
WL-U4
WL-U3
51.06 Ma
51.90 Ma
Clay/Silt
Sand
Diatom ooze
Nannofossil ooze
Sandy mud
Limestone
Lithology
RiseSite
U1356
RiseSite
U1359
RiseSite
U1361
ShelfSite
U1358
ShelfSite
U1360
Clast-richsandy diamict
Clast-poorsandy diamict
Timescale
25
30
35
40
45
50
55
Age
(Ma)
0
5
10
15
20
Eoce
neO
ligoc
ene
Pale
o-ce
neM
ioce
ne
Plio-cene
cene
Holocene
C18
C17
C16
C15
C13
C12
C11
C10
C9
C8
C7A
C7
C6C
C6B
C6AA
C6A
C26
C25
C24
C23
C22
C21
C20
C19
C5E
C5D
C5C
C5B
C5A D
C5A C
C5ABC5AAC5A
C5
C4A
C4
C3B
C3A
C3
C2A
C2
C1 C1n
C3n
C2An
C3An
C4n/C4An
C5n
C5r.2n
C5An
C5An
C3An
C2An
C3n
C1nC2n
C5n
1000
975
950
925
900
875
850
825
800
775
750
725
700
675
650
625
600
575
550
525
500
475
450
425
400
375
350
325
300
275
250
225
200
175
150
125
100
75
50
250
Dep
th (m
bsf)
C24n
C12n
C9n
C8n
C7An
C5Dn
C5Cn
C5AAnC5ABnC5ACnC5ADn
C23n.2n
C11n.1n
C10n
C5Bn.2n
600
575
550
525
500
475
450
425
400
375
350
325
300
275
250
225
200
175
150
125
100
75
50
250
375
350
325
300
275
250
225
200
175
150
125
100
75
50
250
250
Insu�cient paleomagnetic data
C5AB
C5AA
C5A
C5
C4A
C4
C3B
C3A
C3
C2A
C2
C1
0
5
10 Mio
cene
Plio
-ce
nePl
eist
o-ce
ne
Holo-cene
1
2
3
7
8
9
6
4
13
11
12
h
h
Pleist.
Plio.
C12r
C23n.2n
50
250
Pleist.
C12r
14.3 m
h
h
U5
U3
Timescale
A
B
Figure 4. [A] S tacked deep-sea benthic foraminifer oxygen isotope curve for 0–65 Ma (updated from Zachos et al., 2008) converted into “Gradstein timescale” (Gradstein et al., 2004) and combined with chronostratigraphy of the sites drilled dur ing E xpedi t ion 318. E TM2 = Eocene Thermal Maximum 2, PETM = Paleocene/Eocene Thermal Maximum, ETM1 = Eocene Thermal Maximum 1.
[B] Chronostratigraphic framework for sites drilled during Expedition 318. Timescales are those of Gradstein et al. (2004). [11x17 landscape]
18 Scientific Drilling, No. 12, September 2011
Science Reports
Wilkes Land margin also includes sites with ultrahigh accu-mulation rates of sediments that document the Holocene deglaciation and subsequent climate and sedimentological variability extending over the past 10,000 y. In general, our strategy was to core and analyze sedimentary records along the inshore-offshore transect to constrain the age, nature, and environments of deposition, until now only inferred from seismic surveys of the Wilkes Land continental shelf, rise, and abyssal plain (Escutia et al., 1997; De Santis et al., 2003; Escutia et al., 2005).
The Expedition
IODP Expedition 318 (January–March 2010; Wellington, New Zealand, to Hobart, Australia), occupied seven sites (Fig. 3) across the Wilkes Land Margin at water depths be-tween ~400 mbsl and 4000 mbsl. Together, we retrieved ~2000 meters of high-quality upper Eocene–Quaternary sedimentary cores (Fig. 4a, b). Sites U1355, U1356, U1359, and U1361 are on the Wilkes Land rise, and Sites U1358, U1360, and U1357 are on the Wilkes Land shelf. The cores span ~53 m.y. of Antarctic history, revealing the history of the Wilkes Land Antarctic margin from an ice-free “green-house Antarctica,” to the first cooling, to the onset and ero-sional consequences of the first glaciation and the subse-quent dynamics of the waxing and waning ice sheets (Fig. 4). Furthermore, we also were able to capture the record of the last deglaciation in terms of thick, unprecedented “tree ring style” records with annual to seasonal resolution taken in the Adélie depression (U1357) (Fig. 5).
Initial studies now also reveal details of the tectonic history of the Australo-Antarctic Gulf (at 53 Ma), the onset of the second phase of rifting between Australia and Antarctica (Colwell et al., 2006; Close et al., 2009), ever-subsiding margins and deepen- ing, to the present ocean/continent configu-ration. Tectonic and cli-matic change turned the initially shallow, broad subtropical Antarctic Wilkes Land offshore shelf into a deeply subsided basin with a narrow ice-infested margin (Fig. 6).
Siegert, 2009). However, reports of beach gravel deposited 20 m above sea level in Bermuda and the Bahamas from 420 ka to 360 ka indicate the collapse of not only the WAIS (6 m of sea-level equivalent, SLE) and Greenland ice sheet (6 m of SLE), but possibly also 8 m of SLE from East Antarctic ice sources (Hearty et al., 1999). Therefore, during episodes of global warmth, with likely elevated atmospheric CO2 con-ditions, the EAIS may contribute just as much or more to rising global sea level as the Greenland ice sheet. In the face of rising CO2 levels (Pachauri, R.K., and Reisinger, A., 2007), a better understanding of the EAIS dynamics is therefore urgently needed from both an academic as well as a societal point of view.
A key region for analysis of the long- and short-term beha-vior of the EAIS is the eastern sector of the Wilkes Land mar-gin, located at the seaward termination of the largest East Antarctic subglacial basin, the Wilkes subglacial basin. The base of the portion of the EAIS draining through the Wilkes subglacial basin is largely below sea level, suggesting that this portion of the EAIS can potentially be less stable than other areas of the EAIS (Escutia et al., 2005). Numerical models of ice-sheet behavior (Huybrechts, 1993; DeConto and Pollard, 2003a, 2003b; DeConto et al., 2007; Pollard and DeConto, 2009) provide a basic understanding of the cli-matic sensitivity of particular Antarctic regions for early ice-sheet formation, connection and expansion, and eventual development of the entire ice sheet. For example, in these models glaciation is shown to have begun in the East Antarctic interior, discharging mainly through the Lambert Graben to Prydz Bay. These models imply that the EAIS did not reach the Wilkes Land margin until a later stage. These models can only be validated through drilling and obtaining direct evidence from the sedimentary record.
Scientific Objectives
The overall objectives of Expedition 318 were to date the identified seismic units and to obtain long-term records of Antarctic glaciation to better understand its relationships with global paleoclimate and paleoceanographic changes. Of particular interest is testing the sensitivity of the EAIS to episodes of global warming and detailed analysis of criti-cal periods in Earth’s climate history, such as the Eocene–Oligocene and Oligocene–Miocene glaciations, late Miocene, Pliocene, and the last deglaciation. During these times, the Antarctic cryosphere evolved in a step-wise fashion to ultimately assume its present-day configuration, charac-terized by a relatively stable EAIS. Conceivably even more important than the history of the Antarctic glaciations are past lessons of deglaciations and periods of exceptional warmth. We therefore planned to core several sequences from the Pleistocene and Pliocene that formed during inter-glacial intervals of exceptional warmth, periods that may pro-vide valuable information about Antarctica’s response to warming predicted in the centuries ahead. Furthermore, seismic reflection and shallow coring data indicate that the
Figure 5.Example of a core section from Holocene diatomaceous ooze, Site U1357. Note the distinct seasonal laminations.
cm
125
115
120
110

Scientific Drilling, No. 12, September 2011 19
Science Reports
activity related to the commencement of rapid seafloor spreading in the Australia-Antarctic Basin (AAB), reported to initiate around the same time (~50 Ma; Colwell et al., 2006). Also, combined Site U1356 and ODP Leg 189 dinocyst distribution patterns suggest earliest through-flow of South Pacific Antarctic waters through the Tasmanian Gateway to be coeval with this tectonic phase. Sedimentological and microfossil information from this interval from Hole U1356A also suggest some deepening during the early middle Eocene.
At Site U1356, the upper middle Eocene to the basal Oligocene is conspicuously missing in a ~19-m.y. hiatus at ~890 bsf (~47.9–33.6 Ma) marking unconformity WL-U3 based on dinocyst and paleomagnetic evidence. Despite ongoing tectonic reorganizations, it appears likely that the erosive nature of unconformity WL-U3 is notably related to the early stages of EAIS formation. The impact of ice-sheet growth, including crustal and sea-level response, and major erosion by the ice sheets, is proposed as the principal mecha-nism that formed unconformity WL-U3. This is supported by the abrupt increase in benthic foraminiferal δ18O values and
coeval sea-level change globally recorded in complete marine successions (Oligocene isotope event Oi-1; Miller et al., 1985; Coxall et al., 2005). Progressive subsidence—the large accommodation space created by ero-sion in the margin (300–600 m of missing strata; Eittreim et al., 1995)—and partial eustatic recovery allowed sediments of early Oligocene age to accumulate above unconformity WL-U3.
Microfossils, sedimentology, and geo-chemistry of the Oligocene sediments from Site U1356, at present occupying a distal setting (i.e., lowermost rise-abyssal plain) and immediately above unconfor-mity WL-U3, unequivocally reflect ice-house environments with evidence of ice-berg activity (dropstones) and at least seasonal sea-ice cover. The sediments, dominated by hemipelagic sedimentation with bottom current and gravity flow influence, as well as biota, indicate deeper water settings relative to the underlying middle Eocene environments. These find-ings imply significant crustal stretching, subsidence of the margin, and deepening of the Tasman Rise and the Adélie Rift Block (ARB) between 47.9 Ma and 33.6 Ma (Fig. 6).
Record of EAIS Variability
Drilling at continental rise Site U1356 also recovered a thick section of Oligocene
“Pre-Glacial” Regional Unconformity WL-U3 and the Timing, Nature, and Consequences of the First Major Phase of EAIS Growth
Prior to the expedition, the prominent unconformity WL-U3 had been interpreted to separate pre-glacial (Eocene) strata from (Oligocene) glacial-influenced deposits (Escutia et al., 1997, 2005). Drilling and dating of WL-U3 at continen-tal rise Site U1356 and shelf Site U1360 (Fig. 3) confirmed that this surface represents major erosion related to the onset of glaciation at ~34 Ma (early Oligocene), with immedi-ately overlying deposits dated as 33.6 Ma (Fig. 7). Below unconformity WL-U3 at Site U1356, we recovered a record that is late early to early middle Eocene in age and that inclu-des peak greenhouse conditions and likely some of the early Eocene hyperthermals (Fig. 8). We infer subtropical shal-low-water depositional environments for this section based on dinocysts, pollen and spores, and the chemical index of alteration, among other indicators. A hiatus spanning ~2 m.y. separates the lower Eocene from the middle Eocene record at Site U1356 according to dinocyst and magnetostrati- graphic evidence. This hiatus may be related to tectonic
Figure 6. Conceptual illustration of tectonic, geological, sedimentological, and climatic evolution of the Wilkes Land margin since the middle early Eocene (~54 Ma). U3, U4, and U5 refer to seismic unconformities WL-U3, WL-U4, and WL-U5, respectively. Oi-1 = Oligocene isotope Event 1, CPDW = Circumpolar Deep Water, ACSC = Antarctic Circumpolar Surface Water, UCPDW = Upper Circumpolar Deep Water, LCPDW = Lower Circumpolar Deep Water, AABW = Antarctic Bottom Water. MTD = mass transport debris flows.
500 km
Antarctic Counter CurrentProto-Leeuwin Current
Wilkes Shelf53–48 Ma
0
200
400
Wilkes Shelf15–0 Ma
0
800
1600
Rifting ~50 MaX
0
250
400
Icebergs andseasonal sea ice
Sea levelSea levelWilkes Shelf
33 Ma(Oi-1)
onset of glaciation
Wilkes Shelf30–15 Ma
0
1
2
U3
U3
U4
U3
U4U5
U3
U3
U5
ACSC
X
X
X
X
CPDW
Sea level
Sea level
X
AABW
UCPDW
X
X
Current coming out of page
Current going into page
Wilkes Land
U3
Deepwater production
Wilkes
Contourites and turbidites
Contourites and turbidites
MTDs, contourites, and turbidites
Neritic/Upper slope deposits
Basement
Wilkes Land
Wilkes Land
Wilkes Land
LCPDW
ACSC
CPDW
Dep
th (m
)D
epth
(m)
Dep
th (m
)
Dep
th (k
m)
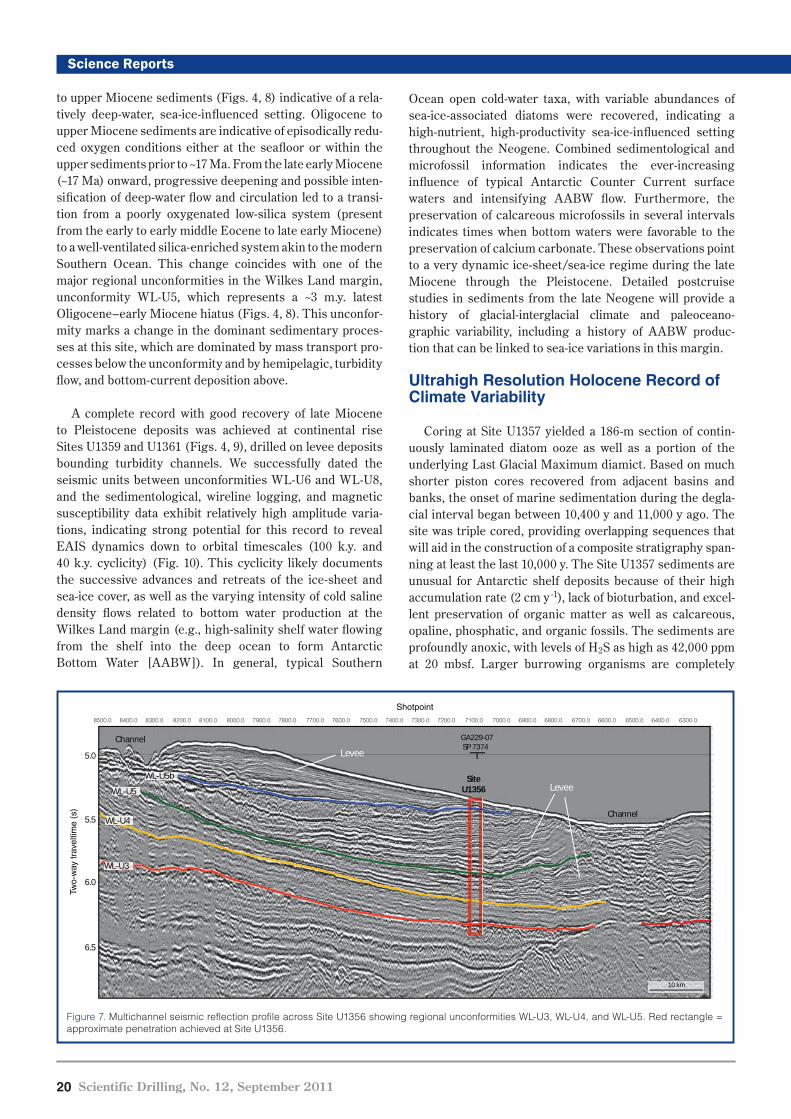
20 Scientific Drilling, No. 12, September 2011
Science Reports
Ocean open cold-water taxa, with variable abundances of sea-ice-associated diatoms were recovered, indicating a high-nutrient, high-productivity sea-ice-influenced setting throughout the Neogene. Combined sedimentological and microfossil information indicates the ever-increasing influence of typical Antarctic Counter Current surface waters and intensifying AABW flow. Furthermore, the preservation of calcareous microfossils in several intervals indicates times when bottom waters were favorable to the preservation of calcium carbonate. These observations point to a very dynamic ice-sheet/sea-ice regime during the late Miocene through the Pleistocene. Detailed postcruise studies in sediments from the late Neogene will provide a history of glacial-interglacial climate and paleoceano- graphic variability, including a history of AABW produc- tion that can be linked to sea-ice variations in this margin.
Ultrahigh Resolution Holocene Record of Climate Variability
Coring at Site U1357 yielded a 186-m section of contin-uously laminated diatom ooze as well as a portion of the underlying Last Glacial Maximum diamict. Based on much shorter piston cores recovered from adjacent basins and banks, the onset of marine sedimentation during the degla-cial interval began between 10,400 y and 11,000 y ago. The site was triple cored, providing overlapping sequences that will aid in the construction of a composite stratigraphy span-ning at least the last 10,000 y. The Site U1357 sediments are unusual for Antarctic shelf deposits because of their high accumulation rate (2 cm y -1), lack of bioturbation, and excel-lent preservation of organic matter as well as calcareous, opaline, phosphatic, and organic fossils. The sediments are profoundly anoxic, with levels of H2S as high as 42,000 ppm at 20 mbsf. Larger burrowing organisms are completely
to upper Miocene sediments (Figs. 4, 8) indicative of a rela-tively deep-water, sea-ice-influenced setting. Oligocene to upper Miocene sediments are indicative of episodically redu-ced oxygen conditions either at the seafloor or within the upper sediments prior to ~17 Ma. From the late early Miocene (~17 Ma) onward, progressive deepening and possible inten-sification of deep-water flow and circulation led to a transi-tion from a poorly oxygenated low-silica system (present from the early to early middle Eocene to late early Miocene) to a well-ventilated silica-enriched system akin to the modern Southern Ocean. This change coincides with one of the major regional unconformities in the Wilkes Land margin, unconformity WL-U5, which represents a ~3 m.y. latest Oligocene–early Miocene hiatus (Figs. 4, 8). This unconfor-mity marks a change in the dominant sedimentary proces-ses at this site, which are dominated by mass transport pro-cesses below the unconformity and by hemipelagic, turbidity flow, and bottom-current deposition above.
A complete record with good recovery of late Miocene to Pleistocene deposits was achieved at continental rise Sites U1359 and U1361 (Figs. 4, 9), drilled on levee deposits bounding turbidity channels. We successfully dated the seismic units between unconformities WL-U6 and WL-U8, and the sedimentological, wireline logging, and magnetic susceptibility data exhibit relatively high amplitude varia-tions, indicating strong potential for this record to reveal EAIS dynamics down to orbital timescales (100 k.y. and 40 k.y. cyclicity) (Fig. 10). This cyclicity likely documents the successive advances and retreats of the ice-sheet and sea-ice cover, as well as the varying intensity of cold saline density flows related to bottom water production at the Wilkes Land margin (e.g., high-salinity shelf water flowing from the shelf into the deep ocean to form Antarctic Bottom Water [AABW]). In general, typical Southern
Figure 7. Multichannel seismic reflection profile across Site U1356 showing regional unconformities WL-U3, WL-U4, and WL-U5. Red rectangle = approximate penetration achieved at Site U1356.
WL-U3
WL-U4
WL-U5
WL-U5b
5.0
5.5
6.0
6.5
SiteU1356
GA229-07 SP 7374
10 km
Levee
Levee
Channel
Channel
Two-
way
trav
eltim
e (s
)
Shotpoint8500.0 8400.0 8300.0 8200.0 8100.0 8000.0 7900.0 7800.0 7700.0 7600.0 7500.0 7400.0 7300.0 7200.0 7100.0 7000.0 6900.0 6800.0 6700.0 6600.0 6500.0 6400.0 6300.0
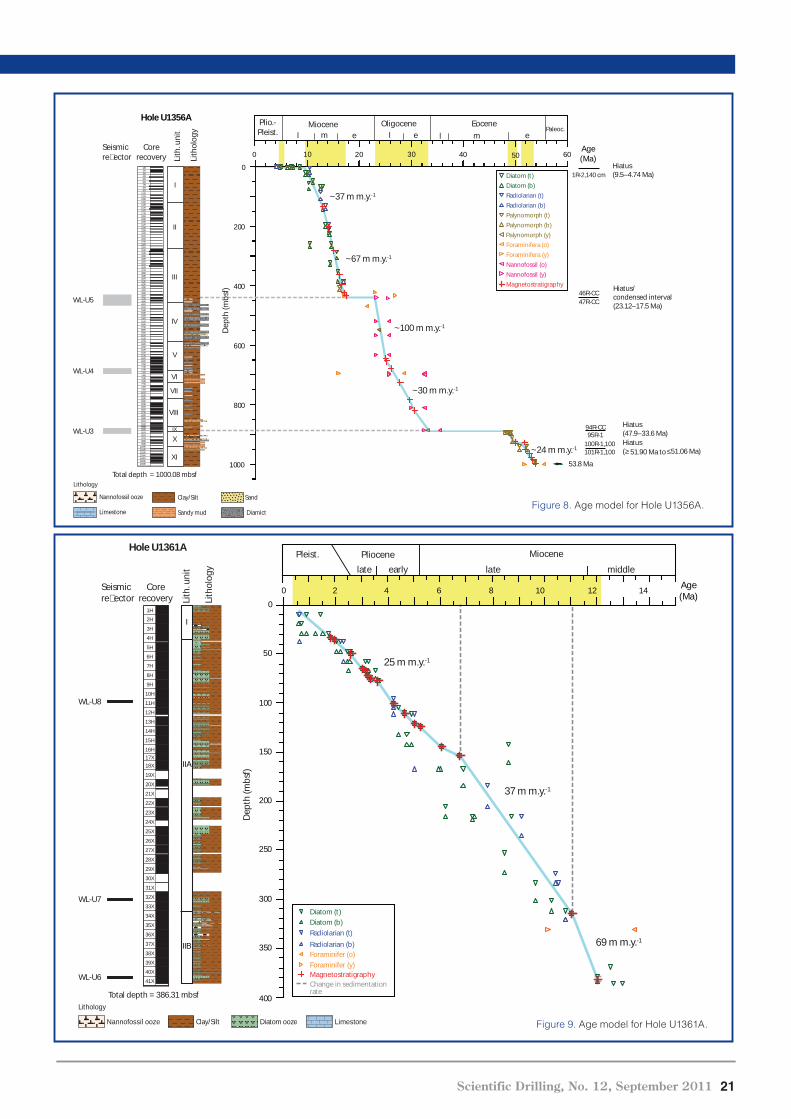
Scientific Drilling, No. 12, September 2011 21
Science Reports
MiocenePliocene
elddimetalearly
Pleist.
late
25 m m.y.-1
69 m m.y.-1
37 m m.y.-1
Age(Ma)Li
thol
ogy
Hole U1361A
Dep
th (m
bsf)
1H
2H
3H
4H
5H
6H
7H
8H
9H
10H
11H
12H
13H
14H
15H
16H17X18X
19X
20X
21X
22X
23X
24X
25X
26X
27X
28X
29X
30X
31X
32X
33X
34X
35X
36X
37X
38X
39X
40X
41X
0
50
100
150
200
250
300
350
400
0 2 4 6 8 10 12 14
Lith
. uni
t
I
IIA
IIB
Total depth = 386.31 mbsf
WL-U8
WL-U7
Seismicre�ector
WL-U6
Corerecovery
Diatom (t)Diatom (b)Radiolarian (t)
Radiolarian (b)
Magnetostratigraphy
Foraminifer (o)Foraminifer (y)
Clay/Silt enotsemiL ezoo lissofonnaN
Lithology
Diatom ooze
Change in sedimentationrate
Figure 9. Age model for Hole U1361A.
0
200
400
600
800
1000
020 30 40 60
Hiatus(9.5–4.74 Ma)
Hiatus/condensed interval(23.12–17.5 Ma)47R-CC
46R-CC
1R-2,140 cm
Hiatus(47.9–33.6 Ma)95R-1
94R-CC
Hiatus(≥51.90 Ma to ≤51.06 Ma)101R-1,100
100R-1,100
~37 m m.y.-1
~67 m m.y.-1
~30 m m.y.-1
~24 m m.y.-1
Miocene Oligocene Eocenel m e l m e
Plio.-Pleist. Paleoc.
l e
53.8 Ma
~100 m m.y.-1
Hole U1356A
Age(Ma)
Diatom (t)
Diatom (b)
Radiolarian (t)
Radiolarian (b)
Palynomorph (t)
Palynomorph (b)
Magnetostratigraphy
Foraminifera (o)
Foraminifera (y)
Nannofossil (o)
Nannofossil (y)
0301
Palynomorph (y)
50
Dep
th (m
bsf)
Corerecovery
1R2R3R4R5R6R7R8R9R
10R11R12R13R14R15R16R17R18R19R20R21R22R23R24R25R26R27R28R29R30R31R32R33R34R35R36R37R38R39R40R41R42R43R44R45R46R47R48R49R50R51R52R53R54R55R56R57R58R59R60R61R62R63R64R65R66R67R68R69R70R71R72R73R74R75R76R77R78R79R80R81R82R83R84R85R86R87R88R89R90R91R92R93R94R95R96R97R98R99R
100R101R102R103R104R105R106R
Total depth = 1000.08 mbsf
I
VI
V
IV
III
II
VII
VIII
IX
X
WL-U5
WL-U4
WL-U3
Lith
. uni
t
Seismicre�ector
XI
Lith
olog
y
Clay/Silt SandNannofossil ooze
Sandy mud DiamictLimestone
Lithology
Figure 8. Age model for Hole U1356A.
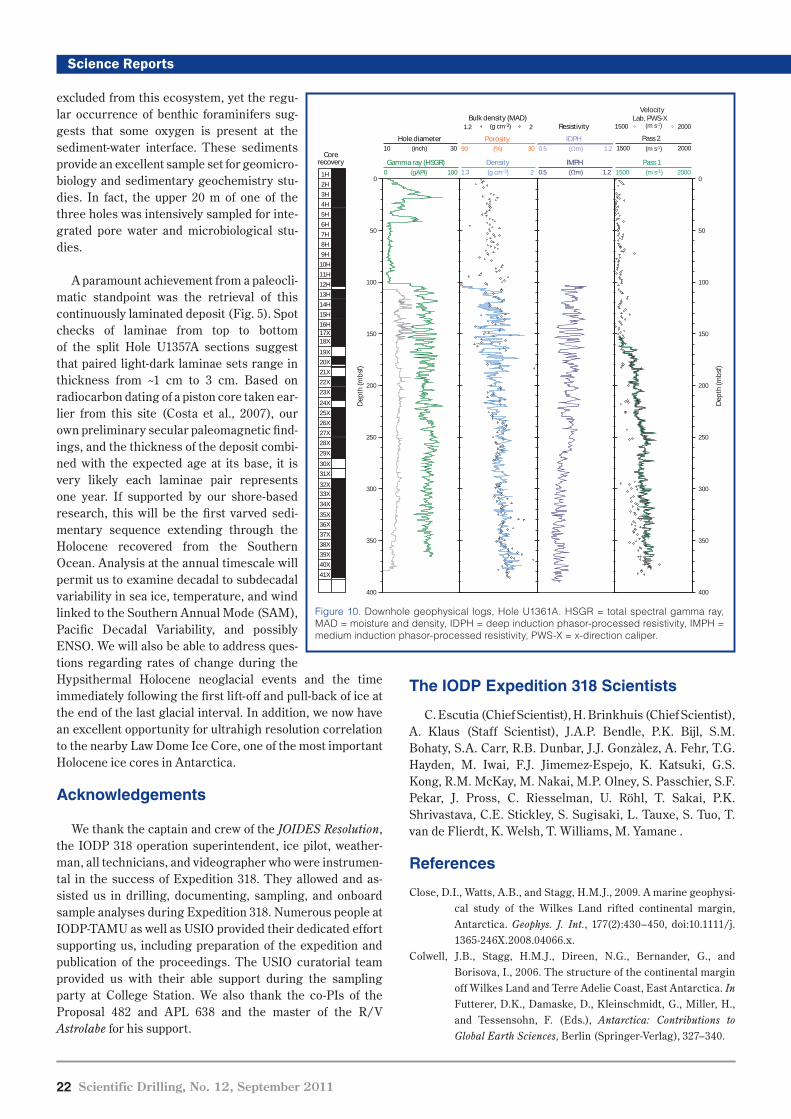
22 Scientific Drilling, No. 12, September 2011
Science Reports
The IODP Expedition 318 Scientists
C. Escutia (Chief Scientist), H. Brinkhuis (Chief Scientist), A. Klaus (Staff Scientist), J.A.P. Bendle, P.K. Bijl, S.M. Bohaty, S.A. Carr, R.B. Dunbar, J.J. Gonzàlez, A. Fehr, T.G. Hayden, M. Iwai, F.J. Jimemez-Espejo, K. Katsuki, G.S. Kong, R.M. McKay, M. Nakai, M.P. Olney, S. Passchier, S.F. Pekar, J. Pross, C. Riesselman, U. Röhl, T. Sakai, P.K. Shrivastava, C.E. Stickley, S. Sugisaki, L. Tauxe, S. Tuo, T. van de Flierdt, K. Welsh, T. Williams, M. Yamane .
References
Close, D.I., Watts, A.B., and Stagg, H.M.J., 2009. A marine geophysi-cal study of the Wilkes Land rifted continental margin, Antarctica. Geophys. J. Int., 177(2):430–450, doi:10.1111/j. 1365-246X.2008.04066.x.
Colwell, J.B., Stagg, H.M.J., Direen, N.G., Bernander, G., and Borisova, I., 2006. The structure of the continental margin off Wilkes Land and Terre Adelie Coast, East Antarctica. In Futterer, D.K., Damaske, D., Kleinschmidt, G., Miller, H., and Tessensohn, F. (Eds.), Antarctica: Contributions to Global Earth Sciences, Berlin (Springer-Verlag), 327–340.
excluded from this ecosystem, yet the regu-lar occurrence of benthic foraminifers sug-gests that some oxygen is present at the sediment-water interface. These sediments provide an excellent sample set for geomicro-biology and sedimentary geochemistry stu-dies. In fact, the upper 20 m of one of the three holes was intensively sampled for inte-grated pore water and microbiological stu-dies.
A paramount achievement from a paleocli-matic standpoint was the retrieval of this continuously laminated deposit (Fig. 5). Spot checks of laminae from top to bottom of the split Hole U1357A sections suggest that paired light-dark laminae sets range in thickness from ~1 cm to 3 cm. Based on radiocarbon dating of a piston core taken ear-lier from this site (Costa et al., 2007), our own preliminary secular paleomagnetic find- ings, and the thickness of the deposit combi-ned with the expected age at its base, it is very likely each laminae pair represents one year. If supported by our shore-based research, this will be the first varved sedi-mentary sequence extending through the Holocene recovered from the Southern Ocean. Analysis at the annual timescale will permit us to examine decadal to subdecadal variability in sea ice, temperature, and wind linked to the Southern Annual Mode (SAM), Pacific Decadal Variability, and possibly ENSO. We will also be able to address ques-tions regarding rates of change during the Hypsithermal Holocene neoglacial events and the time immediately following the first lift-off and pull-back of ice at the end of the last glacial interval. In addition, we now have an excellent opportunity for ultrahigh resolution correlation to the nearby Law Dome Ice Core, one of the most important Holocene ice cores in Antarctica.
Acknowledgements
We thank the captain and crew of the JOIDES Resolution, the IODP 318 operation superintendent, ice pilot, weather-man, all technicians, and videographer who were instrumen-tal in the success of Expedition 318. They allowed and as-sisted us in drilling, documenting, sampling, and onboard sample analyses during Expedition 318. Numerous people at IODP-TAMU as well as USIO provided their dedicated effort supporting us, including preparation of the expedition and publication of the proceedings. The USIO curatorial team provided us with their able support during the sampling party at College Station. We also thank the co-PIs of the Proposal 482 and APL 638 and the master of the R/V Astrolabe for his support.
Figure 10. Downhole geophysical logs, Hole U1361A. HSGR = total spectral gamma ray, MAD = moisture and density, IDPH = deep induction phasor-processed resistivity, IMPH = medium induction phasor-processed resistivity, PWS-X = x-direction caliper.
Dep
th (m
bsf)
Dep
th (m
bsf)
0
50
100
150
200
250
300
350
400
0
50
100
150
200
250
300
350
400
0.5 1.2(Ωm)IMPH
0.5 1.2(Ωm)IDPH
(m s-1)Pass 1
(m s-1)Lab, PWS-X
1500 2000
1500 2000Gamma ray (HSGR)
0 100(gAPI)
Hole diameter10 30(inch)
Bulk density (MAD)(g cm-3) 1.2 2
Density1.3 2(g cm-3)
Porosity90 30(%) (m s-1)
Pass 21500 2000
Corerecovery
1H
2H
3H
4H
5H
6H
7H
8H
9H
10H
11H
12H
13H
14H
15H
16H17X18X
19X
20X
21X
22X
23X
24X
25X
26X
27X
28X
29X
30X
31X
32X33X
34X
35X
36X
37X
38X
39X
40X
41X
Resistivity
Velocity
Scientific Drilling, No. 12, September 2011 23
Science Reports
Costa, E., Dunbar, R.B., Kryc, K.A., Mucciarone, D.A., Brachfeld, S., Roark, E.B., Manley, P.L., Murray, R.W., and Leventer, A., 2007. Solar forcing and El Niño-Southern Oscillation (ENSO) influences on productivity cycles interpreted from a late Holocene high-resolution marine sediment record, Adélie Drift, East Antarctic margin. In Cooper, A.K., and Raymond, C.R., and the ISAES Editorial Team. (Eds.), Antarctica: A Keystone in a Changing World - Proceedings for the Tenth International Symposium on Antarctic Earth Sciences. USGS Open File Rep., 2007–1047. Washington, DC (The National Academies Press), 1–6, doi:10.3133/of2007-1047.srp036.
Coxall, H.K., Wilson, P.A., Pälike, H., Lear, C.H., and Backman, J., 2005. Rapid stepwise onset of Antarctic glaciation and deeper calcite compensation in the Pacific Ocean. Nature, 433(7021):53–57, doi:10.1038/nature03135.
DeConto, R.M., and Pollard, D., 2003a. A coupled climate–ice sheet modeling approach to the early Cenozoic history of the Antarctic ice sheet. Palaeogeogr., Palaeoclimatol., Palaeoecol., 198(1–2):39–52, doi:10.1016/S0031-0182(03) 00393-6.
DeConto, R.M., and Pollard, D., 2003b. Rapid Cenozoic glaciation of Antarctica induced by declining atmospheric CO2. Nature, 421(6920):245–249, doi:10.1038/nature01290.
DeConto, R., Pollard, D., and Harwood, D., 2007. Sea ice feedback and Cenozoic evolution of Antarctic climate and ice sheets. Palaeoceanography, 22(3):PA3214, doi:10.1029/2006PA 001350.
De Santis, L., Brancolini, G., and Donda, F., 2003. Seismo-stratigraphic analysis of the Wilkes Land Continental Margin (East Antarctica): influence of glacially driven proc-esses on the Cenozoic deposition. Deep Sea Res. Part II, 50(8–9):1563–1594, doi:10.1016/S0967-0645(03)00079-1.
Eittreim, S.L., Cooper, A.K., and Wannesson, J., 1995. Seismic strati-graphic evidence of ice-sheet advances on the Wilkes Land margin of Antarctica. Sediment. Geol., 96(1–2):131–156, doi:10.1016/0037-0738(94)00130-M.
Escutia, C., De Santis, L., Donda, F., Dunbar, R.B., Cooper, A.K., Brancolini, G., and Eittreim, S.L., 2005. Cenozoic ice sheet history from East Antarctic Wilkes Land continental mar-gin sediments. Global Planet. Change, 45(1–3):51–81, doi:10.1016/j.gloplacha.2004.09.010.
Escutia, C., Eittreim, S.L., and Cooper, A.K., 1997. Cenozoic sedimen-tation on the Wilkes Land continental rise, Antarctica. In Ricci, C.A. (Ed.), The Antarctic Region: Geological Evolution and Processes. Proc. Int. Symp. Antarct. Earth Sci., 7:791–795.
Florindo, F., and Siegert, M., 2009. Antarctic Climate Evolution. Developments in Earth and Environmental Sciences, Vol. 8: Amsterdam, The Netherlands (Elsevier).
Gradstein, F.M., Ogg, J.G., and Smith, A., 2004. A Geologic Time Scale 2004: Cambridge (Cambridge University Press).
Hearty, P.J., Kindler, P., Cheng, H., and Edwards, R.L., 1999. A +20 m middle Pleistocene sea-level highstand (Bermuda and the Bahamas) due to partial collapse of Antarctic ice. Geology, 27(4):375–378, doi:10.1130/0091-7613(1999)027 <0375:MMPSL>2.3.CO;2.
Huber, M., Brinkhuis, H., Stickley, C.E., Döös, K., Sluijs, A., Warnaar, J., Schellenberg, S.A., and Williams, G.L., 2004. Eocene cir-culation of the Southern Ocean: was Antarctica kept warm
by subtropical waters? Paleoceanography, 19(4):PA4026, doi:10.1029/2004PA001014.
Huybrechts, P., 1993. Glaciological modelling of the Late Cenozoic East Antarctic Ice Sheet: stability or dynamism? Geograf. Ann., 75(4):221–238m, doi:10.2307/521202.
Intergovernmental Panel on Climate Change (IPCC), The AR4 Synthesis Report 2007: http://www.ipcc.ch/
Kennett, J.P., 1977. Cenozoic evolution of Antarctic glaciation, the circum-Antarctic Ocean, and their impact on global pale-oceanography. J. Geophys. Res., 82(27):3843–3860, doi:10.1029/JC082i027p03843.
Miller, K.G., Aubry, M.-P., Kahn, M.J., Melillo, A.J., Kent, D.V., and Berggren, W.A., 1985. Oligocene–Miocene biostratigraphy, magnetostratigraphy, and isotopic stratigraphy of the west-ern North Atlantic. Geology, 13(4):257–261, doi:10.1130/00917613(1985)13<257:OBMAIS>2.0.CO;2.
Pagani, M., Zachos, J.C., Freeman, K.H., Tipple, B., and Bohaty, S., 2005. Marked decline in atmospheric carbon dioxide con-centrations during the Paleogene. Science, 309(5734):600–603, doi:10.1126/science.1110063.
Pollard, D., and DeConto, R.M., 2009. Modelling West Antarctic ice sheet growth and collapse through the past five million years. Nature, 458(7236):329–332, doi:10.1038/nature07809.
Wise, S.W., Jr., Breza, J.R., Harwood, D.M., and Wei, W., 1991. Paleogene glacial history of Antarctica. In Müller, D.W., McKenzie, J.A., and Weissert, H. (Eds.), Controversies in Modern Geology: Evolution of Geological Theories in Sedimentology, Earth History and Tectonics: Cambridge (Cambridge University Press), 133–171.
Zachos, J.C., Dickens, G.R., and Zeebe, R.E., 2008. An early Cenozoic perspective on greenhouse warming and carbon-cycle dynamics. Nature, 451(7176):279–283, doi:10.1038/nature06588.
Zachos, J.C., Flower, B.P., and Paul, H., 1997. Orbitally paced climate oscillations across the Oligocene/Miocene boundary. Nature, 388(6642):567–570, doi:10.1038/41528.
Authors
Carlota Escutia, Instituto Andaluz de Ciencias de la Tierra, CSIC-Universidad de Granada, Campus de Fuentenueva s/n, 18002 Granada, Spain, e-mail: [email protected] Brinkhuis, Biomarine Sciences, Institute of Environmental Biology, Laboratory of Palaeobotany and Palynology, Utrecht University, Budapestlaan 4, 3584 CD Utrecht, The Netherlands, e-mail: [email protected] Klaus, Staff Scientist/Expedition Project Manager, United States Implementing Organization, Integrated Ocean Drilling Program, Texas A&M University, 1000 Discovery Drive, College Station, TX 77845-9547, U.S.A., e-mail: [email protected]. and the IODP Expedition 318 Scientists
Related Web Link
http://publications.iodp.org/preliminary_report/318/http://www.stratigraphy.org/
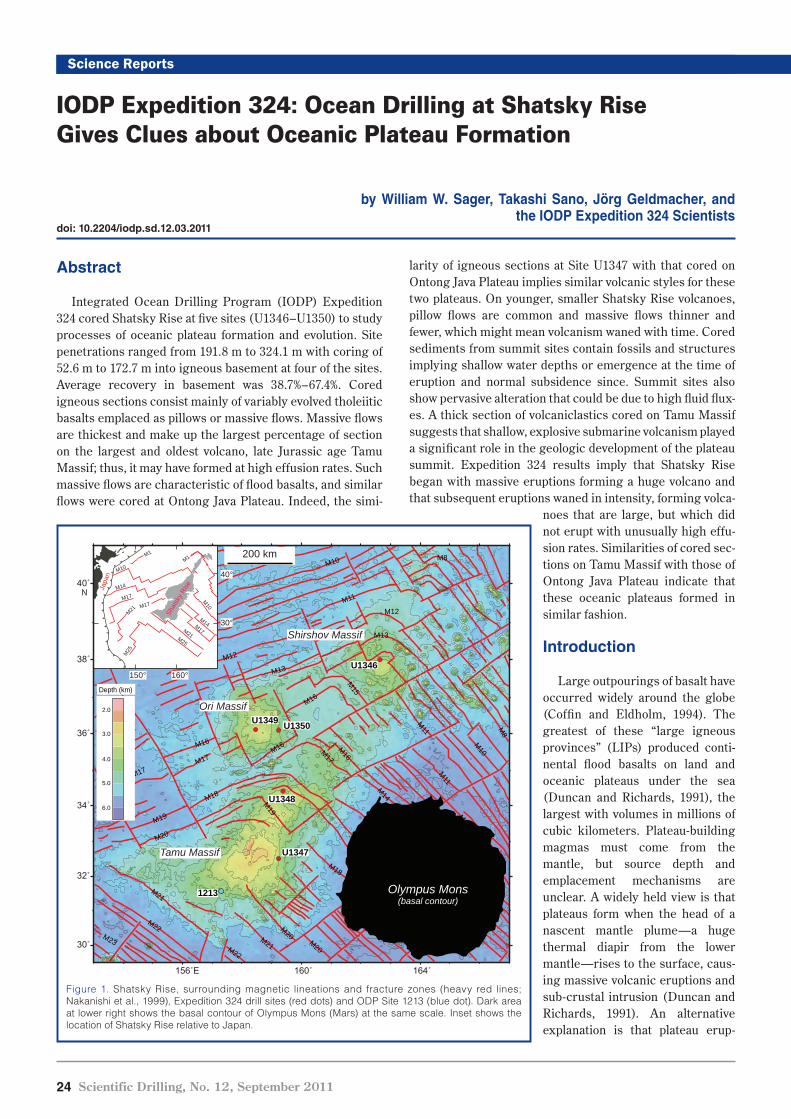
Science Reports
IODP Expedition 324: Ocean Drilling at Shatsky Rise Gives Clues about Oceanic Plateau Formation
by William W. Sager, Takashi Sano, Jörg Geldmacher, and the IODP Expedition 324 Scientists
doi: 10.2204/iodp.sd.12.03.2011
24 Scientific Drilling, No. 12, September 2011
Science Reports
Abstract
Integrated Ocean Drilling Program (IODP) Expedition 324 cored Shatsky Rise at five sites (U1346–U1350) to study processes of oceanic plateau formation and evolution. Site penetrations ranged from 191.8 m to 324.1 m with coring of 52.6 m to 172.7 m into igneous basement at four of the sites. Average recovery in basement was 38.7%–67.4%. Cored igneous sections consist mainly of variably evolved tholeiitic basalts emplaced as pillows or massive flows. Massive flows are thickest and make up the largest percentage of section on the largest and oldest volcano, late Jurassic age Tamu Massif; thus, it may have formed at high effusion rates. Such massive flows are characteristic of flood basalts, and similar flows were cored at Ontong Java Plateau. Indeed, the simi-
larity of igneous sections at Site U1347 with that cored on Ontong Java Plateau implies similar volcanic styles for these two plateaus. On younger, smaller Shatsky Rise volcanoes, pillow flows are common and massive flows thinner and fewer, which might mean volcanism waned with time. Cored sediments from summit sites contain fossils and structures implying shallow water depths or emergence at the time of eruption and normal subsidence since. Summit sites also show pervasive alteration that could be due to high fluid flux-es. A thick section of volcaniclastics cored on Tamu Massif suggests that shallow, explosive submarine volcanism played a significant role in the geologic development of the plateau summit. Expedition 324 results imply that Shatsky Rise began with massive eruptions forming a huge volcano and that subsequent eruptions waned in intensity, forming volca-
noes that are large, but which did not erupt with unusually high effu-sion rates. Similarities of cored sec-tions on Tamu Massif with those of Ontong Java Plateau indicate that these oceanic plateaus formed in similar fashion.
Introduction
Large outpourings of basalt have occurred widely around the globe (Coffin and Eldholm, 1994). The greatest of these “large igneous provinces” (LIPs) produced conti-nental flood basalts on land and oceanic plateaus under the sea (Duncan and Richards, 1991), the largest with volumes in millions of cubic kilometers. Plateau-building magmas must come from the mantle, but source depth and emplacement mechanisms are unclear. A widely held view is that plateaus form when the head of a nascent mantle plume—a huge thermal diapir from the lower mantle—rises to the surface, caus-ing massive volcanic eruptions and sub-crustal intrusion (Duncan and Richards, 1991). An alternative explanation is that plateau erup-
Science Reports
Figure 1. Shatsky Rise, surrounding magnetic lineations and fracture zones (heavy red lines; Nakanishi et al., 1999), Expedition 324 drill sites (red dots) and ODP Site 1213 (blue dot). Dark area at lower right shows the basal contour of Olympus Mons (Mars) at the same scale. Inset shows the location of Shatsky Rise relative to Japan.
M7M8
M10
M9 M10
M11
M12
M8
M11
M12
M13
M13
M16
M17
M17M17
M19
M20
M18
M19
M16M17
M16
M16
M15
M11
M10
M8
M11
M21
M22M23
M22
M21
M20M20
M18
M18
M17 M15
M15
M14
M12
M14
M15M16
156˚E 160˚ 164˚
30˚
32˚
34˚
36˚
38˚
40˚
Tamu Massif
Ori Massif
Shirshov Massif
U1350
U1346
U1349
U1348
U1347
1213 Olympus Mons(basal contour)
Shat
sky R
ise
40°
30°
150° 160°
Japa
n
M25
M21
M17
M10
M1
M25
M21 M17
M17
M14
M14M10
M1
2.0
3.0
4.0
5.0
6.0
Depth (km)
200 km
N
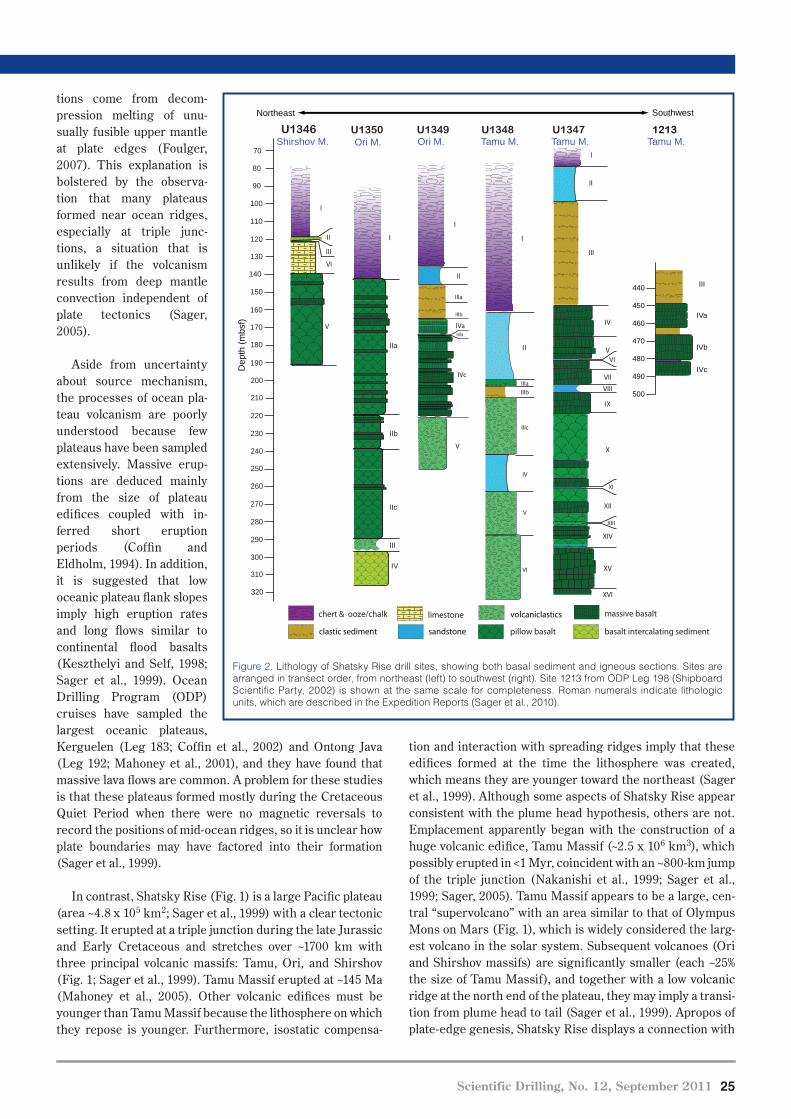
Scientific Drilling, No. 12, September 2011 25
Science ReportsScience Reports
tion and interaction with spreading ridges imply that these edifices formed at the time the lithosphere was created, which means they are younger toward the northeast (Sager et al., 1999). Although some aspects of Shatsky Rise appear consistent with the plume head hypothesis, others are not. Emplacement apparently began with the construction of a huge volcanic edifice, Tamu Massif (~2.5 x 10⁶ km3), which possibly erupted in <1 Myr, coincident with an ~800-km jump of the triple junction (Nakanishi et al., 1999; Sager et al., 1999; Sager, 2005). Tamu Massif appears to be a large, cen-tral “supervolcano” with an area similar to that of Olympus Mons on Mars (Fig. 1), which is widely considered the larg-est volcano in the solar system. Subsequent volcanoes (Ori and Shirshov massifs) are significantly smaller (each ~25% the size of Tamu Massif), and together with a low volcanic ridge at the north end of the plateau, they may imply a transi-tion from plume head to tail (Sager et al., 1999). Apropos of plate-edge genesis, Shatsky Rise displays a connection with
tions come from decom-pression melting of unu-sually fusible upper mantle at plate edges (Foulger, 2007). This explanation is bolstered by the observa-tion that many plateaus formed near ocean ridges, especially at triple junc-tions, a situation that is unlikely if the volcanism results from deep mantle convection independent of plate tectonics (Sager, 2005).
Aside from uncertainty about source mechanism, the processes of ocean pla-teau volcanism are poorly understood because few plateaus have been sampled extensively. Massive erup-tions are deduced mainly from the size of plateau edifices coupled with in- ferred short eruption periods (Coffin and Eldholm, 1994). In addition, it is suggested that low oceanic plateau flank slopes imply high eruption rates and long flows similar to continental flood basalts (Keszthelyi and Self, 1998; Sager et al., 1999). Ocean Drilling Program (ODP) cruises have sampled the largest oceanic plateaus, Kerguelen (Leg 183; Coffin et al., 2002) and Ontong Java (Leg 192; Mahoney et al., 2001), and they have found that massive lava flows are common. A problem for these studies is that these plateaus formed mostly during the Cretaceous Quiet Period when there were no magnetic reversals to record the positions of mid-ocean ridges, so it is unclear how plate boundaries may have factored into their formation (Sager et al., 1999).
In contrast, Shatsky Rise (Fig. 1) is a large Pacific plateau (area ~4.8 x 10⁵ km2; Sager et al., 1999) with a clear tectonic setting. It erupted at a triple junction during the late Jurassic and Early Cretaceous and stretches over ~1700 km with three principal volcanic massifs: Tamu, Ori, and Shirshov (Fig. 1; Sager et al., 1999). Tamu Massif erupted at ~145 Ma (Mahoney et al., 2005). Other volcanic edifices must be younger than Tamu Massif because the lithosphere on which they repose is younger. Furthermore, isostatic compensa-
Figure 2. Lithology of Shatsky Rise drill sites, showing both basal sediment and igneous sections. Sites are arranged in transect order, from northeast (left) to southwest (right). Site 1213 from ODP Leg 198 (Shipboard Scientific Party, 2002) is shown at the same scale for completeness. Roman numerals indicate lithologic units, which are described in the Expedition Reports (Sager et al., 2010).
IVaIVb
IVc
V
IIIa
IIIb
I
II
I
IIa
IIb
IIc
III
IV
70
80
90
100
110
120
130
140
150
160
II
I
I
170
180
190
200
210
220
230
240
250
260
270
280
290
300
310
320
III
II
sandstone
massive basalt
Northeast
IV
VIV
IX
X
XI
XII
VII
VIII
I
VI
V
II
III
XIII
XIV
XV
XVI
b
IV
VI
V
IIIa
IIIc
IIIb 500
490
480
470
460
450
440
IVa
IVb
IVc
III
Southwest
1213U1349 U1347U1348U1350U1346Shirshov M. Ori M. Ori M. Tamu M. Tamu M.Tamu M.
Dep
th (m
bsf)
chert & ooze/chalk
clastic sediment
volcaniclasticslimestone
pillow basalt basalt intercalating sediment
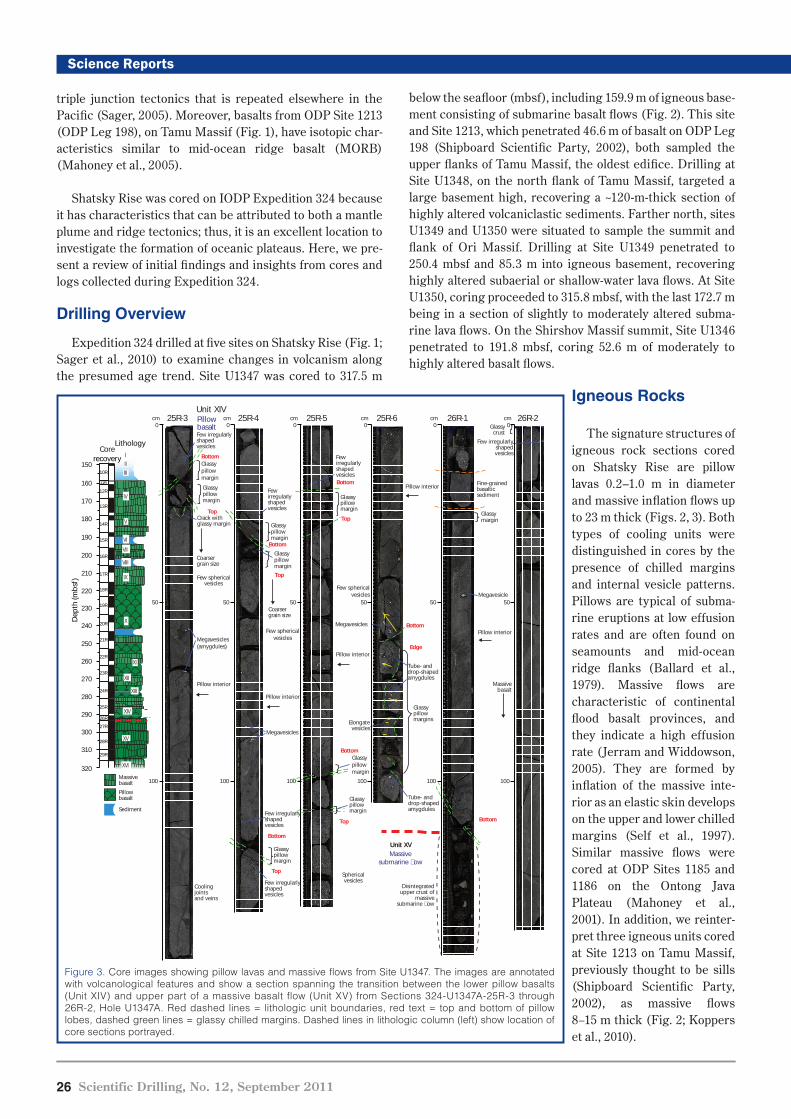
26 Scientific Drilling, No. 12, September 2011
Science Reports
below the seafloor (mbsf), including 159.9 m of igneous base-ment consisting of submarine basalt flows (Fig. 2). This site and Site 1213, which penetrated 46.6 m of basalt on ODP Leg 198 (Shipboard Scientific Party, 2002), both sampled the upper flanks of Tamu Massif, the oldest edifice. Drilling at Site U1348, on the north flank of Tamu Massif, targeted a large basement high, recovering a ~120-m-thick section of highly altered volcaniclastic sediments. Farther north, sites U1349 and U1350 were situated to sample the summit and flank of Ori Massif. Drilling at Site U1349 penetrated to 250.4 mbsf and 85.3 m into igneous basement, recovering highly altered subaerial or shallow-water lava flows. At Site U1350, coring proceeded to 315.8 mbsf, with the last 172.7 m being in a section of slightly to moderately altered subma-rine lava flows. On the Shirshov Massif summit, Site U1346 penetrated to 191.8 mbsf, coring 52.6 m of moderately to highly altered basalt flows.
Igneous Rocks
The signature structures of igneous rock sections cored on Shatsky Rise are pillow lavas 0.2–1.0 m in diameter and massive inflation flows up to 23 m thick (Figs. 2, 3). Both types of cooling units were distinguished in cores by the presence of chilled margins and internal vesicle patterns. Pillows are typical of subma-rine eruptions at low effusion rates and are often found on seamounts and mid-ocean ridge flanks (Ballard et al., 1979). Massive flows are characteristic of continental flood basalt provinces, and they indicate a high effusion rate (Jerram and Widdowson, 2005). They are formed by inflation of the massive inte-rior as an elastic skin develops on the upper and lower chilled margins (Self et al., 1997). Similar massive flows were cored at ODP Sites 1185 and 1186 on the Ontong Java Plateau (Mahoney et al., 2001). In addition, we reinter-pret three igneous units cored at Site 1213 on Tamu Massif, previously thought to be sills (Shipboard Scientific Party, 2002), as massive flows 8–15 m thick (Fig. 2; Koppers et al., 2010).
triple junction tectonics that is repeated elsewhere in the Pacific (Sager, 2005). Moreover, basalts from ODP Site 1213 (ODP Leg 198), on Tamu Massif (Fig. 1), have isotopic char-acteristics similar to mid-ocean ridge basalt (MORB) (Mahoney et al., 2005).
Shatsky Rise was cored on IODP Expedition 324 because it has characteristics that can be attributed to both a mantle plume and ridge tectonics; thus, it is an excellent location to investigate the formation of oceanic plateaus. Here, we pre-sent a review of initial findings and insights from cores and logs collected during Expedition 324.
Drilling Overview
Expedition 324 drilled at five sites on Shatsky Rise (Fig. 1; Sager et al., 2010) to examine changes in volcanism along the presumed age trend. Site U1347 was cored to 317.5 m
Figure 3. Core images showing pillow lavas and massive flows from Site U1347. The images are annotated with volcanological features and show a section spanning the transition between the lower pillow basalts (Unit XIV) and upper part of a massive basalt flow (Unit XV) from Sections 324-U1347A-25R-3 through 26R-2, Hole U1347A. Red dashed lines = lithologic unit boundaries, red text = top and bottom of pillow lobes, dashed green lines = glassy chilled margins. Dashed lines in lithologic column (left) show location of core sections portrayed.
Corerecovery
VI
IX
X
XI
XII
VII
VIII
IIIIII
XIII
XIV
IV
25R-3 25R-4 25R-5 25R-6 26R-1 26R-2
Glassypillowmargin
Glassypillowmargin
Coarsergrain size
Pillow interior
Megavesicles(amygdules)
Coolingjointsand veins
Glassypillowmargin
Glassypillowmargin
Coarsergrain size
Fewirregularlyshapedvesicles
Few sphericalvesicles
Few sphericalvesicles
Megavesicles
Few irregularlyshapedvesicles
Glassypillowmargin
Few irregularlyshapedvesicles
GlassypillowmarginTop
Bottom
Top
Bottom
Top
Bottom
Top
Bottom
Edge
Bottom
Fine-grainedbasalticsediment
Bottom
Disintegratedupper crust of
massivesubmarine �ow
Massivesubmarine �ow
Unit XV
Megavesicle
Megavesicles
Glassycrust
Fewirregularlyshapedvesicles
Glassymargin
Pillow interior
Pillow interior
Pillow interior
Massivebasalt
Sphericalvesicles
Pillowbasalt
Unit XIV
Glassypillowmargin
Glassypillowmargin
Tube- anddrop-shapedamygdules
Tube- anddrop-shapedamygdules
Glassypillowmargins
Top
Bottom
Few sphericalvesicles
Elongatevesicles
Massivebasalt
Pillowbasalt
Sediment
0
Lithology
Dep
th (m
bsf)
10R
11R
12R
13R
14R
15R
16R
17R
18R
19R
20R
21R
22R
23R
24R
25R
26R
27R
28R
29R
150
160
170
180
190
200
210
220
230
240
250
260
270
280
290
300
310
320
50
100
Pillow interior
Few irregularlyshapedvesicles
Crack withglassy margin
Few irregularlyshapedvesicles
XV
XVI
V
cm0
50
100
cm0
50
100
cm0
50
100
cm0
50
100
cm0
50
100
cm
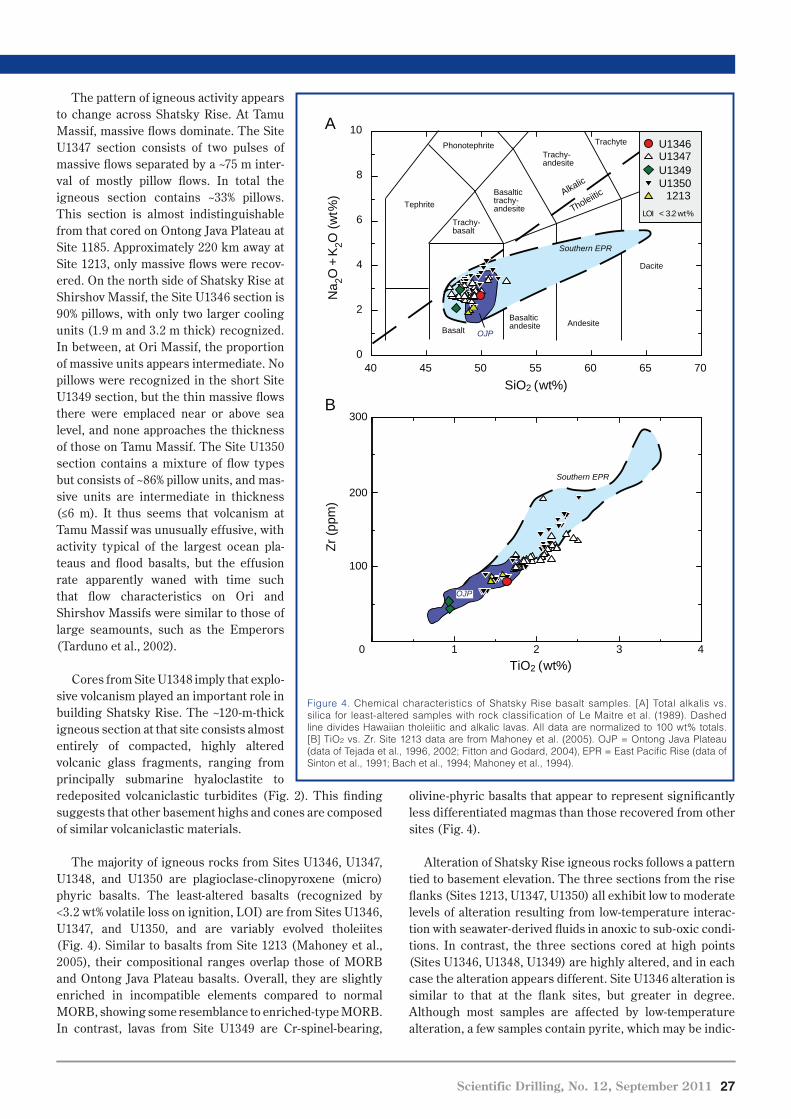
Scientific Drilling, No. 12, September 2011 27
Science Reports
olivine-phyric basalts that appear to represent significantly less differentiated magmas than those recovered from other sites (Fig. 4).
Alteration of Shatsky Rise igneous rocks follows a pattern tied to basement elevation. The three sections from the rise flanks (Sites 1213, U1347, U1350) all exhibit low to moderate levels of alteration resulting from low-temperature interac-tion with seawater-derived fluids in anoxic to sub-oxic condi-tions. In contrast, the three sections cored at high points (Sites U1346, U1348, U1349) are highly altered, and in each case the alteration appears different. Site U1346 alteration is similar to that at the flank sites, but greater in degree. Although most samples are affected by low-temperature alteration, a few samples contain pyrite, which may be indic-
The pattern of igneous activity appears to change across Shatsky Rise. At Tamu Massif, massive flows dominate. The Site U1347 section consists of two pulses of massive flows separated by a ~75 m inter-val of mostly pillow flows. In total the igneous section contains ~33% pillows. This section is almost indistinguishable from that cored on Ontong Java Plateau at Site 1185. Approximately 220 km away at Site 1213, only massive flows were recov-ered. On the north side of Shatsky Rise at Shirshov Massif, the Site U1346 section is 90% pillows, with only two larger cooling units (1.9 m and 3.2 m thick) recognized. In between, at Ori Massif, the proportion of massive units appears intermediate. No pillows were recognized in the short Site U1349 section, but the thin massive flows there were emplaced near or above sea level, and none approaches the thickness of those on Tamu Massif. The Site U1350 section contains a mixture of flow types but consists of ~86% pillow units, and mas-sive units are intermediate in thickness (≤6 m). It thus seems that volcanism at Tamu Massif was unusually effusive, with activity typical of the largest ocean pla-teaus and flood basalts, but the effusion rate apparently waned with time such that flow characteristics on Ori and Shirshov Massifs were similar to those of large seamounts, such as the Emperors (Tarduno et al., 2002).
Cores from Site U1348 imply that explo-sive volcanism played an important role in building Shatsky Rise. The ~120-m-thick igneous section at that site consists almost entirely of compacted, highly altered volcanic glass fragments, ranging from principally submarine hyaloclastite to redeposited volcaniclastic turbidites (Fig. 2). This finding suggests that other basement highs and cones are composed of similar volcaniclastic materials.
The majority of igneous rocks from Sites U1346, U1347, U1348, and U1350 are plagioclase-clinopyroxene (micro)phyric basalts. The least-altered basalts (recognized by <3.2 wt% volatile loss on ignition, LOI) are from Sites U1346, U1347, and U1350, and are variably evolved tholeiites (Fig. 4). Similar to basalts from Site 1213 (Mahoney et al., 2005), their compositional ranges overlap those of MORB and Ontong Java Plateau basalts. Overall, they are slightly enriched in incompatible elements compared to normal MORB, showing some resemblance to enriched-type MORB. In contrast, lavas from Site U1349 are Cr-spinel-bearing,
Figure 4. Chemical characteristics of Shatsky Rise basalt samples. [A] Total alkalis vs. silica for least-altered samples with rock classification of Le Maitre et al. (1989). Dashed line divides Hawaiian tholeiitic and alkalic lavas. All data are normalized to 100 wt% totals. [B] TiO2 vs. Zr. Site 1213 data are from Mahoney et al. (2005). OJP = Ontong Java Plateau (data of Tejada et al., 1996, 2002; Fitton and Godard, 2004), EPR = East Pacific Rise (data of Sinton et al., 1991; Bach et al., 1994; Mahoney et al., 1994).
TiO2 (wt %)
Zr (p
pm)
300
200
100
0 1 2 3 4
0
2
4
6
8
10
40 45 50 55 60 65 70
Alkalic
Tholeiitic
Dacite
AndesiteBasalticandesiteBasalt
Trachy-basalt
Basaltictrachy-andesite
Trachy-andesite
Trachyte
Tephrite
Phonotephrite
SiO2 (wt %)
Na 2O
+K
2O (w
t %)
OJP
Southern EPR
1213U1350U1349U1347U1346
LOI < 3.2 wt%
A
B
Southern EPR
OJP
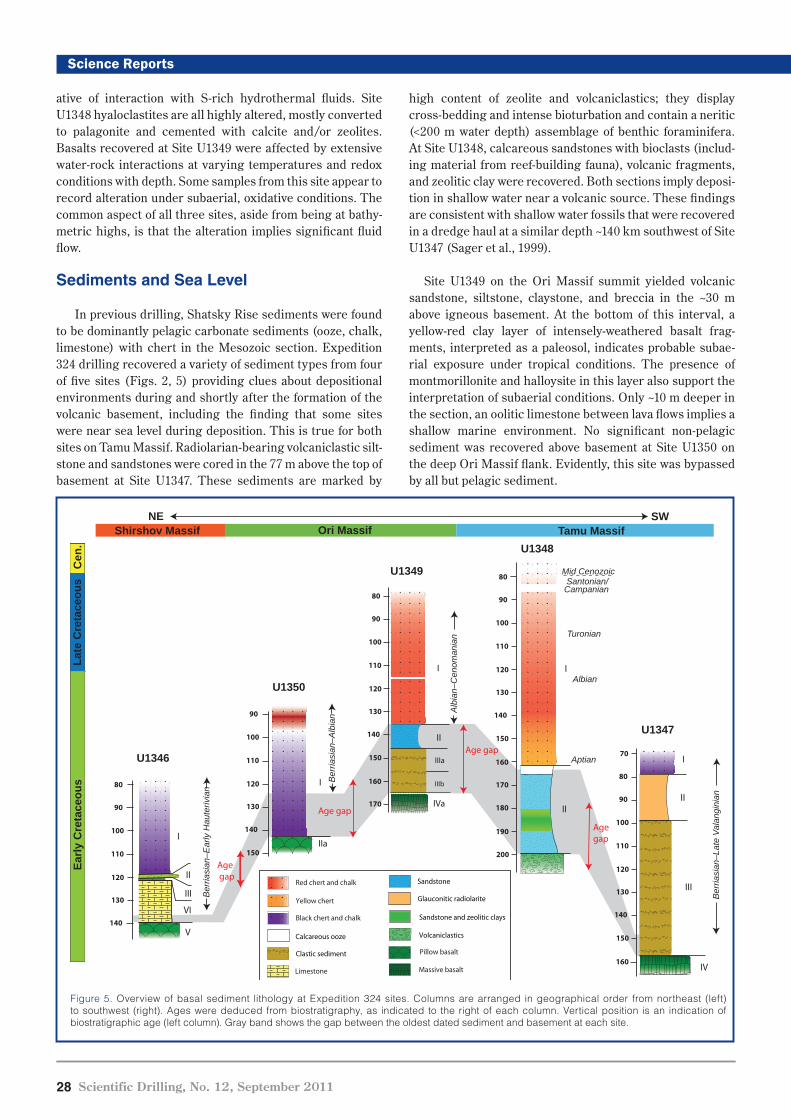
28 Scientific Drilling, No. 12, September 2011
Science Reports
high content of zeolite and volcaniclastics; they display cross-bedding and intense bioturbation and contain a neritic (<200 m water depth) assemblage of benthic foraminifera. At Site U1348, calcareous sandstones with bioclasts (includ-ing material from reef-building fauna), volcanic fragments, and zeolitic clay were recovered. Both sections imply deposi-tion in shallow water near a volcanic source. These findings are consistent with shallow water fossils that were recovered in a dredge haul at a similar depth ~140 km southwest of Site U1347 (Sager et al., 1999).
Site U1349 on the Ori Massif summit yielded volcanic sandstone, siltstone, claystone, and breccia in the ~30 m above igneous basement. At the bottom of this interval, a yellow-red clay layer of intensely-weathered basalt frag-ments, interpreted as a paleosol, indicates probable subae-rial exposure under tropical conditions. The presence of montmorillonite and halloysite in this layer also support the interpretation of subaerial conditions. Only ~10 m deeper in the section, an oolitic limestone between lava flows implies a shallow marine environment. No significant non-pelagic sediment was recovered above basement at Site U1350 on the deep Ori Massif flank. Evidently, this site was bypassed by all but pelagic sediment.
ative of interaction with S-rich hydrothermal fluids. Site U1348 hyaloclastites are all highly altered, mostly converted to palagonite and cemented with calcite and/or zeolites. Basalts recovered at Site U1349 were affected by extensive water-rock interactions at varying temperatures and redox conditions with depth. Some samples from this site appear to record alteration under subaerial, oxidative conditions. The common aspect of all three sites, aside from being at bathy-metric highs, is that the alteration implies significant fluid flow.
Sediments and Sea Level
In previous drilling, Shatsky Rise sediments were found to be dominantly pelagic carbonate sediments (ooze, chalk, limestone) with chert in the Mesozoic section. Expedition 324 drilling recovered a variety of sediment types from four of five sites (Figs. 2, 5) providing clues about depositional environments during and shortly after the formation of the volcanic basement, including the finding that some sites were near sea level during deposition. This is true for both sites on Tamu Massif. Radiolarian-bearing volcaniclastic silt-stone and sandstones were cored in the 77 m above the top of basement at Site U1347. These sediments are marked by
Figure 5. Overview of basal sediment lithology at Expedition 324 sites. Columns are arranged in geographical order from northeast (left) to southwest (right). Ages were deduced from biostratigraphy, as indicated to the right of each column. Vertical position is an indication of biostratigraphic age (left column). Gray band shows the gap between the oldest dated sediment and basement at each site.
IVa
IIIa
IIIb
I
II
U1349
U1347
U1348
I
IIa
U1350
II
I
I
III
II
90
100
110
120
130
140
150
80
90
100
110
120
130
140
150
160
170
80
90
100
110
120
130
140
150
160
170
180
190
200
70
80
90
100
110
120
130
140
150
160
Shirshov MassifNE SW
Ori Massif Tamu Massif
Black chert and chalk
Red chert and chalk
Yellow chert
Limestone
Sandstone
Sandstone and zeolitic clays
Glauconitic radiolarite
Calcareous ooze
Clastic sediment
Volcaniclastics
Massive basalt
Pillow basalt
IV
80
90
100
110
120
130
140
U1346
I
VI
V
II
III Ber
riasi
an–E
arly
Hau
teriv
ian
Ber
riasi
an–L
ate
Vala
ngin
ian
Alb
ian–
Cen
oman
ian
Ber
riasi
an–A
lbia
n
Albian
Turonian
Mid Cenozoic Santonian/Campanian
Aptian
Early
Cre
tace
ous
Late
Cre
tace
ous
Cen
.
Age gap
Age gap
Age gap
Age gap
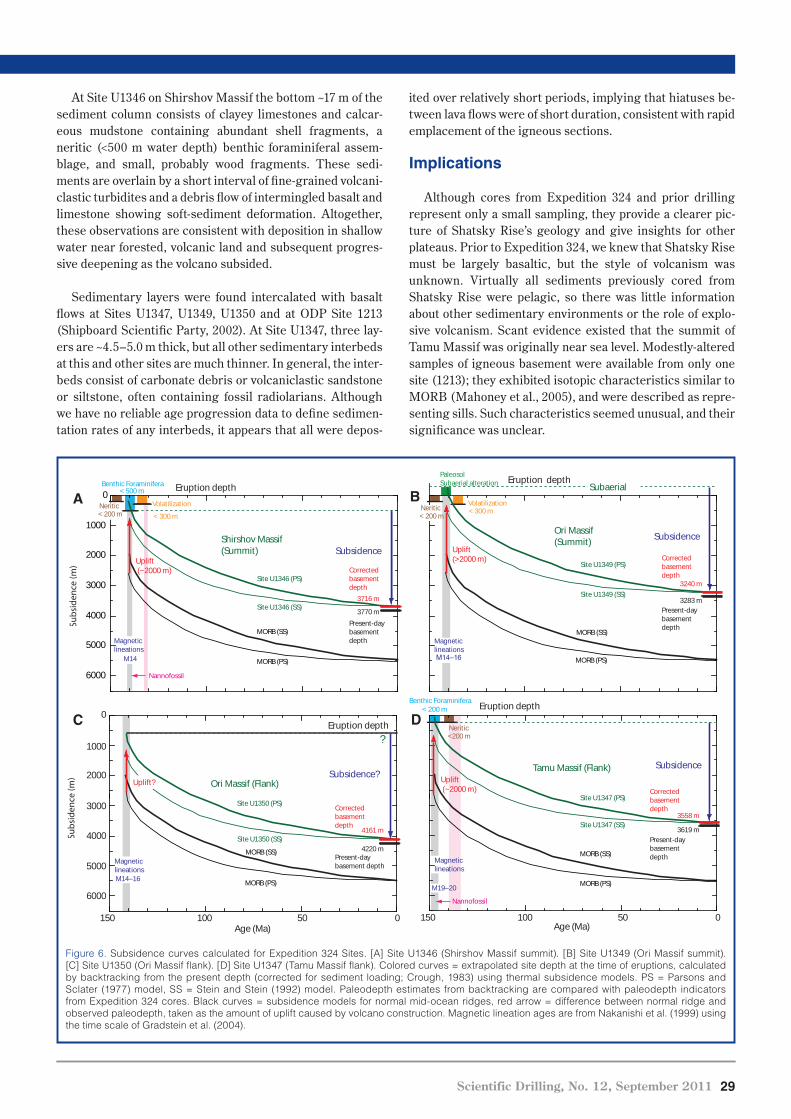
Scientific Drilling, No. 12, September 2011 29
Science Reports
ited over relatively short periods, implying that hiatuses be-tween lava flows were of short duration, consistent with rapid emplacement of the igneous sections.
Implications
Although cores from Expedition 324 and prior drilling represent only a small sampling, they provide a clearer pic-ture of Shatsky Rise’s geology and give insights for other plateaus. Prior to Expedition 324, we knew that Shatsky Rise must be largely basaltic, but the style of volcanism was unknown. Virtually all sediments previously cored from Shatsky Rise were pelagic, so there was little information about other sedimentary environments or the role of explo-sive volcanism. Scant evidence existed that the summit of Tamu Massif was originally near sea level. Modestly-altered samples of igneous basement were available from only one site (1213); they exhibited isotopic characteristics similar to MORB (Mahoney et al., 2005), and were described as repre-senting sills. Such characteristics seemed unusual, and their significance was unclear.
At Site U1346 on Shirshov Massif the bottom ~17 m of the sediment column consists of clayey limestones and calcar-eous mudstone containing abundant shell fragments, a neritic (<500 m water depth) benthic foraminiferal assem-blage, and small, probably wood fragments. These sedi-ments are overlain by a short interval of fine-grained volcani-clastic turbidites and a debris flow of intermingled basalt and limestone showing soft-sediment deformation. Altogether, these observations are consistent with deposition in shallow water near forested, volcanic land and subsequent progres-sive deepening as the volcano subsided.
Sedimentary layers were found intercalated with basalt flows at Sites U1347, U1349, U1350 and at ODP Site 1213 (Shipboard Scientific Party, 2002). At Site U1347, three lay-ers are ~4.5–5.0 m thick, but all other sedimentary interbeds at this and other sites are much thinner. In general, the inter-beds consist of carbonate debris or volcaniclastic sandstone or siltstone, often containing fossil radiolarians. Although we have no reliable age progression data to define sedimen-tation rates of any interbeds, it appears that all were depos-
Figure 6. Subsidence curves calculated for Expedition 324 Sites. [A] Site U1346 (Shirshov Massif summit). [B] Site U1349 (Ori Massif summit). [C] Site U1350 (Ori Massif flank). [D] Site U1347 (Tamu Massif flank). Colored curves = extrapolated site depth at the time of eruptions, calculated by backtracking from the present depth (corrected for sediment loading; Crough, 1983) using thermal subsidence models. PS = Parsons and Sclater (1977) model, SS = Stein and Stein (1992) model. Paleodepth estimates from backtracking are compared with paleodepth indicators from Expedition 324 cores. Black curves = subsidence models for normal mid-ocean ridges, red arrow = difference between normal ridge and observed paleodepth, taken as the amount of uplift caused by volcano construction. Magnetic lineation ages are from Nakanishi et al. (1999) using the time scale of Gradstein et al. (2004).
< 300 mVolatilization
MORB (PS)
MORB (SS)
3240 m
3283 mPresent-day basementdepth
Correctedbasement depth
Eruption depth
Uplift(>2000 m)
Ori Massif(Summit)
M14–16
Magneticlineations
Subsidence
Site U1349 (SS)
Site U1349 (PS)
PaleosolSubaerial alteration Subaerial
< 200 mNeritic
B
MORB (PS)
MORB (SS)
4161 m
4220 mPresent-day basement depth
Correctedbasement depth
Ori Massif (Flank)Subsidence?
Site U1350 (SS)
Site U1350 (PS)
?Eruption depth
0
1000
2000
3000
4000
5000
6000
050100150Age (Ma)
C
Uplift?
0
1000
2000
3000
4000
5000
6000MORB (PS)
MORB (SS)
3716 m
3770 m
Present-day basementdepth
Correctedbasement depth
Eruption depth
< 300 m
Volatilization
< 500 mBenthic Foraminifera
Shirshov Massif(Summit)
Site U1346 (SS)
Site U1346 (PS)
Subsidence
< 200 mNeritic
Nannofossil
M14
Magneticlineations
A
Uplift (~2000 m)
050100150
MORB (PS)
MORB (SS)
3558 m
3619 mPresent-day basementdepth
Correctedbasement depth
Eruption depth
Age (Ma)
Benthic Foraminifera
Tamu Massif (Flank)
M19–20
Magneticlineations
Subsidence
Site U1347 (SS)
Site U1347 (PS)
Nannofossil
< 200 m
<200 mNeritic
D
Uplift (~2000 m)
M14–16
Magneticlineations
30 Scientific Drilling, No. 12, September 2011
Science Reports
Expedition 324 provided samples of igneous basement at four new sites, and broadly MORB-like characteristics appear general. Massive flows are found at several locations, and the thickest and greatest percentage of total section are found on Tamu Massif, which is characterized by massive flows similar to those found in continental flood basalt provinces (Jerram and Widdowson, 2005) and Ontong Java Plateau (Mahoney et al., 2001). Because of its large size, shape, and style of volcanism, Tamu Massif appears to be a “supervolcano”. It suggests that other oceanic plateaus may have formed from similarly colossal volcanoes. In contrast, massive flows are thinner and less abundant at Ori and Shirshov massifs, whose size and eruption style were probably similar to those of the present island of Hawaii—that is , big but not deserving of superlatives.
Expedition 324 cores suggest that the summits of Shatsky Rise volcanoes were near sea level or perhaps emergent. The large interior of the Tamu Massif summit may have been emergent, perhaps with significant elevation because the basal sediments of Site U1347 were deposited in shallow water, but the top of the volcano is ~800 m shallower. Site U1349, with evidence of both shallow water and emergence, suggests that the summit of Ori Massif was at the water’s edge. Site U1346, located at the edge of a summit platform on Shirshov Massif, also indicates shallow-water sedimentation and implies that volcanic cones in the interior may have been emergent. It is likely that the plateau formed one or more islands through the late Jurassic and Early Cretaceous, but their size and duration are unclear. Backtracked subsidence curves for the sites (Fig. 6) show that the present depth of the top of igneous basement is consistent with that predicted by normal lithospheric subsidence. If there was dynamic uplift during plateau formation, for example, owing to the arrival of a plume head (Coffin and Eldholm, 1994), there is no evidence of it now.
Site U1348 provided a surprise with a thick pile of highly altered hyaloclastite. Prior to Expedition 324, no significant accumulation of such sediment had been recovered from Shatsky Rise. The finding of this material should not be a surprise, given that it is common on seamounts (Smith and Batiza, 1989). The large basement ridge at Site U1348, thought to be the top of a fault block, consists wholly or in part of the products of explosive submarine volcanism. With this discovery, it seems likely that many of the basement highs imaged on seismic sections (Sager et al., 1999) have a similar origin.
The extent of alteration of igneous basement was also a surprise. We thought it was possible to obtain relatively unaltered samples by drilling through the weathered cara-pace, but heavy alteration occurred throughout the three higher-elevation igneous sections (U1346, U1348, U1349). This finding implies that fluid circulation at the summits of the volcanic edifices was pervasive. Whether this is a result of proximity to sea level, to heat concentration, or of the
volcanic structure is unclear. In contrast, flank flows appear to have been armored by subsequent flows, restricting fluid flow and consequent alteration.
Results now available from Expedition 324 are mainly physical descriptions of the processes of volcanism, sedi-mentation, and evolution of the Shatsky Rise plateau. Resolution of what caused Shatsky Rise formation is not yet feasible but should be closer after careful studies of the recovered samples, especially those involving high-precision age determination and isotopic and geochemical characteri-zation of the igneous basement. Whatever mechanism is called upon to generate this plateau, it must explain the fact that initial eruptions built an enormous volcanic edifice with massive lava flows and rose to sea level during edifice building and subsided normally thereafter. Expedition 324 results also indicate that different parts of oceanic plateaus can have different styles of eruption, with some having char-acteristics similar to that of normal seamount volcanism elsewhere.
IODP Expedition 324 Scientists
W.W. Sager (Co-Chief Scientist), T. Sano (Co-Chief Scientist), J. Geldmacher (Staff Scientist), R. Almeev, A. Ando, C. Carvallo, A. Delacour, H.A. Evans, A.R. Greene, A.C. Harris, S. Herrmann, K. Heydolph, N. Hirano, N. Idrissi, A. Ishikawa, G. Iturrino, M.-H. Kang, A.A.P. Koppers, S. Li, K. Littler, J.J. Mahoney, N. Matsubara, M. Miyoshi, D.T. Murphy, J.H. Natland, M. Ooga, J. Prytulak, K. Shimizu, M. Tominaga, Y. Uchio, M. Widdowson, and S. C. Woodard.
References
Bach, W., Hegner, E., Erzinger, J., and Satir, M., 1994. Chemical and isotopic variations along the superfast spreading East Pacific Rise from 6°S to 30°S. Contrib. Mineral. Petrol., 116:365–380, doi:10.1007/BF00310905.
Ballard, R.D., Holcomb, R.T., and van Andel, Tj.H., 1979. The Galapagos Rift at 86°W: Sheet flows, collapse pits, and lava lakes of the rift valley. J. Geophys. Res., 84:5407–5422, doi:10.1029/JB084iB10p05407.
Coffin, M.F., and Eldholm, O., 1994. Large igneous provinces: Crustal structure, dimensions, and external consequences. Rev. Geophys., 32:1–36, doi:10.1029/93RG02508.
Coffin, M.F., Pringle, M.S., Duncan, R.A., Gladczenko, T.P., Storey, M., Müller, R.D., and Gahagan, L.A., 2002. Kerguelen hotspot magma output since 130 Ma. J. Petrol., 43:1121–1139. doi:10.1093/petrology/43.7.1121.
Crough, S.T., 1983. The correction for sediment loading on the sea-floor. J. Geophys. Res., 88:6449–6454, doi:10.1093/petrology/43.7.1121.
Duncan, R.A., and Richards, M.A., 1991. Hotspots, mantle plumes, flood basalts, and true polar wander. Rev. Geophys., 29:31–50. doi:10.1029/90RG02372.
Fitton, J.G., and Godard, M., 2004. Origin and evolution of magmas on the Ontong Java Pla teau. In Fitton, J.G., Mahoney, J.J., Wallace, P.J., and Saunders, A.D. (Eds.), Origin and Evo-
Scientific Drilling, No. 12, September 2011 31
Science Reports
lution of the Ontong Java Plateau, Geol. Soc. Spec. Publ., 229:151–178.
Foulger, G.R., 2007. The “plate” model for the genesis of melting anomalies. In Foulger, G.R., and Jurdy, D.M. (Eds.), Plates, Plumes, and Planetary Processes. Spec. Pap. – Geol. Soc. Am., 430:1–28.
Gradstein, F.M., Ogg, J.G., and Smith, A., 2004. A Geologic Time Scale 2004: Cambridge (Cambridge University Press).
Jerram, D.A., and Widdowson, M., 2005. The anatomy of continental flood basalt provinces: Geological constraints on the proc-ess and products of flood volcanism. Lithos, 79:385–405, doi:10.1016/j.lithos.2004.09.009.
Keszthelyi, L., and Self, S., 1998. Some physical requirements for the emplacement of long basaltic lava flows. J. Geophys. Res., 103:27,447–27,464, doi:10.1029/98JB00606.
Koppers, A.A.P., Sano, T., Natland, J.H., Widdowson, M., Almeev, R., Greene, A.R., Murphy, D.T., Delacour, A., Miyoshi, M., Shimizu, K., Li, S., Hirano, N., Geldmacher, J., and the Expedition 324 Scientists, 2010. Massive basalt flows on the southern flank of Tamu Massif, Shatsky Rise: A reappraisal of ODP Site 1213 basement. In Sager, W.W., Sano, T., Geldmacher, J., and the Expedition 324 Scientists, Proc. IODP, 324: Tokyo (Integrated Ocean Drilling Progam Management International, Inc.). doi:10.2204/iodp.proc.324.109.2010.
Le Maitre, R.W., Bateman, P., Dudek, A., Keller, J., Lameyre, J., Le Bas, M.J., Sabine, P.A., Schmid, R., Sorensen, H., Streckeisen, A., Wolley A.R., and Zanettin, B., 1989. A Classification of Igneous Rocks and Glossary of Terms: Oxford (Blackwell Scientific Publications).
Mahoney, J.J., Duncan, R.A., Tejada, M.L.G., Sager, W.W., and Bralower, T.J., 2005. Jurassic-Cretaceous boundary age and mid-ocean-ridge-type mantle source for Shatsky Rise. Geology, 33:185–188, doi:10.1130/G21378.1.
Mahoney, J.J., Fitton, J.G., Wallace, P.J., et al., 2001. Proc. ODP, Init. Repts., 192: College Station, TX (Ocean Drilling Program). doi:10.2973/odp.proc.ir.192.2001.
Mahoney, J.J., Sinton, J.M., Kurz, M.D., Macdougall, J.D., Spencer, K.J., and Lugmair, G.W., 1994. Isotope and trace element characteristics of a super-fast spreading ridge: East Pacific Rise 13–23°S. Earth Planet. Sci. Lett., 121:173–193, doi:10.1016/0012-821X(94)90039-6.
Nakanishi, M., Sager, W.W., and Klaus, A., 1999. Magnetic lineations within Shatsky Rise, northwest Pacific Ocean: Implications for hot spot-triple junction interaction and oceanic plateau formation. J. Geophys. Res., 104:7539–7556, doi:10.1029/ 1999JB900002.
Parsons, B., and Sclater, J.G., 1977. An analysis of the variation of ocean floor bathymetry and heat flow with age. J. Geophys. Res., 82:803–827. doi:10.1029/JB082i005p00803.
Sager, W.W., 2005. What built Shatsky Rise, a mantle plume or ridge tectonics? In Foulger, G.R., Natland, J.H., Presnall, D.C., and Anderson, D.L. (Eds.), Plates, Plumes, and Paradigms. Spec. Pap.-Geol. Soc. Am., 388:721–733, doi:10.1029/ 1998JB900009.
Sager, W.W., Kim, J., Klaus, A., Nakanishi, M., and Khankishieva, L.M., 1999. Bathymetry of Shatsky Rise, northwest Pacific Ocean: Implications for ocean plateau development at a tri-ple junction. J. Geophys. Res., 104:7557–7576, doi:10.1029/
1998JB900009.Sager, W.W., Sano, T., Geldmacher, J., and the Expedition 324
Scientists, 2010. Proc. IODP, 324: Tokyo (Integrated Ocean Drilling Program Management International, Inc.), doi:10.2204/iodp.proc.324.2010.
Self, S., Thordarson, T., and Keszthelyi, L., 1997. Emplacement of continental flood basalt lava flows. In Mahoney, J.J., and Coffin, M.F. (Eds.), Large Igneous Provinces. Geophys. Monogr. – Am. Geophys. Union, 100:381–410.
Shipboard Scientific Party, 2002. Site 1213. In Bralower, T.J., Premoli Silva, I., Malone, M.J., et al., Proc. ODP, Init. Repts., 198: College Station, TX (Ocean Drilling Program), 1–110, doi:10.2973/odp.proc.ir.198.109.2002.
Sinton, J.M., Smaglik, S.M., Mahoney, J.J., and Macdonald, K.C., 1991. Magmatic pro cesses at superfast spreading mid-ocean ridges: Glass compositional variations along the East Pacific Rise 13°–23°S. J. Geophys. Res., 96:6133–6155, doi:10.1029/90JB02454.
Smith, T.L., and Batiza, R., 1989. New field and laboratory evidence for the origin of hyaloclastite flows on seamount summits. Bull. Volcanol., 51:96–114, doi:10.1007/BF01081979.
Stein, C.A., and Stein, S., 1992. A model for the global variation in oceanic depth and heat flow with lithospheric age. Nature, 359:123–129, doi:10.1038/359123a0.
Tarduno, J.A., Duncan, R.A., Scholl, D.W., et al., 2002. Proc. ODP, Init. Repts., 197: College Station, TX (Ocean Drilling Program).
Tejada, M.L.G., Mahoney, J.J., Duncan, R.A., and Hawkins, M.P., 1996. Age and geochemistry of basement and alkalic rocks of Malaita and Santa Isabel, Solomon Islands, southern mar-gin of Ontong Java Plateau. J. Petrol., 37:361–394, doi:10.1093/petrology/37.2.361.
Tejada, M.L.G., Mahoney, J.J., Neal, C.R., Duncan, R.A., and Petterson, M.G., 2002. Basement geochemistry and geo-chronology of Central Malaita, Solomon Islands, with impli-cations for the origin and evolution of the Ontong Java Plateau. J. Petrol., 43:449–484, doi:10.1093/petrology/ 43.3.449.
Authors
William W. Sager, Department of Oceanography, Texas A&M University, College Station, TX 77843-3146, U.S.A., e-mail: [email protected] Sano, Department of Geology and Paleontology, National Museum of Nature and Science, 4-1-1 Amakubo, Tsukuba 305-0005, Japan, e-mail: [email protected]örg Geldmacher, Integrated Ocean Drilling Program, Texas A&M University, 1000 Discovery Drive, College Station, TX 77845-9547, U.S.A., e-mail:[email protected] IODP Expedition 324 Scientists
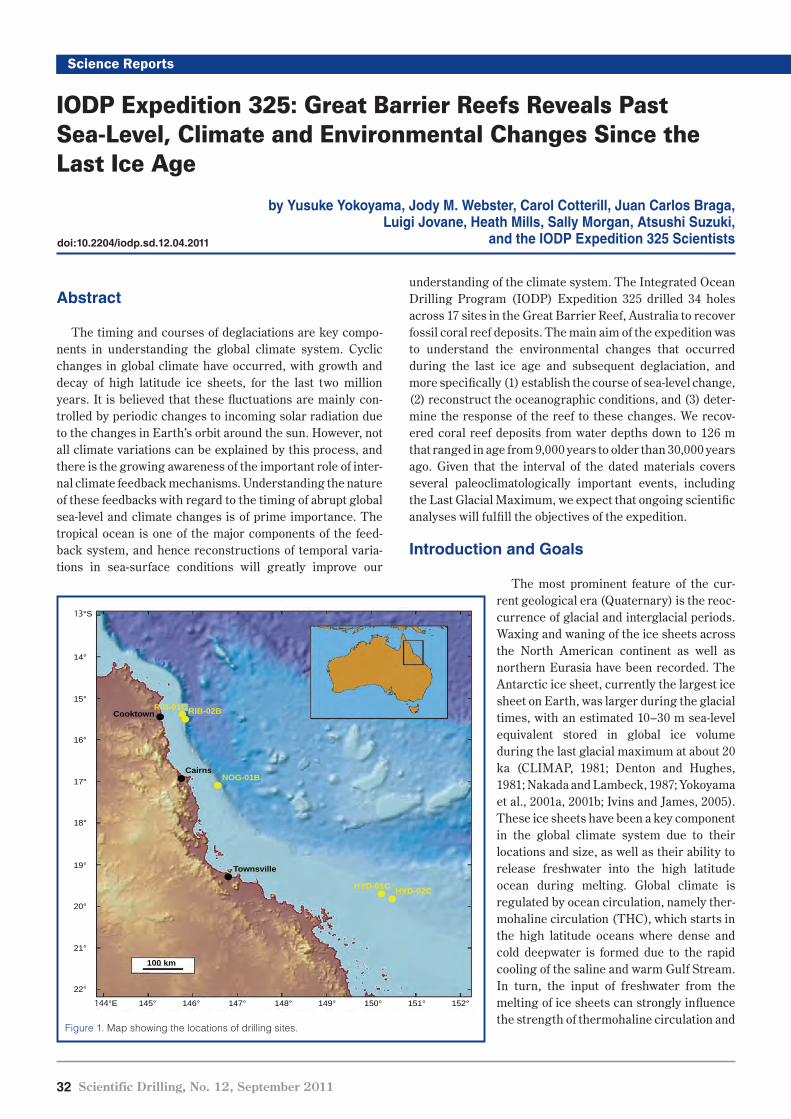
Science Reports
IODP Expedition 325: Great Barrier Reefs Reveals Past Sea-Level, Climate and Environmental Changes Since the Last Ice Age
doi:10.2204/iodp.sd.12.04.2011
32 Scientific Drilling, No. 12, September 2011
Science Reports Science Reports
by Yusuke Yokoyama, Jody M. Webster, Carol Cotterill, Juan Carlos Braga, Luigi Jovane, Heath Mills, Sally Morgan, Atsushi Suzuki,
and the IODP Expedition 325 Scientists
Abstract
The timing and courses of deglaciations are key compo-nents in understanding the global climate system. Cyclic changes in global climate have occurred, with growth and decay of high latitude ice sheets, for the last two million years. It is believed that these fluctuations are mainly con-trolled by periodic changes to incoming solar radiation due to the changes in Earth’s orbit around the sun. However, not all climate variations can be explained by this process, and there is the growing awareness of the important role of inter-nal climate feedback mechanisms. Understanding the nature of these feedbacks with regard to the timing of abrupt global sea-level and climate changes is of prime importance. The tropical ocean is one of the major components of the feed-back system, and hence reconstructions of temporal varia-tions in sea-surface conditions will greatly improve our
understanding of the climate system. The Integrated Ocean Drilling Program (IODP) Expedition 325 drilled 34 holes across 17 sites in the Great Barrier Reef, Australia to recover fossil coral reef deposits. The main aim of the expedition was to understand the environmental changes that occurred during the last ice age and subsequent deglaciation, and more specifically (1) establish the course of sea-level change, (2) reconstruct the oceanographic conditions, and (3) deter-mine the response of the reef to these changes. We recov-ered coral reef deposits from water depths down to 126 m that ranged in age from 9,000 years to older than 30,000 years ago. Given that the interval of the dated materials covers several paleoclimatologically important events, including the Last Glacial Maximum, we expect that ongoing scientific analyses will fulfill the objectives of the expedition.
Introduction and Goals
The most prominent feature of the cur-rent geological era (Quaternary) is the reoc-currence of glacial and interglacial periods. Waxing and waning of the ice sheets across the North American continent as well as northern Eurasia have been recorded. The Antarctic ice sheet, currently the largest ice sheet on Earth, was larger during the glacial times, with an estimated 10–30 m sea-level equivalent stored in global ice volume during the last glacial maximum at about 20 ka (CLIMAP, 1981; Denton and Hughes, 1981; Nakada and Lambeck, 1987; Yokoyama et al., 2001a, 2001b; Ivins and James, 2005). These ice sheets have been a key component in the global climate system due to their locations and size, as well as their ability to release freshwater into the high latitude ocean during melting. Global climate is regulated by ocean circulation, namely ther-mohaline circulation (THC), which starts in the high latitude oceans where dense and cold deepwater is formed due to the rapid cooling of the saline and warm Gulf Stream. In turn, the input of freshwater from the melting of ice sheets can strongly influence the strength of thermohaline circulation and
Figure 1. Map showing the locations of drilling sites.
144°E 145° 146° 147° 148° 149° 150° 151° 152°
13°S
14°
15°
16°
17°
18°
19°
20°
21°
22°
100 km
Cooktown
Cairns
Townsville
NOG-01B
RIB-01C
HYD-01C HYD-02C
RIB-02B
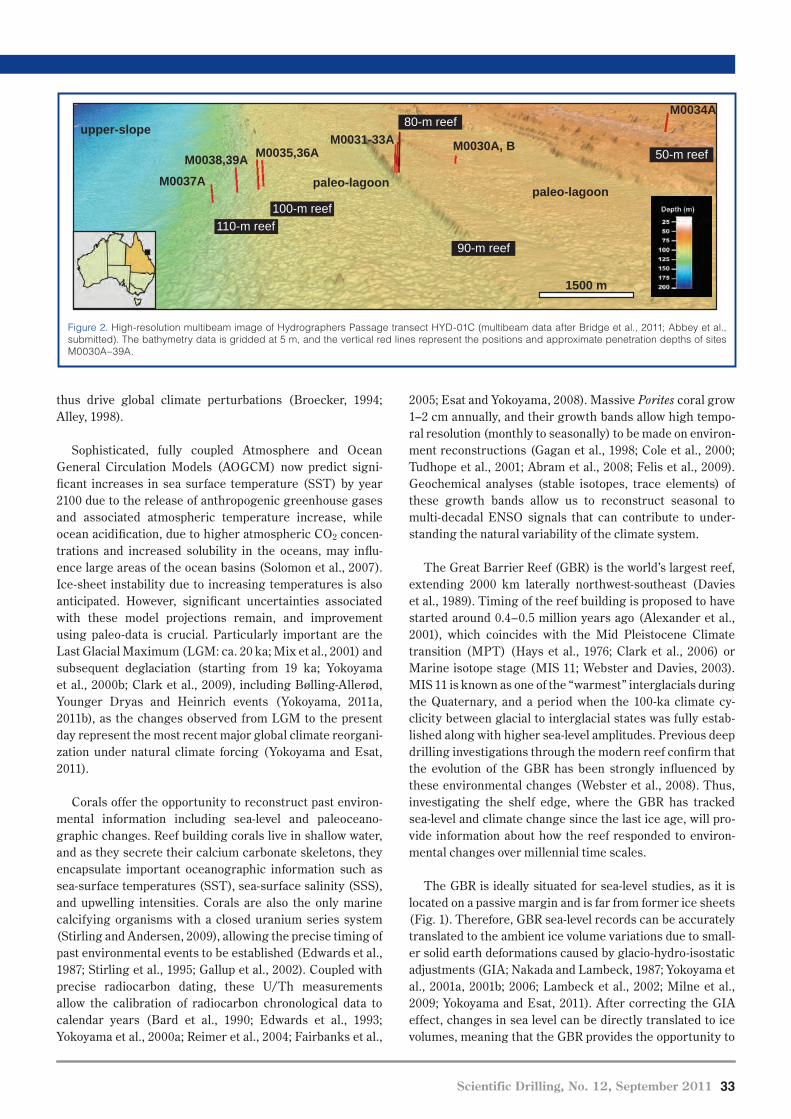
Science ReportsScience Reports
Scientific Drilling, No. 12, September 2011 33
Science Reports
2005; Esat and Yokoyama, 2008). Massive Porites coral grow 1–2 cm annually, and their growth bands allow high tempo-ral resolution (monthly to seasonally) to be made on environ-ment reconstructions (Gagan et al., 1998; Cole et al., 2000; Tudhope et al., 2001; Abram et al., 2008; Felis et al., 2009). Geochemical analyses (stable isotopes, trace elements) of these growth bands allow us to reconstruct seasonal to multi-decadal ENSO signals that can contribute to under-standing the natural variability of the climate system.
The Great Barrier Reef (GBR) is the world’s largest reef, extending 2000 km laterally northwest-southeast (Davies et al., 1989). Timing of the reef building is proposed to have started around 0.4–0.5 million years ago (Alexander et al., 2001), which coincides with the Mid Pleistocene Climate transition (MPT) (Hays et al., 1976; Clark et al., 2006) or Marine isotope stage (MIS 11; Webster and Davies, 2003). MIS 11 is known as one of the “warmest” interglacials during the Quaternary, and a period when the 100-ka climate cy-clicity between glacial to interglacial states was fully estab-lished along with higher sea-level amplitudes. Previous deep drilling investigations through the modern reef confirm that the evolution of the GBR has been strongly influenced by these environmental changes (Webster et al., 2008). Thus, investigating the shelf edge, where the GBR has tracked sea-level and climate change since the last ice age, will pro-vide information about how the reef responded to environ-mental changes over millennial time scales.
The GBR is ideally situated for sea-level studies, as it is located on a passive margin and is far from former ice sheets (Fig. 1). Therefore, GBR sea-level records can be accurately translated to the ambient ice volume variations due to small-er solid earth deformations caused by glacio-hydro-isostatic adjustments (GIA; Nakada and Lambeck, 1987; Yokoyama et al., 2001a, 2001b; 2006; Lambeck et al., 2002; Milne et al., 2009; Yokoyama and Esat, 2011). After correcting the GIA effect, changes in sea level can be directly translated to ice volumes, meaning that the GBR provides the opportunity to
thus drive global climate perturbations (Broecker, 1994; Alley, 1998).
Sophisticated, fully coupled Atmosphere and Ocean General Circulation Models (AOGCM) now predict signi-ficant increases in sea surface temperature (SST) by year 2100 due to the release of anthropogenic greenhouse gases and associated atmospheric temperature increase, while ocean acidification, due to higher atmospheric CO2 concen-trations and increased solubility in the oceans, may influ-ence large areas of the ocean basins (Solomon et al., 2007). Ice-sheet instability due to increasing temperatures is also anticipated. However, significant uncertainties associated with these model projections remain, and improvement using paleo-data is crucial. Particularly important are the Last Glacial Maximum (LGM: ca. 20 ka; Mix et al., 2001) and subsequent deglaciation (starting from 19 ka; Yokoyama et al., 2000b; Clark et al., 2009), including Bølling-Allerød, Younger Dryas and Heinrich events (Yokoyama, 2011a, 2011b), as the changes observed from LGM to the present day represent the most recent major global climate reorgani-zation under natural climate forcing (Yokoyama and Esat, 2011).
Corals offer the opportunity to reconstruct past environ-mental information including sea-level and paleoceano- graphic changes. Reef building corals live in shallow water, and as they secrete their calcium carbonate skeletons, they encapsulate important oceanographic information such as sea-surface temperatures (SST), sea-surface salinity (SSS), and upwelling intensities. Corals are also the only marine calcifying organisms with a closed uranium series system (Stirling and Andersen, 2009), allowing the precise timing of past environmental events to be established (Edwards et al., 1987; Stirling et al., 1995; Gallup et al., 2002). Coupled with precise radiocarbon dating, these U/Th measurements allow the calibration of radiocarbon chronological data to calendar years (Bard et al., 1990; Edwards et al., 1993; Yokoyama et al., 2000a; Reimer et al., 2004; Fairbanks et al.,
Figure 2. High-resolution multibeam image of Hydrographers Passage transect HYD-01C (multibeam data after Bridge et al., 2011; Abbey et al., submitted). The bathymetry data is gridded at 5 m, and the vertical red lines represent the positions and approximate penetration depths of sites M0030A–39A.
paleo-lagoonpaleo-lagoon
upper-slopeM0034A
M0030A, BM0031-33A
M0037AM0038,39A M0035,36A
90-m reef
80-m reef
50-m reef
100-m reef110-m reef
1500 m
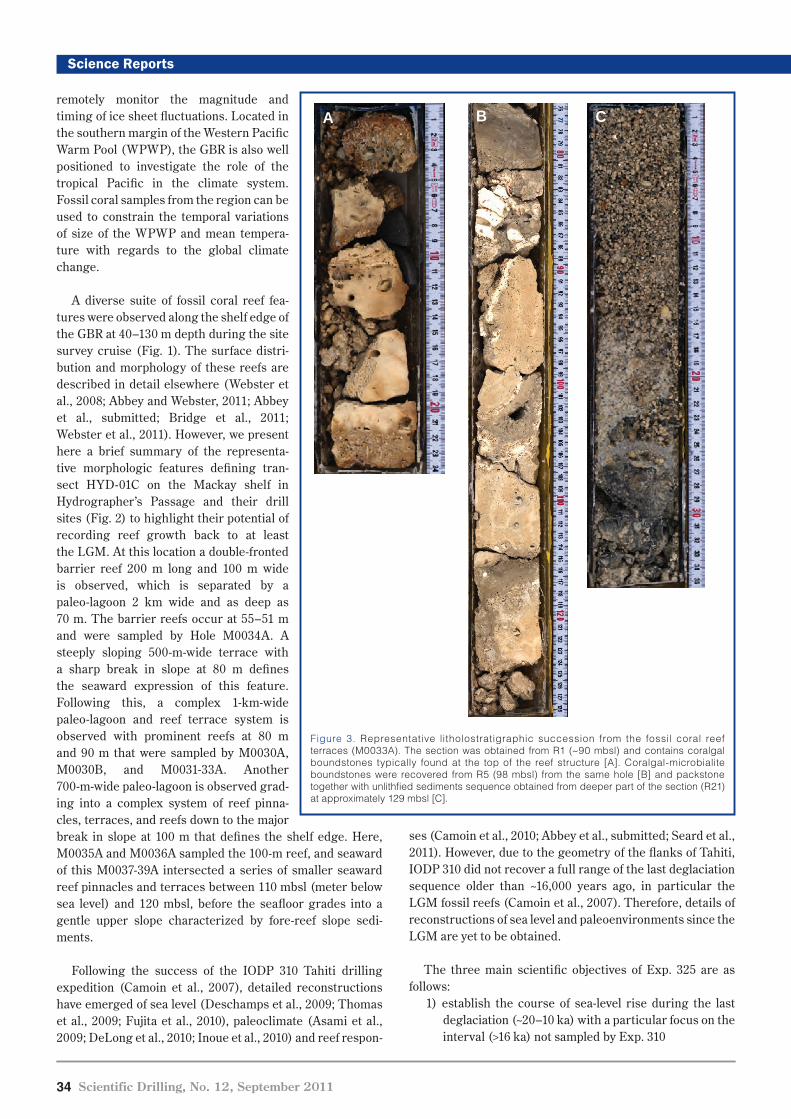
34 Scientific Drilling, No. 12, September 2011
Science Reports
ses (Camoin et al., 2010; Abbey et al., submitted; Seard et al., 2011). However, due to the geometry of the flanks of Tahiti, IODP 310 did not recover a full range of the last deglaciation sequence older than ~16,000 years ago, in particular the LGM fossil reefs (Camoin et al., 2007). Therefore, details of reconstructions of sea level and paleoenvironments since the LGM are yet to be obtained.
The three main scientific objectives of Exp. 325 are as follows:
1) establish the course of sea-level rise during the last deglaciation (~20–10 ka) with a particular focus on the interval (>16 ka) not sampled by Exp. 310
remotely monitor the magnitude and timing of ice sheet fluctuations. Located in the southern margin of the Western Pacific Warm Pool (WPWP), the GBR is also well positioned to investigate the role of the tropical Pacific in the climate system. Fossil coral samples from the region can be used to constrain the temporal variations of size of the WPWP and mean tempera-ture with regards to the global climate change.
A diverse suite of fossil coral reef fea-tures were observed along the shelf edge of the GBR at 40–130 m depth during the site survey cruise (Fig. 1). The surface distri-bution and morphology of these reefs are described in detail elsewhere (Webster et al., 2008; Abbey and Webster, 2011; Abbey et al., submitted; Bridge et al., 2011; Webster et al., 2011). However, we present here a brief summary of the representa- tive morphologic features defining tran-sect HYD-01C on the Mackay shelf in Hydrographer’s Passage and their drill sites (Fig. 2) to highlight their potential of recording reef growth back to at least the LGM. At this location a double-fronted barrier reef 200 m long and 100 m wide is observed, which is separated by a paleo-lagoon 2 km wide and as deep as 70 m. The barrier reefs occur at 55–51 m and were sampled by Hole M0034A. A steeply sloping 500-m-wide terrace with a sharp break in slope at 80 m defines the seaward expression of this feature. Following this, a complex 1-km-wide paleo-lagoon and reef terrace system is observed with prominent reefs at 80 m and 90 m that were sampled by M0030A, M0030B, and M0031-33A. Another 700-m-wide paleo-lagoon is observed grad-ing into a complex system of reef pinna-cles, terraces, and reefs down to the major break in slope at 100 m that defines the shelf edge. Here, M0035A and M0036A sampled the 100-m reef, and seaward of this M0037-39A intersected a series of smaller seaward reef pinnacles and terraces between 110 mbsl (meter below sea level) and 120 mbsl, before the seafloor grades into a gentle upper slope characterized by fore-reef slope sedi-ments.
Following the success of the IODP 310 Tahiti drilling expedition (Camoin et al., 2007), detailed reconstructions have emerged of sea level (Deschamps et al., 2009; Thomas et al., 2009; Fujita et al., 2010), paleoclimate (Asami et al., 2009; DeLong et al., 2010; Inoue et al., 2010) and reef respon-
Figure 3. Representative litholostratigraphic succession from the fossil coral reef terraces (M0033A). The section was obtained from R1 (~90 mbsl) and contains coralgal boundstones typically found at the top of the reef structure [A]. Coralgal-microbialite boundstones were recovered from R5 (98 mbsl) from the same hole [B] and packstone together with unlithfied sediments sequence obtained from deeper part of the section (R21) at approximately 129 mbsl [C].
A B C
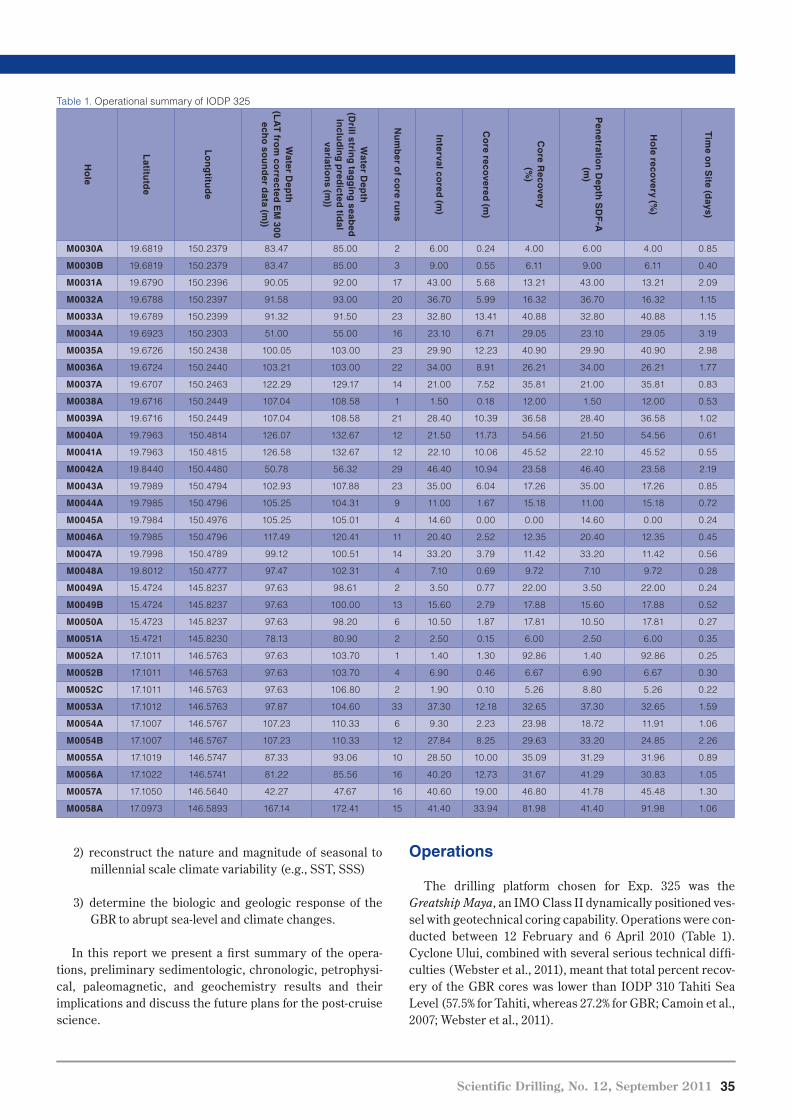
Scientific Drilling, No. 12, September 2011 35
Science Reports
Operations
The drilling platform chosen for Exp. 325 was the Greatship Maya, an IMO Class II dynamically positioned ves-sel with geotechnical coring capability. Operations were con-ducted between 12 February and 6 April 2010 (Table 1). Cyclone Ului, combined with several serious technical diffi-culties (Webster et al., 2011), meant that total percent recov-ery of the GBR cores was lower than IODP 310 Tahiti Sea Level (57.5% for Tahiti, whereas 27.2% for GBR; Camoin et al., 2007; Webster et al., 2011).
2) reconstruct the nature and magnitude of seasonal to millennial scale climate variability (e.g., SST, SSS)
3) determine the biologic and geologic response of the GBR to abrupt sea-level and climate changes.
In this report we present a first summary of the opera-tions, preliminary sedimentologic, chronologic, petrophysi-cal, paleomagnetic, and geochemistry results and their implications and discuss the future plans for the post-cruise science.
Table 1. Operational summary of IODP 325
Ho
le
Latitu
tde
Lo
ng
titud
e
Water D
epth
(L
AT
from
corrected
EM
300
echo
sou
nd
er data (m
))
Water D
epth
(D
rill string
tagg
ing
seabed
in
clud
ing
pred
icted tid
al variatio
ns (m
))
Nu
mb
er of co
re run
s
Interval co
red (m
)
Co
re recovered
(m)
Co
re Reco
very(%
)
Pen
etration
Dep
th S
DF
-A
(m)
Ho
le recovery (%
)
Tim
e on
Site (d
ays)
M0030A 19.6819 150.2379 83.47 85.00 2 6.00 0.24 4.00 6.00 4.00 0.85
M0030B 19.6819 150.2379 83.47 85.00 3 9.00 0.55 6.11 9.00 6.11 0.40
M0031A 19.6790 150.2396 90.05 92.00 17 43.00 5.68 13.21 43.00 13.21 2.09
M0032A 19.6788 150.2397 91.58 93.00 20 36.70 5.99 16.32 36.70 16.32 1.15
M0033A 19.6789 150.2399 91.32 91.50 23 32.80 13.41 40.88 32.80 40.88 1.15
M0034A 19.6923 150.2303 51.00 55.00 16 23.10 6.71 29.05 23.10 29.05 3.19
M0035A 19.6726 150.2438 100.05 103.00 23 29.90 12.23 40.90 29.90 40.90 2.98
M0036A 19.6724 150.2440 103.21 103.00 22 34.00 8.91 26.21 34.00 26.21 1.77
M0037A 19.6707 150.2463 122.29 129.17 14 21.00 7.52 35.81 21.00 35.81 0.83
M0038A 19.6716 150.2449 107.04 108.58 1 1.50 0.18 12.00 1.50 12.00 0.53
M0039A 19.6716 150.2449 107.04 108.58 21 28.40 10.39 36.58 28.40 36.58 1.02
M0040A 19.7963 150.4814 126.07 132.67 12 21.50 11.73 54.56 21.50 54.56 0.61
M0041A 19.7963 150.4815 126.58 132.67 12 22.10 10.06 45.52 22.10 45.52 0.55
M0042A 19.8440 150.4480 50.78 56.32 29 46.40 10.94 23.58 46.40 23.58 2.19
M0043A 19.7989 150.4794 102.93 107.88 23 35.00 6.04 17.26 35.00 17.26 0.85
M0044A 19.7985 150.4796 105.25 104.31 9 11.00 1.67 15.18 11.00 15.18 0.72
M0045A 19.7984 150.4976 105.25 105.01 4 14.60 0.00 0.00 14.60 0.00 0.24
M0046A 19.7985 150.4796 117.49 120.41 11 20.40 2.52 12.35 20.40 12.35 0.45
M0047A 19.7998 150.4789 99.12 100.51 14 33.20 3.79 11.42 33.20 11.42 0.56
M0048A 19.8012 150.4777 97.47 102.31 4 7.10 0.69 9.72 7.10 9.72 0.28
M0049A 15.4724 145.8237 97.63 98.61 2 3.50 0.77 22.00 3.50 22.00 0.24
M0049B 15.4724 145.8237 97.63 100.00 13 15.60 2.79 17.88 15.60 17.88 0.52
M0050A 15.4723 145.8237 97.63 98.20 6 10.50 1.87 17.81 10.50 17.81 0.27
M0051A 15.4721 145.8230 78.13 80.90 2 2.50 0.15 6.00 2.50 6.00 0.35
M0052A 17.1011 146.5763 97.63 103.70 1 1.40 1.30 92.86 1.40 92.86 0.25
M0052B 17.1011 146.5763 97.63 103.70 4 6.90 0.46 6.67 6.90 6.67 0.30
M0052C 17.1011 146.5763 97.63 106.80 2 1.90 0.10 5.26 8.80 5.26 0.22
M0053A 17.1012 146.5763 97.87 104.60 33 37.30 12.18 32.65 37.30 32.65 1.59
M0054A 17.1007 146.5767 107.23 110.33 6 9.30 2.23 23.98 18.72 11.91 1.06
M0054B 17.1007 146.5767 107.23 110.33 12 27.84 8.25 29.63 33.20 24.85 2.26
M0055A 17.1019 146.5747 87.33 93.06 10 28.50 10.00 35.09 31.29 31.96 0.89
M0056A 17.1022 146.5741 81.22 85.56 16 40.20 12.73 31.67 41.29 30.83 1.05
M0057A 17.1050 146.5640 42.27 47.67 16 40.60 19.00 46.80 41.78 45.48 1.30
M0058A 17.0973 146.5893 167.14 172.41 15 41.40 33.94 81.98 41.40 91.98 1.06
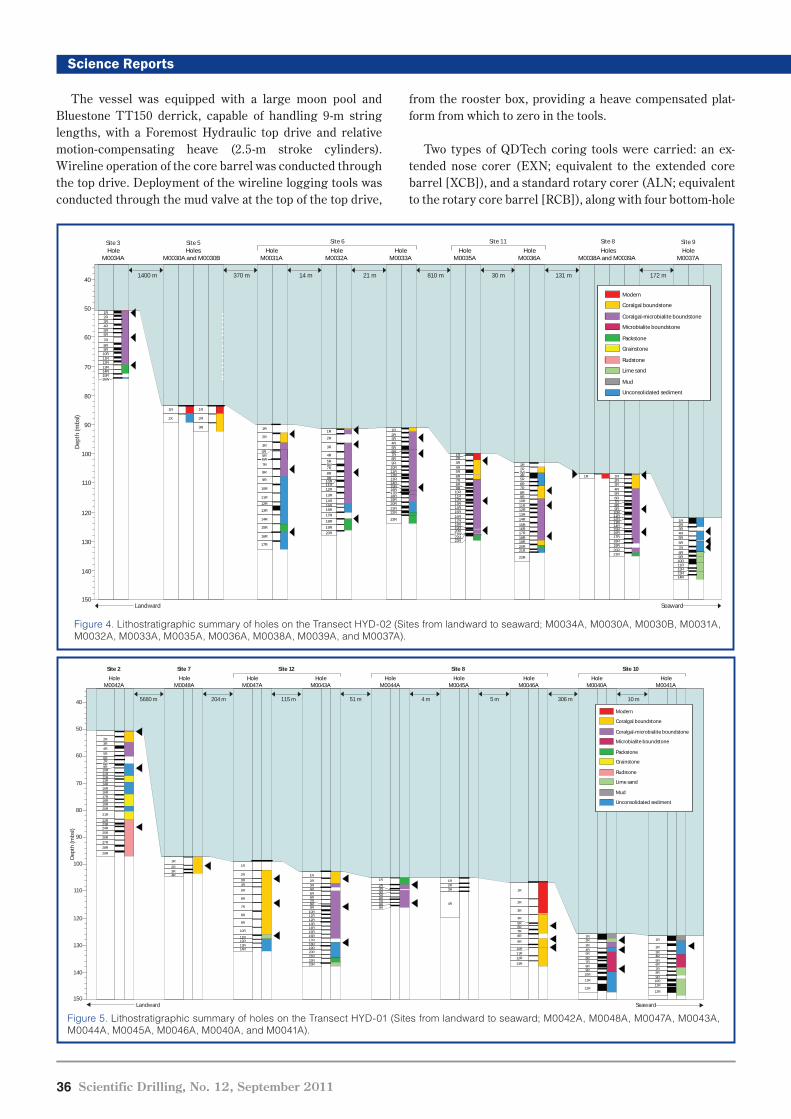
36 Scientific Drilling, No. 12, September 2011
Science Reports
from the rooster box, providing a heave compensated plat-form from which to zero in the tools.
Two types of QDTech coring tools were carried: an ex-tended nose corer (EXN; equivalent to the extended core barrel [XCB]), and a standard rotary corer (ALN; equivalent to the rotary core barrel [RCB]), along with four bottom-hole
The vessel was equipped with a large moon pool and Bluestone TT150 derrick, capable of handling 9-m string lengths, with a Foremost Hydraulic top drive and relative motion-compensating heave (2.5-m stroke cylinders). Wireline operation of the core barrel was conducted through the top drive. Deployment of the wireline logging tools was conducted through the mud valve at the top of the top drive,
150
140
130
120
110
100
90
80
70
60
50
40
Dep
th (m
bsl)
Landward Seaward
2R3R4R5R6R7R
9R10R11R12R13R14R15R16R17R18R19R20R
21R
22R23R24R25R26R27R
28R
29R
1R
2R3R4R
1R
2R
3R4R
5R
6R
7R
8R
9R
10R
11R12R13R14R
1R
2R3R4R5R6R7R8R9R
10R11R12R13R14R15R16R17R18R19R20R21R22R23R
1R
2R3R4R5R6R7R8R9R
1R
2R
3R
4R5R6R7R8R
9R
10R11R12R
13R
1R2R3R
4R
1R2R3R4R5R6R7R8R9R
10R
11R
12R
1R
2R3R4R5R6R7R8R9R
10R11R
12R
Site 2 Site 7 Site 8
HoleM0042A
HoleM0048A
HoleM0044A
HoleM0045A
HoleM0046A
Site 12
HoleM0047A
HoleM0043A
Site 10
HoleM0040A
HoleM0041A
Modern
Coralgal boundstone
Coralgal-microbialite boundstone
Microbialite boundstone
Packstone
Grainstone
Rudstone
Lime sand
Mud
Unconsolidated sediment
8W
5680 m 204 m 115 m 51 m 4 m 5 m 306 m 10 m
Figure 5. Lithostratigraphic summary of holes on the Transect HYD-01 (Sites from landward to seaward; M0042A, M0048A, M0047A, M0043A, M0044A, M0045A, M0046A, M0040A, and M0041A).
150
140
130
120
110
100
90
80
70
60
50
40
HoleM0034A
HolesM0030A and M0030B
HoleM0031A
HoleM0032A
HoleM0033A
HoleM0035A
HoleM0036A
HolesM0038A and M0039A
HoleM0037A
Landward Seaward
1R2R3R4R5R6R7R8R9R
10R11R12R13R14R15R
1R
2X
1R
2R
3R 1R
2R
3R
4R5R
7R
8R
9R
10R
11R
12R
13R
14R
15R
16R
17R
1R
2R
3R
4R
5R
7R8R9R
10R11R12R
13R
14R15R16R17R
18R
19R20R
1R2R3R4R5R6R7R8R9R
10R11R12R13R14R15R16R
18R19R20R21R22R
23R
1R2R3R4R5R6R7R8R9R
10R11R12R13R14R15R16R17R18R19R20R
22R23R
1R2R
4R5R6R7R8R9R
10R11R12R13R14R15R16R17R18R19R20R21R
22R
1R 1R2R3R4R5R6R7R8R9R
10R11R12R13R14R15R16R17R18R19R20R21R
1R2R3R4R5R6R7R8R9R
10R11R12R13R14R
1400 m 370 m 14 m 21 m 810 m 30 m 131 m 172 m
16W
6W6M
17R
21W
3W
Modern
Coralgal boundstone
Coralgal-microbialite boundstone
Microbialite boundstone
Packstone
Grainstone
Rudstone
Lime sand
Mud
Unconsolidated sediment
Dep
th (m
bsl)
Site 3 Site 5 Site 6 Site 11 Site 8 Site 9
Figure 4. Lithostratigraphic summary of holes on the Transect HYD-02 (Sites from landward to seaward; M0034A, M0030A, M0030B, M0031A, M0032A, M0033A, M0035A, M0036A, M0038A, M0039A, and M0037A).
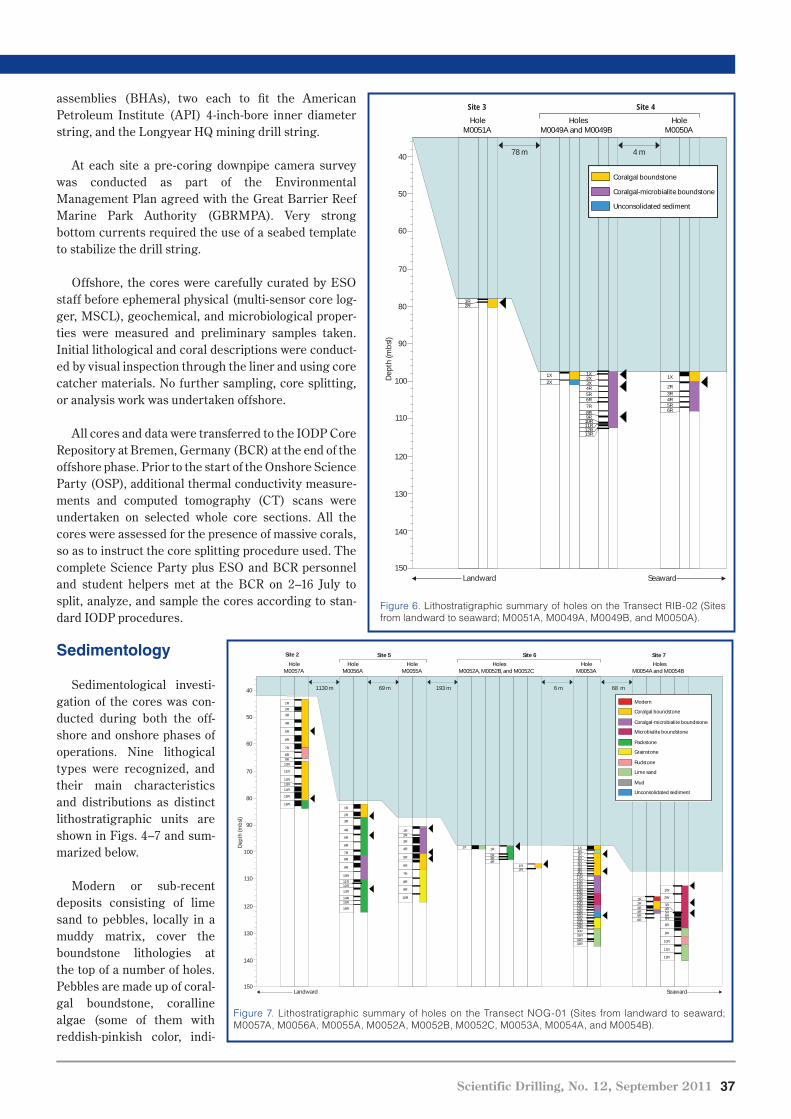
Scientific Drilling, No. 12, September 2011 37
Science Reports
assemblies (BHAs), two each to fit the American Petroleum Institute (API) 4-inch-bore inner diameter string, and the Longyear HQ mining drill string.
At each site a pre-coring downpipe camera survey was conducted as part of the Environmental Management Plan agreed with the Great Barrier Reef Marine Park Authority (GBRMPA). Very strong bottom currents required the use of a seabed template to stabilize the drill string.
Offshore, the cores were carefully curated by ESO staff before ephemeral physical (multi-sensor core log-ger, MSCL), geochemical, and microbiological proper-ties were measured and preliminary samples taken. Initial lithological and coral descriptions were conduct-ed by visual inspection through the liner and using core catcher materials. No further sampling, core splitting, or analysis work was undertaken offshore.
All cores and data were transferred to the IODP Core Repository at Bremen, Germany (BCR) at the end of the offshore phase. Prior to the start of the Onshore Science Party (OSP), additional thermal conductivity measure-ments and computed tomography (CT) scans were undertaken on selected whole core sections. All the cores were assessed for the presence of massive corals, so as to instruct the core splitting procedure used. The complete Science Party plus ESO and BCR personnel and student helpers met at the BCR on 2–16 July to split, analyze, and sample the cores according to stan-dard IODP procedures.
Sedimentology
Sedimentological investi-gation of the cores was con-ducted during both the off-shore and onshore phases of operations. Nine lithogical types were recognized, and their main characteristics and distributions as distinct lithostratigraphic units are shown in Figs. 4–7 and sum-marized below.
Modern or sub-recent deposits consisting of lime sand to pebbles, locally in a muddy matrix, cover the boundstone lithologies at the top of a number of holes. Pebbles are made up of coral-gal boundstone, coralline algae (some of them with reddish-pinkish color, indi-
1R2R
1X2X
1X2X3X4R5R6R7R8R9R
10R11R12R13R
1X
2R3R4R5R6R
150
140
130
120
110
100
90
80
70
60
50
40
Site 3
HoleM0051A
Site 4
HolesM0049A and M0049B
HoleM0050A
Landward Seaward
Coralgal boundstone
Coralgal-microbialite boundstone
Unconsolidated sediment
Dep
th (m
bsl)
78 m 4 m
Figure 6. Lithostratigraphic summary of holes on the Transect RIB-02 (Sites from landward to seaward; M0051A, M0049A, M0049B, and M0050A).
150
140
130
120
110
100
90
80
70
60
50
40
Site 2 Site 7
HoleM0057A
HolesM0054A and M0054B
Site 5
HoleM0056A
HoleM0055A
Landward Seaward
Site 6
HolesM0052A, M0052B, and M0052C
HoleM0053A
1R
2R
3R
4R
5R
6R
7R
8R9R
10R
11R
12R13R
14R
15R
16R1R
2R
3R
4R
5R
6R
7R
8R
9R
10R
11R12R
13R
14R15R
16R
1R2R
3R
4R
5R
6R
7R
8R
9R
10R
1X 1R
2R3R4R
1R2R
1X2R3R4R5R6R7R8R9R
10R11R12R13R14R15R16R17R18R19R20R21R22R23R24R25R26X27R28R29R30R31R32R33R
1R2R3R4R5R6R
1W
2W
3R4R
6R7R
8R
9R
10R
11R
12R
1130 m 69 m 193 m 6 m 68 m
5R
Modern
Coralgal boundstone
Coralgal-microbialite boundstone
Microbialite boundstone
Packstone
Grainstone
Rudstone
Lime sand
Mud
Unconsolidated sediment
Dep
th (m
bsl)
Figure 7. Lithostratigraphic summary of holes on the Transect NOG-01 (Sites from landward to seaward; M0057A, M0056A, M0055A, M0052A, M0052B, M0052C, M0053A, M0054A, and M0054B).
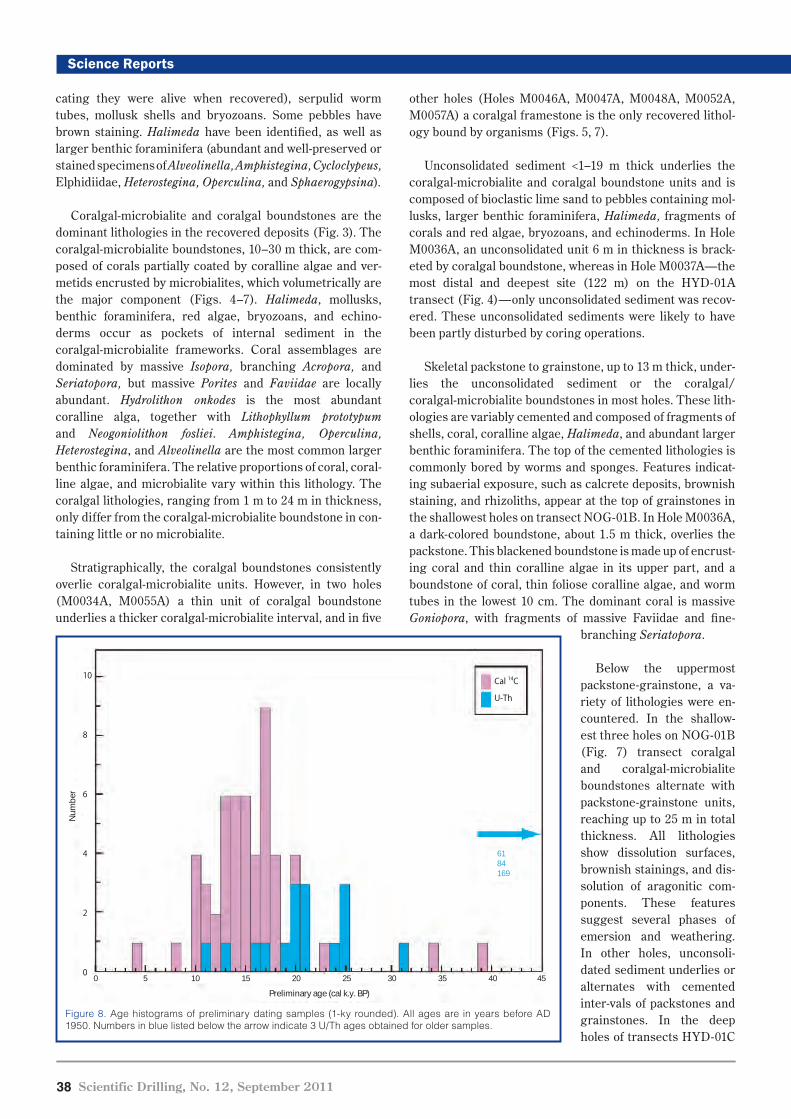
38 Scientific Drilling, No. 12, September 2011
Science Reports
cating they were alive when recovered), serpulid worm tubes, mollusk shells and bryozoans. Some pebbles have brown staining. Halimeda have been identified, as well as larger benthic foraminifera (abundant and well-preserved or stained specimens of Alveolinella, Amphistegina, Cycloclypeus, Elphidiidae, Heterostegina, Operculina, and Sphaerogypsina).
Coralgal-microbialite and coralgal boundstones are the dominant lithologies in the recovered deposits (Fig. 3). The coralgal-microbialite boundstones, 10–30 m thick, are com-posed of corals partially coated by coralline algae and ver-metids encrusted by microbialites, which volumetrically are the major component (Figs. 4–7). Halimeda, mollusks, benthic foraminifera, red algae, bryozoans, and echino-derms occur as pockets of internal sediment in the coralgal-microbialite frameworks. Coral assemblages are dominated by massive Isopora, branching Acropora, and Seriatopora, but massive Porites and Faviidae are locally abundant. Hydrolithon onkodes is the most abundant coralline alga, together with Lithophyllum prototypum and Neogoniolithon fosliei. Amphistegina, Operculina, Heterostegina, and Alveolinella are the most common larger benthic foraminifera. The relative proportions of coral, coral-line algae, and microbialite vary within this lithology. The coralgal lithologies, ranging from 1 m to 24 m in thickness, only differ from the coralgal-microbialite boundstone in con-taining little or no microbialite.
Stratigraphically, the coralgal boundstones consistently overlie coralgal-microbialite units. However, in two holes (M0034A, M0055A) a thin unit of coralgal boundstone underlies a thicker coralgal-microbialite interval, and in five
other holes (Holes M0046A, M0047A, M0048A, M0052A, M0057A) a coralgal framestone is the only recovered lithol-ogy bound by organisms (Figs. 5, 7).
Unconsolidated sediment <1–19 m thick underlies the coralgal-microbialite and coralgal boundstone units and is composed of bioclastic lime sand to pebbles containing mol-lusks, larger benthic foraminifera, Halimeda, fragments of corals and red algae, bryozoans, and echinoderms. In Hole M0036A, an unconsolidated unit 6 m in thickness is brack-eted by coralgal boundstone, whereas in Hole M0037A—the most distal and deepest site (122 m) on the HYD-01A transect (Fig. 4)—only unconsolidated sediment was recov-ered. These unconsolidated sediments were likely to have been partly disturbed by coring operations.
Skeletal packstone to grainstone, up to 13 m thick, under-lies the unconsolidated sediment or the coralgal/coralgal-microbialite boundstones in most holes. These lith-ologies are variably cemented and composed of fragments of shells, coral, coralline algae, Halimeda, and abundant larger benthic foraminifera. The top of the cemented lithologies is commonly bored by worms and sponges. Features indicat-ing subaerial exposure, such as calcrete deposits, brownish staining, and rhizoliths, appear at the top of grainstones in the shallowest holes on transect NOG-01B. In Hole M0036A, a dark-colored boundstone, about 1.5 m thick, overlies the packstone. This blackened boundstone is made up of encrust-ing coral and thin coralline algae in its upper part, and a boundstone of coral, thin foliose coralline algae, and worm tubes in the lowest 10 cm. The dominant coral is massive Goniopora, with fragments of massive Faviidae and fine-
branching Seriatopora.
Below the uppermost packstone-grainstone, a va-riety of lithologies were en-countered. In the shallow-est three holes on NOG-01B (Fig. 7) transect coralgal and coralgal-microbialite boundstones alternate with packstone-grainstone units, reaching up to 25 m in total thickness. All lithologies show dissolution surfaces, brownish stainings, and dis-solution of aragonitic com-ponents. These features suggest several phases of emersion and weathering. In other holes, unconsoli-dated sediment underlies or alternates with cemented inter-vals of packstones and grainstones. In the deep holes of transects HYD-01C
Figure 8. Age histograms of preliminary dating samples (1-ky rounded). All ages are in years before AD 1950. Numbers in blue listed below the arrow indicate 3 U/Th ages obtained for older samples.
Num
ber
Preliminary age (cal k.y. BP)
0 5 10 15 20 25 30 35 40 45
10
8
6
4
2
0
Cal 14C
U-Th
6184169
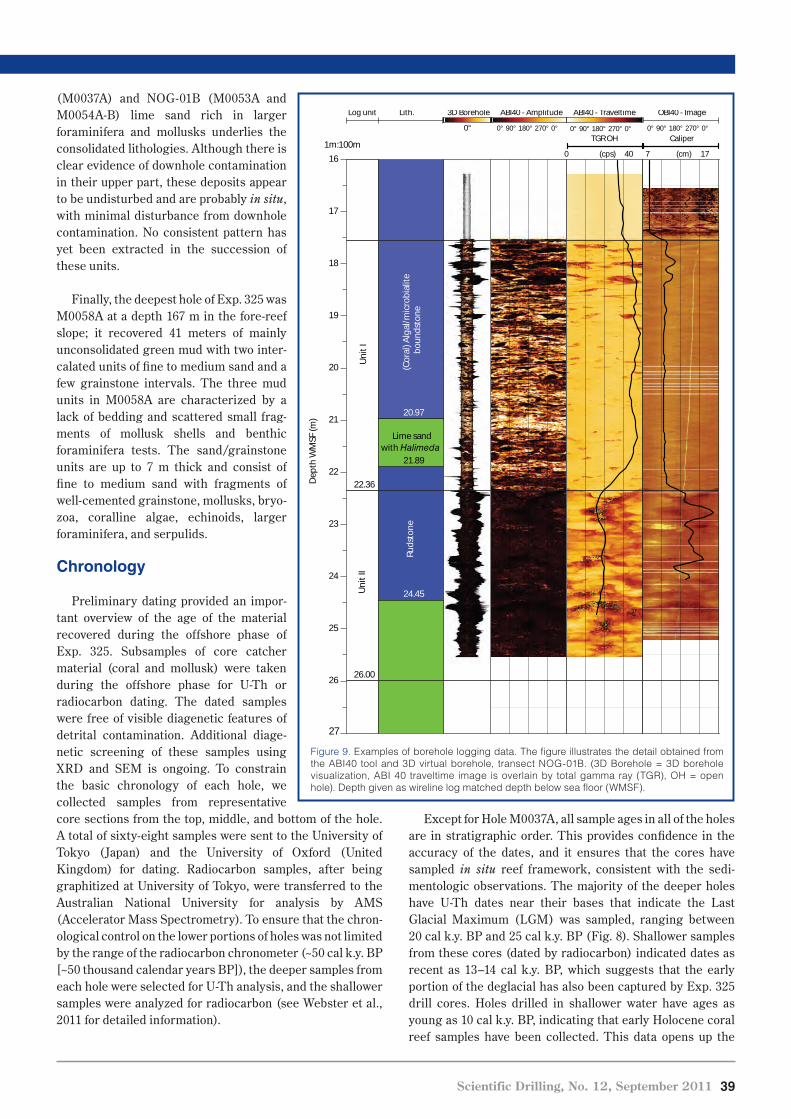
Scientific Drilling, No. 12, September 2011 39
Science Reports
Except for Hole M0037A, all sample ages in all of the holes are in stratigraphic order. This provides confidence in the accuracy of the dates, and it ensures that the cores have sampled in situ reef framework, consistent with the sedi-mentologic observations. The majority of the deeper holes have U-Th dates near their bases that indicate the Last Glacial Maximum (LGM) was sampled, ranging between 20 cal k.y. BP and 25 cal k.y. BP (Fig. 8). Shallower samples from these cores (dated by radiocarbon) indicated dates as recent as 13–14 cal k.y. BP, which suggests that the early portion of the deglacial has also been captured by Exp. 325 drill cores. Holes drilled in shallower water have ages as young as 10 cal k.y. BP, indicating that early Holocene coral reef samples have been collected. This data opens up the
(M0037A) and NOG-01B (M0053A and M0054A-B) lime sand rich in larger foraminifera and mollusks underlies the consolidated lithologies. Although there is clear evidence of downhole contamination in their upper part, these deposits appear to be undisturbed and are probably in situ, with minimal disturbance from downhole contamination. No consistent pattern has yet been extracted in the succession of these units.
Finally, the deepest hole of Exp. 325 was M0058A at a depth 167 m in the fore-reef slope; it recovered 41 meters of mainly unconsolidated green mud with two inter-calated units of fine to medium sand and a few grainstone intervals. The three mud units in M0058A are characterized by a lack of bedding and scattered small frag-ments of mollusk shells and benthic foraminifera tests. The sand/grainstone units are up to 7 m thick and consist of fine to medium sand with fragments of well-cemented grainstone, mollusks, bryo-zoa, coralline algae, echinoids, larger foraminifera, and serpulids.
Chronology
Preliminary dating provided an impor-tant overview of the age of the material recovered during the offshore phase of Exp. 325. Subsamples of core catcher material (coral and mollusk) were taken during the offshore phase for U-Th or radiocarbon dating. The dated samples were free of visible diagenetic features of detrital contamination. Additional diage-netic screening of these samples using XRD and SEM is ongoing. To constrain the basic chronology of each hole, we collected samples from representative core sections from the top, middle, and bottom of the hole. A total of sixty-eight samples were sent to the University of Tokyo (Japan) and the University of Oxford (United Kingdom) for dating. Radiocarbon samples, after being graphitized at University of Tokyo, were transferred to the Australian National University for analysis by AMS (Accelerator Mass Spectrometry). To ensure that the chron-ological control on the lower portions of holes was not limited by the range of the radiocarbon chronometer (~50 cal k.y. BP [~50 thousand calendar years BP]), the deeper samples from each hole were selected for U-Th analysis, and the shallower samples were analyzed for radiocarbon (see Webster et al., 2011 for detailed information).
Figure 9. Examples of borehole logging data. The figure illustrates the detail obtained from the ABI40 tool and 3D virtual borehole, transect NOG-01B. (3D Borehole = 3D borehole visualization, ABI 40 traveltime image is overlain by total gamma ray (TGR), OH = open hole). Depth given as wireline log matched depth below sea floor (WMSF).
ABI40 - Traveltime OBI40 - ImageABI40 - Amplitude
TGR OH
0 40(cps)
Caliper
7 17(cm)
Log unit 3D Borehole
0°
Lith.
0° 90° 180° 270° 0° 0° 90° 180° 270° 0° 0° 90° 180° 270° 0°
17
18
19
20
21
22
23
24
25
26
22.36
Uni
t I
26.00
Uni
t II
20.97(C
oral
) Alg
al/m
icro
bial
itebo
unds
tone
21.89
Lime sandwith Halimeda
24.45
Ruds
tone
16
27
Dep
th W
MSF
(m)
1m:100m
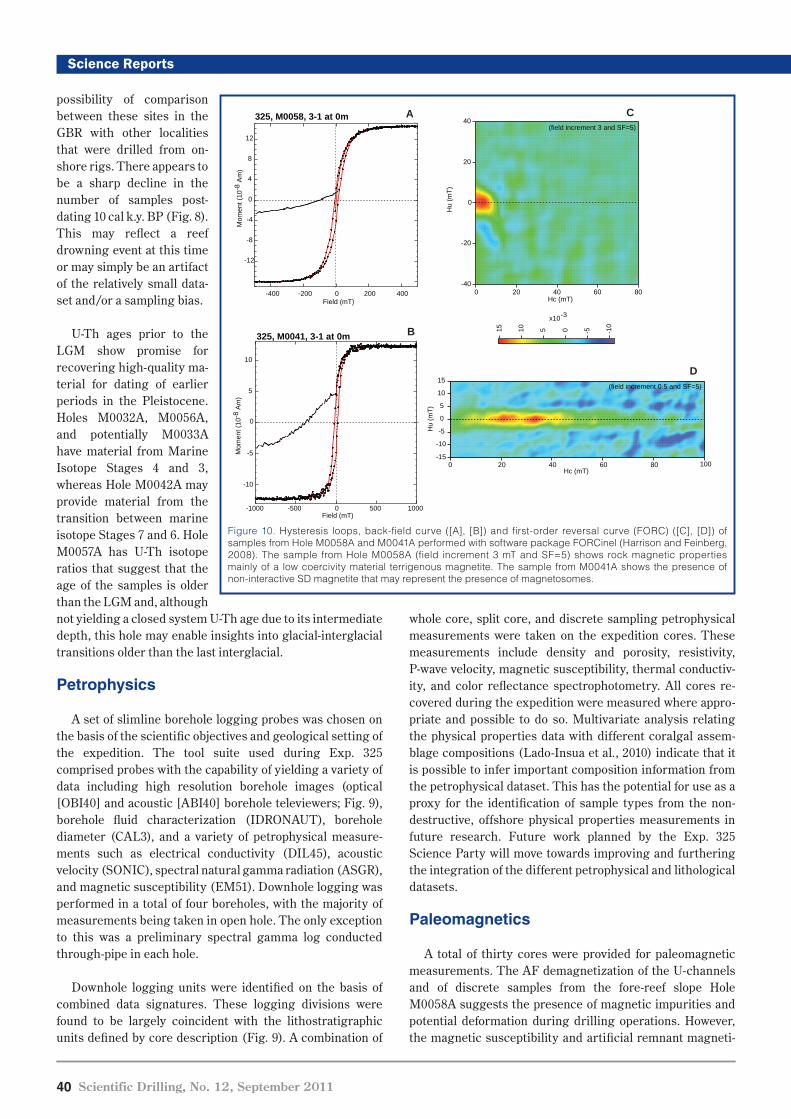
40 Scientific Drilling, No. 12, September 2011
Science Reports
possibility of comparison between these sites in the GBR with other localities that were drilled from on-shore rigs. There appears to be a sharp decline in the number of samples post-dating 10 cal k.y. BP (Fig. 8). This may reflect a reef drowning event at this time or may simply be an artifact of the relatively small data-set and/or a sampling bias.
U-Th ages prior to the LGM show promise for recovering high-quality ma-terial for dating of earlier periods in the Pleistocene. Holes M0032A, M0056A, and potentially M0033A have material from Marine Isotope Stages 4 and 3, whereas Hole M0042A may provide material from the transition between marine isotope Stages 7 and 6. Hole M0057A has U-Th isotope ratios that suggest that the age of the samples is older than the LGM and, although not yielding a closed system U-Th age due to its intermediate depth, this hole may enable insights into glacial-interglacial transitions older than the last interglacial.
Petrophysics
A set of slimline borehole logging probes was chosen on the basis of the scientific objectives and geological setting of the expedition. The tool suite used during Exp. 325 comprised probes with the capability of yielding a variety of data including high resolution borehole images (optical [OBI40] and acoustic [ABI40] borehole televiewers; Fig. 9), borehole fluid characterization (IDRONAUT), borehole diameter (CAL3), and a variety of petrophysical measure-ments such as electrical conductivity (DIL45), acoustic velocity (SONIC), spectral natural gamma radiation (ASGR), and magnetic susceptibility (EM51). Downhole logging was performed in a total of four boreholes, with the majority of measurements being taken in open hole. The only exception to this was a preliminary spectral gamma log conducted through-pipe in each hole.
Downhole logging units were identified on the basis of combined data signatures. These logging divisions were found to be largely coincident with the lithostratigraphic units defined by core description (Fig. 9). A combination of
whole core, split core, and discrete sampling petrophysical measurements were taken on the expedition cores. These measurements include density and porosity, resistivity, P-wave velocity, magnetic susceptibility, thermal conductiv-ity, and color reflectance spectrophotometry. All cores re-covered during the expedition were measured where appro-priate and possible to do so. Multivariate analysis relating the physical properties data with different coralgal assem-blage compositions (Lado-Insua et al., 2010) indicate that it is possible to infer important composition information from the petrophysical dataset. This has the potential for use as a proxy for the identification of sample types from the non-destructive, offshore physical properties measurements in future research. Future work planned by the Exp. 325 Science Party will move towards improving and furthering the integration of the different petrophysical and lithological datasets.
Paleomagnetics
A total of thirty cores were provided for paleomagnetic measurements. The AF demagnetization of the U-channels and of discrete samples from the fore-reef slope Hole M0058A suggests the presence of magnetic impurities and potential deformation during drilling operations. However, the magnetic susceptibility and artificial remnant magneti-
-12
-8
-4
0
4
8
12
-400 -200 0 200 400
325, M0058, 3-1 at 0m
Field (mT)
Mom
ent (
10-8
Am
)
a)
-10
-5
0
5
10
Mom
ent (
10-8
Am
)
-1000 -500 0 500 1000
-40
-20
0
20
40
)Tm( u
H
806040200Hc (mT)
15 10 5 0 -5 -10
x10-3
b)
c)
325, M0041, 3-1 at 0m
d)
-15
-10
-5
0
5
10
15
100806040200
)Tm( u
H
Hc (mT)
Field (mT)
(field increment 0.5 and SF=5)
(field increment 3 and SF=5)
A C
B
D
Figure 10. Hysteresis loops, back-field curve ([A], [B]) and first-order reversal curve (FORC) ([C], [D]) of samples from Hole M0058A and M0041A performed with software package FORCinel (Harrison and Feinberg, 2008). The sample from Hole M0058A (field increment 3 mT and SF=5) shows rock magnetic properties mainly of a low coercivity material terrigenous magnetite. The sample from M0041A shows the presence of non-interactive SD magnetite that may represent the presence of magnetosomes.

Scientific Drilling, No. 12, September 2011 41
Science Reports
zations such as anhysteretic (ARM), isothermal (IRM), and indirect parameters (ARM/IRM, S-ratio, and HIRM) show clear separations, with two horizons of high concentrations of a low coercivity magnetic mineral (Webster et al., 2011). Rock magnetic properties confirm that the magnetic car-rier is magnetite (Fig. 10a, 10c) with the two horizons char-acterized by a mixture of low and high-coercivity minerals. The magnetic horizons may correspond to two periods of higher terrigenous sediment input that likely correlate with the two sand/grainstone lithologic units observed in the core. While in the shelf edge fossil reef cores (e.g., M0041), a non-interactive single domain (SD) low coerci-vity mag-netic mineral (probably magnetite) was measured in discrete samples from fossil coral materials. We attribute that to the presence of magnetosomes of magnetotactic bacteria (Fig. 10b, 10d; Egli et al., 2010). Further studies of rock magnetic properties will provide more detailed infor-mation and help establish the nature of relationships bet-ween magnetic properties, coral formation, and climate change.
Geochemistry
A total of 115 interstitial water (IW) samples were acquired during Exp. 325, from transects of HYD-01C (16), HYD-02A (20), RIB-02A (2), and NOG-01B (77). (Numbers in parentheses indicate the number of samples obtained from each transect.) The majority of the IW samples was collected from the holes drilled into the carbonate reef com-plex of the GBR. The pH, alkalinity, and ammonium concen-trations of IW collected from the holes drilled into the car-bonate reef complex did not indicate any apparent depth-related or transect-specific variation, probably due to the scarcity of IW samples at each transect.
However, Hole M0058A (NOG-01B transect) consisted of fine to coarse sediments, unlike other holes, and there-fore continuous IW sampling was possible. While there was no systematic vertical variation in the pH, alkalinity, and
Figure 11. Porewater geochemistry data from Hole M0058A. Gray bars represent the two coarse sand/grainstone units
0
10
20
30
40
7.0 7.5 8.0pH
0 2 4 6Alkalinity (mM)
0 1 2NH4 (mM)
0 500Sr (mM)
Depth
(mbs
f)
250
Figure 12. Comparisons of preliminary dating results and previously published sea-level and climatological data. [A] Previously published data on relative sea level from 20 cal k. y. BP through present. MWP= meltwater pulse. [B] GISP2 δ18O proxy for temperature over Greenland. [C] Sea-surface temperature variation in the Western Pacific Warm Pool (WPWP) (Linsley et al., 2010). [D] Histogram showing preliminary dating results on core catcher samples. Age distribution clearly indicates that the recovered fossil coral reef cores cover key intervals of interest for sea-level changes and environmental reconstruction, including the last glacial maximum (LGM), Bölling-Alleröd (B/A), and Younger Dryas (YD). Sources of data: Tahiti = Bard et al., 1996, 2010; Huon Peninsula = Chappell and Polach, 1991; Edwards et al., 1993; Huon drill core = Cutler et al., 2003; Sunda shelf = Hanebuth et al., 2000; Barbados = Fairbanks, 1989; Bard et al., 1990; Bonaparte = Yokoyama et al., 2000b; 2001a; DeDeckker and Yokoyama, 2009. GISP2 = Stuiver and Grootes, 2000.
B/A
Age (cal. y BP)
0
2
4
6
8
10
Num
ber o
fpr
elim
inar
y ag
es
N = 61
LGM
10,000 20,0000
YD
5,000 15,000
120
100
80
60
40
20
0
-42
-40
-38
-36
-34
LGM
B/A
YD
MWP-1A
Dep
th (m
bsl)
GIS
P2 •
18 O (‰
VSM
OW
)
MWP-1B?
Key to relativesea-level dataTahitiBarbados
Huon PeninsulaHuon drill coreSunda shelf
-4
-3
-2
-1
0
1
Age (cal. y BP)
HoloceneClimatic Optimum
Medieval Warm Period
LGM
Indonesian and WPWP eight core compositeMakasar St. cores: 13GGC, 70GGC,MD62, and MD6Makassar St., southwest Sulawesi
A
B
19ka-MWP
Bonaparte
WPW
P SS
T (°
C)C
D
WP
WP
SS
T (
° C)
Dep
th (
mbs
l)
42 Scientific Drilling, No. 12, September 2011
Science Reports
chloride, the ammonia and strontium concentrations increased with depth (Fig. 11). The notable characteristic of IW from Hole M0058A is that two large anomalies occur coincident with the two sand/grainstone lithologic units, in the profiles for total iron and manganese concentrations. The percentage quartz profile of the sediments displayed the opposite trend to that of percentage carbonate. These litho-logic units also contain low total organic carbon con-tent, with an average value of 0.25%, compared to the rest of the core. Consistent with the paleomagnetic data, these fin-dings suggest that the two sand/grainstone units may corre-spond to the increased input of terrestrial material during their deposition. Further investigations are needed to fully understand the cause of lithologic changes found at Hole M0058A.
Microbiology
The subsurface microbial ecology will be characterized using multiple molecular based techniques. Fine grain sedi-ment cores collected from transect NOG-01B, Hole M0058A represent the bulk of microbiological sampling. Sediment was collected for cell enumeration and phylogenetic analysis during shipboard and onshore operations. Shipboard sam-ples were taken at multiple depths downcore, immediately frozen at -80°C for the duration of the cruise and then shipped on dry ice to labs in the United States (Texas A&M University) and China (China University of Geosciences). Onshore, sediment was collected from locations adjacent to the samples collected during the offshore phase. These samples are designed to test shifts in microbial community activity and structure during 4oC transit to, and storage in, Bremen, Germany against those samples collected immedi-ately after coring that were frozen offshore. Samples re- mained at 4°C for approximately three months prior to shore-based sampling. Microbial communities in both ship-board and onshore sediment samples will be described for total structure and function using DNA- and RNA-based molecular targets, respectively. For cell enumeration, on-shore sediment samples were preserved in 4% formaldehyde and stored at 4°C. By combining all microbial data, the total, potential, and active communities can be determined. The analysis will provide a unique advance in understanding sub-surface microbial ecology, as well as a description of poten-tial sediment composition and chemistry altering biological processes that may occur during standard IODP 4°C stor-age.
Concluding Remarks and Future Plans
During the course of IODP Expedition 325 offshore phase, thirty-four holes were drilled, obtaining 225 meters of core materials from water depths ranging from 42 mbsl to 167 mbsl (Fig. 12). The preliminary chronology of core catcher materials dated by both radiocarbon and U-series methods prior to the OSP provided a firm chronological framework for conducting further scientific analyses.
Fulfillment of the Exp. 325 scientific objectives can be seen as follows:
1. Reconstruct the course of postglacial sea-level change in GBR from 20 ka to 10 ka. Coral-algal-microbialite lithologies of in situ and robust Isopora and Acropora assemblages are indicative of very shallow reef envi-ronments. They will contribute to the reconstruction of a robust sea-level curve from the LGM to 10 ka.
2. Establish sea-surface variations in the GBR from 20 ka to 10 ka. preliminary chronologic results clearly show that important coral reef deposits were recovered con-sisting of key paleoenvironmental intervals including LGM, Bölling-Alleröd, Younger Dryas, and Heinrich events. Massive coral colonies suitable for paleocli-mate studies will help define SST variations and aid paleoceanographic reconstruction for the region.
3. Investigate the response of the GBR to environmental changes caused by sea-level and climate changes. Cores were recovered from various locations and water depths along the GBR. Their large geographical spread and shelf edge position will allow the results to be interpreted in both a broad temporal and spatial context, allowing a better understanding of the devel-opment of the GBR in response to environmental changes.
In addition to the main scientific outcomes summarized above, we expect three additional scientific outcomes will be achieved.
1. It is believed that sea-level and paleoclimate informa-tion can be extended back to the LGM and pre-LGM periods based on the preliminary age determinations. This will enable a reconstruction of the evolution of the GBR during these earlier periods.
2. High-resolution paleoenvironmental information obtained from a nearly continuous 41-m sediment core in the fore-reef slope of Noggin Pass (M0058A) will complement the sea-level and paleoenvironmental records obtained from reef cores recovered from shal-lower shelf sites.
3. The microbial community structure and function will also be assessed within the Hole M0058 sediments using direct count microscopy and RNA/DNA gene targets. Correlations will be made between offshore and onshore geochemical characterizations in order to better describe the subsurface biosphere ecology.
Future work will now focus on more detailed sedimento-logical, petrophysical, geochemical, and geophysical investi-gations in the various laboratories of the IODP Exp. 325 Science Party members. The results obtained from these
Scientific Drilling, No. 12, September 2011 43
Science Reports
studies will improve our understanding of sea-level and cli-mate change as well as coral reef response since the LGM.
Acknowledgements
We are grateful to Great Barrier Reef Marine Park Authority (GBRMPA), to the captains and crew of the RV Great Ship Maya, to Dan Evans, David Smith, Colin Graham, David McInroy, Dave Wallis, Graham Tulloch, Lee Baines, Mary Mowat, Martin Kölling, Richard le Provost, Jan Hoffman, Simon Barry and the rest of the ESO support staff of the mission-specific operations for ECORD, and to Ursula Röhl, Holger Kuhlmann, Alex Wülbers and the BCR staff in Bremen. Without these individuals and the many others left unnamed, the Great Barrier Reef Coral Reef operations would not have been possible. The work presented here was partly supported by JSPS (NEXT program GR031), GCOE, and the Australian Research Council (DP109400).
IODP Expedition 325 Scientists
Y. Yokoyama (Co-Chief Scientist), J. M. Webster (Co-Chief Scientist), C. Cotterill (Staff Scientist), L. Anderson, S. Green, R. Bourillot, J.C. Braga, A. Droxler, T.M. Esat, T. Felis, K. Fujita, M. Gagan, E. Gischler, E. Herrero-Bervera, J. Hongchen, M. Humblet, M. Inoue, T. Lado Insua, Y. Iryu, L. Jovane, H. Kan, B. Linsley, D. Loggia, H. Mills, D. Potts, C. Seard, A. Suzuki, A. Thomas, W. Thompson, M. Tiwari, and A. Tudhope.
References
Abbey, E., Webster, J.M., and Beaman, R., submitted. Morphology
and origin of submerged features along the shelf edge of the
Great Barrier Reef, Australia. Mar. Geol.
Abbey, E.A., and Webster, J.M., 2011. Submerged reefs. In Hopley, D.
(Ed.), Encyclopaedia of Modern Coral Reefs: New York
(Springer-Verlag), 1236.
Abram, N., Gagan, M.K., Cole, J.E., Hantoro, W., and Mudelsee, M.,
2008. Coral evidence for a recent intensification of the
Indian Ocean Dipole. Nature Geosci., 1:849–853,
doi:10.1038/ngeo357.
Alexander, I., Wilson, P.A., Cooper, M.J., and International
Consortium Great Barrier Reef Drilling, 2001. New con-
straints on the origin of the Australian Great Barrier Reef:
Results from an international project of deep coring.
Geology, 29(6):483–486, doi:10.1130/0091-7613(2001)029
<0483:NCOTOO>2.0.CO;2.
Alley, R.B., 1998. Palaeoclimatology-Icing the north Atlantic. Nature,
392(6674):335, doi:10.1038/32781.
Asami, R., Felis, T., Deschamps, P., Hanawa, K., Iryu, Y., Bard,
E., Durand, N., and Murayama, M., 2009. Evidence for tropi-
cal South Pacific climate change during the Younger Dryas
and the Bølling-Allerød from geochemical records of fossil
Tahiti corals. Earth Planet. Sci. Lett., 288:96–107,
doi:10.1016/j.epsl.2009.09.011.
Bard, E., Hamelin, B., and Delanghe-Sabatier, D., 2010. Deglacial
Meltwater Pulse 1B and younger Dryas sea levels revisited
with boreholes at Tathiti. Nature, 327:1235–1237.
Bard, E., Hamelin, B., and Fairbanks, R.G., 1990. U-Th ages obtained
by mass spectrometry in corals from Barbados: Sea level
during the past 130,000 years. Nature, 346:456–458,
doi:10.1038/346456a0.
Bard, E., Hamelin, B., Arnold, M., Montaggioni, L.F., Cabioch, G.,
Faure, G., and Rougerie, F., 1996. Deglacial sea-level record
from Tahiti corals and the timing of global meltwater dis-
charge. Nature, 382:241–244, doi:10.1038/382241a0.
Bridge, T.C.L., Done, T.J., Beaman, R.J., Friedman, A., Williams,
S.B., Pizarro, O., and Webster, J.M., 2011. Topography, sub-
stratum and benthic macrofaunal relationships on a tropical
mesophotic shelf margin, central Great Barrier Reef,
Australia. Coral Reefs, 30:143–153, doi:10.1007/s00338-
010-0677-3.
Broecker, W.S., 1994. Massive iceberg discharges as triggers for
global climate change. Nature, 372:421–424, doi:10.1038/
372421a0.
Camoin, G., Seard, C., Deschamps, P., Webster, J., Abbey, E., Braga,
J.-C., Iryu, Y., Durand, N., Bard, E., Hamelin, B., Yokoyama,
Y., and Thomas, A., 2010. Reef response to sea-level and
environmental changes during the last deglaciation. IODP
Expedition 310 “Tahiti Sea Level”. Geophys. Res. Abstr.,
EGU2010-14988.
Camoin, G.F., Iryu, Y., McInroy, D.B., and the IODP Expedition 310
Scientists, 2007. IODP Expedition 310 reconstructs sea
level, climatic, and environmental changes in the South
Pacific during the last degraciation. Sci. Drill., 5:4–12,
doi:10.2204 /iodp.sd.5.01.2007.
Chappell, J., and Polach, H., 1991. Post-glacial sea-level rise from a
coral record at Huon Peninsula, Papua New Guinea. Nature,
349:147–149, doi:10.1038/349147a0.
Clark, P.U., Archer, D., Pollard, D., Blum, J.D., Rial, J.A., Brovkin, V.,
Mix, A.C., Pisias, N.G., and Roy, M., 2006. The middle
Pleistocene transition: Characteristics, mechanisms, and
implications for long-term changes in atmospheric pCO2.
Quat. Sci. Rev., 25:3150–3184, doi:10.1016/j.quascirev.
2006.07.008.
Clark, P.U., Dyke, A.S., Shakun, J.D., Carlson, A.E., Clark, J.,
Wohlfarth, B., Mitrovica, J.X., Hostetler, S.W., and McCabe,
A.M., 2009. The last glacial maximum. Science, 325:710–
714, doi:10.1126/science.1172873.
CLIMAP, 1981. Seasonal reconstruction of the Earth’s surface at the
last glacial maximum. Geological Society of America, Map
and Chart Series, C36.
Cole, J.E., Dunbar, R.B., McClanahan, T.R., and Muthiga, N., 2000.
Tropical Pacific forcing of decadal SST variability in the
western Indian Ocean over the past two centuries. Science,
287:617–619, doi:10.1126/science.287.5453.617.
Cutler, K.B., Edwards, R.L., Taylor, F.W., Cheng, H., Adkins, J.,
Gallup, C.D., Cutler, P.M, Burr, G.S., and Bloom, A.L., 2003.
Rapid sea-level fall and deep ocean temperature change
since the last interglacial period. Earth Planet. Sci. Lett.,
206(3–4):253–271, doi:10.1016/S0012-821X(02)01107-X.
Davies, P.J., Symonds, P.A., Feary, D.A., and Pigram, C.J., 1989. The
44 Scientific Drilling, No. 12, September 2011
Science Reports
evolution of the carbonate platforms of northeast Australia,
controls on carbonate platform and basin development.
Society of Economic Paleontologists and Mineralogists Special
Publication, 44:233–258.
DeDeckker, P., and Yokoyama, Y., 2009. Micropalaeontological evi-
dence for Late Quaternary sea-level changes in Bonaparte
Gulf, Australia. Global Planet. Change, 66:85–92,
doi:10.1016/j.gloplacha.2008.03.012.
DeLong, K., Quinn, T.M., Shen, C.C., and Lin, K., 2010. A snapshot
of climate variability at Tahiti 9.5 ka using a fossil coral
from IODP Expedition 310. Geochem. Geophys. Geosyst.,
11:Q06005, doi:10.1029/2009GC002758.
Denton, G.H., and Hughes, T.J., 1981. The Last Great Ice Sheets: New
York (John Wiley and Sons).
Deschamps, P., Durand, N., Bard, E., Hamelin, B., Camoin, G.,
Thomas, A.L., Henderson, G.M., and Yokoyama, Y., 2009.
Synchroneity of Meltwater Pulse 1A and the Bolling onset:
New evidence from the IODP “Tahiti Sea-Level” Expedition.
Geophys. Res. Abstr., 11(EGU2009-10233).
Edwards, R.L., Beck, J.W., Burr, G.S., Donahue, D.J., Chappell,
J.M.A., Bloom, A.L., Druffel, E.R.M., and Taylor, F.W., 1993.
A large drop in atmospheric 14C/12C and reduced melting
in the Younger Dryas, documented with 230Th ages of
corals. Science, 260:962–968, doi:10.1126/science.260.
5110.962.
Edwards, R.L., Chen, J.H., and Wasserburg, G.J., 1987. 238U-234U-230Th-232Th systematics and the precise measurement of
time over the past 500,000 years. Earth Planet. Sci. Lett.,
81:175–192, doi:10.1016/0012-821X(87)90154-3.
Egli, R., Chen, A.P., Winklhofer, M., Kodama, K.P., and Horng, C.-S.,
2010. Detection of noninteracting single domain particles
using first-order reversal curve diagrams. Geochem.
Geophys. Geosyst., 11, Q01Z11, doi:10.1029/2009GC002916.
Esat, T.M., and Yokoyama, Y., 2008. Issues in radiocarbon and
U-series dating of corals from the last glacial period. Quat.
Geochronol., 3:244–252, doi:10.1016/j.quageo.2007.11.004.
Fairbanks, R.G., 1989. A 17,000-year glacio-eustatic sea level record:
Influence of glacial melting dates on Younger Dryas event
and deep ocean circulation. Nature, 342:637–642,
doi:10.1038/342637a0.
Fairbanks, R.G., Mortlock, R.A., Chiu, T.-C., Cao, L., Kaplan, A.,
Guilderson, T.P., Fairbanks, T.W., Bloom, A.L., Grootes,
P.M., and Nadeau, M.-J., 2005. Radiocarbon calibration
curve spanning 0 to 50,000 years BP based on paired 230Th/ 234U/238U and 14C dates on pristine corals. Quat. Sci. Rev.,
24:1781–1796, doi:10.1016/j.quascirev.2005.04.007.
Felis, T., Suzuki, A., Kuhnert, H., Dima, M., Lohmann, G., and
Kawahata, H., 2009. Subtropical coral reveals abrupt early-
twentieth-century freshening in the western North Pacific
Ocean. Geology, 37:527–530, doi:10.1130/G25581A.1.
Fujita, K., Omori, A., Yokoyama, Y., Sakai, S., and Iryu, Y., 2010. Sea-
level rise during Termination II inferred from large benthic
foraminifers: IODP Expedition 310, Tahiti Sea Level. Mar.
Geol., 271:149–155, doi:10.1016/j.margeo.2010.01.019.
Gagan, M.K., Ayliffe, L.K., Hopley, D., Cali, J.A., Mortimer, G.E.,
Chappell, J., McCulloch, M.T., and Head, M.J., 1998.
Temperature and surface-ocean water balance of the mid-
Holocene tropiacl western Paficic. Science, 279:1014–1018,
doi:10.1126/science.279.5353.1014.
Gallup, C.D., Cheng, H., Taylor, F.W., and Edwards, R.L., 2002. Direct
determination of the timing of sea level change during
Termination II. Science, 295:310–313, doi:10.1126/
science.1065494.
Hanebuth, T., Stattegger, K., and Grootes, P.M., 2000. Rapid flooding
of the Sunda Shelf: A late-glacial sea-level record. Science,
288:1033–1035, doi:10.1126/science.288.5468.1033.
Harrison, R.J., and Feinberg, J.M., 2008. FORCinel: An improved
algorithm for calculating first-order reversal curve distri-
butions using locally weighted regression smoothing,
Geochem. Geophys. Geosyst., 9, Q05016, doi:10.1029/
2008GC001987.
Hays, J.D., Imbrie, J., and Shackelton, N.J., 1976. Variations in the
Earth’s orbit: Pacemaker of the Ice Ages. Science, 194:1121–
1132, doi:10.1126/science.194.4270.1121.
Inoue, M., Yokoyama, Y., Harada, M., Suzuki, A., Kawahata, H.,
Matsuzaki, H., and Iryu, Y., 2010. Trace element variations
in fossil corals from Tahiti collected by IODP Expedition
310: Reconstruction of marine environments during the
last deglaciation (15 to 9 ka). Mar. Geol., 271:303–306,
doi:10.1016/j.margeo.2010.02.016.
Ivins, E.R., and James, T.S., 2005. Antarctic glacial isostatic adjust-
ment: A new assessment. Antarct. Sci., 17:537-549,
doi:10.1017/S0954102005002968.
Lado-Insua, T., Moran, K., Anderson, L., Webster, J.M., Morgan, S.,
Fehr, A., Lofi, J., Lukies, V., Loggia, D., and IODP Expedition
325 Scientists, 2010. Are physical properties able to
differentiate glacial and interglacial coral identity?
[American Geophysical Union, Fall Meeting, San Francisco,
13–17 December 2010] Abstract PP11E-1476.
Lambeck, K., Yokoyama, Y., and Purcel, A., 2002. Into and out of the
Last Glacial Maximum: Sea-level change during oxygen iso-
tope stages 3 and 2. Quat. Sci. Rev., 21:343–360, doi:10.1016/
S0277-3791(01)00071-3.
Linsley, B.K., Rosenthal, Y., and Oppo, D.W., 2010. Holocene evolution
of the Indonesian throughflow and the western Pacific
warm pool. Nature Geosci., 3(8):578–583, doi:10.1038/
ngeo920.
Milne, G.A., Gehrels, W.R., Hughes, C.W., and Tamisiea, M.E., 2009.
Identifying the causes of sea-level change. Nature Geosci.,
2:471–478, doi:10.1038/ngeo544.
Mix, A.C., Bard, E., and Schneider, R., 2001. Environmental proc-
esses of the ice age: Land, oceans, glaciers (EPILOG).
Quat. Sci. Rev., 20:627–657, doi:10.1016/S0277-3791
(00)00145-1.
Nakada, M., and Lambeck, K., 1987. Glacial rebound and relative sea-
level variations: A new appraisal. Geophys. J. Roy. Astr. Soc.,
90:171–224.
Reimer, P.J., Baillie, M.G.L., Bard, E., Bayliss, A., Beck, J.W.,
Bertrand, C.J.H., Blackwell, P.G., Buck, C.E., Burr, G.S.,
Cutler, K.B., Damon, P.E., Edwards, R.L., Fairbanks, R.G.,
Friedrich, M., Guilderson, T.P., Hogg, A.G., Hughen, K.A.,
Kromer, B., McCormac, G., Manning, S., Ramsey, C.B.,
Reimer, R.W., Remmele, S., Southon, J.R., Steiver, M.,
Talamo, S., Taylor, F.W., van der Plicht, J., and Weyhenmeyer,
Scientific Drilling, No. 12, September 2011 45
Science Reports
C.E., 2004. Intcal04 terrestrial radiocarbon age calibration,
0-26 cal kyr BP. Radiocarbon, 46:1029–1058.
Seard, C., Camoin, G., Yokoyama, Y., Matsuzaki, H., Durand, N.,
Bard, E., Sepulcre, S., and Deschamps, P., 2011. Microbialite
development patterns in the last deglacial reefs from Tahiti
(French Polynesia; IODP Expedition #310): Implications on
reef framework architecture. Mar. Geol., 279:63–86,
doi:10.1016/j.margeo.2010.10.013.
Solomon, S., Qin, D., Manning, M., Chen, Z., Marquis, M., Averyt,
K.B., Tignor, M., and Miller, H.L., 2007. Climate Change
2007 - The Physical Science Basis. Contribution of Working
Group I to the Fourth Assessment Report of the
Intergovernmental Panel on Climate Change: U.K. and New
York (Cambridge University Press).
Stirling, C.H., and Andersen, M.B., 2009. Uranium-series dating of
fossil coral reefs: Extending the sea-level record beyond the
last glacial cycle. Earth Planet. Sci. Lett., 284:269–283,
doi:10.1016/j.epsl.2009.04.045.
Stirling, C.H., Esat, T.M., McCulloch, M.T., and Lambeck, K., 1995.
High-precision U-series dating of corals from Western
Australia and implications for the timing and duration of the
Last Interglacial. Earth Planet. Sci. Lett., 135:115–130.
Stuiver, M., and Grootes, P.M., 2000. GISP2 oxygen isotope ratios.
Quat. Res., 53:277–283, doi:10.1006/qres.2000.2127.
Thomas, A.L., Henderson, G., Deschamps, P., Yokoyama, Y., Mason,
A.J., Bard, E., Hamelin, B., Durand, N., and Camoin, G.,
2009. Penultimate deglacial sea level timing from uranium/
thorium dating of Tahitian corals. Science, 324:1186–1189,
doi:10.1126/science.1168754.
Tudhope, A.W., Chilcott, C.P., McCulloch, M.T., Cook, E.R., Chappell,
J., Ellan, R.M., Lea, D.W., Lough, J.M., and Shimmield,
G.B., 2001. Variability in the El Niño-Southern Oscillation
through a glacial-interglacial cycle. Science, 291(5508):1511–
1517, doi:10.1126/science.1057969.
Webster, J.M., and Davies, P.J., 2003. Coral variation in two deep drill
cores: Significance for the Pleistocene development of the
Great Barrier Reef. Sediment. Geol., 159:61–80, doi:10.1016/
S0037-0738(03)00095-2.
Webster, J.M., Davies, P.J., Beaman, R.J., Williams, S., and Byrne, M.,
2008. Evolution of drowned shelf edge reefs in the GBR;
implications for understanding abrupt climate change, coral
reef response and modern deep water benthic habitats.
CSIRO Marine National Facility, RV Southern Surveyor voy-
age summary SS07/2007. http://www.marine.csiro.au/
nationalfacility/voyagedocs/2007/summarySS07-2007.pdf.
Webster, J.M., Yokoyama, Y., Cotterill, C., and the Expedition 325
Scientists, 2011. IODP Expedition 325. Proc. IODP, 325:
Washington, DC (Integrated Ocean Drilling Program
Management International, Inc.). doi:10.2204/iodp.
proc.325.106.2011.
Yokoyama, Y., 2011a. Last glacial interstadials. In Hopley, D. (Ed.),
Encyclopaedia of Modern Coral Reefs. New York (Springer-
Verlag), 1236.
Yokoyama, Y., 2011b. Last glacial lowstand and shelf exposure. In
Hopley, D. (Ed.) Encyclopaedia of Modern Coral Reefs. New
York (Springer-Verlag), 1236.
Yokoyama, Y., and Esat, T.M., 2011. Global climate and sea level:
Enduring variability and rapid fluctuations over the past
150,000 years. Oceanography, 24:54–67, doi:10.5670/
oceanog.2011.27.
Yokoyama, Y., DeDeckker, P., Lambeck, K., Johnston, P., and Fifield,
L.K., 2001a. Sea-level at the last glacial maximum: Evidence
from northwestern Australia to constrain ice volumes for
oxygen isotope stage 2. Palaeogeogr. Palaeoclim. Palaeoecol.,
165:281–297, doi:10.1016/S0031-0182(00)00164-4.
Yokoyama, Y., Esat, T.M., Lambeck, K., and Fifield, L.K., 2000a. Last
ice age millennial scale climate changes recorded in Huon
Peninsula corals. Radiocarbon, 42:383–401.
Yokoyama, Y., Lambeck, K., DeDeckker, P., Johnston, P., and Fifield,
L.K., 2000b. Timing of the Last Glacial Maximum from
observed sea-level minima. Nature, 406:713–716,
doi:10.1038/35021035.
Yokoyama, Y., Purcell, A., Lambeck, K., and Johnston, P., 2001b.
Shore-line reconstruction around Australia during the Last
Glacial Maximum and Late Glacial Stage. Quat. Int.,
83–85:9–18, doi:10.1016/S1040-6182(01)00028-3.
Yokoyama, Y., Purcell, A., Marshall, J.F., and Lambeck, K., 2006. Sea-
level during the early deglaciation period in the Great
Barrier Reef, Australia. Global Planet. Change, 53:147–153,
doi:10.1016/j.gloplacha.2006.01.014.
Authors
Yusuke Yokoyama, Atmosphere and Ocean Research Institute, University of Tokyo, 5-1-5 Kashiwanoha, Kashiwa, Chiba 277-8564 Japan, e-mail: [email protected] M. Webster, Geocoastal Reseach Group, School of Geosciences, The University of Sydney, Sydney, NSW 2006, Australia.Carol Cotterill, British Geological Survey, Murchison House, Edinburgh, Scotland, EH9 3LA, U.K.Juan Carlos Braga, Departamento de Estratigrafia y Paleontologia, Facultad de Ciencias, Universidad de Granada, Campus Fuentenueva, 18002 Granada, Spain.Luigi Jovane, Geology Department, Western Washington University, 516 High Street, MS 908, Bellingham, WA 98225, U.S.A.Heath Mills, Department of Oceanography, Texas A&M University, 716A Eller, O&M Building, College Station, TX 77843, U.S.A.Sally Morgan, University of Leicester, Department of Geology, University Road, Leicester, LE1 7RH, U.K.Atsushi Suzuki, Geological Survey of Japan, National Institute of Advanced Industrial Science and Technology (AIST), AIST Tsukuba Central 7, 1-1-1 Higashi, Tsukuba, Ibaraki 305-8567, Japan.and the IODP Expedition 325 Scientists
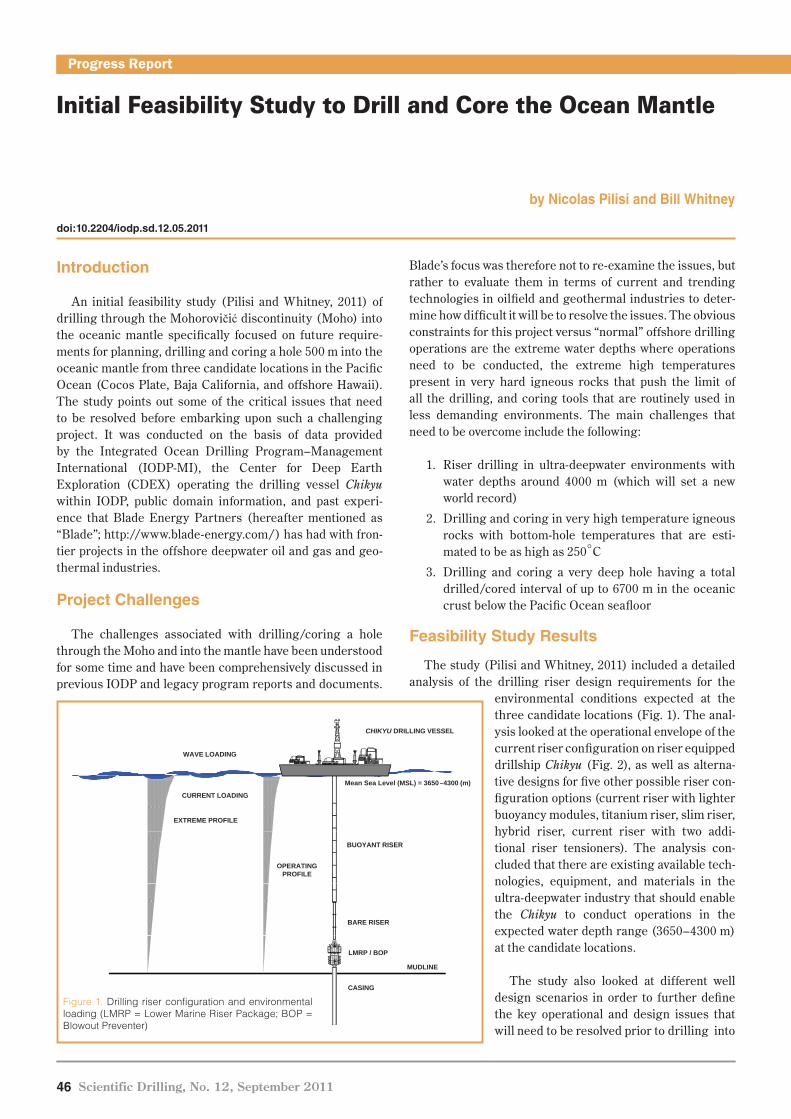
Progress Reports
Initial Feasibility Study to Drill and Core the Ocean Mantle
by Nicolas Pilisi and Bill Whitney
doi:10.2204/iodp.sd.12.05.2011
46 Scientific Drilling, No. 12, September 2011
Progress Reports
Introduction
An initial feasibility study (Pilisi and Whitney, 2011) of drilling through the Mohorovičić discontinuity (Moho) into the oceanic mantle specifically focused on future require-ments for planning, drilling and coring a hole 500 m into the oceanic mantle from three candidate locations in the Pacific Ocean (Cocos Plate, Baja California, and offshore Hawaii). The study points out some of the critical issues that need to be resolved before embarking upon such a challenging project. It was conducted on the basis of data provided by the Integrated Ocean Drilling Program–Management International (IODP-MI), the Center for Deep Earth Exploration (CDEX) operating the drilling vessel Chikyu within IODP, public domain information, and past experi-ence that Blade Energy Partners (hereafter mentioned as “Blade”; http://www.blade-energy.com/) has had with fron-tier projects in the offshore deepwater oil and gas and geo-thermal industries.
Project Challenges
The challenges associated with drilling/coring a hole through the Moho and into the mantle have been understood for some time and have been comprehensively discussed in previous IODP and legacy program reports and documents.
Blade’s focus was therefore not to re-examine the issues, but rather to evaluate them in terms of current and trending technologies in oilfield and geothermal industries to deter-mine how difficult it will be to resolve the issues. The obvious constraints for this project versus “normal” offshore drilling operations are the extreme water depths where operations need to be conducted, the extreme high temperatures present in very hard igneous rocks that push the limit of all the drilling, and coring tools that are routinely used in less demanding environments. The main challenges that need to be overcome include the following:
1. Riser drilling in ultra-deepwater environments with water depths around 4000 m (which will set a new world record)
2. Drilling and coring in very high temperature igneous rocks with bottom-hole temperatures that are esti-mated to be as high as 250°C
3. Drilling and coring a very deep hole having a total drilled/cored interval of up to 6700 m in the oceanic crust below the Pacific Ocean seafloor
Feasibility Study Results
The study (Pilisi and Whitney, 2011) included a detailed analysis of the drilling riser design requirements for the
environmental conditions expected at the three candidate locations (Fig. 1). The anal-ysis looked at the operational envelope of the current riser configuration on riser equipped drillship Chikyu (Fig. 2), as well as alterna-tive designs for five other possible riser con-figuration options (current riser with lighter buoyancy modules, titanium riser, slim riser, hybrid riser, current riser with two addi-tional riser tensioners). The analysis con-cluded that there are existing available tech-nologies, equipment, and materials in the ultra-deepwater industry that should enable the Chikyu to conduct operations in the expected water depth range (3650–4300 m) at the candidate locations.
The study also looked at different well design scenarios in order to further define the key operational and design issues that will need to be resolved prior to drilling into
Progress Report
WAVE LOADING
CHIKYU DRILLING VESSEL
Mean Sea Level (MSL) = 3650–4300 (m)
EXTREME PROFILE
CURRENT LOADING
BUOYANT RISER
OPERATINGPROFILE
BARE RISER
CASING
LMRP / BOP
MUDLINE
CASING
Figure 1. Drilling riser configuration and environmental loading (LMRP = Lower Marine Riser Package; BOP = Blowout Preventer)
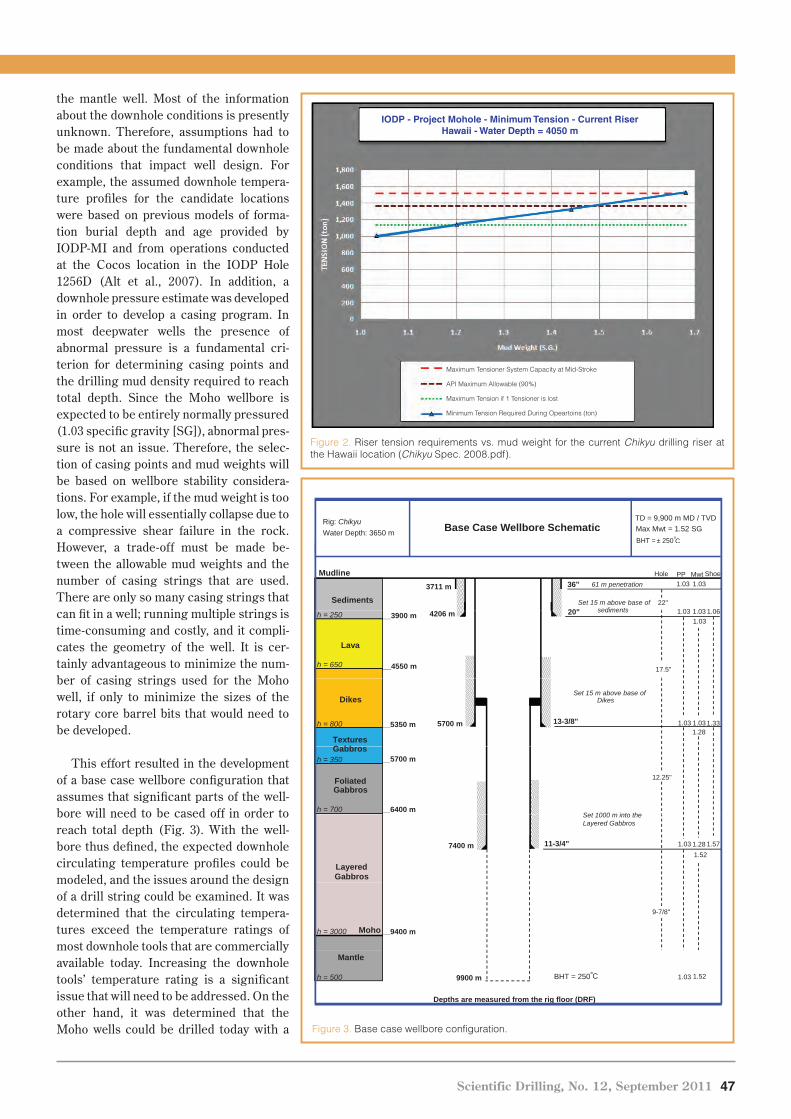
Scientific Drilling, No. 12, September 2011 47
Progress ReportsProgress Reports
the mantle well. Most of the information about the downhole conditions is presently unknown. Therefore, assumptions had to be made about the fundamental downhole conditions that impact well design. For example, the assumed downhole tempera-ture profiles for the candidate locations were based on previous models of forma-tion burial depth and age provided by IODP-MI and from operations conducted at the Cocos location in the IODP Hole 1256D (Alt et al., 2007). In addition, a downhole pressure estimate was developed in order to develop a casing program. In most deepwater wells the presence of abnormal pressure is a fundamental cri-terion for determining casing points and the drilling mud density required to reach total depth. Since the Moho wellbore is expected to be entirely normally pressured (1.03 specific gravity [SG]), abnormal pres-sure is not an issue. Therefore, the selec-tion of casing points and mud weights will be based on wellbore stability considera-tions. For example, if the mud weight is too low, the hole will essentially collapse due to a compressive shear failure in the rock. However, a trade-off must be made be-tween the allowable mud weights and the number of casing strings that are used. There are only so many casing strings that can fit in a well; running multiple strings is time-consuming and costly, and it compli-cates the geometry of the well. It is cer-tainly advantageous to minimize the num-ber of casing strings used for the Moho well, if only to minimize the sizes of the rotary core barrel bits that would need to be developed.
This effort resulted in the development of a base case wellbore configuration that assumes that significant parts of the well-bore will need to be cased off in order to reach total depth (Fig. 3). With the well-bore thus defined, the expected downhole circulating temperature profiles could be modeled, and the issues around the design of a drill string could be examined. It was determined that the circulating tempera-tures exceed the temperature ratings of most downhole tools that are commercially available today. Increasing the downhole tools’ temperature rating is a significant issue that will need to be addressed. On the other hand, it was determined that the Moho wells could be drilled today with a
Figure 2. Riser tension requirements vs. mud weight for the current Chikyu drilling riser at the Hawaii location (Chikyu Spec. 2008.pdf).
IODP - Project Mohole - Minimum Tension - Current RiserHawaii - Water Depth = 4050 m
Maximum Tensioner System Capacity at Mid-Stroke
API Maximum Allowable (90%)
Maximum Tension if 1 Tensioner is lost
Minimum Tension Required During Opeartoins (ton)
Figure 3. Base case wellbore configuration.
Base Case Wellbore SchematicRig: ChikyuWater Depth: 3650 m
TD = 9,900 m MD / TVDMax Mwt = 1.52 SGBHT = ± 250°CBase Case Wellbore Schematic
Sediments
ShoeMwtHole PP36"
22"
1.031.033711 m 61 m penetration
Set 15 m above base of
Mudline
Lava
__3900 m
__4550 m
h = 250
h = 650
1.03
17.5"
4206 m
Dikes
Textures
__5350 m 5700 mh = 800 13-3/8"1.28
1.331.031.03
Set 15 m above base of Dikes
Foliated Gabbros
__5700 m
__6400 m
h = 350
h = 700
12.25"
Layered Gabbros
7400 m 11-3/4" 1.281.03 1.571.52
Moho __9400 mh = 3000
9-7/8"
Mantle
h = 500 9900 m 1.03 1.52BHT = 250°C
Depths are measured from the rig floor (DRF)
Gabbros
sediments
Set 1000 m into theLayered Gabbros
1.03 1.03 1.0620"
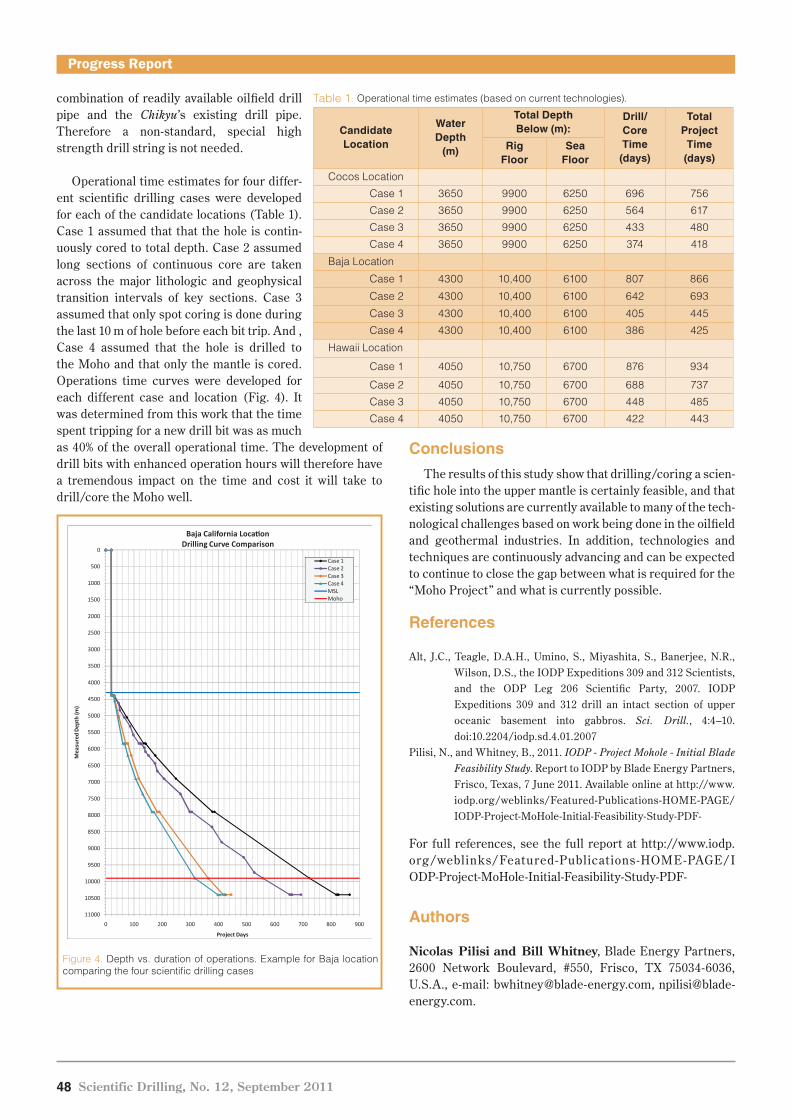
48 Scientific Drilling, No. 12, September 2011
Progress Report
combination of readily available oilfield drill pipe and the Chikyu’s existing drill pipe. Therefore a non-standard, special high strength drill string is not needed.
Operational time estimates for four differ-ent scientific drilling cases were developed for each of the candidate locations (Table 1). Case 1 assumed that that the hole is contin-uously cored to total depth. Case 2 assumed long sections of continuous core are taken across the major lithologic and geophysical transition intervals of key sections. Case 3 assumed that only spot coring is done during the last 10 m of hole before each bit trip. And , Case 4 assumed that the hole is drilled to the Moho and that only the mantle is cored. Operations time curves were developed for each different case and location (Fig. 4). It was determined from this work that the time spent tripping for a new drill bit was as much as 40% of the overall operational time. The development of drill bits with enhanced operation hours will therefore have a tremendous impact on the time and cost it will take to drill/core the Moho well.
Conclusions
The results of this study show that drilling/coring a scien-tific hole into the upper mantle is certainly feasible, and that existing solutions are currently available to many of the tech-nological challenges based on work being done in the oilfield and geothermal industries. In addition, technologies and techniques are continuously advancing and can be expected to continue to close the gap between what is required for the “Moho Project” and what is currently possible.
References
Alt, J.C., Teagle, D.A.H., Umino, S., Miyashita, S., Banerjee, N.R., Wilson, D.S., the IODP Expeditions 309 and 312 Scientists, and the ODP Leg 206 Scientific Party, 2007. IODP Expeditions 309 and 312 drill an intact section of upper oceanic basement into gabbros. Sci. Drill., 4:4–10. doi:10.2204/iodp.sd.4.01.2007
Pilisi, N., and Whitney, B., 2011. IODP - Project Mohole - Initial Blade Feasibility Study. Report to IODP by Blade Energy Partners, Frisco, Texas, 7 June 2011. Available online at http://www.iodp.org/weblinks/Featured-Publications-HOME-PAGE/ IODP-Project-MoHole-Initial-Feasibility-Study-PDF-
For full references, see the full report at http://www.iodp.org/weblinks/Featured-Publicat ions -HOME-PAGE/I ODP-Project-MoHole-Initial-Feasibility-Study-PDF-
Authors
Nicolas Pilisi and Bill Whitney, Blade Energy Partners, 2600 Network Boulevard, #550, Frisco, TX 75034-6036, U.S.A., e-mail: [email protected], [email protected].
Table 1. Operational time estimates (based on current technologies).
CandidateLocation
WaterDepth
(m)
Total Depth Below (m):
Drill/CoreTime (days)
Total ProjectTime (days)
Rig Floor
Sea Floor
Cocos Location
Case 1 3650 9900 6250 696 756
Case 2 3650 9900 6250 564 617
Case 3 3650 9900 6250 433 480
Case 4 3650 9900 6250 374 418
Baja Location
Case 1 4300 10,400 6100 807 866
Case 2 4300 10,400 6100 642 693
Case 3 4300 10,400 6100 405 445
Case 4 4300 10,400 6100 386 425
Hawaii Location
Case 1 4050 10,750 6700 876 934
Case 2 4050 10,750 6700 688 737
Case 3 4050 10,750 6700 448 485
Case 4 4050 10,750 6700 422 443
Figure 4. Depth vs. duration of operations. Example for Baja location comparing the four scientific drilling cases
Blade Moho ArticleFigure 5
0
500
1000
1500
2000
2500
3000
3500
4000
4500
5000
5500
6000
6500
7000
7500
8000
8500
9000
9500
10000
10500
11000
0 100 200 300 400 500 600 700 800 900
Mea
sure
d D
epth
(m)
Project Days
Baja California LocationDrilling Curve Comparison
Case 1Case 2Case 3Case 4MSLMoho
Scientific Drilling, No. 12, September 2011 49
Workshop Reports
International Drilling to Recover Aquifer Sands (IDRAs) and Arsenic Contaminated Groundwater in Asia
by Alexander van Geen
doi:10.2204/iodp.sd.12.06.2011
Workshop Reports
A group of forty-four scientists and students from four-teen countries met on 25–27 April 2011 in Hanoi, Vietnam to set the stage for a new continental drilling program focused on the groundwater arsenic (As) problem in Asia. Half of the participants were from low and lower-middle income coun-tries directly facing the major health threat of elevated groundwater As. This issue affects over 100 million rural inhabitants across Bangladesh, Cambodia, China, India, Myanmar, Nepal, Pakistan, and Vietnam who rely on shallow (typically <100-m-deep) wells as their main source of drinking water (Ravenscroft et al., 2009). Groundwater from these areas can contain As at levels that have been shown to cause deadly cancers and cardiovascular disease and to inhibit the mental development of children (Smith, A.H. et al., 2000; Wasserman et al., 2004; Kapaj et al., 2006; Argos et al., 2010).
There is broad agreement within the international scien-tific community that reductive dissolution of iron (Fe) oxyhy-droxides in river basins across Asia is a key factor leading to widespread occurrence of As in shallow groundwater (Kinniburgh and Smedley, 2001; Fendorf et al., 2010). The underlying reason is the strong affinity of As for Fe oxyhy-droxides that results in As accumulation on the coatings of suspended particles. Upon burial, As is released to ground-water by microbially mediated dissolution of these Fe oxyhy-droxides. There is a lack of necessary data, however, to dis-cern the relative importance of other mechanisms, including the role of local vs. advected sources of reactive organic car-bon that drive aquifers towards reduction. There is also a lack of critical information required to identify the cause of the extraordinary variability of groundwater As concentra-tions across a wide range of spatial scales (Fig. 1.) It is clear that this spatial variability is not directly controlled by the bulk As content of the sediment which, although not par- ticularly elevated, is sufficient to increase groundwater As concentrations to over 1000 times the World Health Organization’s guideline of 10 μg L-1 for As in drinking water if released.
Recent work reviewed at the International Drilling to Recover Aquifer Sands (IDRAs) workshop highlighted the importance of understanding the interactions between geol-ogy, hydrology, geochemistry, and microbiology that must be understood to understand and predict the release of As that occurs mostly in aquifers <100 m deep (Fig. 1a). Because of the difficulty of distinguishing some of these processes,
participants agreed to focus their efforts on the issue of greatest societal relevance, which is the vulnerability of those aquifers that are currently low in As (von Brömssen et al., 2007; Michael and Voss, 2008; Winkel et al., 2011). Tapping those aquifers, shallow or deep, that are low in As has had a much bigger impact in terms of lowering exposure than any other form of mitigation, including water treatment or rainwater harvesting, and it will likely continue to do so for the foreseeable future (Ahmed et al., 2006).
Workshop participants agreed that an effective approach to gaining a better understanding of the vulnerability of low-As aquifers is to study pronounced lateral and vertical con-centration gradients and determine whether such transitions could shift in response to massive groundwater pumping in some regions. In this context, one key question is whether a low-As aquifer is more likely to become contaminated because of inflow from a high-As zone or because of in situ As release triggered by a change in groundwater composi-tion induced by massive pumping for irrigation or municipal and industrial use (Fig. 2). This is a critical distinction. A number of plausible mechanisms have been proposed by which changes in the flow or composition of groundwater in response to pumping could either increase or decrease the As levels in groundwater (Klump et al., 2006; Neumann et al., 2010; McArthur et al., 2010), but none have been demon-strated across a broad range of settings.
Workshop participants agreed that a decade-long inte-grated research program is required in order to identify the mechanisms that are most relevant to predicting the fate of low-As aquifers. A guiding hypothesis for such a program was formulated at the workshop as follows:
“The distribution of As in reducing groundwater is anchored to the local geology across a range of spatial scales and therefore naturally evolves on 100–1000 year time scales. The scale of human perturbations of the natural groundwa-ter flow that threaten aquifers that are currently low in As on 10-yr timescales can be predicted by considering a limited set of parameters.”
Initial studies would be focused on a subset of previously studied sites from which background information is already available, as well as a on series of new transects that are sci-entifically relevant but also cross the borders between affected countries, some of which are politically sensitive
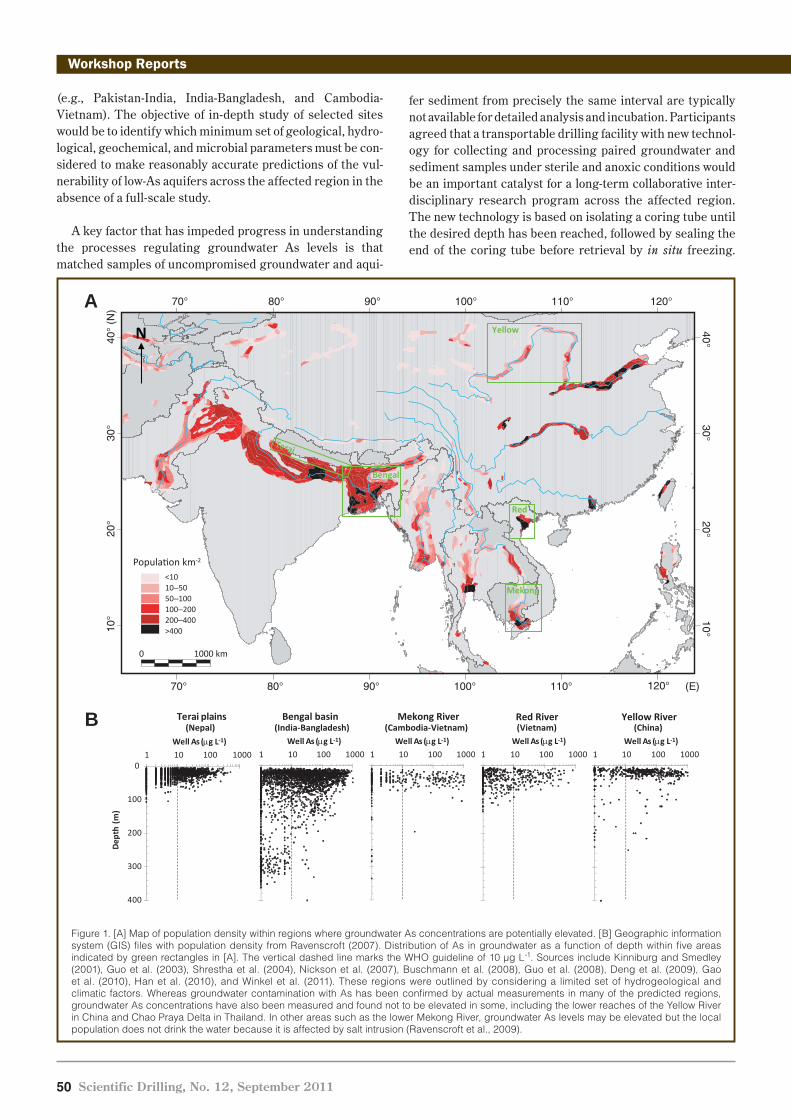
50 Scientific Drilling, No. 12, September 2011
Workshop Reports
fer sediment from precisely the same interval are typically not available for detailed analysis and incubation. Participants agreed that a transportable drilling facility with new technol-ogy for collecting and processing paired groundwater and sediment samples under sterile and anoxic conditions would be an important catalyst for a long-term collaborative inter-disciplinary research program across the affected region. The new technology is based on isolating a coring tube until the desired depth has been reached, followed by sealing the end of the coring tube before retrieval by in situ freezing.
(e.g., Pakistan-India, India-Bangladesh, and Cambodia-Vietnam). The objective of in-depth study of selected sites would be to identify which minimum set of geological, hydro-logical, geochemical, and microbial parameters must be con-sidered to make reasonably accurate predictions of the vul-nerability of low-As aquifers across the affected region in the absence of a full-scale study.
A key factor that has impeded progress in understanding the processes regulating groundwater As levels is that matched samples of uncompromised groundwater and aqui-
1 10 100 1000
Well As (µg L-1)
1 10 100 1000
Well As (µg L-1)
1 10 100 1000
Well As (µg L-1)
1 10 100 1000
Well As (µg L-1)
0
100
200
300
400
1 10 100 1000
Well As (µg L-1)
Dep
th (
m)
Terai plains Bengal basin Mekong River (Nepal) (India-Bangladesh) (Cambodia-Vietnam) (Vietnam) (China)
0 1000 km
Yellow
Red
Mekong
Bengal
Terai
70° 80° 90° 100° 110° 120°
10°
20°
3
0°
40
° (N
)
40° 30° 20° 10°
Population km-2
<1010–5050–100100–200200–400>400
Red River Yellow River
A
B
N
70° 80° 90° 100° 110° (E) 120°
Figure 1. [A] Map of population density within regions where groundwater As concentrations are potentially elevated. [B] Geographic information system (GIS) files with population density from Ravenscroft (2007). Distribution of As in groundwater as a function of depth within five areas indicated by green rectangles in [A]. The vertical dashed line marks the WHO guideline of 10 μg L-1. Sources include Kinniburg and Smedley (2001), Guo et al. (2003), Shrestha et al. (2004), Nickson et al. (2007), Buschmann et al. (2008), Guo et al. (2008), Deng et al. (2009), Gao et al. (2010), Han et al. (2010), and Winkel et al. (2011). These regions were outlined by considering a limited set of hydrogeological and climatic factors. Whereas groundwater contamination with As has been confirmed by actual measurements in many of the predicted regions, groundwater As concentrations have also been measured and found not to be elevated in some, including the lower reaches of the Yellow River in China and Chao Praya Delta in Thailand. In other areas such as the lower Mekong River, groundwater As levels may be elevated but the local population does not drink the water because it is affected by salt intrusion (Ravenscroft et al., 2009).
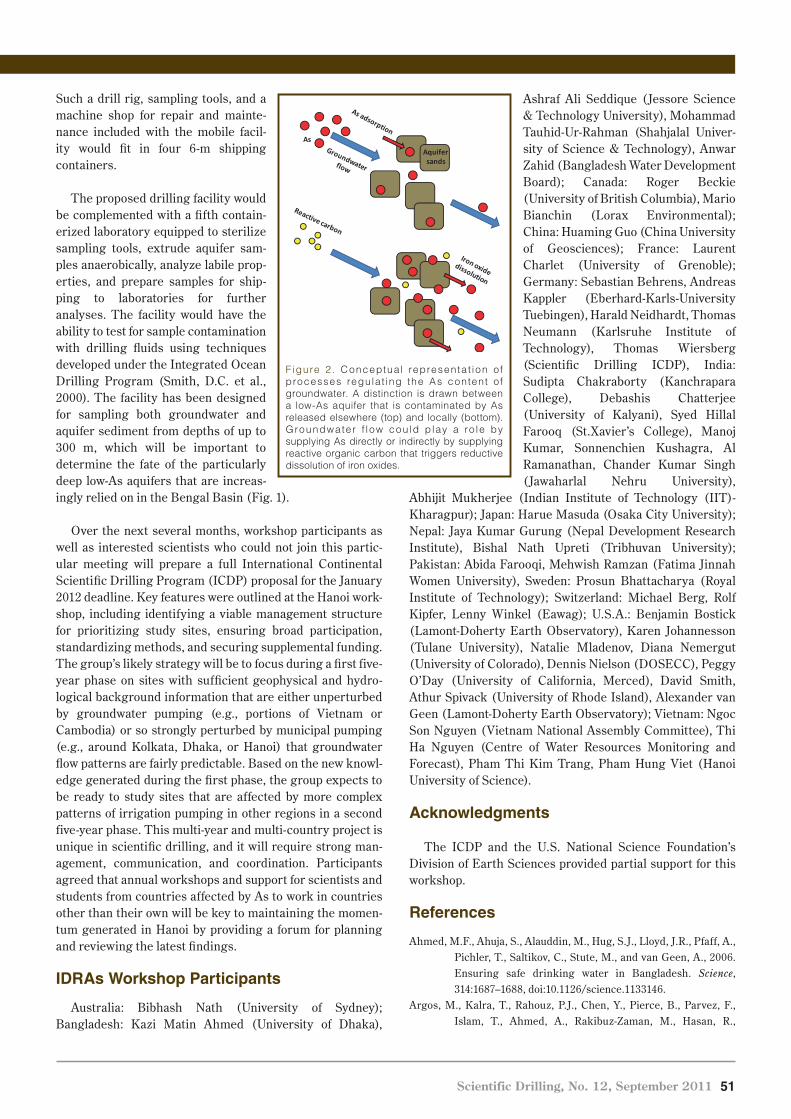
Scientific Drilling, No. 12, September 2011 51
Workshop Reports
Such a drill rig, sampling tools, and a machine shop for repair and mainte-nance included with the mobile facil- ity would fit in four 6-m shipping containers.
The proposed drilling facility would be complemented with a fifth contain-erized laboratory equipped to sterilize sampling tools, extrude aquifer sam-ples anaerobically, analyze labile prop-erties, and prepare samples for ship-ping to laboratories for further analyses. The facility would have the ability to test for sample contamination with drilling fluids using techniques developed under the Integrated Ocean Drilling Program (Smith, D.C. et al., 2000). The facility has been designed for sampling both groundwater and aquifer sediment from depths of up to 300 m, which will be important to determine the fate of the particularly deep low-As aquifers that are increas-ingly relied on in the Bengal Basin (Fig. 1).
Over the next several months, workshop participants as well as interested scientists who could not join this partic-ular meeting will prepare a full International Continental Scientific Drilling Program (ICDP) proposal for the January 2012 deadline. Key features were outlined at the Hanoi work-shop, including identifying a viable management structure for prioritizing study sites, ensuring broad participation, standardizing methods, and securing supplemental funding. The group’s likely strategy will be to focus during a first five-year phase on sites with sufficient geophysical and hydro-logical background information that are either unperturbed by groundwater pumping (e.g., portions of Vietnam or Cambodia) or so strongly perturbed by municipal pumping (e.g., around Kolkata, Dhaka, or Hanoi) that groundwater flow patterns are fairly predictable. Based on the new knowl-edge generated during the first phase, the group expects to be ready to study sites that are affected by more complex patterns of irrigation pumping in other regions in a second five-year phase. This multi-year and multi-country project is unique in scientific drilling, and it will require strong man-agement, communication, and coordination. Participants agreed that annual workshops and support for scientists and students from countries affected by As to work in countries other than their own will be key to maintaining the momen-tum generated in Hanoi by providing a forum for planning and reviewing the latest findings.
IDRAs Workshop Participants
Australia: Bibhash Nath (University of Sydney); Bangladesh: Kazi Matin Ahmed (University of Dhaka),
Ashraf Ali Seddique (Jessore Science & Technology University), Mohammad Tauhid-Ur-Rahman (Shahjalal Univer-sity of Science & Technology), Anwar Zahid (Bangladesh Water Development Board); Canada: Roger Beckie (University of British Columbia), Mario Bianchin (Lorax Environmental); China: Huaming Guo (China University of Geosciences); France: Laurent Charlet (University of Grenoble); Germany: Sebastian Behrens, Andreas Kappler (Eberhard-Karls-University Tuebingen), Harald Neidhardt, Thomas Neumann (Karlsruhe Institute of Technology), Thomas Wiersberg (Scientific Drilling ICDP), India: Sudipta Chakraborty (Kanchrapara College), Debashis Chatterjee (University of Kalyani), Syed Hillal Farooq (St.Xavier’s College), Manoj Kumar, Sonnenchien Kushagra, Al Ramanathan, Chander Kumar Singh (Jawaharlal Nehru University),
Abhijit Mukherjee (Indian Institute of Technology (IIT)- Kharagpur); Japan: Harue Masuda (Osaka City University); Nepal: Jaya Kumar Gurung (Nepal Development Research Institute), Bishal Nath Upreti (Tribhuvan University); Pakistan: Abida Farooqi, Mehwish Ramzan (Fatima Jinnah Women University), Sweden: Prosun Bhattacharya (Royal Institute of Technology); Switzerland: Michael Berg, Rolf Kipfer, Lenny Winkel (Eawag); U.S.A.: Benjamin Bostick (Lamont-Doherty Earth Observatory), Karen Johannesson (Tulane University), Natalie Mladenov, Diana Nemergut (University of Colorado), Dennis Nielson (DOSECC), Peggy O’Day (University of California, Merced), David Smith, Athur Spivack (University of Rhode Island), Alexander van Geen (Lamont-Doherty Earth Observatory); Vietnam: Ngoc Son Nguyen (Vietnam National Assembly Committee), Thi Ha Nguyen (Centre of Water Resources Monitoring and Forecast), Pham Thi Kim Trang, Pham Hung Viet (Hanoi University of Science).
Acknowledgments
The ICDP and the U.S. National Science Foundation’s Division of Earth Sciences provided partial support for this workshop.
References
Ahmed, M.F., Ahuja, S., Alauddin, M., Hug, S.J., Lloyd, J.R., Pfaff, A., Pichler, T., Saltikov, C., Stute, M., and van Geen, A., 2006. Ensuring safe drinking water in Bangladesh. Science, 314:1687–1688, doi:10.1126/science.1133146.
Argos, M., Kalra, T., Rahouz, P.J., Chen, Y., Pierce, B., Parvez, F., Islam, T., Ahmed, A., Rakibuz-Zaman, M., Hasan, R.,
Aquifersands
As
F igure 2. Conceptua l representat ion of processes regulat ing the As content of groundwater. A distinction is drawn between a low-As aquifer that is contaminated by As released elsewhere (top) and locally (bottom). Groundwater f l ow cou ld p lay a ro le by supplying As directly or indirectly by supplying reactive organic carbon that triggers reductive dissolution of iron oxides.
52 Scientific Drilling, No. 12, September 2011
Workshop Reports
Sarwar, G., Slavkovich, V., van Geen, A., Granziano, J., and Ahsan, H., 2010. Arsenic exposure from drinking water, and all-cause and chronic-disease mortalities in Bangladesh (HEALS): A prospective cohort study. The Lancet, 376 (9737):252–258, doi: 10.1016/S0140-3736(10)60481-3.
Buschmann, J., Berg, M., Stengel, C., Winkel, L., Sampson, M.L., Trang, P.T.K., and Viet, P.H., 2008. Contamination of drinking water resources in the Mekong delta floodplains: Arsenic and other trace metals pose serious health risks to population. Environ. Int., 34:756–764, doi:10.1016/j.envint. 2007.12.025.
Deng, Y., Wang, Y., and Ma, T., 2009. Isotope and minor element geo-chemistry of high arsenic groundwater from Hangjinhouqi, the Hetao plain, Inner Mongolia. Appl. Geochem., 24:587–599.
Fendorf, S., Michael, H., and van Geen, A., 2010. Spatial and temporal variations of groundwater arsenic in South and Southeast Asia. Science, 328:1123–1127, doi:10.1126/science.1172974.
Gao, C.R., Liu, W.B., Li, J.F., and Li, F., 2010. Modes of occurrence of arsenic in Quaternary sediments of the Hetao Plain. Geol. China, 37(3):760–770.
Guo, H., Wang, Y., Shpeizer, G.M., and Yan, S., 2003. Natural occur-rence of arsenic in shallow groundwater, Shanyin, Datong Basin, China. J. Environ. Sci. Health, Part A, 38(11):2565–2580.
Guo, H., Yang, S., Tang, X., Li, Y., and Shen, Z., 2008. Groundwater geochemistry and its implications for arsenic mobilization in shallow aquifers of the Hetao Basin, Inner Mongolia. Sci. Total Environ., 393:131–144, doi:10.1016/j.scitotenv. 2007.12.025.
Han, S.B., Zhang, F.C., Zhang, H., Jia, X.F., He, J., and Li, X.F., 2010. An analysis of the distribution and formation of high arsenic groundwater in northern China. Geol. China, 37(3):747–753.
Kinniburgh, D.G., and Smedley, P.L., 2001. Arsenic contamination of ground water in Bangladesh, Final Report, vol. 2, BGS Technical Report WC/00/19, British Geological Survey, Keyworth, U.K., http://www.bgs.ac.uk/arsenic/bphase2/reports.htm.
Klump, S., Kipfer, R., Cirpka, O.A., Harvey, C.F., Brennwald, M.S., Ashfaque, K.N., Badruzzaman, A.B.M., Hug, S.J., and Imboden, D.M., 2006. Groundwater dynamics and arsenic mobilization in Bangladesh assessed using noble gases and tritium. Environ. Sci. Technol., 40:243–250, doi:10.1021/es051284w.
Kapaj, S., Peterson, H., Liber, K., and Bhattacharya, P., 2006. Human health effects from chronic arsenic poisoning – A review. J. Environ. Sci. Health, Part A, 41(10):2399–2428.
McArthur, J.M., Banerjee, D.M., Sengupta, S., Ravenscroft, P., Klump, S., Sarkar, A., Disch, B., and Kipfer, R., 2010. Migration of As, and 3H/3He ages, in groundwater from West Bengal: Implications for monitoring. Water Res., 44:4171–4185, doi:10.1016/j.watres.2010.05.010.
Michael, H.A., and Voss, C.I., 2008. Evaluation of the sustainability of deep groundwater as an arsenic-safe resource in the Bengal Basin. Proc. Natl. Acad. Sci. USA, 105:8531–8536, doi:10.1073/pnas.0710477105.
Neumann, R.B., Ashfaque, K.N., Badruzamman, A.B.M., Ali, M.A., Shoemaker, J.K., and Harvey, C.F., 2010. Anthropogenic
influences on groundwater arsenic concentrations in Bangladesh. Nature Geosci., 3:46–52. doi: 10.1038/NGEO685.
Nickson, R., Sengupta, C., Mitra, P., Dave, S.N., Banerjee, A.K., Bhattacharya, A., Basu, S., Kakoti, N., Moorthy, N.S., Wasuja, M., Kumar, M., Mishra, D.S., Ghosh, A., Vaish, D.P., Srivastava, A.K., Tripathi, R.M., Singh, S.N., Prasad, R., Bhattacharya, S., and Deverill, P., 2007. Current knowledge on the distribution of arsenic in groundwater in five states of India. J. Environ. Sci. Health A Tox. Hazard. Subst. Environ. Eng., 42:1707–1718, doi:10.1080/109345 20701564194.
Ravenscroft, P., 2007. Predicting the global extent of arsenic pollution of groundwater and its potential impact on human health. Unpublished report prepared for UNICEF, December 2007. Accessible online at: http://phys4.harvard.edu/~wilson/arsenic/references/Ravenscroft_Prediction.pdf.
Ravenscroft, P., Brammer, H., and Richards, K., 2009. Arsenic Pollution: A Global Synthesis: Chichester, U.K. (Wiley-Blackwell). doi:10.1002/9781444308785.
Shrestha, C.R., Whitney, J.W., and Shrestha, K.B., 2004. The State of Arsenic in Nepal-2003: Kathmandu, Nepal (National Arsenic Steering Committee, Environment and Public Health Organization), 126 pages and CD-ROM.
Smith, A.H., Lingas, E.O., Rahman, M., 2000. Contamination of drinking-water by arsenic in Bangladesh: a public health emergency. Bulletin WHO 2000, 78(9):1093–1103.
Smith, D.C., Spivack, A.J., Fisk, M.R., Haveman, S.A., Staudigel, H., and Ocean Drilling Program Leg 185 Shipboard Scientific Party, 2000. Tracer-based estimates of drilling-induced microbial contamination of deep sea crust. Geomicrobiol. J., 17:207–219, doi:10.1080/01490450050121170.
von Brömssen, M., Jakariya, M., Bhattacharya, P., Ahmed, K.M., Hasan, M.A., Sracek, O., Jonsson, L., Lundell, L., and Jacks G., 2007. Targeting low-arsenic aquifers in groundwater of Matlab Upazila, Southeastern Bangladesh. Sci. Total Environ., 379:121–132, doi:10.1016/j.scitotenv.2006.06.028.
Wasserman, G.A., Liu, X., Parvez, F., Ahsan, H., Factor-Litvak, P., van Geen, A., Cheng, Z., Slavkovich, V., Hussain, I., Momotaj, H., and Graziano, J.H., 2004. Water arsenic exposure and children’s intellectual function in Araihazar, Bangladesh. Environ. Health Perspect., 112:1329–1333, doi:10.1289/ehp.6964.
Winkel, L.H.E., Trang, P.T.K., Lan, V.M, Stengel, C., Amini, M., Ha, N.T., Viet, P.H., and Berg, M., 2011. Arsenic pollution of groundwater in Vietnam exacerbated by deep aquifer exploitation for more than a century. Proc. Natl. Acad. Sci. USA, 108:1246–1251, doi:10.1073/pnas.1011915108.
Author
Alexander van Geen, Lamont-Doherty Earth Observatory (LDEO), Columbia University, 131 Corner, 61 Route 9W – P.O. Box 1000, Palisades, N.Y. 10964-8000, U.S.A., e-mail: [email protected].
Related Web Link
http://hanoi.icdp-online.org
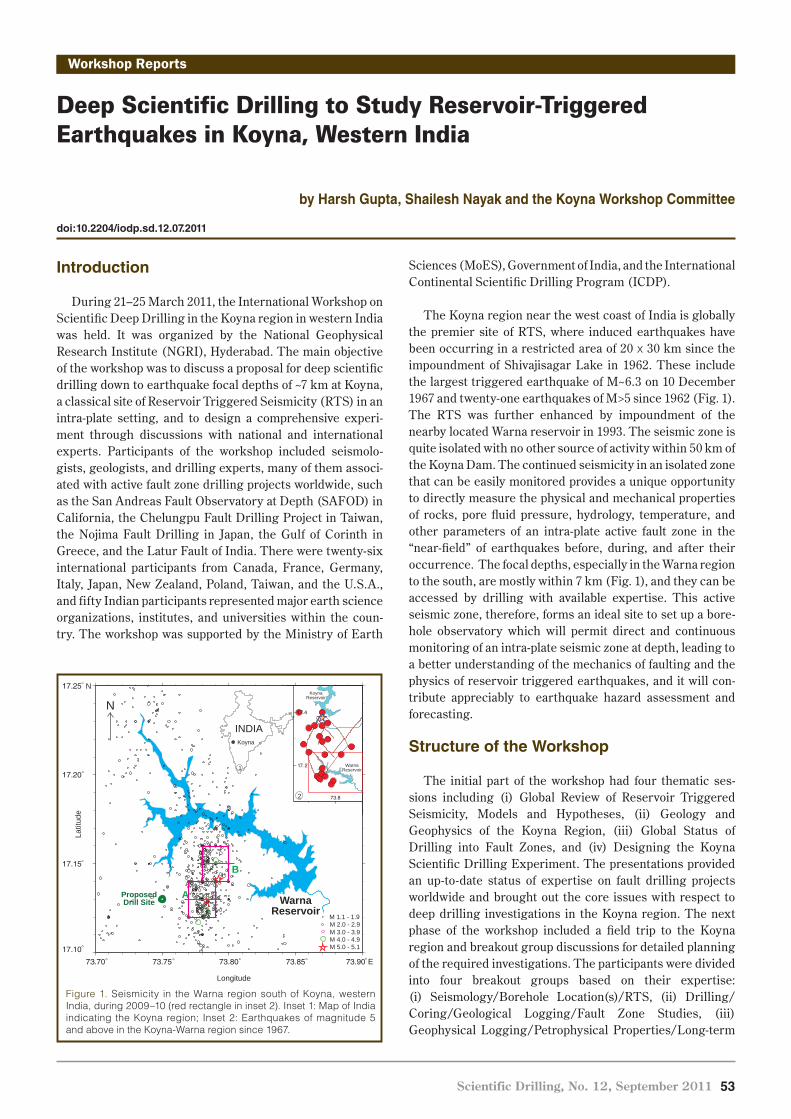
Scientific Drilling, No. 12, September 2011 53
Workshop Reports
Deep Scientific Drilling to Study Reservoir-Triggered Earthquakes in Koyna, Western India
by Harsh Gupta, Shailesh Nayak and the Koyna Workshop Committee
doi:10.2204/iodp.sd.12.07.2011
Workshop Reports
Introduction
During 21–25 March 2011, the International Workshop on Scientific Deep Drilling in the Koyna region in western India was held. It was organized by the National Geophysical Research Institute (NGRI), Hyderabad. The main objective of the workshop was to discuss a proposal for deep scientific drilling down to earthquake focal depths of ~7 km at Koyna, a classical site of Reservoir Triggered Seismicity (RTS) in an intra-plate setting, and to design a comprehensive experi-ment through discussions with national and international experts. Participants of the workshop included seismolo-gists, geologists, and drilling experts, many of them associ-ated with active fault zone drilling projects worldwide, such as the San Andreas Fault Observatory at Depth (SAFOD) in California, the Chelungpu Fault Drilling Project in Taiwan, the Nojima Fault Drilling in Japan, the Gulf of Corinth in Greece, and the Latur Fault of India. There were twenty-six international participants from Canada, France, Germany, Italy, Japan, New Zealand, Poland, Taiwan, and the U.S.A., and fifty Indian participants represented major earth science organizations, institutes, and universities within the coun-try. The workshop was supported by the Ministry of Earth
Sciences (MoES), Government of India, and the International Continental Scientific Drilling Program (ICDP).
The Koyna region near the west coast of India is globally the premier site of RTS, where induced earthquakes have been occurring in a restricted area of 20 x 30 km since the impoundment of Shivajisagar Lake in 1962. These include the largest triggered earthquake of M~6.3 on 10 December 1967 and twenty-one earthquakes of M>5 since 1962 (Fig. 1). The RTS was further enhanced by impoundment of the nearby located Warna reservoir in 1993. The seismic zone is quite isolated with no other source of activity within 50 km of the Koyna Dam. The continued seismicity in an isolated zone that can be easily monitored provides a unique opportunity to directly measure the physical and mechanical properties of rocks, pore fluid pressure, hydrology, temperature, and other parameters of an intra-plate active fault zone in the “near-field” of earthquakes before, during, and after their occurrence. The focal depths, especially in the Warna region to the south, are mostly within 7 km (Fig. 1), and they can be accessed by drilling with available expertise. This active seismic zone, therefore, forms an ideal site to set up a bore-hole observatory which will permit direct and continuous monitoring of an intra-plate seismic zone at depth, leading to a better understanding of the mechanics of faulting and the physics of reservoir triggered earthquakes, and it will con-tribute appreciably to earthquake hazard assessment and forecasting.
Structure of the Workshop
The initial part of the workshop had four thematic ses-sions including (i) Global Review of Reservoir Triggered Seismicity, Models and Hypotheses, (ii) Geology and Geophysics of the Koyna Region, (iii) Global Status of Drilling into Fault Zones, and (iv) Designing the Koyna Scientific Drilling Experiment. The presentations provided an up-to-date status of expertise on fault drilling projects worldwide and brought out the core issues with respect to deep drilling investigations in the Koyna region. The next phase of the workshop included a field trip to the Koyna region and breakout group discussions for detailed planning of the required investigations. The participants were divided into four breakout groups based on their expertise: (i) Seismology/Borehole Location(s)/RTS, (ii) Drilling/Coring/Geological Logging/Fault Zone Studies, (iii) Geophysical Logging/Petrophysical Properties/Long-term
Workshop Reports
Figure 1. Seismicity in the Warna region south of Koyna, western India, during 2009–10 (red rectangle in inset 2). Inset 1: Map of India indicating the Koyna region; Inset 2: Earthquakes of magnitude 5 and above in the Koyna-Warna region since 1967.
ProposedDrill Site
N
WarnaReservoir
A
B
Koyna
INDIA
1
KoynaReservoir
WarnaReservoir
2
M 1.1 - 1.9M 2.0 - 2.9M 3.0 - 3.9M 4.0 - 4.9M 5.0 - 5.1
Latit
ude
Longitude
N
E° ° ° ° °
°
°
°
°

54 Scientific Drilling, No. 12, September 2011
Workshop Reports
• Take up geophysical surveys like seismic reflection, magnetotelluric, deep electrical sounding, gravity and magnetics to constrain the fine structure of the seis-mic zone.
• Acquire very high-resolution Light Detection And Ranging (LIDAR) data.
2. Studying hydraulic connectivity
• Initially drill about four test boreholes around the seis-mic zone, each penetrating about 200 m into the pre-Trappean basement.
• Perform suites of measurements on geochemical and geophysical parameters in and across these boreholes.
• Model regional hydraulic connectivity.
3. Plan the main borehole based on 1 and 2.
The workshop provided an excellent opportunity for the global community of concerned scientists to discuss the ideas and data collected and results obtained from the Koyna site of RTS for over the last four decades. The suggestions and plan of action as summarized above is now being implemented.
Authors
Harsh Gupta, National Geophysical Research Institute (CSIR-NGRI), Uppal Road, Hyderabad, 500 007, India; e-mail: [email protected] Nayak, Ministry of Earth Sciences (MoES), C.G.O. Complex, Lodhi Road, New Delhi 110 003, India.
and the Koyna Workshop Committee: Y.J. Bhaskar Rao, R.K. Chadha, B.K. Bansal, D. Srinagesh, N. Purnachandra Rao, Sukanta Roy, H.V.S. Satyanarayana, D. Shashidhar, and K. Mallika.
Monitoring, and (iv) Temperature/Hydrogeology/Fluid and Gas Sampling. The breakout group dis-cussions started at Hyderabad and continued through the field visit to Koyna and for another full day at Karad. The hallmark of the event was the gathering of experts from all major fault zone drill-ing programs worldwide, all working together to address the major challenges of undertaking the deep drilling investigations at Koyna.
Suggested Site for Deep Borehole
A borehole site for deep scientific drilling (green dot in Fig. 1, about 2 km west of block) was sug-gested on the basis of observed seismicity in the past two years (2009 and 2010), accessibility, and other logistic considerations. In Fig. 1, hypocenters are plotted of earthquakes of magnitude M1.1 and larger that occurred during 2009 and 2010 in block A. The seismic activ-ity has been quite intense, as there were 81, 26, and 5 events of M1.1 to M1.9, M2.0 to M2.9, and M3.0 to M3.9, respec-tively. During 2009 and 2010 there was also one earthquake each of M4.3 and 5.0 in block A. A majority of these events are confined within a focal depth of 1–5 km in block A.
Outcome of the Workshop
All the participants at the workshop agreed that Koyna is an outstanding world-class geological site and a natural seis-mic laboratory to conduct a deep borehole experiment for earthquake studies. The MoES has declared its support to the program, and the ICDP has offered to make available its technical expertise in deep drilling and logging, training of manpower, and support towards drilling after receiving a successful drilling proposal. Experts from around the world have offered to bring in new tools and techniques for meas-urements and modeling.
On the basis of intensive discussions among the partici-pants and important suggestions received from experts from India and abroad, a few key areas were identified for detailed preliminary studies. Foremost among these is the need to understand the hydrology of the region and connectivity between the reservoirs and host country rock. We also need to constrain the fine structure of the seismic zone in the area including detailed mapping of the causative faults, both of which would be critical in locating the deep borehole obser-vatory in the region. The following three-tiered action plan was agreed upon.
1. Revisiting old data and acquiring new data
• Compile all available earthquake data for Koyna area and apply the most appropriate techniques to improve hypocenter locations.
• Deploy a larger number of seismic stations, especially in the region close to the active Warna seismic zone.
Figure 2. Depth sections of the two blocks shown in Fig. 1 in pink. Number of earthquakes during 2009–2010 in [A]: M1.1–1.9 (81 events), M2–2.9 (26 events), M3–3.9 (5 events), and one earthquake each of M4.3 and M5.0. In [B], M1.1–1.9 (54 events), M2–2.9 (24 events), M3–3.9 (7 events), and one earthquake each of M4.2 and M5.1.
A B
M 1.1 - 1.9M 2.0 - 2.9M 3.0 - 3.9M 4.0 - 4.9M 5.0 - 5.1
Dep
th (k
m)
Dep
th (k
m)
°
°
°
° °
°
°
°° ° ° ° ° °E E
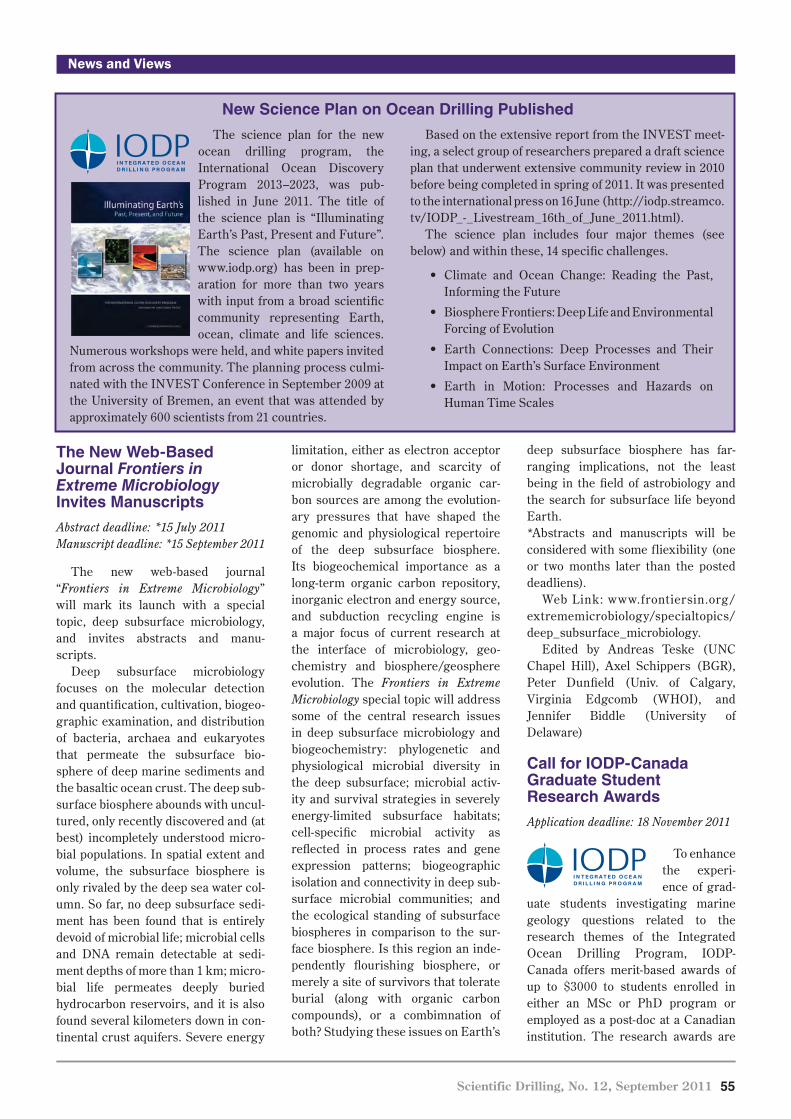
Scientific Drilling, No. 12, September 2011 55
News and Views
The New Web-Based Journal Frontiers in Extreme Microbiology Invites Manuscripts
Abstract deadline: *15 July 2011Manuscript deadline: *15 September 2011
The new web-based journal “Frontiers in Extreme Microbiology” will mark its launch with a special topic, deep subsurface microbiology, and invites abstracts and manu- scripts.
Deep subsurface microbiology focuses on the molecular detection and quantification, cultivation, biogeo-graphic examination, and distribution of bacteria, archaea and eukaryotes that permeate the subsurface bio-sphere of deep marine sediments and the basaltic ocean crust. The deep sub-surface biosphere abounds with uncul-tured, only recently discovered and (at best) incompletely understood micro-bial populations. In spatial extent and volume, the subsurface biosphere is only rivaled by the deep sea water col-umn. So far, no deep subsurface sedi-ment has been found that is entirely devoid of microbial life; microbial cells and DNA remain detectable at sedi-ment depths of more than 1 km; micro-bial life permeates deeply buried hydrocarbon reservoirs, and it is also found several kilometers down in con-tinental crust aquifers. Severe energy
limitation, either as electron acceptor or donor shortage, and scarcity of microbially degradable organic car-bon sources are among the evolution-ary pressures that have shaped the genomic and physiological repertoire of the deep subsurface biosphere. Its biogeochemical importance as a long-term organic carbon repository, inorganic electron and energy source, and subduction recycling engine is a major focus of current research at the interface of microbiology, geo-chemistry and biosphere/geosphere evolution. The Frontiers in Extreme Microbiology special topic will address some of the central research issues in deep subsurface microbiology and biogeochemistry: phylogenetic and physiological microbial diversity in the deep subsurface; microbial activ-ity and survival strategies in severely energy-limited subsurface habitats; cell-specific microbial activity as reflected in process rates and gene expression patterns; biogeographic isolation and connectivity in deep sub-surface microbial communities; and the ecological standing of subsurface biospheres in comparison to the sur-face biosphere. Is this region an inde-pendently flourishing biosphere, or merely a site of survivors that tolerate burial (along with organic carbon compounds), or a combimnation of both? Studying these issues on Earth’s
deep subsurface biosphere has far-ranging implications, not the least being in the field of astrobiology and the search for subsurface life beyond Earth.*Abstracts and manuscripts will be considered with some fliexibility (one or two months later than the posted deadliens).
Web Link: www.frontiersin.org/extrememicrobiology/specialtopics/deep_subsurface_microbiology.
Edited by Andreas Teske (UNC Chapel Hill), Axel Schippers (BGR), Peter Dunfield (Univ. of Calgary, Virginia Edgcomb (WHOI), and Jennifer Biddle (University of Delaware)
Call for IODP-Canada Graduate Student Research Awards
Application deadline: 18 November 2011
To enhance the experi-ence of grad-
uate students investigating marine geology questions related to the research themes of the Integrated Ocean Drilling Program, IODP-Canada offers merit-based awards of up to $3000 to students enrolled in either an MSc or PhD program or employed as a post-doc at a Canadian institution. The research awards are
The science plan for the new ocean drilling program, the International Ocean Discovery Program 2013–2023, was pub-lished in June 2011. The title of the science plan is “Illuminating Earth’s Past, Present and Future”. The science plan (available on www.iodp.org) has been in prep-aration for more than two years with input from a broad scientific community representing Earth, ocean, climate and life sciences.
Numerous workshops were held, and white papers invited from across the community. The planning process culmi-nated with the INVEST Conference in September 2009 at the University of Bremen, an event that was attended by approximately 600 scientists from 21 countries.
Based on the extensive report from the INVEST meet-ing, a select group of researchers prepared a draft science plan that underwent extensive community review in 2010 before being completed in spring of 2011. It was presented to the international press on 16 June (http://iodp.streamco.tv/IODP_-_Livestream_16th_of_June_2011.html).
The science plan includes four major themes (see below) and within these, 14 specific challenges.
• Climate and Ocean Change: Reading the Past,Informing the Future
• BiosphereFrontiers:DeepLifeandEnvironmentalForcing of Evolution
• Earth Connections: Deep Processes and TheirImpact on Earth’s Surface Environment
• Earth in Motion: Processes and Hazards onHuman Time Scales
New Science Plan on Ocean Drilling Published

56 Scientific Drilling, No. 12, September 2011
News and Views
intended to support projects directed toward the objectives of upcoming or past DSDP/ODP/IODP expedi-tions, utilizing core material and/or shipboard data.
Please contact the IODP-Canada Coordinator ([email protected] canada.ca) for more information.
The Netherlands Joins ICDP
Starting 2011, the Netherlands is a member country of ICDP. Dutch
community, ICDP-NL, is an open plat-form that intends to bundle the ex- pertise of (sometimes rather small) research groups and specialists and to support the ambitions of the Dutch scientists. The community consists of scientists of a broad variety of Earth science disciplines, ranging from archaeology to tectonics. It not only involves universities but also the Netherlands Organisation for Applied Scientific Research (TNO). The Board of ICDP-NL is chaired by Stefan Luthi (TU Delft) and advised by a represen-tative of the drilling industry. The membership fee is financed by the Earth and Life Science division of the Netherlands Organization for Scientific Research (NWO).
A first symposium was held on 14 February 2011, during which also the agreement between NWO and ICDP was signed. ICDP-NL will cooperate closely with IODP-NL, for instance, by organizing joints meetings.
Dutch scientists already have a long track record in continental drilling. ICDP-NL will build on the expertise gained during these collaborative proj-ects and is looking forward to now becoming fully involved in initiating and executing ICDP projects.
Contact details, the press release and the first newsletter can be found
on the ICDP website under National Programs.
Australia and New Zealand in Scientific Drilling
ANZIC IODP activities are proceed-ing smoothly. The 2010 ANZIC Annual Report is now available on www.iodp.org.au. The report not only covers Australian and New Zealand activities in IODP in 2010, but looks at the future and makes the point that we are fully committed to IODP, now and in the future. Australia now has funding until the end of the present phase of IODP, and New Zealand is actively pursuing such funding. Planning is underway for an IODP session at the International Geological Congress in Brisbane in mid-2012 (www.34igc.org), and a large number of international participants are expected to attend.
In the first six months of 2011, four ANZIC scientists participated in IODP expeditions: two aboard the Louisville Seamount Trail expedition (330), one aboard the CRISP expedi-tion (334) and one aboard the Superfast Spreading expedition (335).
A New Zealand Scientific Drilling Workshop was held in Dunedin in March 2011, and a white paper is cur-rently under development to sketch the concept and importance of the DrillNZ initiative to various stakehold-ers. A New Zealand-led IODP work-shop “Conceptual framework for ocean drilling to unlock the secrets of slow slip events” was held at Gisborne, New Zealand in August 2011. Since beginning of August 2011, NIWA (the Natonal Insitute of Water and Atmosphere) has joined the consor-tium of New Zealand Universities and Crown reseach Institutes contributing to ANZIC, and has committed funds towards the New Zealand IODP mem-bership fee up to 2013–2014.
An Indian Ocean IODP workshop will be held in Goa, India over the period 16-18 October 2011. The organ-izers are India and ANZIC. The aim of the workshop is to further develop
existing proposals and design new ones, in the hope that JOIDES Resolution will be in the Indian Ocean in 2014.
Australia and New Zealand are making important scientific contribu-tions to IODP, and a number of major coring expeditions in our region have improved and will improve the under-standing of global scientific questions. Although IODP is now working out-side the region, these two countries remain keen supporters of global IODP science.
2nd Swiss ICDP Meeting (March 2011, Zürich)
About 40 sci-entists gathered in March 2011 in
Zurich to exchange news about past, present and future ICDP projects with active Swiss involvement. Since Switzerland became an ICDP member through support from the Swiss National Sccience Foundation only three years ago, a series of projects with Swiss participation have been already drilled or are underway, and more are planned, reflecting an active contribution to the overall ICDP pro-gram. Scientists from Swiss institu-tions are acting as as PIs and Co-PIs in several drilling projects targeting lake sediment records, the subsurface biosphere, volcanic domains, sedi-mentary basins and groundwater contamination.
One of the main goals of the meet-ing was to address new themes to take further advantage from the Swiss ICDP membership. For example, sev-eral ideas were raised in the context of research on geothermal energy, where large commercial projects are currently underway, and it was sug-gested that a geothermal component could complement any continental drilling project. In the same context, CO2 sequestration gained wide atten-tion and might be further explored in the near future. New ideas will ad-dress drilling targets also within Switzerland. For example, a drilling initiative involving scientists from perialpine countries aims to explore the timing and extent of alpine glacia-
Scientific Drilling, No. 12, September 2011 57
News and Views
tions and related erosion and sedimen-tation through drilling the sedimen-tary infill of overdeepened troughs all around the Alpine region. Kick-off meetings with international partners are planned to explore possibilities for an ICDP workshop proposal. In a simi-lar fashion, the Alps themselves pro-vide a series of drilling objectives that may serve as unique records of tec-tonic and petrologic processes. One example is the highly metamorphic Ivrea Zone (Southern Alps), where lower-crust rocks are outcropping at the surface and where a drill hole could reach upper mantle rocks (i.e., the Moho) in much shallower depth as in its original location.
Altogether, the Swiss scientific drilling community is very active, and the combined IODP and ICDP mem-berships will continue to provide the ideal platform to conduct and realize these fascinating drilling initiatives. Contact: [email protected].
D/V Chikyu Damaged by Tsunami, Repairs Planned
At 2:47 p.m. JST on 11 March, the
Tohoku region in the northern Pacific coast of Japan suffered an M9 earth-quake followed by a 7+ m tsunami strike and numerous aftershocks. At that time, D/V Chikyu was in port at Hachinohe preparing for IODP Exp. 337. The Chikyu immediately evacu-ated port; however, during the emer-gency evacuation the vessel suffered damage. All personnel and visitors aboard, including a visiting delegation of local elementary school students, were safely accounted for.
On 20 March, Chikyu arrived at the port of Muroran in southern Hokkaido where divers made a provisional as-sessment of the ship’s damage. From 20 April until 18 June, the Chikyu was dry-docked for repair at the Yokohama Dockyard and Machinery, and re-turned to sea for testing on 18 June 2011.
One of DV/ Chikyu’s azimuth thrust-ers suffered damage as tsunami waves buffeted the vessel in the Hachinohe
port, and its replacement is currently being manufactured. The new thruster is expected to be installed by the end of March 2012.
IODP-Canada Summer School Scholarships
IODP-Canada is pleased to
announce that five students received scholarships to attend one of the 2011 ECORD summer schools held in Bremen, Germany and Urbino, Italy.
Congratulations to Thi Hao Bui (PhD student, McGill University), Jon Furlong (MSc student, University of Victoria), Fritz Griffith (MSc stu-dent, University of Ottawa), Lucie Hubert-Théou (PhD student, McGill University), and Stefan Markovic (PhD student, University of Toronto).
IODP/ICDP-Canada Booth at GAC-MAC 2011
IODP-Canada and ICDP-Canada
shared an exhibi-tion booth at the joint annual meet-
ing of the Geological Association of Canada and the Mineralogical Association of Canada, held at the University of Ottawa on 25–27 May 2011. Over 1050 Earth scientists (including 285 students) from Asia, Canada, Europe, and the U.S. attended the conference.
Anne de Vernal, Chair of IODP-Canada, and the Coordinators of IODP-Canada and ICDP-Canada staffed the booth and met with stu-dents, faculty and funding agency rep-
resentatives. Many ECORD, IODP and ICDP outreach materials were distrib-uted, and subscribers to the Canadian mailing list increased by over 10%. The new IODP-Canada Website (www.iodp canada.ca) was launched just prior to the start of the conference.
ICDP Dead Sea Core Opening Party, Part I
Within the framework of the ICDP Dead Sea
Deep Drilling Project (DSDDP) a first core opening party took place at the GFZ German Research Centre for Geosciences, Potsdam, in June 2011. A group of 18 involved scientists and student helpers from Israel, Japan, Switzerland, and the U.S., together with the German team around Prof. Dr. Achim Brauer, opened and described around 470 meters of a total of 720 meters of sediment cores that had been obtained during the drilling campaign at the Dead Sea deep basin from November 2010 to March 2011. Additional assistance was given by the ICDP Operational Support Group. Furthermore, modern non-destructive scanning techniques, such as micro-XRF analyses, magnetic susceptibility measurements and photographic line-scanning, have been applied at the sediments, encouraging the scientists to work in a two-shift system seven days a week in order to cope with the enormous amount of Dead Sea sedi-ments from one 450-m deep borehole and several short cores. First estima-tions based on the succession of salt, laminated sequences and detrital sediment flux point out that the sedi-ments comprise at least two climatic cycles, hence covering the last
~200 thousand years. All scien-tists are looking forward to meeting again at the GFZ labo-ratories in October this year to perform the same procedure with the remaining 250 meters from the second deep borehole and to get new insights into this fascinating archive of natural climate dynamics and seismic activity.

58 Scientific Drilling, No. 12, September 2011
News and Views
Bighorn Basin Coring Project (BBCP)
The Bighorn Basin Coring Project (BBCP) initiated drilling operations in the Bighorn Basin of Wyoming (U.S.) on 13 July 2011 and completed drilling on 4 August 2011. The main goal of the project is to recover com-plete, unweathered core samples from Paleogene continental strata that record rapid global warming events known as hyperthermals (e.g., Paleocene-Eocene Thermal Maximum [PETM] and Elmo). By applying vari-ous geochemical, geophysical, and paleontological methods on these
high-quality (HQ) cores, the project aims to better understand the causes of these climate events and their effects on continental systems. The project was highly successful in achieving all of its drilling goals with >95% core recovery in each hole. Three sites in the basin were targeted (Basin Substation, Polecat Bench, Gilmore Hill) with two holes drilled at each site to get overlapping cores. A total of 921 meters of HQ core was recovered in liners with all but one of the sites being drilled with municipal water only, thus reducing the potential for core contamination. In mid-August, the cores started their journey from
Powell, Wyoming to the IODP Bremen Core Repository at the University of Bremen, Germany, where they will be split, described, and sampled by the BBCP Science Team in early 2012. BBCP web page: http://earth.unh.edu/clyde/BBCP.shtml
Facebook page with real time updates: http://www.facebook.com/pages/Bighorn-Basin-Coring -Project /120607821348013.
ISAES-11 Antarctic Shallow Scientific Drilling Workshop
Following the 11th International Symposium on Antarctic Earth
ANDRILL Coulman High Project – Site Survey Outcomes and Future Plans
Field surveys were conducted from November 2010 through January 2011 on the Ross Ice
Shelf (RIS), northeast of McMurdo Station and Scott Base, in Antarctica, in preparation for the proposed ANDRILL Coulman High (CH) Project. The survey work is chroni-cled in a well-illustrated blog provided by Dr. Frank Rack, which is online at <http://www.andrill.org/science/ch/news>.
The CH Project surveys, which involved integrated planning and execution by a combined international team from New Zealand and the United States, achieved all pri-mary and secondary objectives. A transverse route from Ross Island to CH across the RIS was established using a tracked-vehicle-mounted ground-penetrating radar sys-tem supplemented by airborne radar. Four GPS stations and a weather station were established to measure lateral and vertical motions of the RIS and to monitor environ-mental conditions. A series of combined U.S.-NZ field camps on the RIS were occupied, and the ANDRILL hot water drill (HWD) system was used to melt numerous holes through 260–275 m of ice. Oceanographic moorings comprised of inductive oceanographic instruments were deployed through the RIS at two sites, and were recovered to the ice surface after two months; one mooring was then redeployed to accomplish multi-year observations at CH. Video camera observations of the interior and basal sur-face of the ice shelf were made at several sites and these observations were integrated with conductivity-tempera-ture-depth (CTD) measurements through the ice shelf to the seafloor at each site. The Submersible Capable of under-Ice Navigation and Imaging (SCINI) underwater remotely operated vehicle (ROV) was deployed through the ice to explore the underside of the ice shelf while con-ducting operational tests. SCINI discovered an unusual biological community living in the ice and recovered bio-
logical samples using an improvised suction pump (Rack et al., 2011); these samples and extensive imagery are being further investigated.
ANDRILL is a multinational scientific program to inves-tigate Antarctica’s glacial and tectonic history. Of specific interest is Antarctica’s past and future role in global envi-ronmental change as revealed through stratigraphic drill-ing along the Antarctic margin and related numerical modeling of climate and ice sheet behavior. ANDRILL is developing the CH Project to investigate Early Miocene and Paleogene paleoenvironmental and tectonic history by drilling at two sites on the Ross Ice Shelf, approximately 150 km east of McMurdo Station, over the subsea geologic structure known as the Coulman High. Further informa-tion about the project is available at <http://www.andrill.org/science/ch>.
The ANDRILL Science Committee (ASC) has issued an international call for submission of statements of inter-est in the CH Project from international scientists. This survey is available online at <http://www.andrill.org/sci ence/ch-survey>. The scientific team for the project will only be selected from nations that belong to the ANDRILL consortium. If you would like to know more about how your nation might join the ANDRILL consortium as a par-ticipating member, please contact Dr. Tim Naish, Chair of the ASC, at <[email protected]> or contact Dr. Frank Rack, Secretary of the ASC and Executive Director, ANDRILL Science Management Office, University of Nebraska-Lincoln, at <[email protected]>.
Reference
Rack, F., Levy, R., Falconer, T., Zook, R., Mahacek, P., Carroll, D., Williams, M., Stewart, C., Limeburner, R., and the ANDRILL Coulman High Site Survey Team, 2011. PS14.3: Interdisciplinary outcomes of the ANDRILL Coulman High Site surveys. [paper presented at 11th International Symposium on Antarctic Earth Sciences, Edinburge, Scotland, 10–15 July 2011]

Scientific Drilling, No. 12, September 2011 59
News and Views
Sciences (ISAES-11) in Edinburgh, Scotland, a one-day workshop on Antarctic Shallow Scientific Drilling was held in the John McIntyre Conference Centre of the University of Edinburgh (Scotland) on Sunday, 17 July 2011. The workshop, which attracted over thirty-six international attendees from six countries, was co-convened by Frank Rack (University of Nebraska-Lincoln) and Bruce Luyendyk (University of California, Santa Barbara). The presentations explored the use of numerical models and data-model integration strategies to answer important scientific ques-tions, identified potential shallow drill-ing targets from specific sites around the Antarctic margin, including land-ocean transects, and reviewed the stat-us of existing and emerging technol-ogy options that could be used to implement shallow (up to 200 mbsf)
scientific drilling/coring of glacial and glacial-marine sediment and rocks in ice-covered seas (e.g., mission specific platforms, including options for either ship-mounted rigs or seafloor drills). Further information about the out-comes of the workshop will be avail-able online in the near future at <http://www.shaldril.org>.
International Workshop on Scientific Drilling in the Indian Ocean17–18 October 2011, Goa, India
The Indian Ocean has experienced an extremely complicated tectonic his-tory. From the disintegration of Gondwanaland to the collision of the
Indian plate with Asia and the subduc-tion of the Indian plate in one of the most prominent subduction zones, the region has a diversity of key tectonic features. Much geo-scientific knowl-edge regarding the Indian Ocean was gained from the International Indian Ocean Expedition program (IIOE-1960–65). Since then, integrated geo-physical and geological studies have considerably improved our under-standing of geological evolution of this region. Results from previous studies in association with the ODP/DSDP boreholes in the Indian Ocean have further strengthened our knowledge.
Despite these remarkable efforts, several key questions related to the Indian Ocean with significant global relevance are still unanswered. Decades of geo-scientific work focused on this sector has produced compel-ling hypotheses on various fronts. Our
The PASADO Core Processing Strategy: A Flexible Protocol for Sediment Subsampling in Multidisciplinary Drilling Projects
Subsampling of sediment cores is the important first step of almost every study. Sampling procedures were developed within IODP/ODP/DSDP to ensure the repro-ducibility of core treatment as well as its documentation. In contrast, procedures for lacustrine sediment cores are as manifold as the corresponding scientific questions and communities. A sampling assembly and a flexible sampling protocol are described in the version adapted to the PASADO project. This protocol introduces a core splitter and a sampling assembly consisting of a divider and a D-scoop for fast and efficient subsampling. Detailed information can be found in our recently published paper (Ohlendorf et al., 2011).
The core splitter cuts plastic core liners without con-tamination of the sediment by liner material. The core sampling assembly is used to sample one core half
completely in contig-uous steps. The core half is split into slic- es of similar thick-ness by inserting thin disks through a comb-like divider, and the D-scoop is used to sample these sedi-ment disks (Fig. 1). The utilization of the
sediment is optimized because all sediment is sampled in one step. Subsamples with known volume can then be taken from the exact same stratigraphic level in the core. Quality flags are defined to document the condition of every (sub)sample and to allow a first classification of the sediment character.
ReferenceOhlendorf, C., Gebhardt, C., Hahn, A., Kliem, P., Zolitschka, B.,
and the PASADO science team, 2011. The PASADO core processing strategy - A proposed new protocol for sedi-ment core treatment in multidisciplinary lake drilling projects. Sediment. Geol., 239:104–115, doi:10.1016/ j.sedgeo.2011.06.007.
Authors
Christian Ohlendorf, Geomorphology and Polar Research (GEOPOLAR), Institute of Geography, University of Bremen, Celsiusstr. FVG-M, D-28359 Bremen, Germany, e-mail: [email protected] Gebhardt, Alfred Wegener Institute for Polar and Marine Research, Am Alten Hafen 26, D-27568 Bremerhaven, Germany.Annette Hahn, Pierre Kliem, and Bernd Zolitschka, Geomorphology and Polar Research (GEOPOLAR), Institute of Geography, University of Bremen, Celsiusstr. FVG-M, D-28359 Bremen, Germany.and the PASADO science team
Related Web Link
http://www.icdp-online.org/front_content.php?idcatart=2794Figure 1. Photographs of core splitter and the sledges with the four blades, divider, and the D-scoop.
Splitter Divider
D-scoop Subsampling
60 Scientific Drilling, No. 12, September 2011
News and Views
present understanding vis-a-vis these propositions requires corroboration from direct measurements such as deep ocean cores. The need for scien-tific drilling in the Indian Ocean sector is highly evident by several active IODP drilling proposals at various stages (e.g. proposal nos. 549, 552, 595, 667, 701, 702, 704, 717, 724, 727, 760, 776, 778, 780 and 783).
IODP-India in association with ANZIC is organizing an international workshop to discuss various scientific proposals for drilling in the Indian Ocean sector as well as to encourage discussions of new proposals in this sector for the new phase of the IODP. The Indian Ocean IODP Workshop will be held in Goa on 17–18 October with about 100 participants from all over the world. The workshop is planned back to back with the seventh Asian Marine Geology Meeting, also taking place in Goa during the previ-ous week.
Because there has been no scien-tific ocean drilling in the Indian Ocean for nearly a decade, this workshop is vital to developing strong new drilling proposals. Also, India itself has only joined IODP recently, and such a work-shop will provide wide exposure to the Indian science community of IODP science and IODP capability. The fol-lowing four themes have been arranged for the workshop and with planning subcommittees largely formed:
1. Cenozoic oceanography, climate change, gateways and reef devel-
opment: broad questions related to the Indian Ocean, and narrow ones such as the Indonesian Throughflow, sea-level changes, and the origin of late Pleistocene reefs.
2. The history of the monsoons: tec-tonics, uplift, weathering and ero-sion, sediment deposition, cli-mate and oceanography, and discussions/nurturing of propos-als that have emerged since the 2008 Detailed Planning Group (DPG) workshop on monsoons.
3. Tectonics and volcanism: tecto-nism of the Indian Ocean, includ-ing plate tectonics, the evolution of the oceanic crust and mid-ocean ridge formation, the forma-tion of large igneous provinces, continental rifting and related deposition, and subduction, arc volcanism and earthquakes.
4. The deep biosphere: studies of the “extremophiles” of the deep biosphere in sediments and basalts focusing on the nature of the oceanography and inputs of organic matter into the Indian Ocean.
More information on this workshop can be found at www.iodp.org/work shops/8/ or www.ncaor.gov.in/iodp/index.html.
Workshop conveners: Dr. Dhananjai K. Pandey, Program
Officer (IODP-India), e-mail: [email protected], and Professor
Neville Exon: ANZIC Program Scientist, e-mail: [email protected].
International Review of the ICDP with Outstanding Results
On behalf of the Assembly of Governors, (AOG)
and at the request of the main fund- ing partners of the program, the International Continental Scientific Drilling Program was evaluated in May 2011 by an international review committee of independent experts with key expertise in major programs in the geosciences and funding organizations.
The committee concluded that ICDP is a highly successful program, achieving with very modest invest-ments world-class science of global impact. The program has been highly effective in community-building and is driving integration in modern Earth system science. It has demonstrated strong scientific leadership and effec-tive allocation of its limited financial resources. The program holds great promise to further attract new mem-ber states, organizations and indus-trial partners.
One important outcome of the as-sessment is to start developing a new ICDP Science Plan. The AOG has therefore initiated the planning for an International Symposium on Continental Scientific Drilling in 2013.
Following the 11 March Tohoku earthquake, IODP mobilized a Detailed Planning Group (DPG) to investigate the feasibility of drilling into the seismogenic fault. Box 1 on page 61 is an excerpt from the report produced by the DPG.
A DPG meeting in May led to a full proposal for drilling within an area of 6–7 km water depth near the trench where the fault can be reached within 1 km subseafloor. Later plans are to measure ephemeral properties related to the rupturing of the fault as a baseline; repeat observa-tions are a key target. Properties include an expected fric-tion induced temperature anomaly providing a proxy for fault strength (friction) during rupture. Drilling is required within about 18 months after rupture before a
temperature anomaly has dissipated too much. This is a unique opportunity to sample a fault as close in time as possible to a major and large displacement earthquake event, but drilling and casing a hole in these water depths is a technological challenge. The study, if deemed feasible and implemented, will complement ongoing studies in the Nankai Trough, which targets a strong mega-fault expected to rupture within a few decades.
References for figures in Box 1 available in the full DPG Report, which is at http://www.iodp.org/weblinks/Featured-Publications -HOME-PAGE/Tohoku-Rapid- Response-Drilling-DPG-Report/.
Used by permission.
Drilling into the Fault Zone of the Giant Tohoku Earthquake?
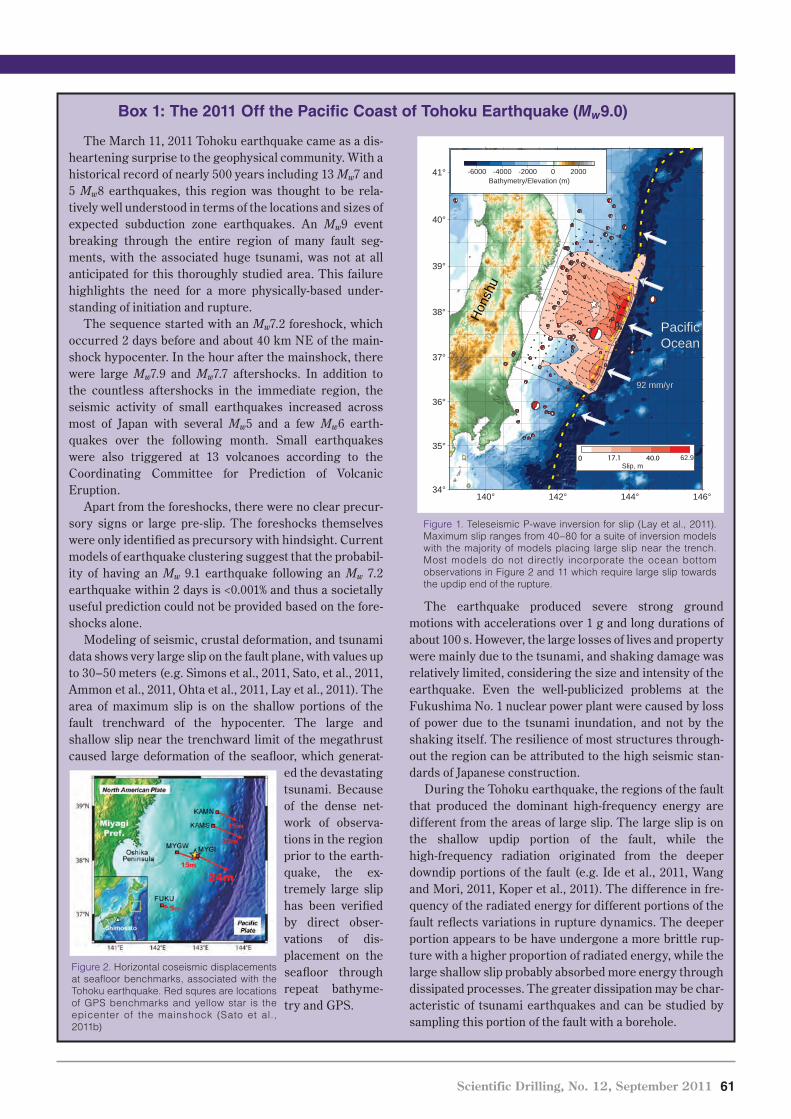
Scientific Drilling, No. 12, September 2011 61
News and Views
The March 11, 2011 Tohoku earthquake came as a dis-heartening surprise to the geophysical community. With a historical record of nearly 500 years including 13 Mw7 and 5 Mw8 earthquakes, this region was thought to be rela-tively well understood in terms of the locations and sizes of expected subduction zone earthquakes. An Mw9 event breaking through the entire region of many fault seg-ments, with the associated huge tsunami, was not at all anticipated for this thoroughly studied area. This failure highlights the need for a more physically-based under-standing of initiation and rupture.
The sequence started with an Mw7.2 foreshock, which occurred 2 days before and about 40 km NE of the main-shock hypocenter. In the hour after the mainshock, there were large Mw7.9 and Mw7.7 aftershocks. In addition to the countless aftershocks in the immediate region, the seismic activity of small earthquakes increased across most of Japan with several Mw5 and a few Mw6 earth-quakes over the following month. Small earthquakes were also triggered at 13 volcanoes according to the Coordinating Committee for Prediction of Volcanic Eruption.
Apart from the foreshocks, there were no clear precur-sory signs or large pre-slip. The foreshocks themselves were only identified as precursory with hindsight. Current models of earthquake clustering suggest that the probabil-ity of having an Mw 9.1 earthquake following an Mw 7.2 earthquake within 2 days is <0.001% and thus a societally useful prediction could not be provided based on the fore-shocks alone.
Modeling of seismic, crustal deformation, and tsunami data shows very large slip on the fault plane, with values up to 30–50 meters (e.g. Simons et al., 2011, Sato, et al., 2011, Ammon et al., 2011, Ohta et al., 2011, Lay et al., 2011). The area of maximum slip is on the shallow portions of the fault trenchward of the hypocenter. The large and shallow slip near the trenchward limit of the megathrust caused large deformation of the seafloor, which generat-
ed the devastating tsunami. Because of the dense net-work of observa-tions in the region prior to the earth-quake, the ex-tremely large slip has been verified by direct obser-vations of dis-placement on the seafloor through repeat bathyme-try and GPS.
The earthquake produced severe strong ground motions with accelerations over 1 g and long durations of about 100 s. However, the large losses of lives and property were mainly due to the tsunami, and shaking damage was relatively limited, considering the size and intensity of the earthquake. Even the well-publicized problems at the Fukushima No. 1 nuclear power plant were caused by loss of power due to the tsunami inundation, and not by the shaking itself. The resilience of most structures through-out the region can be attributed to the high seismic stan-dards of Japanese construction.
During the Tohoku earthquake, the regions of the fault that produced the dominant high-frequency energy are different from the areas of large slip. The large slip is on the shallow updip portion of the fault, while the high-frequency radiation originated from the deeper downdip portions of the fault (e.g. Ide et al., 2011, Wang and Mori, 2011, Koper et al., 2011). The difference in fre-quency of the radiated energy for different portions of the fault reflects variations in rupture dynamics. The deeper portion appears to be have undergone a more brittle rup-ture with a higher proportion of radiated energy, while the large shallow slip probably absorbed more energy through dissipated processes. The greater dissipation may be char-acteristic of tsunami earthquakes and can be studied by sampling this portion of the fault with a borehole.
Box 1: The 2011 Off the Pacific Coast of Tohoku Earthquake (Mw9.0)
140° 142° 144° 146°34°
35°
36°
37°
38°
39°
40°
41°
92 mm/yr
PacificOcean
Hons
hu
-6000 -4000 -2000 0 2000Bathymetry/Elevation (m)
62.9, mpilS
40.00 17.1
Figure 1. Teleseismic P-wave inversion for slip (Lay et al., 2011). Maximum slip ranges from 40–80 for a suite of inversion models with the majority of models placing large slip near the trench. Most models do not directly incorporate the ocean bottom observations in Figure 2 and 11 which require large slip towards the updip end of the rupture.
Figure 2. Horizontal coseismic displacements at seafloor benchmarks, associated with the Tohoku earthquake. Red squres are locations of GPS benchmarks and yellow star is the epicenter of the mainshock (Sato et al., 2011b)

180˚ 150˚W 120˚W
-60˚
-30˚
0˚
30˚
60˚
-60˚
-30˚
0˚
30˚
60˚
ICDP
IODP
83
4
4
17
1
52
5 36
6
180˚ 150˚W 120˚W
N
2
90˚W 60˚W 30˚W 0˚ 30˚E90˚E 120˚E 150˚E
90˚E 120˚E 150˚E 90˚W 60˚W 30˚W 0˚ 30˚E
ESO Operations Platform Dates Port of Origin
No expedition is currently scheduled.
336 - Mid-Atlantic Ridge Microbiology JOIDES Resolution 16 Sep.–17 Nov. 2011 Bridgetown, Barbados
339 - Mediterranean Outflow JOIDES Resolution 17 Nov. 2011–17 Jan. 2012 Ponta Delgada, Azores
340T - Atlantis Massif Oceanic Core Complex JOIDES Resolution 17 Jan.–6 Feb. 2012 Lisbon, Portugal
340 - Lesser Antilles Volcanism and Landslides JOIDES Resolution 6 Feb.–18 Mar. 2012 St. John's, Antigua
341 - Southern Alaska Tectonics Climate and Sedimentation Experiment JOIDES Resolution 2013 (dates TBD) Victoria, B.C., Canada
342 - Newfoundland Paleogene and Cretaceous Sediment Drifts JOIDES Resolution 18 Jun.–17 Aug. 2012 Curacao, Dutch Antilles
337 - Deep Coalbed Biosphere off Shimokita Chikyu Cancelled*** Hachinohe, Japan
338 - NanTroSEIZE Plate Boundary Deep Riser - 2 Chikyu Jun. 2012–Dec. 2012 Shingu, Japan
ICDP - Project Schedule http://www.icdp-online.org/projects/
IODP - Expedition Schedule http://www.iodp.org/expeditions/
3
Schedules
1
2
4
CDEX Operations ** Platform Dates Port of Origin
ICDP Projects Drilling Dates Location
Colorado Plateau Oct. 2011 Arizona, U.S.A.
Lake Ohrid Jun. 2011–Jul. 2012 Macedonia, Albania
Campi Flegrei Sep. 2011–Sep. 2012 Naples, Italy
Songliao Basin Sep. 2011–Sep. 2012 Daqing, China
COREF Jan. 2012–Jul. 2012 Ryukyu Islands, Japan
GONAF Apr. 2012–Jul. 2012 Istanbul, Turkey
1234
5
TBD=to be determined* Sailing dates may change slightly. Staffing updates for all expeditions to be issued soon.** CDEX schedule subject to OTF and SAS approval.***Expedition is currently postponed indefinitely due to earthquake in northeastern Japan.
6
7
8
USIO Operations * Platform Dates Port of Origin
5
6