
Public Programs, Innovation, and Firm Performance in Chile
46
Public Programs, Innovation, and Firm Performance in Chile Roberto Alvarez Gustavo Crespi Conrado Cuevas Inter-American Development Bank Competitiveness and Innovation Division (IFD/CTI) TECHNICAL NOTES No. IDB-TN-375 February 2012
Transcript of Public Programs, Innovation, and Firm Performance in Chile

Public Programs, Innovation, and Firm Performance in Chile
Roberto Alvarez Gustavo Crespi Conrado Cuevas
Inter-American Development Bank
Competitiveness and Innovation Division (IFD/CTI)
TECHNICAL NOTES
No. IDB-TN-375
February 2012

Public Programs, Innovation, and Firm Performance in Chile
Roberto Alvarez Gustavo Crespi Conrado Cuevas
Inter-American Development Bank
2012

http://www.iadb.org The Inter-American Development Bank�Technical Notes encompass a wide range of best practices, project evaluations, lessons learned, case studies, methodological notes, and other documents of a technical nature. The information and opinions presented in these publications are entirely those of the author(s), and no endorsement by the Inter-American Development Bank, its Board of Executive Directors, or the countries they represent is expressed or implied. This paper may be freely reproduced.
1
Public Programs, Innovation, and Firm Performance in Chile*
Roberto Alvarez Gustavo Crespi Conrado Cuevas [email protected] [email protected] [email protected] Department of Economics and Inter-American INTELIS, INTELIS, University of Chile Development Bank University of Chile
Abstract
This paper evaluates the impact of two public programs, FONTEC and FONDEF, aimed at fostering innovation in Chilean firms. With the cooperation of several public agencies, participants and non-participants in these programs during the period 1995–2000 were identified from a large panel of firms in the manufacturing sector. From this information, the effect of the programs could be determined using propensity score matching (PSM) and differences in differences (DID) in a multiple treatment setting. Results show that these programs have generally been associated with increases in employment and productivity, but the impact is heterogeneous across programs and indicators of firm performance. JEL codes: D22, L2, O3 Keywords: innovation, policy evaluation, employment, wages, productivity
* The authors would like to thank CONICYT and CORFO for providing information on participating firms and the National Institute of Statistics for matching information with the Manufacturing Survey, as well as José Miguel Benavente, Claudio Bravo-Ortega, Gonzalo Herrera, Alfredo Liu, Alejandro Guerra, Esteban Zapata, Andrés Zahler, and seminar participants at the Ministry of Economy of Chile, University of Chile, and GLOBELICS 2011 for their useful comments and suggestions, and Rolando Campusano for his valuable research assistance. They are also grateful to the Millennium Science Initiative (Project NS 100017 “Centro Intelis”) for their financial support.
2
1. Introduction
There is broad consensus that innovation is an important source of productivity growth and
that it can explain why some countries get richer and others fall behind. Under this
assumption and given that market failures do not allow countries to reach optimal levels of
innovation, most countries around the world have implemented fiscal incentive programs to
improve private sector innovation and productivity.1 In Chile, since the mid–1990s,
successive governments have promoted business innovation policies oriented to improving
long-run productivity and economic growth. Although there is some evidence that fiscal
incentives encourage firm-level investments in innovation, the impact of these public policy
programs on firm performance in developing countries in general, and in Chile in particular,
has not been fully evaluated.2
A few specific programs in Chile have been analyzed. An early attempt to evaluate a
public policy program was carried out by Benavente and Crespi (2003), who looked at the
effects of PROFO (Group Development Projects) on firm performance. However, this
program is not directly linked to the improvement of innovation outcomes. The PROFO
Program was designed to overcome scale barriers that could impede access of small and
medium-sized enterprises (SMEs) to technology, markets, and management skills by
providing incentives for firms to voluntarily come together to address a common set of
production or management problems (Tan, 2009).
Benavente et al. (2007) evaluated the FONTEC program using a survey specially
designed for a sample of treated and untreated firms. The treated firms correspond to those
1 Fiscal incentives come in two forms: direct subsidies and tax incentives. In the case of Chile, the bulk of the fiscal incentives system has been based on direct subsidies. Recently, Chile began exploring tax incentives. 2 For a review of the evidence for some programs and countries in Latin America, see Hall and Maffioli (2008) and Lopez-Acevedo and Tan (2010).

3
funded by Line 1 during the period 1992–2002.3 The results suggest a positive effect of this
program in terms of input additionality. It increased the overall R&D budget of the firms, but
it did not stimulate additional private investment in innovation activities (the crowding-in
effect). They also found that FONTEC effectively promoted process innovation and fostered
changes in the innovation strategy of the firms, but it did not significantly foster patenting
activities and had no significant impact on the creation or adoption of new products. In terms
of firm performance, they found that FONTEC increased sales, employment, and exports, but
did not significantly affect productivity. However, one problem with the methodology used
in this paper is that because the information on firm performance was collected through a
dedicated survey, it is subject to recall bias. Another problem is that firms were followed
over fixed period of three years from the innovation project’s inception, leading to results
that have validity only for the short term.
Tan (2009) used a specific question on the World Bank’s Investment Climate Survey to
identify firms that had made use of different productive development programs offered by
the Chilean Development Agency (CORFO). After identifying both treated and untreated
firms, he linked the results to the Annual Survey of Manufacturers in order to evaluate the
various programs offered by CORFO. He found evidence that participation in these programs
is associated with improvements in intermediate outcomes (training, adoption of new
technology, and organizational practices). He also found statistically significant effects of
these programs on sales, production, labor productivity, wages, and exports. Interestingly, the
3 FONTEC operates five lines. Line 1 corresponds to projects aimed at developing new products and improving production process. The other four financing lines cover technological infrastructure, group technological transfer, technology transfers organizations, and pre-investment studies. For more details, see Benavente et al. (2007).
4
findings reveal positive effects for subsidized technical assistance programs, and support for
cluster formation and technology upgrading, but not for financing programs.
One problem with Tan’s (2009) methodology is that beneficiaries are identified from
self-reported information provided by the firms. This introduces an unknown bias to the
estimates due to measurement error with regard to the treatment variable. Moreover, although
firms are followed over a longer period of time, findings are only valid for the cross-section
of firms that actually answered affirmatively to the enterprise survey, and there is no way to
guarantee that the findings can be also extrapolated to other cohorts of beneficiaries.
There are other recent program evaluations for Chilean instruments, but they are not
directly focused on innovation. Bonilla and Cancino (2011) measure the impact of the Seed
Capital Program of SERCOTEC, a program attempting to reduce the problem of financial
access for small firms. The results show a positive and significant effect on employment, but
not on sales. Arráiz, Henríquez, and Stucchi (2011) evaluated the impact of the Chilean
Supplier Development Program, which is aimed at improving and stabilizing commercial
linkages between SMEs suppliers and their large-firm clients. The results show a positive
effect of this program on employment, sales, and the sustainability of the SMEs suppliers.
More recently, the SMEs division of CORFO carried out a full impact evaluation of the
different programs aimed at productivity upgrading by SMEs (CORFO, 2010). The findings
suggest that programs that provide technical assistance (such as the Technical Assistance
Fund-FAT) and even the PROFO program had no impact on firm performance. This was not
the case with regard to cluster and supplier development programs, where the results were
encouraging. A notable feature of this evaluation is that it makes use of tax registry
information, which allows for the identification of almost all the beneficiaries and for access
5
to a large group of potential control firms. However, this same virtue is also a problem, as the
information contained in the tax register on firm characteristics is very limited, which makes
it of little use in identifying a comparable group of control firms. Another methodological
problem with this evaluation is that it follows beneficiaries over a very short period of time—
two years on average—so the results are only valid for the short term.
This paper evaluates the impact of two public programs aimed at increasing innovation
in Chilean firms. In contrast to previous evidence, we use a large panel of plants in the
manufacturing industry during the period 1995–2006. We do not have to rely on special
surveys that might not be representative and are affected by recall bias. With the cooperation
of the Chilean National Research Council (CONICYT) and CORFO, we identified firms that
have participated in these programs. In collaboration with the National Office of Statistics
(INE), we linked this information to the national annual manufacturing survey (ENIA),
which yielded a large group of potential control firms. This information allows us to identify
the effect of the programs using propensity score matching (PSM) and differences in
differences (DID). Moreover, since there is a small overlap in the beneficiaries of the two
programs, we were able to apply a multiple-treatment methodology and determine whether
both programs have reinforcing effects.
Our results show that these programs are associated with both employment and
productivity growth, but that the impacts are heterogeneous not only across programs and but
also according to the indicator of firm performance. In addition, the evidence points to an
important reinforcing effect of using both programs. However, this finding needs to be
evaluated taking into account that the sample of multiple users is very small.

6
This paper is structured as follows. The next section discusses the rationality for
government intervention with regard to the business innovation. The third sections describes
the main features of the assessed programs. The fourth section presents the data and the main
findings on program utilization. The fifth section presents the methodology. The sixth section
provides the results of the programs evaluation using several specifications. The seventh
section concludes.
2. The Rationale for Innovation Policy
The fundamental premise underlying innovation policies is that government intervention
would be necessary if profit-driven actors underperformed with regard to the production
and/or exchange of technological knowledge from a social welfare perspective (Steinmueller,
2010). The economics of innovation literature has provided several rationales justifying that
this is indeed the case. Broadly speaking, the rationale for public policy in this field can be
articulated around the following considerations:
(i) Spillovers and the “public good” nature of knowledge
Since the seminal works by Nelson (1959) and Arrow (1962), scientific and technological
knowledge has been regarded as a nonexcludable and nonrival good. To the extent that
private benefits associated with knowledge creation are not fully appropriable by the
innovators, this creates a wedge between the private and social returns of knowledge
investments, leading to a rate of investment in knowledge that will fall short of socially
optimum levels. This rationale applies not only to the levels of innovation efforts but also to
the direction of these efforts. Certainly, the “public good” rationale of knowledge applies

7
more strongly to scientific than technological knowledge.4 To the extent that the latter is
more applied, predictable, and linked to firm-specific assets, it is more likely that innovators
will be able to collect a larger share of the value of innovation to society, so that private
sector investments in technological knowledge would be closer—although not equal—to
socially optimal levels.5
(ii) The problem of asymmetric information
The economics of information literature (Stiglitz and Weiss, 1981) makes clear that
asymmetric information in market transactions (due to the problems of adverse selection and
moral hazard) can affect firm innovation from two different perspectives. From the
perspective of investment theory, innovation projects have several peculiar characteristics,
which differentiate it from ordinary investment (Hall and Lerner, 2010). First, innovation
projects are riskier than physical investment projects. Consequently, external investors might
require a higher risk premium for the financing of innovation activities. Second, because of
the problem of spillovers, innovators are reluctant to share information about their projects
with potential outside investors, further worsening the asymmetric information problem.
Third, the difficulty of using intangible assets as collateral also leads to increased costs for
external capital in the form of a higher risk premium. In summary, asymmetric information
creates a wedge between the opportunity cost that private innovators require for their
innovation investments and the cost of capital that external investors are willing to charge to
4 On the other hand, projects with a significant basic research component are unlikely to produce results with commercial application in the short run. Although this may discourage private investment, the projects could still have a high social return because of the skills and knowledge produced during their development, apart from their final achievements. 5 The applied nature of technological knowledge also makes it more prone to being protected by intellectual property rights. However, this by no means implies that firm investment in technological knowledge will be socially optimal; appropriability problems also exist in the case of this knowledge, as the coverage offered by intellectual property rights protection is usually limited.

8
finance innovation projects. The result is that privately (and eventually socially) profitable
innovation projects will not materialize because the cost of financing is simply too high.
The second perspective on how asymmetric information affects innovation concerns
knowledge dissemination, and it relates to the fact that private actors do not have perfect
information on technology or production possibilities. Adverse selection and moral hazard
problems also extend to the (imperfect) operation of technology markets. This claim is
consistent with two empirical findings: (i) that there are persistent differences in the
technological performance between countries, so that catching up is far from being an
automatic process, consistent with the idea of knowledge as a global public good (Fagerberg
and Verspagen, 2002); and (ii) that the process of technology diffusion, even within narrowly
defined industries, is sluggish, leading to a persistent firm heterogeneity in productive
performance (Disney, Haskel, and Heden, 2003).
(iii) The pervasiveness of coordination and institutional failures
A key contribution of the innovation systems literature is that knowledge has non-negligible
tacit components and as such innovation is the result of feedback and interaction involving
numerous actors (Lundvall, 1992). Although many of these interactions are market mediated,
a large proportion of them are governed by nonmarket institutions. Because the efficiency of
this process at the macro level depends on the behavior of individual actors and the
institutions that govern their interaction, coordination problems might arise (Soete,
Verspagen, and Ter Weel, 2010). Solving the coordination problem requires paying attention
not only to the linkages among the actors but also to their absorptive capacity (Cohen and
Levinthal, 1989). The concept of absorptive capacity is a key ingredient of the new literature
of innovation, in particular from the perspective of catching-up economies. Following
9
Steinmueller (2010), the concept of absorptive capacity refers to fact that new knowledge
might not be employable without heavy co-investments by the users in corresponding human
capital and learning; furthermore, it implies that the new knowledge might not be
reproducible without the direct assistance of the originator.
To the extent that institutions govern human interactions, the innovation systems
literature puts strong emphasis on institutional governance and change. These are
institutional design arrangements that foster public-private interactions while minimizing
problems of moral hazard. Institutional change interventions build linkages between the
different actors involved in the innovation process (universities, public research
organizations, technology producers and users, consumers, etc.) either by defining new roles
for existing institutions (such as allowing the patenting of university research in order to
encourage technology transfer) or by creating clubs or consortia that regulate interactions
between the agents (Steinmueller, 2010). These sorts of arrangements may lead to a better
equilibrium because innovation costs are not duplicated in separate efforts that lead to
identical results, several externalities are internalized, and access to complementary tacit
knowledge is encouraged.
3. The Implementation of Innovation Policy: The Case of Chile
The previous analysis offers different conceptual frameworks that justify the implementation
of innovation policies based on the idea that profit-seeking agents will produce both a level
and direction of knowledge investments that will fall short of socially desirable outcomes.
According to David, Hall, and Toole (2000), broadly speaking, public policy has suggested
two main approaches to solving the under-provision of innovation efforts by private firms: (i)

10
direct production of knowledge in public institutions (universities, laboratories, and public
research institutes); and (ii) fiscal incentives for a greater amount of private investment in
knowledge generation. Without ignoring the importance of government investment in public
research organizations, the issues of governance, funding incentives, and productivity
impacts related to the operations of these organizations are sufficiently complex as to require
a far more specific focus than the scope of this paper allows. The focus herein is on a
particular class of fiscal incentives: direct subsidies, without ignoring that there are other
available types of fiscal incentives, such as tax incentives and entrepreneurship programs,
among others. However, coverage and implementation experience in the case of Chile is far
more limited.
Since the early 1990s, the Chilean government, through diverse public agencies, has
implemented several programs designed to support innovation and productivity in private
firms. This paper focuses on two such programs, FONTEC and FONDEF.
FONTEC (National Productivity and Technological Development Fund), managed by
the Chilean National Development Agency (CORFO), provides financing for innovation
projects carried out by private firms. FONTEC was established in 1991 and has supported
more than 2,200 business innovation projects. FONTEC operates as a matching grant,
subsidizing a percentage of the total costs of the private projects, the private co-funding has
varied between 40 and 65 percent, and it has increased over time (Benavente, Crespi, and
Maffioli, 2007). The subsidy never covers the full costs of the supported project, allowing for
better alignment between the goals of the public agency and the firm, somehow controlling
for the potential problem of moral hazard. In other words, if the beneficiary wants to increase
the size of the innovation project in order to extract a higher subsidy, it will have to pay

11
more. Related to this, a noteworthy feature of this cost-shared approach is that public
agencies can also adjust the amount of the co-funding according to the main characteristics of
the projects or the beneficiary. Indeed, in the case of innovation projects, the share of the
subsidy might increase when the project implies the participation of more than one
beneficiary since it is expected that projects that involve more than one firm or a firm
collaborating with a university might lead to higher spillovers.
Sometimes subsidies might target the fixed capital component of an innovation project
(for example, the R&D laboratory or the CAD system) under the assumption that when these
capabilities are available they might reduce the innovation costs of future innovation
projects. Alternatively, there might be an increase in the subsidy component when the
project’s beneficiary is a small firm, under the assumption that the intensity of market
failures faced by SMEs is also higher. Finally, the operation of the co-funding mechanisms is
implemented through the ex-post reimbursement of the approved expenditures that qualify
for the subsidy.
Box 1 provides the main objectives of these programs and a description of the financing
lines. The focus of evaluation is on the impact of the Line 1, which is the utilization of direct
subsidies oriented to business innovation. This line only finances innovation projects carried-
out by individual firms. The Line 1 represents the backbone of FONTEC, with more than 70
percent of the total number of supported projects and almost 80 percent of total funding
(between 1992 and 2004). The remaining lines described in the box had much lower activity.
An important attribute of FONTEC is that grants are allocated under an open window
system on a first in-first out basis. External peer reviewers technically assess innovation
projects submitted by firms, and an adjudicatory committee with representatives from both

12
the public and private sectors makes the decision. The rationale for the open window system
rests on the idea that business innovation support requires flexible and fast assessment
mechanisms, goals that are more difficult to achieve in the case of a system based on calls for
proposals. Although this approach provides for a more flexible system, the main drawback is
that the competition component normally associated with a call for proposal system might be
somehow mitigated.
It is clear from Box 1 that the main objective of Line 1 of FONTEC is to provide for a
better alignment between internal and external costs of financing innovation projects,
providing a signal to both firms and financiers that they should become involved in
innovation. Thus, it would appear that Line 1 is targeting an asymmetric information problem
and the typical liquidity constraints that hinder business innovation.
In March 2005, FONTEC was formally terminated and merged with another fund
(known as the Innovation Development Fund—FDI), giving rise to a new organizational
structure called INNOVA. The merger was motivated not only by the need to increase the
operational efficiency of both funds and avoid duplication of effort, but also by the need to
create an organization capable of implementing programs with a sector focus in addition to
the standard “open window” system. Despite this, many of the lines of FONTEC, and in
particular Line 1 (renamed “business innovation”), remained in operation under INNOVA.
However, because in 2006 INNOVA put in place new programs to support the generation of
sector public goods, entrepreneurship, and technology transfer and diffusion, the share of
Line 1 in the overall budget of INNOVA declined to about 25 percent.
FONDEF (Science and Technology Development Fund), managed by CONICYT,
provides funding for precompetitive R&D and technology projects organized jointly by

13
universities, technology institutes, and the private sector. The government’s subsidy also
corresponds to a matching grant covering part of the total costs of the project (Tan, 2009).
The objective of this program is to contribute to improving the competitiveness of the
national economy through joint projects between research institutions and private companies
to carry out applied research, precompetitive development, and technology transfer.
The financing is directed at universities and nonprofit research and development
institutions, as main beneficiaries, but private sector participation is required. A main
difference between FONDEF and FONTEC is that the allocation of the research and
development grants is carried out through an annual public bidding process based on project
proposals, although an open window system operates for the financing of technology transfer
projects. The maximum contribution of FONDEF is 55 percent of the total cost of the project
with a maximum of approximately US$900,000 for projects with a duration of 36 months.
The research institution (executor) involved in the project is required to contribute an amount
equivalent to 20 percent of the total cost of the project. For associates and companies, the
required minimum contribution is 25 percent of the total cost of the project. For those
projects requiring more time to be executed (up to 72 months), there is a maximum amount
of about US$1.5 million financed by FONDEF.6
For FONDEF, the economic justification seems to be more closely related to the idea of
subsidizing coordination failures and internalizing innovation spillovers through the
formation of joint ventures and collaboration. In other words, in addition to providing cash
financing, its objective was to create incentives for aligning the interests of public research
organizations with those of the productive sector. These incentives would also allow
6 The contribution of private agents can also be nonfinancial resources, such as hours worked by firm staff, facilities, and others.

14
companies to obtain access to a large set of complementary knowledge assets and
technological infrastructure to implement their innovation programs.
Because tacit knowledge is not easily transmissible among multiple economic agents, the
strengthening of innovation requires government-sponsored incentives for the establishment
of formal agreements among the different organizations that are part of the innovation
system. These joint projects between research institutions and firms would facilitate
communication and exchange of information between suppliers and users of new
technologies.
In sum, although FONDEF and FONTEC, by co-financing private initiatives, have the
primary objective of improving innovation capabilities and productivity at the firm level,
they aim at achieving this through very different mechanisms. While FONTEC focuses on
alleviating the financial constraints that harm business innovation, FONDEF alleviates
coordination failures that hinder collaboration and interaction between public research
organizations and firms. Given the different nature of these two programs, it is important for
policy design not only to compare them in terms of their impacts on business performance,
but also to determine whether there are synergistic effects that would suggest the need for
better coordination between the two programs. Before moving to the impact evaluation
methodology, the next section describes the data used for evaluation in more detail.

15
Box1: Objectives of FONTEC and Financing Lines
The main objectives of this program are: i. “to promote Research and Development (R&D), scientific technical services and other
activities that contribute to technological development and thereby help enhance the ability of private business to compete and increase their output;
ii. to expand the national technology supply and use of technology either generated or adapted in Chile”; and
iii. to promote interaction and cooperation between the country’s public research organizations and its businesses encouraging them to undertake joint projects”
FONTEC operates five financing lines: Line 1 - Technological innovation: it finances projects aimed at developing new products and improving production processes. It covers the development of prototypes and market testing. The FONTEC subsidy cannot exceed 50 percent of total costs. Line 2 - Technological infrastructure: it finances investment in physical infrastructure, installation, equipment and the training of staff involved in the development of this infrastructure. The co-financing limit ranges between 20 percent and 30 percent, depending on whether the investment is submitted by a single firm or a group of firms. Line 3 - Group transfer: it supports projects submitted by a group of at least five firms and it covers the cost of technological missions abroad, training, and technical assistance held by highly specialized international experts. The co-financing limit is fixed at 45 percent for technological missions and 50 percent for specialized consultants. In any case the amount of funds granted by FONTEC cannot be higher than US$100,000. Line 4 - Technology transfer organizations: it finances projects submitted by groups of at least five firms with the aim of setting up a technology transfer center to study, develop, disseminate, and adapt technology. The maximum subsidy is equal to 50 percent of the investment and cannot be higher than US$400,000. Line 5 - Preinvestment studies: it supports evaluations and studies of potential technological investment. Maximum financing cannot exceed 50 percent of the overall cost or US$15,000.

16
4. Data
The dataset used in this paper is a combination of two main sources of information: The
Annual Survey of Manufacturers (ENIA) and data on firms participating in FONTEC and
FONDEF during the period 1995–2006. Although information on program participation is
available for a longer time period, at the time of this evaluation the manufacturing survey
(ENIA) carried out by the National Institute of Statistics of Chile (INE) was available only
for the period 1995–2006.
This survey covers all Chilean manufacturing plants with 10 or more workers. For each
plant and year, ENIA collects data on production, value added, sales, employment, and
wages (production and nonproduction), exports, investment, depreciation, energy usage,
foreign licenses, and other plant characteristics. In addition, plants are classified according to
the International Standard Industrial Classification (ISIC) rev. 2. The fact that we are using
ENIA as our business register implies that we are only able to assess the programs’ impacts
on manufacturing firms. According to information from program records, a little over 50
percent of the beneficiaries are manufacturing firms, with agriculture being the second
largest sector (about 20 percent of beneficiaries) (Benavente and Price, 2009).
In contrast to ENIA, where information is recorded at the plant level, the information on
participation in public programs is provided at the firm level, and a firm can have more than
one plant. In such a case, the INE carried out a procedure for matching firm-level with the
plant-level information. We have information for treated plants only, distinguishing between
those belonging to a multi-plant and those that are one-plant firms. The empirical part of this
paper assumes that all plants belonging to a firm participating in this program are treated.7
7 Other allocation algorithms are also possible. For example, projects could have been allocated to the largest plant in the firm or to the lowest plant in the firm. Also, we could drop multi-plant firms. However, given the
17
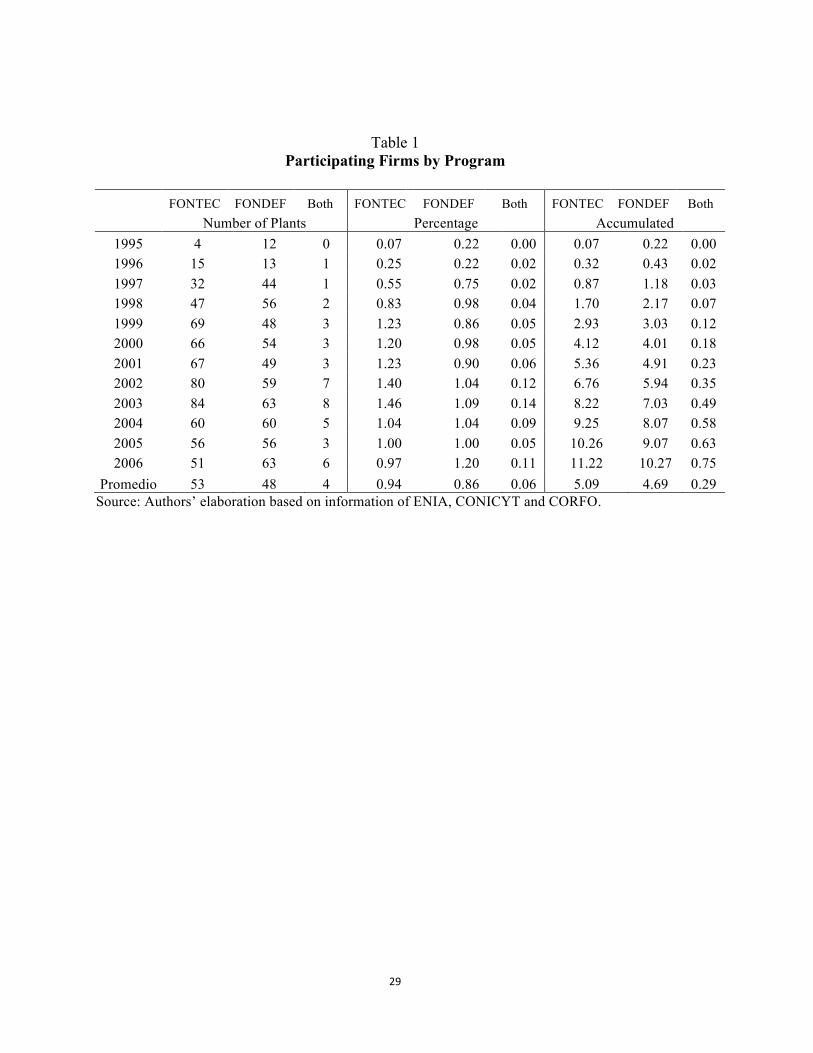
The descriptive statistics show that a few plants have been beneficiaries of business
innovation support programs. Table 1 shows the number of plants, the percentage over the
total number of plants, and the accumulated percentage for each year during the period 1995–
2006. On average, approximately 50 plants per year have participated in these programs,
representing less than 1 percent of the total number of plants. In the case of plants using both
programs, the number of participants is even lower, reaching a maximum of 8 plants in 2003,
only 0.15 percent of the total number of manufacturing plants. However, by the end of the
period, approximately 10 percent of the plants in the manufacturing industry had participated
in FONTEC or FONDEF, and 0.75 percent of then had used both instruments jointly.
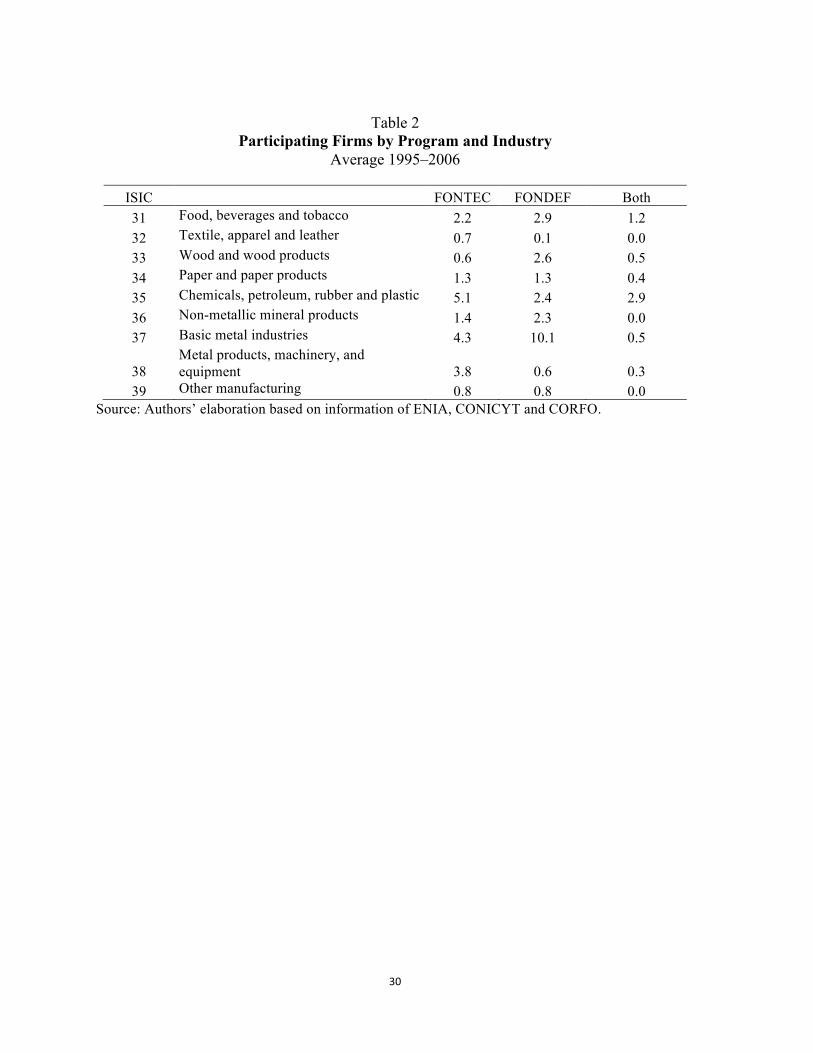
Table 2 show the distribution of participating plants across 2-digit industries for the
period 1995–2006. The highest rate of participation in FONTEC corresponds to plants in the
chemicals (35) and basic metals industries (37). In the case of FONDEF, the utilization of
this program is higher for basic metals industries (37) and food, beverage, and tobacco
industries (31). For firms using both instruments, those that used them the most were the
chemicals industries.
5. Methodology
5.1 Evaluation Issues
The impact of two different programs on several measures of firm performance was
evaluated using a quasi-experimental approach. Although innovation policies might be
justified by the presence of market, coordination, and institutional failures, successful
implementation needs to take into account the government’s ability to deliver solutions. In
arbitrariness of the first choice and the loss of too many observations in the second (about 40 percent of treated plants belong to a multi-plants firm) prevent us of using these alternatives.

18
real life, governments face informational constraints that may be as or even more severe than
those of firms. Firms, R&D projects, and innovations are highly heterogeneous. This means
that policy that is optimal in the strict sense of achieving Pareto efficiency should vary not
only from firm to firm, but also from project to project. This puts administrating agencies
under a severe informational stress (Toivanen, 2009). Although there might be a strong case
for STI policies, actual implementation could easily lead to the wrong results. In other words,
public support could lead to the crowding out of private efforts.
According to Lach (2002), firms normally have a portfolio composed of several
innovation projects. Under a matching-grant system, from the firm’s point of view, receiving
a subsidy may turn an unprofitable project into a profitable one or, alternatively, it may
accelerate completion of a project already underway. If subsidies involve the setting up or
upgrading of research facilities, the fixed costs of future research projects will be reduced,
increasing the probability that they will be completed or undertaken. The know-how gained
from the project being supported can spill over to other current and future research projects,
thereby enhancing their prospects for success. In all these ways, a matching-grant subsidy
may stimulate current and future research projects. If these hypotheses are true, a crowding-
in effect of public financing on private innovation investment can be expected.
However, it is also possible to expect that some research projects would have been
carried out in the absence of government funding anyway. There are several external sources
of funds for research projects, including public, foreign, or multilateral institutions; the
financial sector; and foundations. This possibility of substitution can be increased by
administrators who are often under pressure to avoid the appearance of “wasting” public
funds and who may be eager to fund projects with a higher probability of success and with

19
clearly identifiable results (projects that are also likely to have access to a range of alternative
sources of funding). Another reason for substitution is that a project enhanced by a subsidy
could have an effect on the price of inelastically supplied complementary inputs (for
example, research time). If the subsidy turns an unattractive project into an attractive one, but
there are human capital constraints, the researcher or the team may decide to discontinue
what previously was an attractive project (which might have been funded by other sources).
The commitment to undertake the subsidized project may crowd out other unsubsidized
projects (and their accompanying resources). Thus, it is not possible to simply extrapolate
that increasing the firm innovation budget with public funds will lead immediately to a
proportional increase in projects and to better economic performance.
One of the first issues to be defined in impact evaluation is how and when to measure the
effects of the program, that is, the outcomes of interest. In the spirit of the CDM model
(Crépon, Duguet, and Mairesse, 1998), a distinction can be made between innovation-input
indicators and economic-performance indicators. Innovation-input indicators are those most
directly affected by the intervention. For instance, for a fiscal incentives program, an
innovation-input indicator is total investment in innovation by the beneficiary. While the
relationship between the subsidy and the total investment seems in principle almost
tautological, the previous discussion herein clearly highlights that this is not necessarily true
(see e.g. David, Hall, and Toole, 2000). In other words, to the extent that innovation policies
are able to change the firm’s marginal cost of capital and to the extent that investment
decisions react to this change in the cost of capital, it might be possible to identify the extent
to which innovation policies generate input additionality.
20
However, just assessing whether innovation efforts increase as a consequence of a
subsidy is not enough for policy evaluation purposes. The whole portfolio of innovation
projects held by the firm is normally affected. As a result, projects with different levels of
productivity might be executed while others might be postponed. Thus, assessing the outputs
of innovation investments is critical (output additionality).
Innovation outputs are variables where the concrete realization of innovation activities is
observed and their impacts on economic performance materialize. In the case of business
innovation programs, important output variables to measure output additionality are, for
example, productivity growth, employment, wages, and exports to just cite a few. The
standard approach in impact evaluation of innovation policies to date has been to focus on
input additionality or, in other words, to look at effects on innovation investments, including
R&D. This is done mainly because, due to data constraints, evaluators can follow
beneficiaries over a short period of time after receiving the grant. However, if this period is
too short, the only impact that can be truly measured is effort. This paper, however, moves
away from this constraint. The dataset herein is rich enough to enable us to follow firms for a
longer time period. Since the input additionality of FONTEC has already been tested
(Benavente, Crespi, and Maffioli 2007), the focus of this research will be on the far more
elusive output additionality.
Having beneficiaries’ time series is important because, in the case of output
additionality, a “time to build” period is normally necessary in order to determine impacts.
More generally, the impact of different programs may display different patterns over time.
An intervention may generate a one-shot increase in the outcome that could be either
persistent or fade out progressively with time; the impact of a program may only appear after

21
a certain period, or may even generate an initial drop in the outcome that is later overshot by
increases in subsequent years. As a result, a proper consideration of the timing of the effects
is crucial in an impact evaluation setting, and failures to account for these factors may lead to
misleading conclusions and policy recommendations. Even after carefully considering and
selecting the relevant outcomes and indicators, evaluating the impacts of public programs is
not a trivial task, especially when the interpretation of the relationship between program
participation and the outcomes of interest is to be causal.
In impact evaluation, the main definition of causality is based on the concept of
counterfactuals. For instance, suppose a firm receives a subsidy for innovation investment,
and suppose we observe the value of a given outcome of interest for that firm. Then, the
public subsidy is said to have a causal effect if the outcome of the firm in absence of subsidy,
but holding everything else equal, would have been different. In other words, the program or
“treatment” has a causal effect if the observed outcome when the firm receives a subsidy is
different from the counterfactual outcome, that is, the outcome that would have been
observed if the firm had not received the subsidy. While this definition of causality is
relatively simple and intuitive, it introduces a serious problem from an empirical point of
view, because the counterfactual outcome, by definition, is never observed. In other words, if
a firm receives a subsidy, it is impossible to know with certainty how this firm would have
done it without it. This problem can be approached by setting a control group of firms that
did not receive support from the program (or from any other program) selected in a way as to
minimize all the observable differences between both groups.

22
5.2 Econometric Methodology
The major challenge in impact evaluation is how to properly set the control group in a way
that renders a credible counterfactual. In any quasi-experimental impact evaluation, the key
issue is how to minimize the selection bias that emerges from both the observable and
unobservable differences between the control group and the beneficiaries in a no-treatment
state. Although the differences between the two groups cannot be tested during the period
over which the treatment is being implemented, it can be tested during the baseline period
just prior to the treatment. The empirical strategy followed in this paper uses propensity score
matching techniques in order to compare firms that are comparable where the propensity
score is estimated on the basis of firm characteristics just prior to the treatment
(characteristics both in level and in growth rates). After estimating the propensity score for
each firm, control firms that fall outside the common support for the treated firms are
eliminated from the sample. This eliminates firms in the control group that are very different
from treated firms.
Using propensity score matching techniques allows for the reduction of the selection bias
generated by differences in the observable characteristics of the firms in the different groups.
However, it does not control for the selection bias generated by unobservable characteristics.
In order to control for these characteristics, some assumptions need to be made. This paper
uses the standard assumption that unobservable firm characteristics can be approximated by a
plant-level fixed effect. This makes it possible to remove unobserved differences between the
beneficiary and the control group by using either first differences or fixed-effect estimators,
under the assumption that these differences are constant over time (see Hall and Maffioli,

23
2008). After identifying comparable firms using the propensity score estimates, fixed effects
panel data techniques are used to estimate the impacts using the selected sample of firms.
Given that in this research we have two interventions (or three treatments), the empirical
strategy summarized above needs to be adjusted. In this case, the treatment variable can take
four values, i.e. T=j with j=(0,1,2,3). The treatment is codified as follows: 0 when the firm
receives no treatment, 1 when the firm participated in FONTEC only, 2 when the firm
participated in FONDEF only and 3 when the firm participated in both.
Let Pi be the probability of receiving the treatment T=j. To estimate this probability, we
use a Probit model with j=0 as the base category. To evaluate these programs, we estimate
pair-wise Probit models between the three treatment groups and the control group. This is
different from the strategy followed by Castillo et al. (2010) for considering multiple
treatments. They estimate a multinomial Logit for the probability of participating in the
different programs using cross-sectional information. This paper does not follow this
approach, because in the period under study, plants entered treatment in different years.
Moreover, Probit allows a better balance of plants between treated and untreated using the
procedure developed by Leuven and Sianesi (2003).
We use the predicted probability from these models for finding nonparticipant firms with
similar probability of receiving treatment j. To select the appropriate control group for each
treated plant, we use the five closer neighbors following Leuven and Sianesi (2003). The
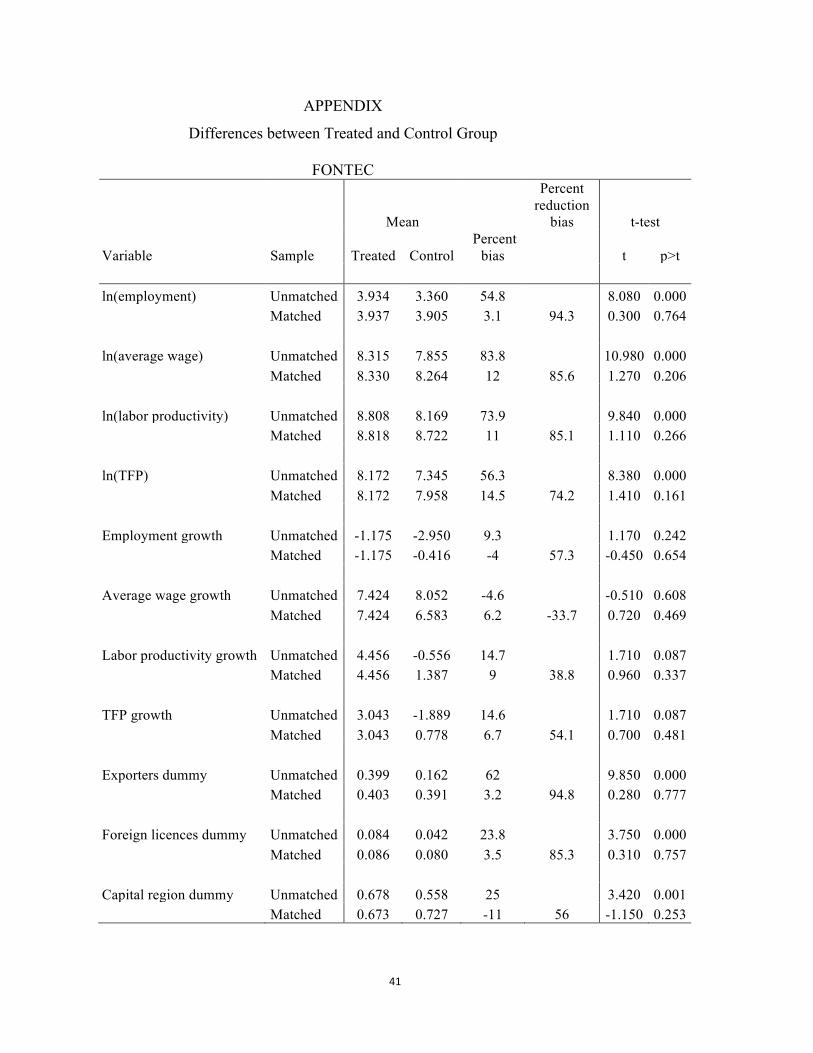
comparison between treated and control group for each treatment resulting from this
procedure is shown in the appendix. In general, the matching is relatively successful in
reducing the ex ante observable differences between treated and the control group for the
common support.

24
Second, using the sample of treated and control in the common support, we estimate the
impact of treatment for each pairwise comparison:
iktktiitjitikt XTYLog εααβθ ++++= ´)( (1)
where the Yikt is the interest outcome variable (employment, average wage, labor
productivity, and total factor productivity8), Tjit is a dummy equal to 1 since the first year is
treated until the end of the sample, Xit is a vector of control variables (specifically by age and
age squared),9 αi is a plant-specific effect, and αkt is a industry- and year-specific effect. This
last set of dummy variables controls for common temporal shocks across 3-digit industries.
For the dependent variables, employment is defined as the number of workers, average
wage as the total wage bill over the number of workers, labor productivity as real value-
added per worker, and total factor productivity (TFP).
In equation (1), the average impact over the whole period of participation is captured by
the parameter θ, and it is a useful indicator of the effect of the program. However, further
relevant information can be obtained by studying the effect of the program over time. To do
that, we modify equation (2) and define two dummy variables for treatment: one for the first
three years since the plant is treated, and one for the following years (from the fourth year up
to the end of the sample). This is not an arbitrary choice. Most of the programs last three
years, and in FONDEF specifically, the first three years are mostly oriented to research in the
technological centers associated with the project.
8 Total factor productivity is computed as the residual from the estimation of 3-digit industry production functions using the methodology of Levinsohn and Petrin (2003). 9 We control for these variables because due to learning effects related to age, impact indicators could show a different pattern according to firms of different seniority. These patterns—as the learning model suggests—could be non-linear. By controlling for these variables, we can be sure that we are comparing firms with similar patterns of learning over the intervention period.

25
6. Econometric Results
With regard to the propensity score, we estimate three different Probit models for the
probability of participating in FONTEC, FONDEF, or both programs. In each case, the
treatment variable is equal to 1 if that year the plant started a program, and zero otherwise.
Treated plants are dropped from the sample after the first year of treatment. This is done to
guarantee that they cannot be considered as untreated after that year, given that the idea is to
identify factors affecting the probability of entering into a program.
We take as explanatory variables of the probability of participation several plant
characteristics in the year before they were treated and the three years before growth rates in
some variables. Specifically, we use employment, average wage, a dummy variable that takes
value one if the firm is exporter, a dummy for foreign firms, a dummy for firms located in the
metropolitan region (the capital of the country), a dummy for firms that have purchased
foreign technical licenses, TFP, labor productivity, and industry dummies. All these variables
are measured at t-1, where t is the year of start of the program. We also include the average
growth in wages, employment, TFP, and labor productivity between t-3 and t-1 to control for
differences in outcome trends across participating and nonparticipating firms.
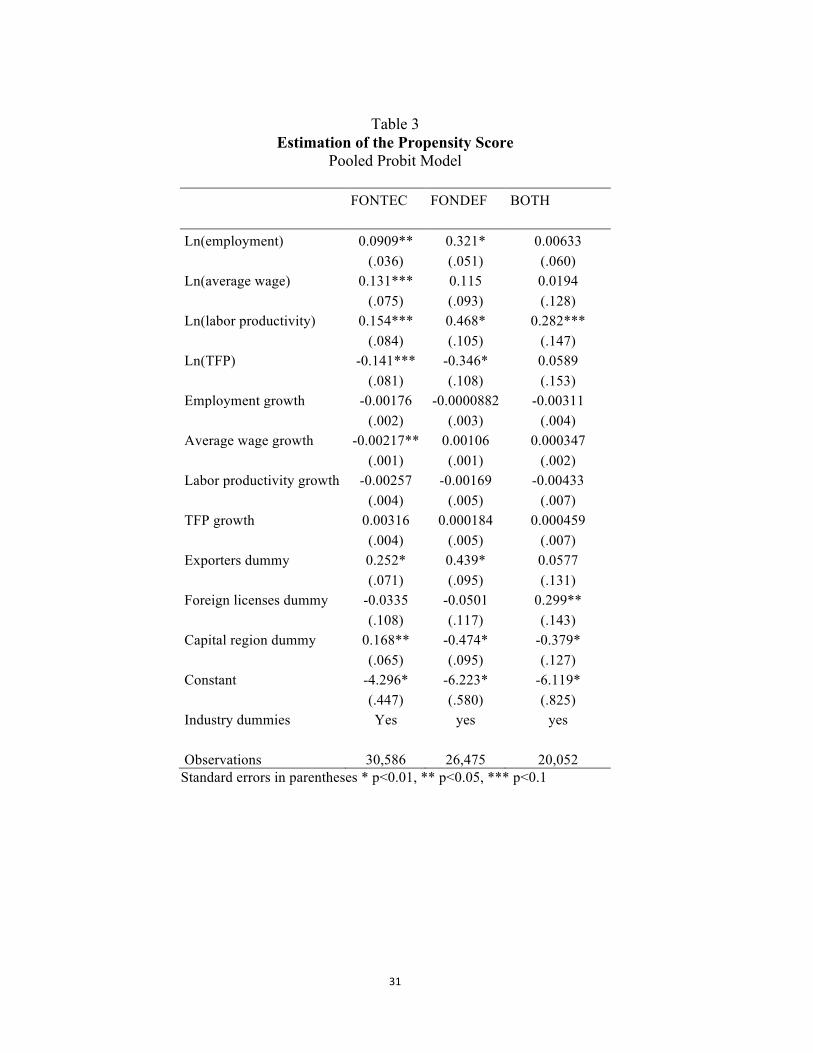
Table 3 shows the results of the propensity score. In general, we find that larger plants
(measured by the log of employment), more productive plants (measured by the log of value-
added per worker), and exporters are more likely to participate in these programs. In the case
of other level variables, we find that higher wages (a rough proxy for labor skills) increase
only the probability of participating in FONTEC, and lower productivity increases the
probability of participating in both FONTEC and FONDEF, but it does not affect the
probability of using them simultaneously.
26
Another interesting result is that most of the growth variables are not statistically
significant in relation to the probability of participating. Localization of firms in the capital
city increases the probability of using FONTEC, but it reduces the probability of
participating in FONDEF and both programs simultaneously.10 Finally, the estimations show
that purchases of foreign licenses (a proxy for efforts in technological innovation) only
increases the probability of using both instruments jointly.
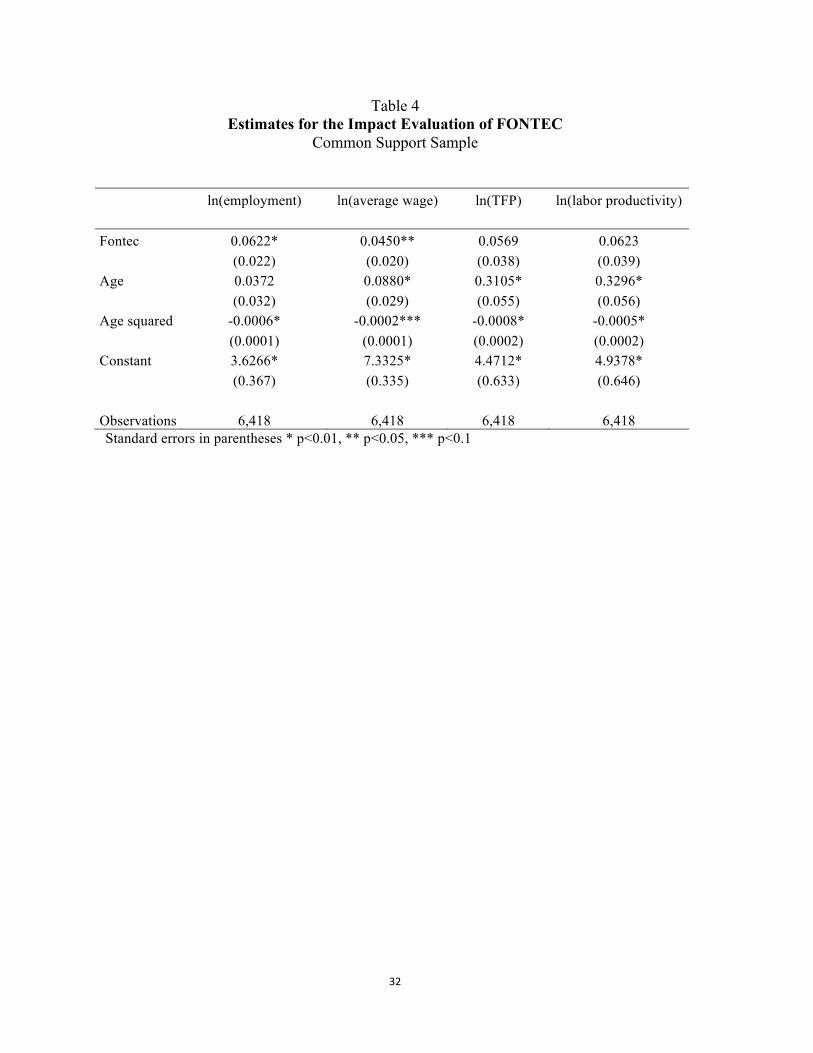
The basic results for FONTEC are shown in Table 4. Participation in FONTEC is
positively associated with all performance variables under study, but it is only significant for
employment and wages. According to these results, the effect on employment levels and
average wages is 6.4 percent and 4.6 percent, respectively. The estimation of the impact of
this program, using dummy variables for the first three years of treatment and from the fourth
year up to the end, indicates some difference in the timing of the effects (Table 5). First, we
find that the positive impact on employment is similar over time. Second, the positive effect
on wages is concentrated in the first years of treatment. Third, in contrast to previous
estimations, we find a positive impact of about 7 percent in TFP and labor productivity.
In the case of FONDEF, the results shown in Table 6 suggest more mixed outcomes.
There is a negative effect of about 8 percent on employment, which could be associated with
process innovation carried out by the treated firms. This finding is also consistent with the
positive effect of FONDEF on labor productivity of about 10 percent. However, we find no
significant impact on TFP and wages. Table 7, splitting the average impact between the first
three-years and afterwards, reveals that the negative effect on employment is distributed
almost homogenously over time, but the positive effect on labor productivity is not lasting.
10 This result is consistent with the idea that FONDEF had a higher concentration in commodities processing industries that are located mostly in regions.

27
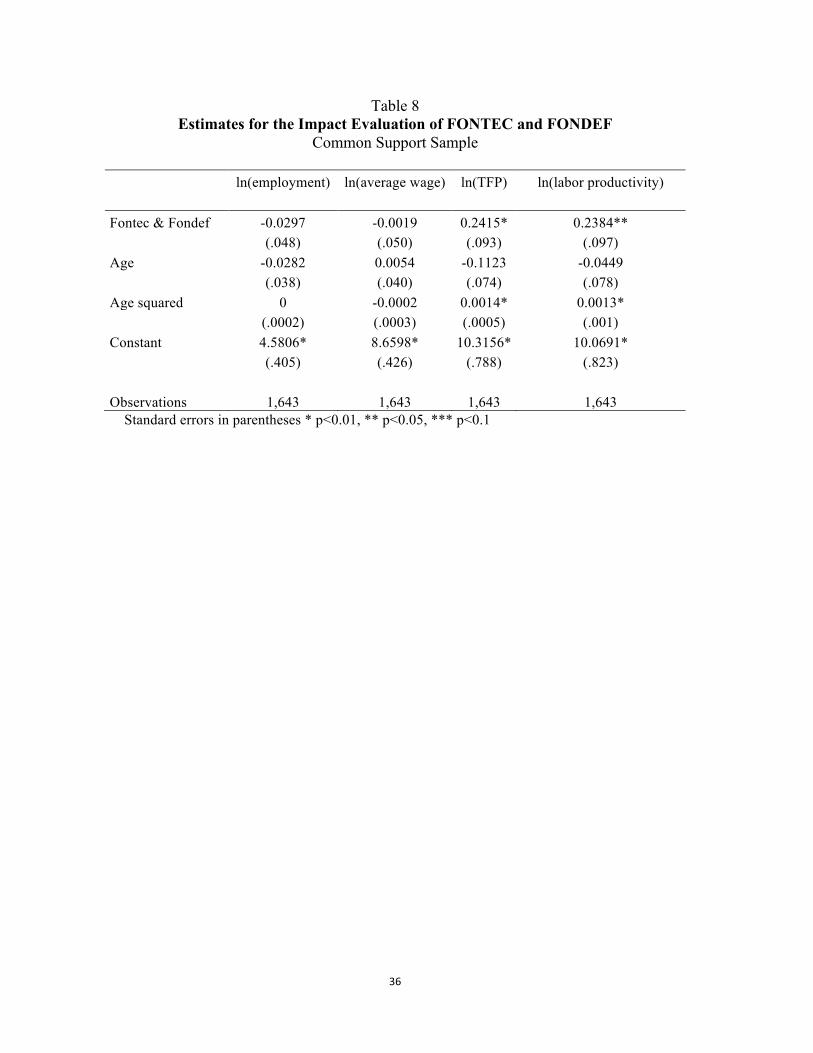
Table 8 presents the results of the impact of both programs used jointly by the firms.
These results show some evidence of positive and large effects on both measures of
productivity, on average about 24 percent. The effects on employment and wages are
negative, but they are not statistically significant. The results in Table 9 show that the effects
on TFP and labor productivity are larger after the first three years of participation in these
programs.
In sum, our results reveal that participation in these programs is associated with
improvements in the performance of the participants, with the exception of the negative
effect of FONDEF on employment. We also find that there are relevant differences not only
in terms of the variables under study but also in the timing of these effects. However, we
caution that the low number of participants in these programs, especially in the case of firms
using both of them, presents important methodological challenges for finding an adequate
control group using standard techniques of propensity score matching. There are also
limitations associated with the fact that we do not have information about intermediate
results, such as measures innovation, that impede a deeper understanding of the effects of
these program on these outcomes and how they might bring about changes in firm
performance.
7. Conclusions
Using a large panel data of manufacturing plants during the period 1995–2008, we have
evaluated the impact of two public programs, FONTEC and FONDEF, on several measures
of firm performance. Given that we did not have access to information on innovation-related
variables, we focused on four measures of performance: employment, wages, labor

28
productivity, and TFP. We used two different specifications for understanding both the
average positive effects and the dynamics of these effects over time.
Our results show that these programs are associated with increases in employment and
productivity, but the impact is heterogeneous across programs and indicators of firm
performance. FONTEC has had some positive effect on employment, wages, and both
measures of productivity. However, the effect on productivity and wages is concentrated in
the first three years of utilization of this program. In contrast, the impact of FONDEF was
found to be negative on employment and positive on productivity (labor), without generating
significant changes in wages or TFP. In addition, the evidence suggests a reinforcing positive
effect on both measures of productivity when both programs were used.
One potential explanation of this last result may be associated with the market failures
that these programs are aimed to ameliorate: (i) coordination problems and (ii) market
failures related to asymmetric information and access to financing. The effects on
productivity of using these instruments could be greater if public policies were to adopt a
design that considers both subsidies to universities to solve the coordination failure and
matching grants to firms to solve the liquidity constraints that could impede the
implementation and scaling up of innovation projects. These findings could be an important
contribution to policy discussions on the design of these instruments.
29
Table 1 Participating Firms by Program
FONTEC FONDEF Both FONTEC FONDEF Both FONTEC FONDEF Both Number of Plants Percentage Accumulated
1995 4 12 0 0.07 0.22 0.00 0.07 0.22 0.00 1996 15 13 1 0.25 0.22 0.02 0.32 0.43 0.02 1997 32 44 1 0.55 0.75 0.02 0.87 1.18 0.03 1998 47 56 2 0.83 0.98 0.04 1.70 2.17 0.07 1999 69 48 3 1.23 0.86 0.05 2.93 3.03 0.12 2000 66 54 3 1.20 0.98 0.05 4.12 4.01 0.18 2001 67 49 3 1.23 0.90 0.06 5.36 4.91 0.23 2002 80 59 7 1.40 1.04 0.12 6.76 5.94 0.35 2003 84 63 8 1.46 1.09 0.14 8.22 7.03 0.49 2004 60 60 5 1.04 1.04 0.09 9.25 8.07 0.58 2005 56 56 3 1.00 1.00 0.05 10.26 9.07 0.63 2006 51 63 6 0.97 1.20 0.11 11.22 10.27 0.75
Promedio 53 48 4 0.94 0.86 0.06 5.09 4.69 0.29 Source: Authors’ elaboration based on information of ENIA, CONICYT and CORFO.
30
Table 2
Participating Firms by Program and Industry Average 1995–2006
ISIC FONTEC FONDEF Both 31 Food, beverages and tobacco 2.2 2.9 1.2 32 Textile, apparel and leather 0.7 0.1 0.0 33 Wood and wood products 0.6 2.6 0.5 34 Paper and paper products 1.3 1.3 0.4 35 Chemicals, petroleum, rubber and plastic 5.1 2.4 2.9 36 Non-metallic mineral products 1.4 2.3 0.0 37 Basic metal industries 4.3 10.1 0.5
38 Metal products, machinery, and equipment 3.8 0.6 0.3
39 Other manufacturing 0.8 0.8 0.0 Source: Authors’ elaboration based on information of ENIA, CONICYT and CORFO.
31
Table 3
Estimation of the Propensity Score Pooled Probit Model
FONTEC FONDEF BOTH Ln(employment) 0.0909** 0.321* 0.00633 (.036) (.051) (.060) Ln(average wage) 0.131*** 0.115 0.0194 (.075) (.093) (.128) Ln(labor productivity) 0.154*** 0.468* 0.282*** (.084) (.105) (.147) Ln(TFP) -0.141*** -0.346* 0.0589 (.081) (.108) (.153) Employment growth -0.00176 -0.0000882 -0.00311 (.002) (.003) (.004) Average wage growth -0.00217** 0.00106 0.000347 (.001) (.001) (.002) Labor productivity growth -0.00257 -0.00169 -0.00433 (.004) (.005) (.007) TFP growth 0.00316 0.000184 0.000459 (.004) (.005) (.007) Exporters dummy 0.252* 0.439* 0.0577 (.071) (.095) (.131) Foreign licenses dummy -0.0335 -0.0501 0.299** (.108) (.117) (.143) Capital region dummy 0.168** -0.474* -0.379* (.065) (.095) (.127) Constant -4.296* -6.223* -6.119* (.447) (.580) (.825) Industry dummies Yes yes yes Observations 30,586 26,475 20,052
Standard errors in parentheses * p<0.01, ** p<0.05, *** p<0.1
32
Table 4 Estimates for the Impact Evaluation of FONTEC
Common Support Sample
ln(employment) ln(average wage) ln(TFP) ln(labor productivity) Fontec 0.0622* 0.0450** 0.0569 0.0623 (0.022) (0.020) (0.038) (0.039) Age 0.0372 0.0880* 0.3105* 0.3296* (0.032) (0.029) (0.055) (0.056) Age squared -0.0006* -0.0002*** -0.0008* -0.0005* (0.0001) (0.0001) (0.0002) (0.0002) Constant 3.6266* 7.3325* 4.4712* 4.9378* (0.367) (0.335) (0.633) (0.646) Observations 6,418 6,418 6,418 6,418 Standard errors in parentheses * p<0.01, ** p<0.05, *** p<0.1

33
Table 5 Estimates for the Timing of Impact Evaluation of FONTEC
Common Support Sample
ln(employment) ln(average
wage) ln(TFP) ln(labor
productivity) First three years of treatment 0.0598* 0.0464** 0.0664*** 0.0690***
(.023) (.021) (.039) (.040) Fourth and later years of treatment 0.0691** 0.0411 0.0293 0.0431
(.027) (.025) (.047) (.048) Age 0.0369 0.0881* 0.3115* 0.3303* (.032) (.029) (.055) (.056) Age squared -0.0006* -0.0002*** -0.0007* -0.0005* (.0001) (.0001) (.0002) (.0002) Constant 3.6344* 7.3343* 4.4787* 4.9498*
(.364) (.333) (.629) (.642) Observations 6,418 6,418 6,418 6,418 Standard errors in parentheses * p<0.01, ** p<0.05, *** p<0.1

34
Table 6 Estimates for the Impact Evaluation of FONDEF
Common Support Sample
ln(employment) ln(average wage) ln(TFP) ln(labor productivity) Fondef -0.0771** -0.0087 0.0578 0.1006***
(.031) (.029) (.055) (.058) Age 0.0605 0.1004* 0.0347 0.0145
(.037) (.034) (.066) (.069)
Age squared -0.0007* -0.0001 -
0.0008* -0.0007** (.0002) (.0002) (.0003) (.0003)
Constant 4.2945* 7.2660* 8.8334* 9.2980* (.515) (.475) (.913) (.963)
Observations 3,756 3,756 3,756 3,756
Standard errors in parentheses * p<0.01, ** p<0.05, *** p<0.1

35
Table 7 Estimates for the Timing of Impact Evaluation of FONDEF
Common Support Sample
ln(employment) ln(average wage) ln(TFP) ln(labor
productivity) First three years of treatment -0.0794** 0.0046 0.0613 0.0998***
-0.032 -0.029 -0.056 -0.06 Fourth and later years of treatment -0.0694*** -0.0533 0.0458 0.1033
(.039) (.036) (.069) (.073) Age 0.0602 0.1020* 0.0351 0.0144
(.037) (.034) (.066) (.069)
Age squared -0.0007* -0.0001 -
0.0008* -0.0007** (.0002) (.0002) (.0003) (.0003)
Constant 4.2826* 7.2035* 8.8320* 9.3162* (.535) (.493) (.948) (1.0)
Observations 3,756 3,756 3,756 3,756
Standard errors in parentheses * p<0.01, ** p<0.05, *** p<0.1
36
Table 8 Estimates for the Impact Evaluation of FONTEC and FONDEF
Common Support Sample
ln(employment) ln(average wage) ln(TFP) ln(labor productivity) Fontec & Fondef -0.0297 -0.0019 0.2415* 0.2384**
(.048) (.050) (.093) (.097) Age -0.0282 0.0054 -0.1123 -0.0449
(.038) (.040) (.074) (.078) Age squared 0 -0.0002 0.0014* 0.0013*
(.0002) (.0003) (.0005) (.001) Constant 4.5806* 8.6598* 10.3156* 10.0691*
(.405) (.426) (.788) (.823) Observations 1,643 1,643 1,643 1,643
Standard errors in parentheses * p<0.01, ** p<0.05, *** p<0.1

37
Table 9 Estimates for the Timing of Impact Evaluation of and FONTEC and FONDEF
Common Support Sample
ln(employment) ln(average
wage) ln(TFP) ln(labor
productivity) First three years of treatment -0.0372 -0.0356 0.2021** 0.2060**
(.050) (.052) (.097) (.101) Fourth and later years of treatment -0.0104 0.0856 0.3439* 0.3225*
(.058) (.061) (.113) (.119) Age -0.0297 -0.0017 -0.1207 -0.0518
(.038) (.040) (.074) (.078) Age squared 0 -0.0001 0.0015* 0.0014*
(.0002) (.0003) (.0005) (.001) Constant 4.6028* 8.7325* 10.3777* 10.0970*
(.411) (.432) (.801) (.836) Observations 1,643 1,643 1,643 1,643 Standard errors in parentheses * p<0.01, ** p<0.05, *** p<0.1

38
References
Arrow, K. 1962. “Economic Welfare and the Allocation of Resources for Invention,” in
R. Nelson (Ed.). The Rate and Direction of Inventive Activity. Princeton, NJ,
United States: Princeton University Press.
Arráiz, I., F. Henríquez, and R. Stucchi. 2011. "Impact of the Chilean Supplier
Development Program on the Performance of SMEs and their Large Firm
Customers." OVE Working Paper Series 04/11. Office of Evaluation and
Oversight (OVE).Washington, DC: Inter-American Development Bank.
Benavente, J.M. and G. Crespi. 2003. "The Impact of an Associative Strategy (the
PROFO Program) on Small and Medium Enterprises in Chile." SPRU Electronic
Working Paper Series 88, University of Sussex, SPRU - Science and Technology
Policy Research.
Benavente, J. M., G. Crespi, and A. Maffioli. 2007. "Public Support to Firm-Level
Innovation: An Evaluation of the FONTEC Program." OVE Working Papers 0507,
Office of Evaluation and Oversight (OVE). Washington, DC: Inter-American
Development Bank.
Benavente J.M and J.J. Price. 2009. “Apoyo público a la innovación empresarial: de
FONTEC a nuestros días." In Munoz, O. (Ed), Desarrollo productivo en Chile. La
experiencia de CORFO entre 1990 y 2009. Santiago, Chile: CORFO-FLACSO.
Bonilla, C., and C. Cancino. 2011. “The Impact of the Seed Capital Program of
SERCOTEC in Chile.” IDB Working Paper Series No. IDB-WP-279. Washington,
DC: Inter-American Development Bank.
Castillo, V., A. Maffioli, A. Monsalvo, S. Rojo, and R. Stucchi. 2010. “Can SME Policy
Improve Firms Performance? Evidence from an Impact Evaluation in Argentina.”
OVE Working Papers 0710, Office of Evaluation and Oversight (OVE).
Washington, DC: Inter-American Development Bank.
Cohen, W. and D. Levinthal. 1989. “Innovation and Learning: The Two Faces of R&D.”
Economic Journal 99(397): 569–96.
Crépon, B., E. Duguet, and J. Mairesse. 1998. “Research and Development, Innovation
and Productivity: An Econometric Analysis at the Firm Level.” Economics of
Innovation and New Technology 7(2): 115–58.
39
David, P., B. Hall, and A. Toole. 2000. “Is Public R&D a Complement or Substitute for
Private R&D?: A Review of the Econometric Evidence.” Research Policy 29(4–
5): 497–529.
Disney, R., J. Haskel, and Y. Heden. 2003. Restructuring and Productivity Growth in
UK Manufacturing.” Economic Journal 113(489): 666–94.
Fagerberg, J. and B. Verspagen. 2002. “Technology Gaps, Innovation Diffusion, and
Transformation: An Evolutionary Interpretation.” Research Policy 31(8–9): 1291–
1304.
Hall, B. and J. Lerner. 2010. “The Financing of R&D and Innovation.” In Hall, B.H. and
N. Rosenberg (Eds.): The Economics of Innovation. Volume 1, Ch. 14.
Amsterdam, The Netherlands: North Holland.
Hall, B. H. and A. Maffioli. 2008. "Evaluating the Impact of Technology Development
Funds in Emerging Economies: Evidence from Latin America." NBER Working
Papers 13835. Cambridge, MA, United States: National Bureau of Economic
Research.
Lach, S. 2002. "Do R&D Subsidies Stimulate or Displace Private R&D? Evidence from
Israel." Journal of Industrial Economics 50(4): 369–90.
Leuven, E. and B. Sianesi. 2003. "PSMATCH2: Stata Module to Perform Full
Mahalanobis and Propensity Score Matching, Common Support Graphing, and
Covariate Imbalance Testing." Available at
http://econpapers.repec.org/software/bocbocode/S432001.htm
Levinsohn, J. and A. Petrin. 2003. “Estimating Production Functions Using Inputs to
Control for Unobservables.” Review of Economic Studies 70(3): 317–41.
Lopez-Acevedo, G. and H. Tan. 2010. “Impact Evaluation of SME Programs in Latin
America and the Caribbean.” Washington D.C.: The World Bank.
Lundvall, B. Å. 1992. “National Systems of Innovation: Towards a Theory of
Innovation and Interactive Learning.” London, England: Printer Publishers.
Nelson, R. 1959. “The Simple Economics of Basic Scientific Research,” Journal of
Political Economy 67(3): 297-306.
40
Soete, L., B. Verspagen, and B. Ter Weel. 2010. "Systems of Innovation." In Hall, B.H.
and N. Rosenberg (Eds.): The Economics of Innovation. Volume 2. Amsterdam,
The Netherlands: North Holland.
Stiglitz, J. E. and A. Weiss. 1981. "Credit Rationing in Markets with Imperfect
Information." American Economic Review 71(3): 393–410.
Steinmueller, W. E. 2010. “Economics of Technology Policy.” In Hall, B.H. and N.
Rosenberg (Eds.): The Economics of Innovation. Volume 2. Amsterdam, The
Netherlands: North Holland.
Tan, H. 2009: “Evaluating SME Support Programs in Chile Using Panel Firm Data.”
World Bank Policy Research Working Paper No. 5082. Washington, DC: The
World Bank.
Toivanen, O. 2009. “Innovation Policy, Entrepreneurship, and Development: A Finnish
View.” United Nations University Research Paper No. 2009/48. New York, N
United States: The United Nations.
41
APPENDIX
Differences between Treated and Control Group
FONTEC
Mean
Percent reduction
bias t-test
Variable Sample Treated Control Percent
bias t p>t ln(employment) Unmatched 3.934 3.360 54.8 8.080 0.000 Matched 3.937 3.905 3.1 94.3 0.300 0.764 ln(average wage) Unmatched 8.315 7.855 83.8 10.980 0.000 Matched 8.330 8.264 12 85.6 1.270 0.206 ln(labor productivity) Unmatched 8.808 8.169 73.9 9.840 0.000 Matched 8.818 8.722 11 85.1 1.110 0.266 ln(TFP) Unmatched 8.172 7.345 56.3 8.380 0.000 Matched 8.172 7.958 14.5 74.2 1.410 0.161 Employment growth Unmatched -1.175 -2.950 9.3 1.170 0.242 Matched -1.175 -0.416 -4 57.3 -0.450 0.654 Average wage growth Unmatched 7.424 8.052 -4.6 -0.510 0.608 Matched 7.424 6.583 6.2 -33.7 0.720 0.469 Labor productivity growth Unmatched 4.456 -0.556 14.7 1.710 0.087 Matched 4.456 1.387 9 38.8 0.960 0.337 TFP growth Unmatched 3.043 -1.889 14.6 1.710 0.087 Matched 3.043 0.778 6.7 54.1 0.700 0.481 Exporters dummy Unmatched 0.399 0.162 62 9.850 0.000 Matched 0.403 0.391 3.2 94.8 0.280 0.777 Foreign licences dummy Unmatched 0.084 0.042 23.8 3.750 0.000 Matched 0.086 0.080 3.5 85.3 0.310 0.757 Capital region dummy Unmatched 0.678 0.558 25 3.420 0.001 Matched 0.673 0.727 -11 56 -1.150 0.253

42
FONDEF
Mean
Percent reduction
bias
Variable Sample Treated Control Percent
bias t p>t Ln(employment) Unmatched 4.944 3.361 144.3 19.400 0.000 Matched 4.963 5.029 -6 95.8 -0.490 0.621 Ln(average wage) Unmatched 8.592 7.856 119.2 15.240 0.000 Matched 8.605 8.472 21.5 81.9 1.810 0.071 Ln(labor productivity) Unmatched 9.515 8.169 122.8 17.870 0.000 Matched 9.552 9.412 12.8 89.6 1.060 0.291 Ln(TFP) Unmatched 9.357 7.346 94.4 17.370 0.000 Matched 9.418 9.067 16.5 82.5 1.270 0.205 Employment growth Unmatched 0.239 -2.944 15.8 1.830 0.067 Matched 0.010 1.985 -9.8 37.9 -0.890 0.377 Average wage growth Unmatched 7.285 8.048 -5 -0.540 0.589 Matched 7.386 6.978 2.7 46.6 0.270 0.789 Labor productivity growth Unmatched -1.399 -0.571 -2.2 -0.250 0.806 Matched -2.120 0.055 -5.7 -162.5 -0.670 0.505 TFP growth Unmatched -3.063 -1.901 -3.2 -0.350 0.725 Matched -3.775 -0.190 -9.9 -208.5 -1.190 0.233 Exporters dummy Unmatched 0.719 0.162 150.5 20.190 0.000 Matched 0.736 0.725 2.8 98.2 0.220 0.826 Foreign licences dummy Unmatched 0.142 0.042 49.1 7.840 0.000 Matched 0.145 0.168 -11.2 77.2 -0.730 0.464 Capital region dummy Unmatched 0.217 0.557 -74.5 -8.400 0.000 Matched 0.228 0.250 -4.8 93.5 -0.440 0.661

43
FONTEC AND FONDEF
Mean
Percent reduction
bias
Variable Sample Treated Control Percent
bias t p>t Ln(employment) Unmatched 3.667 3.361 23.5 2.540 0.011 Matched 3.662 4.441 -59.8 -154.5 -3.370 0.001 Ln(average wage) Unmatched 8.651 7.855 136.3 11.180 0.000 Matched 8.658 8.815 -26.8 80.3 -1.570 0.118 Ln(labor productivity) Unmatched 10.348 8.169 196.6 19.680 0.000 Matched 10.390 10.156 21.1 89.3 1.140 0.257 Ln(TFP) Unmatched 9.747 7.345 166.5 14.410 0.000 Matched 9.775 9.493 19.6 88.3 0.990 0.325 Employment growth Unmatched -0.836 -2.947 12.8 0.830 0.409 Matched -1.202 -0.268 -5.6 55.8 -0.440 0.664 Average wage growth Unmatched 6.475 8.052 -10.7 -0.760 0.448 Matched 6.659 7.627 -6.5 38.6 -0.480 0.635 Labor productivity growth Unmatched 2.610 -0.557 10 0.640 0.523 Matched 3.019 -5.875 28.1 -180.9 2.280 0.024 TFP growth Unmatched 1.350 -1.888 10.6 0.670 0.506 Matched 1.539 -8.519 33.1 -210.7 2.760 0.007 Exporters dummy Unmatched 0.439 0.162 75.8 6.820 0.000 Matched 0.430 0.641 -57.7 23.8 -3.000 0.003 Foreign licences dummy Unmatched 0.209 0.042 73.6 8.880 0.000 Matched 0.216 0.219 -1.3 98.2 -0.060 0.954 Capital region dummy Unmatched 0.261 0.558 -63.1 -4.950 0.000 Matched 0.254 0.275 -4.4 93 -0.270 0.786