PTON - Short - Hedgeye
72
© Hedgeye Risk Management LLC. PTON - Short March 17, 2020 Overvalued With Competition Accelerating Brian McGough Jeremy McLean Hedgeye Retail
-
Upload
khangminh22 -
Category
Documents
-
view
2 -
download
0
Transcript of PTON - Short - Hedgeye

© Hedgeye Risk Management LLC.© Hedgeye Risk Management LLC© Hedgeye Risk Management LLC.
PTON - Short
March 17, 2020
Overvalued With Competition Accelerating
Brian McGough
Jeremy McLean
Hedgeye Retail

© Hedgeye Risk Management LLC.
DISCLAIMER
Hedgeye Risk Management, LLC (“Hedgeye”) is a registered investment advisor, registered with the State of Connecticut. Hedgeye is not abroker dealer and does not provide investment advice to individuals. This research does not constitute an offer to sell, or a solicitation of anoffer to buy any security or investment vehicle. This research is presented without regard for individual investment preferences or riskparameters; it is general information and does not constitute specific investment advice, nor does it constitute or contain any legal or taxopinions. This presentation is based on information from sources believed to be reliable. Hedgeye is not responsible for errors, inaccuraciesor omissions of information. The opinions and conclusions contained in this report are those of the individual expressing those opinions orconclusion and are intended solely for the use of Hedgeye’s clients and subscribers, and the authorized recipients of the content. Inreaching its own opinions and conclusions, Hedgeye and its employees have relied upon research conducted by Hedgeye’s employees, whichis based upon sources considered credible and reliable within the industry. Neither Hedgeye, nor its employees nor any individualexpressing opinions, conclusions or data are responsible for the validity or authenticity of the information upon which it has relied.
TERMS OF USEThis report is protected by United States and foreign copyright laws and is intended solely for the use of its authorized recipient. Accessmust be provided directly by Hedgeye. There is a fee associated with access to this report and the information and materials presentedduring the event. Redistribution or republication of this report and its contents are strictly prohibited. By joining this call or possessingthese materials, you agree to these Terms. For more detail please refer to the appropriate sections of the Hedgeye Services Agreement andthe Terms of Service at https://www.hedgeye.com/terms_of_service.
Legal
2

© Hedgeye Risk Management LLC.
Please submit questions* to
*Answered at the end of the call
3

© Hedgeye Risk Management LLC.
1
2
3
The PTON Playbook
Peloton owns a defendable core concept in connected cycling, but the TAM is too small to justify the valuation especially with competition ramping at all different price points to take their fair share. That limited TAM has driven PTON to move investments away from the core where the competitive moat is much weaker or nonexistent. Margins and returns in these other business will be very low to the point it means PTON may never earn money while it invests to grow outside the core. The TAM growth was fueled by the early private investment rounds looking to garner a big valuation on the IPO. For the most part the market has seen through it, but there is still a lot of downside in the stock when it becomes a clear reality.
4
Streaming fitness content is a commodity. There is essentially no differentiation in the various product offerings. That means comparable content can be found on YouTube for free or as part of Prime video. This is why Peloton saw significantly stagnated growth in digital only subs leading them to cut the price by 33%, offer a 30day free trial, and plug money into a new marketing campaign in December. Due to the trial the 2Q(Dec) number was irrelevant, but with the help of the price cut and Covid home exercise interest, growth needs to go parabolic in 3Q, or the digital only bull case is nil. You have to believe in tens of millions of subscribers and hope pricing wont crash to want to get long PTON on the digital only opportunity. Watch out if Amazon gets serious, or Netflix gets going, on digital streaming content.
We expected 2Q and 3Q of this year to be the best selling periods the company every had by far, and we think the best it everwill have in terms of new equipment and new connected fitness subscribers. 3Q will likely be the peak of adoption (added subs). Ending subscriber growth has slowed for 6 straight quarters, and guidance signaled a slowdown again in 3Q20. We think by 4Q, growth rates will underperform and the fact we are most likely heading into a recession means that slowdown will be amplified further. On our revised TAM and share estimates the core cycling business could be worth about $3bn over the long term if the company executes. However with the company losing money, seeing slowing revenue metrics, and burning cash, we think there is much more downside in this environment. Punchline PTON is worth $6 to $12 per share.
There is a viable business in connected cycling, but TAM is too small
Digital Only is not the opportunity people think it is
Numbers were bound to slow, in a recession they could plummet

© Hedgeye Risk Management LLC.
BEST IDEAS - LONG Trend Tail BEST IDEAS - SHORT Trend Tail
Active Longs Mkt. Cap ($MM) Active Shorts Mkt. Cap ($MM)
DLTR Dollar Tree $15,861 HBI Hanesbrands $3,037 X X
GIL Gildan $2,916 KSS Kohls $3,086 X X
NKE Nike $104,016 PTON Peloton Interactive $6,245 - X
DOL-CA Dollarama $8,258 FL Foot Locker $2,474 X X
RH RH $1,786 OXM Oxford Industries $664 X X
LONG BIAS SHORT BIAS
CPRI Capri $1,443 RL Ralph Lauren $5,281
BURL Burlington Stores $8,730 WSM Williams-Sonoma $2,756
FIVE Five Below $3,183 BBY Best Buy $14,828
ADS-DE Adidas $38,352 DKS Dick's Sporting Goods $1,862
PUM-DE Puma $8,295 BBBY Bed Bath and Beyond $773
TPR Tapestry $3,169 VFC VF Corp $21,994
AMZN Amazon.com $840,876 JWN Nordstrom $2,675
UAA Under Armour $4,157 CRI Carter's $2,817
ELY Callaway $769 SHOO Steve Madden $1,838
LOW Lowe's $55,638 SIG Signet Jewelers $553
GES Guess? $491 GOOS Canada Goose $1,631
VVV Valvoline $2,640 RVLV Revolve $608
ORLY O'Reilly Automotive $22,443 GPS Gap Inc $3,113
LB L Brands $3,221 TGT Target $46,985
OLLI Ollie's Bargain Outlet $2,459 GOLF Acushnet $1,726
DECK Decker's Outdoor $3,116 KTB Kontoor Brands $1,509
RECENTLY REMOVED: Thesis and/or Price Changed RECENTLY REMOVED: Thesis and/or Price Changed
REAL RealReal $560 W Wayfair $2,867
CHWY Chewy $9,674 KTB Kontoor Brands $1,509
BME-GB B&M European Value Retail $3,324 TJX TJX $49,780
SFIX StitchFix $1,254 PVH PVH Corp $2,973
M Macy's $2,073
COLM Columbia Sportswear $4,039
Retail Position Monitor
5Data Source: Hedgeye, Factset
Hedgeye’s “bench” represents Hedgeye’s outlook on companies currently under Hedgeye’s review, or for which timing is not right for greater coverage. Hedgeye may or may not provide further commentary on any or all companies represented on the bench and representation of a company on the bench does not forecast whether Hedgeye will or will not issue any additional material on that company

© Hedgeye Risk Management LLC.
Peloton Interactive (PTON)3Q20 FY2020 FY2021 FY2022 FY2023 FY2024
Hedgeye 868 926 1238 1509 1734 1927Consensus 848 929 1468 2166 3043 4078Hedgeye $549 $1,577 $1,812 $1,964 $2,064 $2,003Consensus $479 $1,544 $2,260 $3,215 $4,199 $5,256Hedgeye -10.1% -15.1% -17.6% -17.6% -16.5% -15.6%Consensus -12.2% -15.6% -13.0% -9.2% -5.0% -0.6%Hedgeye -$0.19 -$0.81 -$1.10 -$1.18 -$1.15 -$1.02Consensus -$0.19 -$1.01 -$1.04 -$1.05 -$0.73 -$0.20
Connected Fitness Subscribers
Revenue
EBIT Margin
EPS
6Data Source: Hedgeye Estimates, Factset
Financial Summary

© Hedgeye Risk Management LLC.© Hedgeye Risk Management LLC.
What is it?
7Data Source: Hedgeye Estimates

© Hedgeye Risk Management LLC. 8Data Source: Company Reports
But it thinks it is everything under the sun.
It Is NOT An Everything Company

© Hedgeye Risk Management LLC.
The Core Concept is Solid, The Rest is a Money Pit
9
This is a home streaming cycling service company, selling the associated hardware…
By most accounts the heavy users are big fans of the bike and the classes. It’s relatively inexpensive for active users, convenient, engaging, and brings all the benefits of exercise.
For frequent users the utility of a class for $39 a month at their convenience is a fantastic proposition. Classes cost on average $15-25 across the country. In NYC the costs are roughly $35 per session so it offers even more utility.
Data Source: Company Website
Bringing the experience of a studio cycling class to the home at a reasonable price was a great idea.
Bike = Engaging, Good Value, Competitive Moat Others = Less Engaging, Lower Value, Weak Moat

© Hedgeye Risk Management LLC.© Hedgeye Risk Management LLC.
Digital Only - The Uber Bull Case?

© Hedgeye Risk Management LLC.
We Think Bulls See the Opportunity as Being Digital Only
Most investors seem to understand that there is unlikely to be ~10mm households that will join connected fitness buying a piece of equipment. The pricing is too big a hurdle.
Yet there seems to be a perception that Peloton digital only could be the next Netflix.
Data Source: Company Website 11

© Hedgeye Risk Management LLC.
But We’re Already Seeing Problems With Digital Only - Price Cut
12Data Source: Company Website
If this was such a compelling market opportunity and value proposition, this would not be necessary.
Digital only would make PTON purely a content company, which means value/differentiation would be quality of content. That would mean higher costs on instructors, studio, production. Costs that are too high to incur when competitors and copycats can easily replicate the digital only streaming offers.
An exercise content platform (think exercise specific YouTube) would make PTON irrelevant in this channel.
Digital only subscription was ‘launched’ in June 2018 at $19.49/month. It has already been reduced to $12.99 in December 2019. In Digital only you are competing against every streaming content company in existence including many free or ad supported models (like Youtube). The differentiation here is nil, switching is easy, and therefore there are no profits to be made.

© Hedgeye Risk Management LLC.
No Growth - This is Why the Digital Price Was Slashed
13
As of June 30, 2019, we had approximately 102,000 Peloton Digital Subscribers… This compared to approximately 46,000 and 22,000 Peloton Digital Subscribers as of June 30, 2018 and June 30, 2017, respectively. - PTON S-1
We suspect the original pricing was set for breakeven, we doubt the company makes money per sub on digital. Which is why PTON doesn’t disclose a Digital Only Customer Acquisition Cost. It’s fake TAM, no material profits to be made.
Data Source: Company Filings, Company Website, Hedgeye Estimates
Peloton Blog implies “launch” in June 2018 (or that’s when it was promoted), lets look at sub growth rate…
Text of PTON Shareholder letter: We ended the quarter with 105,856 Digital Subscribers
0
2,000
4,000
6,000
8,000
10,000
12,000
14,000
16,000
0
20,000
40,000
60,000
80,000
100,000
120,000
Jun-16 Sep-16 Dec-16 Mar-17 Jun-17 Sep-17 Dec-17 Mar-18 Jun-18 Sep-18 Dec-18 Mar-19 Jun-19 Sep-19
Digital SubscribersNet New Digital Subs QoQ ('17,'18, '19 Straighlined) Total (Left Axis)

© Hedgeye Risk Management LLC.
The New Marketing Campaign and Free Trial
14
We suspect these actions will have a material benefit to digital only subscription additions. COVID-19 is likely also helping sub additions, at least for the potential of new trials while people are self quarantining for a month or so. Though, most of those won't be in final 3Q number since they likely have been added in March.
Data Source: YouTube, Company Websites
Alongside the Digital Only price cut Peloton also introduced a 30day free trial. This is one of the reasons we don’t know the real sub additions for 2Q20. At the end of December is also started a new marketing campaign heading into the big New Year’s resolution season.

© Hedgeye Risk Management LLC.
Though It Also Had a Marketing Campaign in ‘18
15
Keep in mind its likely about 30-50% of additions happen in the March end Q.
Data Source: ispot.tv
Commercial From Dec ‘18

© Hedgeye Risk Management LLC.
Peloton Just Went to 90 Day Free Trial
16
Why 3 months after doing 30 day free trial, do you expand to a 90day free trial? It doesn’t seem like you would do that if you’re product is in demand and conversion is high.
Could it be nobody wants to pay for it? Peloton is trying to get people hooked, seems unsuccessful so far.
Data Source: Company Website

© Hedgeye Risk Management LLC.
The Important Number, New Digital Subs
17Data Source: Company Reports, Hedgeye Estimates
Perhaps the connected fitness slowdown will be so notable the digital won’t matter, but this seems like a very important number this Q for the long term bull case.
Digital only needs to go parabolic with a massive jump with the price cut.
For context, connected fitness just added about 150k subs in 1Q, if Digital cant do at least in that range after the price cut, the big 4Q awareness spike, and the marketing campaign, something is wrong.
We’re unable to get a good read from our survey as Ns are too small.
102 106 109
225
300
0
50
100
150
200
250
300
350
4Q19 1Q20 2Q20 3Q20E 4Q20E
Digital Only Subs (thousands)4Q19 1Q20 2Q20 3Q20E 4Q20E
With the price cut this number needs to go up big, or the bull case on digital is punk.

© Hedgeye Risk Management LLC.
The Odd Management Thoughts on Digital Only
18
Justifying Pricing
On the last call the CFO twice reiterated that the pricing of digital only ($12.99) is for one user only, vs connected fitness ($39) is for a household. She was seeming to justify the price difference. Yet the company should know that people will share, there are no protections to limit to one user, and there is no evidence of the company trying to enforce this.
Yet the CEO said this on the last call referring to using digital on a different bike: “it's on a dramatically inferior bike and an inferior experience because you don't get all the interconnectivity and the leaderboard”
Therefore, we can deduce that the price variance is NOT about user quantity, but rather the value of the product. Of course management has to be cautious about signaling digital as being much lower value than the connected fitness product, since that would signal to investors the lack of opportunity in this market. Streaming fitness without some other service is a commodity.
You also had the CEO state “you can count on one hand the number of people” that switched from connected fitness down to digital. Again showing the significant lower value of the product, otherwise why would you pay 3x for connected.
Yet the CEO also believes a full body bootcamp workout is the best one can get. So digital only is less valuable, but bike is limited in quality of workout.
Data Source: Company Reports
Digital A Marketing/Pipeline Tool
“Over time, Peloton Digital has become an incredibly powerful lead generation tool for us as well.”
“Obviously, we've seen some marketing from some of these other pure hardware players trying to take advantage of our content. To the extent that they get any traction, which we haven't seen, and they are becoming digital subscribers, we would celebrate that because it is an introduction into our ecosystem.”
To think that digital subs are a pool to sell bike’s is ridiculous. There is large barrier in price to converting people from one to the other. Not to mention that digital subs are a fraction of connected fitness growth, so if conversion numbers were that good, the pool would rapidly empty.
© Hedgeye Risk Management LLC.
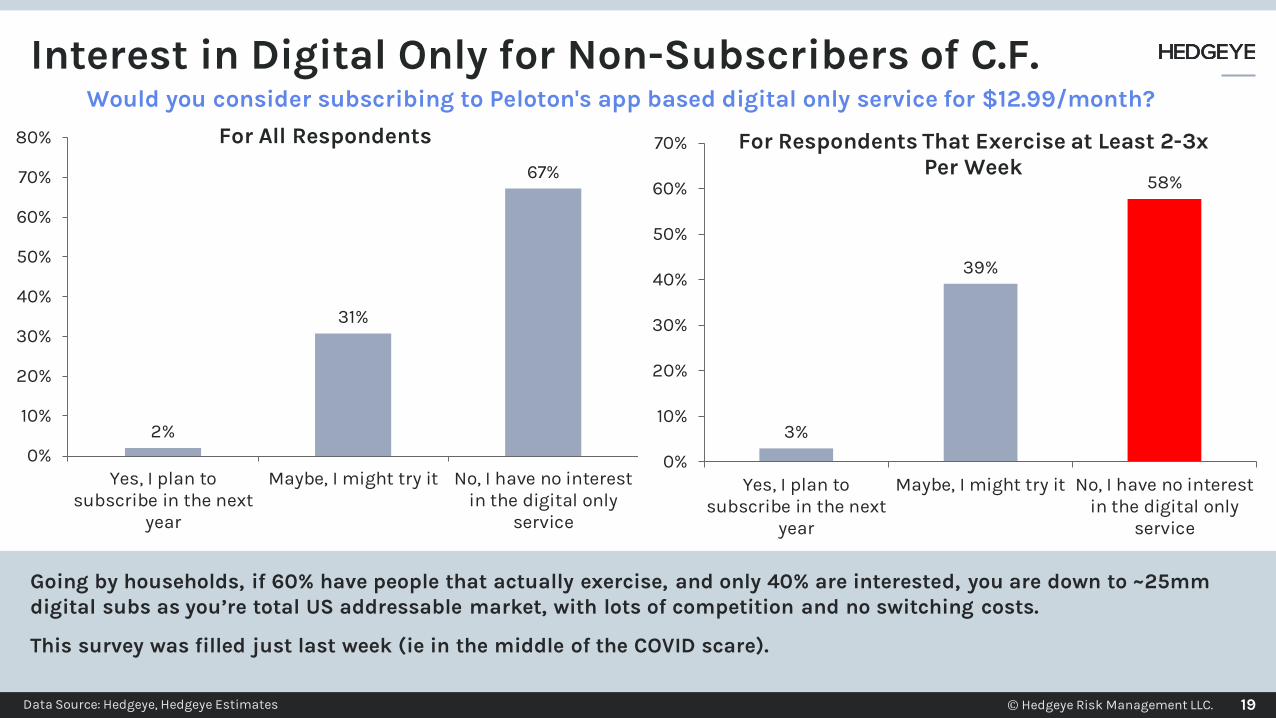
Interest in Digital Only for Non-Subscribers of C.F.
19
Going by households, if 60% have people that actually exercise, and only 40% are interested, you are down to ~25mm digital subs as you’re total US addressable market, with lots of competition and no switching costs.
This survey was filled just last week (ie in the middle of the COVID scare).
Data Source: Hedgeye, Hedgeye Estimates
2%
31%
67%
0%
10%
20%
30%
40%
50%
60%
70%
80%
Yes, I plan tosubscribe in the next
year
Maybe, I might try it No, I have no interestin the digital only
service
For All Respondents
Would you consider subscribing to Peloton's app based digital only service for $12.99/month?
3%
39%
58%
0%
10%
20%
30%
40%
50%
60%
70%
Yes, I plan tosubscribe in the next
year
Maybe, I might try it No, I have no interestin the digital only
service
For Respondents That Exercise at Least 2-3x Per Week

© Hedgeye Risk Management LLC.
Low Mid HighSubs (mm) 5 10 15Gross Profit Per Sub $50 $100 $110Gross Profit (mm) $250 $1,000 $1,650SG&A (mm) $500 $650 $750Profit (mm) -$250 $350 $900Multiple NA 10.0 x 12.0 xLong Term Value (mm) $0 $3,500 $10,800
Is the Digital Only Opportunity Priced In?
What would you have to believe on digital only to buy it here?
20Data Source: Hedgeye Estimates
You have to believe that Peloton penetrates around half of the potential market to justify the value it was at a few months ago.
And that is likely 5-10 years down the road.
SG&A may be high on this, but the company is already at $726mm in TTM Op Ex.
Let’s assume we’re wrong on digital, people do want/stay with it, and there is some price integrity vs competition.

© Hedgeye Risk Management LLC.© Hedgeye Risk Management LLC.
Competition is Closing In Fast

© Hedgeye Risk Management LLC.
• More competitors in Live Fitness
• More competitors in Equipment
• More competitors in Connected Fitness
• More competitors in Digital Only (watch out for the big guys)
22Data Source: Hedgeye Estimates
Competition Ramping In Everything...

© Hedgeye Risk Management LLC. 23Data Source: Hedgeye Estimates
Live fitness will not be going away. Many concepts will die, but some will thrive, and people will try them.
Live Fitness Concepts Booming

© Hedgeye Risk Management LLC. 24Data Source: Company Websites, Amazon.com
Horizon Bike Copying the Design With Easy Digital Only Integration
Equipment Competition
$699.99
$399.99

© Hedgeye Risk Management LLC. 25Data Source: Company Websites
We think this will end up looking like the meal kit space, 2 or 3 winners that rapidly run out of TAM
Connected Fitness Competition

© Hedgeye Risk Management LLC. 26Data Source: Variis.com
$2500 bike and $40 a month. Equinox is going at the high-end consumer, a real risk to PTON share
The Equinox/SoulCycle Launch

© Hedgeye Risk Management LLC. 27Data Source: Hedgeye Estimates
Social distancers will only pick Peloton?
Digital Only Competition
?

© Hedgeye Risk Management LLC.
So why do we assume people pick Peloton in their time of #socialdistancing ?
28

© Hedgeye Risk Management LLC.© Hedgeye Risk Management LLC.
Addressable Market Overstated

© Hedgeye Risk Management LLC.
Company’s Total Addressable (& Serviceable) Market
30Data Source: Company Reports, International Health, Racquet & Sportsclub Association
PTON estimates TAM of 67mm households of which 45mm are in the US. The ServicableAddressable Market (SAM) is estimated at 14mm globally and 12mm in the US. So ~7% penetrated.
That’s $50,000 in income.
Fastest growing customer segment is below $75,000 in household income.
62mm people in the US and 183mm globally have gym memberships. –IHRSA.
5mm treadmills and 3mm stationary bikes sold in 12 months ended Mar. 2019 – IHRSA.

© Hedgeye Risk Management LLC.
US Households 128,500,000 % With Home Broadband Internet 84%Households With Broadband Internet 107,940,000
Income Bracket $75k+Workout frequently a least once a weekWilling to Spend on Gym Membership at least $11/mo on subTried Spin Class, Soul Cycle, X-fit, Orange Theory or Flywheel% on Survey Meeting Criteria Above 6.1%Addressable Market 6,611,325
US Households 128,500,000 % With Home Broadband Internet 84%Households With Broadband Internet 107,940,000
% Willing to Spend $20+ on sub, and $1800+ on equipment 5.0%Addressable Market 5,397,000
How We Break Down the TAM (US)
Propensity to Spend Income, Exercise, Interest
31Data Source: Hedgeye Survey, Leichtman Research Group
We see the market as being around 6mm households in the US. Given the competition and PTON as the first mover, 30-40% would be an ambitious market share. That’s 1.7mm to 2.4mm Connected Fitness Subs. We’ll come back to this on valuation.

© Hedgeye Risk Management LLC.
Idea of Shifting to Home Workouts is Unlikely
Exercise at home has been around forever (literally).
Consuming fitness content at home has been around for roughly 4 decades.
The only thing that is new, is the quality of trying to replicate an in-person experience.
The best comparable we can think of is Movie Going.
Technology has made at home movie watching closer to the in-person experience, but…
32Data Source: Statista
If all the consumer wanted was at home fitness, gyms would not exist today.
The equipment cost is a real barrier to many. And the success of fitness concepts suggests that people like to workout in a live setting.
We have heard the bull case of “at home fitness becoming long term trend. ”
HDTVs
Blu-Ray Movie going didn’t fall off a cliff, only down ~15% from levels when major home viewing innovations came.
Since people are unlikely to consume more exercise content (ie not workout more hours), we would have to see a big dropoffin live exercise for the big TAM to be possible. We think too many people will want to feel the real thing, just like many people still go to the movies.
North America Movie Tickets Sold

© Hedgeye Risk Management LLC.
Some people just try the new thing… They tried yoga, they tried crossfit, they did spinning, pilates, they do peloton, and they will move on to the next thing when it hits.
Exercise concepts and equipment have always been a “fad” type business. Like the new diet or the new cool shoes.
Remember Jazzercize, Tae Bo (1mm videos), Bowflex Home Gym, Thighmaster, Aerobics, Shake Weights (2mm units at $20), Ab Slide, Wii Fit, Pilates, EasyTone shoes, Medicine balls, Kettleballs, Power Plates, Pole Dancing….
33Data Source: Youtube, Total Gym, Amazon, Jazzercise
Some of these customers just try everything, then switch. Peloton needs to keep innovating.
What is Real vs “Fad”?

© Hedgeye Risk Management LLC.
Nothing Stays At The Peak in This Industry
Data Source: Google Trends 34
Zumba Interest Yoga Interest
P90x Interest Orange Theory Interest
010
2030405060708090
100
20
06
-12
20
07-
05
20
07-
102
00
8-0
32
00
8-0
82
00
9-0
12
00
9-0
62
00
9-1
12
010
-04
20
10-0
92
011
-02
20
11-0
72
011
-12
20
12-0
52
012
-10
20
13-0
32
013
-08
20
14-0
12
014
-06
20
14-1
12
015
-04
20
15-0
92
016
-02
20
16-0
72
016
-12
20
17-0
52
017
-10
20
18-0
32
018
-08
20
19-0
12
019
-06
20
19-1
10
102030405060708090
100
20
06
-12
20
07-
05
20
07-
102
00
8-0
32
00
8-0
82
00
9-0
12
00
9-0
62
00
9-1
12
010
-04
20
10-0
92
011
-02
20
11-0
72
011
-12
20
12-0
52
012
-10
20
13-0
32
013
-08
20
14-0
12
014
-06
20
14-1
12
015
-04
20
15-0
92
016
-02
20
16-0
72
016
-12
20
17-0
52
017
-10
20
18-0
32
018
-08
20
19-0
12
019
-06
20
19-1
1
010
2030405060708090
100
20
04
-01
20
04
-07
20
05
-01
20
05
-07
20
06
-01
20
06
-07
20
07-
01
20
07-
07
20
08
-01
20
08
-07
20
09
-01
20
09
-07
20
10-0
12
010
-07
20
11-0
12
011
-07
20
12-0
12
012
-07
20
13-0
12
013
-07
20
14-0
12
014
-07
20
15-0
12
015
-07
20
16-0
12
016
-07
20
17-0
12
017
-07
20
18-0
12
018
-07
20
19-0
12
019
-07
Cycles of other popular workout fads/trends
010
2030405060708090
100
20
11-1
22
012
-03
20
12-0
62
012
-09
20
12-1
22
013
-03
20
13-0
62
013
-09
20
13-1
22
014
-03
20
14-0
62
014
-09
20
14-1
22
015
-03
20
15-0
62
015
-09
20
15-1
22
016
-03
20
16-0
62
016
-09
20
16-1
22
017
-03
20
17-0
62
017
-09
20
17-1
22
018
-03
20
18-0
62
018
-09
20
18-1
22
019
-03
20
19-0
62
019
-09
20
19-1
2

© Hedgeye Risk Management LLC.
P90x sold about 5mm copies.
Crossfit has about 13000 gyms globally with let's say 200 average members… that’s about 2.6mm users.
At the peak Zumba had about 15mm active members
At its peak, the leader in high end fitness equipment (Technogym) was worth about $2.5bn
Yoga had about 35mm people at the peak in the US (many of which don’t pay)
35Data Source: Technogym, Trinity Crossfit, Zumba, Factset, Miami Herald, RallyFitness, The Guardian
Some other massive fitness trends suggest real limitations with street at 5.2mm PTON C.F. subs in 5 years
Where could PTON settle out?

© Hedgeye Risk Management LLC.© Hedgeye Risk Management LLC.
TAM Survey Insights
36Data Source: Hedgeye Estimates

© Hedgeye Risk Management LLC.
Exercise Frequency
“How often do you exercise?”
Slight up tick implied in exercise frequency.
Perhaps just sampling error but would make logical sense given the time of year the survey was executed. People try to increase exercise in Jan and continue as long as they are able. Likely workout less in the holiday season.
Data Source: Hedgeye Survey
11%
18%
25%
11%13%
23%
15%
17%
28%
9%
12%
20%
0%
5%
10%
15%
20%
25%
30%
Everyday 4-6 times perweek
2-3 times perweek
Once per week A couple times amonth
Never
Dec-19 Mar-20
37

© Hedgeye Risk Management LLC.
Membership Propensity to Spend
“How much are you willing to spend PER MONTH on all of your exercise/fitness memberships whether a digital service from home or at a gym/fitness center?”
Overall similar results, perhaps a slight shift towards lower end of price spectrum.
Data Source: Hedgeye Survey
40%
17%18%
13%
8%
3%1% 1%
41%
16%
19%
15%
7%
2% 1% 0%0%
5%
10%
15%
20%
25%
30%
35%
40%
45%
$0 $1-$10 $11-$20 $21-$40 $40-$75 $75-$150 $150-$250 $250+
Dec-19 Mar-20
38

© Hedgeye Risk Management LLC.
Equipment Propensity to Spend
“How much are you willing to spend on a single exercise stationary bike or treadmill?”
Overall similar results, perhaps a slight shift towards lower end of price spectrum.
Data Source: Hedgeye Survey
33%
18%
8%
4%2% 1%
0%
33%33%
20%
10%
3%2% 1%
0%
31%
0%
5%
10%
15%
20%
25%
30%
35% Dec-19 Mar-20
39

© Hedgeye Risk Management LLC.
Awareness Index
“How much are you willing to spend on a single exercise stationary bike or treadmill?”
Overall similar results, perhaps a slight shift towards lower end of price spectrum.
Data Source: Hedgeye Survey
64
77
0
10
20
30
40
50
60
70
80
90
100
Peloton Aided Awareness Index (Indexed to Highest Response)
Dec-19 Mar-20
40

© Hedgeye Risk Management LLC.
Peloton Equipment Purchase Intention
“How much are you willing to spend on a single exercise stationary bike or treadmill?”
Overall similar results, perhaps a slight shift towards higher likelihood to purchase.
Surprisingly similar “never percentage”
Data Source: Hedgeye Survey
4%
24%
43%
28%
5%
29%
38%
28%
0%
5%
10%
15%
20%
25%
30%
35%
40%
45%
50%
Yes, I definitely intend tobuy a Peloton bike or
treadmill in the next year.
Yes, I might buy a Pelotonbike or treadmill, not
sure when.
No, I probably won'tPeloton bike or treadmill
No, I will never buy aPeloton bike or treadmill
Dec-19 Mar-20
41

© Hedgeye Risk Management LLC.© Hedgeye Risk Management LLC.
Recession Risk
42Data Source: Hedgeye Estimates

© Hedgeye Risk Management LLC.
This Business is Cyclical, Recession Risk is Real
43Data Source: Factset, NSGA
Bulls argue that there will be a trade down to Peloton in a recession. It is cheaper than attending spin classes.
However, consumers cut back on large purchases even when it can be financed.
There are many ways to exercise for nearly no cost after all.
CEO Foley Pre-IPO interview: “It’s essentially a recession proof category” (fitness spend increased in ’08 ’09)
-14% -15% -16%
-26%
-18% -18%
-30%
-37%
-44%
-36%
-56%
-42%-37%
-50%
-7%
0%
6%
-60.0%
-50.0%
-40.0%
-30.0%
-20.0%
-10.0%
0.0%
10.0% Nautilus In RecessionNLS Revenue Growth 2 Year
21%
9%
4% 4%
1%
-11%
-7% -8%-10%
-1%
1% 2%
-15.0%
-10.0%
-5.0%
0.0%
5.0%
10.0%
15.0%
20.0%
25.0%
4Q07 1Q08 2Q08 3Q08 4Q08 1Q09 2Q09 3Q09 4Q09 1Q10 2Q10 3Q10
Weight Watchers In RecessionWeight Watchers Revenue Growth 2 Year
Wrong!!!

© Hedgeye Risk Management LLC.
-Has over 200 software engineers on its team (but only 32 content generators, ie instructors).
-Owns a bike manufacturing operation in Taiwan.
-Has a base of 76 stores and growing.
-Has a new HQ with ~$30mm in rent (and 16 year lease).
What happens when revs slow to a halt (as we often see in fitness), and/or you hit a recession?
44Data Source: Company Documents, Company Website
This is an at home indoor cycling stream content and hardware brand that…
Vertical Integration is VERY Risky for This Model

© Hedgeye Risk Management LLC.
No Profits In Sight With Current Strategy
We don’t think the model as it is being run today chasing TAM and going rapidly outside the core can be profitable.
-22.1%
-15.1%
-17.6% -17.6%-16.5% -15.6%
-25%
-20%
-15%
-10%
-5%
0%
5%
10%
FY2019 FY2020E FY2021E FY2022E FY2023E FY2024E
Operating Margin
EBIT Margin
45Data Source: Hedgeye Estimates, Company Reports
Companies with this type of earnings profile have nearly no bottom in a recession.

© Hedgeye Risk Management LLC.
This Isn’t Built for Weak Consumer Environment
Peloton’s CFO said of the hundreds of Key Performance Indicators (KPIs) only engagement, subscriber growth and churn really matter.
Not costs, margins or cash flow? Perhaps return on invested capital?
The CFO joined in April 2018 with an eye to take the company public. Her background is in capital markets origination and she succeeded in maximizing the IPO price.
“I look at WeWork and I have so much sympathy.”
“For us, it’s growth—not at all costs—but growth is 100% our priority. If your opportunity is massive, you should just grow as fast as you can.” – Jill Woodworth
Apparently, there is at least some consideration for costs – the company reportedly abandoned plans for a Super Bowl ad. Though, not sure the core football fan is the customer here when holidays and January have passed.
We recognize that this is a company focused on growth, but someone (at least the CFO) should care about costs and margins. That hyper focus on revenue growth pervades the decision making at the company with store openings, purchasing manufacturing, building everything themselves, building expensively.
Woodworth has experience with IPOs, not running startups for long term health. Hence the focus on growth metrics for valuation.
Data Source: Fortune, CFO Dive, Axios,
CFO Jill Woodworth
46

© Hedgeye Risk Management LLC.
Cash Burn – Run Out Before Break Even?
47Data Source: Hedgeye Estimates, Company Reports
The company is investing heavily and losses are high.
With a vertical model, as revs slows profits can get worse.
Running out of cash and having to tap capital markets again is a real possibility within 3-4 years.
$379
$1,172
$732
$353
-$9
-$276-$400
-$200
$0
$200
$400
$600
$800
$1,000
$1,200
$1,400
FY2019 FY2020E FY2021E FY2022E FY2023E FY2024E
Cash Balance (mm)
Cash Balance
Management’s Breakeven Inflection Estimate

© Hedgeye Risk Management LLC.© Hedgeye Risk Management LLC.
Valuation
48Data Source: Hedgeye Estimates

© Hedgeye Risk Management LLC.
Recession Valuation
Virus spread = recession and the negative impact from recession will be much greater than any positive impact from people self quarantining.
The COVID bull case does have the issue of delivery time. People might want to trial a Peloton now to substitute their normal studio/gym workout. But delivery is typically 2-3 weeks, longer if seeing a demand spike. People might not get their bike by the end of their social distancing.
As growth slows, this could look a lot like Wayfair or Blue Apron, so let's compare to W today
Wayfair EV $4,250NTM US Sales $9,400Wayfair Sales Multiple 0.45 x
PTON NTM Sales $1,715Implied PTON EV $776PTON Cash $1,130PTON Equity Value $1,906PTON Shares 280Share Price $6.81
Recession Downside
~70% downside
49Data Source: Hedgeye Estimates, Company Reports

© Hedgeye Risk Management LLC.
Valuation On Run Rate Subs/Contribution Margin
50Data Source: Hedgeye Estimates, Company Reports
We think there is a viable business with the bike streaming service.
With relatively bullish assumptions, we can get to $2-$3bn in value.
This is what it could be worth with several years of strategy change and execution that we don’t see happening.
Since our last deck we have taken down the target market share given new entrants in high end connected fitness.
Subscription Price $39Annual Revenue Per Sub $468US Sub Contribution Margin 68%Annual Contribution Per Sub $318US Subscriber Target (mm) 1.9
Intl Sub Contribution Margin 58%Intl Subscriber Target (mm) 0.45
US Subscriber Contribution Dollars (mm) $605Intl Subscriber Contribution Dollars (mm) $122
Gross Profit/Bike (at 80% of Today) $850Bikes Per Year 6Yr Replacement Cycle (mm) 0.39Bike Replenishment Gross Profit Dollars (mm) $333
Overhead/SG&A (mm) $550Run Rate EBITDA (5+ Years Out) $510
Discount Rate 10.0%Present Value at 5 Years Out $317Multiple 10.0xEnterprise Value $3,166Equity Downside -49%
Valuation Summary - Out Year Target
Punchline is we think PTON is worth $6 to $12 per share

© Hedgeye Risk Management LLC.
Please submit questions* to
*Answered at the end of the call
51Data Source: Hedgeye Estimates

© Hedgeye Risk Management LLC.© Hedgeye Risk Management LLC.
Appendix
52Data Source: Hedgeye Estimates

© Hedgeye Risk Management LLC.
CEO John Foley: formerly President of eCommerce at Barnes & Noble before PTON founding.
CFO Jill Woodworth: Managing Director of JP Morgan. Investment banker at Morgan Stanley.
President & Director William Lynch: CEO of Savant Systems (luxury smart home technology company). CEO of Barnes & Noble and oversaw the Nook.
Chief Operating Officer Tom Cortese: CEO of Proust.com, online social media and memory sharing company.
Chief Technology Officer Yony Feng: Senior Platform Engineer at Ticketfly, Software Engineer at Skype and Cisco.
Chief Revenue Officer Tim Shannehan: VP of Sales at IMG and Inspirato.
Chief Supply Chain Officer Jon Adee: COO and EVP of Retail Sales at Savant Systems, Barnes & Noble MD of Nook Hardware.
53Data Source: Company Filings, LinkedIn.
Many of the executives worked together at Barnes & Noble
Management Background

© Hedgeye Risk Management LLC.
Company founded in 2012.
First Peloton pop up store in Short Hills mall Nov 2013.
Bike launched in 2014.
The company raised $550mm at a $4.2bn valuation last year (2018).
It raised $994.7mm total before going public.
Dual class structure. CEO has 6% of the class B stock, with 20-1 voting power.
At the IPO price it was valued at $8.1bn.
Management is talking breakeven by 2023.
54Data Source: Company Documents, Company Website
Peloton Timeline
How We Got Here
So Why Not Stick With That?

© Hedgeye Risk Management LLC.
Shares were priced up at $29 after the range during the roadshow was $26-29. CEO Foley says they left some money on the table.
Was to open trading at $24-$25.
Nasdaq got on the phone.
Deal cut, opened at $27.
Sold off as low as $21 in the following months.
The stock did rally all the way back peaking just under $37.
55Data Source: CNBC, Company Documents
Perhaps the size of the deal was too much to handle in a tough IPO tape.
The IPO Debacle

© Hedgeye Risk Management LLC. 56Data Source: Company Website, Company Reports
New Hardware Expected: Cheaper Tread, Rowing Machine
Key Products/Numbers/Metrics
Hardware Subscriptions Operational
Bike: $2,245 plus $250 installation
Tread: $4,295 plus $300 installation
Bike Essentials: $159
Tread Essentials: $229
Digital Only Single Account: $12.99/mo
Adjusted GP Per Connected Fitness Device: $1,063
Adjusted CAC Per Connected Fitness Sub$1,057 ($5 Net)
FY2019 Monthly Avg Churn0.65%
’19 Lifetime Value of Connected Fitness Sub$3,593
Connected Fitness Subscribers562,774
Digital Subscribers105,856
2019 Hardware Revenue$719mm
2019 Subscription Revenue$181mm
2019 Subscription Gross Margin42.7%

© Hedgeye Risk Management LLC. 57Data Source: Hedgeye Dec 19
US General Population (online) – Indexed to Highest
Survey: Aided Awareness Index
64
33
9
22
86
100
80
13
67
9
27
0
20
40
60
80
100
120
Peloton Soul Cycle Echelon OrangeTheory
Crossfit Yoga NordicTrack
FlyWheel Spinning Barry's BootCamp
None of theabove
Which have you heard of?

© Hedgeye Risk Management LLC.
Don’t Worry, The CEO Says Peloton is Profitable
58Data Source: CNBC, YouTube
Maybe he meant gross margin or contribution margin is positive?
Looking back we can’t reconcile his statement with the company’s earnings with the S-1 showing significant adjusted EBITDA losses for each year disclosed.
A year and a half later, for the IPO the company is talking about breakeven in 2023.
Question: “Are you profitable?”Answer: “We are profitable, weirdly. It’s a beautiful business model. Um, our investors are happy. Um, yes.”

© Hedgeye Risk Management LLC.
PTON Bought a Factory, Why?
Peloton acquired Tonic Fitness Technology, one of its two Taiwanese bike manufacturing partners, for $47.4mm last quarter. Tonic makes treadmills, ellipticals, rowing machines, and cycling machines. Peloton is planning substantial expansion plans to be finished in 2020.
CEO Foley said, “We aren't in China meaningfully, and are very comfortable with Taiwan, but this gives us more transparency into our upstream supply chain ... So we have more optionality if we find ourselves in the position of considering stateside manufacturing.”
Tonic previously had 300 employees making 300 to 400 bicycles per day, as it scaled up and invested in the facility the number of employees has been reduced to 200 while the output has almost doubled to 600 bicycles.
Peloton also acquired Gossamer Engineer and its staff of 16. The team previously worked with Facebook to develop the Portal video chat device.
59Data Source: Axios, Pelobuddy, TaiSPO, Magtonic,com,
The question is Why? We think it is to increase production and have more control over supply as well as launch the rower.
There should have been much better options to increase production that required less capital and less long term operational risk.
“A brand-new fitness facility… that is going to be, we believe, one of the best, if not the best manufacturing facility for fitness equipment in the world.” PTON 1Q20 CC
Manufacturing capacity is the last thing a company like this needs to own.

© Hedgeye Risk Management LLC.
Few Durable Goods Brands Have a Chain of Stores
60
Peloton’s locations are primarily in A malls with a couple of street locations. These are malls with low occupancy costs and high rents.
Peloton has $785mm in operating lease obligations. That includes its expensive HQ.
Data Source: Peloton website, Macerich, Simon Property
The Peloton store concept is akin to Tesla, Tempur-Pedic or a single appliance brand. There are few retailer concepts with such low frequency of shopping as Peloton. In contrast to mattresses or appliances a household most likely would only have one Peloton machine. Peloton has also chosen a strategy of the most expensive malls. Tesla has recently looked to close stores.
Tesla has 80 gallery/dealerships in the US.
Tempur-Pedic has 57 US stores.
Peloton has 76 stores in the US, 6 in Germany, 9 in the UK, and 7 in Canada.
NordicTrack closed all 300 stores in 1998.
The rents are between 11-13% of sales at these malls. Showrooms are 2-3,000 sq. feet while the company also has some microstores at 2-300 square feet.

© Hedgeye Risk Management LLC.
Past Music Use Costs Have Been (Will Be) Ongoing
The National Music Publishers Association (NMPA) sued Peloton for $150mm for copyright infringement.
NMPA president David Israelite said, “It is frankly unimaginable that a company of this size and sophistication would think it could exploit music in this way without the proper licenses for this long, and we look forward to getting music creators what they deserve.”
61Data Source: Company Filings, NMPA, Quartz,
Peloton excludes the costs of past music payments from its contribution margin, but the costs seem ongoing.
There is no visibility when the payments for past content use end.
Its possible these costs actually head higher as some lawsuits are ongoing.

© Hedgeye Risk Management LLC.
Music Can’t Be Leveraged, Could Easily Go Higher
Music is the largest variable cost of subscription revenue (~23%).
Peloton is in a worse position than streaming services like Spotify. In addition to paying royalties to music right holders it also has to pay “public performance rights” because it is considered a live concert.
The same percentage YY would confirm that music costs are variable.
The cost of past content use has been $15.5mm in 2017, $14.5mm in 2018, and $16.4mm in 2019. That represents underpayment for past use and most likely represents higher future music costs as the company settles with the music industry that has held out for higher payment rates.
If the contracts on are on a per stream basis, given Peloton is seeing higher adoption and higher engagement, music costs could actually deleverage.
62Data Source: Company Reports, Industry Calls
Our industry checks indicate that a low 20s% for music costs is likely correct and that if anything the risk is in costs going higher as a % of revenue, not likely to go down.
Music is critical to the value proposition to the consumer and cant be replicated vs getting rights to use it.
'18 from '17 '19 from '18Increase in music costs 10.9$ 23.1$ Increase in subscription revenue 48.0$ 101.0$ Music cost growth as a % of incremental revenue 23% 23%

© Hedgeye Risk Management LLC. 63Data Source: Company Reports, Hedgeye Estimates
Why does Peloton present the number this way?
Peloton Churn Definition BreakdownThis is either cancelled subs coming back, or bikes being sold to someone else. Including
reactivations understates the real churn and ignores CAC for reactivations.
Why not just use the quarterly beginning subscriber base? Well if your subscriber
count is growing, using the average of the months increases the denominator, reducing
the calculated churn.
Why use a monthly number? Well it looks so much small than a quarterly number, doesn’t it?
Why ignore the digital subs? We suspect churn in this subscriber base is much higher, evidenced by the lack of growth this quarter.

© Hedgeye Risk Management LLC.
And the Lifetime is Already Down Over a Third
64Data Source: Company Documents
If you valued the company on the average customer life from the S-1, your valuation should be down ~40% already, not counting how much worse churn will get from here.
LTV Months Implied at ~95Down 38% YY !!!

© Hedgeye Risk Management LLC.
1Q17 2Q17 3Q17 4Q17 1Q18 2Q18 3Q18 4Q18 1Q19 2Q19 3Q19 4Q19 1Q20 2Q20 3Q20E 4Q20EAvg Monthly Churn Quarter 0.62% 0.50% 0.97% 0.61% 0.52% 0.49% 0.55% 0.85% 0.50% 0.52% 0.68% 0.79% 0.90% 0.74% 1.10% 1.10%Basic Q Churn 1.9% 1.5% 2.9% 1.8% 1.6% 1.5% 1.7% 2.6% 1.5% 1.6% 2.0% 2.4% 2.7% 2.2% 3.3% 3.3%Average Subs 115,562 146,102 193,339 231,778 261,312 319,673 409,749 484,156 536,988 637,390 790,003 898,500 Start 107,708 123,416 168,788 217,889 245,667 276,957 362,388 457,109 511,202 562,774 712,005 868,000 Lost 1,803 2,148 3,190 5,910 3,920 4,987 8,359 11,474 14,499 14,150 26,070 29,651 Added 17,511 47,520 52,291 33,688 35,210 90,418 103,080 65,567 66,071 163,381 182,065 90,651 End 107,708 123,416 168,788 217,889 245,667 276,957 362,388 457,109 511,202 562,774 712,005 868,000 929,000
128% 124% 115% 110% 108% 103% 96% 90% 82%Quarterly Churn 1.7% 1.7% 1.9% 2.7% 1.6% 1.8% 2.3% 2.5% 2.8% 2.5% 3.7% 3.4%Annual Churn TTM 12.1% 12.3% 10.7% 10.6% 11.7% 14.2% 13.4% 14.5% 16.5%
It’s Even Worse When Converting to Annual Properly
65
Churn Analysis Math
Taking the monthly number and converting it to quarter results and TTM annual churn.
Data Source: Hedgeye Estimates, Company Documents
Street Forecasts on End Subs

© Hedgeye Risk Management LLC. 66Data Source: SensorTower, Hedgeye Estimates
Are we past peak on the S Curve? App Downloads already appear to be slowing.
Peak Interest and Adoption Happening Now
Here on Subs
Here on Churn
S-Curve on Subs and Churn
0
100000
200000
300000
400000
500000
600000
700000
800000
Jan
-17
Feb
-17
Mar
-17
Ap
r-17
May
-17
Jun
-17
Jul-
17A
ug
-17
Sep
-17
Oct
-17
Nov
-17
Dec
-17
Jan
-18
Feb
-18
Mar
-18
Ap
r-18
May
-18
Jun
-18
Jul-
18A
ug
-18
Sep
-18
Oct
-18
Nov
-18
Dec
-18
Jan
-19
Feb
-19
Mar
-19
Ap
r-19
May
-19
Jun
-19
Jul-
19A
ug
-19
Sep
-19
Oct
-19
Nov
-19
Dec
-19
Est
TTM Peloton App Downloads

© Hedgeye Risk Management LLC.
Annualized Lifetime Actually Trending to Less Than Half the Implied IPO Value
67
2019 Monthly Churn 0.65% Monthly Guidance 1.00%x 12 Months 7.80% 2020 Estimated Annualized Churn 16.83%
Customer Lifetime 12.8 years Customer Lifetime 5.9 years
S-1 Implied Numbers 2020 Estimated Numbers
Using where the churn is likely to end up at year end based on estimates and guidance, we get to a 5.9 year customer life. Less than half the number implied on the IPO.
Data Source: Company Documents, Hedgeye Estimates

© Hedgeye Risk Management LLC.
Segmentation: The Advertising Imagery is Very Elitist
68Data Source: Twitter – Clue Heywood, Marketing Week, Digiday, iSpot.tv, Company Advertisements
Every person in a Peloton ad is in great shape, lives in a beautiful home, and makes their bike the centerpiece.
Estimated to spend $108.7mm in 2017, $141.9mm in 2018 according to Nielsen, and $112.6mm YTD through November.
In the past month Peloton has aired TV ads 26,148 times, ranking #6 with spending at #34 nationally.
Awareness is very high at 67% as of April, likely much higher after the holiday ad buzz.

© Hedgeye Risk Management LLC.
Bowflex in Contrast… “If I Can You Can”
69Data Source: Bowflex
If you take a look at Bowflex’s “If I can, you can”marketing campaign you can see a good example of an inclusive and inspiring ad. But this is not what Peloton’s marketing has been like. It has not been targeting people who haven’t exercised, most likely because it’s a high price point.
None of these people would ever be featured in a Peloton add. And Peloton riders workout in front of a large window with the shades drawn.
We’re not saying one is better or worse, just that they are clearly segmenting the addressable market.

© Hedgeye Risk Management LLC.
12% of all new gym memberships occur in January. – IHRSA
80% of gym memberships go unused. – IHRSA
The average income of a gym member is $75,000. - IHRSA
According to a 2012 study, 80% of gym members that join in January quit within 5 months. 14% quit by the end of February.
50% of all new gym members quit within 6 months. – IHRSA
In 2018 the average gym membership in the US was $58 per month. – Statistic Brain
40% of gym members enroll in group exercise classes.
The two most popular pieces of equipment in a gym are treadmills and strength training machines. - IHRSA
70Data Source: IHRSA
January is the best month for new gym memberships, but most people quit soon after.
Some Figures on Gym Memberships

© Hedgeye Risk Management LLC.
The Rower Is Likely Next
71
Peloton’s interest in a rowing machine is likely to head off competition in a “better full body workout” than capturing the existing base of participants that would be attracted to its entry. The largest hurdles for rowing include the general lack of familiarity and educating consumers on how to operate the machine correctly
Data Source: US Patent Office, Taiwan Trade Shows
Tonic Fitness recently filed a patent application for a high tech indoor rowing machine.
Tonic has been developing with Body Alive a rower with magnetic resistance.

© Hedgeye Risk Management LLC.
For more information, contact us at:
72
[email protected](203) 562-6500


![Blindspots| [Short stories]](https://static.fdokumen.com/doc/165x107/63266b6f5c2c3bbfa803ad6f/blindspots-short-stories.jpg)