PT Bank Mandiri (Persero) Tbk
100
0 PT Bank Mandiri (Persero) Tbk Q1 2006 Results Presentation
-
Upload
khangminh22 -
Category
Documents
-
view
1 -
download
0
Transcript of PT Bank Mandiri (Persero) Tbk

0
PT Bank Mandiri (Persero) Tbk
Q1 2006 Results Presentation
97
Jan 1 2006
IPOfrom:
+13.79%+152.14%JCI
+3.05%+150.37%BMRI
Shareholding Information
100.00%20,288,716,31414,165TOTAL
26.9%5,458,251,917 371Total
26.9%5,454,980,417 3232. Institutional
0.0%3,271,500 511. Retail
INTERNATIONAL
73.1%14,830,464,39713,791 Total
0.3%66,654,500 41 7. Mutual Funds
1.4%290,472,083 148 6. Institutional
0.3%53,574,500 27 5. Assurance/Banks
0.4%71,459,500 82 4. Pension Funds/
Cooperatives/ Foundations
0.5%101,833,814 10,568 3. Employees
1.2%246,470,000 2,924 2. Retail
69.0%14,000,000,0001 1. Government
DOMESTIC
%SharesInvestors
Shareholders as of 31 March 2006Description
0
200
400
600
800
1,000
1,200
1,400
1,600
1,800
2,000
2,200
11-Jul-0315-A
ug-0323-S
ep-0328-O
ct-039-D
ec-0320-Jan-0427-Feb-046-A
pr-0413-M
ay-0421-Jun-0427-Jul-041-S
ep-048-O
ct-0412-N
ov-0427-D
ec-042-Feb-0514-M
ar-0519-A
pr-0527-M
ay-051-Jul-055-A
ug-0513-S
ep-0518-O
ct-0529-N
ov-055-Jan-0613-Feb-0620-M
ar-06
BMRI
JCI

1
Bank Mandiri Presentation Contents
Results Overview Page #Q1 2006 Summary Financials 2 - 3
Quarterly Asset Mix & Interest Source 4
Quarterly Loan Growth & LDR 5
Business Unit Performance 6
Consumer Loan Portfolio Details 7
Recap Bond Portfolio Summary & Movement 8Quarterly Funding Mix 9
Quarterly Savings Deposits & Funding Rates 10
Quarterly Net Interest Margins and Spread 11 - 12
Quarterly Non-Interest Operating Income 13
Quarterly Overhead Expenses & Detail 14
Quarterly NPL & Cat. 2 Loan Movement 15 - 16
Quarterly Asset Quality 17
Provisioning & Collateral 18
Quarterly Analysis of NPL Downgrades 19
Core Earnings Analysis & Profitability 20
Quarterly Capital Structure 21
Additional Factors 22
Corporate Actions 23 - 26
Service Quality, NPLs & SPV RegulationsService Quality Achievements 27 - 29
Top Debtor Developments 30 - 32
SPV & Regulatory Progress 33 - 37
Financial Summary Page #Summary Balance Sheets & P&L 38 -40
Recap Bond Portfolio Detail 41
Bank Mandiri Credit Ratings 42
Reconciliation to IFRS (FY 2005) 43
Bank Mandiri Strategic Roadmap 44 – 47
Loan Movement & Portfolio DetailBI Regulation PBI no. 7/2/PBI/2005 48
Interest, Provisioning & Collateral 49
Detailed NPL Analysis & Write-Offs 50 - 54
Performing Loan Analysis 55 - 58
Restructured & IBRA Loan Analysis 59 - 61
Loan Portfolio Detail Analysis 62 - 66
Additional InformationConsumer Banking Details 67 - 69
Summary of Principal Subsidiaries 70
Bank Syariah Mandiri Details 71 - 72
Mandiri Sekuritas Details 73
Bank Mandiri at a GlanceNew Directors, Staffing & Network 74 - 79
Q4 2005 Peer Comparisons 80 - 83
Q1 2006 Published Financial Statements 84 - 93

2
25.2%26.6%23.7%Total CAR(2)
1,150
30
23.2%
18.0%
44.4%
25.3%
51.8%
4.0%
56.6%
2.5%
0.5%
23,215
206,289
263,383
92,056
106,853
FY 2005
(6.4)
(2.5)
(5.8)
15.8
2.2
(1.1)
5.6
YoY Change (%)
1,178
25.14
24.6%
19.5%
46.9%
26.2%
53.0%
3.9%
48.2%
8.7%
1.2%
23,889
198,083
254,885
92,225
105,075
Q1 2006
25,352Total Equity
58.3%LDR
25.8%Total CAR incl. Market Risk
20.5%Tier 1 CAR(2)
51.1%Provisions / NPLs
43.7%Cost to Income(1)
8.3%RoE – after tax (p.a.)
1.3%RoA - before tax (p.a.)
1,259Book Value/Share (Rp)
26EPS (Rp)
17.8%Gross NPL / Total Loans
4.5%NIM (quarterly)
171,016Customer Deposits
249,373Total Assets
93,211Government Bonds
99,650Gross Loans
Q1 2005IDR billion / %
Key Quarterly Balance Sheet Items & Financial Ratios
(1) (G&A and employee expenses) / (Net Interest Income + Other Operating Income), excluding bond gains(2) Bank only – Not including Market Risk

3
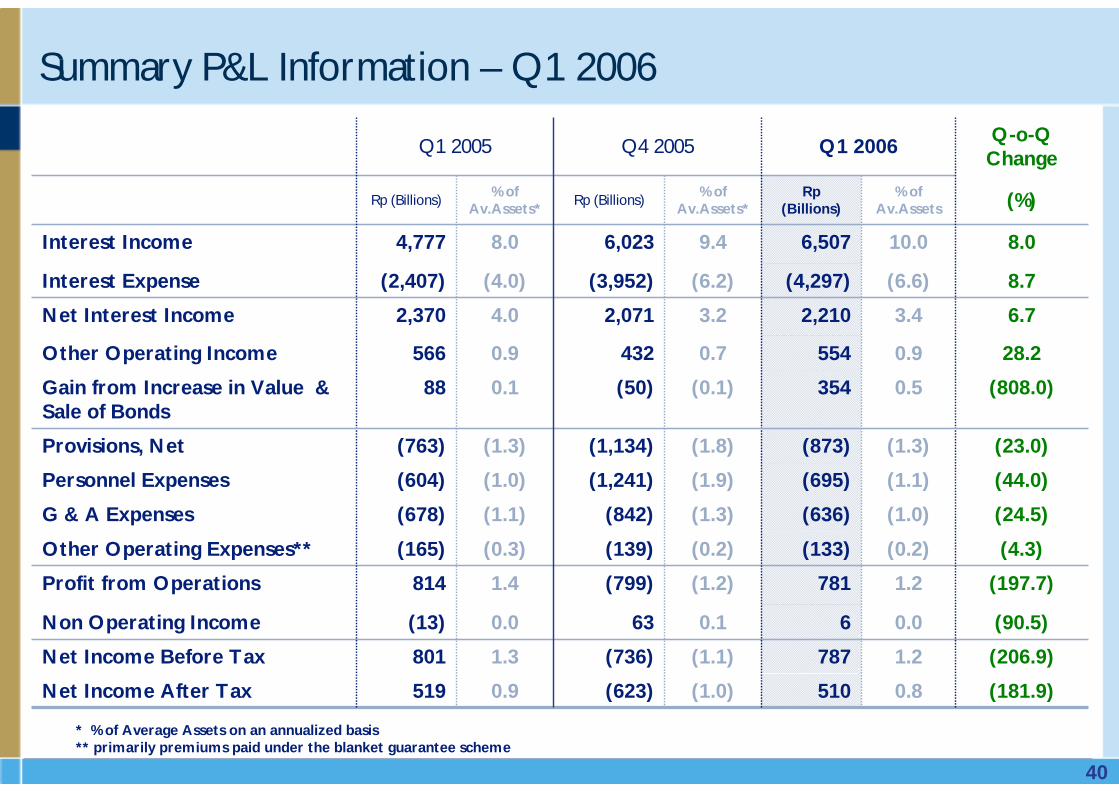
Summary P&L Information – Q1 2005 vs. Q1 2006
302.30.6354 0.188 Gain from Increase in Value & Sale of Bonds
(146.2)0.06 0.0(13)Non Operating Income
(19.4)(0.2)(133)(0.3)(165)Other Operating Expenses**
(1.7)1.2787 1.3801 Net Income Before Tax
(6.2)(1.0)(636)(1.1)(678)G & A Expenses
15.1(1.1)(695)(1.0)(604)Personnel Expenses
14.4(1.4)(873)(1.3)(763)Provisions, Net
(1.7)0.8510 0.9519 Net Income After Tax
(4.1)1.2781 1.3814 Profit from Operations
(2.1)0.9554 0.9566 Other Operating Income
(6.8)3.42,210 3.92,370 Net Interest Income
78.5(6.7)(4,297)(4.0)(2,407)Interest Expense
36.210.26,507 7.94,777 Interest Income
(%)% of Av.Assets
Rp (Billions)% of
Av.Assets*Rp (Billions)
YoY ChangeQ1 2006Q1 2005
* % of Average Assets on an annualized basis** primarily premiums paid under the blanket guarantee scheme

4
164.0
172.6
182.9
176.9
173.9
170.3 153.8
153.5
44.6
41.2
43.0
44.5
49.2 42.5
48.3
48.3
50.4
57.0
65.4
60.5
57.3
44.6
39.0
36.1
38.6 54.0
47.1
50.6 55.4
50.2
54.6
60.7
56.6
60.2
51.4
64.5
57.692.2
92.1
92.3
92.5
93.2
93.1
153.8
153.9
155.5
148.8
152.7
94.0
102.3
107.3
122.9
131.4
137.0
105.1
106.9
106.7
104.0
99.5
94.4
42.3
72.6
66.8
68.7
75.9 76.7
82.3
87.0
40.3
30.4
46.6
33.4
18.323.2
25.7
0
20
40
60
80
100
120
140
160
180
200
220
240
260
280
Q1 '00
Q2 '00
Q3 '00
Q4 '00
Q1 '01
Q2 '01
Q3 '01
Q4 '01
Q1 '02
Q2 '02
Q3 '02
Q4 '02
Q1 '03
Q2 '03
Q3 '03
Q4 '03
Q1 '04
Q2 '04
Q3 '04
Q4 '04
Q1 '05
Q2 '05
Q3 '05
Q4 '05
Q1 '06
Government Bonds Loans Other Assets
46.2%
46.7%
38.2%40.7%
45.6%47.4%
60.6%
74.1%
68.2% 67.8%63.6%
75.4% 74.7%
74.9%
42.6%
48.0%50.5%
42.3%
34.1%29.9%
22.1%19.3%19.0%18.1%19.0%19.8%
Int. from Bonds Int. from Loans
Total assets grew by 2.2% Y-o-Y – ConsolidatedA
s a % of T
otal Interest Income
Tot
al A
sset
s (R
p tn
)

5
-1.7%
5.6%
QoQ Growth (%)
YoY Growth (%)
44.641.242.343.044.549.242.548.348.350.458.765.468.766.872.675.976.782.387.094.499.5
106.7106.9105.1
104.0
27.5%
36.1%
53.1%
51.8%
26.3% 25.3%28.3%26.5%
35.4%
56.8%
53.7%
42.5%
47.9%
Q1 '00
Q3 '00
Q1 '01
Q3 '01
Q1 '02
Q3 '02
Q1 '03
Q3 '03
Q1 '04
Q3 '04
Q1 '05
Q3 '05
Q1 '06
Loans (Rp tn)
LDR (%)
22.922.625.6
31.4 33.033.337.7
33.935.1 35.7
1.4 1.6 3.1 3.7 5.1 6.58.5 9.5 10.8 11.511.5
45.142.338.940.6
42.7 41.838.2 39.5
41.5 42.944.0 44.743.140.2
35.3
30.1
36.1
22.2
4.2
11.3
1.5
Q4 '02
Q1 '03
Q2 '03
Q3 '03
Q4 '03
Q1 '04
Q2 '04
Q3 '04
Q4 '04
Q1 '05
Q2 '05
Q3 '05
Q4 '05
Q1 '06
Loan volume was flat or declining across all segments Q-o-Q
Quarterly Loan Data – Consolidated
1.9%85.9%1.82Micro
6.5%14.5%6.40Small
11.7%20.3%11.45Consumer
100.0%5.6%98.07Total
36.0%4.3%35.32Commercial
43.9%0.4%43.07Corporate
% of Portfolio
Loans(Rp tn)
By Segment (Bank only)
Y-O-Y Growth (%)
Quarterly Loan Segment Details – Bank Only
Corporate
Commercial
Consumer
As of March 2006; Non-consolidated numbers* Note: Includes IBRA loan purchases of Rp 5 tr
* SmallMicro

6
18.0%(10.1%)3.8%39.2%24.0%32.1%% of Pre-Prov. Operating Profit***
287(264)(16)601(348)(68)Operating Profit (Incl. Provision)
(33.7%)
(166)
(20)
18
(165)
0
(165)
0
23,844
CRG
(2.0%)
63
(71)
21
113
23
89
1,328
7,670
Small & Micro
7,315111,15423,20458,770Deposits & Borrowings (Avg. Bal.)
106,81311,46623,94524,963Earning Assets (Avg. Bal.)
(139)187207128Interest Margin on Assets
4872722248Other Operating Income
(171)982461546Total Interest Margin
(33)795254419Interest Margin on Liabilities
(22)(611)(90)(68)Other Operating Expenses**
36.7%76.8%(44.4%)(8.7%)% of Operating Profit (Incl. Prov.)
294643392526Pre-Provision Operating Profit
Cons.Corp.Business Unit Performance (Rp bn) Treasury*Comm.
Excludes Overseas* Includes Government Bonds** Includes Allocated Cost*** Balance of pre-provision operating profit attributable to funds transfer pricing on capital not allocated to BU
Business Unit Performance, Q1 2006 (Reviewed)

7
283 411 655199 328540
1,802
1,860
1,902
1,912
1,918
1,932
1,938
1,930
1,906823
815786
934
428494
594
479
510
816
727
653688 888 792
3,250
3,050
2,885
2,591
1,996
1,011
1,52 2
152
4,033
4,131
4,217
4,2233,5672,852
1,058
1,939
1,921
1,493
1,279
1,367
1,354
1,257
1,206
1,270
1,136
0
2,000
4,000
6,000
8,000
10,000
12,000
Q3 '03
Q4 '03
Q1 '04
Q2 '04
Q3 '04
Q4 '04
Q1 '05
Q2 '05
Q3 '05
Q4 '05
Q1 '06
Other
Cash Collateral LoansCredit Cards
Payroll Loans
Home Equity LoansMortgages
Consumer lending contracted 0.8% despite Mortgage growth
(10.81%)9.03%Cash Collateral Loans
(6.44%)6.10%Credit Cards
(1.25%)(0.59%)Payroll Loans
(2.38%)13.07%Home Equity Loans
6.56%62.86%Mortgages
Growth (%)
Q-o-QY-o-Y
20.33%
80.91% 9.17%Other
Total Consumer
Loan Type
(0.78%)
*Auto & Motorcycle Loans channeled or executed through finance companies = Rp 3.77 tn in our Commercial Loan Portfolio
Quarterly Consumer Loan Balances by Type Consumer Loan Growth by Type

8
Sales of Rp20 bn from the Recap Bond Portfolio in Q1 ‘06
Portfolio Sales as of March 2006 (Rp bn)
92.261.128.92.2Total
-
88.4
3.9
Total
66.2%31.4%2.4%% of Total
----Hedge Bonds
95.8%59.727.01.6Variable Rate
4.2%1.41.90.6Fixed Rate
% of TotalHTM(Nominal Value)
AFS(Mark to Market#)
Trading(Mark to Market*)
At Fair Value, Mar 2006 (Rp tn)
177.4
176.9 153.5
148.8 123.0
93.1
92.2
92.1
4.0
0.0
32.3
2.51.0
15.8
24.5
0
40
80
120
160
200
1999 2000 2001 2002 2003 2004 2005 Q1 '06
0
5
10
15
20
25
30
35Recap Bonds
Bond Sales
Bond Portfolio Movement (Fair Value) 1999 – Q1 ‘06
Rup
iah
(Tri
llion
s)
(66)
257
2,544
2005
48
5
20
Q1 ‘06
66
1,365
32,334
2004
1,868Realized Profit
Unrealized Profit
Bonds Sold
IDR bn
(52)
24,505
2003
* Mark to Market impacts Profit# Mark to Market impacts Equity

9
15.3
16.6
16.6
18.0
17.6
19.7
19.8
22.1
22.3
24.4
25.1
29.6
28.9
31.9
33.4
40.6
40.5
42.3
44.6
52.0
49.5
47.8
44.2
45.2
41.8
14.3
19.5
23.4
31.1
29.6
29.7
29.2
31.2
27.7
27.2
26.1
24.8
24.8
27.9
30.1
28.8
30.8
30.7
30.9
28.0
27.5
30.8
28.3
30.1
30.2
97.2
92.9
90.3
87.8
100.9
91.5
106.9
107.7
106.1
104.1
100.7
105.1
96.7 66.5
65.0
72.3
79.8
93.2 90.8
17.3 19.1 19.921.5
23.625.9 21.3
23.4 21.5 17.8 20.6 20.6 19.4 18.618.0 17.3
16.5 13.8 12.511.6
11.113.3 16.3
15.715.9
12.314.911.612.311.911.9
10.210.79.1
12.1 11.5
94.0
85.9
80.5
70.3
68.4
63.4
0
20
40
60
80
100
120
140
160
180
200
Q1 '00
Q2 '00
Q3 '00
Q4 '00
Q1 '01
Q2 '01
Q3 '01
Q4 '01
Q1 '02
Q2 '02
Q3 '02
Q4 '02
Q1 '03
Q2 '03
Q3 '03
Q4 '03
Q1 '04
Q2 '04
Q3 '04
Q4 '04
Q1 '05
Q2 '05
Q3 '05
Q4 '05
Q1 '06
Rp Savings Deposits Rp Demand Deposits FX Demand Deposits Rp Time Deposits FX Time Deposits
Q1 fall of 4.0% on Rp Time & Savings, FX Demand accounts
Deposit Analysis – Bank Only
Dep
osits
by
Typ
e (R
p tn
)
54.1%
45.3%
67.2%68.6%66.5%
68.3%
62.6%
48.7%44.6% 46.4%
53.7% 51.7%57.3% 56.2%
61.5%
47.8%
44.2%
51.5%50.9%
26.8%
44.5%
37.0%
33.8%32.1%31.4%32.1%32.9%
22.6%
Retail Deposits (%) Low-Cost Deposits (%)
As a %
of Total D
eposits

10
Savings deposit volume slips 7.5% in Q1
15.316.616.618.017.619.719.822.122.324.425.129.628.931.933.440.540.542.344.652.049.547.844.245.241.8
21.9%
22.7%
27.1%
30.6%
10.3%
16.2%
11.7%11.0%
22.8%
15.6%
16.0%16.8%
17.4%
16.9%13.5%
11.5%11.2% 15.2%
Q1 '00
Q3 '00
Q1 '01
Q3 '01
Q1 '02
Q3 '02
Q1 '03
Q3 '03
Q1 '04
Q3 '04
Q1 '05
Q3 '05
Q1 '06
Savings Deposits (Rp tn)
As % of Total Deposits
National Share of Savings Deposits (%)
3.7%
6.1%
3.7% 3.4% 3.5%3.3%
6.0% 4.4%4.8%4.3%
9.5%
6.9% 5.3%
10.6%
11.9%11.4%
6.8%8.4%
13.9%
6.4%
17.1%
12.7%11.9%
7.8%
13.1%
8.5%7.4%
17.0%Rp DDRp SavingsRp TD1 Mo. SBIs
Savings Deposit Growth Average Quarterly Deposit Costs (%)
SBITD
SDDD
2.7% 2.4%
0.8% 0.5%1.4%
4.4%
2.6%1.7%
1.1%1.9%
2.7%2.1%
4.3%4.0%Q
1 '02
Q3 '02
Q1 '03
Q3 '03
Q1 '04
Q3 '04
Q1 '05
Q3 '05
Q1 '06
FX DDFX TD FX TD
FX DD

11
Margins expand slightly on rising bond yields
All figures - Bank Only
2.6%
2.5%
3.0%
2.4%
2.5%
3.0%
3.0%
3.9% 2.9%
2.9%
3.4%
2.8%
3.0%
3.3%
3.3%
3.7%
4.7%
4.5%
4.0%
4.3%
4.3%
3.6%
3.8%
3.6%
3.8%
0.8% 0.8%
1.8%
2.2%
1.1%
1.5%
1.7%
2.2%
2.1%
2.0%
2.5%
2.2%
2.2%
2.5%
3.2% 3.2% 4.2% 4.2%
3.8%
4.1%
4.1%
3.4%
3.7%
3.4%
3.6%
Q1 '00
Q2 '00
Q3 '00
Q4 '00
Q1 '01
Q2 '01
Q3 '01
Q4 '01
Q1 '02
Q2 '02
Q3 '02
Q4 '02
Q1 '03
Q2 '03
Q3 '03
Q4 '03
Q1 '04
Q2 '04
Q3 '04
Q4 '04
Q1 '05
Q2 '05
Q3 '05
Q4 '05
Q1 '06
Spread
NIM
11.3%10.9%
11.9%
13.0%12.3%
12.6%12.8%13.0%
13.9%13.6%13.5%13.0%
11.8%11.5%
10.4%
9.5% 9.3%8.8% 8.7%
8.2%
9.4%
10.7%11.3%
10.5%10.1%10.1%
10.8%11.2%11.1%11.1%10.8%
11.8%11.6%11.0%10.8%
9.6%9.1%
7.2%
6.3%5.7%
7.8%
8.9%8.4%
7.3%
4.8%4.6%4.8%4.6%4.6%
5.1%
Yield on Assets
Cost of Funds

12
Quarterly Margin Analysis by Currency
Quarterly Rupiah Margins Quarterly Foreign Currency Margins
1.4%1.2%
1.6%2.4%2.5%
2.4%2.1%2.5%
3.9%4.0%3.5%4.1%3.6%4.1%
3.0%2.5%1.9%
3.7%4.1%
2.1%
2.6%
2.4%
3.5%4.5%
1.4%
13.0%
15.9%
14.1%
18.3%18.9%
11.9%
12.4%
8.2%
10.2%
14.0%
17.6%
12.5%12.7%
7.4%
8.5%
13.1%
17.6%
14.0%
8.3%
5.4%7.3%
11.7%
14.4%
11.1%
Q1 '00
Q3 '00
Q1 '01
Q3 '01
Q1 '02
Q3 '02
Q1 '03
Q3 '03
Q1 '04
Q3 '04
Q1 '05
Q3 '05
Q1 '06
Avg SpreadAvg Loan YieldAvg Bond YieldAvg 1-Mo. SBIAvg COF
0.5%1.6%
0.4%-0.5%
0.8%
1.0%1.6%2.9%
3.4%2.5%1.3%0.1%
-0.2%-0.8%
0.8%
2.2%1.4%
0.6%
0.2%
-2.9%
3.0%2.9%
3.0%1.4%3.1%
4.2%
7.3%6.5%
11.8%
5.7%
5.6%
7.6%
3.5%4.6%5.1%
Q1 '00
Q3 '00
Q1 '01
Q3 '01
Q1 '02
Q3 '02
Q1 '03
Q3 '03
Q1 '04
Q3 '04
Q1 '05
Q3 '05
Q1 '06
Avg SpreadAvg Loan YieldAvg Bond YieldAvg USD 1Mo SIBORAvg COF
13
Details of Q1 2005 & 2006
107.4 145.6 141.3 136.7 134.1 163.6 133.5
60.6 38.588.3
109.1 81.4 65.5 102.391.2
75.432.8
17.0
34.613.7 70.3
41.24.3
19.8
10.956.7
62.1
92.3 61.348.8
75.4 65.2
113.5
54.920.3
23.2
25.425.1
26.132.4 38.0
38.6
37.56.5 55.4
22.721.8 17.8
28.7 20.9
20.4
26.5
112.5 127.5
Q1 '04
Q2 '04
Q3 '04
Q4 '04
Q1 '05
Q2 '05
Q3 '05
Q4 '05
Q1 '06
Credit CardsTransfer, Collection, Clearing & Bank ReferenceOpening L/C & Bank GuaranteesFee from SubsidiariesOthersAdministration Fee for Deposit & Loan
7.3% 9.6%11.5% 12.4% 12.8% 12.8% 12.1%
17.7%
10.9%
% of Operating Income*
Non-loan Related Fees & Commissions decline on Subsidiaries
Non-loan related fees & commissions
*Non-Loan related fees & commissions/Total Operating Income*Others include Custodian & Trustee fees, Syndication, Mutual Funds, Payment Points, etc.
(12.2)338.66385.73Total
48.426.4817.84Credit Cards
43.937.5326.08Transfers, Collections..
12.454.9048.83L/C & Guarantees
(84.6)10.8570.31Subsidiaries
(7.3)75.4181.37Others*
(5.5)133.48141.31Administration Fees
Y-o-Y
(%)
Q12006
Q12005
Non-Loan Related Fees &
Commissions(Rp billion)

14
379276359336314428270753365500472775388460618749521670763
1,034678793767842
370 325
299298 406
322389475 408495
419377
527555
597723
604677667
1,241637
695
211
327
649
957
Q1 '00
Q3 '00
Q1 '01
Q3 '01
Q1 '02
Q3 '02
Q1 '03
Q3 '03
Q1 '04
Q3 '04
Q1 '05
Q3 '05
Q1 '06
G&A Expenses (Rp bn) Personnel Expenses (Rp bn)
Cost to Income Ratio returns to below 50% in Q1
48.2%
83.3%
33.7%
43.7%38.9%
36.9%33.8%
37.1%
57.6%
45.4%
31.1%
39.9%42.8%
40.4%
CIR* (%)
Annual Avg CIR (%)
*Excluding Bond gains
15.7%268,354 231,956 Base Salary
14.1%303,387 265,803 Other Allowances
(6.0%)637,037 677,546 Total G & A Expenses
32.4%41,592 31,403 Employee Related
(32.2%)52,140 76,850 Professional Services
1.4%63,355 62,467 Transportation & Traveling
16.5%76,744 65,849 Subsidiaries
103,035
201,310
136,632
604,086
24,821
63,267
18,239
Q1‘05
(58.2%)43,078 Promotion & Sponsorship
(15.6%)169,839 IT & Telecommunication
G & A Expenses
15.1%695,295 Total Personnel Expenses
7.3%26,627 Training
46.6%26,741 Post Employment Benefits
Personnel Expenses
Change (Y-o-Y)
Q1 ‘06
39.3%190,289 Occupancy Related
70,186 10.9%Subsidiaries
Breakdown of Q1 2005 & 2006 Operating ExpensesQuarterly Consolidated Operating Expenses & CIR

15
1,245321
1,7878173,574
70,944
Beg.Balance
U/G fromNPL
D/G toNPL
NetDisburse.
FX Impact EndBalance
Q1 2006 Loan Movement, PL & NPL
Performing Loan Movements (Rp bn) - Bank Only Non-Performing Loan Movements (Rp bn) – Bank Only
27,1268126,752 1,787 120
22834
1,190
Beg.Balance
U/G to PL D/G fromPL
Disburse. CollectionsWrite-OffsFX Impact EndBalance

16
Q1 2006 Movement in Category 1 and 2 Loans
60,662889
20126
257
1,4092,295 58,857
Beg. Bal. D/G to 2 U/G from2
D/G toNPL
U/G fromNPL
NetDisburse.
FX Impact End Bal.
Category 1 Loan Movements (Rp bn) – Bank Only Category 2 Loan Movements (Rp bn) – Bank Only
356
120551,530
1,4092,29512,91212,087
Beg. Bal. Cat. 1 D/G U/G to 1 D/G to NPL NPL U/G NetDisburse.
FX Impact End Bal.

17
NPL Movement - Consolidated
14.1%12.5% 9.4%
9.1%9.0% 6.6%
7.3%7.3%
25.3%26.2%
7.2%8.2%8.4%
23.4%24.6%
9.7% 7.3%
8.6%
7.1%17.8%
9.5% 10.3%15.4%13.7%15.3%15.0%
46.9%
44.4%
139.1%
128.8%
128.4%
190.4%
129.5%
100.2%
Q1 '01
Q3 '01
Q1 '02
Q3 '02
Q1 '03
Q3 '03
Q1 '04
Q3 '04
Q1 '05
Q3 '05
Q1 '06
Gross NPL Ratio Net NPL RatioProv/NPL Prov/NPL incl. Coll.
Provisioning coverage reflects BI requirements
Category 2 Loans – Bank Only
14,81715,48911,93212,65511,02913,37811,37116,20217,43215,58515,34510,983106219,9129,8528,334
12,35214,39416,42312,91212,086
0
2,000
4,000
6,000
8,000
10,000
12,000
14,000
16,000
18,000
20,000
Q1 '01
Q3 '01
Q1 '02
Q3 '02
Q1 '03
Q3 '03
Q1 '04
Q3 '04
Q1 '05
Q3 '05
Q1 '06
2 - Special Mention Loans (Rp Bn)
12.3%9.4%
15.0%
24.8%26.2%
0%
10%
20%
30%
40%
50%
Cat 2 %
18
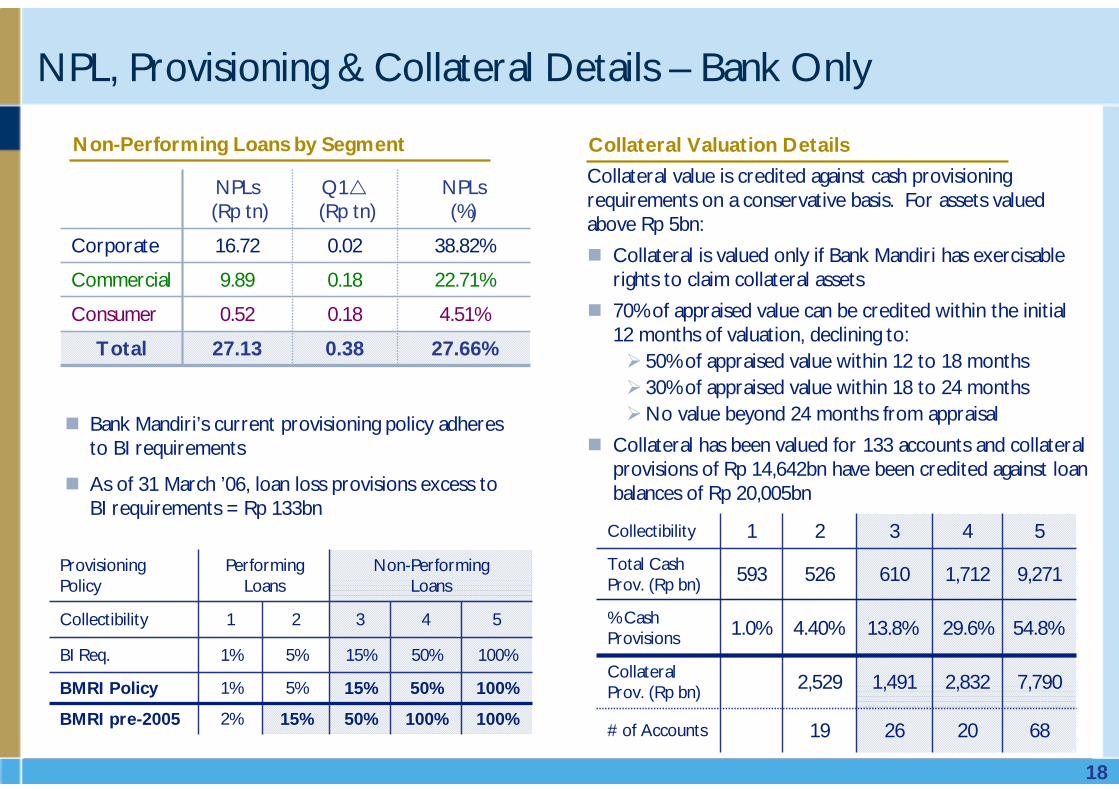
NPL, Provisioning & Collateral Details – Bank Only
27.13
0.52
9.89
16.72
NPLs(Rp tn)
4.51%0.18Consumer
38.82%0.02Corporate
NPLs(%)
Q1(Rp tn)
22.71%0.18Commercial
0.38Total 27.66%
100%50%15%5%1%BMRI Policy
100%
54321Collectibility
Non-PerformingLoans
PerformingLoans
50%
15%
15%
5%
100%2%BMRI pre-2005
100%50%1%BI Req.
Provisioning Policy
Collateral Valuation DetailsNon-Performing Loans by Segment
Bank Mandiri’s current provisioning policy adheres to BI requirements
As of 31 March ’06, loan loss provisions excess to BI requirements = Rp 133bn
Collateral value is credited against cash provisioning requirements on a conservative basis. For assets valued above Rp 5bn:
Collateral is valued only if Bank Mandiri has exercisable rights to claim collateral assets
70% of appraised value can be credited within the initial 12 months of valuation, declining to:
50% of appraised value within 12 to 18 months30% of appraised value within 18 to 24 monthsNo value beyond 24 months from appraisal
Collateral has been valued for 133 accounts and collateral provisions of Rp 14,642bn have been credited against loan balances of Rp 20,005bn
9,2711,712 610 526 593 Total Cash Prov. (Rp bn)
54321Collectibility
68
54.8%29.6%13.8%4.40%1.0%% Cash Provisions
26
1,491
19
2,529
20# of Accounts
7,790 2,832 Collateral Prov. (Rp bn)

19
4.5%
3.6%
5.1%
1.2%
4.8%
2.9%
Q4 2005
Q1 2006 Details
84,767.6
1,972.6
59,005.7
902.8
4,123.9
18,762.7
Q1 ‘06 Balance (Rp
bn)
Q3 2005
Q1 2006
UG toPL
DG to NPL
Q2 2005
Loan Background
1.8%
0.2%
2.3%
0.2%
0.3%
0.8%
Total Corporate, Commercial & Small Business Loans
Net Upgrades/Downgrades#
2.0%
0.4%
1.4%
0.1%
0.5%
4.5%
8.0%
1.8%
8.2%
0.1%
3.4%
10.0%
0.1%
0.3%
0.1%
0.1%
-
0.1%
1.8%
0.4%
2.3%
0.2%
0.3%
0.9%
Total
Overseas
Post-Merger
Pre-Merger
IBRA
Restructured
Quarterly Analysis of Upgrades and Downgrades*
* Excluding Micro & Consumer Banking# % downgrades and upgrades are quarterly figures
Note: For a breakdown of Corporate and Commercial loans, please refer to the detail slide in the appendix.

20
1,483
3,357
4,145
3,514
4,787
5,492
2,650
1,196
260
114
402
103
2,021
2,072
1,651
74
1,454
354
367
0
1,000
2,000
3,000
4,000
5,000
6,000
7,000
8,000
2000 2001 2002 2003 2004 2005 Q1 '06
Gain on Sale/Value of Securities
FX Gain
Core Earnings
Pre
-Pro
visi
on
Ope
rati
ng P
rofit
IDR bn
Q1 2006 core earnings decline 19.4% from Q1 2005
472 308
1,1681,549 1,744
519 510290
1,300
602
690
1,329
97
9671,017
1,528
1,408
668
(410)
645799
819
775
(623)
829
2000 2001 2002 2003 2004 2005 2006
Q1 PAT Q2 PAT Q3 PAT Q4 PAT
8.1%
21.5%23.6%
8.7%
22.8%
26.2%
2.5%
RoE - After Tax(Annualized)
Core Earnings Profit After Tax & ROE

21
44.0
42.3
42.6
59.2 51.3
51.6
58.1
61.0
56.1
64.3
72.5
77.8
79.5
89.5
91.9
94.2
96.2
102.3
108.9
114.1
115.9
117.5
115.9
110.7
15.5
14.6
15.1
15.4
17.8
16.8
18.4
17.0
20.7
24.4
25.0
25.5
28.1
26.5
27.2
27.5
30.4
27.5
27.8
27.4
27.9
13.3
13.3
9.7Q
2 '00
Q3 '00
Q4 '00
Q1 '01
Q2 '01
Q3 '01
Q4 '01
Q1 '02
Q2 '02
Q3 '02
Q4 '02
Q1 '03
Q2 '03
Q3 '03
Q4 '03
Q1 '04
Q2 '04
Q3 '04
Q4 '04
Q1 '05
Q2 '05
Q3 '05
Q4 '05
Q1 '06
RWA (Rp tn) Total Capital (Rp tn)
26.1%
31.3%
26.4%27.5%
25.3% 25.2%
23.7%
23.7%
28.5%29.8%
23.4%
27.7%
30.7%
CAR
BI Min Req
High CAR maintained at 25.2%

22
Additional Factors
Written-off Loans
Written-off Loans
Aggregate of IDR 22.93 tn (US$ 2.53 bn) in written-off loans as of end-March 2006, with significant recoveries on-going:
2001: IDR 2.0 tn2002: IDR 1.1 tn2003: IDR 1.2 tn2004: IDR 1.08 tn2005: IDR 0.818 tn (US$ 83.2 mn)Q1 ’06: IDR 0.204 tn (US$ 22.5 mn)
Loan Collateral
Undervalued
Loan Collateral
Undervalued
Collateral values included for provisioning purposes on only 133 accounts. This will rise as current valuations are completed

23
Corporate Actions
DividendPaymentDividendPayment
Dividend Payment of Rp14.853 per share
Schedule :
a. Cum Date : June 14, 2006
b. Ex Date : June 15, 2006
c. Payment Date : June 30, 2006
Total Dividend payments for 2005 = Rp301,684,655,575.70

24
Annual General Meeting Results
1. Approved Annual Report of the Company for the Financial Year Ending on 31 Dec ’05 and ratified Consolidated Financial Report of the Company for the Financial Year Ending on 31 Dec ’05.
2. Approved Annual Report of the Partnership and Environment Construction Program for the Financial Year Ending on 31 Dec ’05.
3. Gave full release and discharge (volledig acquit et de charge) to the Board of Directors and Board of Commissioners for their management and supervision during the Financial Year Ending 31 Dec ’05.
1. Approved and determined the use of the net profit of the company for the Financial Year of 2005, in amount of Rp603,369,311,151.39.
1. To appoint the Public Accountant Office Purwantono, Sarwoko & Sandjaya – Ernst & Young as the Public Accountant Office to audit the Consolidated Financial Report of the Company for the Financial Year Ending 31 Dec ’06.
2. To Appoint the Financial and Development Supervisory Board of the Province of DKI Jakarta II (BPKP Provinsi DKI Jakarta II) to audit the Annual Report of Partnership and Environment Construction Program for the Financial Year Ending on 31 Dec ’06.
Agenda 1Agenda 1
Agenda 2Agenda 2
Agenda 3Agenda 3

25
1. Approved that Salary of the members of The Board of Directors and the members of the Board of Commissioners shall not increase, therefore the amount of such salary and honorarium remains the same as the amount of salary and honorarium as determined in the Annual General Meeting of shareholders held on 16 May ’05.
2. Approved that Facilities and Benefits of the members of the Board of Directors and the members of the Board of Commissioners is determined pursuant to the resolution of the Annual General Meeting of Shareholders held on 14 Jun ’02 and Letter of The Ministry of The State-owned Enterprise No. S-412/MBU/2004, dated 10 August ’04.
3. Approved that Post-service benefits of the members of the Board of Directors and the members of Board of Commissioners is determined pursuant to the resolution of the General Meeting of Shareholders held on 22 Jan ’03.
1. Approved to grant options for phase-III amounting to 309,416,215 options or 1.55% of the fully issued and paid-up capital at the time of IPO, to buy the Company’s new Series B shares which will be issued, in which every 1 (one) option gives right to the holder to buy 1 (one) Company’s new Series B shares.
2. Determined the price and the implementation guidelines of MSOP phase-III shall follow the Decision of the Board of Directors of Jakarta Stock Exchange No. Kep-305/BEJ/07/2004, dated on 19 Jul ’04, particularly Rule No.1-A.
Annual General Meeting ResultsAgenda 4Agenda 4
Agenda 5Agenda 5

26
3. Approved that to grant authority to the Board of Commissioners to:a. Increase the issued and paid-up capital of the Company, which followed by the amendment of
article 4 paragraph 2 and paragraph 3 of the Company’s Articles of Association in case there is an execution of the option by purchasing the Company’s new Series B shares.
b. Determine the implementation and supervision policy of MSOP phase-III, including to determine the option receiver, and to report it to the next General Meeting of Shareholders.
1. To terminate with honor, Johannes Bambang Kendarto as Director of the Company and thank him for his services provided during his post effective as of the closing of this Meeting.
2. To appoint 5 new Directors of the Company , as follows: 1. Sentot A. Sentausa - Director 2. Thomas Arifin - Director 3. Budi G. Sadikin - Director 4. Bambang Setiawan - Director5. Riswinandi - Director
3. To designate Edwin Gerungan, who is the President Commissioner of the Company, as an Independent Commissioner.
4. Approved to grant authority to the Board of Commissioners of the Company to determine the allocation of duty and authority among the Directors of the Company pursuant to the Articles of Association of the Company.
Annual General Meeting ResultsAgenda 5 (cont.)Agenda 5 (cont.)
Agenda 6Agenda 6

27
Comprehensive implementation of Service Excellence Program
A mystery shopping survey by MRI, along with setting up measurement parameters & service level indicators in respective working units at banking industry best practice as well as its rigorous and continuous monitoring Implement scoring tools by SQLO (Service Quality Liaison Officer) of hubs & regional offices to track and monitor branch service quality
On-going training program for Front Liners (Customer Service), Headof hubs & spokesAnnual selection program for The Best Front Liners and The Best BranchParticipation in the National Customer Service Championships
More convenient and efficient Queuing SystemsFreeing up CSOs / CSRs to focus on servicing customersIntroducing Week-end Banking
Measuring Service Quality
Measuring Service Quality
Internalization and
Recognition Program
Internalization and
Recognition Program
Implementing Breakthrough
Projects
Implementing Breakthrough
Projects
28
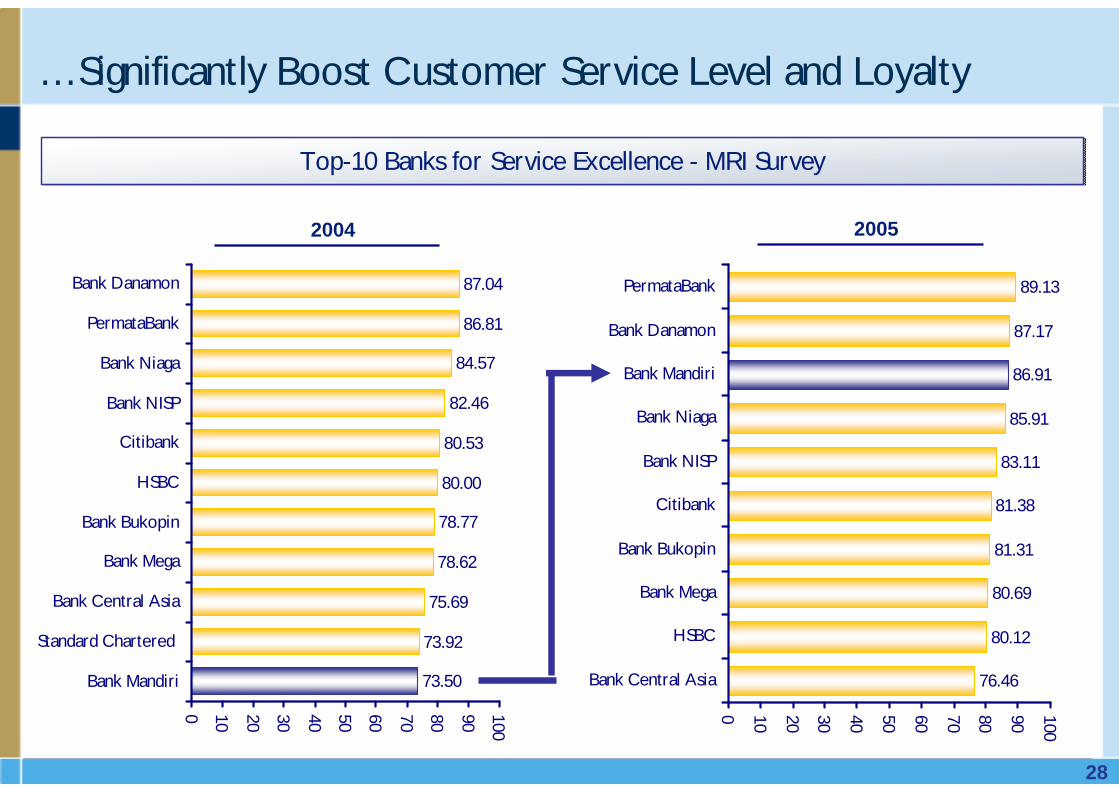
…Significantly Boost Customer Service Level and Loyalty
73.50
73.92
75.69
78.62
78.77
80.00
80.53
82.46
84.57
86.81
87.04
0 10 20 30 40 50 60 70 80 90 100
Bank Mandiri
Standard Chartered
Bank Central Asia
Bank Mega
Bank Bukopin
HSBC
Citibank
Bank NISP
Bank Niaga
PermataBank
Bank Danamon
Top-10 Banks for Service Excellence - MRI SurveyTop-10 Banks for Service Excellence - MRI Survey
76.46
80.12
80.69
81.31
81.38
83.11
85.91
86.91
87.17
89.13
0 10 20 30 40 50 60 70 80 90 100
Bank Central Asia
HSBC
Bank Mega
Bank Bukopin
Citibank
Bank NISP
Bank Niaga
Bank Mandiri
Bank Danamon
PermataBank
2004 2005

29
65.19
68.35
69.66
70.13
70.42
73.74
77.73
78.02
78.12
82.94
0 10 20 30 40 50 60 70 80 90 100
Standard Chartered
Bank Mega
HSBC
Citibank
Bank Bukopin
Bank NISP
Bank Niaga
Bank Mandiri
Bank Danamon
Bank Permata
Customer ServiceCustomer Service Banking HallBanking Hall Phone BankingPhone Banking
Understand product knowledge and communicate well.
Provide product explanation to customers clearly and
sufficiently
Understand product knowledge and communicate well.
Provide product explanation to customers clearly and
sufficiently
Outstanding in several Service Areas
Provide comfort for customers in conducting their transactionsProvide comfort for customers in conducting their transactions
Ability to serve promptly and securely, and provide reliable
peripherals
Ability to serve promptly and securely, and provide reliable
peripherals
96.77
97.42
97.86
98.31
98.65
99.33
99.52
100.00
100.00
100.00
0 10 20 30 40 50 60 70 80 90 100
HSBC
Bank NISP
BII
Bank Central Asia
Bank Permata
Citibank
Bank Mega
Bank Niaga
Bank Mandiri
Bank Danamon
67.13
67.27
70.80
72.35
75.22
76.00
76.56
78.03
78.42
80.43
0 10 20 30 40 50 60 70 80 90 100
Standard Chartered
BII
Bank BNI
Bank Bukopin
Bank Niaga
Bank Mega
Bank Danamon
Bank NISP
Bank Permata
Bank Mandiri
30
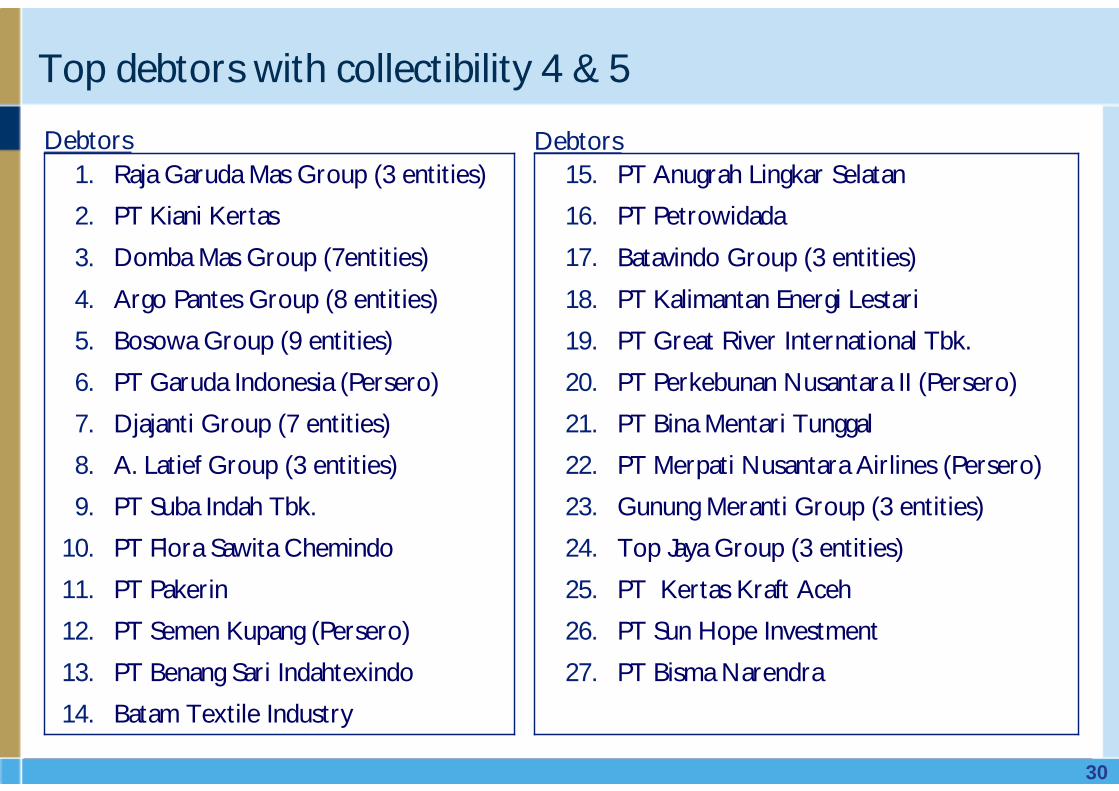
Top debtors with collectibility 4 & 5
Batam Textile Industry14.
PT Bisma Narendra27.PT Benang Sari Indahtexindo13.
PT Sun Hope Investment26.PT Semen Kupang (Persero)12.
PT Kertas Kraft Aceh25.PT Pakerin11.
Top Jaya Group (3 entities)24.PT Flora Sawita Chemindo10.
Gunung Meranti Group (3 entities)23.PT Suba Indah Tbk.9.
PT Merpati Nusantara Airlines (Persero)22.A. Latief Group (3 entities)8.
PT Bina Mentari Tunggal21.Djajanti Group (7 entities)7.
PT Perkebunan Nusantara II (Persero)20.PT Garuda Indonesia (Persero)6.
PT Great River International Tbk.19.Bosowa Group (9 entities)5.
PT Kalimantan Energi Lestari18.Argo Pantes Group (8 entities)4.
Batavindo Group (3 entities)17.Domba Mas Group (7entities)3.
PT Petrowidada16.PT Kiani Kertas2.
PT Anugrah Lingkar Selatan15.Raja Garuda Mas Group (3 entities)1.Debtors Debtors

31
Status of selected large debtors
RGM is required to increase installment amount to improve loan quality and ensure final settlement by June 2010
Awaiting concrete proposal from debtor & Government to improve loan Bank Mandiri holds MCBs of Rp1,018 billion, and is still waiting for formal extension of Government guarantee
Bank Mandiri still open to opportunities to negotiate with potential investors to resolve the outstanding loans
Restructuring of loans to Argo Pantes require debtor to dispose of non-core assets and property of PT. Alfa Goldland Realty (subsidiary) as sources of repayment
Subsidiaries are no longer in operation, so Bank Mandiri will recover loans through collateral sales / asset disposals, and will collect the remainder from the Djajanti Group Owner
Raja GarudaMas
Raja GarudaMas
Kiani KertasKiani Kertas
Argo PantesArgo Pantes
GarudaIndonesiaGaruda
Indonesia
DjajantiGroup
DjajantiGroup
32
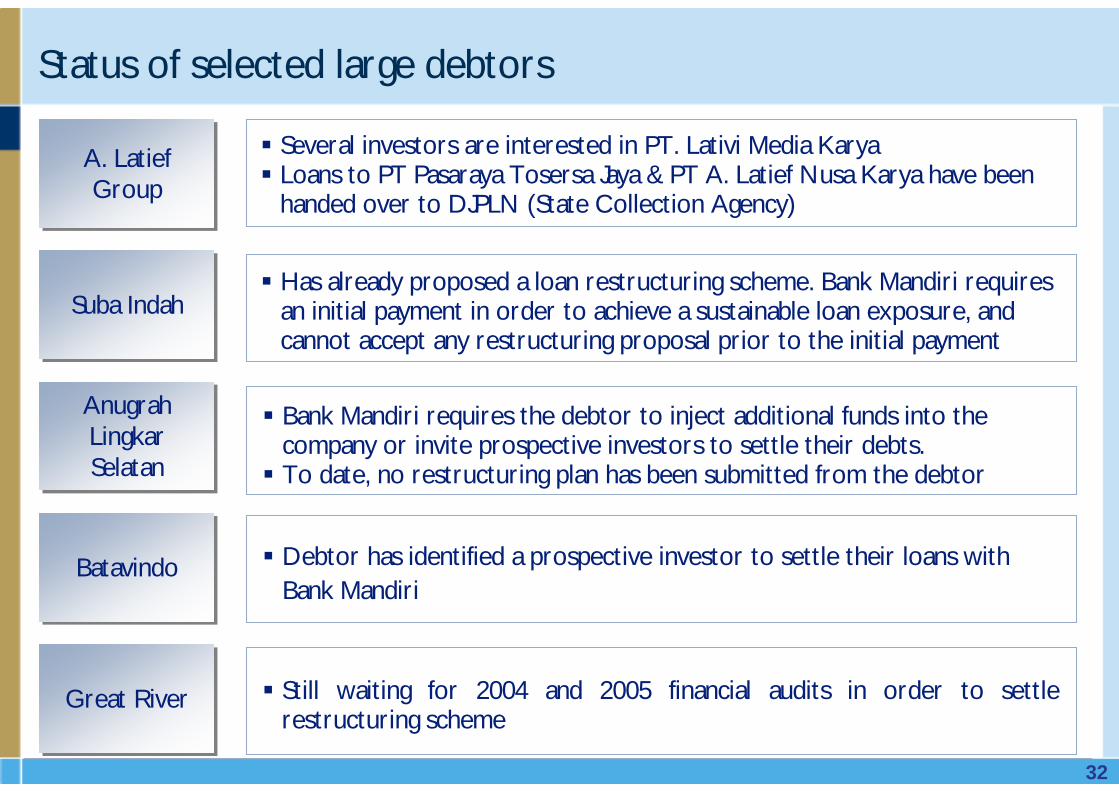
Status of selected large debtors
Several investors are interested in PT. Lativi Media KaryaLoans to PT Pasaraya Tosersa Jaya & PT A. Latief Nusa Karya have been handed over to DJPLN (State Collection Agency)
Has already proposed a loan restructuring scheme. Bank Mandiri requires an initial payment in order to achieve a sustainable loan exposure, and cannot accept any restructuring proposal prior to the initial payment
Bank Mandiri requires the debtor to inject additional funds into the company or invite prospective investors to settle their debts.To date, no restructuring plan has been submitted from the debtor
Debtor has identified a prospective investor to settle their loans with Bank Mandiri
Still waiting for 2004 and 2005 financial audits in order to settle restructuring scheme
A. LatiefGroup
A. LatiefGroup
Suba IndahSuba Indah
AnugrahLingkarSelatan
AnugrahLingkarSelatan
BatavindoBatavindo
Great RiverGreat River

33
Update on regulations to accelerate NPL resolution
Consultations with other stakeholders and regulators are underwayBI strongly supports the issuance of the new regulations, stating that it will help to accelerate the resolution of recently increasing NPLs in the banking systemState auditor (BPK) also says that such regulation can be issued as long as that the process to implement the additional authority is accountable, transparent and done in conjunction with capability development of the state banks
Source: MoF presentations, News search
A Government Regulation (PP) to clarify that State Owned Enterprise’s (SOE) receivables are not state receivables and need not be managed and resolved as suchA Ministry of Finance Regulation clarifying the authority of State Banks to manage receivables, including resolving NPLs, in line with corporate laws and regulations
The Office of the Coordinating Minister of Economy plays an important role in ensuring that all regulations related to the Financial Sector Reform package, including the two regulations mentioned above, will be completed on timeThe two regulations relating to SOE receivables are expected to be completed before the end of June 2006
Ministries of Finance and SOE have publicly stated that the Government is in the process of preparing two regulations to accelerate NPL resolution in State Banks:Ministry of
Finance & Ministry of
SOE
Ministry of Finance & Ministry of
SOE
Bank Indonesia and
Other Key Stakeholders
Bank Indonesia and
Other Key Stakeholders
Other Government
Bodies
Other Government
Bodies

34
New regulations expected to provide flexibility in managing NPLs
Clarification will allow for resolution and management of SOE receivables through mechanisms not available for state receivables
The authority will be implemented through accountable and transparent means and in accordance with good governance principlesThe authority will allow acceleration of NPL resolution through loan disposal or sale in bulk or individuallyIf required, SOEs can provide principal forgiveness to cooperative debtors in settling their obligations in a manner similar to private banks
Initially expect a regulatory framework for establishing an SPV in IndonesiaThe regulation would allow a separation between economic beneficiary and legal ownership of assets Currently there is no clear signal if the regulatory framework is going to be part of the soon to released financial sector package
The regulation is the basis to provide authority to SOE banks to manage NPLs in accordance with corporate laws and regulationsThe regulation is consistent with Law No. 1/ 2004 which defines state receivables as the amount of money owed to the central government
Clarify that SOE
Receivables are not State Receivables
Clarify that SOE
Receivables are not State Receivables
Authority of SOE in
managing and resolving
Receivables
Authority of SOE in
managing and resolving
Receivables
SPV Regulatory Framework
SPV Regulatory Framework

35
Alternatives for NPL resolution with expected new regulations
State Banks can currently provide principal reduction up to Rp 10bn when approved by the Minister of Finance. The new regulations would allow for principal reduction in settlement with existing debtors after consideration of the following aspects
Private banks in Indonesia that have significantly reduced NPLs through such salesDisposal can be done with individual loans or portfolios of loansCriteria need to be defined for eligibility of investors to participate
Establishing an off-shore SPV(s) as the new legal owner of the assetsEstablishing a JV Financial Company in Indonesia to manage problem loans/NPLsPotential investors can be invited to be joint owners of the company/entity
Debtors’ cooperation & good intentions. Uncooperative debtors will not be eligibleCash flows both from operations as well other assetsCommercial considerations - settlement of problem loans > other alternatives including restructuring through interest rate reduction or increasing tenor/ postponement of principal payment
The authority to optimally resolve NPLs should include pursuing disposal or sale of loans to third parties, if necessary at below the principal value
The legal framework for establishing SPV in Indonesia is not expected, but it is still possible to establish a company for managing and resolving NPLs by:
Principal Reduction for
Settlement with Debtors
Principal Reduction for
Settlement with Debtors
Loan Disposal Loan Disposal
Establishing off-shore SPV
or JV Financial Company
Establishing off-shore SPV
or JV Financial Company

36
Establishing a “Bad Bank” remains an option
Achieve the target of 5% Net NPL by 2007Bank Mandiri has Rp ~27.1tn on-balance sheet NPLs & Rp 22.9tn off-balance-sheetImplementation of the bad-bank concept could accelerate the resolution and allow management to focus on business/debtors with future prospects
Significant management time is now allocated to manage and resolving NPLs, hindering our ability to grow good business Significant personnel from our credit restructuring unit (22.5%) are now dedicated to managing off-balance sheet problem loansThese resources can be allocated to debtors with better prospects if our off-balance sheet loans can be managed by the bad bank
With the revision, State Banks can dispose of NPLs in the same manner as private banksFor optimal returns, Bank Mandiri would like to retain the economic benefits from future collection from the NPLs
Due to the high level of NPLs both off and on balance sheet, Bank Mandiri needs to pursue options which could quickly:
Resolution of NPLs in bulkResolution of NPLs in bulk
Limited Resources to Manage NPLs
Limited Resources to Manage NPLs
Retaining Upside from
NPL Collections
Retaining Upside from
NPL Collections

37
Internal work in progress to accelerate NPL resolution
In AGM/EGMs, a limit of Rp 5 tn in principal reduction has been approved and is available for written-off loansOur credit restructuring unit will centrally monitor the utilization of these limits
We are revising or developing new policies and procedures to be implemented with the additional authority provided by the new regulationDeveloping eligibility criteria for principal reduction or loan disposalUn-cooperative debtors will not be eligible for principal reduction
Independent parties to conduct legal & commercial review of loan disposalNew and revised policies will need to be reviewed by the commissioners Regulators and supervisor body are to be consulted to ensure policies are in line with good governance as expected by these stakeholders
BOD has proposed a separate Directorate to manage NPLs:A separate unit within Credit Restructuring will focus on disposal and other exit strategies made possible with the new regulationsCMO will explore options to establish a bad-bank with help of advisors
Shareholder Approval for
Principal Reduction
Shareholder Approval for
Principal Reduction
OrganizationOrganization
Policies and Criteria
Policies and Criteria
Review by Independent
Parties
Review by Independent
Parties

38
25.4
79.351.140.6
171.090.6(9.1)17.881.999.762.529.01.7
93.24.18.25.13.7
14.3
2.4
249.4Rp (trillions)
Q1’05
98.30.87.36.5Certificates of BI
55.32.422.220.3Current Account w/BI
36.00.43.32.5Cash
23.9
110.143.844.1
198.192.2
(12.9)27.577.6
105.161.128.92.2
92.23.5
16.30.0
254.9Rp (trillions)
Q1 ‘06
(5.8)2.623.2Shareholders’ Equity
38.912.1112.7Certificate & Time Deposits
(14.2)4.847.2Savings Deposits
8.74.946.4Demand Deposits
15.821.9206.3Total Deposits – Non-Bank
55.53.027.0Non-Performing Loans
5.611.6106.9Loans
44.7(1.4)(12.0)Allowances
(2.3)6.761.1HTM
(0.2)3.228.8AFS
(1.1)10.292.1Government Bonds
1.710.297.9Loans – Net
(5.2)8.679.8Performing Loans
31.10.22.1Trading
(14.1)0.44.0Securities - Net
98.61.816.1Current Accounts & Placements w/Other Banks
(100.0)0.08.3Other Placements w/BI
2.228.1263.4Total Assets
Rp % ChangeUSD (billions)#Rp (trillions)
Y-o-YQ4‘05
Summary Balance Sheet: March & Dec 2005, March 2006
# USD1 = Rp9,065.5

39
Summary Quarterly Balance Sheet: Q2 ‘05 – Q1 ‘06
13.30.87.36.50.15.4Certificates of BI
9.42.422.220.318.815.9Current Accounts w/BI
29.50.43.32.52.62.3Cash
23.2
112.7
47.2
46.4
206.3
97.9
-12.0
27.0
79.8
106.9
61.1
28.8
2.1
92.1
4.0
16.1
8.3
263.4
Rp (tn)
Q4 ‘05
23.9
110.1
43.8
44.1
198.1
92.2
(12.9)
27.5
77.6
105.1
61.1
28.9
2.2
92.2
3.5
16.3
0.0
254.9
Rp (tn)
Q1 ‘06
2.92.623.622.8Shareholders’ Equity
(2.3)12.199.489.2Certificate & Time Deposits
(7.0)4.846.049.5Savings Deposits
(4.9)4.941.144.4Demand Deposits
(4.0)21.9186.4183.2Total Deposits – Non-Bank
1.73.025.025.6Non-Performing Loans
(1.7)11.6106.7104.0Loans
7.6(1.4)(11.9)(10.9)Allowances
0.06.761.161.1HTM
0.43.228.829.0AFS
0.210.292.392.5Government Bonds
(5.8)10.294.793.1Loans – Net
(2.8)8.681.778.5Performing Loans
3.10.22.32.4Trading
(12.2)0.44.23.3Securities - Net
1.51.812.613.4Current Accounts & Placements w/Other Banks
(100.0)0.02.44.1Other Placements w/BI
(3.1)28.1250.3256.8Total Assets
Rp % ChangeUS$ (bn)#Rp (tn)Rp (tn)
Q-o-QQ3 ‘05Q2 ‘05
# USD1 = Rp9,065.5
40
Summary P&L Information – Q1 2006
0.9
1.3
0.0
1.4
(0.3)
(1.1)
(1.0)
(1.3)
0.1
0.9
4.0
(4.0)
8.0
% of Av.Assets*
519
801
(13)
814
(165)
(678)
(604)
(763)
88
566
2,370
(2,407)
4,777
Rp (Billions)
Q1 2005
(808.0)0.5354 (0.1)(50)Gain from Increase in Value & Sale of Bonds
(90.5)0.06 0.163 Non Operating Income
(4.3)(0.2)(133)(0.2)(139)Other Operating Expenses**
(206.9)1.2787 (1.1)(736)Net Income Before Tax
(24.5)(1.0)(636)(1.3)(842)G & A Expenses
(44.0)(1.1)(695)(1.9)(1,241)Personnel Expenses
(23.0)(1.3)(873)(1.8)(1,134)Provisions, Net
(181.9)0.8510 (1.0)(623)Net Income After Tax
(197.7)1.2781 (1.2)(799)Profit from Operations
28.20.9554 0.7432 Other Operating Income
6.73.42,210 3.22,071 Net Interest Income
8.7(6.6)(4,297)(6.2)(3,952)Interest Expense
8.010.06,507 9.46,023 Interest Income
(%)% of Av.Assets
Rp (Billions)
% of Av.Assets*
Rp (Billions)
Q-o-Q Change
Q1 2006Q4 2005
* % of Average Assets on an annualized basis** primarily premiums paid under the blanket guarantee scheme

41
Trading AFS HTM Trading AFS HTMFixed Rate
FR0002 15-Jun-09 14.00% 68 105.85 72 FR0005 15-Jul-07 12.25% 500 100.66 503 FR0010 15-Mar-10 13.15% 1,350,000 100.00 1,350,000 FR0014 15-Nov-10 15.58% 2,947 112.71 3,321 FR0019 15-Jun-13 14.25% 1,101,133 110.21 1,213,547 FR0020 15-Dec-13 14.28% 518,538 538,491 110.67 573,850 595,932 Sub Total 519,106 1,642,571 1,350,000 574,426 1,812,801 1,350,000
Variable RateVR0010 25-Oct-06 12.92% 1,342,361 100.03 1,342,710 VR0011 25-Feb-07 12.92% 5,000 100.01 5,001 VR0012 25-Sep-07 12.73% 44,000 190,000 100.00 43,998 189,992 VR0013 25-Jan-08 12.92% 155,000 1,198,384 99.98 154,961 1,198,084 VR0014 25-Aug-08 12.92% 40,000 99.84 39,936 VR0016 25-Jul-09 12.92% 20,000 99.18 19,837 VR0017 25-Jun-11 12.73% 30,000 328,270 99.21 29,762 325,670 VR0019 25-Dec-14 12.73% 5,050,000 1,114,300 99.19 5,009,196 1,114,300 VR0020 25-Apr-15 12.92% 4,100,000 391,029 99.08 4,062,362 391,029 VR0021 25-Nov-15 12.92% 2,400,000 690 99.07 2,377,656 690 VR0022 25-Mar-16 12.73% 692,844 6,796,813 99.06 686,352 6,796,813 VR0023 25-Oct-16 12.92% 659,738 4,086,068 98.91 652,534 4,086,068 VR0024 25-Feb-17 12.69% 8,210,550 100.00 8,210,550 VR0025 25-Sep-17 12.83% 5,210,550 100.00 5,210,550 VR0026 25-Jan-18 12.09% 3,475,267 100.00 3,475,267 VR0027 25-Jul-18 12.09% 3,475,267 100.00 3,475,267 VR0028 25-Aug-18 12.92% 1,696,428 3,475,267 98.88 1,677,377 3,475,267 VR0029 25-Aug-19 12.92% 5,344,421 3,475,267 98.80 5,280,235 3,475,267 VR0030 25-Dec-19 12.83% 8,016,765 100.00 8,016,765 VR0031 25-Jul-20 12.92% 5,597,343 12,016,765 98.65 5,521,555 12,016,765 Sub Total 1,636,361 27,257,428 59,744,598 1,636,206 26,981,013 59,744,598 Grand Total 2,155,467 28,899,999 61,094,598 2,210,631 28,793,814 61,094,598
2.34% 31.36% 66.30% 2.40% 31.26% 66.34%92,150,064 92,099,043
SeriesFair ValueNominal
Total Fair ValueTotal Nominal Value
Maturity Date
Interest Rate (%)
Mark to Market
Recap Bond Portfolio Details, 31 Mar 2006 – Bank Only
(Stated in Rp Millions)

42
Bank Mandiri’s Credit Ratings
BShort Term Local Currency Debt
idnAA
BB-
B+
B
BB-
Stable
NR
NR
BB-
Stable
Fitch
B2BBLong Term Local Currency Debt
Subordinated Debt
BShort Term Foreign Currency Debt
idA+BB-Long Term Local Currency Debt
NPBShort Term Foreign Currency Debt
B3Long Term Bank Deposits
BShort Term Local Currency Debt
Bank Mandiri Ratings
B2B+Long Term Foreign Currency Debt
PositivePositiveOutlook
Sovereign Ratings
StableLong Term Local Currency Outlook
B3Long Term Bank Deposits
WRBB-Long Term Foreign Currency Debt
PositiveStableLong Term Foreign Currency Outlook
BNational Rating
E+Bank Financial Strength
PefindoMoody’sS&P

43
Reconciliation to IFRS
5,166
(90)
38
-
-
75
10
25
-
70
(309)
5,256
Rp (Billions)
FY ’04 FY ’05FY ’03FY ’02
(1,405)4,395 3,176 Net profit in accordance with IFRS
--293 Securities & Gov. Bond (trading portfolio)
25199 -De-recognition of revaluation of premises & equipment
86182 (184)Deferred income taxes
955 -Accretion on deferred inc. arising from loan purchase from IBRA
-(21)10Employee benefits
(223)104 351Allow. for possible losses on commitments & contingencies
(2,008)(191)430Net Adjustment
--(995) De-recognition of allowances
-52 -Change in fair value of derivatives
(2,681) (662)955Allow. for possible losses on earning assets
IFRS Adjustments
603 4,586 2,746 Net profit under Indonesian GAAP
Rp (Billions)Rp (Billions)Rp (Billions)
IFRS = International Financial Reporting Standards
44
Corporate Consumer
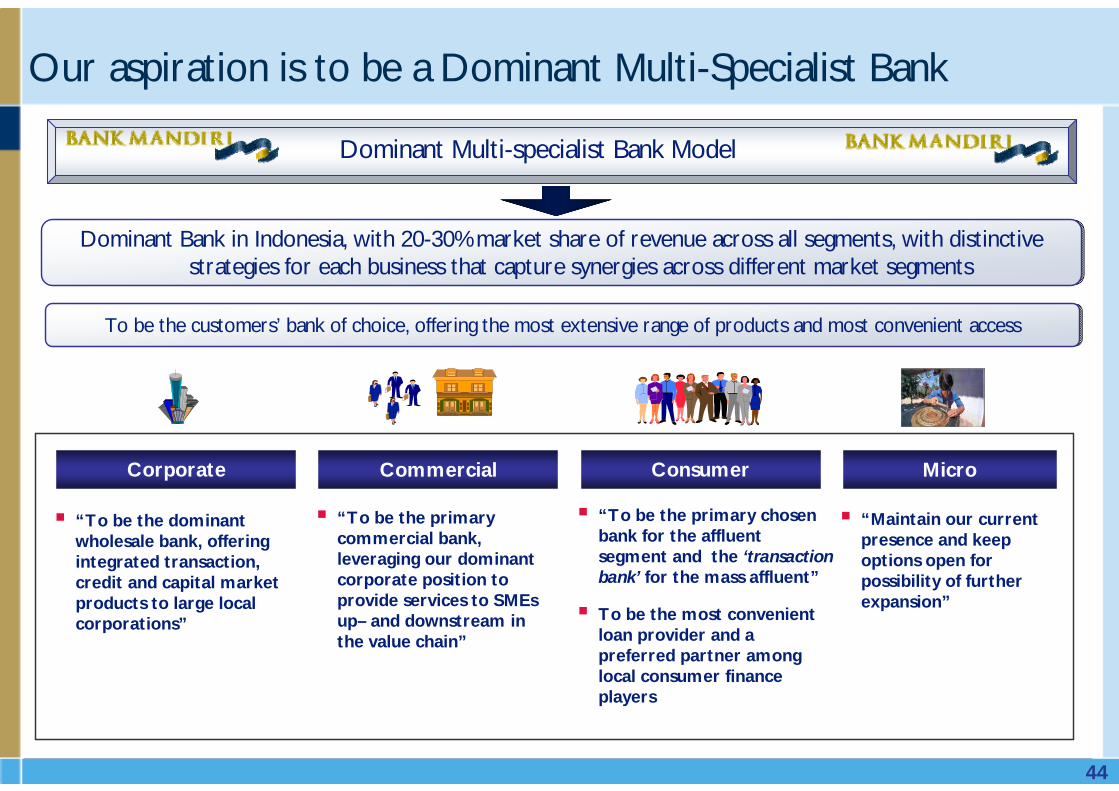
Dominant Bank in Indonesia, with 20-30% market share of revenue across all segments, with distinctive strategies for each business that capture synergies across different market segments
Dominant Bank in Indonesia, with 20-30% market share of revenue across all segments, with distinctive strategies for each business that capture synergies across different market segments
Commercial Micro
Our aspiration is to be a Dominant Multi-Specialist Bank
“To be the dominant wholesale bank, offering integrated transaction, credit and capital market products to large local corporations”
“To be the primary commercial bank, leveraging our dominant corporate position to provide services to SMEsup– and downstream in the value chain”
“To be the primary chosen bank for the affluent segment and the ‘transaction bank’ for the mass affluent”
To be the most convenient loan provider and a preferred partner among local consumer finance players
“Maintain our current presence and keep options open for possibility of further expansion”
Dominant Multi-specialist Bank Model
To be the customers’ bank of choice, offering the most extensive range of products and most convenient accessTo be the customers’ bank of choice, offering the most extensive range of products and most convenient access

45
Maintaining our position as market leader and focusing our effort to shift into a more profitable product mix (e.g. fee-based products)Leveraging our strength in wholesale and investment banking through Mandiri SekuritasEnsuring profitability of our loan book by fundamentally reworking risk management processes Exiting non profitable businesses by reducing our exposure to relationships and sectors which do not offer sufficient returns for the risk
Expand our engagement in the consumer segmentBoost our efforts to build Mandiri Prioritas by building our sales capabilities, while refocusing our list of initiatives on acquisition and retention of the mass affluent segmentAspire to have the largest share in terms of primary banking relationships based on the largest branch and ATM network in the country and expansion of EDCs Play a major role in certain consumer finance segments eg. mortgage and cardsIncrease and optimize integration with Bank Syariah Mandiri and AXA Mandiri to provide complete solutions
Accessing and integrating the financial flows across the value chain to better understand the risks and price accordinglyProviding innovative fee-based products around cash management and working capital arrangements to dominate fee businessesFocusing on mid-caps and larger small companies with transaction intensive businessesCapturing wealth management opportunities of operator-owner entities
Focus of this year is to maintain our presence in this segmentLeveraging our in-branch capacity to serve the customersKeep an option for possibility of further expansion later in 2006
Corporate Banking
Corporate Banking
Commercial Banking
Commercial Banking
Consumer Banking
Consumer Banking
Micro BankingMicro
Banking
Individual segment strategies

46
Transformation themes for achieving these aspirations
Revamp alliance program
Revamp alliance program
Build winning organization and
performance culture
Build winning organization and
performance culture
Strategic Aspiration: Dominant Multi-Specialist Bank
Strengthen risk management and
operations
Strengthen risk management and
operations
Re-structure the organization
Revamp performance management system
Reinforce high ethical standards
Implement new corporate culture in the bank
Establish a Leadership and talent development program
Implement new coverage models for wholesale banking
Design and implement an optimal retail channel network configuration
Embed stronger service and sales culture in branches
Develop and launch a lower affluent retail offering
Acquire ethnic banks and multi-finance companies
Improve current NPL position : Bad bank and quick liquidation
Design and implement a strong CRM based loan monitoring system
Enhance effectiveness of current loan approval processes
Optimize end-to-end operations, e.g. significantly reduce TAT for consumer loans
Specify focus of alliance management program
Aggressively launch 2-3 high opportunity programs
“Culture”“Strategic Alliances”
“Control NPLs”
“Boost Sales”
Deliver tailored proposition for
priority segments
Deliver tailored proposition for
priority segments

47
Vision of Bank Mandiri Implementation Roadmap
Source: Team Analysis
“Back on Track” “Outperform the Market” “Shaping the End Game”
~12 months ~12-24 months ~12-24 months
Build winning organization & performance culture
Strengthen risk management & operations
Deliver tailored proposition for priority segments
Revamp alliance program
“Bad Bank” up and running to resolve NPL issuesKey operational improvements well-underway
New BU structure and Performance Management System in place to drive performance cultureHigher professional standards embedded
Piloted and implementing CST model for large corporatesNew commercial business model in place for medium and small commercial
NPLs down to 5% gross
Dominant corporate bank built on CST modelAmong top commercial players with strong penetration in target segmentsCompleted acquisition of specialized bank and multifinance companyMarket-leading position for affluent and lower affluent bankingMost convenient and service-oriented retail bank
Among most desired employers in Indonesia due to best people development program
NPLs fully resolved and Bad Bank dissolved
Alliance program up and running, creating synergies across segments
Completed acquisition and integration of major domestic bank
Overall Bank C/I ratio of ~76% with ~15% market share
C/I ratio of ~59% with ~16-17% market share
C/I ratio of ~54-55% with ~20-30% market shareP/B ratio 2.2 Exploring regional expansion options
Top 3 alliance program up and running, creating synergies across segments
Horizon 1:Fix the leaks and lay foundations
Horizon 2: Consolidate and build momentum
Horizon 3: Accelerate and grow

48
Regulations on Asset Classification: PBI No. 7/2/PBI/2005)
Classificationby Aging of
Interest Payments#
Classificationby Aging of
Interest Payments#
BI Collectibility takes precedence#
BI Collectibility takes precedence#
One Debtor, One Project Concept*One Debtor, One Project Concept*
Completeness of Financial Report*Completeness of Financial Report*
DetailedClassification Guidance#
DetailedClassification Guidance#
Business OutlookBusiness growth potentialMarket condition & debtor position in the marketManagement qualityGroup supportEnvironmental factors
Financial ConditionProfitabilityCapital structureCash flow Sensitivity to market risk
Payment AbilityOn time paymentAvailability of debtor’s financial informationCompleteness of credit documentationCompliance toward credit agreementNature of payment sourceAppropriateness of funds usage
In instances where there is disagreement in the determination of earning asset collectibility between the bank, its external auditors and BI, the bank must adopt BI’s determination
The Bank must classify all of its earning assets to a single debtor at the level of the lowest quality assetFor debtors with exposures to more than one bank, all banks must adopt the lowest classification applied by any one bank to the debtor.All earning assets related to a particular project must be classified at the same level
Banks must require debtors to submit current financial statementsFailure to submit financial statements must result in an automatic downgrade of collectibility by one level, or to a maximum classification of sub-standard
No change to BI Prov. Req.CurrentPreviouslyClassification by Payment History
100%181+ days271+ daysCategory 5 - Loss
50%121 – 180 days181 – 270 daysCategory 4 - Doubtful
15%91 – 120 days91 – 180 daysCategory 3 – Sub-Standard
5%1 – 90 days1 – 90 daysCategory 2 – Special Mention
1%CurrentCurrentCategory 1 - Current
# Implemented in Q1 2005 * Implemented in Q2 2005

49
Accounting for Interest, Provisions and Collateral
Recognition of Interest IncomeRecognition of Interest Income
Booking of Payments from
Borrowers
Booking of Payments from
Borrowers
Valuation of Collateral & Provisioning
Valuation of Collateral & Provisioning
ProvisioningProvisioning
IBRA LoansRestructured LoansRegular LoansClassification
Cash BasisCash BasisCash BasisCat. 5 - Loss
Cash BasisCash BasisCash BasisCat. 4 - Doubtful
Cash BasisCash BasisCash BasisCat. 3 – Sub-Standard
Cash BasisCash BasisAccrual BasisCat. 2 – Special Mention
Cash BasisAccrual BasisAccrual BasisCat. 1 - Current
IBRA Loans(w/o new agreement)Restructured LoansRegular LoansClassification
PrincipalPrincipalPrincipalCat. 5 - Loss
PrincipalPrincipalPrincipalCat. 4 - Doubtful
PrincipalInterestInterestCat. 3 – Sub-Standard
PrincipalInterestInterestCat. 2 – Special Mention
PrincipalInterestInterestCat. 1 - Current
IBRA LoansRestructured LoansRegular LoansClassification
100%Cat. 5 - Loss
50%Cat. 4 - Doubtful
15%Cat. 3 – Sub-Standard
5%Cat. 2 – Special Mention
As per BI regulations, except:− Difference between principal and
purchased value book as − Provisions, or− Deferred income if a new
agreement has been made
As per BI regulations, except:− Not reversed by upgrading − Reversed by principal repayment − Beginning provisions determined at
31 Dec. 2004− Based on net book value after
restructuring loss
1%Cat. 1 - Current
All LoansCollateralClassification
Cat. 5 - Loss
Cat. 4 - Doubtful
Cat. 3 – Sub-Standard
−Can be credited against cash provisions for Cat. 2-5
Cat. 2 – Special Mention
Collateral valuation for provisioning is determined by the aging of the most recent independent appraisal (for assets over Rp 5bn):−70% of appraised value within the initial 12 months−50% of appraised value within 12 to 18 months−30% of appraised value within 18 to 24 months−No value after 24 months from appraisal
Not valuedCat. 1 - Current

50
Q4 2005#Q3 2005#Q2 2005# Q1 2006#
84,768
1,973
59,006
903
4,124
18,763
41,694
95
34,444
645
621
5,890
43,073
1,878
24,562
258
3,503
12,873
Value (Rp bn)
4.5%
3.6%
5.1%
1.2%
4.8%
2.9%
6.3%
3.3%
6.5%
0.1%
2.7%
6.6%
2.9%
3.6%
3.3%
6.1%
5.2%
1.1%
Net
2.0%
0.4%
1.4%
0.1%
0.5%
4.5%
1.7%
9.2%
2.5%
0.2%
1.7%
1.9%
5.5%
0.8%
6.9%
-
0.9%
5.7%
Net
8.0%
1.8%
8.2%
0.1%
3.4%
10.0%
7.3%
-
5.4%
0.1%
3.0%
17.9%
8.7%
1.4%
12.0%
0.2%
3.5%
6.1%
Net
0.1%
0.3%
0.1%
0.1%
-
0.1%
0.1%
-
0.1%
0.1%
-
0.3%
0.0%
0.3%
-
-
-
-
UG to PL
1.8%
0.4%
2.3%
0.2%
0.3%
0.9%
2.2%
4.3%
2.5%
0.3%
1.8%
1.0%
1.5%
0.2%
2.1%
-
-
0.8%
DG to NPL
Total
Overseas
Post-Merger
Pre-Merger
IBRA
Restructured
Total Loans
Total
Overseas
Post-Merger
Pre-Merger
IBRA
Restructured
Commercial & Small Business Loans
Total
Overseas
Post-Merger
Pre-Merger
IBRA
Restructured
Corporate Loans
Loan Background
1.8%
0.2%
2.3%
0.2%
0.3%
0.8%
2.1%
4.3%
2.4%
0.3%
1.8%
0.7%
1.4%
0.0%
2.1%
-
-
0.8%
Net
Quarterly Analysis of NPL and PL changes
* Corporate, Commercial & Small Business Loans Only# % downgrades and upgrades are quarterly figures

51
Q1 2006 Loan Detail: Collectibility by Business UnitLoan Profile: Q1 Collectibility (%) by BU - Bank Only
50.1%
60.0%
88.4%
76.8%
11.1%
13.1%
8.4%
14.4%16.6%
5.3%
5.5%
9.1%
4.4%
24.4%17.1%
4.5%
78.9%
0.9% 1.0%
1.0%
1.5% 1.4%3.2%
0.8% 2.1%
Corp Comm Small Micro Cons
5
4
3
2
1
0
10,000
20,000
30,000
40,000
50,000
Corp Comm Small Micro Cons
5
4
3
2
1
Loan Profile: Q1 Collectibility (Rp bn) by BU - Bank Only

52
13.5% were still current on interest payments with a further 21.0% less than 30 days overdue
46.4% were Commercial borrowers
10.3% were loans previously restructured
0.7% were loans purchased from IBRA
Largest downgrades by sector:
Textile Manufacturing
Wood Manufacturing
Agriculture
59.6% were Rupiah loans
45.7% were Working Capital loans
1st time downgrades from Textile and Wood Manufacturing, Agriculture & Retail Trade
Corp
Com
m
Small
Organic
Restr
IBRA O/S
Mfg-Text
Mfg-Wood
Mfg-Oth
Agri
Trading-Ret
Constr
Trading-H&R
Trading-Oth
Oth<5%
IDR
US
D
WC
Invest.
Export
Program
Current
< 30 Days
31-60 Days
61-90 Days
90+ Days
0%
10%
20%
30%
40%
50%
60%
70%
80%
90%
100%
GAS Backgrnd Sector Currency Purpose Int. Aging
Q1 2006 Loan Detail*: Downgrades to NPL
* Excluding Micro & Consumer Loans Only
Corporate, Commercial & Small Business loans downgraded to NPL in Q1 totaled Rp 1,558 billion (1.6% of total loans). Of these loans:
Loan Profile: Q1 Downgrades to NPL (Rp 1,558 bn) - Bank Only

53
Q1 2006 Loan Detail*: Non-Performing LoansLoan Profile: Q1 NPLs (Rp 26,424 bn) Bank Only
22.1% remain current on interest payments and 13.7% are less than 90 days overdue
63.3% are to Corporate customers
37.3% are Investment loans
Primary sectors are:Manufacturing
•Textiles•Pulp & Paper•Wood
ConstructionTrading
55.8% are US Dollar loans
33.4% were previously restructured
12.2% were loans purchased from IBRA
16.2% are Cat. 3 & 21.1% are Cat. 4
Corporate, Commercial & Small Business NPLs totaled Rp26,424 billion in Q1, or 26.9% of total loans. Of these NPLs in Q1:
3
4
5
Organic
Restr
IBR
A
O/S
Mfg-Text
Mfg-P&P
Mfg-Oth
Constr
Mfg-Wood
Trading
Agri
Mfg-Chem
Mfg-NonM
Oth<5%
USD
IDR
Invest
WC
Synd
Export
Program
Current
< 30 Days
31-60 Days61-90 Days
90+ Days
0%
10%
20%
30%
40%
50%
60%
70%
80%
90%
100%
Collectibility Backgrnd Sector Currency Purpose Int. Aging* Excluding Micro & Consumer Loans Only

54
NPL Loan Detail*: Quarterly by Interest Days Past DueQuarterly Downgrades to NPL & Interest DPD - Bank Only
976
665
474
1,108
11,161
6,901
1,177
4,106
1,558
11.8%
43.8%
14.2%
21.0%
65.5%
53.0%
32.8%
38.3%
13.5%
26.0%
10.6%
22.7%
0.5%
25.1%
21.1%
15.9%
10.2%
21.0%
0
2,000
4,000
6,000
8,000
10,000
12,000
Q1 '04Q2 '04Q3 '04Q4 '04Q1 '05Q2 '05Q3 '05Q4 '05Q1 '06
0.0%
12.5%
25.0%
37.5%
50.0%
62.5%
75.0%
Rp Value
Current (%)
<30 Days (%)
Quarterly NPL Stock & Interest DPD - Bank Only
Rp tn
6,196
6,451
5,925
6,334
17,456
24,962
24,193
26,248
26,424
18.7%
22.5%
26.3%
51.9%
60.0%
51.3%
33.0%
28.7%
22.1%
5.3%3.3%
4.5%2.8%
17.2%
10.2%8.5% 7.7% 6.6%
0
5,000
10,000
15,000
20,000
25,000
30,000
Q1 '04Q2 '04Q3 '04Q4 '04Q1 '05Q2 '05Q3 '05Q4 '05Q1 '06
0%
10%
20%
30%
40%
50%
60%
Rp Value
Current (%)
<30 Days (%)
* Excluding Micro & Consumer Loans Only

55
Q1 2006 Loan Detail*: New Downgrades to Category 2Loan Profile: Q1 Downgrades to Cat. 2 loans (Rp 1,492 bn) - Bank Only
62.5% are for Commercial & 23.8% are for Small Business customers
44.1% are current & 1.1% are 1 day overdue
Primary sectors downgraded are:AgricultureTransportationConstructionRetail Trading
78.7% are Rupiah loans
52.8% are Working Capital loans
11.9% are Restructured loans
0.3% were purchased from IBRA
Rp 1,492 billion (1.5% of total loans) in Corporate, Commercial & Small Business loans were downgraded to Category 2 in Q1. Of the downgraded Special Mention Loans in Q1:
Corp
Com
m
Small
Current
1 Day
< 30
31-60
61+
Agri
Trans
Mfg-Oth
Trading-Oth
Constr
Trading-Ret
Mfg-Chem
Oth<5%
IDR
USD
WC
Invest.
ExportProgram
Organic
Restr
IBRA O/S
0%
10%
20%
30%
40%
50%
60%
70%
80%
90%
100%
GAS Days Aging Sector Currency Purpose Backgrnd * Excluding Micro & Consumer Loans Only

56
Q1 2006 Loan Detail*: Category 2 Loans
Loan Profile: Q1 Category 2 Loans (Rp 9,928 bn) Bank Only
48.1% are to Corporate customers
70.0% are current or 1 day overdue
Primary sectors in Category 2 are:Chemical Manufacturing AgricultureConstructionTrading, Hotels & Restaurants
59.8% are Rupiah loans
54.1% are Investment loans
34.0% are Restructured loans
3.7% were purchased from IBRA
78.1% saw no change in collectibility
Rp 9,928 billion (10.1% of total loans) in Corporate, Commercial & Small Business loans were in Category 2 in Q1. Of these Special Mention loans in Q1:
Corp
Com
m
Small
Current
1 Day
< 30
31-60
61+
Mfg-Chem
Mfg-Oth
Agri
Constr
Trading-H&R
Trading-Oth
Mass Trans
Comm
Oth<5%
IDR
USD
Invest.
WC
ExportSynd.
Program
Organic
Restr
IBRA
PL NC
1 to 2
New Bal.
0%
10%
20%
30%
40%
50%
60%
70%
80%
90%
100%
GAS Days Aging Sector Currency Purpose Backgrnd Move. * Excluding Micro & Consumer Loans Only

57
51.1% were to Commercial borrowers
68.4% were loans with no previous restructuring history
31.6% were loans previously restructured
Largest upgrades by sector:
Agriculture
Retail Trading
Mining
79.4% were Rupiah loans
58.6% were Working Capital loans
63.3% of upgrades to PL were NPLs moving to Category 2
36.7% of upgrades to PL were NPLs moving to Category 1
Corp
Comm
Small
Organic
Restr
O/S
Agri
Trading-Ret
Mining
Trading-Oth
Oth<5%
IDR
US
D
WC
Invest.
Program
1
2
0%
10%
20%
30%
40%
50%
60%
70%
80%
90%
100%
GAS Backgrnd Sector Currency Purpose Collect.
Q1 2006 Loan Detail*: Upgrades to PL
* Excluding Micro & Consumer Loans Only
Corporate, Commercial & Small Business loans upgraded to PL in Q1 totaled Rp 58 billion (0.1% of total loans). Of these loans:
Loan Profile: Q1 Upgrades to PL (Rp 58 bn) - Bank Only

58
Q1 2006 Loan Detail*: Performing Loans
Loan Profile: Q1 Performing Loans (Rp 58,343 bn) Bank Only
45.2% are to Corporate customers & 43.0% are to Commercial customers
81.4% have no restructuring history
17.0% are Restructured loans
1.6% were purchased from IBRA
Primary sectors in Category 2 are:F&B ManufacturingAgricultureConstructionChemical manufacturing
76.2% are Rupiah loans
52.5% are Working Capital loans
90.0% saw no change in collectibility
0.1% were upgraded from NPL
Rp 58,343 billion (59.5% of total loans) in Corporate, Commercial & Small Business loans were performing in Q1. Of these performing loans in Q1:
* Excluding Micro & Consumer Loans Only
Corp
Comm
Small
Organic
Restr
IBRAO/S
Mfg-F&B
Mfg-Oth
Agri
Constr
Trading-Oth
Mfg-Chem
Trading-Ret
Bus Serv
Oth<5%
IDR
US
D
WC
Invest.
Export
Other
1
2
0%
10%
20%
30%
40%
50%
60%
70%
80%
90%
100%
GAS Backgrnd Sector Currency Purpose Collect.

59
25,123
29,542
23,987
21,045
19,427
18,942
27,423
10,5831999A
ddD
educt2000A
ddD
educt2001A
ddD
educt2002A
ddD
educt2003A
ddD
educt2004A
ddD
educt2005A
ddD
eductQ
1 '06
Others#Write-OffsRepaymentsRestructuringBalance
Limited Restructured Loan Activity in Q1 ‘06
IDR bn
#Others includes partial payments, FX impacts, and fluctuation in Working Capital facilities
Loans by Restructuring Type in Q1 2006
Additional loans2%
LT loans w/convert.
option8%
Maturity extension w/reduced
rates12%
Maturity extension w/other restr'g*
25%
Maturity extension
53%
*Other Restructuring includes reduction of interest rates, rescheduling of unpaid interest & extension of repayment period for unpaid interest
Restructured Loan Movement 1999 - Q1 ‘06
228
19
Q1 ‘06
813
391
FY ‘04
1,118NPL Collections
718Loans Restructured
FY ‘05(Rp billions)

60
Q1 2006 Loan Detail*: Restructured LoansLoan Profile: Q1 Restructured Loans (Rp 18,763 bn) Bank Only
53.0% are performing
72.2% of loans in Category 2 are current in interest payments
Of the 47.0% which are in NPL, 17.9% are current in interest payments
Primary sectors are:AgricultureManufacturing
•Chemicals•Textiles•F & B
58.1% are Rupiah loans
34.9% are Investment loans
68.6% are to Corporate customers
6.0% deteriorated in collectibility
2.0% showed improved collectibility
Of the remaining Rp 18,763 billion in restructured Corporate, Commercial & Small Business loans in Q1, or 19.1% of total loans:
1
2
3
4
5
Current
<30 Days31-60 Days61-90 Days
90+
Agri
Mfg-Text
Mfg-Chem
Mfg-F&B
Mfg-Oth
Mfg-NonM
Mfg-P&P
Mfg-Oth
Trading
Oth<5%
IDR
USD
Invest.
WC
Synd.
Export
Program
Corp
Com
m
Small
NPL DG
NPL NC
DG to NPLPL DG
PL NC
PL UG
0%
10%
20%
30%
40%
50%
60%
70%
80%
90%
100%
Collect. NPL Aging Sector Currency Purpose GAS Movement* Excluding Micro & Consumer Loans Only
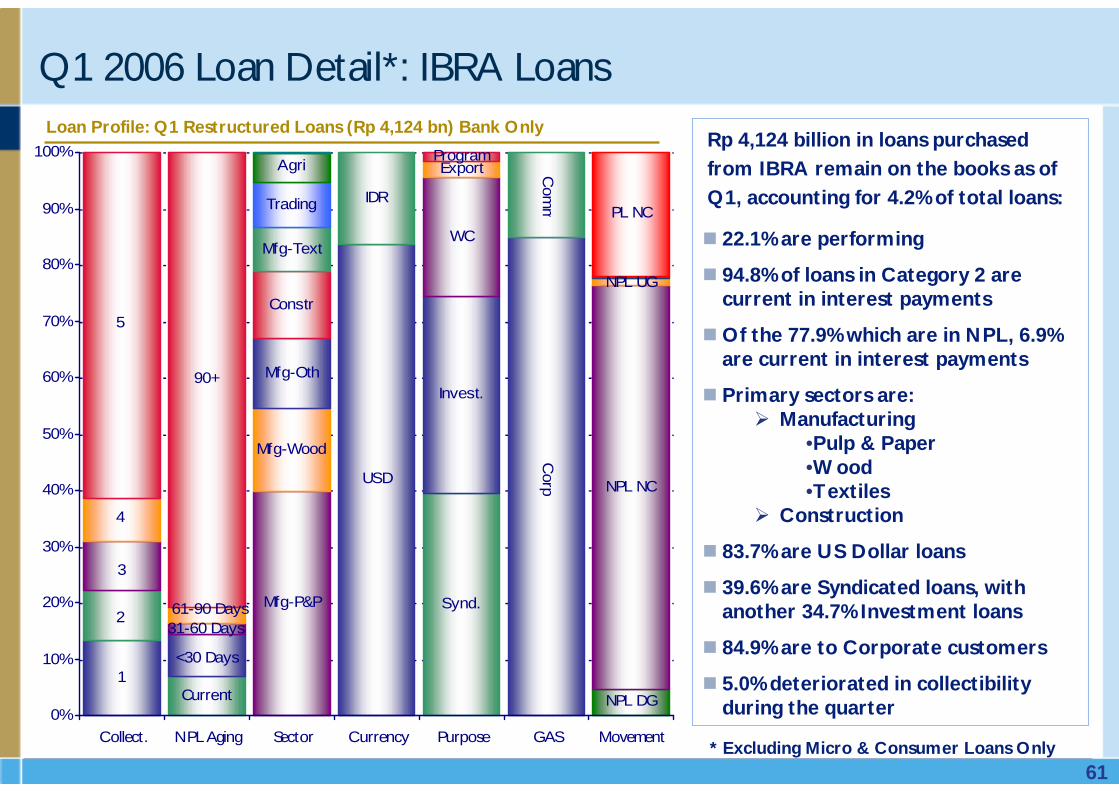
61
Q1 2006 Loan Detail*: IBRA LoansLoan Profile: Q1 Restructured Loans (Rp 4,124 bn) Bank Only
22.1% are performing
94.8% of loans in Category 2 are current in interest payments
Of the 77.9% which are in NPL, 6.9% are current in interest payments
Primary sectors are:Manufacturing
•Pulp & Paper•Wood•Textiles
Construction
83.7% are US Dollar loans
39.6% are Syndicated loans, with another 34.7% Investment loans
84.9% are to Corporate customers
5.0% deteriorated in collectibility during the quarter
Rp 4,124 billion in loans purchased from IBRA remain on the books as of Q1, accounting for 4.2% of total loans:
1
2
3
4
5
Current
<30 Days
31-60 Days61-90 Days
90+
Mfg-P&P
Mfg-Wood
Mfg-Oth
Constr
Mfg-Text
Trading
Agri
USD
IDR
Synd.
Invest.
WC
ExportProgram
Corp
Com
m
NPL DG
NPL NC
NPL UG
PL NC
0%
10%
20%
30%
40%
50%
60%
70%
80%
90%
100%
Collect. NPL Aging Sector Currency Purpose GAS Movement* Excluding Micro & Consumer Loans Only

62
Constr9.5%
Agri10.3%
Oth<4%18.7%
Mfg-P&P4.4%
Bus Serv4.6%
Trading-Ret4.8%
Mfg-Oth14.1%
Mfg-F&B11.6%
Trading-Oth8.3%
Mfg-Text6.2%
Mfg-Chem7.6%
Mfg-Oth
Mfg-F&B
Agri
Constr
Trading-Oth
Mfg-Chem
Mfg-Text
Trading-Ret
Bus Serv
Mfg-P&P
Oth<4%
Loan Portfolio Sector Analysis, Q1 2006
(1) Non-consolidated numbers* Each sector < 4%

63
1
2
3
4
5
Current
1 Day
< 3031-6061+
Mfg-F&B
Mfg-Oth
Mfg-Chem
Agri
Mfg-P&P
Mfg-Text
Constr
Trading
Oth<5%
IDR
USD
WC
Invest.
Synd.
Export
Other
Organic
Restr
IBRA
O/S
New Bal.
NPL DG
NPL NC
DG to NPL
PL NC
PL UG
0%
10%
20%
30%
40%
50%
60%
70%
80%
90%
100%
Collect. Cat. 2Aging
Sector Currency Purpose Backgrnd Movement
61.2% are performing loans, with 11.1% in Category 2
83.4% of Category 2 loans are current in interest payments
23.0% of NPLs are current in interest payments, with another 8.0% less than 30 days overdue
Primary sectors in Corporate are:Food & Beverage MfgChemical MfgPulp & Paper MfgAgriculture
51.5% are Rupiah loans
43.5% are Working Capital loans
29.9% are Restructured loans
8.1% were purchased from IBRA
Q1 2006 Loan Detail: Corporate LoansLoan Profile: Q1 Corporate Loans Only (Rp 43,073 bn) Bank Only Rp 43,073 billion in loans were in the
Corporate portfolio in Q1, or 43.9% of total loans. Of the Corporate Loans in Q1:

64
76.7% are performing, with 12.4% in Category 2
50.8% in Category 2 are current or 1 day overdue in interest payments
20.5% of NPLs are current in interest payments and 4.2% are less than 30 days overdue
Primary sectors in Commercial are:Construction Agriculture Trading & RetailBusiness Services
81.3% are Rupiah loans
51.2% are Working Capital loans
14.1% are Restructured loans
1.5% were purchased from IBRA
1
2
34
5
Current
1 Day
< 30
31-60
61+
Mfg-Oth
Constr
Agri
Trading-Oth
Trading-Ret
Bus Serv
Mfg-Chem
Mfg-Text
Oth<5%
IDR
USD
WC
Invest.
ExportProgram
Other
Organic
Restr
IBRA
New Bal.NPL DG
NPL NC
DG to NPLPL DG
PL NC
PL UG
0%
10%
20%
30%
40%
50%
60%
70%
80%
90%
100%
Collect. Cat. 2Aging
Sector Currency Purpose Backgrnd Movement
Q1 2006 Loan Detail: Commercial & Small Business Loans*Loan Profile: Q1 Commercial & Small Loans* Only (Rp 41,694 bn) Bank Only
Rp 41,694 billion in loans were in the Commercial portfolio in Q1, or 42.5% of total loans. Of the Commercial & Small Business Loans* in Q1:
* Excluding Micro Loans
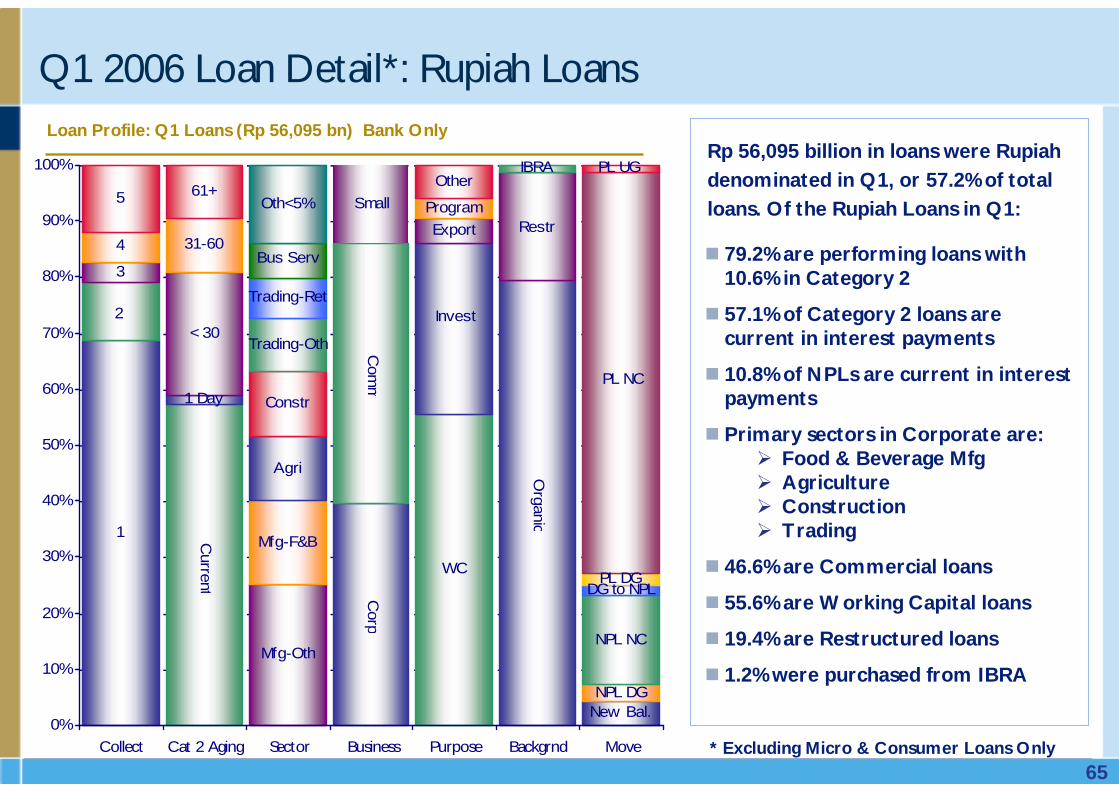
65
Q1 2006 Loan Detail*: Rupiah LoansLoan Profile: Q1 Loans (Rp 56,095 bn) Bank Only
1
2
3
4
5
Current
1 Day
< 30
31-60
61+
Mfg-Oth
Mfg-F&B
Agri
Constr
Trading-Oth
Trading-Ret
Bus Serv
Oth<5%
Corp
Com
m
Small
WC
Invest
ExportProgram
Other
Organic
Restr
IBRA
New Bal.NPL DG
NPL NC
DG to NPLPL DG
PL NC
PL UG
0%
10%
20%
30%
40%
50%
60%
70%
80%
90%
100%
Collect Cat 2 Aging Sector Business Purpose Backgrnd Move
79.2% are performing loans with 10.6% in Category 2
57.1% of Category 2 loans are current in interest payments
10.8% of NPLs are current in interest payments
Primary sectors in Corporate are:Food & Beverage MfgAgricultureConstructionTrading
46.6% are Commercial loans
55.6% are Working Capital loans
19.4% are Restructured loans
1.2% were purchased from IBRA
Rp 56,095 billion in loans were Rupiah denominated in Q1, or 57.2% of total loans. Of the Rupiah Loans in Q1:
* Excluding Micro & Consumer Loans Only

66
Q1 2006 Loan Detail*: Foreign Currency Loans
Loan Profile: Q1 FX Loans (Rp 28,673 bn) Bank Only
48.5% are performing loans with 13.9% in Category 2
79.4% of Category 2 loans are current in interest payments
31.0% of NPLs are current in interest payments
Primary sectors in Corporate are:Manufacturing of
ChemicalsTextiles & LeatherPulp & Paper
AgricultureMining
72.8% are Corporate loans
44.1% are Investment loans
27.4% are Restructured loans
12.0% were purchased from IBRA
Rp 28,673 billion in loans were foreign currency denominated in Q1, or 29.2% of total loans. Of the FX Loans in Q1:
4
1
2
3
5
Current
1 Day
< 30
31-6061+
Mfg-Chem
Mfg-Text
Mfg-P&P
Agri
Mfg-Oth
Mfg-Wood
Mining
Trading
Constr
Mfg-F&B
Oth<5%
Corp
Com
m
Invest.
WC
Synd.
Export
Organic
Restr
IBRA
O/S
New Bal.
NPL DG
NPL NC
NPL UGDG to NPL
PL DG
PL NC
PL UG
0%
10%
20%
30%
40%
50%
60%
70%
80%
90%
100%
Collect Cat 2 Aging Sector Business Purpose Backgrnd Move* Excluding Micro & Consumer Loans Only

67
Other Transaction Services
3,427
3,772
4,118
4,429
4,702
2,665
1,014
1,800
341
1,303321 497 566 680
1,13295272 112 2347 18516418 50
106
6,9887,364
1,053
3,808
3,072
1,069695
1,356
288.45
22.07
257.94198.52165.85
1,0861,016 1,023
15927
706679
Q3 '02
Q4 '02
Q1 '03
Q2 '03
Q3 '03
Q4 '03
Q1 '04
Q2 '04
Q3 '04
Q4 '04
Q1 '05
Q2 '05
Q3 '05
Q4 '05
Q1 '06
Debit Cards Issued* (000)SMS Subs. (000)SMS Trans. (000)Internet Bank. Subs. (000)Call Center Trans. (000)
Electronic banking channels rapidly expanding
389.7475.3
582.3
651.8691.5698.0
617.9
564.2
336.5
290.5268.7
74.2
115.8
203.9
232.9
52.2
94.2
159.0
226.2
271.8
138,259
338,518
293,246
263,908
225,829
98,004
2,7096,27012,20125,429
41,744
62,551
Q1 '00
Q3 '00
Q1 '01
Q3 '01
Q1 '02
Q3 '02
Q1 '03
Q3 '03
Q1 '04
Q3 '04
Q1 '05
Q3 '05
Q1 '06
Avg Daily Volume (000)
Avg Daily Value (Rp Mn)
ATM Average Daily Transaction Volume and Value
* Debit Cards reintroduced in Jan. ‘04

68
Credit Card business growth has resumed
Mandiri Visa Card Holders and EOQ Receivables
1,367.4
1,279.4
1,353.6
1,256.6
1,205. 8
1,135.6
933.6
823.2
567.5
645.9
747.9
814.9
785.7
1,270.2
752.4
650.7
225.7
275.3
338.2
418.0
709.4
245.3275.4
357.5
509.2
679.1
731.9764.9
Q4 '02
Q1 '03
Q2 '03
Q3 '03
Q4 '03
Q1 '04
Q2 '04
Q3 '04
Q4 '04
Q1 '05
Q2 '05
Q3 '05
Q4 '05
Q1 '06
Receivables (Rp Bn)
Cards (000s)
82 78 90 95110127170162172179165191168166187170172190216199191199193209184165204
24
18
20
2119
21
1919
19
30
2823
2017
18
19
18
22
8
20
18
22
2116
119
8
7
75
4
3 3
4
7
7
4 22
4
2
3
18
2721
9
8 7
7
12
12
25
Jan '04
Mar '04
May '04
Jul '04
Sep '04
Nov '04
Jan '04
Mar '04
May '05
Jul '05
Sep '05
Nov '05
Jan '06
Mar '06
Transfer Balance
Cash Advance
Retail
Visa Card Monthly Sales by Type of Transaction(Rp Billion)
Transferred from GE

69
Credit Card portfolio stable throughout in Q1
Mandiri Visa Card Delinquency Rates(%)
106.1
82.9
38.635.9
38.9
45.4
67.2
75.6
98.7
21.225.4
15.911.8 12.4
7.5
0.0
12.2 13.1
2.6 2.3 2.3
70.7
9.6
2.50.4 0.9 1.5 1.6 1.9 2.1
Jan '04
Apr '04
Jul '04
Oct '04
Jan '05
Apr '05
Jul '05
Oct '05
Jan '06
NPLs (90+DPD)Write-OffsRecoveries
Monthly Charge-offs, NPLs & Recoveries (Rp Billion)
21.3%
9.1%
7.1% 7.1%7.7%
9.2%10.2%
3.6%
5.0%
4.5%3.8%
4.3%4.8%
1.9%2.5% 2.4%
3.1%
16.0%
8.6%
16.8%
7.4%
5.3%5.0%
3.3%
13.3%
10.7%
4.6%
3.4%
7.2%
5.0%4.5%
5.4%
12.7%
9.5%
2.4%2.1%
7.8%
5.8%
2.5%1.7%
Jan '04
Apr '04
Jul '04
Oct '04
Jan '05
Apr '05
Jul '05
Oct '05
Jan '06
30 DPD - Rp90 DPD - Rp30 DPD - Cards90 DPD - Cards

70
Summary of Principal Subsidiaries
• Equity Investment of Rp671.7 billion
• Total Assets Rp1,028 billion, total liabilities Rp314.5 billion and Equity of Rp713 billion
• Operating Income amount to Rp21.6 billion, and PAT Rp10.9 billion
• Equity transactions in BEJ of Rp5,065 billion
• Bond transactions (SUN & Corporate) through BES and HIMDASUN of Rp3,322 billion
• Largest local bond house : 42% of all secondary trading of Government bonds and 17% of all secondary trading of corporate bonds in the country.
• Assets Under Management amounting to Rp316 billion on average.
Bank Syariah Mandiri Mandiri Sekuritas AXA Mandiri
• Equity Investment of Rp69.5 billion
• Total Assets of Rp1,146 billion and Annual First Year Premium (AFYP) of Rp53.5 billion
• Total Gross Written Premium (GWP) amounted to Rp104 billion, consisting of unit-linked premiums of Rp95 billion (92%) and traditional product premiums of Rp8.4 billion (8%). Group business accounted for Rp11.8 billion, with the remainder of Rp91.9 billion from individual premiums
• Embedded value of Rp259 billion (before expense overruns) and appraisal value of Rp1,057 billion
• Operating since December 2003, has a presence in 593 Bank Mandiri branches with a team consisting of 662 Financial Advisors (FAs)
• As of Q4 2005, AXA Mandiri was number 3 out of all life insurance companies in Indonesia, with a market share of new business of 7.5%
• Equity Investment of Rp650.3 billion
• Total Assets Rp8,228billion, with total financing extended of Rp6,177billion and total funds Rp7,040billion
• Operating Income of Rp208.7 billion and Profit After Tax of Rp17.7 billion
• Market share against Syariah Banking:40.05% in assets, 38.61% in financing extended and 47.06% in deposits.
• CAR=12.67%
• ROA=1.41%
• ROE=11.15%
• 165 outlets, consisting of 111 branches and 54 cash outlets, along with 51 branded ATMs

71
Branch Network & Customer Growth
Bank Syariah Mandiri
3248
88
134
164 165206
587533
357
115
70
2001 2002 2003 2004 2005 Q1 '06
Branches
Customers (000s)
Summary Balance Sheet (Rp Billions)
633
3,818
1,958
1,261
7,037
5,664
(127)
5,791
383
168
1,689
8,273
2005
450
1,578
753
298
2,629
2,119
(42)
2,162
76
36
1,023
3,422
2003
6,1775,267 Total Financing
473427 Securities - Net
231235 Current Accounts & Placements w/Other Banks
1,232796 Cash & placement w/ BI
8,2286,870 Total Assets
Q1 ‘062004Rp Bn
6,0395,181 Total Financing - Net
7,0405,882 Third Party Funds
1,491981 Demand Deposits
2,0681,567 Savings Deposits
3,4813,334 Time Deposits
549
(86) (138)Allowances
Shareholders Equity 650

72
Bank Syariah Mandiri
Summary P&L (Rp billions)
14.6%
1.8%
11.9%
75.6%
83.8
136.7
137.2
435.6
93.6
479.1
386.4
865.5
2005
11.2%
1.4%
12.7%
87.8%
17.7
26.0
24.2
90.6
27.1
96.5
112.2
208.7
Q1 ‘06
3.6%
1.0%
20.9%
66.1%
15.8
24.5
23.0
159.9
51.9
131.1
148.4
279.4
2003
10.6%39.3%CAR
83.3%74.6%LDR
103.430.1Net Income after tax
150.443.4Net Income before tax
140.642.3Income from Operations
7.4%
3.6%
84.4
35.5
91.3
71.5
162.7
2002
315.0Bank's Share in Operating Income
269.23rd Party Share on Returns
584.2Total Operating Income
2004
276.4Operating Expenses
2.9%ROA
22.3%
102.0Other Operating income
ROE
Selected Financial Ratios

73
Mandiri Sekuritas
Summary P&L
18.4
48.0
(34.8)
82.8
21.2
48.4
20.6
114.5
131.8
(13.1)
9.0
6.0
42.6
20.9
197.3
2005
21.6109.448.4Profit from operations
2.236.25.7Commissions
13.853.729.8Salaries and allowances
52.7
72.4
24.0
11.6
54.1
33.5
25.5
24.9
6.1
5.1
3.9
102.4
2003
0.320.6Underwriting & Selling Fees
0.910.4Advisory fees
1.153.0Investment Mgmt Fees
4.515.6Brokerage Commissions
47.7244.0Operating Revenue
Q1 ‘062004Rp Bn
30.082.7Interest & Dividends
26.1134.6Operating Expenses
4.223.4G & A expenses
(6.5)(8.1)Other income (charges) - net
15.1101.3 Income before tax
63.0
61.9 10.9Gain on Trading of Marketable Securities
Net Income after tax 10.9692.8
305.0
137.1
52.7
30.1
565.9
9.6
84.3
746.5
-
51.8
1,258.7
2005
698.9
150.0
67.0
61.7
79.3
380.8
8.0
123.0
794.0
50.0
82.9
1,079.7
2003
91.6478.6Receivables
550.7538.8Marketable Securities
0.050.0Time deposit
104.7117.4Cash & Equivalent
1,027.91,435.7Total Assets
Q1 ‘062004Rp Bn
314.5699.3Total Liabilities
46.139.1Payable to Clearing & Guarantee body
53.6420.3Payable to customers
87.12.0Repo
105.0190.0Bank Loans
736.4
11.8 10.3Property & Equipment-net
Shareholders Equity 713.3
Summary Balance Sheet

74
New Management Team as of 22 May 2006
Agus Martowardojo
President Director
I Wayan Agus Mertayasa
Deputy President Director
Acting CFO
Omar S. Anwar
Director
Consumer Finance
Abdul Rachman
Director
Corporate Banking
Sasmita
Director
Technology &
Operations
Zulkifli Zaini
Director
Commercial Banking
Thomas Arifin
Director
Treasury
Riswinandi
Director
Special Asset
Management
Sentot A. Sentausa
Director
Risk Management
Bambang Setiawan
Director
Compliance &
Human Capital
Budi G. Sadikin
Director
Micro & Retail
Banking

75
Personal Data:Name : Sentot A. SentausaDate of Birth : Jakarta, 10 June 1957
Educational Background:Master of Business Administration, Monash University, Melbourne, 1995;Bachelor of Statistics, Faculty of Math and Science, Padjadjaran University, Bandung, 1983
Work Experience:Coordinator, Risk Management Bank Mandiri, 2005;Group Head/SVP, Consumer Risk Management Bank Mandiri, 2004;Group Head/SVP, Procurement and Fixed Asset Bank Mandiri, 2003.
CURRICULUM VITAE Director
Personal Data:Name : Thomas ArifinDate of Birth : Tanjung Enim, 16 January 1961
Educational Background:Master of Business Administration, European University, Toulouse, France, 1993-Present;Bachelor of Management, University of Indonesia , Jakarta, 1990Bachelor of Accounting, Parahyangan Catholic University, Bandung, 1986
Work Experience:General Manager, Risk Management Group Bank Permata, 2003;First Vice President, International Banking Group Head Bank Bali, 2002-2003;First Vice President, General Manager Bank Bali Los Angeles Branch, USA, 1996-2002.

76
Personal Data:Name : Budi Gunadi Sadikin Date of Birth : Bogor, 6 May 1964
Educational Background:Bachelor of Physics, Faculty of Math and Science, Institute of Technology, Bandung 1988
Work Experience:Executive Vice President, Head Of Consumer Mass Market Bank Danamon, 2003-2006;Senior Vice President, Director Of Consumer and Commercial Bank, ABN-AMRO Indonesia & Malaysia, 2002-2003;Senior Vice President, Director Of Consumer and Commercial Bank, ABN-AMRO Indonesia, 2000-2002;
CURRICULUM VITAE Director
Personal Data:Name : Bambang Setiawan Date of Birth : Semarang, 20 November 1958
Educational Background:Master of Business Administration in Accounting, Temple University, Philadelphia, Pennsylvania, 1993;Bachelor of Accounting, Airlangga University, Surabaya, 1984
Work Experience:Coordinator, Information and Technology/Group Head Accounting Bank Mandiri, 2005;Deputy Head in Technology, Center of Financial Transaction Reporting and Analysis, 2004;Group Head/Senior Vice President Compliance Bank Mandiri, 2003;Project Head/Vice President Financial Control Bank Mandiri, 2001;

77
Personal Data:Name : Riswinandi Date of Birth : Jakarta, 12 September 1957
Educational Background:Bachelor of Corporate Management, Trisakti University, Jakarta, 1983
Work Experience:Group Head Credit Recovery II Bank Mandiri, 2005-2006;Commissioner, Bank Mandiri, 2003;Director, Bank Danamon, 2002;
CURRICULUM VITAE Director

78
CreditRecovery I
CorporateBanking
Abdul Rachman
ConsumerFinance
Omar S. Anwar
Finance& StrategyI Wayan Agus
Mertayasa
Technology& Operations
Sasmita
Organization StructureBoard of Commissioners
AXA Mandiri FinancialServices
RiskManagementSentot Sentausa
ElectronicBanking
MandiriSecurities
AssetManagement
ConsumerRisk
JakartaCommercial
Sales
MicroBusiness
ConsumerCard
JakartaNetwork
CorporateBanking I
MarketRisk
InvestorRelations
IT PlanningSecurity
HumanCapital
Bank SyariahMandiri
WealthManagement
ComplianceProcurement
& Fixed Asset
CommercialRisk I
Accounting
RegionalCommercial
Sales
SmallBusiness
ConsumerLoans
LearningCenter
RegionalNetwork
CorporateBanking II
Portfolio & Operational
Risk
Strategy &Performance
IT BusinessSolutions
ProductManagement
MassBanking
LegalCorporateBanking III
CorporateRisk
ChangeManagement
Office
IT Infrastructure& Operations
CentralOperations
Groups moved to New Directorate
New Directorate
Consolidated Directorate
Subsidiaries
IT Information& Knowledge
Mgmt
ConsumerCollection
CreditOperations
Audit CommitteeRisk Policy Committee
Nomination & Remuneration CommitteeGood Corporate Governance Committee
InternalAudit
FION
ChiefEconomist
Treasury
BMEL
CommercialBanking
Zulkifli Zaini
Micro &Retail Banking
Budi Sadikin
Compliance& HC
BambangSetiawan
CreditRecovery II
Special AssetManagement
Riswinandi
CommercialRisk II
Board of Directors
Deputy President Director & CFOI Wayan Agus Mertayasa
President Director & CEOAgus Martowardojo
CorporateCenter
BusinessUnits
SharedServices
Corporate Secretary
Treasury
Thomas Arifin

79
21,179
19,606
18,016
17,204
17,735
18,39 7
19,693
21,192
1999
2000
2001
2002
2003
2004
2005
Q1 '06
Staffing and Distribution Network Growth
658
635
730
909
546
687
789
909
1999
2000
2001
2002
2003
2004
2005
Q1 '06
6,121
6,025
3,160
4,000
4,716
5,537
1999
2000
2001
2002
2003
2004
2005
Q1 '06
2,664
513
533
1,184
2,022
2,470
2,560
1,559
1999
2000
2001
2002
2003
2004
2005
Q1 '06
Employees
Domestic Branch Network
ATM Network
ATM-Link Network
90500New ATMs 1044905205002117.67.0% Change -0,13.73.1-4.5-8.1
12059New Branches 0435289-112

80
Loan growth, quality and provisioning relative to peersBank Only, As of December 2005
335%
153%
146%
83%
50%
44%
42%
109%
73%
80%
Lippo
BRI
BCA
Danam
on
Panin
Permata
BII
BNI
Mandiri
Niaga
Ratio of Provisions to NPL(%)
100,326
75,533
62,659
54,170
35,995
29,352
22,207
15,509
8,125
20,369
Mandiri
BRI
BNI
BCA
Danam
on
Niaga
Permata
BII
Panin
Lippo
Total Loans(Rp bn)
58.0%
13.3%
8.3%
21.1%
23.6%
34.1%
36.9%
39.0%
44.7%
50.2%
BII
Permata
Lippo
Niaga
Panin
BCA
Danam
on
BRI
Mandiri
BNI
Loan Growth (YTD)(%)
0.5%
0.8%
1.4%
1.9%
2.6%
3.2%
4.3%
8.4%
16.1%
2.1%
Lippo
BCA
Danam
on
BRI
BII
Permata
Panin
Niaga
BNI
Mandiri
NPL Ratio (Net)(%)
85.4%
80.8%
78.5%
77.8%
55.3%
55.2%
54.2%
50.0%
41.8%
32.4%
Niaga
Danam
on
Permata
BRI
BII
Panin
BNI
Mandiri
BCA
Lippo
Loan to Deposit Ratio(%)
1.7%
1.8%
2.6%
2.9%
4.7%
5.2%
5.3%
9.3%
13.7%
26.7%
BCA
Lippo
Danam
on
BII
BRI
Niaga
Permata
Panin
BNI
Mandiri
NPL Ratio (Gross)(%)
Average

81
Asset and liability mix relative to peersBank Only, As of December 2006
7.2%
6.4%
6.1%
5.8%
5.5%
5.3%
5.0%
4.7%
4.2%
3.7%
Panin
Danam
on
Niaga
Permata
BII
Mandiri
BRI
BNI
BCA
Lippo
77.5%
74.4%
67.6%
59.3%
49.5%
42.6%
42.4%
35.3%
48.0%
48.4%
Niaga
Permata
BRI
Danam
on
BII
Panin
BNI
Mandiri
BCA
Lippo
71.4%
71.4%
68.8%
58.1%
45.3%
40.9%
36.8%
32.0%
29.3%
28.4%
BCA
Lippo
BRI
BNI
Mandiri
BII
Permata
Panin
Danam
on
Niaga
254,289
34,954
29,116
35,758
41,362
47,333
66,764
122,776
147,108
149,663
Mandiri
BCA
BNI
BRI
Danam
on
BII
Niaga
Panin
Permata
Lippo
Loans to Total Earning Assets(%)
Cost of Funds (p.a.)(%)
Total Assets(Rp bn)
Low Cost Deposit Ratio(%)
16.5%
12.3%
11.7%
11.1%
10.6%
10.4%
10.3%
10.2%
9.4%
8.7%
BRI
Danam
on
Permata
Niaga
Panin
BII
BNI
BCA
Lippo
Mandiri
Yield on Assets (p.a.)(%)
Average
199,037
129,556
115,47 7
97,046
44,417
36,739
34,389
28,302
27,290
25,105
Mandiri
BCA
BNI
BRI
Danam
on
BII
Niaga
Permata
Panin
Lippo
Total Deposits(Rp tn)
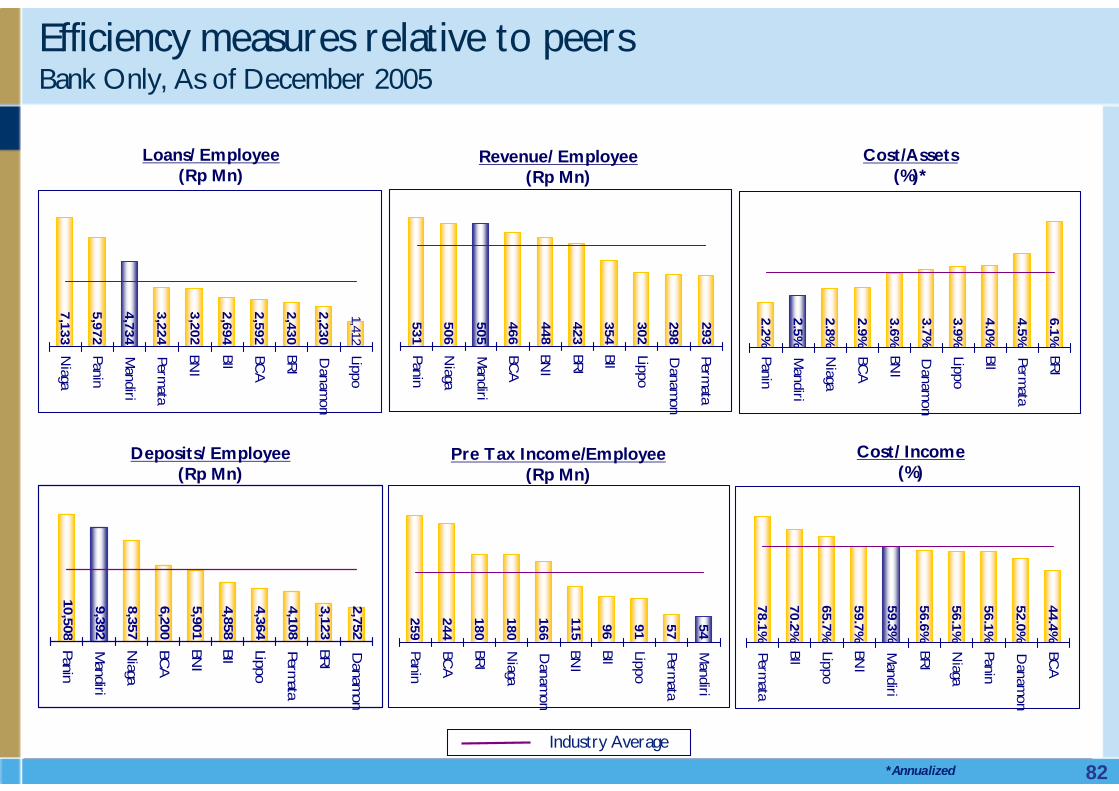
82
Efficiency measures relative to peersBank Only, As of December 2005
78.1%
70.2%
65.7%
59.7%
59.3%
56.6%
56.1%
56.1%
52.0%
44.4%
Permata
BII
Lippo
BNI
Mandiri
BRI
Niaga
Panin
Danam
on
BCA
531
506
505
466
448
302
298
293
354
423
Panin
Niaga
Mandiri
BCA
BNI
BRI
BII
Lippo
Danam
on
Permata
10,508
9,392
8,357
6,200
5,901
4,858
4,364
4,108
3,123
2,752
Panin
Mandiri
Niaga
BCA
BNI
BII
Lippo
Permata
BRI
Danam
on
7,133
2,230
1,412
2,430
2,592
2,694
3,202
3,224
4,734
5,972
Niaga
Panin
Mandiri
Permata
BNI
BII
BCA
BRI
Danam
on
Lippo
Revenue/ Employee(Rp Mn)
Cost/ Income(%)
Loans/ Employee(Rp Mn)
Deposits/ Employee(Rp Mn)
259
244
180
180
166
115
96 91 57 54
Panin
BCA
BRI
Niaga
Danam
on
BNI
BII
Lippo
Permata
Mandiri
Pre Tax Income/Employee(Rp Mn)
2.5%
2.8%
2.9%
3.6%
3.7%
3.9%
4.0%
4.5%
6.1%
2.2%Panin
Mandiri
Niaga
BCA
BNI
Danam
on
Lippo
BII
Permata
BRI
Cost/Assets(%)*
Industry Average
*Annualized

83
Measures of scale and returns relative to peersBank Only, As of December 2005
37.9%
28.2%
26.0%
24.2%
24.1%
21.1%
14.3%
14.1%
12.6%
2.8%
BRI
BCA
BII Danam
on
Lippo
Niaga
Permata
Panin
BNI
Mandiri
948
909
762
746
504
255
213
180
396
306
BNI
Mandiri
BCA
Danam
on
BRI
Lippo
Permata
BII
Niaga
Panin
12.2%
6.6%
6.0%
5.9%
5.4%
5.4%
5.4%
4.9%
4.1%
3.8%
BRI
Danam
on
BCA
Permata
Niaga
Lippo
BNI
BII
Panin
Mandiri
31,079
4,115
2,597
5,753
6,889
7,562
16,139
19,570
20,896
21,192
BRI
Mandiri
BCA
BNI
Danam
on
BII
Permata
Lippo
Niaga
Panin
Branches
Return on Equity (After Tax)(%)
Employees
Net Interest Margins(%)
5.0%
4.3%
3.4%
2.3%
2.1%
1.9%
1.7%
1.6%
1.2%
0.5%
BRI
Danam
on
BCA
Panin
Niaga
Lippo
BII
BNI
Permata
Mandiri
Return on Assets (Before Tax)(%)
3,447
2,560
2,272
804
717
691
674
546
298
197
BCA
Mandiri
BNI
Danam
on
BII
Lippo
BRI
Permata
Niaga
Panin
ATMs
Industry Average

84
BA
NK
CO
NSO
LIDA
TED
March 31,2006
March 31,2005
March 31,2006
March 31,2005
(Unaudited)
(Unaudited)
(Unaudited)
(Unaudited)
ASSET
S 1.
C a s h
3,166,068
2,274,552
3,266,239
2,359,664
2. Placem
ents with Bank Indonesia
a. Current accounts w
ith Bank Indonesia21,758,350
13,948,874
22,206,410
14,295,463
b. C
ertificates of Bank Indonesia6,653,174
3,669,842
7,337,174
3,669,842
c. O
thers-
5,093,961
-
5,093,961
3.
Current accounts w
ith other banks a. Rupiah
2,687
6,956
6,164
11,441
b. Foreign currencies621,034
694,794
665,988
817,301
4.
Placements w
ith other banks a. Rupiah
2,325,559
3,260,699
2,401,680
3,370,298
Allow
ance for possible losses on placements w
ith other banks - / -(23,357)
(46,211)
(24,830)
(47,983)
b. Foreign currencies
13,063,520
4,170,867
13,374,644
4,117,028
Allow
ance for possible losses on placements w
ith other banks - / -(136,845)
(48,658)
(136,846)
(48,658)
5.
Securities a. Rupiah i. Trading
201,096
119,448
507,366
291,204
ii. Available for sale
997,702
1,202,506
1,520,745
1,667,008
iii. Held to m
aturity1,038,440
1,093,945
1,052,278
1,241,973
A
llowance for possible losses on securities - / -
(1,038,318)
(1,124,322)
(1,043,096)
(1,129,166)
b. Foreign currencies i. Trading
45,997
86,101
85,814
125,064
ii. Available for sale
66,638
215,288
270,299
668,213
iii. Held to m
aturity969,602
1,369,853
1,204,397
1,484,095
A
llowance for possible losses on securities - / -
(64,635)
(237,623)
(64,635)
(237,623)
6. Securities sold w
ith agreement to repurchase
-
-
-
-
7. G
overnment Recapitalization Bonds
a. Trading2,210,630
1,568,770
2,210,630
1,685,668
b. A
vailable for sale28,793,814
28,991,274
28,920,070
28,991,274
c. H
eld to maturity
61,094,598
62,534,079
61,094,598
62,534,079
8. Securities purchased w
ith agreement to resell (reverse repo)
a. Rupiah-
-
210,037
471,071
A
llowance for possible losses on securities purchased w
ith agreement to resell -/-
-
-
-
-
b. Foreign currencies-
-
-
-
A
llowance for possible losses on securities purchased w
ith agreement to resell -/-
-
-
-
-
9. D
erivative receivables456,745
215,218
456,773
215,253
A
llowance for possible losses on derivative receivables - / -
(4,569)
(2,881)
(4,569)
(2,881)
10. Loans a. Rupiah - Related parties
352,675
411,145
354,601
416,751
- Third parties69,028,778
59,287,718
74,676,582
64,881,742
A
llowance for possible losses on loans - / -
(7,137,376)
(4,272,171)
(7,274,919)
(4,379,346)
b. Foreign currencies - Related parties
517,728
575,025
620,715
686,173
- Third parties28,170,717
32,437,711
29,422,922
33,529,786
A
llowance for possible losses on loans - / -
(5,575,136)
(4,507,231)
(5,623,140)
(4,534,378)
11. A
cceptances receivables3,741,200
5,620,991
3,743,376
5,625,121
A
llowance for possible losses on acceptances receivables - / -
(166,248)
(213,927)
(166,248)
(213,927)
12. O
ther receivables - Trade transactions3,053,649
3,916,949
3,053,649
3,916,949
A
llowance for possible losses on other receivables - trade transactions -/-
(937,337)
(918,099)
(937,337)
(918,099)
13. Investm
ents in shares of stock2,123,400
2,110,536
139,179
108,961
A
llowance for possible losses on investm
ents in shares of stock - / -(73,298)
(78,298)
(73,298)
(78,298)
14.
Accrued Incom
e1,973,809
1,309,254
1,998,323
1,315,186
15.
Prepaid expenses443,433
674,920
498,757
734,635
16.
Prepaid tax309,907
264,525
315,375
282,413
17.
Deferred tax assets
1,895,984
1,989,287
1,912,688
1,992,830
18. Prem
ises and equipment
7,714,917
7,411,732
8,133,317
7,781,230
A
ccumulated depreciation - / -
(2,740,547)
(2,207,285)
(2,985,684)
(2,414,865)
19. A
bandoned properties238,236
264,211
238,236
264,211
Provision for possible losses on abandoned properties - / -
-
(264,211)
-
(264,211)
20. Leased assets
-
37,550
-
37,550
Accum
ulated depreciation for leased assets - / --
(19,401)
-
(19,401)
21.
Repossessed assets158,922
169,373
188,701
200,344
Provision for possible losses on repossessed assets - / -
-
(169,373)
-
(169,373)
22. O
ther assets837,119
5,727,425
1,131,865
8,947,767
TO
TA
L ASSET
S246,128,462
238,615,688
254,884,990
249,373,340
BA
LAN
CE SH
EETS
As of M
arch 31, 2006 and 2005
(In Millions of Rupiah)
NO
DESC
RIP
TIO
N

85
March 31,2006
March 31,2005
March 31,2006
March 31,2005
(Unaudited)
(Unaudited)
(Unaudited)
(Unaudited)
LIAB
ILITIES A
ND
SHA
REHO
LDERS' EQ
UIT
Y1
D
emand deposits
a. Rupiah
30,176,496
27,510,591
31,486,315
28,535,982
b. Foreign currencies12,347,587
11,871,381
12,662,774
12,092,342
2
Liabilities im
mediately payable
774,729
815,076
844,369
921,449
3
Savings deposits41,776,917
49,458,229
43,844,544
51,122,131
4
Tim
e deposits a. Rupiah - Related parties
823,963
186,555
643,836
25,371
- Third parties89,941,492
64,800,229
93,064,278
67,464,569
b. Foreign currencies
- Related parties
94,225
15,242
49,526
1,917
- Third parties
15,782,761
11,092,986
16,330,996
11,774,275
5
Certificates of deposit
a. Rupiah-
-
-
-
b. Foreign currencies
-
-
-
-
6
Deposits from
other banks7,749,687
10,781,984
8,399,607
11,338,607
7
Securities sold w
ith repo agreements to repurchase
1,502,978
3,311,577
1,589,709
3,311,577
8
Derivative payable
182,041
129,841
182,279
129,927
9
Acceptances payable3,741,200
5,620,991
3,743,376
5,625,121
10
Securities issued a. Rupiah
888,367
858,012
1,088,367
1,058,012
b. Foreign currencies2,610,085
3,373,875
2,609,011
3,351,738
11
Fund borrow
ings a. Funding facilities from
Bank Indonesia-
-
-
-
b. O
thers i. Rupiah - Related parties
-
-
-
-
- Third parties1,853,167
1,792,399
1,958,166
2,177,399
ii. Foreign currencies
- Related parties
-
-
-
-
- Third parties
1,483,932
6,337,697
1,468,611
6,385,052
12
Estimated losses on com
mitm
ents and contingencies432,570
789,668
452,233
795,041
13
O
bligation under capital lease-
785
-
785
14
Accrued expenses
722,268
495,988
761,226
534,446
15
Taxes payable-
-
17,849
32,432
16
D
eferred tax liabilities-
-
-
-
17
O
ther liabilities5,149,413
5,962,110
5,546,966
9,235,724
18
Subordinated Loans - Related parties
-
-
-
-
- Third parties4,214,922
6,792,716
4,246,922
6,824,716
19
Loan C
apital - Related parties
-
-
-
-
- Third parties-
1,278,653
-
1,278,653
20
M
inority Interests -
-
4,580
3,727
21
Shareholders' Equity
a. Share capital10,144,789
10,070,008
10,144,789
10,070,008
b. Additional paid-in capital/agio
6,016,827
5,970,132
6,016,827
5,970,132
c. Share options206,596
14,981
206,596
14,981
d. Funds for paid-up capital
-
-
-
-
e. D
ifferences arising from translation of foreign currency financial statem
ents70,796
85,082
70,796
85,082
f. Premises and equipm
ent revaluation increment
3,046,936
3,046,936
3,056,724
3,056,724
g. Unrealized losses on available for sale securities and G
overnment
Recapitalization Bonds net of deferred tax (110,402)
(528,596)
(110,402)
(525,140)
h. D
ifference arising from equity transactions of subsidiaries
(11,359)
-
(11,359)
-
i. Retained earnings *)
4,515,479
6,680,560
4,515,479
6,680,560
TO
TA
L LIAB
ILITIES &
SHA
REHO
LDERS' EQ
UIT
Y246,128,462
238,615,688
254,884,990
249,373,340
*) Accum
ulated Losses of Rp162,874,901 million has been elim
inated against additional paid-in capital/agio due to quasi-reorganization as of April 30,2003
DESC
RIPTIO
N N
O
BA
NK
CO
NSO
LIDA
TED
BA
LAN
CE SH
EETS
As of M
arch 31, 2006 and 2005
(In Millions of Rupiah)
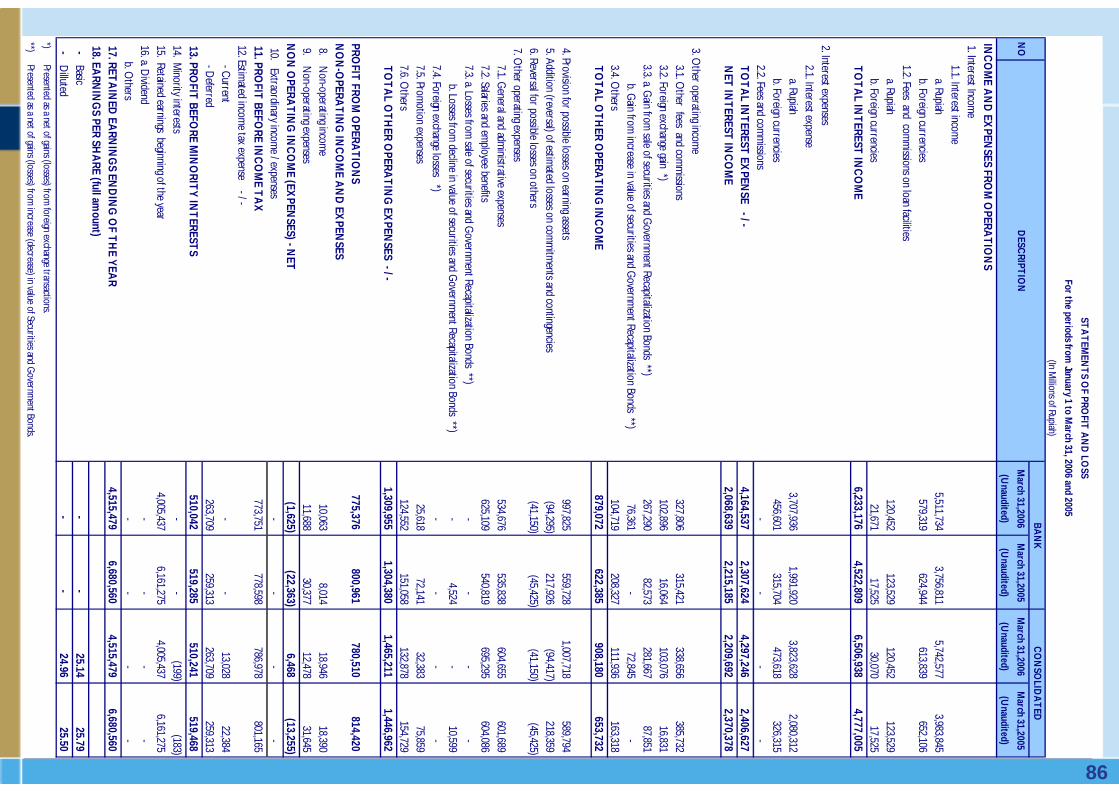
86
March 31,2006
March 31,2005
March 31,2006
March 31,2005
(Unaudited)
(Unaudited)
(Unaudited)
(Unaudited)
INC
OM
E AN
D EX
PENSES FRO
M O
PERAT
ION
S 1. Interest Incom
e1.1. Interest incom
e a. Rupiah
5,511,734
3,756,811
5,742,577
3,983,845
b. Foreign currencies579,319
624,944
613,839
652,106
1.2. Fees and com
missions on loan facilities
a. Rupiah120,452
123,529
120,452
123,529
b. Foreign currencies
21,671
17,525
30,070
17,525
TO
TA
L INT
EREST IN
CO
ME
6,233,176
4,522,809
6,506,938
4,777,005
2. Interest expenses
2.1. Interest expense a. Rupiah
3,707,936
1,991,920
3,823,628
2,080,312
b. Foreign currencies456,601
315,704
473,618
326,315
2.2. Fees and com
missions
-
-
-
-
TO
TA
L INT
EREST EX
PENSE - / -
4,164,537
2,307,624
4,297,246
2,406,627
NET
INT
EREST IN
CO
ME
2,068,639
2,215,185
2,209,692
2,370,378
3. O
ther operating income
3.1. O
ther fees and comm
issions 327,806
315,421
338,656
385,732
3.2. Foreign exchange gain *)102,896
16,064
103,076
16,831
3.3. a. G
ain from sale of securities and G
overnment Recapitalization Bonds **)
267,290
82,573
281,667
87,851
b. Gain from
increase in value of securities and Governm
ent Recapitalization Bonds **)76,361
-
72,845
-
3.4. Others
104,719
208,327
111,936
163,318
T
OT
AL O
TH
ER OPERA
TIN
G IN
CO
ME
879,072
622,385
908,180
653,732
4. Provision for possible losses on earning assets997,825
559,728
1,007,718
589,794
5. Addition (reversal) of estim
ated losses on comm
itments and contingencies
(94,295)
217,926
(94,417)
218,359
6. Reversal for possible losses on others(41,150)
(45,425)
(41,150)
(45,425)
7. O
ther operating expenses
7.1. General and adm
inistrative expenses534,676
535,838
604,655
601,689
7.2. Salaries and employee benefits
625,109
540,819
695,295
604,086
7.3. a. Losses from
sale of securities and Governm
ent Recapitalization Bonds **)-
-
-
-
b. Losses from
decline in value of securities and Governm
ent Recapitalization Bonds **)-
4,524
-
10,599
7.4. Foreign exchange losses *)
-
-
-
-
7.5. Promotion expenses
25,618
72,141
32,383
75,859
7.6. O
thers 124,552
151,058
132,878
154,729
TO
TA
L OT
HER O
PERAT
ING
EXPEN
SES - / -1,309,955
1,304,380
1,465,211
1,446,962
PROFIT
FROM
OPERA
TIO
NS
775,376
800,961
780,510
814,420
NO
N-O
PERAT
ING
INC
OM
E AN
D EX
PENSES
8. Non-operating incom
e10,063
8,014
18,946
18,390
9. N
on-operating expenses 11,688
30,377
12,478
31,645
N
ON
OPERA
TIN
G IN
CO
ME (EX
PENSES) - N
ET(1,625)
(22,363)
6,468
(13,255)
10. Extraordinary incom
e / expenses-
-
-
-
11. PRO
FIT BEFO
RE INC
OM
E TA
X773,751
778,598
786,978
801,165
12. Estim
ated income tax expense - / -
- Current
-
-
13,028
22,384
- Deferred
263,709
259,313
263,709
259,313
13. PROFIT
BEFORE M
INO
RITY IN
TEREST
S510,042
519,285
510,241
519,468
14. M
inority interests -
-
(199)
(183)
15. Retained earnings beginning of the year
4,005,437
6,161,275
4,005,437
6,161,275
16. a. Dividend
-
-
-
-
b. Others
-
-
-
-
17. RETA
INED
EARN
ING
S END
ING
OF T
HE YEA
R4,515,479
6,680,560
4,515,479
6,680,560
18. EA
RNIN
GS PER SH
ARE (full am
ount)-
Basic-
-
25.14
25.79
-
Dilluted
-
-
24.96
25.50
*)Presented as a net of gains (losses) from
foreign exchange transactions.
**)Presented as a net of gains (losses) from
increase (decrease) in value of Securities and Governm
ent Bonds.
NO
DESC
RIPTIO
N
BAN
KC
ON
SOLID
AT
ED
STA
TEM
ENT
S OF PRO
FIT A
ND
LOSS
For the periods from January 1 to M
arch 31, 2006 and 2005
(In Millions of Rupiah)

87
March 31,2006
March 31,2005
March 31,2006
March 31,2005
(Unaudited)
(Unaudited)
(Unaudited)
(Unaudited)
C
OM
MIT
ME
NT
S
Co
mm
itment R
eceivables 1.
Unused fund borrow
ings facilities a. R
upiah-
-
-
-
b. Foreign currencies
-
-
-
-
2. O
thers-
-
-
-
To
tal Co
mm
itment R
eceivables-
-
-
-
CO
MM
ITM
EN
T P
AY
AB
LE
S 1.
Unused loan facilities granted
a. Rupiah
16,929,984
19,313,902
17,007,664
19,332,175
b. Foreign currencies2,399,872
3,393,532
2,399,872
3,393,532
2.
Outstanding irrevocable letters of credit
3,430,979
6,989,826
3,733,703
7,156,803
3. O
thers-
-
-
-
To
tal Co
mm
itment P
ayables22,760,835
29,697,260
23,141,239
29,882,510
CO
MM
ITM
EN
TS
- NE
T(22,760,835)
(29,697,260)
(23,141,239)
(29,882,510)
C
ON
TIN
GE
NC
IES
C
ontingent R
eceivables 1.
Guarantees received
a. Rupiah
220,971
99,793
220,971
99,793
b. Foreign currencies2,190,977
2,181,994
2,193,424
2,219,121
2.
Unrecognized interest incom
e a. R
upiah2,744,231
1,512,104
2,744,411
1,512,104
b. Foreign currencies
1,683,716
640,973
1,683,716
640,973
3. O
thers32,904
32,962
32,904
32,962
T
otal C
ontingent R
eceivables6,872,799
4,467,826
6,875,426
4,504,953
C
ON
TIN
GE
NT
PA
YA
BL
ES
1. G
uarantees issued a. Bank guarantees - R
upiah3,271,703
3,001,805
3,351,083
3,084,909
- Foreign currencies
7,015,857
7,713,216
7,111,934
7,748,967
b. Others
-
-
-
3,167
2. O
utstanding revocable letters of credit-
-
-
-
3.
Others
55,067
31,302
52,883
31,302
To
tal Co
ntingent Payables
10,342,627
10,746,323
10,515,900
10,868,345
CO
NT
ING
EN
CIE
S - N
ET
(3,469,828)
(6,278,497)
(3,640,474)
(6,363,392)
BA
NK
CO
NS
OL
IDA
TE
D
NO
DE
SC
RIP
TIO
N
ST
AT
EM
EN
TS
OF
CO
MM
ITM
EN
TS
AN
D C
ON
TIN
GE
NC
IES
As o
f March 31, 2006 and 2005
(In Millions of R
upiah)

88
MANAGEMENT OF THE BANK AS OF MARCH 31, 2006 Jakarta, May 31, 2006Board of Commissioners
- Chairman : Edwin Gerungan S. E & O- Deputy Chairman : Muchayat Board of Directors- Commissioner : Soedarjono PT Bank Mandiri (Persero) Tbk.- Commissioner : Richard Claproth - Independent Commissioner : Pradjoto- Independent Commissioner : Gunarni Soeworo - Independent Commissioner : Yap Tjay Soen
Board of Directors- President Director : Agus Martowardojo - Deputy President Director : Wayan Agus Mertayasa - Director : Omar Sjawaldy Anwar - Director : Johanes Bambang Kendarto - Director : Zulkifli Zaini - Director : Abdul Rachman- Director : Sasmita
As approved in the Shareholder's General Meeting on May 22, 2006The change in member of the Boards of Directors are as follow :President Director : Agus Martowardojo Director : Sentot A. SentausaDeputy President Director : Wayan Agus Mertayasa Director : Bambang SetiawanDirector : Omar Sjawaldy Anwar Director : RiswinandiDirector : Zulkifli Zaini Director : Thomas ArifinDirector : Abdul Rachman Director : Budi Gunardi SadikinDirector : Sasmita
1) The above financial information as of and for the three months ended March 31, 2006 and 2005 is derived from the consolidated financial statements that have been reviewed by Public Accounting Firm Purwantono, Sarwoko & Sandjaja (previously Prasetio, Sarwoko & Sandjaja), a member of Ernst & Young Global (Partner In-charge is Drs. Soemarso S. Rahardjo ME (2005 : Drs. Sandjaja)) which stated that they did not find indication for material modification that should be made to the consolidated financial statements in order for them to comply with generally accepted accounting principles in Indonesia in their reports dated May 17, 2006 (except for note 60b as to which the date is May 22, 2006) and May 29, 2005, respectively, as the financial information is derived from the consolidated financial statements, it does not provide a complete presentation of all disclosures that are included in the consolidated financial statements.
2) The above financial information is presented in accordance with the following stipulations:a) Bank Indonesia's Regulation No. 3/22/PBI/2001 dated December 13, 2001 as amanded by Bank Indonesia's Regulation No. 7/50/PBI/2005 dated November 29, 2005 regarding Transparency of Bank's Financial Condition.b) Bank Indonesia’s Circular Letter No. 7/10/DPNP dated March 31, 2005 regarding the amendment of Bank Indonesia's Circular Letter No. 3/30/DPNP dated December 14, 2001 concerning Presentation of Quarterly and Monthly Published Financial Statements of Commercial Banks and Certain Report Submitted to Bank Indonesia.c) Bank Indonesia's Regulation No. 4/7/PBI/2002 dated September 27, 2002 regarding Prudential Principles for Purchase of Credit by Commercial Banks from the Indonesian Banks Restructuring Agency (IBRA). d) Bank Indonesia's Letter No. 5/559/DPNP/IDPnP dated December 24, 2003 regarding Bank's Published Financial Statements. e) Rule X.K.2, Decision of Chairman of the Capital Market Supervisory Agency (Bapepam), Attachment No. Kep-36/PM/2003 dated September 30, 2003 regarding "Obligation to Submit Periodic Financial Statements"
3) Bank assessed asset quality rating based on Bank Indonesia's Regulation No. 7/2/PBI/2005 dated January 20, 2005, as amanded by Bank Indonesia's Regulation No. 8/2/PBI/2006 dated January 30, 2006 regarding change in PBI 7, which among others required the Bank to apply the asset quality designated by Bank Indonesia, in the event of difference in assesment of asset quality between Bank and Bank Indonesia and other consideration such as classification determined by other commercial banks on the earning assets given by more than one bank and availiability of audited financial statements.
4) For comparative purposes, certain accounts in the financial information as of and for the three months ended March 31, 2005 have been reclassified to conform with the presentation of accounts in the financial information as of and for the three months ended March 31, 2006.
5) Exchange rate of 1 US Dollar as of March 31, 2006 and 2005 was Rp 9,065.50 and Rp 9,471.50 respectively.6) Basic and diluted earnings per share are calculated by dividing the net profit with the weighted average number of shares issued and fully paid during the period, after considering the effects
of stock options. 7) The appointment of Compliance Director is in the process of approval from Bank Indonesia.
Zulkifli Zaini Director Director
(Norbax Inc) : 7.99%
Public : 23.01%
Omar Sjawaldy Anwar
SHAREHOLDER
Republic of Indonesia : 69%(Ultimate Shareholders')
JP Morgan Chase Bank US Resident

89
SPECIAL SUB SPECIAL SUBMENTION STANDARD MENTION STANDARD
I Related PartiesA EARNING ASSETS1 Placement with other banks 126,917 - - - - 126,917 237,245 - - - - 237,245 2 Securities *) 92,661,717 - - - - 92,661,717 93,491,203 - - - - 93,491,203 3 Loan to related parties 662,825 - 6,000 - 201,578 870,403 629,609 - - - 356,562 986,171
a. Small scale business credit (KUK) - - - - - - - - - - - - b. Property Loans 9,240 - - - - 9,240 16,599 - - - - 16,599
i. Restructured 8,750 - - - - 8,750 15,625 - - - - 15,625 ii. Unrestructured 490 - - - - 490 974 - - - - 974
c. Other restructured loans 224,944 - - - - 224,944 118,956 - - - 148,793 267,749 d. Others 428,641 - 6,000 - 201,578 636,219 494,054 - - - 207,769 701,823
4 Investment in shares of stock to related parties 2,050,774 - - - - 2,050,774 2,027,797 - - - 5,159 2,032,956 a. In bank financial institutions 1,161,123 - - - - 1,161,123 1,069,684 - - - - 1,069,684 b. In non bank financial institutions 889,651 - - - - 889,651 828,989 - - - 5,159 834,148 c. Due to loan restructuring - - - - - - d. Others - - - - - - 129,124 - - - - 129,124
5 Other receivables to related parties 39,622 - - - - 39,622 29,922 - - - 3,149 33,071 6 Commitments and contingencies to related parties 18,690 - - - - 18,690 1,524 - - - 745 2,269
B NON EARNING ASSETS 1 Abandoned properties - - - - - - - - - - - - 2 Repossessed Assets - - - - - - - - - - - - 3 Interbranch and suspense account - - - - - - - - - - - -
II Third PartiesA EARNING ASSETS1 Placement with other banks 15,885,883 - - - - 15,885,883 12,976,361 - - - 13,671 12,990,032 2 Securities (issued by Bank Indonesia and third parties) 8,280,671 - 64,276 - 1,065,027 9,409,974 6,087,823 - 58,230 - 1,213,850 7,359,903 3 Loan to third parties 58,194,560 12,086,490 4,404,683 5,786,772 16,726,990 97,199,495 62,241,859 12,337,907 7,682,813 3,969,390 5,493,459 91,725,428
a. Small scale business credit (KUK) 3,610,579 680,515 99,909 131,519 380,317 4,902,839 3,197,916 364,516 26,330 55,974 279,438 3,924,174 b. Property Loans 3,277,017 1,296,523 302,335 972,155 649,385 6,497,415 2,517,568 751,779 186,867 51,864 9,290 3,517,368
i. Restructured 43,891 231,004 71,469 14,592 160,269 521,225 340,730 559,057 - - - 899,787 ii. Unrestructured 3,233,126 1,065,519 230,866 957,563 489,116 5,976,190 2,176,838 192,722 186,867 51,864 9,290 2,617,581
c. Other restructured loans 6,063,908 2,922,185 993,767 1,874,524 5,730,944 17,585,328 7,432,248 3,789,413 4,075,140 2,800,818 1,401,675 19,499,294 d. Others 45,243,056 7,187,267 3,008,672 2,808,574 9,966,344 68,213,913 49,094,127 7,432,199 3,394,476 1,060,734 3,803,056 64,784,592
4 Investment in shares of stock of third parties - - 1 - 72,625 72,626 3,000 - 1,955 - 72,625 77,580 a. In bank financial institutions - - - - - - - - - - - - b. In non bank financial institutions - - 1 - - 1 - - - - - - c. Due to loan restructuring - - - - 72,625 72,625 - - - - 72,625 72,625 d. Others - - - - - - 3,000 - 1,955 - - 4,955
5 Other receivables from third parties 4,628,699 684,489 886,054 219,547 793,183 7,211,972 5,588,137 2,296,467 1,011,995 30,523 792,965 9,720,087 6 Commitments and contingencies to third parties 12,982,301 307,923 230,310 17,694 161,621 13,699,849 12,385,913 4,843,373 285,796 - 187,496 17,702,578
B NON EARNING ASSETS 1 Abandoned properties - - - - - 238,236 - - - - - 264,211 2 Repossessed Assets - - - - - 158,922 - - - - - 169,373 3 Interbranch and suspense account - - - - - 675,560 - - - - - 1,335,706
195,532,659 13,078,902 5,591,324 6,024,013 19,021,024 240,320,640 195,700,393 19,477,747 9,040,789 3,999,913 8,139,681 238,127,813
1 a. Required allowance for possible losses on earning assets 953,468 575,191 791,827 1,823,797 11,193,138 15,337,421 991,777 1,033,947 1,535,159 1,242,172 6,314,480 11,117,535 b. Required allowance for possible losses on non earning assets - - - - - - - - - - - -Total required allowance for possible losses on assets **) 953,468 575,191 791,827 1,823,797 11,193,138 15,337,421 991,777 1,033,947 1,535,159 1,242,172 6,314,480 11,117,535
2 a. Established allowance for possible losses on earning assets 1,072,730 575,191 791,827 1,823,797 11,326,146 15,589,691 1,294,107 1,033,947 1,836,202 1,242,172 6,832,661 12,239,089 b. Established allowance for possible losses on non earning assets - - - - - 374,678 - - - - - 1,742,294 Total established allowance for possible losses on assets 1,072,730 575,191 791,827 1,823,797 11,326,146 15,964,369 1,294,107 1,033,947 1,836,202 1,242,172 6,832,661 13,981,383
3 Value of bank's assets pledge as collateral :a. To Bank Indonesia - -b. To others - -
4 Percentage of small scale business credit to total loans 4.99% 4.23%5 Percentage of small scale business credit debtors to total debtors 38.70% 30.96%6 Percentage UMKM to total loans 11.41% 8.47%7 Percentage of UMKM debtors to total debtors 42.11% 35.38%*) Include Government Recapitalization Bonds
**) The Calculation of allowance for possible losses on earning assets should be provided on the principal after deducting by collaterals. No allowance for posible losses is required for certificates of Bank Indonesia, placements with Bank Indonesia and government bond.
No March 31, 2006 March 31, 2005
LOSS TOTAL
TOTAL
DESCRIPTIONLOSS TOTAL CURRENT DOUBTFUL
EARNING ASSETS AND OTHER INFORMATIONAs of March 31, 2006 and 2005
(In Millions of Rupiah)B A N K
CURRENT DOUBTFUL

90
Contract Value Hedging Others Receivable Payable Netting Agreement
A. Exchange Rate Related
1 Spot - 3,870 - - -
2 Forward - 461,270 1,469 20,876 -
3 Optiona. Purchased - - 37 97 - b. Written - - 228 11 -
4 Future - - - - -
5 Swap - 6,620,278 453,539 35,104 -
6 Other - - - - -
B Interest Rate Related
1 Forward - 1,472 1,472 - -
2 Optiona. Purchased - - - - - b. Written - - - - -
3 Future - - - - -
4 Swap 107,719 18,234 - 125,953 -
5 Other - - - - -
C Other - - - - -
TOTAL 456,745 182,041
FOREIGN EXCHANGE AND DERIVATIVES TRANSACTIONAs of March 31, 2006(In Millions of Rupiah)
NO TRANSACTIONBANK (Unaudited)
Contract Market Value Derivative Receivable & Payable

91
I. CO
MPO
NEN
TSA
. C
ORE C
APITA
L21,632,308
23,363,919
1.
Paid-Up C
apital10,144,789
10,070,008
2.
Disclosed Reserves
a.Agio
6,016,827
5,970,132
b.Disagio (-/-)
-
-
c.Shares O
ption206,596
14,981
d.
Donated Capital / Additional Paid-In Capital-
-
e.
General and Appropriated Reserves2,560,285
747,000
f.
Previous years profit after tax2,246,139
6,087,417
g.
Previous years losses (-/-)-
-
h.
Current year profit after tax (50%)386,876
389,299
I.
Current year losses (-/-)-
-
j.
Differences Arising from
Translation of Financial Statements
in Foreign Currencies 1) Positive Adjustm
ent70,796
85,082
2) N
egative Adjustment (-/-)
-
-
k.Funds for Paid-Up Capital
-
-
l.D
ecline in Value of equity participation in Available for Sale Portfolio (-/-)-
-
m
.D
ifferences Arising from Restructuring of Transaction am
ong Entities under Com
mon Control
-
-
3.G
oodwill (-/-)
-
-
4.D
ifferences arising from assets and liabilities valuation due to Q
uasiReorganization
-
-
B.Supplem
ental Capital (M
ax 100% of core capital)8,334,588
9,021,496
1.Reserve for Prem
ises and Equipment Revaluation
3,046,936
3,046,936
2.Differences Arising from
Assets and Liabilities Valuation due to Quasi
Reorganization-
-
3.General Reserves of Allowance for Possible Losses on Earning Assets
(max 1.25% of risk weighted assets)
1,072,730
1,294,107
4. Loan Capital-
102,292
5.Subordinated Loans (m
ax 50% of core capital)4,214,922
4,578,161
6.Increase in Value of Equity Participation in Available for Sale Portfolio (45%)
-
-
C.
AD
DITIO
NA
L SUPPLEM
ENTA
L CA
PITAL FU
LFILLING
REQU
IREMEN
T-
-
D
. A
DD
ITION
AL SU
PPLEMEN
TAL C
APITA
L ALLO
CA
TED TO
AN
TICIPA
TE M
ARKET RIS K
-
-
II. TOTA
L CO
RE CA
PITAL A
ND
SUPPLEM
ENTA
L CA
PITAL (A
+B)29,966,896
32,385,415
III. TO
TAL C
ORE C
APITA
L,SUPPLEM
ENTA
L CA
PITAL, A
ND
AD
DITIO
NA
L SU
PPLEMEN
TAL C
APITA
L ALLO
CA
TED TO
AN
TICIPA
TE MA
RKET RISK (A
+B+D)
29,966,896
32,385,415
IV. INVESTM
ENTS IN
SHA
RES OF STO
CK (-/-)
(2,050,102)
(2,032,459)
V. TOTA
L CA
PITAL FO
R CRED
IT RISK (II-IV)27,916,794
30,352,956
VI.TO
TAL C
APITA
L FOR C
REDIT A
ND
MA
RKET RISK (III-IV)27,916,794
30,352,956
VII.C
REDIT RISK-W
EIGH
TED A
SSETS110,698,401
114,042,265
VIII.M
ARKET RISK-W
EIGH
TED A
SSETS2,966,744
3,722,859
IX
.ESTABLISH
ED C
APITA
L AD
EQU
AC
Y RATIO
FOR C
REDIT RISK (V : VII)
25.22%26.62%
X. ESTA
BLISHED
CA
PITAL A
DEQ
UA
CY RA
TIO FO
R CRED
IT AN
D
MA
RKET RISK (VI:(VII+VIII)24.56%
25.77%X
I.EXC
ESS AD
DITIO
NA
L SUPPLEM
ENTA
L CA
PITAL RA
TIO ((C
-D):(VII+VIII))
0.00%0.00%
XII.REQ
UIRED
MIN
IMU
M C
APITA
L AD
EQU
AC
Y RATIO
8%8%
CA
LCU
LATIO
N O
F CA
RA
s of March 31, 2006 and 2005
(In Millions of Rupiah)
NO
DESC
RIPTION
BAN
K
March 31, 2006
March 31, 2005

92
a.Summ
ary of loan purchased from IBRA
1 Loan principal / outstanding balance as of M
arch 31, 20064,274,992
2
Amount of loans purchased from
January 1, 2002 - March 31, 2006
5,579,541
3 Total provision for loan losses and deferred incom
e arising from the difference betw
een outstanding loans and purchase price
151,136
4 Allow
ance for possible loan losses as of March 31, 2006
841,503
5 Interest incom
e and other income related to loans purchased from
IBRA from
January 1, 2006 - March 31, 2006
34,751
b.Summ
ary of movem
ent of loans purchased from IBRA
1 Beginning Balance
4,771,405
2 Foreign currency translation
(312,861)
3 Additional loan purchased during the period
-
4 Repaym
ent during the period(183,552)
5
Loan written-off during the period
-
6 Ending Balance
4,274,992
c.Summ
ary of movem
ent of allowance for possible loan losses derived from
the difference between loan principal
and purchase price
1 Beginning Balance
-
2 Foreign currency translation
-
3 Additional allow
ance for possible losses on loan purchased from IBRA during the period
-
4 Allow
ance for possible losses for loan written-off
-
5 Reversal of allow
ance for possible losses due to excess of repayment over purchase price
-
6 Ending Balance
-
d.Summ
ary of movem
ent of deferred income derived from
the difference between loan principal and purchase price
1 Beginning Balance
159,858
2 Foreign currency translation
(8,606)
3 Additional deferred incom
e of loan purchased from IBRA during the period
-
4 D
eferred income for loans w
ritten-off-
5
Reversal of deferred income due to excess of repaym
ent over purchase price(116)
6
Ending Balance151,136
e.Loan covered by new
credit agreements
4,274,992
f.Additional facility extended to debtors under loan purchased from IBRA
2,688
NO
DESC
RIPTION
Amount
(Unaudited)
NO
DESC
RIPTION
Amount
(Unaudited)
NO
DESC
RIPTION
Amount
(Unaudited)
NO
DESC
RIPTION
Amount
(Unaudited)
LOA
N PU
RCH
ASED
FROM
IBRAJanuary 1, 2006 to M
arch 31, 2006(In m
illions of Rupiah)(Based on Bank Indonesia's Regulation N
o. 4/7/PBI/2002 dated September 27, 2002 C
hapter VI section 24)
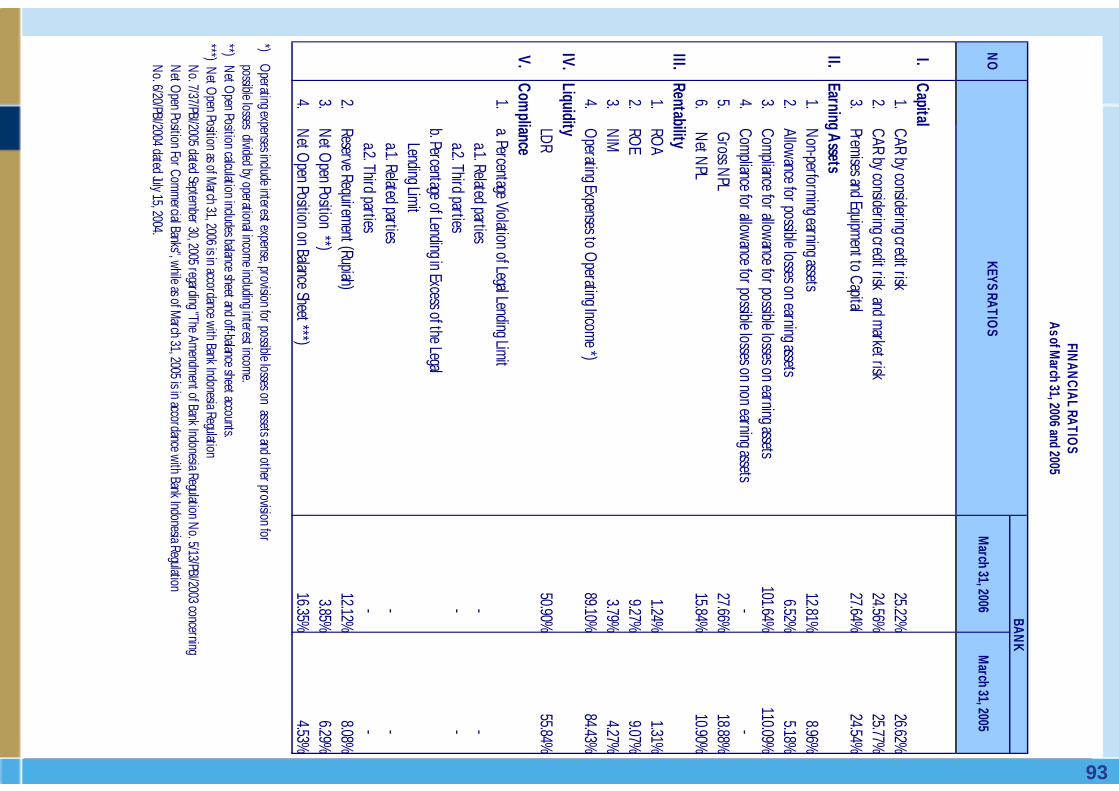
93
I.Capital
1.CAR by considering credit risk
25.22%26.62%
2.CAR by considering credit risk and market risk
24.56%25.77%
3.Premises and Equipment to Capital
27.64%24.54%
II.Earning Assets
1.N
on-performing earning assets
12.81%8.96%
2.Allowance for possible losses on earning assets
6.52%5.18%
3.Compliance for allowance for possible losses on earning assets
101.64%110.09%
4.Com
pliance for allowance for possible losses on non earning assets-
-
5.
Gross NPL
27.66%18.88%
6. N
et NPL
15.84%10.90%
III.Rentability
1.RO
A1.24%
1.31%2.
ROE
9.27%9.07%
3.N
IM3.79%
4.27%4.
Operating Expenses to O
perating Income *)89.10%
84.43%IV.
LiquidityLDR50.90%
55.84%V.
Compliance
1.a. Percentage Violation of Legal Lending Limit a.1. Related parties
-
-
a.2. Third parties-
-
b. Percentage of Lending in Excess of the Legal Lending Lim
it a.1. Related parties
-
-
a.2. Third parties-
-
2.
Reserve Requirement (Rupiah)
12.12%8.08%
3.N
et Open Position **)
3.85%6.29%
4.N
et Open Position on Balance Sheet ***)
16.35%4.53%
*) Operating expenses include interest expense, provision for possible losses on assets and other provision for
possible losses divided by operational income including interest incom
e.**) N
et Open Position calculation includes balance sheet and off-balance sheet accounts.
***) Net O
pen Position as of March 31, 2006 is in accordance with Bank Indonesia Regulation
No. 7/37/PBI/2005 dated Septem
ber 30, 2005 regarding "The Amendment of Bank Indonesia Regulation N
o. 5/13/PBI/2003 concerning N
et Open Position For Com
mercial Banks", while as of M
arch 31, 2005 is in accordance with Bank Indonesia Regulation N
o. 6/20/PBI/2004 dated July 15, 2004.
FINAN
CIAL RATIOS
As of March 31, 2006 and 2005
NO
KEYS RATIOS
BANK
March 31, 2006
March 31, 2005

94
Notes
_____________________________________________________________________________
_____________________________________________________________________________
_____________________________________________________________________________
_____________________________________________________________________________
_____________________________________________________________________________
_____________________________________________________________________________
_____________________________________________________________________________
_____________________________________________________________________________
_____________________________________________________________________________
_____________________________________________________________________________
_____________________________________________________________________________
_____________________________________________________________________________

95
Notes
_____________________________________________________________________________
_____________________________________________________________________________
_____________________________________________________________________________
_____________________________________________________________________________
_____________________________________________________________________________
_____________________________________________________________________________
_____________________________________________________________________________
_____________________________________________________________________________
_____________________________________________________________________________
_____________________________________________________________________________
_____________________________________________________________________________
_____________________________________________________________________________

96
Notes
_____________________________________________________________________________
_____________________________________________________________________________
_____________________________________________________________________________
_____________________________________________________________________________
_____________________________________________________________________________
_____________________________________________________________________________
_____________________________________________________________________________
_____________________________________________________________________________
_____________________________________________________________________________
_____________________________________________________________________________
_____________________________________________________________________________
_____________________________________________________________________________

98
[email protected] LienandjajaBNP PARIBAS PEREGRINE
[email protected] KosasihDEUTSCHE VERDHANA SECURITIES
[email protected] TanjaUBS
[email protected] NanwaniABN AMRO Asia Securities Indonesia
[email protected] HalimMACQUARIE SECURITIES INDONESIA
[email protected] MaMORGAN STANLEY DEAN WITTER
[email protected] SilaenKIM ENG SECURITIES
6221-515-8826
6221-526-3445
6221-5291-8570
6221-515-1330
852-3191-8611
6221-3983-5428
6221-350-9888
662-614-6213
6221-574-6911
6221-250-5081
TELEPHONE
Arief Koeswanto
Darmawan Halim
Rizal Prasetijo
Made Aditya Wardhana
Warren Blight
Ferry Hartoyo
Mulya Chandra
Roger Lum
Stephan Hasjim
Andy Lesmana
ANALYST
[email protected], KELTON
[email protected] SECURITIES
[email protected] SUISSE
DBS VICKERS SECURITIES
MANDIRI SEKURITAS
J.P. MORGAN ASIA
G.K. GOH INDONESIA
MERRILL LYNCH
CLSA LIMITED
BAHANA SECURITIES
BROKERAGE
The equity analysts listed above actively follow Bank Mandiri, but not all have issued research reports or formally instituted coverage.
Equity Research Contact Details

99
For Additional Information:
Please refer to our website at www.bankmandiri.co.id
Or Contact:
Ekoputro AdijayantoCorporate Secretary Tel: (6221) 524 5299 Fax: (6221) 5296 4024
Jonathan ZaxHead of Investor RelationsTel: (6221) 3002-3171Fax: (6221) 5290 4249E-mail: [email protected]
PT Bank Mandiri (Persero) TbkPlaza MandiriJl. Jend. Gatot Subroto Kav. 36-38Jakarta 12190Main Tel: 526-5045