Prospective cohort study of sheep dip exposure and 'dipper's flu'
252
Executive Health and Safety Prospective cohort study of sheep dip exposure and ‘dipper’s flu’ Prepared by the University of Manchester, Cardiff University and the Medical Toxicology Unit (MTU) for the Health and Safety Executive 2010 RR775 Research Report
-
Upload
khangminh22 -
Category
Documents
-
view
0 -
download
0
Transcript of Prospective cohort study of sheep dip exposure and 'dipper's flu'

Executive Health and Safety
Prospective cohort study of sheep dip exposure and ‘dipper’s flu’
Prepared by the University of Manchester,Cardiff University and the Medical Toxicology Unit (MTU)for the Health and Safety Executive 2010
RR775 Research Report

Executive Health and Safety
Prospective cohort study of sheep dip exposure and ‘dipper’s flu’
Dr A C Povey Centre for Occupational and Environmental Health School of Community Based Medicine Faculty of Medical & Human Sciences The University of Manchester Devas Street Manchester M13 9PL
Dr H G Rees & Dr J P Thompson Department of Pharmacology Radiology and Oncology Cardiff University Heath Park Cardiff CF14 4XN
Dr L Karalliedde Medical Toxicology Unit Guy’s & St Thomas’ NHS Foundation Trust Avonley Road London SE14 5ER
A prospective study was carried out to investigate the nature, frequency and signs of ill-health among farmers treating sheep for ectoparasites. Farmers were interviewed by a study nurse before and after treatment and also kept a symptom diary and measured their body temperature for 7 days following treatment. Blood and urine samples were collected. Blood samples were analysed for butyrylcholinesterase activity, clinical biochemistry and haematology parameters as well as serology for infectious pathogens. Urine samples were analysed for pesticide metabolites. Farmers reporting and not reporting symptoms following treatment were compared to examine the extent to which pesticide and other exposures were associated with ill-health.
This report and the work it describes were funded by the Health and Safety Executive (HSE). Its contents, including any opinions and/or conclusions expressed, are those of the authors alone and do not necessarily reflect HSE policy.
HSE Books

© Crown copyright 2010
First published 2010
All rights reserved. No part of this publication may be reproduced, stored in a retrieval system, or transmitted in any form or by any means (electronic, mechanical, photocopying, recording or otherwise) without the prior written permission of the copyright owner.
Applications for reproduction should be made in writing to:Licensing Division, Her Majesty’s Stationery Office,St Clements House, 2-16 Colegate, Norwich NR3 1BQor by e-mail to [email protected]
ii

ACKNOWLEDGEMENTS
We wish to thank the following for their assistance in the planning and execution of this study.
Field Nurses: Wales: Caroline Wilson, Paula Garry, Margaret Brodie, Janet Longar. Manchester: Sarah Lee, Maurice Grundy, Helen Buckingham, Louise Lewis. South east England: Robert Wibberley, Rachel Potts.
Technical Advice: Health & Safety Laboratory, Buxton: Dr John Cocker, Head of Biological Monitoring; Dr Kate Jones, Principal Scientist; Dr Ian Mason, Principal Scientist. National Public Health Service, Cardiff: Dr Diana Westmoreland, Consultant Virologist; Ian Phillips Lead Biomedical Scientist. School of Medicine, Cardiff University: Dr Meirion Evans, Senior Lecturer in Epidemiology & Public Health; Dr Andrew Freedman, Senior Lecturer Infectious Diseases. North West Lung Centre, Wythenshawe Hospital, Manchester: Dr Robert Niven, Consultant in Respiratory Medicine.
Administrative Team (Manchester): Jill Stocks, Dominic Kelly, Chris Gould, Leanne Lightfoot, Gillian Watkins, Bussie Awosanya.
iii

FOREWORD
The present study originated from a workshop organised by the Ministry of Agriculture, Fisheries and Food in 2000. The Ministry subsequently invited the project investigators to submit a joint research project on the following proposal: “to carry out studies to support a clinical definition of dipper’s flu, to determine it’s incidence, to elucidate what causes it (in particular whether organophosphate exposure is a factor and to characterise relevant exposure patterns if this is the case) and the extent to which sufferers go on to develop chronic disease”. Following delays because of the 2001 foot & mouth epidemic and other difficulties, the study was undertaken between 2004 and 2006, administered by the Health & Safety Executive.
iv

CONTENTS
Foreword ivContents vExecutive Summary viii1.0 INTRODUCTION 1 1.1 Sheep farming in the United Kingdom 1 1.2 Sheep ectoparasites & methods of control 1 1.3 Ill health in sheep dippers 2 1.4 Exposures during sheep dipping 3 1.5 Rationale for study 7 1.6 Aims and objectives of the present study 7 2.0 MATERIALS AND METHODS 9 2.1 Study design 9 2.2 Study population 9 2.3 Recruitment 9 2.4 Questionnaires 11 2.5 Exposure assessment 12 2.6 Biological markers of exposure 12 2.7 Health effects 13 2.8 Classification of dipper’s flu syndromes 13 2.9 Statistical analysis 14 3 DESCRIPTION OF PILOT STUDIES AND STUDY POPULATIONS 17 3.1 Pilot studies 17 3.2 Study population 17 3.3 Health status 21 3.4 Exposures 22 3.5 Levels of biomarkers in farmers 24 4 DESCRIPTIVE ANALYSIS OF SYMPTOM DIARIES 27 4.1 Description of symptom complexes 27 4.2 Categorisation of diary symptom complexes 29 4.3 Diary symptom complex scores 39 5 DESCRIPTIVE ANALYSIS OF HEALTH QUESTIONNAIRES 55 5.1 Frequency of health questionnaire scores 55 5.2 Categorisation of health questionnaire scores 55 5.3 Health questionnaire scores 68 6 DESCRIPTIVE ANALYSIS OF HEALTH EFFECTS 75 6.1 Clinical Biochemistry 75 6.2 Haematology 75 6.3 Temperature 76 6.4 Associations between health effects and diary symptom complex scores 76 6.5 Associations between health effects and health questionnaire scores 79 6.6 Associations between health effects and exposures 79 6.7 Associations between health effects and endotoxin concentrations in sheep 80
dip 6.8 Associations between health effects and urinary pesticide metabolite 80
concentrations6.9 Associations between health effects and butyrylcholinesterase activity 85 7 ANALYSIS OF INCIDENT CASES OF ILL HEALTH 87 7.1 Descriptive analysis of incident cases of ill-health 87 7.2 Associations between incident cases and demographic variables 87 7.3 Associations between incident cases and exposures 87
v

7.4 Associations between incident cases and endotoxin concentrations in sheep 87 dip
7.5 Associations between incident cases and urinary pesticide metabolites 90 7.6 Associations between incident cases and butyrylcholinesterase activity 92 7.7 Associations between incident cases and health effects 92 7.8 Multivariate analysis of incident cases of ill-health 92 8 PRINCIPAL COMPONENT ANALYSIS OF DIARY SYMPTOM 101 COMPLEXES8.1 Component identification 101 8.2 Associations between individual components and demographic variables 101 8.3 Associations between individual components and exposure variables 101 8.4 Associations between individual components and urinary pesticide 102 metabolites9 DISCUSSION 109 9.1 The nature, frequency of symptoms and signs of acute ill health 111 9.2 The association between self-reported symptoms and specific exposures and 113 biological effects.9.3 The association between self-reported symptoms and exposure to dipping 116 chemicals, infectious agents and endotoxins 9.4 Summary and future work 119 APPENDICES 121 REFERENCES 235
vi

EXECUTIVE SUMMARY
Sheep farmers have often complained of ill health immediately after dipping sheep (‘dipper’s flu’). This remains ill-defined as a clinical entity and the pathological mechanisms are poorly understood though it has been suggested that it may represent mild organophosphate (OP) toxicity. The present study was designed to determine the nature and frequency of symptoms and signs of acute ill health amongst farmers treating sheep for ectoparasites and to establish whether those farmers who develop flu-like symptoms differed in their exposure to OPs, endotoxins and infectious agents when compared to other farmers operating at the same time who remained free of symptoms.
A cohort of approximately 8700 sheep farmers from north west England, south east England or south and mid Wales was identified from records held by the National Farmers’ Union, Shepherd’s Guides and the British Wool Marketing Board. Information on the study, a consent form and a brief questionnaire were sent to the identified person. Farmers who were recruited were followed through two dipping seasons (between 2005 and 2006) and were asked to keep a record of their body temperature and a diary of symptoms (a total of 10 symptom complexes related to influenza) that occurred up to a week after treating their sheep. Farmers were also asked to complete an 83-item questionnaire related to more general symptoms, before and after treating sheep. Recruited farmers were visited by a study nurse prior to the treatment of the sheep (visit one) so as to obtain (i) demographic data and work history, (ii) baseline blood and urine samples, (iii) to explain the symptom diary and (iv) deliver training in temperature measurement. During the sheep treatment period farmers were then re-interviewed 24-48 hours after treatment finished (visit two) and then 2-3 weeks subsequently (visit three). Blood and urine samples were collected during visits two and three and analysed in different laboratories for routine clinical biochemistry and haematology parameters, as well as serology for infectious pathogens. Putative dipper’s flu syndromes were defined a priori or identified through literature searches. The associations between specific exposures (self-reported and biomarker defined) and dipper’s flu symptom scores and symptom categories were examined. Multivariate analysis of the risk of reporting new symptoms up to 48 hours after treatment was carried out using logistic regression with and without adjustment for demographic, exposure and health variables. Principle component analysis of the diary symptom complexes was carried out using varimax rotation. Results are as follows:
• Approximately half of the cohort replied to the original letter and 781 farmers who planned to dip their sheep in 2005 and 2006 were recruited and interviewed for the study. Symptom diaries and health questionnaires were obtained from 45% and 21% of the interviewed farmers respectively. Study participants were more likely to perceive a higher risk from sheep dip than those who did not take part but the difference in perceived risk was not large.
• Farmers used a range of different methods and products to treat their sheep. Pour-ons were used by 50% of farmers and dipping by a further 35%. Pyrethroids were used by 31% farmers, OPs by a further 28% and 19% of farmers used triazines.
• Analysis of visit two urines indicated that over 80% of them contained pyrethroid and/or OP metabolites at levels that were generally consistent with those found in previous studies of sheep farmers. Self-reported pesticide use was not necessarily an accurate indicator of exposure as 63 and 75% of farmers who reported using only avermectins and triazines respectively had detectable levels of urinary OP and pyrethroid metabolites
• Analysis of blood samples obtained at visits one and two indicated that there was little evidence of significant falls in plasma cholinesterase activity after treatment. Only 5% of farmers showed a significant fall (>20.8%) in plasma cholinesterase.
vii

• Analysis of blood samples obtained at visits two and three indicated that there was little evidence of exposure to infectious pathogens. Seroconversion rates were less than 2% with 3 farmers showing evidence of seroconversion to Adenovirus (n=2), Influenza B2 (n=1) and Respiratory syncytial virus (n=1), with one farmer seroconverting to both Adenovirus and Influenza B2. No samples tested positive for Chlamydia, Mycoplasma pneumoniae, Q fever, or Lepotospira whereas 33% of samples showed evidence of past infection with Toxoplasma.
• Analysis of sheep dip indicated the presence of varying levels of endotoxin which could be greatly increased (by more than 1000 fold) after sheep dipping.
• On the day before treatment, 7.3% of farmers reported that they felt ill. Following treatment only 3% of farmers complained of feeling ill on days one, two and three, and reporting was even lower, but not significantly so, later in the week. The reporting of specific symptom complexes varied significantly over the seven days following treatment with symptom reporting being highest on day two. The most common symptom being musculo-skeletal pain which was recorded by approximately 8% of farmers on day two. Few farmers reported a temperature over 37.7o Celsius suggesting that farmers did not develop a pyrexia after treating sheep. The commonest complaints identified using the health questionnaires were similar at all three visits and included general aches, joint stiffness, tiredness and waking up tired.
• Analysis of visit two blood samples revealed that approximately 30% of Immunoglobulin E (IgE), 20% of Mean Cell Haemoglobin, 18% of eosinophil, 16% of C reactive protein and 16% of creatinine results were outside the laboratory reference ranges. These altered levels were not associated with changes in symptom reporting again suggesting the absence of significant physical illness, while some results (e.g. for IgE and creatinine) were consistent with the results of physical activity or allergic effects. There were no associations between abnormal clinical biochemistry or haematology and self-reported exposures or urinary pesticide metabolites.
• Few farmers (<2%) were identified as having dipper’s flu. Diary symptom scores and symptom reporting were significantly higher in those farmers who previously reported having suffered from dipper’s flu and who perceived a high risk of ill health from sheep dipping but did not vary with self-reported use of OPs or non-OPs. However, a more detailed categorisation of non-OP products revealed different patterns of reporting. On day three, two or more symptoms were reported by 13% of farmers using triazines, 13% of those using OPs, 21% of those using avermectins and approximately 30% of farmers using pyrethroids (p<0.01). These results were not confirmed using urinary metabolites as a more objective marker of exposure.
• Multi-variate analysis of incident cases with new symptoms on days one and two was carried out using four different models with differing case and referent definitions. Symptom reporting was associated with ill-health at visit one, a previous history of dipper’s flu and so the perceived sheep dip risk in some but not all models. Farmers who held a certificate of competence for handling pesticides were less likely to report any symptoms. Holding a certificate of competence and older age were significantly associated with a decreased risk. Self-reported use of OPs or pyrethroids but not avermectins was associated with being a case when compared to those farmers who reported using triazines. These results were not confirmed using urinary metabolites as a more objective marker of exposure as there was no evidence of any associations between symptom reporting and urinary pesticide metabolites.
• A principal component analysis of new symptoms on days one and two showed little evidence of altered reporting of the identified components with either self-reported pesticide use or exposure defined by the presence or absence of urinary pesticide metabolites.
• The increased symptom reporting found in this study is then unlikely to result from any of the exposures examined. Further work would be required to better identify the cause of this increased symptom reporting.
viii

1 INTRODUCTION
1.1 Sheep Farming in the United Kingdom
Sheep farming is of significant economic importance in the United Kingdom. In 2002 approximately 35,800,000 sheep were held on 303,000 holdings, which employed around 530,000 people. Sheep numbers rose between 1980 and 1994, probably in response to agricultural subsidies, but have since fallen (Department for Environment, Food and Rural Affairs, 2008). The highest density of sheep per hectare is in Wales, followed by the north and northeast of England, and the west midlands. There is also substantial activity in the southwest of England, Kent and Scotland. Many of the farms are small enterprises, with most labour provided by members of the family, and a smaller proportion by regular, seasonal or casual employees (Department for Environment, Food and Rural Affairs, 2005).
1.2 Sheep Ectoparasites & Methods of Control
1.2.1 Sheep Ectoparasites
Infestation with skin parasites causes animal suffering and death (Trainer et al, 2002). It also impairs the sale value of animals in terms of weight, general condition, wool quality and hide quality (for leather manufacture). In the United Kingdom, most infestations are caused by six skin parasites: blow fly, sheep scab, lice, tics, keds and headfly (Trainer et al, 2002). Ectoparasite activity is related to ambient temperature, and varies in different parts of the UK. Data on the precise incidence rates is incomplete (Gwlad, 2007).
1.2.2 Sheep Dipping & Other Methods of Controlling Ectoparasites
British farmers traditionally dip all or some of their sheep 1-3 times a year to control ectoparasites. During the 1980s organophosphate (OP) compounds replaced organochlorines as the active pesticide in dips. Between 1984 and 1991 compulsory dipping was ordered in the United Kingdom to control sheep scab, and sales of OP dips reached a peak in 1991. Since then they have declined sharply, with substitution of pyrethroid compounds and possibly an overall reduction in dipping. In recent years sheep dips have contained one of two organophosphate pesticides either diazinon or propetamphos. Furthermore, other methods of application, including pour-on, spray/spot-on, injections, and jetting / showering, are becoming more widely used. These are described in detail elsewhere (Niven et al, 1993, 1996; Trainor et al, 2002).
Only products licensed by the United Kingdom Veterinary Medicines Directorate (VMD) may be used for treatment (Veterinary Medicines Directorate, 2006). Authorisation of treatments is dependent upon their efficacy and safety for consumers, users and animals. The treatments authorised during the course of this study are listed in Table 1. Ectoparasites exhibit differing levels of resistance to the different insecticides in use, and specific pesticides are recommended for different infestations.
The number of treatments applied each year depends upon local factors such as ectoparasite activity. Each of the application methods may use a range of different insecticides, and a farmer may use different methods during the course of a year, or treatment period. In the UK, dipping has traditionally been undertaken in the spring and summer, partly because of ectoparasite activity, and partly because of regulatory controls. Further insecticide applications may be performed on an ad-hoc basis. The decision when to treat is often taken at short notice, depending upon weather conditions, which dictate both ectoparasite activity, and the ease of gathering and treating flocks of sheep. Blow fly activity in particular is related to environmental
1

temperature. During the spring and summer, fly activity tends to spread from south to north, and this is anticipated or followed by treatment (Hughes, personal communication).
Table 1 Sheep Ectoparasite Treatments Approved by the VMD in 2005 – 2006a
Proprietary Name Manufacturer Mode of Active Pesticide Application (class)
Auriplak Fly & Scab Dip Virbac Ltd dip 10% w/w cypermethrin (synthetic pyrethroid)
Clik Novartis Animal Health pour-on 5% w/v dicyclanil UK Ltd (pyrimidine derived)
Coopers Ectoforce Sheep Schering Plough Animal dip 60% w/w diazinon Dip Health (organophosphate) Coopers Spot On Schering- Plough Ltd pour on 1% w/v deltamethrin Insecticide (synthetic pyrethroid) Crovect Pour On Novartis Animal Health pour-on 1.25% cypermethrin
UK Ltd (synthetic pyrethroid) Cydectin 1% Injectable Fort Dodge Animal injection 1% moxidectin Solution for Sheep Health Ltd (avermectin) Dectomax Injectable Solution for Cattle & Sheep
Pfizer Ltd injection 1% doramectin (avermectin)
Dysect Sheep Pour On Fort Dodge Animal pour-on 1.5% w/v alpha-cypermethrin Health Ltd (synthetic pyrethroid)
Ecofleece Sheep Dip Bimeda UK (a division of dip 10% w/w cypermethrin Cross VetPharm Group) (synthetic pyrethroid)
Ivomec Classic Injection for Cattle & Sheep
Merial Animal Health Ltd injection 1% w/v ivermectin (avermectin)
Noromectin Injection for Norbrook Laboratories injection 1% w/v ivermectin Sheep Ltd (avermectin) Noromectin Multi Injection Norbrook Laboratories
Ltd injection 1% w/v ivermectin
(avermectin) Osmond’s Gold Fleece Bimeda UK (a division of dip 60% w/w diazinon Sheep Dip Cross VetPharm Group (organophosphate) Paracide Plus Animax Ltd dip 16% w/w diazinon
(organophosphate) (Young’s) Robust Novartis Animal Health dip 10% cypermethrin
UK Ltd (synthetic pyrethroid) Vetrazin Pour On Novartis Animal Health pour-on 6% cyromazine
UK Ltd (triazine) Zermex 1% w/v Injectable Fort Dodge Animal injection 1% w/v moxidectin Solution for Sheep Health Ltd (avermectin) a Veterinary Medicines Directorate (2005,2006)
1.3 Ill Health in Sheep Dippers
Complaints of ill health by sheep dippers emerged after the introduction of OP dips to the United Kingdom in the 1980’s (Murray et al, 1992; Cook, 1992). These were accompanied by protests from action groups, media speculation, toxicological investigations, legal actions seeking compensation, and changes in government regulation. While many of these complaints referred to chronic ill-health as a result of sheep dipping, there were also concerns regarding acute ill-health. The term "dipper’s flu" has been used by many to describe these episodes of ill-health coined, but still remains ill defined. Symptoms may include fever, coryza, headache, dizziness and myalgia (Baxter et al, 2000).
2

1.3.1 Frequency of acute ill-health
The frequency of acute ill-health as a result of treating sheep for ectoparasites is currently unknown. In one study, 18% of dippers, apparently in good health reported that they had, on one or more occasions, suffered symptoms after dipping that they identified as ‘dipper’s flu’ (Povey, personal communication). In contrast, 79% of OP support group members reported that they had suffered immediate health effects following exposure to OPs (Fletcher et al, 2005). Hence the prevalence rate may well vary on the basis of study selection criteria. The yearly incidence rate also may well be much lower than the life-time prevalence. Adverse reactions to sheep dips in both humans and animals may be reported on a voluntary basis to the Suspected Adverse Reaction Surveillance Scheme run by the Veterinary Medicines Directorate (Veterinary Medicines Directorate, 2008). Between 1994 and 1998, 30 to 40 reports of adverse reactions to sheep dip were received each year of which approximately half related to acute ill-health (Veterinary Products Committee, 2003), but it is recognised that there is underreporting of incidents. There are also problems in assessing the validity of these reports, given that few if any farmers have been evaluated by clinical toxicologists, in the critical period immediately after OP exposure, when the extent of exposure can be verified by measuring levels of blood cholinesterase and urinary organophosphate metabolites (Trainor et al, 2002). Since 1998 the incidence of adverse reactions reported to this scheme has fallen. Paradoxically, when compared with sheep dippers far fewer complaints are made by other occupational groups in the United Kingdom, such as pesticide formulators and pest control operatives, whose exposures to OPs are of a greater magnitude, and for far longer periods of time (Ray, 1998).
1.3.2 Signs and symptoms of acute ill-health
The signs and symptoms of acute ill health following sheep dipping (treatment) are poorly characterised as there have been few studies which have examined them in a prospective rather than a retrospective manner. In one prospective study of 24 sheep farmers, 50% developed new symptoms within 24 hours of dipping, but a common pattern of symptoms was not evident. Two had significant depression of erythrocyte cholinesterase associated with handling dip concentrate (Rees, 1996). A more detailed analysis of symptom reporting in a study of 146 sheep farmers identified 3 symptom clusters which had some biological plausibility. These were 1) shivering, 2) generalised cramp, weak muscles & stiff joints, and 3) dry mouth, sore throat, headache, sleep-walking & trouble thinking. However, on the whole, the clusters were not thought to represent physical illness (Jackson & Spurgeon, 2001).
More recently, in a large postal survey of 10,765 men living in rural areas of England and Wales frequently reported symptoms following sheep dipping included headache (lifetime prevalence of approximately 23%), aching limbs (approximately 12%), runny nose (approximately 8%) and muscle weakness (approximately 7%: Solomon et al, 2007a). Dipping sheep was correlated with the symptoms of chronic organophosphate induced neuropsychiatric disorder (COPIND) proposed by Jamal et al (2002), but the authors concluded that their symptoms may have been caused by psychological rather than toxic mechanisms. Individual scores of somatising tendency were related to frequency of symptoms (both for pesticide users & sheep dippers), and with the presence of multiple symptoms. There was a strong tendency for individuals to have clusters of symptoms, but these were not related to specific pesticide exposures. Flu-like symptoms were not commoner in sheep dippers than others.
1.4 Exposures during sheep dipping
Sheep dipping is a relatively complex process, with potential exposure to a number of different environmental agents and physical stressors. Before dipping starts, the sheep are gathered
3

together for ease of handling, and in upland areas, this may take several days. Both gathering and dipping are arduous processes requiring considerable energy expenditure. Most sheep farmers regard it as the most physically difficult work of the year. Sheep dipping is dirty, arduous work, and farmers find it difficult to avoid skin contamination with dip fluid. Farmers are exposed to both sheep and dogs (and their parasites), soil, and detritus in dip tubs. Facilities for drinking water, hand washing and wound dressing may be poor. Occupational hygiene studies show significant exposure to OPs on handling dip concentrate, but not dilute dip (Buchanan et al, 2001).
1.4.1 Organophosphates
Between 2005 and 2006, the period of this study, sheep dips in the United Kingdom contained only one active OP, diazinon. This is a diethoxy-phosphorothioate compound and is classed as moderately toxic (UNEP 1986).
The toxicology of OPs is comprehensively described elsewhere (UNEP, 1986; Ballantyne & Marrs, 1992; Karalliedde et al, 2001; Krieger, 2001). Those effects common to OPs in general can be classified into three main groups: the acute cholinergic syndrome resulting from the effects of acetylcholinesterase inhibition, delayed effects following inhibition of acetylcholinesterase (intermediate syndrome) and delayed polyneuropathy. Of particular interest for this study are the acute cholinergic effects resulting from an accumulation of acetylcholine at different receptors in the nervous system. These effects can be grouped on a physiological basis. Muscarinic effects, including cough, coryza, nausea, vomiting, diarrhoea, eye pain and sweats, result from acetylcholine accumulation within postganglionic synapses of the parasympathetic nervous system. Nicotinic effects are those that occur due to accumulation of acetylcholine at autonomic ganglia, neuromuscular junctions and the adrenal medulla. The clinical manifestions are mainly myalgia and muscle weakness. Central effects including headache, paresthesiae, dizziness, insomnia and depression, are attributed to cholinergic stimulation within the brain. Cholinergic symptoms usually appear immediately, or a few hours after exposure, depending on the dose. They are reported to hardly ever appear more than 24 hours after exposure. Severe symptoms following high exposure can last for hours or days. Following such severe poisoning, mild symptoms can last for weeks. Severe poisoning should be easily identified, but very mild toxicity may be difficult to diagnose.
OP effects have been related to contaminants of higher toxicity present from production, such as oxon forms, monothiotetraethylpyrophosphate and sulphotetraethylpyrophosphate (Meier, 1979; Gallo & Lawryk, 1991). Prolonged storage of formulated pesticide may also produce these contaminants, and lead to degradation of emulsion, both of which enhance toxicity (Soliman et al, 1982; UNEP, 1986).
1.4.2 Pyrethroids
Pyrethrin insecticides are natural derivatives of Chrysanthemum cinerariafolium and other plants. The structure of pyrethrins has been modified to produce synthetic pyrethroids such as cypermethrin and deltamethrin. Synthetic pyrethroids are widely used as insecticides for crops and animals (Cage et al, 1998a,b; Trainor et al, 2002,). During this study, cypermethrin and alpha-cypermethrin were licensed as plunge dips and pour-ons for sheep. Deltamethrin was only licensed as a pour-on (Veterinary Medicines Directorate, 2004, 2005). The toxicology of synthetic pyrethroids is described in detail elsewhere (Cage et al, 1998a,b). In humans, pyrethroids generally exhibit low toxicity, related to their poor dermal absorption and their rapid metabolism. Symptoms are sometimes attributed to the solvent carriers rather than the pyrethroid (He et al, 1989; Chen et al, 1991; Cage et al, 1998a, b). In the UK, pyrethroid
4

poisoning appears to be rare, and long-term health effects have not been convincingly described (Cage et al 1998a,b; Leverton et al, 2007).
1.4.3 Avermectins
Avermectins are semi synthetic macrocyclic lactones, derived from fermentation of the soil actinomycete Streptomyces avermitilis. Ivermectin, doramectin and moxidectin are avermectin pesticides active against animals from different phyla; namely arthropoda (insects) and nematodes (round worms). Their detailed toxicology is described elsewhere (Gregus & Klassen, 2001; Stevens & Breckenridge, 2001; Chamberlain, 2006; Woodward, 2006; World Health Organisation, 2006).
Ivermectin is a mixture of two related avermectins. In the United Kingdom it is licensed for use by injection to control ectoparasites in sheep (Veterinary Medicines Directorate, 2006). A small number of cases of accidental injection of limited quantities of ivermectin have been described in the literature. One case resulted in localised swelling and the other nausea and colicky abdominal pain. Accidental eye contact has resulted in local irritation. In the United Kingdom doramectin is licensed for injectable use to control ectoparasites in sheep. It is also licensed as a pour-on, but only for use in cattle (Veterinary Medicines Directorate, 2006). There is little information available on toxicity in humans. (Chamberlain, 2006; Roberts, 2006) In the United Kingdom moxidectin is licensed for injectable use to control ectoparasites in sheep (Veterinary Medicines Directorate, 2006).
1.4.4 Triazines
Cyromazine is a triazine compound. It is used as an insecticide, and is effective against a wide variety of insects. Other triazines are used as herbicides, and act by inhibiting aliphatic amino acid synthesis in plants (Hazardous Substance Database, 2003). Little information on the toxicology of cyromazine is available in the public domain. The World Health Organisation has classified it as slightly hazardous on the basis of toxicity in animal experiments (Arnold, 1990). There do not appear to be any published reports on the human toxicity of cyromazine.
1.4.5 Formulants
The insecticides in sheep ectoparasite treatments are formulated with a variety of substances to enhance their use. For example, dips commonly contain organic solvents to form emulsions. These spread over and adhere to the fleece of sheep, increasing the contact time between insecticide and ectoparasite. Similarly, pour-ons and spot-ons are formulated to improve their flow and ease of application. The products may contain antimicrobial agents to prevent bacterial growth in the product, and reduce the incidence of infections such as fungal foot-rot in sheep following dipping. In the past, epichlorhydrin and phenol were widely used for this purpose. Phenol was removed from dip formulations in the early 1990’s, but it not clear whether epichlorhydrin is still used as a formulant. Colourings may be included for cosmetic reasons.
1.4.6 Influenza & other flu-like Infections
Anecdotal reports that describe dipper’s flu as a flu-like, febrile illness occurring after dipping periods would be consistent with an acute infectious illness. Sheep farmers, like the population in general, may be exposed to influenza and a number of other flu-like illnesses. In the United Kingdom, statistics on medical consultations for flu-like illnesses are collected routinely from sentinel general practices, and extrapolated to the total population. Between October 2005 and May 2006 (the influenza season), approximately 30 cases per 100,000 of flu-like illness were reported each week in the United Kingdom, rising to a peak of 42.2 cases per 100,000 in week 7
5

of 2006 (Desai et al, 2006). This was a year of low “influenza” activity, but these figures represented between approximately 18,000 and 25,000 individual cases each week. Most cases of flu-like illness are not investigated virologically, and the prevalence of different pathogens will vary from year to year. Common pathogens causing influenza-like symptoms in the UK include respiratory syncytial virus (RSV), Influenza A, Influenza B, Mycoplasma pneumoniae and Adenovirus. In England and Wales, the autumn and winter of 2005 – 2006 was a period of moderately high RSV activity, when compared with the earlier part of the decade, with reported cases peaking at 760 during week 51 of 2005. There were 608 reports of Influenza B, and 448 reports of Influenza A between week 40 in 2005 and week 20 in 2006 (Desai et al, 2006). Fewer than 20 infections with Mycoplasma pneumoniae were reported during the majority of months (Communicable Disease Report Weekly, 2005, 2006). The number of reports of Adenovirus has declined progressively since the early 1990s and during the period of this study the number was low at between 0 and 5 each month (HPA 2008).
1.4.7 Zoonoses
Pyrexial infections might also be transmitted from animals. During gathering and treatment farmers have more frequent, and closer contact with sheep, and sheep ectoparasites than usual. Modes of transmission of zoonoses during gathering and dipping sheep might include inhalation of infectious particles from dust, soil, faeces, and aerosols / droplets of contaminated water. Also ingestion following hand-mouth contact, contamination of skin abrasions and mucous membranes, and bites from infected insects.
During lambing shepherds often have more intimate contact with sheep than during dipping, and some zoonoses associated with sheep (C.burnetii and T.gondii) are more likely to be transmitted during the former. This also has implications for when infections are acquired. In Wales for example, the peak breeding for sheep season is between February and March, while most dipping in Wales is undertaken between May and August (Gwlad, 2007).
Infection with a specific pathogen frequently causes a specific syndrome of symptoms. For example infection with Campylobacter is usually localised to the gut and will give diarrhoea, while Salmonella is often a systemic infection giving a febrile illness. However, many zoonoses have similar symptoms, and a specific pathogen may cause a wide range of atypical symptoms. Conversely, many infections may be asymptomatic, although the virulence of a pathogen may vary over a period of decades. A large number of different zoonoses might cause flu-like illness in agricultural workers engaged in gathering and treating sheep. These include cryptosporidiosis, ovine chlamydiosis and Q fever.
Many factors might influence both the transmission of specific infections, and the development of symptoms. Some zoonotic pathogens are commoner than others in the agricultural environment in general, and in different host animals such as sheep, dogs and rats. Numbers can be influenced by environmental factors such as ambient temperature & humidity, nutritional resources, presence of host species, and control measures. Consequently, levels tend to vary both seasonally and between years, and may be localised to particular geographical areas.
1.4.8 Endotoxins
Endotoxins are lipopolysaccharide membrane constituents derived from dead or dying gram-negative bacteria. Endotoxin exposure is associated with contact with decaying organic matter (Klaassen, 2001), and inhalation of endotoxin particles has been proposed as a cause of byssinosis and humidifier fever (Parkes, 1994; Baxter et al, 2000). It has been suggested that
6

symptoms complained of by sheep dippers might be related to endotoxin exposure (Waclawski et al, 1994). Endotoxin exposure is associated with symptoms such as cough, chest tightness, wheeze, fever, and joint pain (Donham et al, 1989; Zejda et al, 1994). Inhalation of pure endotoxin is associated with reductions in Forced Expiratory Volume in one second (FEV1), and symptoms such as chest tightness, airway irritation, fever, headache, tiredness, joint pain, muscle pain and nausea (Thorn & Rylander, 1998). Sewage workers were reported to have flu-like, gastrointestinal and neurological symptoms, which correlated with self-reported endotoxin exposure (Douwes et al, 2001). Endotoxin exposures in this study were, however, generally low.
A study of endotoxin exposure during sheep dipping on six British farms has been reported (Waclawski et al, 1994). Concentrations of endotoxin in sheep dip rose with dipping, but were not related to the number of sheep dipped. Neither were levels of endotoxin in air related to levels in dip. Both dip and air levels of endotoxin were relatively low.
1.4.9 Other Environmental Exposures
Studies in swine confinement buildings give some indication of the exposures which might be experienced during sheep dipping. These have identified a wide range of substances, including aerosols of animal gut flora bacteria (from faecal contamination), gut epithelium, animal dander, hair, bacteria, beta-1,3-glucan, histamine, pollen grains, insect spores, fungal spores and veterinary antibiotics (Hamscher et al, 2003).Heat exhaustion might be a problem during gathering and dipping during hot summers, but does not appear to have been studied in this context. Symptoms include hyperpyrexia, nausea, weakness, headache and thirst (Stroud, 2003).
1.5 Rationale for the study
There appear to have been few epidemiological studies of dipper’s flu. The pathological mechanisms are poorly understood, and it is not known whether it is a potential marker of susceptibility to chronic ill health. Symptoms may include fever, coryza, headache, dizziness and myalgia (Baxter et al, 2000). Attention has focussed on the active OP insecticides in dip as a cause of acute ill health but when treating sheep, farmers may be exposed to a large number of different environmental agents. Commercial OP pesticides may also contain toxic contaminants or breakdown products, and sheep dips are formulated with different organic compounds having a variety of toxic effects (National Office of Animal Health, 2000). Furthermore, there are a number of other agents such as endotoxins or infectious pathogens that may be aetiologically important.
1.6 Aims and objectives
The objectives of the study were: 1. To determine the nature and frequency, of symptoms and signs of acute ill health,
amongst farmers treating sheep for ectoparasites in 2005-2006. 2. To establish whether the development of flu-like symptoms in farmers treating sheep for
ectoparasites, is associated with specific exposures and biological effects. 3. To establish whether farmers who develop flu-like symptoms have different levels of
exposure to dipping chemicals, infectious agents and endotoxins, compared with farmers treating sheep at the same time in adjacent areas, who did not become acutely ill.
7

8

2 MATERIALS AND METHODS
2.1 Study design
The study had a two phase design. The first phase was a cohort study designed to address objectives 1 and 2 and also to identify subjects for the second phase. This second phase, designed to address objective 3, was to be a case-referent study nested within this original cohort.
To be eligible for the cohort, farmers had to be aged between 18 – 70 years and be planning to treat their sheep in 2005 – 2006. Cases were to be identified by asking farmers two questions, within 48 hours of them completing treatment. These questions were (i) “Have you felt ill since dipping (or treating) sheep?”, and (ii) what has your temperature been since dipping (or treating) sheep?”. Farmers were to be designated as cases of “dipper’s flu” if they answered yes to question (i), or more than 37.50C to question (ii). Referents were then to be farmers who were healthy and without a high temperature who were actively treating in the same area.
Ethical approval for the study, including subsequent changes in protocol, was gained from the South East Multicentre Research Ethical Committee.
2.1.1 Changes in Study design
The original study design in 2000 included only those farmers treating sheep by dipping. However, pilot studies in 2005 indicated that the number of farmers using alternative treatments such as pour-ons and injections had greatly increased. Therefore, all types of treatment for sheep ectoparasites were included in the study.
There were practical difficulties in identifying farmers as cases and referents for the case-referent study. It proved very difficult to contact farmers immediately after treatment and of those who were contacted very few farmers reported being ill or having a high temperature. Hence the second phase of the study was modified to become a cross-sectional study of all farmers, in the original cohort, who were identified as actively dipping during a defined time period (from May 2005 until July 2006). Case identification was then carried out (at the end of the study) using self-reported symptoms to identify farmers with dipper’s flu as classified a priori for this study or from published definitions.
2.2 Study population
The study was based in three distinct areas in the UK: north west England (Cumbria, Cheshire, Derbyshire, Lancashire, North Yorkshire, Staffordshire and West Yorkshire), south east England (East Sussex, Hampshire, Kent, Surrey, and West Sussex), and Wales (Powys, Ceredigion and Carmarthenshire). The details of farmers residing within these areas were obtained from the National Farmers’ Union (NFU), the British Wool Marketing Board (BWMB), and Cumbrian Shepherd’s Guides. Duplicate entries were eliminated from the study database. Telephone numbers for as many of the sampling frame as possible were obtained using the online directory of enquiries from BT.
2.3 Recruitment All study subjects were sent a letter inviting them to participate in the study, along with an information sheet, consent form and screening questionnaire (Appendices 1-4). Eight weeks later, non-responders were sent a reminder postcard (Appendix 5), which was followed up by a reminder telephone call. Those people who did not wish to participate were asked to complete a
9

brief questionnaire over the telephone about occupational exposure, symptoms following treating sheep for ectoparasites, and attitudes to OP sheep dips (Appendices 6-7). Farmers were offered up to £100 to cover any inconvenience the study might cause.
2.3.1 Participation in the phase 1 cohort study
Those farmers that agreed to take part were contacted by a study nurse to arrange a convenient time to be visited for an interview. A letter confirming the interview was sent along with a general questionnaire (Appendices 8-9). In Wales, subjects were given the option of completing questionnaires in the Welsh language.
On the first visit to the farmer, the nurse confirmed when the farmer planned to treat their sheep, and reviewed the general questionnaire (Appendix 9) to ensure that the questions had been answered correctly. Following this a structured interview was carried out using a health questionnaire (Appendix 10) and a nurse’s research form (Appendix 11). Once the interview was complete, a blood and urine sample was taken for baseline investigations and the farmer given an information sheet and consent form for performing genetic testing (Appendices 12-13). Farmers were trained by the nurse in the different tasks relevant to the study (Appendix 14). The farmer was given a pack containing an unbranded oral digital thermometer (measuring temperature in Centigrade, supplied by Access Diagnostic Tests UK, Halam Grange, Nottinghamshire) and a symptom diary (Appendix 15). Written instructions were also left on how to collect and record the data (Appendix 15), the urine sample (Appendix 16), their temperature (Appendix 17) and to collect a sheep dip sample (Appendix 18). At the end of the interview, the nurse completed a check list to ensure completeness of data (Appendix 19) and that samples had been taken (Appendix 20).
Farmers were asked to telephone (or return a stamped & addressed card) a week before they planned to start treatment. The nurse then telephoned the farmer within 48 hours of them starting treatment to ascertain whether or not they had acute symptoms (Appendix 21).
2.3.2 Participation in the phase 2 cross-sectional study
The nurse telephoned farmers to find out whether they were actively treating their sheep and if so they arranged to visit the farmer as soon as possible and ideally within 48 hours after the start of treatment. At this second visit, the nurse reviewed the diary and temperature measurements, and administered further questionnaires on acute symptoms and chemical exposures during this treatment period (Appendices 22-23). The nurse also obtained samples of blood and urine from the farmers, and collected the dip samples taken from the dipping tub before and after dipping (for those farmers that undertook this). At the end of the interview, the nurse completed a check list to ensure completeness of data (Appendix 24) and that samples had been taken (Appendix 25). The nurse subsequently arranged to visit the farmer for a third and final time (Appendix 26).
Approximately two to three weeks after the second visit, the nurse visited farmers to administer questionnaires on symptoms experienced during the intervening period (Appendices 27-28) and to obtain a further blood sample. At the end of the interview, the nurse completed a check list to ensure completeness of data (Appendix 29) and that samples had been taken (Appendix 30).
2.3.3 Missed treatment participants
There were a number of participants who had treated their sheep before the nurse could interview them. These farmers were asked to complete questionnaires on health, lifestyle and
10

occupational exposures (Appendices 31-32) to enable some information to be collected about them. Fortunately, the majority of these farmers were able to participate in the study at the next treatment period, after being sent a postcard asking if they would like to continue to participate (Appendix 33).
2.3.4 Ineligibles and volunteers
Only farmers who were in the original sampling frame, i.e. those who were sent a letter of invitation, were eligible to participate in the study. Of these, there were a proportion who were ineligible because, for example, they did not have sheep, did not personally participate in treating their sheep, or were too old/young. Those who were ineligible because of their age were sent a letter and a short questionnaire (Appendices 34-35) to obtain some information about them. There were also other farmers who had heard about the study and wished to participate. They were sent a letter (Appendix 36) and the same questionnaire as the ineligibles, but could not participate in the full study because they were not part of the original sampling frame. None of the material collected by these means is included in this report.
2.4 Questionnaires
Questionnaires were developed partly based upon those used in previous studies. The general questionnaire, health questionnaire and nurse questionnaires were developed by the study investigators. Attitudes to sheep dip toxicity were adapted from a previous study (Stephens et al, 1995).
2.4.1 General questionnaire
Before being interviewed by the study nurse, the participant was asked to complete a general questionnaire, asking for information on medical history (including a history of dipper’s flu), lifestyle factors (e.g. alcohol consumption and tobacco use) and an occupational history (including working with sheep, cattle and other livestock) and previous exposures to pesticides including use of personal protective equipment (Appendix 9).
2.4.2 Nurse questionnaires
During the first farm visit the nurse administered a more detailed questionnaire to obtain additional information on their medical history, lifestyle factors, historical dipping exposure, symptoms following historical exposure to dip and their attitude to OP sheep dips and whether they currently held a certificate of competence for handling pesticides (Appendix 11). During the second and third visits the nurse administered a questionnaire to obtain more information on reported symptoms (in the symptom diary), their working practices and whether they had been exposed to pesticides (Appendices 23 and 28).
2.4.3 Health questionnaires
At visits 1, 2 and 3, farmers were asked whether they had been troubled by any of 83 different symptoms in the previous 4 weeks (at visit 1 undertaken before treatment of sheep), since they had treated (visit 2) or since they had last been visited (visit 3).
2.4.4 Symptom diary
Farmers were asked to record exposures and symptoms every evening for 7 days from the first day of treating sheep (Appendix 15). They were also asked to measure their oral temperatures
11

twice on each day. Symptoms were identified a priori as being consistent with dipper’s flu as characterised previously in the scientific literature.
2.5 Exposure assessment
2.5.1 Self-reported exposures
Detailed information on the treatment methods, the types of pesticides used, skin exposure to pesticides, handling of concentrate, the use of personal protective equipment, and the number of sheep dipped was obtained through the use of the general questionnaires, the symptom diary and the nurse questionnaires.
2.5.2 Endotoxins
It was originally intended to assess endotoxin exposure by measurement of blood lymphocyte immunophenotype (namely CD3, CD4, CD8, CD14 and CD25 measured by flow cytometry). However, the analytical method involved processing blood samples within hours of the blood being taken, and it proved impractical to deliver the samples to the test laboratory within the required time following exposure. Therefore, endotoxin levels in dip were measured, as an alternative parameter of exposure.
Immediately after the end of dipping, farmers collected samples of used dip from the dip tubs. Between 20 and 60 millilitres of dip was placed in non-pyrogenic containers, supplied by Sterilin. These were stored at -200 C, and analysed for endotoxin content at the North West Lung Research Centre, Wythenshawe Hospital, Manchester. In the laboratory, each aliquot was diluted to 1:400, and then three further serial dilutions of 1:10 were carried out using certified pyrogen free water and tubes. One hundred microlitres (100µL) of each serial dilution (1:4,000, 1:40,000 and 1:400,000) were assayed in duplicate using a kinetic limulus assay (Levin & Bang, 1968; Cooper et al, 1997). The diluted aliquots were transferred to a microtitre plate (96 wells, Becton Dickinson Labware) and 100µL of Limulus Amebocyte Lysate (LAL, Charles River Endosafe) was added. The plate was incubated at 370C and optical densities were read every 30 seconds at a wavelength of 405nm for one hour (BIO-TEK Instruments). Results were calculated from a standard curve generated from each plate using Biolise software (Charles River Endosafe). Results were expressed as Endotoxin Unit per millilitre.
2.6 Biological markers of exposure
There are a large number of agents that may potentially be associated with acute ill-health following the treatment of sheep for ectoparasites; in particular these agents may be OPs, endotoxins and infectious agents. To identify exposure to these agents, blood and urine samples were obtained, with consent, from study participants.
2.6.1 Infectious agents
On the second and third visits, 10 ml of blood was collected in a plain sample bottle for paired serological titres. Samples were stored at 50C. The tests were undertaken at the National Public Health Service Microbiology Laboratory Cardiff, using standard complement fixation techniques. Reagents were supplied by Institute Virion Ltd, Weingartenstasse 9, CH-8803, Ruschlikon Switzerland. The following antigens were employed: pooled adenovirus serotypes 3,4,6 & 7; influenza A virus; influenza B virus; group antigens for C.psittaci, C.pneumoniae & C.trachomatis; M.pneumoniae; C.burnetii; RSV; and pooled antigens for L.australis, L.canicola, L.grippotyphosa, L.icterohaemorrhaghiae, L.pomona & L.sejroe.
12

2.6.2. Butyrylcholinesterase activity
Exposure to OPs was assessed by measuring changes in blood butyrylcholinesterase (also known as plasma cholinesterase) by taking blood samples before and after treatment of sheep. On the first and second visits, 3 ml of venous blood was collected in EDTA sample bottles for butyrylcholinesterase estimation. Analysis was performed by the Department of Chemical Pathology at St Thomas’ Hospital, London, using a modification of the Ellman method (Ellman et al, 1961; Das & Liddell, 1970).
2.6.3 Organophosphate and Pyrethroid Urine metabolites
Exposure to pesticides was also assessed by measurement of pesticide metabolites in urine samples collected pre and post treatment. On the first visit (before treatment), immediately after the end of treatment, and on the third visit (2-3 weeks after the end of treatment), 20 ml of urine was collected in a Universal Container supplied by Sterilin of Stone, Stafford. Samples were stored at –200C. The urine samples were analysed at the Health & Safety Laboratory (HSL), Buxton for both pyrethroid and organophosphate metabolites.
The following OP metabolites were assayed: diethylphosphate (DEP), diethylthiophosphate (DETP), diethyl-dithiophosphate (DEDTP), dimethylphosphate (DMP), dimethylthiophosphate (DMTP) and dimethyl-dithiophosphate (DMDTP). A standard method, devised by the HSL was used, consisting of distillation and derivitisation of residue, followed by high resolution gas chromatographic analysis with flame photometric detection (Nutley & Cocker, 1993). Diazinon, the only OP pesticide licensed for use during the course of this study is metabolised to DEP and DETP. The following pyrethroid metabolites were assayed: cis and trans 3-(2,2-dichlorovinyl)-2,2-dimethylcyclopropane-1-carboxylic acid (cis and trans DCVA, also known as DCCA), 3 phenoxybenzoic acid (PBA), and cis-3-(2,2-dibromovinyl)-2,2-dimethylcyclopropane carboxylic acid (cDBVA). Urine samples were hydrolysed with sulphuric acid, extracted with chlorobutane, and after removal of solvent derivatised with methanolic potassium hydroxide and pentabenzyl bromide. The derivatives were washed with water and extracted into toluene before injection into a GC-MS. The latter comprised high resolution capillary chromatography linked to a mass spectrometer operating in the negative ion chemical ionisation mode with selected ion monitoring. For the methods used, the limit of detection was approximately 1 µg/l with the coefficient of variation between 24% and 31% (Woollen et al, 1992; Cocker et al, 2002). Cypermethrin is metabolised to cis & trans DCVA and to PBA. Deltamethrin is metabolised to cDBVA and to PBA.
2.7 Health effects
At the second visit, venous blood samples were collected for assessment of biological effects. Standard blood collection tubes supplied by Vacutainer were used. Using standard methods, they were analysed at the University Hospital of Wales Cardiff for full blood count (with differential white count), C-reactive protein, serum amylase, liver function tests, serum creatinine, and serum IgE.
2.8 Classification of dipper’s flu syndromes
A working definition of dipper’s flu syndrome was developed a priori for this study. Ten groups of symptoms (‘symptom complexes’) were identified for use in the symptom diary (Appendix 15) and the initial definition of a dipper’s flu syndrome for this study was that the farmer had to have all ten symptom complexes. Given the lack of farmers with all these symptom complexes, a less restrictive definition based upon the number of symptom complexes
13

was used instead: analysis was then carried out in farmers with either no symptom complexes, or one symptom complex, or two or more symptom complexes.
In addition, further definitions of dipper’s flu syndromes were derived from previously published definitions obtained from different sources namely (i) a textbook (Baxter et al, 2000), (ii) a research report (Stephens et al, 1995a) and (iii) web-based material (DoctorMyhill.co.uk, 2006). These definitions contained three, four and four symptoms respectively. The published definitions were matched as closely as possible to the symptom diary blind to any results of the study. These definitions are described in full in Appendix 37.
Similarly dipper’s flu was also defined a priori or using published definitions using the symptoms present on the (longer) health questionnaires: 29 symptoms on these questionnaires were identified for this study as being related to dipper’s flu. Using definitions developed from (i) a textbook (Baxter et al, 2000), (ii) a research report (Stephens et al, 1995a) and (iii) web-based material (DoctorMyhill.co.uk, 2006), 9, 8 and 11 symptoms, respectively, in the health questionnaire were identified as matching those published definitions. This matching was carried out independently of any results of the study. These definitions are described in full in Appendix 38.
Questions within the symptom diary (Appendices 39 and 40) and the health questionnaire (Appendices 41-44) have also been used to develop either a priori (Appendices 39, 41 and 42) or from published sources (Appendices 40, 43 and 44) a further series of ill-health syndromes that might be plausibly related to the exposures during the treatment period. No analysis has been carried out using these definitions for this report.
2.9 Statistical analysis
2.9.1 Description of study population
Frequencies are presented for categorical data and means with standard deviations for continuous data. The relationships between the collected data and interviewed participants and non-responders, those who did or did not complete the symptom diary and those who were visited once or more than once was examined by cross tabulation, comparison of means (and medians) where appropriate and calculation of simple univariate statistics (chi square, t-tests, Mann-Whitney U test) to compare the values in the two groups. p values less than 0.05 are reported. Descriptive data for the analysis of urinary pesticide metabolites is provided for all the samples analysed at visit 2, but for exploratory analysis data is restricted to those visit 2 samples that were obtained within 3 days after the initial day of treatment and who had a urinary creatinine level of within the range of 3-30mmole/litre. Using the visit 2 urine data, farmers were categorised into those with either (i) no detectable pesticide metabolites (ii) pyrethroid metabolites only , (iii) OP metabolites only and (iv) those with both pyrethroid and OP metabolites present in their urine.
2.9.2 Symptom diary analysis
Analysis of the symptom diary reporting has been carried out using both symptom scores and symptom categories developed using different dipper’s flu definitions (Appendix 37). Symptom scores for each farmer were calculated for the different definitions (Appendix 37) with a positive response =1 and a negative response =0. Following the initial description of symptom scores for each definition, further analysis was restricted to those scores obtained by using the definition developed a priori for this study (i.e. using all ten symptoms). Symptom scores are presented as mean ± standard deviation (SD) for each category. Symptom scores on days 1 to 6
14

were compared with those on day 7 by a paired t-test. Associations between symptom scores and potential confounders and exposures were analysed by the calculation of simple univariate statistics (t-tests, Mann-Whitney U-tests) to compare the values in the different groups. Correlation analysis between symptom scores and continuous variables were also carried out. p values less than 0.05 are reported.
Numbers of farmers in different symptom categories were calculated for the different dipper’s flu definitions (Appendix 37). Following the initial description of these results, further analysis was again restricted to the categories developed a priori for this study (i.e. namely no symptoms, 1 symptom or 2 or more symptoms). Frequencies of different symptoms reported at different days throughout the diary were compared to those values obtained at day 7 using a matched McNemar test. Associations between the different categories and potential confounders and exposures were analysed by the calculation of simple univariate statistics (chi square test) to compare the values in the different groups. Multivariate analysis of the risk of being an incident cases on days 1 and 2 following the self-reported use of specific products was carried out using logistic regression with and without adjustment for demographic (age, sex, region, smoking and drinking), exposure (number of sheep handled, certificate of competence for handling pesticides) and health (health status at visit 1, ever had dipper’s flu and perceived risk of sheep dip) variables. In contrast to the univariate analysis in which certain variables (age, smoking, pre-treatment health status and perceived sheep dip risk) were grouped into categories, in the multi-variate analysis these variables were entered as continuous variables to reduce the problems associated with small samples and sparse data in logistic regression analysis (Greenland et al, 2000). Principle component analysis of the diary symptom complexes was carried out using varimax rotation. Only those components with eigenvalues >1 are presented.
2.9.3 Health questionnaire analysis
Health questionnaire response were analysed using both total symptom scores and symptom categories developed using different dipper’s flu definitions (Appendix 38). Symptom scores were calculated for each health questionnaire (at visits 1,2 and 3) after the elimination of two questions due to lack of responses (namely “difficulty getting an erection” and “loss of sexual appetite”) by coding the responses as follows: never=0, some of the time =1, most of the time =2 and all of the time =3. Following the initial description of this data, only health questionnaires obtained within 7 days and 10-28 days after the initial day of treatment were used to define visit 2 and visit 3 responses respectively
Following the initial description of symptom scores for each definition, further analysis was restricted to those scores obtained by using the definition developed a priori for this study (i.e. using all ten symptoms). Symptom scores are presented as mean ± SD for each category. Symptom scores on visit 2 and 3 were compared with those on visit 1 by a paired t-test. Associations between symptom scores and potential confounders and exposures were analysed by the calculation of simple univariate statistics (t-tests, Mann-Whitney U-tests) to compare the values in the different groups. Correlation analysis between symptom scores and continuous variables were also carried out. p values less than 0.05 are reported.
To categorise the health questionnaire symptom scores at each visit, the median score (of all positive responses) was calculated and three groups of farmers were thus identified: namely those with no symptoms, those with a symptom score less than the median and those with a symptom score greater than the median. For the purposes of comparing farmers across the three visits, the median score at visit 1 was used to categorise farmers also at visits 2 and 3. For the purpose of comparing categories within a visit, the median score at that visit was used. Following the initial description of health questionnaire symptom scores for each definition,
15

further analysis was restricted to those scores obtained by using the definition developed a priori for this study (i.e. using all 29 symptoms: Appendix 38).
Frequencies of different symptoms reported at visits 2 and 3 are compared to those obtained at visit 1 and then analysed by using a matched McNemar test. Associations between the different categories and potential confounders and exposures were analysed by the calculation of simple univariate statistics (chi square test) to compare the values in the different groups: p values less than 0.05 are reported.
2.9.4 Health effects analysis
Clinical biochemical data and full blood count data were categorised on the basis of the reference range provided by the laboratories at the University Hospital of Wales Cardiff which carried out the analyses. Further analysis was then restricted to those variables for which at least 10% of the results lay outside the reference range. Associations between the different categories and potential confounders and exposures were analysed by the calculation of simple univariate statistics (chi square test, t-tests, Mann-Whitney U-tests) to compare the values in the different groups: p values less than 0.05 are reported.
16

3 RESULTS
3.1 Pilot studies
The pilot study was designed to (i) examine procedures to recruit sheep dippers into the study (ii) determine the likely response rates, (iii) test procedures for taking the farmers’ temperature and recording symptoms via a diary, (iv) obtain information on “dipper’s flu” symptoms, to define better the questionnaires and diary for the main study, (v) develop audit procedures, and (vi) identify and resolve other problems with the study protocol. The initial pilot study was conducted in Derbyshire because of its proximity to the study administrative centre in Manchester.
Names and addresses of sheep farmers living in the midlands were purchased from the NFU and the BWMB. There were 260 names on the NFU database and 1067 on the BWMB database; 159 were in both. For the NFU data, all Stockport (SK) postcodes were dropped, and a 63% random sample was obtained, resulting in a count of 100 in the sampling frame. For the BWMB data, SK postcodes, Staffordshire county and NFU matches were dropped before a random sample was taken. An 18% random sample was obtained, resulting in a count of 100, and giving a total of 200 subjects. An information pack and covering letter was sent to each subject asking them to participate in the study; non-responders were sent a reminder pack 2 weeks later. The compensation offered to this sample of farmers was £20. From the 200 subjects, there was a positive response from 6 (3.0%), a negative response from 23 (11.5%) no response from 116 (58%) with 51 subjects being ineligible (25.5%). Four letters were returned directly without being opened (2%). More positive replies were obtained from subjects identified through the NFU (5) than through the BWMB (1). Excluding those subjects who were ineligible and those whose letters were returned, the overall response rate was 4.1%; 1.3% for BWMB subjects, and 7.1% for NFU subjects. Recruitment was thus disappointingly low but those farmers who were recruited were interviewed successfully and biological samples were collected, processed and transported to the appropriate laboratories according to the protocol.
Following the initial pilot studies, the information (introductory letter, information sheet and consent form) sent out to farmers was reviewed and modified so as to make it less formal and to remove jargon (e.g. the term “dipper’s flu study” was replaced by a more neutral descriptor “sheep dipping and health survey”). In addition, the amount of money that was offered to farmers in compensation for their time and effort was raised from £20 to £100 (if the farmer was visited three times during the study). This new approach was piloted in two populations selected from the Cumbrian Shepherd’s Guide: one population received information via a letter with follow-up by phone whilst the other received a phone call first and if interested then the letter. Overall, a large number of farmers were excluded (37/150 =25%) due in part to the inaccuracies in the register of farmers. Overall 17 farmers agreed to take part, 81 refused and no contact was made with 15 farmers. Those who received the letter first were more likely to agree to take part in the study (n=14: response rate 21.2%) than those who received a phone call first (n=3; response rate 9.4%). Changing the introductory material and increasing the offer of compensation had thus increased the response rate.
3.2 Study population
Following the increased recruitment rate in the second pilot study, 8747 farmers in Wales, north west England and south east England were contacted with the revised introductory material. Responses to these letters are shown in Figure 1. A response was obtained from 4729 farmers (54.1%). Of the responders 963 were excluded for a variety of reasons and of the 3766 potential participants, 2925 refused to participate. 781 of the 841 who agreed to participate were
17

Figure 1
Study database N=8747 (100%)
Agreed to participate
N=841 (9.6)
Refused to participate
N=2925 (33.4)
Initial non-responders N=4018 (45.9)
Ineligible N=775 (8.9)
Deceased N=71 (0.8)
Moved address
N=117 (1.3)
Responded to telephone
questionnaire N=56 (0.6)
Responders N=4729 (54.1)
Potential participants
N=3766 (43.1)
Excluded N=963 (11.0)
Interviewed participants N=781 (9.3)
Non-responders N=3962 (45.3)
Response rate
interviewed (and hence defined as an interviewed participant), a final response rate of 9.3%. There was no-response initially from 4018 farmers (45.9%): 56 of these initial non-responders did answer a telephone questionnaire. Of the 781 farmers who were interviewed, 352 (45.1%) completed symptom diaries (Figure 2).
Interviewed farmers First visit N=781
(Prior to treatment)
Interviewed farmers Second visit N=156 (Immediately after
treatment)
Interviewed farmers Third visit N=149
(Two to four weeks after treatment)
Completed Symptom diary N=352 (45.1)
Completed Symptom diary N=154 (98.7)
Completed Symptom diary N=144 (96.6)
Figure 2 Number of farmers interviewed and who completed symptom diaries
18

156 farmers were visited for a second time immediately after treatment and 149 had a third visit two to four weeks after treatment. The vast majority of the farmers visited a second or third time completed symptom diaries (Figure 2)
Response rates in different strata of the study population were then examined (Table 2). Men were more likely than women to be non-responders (52% vs 45.9% respectively; p=0.003), but less likely to decline to take part (36.6% vs 40.7%) or be an interviewed participant (11.5% vs 13.4%). Farmers in Wales (11.7%) were more likely to take part (and be an interviewed participant) than those farmers in south east (9.7%) or north west England (7.8%). Interviewed participants were more likely to have been identified through records obtained from the BWMB (11.5%) than either the Cumbrian Shepherd’s Guides (6.4%) or the NFU (7.3%).
Table 2 Response rates in study population by sex, geographical region and source of
information
Variable Definition Total N
n (% of total) Interviewed Participant
Declined to take part
Non-responder
Sex Male Female Missing information
5778 885 1005
662 (11.5) 119 (13.4) 0 (0)
2113 (36.6) 360 (40.7) 452 (45.0)
3003 (52.0) 406 (45.9) 553 (55.0)
Area Wales N West England S East England
3752 2119 1797
440 (11.7) 166 (7.8) 175 (9.7)
1350 (36.0) 962 (45.4) 613 (34.1)
1962 (52.3) 991 (46.8) 1009 (56.1)
Source National Farmers’ Union Shepherd’s Guides British Wool Marketing Board
2146 219 5303
157 (7.3) 14 (6.4) 610 (11.5)
886 (41.3) 120 (54.8) 1919 (36.2)
1103 (51.4) 85 (38.8) 2774 (52.3)
The interviewed participants were then compared with those (initially non-responding) farmers who completed a telephone questionnaire (Table 3). Participants in the study were younger and more likely to have had dipper’s flu than those farmers who completed the telephone questionnaire: 25% of participants reported that they had had dipper’s flu but only 8% of the initial non-responders (p=0.007; Table 3). Treatment methods were different in the two groups with the initial non-responders more likely to use injections and less likely to use pour-ons than the interviewed participants (p<0.001). Interviewed participants were more likely to perceive the highest risk from sheep dips but the absolute difference was relatively small.
The farmers who completed the symptom diary were compared with those who did not (Table 4). There was no difference in the age, sex, smoking or drinking habits of the farmers who did or did not complete the symptom diary. Similarly there was no difference in whether they held a certificate of competence or were a contract dipper. However, farmers living in north west England were more likely to complete a symptom diary than those living in south east England or Wales (62.7% vs 35.4% vs 42.3% respectively (Table 4). There was a small, but statistically significant, difference in the attitudes to sheep dip toxicity with those who completed the diary having a lower score and hence perceiving a lower risk (Table 4).
Those farmers who had more than one visit were less likely to be women or current smokers or live in south east England but were younger and more likely to hold a certificate of competence but had a similar experience of dipper’s flu as those visited only once (Table 5). This geographical variation is likely to reflect the fact that in 2005 the treatment period in the south east (which is earlier than in other parts of the UK) was missed. There was again a small, but
19

statistically significant difference in the attitudes to sheep dip toxicity between those who had one or more than one visit (Table 5).
Table 3 Demographics, treatment practices, ill-health and attitudes to sheep dip toxicity
in interviewed participants and non-responders who answered a telephone aquestionnaire
Variable Definition Interviewed Participant (n=781)
Non-responders Interviewed by telephone (n=56)
p
Sex Male/female (% male)
662/119 (84.8) 43/3 (93.5) 0.11
Age Mean ±SD (n) 53.1±10.2 (774)
58.1±10.9 (49) 0.001
Dipping (%) 123 (36.2) 14 (34.1)
Method used Pour-on (%) Injection (%)
178 (52.5) 24 (7.1)
12 (29.3) 11 (26.8)
<0.001
Shower (%) 14 (4.1) 4 (9.8) Product used Non-OP/OP (%OP) 236/104 (30.5) 17/7 (29.2) 0.93 Concentrate used Yes/no (% yes) 707/46 (93.9) 46/3 (93.9) 1.0 Ever had Dipper’s flu Yes/no (% yes) 173/520 (25.0) 4/46 (8.0) 0.007 Perceived sheep dip risk b Mean ±SD (n) 15.8±5.5 (776) 13.6±6.5 (51) 0.006
a Non-responders answered a brief telephone questionnaire; b Based upon scale used by Stephens et al, (1995a); max score = 24
Table 4 Demographics of interviewed participants who did and did not complete a symptom
diary
Variable Definition Symptom diary
pCompleted Not completed
Number n 352 429 Sex Male/female (% male) 303/49 (86.1) 359/70 (83.7) 0.41 Age Mean ±SD (n) 53.2±10.4 (422) 53.0±10.0 (352) 0.76
Wales (%) 186 (42.3) 254 (57.7) Region North West England (%) 104 (62.7) 62 (37.3) <0.001
South East England (%) 62 (35.4) 113 (64.6) Current smoker Yes/No (% yes) 50/301 (13.9) 61/367 (14.2) 0.99 Current drinker Yes/No (% yes) 295/56 (84.0) 360/68 (84.1) 1.00 Certificate holdera Yes/No (% yes) 121/228 (34.7) 128/294 (30.3) 0.23 Contract dipper Yes/No (% yes) 9/340 (2.6) 6/416 (1.4) 0.37 Perceived sheep dip riskb Mean ±SD (n) 15.3±5.6 (352) 16.2±5.4 (424) 0.02
a Certificate of competence for handling pesticides; b Based upon scale used by Stephens et al, (1995a): max score =24
20

Table 5 Demographics of interviewed participants who had one or more than one visit
Variable Definition Number of visits One More than one p
Number n 620 161 Sex Male/female (%male) 514/106 (82.9) 148/13 (91.9) 0.007 Age Mean ±SD (n) 53.6±10.0 (613) 51.4±10.7 (161) 0.01
Wales (%) 339 (77.0) 101 (23.0) Region North West England (%) 113 (68.1) 53 (31.9) <0.001
South East England (%) 168 (96.0) 7 (4.0) Current smoker Yes/No (% yes) 94/525 (15.2) 17/143 (10.6) <0.001 Current drinker Yes/No (% yes) 522/97 (84.3) 133/27 (83.1) 0.80 Certificate holdera Yes/No (% yes) 181/429 (29.7) 68/93 (42.2) 0.003 Contract dipper Yes/No (% yes) 11/599 (1.8) 4/157 (2.5) 0.61 Ever had dipper’s flu
Yes/no (% yes) 131/419 (23.8) 42/101 (29.4) 0.21
Perceived sheep dip risk b Mean ±SD (n) 16.0±5.5 (598) 15.0±5.5 (153) 0.05
a Certificate of competence for handling pesticides; b Based upon scale used by Stephens et al, (1995a); max score =24
3.3 Health status
At the first visit most farmers (74.6%) reported that their health was either good or very good but a small proportion (3.9%) indicated that their health was either poor or very poor. The health status of the interviewed participants at the first visit is shown in Table 6. Over one half of farmers (54.7%) reported bone or joint disorders and one third respiratory problems (34.1%). Approximately one quarter of the farmers reported that they had had allergies, dipper’s flu, or infectious illnesses through working with animals. The mean total symptom score at visit 1 was 18.3 ±16.4 which was equivalent to approximately 7.5% of the maximum total score available (243 from 81 questions).
There was little difference in the frequency of self-reported ill health amongst those who did or did not complete the symptom diary. Health was poor or very poor in 3.1% of farmers who completed the diary and 4.5% in those who did not complete it (p=0.24). Those farmers who completed the symptom diary were more likely to have had an infectious illness through working with animals (31.0% vs 20.3% respectively; p<0.001) but less likely to have had an intestinal disorder (11.1% vs 16.4% p=0.05) or allergies (20.7% vs 37.3%, p=0.02: Table 6). Those who did or did not complete the symptom diary did not differ in their reporting of previously suffering from dipper’s flu. Those farmers who completed the symptom diary had a lower health questionnaire symptom score at visit 1 than those who did not: the difference in scores was small but statistically significant (16.4±15.3 vs 19.6±17.0; p=0.008).
There was little difference in the frequency of self-reported ill health amongst those who were visited once and those visited more than once. Health was poor or very poor in 4.4% of farmers who were visited once and 1.9 % in those visited more than once (p=0.34). Those farmers who had more than one visit were more likely to have had an infectious illness through working with animals (36.6% vs 22.1% p<0.001; Table 7). There was no difference in the proportion of farmers having one visit reporting having had dipper’s flu and those who had more than one visit. There was also no difference in the health questionnaire symptom score at visit 1 between those who had one or more than one visit (18.5 ±16.4 vs 17.3±4.3 respectively; p=0.45)
21

Table 6 Health status of interviewed participants who did and did not
complete a symptom diary
Variable Yes/No (% yes)
pInterviewed Symptom diary participant Completed Not completed
Bone or joint disorders 424/351 (54.7) 200/149 (57.3) 224/202 (52.6) 0.21 Bladder or kidney disorders 89/687 (11.4) 38/312 (10.9) 51/375 (12.0) 0.71 Skin disorders 162/615 (20.8) 64/285 (18.3) 98/330 (22.9) 0.14 Blood disorders 39/737 (5.0) 20/329 (5.7) 19/408 (4.4) 0.52 Gland disorders 72/704 (9.3) 30/321 (8.5) 42/383 (9.9) 0.61 Nervous system disorders 118/655 (15.3) 52/296 (14.9) 66/359 (15.5) 0.90 Intestinal disorders 109/668 (14.0) 39/311 (11.1) 70/357 (16.4) 0.05 Serious infectious illnesses 33/743 (4.3) 11/339 (3.1) 22/404 (5.2) 0.44 Allergies 192/577 (25.0) 72/276 (20.7) 120/301 (37.3) 0.02 Dipper’s flu 173/520 (25.0) 81/228 (26.2) 92/292 (24.0) 0.55 Infectious illnesses through working with animals
192/572 (25.1) 107/238 (31.0) 85/334 (20.3) <0.001
Heart or circulation problems 168/608 (21.6) 76/274 (27.7) 92/334 (19.2) 0.96 Respiratory problems 62/120 (34.1) 19/28 (40.4) 43/92 (31.9) 0.37
Table 7 Health status of interviewed participants who received one or more than one visit
Variable Yes/No (% yes)
pInterviewed Number of visits Participant One More than one
Bone or joint disorders 424/351 (54.7) 330/286 (53.6) 94/65 (59.1) 0.25 Bladder or kidney disorders 89/687 (11.4) 77/538 (12.5) 12/149 (7.5) 0.10 Skin disorders 162/615 (20.8) 126/491 (20.4) 36/124 (22.5) 0.64 Blood disorders 39/737 (5.0) 31/584 (5.0) 8/153 (5.0) 1.0 Gland disorders 72/704 (9.3) 57/559 (9.3) 15/145 (9.4) 1.0 Nervous system disorders 118/655 (15.3) 99/515 (16.1) 19/140 (11.9) 0.24 Intestinal disorders 109/668 (14.0) 89/527 (14.4) 20/141 (12.4) 0.60 Serious infectious illnesses 33/743 (4.3) 28/588 (4.5) 5/155 (3.1) 0.57 Allergies 192/577 (25.0) 161/448 (26.4) 31/129 (19.4) 0.08 Dipper’s flu 173/520 (25.0) 131/419 (23.8) 42/101 (29.4) 0.21 Infectious illnesses through working with animals
192/572 (25.1) 133/470 (22.1) 59/102 (36.6) <0.001
Heart or circulation problems 168/608 (21.6) 139/476 (22.6) 29/132 (18.0) 0.25 Respiratory problems 62/120 (34.1) 52/104 (33.3) 10/16 (38.5) 0.77
3.4 Exposures
Sheep treatment variables and practices of those farmers who completed the symptom diary are shown in Table 7 and vary between the different regions (data not shown). The number of sheep treated varied between 1 and 8200 (median 274), treatment lasted between 0.08 and 32 hours (median 4 hours) and lasted between 1 and 5 days (median one day).
22

Over one half of the farmers used pour-ons, with a further third using dips to treat their sheep (Table 8). Farmers reported using a range of different products with a similar proportion of farmers using pyrethroids or OPs (approximately 30%) and a smaller proportion using triazines (approximately 19%). Overall, approximately 30% of farmers used OPs and approximately 67% used non-OPs. It was not possible to characterise the products used by 15 farmers.
Table 8 Sheep treatment variables and practices of farmers
who completed the symptom diary
Variable Definition n Whole population (n=352)
Number of sheep treated Mean ± SD (n) Median (range)
328 502±826 (328) 274 (1-8200)
Number of days treating Mean ± SD (n) Median (range)
350 1.5±0.9 (350) 1 (1-5)
Number of hours treating Mean ± SD (n) Median (range)
321 5.5±5.2 (321) 4 (0.08-32)
Method used
Pour-on (%) Dip (%) Injection (%) Shower (%) Mixed methods (%) Unknown (%)
352
176 (50.9) 122 (35.3) 23 (6.6) 14 (4.0) 11 (3.2) 6 (1.7)
Product used
Pyrethroid (%) OP (%) Triazine (%) Avermectin (%) Other characterised (%) Mixed (%) Unknown (%)
352
108 (30.7) 98 (27.8) 68 (19.3) 24 (6.8) 17 (4.8) 22 (6.2) 15 (4.3)
Non-OP (%) OP (%) Unknown (%)
352 235 (66.8) 102 (29.0) 15 (4.3)
3.4.1 Endotoxin concentrations in sheep dip
The concentration of endotoxin was measured in sheep dip samples (before and after treatment) obtained from 31 different farmers. Matched (pre/post dip samples) were obtained from 25 farmers. The concentration of endotoxin in pre-treatment sheep dip varied between 1.2 and 75562 EU/ml and in post-dip concentrations ranged from 1170 to 98851 EU/ml. The endotoxin concentration was always higher in the sheep dip after treatment (Figure 3) with the percentage increase in endotoxin levels ranging from 77 to 1,278,000% after dipping.
23

EU
/ml
100000
10000
1000
100
10
1
ivi l
i i i
Ind dua farms
pre-d pping post-d pp ng
Figure 3 Endotoxin concentrations in sheep dip pre and post dipping
3.5 Levels of biomarkers in farmers
Blood samples were obtained at all three visits and urine samples were obtained from farmers only at visits 1 and 2. Cholinesterase activity was measured at visits 1 and 2, viral titres and visits 2 and 3 and pesticide metabolites at visits 1 and 2.
3.5.1 Urinary pesticide metabolites
Results from the analysis of urine samples collected at visit 2 are shown in Table 9. A range of pyrethroid and OP metabolites were present in the urine samples. Pyrethroid metabolites were not detected in between 67% and 95% of urine samples depending upon the metabolite itself, but were above the 90th percentile level (defined in a non-occupationally exposed group) in 2.7-19.6% of the samples. Urine samples were most likely to have detectable levels of 3-PBA (a metabolite of cypermethrin and deltamethrin) but most samples (42 out of 49) had levels below the 90th percentile level. In contrast, few samples had detectable levels of cDBVA (a metabolite of deltamethrin) but most levels (29/30) were above the 90th percentile.
OP metabolites were not detected in between 47% and 99% of the urine samples analysed depending upon the specific metabolite measured, but were above the 90th percentile in up to 24 % of samples. Few samples had detectable levels of DMDTP or DEDTP. Approximately 50% of samples had detectable levels of DMP but most (66 out of 78) had levels below the 90th
percentile level. With regard to the specific metabolites of diazinon, DEP was detected in approximately 30% of samples, with 23 out of 45 having levels greater than the 90th percentile. DETP was detected in approximately 25% of the samples with 35 out of 37 having levels greater than the 90th percentile (Table 9).
The proportion of farmers with urinary pesticide metabolites at visit 2 have been categorised into those with either no detectable urinary pyrethroid or OP metabolites (no exposure), only pyrethroid metabolites (and exposed to pyrethroids) , only OP metabolites (and hence exposed to OPs) or those with both urinary pyrethroid and OP metabolites (and hence exposed to pyrethoids and OPs). Restricting this analysis to those urine samples collected within 3 days of
24

last treatment and with a urinary creatinine level between 3-30mmol/l, detectable levels of urinary OP metabolites were found in 41 out of 43 farmers who reported the use of OPs (95.3%). Detectable levels of urinary pyrethroid metabolites were found in 25 out of 36 farmers (69.4%) who reported the use of pyrethroids. Detectable levels of OPs and pyrethroid metabolites were found in the urine of 12 (out of 19; 63.2%) of farmers who reported the use of avermectins and 75% (12 out of 16) farmers who reported the use of triazines only.
Table 9 Concentrations of urinary pesticide metabolites at visit 2a
Exposure n (%) Rangec
(µµµµmol/mol creatinine)
General Specific Metabolite Not detected/<90th
percentileb/>90thpercentileb
Pyrethroid
Cypermethrin & Deltamethrin
3PBA 92 (66.2)/41 (29.5)/6 (4.3) 0.24-10.18
Cypermethrin cDCVA 110 (79.1)/1 (0.7)/28 (20.1) 0.23-3.46 Cypermethrin tDCVA 122 (87.8)/3 (2.2)/14 (10.1) 0.32-14.71 Deltamethrin cDBVA 131 (94.2)/4 (2.9)/4 (2.9) 0.23-1.74
Metabolised to DMP 64 (46.0)/64 (46.0)/11 (7.9) 3.35-341.58 DMTP 84 (60.4)/30 (20.3)/25 (18.0) 3.83-65.92
Organophosphates methyl metabolites
DMDTP 136 (97.8)/-(0)/3 (2.2) 13.87-38.40
Metabolised to ethyl metabolites
DEP 94 (67.6)/22 (15.8)/23 (16.5) 2.46-83.88 DETP 103 (74.1)/2 (1.4)/34 (24.5) 3.51-134.76 DEDTP 137 (98.6)/2 (1.4)/- (0) 4.04,6.17
a Visit 2 occurred immediately after day after treatment; b 90th percentile levels in non-occupationally exposed population (data provided by HSL) and are the following: PBA <1.9µmol/mol creatinine; cDCVA 0.3µmol/mol creatinine; tDCVA 0.5 µmol/mol creatinine; cDBVA <0.4 µmol/mol creatinine; DMP 35 µmol/mol creatinine; DMTP 15 µmol/mol creatinine; DMDTP 3 µmol/mol creatinine; DEP 9 µmol/mol creatinine; DETP 4 µmol/mol creatinine; DEDTP 7 µmol/mol creatinine; c Of urine samples containing detectable levels
3.5.2 Butyrylcholinesterase
The percentage change in butyrylcholinesterase activity in matched blood samples collected before after the treatment of sheep is shown in Figure 4. The laboratory methods used in this study cannot identify falls in an individual’s butyrylcholinesterase of less than 15% with precision. Furthermore, if interindividual variation is taken into account, this threshold rises to 20.8% (Mason & Lewis, 1989). Using a 15% drop in cholinesterase activity as an indicator of significant OP absorption (Health and Safety Laboratory, 2005), 5 farmers (out of 100) had evidence of significant exposure and no farmers had falls of more than 20.8%. Of those 5 farmers, only 1 (20%) reported OP use during sheep treatment.
3.5.3 Infectious pathogens
The prevalence of antibodies in blood samples taken at visits 2 and 3 and the seroconversion rates in paired samples are shown in Table 10. Overall few samples had measureable titres, namely for Influenza A2, Influenza B2, RSV and Adenovirus. High rates of positive titres were found only for Toxoplasma but there was no evidence that the infection was acquired recently as all samples were IgG positive but IgM negative. Two farmers had evidence of infection to Adenovirus (i.e. seroconverted) and one of these farmers had also seroconverted for Influenza B2. One farmer seroconverted for RSV. Due to these low rates no analysis to examine associations between health outcomes has been carried out on infectious pathogens.
25

ili
ivi
0
% c
hang
e n
cho
nest
eras
e ac
tty
-40
-20
20
40
i li ivi a
a
l i i i i
a
b c d e f g
h
i
/ a /h
1/ b 0/ 0/1/ c 2/ d 1/0/ 0/ 0/0/ 0/ 0/0/ 0/ 0/1/ e 1/ f 1/0/ 2/ g 2/0/ 0/ 0/
/ i 4/ i 0/0/ - -0/ 0/ 0/
ivi l
0
Figure 4 Percentage Change n cho nesterase act ty after treatment of sheep
100 x [visit 2 cholinesterase activity (post treatment) – visit 1 cholinesterase activity (pre-treatment ) ] visit 1 cholinesterase activity (pre-treatment)
Table 10 Preva ence of ant bod es at v sit 2 and v sit 3
All titres are from different farmers except for one farmer for which there was a titre for influenza B2 at visits 2 and 3 (64 on both occasions) and a titre of 32 for adenovirus at visit 3. Titres are 32; 64; 32, 64; 32; 128; 32,32;
Seroconversion based upon analysis of paired samples: samples showed at least a four fold increase in titre between visits 2 and 3 were considered to have seroconverted. No single sample had a titre of 256 or more which might indicate recent infection; Toxoplasma samples were all IgG positive but IgM negative indicating that the infection was not acquired recently.
Positive Negative (% positive)Test
Visit 2 Visit 3 Seroconversion total (% conversion)
Influenza A2 144 (0.7) 137 (0) 127 (0) Influenza B2 144 (0.7) 135 (1.5) 127 (0.8) Chlamydia group 145 (0) 137 (0) 127 (0) Mycoplasma pneumoniae 145 (0) 137 (0) 127 (0) Q fever 145 (0) 137 (0) 127 (0) RSV 144 (0.7) 137 (0.7) 127 (0.8) Adenovirus 145 (0) 125 (1.6) 127 (1.6) Leptospira 145 (0) 130 (0) 120 (0) Toxoplasma 13 20 (65.0) 7 (57.1) 10 (0) Hydatid 9 (0) Paul Bunnell screen 147 (0) 136 (0) 129 (0)
Ind dua Farmers
20 40 60 80 100
26

4 Symptom Diary
4.1 Description of symptom complexes
On the day before treatment, 7.3% of farmers reported that they felt ill. Following treatment the proportion of farmers complaining of feeling generally ill was approximately 3% on days 1, 2 and 3 and lower, but not significantly so, later in the week (Figure 5). Hence there was no evidence that there was an increase in proportion of farmers complaining of feeling ill after treatment.
The proportion of farmers complaining of the other 9 specific diary symptom complexes up to seven days after the day of treatment is shown in Figure 5. The proportion of farmers complaining of these other nine specific symptom complexes all showed variation during the week and in comparison with day 7 significant variations were detected especially early in the week (Figure 5). The highest proportion of farmers complaining of any of these symptom complexes was highest on day 2: the most prevalent symptom complex was pain in muscles or joints, with the lowest being sweaty, shivery or feverish.
The proportion of farmers feeling unusually tired on day 2 only was significantly different from the proportion on day 7 (12.4% vs 7.9; p<0.05). The proportion of farmers complaining of headaches was on days 1, 2 and 3 significantly higher than that found on day 7: on day 2 13.3% complained of headaches. The proportion of farmers reporting being sweaty, shivery or feverish was significantly higher on days 2, 3 and 5: on day 2 this proportion was 5.5%. The proportion of farmers complaining of pain in muscles or joints was significantly higher on days 2,3, 4 and 5: on day 2 the proportion was 17.3%. The proportion of farmers complaining of nasal symptoms was significantly higher on days 1, 2, 3 and 4: on day 2 the proportion was 15.0%. The proportion of farmers complaining of a hoarse voice or sore throat was significantly higher on days 1,2,3 and 4 with the proportion on day 2 being 11.8%. Cough, shortness of breath or wheeze was significantly higher on days 2, 3 and 4: on day 2 the proportion of farmers with this symptom was 9.2 %. Nausea and gastrointestinal symptoms were significantly higher on days 2, 3 and 4 but only 6.6% of farmers complained of this problem on day 2. Eye irritation was higher on days 1 2 and 3: on day 2 the proportion of farmers with this complaint was 7.2% (Figure 5).
Figure 6 shows how the incidence of new symptom complexes varies over the seven days following treatment. In general new cases associated with any symptom complex were found earlier in the week rather than later. The proportion of new cases of feeling unusually tired was 9.2% on day 1 and 6.9% of day 2, both significantly higher than that found on day 7 (2.7%). The proportion of new cases of headache was also significantly higher on days 1 (11.0%) and 2 (8.7%) than later in the week. Similarly the proportion of new cases of farmers with pain in their muscles or joints (13.0%, 6.5%), or nasal symptoms (10.1%, 7.8%) or a hoarse voice/sore throat (11.0%, 4.5%) were significantly higher on days 1 and 2 respectively. The proportion of new cases of farmers with a cough (7.2%) or eye irritation (8.4%) was significantly higher only on day 1. There was no significant variation in the proportion of new cases of farmers feeling generally ill or sweaty/shivery/feverish or with nausea over the week.
The proportion of farmers having one or more than one symptom complexes is shown in Figure 7. There was evidence that the proportion of farmers complaining of one or more symptom complexes was higher earlier in the week than later in the week. On day 7 78.7% of farmers did not report a single symptom complex whereas on day 2 this proportion was 57.1%. Of those who complain of symptom complexes between 9 and 20% (depending on the day) complained of only one symptom. Those complaining of two or more symptom complexes varied between
27

25
li lly illFee ng genera
25
20 20
15 15% %
10 10
5 5
0 0 0 1 2 3 4 5 6 7 8 0 1 2 3 4 5 6 7
li ll i
*
Fee ng unusua y t red
8
Day after treatment Day after treatment
25
* *
Headache
**
25
20 20
15 15% %
10 10
5 5
0
i ild
* *
Sweaty,sh very,fever sh, hot or co
**
0 1 2 3 4 5 6 7 8
Day after treatment
0 0 1 2 3 4 5 6 7 8
Day after treatment
25
20
15%
10
5
0
Pain in muscles or joints ***
** * *
25
20
15%
10
5
0
li i
*
Runny,stuffy,b ocked or rr tated nose
***
** **
0 1 2 3 4 5 6 7 8 0 1 2 3 4 5 6 7 8
Day after treatment Day after treatment
iHoarse vo ce or sore throat
*** ***
**
** **
2525
2020
1515%%
1010
55
*
Cough,shortness of breath or wheeze
** **
0 1 2 3 4 5 6 7 8
Day after treatment
0 0 1 2 3 4 5 6 7 8
Day after treatment
0
25
iiti i l i i
*
Nausea, poor appet te, vom ng, abdom na
pa n or d arrhoea
** **
25
20 20
15 15% %
10 10
5 5
0
i i iEye rr tat on
*** **
**
0 1 2 3 4 5 6 7 8
Day after treatment
0 0 1 2 3 4 5 6 7 8
Day after treatment
Figure 5Prevalence of specific diary symptom complexes by day after treatment
Symptom Prevalence on days 1-6 compared to that on day 7. * p<0.05, **p<0.01, ***p<0.001
28

11.7% (on day 7) to 26.5% (on day 2). Only two farmers, on day 3 and day 7, reported all ten symptom complexes.
0 0
2 4
6 8
1
2 3
4 5
6 7
%
No of symptoms
Day
20
40
60
80
100
10
Figure 6 Percentage of farmers reporting diary symptom complexes by day after treatment
4.2 Categorisation of diary symptom complexes
The number of farmers with dipper’s flu based upon different definitions including those derived a priori for this study and those from various sources is shown in Table 11. There were few farmers with all ten symptom complexes rendering detailed analysis impossible. There were significantly higher numbers of farmers complaining of either 1 or more symptom complexes or 2 or more symptom complexes on days 1, 2, 3, 4 and 5 when compared to the numbers reporting on day 7. Figure 8 shows how the proportion of farmers who reported either no symptom complexes, one symptom complex or two or more symptom complexes varied over the week and again indicates that there was a general increase in symptom reporting on day 2.
29

(
i i i i i l i i initidi l i a
a b c
j d
j e
j
b 0/ 0/ 1/ 0/ 0/ 0/ 1/
≥b / / / / / / /
≥b / / / / / / /
c 3/ 7/ 7/ 3/ 2/ 2/ 3/
d 0/ 0/ 1/ 1/
0/1/ 2/
e 4/ 3/ 4/ 3/ 2/ 0/ 3/
There were few farmers who had all symptom complexes corresponding to definitions of dipper’s flu defined a priori from different sources including a textbook (Baxter et al, 2000) , a research report (Stephens at al, 1995a) and web-based definition DoctorMyhill.co.uk, 2006). Furthermore there was no evidence that the numbers of farmers reporting these constellations of symptoms varied over the week (Table 11).
Table 11 Var at on n number of farmers w th d pper’s f u based upon a pr or def ons using
ary symptom comp exes w th day after treatment
Dipper’s flu defined in appendix 37; symptom complexes from the symptom diary ; headache; pain in muscles or oints; runny, stuffy, blocked or irritated nose; headache; sweaty, shivery, feverish, hot or cold; pain in muscles or oints; nausea, poor appetite, vomiting, abdominal pain or diarrhoea; feeling generally ill, feeling unusually tired; headache; pain in muscles or oints. Significantly different *p<0.05, ** p<0.01, *** p<0.001
Number with ill-health (%) Dipper’s flu definition Day 1 Day 2 Day 3 Day 4 Day 5 Day 6 Day 7
All 10 Symptoms
347 (0)
347 (0)
348 (0.3)
347 (0)
345 (0)
344 (0)
343 (0.3)
2 symptoms67 280 (19.3)**
92 255 (26.5)***
72 276 (20.7)***
64 283 (18.4)***
57 288 (16.5)**
43 301 (12.5)
40 302 (11.7)
1 symptom128 219 (36.9) ***
149 198 (42.9) ***
128 220 (36.8)***
115 232 (33.4)***
93 252 (27.0)**
83 261 (24.1)
73 269 (21.3)
Textbook344
(0.9) 344
(2.0) 341
(2.0) 344
(0.9) 343
(0.6) 342
(0.6) 339
(0.9) Research Report
347 (0)
347 (0)
348 (0.3)
347 (0.3)
345 (0) 344
(0.3) 342
(0.6)
Web-based343
(1.2) 344
(0.9) 344
(1.1) 345
(0.6) 343
(0.6) 344
(0) 339
(0.9)
100
80
60 %
40
20
0 1 2 3 4 5 6 7
Day after treatment
2 or more symptoms 1 symptom 0 symptoms
Figure 7 Percentage of farmers reporting two or more diary symptom complexes, one symptom
complex or no symptom complex by day after treatment
30

Given the lack of farmers fulfilling any a priori dipper’s flu definition, further analysis of this data was carried out using three groups of farmers: namely those with either no symptom complex, one symptom complex, or two or more symptom complexes on any given day. Similar results were obtained if two groups (those with no symptom complexes or with one or more symptom complexes) were used (data not shown).
4.2.1 Associations between diary symptom complexes and demographic variables
The proportion of farmers with none, one, or two or more symptom complexes did not vary significantly with region, gender, age, current smoking or drinking status and whether the farmer held a certificate of competence (or not) or was a contract dipper (or not) (Table 12). However there were significant differences in these proportions in strata defined by the farmer’s self-reported health status at visit 1, whether they had ever suffered from dipper’s flu and attitudes to sheep dip toxicity (Table 12).
In particular, farmers who reported their heath status at visit 1 as being poor or very poor were more likely to have two or more symptom complexes than farmers whose health at visit 1 was average or good/very good (e.g. 72.7% vs 14.6% on day 1) over all the seven days of the diary. Farmers who reported as having suffered previously from dipper’s flu were more likely to report two or more symptom complexes again (e.g. 38.5% vs 11.5% on day 1) throughout the seven diary days (Table 12).
Farmers were also categorised on their attitude to sheep dip toxicity. Those farmers who perceived a high risk were more likely to report two or more diary symptom complexes throughout the seven day diary than those farmers reporting one or no symptom complexes (e.g. 30.7% vs 10.3% on day 1; Table 12).
4.2.2 Associations between diary symptom complexes and exposures
There was no evidence that the proportion of farmers with none, one, or two or more diary symptom complexes varied with the treatment method over the diary week (Table 13). Similar proportions of farmers reporting two or more symptom complexes were observed in those farmers using either injections, dips or pour-ons as the method of treatment. On day 1, approximately 21% of farmers who dipped reported two or more symptom complexes as compared to approximately 20% who used pour-ons and 18% who injected (Table 13).
There was however, evidence of a significant association on days 1, 3 and 5 between the type of product used and the proportions of farmers with none, one or two or more diary symptom complexes (Table 13). In particular farmers using pyrethroids were more likely to report 2 or more symptom complexes than farmers using the other products. On day 3 29.9% of farmers who used pyrethroids reported two or more symptom complexes in comparison with 20.8% who used avermectins, 13.7% OPs and 13.2% triazines. There was little evidence to indicate that farmers using OPs were more likely to report symptom complexes than farmers using other products over the seven diary days (Figure 9).
4.2.3 Associations between diary symptom complexes and endotoxin concentrations in sheep dip
There were no associations between endotoxin concentrations in sheep dip at the end of dipping and whether the farmer reported none, one, or two or more diary symptom complexes on any of the seven diary days (Table 14).
31
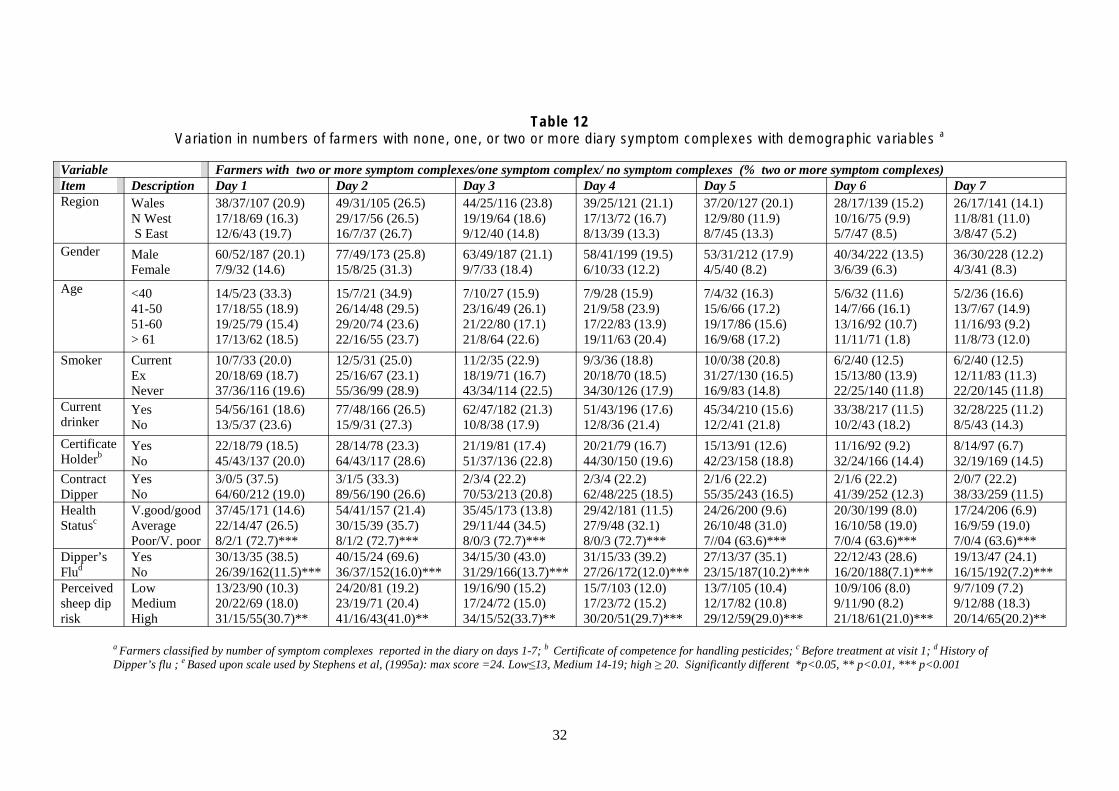
Table 12 aVariation in numbers of farmers with none, one, or two or more diary symptom complexes with demographic variables
Variable Farmers with two or more symptom complexes/one symptom complex/ no symptom complexes (% two or more symptom complexes) Item Description Day 1 Day 2 Day 3 Day 4 Day 5 Day 6 Day 7 Region Wales 38/37/107 (20.9) 49/31/105 (26.5) 44/25/116 (23.8) 39/25/121 (21.1) 37/20/127 (20.1) 28/17/139 (15.2) 26/17/141 (14.1)
N West 17/18/69 (16.3) 29/17/56 (26.5) 19/19/64 (18.6) 17/13/72 (16.7) 12/9/80 (11.9) 10/16/75 (9.9) 11/8/81 (11.0) S East 12/6/43 (19.7) 16/7/37 (26.7) 9/12/40 (14.8) 8/13/39 (13.3) 8/7/45 (13.3) 5/7/47 (8.5) 3/8/47 (5.2)
Gender Male Female
60/52/187 (20.1) 7/9/32 (14.6)
77/49/173 (25.8) 15/8/25 (31.3)
63/49/187 (21.1) 9/7/33 (18.4)
58/41/199 (19.5) 6/10/33 (12.2)
53/31/212 (17.9) 4/5/40 (8.2)
40/34/222 (13.5) 3/6/39 (6.3)
36/30/228 (12.2) 4/3/41 (8.3)
Age <40 41-50 51-60 > 61
14/5/23 (33.3) 17/18/55 (18.9) 19/25/79 (15.4) 17/13/62 (18.5)
15/7/21 (34.9) 26/14/48 (29.5) 29/20/74 (23.6) 22/16/55 (23.7)
7/10/27 (15.9) 23/16/49 (26.1) 21/22/80 (17.1) 21/8/64 (22.6)
7/9/28 (15.9) 21/9/58 (23.9) 17/22/83 (13.9) 19/11/63 (20.4)
7/4/32 (16.3) 15/6/66 (17.2) 19/17/86 (15.6) 16/9/68 (17.2)
5/6/32 (11.6) 14/7/66 (16.1) 13/16/92 (10.7) 11/11/71 (1.8)
5/2/36 (16.6) 13/7/67 (14.9) 11/16/93 (9.2) 11/8/73 (12.0)
Smoker Current 10/7/33 (20.0) 12/5/31 (25.0) 11/2/35 (22.9) 9/3/36 (18.8) 10/0/38 (20.8) 6/2/40 (12.5) 6/2/40 (12.5) Ex 20/18/69 (18.7) 25/16/67 (23.1) 18/19/71 (16.7) 20/18/70 (18.5) 31/27/130 (16.5) 15/13/80 (13.9) 12/11/83 (11.3) Never 37/36/116 (19.6) 55/36/99 (28.9) 43/34/114 (22.5) 34/30/126 (17.9) 16/9/83 (14.8) 22/25/140 (11.8) 22/20/145 (11.8)
Current drinker
Yes No
54/56/161 (18.6) 13/5/37 (23.6)
77/48/166 (26.5) 15/9/31 (27.3)
62/47/182 (21.3) 10/8/38 (17.9)
51/43/196 (17.6) 12/8/36 (21.4)
45/34/210 (15.6) 12/2/41 (21.8)
33/38/217 (11.5) 10/2/43 (18.2)
32/28/225 (11.2) 8/5/43 (14.3)
Certificate Holderb
Yes No
22/18/79 (18.5) 45/43/137 (20.0)
28/14/78 (23.3) 64/43/117 (28.6)
21/19/81 (17.4) 51/37/136 (22.8)
20/21/79 (16.7) 44/30/150 (19.6)
15/13/91 (12.6) 42/23/158 (18.8)
11/16/92 (9.2) 32/24/166 (14.4)
8/14/97 (6.7) 32/19/169 (14.5)
Contract Yes 3/0/5 (37.5) 3/1/5 (33.3) 2/3/4 (22.2) 2/3/4 (22.2) 2/1/6 (22.2) 2/1/6 (22.2) 2/0/7 (22.2) Dipper No 64/60/212 (19.0) 89/56/190 (26.6) 70/53/213 (20.8) 62/48/225 (18.5) 55/35/243 (16.5) 41/39/252 (12.3) 38/33/259 (11.5) Health V.good/good 37/45/171 (14.6) 54/41/157 (21.4) 35/45/173 (13.8) 29/42/181 (11.5) 24/26/200 (9.6) 20/30/199 (8.0) 17/24/206 (6.9) Statusc Average 22/14/47 (26.5) 30/15/39 (35.7) 29/11/44 (34.5) 27/9/48 (32.1) 26/10/48 (31.0) 16/10/58 (19.0) 16/9/59 (19.0)
Poor/V. poor 8/2/1 (72.7)*** 8/1/2 (72.7)*** 8/0/3 (72.7)*** 8/0/3 (72.7)*** 7//04 (63.6)*** 7/0/4 (63.6)*** 7/0/4 (63.6)*** Dipper’s Yes 30/13/35 (38.5) 40/15/24 (69.6) 34/15/30 (43.0) 31/15/33 (39.2) 27/13/37 (35.1) 22/12/43 (28.6) 19/13/47 (24.1) Flud No 26/39/162(11.5)*** 36/37/152(16.0)*** 31/29/166(13.7)*** 27/26/172(12.0)*** 23/15/187(10.2)*** 16/20/188(7.1)*** 16/15/192(7.2)*** Perceived Low 13/23/90 (10.3) 24/20/81 (19.2) 19/16/90 (15.2) 15/7/103 (12.0) 13/7/105 (10.4) 10/9/106 (8.0) 9/7/109 (7.2) sheep dip Medium 20/22/69 (18.0) 23/19/71 (20.4) 17/24/72 (15.0) 17/23/72 (15.2) 12/17/82 (10.8) 9/11/90 (8.2) 9/12/88 (18.3) risk High 31/15/55(30.7)** 41/16/43(41.0)** 34/15/52(33.7)** 30/20/51(29.7)*** 29/12/59(29.0)*** 21/18/61(21.0)*** 20/14/65(20.2)**
a Farmers classified by number of symptom complexes reported in the diary on days 1-7; b Certificate of competence for handling pesticides; c Before treatment at visit 1; d History of Dipper’s flu ; e Based upon scale used by Stephens et al, (1995a): max score =24. Low≤13, Medium 14-19; high ≥ 20. Significantly different *p<0.05, ** p<0.01, *** p<0.001
32

Table 13 Variation in numbers of farmers with none, one, or two or more diary symptom complexes with self-reported exposuresa
Variable Farmers with two or more symptoms/one symptom/ no symptoms (% two or more symptoms ) Item Description Day 1 Day 2 Day 3 Day 4 Day 5 Day 6 Day 7 Treatment Injection 4/2/16 (18.2) 6/4/13 (26.1) 4/3/16 (17.4) 3/1/19 (13.0) 4/2/17 (17.4) 2/4/17 (8.7) 3/1/19 (13.0) method Dip
Pour-on 25/26/70 (20.7) 34/26/114 (19.5)
31/25/64 (25.8) 50/22/102 (28.7)
19/25/76 (15.8) 43/23/109 (24.6)
19/19/82 (15.8) 34/28/112 (19.5)
14/10/94 (11.9) 33/22/119 (19.0)
12/14/92 (10.2) 25/17/131 (14.5)
12/9/97 (10.2) 20/19/132 (11.7)
Shower 1/3/10 (7.1) 2/2/10 (14.3) 2/2/10 (14.3) 3/2/9 (21.4) 2/1/11 (14.3) 1/5/8 (7.1) 1/3/10 (7.1) Mixed 2/3/6 (18.2) 2/4/5 (18.2) 3/3/5 (27.3) 3/1/7 (27.3) 3/0/8 (27.3) 3/0/8 (27.3) 3/1/7 (27.3)
General Non-OP 43/40/148 (18.6) 63/36/134 (27.0) 51/33/150 (21.8) 42/35156 (18.0) 41/26/165 (17.7) 31/28/172 (13.4) 27/26/177 (11.7) Product OP 20/18/63 (19.8) 25/19/55 (25.3) 14/21/64 (14.1) 16/15/68 (16.2) 10/7/81 (10.2) 9/10/79 (9.2) 11/6/80 (11.3)
Unknown 4/3/8 (26.7) 4/2/9 (26.7) 7/2/6 (46.7) 6/1/8 (40.0) 6/3/6 (40.0)*** 3/2/10 (20.0) 2/1/12 (13.3) Specific product
Avermectin OP
5/1/16 (22.7) 17/17/63 (17.5)
7/3/14 (29.2) 22/19/54 (23.2)
5/3/16 (20.8) 13/20/62 (13.7)
4/1/19 (16.7) 15/13/67 (15.8)
5/2/17 (20.8) 9/7/78 (9.6)
4/3/17 (12.5) 8/9/77 (8.5)
4/1/19 (16.7) 10/6/77 (10.8)
Pyrethroid 24/26/58 (22.2) 37/19/51 (34.6) 32/17/58 (29.9) 26/20/61 (24.3) 22/18/66 (20.8) 17/18/70 (16.2) 14/13/79 (13.2) Triazine 9/8/50 (13.4) 13/6/49 (19.1) 9/6/53 (13.2)* 8/9/51 (11.8) 7/4/57 (10.3)* 5/4/59 (7.4) 5/7/54 (7.6)
a Farmers classified by number of symptom complexes reported in the diary on days 1-7 ; Significantly different *p<0.05, **p<0.01, ***p <0.001
33

80
100
pDay 1
=0.09
100
pDay 2
=0.06
100
pDay 3
=0.01
100
60 60 60 60 % % % %
40 40 40 40
20 20 20 20
0 0 0
pDay 4 =0.12
2 or more 1 0 2 or more 1 0Number of symptoms Number of symptoms
0 2 or more 1 0 2 or more 1 0
Number of symptoms Number of symptoms
80 80 80
in
id i i
p
%
0
p
%
0
p
%
0
AvermectOrganophosphate PyrethroTr az ne
Day 5 =0.01
20
40
60
80
100 Day 6
=0.07
20
40
60
80
100 Day 7
=0.56
20
40
60
80
100
2 or more 1 0 2 or more 1 0 2 or more 1 0 Number of symptoms Number of symptoms Number of symptoms
Figure 8 Percentage of farmers reporting two or more diary symptom complexes, one symptom complex or no symptom complexes by product
used and by day after treatment
34

Table 14 Endotoxin concentrations in sheep dip from farmers with none, one, or two or more
adiary symptom complexes
Day Mean (± sd) endotoxin concentration in EU/ml ( n) > 2 complexes 1 complex 0 complexes
1 30595±17497 (4) 19442±13624 (9) 31113±21504 (16) 2 31744±31072 (8) 22747±15048 (11) 29949±9128 (9) 3 31142±14662 (4) 25851±15200 (7) 27540±22406 (17) 4 32389±12292 (4) 25570±16678 (6) 27263±21926 (18) 5 29131±12766 (3) 14008±10371 (2) 28478±21034 (22) 6 25448±12948 (3) 15277±12223 (4) 30223±21245 (20) 7 37725±40849 (4) 26606±13737 (4) 24720±14195 (19)
aFarmers classified by number of symptom complexes reported in the diary on that particular day No significant differences in endotoxin concentration with symptom reporting
4.2.4 Associations between diary symptom complexes and urinary pesticide metabolites
There were no significant associations between farmers who reported none, one, or two or more diary symptom complexes and the concentration of urinary pyrethroid metabolite concentrations (Table 15).
Significant associations were detected between farmers reporting symptoms and with the concentration of urinary OP metabolites on day 1 (with DEDTP), day 4 (with DETP), day 5 (with DMTP) and day 6 (with DEDTP; Table 16). However, the associations with DEDTP were based on small numbers (only 2 with detectable levels) and those associations with DETP and DMTP did not provide any evidence of a dose-response. For example, on day 4, approximately 9% of farmers with DETP levels higher than the 90th percentile (as defined by a non-occupationally exposed population) but 23% of farmers with no detectable DETP reported two or more symptoms.
There was also little evidence of an association between total concentrations of urinary OP metabolites either expressed as methyl or ethyl metabolites, metabolites arising from diazinon or the sum of methyl and ethyl metabolites (Table 17). There was a significant association with the sum of methyl and ethyl metabolites and symptom reporting on day 5 only. However, there was again no evidence of a dose–response relationship, with 22.2% of farmers with total OP concentrations greater than the 90th percentile reporting two or more symptoms compared to 33% of those with no detectable OP metabolites.
In those farmers categorised by the presence or absence of pyrethroid or OP urinary metabolites, there was little evidence of increased reporting in those farmers with urinary pesticide metabolites (Table 17). Indeed those farmers with urinary OP metabolites tended to have lower reporting than those farmers with no metabolites or pyrethroid metabolites or both pyrethroid and OP metabolites in their urine. On day 5, there was a significant difference in reporting rates with 45.5% of those farmers with only urinary pyrethroid metabolites reported having two or more symptoms as compared to 29% of those with no urinary pesticide metabolites, 6% of those farmers with only OP urinary metabolites and 16.7% with both pyrethroid and OP metabolites.
35

Table 15 Urinary pyrethroid metabolite concentrations in farmers with none, one, or two or more diary symptom complexesa,b
Urinary pyrethroid Farmers with two or more symptoms/one symptom/ no symptoms (% two or more symptoms) Metabolite Levelc Day 1 Day 2 Day 3 Day 4 Day 5 Day 6 Day 7
PBA not detected <90th percentile >90th percentile
21/17/51 (23.6) 9/4/28 (22.0) 2/1/3 (33.3)
28/20/42 (31.1) 13/4/24 (31.7) 3/0/3 (50.0)
20/11/59 (22.2) 8/8/25 (19.5) 1/1/4 (16.7)
17/12/61 (18.9) 7/4/30 (17.1) 2/0/4 (33.3)
12/13/64 (13.5) 9/2/30 (22.0) 2/0/4 (33.3)
9/10/70 (10.1) 6/6/29 (14.6) 2/0/4 (33.3)
10/9/71 (11.1) 7/5/29 (17.1) 0/3/3 (0) *
cDCVA not detected <90th percentile
>90th percentile
26/19/62 (24.3) 0/0/1 (0) 6/3/19 (21.4)
32/22/54 (29.6) 0/0/1 (0) 12/2/14 (42.9)
21/15/72 (19.4) 0/0/1 (0) 8/5/15 (28.6)
18/14/76 (16.7) 0/0/1 (0) 8/2/18 (28.6)
18/13/76 (16.8) 0/0/1 (0) 5/2/21 (17.9)
14/13/80 (13.1) 0/0/1 (0) 3/3/22 (10.7)
15/12/81 (13.9) 0/0/1 (0) 2/5/21 (7.1)
tDCVA not detected <90th percentile >90th percentile
27/22/70 (22.7) 1/0/2 (33.3) 4/0/10 (28.6)
41/23/56 (34.2) 0/0/3 (0) 3/1/10 (21.4)
27/18/75 (22.5) 0/1/2 (0) 2/1/11 (14.3)
23/15/82 (19.2) 0/0/3 (0) 3/1/10 (21.4)
19/15/85 (16.0) 0/0/3 (0) 4/0/10 (28.6)
15/15/89 (12.6) 0/0/3 (0) 2/1/10 (14.3)
17/13/90 (14.2) 0/0/3 (0) 0/4/10 (0)
cDBVA not detected <90th percentile >90th percentile
29/21/78 (22.7) 1/0/3 (25.0) 2/1/1 (50.0)
40/23/66 (31.0) 1/1/2 (25.0) 3/0/1 (75.0)
26/18/85 (20.2) 1/1/2 (25.0) 2/1/1 (50.0)
22/16/91 (17.1) 2/0/2 (60.0) 2/0/2 (50.0)
20/15/93 (15.6) 1/0/3 (25.0) 2/0/2 (50.0)
14/15/99 (10.9) 1/0/3 (25.0) 2/1/1 (50.0)
14/16/99 (10.9) 1/0/3 (25.0) 2/1/1 (50.0)
a Farmers classified by number of symptoms reported in the diary on that particular day; b Urine samples restricted to those collected at visit 2 within three days of last treatment and with a creatinine level between 3 and 30mmol/l; c 90th percentile levels in non-occupationally exposed population (data provided by HSL) and are the following PBA <1.9µmol/mol
*creatinine; cDCVA 0.3µmol/mol creatinine; tDCVA 0.5 µmol/mol creatinine; cDBVA <0.4 µmol/mol creatinine; Significantly different p<0.05
36

Table 16 Urinary OP metabolite concentrations in farmers with none, one, or two or more diary symptom complexes a,b
Urinary OP Farmers with two or more symptoms/one symptom/ no symptoms (% two or more symptoms) Metabolite Levelc Day 1 Day 2 Day 3 Day 4 Day 5 Day 6 Day 7
DMP not detected <90th percentile >90th percentile
21/9/32 (33.9) 10/10/43 (15.9) 1/3/7 (9.1)
25/11/28 (39.1) 15/10/37 (24.2) 4/3/4 (36.4)
20/9/35 (31.3) 7/9/46 (11.3) 2/2/7 (18.2)
17/6/41 (26.6) 7/8/47 (11.3) 2/2/7 (18.2)
16/6/42 (25.0) 5/7/50 (8.1) 2/2/6 (20.0)
10/5/49 (15.6) 5/9/48 (8.1) 2/2/6 (20.0)
8/8/48 (12.5) 7/6/49 (11.3) 2/3/6 (18.2)
DMTP not detected <90th percentile >90th percentile
18/14/51 (21.7) 8/4/17 (27.6) 6/4/14 (25.0)
26/18/39 (31.3) 10/3/17 (33.3) 8/3/13 (33.3)
20/11/52 (24.1) 5/4/21 (16.7) 4/5/15 (16.7)
19/12/52 (22.9) 3/4/23 (10.0) 4/0/20 (16.7)
17/12/53 (20.7) 2/2/26 (6.7) 4/1/19 (16.7)
16/9/60 (15.9) 0/4/26 (0) 4/3/17 (16.7)
12/11/60 (14.5) 1/3/26 (3.3) 4/3/17 (16.7)
DMDTP not detected <90th percentile >90th percentile
31/21/81 (23.3) -1/1/1 (33.3)
42/24/68 (31.3) -2/0/1 (66.7)
28/20/86 (20.9) -1/0/2 (33.3)
26/16/92 (19.4) -0/0/3 (0.0)
23/15/95 (17.3) -0/0/3 (0)
17/15/101 (12.8) -0/1/2 (0)
16/17/101 (11.9) -1/0/2 (33.3)
DEP not detected <90th percentile
>90th percentile
26/12/54 (28.3) 1/6/15 (4.5) 5/4/13 (22.7)
35/13/45 (37.6) 3/6/13 (13.6) 6/5/11 (27.4)
23/13/57 (24.7) 2/5/15 (9.1) 4/2/16 (18.2)
22/13/58 (23.7) 1/1/20 (4.5) 3/2/17 (13.6)
19/12/62 (20.4) 1/2/19 (4.5) 3/1/17 (14.3)
15/9/69 (16.1) 1/3/18 (4.5) 1/4/16 (4.8)
14/11/68 (15.1) 2/2/18 (9.1) 1/4/17 (4.5)
DETP not detected <90th percentile
>90th percentile
26/14/61 (25.7) 1/1/0 (50.0) 5/7/21 (15.2)
34/17/51 (33.3) 1/1/0 (50.0) 9/6/18 (27.3)
24/16/62 (23.5) 1/0/1 (50.0) 4/4/25 (12.1)
22/13/67 (21.6) 1/1/0 (50.0) 3/2/28 (9.1)*
20/13/68 (19.8) 1/0/1 (50.0) 2/2/29 (6.1)
14/11/76 (13.9) 1/0/1 (50.0) 2/5/26 (6.1)
13/14/75 (12.7) 1/0/1 (50.0) 3/3/27 (9.1)
DEDTP not detected <90th percentile >90th percentile
30/22/82 (22.4) 2/0/0 (100.0)* -
42/24/69 (31.1) 2/0/0 (100.0) -
29/19/87 (21.5) 0/1/1 (0.0) -
26/15/94 (19.3) 0/1/1 (0.0) -
23/15/96 (17.2) 0/0/2 (0) -
17/14/103 (12.7) 0/2/0 (0.0)** -
16/17/102 (11.9) 1/0/1 (50.0) -
a Farmers classified by number of symptom complexes reported in the diary on that particular day; b Urine samples restricted to those collected at visit 2 within three days of last treatment and with a creatinine level between 3 and 30mmol/l; c 90th percentile levels in non-occupationally exposed population (data provided by HSL) and are the following; DMP 35 µmol/mol creatinine; DMTP 15 µmol/mol creatinine; DMDTP 3 µmol/mol creatinine; DEP 9 µmol/mol creatinine; DETP 4 µmol/mol creatinine; DEDTP 7 µmol/mol creatinine; Significantly different * p<0.05; ** p<0.01
37

Table 17 Total urinary OP & pyrethroid metabolite concentrations in farmers with none, one, or two or more diary symptom complexesa,b
Total urinary OPs Farmers with two or more symptoms/one symptom/ no symptoms (% two or more symptoms) Metabolites Levelc Day 1 Day 2 Day 3 Day 4 Day 5 Day 6 Day 7
Methyl not detected 13/5/22 (32.5) 16/9/16 (39.0) 14/6/21 (34.1) 13/4/24 (31.7) 13/5/23 (31.7) 8/3/30 (19.5) 6/5/30 (14.6) (DMP+DMTP+ <90th percentile 17/15/52 (20.2) 24/13/47 (28.6) 14/12/58 (16.7) 12/10/62 (14.3) 8/8/67 (9.6) 7/12/64 (8.4) 9/10/65 (10.7) DMDTP) >90th percentile 2/2/8 (16.7) 4/2/6 (33.3) 1/2/9 (8.3) 1/2/9 (8.3) 2/2/8 (16.7)* 2/1/9 (16.7) 2/2/8 (16.7)
Ethyl not detected 22/9/48 (27.8) 30/10/40 (37.5) 21/11/48 (26.3) 19/11/50 (23.8) 17/11/52 (21.3) 13/7/60 (16.3) 11/11/58 (13.8) (DEP+DETP+ <90th percentile 7/9/22 (18.4) 9/10/19 (23.7) 6/7/25 (15.8) 6/3/29 (15.8) 5/3/29 (13.5) 3/5/29 (8.1) 5/3/30 (13.2) DEDTP) >90th percentile 3/4/12 (15.8) 5/4/10 (26.3) 2/2/15 (10.5) 1/2/16 (5.3) 1/1/17 (5.3) 1/4/14 (5.3) 1/3/15 (5.3)
Diazinon (DEP+DETP)
not detected <90th percentile >90th percentile
22/9/48 (27.8) 6/7/17 (20.0) 4/6/17 (14.8)
30/10/40 (37.5) 8/9/13 (26.7) 6/5/16 (22.2)
21/11/48 (26.3) 6/6/18 (20.0) 2/3/22 (7.4)
19/11/50 (23.8) 6/2/22 (20.0) 1/3/23 (3.7)
17/11/52 (21.3) 5/3/22 (6.7) 1/1/24 (3.8)
13/7/60 (16.3) 3/5/22 (10.0) 1/4/21 (3.8)
11/11/58 (13.8) 5/2/23 (16.7) 1/4/22 (3.7)
not detected 11/5/18 (32.4) 13/7/15 (37.1) 12/5/18 (34.3) 12/3/20 (34.3) 12/4/19 (34.3) 8/2/25 (22.9) 6/5/24 (17.1) Methyl+ethyl <90th percentile 17/14/56 (19.5) 24/15/48 (27.6) 14/13/60 (16.1) 12/11/64 (13.8) 8/9/68 (10.5) 7/12/67(8.1) 8/10/69 (9.2)
>90th percentile 4/3/8 (26.7) 7/2/6 (46.7) 3/2/10 (20.0) 2/2/11 (13.3) 2/2/11 (13.3)* 2/2/11 (13.3) 3/2/10 (20.0)
None 7/4/12 (30.4) 8/5/11 (33.3) 8/3/13 (33.3) 8/2/14 (33.3) 7/4/13 (29.2) 4/1/19 (16.7) 4/2/18 (16.7)
OP+ pyrethroidc Pyrethroid only OP only
4/1/6 (36.4) 11/11/32 (20.4)
5/2/4 (45.4) 13/14/27 (24.1)
4/2/5 (36.4) 6/7/41 (11.1)
4/1/6 (36.4) 4/9/41 (7.4)
5/0/6 (45.5) 3/8/42 (5.7)
4/1/6 (36.4) 4/7/42 (7.5)
2/3/6 (18.2) 5/6/43 (9.3)
OP+ pyrethroid 10/6/32 (20.8) 18/3/27 (37.5) 11/8/29 (22.9) 10/4/34 (20.8) 8/3/37 (16.7)** 5/7/36 (10.4) 6/6/36 (12.5)
a Farmers classified by number of symptom complexes reported in the diary on that particular day; b Urine samples restricted to those collected at visit 2 within three days of last treatment and with a creatinine level between 3 and 30mmol/l; c 90th percentile levels in non-occupationally exposed population (data provided by HSL) and are the following methyl <56µmol/mol creatinine ; ethyl <19 µmol/mol creatinine; diazinon <13µmol/mol creatinine; methyl+ethyl <77 µmol/mol creatinine; ccategorised based on the presence or absence of urinary OPs or pyrethroids. Significantly different *p<0.05, **p<0.01.
38

4.2.5 Associations between diary symptom complexes and butyrylcholinesterase activity
There were no associations between changes in butyrylcholinesterase activity (as defined by a 15% difference between post treatment and pre treatment levels) and the proportion of farmers with no symptom complexes, and one or more than two symptom complexes over the seven day diary period (Table 18). Of the 5 farmers with a 15% (or more) reduction in activity, none reported having two or more diary symptom complexes.
Table 18 Changes in butyrylcholinesterase activity in farmers with none, one, two or more diary
asymptom complexes
Day >2 symptoms/ 1 symptom/ 0 symptom (% >2 symptoms) a
Reductionb No reduction 1 0/0/4 (0) 28/16/47 (30.8) 2 0/2/3 (0) 35/18/39 (38.0) 3 0/0/5 (0) 26/17/49 (28.3) 4 0/1/4 (0) 24/16/52 (26.1) 5 0/0/5 (0) 20/14/57 (22.0) 6 0/0/5 (0) 14/16/61 (15.4) 7 0/0/5 (0) 16/12/63 (17.6)
a Farmers classified by number of symptom complexes reported in the diary on that particular day; b Butyryl-cholinesterase activity categorised as reduced if activity was reduced by more than 15% between visits 1 and 2 (Health and Safety Laboratory, 2005); No significant differences in symptom reporting
4.3 Diary symptom complex scores
The mean number of diary symptom complexes, calculated using the dipper’s flu definition developed a priori for this study (Appendix 37), reported by farmers was either one or less than one in the seven days after treatment (Table 19). As the maximum number of symptom complexes that could be reported was 10, the symptom reporting as a percentage of maximum score was generally less than 10%. However despite the small scores, the mean symptom complex score on days 1 to 5 (but not 6) was significantly higher than that on day 7. The total symptom complex score (calculated from the sum of individual farmers’ symptom complexes on each day) by day of treatment is also shown in Table 19. This also showed evidence of a variation with day after treatment with the maximum score on day 2 being more than twice the score on day 7.
Table 20 shows the symptom complex scores obtained using definitions of dipper’s flu defined using published or readily available sources including a textbook (Baxter et al, 2000), a research report (Stephens et al, 1995a) or a web-based definition (DoctorMyhill.co.uk, 2006). Using the textbook definition the mean symptom complex score varied between 0.2 and 0.5 (i.e. between approximately 7% and 16% of maximum). The mean symptom complex score using the research report definition varied between 0.2 and 0.4 (i.e. between 5% and 10% of maximum). Using the web-based definition the mean score varied between 0.3 and 0.5 (i.e. between 7.5% and 12.5% of maximum). However, the mean symptom complex scores for all these definitions were significantly higher than that that on day 7 for days 1, 2, 3 and 4 (for the textbook and the web-based definition) and on days 1, 2, 3, 4 and 5 for the research report definition. Further
39

analysis uses the dipper’s flu symptom complex score obtained by summing the score for all ten individual symptoms (this study definition: Appendix 37).
Table 19 Variation in dipper’s flu diary scores by day after treatmenta
Day Symptom complex scoreb
mean±SD (n)
Symptom complex score differencec
Mean , 95%CI (n)
Total symptom complex scored
(% max score) 1 0.8±1.4 (347) 0.32, 0.18-0.46 (337)*** 276 (8.0) 2 1.0±1.6 (347) 0.54, 0.39-0.68 (340)*** 352 (10.1) 3 0.9±1.6 (348) 0.39, 0.26-0.51 (341)*** 304 (8.7) 4 0.8±1.4 (347) 0.26, 0.14-0.37 (340)*** 259 (7.5) 5 0.6±1.3 (345) 0.14, 0.05-0.24 (340)** 215 (6.2) 6 0.5±1.2 (344) 0.04, -0.02-0.11 (339) 179 (5.2) 7 0.5±1.3 (342) - 166 (4.9)
a Dipper’s flu (this study) comprises all ten diary symptom complexes (Appendix 37); bMaximum score from symptom diary is 10; c between day of treatment and day 7 in matched pairs; d Sum of individual farmers’ symptom scores on a given day; Significantly different ** p<0.01, *** p<0.001
Table 20 Variation in symptom diary scores of different dipper’s flu definitions by day of
treatment
Day
Textbook score b Research report scorec Web-based score d
Mean±SD (n)
Differencee
Mean , 95%CI (n)
Mean±SD (n)
Differencee
Mean , 95%CI (n)
Mean±SD (n)
Differencee
Mean , 95%CI (n)
1 0.3±1.6 (347)
0.12, 0.06-0.19 (337) ***
0.3±0.6 (347)
0.10,0.03-0.17 (337)***
0.4±0.7 (347)
0.11,0.04-0.19 (337)**
2 0.5±0.8 (347)
0.23, 0.17-0.31 (340) ***
0.4±0.7 (347)
0.22,0.15-0.29 (340)**
0.5±0.9 (347)
0.21,0.13-0.29 (340)**
3 0.4±0.7 (348)
0.14, 0.08-0.21 (341)***
0.4±0.7 (348)
0.16,0.09-0.23 (341)***
0.4±0.8 (348)
0.13,0.06-0.21 (341)**
4 0.3±0.6 (347)
0.11, 0.05-0.18 (341)***
0.3±0.7 (347)
0.11,0.05-0.17 (341)**
0.3±0.7 (347)
0.07,0.01-0.15 (341)*
5 0.3±0.6 (345)
0.05,<-0.01-0.1 (340)
0.3±0.6 (345)
0.06,0.01-0.11 (340)*
0.3±0.7 (345)
0.06,-0.05-0.11 (340)
6 0.2±0.5 (344)
0.02, -0.02-0.06 (339)
0.2±0.6 (344)
0.04,<-0.01-0.08 (339)
0.3±0.6 (344)
<0.01, -0.05-0.05 (339)
7 0.2±0.5 (342)
- 0.2±0.6 (342)
- 0.3±0.7 (342)
-
a Dipper’s flu definitions presented in Appendix 37; b Score obtained from three symptom complexes namely headache; pain in muscles or joints; runny, stuffy, blocked or irritated nose (Baxter et al, 2000) ; c Score obtained from four symptom complexes namely headache; sweaty, shivery, feverish, hot or cold; pain in muscles or joints; nausea, poor appetite, vomiting, abdominal pain or diarrhoea (Stephens et al, 1995a ) d Score obtained from four symptom complexes namely feeling generally ill, feeling unusually tired; headache; pain in muscles or joints (DoctorMyhill.co.uk, 2006); e between day of treatment and day 7 in matched pairs. Significantly different * p<0.05; ** p<0.01; *** p<0.001
4.3.1 Associations between diary symptom complex scores and demographic variables
There were no associations between symptom complex scores on the seven days of the diary and either region, gender, age, current smoking or drinking habits or whether the farmer was a
40

contract dipper or had a certificate of competence (Table 21). Symptom complex scores however were strongly associated with health status at visit 1, with those farmers reporting poor or very poor health having higher symptom scores than farmers with either average or very good and good health (e.g. 3.5±2.9 vs 1.1±1.6 and 0.6±1.1 respectively on day 1; p<0.001). Farmers who previously reported having suffered from dipper’s flu also had a higher symptom complex score (e.g. 1.6±2.0 vs 0.5±1.0 on day 1; p<0.001). Farmers who had a high perceived risk of sheep dip also reported more symptom complexes than other farmers with medium or low perceived risk (e.g. 1.3±1.9 vs 0.7±1.1 and 0.4±0.8 respectively on day 1; p<0.01).
4.3.2 Associations between diary symptom complex scores and self-reported exposures
Symptom complex scores were not associated with the type of method used to treat sheep but they were associated with the type of product used (Table 22). Specifically there were significant differences in scores on days 3 and 5, when analysis was restricted to just the four main product groups (avermectin, OP, pyrethroid and triazines), which suggested that symptom complex scores were higher in those farmers who used pyrethroids. On day 3 the mean symptom complex score for pyrethroid was 1.2±1.8, for avermectins 0.7±1.2, triazines 0.7±1.8 and OPs 0.6±1.1 (p<0.01). There was little evidence to indicate that symptom complex reporting was higher in those farmers who used OPs: for example the mean symptom complex score for those farmers using OPs was lower than that reported by farmers using pyrethroids over all the seven days of the diary.
4.3.3 Associations between diary symptom complex scores and endotoxin concentrations in sheep dip
Figure 9 shows the linear regression between the symptom complex score on the seven diary days and endotoxin concentrations in sheep dip after treatment. There were no associations between symptom complex scores and endotoxin concentration.
4.3.4 Associations between diary symptom complex scores and urinary pesticide metabolites
The associations between diary symptom complex scores and urinary pesticide metabolites were examined by categorising the urine metabolites (Tables 23-25) and by linear regression analysis (Figures 10-14).
There was no evidence that symptom complex scores were associated with concentrations of PBA, cDCVA and tDCVA (Table 23). On days 6 and 7 symptom complex scores were associated in a dose–response fashion with cDBVA concentrations in a small number of samples (Table 23). On day 6 the mean symptom complex score in those with no detectable cDBVA concentrations was 0.5±1.1, 1.0±2.0 in those with cDBVA levels less than the 90th
percentile and 2.5±3.1 in those with levels greater than the 90th percentile (p=0.05). There was no evidence of an association between the sum of cDCVA and tDCVA and diary symptom complex scores (Figure 10).
41

Table 21 Variation in symptom diary complex scores with demographic variables
Variable Mean ±SD (n) symptom complex score Item Definition Day 1 Day 2 Day 3 Day 4 Day 5 Day 6 Day 7 Region Wales
N West S East
0.9±1.4 (182) 0.8±1.5 (104) 0.6±1.1 (61)
1.1±1.7 (185) 1.0±1.5 (102) 0.9±1.4 (60)
1.0±1.9 (185) 0.8±1.3 (102) 0.6±1.2 (61)
0.9±1.6 (185) 0.6±1.2 (102) 0.6±1.0 (60)
0.7±1.5 (184) 0.5±1.1 (101) 0.5±1.0 (60)
0.6±1.5 (184) 0.4±0.9 (101) 0.3±0.7 (59)
0.6±1.5 (184) 0.4±0.9 (100) 0.3±0.6 (58)
Gender Male Female
0.8±1.4 (299) 0.7±1.5 (48)
1.0±1.5 (299) 1.3±1.9 (48)
0.9±1.6 (299) 0.7±1.5 (49)
0.8±1.5 (298) 0.6±1.0 (49)
0.7±1.4 (296) 0.4±1.0 (49)
0.6±1.3 (296) 0.3±0.9 (48)
0.5±1.3 (294) 0.3±0.7 (48)
Age <40 41-50 51-60 > 61
1.1±1.5 (42) 0.8±1.4 (90) 0.7±1.3 (123) 0.8±1.5 (92)
1.4±1.7 (43) 1.2±1.8 (88) 0.9±1.4 (1230 0.9±1.5 (93)
0.9±1.8 (44) 1.1±1.8 (88) 0.7±1.3 (123 0.9±1.7 (93)
0.8±1.5 (44) 0.9±1.5 (88) 0.6±1.2 (122) 0.8±1.6 (93)
0.7±1.5 (43) 0.6±1.2 (87) 0.6±1.2 (122) 0.7±1.5(93)
0.6±1.4 (43) 0.6±1.2 (87) 0.5±1.2 (121) 0.5±1.3 (93)
0.6±1.7 (43) 0.5±1.0 (87) 0.4±1.2 (120) 0.5±1.4 (92)
Smoker Current 0.7±1.1 (50) 1.0±1.6 (48) 0.9±1.9 (48) 0.7±1.4 (48) 0.6±1.3 (48) 0.4±1.2 (48) 0.5±1.2 (48) Ex 0.8±1.6 (107) 0.9±1.6(108) 0.8±1.6 (108) 0.7±1.2 (108) 0.5±1.2 (108) 0.6±1.1 (108) 0.4±1.0 (106) Never 0.8±1.4 (189) 1.1±1.6 (190) 0.9±1.5 (191) 0.8±1.5 (190) 0.5±1.4 (188) 0.5±1.3 (187) 0.5±1.4 (187)
Current drinker
Yes No
0.8±1.3 (291) 0.9±1.7 (55)
1.0±1.5 (291) 1.3±2.0 (55)
0.8±1.5 (291) 1.1±2.2 (56)
0.7±1.3 (290) 1.0±1.9 (56)
0.6±1.1 (289) 0.9±2.0 (55)
0.5±1.0 (288) 0.8±1.9 (55)
0.4±1.1 (285) 0.7±1.9 (56)
Certificate Yes 0.7±1.2 (119) 0.8±1.4 (120) 0.7±1.4 (121) 0.7±1.3 (120) 0.5±1.2 (119) 0.4±1.2 (119) 0.4±1.4 (119) Holdera No 0.9±1.5 (225) 1.1±1.7 (224) 1.0±1.7 (224) 0.8±1.4 (224) 0.7±1.4 (223) 0.6±1.2 (222) 0.5±1.2 (220) Contract Yes 1.0±1.5 (8) 1.2±2.0 (9) 1.3±2.2 (9) 1.3±2.2 (9) 1.0±2.0 (9) 1.1±2.3 (9) 1.1±2.7 (9) dipper No 0.8±1.4 (336) 1.0±1.6 (335) 0.9±1.6 (336) 0.7±1.4 (335) 0.6±1.3 (333) 0.5±1.2 (332) 0.5±1.2 (330) Health V.good/good 0.6±1.1 (253) 0.8±1.3 (252) 0.6±1.4 (253) 0.5±1.7 (252) 0.4±1.0 (250) 0.4±1.0 (249) 0.3±1.0 (247) Statusb Average 1.1±1.6 (83) 1.4±1.8 (84) 1.3±1.7 (84) 1.1±1.7 (84) 1.0±1.5 (84) 0.7±1.3 (84) 0.6±1.2 (84)
Poor/v. poor 3.5±2.9 (11)*** 3.5±2.6 (11)*** 3.3±2.7 (11)*** 2.6±2.1 (11)*** 2.8±2.6 (11)*** 2.6±2.6 (11)*** 2.8±3.0 (11)*** Dipper’s Yes 1.6±2.0 (78) 2.0±2.1 (79) 1.9±2.3 (79) 1.6±1.9 (79) 1.3±1.6 (77) 1.0±1.5 (77) 1.0±1.6 (79) Fluc No 0.5±1.0 (227)*** 0.6±1.2 (225)*** 0.5±1.2 (226)*** 0.5±1.0 (225)*** 0.4±1.0 (225)*** 0.3±1.0 (224)*** 0.3±0.9 (223)***
Perceived Low 0.4±0.8 (126) 0.6±1.0 (125) 0.5±1.0 (125) 0.4±1.0 (125) 0.4±1.0 (125) 0.3±1.0 (125) 0.3±0.9 (125) sheep dip Medium 0.7±1.1 (111) 0.7±1.2 (113) 0.7±1.3 (113) 0.7±1.2 (112) 0.5±1.1 (111) 0.3±1.0 (110) 0.3±1.0 (109) riskd High 1.3±1.9 (101)*** 1.7±2.1 (100)*** 1.4±2.1 (101)*** 1.2±1.8 (101)*** 1.0±1.6 (100)*** 0.9±1.6 (100)*** 0.9±1.8 (99)***
a Certificate of competence for handling pesticides ; b Before treatment at visit 1 ; chistory of dipper’s flu; dBased upon scale used by Stephens et al, (1995a): max score =24. Low ≤13, Medium 14-19; high ≥ 20. ; Significantly different *** p<0.001
42

Table 22 Variation in symptom diary complex scores with self-reported exposures
Variable Mean ±SD (n) symptom complex score Item Description Day 1 Day 2 Day 3 Day 4 Day 5 Day 6 Day 7 Treatment method Injection
Dip Pour-on Shower Mixed
0.6±1.3 (22) 0.8±1.2 (121) 0.8±1.6 (174) 0.5±1.1 (14) 0.9±1.5 (11)
0.8±1.2 (23) 1.0±0.5 (120) 1.1±1.7 (174) 0.6±1.2 (14) 1.2±1.7 (11)
0.5±0.8 (23) 0.8±1.5 (120) 1.0±1.8 (175) 0.6±1.3 (14) 1.2±1.6 (11)
0.3±0.7 (23) 0.7±1.5 (120) 0.8±1.4 (174) 0.8±1.3 (14) 0.9±1.6 (11)
0.4±0.8 (23) 0.5±1.1 (118) 0.8±1.5 (174) 0.5 ±1.2 (14) 0.8±1.5 (11)
0.4±0.8 (23) 0.4±1.1 (118) 0.6±1.4 (173) 0.6±1.1 (14) 0.8±1.4 (11)
0.6±1.4 (23) 0.4±1.1 (118) 0.5±1.4 (171) 0.5±1.1 (14) 0.8±1.3 (11)
General product Non-OP OP Unknown
0.8±1.5 (231) 0.7±1.2 (101) 1.1±1.6 (15)
1.0±1.6 (233) 1.0±1.4 (99) 1.1±1.7 (15)
0.9±1.7 (234) 0.7±1.3 (99) 1.8±1.9 (15)
0.7±1.4 (233) 0.7±1.3 (99) 1.6±2.0 (15)
0.7±1.4 (232) 0.4±1.0 (98) 1.7±2.0 (15)***
0.6±1.3 (231) 0.4±1.1 (98) 0.8±1.5 (15)
0.5±1.3 (230) 0.4±1.1 (97) 0.5±1.4 (15)
Specific product Avermectin OP Pyrethroid Triazine
0.8±0.6 (22) 0.7±1.1 (97) 1.0±1.6 (108) 0.6±1.4 (67)
1.0±1.49 (24) 0.9±1.3 (95) 1.2±1.6 (107) 0.8±1.8 (68)
0.7±1.2 (24) 0.6±1.1 (95) 1.2±1.8 (107) 0.7±1.8 (68)*
0.5±1.2 (24) 0.6±1.2 (95) 1.0±1.6 (107) 0.6±1.3 (68)
0.6±1.1 (24) 0.3±0.8 (94) 0.9±1.6 (106) 0.4±1.0 (68)**
0.5±0.9 (24) 0.3±0.9 (94) 0.7±1.5 (105) 0.3±1.1 (68)
0.7±1.5 (24) 0.3±0.8 (93) 0.6±1.6 (106) 0.4±0.9 (66))
Significantly different; *p<0.05 ** p<0.01; *** p<0.001
43

0
2
4
6
8
10
r pDay 1
=-0.08; =0.69
10
r pDay 2
=0.19; =0.35
10 10
Dia
ry s
core
Dia
ry s
core
r pDay 3
=0.08; =0.67
Dia
ry s
core
8 88
Dia
ry s
core
0
r pDay 4
=0.07; =0.71
1x10³ 10x103 100x103 1x10³ 10x103 100x103
Endotoxin concentration (EU/ml) Endotoxin concentration (EU/ml)
0
1x10³ 10x103 100x103 1x10³ 10x103 100x103
Endotoxin concentration (EU/ml) Endotoxin concentration (EU/ml)
0
6 6 6
4 4 4
2 2 2
r p
Di
0
2
4
6
8 r p
Di
0
2
4
6
8 r p
Di
0
2
4
6
8 Day 5
=-0.01; =0.96
ary
scor
e
10
Day 6 =-0.18; =0.37
ary
scor
e
10
Day 7 =0.23; =0.26
ary
scor
e
10
1x10³ 10x103 100x103 1x10³ 10x103 100x103 1x10³ 10x103 100x103
Endotoxin concentration (EU/ml) Endotoxin concentration (EU/ml) Endotoxin concentration (EU/ml)
Figure 9 Diary symptom score by endotoxin concentration in sheep dip after treatmenta
a Total sum of symptoms for dipper’s flu (this study defined in Appendix 37)
44

Table 23 aVariation in symptom diary complex scores with urinary pyrethroid metabolite concentration
Urinary pyrethroid Mean ±SD (n) Symptom score Metabolite Levelb Day 1 Day 2 Day 3 Day 4 Day 5 Day 6 Day 7
PBA not detected <90th percentile
>90th percentile
0.9±1.5 (89) 1.0±2.0 (41) 1.0±1.3 (6)
1.2±1.5 (90) 1.3±1.9 (41) 1.2±1.3 (6)
0.8±1.5 (90) 1.0±1.7 (41) 0.8±1.6 (6)
0.7±1.2 (90) 0.7±1.5 (41) 1.0±1.7 (6)
0.6±1.3 (89) 0.8±1.6 (41) 0.8±1.3 (6)
0.5±1.2 (89) 0.7±1.4 (41) 0.7±1.0 (6)
0.5±1.3 (90) 0.7±1.6 (41) 0.5±0.5 (6)
cDCVA not detected <90th percentile >90th percentile
1.0±1.6 (107) 0 (1) 0.8±1.8 (28)
1.2±1.7 (108) 0 (1) 1.1±1.4 (28)
0.9±1.9 (108) 0 (1) 1.0±1.4 (28)
0.7±1.4 (108) 0 (1) 0.8±1.3 (28)
0.7±1.4 (107) 0 (1) 0.6±1.3 (28)
0.6±1.3 (107) 0 (1) 0.4±0.9 (28)
0.6±1.5 (108) 0 (1) 0.5±1.1 (28)
tDCVA not detected <90th percentile >90th percentile
1.0±1.7(119) 0.7±1.2 (3) 0.9±1.6 (14)
1.3±1.7 (120) 0 (3) 0.6±1.0 (14)
0.9±1.6 (120) 0.3±0.6 (3) 0.6±1.4 (14)
0.7±1.4 (120) 0 (3) 0.7±1.4 (14)
0.7±1.4 (119) 0 (3) 0.8±1.4 (14)
0.6±1.3 (119) 0 (3) 0.4±0.7 (14)
0.6±1.5 (120) 0 (3) 0.3±0.5 (14)
cDBVA not detected <90th percentile
>90th percentile
1.0±1.7(128) 0.5±1.0 (4) 1.8±1.7 (4)
1.2±1.6(129) 0.8±1.0 (4) 2.8±2.5 (4)
0.8±1.5 (119) 1.0±1.4 (4) 2.5±3.1 (4)
0.6±1.2 (129) 1.5±1.7 (4) 2.3±3.3 (4)*
0.6±1.3 (128) 0.8±1.5 (4) 2.0±2.8 (4)
0.5±1.1(128) 1.0±2.0 (4) 2.5±3.1 (4)**
0.5±1.3 (129) 0.8±1.5 (4) 2.8±2.6 (4)**
a Urine samples restricted to those collected at visit 2 within three days of last treatment and with a creatinine level between 3 and 30mmol/l; b 90th percentile levels in non-occupationally exposed population (data provided by HSL) and are the following: PBA <1.9µmol/mol creatinine; cDCVA 0.3 µmol/mol creatinine; tDCVA 0.5 µmol/mol creatinine; cDBVA <0.4 µmol/mol creatinine; Significantly different * p<0.05; ** p<0.01
45

Table 24 aVariation in symptom diary complex scores with urinary OP metabolite concentrations
Urinary OPs Mean±SD symptom score (n) Metabolite Levelb Day 1 Day 2 Day 3 Day 4 Day 5 Day 6 Day 7
DMP not detected <90th percentile >90th percentile
1.2±1.7 (62) 0.8±1.7 (63) 0.7±1.5 (11)
1.4±1.8 (64) 1.0±1.5 (62) 1.3±1.5 (11)
1.2±1.8 (64) 0.6±1.4 (62) 0.5±0.8 (11)
0.9±1.5 (66) 0.5±1.3 (62) 0.6±1.0 (11)
0.9±1.6 (64) 0.5±1.2 (62) 0.6±0.8 (10)
0.6±1.4 (64) 0.4±1.1 (62) 0.8±1.3 (10)
0.6±1.5 (64) 0.5±1.3 (62) 0.8±1.3 (11)
DMTP not detected <90th percentile >90th percentile
0.9±1.5 (83) 0.8±1.1 (29) 1.4±2.5 (24)
1.2±1.7 (83) 1.0±1.4 (30) 1.3±2.0 (24)
0.9±1.5 (83) 0.7±1.3 (30) 1.0±2.0 (24)
0.9±1.4 (83) 0.4±1.1 (30) 0.5±1.3 (24)
0.8±1.5 (82) 0.3±0.8 (30) 0.6±1.4 (24)
0.6±1.5 (82) 0.1±0.3 (30) 0.6±1.2 (24)
0.7±1.6 (83) 0.2±0.5 (30) 0.7±1.4 (24)
DMDTP not detected <90th percentile >90th percentile
1.0±1.7 (133) -1.3±1.5 (3)
1.2±1.6 (134) -2.0±1.7 (3)
0.9±1.6(134) -0.7±1.2 (3)
0.7±1.4 (134) -0 (3)
0.7±1.4 (133) -0 (3)
0.5±1.3 (133) -0.3±0.6 (3)
0.6±1.4(134) -0.7±1.2 (3)
DEP not detected <90th percentile >90th percentile
1.2±1.9 (92) 0.4±0.6 (22) 0.7±1.0 (22)
1.4±1.8 (93) 0.5±0.7 (22) 1.0±1.2 (22)
1.0±1.7 (93) 0.4±0.7 (22) 0.7±1.5 (22)
0.9±1.4 (93) 0.1±0.5 (22) 0.6±1.4 (22)
0.8±1.6 (93) 0.2±0.5 (22) 0.5±1.1 (21)
0.7±1.5 (93) 0.2±0.5 (22) 0.3±0.6 (21)
0.7±1.6 (93) 0.3±0.6 (22) 0.3±0.6 (22)
DETP not detected <90th percentile >90th percentile
1.0±1.8 (101) 2.5±2.1 (2) 0.7±1.2 (33)
1.2±1.7 (102) 3.5±3.5 (2) 1.0±1.3 (33)
1.0±1.6 (102) 3.5±5.0 (2) 0.4±0.9 (33)*
0.8±1.3 (102) 4.0±4.2 (2) 0.3±0.9 (33)***
0.8±1.4 (101) 3.0±4.2 (2) 0.2±0.6 (33)**
0.5±1.2 (101) 3.5±5.0 (2) 0.4±0.8 (33)**
0.6±1.4 (102) 4.0±5.7 (2) 0.3±0.9 (33)**
DEDTP not detected <90th percentile >90th percentile
0.9±1.6 (134) 3.5±2.1 (2)* -
1.1±1.6 (135) 4.0±1.4 (2)* -
0.9±1.6 (135) 0.5±0.7 (2) -
0.7±1.4 (135) 0.5±0.7 (2) -
0.7±1.4 (134) 0 (2) -
0.5±1.3 (134) 1 (2) -
0.5±1.4 (135) 2.0±2.8 (2) -
a Urine samples restricted to those collected at visit 2 within three days of last treatment and with a creatinine level between 3 and 30mmol/l; b 90th percentile levels in non-occupationally exposed population (data provided by HSL) and are the following; DMP 35 µmol/mol creatinine; DMTP 15 µmol/mol creatinine; DMDTP 3 µmol/mol creatinine; DEP 9 µmol/mol creatinine; DETP 4 µmol/mol creatinine; DEDTP 7 µmol/mol creatinine. Significantly different * p<0.05; ** p<0.01 ; *** p<0.001
46

Table 25 aVariation in symptom diary complex scores with total urinary OP and pyrethroid metabolite concentrations
Total urinary OPs Mean±SD score (n) Metabolites Levelb Day 1 Day 2 Day 3 Day 4 Day 5 Day6 Day 7
Methyl not detected 1.1±1.6 (40) 1.4±1.8 (41) 1.2±1.7 (41) 1.1±1.6 (41) 1.2±1.8 (41) 0.8±1.6 (41) 0.7±1.8 (41) (DMP+DMTP+ <90th percentile 0.9±1.7 (84) 1.1±1.6 (84) 0.8±1.6 (84) 0.6±1.3 (84) 0.5±1.2 (83) 0.4±1.0 (83) 0.5±1.2 (84) DMDTP) >90th percentile 0.8±1.6 (12) 1.2±1.6 (12) 0.3±0.7 (12) 0.4±0.9 (12) 0.5±0.8 (12)* 0.6±1.2 (12) 0.7±1.2 (12)
Ethyl not detected 1.1±1.9 (79) 1.3±1.8 (80) 1.1±1.7 (80) 0.8±1.3 (80) 0.9±1.6 (80) 0.6±1.3 (80) 0.6±1.5 (80) (DEP+DETP+ <90th percentile 0.8±1.2 (38) 1.0±1.4 (38) 0.7±1.5 (38) 0.7±1.5 (38) 0.5±1.3 (37) 0.5±1.3 (37) 0.6±1.5 (38) DEDTP) >90th percentile 0.6±0.9 (19) 0.9±1.2 (19) 0.4±1.0 (19) 0.3±0.9 (19) 0.2±0.7 (19) 0.3±0.6 (19) 0.3±0.6 (19)
Diazinon (DEP+DETP)
Not detected <90th percentile >90th percentile
1.1±1.9 (79) 0.9±1.3 (30) 0.6±0.8 (27)
1.3±1.8 (80) 1.2±1.5 (30) 0.8±1.1 (27)
1.1±1.7 (80) 0.9±1.6 (30) 0.3±0.9 (27)
0.8±1.3 (80) 0.8±1.7 (30) 0.3±0.8 (27)
0.9±1.6 (80) 0.6±1.4 (30) 0.2±0.6 (26)
0.6±1.3 (80) 0.6±1.5 (30) 0.2±0.5 (26)
0.6±1.5 (80) 0.7±1.7 (30) 0.2±0.5 (27)
not detected 1.2±1.7 (34) 1.4±1.9 (35) 1.3±1.7 (35) 1.1±1.6 (35) 1.3±1.9 (35) 0.9±1.7 (35) 0.9±2.0 (35) Methyl + Ethyl <90th percentile 0.9±1.7 (87) 1.0±1.6 (87) 0.7±1.6 (87) 0.6±1.2 (87) 0.5±1.2 (86) 0.4±1.0 (86) 0.4±1.1 (87)
>90th percentile 1.1±1.5 (15) 1.5±1.6 (15) 0.7±1.2 (15) 0.6±1.2 (15) 0.5±0.9 (15)* 0.5±1.1 (15) 0.7±1.2 (15)
None 1.2±1.6 (23) 1.2±1.6 (24) 1.2±1.6 (24) 1.1±1.6 (24) 1.2±2.0 (24) 0.7±1.8 (24) 0.9±2.3 (24)
OP+ pyrethroidc Pyrethroid only OP only
1.3±1.8 (11) 0.9±1.6 (54)
1.9±2.4 (11) 1.0±1.5 (54)
1.5±2.0 (11) 0.6±1.4 (54)
1.3±1.7 (11) 0.4±0.8 (54)
1.5±1.9 (11) 0.3±0.8 (53)
1.2±1.6 (11) 0.4±0.8 (53)
0.7±1.0 (11) 0.3±0.7 (54)
OP+ pyrethroid 0.9±1.8 (48) 1.2±1.6 (48) 0.9±1.6 (48) 0.8±1.5 (48) 0.6±1.4 (48)* 0.5±1.2 (48) 0.6±1.5 (48)
a Urine samples restricted to those collected at visit 2 within three days of last treatment and with a creatinine level between 3 and 30mmol/l; b 90th percentile levels in non-occupationally exposed population (data provided by HSL) and are the following: methyl <56µmol/mol creatinine ; ethyl <19 µmol/mol creatinine; diazinon <13µmol/mol creatinine; methyl+ethyl <77 µmol/mol creatinine; ccategorised based on the presence or absence of urinary OPs or pyrethroids. Significantly different *p<0.05
47

2
4
6
8
10
r pDay 1
<0.01; =0.96
10
r pDay 2
=-0.02; =0.85
10
r pDay 3
=-.03; =0.72
10
Sym
ptom
sco
re
Sym
ptom
sco
re
Sym
ptom
sco
re 8 8 8
Sym
ptom
sco
re
0 0 0 0
r pDay 4
=0.05; =0.56
0.1 1 10 0.1 1 10 0.1 1 10 0.1 1 10
cDCVA+tDCVA cDCVA + tDCVA cDCVA + tDCVA cDCVA + tDCVA
6 6 6
4 4 4
2 2 2
r p
0
2
4
6
8 r p
0
2
4
6
8 r p
0
1
2
3
4
5
6
Day 5 =0.04; =0.61
Sym
ptom
sco
re
10
Day 6 =0.04; =0.63
Sym
ptom
sco
re
10
Day 7 =-0.02; =0.83
Sym
ptom
sco
re
0.1 1 10 0.1 1 10 0.1 1 10
cDCVA + tDCVA cDCVA + tDCVA cDCVA + tDCVA
Figure 10Diary symptom score at different days after treatment by sum of urinary pyrethroid metabolites cDCVA and tDCVAa,b
a Total sum of symptoms for dipper’s flu (this study defined in Appendix 37) b Urine samples restricted to those collected at visit 2 within three days of last treatment and with a creatinine level between 3 and 30mmol/l
48

49
Figure 11 Diary symptom score at different days after treatment by sum of urinary DMP and DMTP and DMDTPa,b
a Total sum of symptoms for dipper’s flu (this study defined in Appendix 37) b Urine samples restricted to those collected at visit 2 within three days of last treatment and with a creatinine level between 3 and 30mmol/l
Day 1r=-0.06p=0.51
DMP+DMTP+DMDTP
1 10 100 1000
Sym
ptom
sco
re
0
2
4
6
8
10
DMP+DMTP+DMDTP
1 10 100 1000
Sym
ptom
sco
re
0
2
4
6
8
10
DMP+DMTP+DMDTP
1 10 100 1000
Sym
ptom
sco
re
0
2
4
6
8
10
DMP+DMTP+DMDTP
1 10 100 1000
Sym
ptom
sco
re
0
2
4
6
8
10
DMP+DMTP+DMDTP
1 10 100 1000
Sym
ptom
sco
re
0
2
4
6
8
10
DMP+DMTP+DMDTP
1 10 100 1000
Sym
ptom
sco
re
0
2
4
6
8
10
Day 6r=-0.06; p=0.52
Day 5r=-0.06; p=0.46
Day 4r=-0.08p=0.33
Day 3r=-0.11p=0.19
Day 2
Day 7r=-0.03; p=0.74
DMP+DMTP+DMDTP
1 10 100 1000
Sym
ptom
sco
re
0
2
4
6
8
10 Day 2r=-0.04p=0.68

2
4
6
8
10
r pDay 1
=-0.05; =0.57
10
r pDay 2
=-0.04; =0.69
10
r pDay 3
=-0.06; =0.49
10
Sym
ptom
sco
re
Sym
ptom
sco
re
Sym
ptom
sco
re 8 8 8
Sym
ptom
sco
re
0 0
r pDay 4
=-0.06; =0.49
1 10 100 1000 1 10 100 1000
DEP+DETP+DEDTP DEP+DETP+DEDTP
0
1 10 100 1000 1 10 100 1000
DEP+DETP+DEDTP DEP+DETP+DEDTP
0
6 6 6
4 4 4
2 2 2
r p
0
2
4
6
8 r p
0
2
4
6
8 r p
0
2
4
6
8 Day 5
=-0.09; =0.30
Sym
ptom
sco
re
10 Day 6
=-0.05; =0.59
Sym
ptom
sco
re
10 Day 7
=-0.04; =0.61
Sym
ptom
sco
re
10
1 10 100 1000 1 10 100 1000 1 10 100 1000
DEP+DETP+DEDTP DEP+DETP+DEDTP DEP+DETP+DEDTP
Figure 12 Symptom diary score at different days after treatment by sum of urinary DEP and DETP and DEDTPa,b
a Total sum of symptoms for dipper’s flu (this study defined in Appendix 37) b Urine samples restricted to those collected at visit 2 within three days of last treatment and with a creatinine level between 3 and 30mmol/l;
50

2
4
6
8
10
r pDay 1
=-0.05; =0.55
10
r pDay 2
=-0.04; =0.66
10
r pDay 3
=-0.06; =0.49
10
Sym
ptom
sco
re
Sym
ptom
sco
re
Sym
ptom
sco
re 8 8 8
6 6 6
Sym
ptom
sco
re
0 0 0
r pDay 4
=-0.06; =0.49
1 10 100 1000 1 10 100
DEP+DETP DEP+DETP
0
1000 1 10 100 1000 1 10 100 1000
DEP+DETP DEP+DETP
4 4 4
2 2 2
r p
0
2
4
6
8 r p
0
2
4
6
8 r p
0
2
4
6
8 Day 5
=-0.09; =0.30
Sym
ptom
sco
re
10
Day 6 =-0.05; =0.58
Sym
ptom
sco
re
10
Day 7 =-0.05; =0.59
Sym
ptom
sco
re
10
1 10 100 1000 1 10 100 1000 1 10 100 1000
DEP+DETP DEP+DETP DEP+DETP
Figure 13 Symptom diary score at different days after treatment by sum of urinary diazinon metabolites DEP and DETPa,b
a Total sum of symptoms for dipper’s flu (this study defined in Appendix 37) b Urine samples restricted to those collected at visit 2 within three days of last treatment and with a creatinine level between 3 and 30mmol/l
51

52
Day 1r=-0.07p=0.42
Total OP
1 10 100 1000
Sym
ptom
sco
re
0
2
4
6
8
10
Day 2r=-0.05p=0.59
Total OP
1 10 100 1000
Sym
ptom
sco
re
0
2
4
6
8
10
Day 3r=-0.11p=0.18
Total OP
1 10 100 1000
Sym
ptom
sco
re
0
2
4
6
8
10
Day 4r=-0.10p=0.27
Total OP
1 10 100 1000
Sym
ptom
sco
re
0
2
4
6
8
10
Day 5r=-0.10p=0.25
Total OP
1 10 100 1000
Sym
ptom
sco
re
0
2
4
6
8
10 Day 6r=-0.07p=0.44
Total OP
1 10 100 1000
Sym
ptom
sco
re
0
2
4
6
8
10
Day 7r=-0.05p=0.59
Total OP
1 10 100 1000
Sym
ptom
sco
re
0
2
4
6
8
10
Figure 14 Symptom diary score at different days after treatment by sum of urinary methyl and ethyl OP metabolitesa,b
a Total sum of symptoms for dipper’s flu (this study defined in Appendix 37) b Urine samples restricted to those collected at visit 2 within three days of last treatment and with a creatinine level between 3 and 30mmol/l

Diary symptom complex scores were not associated with concentrations of DMP, DMTP or DMDTP but were associated with DETP (days 3, 4, 5, 6 and 7). However, there was no evidence that symptom complex scores were higher in those farmers with the highest concentrations of OP metabolites. For example, on day 4 the mean score was 0.3±0.9 in those farmers whose urine had DETP levels greater than the 90th percentile, but 0.8 ±1.3 in those farmers without detectable urinary metabolites. Higher symptom scores on days 1 and 2 were reported in those farmers with detectable DEDTP levels but only two farmers had detectable DEDTP on each of these days.
Associations between total OP metabolite concentrations and diary symptom complex scores are shown in Table 25. There were no associations between scores and with total ethyl metabolites. Statistically significant associations were detected with methyl metabolites (day 5) and total OP metabolites (methyl + ethyl, on day 5). Symptom complex scores, however, tended to be lower in those farmers with the highest metabolite concentrations (e.g. on day 5 the symptom complex score was 0.5±0.9 in farmers with total methyl and ethyl metabolites greater than the 90th percentile, but 1.3±1.9 in those farmers without detectable levels). Symptom scores were generally not different between those farmers with no urinary pesticide metabolites and those with either pyrethroid metabolites only, OP metabolites only or both pyrethroid and OP metabolites. On day 5, there was a significant difference in the symptom diary complex scores with the highest scores found in those farmers with urinary pyrethroid metabolites and the lowest in those farmers with only urinary OP metabolites. Scores tended during the week to be lowest in those farmers with urinary OP metabolites. In linear regression analysis there were no associations between symptom complex scores and urinary methyl metabolites (Figure 11), ethyl metabolites (Figure 12), metabolites that could have arisen from exposure to diazinon (Figure 13) or methyl and ethyl metabolites (Figure 14)
4.3.5 Associations between diary symptom complex scores and butyrylcholinesterase activity
Mean symptom complex scores were higher in those farmers without a 15% or more fall in cholinesterase activity between visits 1 and 2 (Table 26).
Table 26 Variation in symptom diary scores with changes in butyrylcholinesterase activity a
Day Mean (±SD) score (n) Reduction No reduction
1 0±0 (4) 1.2±1.7 (91) 2 0.4±0.5 (5) 1.5±1.8 (92) 3 0±0 (5) 1.2±1.8 (92) 4 0.2±0.4 (5) 1.0±1.2 (92) 5 0±0 (5) 0.9±1.5 (91) 6 0±0 (5) 0.7±1.4 (91) 7 0±0 (5) 0.7±1.6 (91)
a Butyrylcholinesterase activity categorised as reduced if activity was reduced by more than 15% between visits 1 and 2 (Health and Safety Laboratory, 2005); No significant differences in symptom scores
53

54

5.0 DESCRIPTIVE ANALYSIS OF HEALTH QUESTIONNAIRES
Responses to the health questions on 83 different symptoms at visit 1, visit 2 and visit 3 are shown in Figures 15, 16 and 17 respectively. At visit 1, the five commonest complaints were tiredness (62.7% of farmers complained of this at least some of the time), forgetting things (55.8%), general aches (54.6%), waking up tired (53.2%) and joint stiffness (51.7%). At visit 2, the five commonest complaints were similar to those at visit 1, and included tiredness (41.0% of farmers at least some of the time), general aches (36.5%), joint stiffness (34.5%), headaches (34.0%) and waking up tired (31.8%). At visit 3, the five commonest complaints were again similar to those at visit 1, and included general aches (40.1% of farmers at least some of the time) , joint stiffness (38.9%), tiredness (38.5%) , waking up tired (36.9%) and joint pain (34.9%).
5.1 Frequency of health questionnaire scores
The questions used in the health questionnaire were used to define dipper’s flu either a priori (this study) or matched as accurately as possible to previously described definitions from various sources including a textbook (Baxter et al, 2000) , a research report (Stephens at al, 1995a) and web-based definition (DoctorMyhill.co.uk, 2006: Appendix 38).
Health questionnaire scores for each of these definitions were then calculated and histograms of the frequency of these scores are shown for different dipper’s flu definitions: this study Figure 18, textbook definition Figure 19, research report Figure 20, and web-based Figure 21. There was little evidence that the dipper’s flu scores as calculated from these different definitions increased at visits 2 and visit 3 (Figures 18-21).
5.2 Categorisation of health questionnaire scores
Heath questionnaire scores were then divided into the following categories, no score, less than the median score and more than the median score, with the median score being defined by the score obtained at visit 1(pre-treatment visit ). At visit 2 and visit 3 the number of farmers with more than the median number of symptoms (for any dipper’s flu definition) was lower than the number at visit 1 (Figure 22). For example, approximately 40% of farmers at visit 1 had greater than the median dipper’s flu score (this study definition) but this decreased to approximately 25% at visits 2 and 3. There was thus little evidence to indicate that the farmers were complaining of more symptoms at visits 2 and 3. Further analysis was next carried out by categorising farmers into groups based upon median scores at visits 2 and 3, using the dipper’s flu definition from this study (Appendix 38).
5.2.1 Association between health questionnaire categories and demographic variables
There were no associations between the proportion of farmers with either no health questionnaire symptoms, or an above or below median dipper’s flu score at visits 2 and 3, and region, gender, age, current smoking or drinking habits or whether they were a contractor or not (Table 27). The proportion of farmers with more than the median number of symptoms was lower at visit 2 but not visit 3 in those farmers with a certificate of competence. The proportion of farmers with more than the median number of symptoms varied with self-reported health status at visit 1: farmers with poor/very poor health and with average health were more likely to have a score greater than the median, than those farmers whose health was good/very good at visit 1 (100% vs 61.5% vs 34.4% respectively at visit 2; p<0.05). However, these results are derived from only 2 farmers with poor or very poor health.
55

Sleep walking (26) Hallucinating (37)
Coughing up blood (49) W eeping (43)
Heart burn slowing (75) Vomiting (52)
Difficulty speaking (50) Distance judging (47)
Blue skin (69) Mouth saliva (66)
Stomach cramps (62) Skin eruptions (48)
Paleness (2) Earache (12)
Bowel movements (70) Ankle swelling (14)
Shakiness (57) Fever (1)
Tight stomach feeling (65) Nosebleeds (42)
Appetite loss (80) Shivering (15)
Chest pain (77) Tingling toes (40)
Nausea (27) Toe numbness (34)
Peeling skin (38) Stomach pain (23)
Problems seeing (25) Difficulty reading (68)
Heart beat speeding (82) Erection difficulties (32)
Hoarse voice (79) Flushing (24)
Sore hands (28) Blurred vision (9)
Sore feet (64) Diarrhoea (11)
Muscle twitching (17) Feeling dizzy (44)
Mouth ulcers (6) Bothered smells (13)
Feeling aggressive (63) Difficulty breathing (56) Light headedness (30)
Loss of sexual appetite (54) Chemical sensitivity (61) Losing track of time (41)
Ringing in ears (20) Sleeping a lot (78)
Dry mouth (46) Itching (71)
Cramps (73) Sweating (18)
Eye irritation (76) Upset stomach (39) Feeling unwell (51)
W heezing chest (83) Feeling hot/cold (21)
Feeling muscle weak (53) Feeling irritated (72)
Heartburn (35) Feeling weak (60)
Depressed (8) Pins and needles (5)
Sore throat (4) Thought lost (58)
Coughing phlegm (33) Runny nose (31)
Trouble sleeping (3) Coughing (10)
Muscle stiffness (81) Muscle pain (36)
Stuff nose (67) Headache (16) Sneezing (74)
Feeling lethargic (59) Joint pain (55)
Joint stiffness (19) W aking up tired (22)
General aches (29) Forgetting things (7)
Tiredness (45)
0 20 40 60 80 100
%
ii
All i
Never Some of the t me Most of the t me
of the t me
Figure 15 Responses to Health questionnaire at visit 1 (before treatment)
56

Coughing up blood (49) Sleep walking (26) Hallucinating (37)
Bowel movements (70) Earache (12) Vomiting (52)
Distance judging (47) Nosebleeds (42)
Paleness (2) Weeping (43)
Heart burn slowing (75) Difficulty speaking (50) Stomach cramps (62)
Ankle swelling (14) Blue skin (69)
Skin eruptions (48) Mouth saliva (66)
Problems seeing (25) Chest pain (77) Shakiness (57)
Peeling skin (38) Mouth ulcers (6)
Heart beat speeding (82) Tight stomach feeling (65)
Tingling toes (40) Fever (1)
Feeling dizzy (44) Toe numbness (34)
Sore hands (28) Shivering (15)
Erection difficulties (32) Appetite loss (80)
Difficulty reading (68) Losing track of time (41)
Diarrhoea (11) Stomach pain (23)
Sore feet (64) Difficulty breathing (56)
Nausea (27) Bothered smells (13)
Blurred vision (9) Loss of sexual appetite (54)
Upset stomach (39) Flushing (24)
Ringing in ears (20) Light headedness (30)
Feeling aggressive (63) Muscle twitching (17) Feeling irritated (72)
Sweating (18) Depressed (8)
Wheezing chest (83) Dry mouth
Chemical sensitivity (61) Heartburn (35)
Sleeping a lot (78) Cramps (73)
Pins and needles (5) Hoarse voice (79) Feeling weak (60)
Feeling hot/cold (21) Itching (71)
Thought lost (58) Coughing (10)
Trouble sleeping (3) Feeling muscle weak (53)
Feeling unwell (51) Forgetting things (7)
Coughing phlegm (33) Eye irritation (76)
Feeling lethargic (59) Sneezing (74)
Runny nose (31) Stuff nose (67)
Muscle pain (36) Sore throat (4)
Muscle stiffness (81) Joint pain (55)
Waking up tired (22) Headache (16)
Joint stiffness (19) General aches (29)
Tiredness (45)
0 20 40 60 80 100
%
ii
All i
Never Some of the t me Most of the t me
of the t me
Figure 16 Responses to Health Questionnaire at visit 2 (shortly after treatment)
57

Coughing up blood (49) Hallucinating (37)
Sleep walking (26) Blue sking (69)
Tight stomach feeling (65) Nosebleeds (42)
Weeping (43) Distance judging (47)
Ankle swelling (14) Vomiting (52)
Difficulty speaking (50) Difficulty reading (68)
Shivering (15) Bowel movements (70)
Peeling skin (38) Earache (12) Paleness (2)
Heart burn slowing (75) Mouth saliva (66)
Stomach cramps (62) Skin eruptions (48)
Fever (1) Heart beat speeding (82)
Chest pain (77) Mouth ulcers (6) Shakiness (57)
Flushing (24) Tingling toes (40)
Toe numbness (34) Sore hands (28)
Difficulty breathing (56) Problems seeing (25)
Stomach pain (23) Appetite loss (80)
Sore feet (64) Nausea (27)
Bothered smells (13) Feeling irritated (72)
Diarrhoea (11) Feeling dizzy (44)
Losing track of time (41) Muscle twitching (17)
Erection difficulties (32) Upset stomach (39)
Feeling aggressive (63) Chemical sensitivity (61)
Blurred vision (9) Light headedness (30)
Feeling hot/cold (21) Itching (71)
Dry mouth (46) Sleeping a lot (78)
Feeling unwell (51) Ringing in ears (20)
Loss of sexual appetite (54) Hoarse voice (79) Thought lost (58) Eye irritation (76)
Wheezing chest (83) Depressed (8)
Cramps (73) Sweating (18)
Feeling weak (60) Pins and needles (5)
Feeling muscle weak (53) Heartburn (35)
Coughing phlegm (33) Stuff nose (67) Sore throat (4) Coughing (10)
Forgetting things (7) Trouble sleeping (3)
Muscle pain (36) Runny nose (31)
Sneezing (74) Muscle stiffness (81) Feeling lethargic (59)
Headache (16) Joint pain (55)
Waking up tired (22) Tiredness (45)
Joint stiffness (19) General aches (29)
0 20 40 60 80 100
%
ii
All i
Never Some of the t me Most of the t me
of the t me
Figure 17 Responses to Health Questionnaire at visit 3 (2-3 weeks after treatment)
58

0 0
il 3 il 8 il
60 50 40 30 20 10
Freq
uenc
y
100
80
60
40
20
Visit 1 25th percent e = 50th percent e = 75th percent e = 15
Score
0 0
il 1 il 4 il
60 50 40 30 20 10
Freq
uenc
y
100
80
60
40
20
Visit 2 25th percent e = 50th percent e = 75th percent e = 11
Score
0
il 1 il 5 il
Freq
uenc
y
100
80
60
40
20
Visit 3 25th percent e = 50th percent e = 75th percent e = 11
0 10 20 30 40 50 60
Score
Figure 18 Histograms of health questionnaire symptom for dipper’s flu (this study definition)a,b
a Dipper’s flu defined in Appendix 38; b Visits 2 and 3 questionnaire scores limited to those obtained within 7 days and 10-28 days respectively after initial day of treatment
59

200
150
100
50
0
il 1 il 3 il 6
Freq
uenc
y
Visit 1 25th percent e = 50th percent e = 75th percent e =
0 5 10 15 20 25 30
Score
0
il 0 il 2 il 5
30.00 25.00 20.00 15.00 10.00 5.00 0.00
Freq
uenc
y
200
150
100
50
Visit 2 25th percent e = 50th percent e = 75th percent e =
Score
0
3 ililil
Freq
uenc
y
200
150
100
50
Visit 25th percent e = 0 50th percent e = 2 75th percent e = 4
0 5 10 15 20 25 30
Score
Figure 19 Histograms of health questionnaire symptom scores for dipper’s flu (Textbook
definition) a,b
a Dipper’s flu defined in Appendix 38 ;b Visits 2 and 3 questionnaire scores limited to those obtained within 7 days and 10-28 days respectively after initial day of treatment
60

Freq
uenc
y Fr
eque
ncy
200
150
100
50
0
200
150
100
50
0
50
ililil
ililil
Score 30 25 20 15 10
Visit 1 25th percent e = 0 50th percent e = 2 75th percent e = 5
Visit 2 25th percent e = 0 50th percent e = 1 75th percent e = 3
0 5 10 15 20 25 30
Score
0
ililil
Freq
uenc
y
200
150
100
50
Visit 3 25th percent e = 0 50th percent e = 1 75th percent e = 3
0 5 10 15 20 25 30
Score
Figure 20 Histograms of health questionnaire symptom scores for dipper’s flu (Research Report
definition)a,b
a Dipper’s flu defined in Appendix 38 ; b Visits 2 and 3 questionnaire scores limited to those obtained within 7
days and 10-28 days respectively after initial day of treatment
61

50 0
ililil
30 25 20 15 10
Freq
uenc
y
200
150
100
50
Visit 1 25th percent e = 1 50th percent e = 4 75th percent e = 7
Score
50 0
ililil
25 20 15 10
Freq
uenc
y
200
150
100
50
Visit 2 25th percent e = 0 50th percent e = 1 75th percent e = 6
Score
0
ililil
Freq
uenc
y
200
150
100
50
Visit 3 25th percent e = 0 50th percent e = 1.5 75th percent e = 5
0 5 10 15 20 25 30
Score
Figure 21Histograms of health questionnaire symptom scores for dipper’s flu (web-based
definition) a,b
a Dipper’s flu defined in Appendix 38; b Visits 2 and 3 questionnaire scores limited to those obtained within 7days and 10-28 days respectively after initial day of treatment
62

100
80 Dippers' flu - this study definition
(median score =10)
% 60
40
20
0 0 <median >median
Number of symptoms
100
80 Dippers' flu - Research report
(Median score = 3)
% 60
40
20
0 0 <median >median
Number of symptoms
100
80
60 %
40
20
0
100
80
60 %
40
20
0
Dippers' flu - Textbook (Median score=4)
VisiVisiVisi
t 1 t 2 t 3
0 <median >median
Number of symptoms
Dippers' flu - Web based (Median score = 5)
0 <median >median
Number of symptoms
Figure 22 Percentage of farmers with either no dipper’s flu symptoms, < median number of symptoms or
>median number of symptoms a,b,c
a Dipper’s flu defined in Appendix 38; b Visits 2 and 3 questionnaires limited to those obtained within 7 days and 10-28 days after initial day of treatment respectively; c Median score defined from visit 1 responses
63

Table 27 Variation in numbers of farmers with either no symptoms or a health questionnaire
dipper’s flu score above or below the median with potential confounders a
Variable >median score/<median score/no score (% >median score)
Item Description HQ visit 2b HQ visit 3c
Region Wales 34/31/18 (41.0) 32/31/17 (40.0) N West England 11/14/9 (32.4) 8/12/6 (30.8) S East England 6/1/0 (85.7) 4/3/0 (57.1)
Gender Male Female
48/41/24 (42.5) 3/5/3 (27.3)
41/43/19 (39.8) 3/3/4 (30.0)
Age <40 41-50 51-60 >61
11/9/7 (40.7) 11/12/5 (39.3) 18/19/8 (40.0) 11/6/7 (45.8)
10/11/4 (40.0) 10/8/5 (43.5) 14/21/7 (33.3) 10/6/7 (43.5)
Smoking Current smoker 5/5/2 (41.7) 2/6/3 (18.2) Ex-smoker 35/26/16 (45.5) 10/12/7 (34.5) Never 11/14/9 (32.4) 32/27/13 (44.4)
Current drinker Yes 43/38/23 (41.3) 36/41/19 (37.5) No 8/7/4 (42.1) 8/4/4 (50.0)
Certificate holderd
Yes No
11/24/16 (21.6) 40/22/11 (54.8)***
15/22/12 (30.6) 29/24/11 (45.3)
Contract dipper Yes No
2/2/0 (50.0) 49/44/27 (40.8)
3/0/1 (75.0) 41/46/22 (37.6)
Health statuse Very good/good Average Poor/very poor
33/37/26 (34.4) 16/9/1 (61.5) 2/0/0 (100.0)*
29/37/22 (33.0) 13/9/1 (56.5) 2/0/0 (100.0)*
Ever had dipper’s Yes 18/11/2 (58.1) 20/6/2 (71.4) flu No 24/30/23 (31.2)** 17/34/18 (24.6)*** Perceived sheep Low 13/23/8 (29.5) 8/20/9 (21.6) dip riskf Medium 14/16/8 (36.8) 14/15/9 (36.8)
High 21/6/10 (56.8)* 21/9/3 (63.6)**
a Dipper’s flu score (this study) defined in Appendix 38; b HQ visit 2 restricted to those questionnaires completed within 7 days after day of treatment; median score =6;c HQ visit 3 restricted to those questionnaires completed within 10-28 days after day of treatment median score =6; d Certificate of competence in handling pesticides;e Health status before treatment at visit 1; f Based upon scale used by Stephens et al, (1995a);max score=24; Low≤13, Medium 14-19; high ≥ 20. Significantly different *p<0.05, ** p<0.01, *** p<0.001
Farmers who reported having had dipper’s flu in the past were also more likely to have a score greater than the median than those who did not (58.1% vs 31.2% at visit 2; p<0.01). Those farmers who perceived a high sheep dip risk were similarly likely to have a score greater than the median than those with medium or low perceived risk (56.8% vs 36.8% vs 39.5% at visit; p<0.05).
5.2.2 Association between health questionnaire categories and exposures
The proportion of farmers with either no symptoms, or a score below the median for dipper’s flu or above the median dipper’s flu score was compared with self-reported exposures (Table 28). There was evidence that the treatment method was associated with differing proportion of farmers in these categories. When the analysis was restricted to just the three most used methods (injection, dip and pour-on) the difference in proportions was of borderline significance (p=0.06).
64

There were no associations between the product used and symptom reporting even when restricted to just avermectins, OPs, pyrethroids and triazines. For example, at visit 2 the proportion of farmers with a greater than median score was 34% for those who used OPs, 39% for avermectin use, 39% for pyrethroids and 60% for triazines. The number of farmers using triazines was small. Handling the concentrate or with splashing the product on the skin was not associated with symptom reporting (Table 28).
Table 28 Variation in numbers of farmers with either no symptoms or a health questionnaire
dipper’s flu score above or below median with self-reported exposures a
Variable >median score/<median score/no score (% >median score)
Item Description HQ visit 2b HQ visit 3c
Treatment method Injection Dip Pour-on Shower Mixed methods
6/4/7 (35.3) 16/21/10 (34.0) 28/15/8 (54.9) 0/2/0 (0) 0/4/2 (0)*
7/6/5 (38.9) 13/16/9 (34.2) 18/21/8 (38.3) 1/1/0 (50.0) 3/2/1 (50.0)
General product Non-OP OP Uncharacterised
32/29/19 (40.0) 15/17/8 (37.5) 3/0/0 (100.0)
29/29/16 (39.2) 12/15/7 (35.3) 2/2/0 (50.0)
Specific product Avermectin OP Pyrethroid Triazine
7/4/7 (38.9) 13/17/8 (34.2) 12/11/8 (38.7) 9/4/2 (60.0)
8/5/5 (44.4) 10/15/7 (31.3) 9/10/8 (33.3) 8/5/1 (57.1)
Concentrate handling Yes No
43/41/21 (41.0) 3/5/3 (27.3)
38/39/17 (40.4) 2/4/3 (22.2)
Product splashed on skin Yes No
33/27/15 (44.0) 15/18/10 (34.9)
22/31/13 (33.3) 17/14/8 (43.6)
a Dipper’s flu score (this study) defined in Appendix 38;b HQ visit 2 restricted to those questionnaires completed within 7 days after day of treatment; median score =6 ; c HQ visit 3 restricted to those questionnaires completed within 10-28 days after day of treatment, median score =6; Significantly different *p<0.05
5.2.3 Association between health questionnaire categories and endotoxin concentration in sheep dip
There were no associations between farmers with no health questionnaire symptoms, or a dipper’s flu score above or below the median and endotoxin concentration in sheep dip (Table 29).
Table 29 Variation in sheep dip endotoxin concentrations in farmers with no symptoms,
or a health questionnaire dipper’s flu score above or below median a
Dipper’s flu scoreb Mean ± SD (n) Endotoxin concentration (EU/mL) Visit 2c Visit 3d
No score 34681 (1) 22372±17408 (2) < Median 14380±10671 (9) 14117±15326 (2) >Median 25093±14125 (7) 24418±12635 (7)
a Dipper’s flu (this study) defined in Appendix 38; bMedian symptom score (of those farmers with one or more symptoms) was 6 for both visits 2 and 3; c HQ visit 2 restricted to those questionnaires completed within 7 days after day of treatment; d HQ visit 3 restricted to those questionnaires completed within 10-28 days after day of treatment; No significant difference in endotoxin concentration
65

5.2.4 Association between health questionnaire categoires and urinary pesticide metabolites
The proportion of farmers with either no score or above or below the median dipper’s flu score was not associated with either urinary concentrations of pyrethroid metabolites (Table 30), OP metabolites (Table 31) or the sum of OP metabolites (Table 32).
Table 30 Variation in numbers of farmers with either no score or a health questionnaire dipper’s
aflu score above or below median with urinary pyrethroid metabolite concentrations
Urine pyrethroids >median score/<median score/no score (% >median score)
Metabolite Levelb,c HQ visit 2c HQ visit 3d
PBA Not detected <90th percentile >90th percentile
25/26/17 (36.8) 14/9/6 (48.3) 3/1/0 (75.0)
23/24/16 (36.5) 6/12/4 (27.3) 3/1/0 (75.0)
cDCVA Not detected <90th percentile >90th percentile
35/27/19 (43.2) 0/0/1 (0) 7/9/3 (36.8)
27/31/15 (37.0) 0/0/1 (0) 5/6/4 (33.3)
tDCVA Not detected <90th percentile >90th percentile
38/31/18 (43.7) 0/1/2 (0) 4/4/3 (36.4)
27/33/17 (35.1) 0/2/0 (0) 5/2/3 (50.0)
cDBVA Not detected <90th percentile >90th percentile
37/35/22 (39.4) 2/1/1 (50.0) 3/0/0 (100.0)
30/35/20 (35.3) 0/2/0 (0) 2/0/0 (100)
a Dipper’s flu (this study) defined in Appendix 38; b Urine samples restricted to those collected at visit 2 within three days of last treatment and with a creatinine level between 3 and 30mmol/l; c90th percentile levels in non-occupationally exposed population (data provided by HSL) and are the following: PBA <1.9µmol/mol creatinine; cDCVA 0.3µmol/mol creatinine; tDCVA 0.5 µmol/mol creatinine; cDBVA <0.4 µmol/mol creatinine; c HQ visit 2 restricted to those questionnaires completed within 7 days after day of treatment; median score =6 ; d HQ visit 3 restricted to those questionnaires completed within 10-28 days after day of treatment; median score =6; No significant difference in symptom reporting
66

Table 31 Variations in numbers of farmers with either no score or a health questionnaire dipper’s
flu score above or below median with urinary OP metabolite concentrationsa,b,c
Urine OPs >median score/<median score/no score (% >median score)
Metabolite Level HQ visit 2 d HQ visit 3d
DEP not detected <90th percentile >90th percentile
32/23/15 (45.7) 4/7/3 (28.6) 6/6/5 (35.3)
26/25/14 (40.0) 4/4/3 (36.4) 2/8/3 (15.4)
DETP not detected <90th percentile >90th percentile
34/25/17 (44.7) 1/1/0 (50.0) 7/10/6 (30.4)
26/28/15 (37.7) 2/0/0 (100.0) 4/9/5 (22.2)
DEDTP not detected <90th percentile >90th percentile
41/36/23 (41.0) 1/0/0 -
31/37/20 (35.2) 1/0/0 (100) -
DMP not detected <90th percentile >90th percentile
29/12/12 (54.7) 11/20/10 (26.8) 2/4/1 (28.6)*
21/14/13 (43.8) 9/20/6 (25.7) 2/3/1 (33.3)
DMTP not detected <90th percentile >90th percentile
25/26/13 (39.1) 10/5/5 (50.0) 7/5/5 (41.2)
17/29/12 (29.3) 9/5/3 (52.9) 6/3/5 (42.9)
DMDTP not detected <90th percentile >90th percentile
41/35/23 (41.4) -1/1/0 (50.0)
32/36/20 (36.4) -0/1/0 (0)
a Dipper’s flu defined in Appendix 38 ; b Urine samples restricted to those collected at visit 2 within three days of last treatment and with a urinary creatinine level between 3 and 30mmol/l; c90th percentile levels in non-occupationally exposed population (data provided by HSL) and are for DMP, DMTP and DMDTP 35,15 and 3 µmol/mol creatinine respectively and for DEP, DETP and DEDTP 9,4 and 7 µmol/mol creatinine; d HQ visits 2 and 3 restricted to those visited within 7 and 10-28 days after day of treatment respectively, median score =6 ; Significantly different * p<0.05.
5.2.5 Association between health questionnaire categories and butyrylcholinesterase activity
The proportion of farmers with either no score, or a score above or below the median dipper’s flu score was not associated with changes in butyrylcholinesterase activity (as assessed by the scores in those farmers whose butyrylcholinesterase levels were or were not reduced by 15% between visits 1 and 2: Table 33).
67

Table 32 Variations in numbers of farmers with no score or a health questionnaire dipper’s flu
score above or below median with total urinary OP and pyrethroid metabolite aconcentrations
Total urinary OPs >median score/<median score/no score (% >median score)
Metabolite Levelb HQ visit 2c HQ visit 3d
Methyl (DMP+DMTP+DMDTP)
not detected <90th percentile >90th percentile
19/8/9 (52.8) 21/23/14 (36.2) 2/5/0 (28.6)
12/12/9 (36.4) 17/22/11 (34.0) 3/3/0 (50.0)
Ethyl (DEP+DETP+DEDTP)
not detected <90th percentile >90th percentile
27/21/13 (44.3) 12/9/6 (44.4) 3/6/4 (23.1)
21/23/13 (36.8) 10/9/4 (43.5) 1/5/3 (11.1)
Diazinon (DEP+DETP)
Not detected <90th percentile >90th percentile
27/21/13 (44.3) 11/6/4 (52.4) 4/9/6 (21.1)
21/23/13 (36.8) 10/5/3 (55.6) 1/9/4 (7.1)
Methyl + Ethyl not detected <90th percentile >90th percentile
16/7/8 (51.6) 21/24/14 (35.6) 5/5/1 (41.6)
12/10/7 (41.4) 17/22/12 (33.3) 3/5/1 (33.3)
None 9/6/6 (42.9) 10/6/6 (45.5)
OP+ pyrethroide Pyrethroid only OP only
7/1/2 (70.0) 12/18/8 (31.6)
2/4/1 (28.6) 11/16/7 (32.4)
OP+ pyrethroid 14/11/7 (43.8) 9/11/6 (34.6)
a Dipper’s flu defined in Appendix 38 ; b Urine samples restricted to those collected at visit 2 within three days of last treatment and with a urinary creatinine level between 3 and 30mmol/l;90th percentile levels in non-occupationally exposed population (data provided by HSL) are the following for methyl, ethyl, diazinon, and methyl+ethyl <56,
c<19, <13 and <77µmol/mol creatinine respectively ; HQ visits 2 and 3 restricted to those within 7and 10-28 days after day of treatment; median score =6; e categorised based on the presence or absence of urinary OPs or pyrethroids. No significant difference in symptom reporting
Table 33 Variations in numbers of farmers with either no symptoms or a dipper’s flu health
questionnaire score above or below median with changes in butyrylcholinesterase activity a
Cholinesterase activity change >median score/<median score/no score (% >median score) HQ visit 2b HQ visit 3c
Reduction 1/4/0 (20.0) 1/2/1 (25.0)
No reduction 30/26/19 (40.0) 27/24/17 (39.7)
a Dipper’s flu (this study) defined in Appendix 38;b HQ visit 2 restricted to those questionnaires completed within 7 days after day of treatment; median score =6 ; c HQ visit 3 restricted to those questionnaires completed within 10-28 days after day of treatment; median score =6 d cholinesterase activity categorised as reduced if activity fell by more than 15% between visits 1 and 2 (HSL 2005); No significant difference in symptom reporting
5.3 Health questionnaire scores
Health questionnaire scores calculated using different dipper’s flu definitions (appendix 38) are shown in Table 34. The mean score at visit 1 for this study’s definition of dipper’s flu was 10.2±8.9 (11% of the maximum score), but 8.0±9.9 at visit 2, and 8.0±10.1 at visit 3: the difference in scores between visits 1 and 3 was significant (p<0.01). Similarly for the other
68

definitions of dipper’s flu (Appendix 38), health questionnaire scores at visits 2 and 3 were lower than those at visit 1, but this was significant between visit 1 and visit 2 only for the web-based definition (p<0.01), and between visit 1 and visit 2 for all three definitions. Only the scores derived from this study’s definition of dipper’s flu are used for further analysis.
Table 34 Variation in health questionnaire scores based upon dipper’s flu definitions with
tsa,b visi
Dipper’s flu definition
Mean score ±SD (n) Mean score difference in paired samples, 95%CI, (n)
Visit 1 Visit 2 Visit 3 Visits 1 and 2 Visits 1 and 3 Visits 2 and 3
This study c 10.2±8.9 (752)
8.0±9.9 (124)
8.0±10.1 (110)
1.4, -0.1-3.0 (118)
2.2, 0.6-3.8 (107)**
0.6,-0.5-1.7 (108)
Textbookd 3.5±3.2 (760)
3.0±3.6 (128)
3.0±3.7 (112)
0.5, -0.2-1.1 (122)
0.9, 0.3-1.5 (107)**
0.3, -0.2-0.8 (110)
Research Reporte
3.0±3.0 (768)
2.5±3.4 (130)
2.5±3.5 (112)
0.4, -0.1-0.9 (124)
0.6, 0.1-1.1 (110)*
0.3, -0.2-0.6 (111)
Web-basedf 4.5±4.0 (768)
3.3 ±4.2 (129)
3.4±4.3 (112)
1.0, 0.4-1.6 (125)**
1.1, 0.5-1.8 (110)**
0.3, -0.3-0.7 (111)
a Dipper’s flu defined in Appendix 38; bHQ visits 2 and 3 restricted to those questionnaires completed within 7 days and 10-28 days after day of treatment respectively; Number of symptoms were 29, 9,8,11 respectively for definitions from this study, Hunters, IOH and web-based; Significantly different *p<0.05, ** p<0.01
5.3.1 Associations between health questionnaire scores and demographic variables
The dipper’s flu score (this study definition) was associated with study region at visit 1, but not at visits 2 or 3 (Table 35). The visit 1 score in north west England was lower than that found in south east England or Wales (7.2±7.3 vs 10.5±8.3 vs 11.1±9.4 respectively; p<0.001). Otherwise dipper’s flu scores were not associated with gender, age, current smoking or drinking habits. They were associated with being a contractor (at visit 3), having a certificate of competence at visit 1, health status at visit 1, previous history of dipper’s flu and perception of risk to sheep dip on visits 1 and 3 only (Table 35). Farmers who reported their health as poor or very poor at visit 1 were more likely to have high symptom scores not only at visit 1 but also visits 2 and 3 (although there were only two farmers at visits 2 and 3 with poor/very poor health at visit 1). At visit 1 the mean score of those farmers with poor/very poor health was 18.1±11.7 but was 16.0±10.4 for those with average health and 8.2±7.2 for those with very good/good health (p<0.001). A previous history of dipper’s flu was also associated with higher dipper’s flu scores at all three visits (e.g. 13.4±10.7 vs 9.1±8.0 at visit 1; p<0.001).
69

Table 35 Variation in health questionnaire dipper’s flu scores with demographic variablesa
Variable Mean ±SD (n) Item Description HQ visit 1 HQ visit 2b HQ visit 3c
Region Wales N West England S East England
11.1±9.4 (429) 7.2±7.3 (152) 10.5±8.3 (171)***
8.7±10.9 (83) 5.6±6.2 (34) 12.1±10.2 (7)
8.1±10.1 (80) 6.3±7.5 (26) 8.7±7.1 (7)
Gender Male Female
9.9±8.8 (636) 11.6±9.6 (116)
8.2±9.9 (113) 6.3±9.8 (11)
8.1±9.6 (103) 4.0±5.4 (10)
Age
<40 41-50 51-60 >61
8.5±8.0 (91) 9.3±8.1 (192) 10.7±9.0 (255) 10.9±9.6 (207)
8.9±12.2 (27) 8.7±10.0 (28) 7.9±9.8 (45) 6.5±7.0 (24)
8.3±11.1 (25) 8.2±10.0 (23) 7.7±9.0 (42) 6.6±7.8 (23)
Smoker Current Ex Never
10.9±10.2 (107) 10.7±8.7 (228) 9.8±8.6 (415)
8.2±8.7 (12) 6.4±9.1 (34) 8.7±10.4 (77)
3.7±5.6 (11) 6.6±7.1 (29) 8.8±10.5 (72)
Current drinker
Yes No
10.1±8.9 (631) 10.6±9.2 (119)
7.7±9.6 (104) 9.7±11.5 (19)
7.5±9.1 (96) 9.1±11.4 (16)
Certificate Holderd
Yes No
8.6±8.1 (238) 11.1±9.1 (504)***
6.4±11.2 (51) 9.2±8.7 (73)
7.4±11.3 (49) 7.9±7.7 (64)
Contract dipper
Yes No
8.9±6.8 (14) 10.3±8.9 (728)
17.0±23.4 (4) 7.7±9.2 (120)
18.0±20.8 (4) 7.3±8.7 (109)*
Health Statuse
V. good/good Average Poor/v poor
8.2±7.2 (562) 16.0±10.4 (160) 18.1±11.7 (26)***
6.3 ±8.8 (93) 12.3±9.8 (26) 34.0±12.7 (2)***
6.4±8.8 (88) 10.9±8.4 (23) 27.5±21.9 (2)**
Ever had dipper’s flu
Yes No
13.4 ±10.7 (166) 9.1 ±8.0 (502)***
13.2±12.6 (31) 5.5±7.3 (77)***
13.2±12.1 (28) 5.1±6.3 (69)***
Perceived sheep dip riskf
Low Medium High
8.1±7.3 (237) 9.1±7.5 (263) 13.5±10.8 (225)***
5.1±5.6 (44) 7.1±8.5 (38) 11.7±13.2 (37)
4.4±4.6 (37) 6.3±6.8 (38) 13.4±13.2 (33)**
a Dipper’s flu (this study) defined in Appendix 38; max score =87 b HQ visit 2 restricted to those questionnaires completed within 7 days after day of treatment; c HQ visit 3 restricted to those questionnaires completed within 10-28 days after day of treatment ; dholder of certificate of competence for handling pesticides; e Before treatment at visit 1; fBased upon scale used by Stephens et al, (1995a);max score=24, Low ≤ 13, medium 14-19, high ≥ 20. Significantly different * p,0.05; **p<0.01; *** p<0.001
Dipper’s flu scores at visits 1 and 3 (but not visit 2) were significantly associated with high perceived risk of sheep dip toxicity. For example, at visit 1, the mean score in those farmers with high perceived risk was 13.5±10.8, but 9.1±7.5 and 8.1±7.3 in those with medium and low perceived risk (p<0.001).
5.3.2 Associations between health questionnaire scores and pesticide exposures
There were no associations between dipper’s flu score at visits 2 and 3 and the treatment method, the product used, concentrate handling or whether the product was splashed onto the farmers’ skin (Table 36).
70

20
30
40
Table 36 Variation in health questionnaire dipper’s flu scores with self-reported exposures a
Variable Mean ±SD (n) Item Description HQ visit 2b HQ visit 3c
Treatment method
Injection Dip
5.6±7.2 (17) 7.0±10.1 (47)
7.4±7.7 (18) 7.0±9.9 (38)
Pour-on 10.3±10.8 (51) 8.4±10.4 (47) Shower 6.0±0 (2) 6.0±5.7 (2) Mixed methods 2.8 ±2.6 (6) 6.8±4.2 (6)
General Non-OP 7.7±9.2 (80) 7.7±9.2 (74) Product OP 7.7±10.8 (40) 7.4±10.2 (34)
Uncharacterised 18.0±11.0 (3) 8.3±5.2 (4) Specific Avermectin 6.2±7.4 (18) 8.0±8.0 (18) product OP 6.4±8.2 (38) 6.7±6.8 (32)
Pyrethroid 8.4±10.6 (31) 7.0±10.4 (27) Triazine 11.5±11.4 (15) 11.4 ±11.7 (14)
Concentrate Yes 8.1±9.9 (105) 7.8±9.4 (94) handling No 5.1±6.0 (11) 4.2±4.9 (9) Product splashed Yes 8.3±10.9 (75) 7.3±10.2 (66) on skin No 7.7±8.4 (43) 8.0±8.4 (39)
a Dipper’s flu (this study) defined in Appendix 38; max score = 87; b HQ visit 2 restricted to those questionnaires completed within 7 days after day of treatment; c HQ visit 3 restricted to those questionnaires completed within 10-28 days after day of treatment; No significant difference in symptom scores
5.3.3 Associations between health questionnaire scores and endotoxin concentration in sheep dip
There was no association between dipper’s flu scores at visits 2 and 3 and endotoxin concentrations in sheep dip (Figure 23).
50
Visir p
t 2 =0.19; =0.46
50
Visir p
t 3 =0.34; =0.25 40
30
Sco
re
Sco
re
20
10 10
0 0
10000 20000 30000 40000 50000 10000 20000 30000 40000 50000
Endotoxin concentration (EU/ml) Endotoxin concentration (EU/ml)
Figure 23 Health questionnaire score at visits 2 and 3 by endotoxin concentration in sheep dip
after treatment a,b
a Total sum of symptoms for dipper’s flu (this study defined in Appendix 38); b Visits 2 and 3 questionnaires limited to those obtained within 7 days and 10-28 days after initial day of treatment respectively
71

5.3.4 Associations between health questionnaire scores and urinary pesticide metabolites.
There was no association between health scores at visits 2 and 3 and urinary PBA, cDCVA and tDCVA concentrations (Table 37).
Table 37 Variation in health questionnaire Dipper’s flu scores with urinary pyrethroid metabolite
concentrations a,b,c
Urine pyrethroids Mean score ±SD (n) Metabolite Leveld HQ visit 2 HQ visit 3
PBA Not detected <90th percentile >90th percentile
7.0±8.7 (68) 9.6±12.0 (29) 17.0±12.3 (4)
6.3±8.1 (63) 8.3±11.8 (22) 13.3±8.1 (4)
cDCVA Not detected <90th percentile >90th percentile
8.4±10.4 (81) 0 (1) 7.5±8.4 (19)
7.3±9.5 (73) 0 (1) 6.3±7.3 (15)
tDCVA Not detected <90th percentile >90th percentile
8.4±10.1 (87) 0.7±1.2 (3) 7.6±10.1 (11)
7.2±9.5 (77) 1.5±0.71 (2) 7.6±7.4 (10)
cDBVA Not detected <90th percentile >90th percentile
7.3±8.8 (94) 10.3±9.2 (4) 31.7±20.0 (3)***
6.5±8.0 (85) 2 (2) 35.0±18.4 (2)***
a Dipper’s flu (this study) defined in Appendix 38; b Urine samples restricted to those collected at visit 2 within three days of last treatment and with a creatinine level between 3 and 30mmol/l; c HQ visits 2 and 3 restricted to those questionnaires completed within 7 and 10-28 days after day of treatment respectively; d 90th percentile levels in non-occupationally exposed population (data provided by SL) and are the following: BPA <1.9µmol/mol creatinine; cDCVA 0.3�µmol/mol creatinine; tDCVA 0.5 µmol/mol creatinine; cDBVA <0.4 µmol/mol creatinine; Significantly different ***p<0.001
There was evidence, albeit based upon small numbers, that the visit 2 score was higher and exhibited a dose response in those farmers with high concentrations of cDBVA. Mean dipper’s flu scores were 7.3±8.6, 10.3±9.2 and 31.7±20.0 in those farmers with no detectable cDBVA, detectable cDBVA but below the 90th percentile level, and detectable cDBVA above the 90th
percentile level respectively (p=0.04; Table 37).
There were no associations between urinary OP metabolites and dipper’s flu scores at visit 2 and visit 3 (Table 38). Neither were there any associations between summed OP metabolites (methyl, ethyl, diazinon based, or total methyl and ethyl) and dipper’s flu scores at visits 2 and 3 (Table 39) except for visit 3 in which scores were lower in farmers with high levels of metabolites that could have been derived from diazinon (Table 39). There was no association between dipper’s flu scores and the presence or absence of pyrethroid or OP metabolites in urine (Table 39)
72

Table 38 Variation in health questionnaire dipper’s flu scores with urinary OP metabolite
concentrationsa,b,c
Urine OPs Mean score ±SD (n) Metabolite Leveld HQ visit 2 HQ visit 3
DEP not detected <90th percentile >90th percentile
9.3±11.2 (70) 4.6±4.6 (14) 6.2±7.0 (17)
8.0±10.0 (65) 6.1±7.2 (11) 3.1±3.0 (13)
DETP not detected <90th percentile >90th percentile
8.2±9.3 (76) 28.5±33.2 (2) 6.0±8.3 (23)***
6.9±8.4 (69) 30.0±25.5 (2) 5.1±6.9 (18)
DEDTP not detected <90th percentile >90th percentile
8.1±10.0 (100) 16 (1) -
6.9±9.1 (88) 21 (1) -
DMP not detected <90th percentile >90th percentile
10.0±10.2 (53) 5.6±8.8 (41) 9.0±13.1 (7)
8.0±9.2 (48) 5.5±8.9 (35) 8.7±10.8 (6)
DMTP not detected <90th percentile >90th percentile
8.4±10.8 (64) 7.2±7.1 (20) 8.2±10.4 (17)
6.8±9.8 (58) 8.0±8.0 (17) 7.2±8.1 (14)
DMDTP not detected <90th percentile >90th percentile
8.1±10.1 (99) -8.0±5.7 (2)
7.1±9.2 (88) -6 (1)
a Dipper’s flu (this study) defined in Appendix 38; b Urine samples restricted to those collected at visit 2 within three days of last treatment and with a creatinine level between 3 and 30mmol/l; c HQ visits 2 and 3 restricted to those questionnaires completed within 7 and 10-28 days after day of treatment respectively; d 90th percentile levels in non-occupationally exposed population (data provided by HSL) and are the following: DMP 35 µmol/mol creatinine; DMTP 15 µmol/mol creatinine; DMDTP 3 µmol/mol creatinine; DEP 9 µmol/mol creatinine; DETP 4 µmol/mol creatinine; DEDTP 7 µmol/mol creatinine. Significantly different ***p<0.001
5.3.5 Associations between health questionnaire scores and butyrylcholinesterase activity
There were no associations between dipper’s flu scores and changes in butyrylcholinesterase activity as assessed by the scores in those farmers whose cholinesterase levels were or were not reduced by 15% between visits 1 and 2 (Table 40)
73

Table 39 Variation in health questionnaire dipper’s flu scores with total urinary OP and
pyrethroid metabolite concentrations a,b,c
Total urinary OPs Mean score ±SD (n) Metabolite Leveld HQ visit 2 HQ visit 3
Methyl (DMP+DMTP+DMDTP)
not detected <90th percentile >90th percentile
10.6±11.1 (36) 6.5±8.7 (58) 9.3±12.9 (7)
8.0±10.0 (33) 6.0±8.5 (50) 10.7±9.6 (6)
Ethyl (DEP+DETP+DEDTP)
not detected <90th percentile >90th percentile
8.5±9.8 (61) 9.1±11.8 (27) 4.2±5.5 (13)
7.1±8.7 (57) 8.8±11.3 (23) 2.7±3.0 (9)
Diazinon (DEP+DETP)
not detected <90th percentile >90th percentile
8.5±9.8 (61) 10.7±12.8 (21) 4.1±5.1 (19)
7.1±8.7 (57) 10.7±12.0 (18) 2.4±2.7 (14)*
Methyl + Ethyl not detected <90th percentile >90th percentile
10.8±11.7 (31) 6.5±8.7 (59) 9.5±10.7 (11)
8.9±10.4 (29) 5.9±8.4 (51) 8.1±8.6 (9)
OP+ pyrethroidd
None Pyrethroid only OP only OP+ pyrethroid
10.3±12.3 (21) 11.8±10.9 (10) 5.2±5.7 (38) 9.1±11.5 (32)
9.5±11.3 (22) 6.7±7.2 (7) 4.6±5.1 (34) 8.3±11.2 (26)
a Dipper’s flu (this study) defined in Appendix 38; b Urine samples restricted to those collected at visit 2 within three days of last treatment and with a creatinine level between 3 and 30mmol/l; b HQ visits 2 and restricted to those questionnaires completed within 7 and 10-28 days after day of treatment respectively; d 90th percentile levels in non-occupationally exposed population (data provided by HSL) and are the following: methyl <56µmol/mol creatinine ; ethyl <19 µmol/mol creatinine; diazinon <13µmol/mol creatinine; methyl+ethyl <77 µmol/mol creatinine; d
categorised based on the presence or absence of urinary OPs or pyrethroids. Significantly different *p<0.05
Table 40 Variation in health questionnaire dipper’s flu scores
ty a,b with changes in butyrylcholinesterase activi
Cholinesterase Mean (±SD) score (n) categoryc HQ visit 2 HQ visit 3 Reduction 2.6±2.5 (5) 3.3±5.2 (4)
No reduction 8.2±10.3 (75) 8.0±10.0 (68) a Dipper’s flu (this study) defined in Appendix 38; b HQ visits 2 and 3 restricted to those questionnaires completed within 7 and 10-28 days after day of treatment respectively; c Butyrylcholinesterase activity categorised as reduced if activity was reduced by more than 15% between visits 1 and 2 (Health and Safety Laboratory, 2005); No significant differences in symptom scores
74

6 DESCRIPTIVE ANALYSIS OF HEALTH EFFECTS
6.1 Clinical Biochemistry
Results of clinical biochemistry tests at visit 2 are shown in Table 41. More than 10% of the results for CRP (approximately 14%), creatinine (approximately 12%) and IgE (approximately 21%) were higher than the reference range. For subsequent comparisons, clinical biochemistry results were then characterised into two groups based upon whether the values were outside the reference range.
Table 41 Results of clinical biochemistry at visit 2a
Analyte Reference range Mean (n) Min-max N (%) > range < Range
CRP <6 mg/l 4.5±7.3 (115) 0-65 16 (13.9) 0 (0)
Amylase 10-95 IU/l 55.0±18.7 (135) 26-142 4 (3.0) 0 (0)
Albumin 35-50g/l 45.7±2.6 (135) 37-53 4 (3.0) 0 (0)
Creatinine 70-120 µmol/l 98.3±15.9 (130) 71-154 16 (12.3) 0 (0)
Alk phos 30-115 IU/l 76.6±22.0 (135) 42-166 8 (5.9) 0 (0)
ASP 25-45 IU/l 24.4±5.7 (133) 13-45 0 (0) 0 (0)
Bilirubin 1-22 µmol/l 11.0±6.0 (135) 3-37 8 (5.9) 0 (0)
Total protein 60-80 g/l 73.9±5.1 (133) 58-86 11 (8.3) 2 (1.5)
Globulin 20-35 g/l 28.2±3.6 (133) 19-38 3 (2.3) 1 (0.8)
IgE <81 kU/l 79.8± 127.0 (133) 2.5-809 28 (21.1) 0 (0) aVisit 2 occurred immediately after day after treatment
6.2 Haematology
Results for full blood count at visit 2 are shown in Table 42. Table 42
Full blood count at visit 2 a
Analyte Reference rangeb Mean (n) Min-max N (%) > range < range
Hb Female 11.5-15.5 g/dl Male 13.0-16.5 g/dl
14.8±1.2 (134) 10.1-17.3 5 (3.7) 7 (5.2)
RBC 4.2-6.9 1012/l 4.9±0.4 (134) 3.7-5.9 0 (0) 5 (3.7)
Hct Female 0.30-0.48 Male 0.34-0.50
0.44±0.03 (134) 0.33-0.51 3 (2.2) 1 (0.7)
MCV 76-100 fl 90.6±4.6 (134) 69-100 0 (0) 2 (1.5)
MCH 27-32 pg 30.3±1.8 (134) 21.3-35.2 20 (14.9) 4 (3.0)
Platelets 150-350 109/l 254±51(134) 148-440 6 (4.5) 2 (1.5)
WBC 4.3-10.8 109/l 6.3±1.7(134) 3.5-14.9 3 (2.2) 8 (6.0)
Neutrophils 2-8 109/l 3.6±1.2 (128) 1.6-8.1 1 (0.8) 8 (6.3)
Lymphocytes 1-4 109/l 2.0±0.6 (128) 0.9-4.5 2 (1.6) 2 (1.6)
Monocytes 0.1-0.8 109/l 0.5±0.2 (128) 0.1-1.2 6 (4.7) 0 (0)
Eosinophils 0.1-0.5 109/l 0.2±0.2 (128) 0.01-2.4 6 (4.7) 24 (18.8)
Basophils 0.01-0.1 109/l 0.05±0.02 (128) 0.01-0.18 4 (3.1) 0 (0)
a Visit 2 occurred immediately after day after treatment b As provided by the laboratory
75

Approximately 15% of the MCH results were higher than the reference range and approximately 19% of eosinophil results lower than the reference range. For subsequent comparisons haematological results have been characterised into two groups based upon whether the values were outside the reference range for MCH and eosinophils.
6.3 Temperature
There was little evidence of a change in body temperature during the week after treatment (Figure 24). Assuming that a temperature above 37.7oC was higher than normal, there were two subjects with high temperatures in the morning (one on day 2, the other on day 4). Temperatures above 37.7 o Celsius in the evening were recorded twice on days 1, 2, 3 and 4 and once on days 6 and 7. There were three reports of a temperature above 38.2oC.
38
37
36
35
34 0 1 2 3 4 5 6 7
o
ii
Tem
pera
ture
( C
)
morn ng even ng
Day after treatment
Figure 24 Farmers’ morning and evening temperature by day after treatment
6.4 Associations between health effects and diary symptom complex scores.
In general, there were no associations between clinical biochemical or haematological results outside the reference range and whether the farmer reported two or more symptom complexes, one symptom complex, or no symptom complex in the diary. More farmers with 2 or more symptom complexes on day 1 had elevated creatinine results (50.0% vs 19.3%; p<0.05) and the overall distribution of creatinine results varied on day 4 (Table 43).
Similarly there were no associations between symptom complex scores and clinical biochemical or haematological results outside the reference range save that for farmers with high creatinine levels had higher symptom complex scores on day 1 (1.6±1.7 vs 0.9±1.5 p<0.05; Table 44).
76

Table 43 Variation in numbers of farmers with either two or more diary symptom complexes, one symptom complex or no symptom complexes with
aclinical biochemistry and haematology categories
Analyte Level Farmers with two or more symptom complexes/one symptom complex/ no symptom complexes (% two or more symptom complexes) Day 1 Day 2 Day 3 Day 4 Day 5 Day6 Day 7
CRP >reference range In reference range
5/3/7 (33.3) 21/6/59 (21.9)
5/6/5 (31.3) 29/17/51 (29.9)
4/4/8 (25.0) 19/15/63 (19.6)
3/3/10 (18.8) 20/11/66 (20.6)
3/1/12 (18.8) 18/12/66 (18.8)
3/2/11 (18.8) 12/16/68 (12.5)
3/2/11 (18.8) 12/16/68 (12.5)
Creatinine >reference range In reference range
8/2/6 (50.0) 21/23/65 (19.3)*
7/4/5 (43.8) 29/23/60 (25.9)
4/5/7 (25.0) 20/17/75 (67.0)
3/6/7 (18.8) 21/12/79 (18.8)*
2/3/11 (12.5) 22/13/76 (19.8)
1/3/12 (6.3) 18/14/79 (16.2)
1/3/12 (6.3) 18/14/79 (16.2)
IgE >reference range In reference range
10/3/14 (51.9) 18/20/63 (17.8)
11/6/11 (39.3) 26/24/53 (25.2)
9/5/14 (32.1) 18/17/68 (17.5)
8/5/15 (28.6) 18/14/71 (17.5)
6/2/20 (21.4) 18/13/71 (17.6)
3/5/20 (10.7) 15/13/74 (14.7)
3/5/20 (10.7) 15/13/74 (14.7)
MCH >reference range In reference range
3/4/13 (15.0) 23/22/59 (22.1)
2/6/12 (10.0) 33/23/50 (30.8)
3/4/13 (15.0) 21/19/67 (19.6)
4/1/15 (20.0) 19/18/70 (17.8)
3/2/15 (15.0) 19/15/72 (17.9)
3/1/16 (15.0) 14/18/74 (13.2)
3/1/16 (15.0) 14/18/74 (13.2)
Eosinophils <reference range In reference range
6/1/15 (27.3) 18/24/52 (19.1)
7/3/12 (31.8) 26/24/47 (26.8)
5/4/13 (22.7) 17/18/62 (17.5)
4/3/15 (18.2) 16/15/66 (16.5)
5/4/13 (22.7) 16/11/69 (16.7)
4/2/16 (18.2) 13/16/67 (13.5)
4/2/16 (18.2) 13/16/67 (13.5)
a Categories obtained using reference range provided by the laboratory that carried out the analyses; Significantly different *p<0.05
77

Table 44 aVariation in diary symptom complex score with clinical biochemistry and haematology categories
Analyte Level Diary symptom complex score (mean ±SD (n) Day 1 Day 2 Day 3 Day 4 Day 5 Day6 Day 7
CRP >reference range In reference range
1.2±1.6 (15) 0.9±1.6 (96)
1.3±1.2 (16) 1.2±1.7 (97)
1.1±1.5 (16) 0.9±1.7 (97)
0.8±1.3 (16) 0.8±1.5 (97)
0.8±2.0 (16) 0.7±1.4 (96)
0.9±2.0 (16) 0.6±1.2 (96)
1.1±2.5 (16) 0.5±1.2 (97)
Creatinine >reference range In reference range
1.6±1.7 (16) 0.9±1.5 (109)*
1.8±1.9 (16) 1.0±1.5 (112)
1.4±2.1 (16) 0.8±1.5 (112)
1.3±2.0 (16) 0.7±1.2 (112)
0.8±1.7 (16) 0.7±1.4 (111)
0.6±1.7 (16) 0.6±1.3 (111)
0.7±2.0 (16) 0.6±1.4 (112)
IgE >reference range In reference range
1.0±1.3 (27) 0.9±1.5 (101)
1.2±1.2 (28) 1.1±1.7 (103
1.1±1.5 (28) 0.9±1.7 (103)
0.9±1.2 (28) 0.7±1.4 (103)
0.6±1.1 (28) 0.7±1.5 (102)
0.5±0.9 (28) 0.6±1.4 (102)
0.5±1.1 (28) 0.6±1.6 (102)
MCH >reference range In reference range
1.0±2.2 (20) 0.9±1.4 (104)
1.0±2.0 (20) 1.1±1.5 (107)
0.9±1.9 (20) 0.9±1.5 (107)
0.7±1.4 (20) 0.7±1.3 (107)
0.5±1.1 (20) 0.7±1.3 (106)
0.5±1.1 (20) 0.6±1.2 (106)
0.4±1.0 (20) 0.6±1.4 (106)
Eosinophils <reference range In reference range
0.9±1.6 (22) 0.9±1.6 (94)
1.3±1.9 (22) 1.1±1.5 (97)
1.0±1.7 (22) 0.8±1.6 (97)
0.8±1.6 (22) 0.7±1.2 (97)
1.0±1.7 (22) 0.6±1.2 (96)
0.6±1.3 (22) 0.6±1.2 (96)
0.5±1.2 (22) 0.6±1.4 (96)
a Categories obtained using reference range provided by the laboratory that carried out the analyses; Significantly different *p<0.05
78

6.5 Associations between health effects and health questionnaire scores
There were few associations between health effects and the numbers of farmers with no health questionnaire symptoms, or a dipper’s flu score above or below the median at visits 2 and 3. Eosinophil levels were significantly associated with dipper’s flu score at visit 3 (Table 45). All four subjects with eosinophil levels higher than the reference range also had a health score greater than the median (Table 45).
Table 45 Variation in numbers of farmers with no symptoms, or a health questionnaire
dipper’s flu score above or below median with clinical biochemistry and haematology categoriesa,b,
Analyte Level >median score/<median score/no score (% >median score) HQ visit 2c HQ visit 3d
CRP >reference range In reference range
7/7/2 (43.8) 29/27/19 (38.7)
6/3/3 (50.0) 23/33/16 (31.9)
Creatinine >reference range In reference range
9/4/2 (60.0) 31/35/23 (34.8)
8/5/1 (57.1) 29/36/19 (34.5)
IgE >reference range In reference range
7/12/4 (30.4) 35/32/19 (40.7)
11/7/4 (50.0) 27/35/17 (34.2)
MCH <reference range In reference range > reference range
0/0/1 (0) 37/33/21 (40.7) 4/9/2 (26.7)
0/0/1 (0) 31/36/17 (36.9) 4/9/2 (26.7)
Eosinophils <reference range In reference range >reference range
9/9/2 (45.0) 30/26/20 (39.5) 1/4/1 (16.7)
3/12/3 (16.7) 26/30/16 (36.1) 4/0/0 (100.0)*
a Dipper’s flu (this study) defined in Appendix 38;b Categories obtained using reference range provided by the laboratory that carried out the analyses; c HQ visits 2 and 3 restricted to those questionnaires completed within 7 and 10-28 days after day of treatment respectively, median score =6 ;Significantly different *p<0.05,
Similarly there were few associations between health effects and dipper’s flu scores at either visits 2 or 3. The visit 3 dipper’s flu score was 15.5±4.7, 7.4±9.0 and 4.2±4.3 for those farmers whose eosinophil concentrations were above, within or below the reference range respectively (p<0.04; Table 46)
6.6 Associations between health effects and exposures
There were no significant associations between exposure variables and having a result for CRP, creatinine, IgE, MCH and eosinophils outside the reference range (Table 47).
79

Table 46 Variation in health questionnaire dipper’s flu scores with clinical biochemistry and
haematology categoriesa,b,c
Analyte Level Mean score ±SD (n) HQ visit 2b HQ visit 3c
CRP >reference range In reference range
12.0±13.0 (16) 6.9±9.1 (75)
11.1±12.8 (12) 6.9±9.0 (72)
Creatinine >reference range In reference range
10.1±12.8 (15) 7.0±9.2 (89)
10.1±12.7 (14) 6.9±8.2 (84)
IgE >reference range In reference range
5.7±6.5 (23) 8.0±10.3 (86)
7.8±7.5 (22) 7.2±9.4 (79)
MCH >reference range In reference range
6.8±8.1 (15) 7.1±8.6 (91)
6.5±7.2 (15) 7.2±8.5 (84)
Eosinophils <reference range In reference range >reference range
6.0±5.6 (20) 7.5±9.0 (76) 7.7±11.6 (6)
4.2±4.3 (18) 7.4±9.0 (72) 15.5±4.7 (4)*
a Dipper’s flu (this study) defined in Appendix 38; b Categories obtained using reference range provided by the laboratory that carried out the analyses; cHQ visits 2 and 3 restricted to those questionnaires completed within 7 and 10-28 days after day of treatment; Significantly different *p<0.05
6.7 Associations between health effects and endotoxin concentration in sheep dip
There were no significant associations between endotoxin concentrations in sheep dip after treatment and having a result for creatinine, IgE, MCH and eosinophils outside the reference range (Table 48).
6.8 Associations between health effects and urinary pesticide metabolites
There were no significant associations between urinary PBA or cDVCA levels and having a CRP, creatinine, IgE, MCH or eosinophil result outside the reference range. There was an association between tDCVA and IgE, with five out of the eight farmers exposed to >90th
percentile of tDCVA having elevated IgE levels. There were also significant associations between CRP and cDBVA concentrations, but only for 2 subjects (Table 49).
80

Table 47 Variation in numbers of farmers with clinical biochemistry
and haematology levels outside the reference range with self-reported exposuresa
Variable > reference range/ reference range (% > reference range) Item Description CRP Creatinine IgE MCH Eosinophilsb
Treatment Injections 3/13 (18.8) 0/20 (0) 3/18 (14.3) 5/16 (23.8) 2/18 (10.0) method Dip
Pour-on 5/38 (11.6) 7/41 (14.6)
10/41 (19.6) 6/44 (12.0)
12/37 (24.5) 9/43 (17.3)
5/46 (9.8) 7/41 (14.6)
8/41 (16.3) 13/35 (27.1)
Shower 0/2 (0) 0/1 (0) 0/2 (0) 1/0 (100) 0/1 (0) Mixed 1/4 (20.0) 0/7 (0) 4/4 (50) 2/5 (28.6) 1/7 (12.5)
General OP 5/33 (13.2) 9/36 (20.0 10/34 (22.7) 13/67 (16.3) 16/65 (19.8) Product Non-OP 11/61 (15.3) 6/74 (7.5) 18/66 (21.4) 6/39 (13.3) 5/38 (11.6)
Unknown 0/4 (0) 1/3 (25.0 0/4 (0) 1/2 (33.3) 2/0 (100) Concentrate Yes 15/83 (15.3) 14/96 (12.7) 25/87 (22.3) 15/94 (13.8) 18/91 (16.5) handling No 1/9 (10.0) 2/11 (15.4) 2/10 (16.7) 2/10 (16.7) 4/7 (36.4) Splashed Yes 8/60 (11.8) 10/68 (12.8) 17/61 (21.8) 12/64 (15.8) 14/62 (18.4) dip on skin No 7/33 (17.5) 6/38 (13.6) 9/38 (19.1) 6/39 (13.3) 8/35 (18.6)
aCategories obtained using reference range provided by the laboratory that carried out the analyses; b For eosinophils, analysis based upon samples < reference range/reference range (%<reference range); No significant differences
Table 48 Variation of sheep dip endotoxin concentrations with clinical biochemistry and
haematology categoriesa,b
Analyte Level Mean ±SD (n) (EU/ml)
Creatinine >reference range In reference range
44584 (1) 22483±23578 (15)
IgE >reference range In reference range
28233±13230 (4) 24052±24149 (15)
MCH >reference range In reference range
16869±3780 (3) 25228±24242 (16)
Eosinophils <reference range In reference range
5894±5896 (2) 26027±22721 (17)
a Categories obtained using reference range provided by the laboratory that carried out the analyses; b No CRP data is presented as all endotoxin results came from farmers whose CRP values were in the reference range; No significant differences in endotoxin concentration
81

Table 49 Variation in numbers of farmers with clinical biochemistry and haematology outside the reference range with urinary pyrethroid metabolite
concentrationsa,b
Urinary pyrethroids > reference range/reference range (% > reference range) Metabolite Levelc CRP Creatinine IgE MCH Eosinophilsd
PBA Not detected <90th percentile >90th percentile
7/55 (11.3) 5/18 (21.7) 1/4 (20.0)
9/60 (13.0) 4/24 (14.3) 0/5 (0.0)
15/55 (21.4) 7/22 (24.1) 0/5 (0)
10/61 (14.1) 4/21 (16.0) 2/3 (40.0)
10/58 (14.7) 7/17 (29.2) 0/4 (0)
cDVCA Not detected <90th percentile >90th percentile
10/61 (14.1) 0/1 (0) 3/15 (16.7)
9/73 (11.0) 0/1 (0) 5/15 (25.0)
18/64 (22.0) 0/1 (0) 4/17 (19.0)
12/72 (14.3) 0/1 (0) 4/13 (23.5)
13/68 (16.0) 0/1 (0) 4/10 (28.6)
tDCVA Not detected <90th percentile >90th percentile
11/68 (13.9) 1/1 (50) 1/8 (11.1)
10/79 (11.2) 1/1 (50.0) 2/9 (18.2)
16/74 (17.8) 1/0 (100) 5/8 (38.5)*
15/76 (16.5) 0/2 (0) 1/7 (12.5)
17/71 (19.3) 0/1 (0) 0/7 (0)
cDBVA Not detected <90th percentile >90th percentile
10/74 (11.9) 1/2 (33.3) 2/1 (66.7)*
12/83 (12.6) 0/4 (0) 1/2 (33.1)
22/75 (22.7) 0/4 (0) 0/3 (0)
15/81 (15.6) 1/2 (33.3) 0/2 (0)
16/76 (17.4) 1/2 (33.3) 0/1 (0)
a Urine samples restricted to those collected at visit 2 within three days of last treatment and with a creatinine level between 3 and 30mmol/l; b Categories obtained using reference range provided by the laboratory that carried out the analyses; b 90th percentile levels in non-occupationally exposed population (data provided by HSL) and are the following: PBA <1.9µmol/mol creatinine; cDCVA 0.3µmol/mol creatinine; tDCVA 0.5 µmol/mol creatinine; Deltamethrin <0.4 µmol/mol creatinine; d For eosinophils, analysis based upon samples <reference range/reference range (% <reference range); Significantly different *p<0.05
82

Table 50 Variation in numbers of farmers with clinical biochemistry and haematology outside the reference range with urinary OP metabolite
concentrations a,b
Urinary OPs > reference range/reference range (% > reference range) Metabolite Levelc CRP Creatinine IgE MCH Eosinophilsd
DMP Not detected <90th percentile >90th percentile
10/35 (22.2) 3/34 (8.1) 0/8 (0)
5/46 (9.8) 8/35 (18.6) 0/8 (0)
9/43 (17.3) 12/32 (27.3) 1/7 (12.5)
9/38 (18.4) 6/38 (13.6) 1/7 (12.5)
9/38 (19.1) 7/35 (16.7) 1/6 (14.3)
DMTP Not detected <90th percentile >90th percentile
6/51 (10.5) 6/13 (31.6) 1/13 (7.1)*
8/54 (12.9) 5/18 (21.7) 0/17 (0)
14/54 (20.6) 6/14 (30.0) 2/14 (12.5)
11/54 (16.9) 2/20 (9.1) 3/13 (18.8)
8/53 (13.1) 6/13 (31.6) 3/13 (18.8)
DMDTP Not detected <90th percentile >90th percentile
12/76 (13.6) -1/1 (50.0)
13/86 (13.1) -0/3 (0)
22/80 (21.6) -0/2 (0)
16/82 (16.3) -0/3 (0)
15/78 (16.1) -2/1 (66.7)
DEP Not detected <90th percentile >90th percentile
10/52 (16.1) 1/10 (9.1) 2/15 (11.8)
9/63 (12.5) 2/11 (15.4) 2/15 (11.8)
14/59 (19.2) 4/11 (26.7) 4/12 (25.0)
12/58 (17.1) 2/14 (12.5) 2/15 (11.8)
13/52 (20.0) 2/12 (14.3) 2/15 (11.8)
DETP Not detected <90th percentile >90th percentile
10/61 (14.1) 0/1 (0) 3/15 (16.7)
11/67 (14.1) 1/1 (50) 1/21 (4.5)
19/62 (23.5) 0/2 (0) 3/18 (14.3)
14/63 (18.2) 0/1 (0) 2/21 (8.7)
11/60 (15.5) 0/1 (0) 6/18 (25.0)
DEDTP Not detected <90th percentile >90th percentile
13/77 (14.4) --
13/88 (12.9) 0/1 (0) -
22/81 (21.4) 0/1 (0) -
16/84 (16.0) 0/1 (0) -
17/78 (17.9) 0/1 (0) -
a Urine samples restricted to those collected at visit 2 within three days of last treatment and with a creatinine level between 3 and 30mmol/l;b Categories obtained using reference range provided by the laboratory that carried out the analyses; c 90th percentile levels in non-occupationally exposed population data provided by HSL) and are the following ; DMP, DMTP and DMTP 35, 15 and 3 µmol/mol creatinine respectively and for DEP, DETP, DEDTP 9,4 and 7 µmol/mol creatinine; d For eosinophils, samples are < reference range/reference range (% <reference range); Significantly different *p<0.05
83

Table 51 Variation in numbers of farmers with clinical biochemistry and haematology outside the reference range with total urinary OP and
pyrethroid metabolite concentrationsa,b
Total urinary OPs > reference range/reference range (% > reference range) Metabolite Levelc CRP Creatinine IgE MCH Eosinophilsd
Methyl Not detected 5/25 (16.7) 3/31 (8.8) 7/28 (20.0) 5/29 (14.7) 5/28 (15.2) (DMP+DMTP+ <90th percentile 8/46 (14.8) 10/49 (16.9) 13/47 (21.7) 10/49 (16.9) 10/45 (18.2) DMDTP) >90th percentile 0/6 (0) 0/9 (0) 2/7 (22.2) 1/7 (12.5) 2/6 (25.0) Ethyl Not detected 9/48 (15.8) 8/54 (12.9) 14/51 (21.5) 12/49 (19.7) 10/46 (17.9) (DEP+DETP+ <90th percentile 2/18 (10.0) 5/22 (18.5) 6/21 (22.2) 2/26 (7.1) 5/22 (18.5) DEDTP) >90th percentile 2/11 (15.4) 0/13 (0) 2/10 (16.7) 2/10 (16.7) 2/11 (15.4)
Diazinon (DEP+DETP)
Not detected <90th percentile >90th percentile
9/48 (15.8) 1/14 (6.7) 3/15 (16.7)
8/54 (12.9) 3/19 (13.6) 2/16 (11.1)
14/51 (21.5) 5/18 (21.7) 3/13 (18.8)
12/49 (19.7) 2/20 (9.1) 2/16 (11.1)
10/46 (17.9) 5/16 (23.8) 2/17 (10.5)
Not detected 5/20 (20.0) 2/27 (6.9) 6/24 (20.0) 5/23 (17.9) 4/23 (14.8) Methyl+ethyl <90th percentile 7/49 (12.5) 11/51 (16.7) 15/49 (23.4) 10/53 (15.9) 10/49 (16.9)
>90th percentile 1/8 (11.1) 0/11 (0) 1/9 (10.0) 1/9 (10.0) 3/7 (30.0) None 3/5 (16.7) 2/18 (10) 2/20 (9.1) 4/17 (19) 2/19 (9.5)
OP+pyrethroide Pyrethroid only OP only
2/5 (28.6) 4/32 (11.1)
0/9 (0) 4/38 (9.5)
4/4 (50) 10/31 (24.4)
1/6 (14.3) 6/38 (13.6)
2/4 (33.3) 8/33 (19.5)
OP+pyrerthoid 4/25 (13.8) 7/24 (22.6) 6/27 (18.2) 5/24 (17.2) 5/23 (17.9)
a Urine samples restricted to those collected at visit 2 within three days of last treatment and with a creatinine level between 3 and 30mmol/l; b Categories obtained using reference range provided by the laboratory that carried out the analyses; c 90th percentile levels in non-occupationally exposed population (data provided by HSL) and are for methyl, ethyl, diazinon, methyl+ ethyl <56, <19, <13 and <77µmol/mol creatinine respectively; d For eosinophils, samples based upon < reference range/reference range (% <reference range); e categorised based on the presence or absence of urinary OPs or pyrethroids. No significant differences
84

There were no significant associations between urinary OP levels and any analyte, except that DMTP levels were associated in a non dose-response manner with creatinine (Table 50). There were no significant associations between any analyte and total urinary OP levels or farmers categorised by the presence or absence of urinary pyrethroid or OP metabolites (Table 51).
6.9 Associations between health effects and butyrylcholinesterase activity
There were no associations between changes in butyrylcholinesterase activity between visits 1 and 2 and having a CRP, creatinine, IgE, MCH or eosinophil result outside the reference range (Table 52).
Table 52 Variation in numbers of farmers with clinical biochemistry and haematology outside the
reference range with changes in butyrylcholinesterase activitya
Analyte Level Reduction/ no reduction (% reduced )b
CRP >reference range In reference range
1/9 (10.0) 1/62 (1.6)
Creatinine >reference range In reference range
0/14 (0.0) 4/66 (5.7)
IgE >reference range In reference range
2/18 (10.0) 3/66 (4.3)
MCH >reference range In reference range
0/12 (0.0) 5/69 (6.8)
Eosinophils <reference range In reference range
2/9 (18.2) 2/66 (2.9)
a Categories obtained using reference range provided by the laboratory that carried out the analyses; b
cholinesterase activity categorised as reduced if activity was reduced by more than 15% between visits 1 and 2 (HSL 2005); No significant differences
85

86

7 ANALYSIS OF INCIDENT CASES OF ILL-HEALTH
7.1 Descriptive analysis of incident cases of ill-health
Figure 6 shows how the incidence of new symptom complexes varied over the seven days following treatment. In general new cases associated with any symptom complex were found earlier in the week rather than later. The proportion of new cases of feeling unusually tired was 9.2% on day 1 and 6.9% of day 2, both significantly higher than that found on day 7 (2.7%). The proportion of new cases of headache was also significantly higher on days 1 (11.0%) and 2 (8.7%) than later in the week. Similarly the proportion of new cases of farmers with pain in their muscles or joints (13.0%, 6.5%), or nasal symptoms (10.1%, 7.8%) or a hoarse voice/sore throat (11.0%, 4.5%) were significantly higher on days 1 and 2 respectively. The proportion of new cases of farmers with respiratory symptoms (7.2%) or eye irritation (8.4%) was significantly higher only on day 1. There was no significant variation in the proportion of new cases of farmers feeling generally ill or sweaty/shivery/feverish or with gastrointestinal symptoms over the week.
The number of new cases of dipper’s flu occurring on days 1 or 2 was determined using the different definitions as used previously. No new cases of dipper’s flu developed on day 1 using the most stringent case definition (namely all 10 symptoms) or Hunter’s definition. In contrast, on day 1 there were three and four new cases of dipper’s flu using the IOH and Web-based definitions respectively. On day 2 there were no new cases of dipper’s flu whatever definition was used. Hence further analysis of this data was carried out using three groups of farmers: namely those with either no new symptom complex, one new symptom complex or two or more new symptom complexes on days 1 or 2.
7.2 Associations between incident cases and demographic variables
Associations between incident cases of ill-health and potential confounders are shown in Table 53. Incident cases of ill-health did not vary between the different regions or with age, gender, smoking or drinking or whether the farmer was a contractor. In contrast, incident cases were associated with not having a certificate of competence, health status before treatment, whether the farmer had ever suffered from dipper’s flu and perceived a high risk from sheep dip (Table 53).
7.3 Associations between incident cases and exposures
There was no association between treatment method or general product used and incident cases of ill-health (Table 54). In contrast, there was significant variation in the number of incident cases with the specific type of product used. The proportion of new cases (on days 1 and 2) varied between 40.2% for pyrethroids, 31.8% (avermectins), 27.7% (OPs) and 23.9% for triazines (Table 54).
7.4 Associations between incident cases and endotoxin concentrations in sheep dip
There was no association between endotoxin concentrations in sheep dip and incident cases of ill-health (Table 55)
87

Day after treatment Day after treatment
ay a er rea men Day after treatment
8
14 li lly illFee ng genera
14
12 12
10 10
% 8 % 8
6 6
4 4
2 2
0
li ll iFee ng unusua y t red
***
**
0 1 2 3 4 5 6 7 8
Day after treatment
0 0 1 2 3 4 5 6 7
Day after treatment
14 Headache
***
**
14
12 12
10 10
% 8% 8
66
44
22
i ild
Sweaty,sh very,fever sh, hot or co
0 1 2 3 4 5 6 7 8
Day after treatment
0 0 1 2 3 4 5 6 7 8
Day after treatment
0
14
in i ljoi
Pa n musc es or nts
***
**
14
12 12
10 10
% 8 % 8
6 6
4 4
2 2
0 0 0 1 2 3 4 5 6 7 8 0 1 2 3 4 5 6 7 8
li i
Runny,stuffy,b ocked or rr tated nose
***
***
14 i
*
Hoarse vo ce or sore throat ***
14
12 12
10 10
% 8 % 8
6 6
4 4
2 2
0 0 0 1 2 3 4 5 6 7 8 0 1 2 3 4 5 6 7 8
D ft t t t
Cough,shortness of breath or wheeze
***
iiti i l i i
Nausea, poor appet te, vom ng, abdom na
pa n or d arrhoea
14 1412121010
% 8% 866442200
i i iEye rr tat on
***
0 1 2 3 4 5 6 7 80 1 2 3 4 5 6 7 8
Day after treatment Day after treatment
Figure 27 Incidence of specific diary symptom complexes by day after treatment Symptom Incidence on days 1-6 compared to that on day 7. * p<0.05, **p<0.01, ***p<0.001
88

Table 53 Associations between incident cases of ill-health and demographic variablesa
Variable Farmers with 2/1/0 new symptoms (% 2 new symptoms) Item Definition
Wales 57/43/81 (31.5) Region N West 32/19/51 (31.4)
S East 18/9/33 (30.0)
Gender Male Female
91/60/144 (30.8) 16/11/21 (33.3)
<40 16/9/17 (38.1)
Age 41-50 51-60
32/17/39 (36.4) 35/26/60 (28.9)
> 61 24/19/49 (26.1) Current 18/5/25 (37.5)
Smoker Ex 28/23/55 (26.4) Never 61/43/84 (32.4)
Current Yes 88/64/135 (30.7) drinker No 19/7/29 (34.5) Certificate of Yes 31/20/68 (26.1) Competenceb No 76/51/94 (34.4)*
Contract Yes 3/1/4 (37.5) dipper No 104/69/157 (31.3)
Health status pre-treatmentc
V good/good Average Poor/v poor
63/55/131 (25.3) 35/15/33 (42.2) 9/1/1 (81.8)***
Ever had Yes 43/14/19 (56.6) dipper’s flu No 47/49/129(20.9)***
Perceived sheep dip riskd
Low Medium High
27/29/68 (21.8) 30/26/54 (27.3) 46/14/40 (46.0)**
a New cases of ill-heath occurring on days 1 or 2; b holder of certificate of competence in handling pesticides; c at visit 1; dBased upon scale used by Stephens et al (1995a); max score = 24; low ≤13 medium 14-19, high≥ 20; Significantly different * p<0.05, ** p<0.01, ***p<0.001.
Table 54 Associations between incident cases of ill-health and self-reported exposuresa
Variable Farmers with 2/1/0 new symptoms (% 2 new symptoms) Item Definition
Method of Injection 6/3/13 (27.3) treatment Dip
Pour-on/spray 37/30/52 (31.1) 58/29/86 (33.5)
Shower 2/4/8 (14.3) Mixed methods 3/4/4 (27.3)
General product Non-OP 74/45/111 (32.2) type OP 29/23/46 (29.6) Specific product Avermectin 7/2/13 (31.8) type OP 26/22/46 (27.7)
Pyrethroid 43/25/39 (40.2) Triazine 16/9/42 (23.9) *
aNew cases of ill-heath occurring on days 1 or 2; Significantly different * p<0.05
89

Table 55 Associations between endotoxin concentrations and
incident cases of ill-healtha
Number of new symptoms on days 1 or 2
Mean ± SD (n) Endotoxin concentration (EU/mL)
0 33244 ± 7180 (7) 1 21980 ± 14639 (11) 2 29923 ± 28006 (10)
a New cases of ill-heath occurring on days 1 or 2
7.5 Associations between incident cases and urinary pesticide metabolites
There were no associations between incident cases of ill-health and urinary pyrethroid metabolites (Table 56), OP metabolites (Table 57) or sum of OP metabolites or the presence or absence of pyrtheorid or OP metabolites (Table 58).
Table 56 Analysis of urinary pyrethroid metabolite concentration
and incident cases of ill-healtha
Metabolite Levelb,c Farmers with 2/1/0 new symptoms (% 2 symptoms)
PBA not detected <90th percentile >90th percentile
32/22/34 (36.4) 15/4/22 (36.6) 3/0/3 (50.0)
cDCVA not detected <90th percentile
>90th percentile
37/24/45 (34.9) -13/2/13 (46.44)
tDCVA not detected <90th percentile >90th percentile
45/25/48 (38.1) 1/0/2 (33.3) 4/1/9 (28.6)
cDBVA not detected <90th percentile >90th percentile
46/25/56 (36.2) 1/1/2 (25.0) 3/0/1 (75.0)
a New cases of ill-heath occurring on days 1 or 2;b Urine samples restricted to those collected at visit 2 within three days of last treatment and with a creatinine level between 3 and 30mmol/l;; c 90th percentile levels in non-occupationally exposed population (data provided by HSL) and are the following: PBA <1.9µmol/mol creatinine; cDCVA 0.3 µmol/mol creatinine; tDCVA 0.5 µmol/mol creatinine; cDBVA <0.4 µmol/mol creatinine;
90

Table 57 Analysis of urinary OP metabolite concentration
and incident cases of ill-healtha
Metabolite Levelb,c Farmers with 2/1/0 new symptoms (% 2 symptoms)
DMP not detected <90th percentile >90th percentile
27/12/23 (43.5) 18/11/33 (29.0) 5/3/3 (45.5)
DMTP not detected <90th percentile >90th percentile
31/20/31 (37.8) 10/3/16 (34.5) 8/3/12 (37.5)
DMDTP not detected <90th percentile >90th percentile
48/26/58 (36.4) -2/0/1 (66.7)
DEP not detected <90th percentile
>90th percentile
39/14/38 (42.9) 4/8/10 (18.2) 7/4/11 (31.8)
DETP not detected <90th percentile
>90th percentile
39/19/42 (39.0) 2/0/0 (100.0) 9/7/17 (27.3)
DEDTP not detected <90th percentile >90th percentile
48/26/59 (36.1) 2/0/0 (100.0) -
a New cases of ill-heath occurring on days 1 or 2; b Urine samples restricted to those collected at visit 2 within three days of last treatment and with a creatinine level between 3 and 30mmol/l; c 90th percentile levels in non-occupationally exposed population (data provided by HSL) and are the following ; DMP 35 µmol/mol creatinine; DMTP 15 µmol/mol creatinine; DMDTP 3 µmol/mol creatinine; DEP 9 µmol/mol creatinine; DETP 4 µmol/mol creatinine; DEDTP 7 µmol/mol creatinine
Table 58 Analysis of total urinary OP and pyrethorid metabolite concentration
and incident cases of ill-healtha
Metabolites Levelb,c Farmers with 2/1/0 new symptoms (% 2 symptoms)
Methyl (DMP+DMTP+DMDTP
not detected <90th percentile >90th percentile
17/10/13 (42.5) 29/13/41 (34.9) 4/3/5 (33.3)
Ethyl (DEP+DETP+DEDTP)
not detected <90th percentile >90th percentile
33/12/33 (42.3) 12/10/16 (31.6) 5/4/10 (26.3)
Diazinon (DEP+DETP)
not detected <90th percentile >90th percentile
33/12/33 (42.3) 10/9/11 (33.3) 7/5/15 (25.9)
not detected 14/8/12 (41.2) Methyl+ethyl <90th percentile 29/16/41 (33.7)
>90th percentile 7/2/6 (46.7) None 9/6/8 (39.1)
OP+pyrethroid Pyrethoird only OP only
5/2/4 (45.5) 16/15/22 (30.2)
OP+pyrethroid 20/3/25 (41.7)
a New cases of ill-heath occurring on days 1 or 2; b Urine samples restricted to those collected at visit 2 within three days of last treatment and with a creatinine level between 3 and 30mmol/l;;c 90th percentile levels in non-occupationally exposed population (data provided by HSL) and are the following for methyl, ethyl, diazinon, and methyl+ethyl <56, <19, <13 and <77µmol/mol creatinine respectively ;
91

7.6 Associations between incident cases and butyrylcholinesterase activity
There were no associations between incident cases of ill-health and changes in butyrylcholinesterase activity (Table 59).
Table 59 Associations between new cases of ill health and
changes in cholinesterase activitya
Cholinesterase activity Farmers with 2/1/0 new changeb symptoms (% 2 symptoms)
Reduction 0/2/2 (0)
No reduction 40/19/32 (44.0)
aNew cases of ill-heath occurring on days 1 or 2; b Butyrylcholinesterase activity categorised as reduced if activity was reduced by more than 15% between visits 1 and 2 (HSL 2005)
7.7 Associations between incident cases and health effects
There were no significant associations between incident cases of ill-health and clinical biochemical or haematological parameters (Table 60).
Table 60 Associations between health effects and new cases of ill-healtha
Analyte Levelb Farmers with 2/1/0 new symptoms (% 2 symptoms)
CRP >reference range in reference range
6/4/5 (40.0) 32/22/42 (33.3)
Creatinine >reference range in reference range
8/4/4 (50.0) 33/26/50 (30.3)
IgE >reference range in reference range
12/6/9 (44.4) 30/27/44 (29.7)
MCH > reference range in reference range
3/7/10 (15.0) 37/27/40 (35.6)
Eosinophils <reference range in reference range
8/4/10 (36.4) 30/27/30 (31.9)
aNew cases of ill-heath occurring on days 1 or 2;b Categories obtained using reference range provided by the laboratory that carried out the analyses
7.8 Multivariate analysis of incident cases of ill-health
The associations between ill-health and demographic variables, exposures and health are shown in Tables 61,62 and 63 using a multi-variate analysis with differing case and referent definitions and with either self-reported pesticide exposures (Table 61), self-reported OP or pyrethroid exposure (Table 62) or exposures categorised based on the presence or absence of any urinary pesticides metabolites (Table 63) or categorised as to whether urinary pyrethroid or OP metabolites were present (Table 64).
92

7.8.1 Modelling with self-reported exposures
Four different models were examined with differing case and referent definitions. In the first model, cases were farmers with 1 or more new symptoms and referents were those farmers with no new symptoms. Results of the multi-variate analysis are shown in Table 61 and indicate that the risk of being a case varied with demographic, exposure and health variables. In particular, the risk of being a case (ORadj, 95%CI) varied with the type of product the farmer reported using. In comparison with those farmers who reported using a triazine, there was an increased risk of being a case if the farmer used an OP (4.59, 1.49-12.45) or a pyrethroid (5.10, 2.12-12.26) but not an avermectin (1.45, 0.38-5.51). Risk however was lower if the farmer held a certificate of competence for handling pesticides (0.25, 0.12-0.52). Pre-treatment (visit 1) health status was associated with being a case with an increase of 1 on this measure increasing the odds of being a case by almost two fold (1.93, 0.27-2.94). Ever having dipper’s flu was associated with an increased risk of being a case (3.02, 1.27-7.20). Increasing age was associated with a decrease risk of being a case: a one year increase in age was associated with a small (~5%) but statistically significant decrease in risk (0.95,0.92-0.98). Other variables in the model were not associated with significant changes in risk.
In the second and third models, the association between the potential risk factors and being a case were explored with cases being defined as having either one new symptom only (model 2) or having 2 or more symptoms (model 3). In the second model, the risk of being a case was again lower if the farmer held a certificate of competence for handling pesticides (0.35, 0.15-0.83). In comparison with those farmers who reported using a triazine, there was an increased risk of being a case if the farmer used a pyrethroid (3.67, 1.27-10.61) but not an avermectin (0.96, 0.15-6.08): there was evidence of an increased risk with self-reported OP use (3.00, 0.92-9.75). Other variables in the model were not associated with significant changes in risk. In the third model the risk of being a case (ORadj, 95%CI) was again lower for those farmers holding a certificate of competence for handling pesticide concentrate (0.12, 0.04-0.36). In addition, in comparison with those farmers who reported using a triazine, there was an increased risk of being a case if the farmer used an OP (6.78, 1.59-24.76) or a pyrethroid (8.00, 2.31-27.69) but not an avermectin (2.39, 0.43-13.17). Pre-treatment (visit 1) health status was associated with being a case with an increase of 1 on this measure increasing the odds of being a case by almost 3.5 fold (3.59, 1.98-6.52). Ever having dipper’s flu was associated with an increased risk of being a case (4.71, 1.60-13.82). Perceived risk of sheep dip was also associated with an increased risk: a unit increase in this measure resulted in an 11% increase in risk (1.11. 1.01-1.22). Increasing age was associated with a decrease risk of being a case: a one year increase in age was associated with a small (~8%) but statistically significant decrease in risk (0.92,0.87-0.96). Other model variables were not associated with significant changes in risk.
In the fourth model, cases were defined as those farmers with ≥ 2 new symptoms and referents were defined as having none or 1 new symptom. Results were similar to those reported for model 3. The risk of being a case (ORadj, 95%CI) was lower for those farmers holding a certificate of competence for handling pesticide concentrate (0.28, 0.12-0.67). In comparison with those farmers who reported using a triazine, there was an increased risk of being a case if the farmer used an OP (4.44, 1.37-14.35) or a pyrethroid (4.02, 1.45-11.11) but not an avermectin (2.26, 0.52-9.86). Pre-treatment (visit 1) health status was associated with being a case with an increase of 1 on this measure increasing the odds of being a case by almost 2.5 fold (2.55, 1.61-4.06). Ever having dipper’s flu was associated with an increased risk of being a case (2.92, 1.27-6.73). Perceived risk of sheep dip was also associated with an increased risk: a unit increase in this measure resulted in a 10% increase in risk (1.10. 1.02-1.18). Increasing age was associated with a decrease risk of being a case: a one year increase in age was associated with a small (~6%) but statistically significant decrease in risk (0.94, 0.91-0.98). Other variables in the model were not associated with significant changes in risk.
93

Table 61 tha,b Odds ratios and 95%CI for the associations between ill-health and demographic variables, self-reported exposures and heal
Variable OR (95%CI) Item Description ≥1vs 0 symptoms 1 vs 0 symptoms ≥2 vs 0 symptoms ≥2 vs 0 or 1symptoms Demographics Sex Male vs female 1.54 (0.60-3.92) 1.28 (0.39-4.20) 1.66 (0.47-5.80) 1.88 (0.66-5.36)
Age 0.95 (0.92-0.98) 0.97 (0.93-1.01) 0.92 (0.87-0.96) 0.94 (0.91-0.98) Region Wales 1.0 1.0 1.0 1.0
NW England 0.73 (0.35-1.51) 0.84 (0.34-2.05) 0.65 (0.25-1.68) 0.87 (1.39-1.92) SE England 0.57 (0.23-1.41) 0.72 (0.24-2.20) 0.40 (0.12-1.40) 0.54 (0.19-1.58)
Smoker Current vs non-smoker 0.48 (0.20-1.28) 0.31 (0.08-1.11) 0.75 (0.23-2.41) 1.10 (0.42-2.85) Alcohol Current vs non-drinker 1.80 (0.71-4.56) 1.97 (0.57-6.83) 1.67 (0.52-5.37) 1.10 (0.40-3.03)
Exposure Product Triazine 1.0 1.0 1.0 1.0 Avermectin 1.45 (0.38-5.51) 0.96 (0.15-6.08) 2.39 (0.43-13.17) 2.26 (0.52-9.86) OP 4.59 (1.49-12.45) 3.00 (0.92-9.75) 6.78 (1.59-24.76) 4.44 (1.37-14.35) Pyrethroid 5.10 (2.12-12.26) 3.67 (1.27-10.61) 8.00 (2.31-27.69) 4.02 (1.45-11.11)
Certificate of competence c Holder vs non-holder 0.25 (0.12-0.52) 0.35 (0.15-0.83) 0.12 (0.04-0.36) 0.28 (0.12-0.68) Number of sheep 1.00 (0.99-1.00) 1.00 (0.99-1.00) 1.00 (0.99-1.00) 1.00 (0.99-1.00)
Health Pre-treatment health statusd 1.93 (1.27-2.94) 1.42 (0.86-2.34) 3.59 (1.98-6.52) 2.55 (1.61-4.08) History of Dipper’s flu Ever vs never 3.02 (1.27-7.20) 1.69 (0.57-5.03) 4.71 (1.60-13.82) 2.92 (1.27-6.73) Perceived sheep dip riske 1.03 (0.97-1.10) 0.99 (0.92-1.07) 1.11 (1.01-1.22) 1.10 (1.02-1.18)
a New cases of ill-heath occurring on days 1 or 2;b multi-variate analysis including demographic, self-reported exposure and health variables as outlined in the Table;c For handling pesticide concentrate;d At visit 1;e Based upon scale used by Stephens et al (1995a).
94

Table 62 Odds ratios and 95%CI for the associations between ill-health and demographic variables, self-reported exposures to OPs and
tha,b pyrethroids and heal
Variable OR (95%CI) Item Description ≥1vs 0 symptoms 1 vs 0 symptoms ≥2 vs 0 symptoms ≥2 vs 0 or 1symptoms Demographics Sex Male vs female 3.09 (0.77-12.35) 3.13 (0.41-23.78) 3.45 (0.65-18.38) 3.14 (0.82-12.08)
Age 0.96 (0.93-1.00) 0.97 (0.93-1.01) 0.92 (0.87-0.98) 0.96 (0.92-1.00) Region Wales 1.0 1.0 1.0 1.0
NW England 1.00 (0.45-2.22) 0.96 (0.37-2.51) 1.20 (0.41-3.50) 1.35 (0.56-3.29) SE England 0.28 (0.08-1.02) 0.21 (0.03-1.50) 0.37 (0.08-1.82) 0.56 (0.14-2.21)
Smoker Current vs non-smoker 0.33 (0.11-0.98) 0.18 (0.03-1.01) 0.47 (0.12-1.80) 0.96 (0.31-2.97) Alcohol Current vs non-drinker 0.85 (0.28-2.56) 0.98 (0.24-3.98) 0.70 (0.17-2.86) 0.62 (0.20-1.92)
Exposure Product Pyrethroids vs OPs 1.28 (0.58-2.83) 1.50 (0.57-3.88) 1.31 (0.46-3.75) 0.90 (0.38-2.16) Certificate of competence c Holder vs non-holder 0.28 (0.12-0.64) 0.35 (0.13-0.91) 0.15 (0.04-0.50) 0.34 (0.13-0.87) Number of sheep 1.000 (0.999-1.000) 1.000 (0.999-1.000) 1.000 (0.999-1.000) 1.000 (0.999-1.000)
Health Pre-treatment health statusd 1.67 (1.04-2.68) 1.20 (0.67-2.17) 3.57 (1.77-7.18) 2.57 (1.51-4.37) History of Dipper’s flu Ever vs never 1.77 (0.63-4.93) 1.09 (0.30-3.95) 2.39 (0.68-8.36) 1.99 (0.75-5.27) Perceived sheep dip riske 1.07 (0.99-1.15) 1.00 (0.91-1.10) 1.19 (1.07-1.32) 1.16 (1.06-1.26)
a New cases of ill-heath occurring on days 1 or 2;b multi-variate analysis including demographic, self-reported exposure and health variables as outlined in the Table;c For handling pesticide concentrate;d At visit 1;e Based upon scale used by Stephens et al (1995a).
95

Table 63 Odds ratios and 95%CI for the associations between ill-health and demographic variables, self-reported exposures, urinary pesticide
tha,b metabolites and heal
Variable OR (95%CI) Item Description ≥1vs 0 symptoms 1 vs 0 symptoms ≥2 vs 0 symptoms ≥2 vs 0 or 1symptoms Demographics Sex Male vs female 1.74 (0.35-8.66) 1.43 (0.19-10.54) 1.19 (0.12-12.24) 0.99 (0.15-6.45)
Age 0.92 (0.88-0.99) 0.95 (0.88-1.02) 0.88 (0.81-0.96) 0.91 (0.85-0.97) Region Wales 1.0 1.0 1.0 1.0
NW England 0.71 (0.27-1.86) 0.80 (0.33-2.75) 0.55 (0.15-1.98) 0.71 (.23-2.17) SE England 4.58 (0.38-54.7) 1.75 (0.1-32.3) 6.06 (0.40-91.8) 2.64 (0.34-20.30)
Smoker Current vs non-smoker 0.29 (0.07-1.21) 0.12 (0.01-1.35) 0.67 (0.12-3.87) 0.98 (0.21-4.63) Alcohol Current vs non-drinker 0.56 (0.14-2.25) 0.35 (0.06-1.94) 1.53 (0.20-11.49) 1.46 (0.27-7.97)
Exposure Urinary pesticide metabolites Any vs none 0.90 (0.24-3.46) 0.97 (0.18-5.19) 0.81 (0.63-4.94) 1.11 (0.27-4.61) Certificate of competence c Holder vs non-holder 0.15 90.05-0.51) 0.19 (0.04-0.93) 0.09 (0.02-0.46) 0.21 (0.06-0.82) Number of sheep 1.00 (0.999-1.001) 0.999 (0.998-1.001) 1.00 (0.999-1.001) 1.00 (0.999-1.001)
Health Pre-treatment health statusd 1.33 (0.70-2.52) 0.74 (0.31-1.77) 2.67 (1.13-06.34) 3.02 (1.39-6.55) History of Dipper’s flu Ever vs never 2.69 (0.72-10.00) 1.56 (0.24-10.14) 3.45 (0.64-18.48) 3.37 (0.83-13.63) Perceived sheep dip riske 1.01 (0.92-1.11) 0.96 (0.86-1.08) 1.10 (0.96-1.26) 1.11 (0.27-4.61)
a New cases of ill-heath occurring on days 1 or 2;b multi-variate analysis including demographic, self-reported exposure and health variables as outlined in the Table;c For handling pesticide concentrate;d At visit 1;e Based upon scale used by Stephens et al (1995a).
96

Table 64 Odds ratios and 95%CI for the associations between ill-health and demographic variables, self-reported exposures, urinary pesticide
metabolites and healtha,b: pesticide metabolites categorised into pyrethroid or OP metabolites
Variable OR (95%CI) Item Description ≥1vs 0 symptoms 1 vs 0 symptoms ≥2 vs 0 symptoms ≥2 vs 0 or 1symptoms Demographics Sex Male vs female 1.67 (0.33-8.51) 1.37 (0.16-11.69) 1.61 (0.12-20.81) 1.22 (0.14-10.43)
Age 0.93 (0.88-0.99) 0.98 (0.90-1.06) 0.86 (0.78-0.94) 0.89 (0.82-0.95) Region Wales 1.0 1.0 1.0 1.0
NW England 0.71 (0.27-1.89) 0.77 (0.21-3.84) 0.30 (0.07-1.31) 0.49 (0.14-1.65) SE England 5.01 (0.39-64.32) 1.09 (0.06-21.83) 5.75 (0.27-120.6) 3.43 (0.38-3.08)
Smoker Current vs non-smoker 0.29 (0.07-1.25) 0.09 (0.01-1.21) 0.59 (0.09-3.92) 0.66 (0.12-3.80) Alcohol Current vs non-drinker 0.57 (0.14-2.33) 0.30 (0.05-1.99) 1.78 (0.19-16.71) 1.72 (0.24-12.32)
Exposure Urinary pesticide metabolites None 1.0 1.0 1.0 1.0 Pyrethroid only 0.69 (0.10-4.97) 1.95 (0.16-24.12) 0.55 (0.03-9.26) 0.44 (0.05-4.07) OP only 0.95 (0.23-3.94) 1.53 (0.28-8.51) 0.37 (0.04-3.27) 0.70 (0.13-3.62) OP + pyrethroid 0.91 (0.20-4.11) 0.19 (0.02-1.82) 2.33 (0.25-21.67) 4.41 (0.71-27.41)
Certificate of competence c Holder vs non-holder 0.15 (0.05-0.51) 0.25 (0.05-1.33) 0.06 (0.01-0.36) 0.15 (0.03-0.63) Number of sheep 1.00 (0.999-1.001) 0.999 (0.998-1.001) 1.00 (0.998-1.001) 1.00 (0.999-1.001)
Health Pre-treatment health statusd 1.34 (0.70-2.58) 0.72 (0.29-1.80) 3.42 (1.26-9.27) 3.85 (1.55-9.53) History of Dipper’s flu Ever vs never 2.60 (0.69-9.74) 1.07 (0.15-7.50) 5.54 (0.85-35.99) 4.70 (1.02-21.69) Perceived sheep dip riske 1.01 (0.92-1.11) 0.9 95 (0.83-1.08) 1.13 (0.97-1.31) 1.10 (0.97-1.24)
a New cases of ill-heath occurring on days 1 or 2;b multi-variate analysis including demographic, self-reported exposure and health variables as outlined in the Table;c For handling pesticide concentrate;d At visit 1;e Based upon scale used by Stephens et al (1995a).
97

This analysis was then restricted to those farmers who reporting using either pyrethroids or OPs as exposure misclassification was lower in these two groups. Results are shown in Table 62. There was no difference in the risk of being case between those farmers who used OPs or pyrethroids no matter what model was used. Significant associations were observed between holding a certificate of competence for handling pesticides and lower risk in all models and age was associated with lower risk especially in model 3 (cases having 2 or more new symptoms vs referents with no new symptoms). Pre-treatment health status (at visit 1) was associated with being a case in models 1,3 and 4 but not model 2 (case having one new symptom only vs referents with no new symptoms ). Perceived sheep dip risk was associated with increased risk in models 3 and 4 (cases having two or more new symptoms). Those who smoked were less likely to be a case in model 1 (one or more new symptoms vs those with no new symptoms)
7.8.2 Modelling with urinary pesticide exposures
The same four models were used as described previously but instead of using self-reported exposures to specific pesticide classes farmers were categorised as to whether they had detectable urinary levels of either any pesticide metabolites (any pesticide vs no pesticide; Table 63 ) or specific classes of pesticide metabolites (no pesticide vs pyrethroids only vs OPs only vs both OPs and pyrethroids, Table 64).
The risk of being a case in the different models when the exposure comparison was between any urinary pesticide metabolite and no detectable urinary metabolite is shown in Table 63. The presence of any pesticide metabolite in the urine was not associated with altered risk in any of the models used. In the first model (1 or more symptoms vs no symptoms) , the risk of being a case was lower if the farmer held a certificate of competence for handing pesticides (0.15, 0.05-0.51) and also decreased with age with a one year increase in age associated with a 7% decrease in risk (0.93, 0.88-0.99). No other variables were associated with increased risk. In the second model (1 symptom vs no symptoms), risk of being a case was decreased if the farmer held a certificate of competence for handing pesticides (0.19, 0.04-0.93) but was not associated with other any factor. In the third model ( 2 or more symptoms vs no symptoms), the risk of being a case was lower if the farmer held a certificate of competence for handing pesticides (0.09, 0.02-0.46) and also decreased with age with a one year increase in age being associated with a 12% decrease in risk (0.88, 0.81-0.96). Pre-treatment (visit 1) health status was associated with being a case with an increase of 1 on this measure increasing the odds of being a case by almost 2.7 fold (2.67, 1.13-6.34). In the fourth model ( 2 or more symptoms vs none or 1 symptoms), the variables associated with altered risk were the same ones as identified in the third model. The risk of being a case was lower if the farmer held a certificate of competence for handing pesticides (0.21, 0.06-0.82) and also decreased with age with a one year increase in age being associated with a 12% decrease in risk (0.91, 0.85-0.97). Pre-treatment (visit 1) health status was associated with being a case with an increase of 1 on this measure increasing the odds of being a case by almost 3 fold (3.02, 1.39-6.35).
The risk of being a case in the different models when the exposure comparison was between no urinary metabolites or specific classes of urinary pesticide metabolites (Table 64). In the first model (1 or more symptoms vs no symptoms) , the risk of being a case was lower if the farmer held a certificate of competence for handing pesticides (0.15, 0.05-0.51) and also decreased with age with a one year increase in age associated with a 7% decrease in risk (0.93, 0.88-0.99). No other variables were associated with increased risk. In the second model (1 symptom vs no symptoms), no variables was associated with altered risk of being a case. In the third model ( 2 or more symptoms vs no symptoms), the risk of being a case was lower if the farmer held a certificate of competence for handing pesticides (0.06, 0.01-0.36) and also decreased with age
98

with a one year increase in age being associated with a 14% decrease in risk (0.86, 0.78-0.94). Pre-treatment (visit 1) health status was associated with being a case with an increase of 1 on this measure increasing the odds of being a case by 3.4 fold (3.42, 1.26-9.27). In the fourth model ( 2 or more symptoms vs none or 1 symptoms), the variables associated with altered risk were the same ones as identified in the third model. The risk of being a case was lower if the farmer held a certificate of competence for handing pesticides (0.15, 0.03-0.63) and also decreased with age with a one year increase in age being associated with a 11% decrease in risk (0.89, 0.82-0.95). Pre-treatment (visit 1) health status was associated with being a case with an increase of 1 on this measure increasing the odds of being a case by almost 4 fold (3.85, 1.55-9.53). Ever having dipper’s flu was associated with an increased risk of being a case in this model (4.70, 1.02-21.69). The presence of any specific class of urinary pesticide metabolite was not associated with altered risk in any of the models used but in model 4 (2 or more symptoms vs none or 1 symptoms) there was an elevated but non-significant risk associated with having both urinary OP and pyrethroid metabolites (4.41,0.71-27.41). The unadjusted risk associated with the presence of both these urinary metabolites was also non-significant (1.11, 0.40-3.07).
99

100

8. PRINCIPAL COMPONENT ANALYSIS OF DIARY SYMPTOM COMPLEXES
8.1 Component identification
Principle component analysis was carried out on new symptoms reported on day 1 and day 2 and results are shown in Table 65. For day 1 symptom complexes, three components were identified which accounted for 51.6% of the variance. Component 1 consisted of three symptom complexes associated with having a runny, stuffy, blocked or irritated nose, and being sweaty, shivery, feverish, hot or cold and feeling generally ill. Component 2 consisted of three complexes involving nausea, poor appetite, vomiting, abdominal pain or diarrhoea and feeling unusually tired and having pain in muscles or joints. Component 3 consisted of three complexes involving a hoarse voice or sore throat, a headache and eye irritation. For day 2 symptom complexes, four components were identified which accounted for 57.0 % of the variance. Component 1 consisted of two complexes namely being sweaty, shivery, feverish, hot or cold and feeling generally ill, component 2 three symptom complexes associated with having a runny, stuffy, blocked or irritated nose and eye irritation and pain in muscles or joints. Component 3 had two complexes namely nausea, poor appetite, vomiting, abdominal pain or diarrhoea and feeling unusually tired. Component 4 consisted of the following three complexes, hoarse voice or sore throat (negative association), cough, shortness of breath or wheeze and having a headache .
8.2 Associations between individual components and demographic variables
The individual symptom complex scores were then combined for each of these individual components on days 1 and 2 and Table 66 shows the associations between the resulting component scores and demographic variables. There was no association between day 1 and day 2 component scores and region, age, sex, being a contractor or smoking and drinking habits. Having a certificate of competence for handling pesticides was not associated with these different components except for component 3 (nausea) on day 2 in which non-holders had higher symptom scores than holders of the certificate. Health status at visit 1 was associated with all three components on day 1, with those with poor/very poor health having higher scores for each three components than those farmers with average or good/very good health . Health status at visit 1 was associated only with component 4 (cough) on day 2 and not day 2 components 1, 2 and 3. Having dipper’s flu previously was associated with all three components on day 1 and also components 1 and 3 on day 2. Perceived sheep dip risk was similarly associated with all three components on day 1 and components 1 and 3 on day 2 with those farmers who perceived a high risk from sheep dip having higher scores than those farmers who perceived a low or medium risk.
8.3 Associations between individual components and exposure variables
Associations between the different components and specific exposure variables are shown in Table 67. There was no association between treatment method and product used (Non-OP vs OP vs unknown) and components on days 1 and 2. The specific product used was associated only with component 1 (sweaty) on day 2 and not with any component on day 1 or other components on day 2.
101

Table 65 Components identified by PCA analysis of incident symptom complexes
on days 1 and 2
Day Component Eigenvalue Variance Symptom complex Loading Runny, stuffy, blocked 0.76 or irritated nose
1 2.897 29.0 Sweaty, shivery, feverish, hot or cold
0.69
Cough, shortness of 0.60 breath or wheeze Feeling generally ill 0.48
1
2 1.256 12.6
Nausea, poor appetite, vomiting, abdominal pain or diarrhoea
0.78
Feeling unusually tired 0.66 Pain in muscles or joints 0.53
3 1.002 10.0
Hoarse voice or sore throat
0.72
Headache 0.66 Eye irritation 0.51
1 2.070 20.7 Sweaty, shivery, feverish, hot or cold
0.83
Feeling generally ill 0.81
2 1.447 14.5
Runny, stuffy, blocked or irritated nose
0.73
Eye irritation 0.64 Pain in muscles or joints 0.49
2 3 1.123 11.2
Nausea, poor appetite, vomiting, abdominal pain or diarrhoea
0.77
Feeling unusually tired 0.48 Hoarse voice or sore -0.67
4 1.058 10.6 throat Cough, shortness of breath or wheeze
0.62
Headache 0.44
8.4 Associations between individual components and urinary pesticide metabolites
The variation in day 1 and day 2 component scores with urinary pyrethroid metabolite concentrations is shown in Table 68. There were no significant associations between component scores on days 1 and 2 with urinary PBA, tDCVA and cDBVA concentrations. On day 2, those farmers with urinary levels of cDCVA greater than the 90th percentile had a higher score than those with no detectable cDCVA . The variation in day 1 and day 2 component scores with urinary OP metabolite concentrations is shown in Table 69. There were no significant associations between component scores on days 1 and 2 with urinary DMP, DMDTP and DEP concentrations. On day 1 component 1 (nose) was associated with DEDTP levels (p<0.05) but this was based upon only two farmers with detectable DEDTP levels. On day 1 component 2 (nausea) was significantly associated with DMTP (p<0.05) , DETP (p<0.001)
102

and DEDTP (p<0.05) levels. The associations with DEDTP levels were based upon two farmers with detectable DEDTP levels. The highest component 2 score was not found in those farmer with the highest DETP levels but in two farmers whose levels were below the 90th percentile. With DMTP categories the highest scores were found in those farmers whose DMTP levels were higher than the 90th percentile.
The variation in day 1 and 2 component scores with total urinary OP and pyrethroid levels is shown in Table 70. There was no association with component scores and urinary ethyl, diazinon or total OP levels. Day 2 component 1 (sweaty, ill) scores were highest in those farmers with no detectable methyl metabolites (p<0.05)
103

Table 66 Variation in day 1 and day 2 component scores with demographic variables
Variable mean±SD Day 1 score (n) mean±SD Day 2 score (n) Item Description Component 1 Component 2 Component 3 Component 1 Component 2 Component 3 Component 4 Region Wales 0.25±0.64 (182) 0.28±0.62 (182) 0.35±0.62 (182) 0.05±0.23 (178) 0.16±0.46(166) 0.12±0.36 (173) 0.09±0.42 (159)
N West 0.24±0.72 (104) 0.23±0.54 (104) 0.28±0.66 (104) 0.03±0.17 (100) 0.19±0.44 (96) 0.11±0.35 (97) 0.05±0.40 (94) S East 0.18±0.47 (61) 0.23±0.59 (61) 0.21±0.58 (61) 0.07±0.31 (60) 0.09±0.35 (56) 0.11±0.31 (57) 0.04±0.43 (55)
Gender Male 0.23±0.61 (299) 0.27±0.60 (299) 0.31±0.63 (299) 0.03±0.20 (290) 0.14±0.42 (273) 0.10±0.33 (281) 0.07±0.40 (262) Female 0.25±0.79 (48) 0.19±0.49 (48) 0.27±0.61 (48) 0.10±0.37 (48) 0.24±0.53 (45) 0.17±0.44 (46) 0.11±0.48 (46)
Age <40 41-50 51-60 >61
0.33±0.72 (42) 0.24±0.66 (90) 0.20±0.57 (123) 0.24±0.67 (92)
0.38±0.79 (42) 0.27±0.54 (90) 0.20±0.48 (123) 0.26±0.66 (92)
0.40±0.70 (42) 0.28±0.62 (90) 0.31±0.60 (123) 0.27±0.63 (92)
0.07±0.35 (41) 0.05±0.21 (88) 0.03±0.18 (118) 0.04±0.25 (91)
0.18±0.45 (39) 0.21±0.52 (81) 0.17±0.44 (114) 0.08±0.32 (84)
0.10±0.30 (40) 0.15±0.42 (85) 0.10±0.33 (115) 0.09±0.29 (87)
0.08±0.43 (38) 0.03±0.45 (79) 0.05±0.35 (106) 0.14±0.44 (85)
Smoking Non-smoker 0.25±0.65 (189) 0.26±0.60 (189) 0.31±0.61 (189) 0.05±0.25 (186) 0.16±0.43 (176) 0.14±0.38 (180) 0.09±0.43 (171) Current smoker 0.14±0.35 (50) 0.22±0.51 (50) 0.30±0.71 (50) 0.06±0.32 (47) 0.23±0.57 (43) 0.13±0.34 (45) 0.02±0.46 (43) Ex-smoker 0.25±0.71 (107) 0.26±0.62 (107) 0.30±0.62 (107) 0.02±0.14 (104) 0.11±0.38 (98) 0.06±0.28 (101) 0.06±0.36 (93)
Drinking Non-drinker 0.25±0.70 (55) 0.35±0.67 (55) 0.35±0.70 (55) 0.04±0.19 (54) 0.15±0.36 (53) 0.17±0.43 (52) 0.10±0.46 (51) Current drinker 0.23±0.63 (291) 0.24±0.57 (291) 0.30±0.61 (291) 0.05±0.24 (283) 0.16±0.45 (264) 0.10±0.33 (274) 0.07±0.41 (256)
Certificatea Non-holder 0.26±0.70 (225) 0.27±0.60 (225) 0.35±0.68 (225) 0.05±0.23 (217) 0.19±0.48 (203) 0.14±0.39 (211) 0.07±0.43 (197) Holder 0.20±0.50 (119) 0.24±0.58 (119) 0.23±0.51 (119) 0.04±0.24 (118) 0.10±0.33 (112) 0.06±0.24 (113)* 0.07±0.38 (108)
Contractor No 0.24±0.64 (336) 0.25±0.58 (336) 0.31±0.63 (336) 0.05±0.24 (327) 0.16±0.44 (307) 0.12±0.35 (317) 0.07±0.41 (299) Yes 0.25±0.46 (8) 0.63±1.06 (8) 0.13±0.35 (8) 0.0±0.0 (8) 0.13±0.35 (8) 0.0±0.0 (7) 0.29±0.49 (7)
Health statusb Very good/good 0.17±0.54 (253) 0.19±0.50 (253) 0.23±0.54 (253) 0.03±0.22 (247) 0.14±0.42 (235) 0.10±0.33 (243) 0.04±0.36 (24) Average 0.30±0.64 (83) 0.36±0.67 (83) 0.40±0.71 (83) 0.09±0.28 (81) 0.19±0.49 (74) 0.15±0.36 (75) 0.11±0.45 (75) Poor/very poor 1.18±1.54 (11)*** 1.10±1.04 (11)*** 1.18±0.98 (11)*** 0.0±0.0 (10) 0.22±0.44 (9) 0.22±0.44 (9) 0.56±0.88 (9)***
Dipper’s fluc Yes 0.13±0.47 (227) 0.17±0.45 (227) 0.18±0.45 (227) 0.03±0.20 (224) 0.15±0.43 (211) 0.05±0.23 (217) 0.06±0.34 (206) No 0.53±0.94 (78)*** 0.42±0.75 (78)*** 0.63±0.88 (78)*** 0.10±0.34 (73)* 0.20±0.47 (69) 0.27±0.48 (71)*** 0.12±0.62 (67)
Perceived Low 0.10±0.34 (126) 0.17±0.50 (126) 0.18±0.45 (126) 0.01±0.09 (124) 0.13±0.43 (117) 0.07±0.28 (1210 0.03±0.37 (112) sheep dip risks Medium 0.19±0.51 (111) 0.23±0.54 (111) 0.23±0.56 (111) 0.04±0.19 (109) 0.13±0.36 (103) 0.08±0.27 (105) 0.07±0.30 (96)
High 0.43±0.86 (101)*** 0.38±0.71 (101)* 0.51±0.80 (101)*** 0.09±0.36 (96)* 0.21±0.51 (89) 0.22±0.46 (92)** 0.14±0.55 (92)
aCertificate of competence for handling pesticides; bBefore treatment at visit 1; cHistory of Dipper’s flu; dBased upon scale used by Stephens et al (1995a): max score =24, Low (≤13), medium (14-19), high (≥20). Significantly different *p<0.05, **p<0.01, ***p<0.001
104

Table 67 Variation in day 1 and day 2 component scores with self-reported exposures
Variable Day 1 Day 2 Item Description Component 1 Component 2 Component 3 Component 1 Component 2 Component 3 Component 4 Treatment Injection 0.27±0.63 (22) 0.27±0.70 (22) 0.10±0.29 (22) 0.0±0.0 (22) 0.14±0.48 (21) 0.05±0.22 (21) 0.10±0.30 (21) method Dip
Pour-on 0.17±0.42 (121) 0.31±0.79 (174)
0.28±0.62 (121) 0.22±0.53 (174)
0.33±0.64 (121) 0.32±0.66 (174)
0.02±0.13 (117) 0.07±0.30 (170)
0.15±0.38 (109) 0.18±0.47 (159)
0.11±0.32 (116) 0.14±0.39 (162)
0.11±0.42 (106) 0.05±0.43 (156)
Shower 0.0±0.0 (14) 0.21±0.58 (14) 0.29±0.61 (14) 0.0±0.0 (14) 0.07±0.27 (14) 0.0±0.0 (13) 0.15±0.38 (13) Mixed 0.18±0.40 (11) 0.55±0.93 (11) 0.18±0.40 (11) 0.0±0.0 (11) 0.18±0.60 (11) 0.0±0.0 (11) -0.10±0.32 (10)
General Non-OP 0.27±0.69 (231) 0.24±0.56 (231) 0.30±0.64 (231) 0.06±0.27 (225) 0.17±0.46 (211) 0.13±0.38 (216) 0.07±0.41 (208) product OP 0.16±0.46 (101) 0.27±0.63 (101) 0.29±0.55 (101) 0.02±0.14 (98) 0.16±0.40 (92) 0.07±0.26 (96) 0.09±0.45 (86)
Unknown 0.27±0.80 (15) 0.40±0.74 (15) 0.47±0.83 (15) 0.0±0.0 (15) 0.0±0.0 (15) 0.07±0.26 (15) 0.0 ±0.0 (14) Specific Avermectin 0.27±0.63 (22) 0.41±0.91 (22) 0.14±0.35 (22) 0.00±0.00 (22) 0.15±0.48 (21) 0.05±0.22 (21) 0.10±0.30 (21) product OP 0.13±0.45 (97) 0.25±0.58 (97) 0.27±0.55 (97) 0.02±0.15 (94) 0.14±0.38 (88) 0.07±0.25 (92) 0.08±0.44 (84)
Pyrethroid 0.34±0.78 (108) 0.22±0.46 (108) 0.42±0.76 (108) 0.10±0.36 (103) 0.19±0.47 (94) 0.17±0.40 (101) 0.13±0.45 (93) Triazine 0.18±0.63 (67) 0.22±0.57 (67) 0.21±0.54 (67) 0.01±0.12 (67)* 0.17±0.49 (63) 0.11±0.37 (62) -0.03±0.31 (63)
Significantly different *p<0.05
105

Table 68 aVariation in day 1 and 2 component scores with urinary pyrethroid metabolite concentrations
Urinary pyrethroid Mean ±SD (n) Factor score Day 1 Day 2
Metabolite Levelb Component 1 Component 2 Component 3 Component 1 Component 2 Component 3 Component 4
PBA not detected <90th percentile
>90th percentile
0.3±0.8 (89) 0.3±0.8 (41) 0.0±0.0 (6)
0.3±0.5 (89) 0.4±0.8 (41) 0.5±0.8 (6)
0.4±0.7 (89) 0.3±0.7 (41) 0.5±0.5 (6)
0.01±0.1 (87) 0.05±0.2 (39) 0.0±0.0 (6)
0.1±0.4 (84) 0.3±0.6 (38) 0.3±0.8 (6)
0.1±0.4 (82) 0.1±0.3 (38) 0.0±0.0 (6)
0.1±0.4 (79) 0.1±0.4 (37) 0.0±0.0 (4)
cDCVA not detected <90th percentile >90th percentile
0.3±0.8 (107) -0.2±0.8 (28)
0.4±0.7 (107) -0.2±0.6 (28)
0.4±0.7 (107) -0.4±0.9 (28)
0.03±0.2 (104) -0.0±0.0 (27)
0.1±0.4 (101) -0.4±0.7 (26)**
0.1±0.4 (99) -0.1±0.4 (26)
0.1±0.4 (95) -0.1±0.5 (24)
tDCVA not detected <90th percentile >90th percentile
0.3±0.8(119) 0.0±0.0 (3) 0.1±0.5 (14)
0.3±0.7 (119) 0.0±0.0 (3) 0.4±0.7 (14)
0.4±0.7 (119) 0.7±1.2 (3) 0.4±0.8 (14)
0.03±0.2 (116) 0.0±0.0 (3) 0.0±0.0 (13)
0.2±0.5 (113) 0.0±0.0 (2) 0.0±0.0 (13)
0.1±0.4 (110) 0.0±0.0 (3) 0.0±0.0 (13)
0.1±0.4 (106) 0.0±0.0 (2) 0.1±0.3 (12)
cDBVA not detected <90th percentile
>90th percentile
0.3±0.8(128) 0.0±0.0 (4) 0.3±0.5 (4)
0.3±0.6(128) 0.3±0.5 (4) 1.3±1.3 (4)*
0.4±0.7 (128) 0.3±0.5 (4) 0.3±0.5 (4)
0.02±0.2 (124) 0.0±0.0 (4) 0.0±0.0 (4)
0.2±0.5 (120) 0.3±1.5 (4) 0.5±0.6 (4)
0.1±0.4(119) 0.3±0.6 (3) 0.0±0.0 (4)
0.1±0.4 (113) 0.0±0.0 (4) 0.7±0.6 (3)
a OP metabolites restricted to those measured at visit 2 within three days of last treatment and with a urinary creatinine level of between 3 and 30 mmole/litre; b 90th percentile levels in non-occupationally exposed population (data provided by HSL) and are the following: PBA <1.9µmol/mol creatinine; cDCVA 0.3 µmol/mol creatinine; tDCVA 0.5 µmol/mol creatinine; cDBVA <0.4 µmol/mol creatinine; Significantly different * p<0.05; ** p<0.01
106

Table 69 aVariation in day 1 and day 2 component scores with urinary OP metabolite concentrations
Urinary OPs Mean±SD (n) factor score Day 1 Day 2
Metabolite Levelb Component 1 Component 2 Component 3 Component 1 Component 2 Component 3 Component 4
DMP not detected <90th percentile >90th percentile
0.3±0.8 (62) 0.3±0.8 (63) 0.2±0.6 (11)
0.4±0.6 (62) 0.2±0.6 (63) 0.4±0.9 (11)
0.5±0.7 (62) 0.3±0.7 (63) 0.2±0.4 (11)
0.04±0.2 (62) 0.0±0.0 (59) 0.0±0.0 (11)
0.2±0.5 (58) 0.2±0.5 (59) 0.1±0.3 (11)
0.1±0.4 (57) 0.1±0.4 (59) 0.2±0.4 (10)
0.1±0.4 (52) 0.1±0.4 (58) 0.1±0.7 (10)
DMTP not detected <90th percentile >90th percentile
0.3±0.7 (83) 0.2±0.5 (29) 0.4±1.2 (24)
0.3±0.6 (83) 0.1±0.4 (29) 0.6±0.9 (24)*
0.3±0.6 (83) 0.5±0.9 (29) 0.4±0.8 (24)
0.04±0.2 (80) 0.0±0.0 (29) 0.0±0.0 (23)
0.2±0.5 (78) 0.2±0.5 (27) 0.1±0.4 (23)
0.2±0.4 (75) 0.1±0.3 (29) 0.0±0.0 (22)
0.1±0.5 (72) 0.1±0.3 (26) 0.05±0.4 (22)
DMDTP not detected <90th percentile >90th percentile
0.3±0.8 (133) -0.0±0.0 (3)
0.3±0.6 (133) -1.0±1.0 (3)
0.4±0.7 (133) -0.3±0.6 (3)
0.02±0.2 (129) -0.0±0.0 (3)
0.2±0.5 (125) -0.3±0.6 (3)
0.1±0.4 (123) -0.0±0.0 (3)
0.1±0.4 (117) -0.3±0.6 (3)
DEP not detected <90th percentile >90th percentile
0.4±0.9 (92) 0.1±0.3 (22) 0.04±0.2 (22)
0.4±0.7 (92) 0.1±0.4 (22) 0.2±0.5 (22)
0.4±0.7 (92) 0.1±0.5 (22) 0.5±0.9 (22)
0.02±0.1 (88) 0.0±0.0 (22) 0.05±0.2 (22)
0.2±0.5 (86) 0.2±0.5 (20) 0.1±0.3 (22)
0.2±0.4 (82) 0.0±0.0 (22) 0.05±0.2 (22)
0.05±0.4 (81) 0.3±0.4 (20) 0.2±0.4 (19)
DETP not detected <90th percentile >90th percentile
0.3±0.8 (101) 0.5±0.7 (2) 0.1±0.4 (33)
0.3±0.6 (101) 2.0±1.4 (2) 0.4±0.7 (33)***
0.4±0.8 (101) 0.0±0.0 (2) 0.2±0.5 (33)
0.03±0.2 (97) 0.0±0.0 (2) 0.0±0.0 (33)
0.2±0.5 (93) 0.5±0.7 (2) 0.1±0.3 (33)
0.2±0.4 (92) 0.0 (1) 0.03±0.2 (33)
0.1±0.4 (87) 0.0±1.4 (2) 0.2±0.5 (31)
DEDTP not detected <90th percentile >90th percentile
0.3±0.8 (134) 1.5±0.7 (2)* -
0.3±0.6 (134) 1.5±2.1 (2)* -
0.4±0.7 (134) 0.5±0.7 (2) -
0.02±0.2 (130) 0.0±0.0 (2) -
0.2±0.5 (126) 0.5±0.7 (2) -
0.1±0.4 (134) 0.0±0.0 (2) -
0.1±0.4 (119) 0.0 (1) -
a OP metabolites restricted to those measured at visit 2 within three days of last treatment and with a urinary creatinine level of between 3 and 30 mmole/litre; b 90th percentile levels in non-occupationally exposed population (data provided by HSL) and are the following; DMP 35 µmol/mol creatinine; DMTP 15 µmol/mol creatinine; DMDTP 3 µmol/mol creatinine; DEP 9 µmol/mol creatinine; DETP 4 µmol/mol creatinine; DEDTP 7 µmol/mol creatinine. Significantly different * p<0.05, ** p<0.01, *** p<0.001
107

Table 70 Variation in day 1 and day 2 component scores with total urinary OP and pyrethroid metabolite concentrationsa,b
Methyl OP
Total urinary OPs & pyrethroids
Metabolites Levelc
not detected <90th percentile
0.3±0.7 (40)
Mean±SD (n) factor score Day 1 Component 1 Component 2
0.4±0.6 (40) 0.5±0.7 (40)
Component 3
0.1±0.3 (40)
Day 2 Component 1
0.2±0.5 (38)
Component 2
0.1±0.4 (36)
Component 3
0.1±0.4 (34)
Component 4
DMDTP) (DMP+DMTP+
>90th percentile 0.2±0.6 (12) 0.3±0.8 (84)
0.5±1.0 (12) 0.3±0.6 (84)
0.2±0.4 (12) 0.4±0.7 (84)
0.0±0.0 (12)* 0.0±0.0 (80)
0.0±0.0 (12) 0.2±0.5 (78)
0.1±0.3 (11) 0.1±0.4 (79)
0.2±0.6 (12) 0.1±0.4 (74)
Ethyl OP not detected <90th percentile
0.4±0.9 (79) 0.3±0.6 (79) 0.4±0.7 (79) 0.03±0.2 (75) 0.2±0.5 (73) 0.2±0.5 (70) 0.1±0.4 (69)
DEDTP) (DEP+DETP+
>90th percentile 0.1±0.2 (19) 0.2±0.4 (38)
0.3±0.6 (19) 0.3±0.8 (38)
0.2±0.5 (19) 0.3±0.7 (38)
0.0±0.0 (19) 0.03±0.2 (38)
0.1±0.3 (19) 0.1±0.4 (36)
0.0±0.0 (19) 0.1±0.2 (37)
0.3±0.5 (19) 0.1±0.5 (33)
Diazinon (DEP+DETP)
Not detected <90th percentile >90th percentile
0.4±0.9 (79) 0.2±0.5 (30) 0.04±0.2 (27)
0.3±0.6 (79) 0.4±0.9 (30) 0.2±0.5 (27)
0.4±0.7 (79) 0.3±0.7 (30) 0.3±0.6 (27)
0.03±0.2 (75) 0.0±0.0 (30) 0.04±0.2 (27)
0.2±0.5 (73) 0.2±0.5 (28) 0.1±0.3 (27)
0.2±0.5 (70) 0.03±0.2 (29) 0.04±0.2 (27)
0.1±0.4 (69) 0.1±0.5 (28) 0.2±0.4 (23)
Methyl + Ethyl OP
not detected <90th percentile >90th percentile
0.3±0.7 (34) 0.3±0.8 (87) 0.1±0.5 (15)
0.4±0.6 (34) 0.2±0.6 (87) 0.6±1.0 (15)
0.4±0.7 (34) 0.3±0.7 (87) 0.3±0.6 (15)
0.1±0.2 (34) 0.01±0.1 (83) 0.0±0.0 (15)
0.2±0.5 (32) 0.2±0.5 (81) 0.1±0.3 (15)
0.1±0.4 (30) 0.1±0.4 (81) 0.1±0.3 (15)
0.1±0.4 (30) 0.1±0.4 (75) 0.2±0.6 (15)
OP + pyrethroidd
None Pyrethroid only OP only OP+pyrethroid
0.4±0.8 (23) 0.2±0.4 (11) 0.3±0.8 (54) 0.3±0.7 (48)
0.4±0.6 (23) 0.5±0.7 (11) 0.2±0.5 (54) 0.3±0.8 (48)
0.3±0.6 (23) 0.6±0.8 (11) 0.4±0.7 (54) 0.3±0.7 (48)
0.0±0.0 (23) 0.2±0.4 (11) 0.02±0.1 (52) 0.0±0.0 (46)**
0.2±0.4 (21) 0.3±0.4 (11) 0.02±0.1 (51) 0.4±0.6 (45)**
0.1±0.4 (21) 0.2±0.4 (9) 0.1±0.4 (50) 0.1±0.4 (46)
0.1±0.4 (20) 0.1±0.3 (10) 0.2±0.4 (47) 0.1±0.5 (43)
a OP metabolites restricted to those measured at visit 2 within three days of last treatment;bMetabolites restricted to those measured at visit 2 within three days of last treatment and with a urinary creatinine level of between 3 and 30 mmole/litre; c 90th percentile levels in non-occupationally exposed population (data provided by HSL) and are the following: methyl <56µmol/mol creatinine ; ethyl <19 µmol/mol creatinine; diazinon <13µmol/mol creatinine; methyl+ethyl <77 µmol/mol creatinine; das defined by the presence or absence of urinary OP and pyrethroid metabolites. Significantly different *p<0.05, **p<0.01
108

9 DISCUSSION
Anecdotal complaints of dipper’s flu associated with sheep dipping have been widely publicised since the early 1990’s. While there is no generally agreed definition of what constitutes dipper’s flu, it has been used to describe “flu-like” symptoms including runny nose, headache, aching limbs and malaise occurring shortly after the time of dipping and persisting for up to 48 hours (Baxter et al, 2000). There, however, have been few epidemiological studies to characterise ill-health following sheep dipping and published studies have failed to demonstrate a coherent or consistent pattern in symptoms (Rees, 1996; Jackson & Spurgeon, 2001). It has been suggested that these symptoms are related to perception of risk, and may be a non-specific psychological response to OP exposure, or alternatively subtle markers of susceptibility to OP poisoning.
Treating sheep for ectoparasites is a complex process, and practices change from year to year. During treatment, farmers are potentially exposed to a number of environmental agents and stressors including physical exertion, OPs and other agricultural pesticides, formulation chemicals, infectious pathogens, animal ectoparasites and animal by-products such as faeces and urine. The presence of so many factors has contributed to the difficulties associated with determining the precise nature of ill-health and the more likely causes of this ill-health. Hence the nature and causes of dipper’s flu are not clear. In 1999, a report by the Committee on Toxicity of Chemicals in Food, Consumer Products and the Environment (COT) stated that “research is needed both to characterise the nature of dipper’s flu more fully and to identify the mechanism involved in its causation” (Committee on Toxicity of Chemicals in Food, Consumer Products and the Environment, 1999).
A cohort study of sheep farmers was therefore undertaken to examine these specific questions, with a first phase being to characterise the nature and incidence of dipper’s flu, and a second phase to examine the aetiology of dipper’s flu with a particular emphasis on exposure to OPs. Alternative epidemiological approaches, such as a case-referent study were not considered appropriate given the lack of a clearly defined case entity. The sampling frame of the study was principally based upon databases held by the NFU and the BWMB, and this study might not have included employed farmworkers (who are unlikely to be members of these organisations), nor the increased numbers of migrant workers who have been employed in British agriculture since this study was designed (Szczepura et al, 2004). It is likely that working practices and awareness of pesticide toxicity may vary between these workers and the farmers involved in this study, and the results from this work may not be directly generalisable to the former.
The original study design included only those farmers who treated sheep by dipping, but pilot studies indicated that the number of farmers using alternative treatments such as pour-ons and injections had greatly increased. Therefore, all types of treatment for sheep ectoparasites were included in the study. Whilst this reduced the power of the study to directly make a comparison between dippers who used OPs and those who used other products, the inclusion of farmers who used other types of treatment (and products) would enable the results of the study to be more relevant to current farming practices and also would determine whether dipper’s flu occurred during other treatments. The latter would suggest that exposure to OPs might not be the causative factor (or sole factor) and that other exposures may well be implicated (e.g. to infectious agents or endotoxins).
The response rate amongst farming communities to epidemiological studies (either using postal questionnaires or telephone interviews) can be quite low in comparison to studies in other populations. In this study, the response rate was only approximately 9% which is perhaps not surprising given the intensive nature of the study (requiring three face-to-face interviews and multiple blood sampling). In a number of studies over the past decade or so, the response rate amongst farmers using current addresses and phone numbers ranged from 19% to 98%
109

(Stephens et al, 1995b; Gerrard 1998; Simkin et al, 1998; Eisner et al, 1998; Booth & Lloyd, 1999; Davies et al, 1999; Pilkington et al, 2001; Thomas et al, 2003; Tahmaz et al, 2003; Stephens & Sreenivasan, 2004; Fletcher et al, 2005; Solomon 2007a). Rees approached 38 farmers living in three adjacent community council electoral wards. The study was designed to maximise response rates, but 27% of subjects refused to participate, largely because of concerns regarding blood testing and time commitments (Rees, 1996). The highest response rate has been obtained from members of OP support groups using telephone contact, but the same study also reported the lowest response rate (19%) when contact, as in this study, was made by letter (Fletcher et al, 2005). This low response rate can be ascribed to a number of reasons including pressure of work, the perceived burden of forms to complete from both the Government and scientific researchers (farmers find form filling particularly stressful; Parry et al, 2005), and disillusionment with progress in understanding the health concerns of certain sections of the farming community. Failure of a class action for financial compensation for health effects related to sheep dips in 2001 may well have contributed to the latter. In addition some farmers are sceptical about whether research funded by certain organisations can be objective. However, it should be noted that the UK biobank, a major prospective cohort study, have also reported low rates (UK Biobank, 2006) which may suggest a more widespread problem in the acceptability of such studies.
The low response rate may directly impact upon how the results can be interpreted with regard to the wider farming community i.e. whether the results are biased. The farmers who took part in this study received up to £100 in compensation for the time taken for this study and this may also have resulted in a biased population. Comparison of the study population with a small number of non-responders, suggests that the study population was more likely to have had dipper’s flu in the past and to perceive that dipping sheep was a risk to human health. Hence, if no effects were observed in this population, then it is unlikely that an effect would be seen in the wider population. More subjects were recruited from Wales than the English regions, but once recruited, those in north west England were more likely to complete the different components of the study. This may have been related to the differing geographical characteristics, practicability of travel to farms, and numbers of field-nurses in Wales and north west England. Due to delays beyond the control of the investigators, the study commenced after the start of sheep-treatment in south east England, and this probably led to the low response and completion rates there. Flock sizes and treatment practices vary between different regions, and the variations in regional recruitment described above may have led to either over or under-ascertainment of health effects in some areas. A number of other factors were unlikely to lead to substantial bias. There were small differences between participants and non-participants with regard to age, gender, cigarette smoking, high perception of risk from sheep dipping, a history of zoonoses, intestinal disorders, and high overall symptom scores before treating. Relatively more subjects using injections and sprays also entered the study, but the differences in numbers were small.
One final factor that should be mentioned is that changes in treatment practices since the 1990’s mean that the present study may not be representative of pesticide exposures in that decade in which farmers’ concerns that ill-health was associated with pesticide exposure were increasingly reported . In particular, there has been a reduction in the use of OP’s in favour of pyrethroids & triazines, and movement from dipping to pour-ons and injection (Liddell, 2000; Trainor et al, 2002). It should thus be stressed that the results from this study will then only directly relate to current exposures and treatment techniques. If significant associations are found with current exposures and techniques it is likely that past exposures may also have affected farmer’s health. Conversely, if there are no significant associations in the current study this does not necessarily rule out past exposures affecting farmer’s health.
110

The objectives of the study were then: 1. To determine the nature and frequency, of symptoms and signs of acute ill health,
amongst farmers treating sheep for ectoparasites in 2005-2006. 2. To establish whether the development of flu-like symptoms in farmers treating sheep
for ectoparasites, is associated with specific exposures and biological effects. 3. To establish whether farmers who develop flu-like symptoms have different levels of
exposure to dipping chemicals, infectious agents and endotoxins, compared with farmers treating sheep at the same time in adjacent areas, who did not become acutely ill.
These objectives are then addressed in the following sections.
9.1 The nature and frequency of symptoms and signs of acute ill health
The symptoms and signs of acute ill-health were characterised by both self-report (using a symptom diary and a health questionnaire) and by more objective means, namely by temperature measurement and by analysis of blood samples collected at the second visit immediately after treatment. The symptom diary was designed to directly describe the health experience of farmers immediately after treatment and hence focussed on flu-like symptoms, whereas the health questionnaire collected further information on other non flu-like symptoms. The diary was completed during the week of treatment (and ideally at the end of each working day) whereas the health questionnaire asked the farmer to recall their health over a period of time (potentially up to 4 weeks). Respondents who completed the symptom diary were generally similar to those who did not, save for a pronounced regional variation which resulted from an inability to interview farmers in south east England before they had treated their sheep. In this region, treatment generally occurs earlier in the year than in north west England or Wales.
There was little evidence of dipper’s flu as defined by either the scientific literature, namely a textbook (Baxter et al, 2000) and a scientific report (Stephens et al, 1995a) or the more popular press (Web-based definitions such as DoctorMyhill.co.uk, 2006) from results obtained by the symptom diary, or the health questionnaire, or by temperature measurement. Very few farmers reported having all 10 flu-like symptom complexes itemised in the symptom diary. Also, few farmers had dipper’s flu as defined using the literature definitions that contained only three or four symptom complexes. Using the web based definition, there were four cases of dipper’s flu on the first day giving an incidence rate of approximately 1% which is much lower than would have been anticipated from previous studies which reported that approximately 18% of sheep farmers had ever had dipper’s flu (Povey, personal communication). A slightly higher figure (25%) of previous experience of dipper’s flu was found in this study. The difference between these two rates may simply reflect differences that can occur between a yearly and a lifetime rate, or alternatively may suggest that the literature definitions do not accurately describe the health experience of farmers during and after the treatment of sheep.
Hence, to examine whether any ill-health occurred after treatment, the incidence and prevalence of any symptom complex in the diary were also determined during the week following treatment. There was clear evidence that the incidence and prevalence of individual symptom complexes varied during the week, with reporting being much higher earlier in the week (i.e. immediately after treatment) rather than later in the week. Furthermore, if a broad definition of ill-health were used, namely one or more symptom complexes on any day, then the incidence rate on day one was approximately 40%, a much higher figure than the rate calculated using the literature-based dipper’s flu definitions. By day seven the percentage of farmers self-reporting one or more symptom complexes was approximately 20%.
111

Mild forms of pesticide toxicity may be difficult to identify from symptoms alone. Whereas the non-specific nature of the reported symptoms were consistent with OP and pyrethroid pesticide exposure, they may also have arisen from the effects of solvent exposure, and numerous other biological effects. A smaller proportion are consistent with vigorous exercise. Hence whilst there is clear evidence that symptom reporting increased immediately after treatment, these findings do not necessarily identify the cause. Further analysis of the data is required to examine whether any combinations of particular symptom complexes are more common than others.
In addition to self-reporting of symptoms, more objective measures of ill-health were also examined. Farmers who completed the symptom diary were asked to measure their temperature using a supplied thermometer. Few farmers reported a temperature over 37.7oC suggesting that pyrexia was not a common feature of ill-health complaints following treatment. Increased body temperature is associated with infection, inflammatory processes, exertion and heat stress. In an exhaustive literature review, the range of measured oral temperatures in healthy adults was reported to be very wide, with 95% of values lying between 33.2 and 38.2 degrees Centigrade (Sund-Levander et al, 2002). One of the reasons for this lack of precision might be measurement error. In the present study, measurements showed a predicted variation between morning and afternoon, occupied a narrower range than the review data, and only three lay above 38.20C. This relative precision is somewhat surprising, given the likely range of physiological and environmental conditions in which the temperatures were measured (e.g. following exercise or outdoors), but the results indicate that in general farmers did not develop pyrexia after treating sheep.
Blood samples taken shortly after treatment (at visit two) from a subset of all farmers interviewed were also analysed for standard clinical biochemistry and a full blood count. In some farmers, there was evidence of elevated values for CRP, creatinine, IgE, and MCH and a decreased eosinophil count. However, there was little evidence that these altered analyte levels were associated with changes in symptom reporting. This suggests the absence of significant physical illness in the farmers and may reflect an over-reporting of symptoms by farmers. An alternative explanation may be that the reference range used by the laboratory was not representative of a larger population. Unfortunately there were too few results outside the reference range to enable more detailed analysis.
CRP is a protein produced in the liver in the acute phase of inflammation, bacterial infection and trauma, and is therefore a relatively non-specific marker of biological effect. Levels may rise 1000 fold in these conditions, but in viral infections elevations are often much lower (Pepys, 2003). Levels also rise following strenuous exertion (Neubauer et al, 2008). The modest rises seen in this study are compatible with the markers of allergy and exercise. Similarly the rises in creatinine are consistent with those reported following strenuous physical exertion (Warburton et al, 2002; Davenport, 2003). Anecdotal reports suggest that physical fitness in farmers has declined dramatically with the increasing use of mechanisation over several decades, and this may have contributed to symptomatology in the present study. There are few studies on this subject. A study of agricultural workers in Israel (almost three decades ago) demonstrated superior aerobic capacity when compared with urban dwellers (Epstein et al, 1981). More recent studies in Finnish farmers indicate that they perceive their physical fitness as being poor (Perko-Makela, 2000), but their aerobic capacity is little different to, and their muscle strength is superior to that of urban populations (Ringsberg, 1993; Lakka et al 1996).
IgE is produced by B lymphocytes, and in inflammatory processes, binds with mast cells to release histamine. Raised levels are associated with allergic respiratory & skin conditions, insect bites, fungal infections, worm-infestations, and adder-bites (Warrell et al, 2003). In Toxoplasmosis, IgE levels tend to rise and then fall again (the latter occurs during the months
112

following infection) (Foudrinier et al, 2003). OP exposure is not usually associated with sensitisation, allergy nor raised IgE. Nevertheless, very high exposures to OP’s are known to affect immune function (probably via general rather than specific toxicity), and some experimental studies have found that they depress immune function (Rodgers et al, 1992; Sharma & Tomar, 1992). Allergic reactions to pyrethroids are uncommon (Bradberry et al , 2005) and the little evidence available indicates that they suppress rather than enhance IgE secretion by lymphocytes (Diel et al, 1998). Exposure to triazine pesticides has not been related to raised IgE levels in published literature. The levels seen in this study probably reflect exposures experienced by farmers in the general course of their work, in addition to those experienced during the treatment of sheep (for example bites by ectoparasites).
The elevated MCH levels were also unrelated to symptoms, and there is not a plausible biological explanation why treating sheep should result in raised MCH. In full blood counts, MCH is derived from three independent variables: packed cell volume (haemacrit), haemoglobin levels and red cell count (Weatherall, 2002). Less than 10% of these independent indices lay outside normal limits, so the MCH findings are likely to be artefactual.
Twenty four farmers had blood eosinophil levels below the reference range, and in four subjects rises in eosinophil levels were related in a dose-response manner to health questionnaire symptoms between 2 and 4 weeks after treatment. In allergic reactions, blood eosinophils are recruited to soft tissues, and in sheep, tissue eosinophilia is associated with exposure to ectoparasites (Heath et al, 1995). Blood eosinophil levels are reported to fall within hours of respiratory challenge with other allergens (Cookson et a,l 1989; Heath et al 1995; Lantero et al, 2002). An allergic response to ectoparasite exposure during sheep treatment, may have caused the observed fall in eosinophils, and this might be consonant with a rise in eosinophils and associated symptoms several weeks after exposure. Falls in eosinophil levels are not reported following pesticide exposures.
9.2 The association between self-reported symptoms, specific exposures and biological effects.
The initial project design included a case-referent study nested within a cohort study. In this, cases and referents were to be identified prior to the second visit on the basis of the farmers reporting themselves ill or having a temperature. However, this proved very difficult to carry out in practice because few farmers reported being ill or having a high temperature. Furthermore, many farmers were not contactable immediately after treatment. This was a busy period of the farming year during which farmers had many competing demands and decisions when to treat sheep are often decided on a day by day basis. Hence the second phase of the study was modified to become a cross-sectional study of all farmers, in the original cohort, who were identified as actively treating during a defined time period (from May 2005 until July 2006). Case identification was then carried out at the end of the study with the investigators blind to the subject’s exposures and blood test results. This was undertaken using self-reported symptoms to identify farmers with dipper’s flu as classified a priori for this study or from published definitions. Differences between those interviewed once or more than once probably reflect then the fact that farmers in south east England were less likely to be visited more than once because during the first dipping season, their treatment period had largely ended before the study had started.
There was clear evidence that the reporting rate of symptoms varied during the week following treatment. Given the lack of farmers with dipper’s flu as identified using a priori definitions, the associations between specific exposures and biological effects were next examined using farmers with either one symptom complex, or two or more symptom complexes. Whilst the presence or absence of one symptom complex might reflect a chance occurrence or be a normal
113

health experience, the presence of two or more symptom complexes is less likely to occur by chance and may then have resulted from an exposure (either by a chemical, infectious or psychological effect). The symptom complexes used reflect relatively non-specific biological effects but this is compatible with exposure to agents like OPs which can affect several different organ systems and result in multiple symptoms.
Associations between exposures and the frequency of symptom complex reporting in the diary and diary scores were initially examined using a simple univariate analysis. This analysis revealed associations between the type of product used and symptom reporting and symptom scores; reporting and scoring were higher in those farmers who used OPs and pyrethroids when compared to those farmers who used triazines. This particular association may be confounded by the treatment method used (e.g. dipping or pour-on) as specific products are more likely to be associated with a specific method. However, there was no association between treatment method and symptom reporting or scores. Furthermore, there were no differences in symptom reporting or scores when either OPs or pyrethroids were used with different methods (data not shown), although the power to detect significant effects was limited given the numbers involved. Previous studies have indicated that handling the dip concentrate is the principal determinant of OP exposure during sheep dipping (Buchanan et al, 2001). There has been little work carried out on exposures following the use of pour-ons or injectables though these methods would be expected to cause less exposure than dipping. For injections, occasional accidental injection of the worker appears to be the principal exposure hazard. Dose estimates indicate only a very low risk of chemical toxicity from a single accidental injection, but there may be a risk from transmission of infectious zoonoses (Trainor et al, 2002). No other significant exposure related associations or surrogates of exposures were detected (e.g. numbers of sheep treated or region). These results tend to suggest that the self-reported use of OPs and pyrethroids were associated with increased symptom reporting and may suggest that OPs or pyrethroids cause ill-health, or that the use of OPs or pyrethroids was a surrogate for another unknown exposure or biological effect. Alternatively, the results in the case of pyrethroids, may reflect susceptible farmers changing from one toxic product (namely OPs) to a product believed to be less toxic (namely pyrethroids). Furthermore, self-reported use of OPs and pyrethroids was not associated with increased symptom reporting in the health questionnaires possibly because of differences in symptom information collected and populations examined.
In addition to these associations between the type of product used and symptom diary reporting/scores, strong associations were also detected with health status before treatment (at visit one), previous experience of dipper’s flu and perceived risk of sheep dip. Similar findings were also obtained from the health questionnaire responses except for a lack of response with type of product. The associations with health status before treatment may simply be because those farmers with poor health were more likely to report symptoms than people with self-reported good health. This may also impact on the type of method (and product) used for treatment. The associations with previous experience of dipper’s flu may reflect a population susceptible to the toxic effects of hazardous products or a population with increased propensity (for whatever reasons) to report symptoms. Again it might be expected that previous experience of dipper’s flu might result in changes in the type of method and product used. The strong association between perceived risk of sheep dip and symptom reporting can perhaps be interpreted as suggesting a psychological rather than toxic mechanism for symptom reporting. Farmers in general (and stock farmers in particular) have high rates of stress and suicide (Parry et al, 2005). Psychological effects have also been found to be important determinants of symptoms in sheep dippers (Jackson & Spurgeon, 2001; Solomon et al, 2007a,b). This latter effect is also seen in urban populations exposed to pesticides (Petrie et al, 2005). Awareness of a hazard may lead to concern about the possibility of illness and the propensity to report more symptoms. This effect has been described as “awareness bias” (Moffatt et al, 2000).
114

The prevalence of symptoms on any particular day was likely to reflect not only a previous environmental exposure (if causative), but also the health of the farmer on the previous day. If a farmer has a symptom one day, they may well have the same symptom the next day and the factors which influence the prevalence of symptoms may not be the same as those that determine the incidence. Whilst it is possible to carry out a time series analysis (and this is planned for the future), the approach taken for this report was to focus on factors influencing the incidence of new symptoms on days one or two. The use of incident data can reduce but not entirely eliminate autocorrelation (that a response on one day may be dependent upon the response on a previous day). Principle component analysis of this incident data identified a number of components on both days 1 and 2 and like previous data significant associations were more likely to be found with health factors (health status at visit 1or history of dipper’s flu or perceived sheep dip risk) rather than exposure variables.
A multi-variate analysis was also carried out to examine the associations between self-reported pesticide use and urinary pesticide metabolites after adjustment for factors including demographic variables (such as age, sex, region, drinking and smoking) , occupational variables (holding a certificate of competence for handling pesticides, number of sheep treated) and health factors (pre-treatment health status at visit 1, ever had dipper’s flu and perceived sheep dip risk). Different models were examined to investigate the associations between incident cases of ill-health, pesticide exposure and other potential risk factors. Cases were defined by the number of new symptom complexes occurring on days 1 or 2: the presence of one new symptom complex may be a chance occurrence or be the result of a variety of factors not necessarily related to the treatment of sheep whereas the presence of two or more symptom complexes might be more likely to be related to sheep treatment. Referents were in three models those farmers with no symptoms and in one model (model 4) those farmers with either one new symptom or no new symptoms. Generally the results from this model were similar to the model (model 3) in which those farmers with no symptoms were compared to those with 2 or more new symptoms.
In models that included self-reported exposure to specific pesticide products there were significant associations between the risk of being a case and certain risk factors. In all models self-reported use of pyrethroids was associated with increased risk and holding a certificate of competence for handling pesticides with a decreased risk. In those models, which used a more restricted definition of caseness (and including those with 2 or more symptoms), other risk factors were identified including self-reported use of OPs, health status at visit 1, previous history of dipper’s flu and perceived sheep dip risk (not in model 1): age in these models were associated with decreased risk. The associations were self-reported pesticide use may suggest that pesticide exposure was associated with this ill-health. However, there was no association with the number of sheep treated and furthermore there does appear to be significant misclassification of exposure amongst these different groups, as those farmers who reported use of avermectins or triazines had detectable levels of either OP or pyrethroid metabolites or both OP and pyrethroid metabolites in their urine. When this analysis was restricted to those farmers who reported use of pyrethroids or OPs only, there was no difference in the risk of being a case whether the farmer used OPs or pyrethroids although in humans pyrethroids generally exhibit low toxicity.
Pesticide products may contain more than one harmful substance (e.g. the pesticide and the solvent vehicle), and there may be interactions between these. Unfortunately, many manufacturers declined to provide information on the formulants in many of the products used in this study, limiting the value of such analysis. In a given proprietary product, the identity and concentration of both active pesticide and formulant may change from year to year. This has implications for any future work, comparing the health of farmers treating sheep across different years. The toxicity of pesticides may not be consistent, varying in different technical products produced by manufacturers (although the present study was not designed to study this aspect of
115

pesticide toxicity). Information on product-use was collected in 364 farmers. Of these, five reported using products which were no longer licensed, raising the possibility of increases in toxicity related to the age of the product. There were no other reports of unlicensed use of pesticides. Such small numbers are unlikely to influence the overall findings of this study. The products and the methods of application used by an individual worker may vary both year to year, and within one treatment season. During one season, this may lead to product interactions, e.g. the potential inhibition of pyrethroid metabolism by dialkylphosphate OP’s (United Nations Environment Programme/International Labour Organisation/World Health Organisation, 1986; Gallo & Lawryk, 1991). In the present study, only very small numbers of farmers used products from more than one pesticide class, and this is very unlikely to substantially affect the findings on health effects.
9.3 The association between self-reported symptoms and exposure to treatment chemicals, infectious agents and endotoxins
In addition to the self-reporting of exposures, which may potentially be affected by recall bias, more objective measures of exposure were also determined, namely biomarkers of exposure to pesticides and infectious agents. In contrast to pesticides and infectious agents there are no specific biomarkers for endotoxin exposure, and instead endotoxin levels in sheep dip itself were measured. The samples were collected at visit two (following dipping) and hence it should be borne in mind that, as described previously, there were some differences between the populations who were or were not visited more than once.
There are two widely used biomarkers of exposure to OPs, namely plasma butyrylcholinesterase activity and urinary OP metabolites. Exposure to OPs can result in the inactivation of butyrylcholinesterase, with differing OPs giving differing degrees of inhibition. However, inhibition does not necessarily correlate closely with toxicity. The advantage of biological monitoring using either butyrylcholinesterase activity or urinary pesticide metabolite levels is that they measure OP absorption by the skin, inhalation, ingestion and all other routes. Falls of more than 30% in butyrylcholinesterase usually indicate OP toxicity. With intermediate falls of 20% to 30%, symptoms may occur (Ohayo-Mitoko et al, 2000). However, there is wide inter-individual variation in butyrylcholinesterase activity, and in individuals measurements are unlikely to detect falls of 30% or less by comparison with a normal range for the population. Instead, baseline values need to be established for each individual. The analytical techniques used in this study have a measurement error of 15%. When intra-individual variation is added to this figure, only changes of more than 20.8% should be considered as indicative of OP exposure (Mason & Lewis, 1989). No farmers in this study had falls of this magnitude although many of them had reported use of OPs or had detectable levels of urinary OP metabolites. This may be an indication of measurement error, or unrecognised / unacknowledged use of OP's by farmers, especially prior to visit 1. In previous studies of sheep dippers, no falls in butyrylcholinesterase were observed although there were some reductions in erythrocyte cholinesterase (Niven et al, 1993, Rees, 1996). In the present study, no associations between butyrylcholinesterase inhibition and symptom reporting were detected. In addition to the problems associated with intra-individual variation, there is the potential that some farmers may have been previously exposed to OPs before their baseline butyrylcholinesterase measurements. Subsequent measurement of butyrylcholinesterase at visit two (following treatment) may then underestimate the actual inhibition. Experience from monitoring programmes in Californian pesticide applicators indicates that baseline levels are stable during any given month, but vary significantly over periods of months and years (Lessenger, 2005). In the Californian study there were highly variable rates of cholinesterase recovery following depletion, with a mean recovery time of 38 days. The Health & Safety Executive recommends 60 days free of organophosphate pesticide exposure before measuring baseline levels.
116

A more sensitive and potentially specific marker of OP and pyrethroid exposure is the measurement of their urinary metabolites. Diazinon is a diethoxy phosphorothioate, and is metabolised to DETP and DEP (Barabas, 1998). Cypermethrin is metabolised to cDCVA, tDCVA and PBA. There was an association between OP use and the sum of DEP and DETP urinary metabolites and also between the use of pyrethroids and urinary levels of cDCVA (data not shown). As univariate and multivariate analysis strongly suggest associations between OP and pyrethroid exposures and symptom reporting/scores, it might have been expected that urinary levels of cDCVA and the sum of DEP+DETP levels would also be associated with symptom reporting/scores. However, while there was evidence of increased symptom reporting in those farmers with high urinary levels of cDCVA this was not statistically significant (which may perhaps just reflect the small numbers of samples analysed). Furthermore, there was no evidence of an association between the sum of DEP and DETP urinary levels and diary symptom reporting /scores.
DETP:DEP excretion occurs in a ratio of approximately 4:1 (Garfitt et al, 2002), so DETP values are a more sensitive indicator of exposure than DEP. In this study, between one quarter and one third of the 148 urine OP metabolite measurements were above the 90th percentile seen in populations not occupationally exposed to these pesticides. The levels are lower than those measured in pesticide formulators, but remain higher than those seen in crop sprayers and horticultural workers in the UK (Cocker et al, 2002). Such levels are not generally associated with depletion of butyrylcholinesterase (Cocker et al, 2002). The levels were comparable with than those seen in previous studies of dippers (Niven et al, 1993; Rees, 1996, Sewell et al, 1999) although in recent years, dip concentrates have been packaged in dissolvable sachets for addition to dip-tubs, or are delivered via closed transfer systems, in order to prevent operators having direct skin contact. The lack of a clear dipper’s flu syndrome may then result from this decrease in pesticide exposure, but the similarity in levels of urinary OP metabolite between this and previous studies suggests that exposure has not decreased drastically. OP use was also significantly associated with urinary metabolites suggesting perhaps little variation in for example the use of PPE across the farming population. This is the first time that pyrethroid metabolites have been measured prospectively in farmers treating sheep for ectoparasites, with 148 samples being collected. The levels seen are lower than those seen in British pest control operators using the synthetic pyrethroid permethrin (Llewellyn et al, 1996). Other studies have also found lower exposures in agricultural workers when compared with pest control operators (Hardt & Angerer, 2003).
Self-reported use of OPs and pyrethroids was associated with ill-health in a multivariate analysis but there was evidence of exposure misclassification using this measure. To explore this further, the same multi-variate analysis was carried out using the presence or absence of urinary pesticide metabolites as the principal exposure variable. In these analyses, the presence of urinary pesticide metabolites was not associated with increased risk of ill-health (however defined). This analysis, using urinary pesticide metabolites, was restricted to a smaller number of farmers and this would affect the power of the study to detect significant associations: however other factors identified in the original analysis such factors such as holding a certificate of competence for handling of pesticides and age were still associated with decreased risk. Hence, although the self-reported use of pesticides was associated with ill-health, the lack of a significant effect with a more objective measure of exposure (namely urine metabolites) and the lack of an association with the number of sheep treated suggests that the association is not the result of pesticide exposure but may be the result of an as yet unidentified mechanism (whether psychological or exposure misclassification). It is worthy of note that having a certificate of competence for pesticide handling was generally significantly associated with a decreased risk. The reason for this is unclear. If this results from better handling of pesticides (and reduced exposure) then this would imply that pesticide exposure was directly associated with increased symptom reporting. An alternative explanation might be that having been on the course makes
117

the farmer more aware of the hazards and risks associated with pesticide use and thus less likely to report symptoms. Practically, however, these results are encouraging in that measures designed to reduce exposure (and potential) ill-health have been demonstrated to reduce risk.
This may then suggest that the original self-reports of exposures were either inaccurate, or that the measurement of urinary pesticide metabolites did not accurately reflect the exposure during the time of dipping. Excretion of urinary dialkylphosphate metabolites continues for 48 hours after exposure (Garfitt et al, 2002) whereas, for example, peak excretion of cypermethrin occurs within 12 and 36 hours following exposure. Hence single spot collections of urine are not ideal measures of OP body load. Urine collected over longer periods might be more representative of exposure, but compliance with urine collections lasting 12 or 24 hours is usually poor. Despite these draw-backs, a single urine sample collected at the end of a work-shift can provide useful information (Garfitt et al, 2002; Rees, 1996; Sewell et al, 1999). In this study, subjects were asked to collect a single spot urine sample at the end of the first working day, but some samples were collected many days after the original exposure. Only those samples collected within the three days after initial exposure were used, and it is possible then that some misclassification of exposure had occurred. However, limiting the analysis of urine samples to those collected on day one did not change the results (data not shown). Alternatively, the change in urinary metabolites over the exposure period might be associated with an increased risk of symptom reporting and further work is ongoing to examine this possibility. At present, the reasons for the lack of an association between urinary levels and symptom reporting remain unclear.
Occupational hygiene studies indicate that significant dermal exposure to OPs may occur on handling dip concentrate, but is less likely following exposure to the dilute dip used to treat sheep (Trainor et al, 2002). The degree of skin contamination by OP pesticide is influenced by several factors including the particular task undertaken in treating sheep, the use of personal protective equipment and the behaviour of individual operators (Niven et al, 1993, 1996; Sewell et al, 1999, Buchanan et al, 2001). Exposure may also occur during disposal of dip, and handling of sheep in the days following dipping.
There was little evidence of an association between symptom reporting and infectious agents, or increases in white cell count and body temperature, suggesting that in general, the increase in symptom reporting seen in this study was not related to the agents tested for. There were some increases in CRP (again unrelated to symptoms) but the importance of other infectious agents cannot be ruled out. The serological assays selected for the present study were chosen by a panel comprising specialists in virology, infectious disease, public health and occupational medicine. Deciding which zoonoses might pose the highest risk posed many practical difficulties, and the factors considered included prevalence of pathogens in the environment, opportunities for disease transmission, likelihood of symptomatic as opposed to asymptomatic infection, linking infection with exposure, and the practicality of pathology testing. There were also difficulties in identifying the most appropriate sampling time following the putative exposure to infectious agents and it is possible that for some agents a longer incubation period may have been needed for the agents to be detected serologically. The feasibility of testing was also determined by whether specific tests exist, the ease of sample collection, the geographical location of laboratories in relation to farmers, the stability of the biological sample, and cost. For example, the commonest zoonoses (Campylobacter, Salmonella, Cryptosporidia and E.coli) are conventionally diagnosed by the collection and culture of stool specimens from patients with diarrhoea. Others such as Listeria are best identified by culture of blood from patients with bacteraemia. Methods like these were considered impractical in the present study.
The other final aetiological agent considered in this study was endotoxin. Currently, there is a lack of a robust method to measure endotoxin exposure that can be used in field studies. Whilst endotoxin exposure results in increased levels of a variety of inflammatory mediators (which
118

can be used as markers of exposure), blood samples have to be processed within 24 hours of collection. In this field study, given the nature and timing of the work, it was impossible to predict when a blood sample was going to be taken and hence when the laboratory staff were to be needed. Hence, an alternative measure of potential exposure was undertaken – namely that of measuring endotoxin in the sheep dip before and after dipping. Endotoxin levels rose as the dipping tub became contaminated with the bacterial components of sheep-dung etc. Previous studies have indicate that exposure to endotoxin in out-door agricultural settings is low (Reynolds et al, 1997, Nieuwenhuijsen et al, 1999). In this study the highest dip level was almost four times greater than that found previously (Waclawski et al, 1994). However, both the present and previous studies measured endotoxin in relatively small numbers of dip samples, and the results may not be representative of sheep dipping as a whole. In addition, the assays used in the two studies may not be comparable.
No relationship was found between dip-endotoxin levels and symptoms recorded in the symptom diary and health questionnaire. With regard to parameters commonly associated with endotoxin exposure, 16 (13.9%) farmers had raised CRP levels (which was unrelated to symptoms) but there were few abnormalities in white count and body temperature. Raised IgE levels were observed in a number of farmers but the relationship between allergy, IgE and endotoxin exposure is not clear (Portengen et al, 2005). Neither endotoxin levels in dip-tubs, nor air levels may be representative of individual exposure (Waclawski et al, 1994). Similarly, white cell immunophenotype assays are non-specific markers of endotoxin exposure, and are extremely difficult to use in field studies. Endotoxin exposure cannot be ruled out as a cause of dipper’s flu but further work is required to better characterise endotoxin exposure.
9.4 Summary and future work
This prospective cohort study has demonstrated that current definitions of dipper’s flu do not adequately describe self-reported ill-health that occurs following the treatment of sheep for ectoparasites. There was an increase in symptom reporting immediately following treatment and this was associated with the type of product used, with the frequency of symptom reporting being higher in farmers who used pyrethroids or OPs, in comparison with farmers who used triazines in particular. Symptom reporting in a multivariate model was also associated with health status before treatment and previous experience of dipper’s flu, but not perceived risk of sheep dip: holding a certificate of competence for handling pesticides and age were associated with reduced risk. However, there was significant exposure misclassification, and repeat analysis using more objective measures of exposure (urinary pesticide metabolites) did not reveal any associations between urinary metabolites and symptom reporting. Furthermore there were no detectable associations between symptom reporting, changes in plasma butyrylcholinesterase activity and urinary pesticide metabolite levels. These forms of biological monitoring are prone to measurement error, but may be more reliable (repeatable) and valid (accurate) than self-reported exposures and also symptom complex reporting. These results suggest that exposure to pesticides per se are not the cause of symptom-reporting in this current study. Other exposure cannot be fully ruled our as it is clearly possible that farmers might be exposed to endotoxin (at least during sheep dipping). However, exposure to infectious agents is unlikely to be a major cause of ill-health during treatment. Hence symptom reporting increases during sheep treatment for as yet unknown reasons but it is unlikely to be the result of the exposures examined in this study. Further planned analysis of this data set includes an examination of the relationship between symptoms and historical dip exposures. Work is planned to characterise the nature of the ill-health identified during sheep treatment by either examining specific case definitions identified a priori or by carrying out a factor analysis to identify specific combinations of symptoms that may or may not be associated with exposures. Furthermore a time series analysis is planned to define better the associations between exposures and ill-health.
119

120

Appendix 1 Invite Letter
«title» «firstinitial» «surname»«address1»«town»«county»«postcode»Study Number: «idno»
Dear «title» «surname»
Health and Sheep Dipping Survey
It has been suggested that many sheep farmers suffer from ill health as a result of the work they do and that this ill health may be unrecognised by doctors. To better understand how sheep farming may affect the health of a farmer, we are organising a new survey in which we are trying to get as many as 1000 sheep farmers to take part.
Would you be interested in taking part in such a survey? You might think that such a survey is not needed but we believe that the experiences of sheep farmers have not yet been fully reported. By taking part in this study, you would help to provide a truer picture of the health of sheep farmers.
You may also think that the survey would be a waste of your time. Your involvement will require time and effort on your part. As recognition of this a payment of up to £100 will be given to you at the end of your contribution to the survey. We will also try to minimise the time you would need to fill in forms by having our staff nurse come and interview you.
The survey is described in greater detail on the information sheet provided. If you require any further details of this survey please contact the team on the free helpline 0800 195 1667 (open Monday to Friday 8am to 4.00pm). If you are willing to take part (or do not want us to contact you again), please complete the accompanying one page questionnaire and consent form and return it to the University of Manchester in the pre-paid envelope provided.
We hope that you are willing to participate and we appreciate your co-operation.
Yours sincerely
Dr Andrew Povey Dr H G Rees Dr John Thomson Dr Lakshman Karalliedde
121

Appendix 2 Information Sheet
INFORMATION SHEET FOR PARTICIPANTS OF THE HEALTH AND SHEEP DIPPING SURVEY
We are writing to ask if you would be willing to take part in a national study investigating the frequency, nature and causes of ill health in farmers and farm workers soon after the treatment of external parasites in sheep by dipping and similar treatments. In the past this has been known as Dipper’s flu but we don’t know whether such problems occur when other methods of external parasite control are used.
This information sheet explains the project and how you would be involved if you decided to take part. It is important that you understand why this study is being carried out. Please read this information sheet carefully and discuss it with your family, friends, or anyone else you like. Please ask one of the staff [their names appear at the end of the sheet] involved in the study if you would like some more information. Take time to decide whether you would like to be involved in this study or not. Thank you for reading this.
What is the study about? The aim of the study is to describe the nature of ill health after dipping and similar treatments, and to investigate its causes.
Why have I been chosen? Your name has been randomly selected from farmers living in your region. We intend to recruit around 1000 sheep farmers from England and Wales.
Do I have to take part? It is entirely up to you whether you wish to participate in the study. Even if you agree to help, you can withdraw at any time without giving any reason. Taking part in the study will have no direct benefit to you personally, but it will allow us to try to establish if there is a link between any activity or exposure during external parasite treatment and ill-health. To do this, it is equally important that we recruit farmers who have not experienced health problems following such parasite treatment, as it is to recruit those who have. Also it is important that we recruit farmers who use pour-ons or other treatments as well as those who plunge dip.
What will happen to me if I agree to take part? If you agree to take part in the study, we will send you a short questionnaire asking about your general health, your work history and lifestyle factors such as smoking. An experienced nurse will then visit you to review this questionnaire and, if required, ask further questions. We will ask you to complete a short questionnaire about your current health and a blood and urine sample will be taken. During external parasite treatment you will be asked to complete a short symptom list and take your temperature (with a thermometer we provide) over a week. The nurse will also contact you during this time to ask about your health. He / she may then visit you on two more occasions to ask about health, the methods of parasite control that you have used, and to collect further blood and urine samples. Each visit will take approximately 40 minutes.
122

What will happen to my answers? Everything you tell us will be confidential, and will be analysed anonymously as part of the study. The results of the study will be published in medical journals. A summary of these results will be sent to you, and if you wish, a copy of the full results. You will not be identified in any report or publication.
What will happen to my blood and urine samples? Your blood and urine samples will be sent to different laboratories to measure chemicals that indicate exposure to external sheep parasite treatments and other agents, and to examine the effects, if any, of such agents. In addition, tests will be conducted to measure the level of certain cells and compounds that are found in the blood. Each of these measurements has a normal range of values that are based on the average values in a healthy population. If any of your tests has a measurement that is higher or lower than these values, we will inform you.
Who do I contact for information or advice? If you have any questions about the study, you can telephone the free helpline on 0800 195 1667 or contact the members of the study group whose names appear at the bottom of this letter.
What are the advantages and disadvantages of taking part in the study? The advantage of taking part in the study is that you would be helping the medical profession and the public to understand any association between the external sheep parasite treatment and acute ill health effects. This may lead to better ways of preventing ill-health. The disadvantages are that you may feel the study takes up your time, and that blood samples will be collected. As a recognition of this, a payment of up to £100 will be given to you at the end of your contribution to the study.
Who is funding the study? The study is being carried out by three professional teams at the University of Manchester, Cardiff University and Guys & St Thomas’ Hospitals, London. It is being funded by the Health and Safety Executive, and has been approved by the South East Research Ethics Committee.
Thank you for considering participation in this study.
Dr Andy Povey Lead Investigator Phone: 0161 275 5232 Email: [email protected]
Gill Watkins Research Co-ordinator Phone: 0161 275 5954 Email: [email protected]
Research Nurses Sarah Lee (North West) Phone: 0161 2755169 Caroline Wilson (Wales / Cymru) Phone: 0800 195 1667 /
Consumers for Ethics in Research (CERES) publish a leaflet entitled ‘Medical Research and you’. This leaflet gives more information about medical research and looks at some questions that you may want to ask. A copy may be obtained from CERES, PO Box 1365, London N16 0BW.
123

Appendix 3 Consent Form
CONSENT FORM
Health and Sheep Dipping Survey
Study No.
I (please print name)
confirm that: Yes No
(please tick boxes)
I have read the Information Sheet on this project (dated Feb 05) and have been given a copy to keep. I understand why the research is being done and any risks involved.
I understand that if I do not want to take part in the study, I can withdraw my consent at any stage without giving a reason.
I agree to give samples of blood and urine for research in this project.I understand how the samples will be collected, that giving a sample for this research is voluntary and I understand that if I do not want to take part in thestudy,I can withdraw my consent at any stage without giving a reason.
I understand that I will be informed if any of the results of the medicalas part of the research are important for my health.
I agree to take part in the study
Signature
Date
tests done
124

_______________________________________________________________
___________________________________________________________________
Appendix 4 Screening Questionnaire
Study Number:
Health and Sheep Dipping Survey
If you decide to take part in this study, please complete this short questionnaire and return it to us in the envelope provided together with your consent form.
Title (e.g. Mr/Mrs/Ms) ____________
First name ____________________ Surname ______________________________
Address
Tel. No. (Home) _________________________ (Mobile) ___________________
Date of birth (dd/mm/yyyy) __________________________
Are you: Male � Female �
How are you planning to treat external sheep parasites in your flock (please tick eachmethod used)?
(a) Plunge dips / Shower � (b) Injectables � (c) Pour-on’s � (d) Not planning to dip / inject etc. �
Which months are you planning to treat external parasites (approx)? _____________
Which is/are your main month(s) of parasite treatment? ___________________
Please return to: The Health and Sheep Dipping Survey, Centre for Occupational and Environmental Health, 4th Floor Humanities Building, University of Manchester, Devas Street, Manchester M13 9PL.
Thank you for completing this form.
125

Appendix 5 Reminder Postcard
Dear «title» «surname»
We recently sent you a letter asking whether you would be interested in taking part in a new Health and Sheep Dipping Survey. We have not yet received a reply from you and we are writing again to encourage you to take part in the study. We believe the study will help determine the extent of ill health amongst sheep farmers immediately after treating sheep and what might be the possible causes. If you would like some further information on the study, or would like the material sent to you again, please contact the study team on freephone 0800 195 1667.
If you do (or do not) wish to take part, please could you detach and return the freepost postcard with the appropriate box ticked. Your unique study number is on the top of the return postcard, so there is no need to fill out any other details.
If you would like to take part in the study, the study team will contact you again shortly. Please reply even if you decide not to take part, as this will ensure that
we will not contact you again.
We hope that you are willing to participate and we appreciate your co-operation.
Yours sincerely
Pl i ii l i
i
� ld li iill i l
� il
i
il i
� �
Study number:
ease t ck the appropr ate box, detach th s ha f of the postcard, and return t to us (Freepost; no stamp requ red).
I wou ke to take part n the study (you w be contacted aga n short y).
I do not want to take part n the study (p ease do not contact me aga n).
Thank you for taking the t me to comp ete th s postcard.
Health and Sheep Dipping Survey Freepost NAT19096 Manchester M13 1YW
126

Appendix 6 Non-Responders Telephone Call (Pre-amble)
Non-responders Telephone Call
Study No:
Name of person in record:
Date when initial letter sent:
“Hello could I speak to………(name of person in record)”
If get the correct person Go to Statement 1
If the person is deceased Go to Statement 2
If the person has moved away Go to Statement 3
Statement 1:
“My name is………, and I am ringing from the Centre for Occupational and Environmental Health at the University of Manchester. “We recently sent you a letter to you asking whether you would like to participate in the Health and Sheep Dipping Survey, but I notice that we have not yet received a reply from you. This study is trying to recruit farmers from across the UK so as to investigate the nature of ill health in farmers soon after the treatment of external parasites in sheep by dipping and similar treatments. We have had a large number of replies already but it is important that we get as many farmers as we can to take part in the study so that our results accurately reflect the health problems that all sheep farmers may face.
“Would you be willing to take part in the study?”
Reply You say…
Yes Can you please fill in the form and send it back to us in the pre-post envelope already provided.
Lost original letter
I can send you a copy of the original letter, or if you prefer you could answer the questionnaire now?
No/Too busy to take part
Would you be willing to answer some questions on the phone now, or at a more convenient time
Statement 2: “I’m very sorry to have bothered you. I’ll make sure we amend our database so we won’t contact you again.” Statement 3:
“I’m sorry, I didn’t realise they had moved. Do you have their new contact details?”
127

Appendix 7 Non-Responder Telephone Questionnaire
Non-responder Telephone Questionnaire
Study No:
Date:
1. What is your Date of birth? ………………………….
2. At what age did you start working on a farm? ……………years old
3. Are you currently working?
� Yes (� Tick if semi-retired)
� No (i) Are you not working because you have retired? � Yes � No
OR
(ii) Is it because of ill health or disability? � Yes � No
4. Have you treated for external sheep parasites in your flock this year?
� Yes (i) What method did you use?
� Dipping � Injectables � Pour-on’s � Showers
(ii) What product did you use? (Trade name) ………………….
� No (i) When are you planning to treat your sheep this year? ……….
(ii) What method will you use?
� Dipping � Injectables � Pour-on’s � Showers
5. Have you ever handled or worked with the concentrate for the treatment of
any external sheep parasites?
� Yes � No
128

6. Have you ever had any illnesses after treating sheep for external parasites?
� Yes What symptoms did you have? …………………………………
� No
7. Have you ever suffered from dippers flu?
� Yes � No
8. I would just like to finish with some questions about organophosphorous
sheep dips. I am asking these questions, as I would like to find out the attitudes
of sheep farmers to the use of these chemicals. Some farmers think they are
safe to use; others think they can cause ill health but we know little about the
attitudes of most farmers. Can you consider the following statements, and
indicate whether you agree, or you are not sure, or you disagree with it?
Statement Do you agree?
1. Sheep dip can’t be that bad for humans, because it doesn’t affect the sheep very much
2. I have never met anyone who has been affected by sheep dip
3. I think sheep dip is unlikely to affect my health in the future
4. Using sheep dip makes a lot of farmers feel ill
5. I am very worried about using sheep dip
6. Sheep dip in its diluted form is not particularly dangerous
7. I think there is too much fuss about the health effects of sheep dip
8. Using sheep dip does not bother me
9. Using sheep dip is very bad for your health
10. You get used to sheep dip, so it doesn’t affect you
11. A few farmers get affected by sheep dip, but most are OK
12. I worry about my health when using sheep dip.
Are you not
sure?
Do you disagree
Those are all the questions that I wanted to ask you. Thank you very much for taking the time to answer them.
129

Appendix 8 Nurse Visit 1 Confirmation Letter
«title» «firstinitial» «surname»«address1»«address2»«address3»«town»«county»«postcode»Study Number: «idno»
Dear «title» «surname»
Re: Health and Sheep Dipping Survey
Thank you for agreeing to take part in our Health and Sheep Dipping Survey. This letter is to confirm that I will visit you on at .
I have enclosed a questionnaire with this letter, which I would be grateful if you could complete, preferably before I visit you, as this will reduce the length of time the interview will take. However, if you prefer, or if you have any difficulties, please do not worry as I can help you to complete it at the interview. I would also be grateful if you could you also have any medications that you are currently taking available for me to look at.
One aspect of the study involves looking at the genetic background of participants to help us determine whether people with particular genes are more sensitive to sheep dip than those without these genes. I have therefore enclosed an information sheet which contains further details of this part of the study, together with a consent form which, when signed, will allow us to test your blood samples for this purpose. Please take your time to read the information sheet, and do not hesitate to contact me if you have any questions or require any further information. I will collect the consent form when I visit you.
Thank you for your help and co-operation.
Yours sincerely
Research Nurse
130

Appendix 9 General Questionnaire
Date questionnaire completed ID label
GENERAL QUESTIONNAIRE
This questionnaire asks about your past medical history, lifestyle factors and occupational history. We need to know these details for everyone taking part in the Health and Sheep Dipping Study to see if any of these factors make some people more likely to get ill than others.
Please complete the following form and give it to the research nurse at the interview.
131

132
1. Would you describe your general health as: Very good � Good � Average � Poor � Very poor � Don’t know � 2. Do you suffer from, or have you ever suffered from any of the following illnesses?
Yes No Don’t know Condition
(Please tick relevant box)
A) Bone or joint disorders e.g. osteoarthritis, arthritis, rheumatism, rheumatoid arthritis, osteoporosis, back problems
B ) Bladder or kidney disorders e.g. frequent infections, blood in urine, renal failure
C) Skin disorders e.g. eczema, psoriasis, rashes
D) Blood disorders e.g. anaemia
E) Gland disorders e.g. diabetes, thyroid disease
F) Nervous system disorders e.g. multiple sclerosis, epilepsy, chronic fatigue syndrome (M.E.), depression, anxiety, schizophrenia
G) Intestinal disorders e.g. ulcers, Crohn’s / colitis, jaundice, diverticulosis
H) Serious infectious illnesses e.g. TB, rheumatic fever, hepatitis, jaundice
I) Allergies e.g. Hay fever, food, dustmite
J) Dippers flu
K) Infectious illnesses through working with animals e.g. leptospirosis
L) Heart or circulation problems e.g. high blood pressure, angina, stroke, thrombosis, chest
pain
M) Respiratory problems e.g. chest infections, sinusitis, tonsillitis, asthma, farmers’ lung,flu, pneumonia, bronchitis, emphysema
MEDICAL HISTORY

MEDICAL HISTORY continued
3. Have you had any of the following vaccinations within the past year? (a) Flu Yes � No � Don’t know � (b) Pneumococcal Yes � No � Don’t know �
4. Are you currently taking any medication?
Yes � No � Don’t know �
If the answer is YES, the nurse will ask you some more questions when (s)he visits you.
5. Have you ever had any surgical operations or procedures?
Yes � No � Don’t know �
If the answer is YES, the nurse will ask you some more questions when (s)he visits you.
ALCOHOL CONSUMPTION
6a. Do you currently drink alcohol?
Yes � (go to question 6b)
No � (go to question 7a)
6b. Please put a tick in the appropriate frequency column, and write down quantity (e.g. number of pints or glasses) drunk on each occasion. Please do not write in the shaded boxes.
Type of drink
Frequency Total Quantity per week
Most days
3-4 times per week
1-2 times per week
Less than once per week
Never Pints Glasses
Beer, lager, stout or shandy
Wine
Sherry, Martini, fortified wines Spirits or Liqueurs
133

TOBACCO USE
7a. Do you currently smoke? (e.g. at least 1 cigarette per week)
Yes � (go to question 7b)
No � (go to question 7e)
7b. Do you smoke: Cigarettes � Cigars � A pipe �
7c. When did you start smoking? Age OR Year
7d. On average, how many cigarettes/cigars or oz/grams of pipe tobacco, do you smoke per day?
7e. Have you ever smoked? (e.g. at least 1 cigarette per week)
Yes � (go to question 7f)
No � (go to question 8)
7f. Did you smoke: Cigarettes � Cigars � A pipe �
7g. Please complete the following table for each time you have smoked:
/ i
1
2
3
4
Age OR year started smoking
Age OR year stopped smoking
Average number of cigarettes/cigars or oz grams of p pe tobacco smoked per day
134

CAFFEINE INTAKE
8a. Do you currently drink tea or coffee?
Yes � (go to question 8b)
No � (go to question 9a)
8b. How many cups per day do you drink?
9a. Do you currently drink any other drinks containing caffeine, e.g. cola, red bull?
Yes � (go to question 9b)
No � (go to Occupational History section)
9b. How many cups / cans per day do you drink?
OCCUPATIONAL HISTORY
The following question is about your working history as a farmer since 1950. On the next two pages, all you have to do is to put a tick or a line in
the relevant boxes, as in the following example:
Year Sheep Cattle Other Other work livestock Please specify Please specify
1980 � 1981 EXAMPLE 1982 1983 � Driver 1984 � Driver 1985 Retired
Please include any time spent helping out as a child.By ‘Other work’ we mean any work outside the farm either on a casual, part-time or full-time basis.In this example, this farmer started working in 1980, was a sheep farmer from1980 to 1984 but also kept cattle in 1980, and was a driver, part-time,between1983 and 1984. This person retired in 1985.If you started working between 1950 – 1980, please start at question 10.1 onpage 6, and continue to question 10.2 on page 7. If you have started workingsince1981, start at question 10.2 on page 7.
135

1
2
3
4
5
6
7
8
9
10a. Work history from 1950 to 1980
Year Sheep Cattle Other livestock Other work (Please specify) (Please specify)
1950
1951
1952
1953
1954
1955
1956
1957
1958
1959
1960
1961
1962
1963
1964
1965
1966
1967
1968
1969
1970
197
197
197
197
197
197
19 7
197
197
136

le lil l
Year Sheep Catt Other vestock (P ease specify)
Other work (P ease specify)
1980
10b. Work history from 1981 to present date
Year
1981
1982
1983
1984
1985
1986
1987
1988
1989
1990
1991
1992
1993
1994
1995
1996
1997
1998
1999
2000
2001
2002
2003
2004
Sheep Cattle Other livestock (Please specify)
Other work (Please specify)
137

138
Please fill in as much detail as you can remember about your parasite control activities for the following years.
What method did you use? (please tick relevant columns)
Did you use gloves? (please tick)
Did you use other protective clothing?
(please tick)
Did you have any illnesses after using
pesticides (please tick) Year
Size of flock
(approx.)
Number of pesticide
treatments per year
Dips Showers Injectables Pour-on’s No Yes Don’t Know No Yes Don’t
Know No Yes Don’t Know
1950s
1960s
1970s
1980s
1990s
2000
2001
2002
2003
2004
Thank you for completing this questionnaire
PREVIOUS EXPOSURE TO PESTICIDES

Appendix 10 Health Questionnaire (Visit 1)
ID label Date questionnaire completed
HEALTH QUESTIONNAIRE - VISIT 1
This questionnaire asks about your health IN THE LAST 4 WEEKS. We need to find out the pattern of health of everyone taking part in Dippers Flu Study to see which symptoms are part of the general wear and tear of farming life and which may be due to sheep dips. Please fill the questionnaire in carefully, following the example below. Place a tick in the relevant box for each question. Please don’t miss any questions out.
Example
In the last 4 weeks, have you been troubled by the following?
Loss of appetite Gain in weight x
x
In this example the person has been troubled by loss of appetite, but as you might expect, not at all by gain in weight.
139

1. In the last 4 weeks, have you been troubled by the following?
Never Some of the time
Most of the time
All of the time
1 Fever 2 Paleness of the skin 3 Trouble sleeping 4 Sore throat 5 Pins and needles 6 Mouth ulcers 7 Forgetting things 8 Feeling down or depressed 9 Blurred vision 10 Coughing 11 Diarrhoea 12 Earache 13 Bothered by the smell of perfume
or aftershave 14 Ankle swelling 15 Shivering 16 Headache 17 Muscle twitching 18 Sweating (without physical
exercise) 19 Stiffness in the joints 20 Ringing or buzzing in the ears 21 Feeling hot or cold 22 Waking up feeling tired and worn
out 23 Stomach pain 24 Reddening of the face or neck
(flushing) 25 Problems seeing 26 Sleep walking 27 Nausea – feeling sick 28 Sore hands 29 General aches and pains 30 Light headedness 31 Runny nose 32 Difficulty getting an erection 33 Coughing up phlegm 34 Numbness of toes 35 Heartburn 36 Pain in your muscles 37 Hallucinating 38 Peeling or flaky skin 39 Upset stomach 40 Tingling of toes 41 Losing track of time 42 Nosebleeds 43 Weeping for no apparent reason
140

Never Some of the time
Most of the time
All of the time
44 Feeling dizzy 45 Tiredness 46 Dry mouth 47 Problems with judging distance 48 Skin eruptions 49 Coughing up blood 50 Experiencing difficulty speaking 51 Generally feeling unwell 52 Vomiting – being sick 53 Feeling of weakness in muscles 54 Loss of sexual appetite 55 Pain in your joints 56 Difficulty breathing 57 Shakiness 58 Losing the thread of your
thoughts 59 Feeling lethargic, or slowed down
generally 60 Feeling of weakness 61 Increased sensitivity for smell of
sheep dip chemicals 62 Stomach cramps 63 Feeling aggressive 64 Sore feet 65 Tight feeling in the upper part of
the stomach 66 Increased saliva in the mouth 67 Stuffy or blocked nose 68 Experiencing difficulty reading 69 Bluish discolouration of parts of
the skin 70 Inability to control bowel
movements 71 Itching or skin rashes 72 Feeling irritated for no particular
reason 73 Cramps other than in the
stomach 74 Sneezing 75 Slowing down of heart beat 76 Eye irritation – redness, watering,
burning 77 Chest pain 78 Sleeping a lot 79 Hoarse voice 80 Loss of appetite 81 Stiffness in the muscles 82 Speeding up of heart beats 83 Wheezing chest
END OF QUESTIONNAIRE – THANK YOU
141

Appendix 11 Nurse Research Form Visit 1
i i
l l
iTi i iDate of nterv ew
ID abe
Interv ewer me of nterv ew
NURSES RESEARCH FORM - VISIT 1
Instructions – please read carefully
• Part I refers to the questions on the General Questionnaire. You should check through the General Questionnaire whilst completing this part of the Nurses Research Form. Depending upon how the participant has answered the General questions, you may need to ask them some of the additional questions on this questionnaire. Please initial any additions you make to the General Questionnaire.
• Ask the participant to answer any questions that have been missed in the General Questionnaire. If they decline to answer or do not know the answer, document this and initial it.
• The questions on Part II do not appear on the General Questionnaire, and should therefore be administered to all participants.
• Please follow all instructions in the questionnaire carefully.
142

•
Medical History
PART I
1. Tick only when you have checked that the question has been answered (or edited by yourself) �
2. If YES has been ticked for any condition, please record the details FOR EACH CONDITION in the following table:
Conditio n No.
Name of illness What treatment did you receive for this illness
At what age or which year did you first suffer from this illness
Do you still suffer from this illness? Yes/No/Don’t know
If NO, when did you stop suffering from this illness?
Care *
Previous Current
* For ‘Care’, please enter: 0 = None; 1 = Hospital inpatient; 2 = Hospital outpatient / day case; 3 = GP; 4 = Other (specify); 5 = Don’t know;
Please also ask:
143

Have you been ill in the last 14 days? Yes � No � Don’t know �
If YES, describe the illness / symptoms 3. Tick only when you have checked that the question has been answered (or edited by yourself) �
4. If YES has been ticked, please record the details OF EACH MEDICATION being taken in the following table.
Name of medicine Reason for taking medicine Dose Frequency Date started Length of time taken
144

5. If YES has been ticked, please record the details FOR EACH PROCEDURE in the following table.
Name of operation Reason for operation Age or year of operation
Care*
* For ‘Care’, please enter: 1 = Hospital inpatient; 2 = Hospital day case; 3 = GP; 4 = Other; 5 = Don’t know
145

Alcohol Consumption
6a. Tick only when you have checked that the question has been answered (or edited) �
If YES has been ticked Check that the frequency and quantity of alcohol drunk per week has been entered. Tick when completed �.
Now go to question 7a.
If NO has been ticked Go to question 7a.
Tobacco Use
7a. Tick only when you have checked that the question has been answered (or edited) �
If YES has been ticked Please tick when you have checked that the following questions have been answered: 7b � 7c � 7d �
Now go to question 8a.
If NO has been ticked Go to question 7e
7e. To be completed for all those who answered NO to question 7a. Tick only when you have checked that the question has been answered (or edited) �
If YES has been ticked Please tick when you have checked that the following questions have been answered: 7f � 7g � Please clarify whether the figures entered
for started / stopped smoking refers to AGE or YEAR.
Now go to question 8a.
If NO has been ticked Go to question 8a
146

Caffeine Intake
8a. Tick only when you have checked that the question has been answered (or edited) �
If YES has been ticked Please tick when you have checked that the followingquestions have been answered:8b �
Now go to question 9a.
If NO has been ticked Go to question 9a
9a. Tick only when you have checked that the question has been answered (or edited) �
If YES has been ticked Please tick when you have checked that the followingquestions have been answered:9b �
Now go to Occupational History
If NO has been ticked Go to Occupational History
Occupational History
10a/b. Check that the record is continuous. Ask about gaps and write in the activity, e.g. travelling, student, unemployed, prison etc. �
If “Other livestock” or “Other work” has been ticked but not specified, ask for details. If these have not been ticked, confirm with the participant that they have not worked with other livestock or been employed in other work rather than farming. �
If more than one other livestock/work has been specified, please ensure that it is clear which years refer to which livestock/work. �
147

148
This section refers to the table in the Previous Exposure To Pesticides section of the General Questionnaire. Please check that the following information has been entered for each year that the farmer has indicated he had sheep on the General Questionnaire. If information is missing, ask the farmer and enter it yourself onto the General Questionnaire, ensuring you initial all edits. 11a. Tick only when information in the column “Size of flock” has been entered/edited clearly and
correctly � 11b. Tick only when information in the column “Number of pesticide treatments per year” has
been entered/edited clearly and correctly � 11c. Tick only when information in the column “Which method did you use” has been
entered/edited clearly and correctly �
Then ask the brand names of pesticides used in each appropriate decade/year and enter them in the following table. If the name of the pesticide is not known, ask:
Can you remember which chemicals were in the pesticide that you used:
1 = Organophosphates (OPs) 2 = Pyrethroids 3 = Phenols (e.g. PURL) 4 = Other
5 = Don’t know
What method did you use?
Dips / showers Injectables Pour-on’s Year Brand name
Chemical Brand name
Chemical Brand name
Chemical
1950s
1960s
1970s
1980s
1990s
1990s
2000
2001
2002
2003
2004
Tick when information has been entered into the table above for ALL relevant years �
Previous Exposure To Pesticides

149
11d. Tick only when information in the column “Did you use gloves” has been entered/edited clearly and correctly �
11e. Tick only when information in the column “Did you use other protective clothing” has been entered/edited clearly and correctly �
If YES has been ticked for any year in this column, please tick the appropriate box(es) in the table below for each relevant year:
Year
Waterproof leggings / waders /
overtrousers
Wellington boots
Bib / apron
Waterproof coat
Goggles Plastic
face shield Other
(specify)
1950s
1960s
1970s
1980s
1990s
1900s
2000
2001
2002
2003
2004

150
Tick when information has been entered into the table above for ALL relevant years �
11f. Tick only when information in the column “Did you have any illnesses after using pesticides” has been entered/edited clearly and correctly �
If YES has been ticked for any year in this column, please enter the information requested in the table below for each relevant year:
What year, or how old were
you, when you became ill?
In your own words, can you describe the symptoms
How soon after dipping
did the symptoms
start?
Had you been handling concentrate
on the day (or day before)?
Yes / No
Did you have a fever at this time? Yes / No
If yes to fever, was this
measured by a
thermometer? Yes / No
Did you see your GP with this illness?
Yes / No
Tick when information has been entered into the table above for ALL relevant years � If the participant has ticked any of the DON’T KNOW boxes to this question, ask: 11g. Have you answered “don’t know” because you can’t remember if you were ill? � Yes � No � Don’t know

PART II
This part of the questionnaire does not refer to the General Questionnaire, and all questions should be administered to all study participants.
Previous Exposure To Pesticides Part II
12. When did you first treat sheep for parasites? Age _______ or Year ____________
13. Has there been a time when you have not treated sheep for parasites? (please tick)
Yes � Complete table for question 13b
No � Go to question 14
Don’t know � Go to question 14
13b. If YES, please tell me the years you did not treat sheep for parasites and the reasons why
14.
Year stopped Year re-started Reason
The next set of questions refers specifically to the method used to treat sheep for parasites.
Please ensure that the details of each method for each year used are entered into the appropriate table. Refer to the General Questionnaire to check the years each method was used. If the participant has used dipping baths, complete question 14a If the participant has used showers, complete question 14b If the participant has used pour-on’s or injectables, complete question 14c
PLEASE GO THE NEXT PAGE
151

152
14a. Ask the participant the following questions for each year they have been using dipping baths to treat sheep parasites (if applicable). Please only use the codes/answers specified for each question.
Questions 1950s 1960s 1970s 1980s 1990s 1990s 2000 2001 2002 2003 2004 1 Where were the dipping bath(s) located?
1=outside 2=within a building 3=within a mobile trailer 4=covered area (roofed but open sides) 5=other (specify)
2 Were you ever the person who poured the concentrate or added it to the bath? Yes / No / Don’t know
3 Did you ever spill concentrate on yourself? Yes / No / Don’t know
4 Did you ever enter the dipping bath, either accidentally or purposely e.g. to rescue a sheep? Yes / No / Don’t know
5 What tasks did you perform? 1 = Plunger/dipper/paddler 2 = Chucker 3 = Helper 4 = Other (specify)
5b If >1 task performed, which task was performed most? See above for code
6 Did you have to man-handle the sheep immediately after dipping, i.e. before the dip had dried off? 1=Yes, usually 2=Yes, sometimes 3=No, never

14b. Ask the participant the following questions for each year they have been using showers to treat sheep parasites (if applicable). Please only use the codes/answers specified for each question.
Questions 1950s 1960s 1970s 1980s 1990s 1990s 2000 2001 2002 2003 2004 1
2
3
4
4b
5
Where was the shower located? 1=outside 2=within a building 3=within a mobile trailer 4=covered area (roofed but open sides) 5=other (specify) Were you ever the person who poured the concentrate or added it to the shower? Yes / No / Don’t know Did you ever spill concentrate on yourself? Yes / No / Don’t know What tasks did you perform? 1 = putting sheep in shower 2 = Other (specify)
If >1 task performed, which task was performed most? See above for code
Did you have to man-handle the sheep immediately after treatment? 1=Yes, usually 2=Yes, sometimes 3=No, never
153

14c. Ask the participant the following questions for each year they have been using injectables or pour-on’s to treat sheep parasites (if applicable). Please only use the codes/answers specified for each question.
Questions 1950s 1960s 1970s 1980s 1990s 1990s 2000 2001 2002 2003 2004 1
2
3
Were you ever the person who injected or poured the concentrate? Yes / No / Don’t know Did you ever spill concentrate on yourself? Yes / No / Don’t know
Did you have to man-handle the sheep immediately after treatment? 1=Yes, usually 2=Yes, sometimes 3=No, never
154

Current Working Issues
15. Do you currently hold a certificate of competence for handling pesticides?
Yes � Year obtained Go to question 16
No � Go to question 16
Don’t know � Go to question 16
16. Are you a contract dipper?
Yes � No � Don’t know �
17. What breed(s) of sheep do you have?
18. When were your sheep last clipped?
19. Did you clip the sheep? Yes � No �
CONTINUED ON NEXT PAGE
155

156
I’m now going to ask you about organophosphorus (OP) based sheep dips. Please consider the following statements, and tell me whether you agree or disagree with the statement, or if you are not sure.
Statement Agree Not sure Disagree
1. Sheep dip can’t be that bad for humans, because it doesn’t affect the sheep very much
2. I have never met anyone who has been affected by sheep dip
3. I think sheep dip is unlikely to affect my health in the future
4. Using sheep dip makes a lot of farmers feel ill
5. I am very worried about using sheep dip
6. Sheep dip in its diluted form is not particularly dangerous
7. I think there is too much fuss about the health effects of sheep dip
8. Using sheep dip does not bother me
9. Using sheep dip is very bad for your health
10. You get used to sheep dip, so it doesn’t affect you
11. A few farmers get affected by sheep dip, but most are OK
12. I worry about my health when using sheep dip
END OF QUESTIONNAIRE
Organophosphorus-based Sheep Dips

Appendix 12 Genetics Information Sheet
INFORMATION SHEET FOR PARTICIPANTS OF HEALTH AND SHEEP DIPPING SURVEY
This information sheet explains one particular aspect of the project and how you would be involved if you decided to take part. It is important you understand why the research is being carried out. Please read this information sheet carefully and discuss it with your family, friends, or anyone else you like. Please ask one of the researchers [their names appear at the end of the sheet] involved in the study if you would like some more information. Take time to decide whether you would like to be involved in the project or not. Thank you for reading this.
What is this study about? Although many people dip sheep, it appears that only a few farmers complain of ill-health immediately after dipping. Whilst this may be due to many factors, it is possible that one reason is that certain farmers may be more (or less) susceptible as a result of their own genetic background. The results of this study may help to determine if people with particular genes are more sensitive to sheep dip.
Why have I been chosen? We are asking every farmer who is participating in the main study whether they would also take part in this aspect of the study.
Do I have to take part? It is entirely up to you whether you wish to participate in this aspect of the study. Even if you agree to help, you can withdraw at any time without giving any reason. Taking part in this aspect of the study will have no direct benefit to you personally, but it will be very important in helping us to establish if there is a link between any factor and susceptibility to dipper’s flu.
What will happen to me if I agree to take part? If you agree to take part in this aspect of the study, we will take an extra blood sample.
What will happen to my blood sample? Your blood sample will be sent to a laboratory where it will be stored until it is analysed for certain genetic factors that may help to determine whether you become ill after being exposed.
Will I be given the results of the genetic tests? You would not be given your own individual genetic test results. It will not be possible to determine from these results whether you have (or have not) become ill as a result of sheep dipping. As this testing is part of a research study, you need not declare that you have undergone a genetic test to your insurers.
157

Who do I contact for information or advice? If you have any questions about the study, you can contact the researchers whose names appear at the bottom of this letter, either by telephoning the free helpline on 0800 195 1667 or by e-mail.
What are the advantages and disadvantages of taking part in the study? The advantage of taking part in the study is that you would be helping the research team to understand any association between any sheep dipping and dippers flu. This may lead to better ways of preventing ill-health. The disadvantage is that an extra blood sample will be taken.
Who is funding the study? The study is being carried out by three research teams at the University of Manchester, the University of Wales College of Medicine and Guys & St Thomas’ Hospitals, London. It is being funded by the Health and Safety Executive.
Thank you for considering participation in this study.
Dr Andy Povey Gillian Watkins Lead investigator Research co-ordinator Phone: 0161 275 Phone: 0161 275 5954 5232 Email: [email protected] Email: [email protected]
Centre for Occupational and Environmental Health,4th Floor Humanities BuildingUniversity of Manchester,Oxford Road, ManchesterM13 9PL
Consumers for Ethics in Research (CERES) publish a leaflet entitled ‘Medical Research and you’. This leaflet gives more information about medical research and looks at some questions that you may want to ask. A copy may be obtained from CERES, PO Box 1365, London N16 0BW.
158

d
e
Appendix 13 Genetics Consent Form
CONSENT FORM
Health and Sheep Dipping Survey
Study No:
I (please print name)
confirm that: Yes No
(please tick boxes)
I agree to give samples of blood and urine for research in this project. I understand how the samples will be collected and that giving a samplthis research is voluntary.
ect (dated Feb 05) and have ng done an
e for
I understand that if I do not want to take part in the study, I can withdraw my consent at any stage without giving a reason.
I understand that future research using the sample I have given may includ Genetic research that would examine genetic influences on ill-health induced by sheep dipping but that the results of these investigations are unlikely to have any implications for me personally.
Signature -------------------------------------------------------------------------
Date ------------------------------------------------------------------------
I have read the Information Sheet on this projbeen given a copy to keep. I understand why the research any risks involved.
is bei
159

Appendix 14 Instructions for Participants
Health and Sheep Dipping Survey
Instructions for study participants
The following instructions are to help you to complete all the tasks relevant to the Health and Sheep Dipping Survey. If you have any questions please do not hesitate to contact the
research team on this freephone number 0800 195 1667. Thank you for your co-operation.
Please would you contact the research team in advance to inform us when you are planning to dip.
On the first day of dipping:
• Complete the symptom diary and check your temperature in the morning and the
evening. If your temperature reading is below 35.5º C it may indicate that the
thermometer is not functioning properly. If this is the case please contact the
research team. Please continue to check your temperature for the next six days.
On the last day of dipping:
• Provide a urine sample in the evening of the dipping session
160

Appendix 15 Symptom Diary
ID label
SYMPTOM DIARY
Thank you for agreeing to take part in the Dipper’s Flu study. This diary enables you to record your temperature and any symptoms you may experience starting on the day you start dipping, and continuing for a further 6 days. You should take your temperature in the morning before you have a drink, and in the evening before you go to bed. You are given an example of how you should complete the dairy on page 2, and you should record your information in the table on page 3. Please complete the diary on a daily basis. If you have any questions or queries, please call the freephone helpline on 0800 195 1667.
We would also be grateful if you could complete the table on page 4 so we can collect some further information about the length of time you spent dipping and your role in the dipping process. You will find an example of how to do this at the top of the page.
Once again, we appreciate your participation in this study.
161

162
Completing the Symptom Diary
In the following example, on the day of dipping this person had a temperature of 37.0º and started to feel ill and had abdominal pain. The next day their temperature had risen to 37.5º, they still felt ill and had a nosebleed. All their symptoms had gone by the next day, although their temperature remained slightly raised for two further days.
Day 1 Day 2 Day 3 Day 4 Day 5 Day 6 Day 7
Date 15/05/04 16/05/04 17/05/04 18/05/04 19/05/04 20/05/04 21/05/04
am
37.0 37.5 37.5 37.3 37.1 37.0 37.0 Temperature
pm 37.0 37.5 37.5 37.3 37.0 37.0 37.0
Feeling generally ill � �
Feeling unusually tired
Headache
Sweaty, shivery, feverish, hot or cold
Pain in your muscles or joints
Runny, stuffy, blocked or irritated nose
Hoarse voice or sore throat
Cough, shortness of breath or wheeze
Nausea, poor appetite, vomiting, abdominal pain or diarrhoea
�
Eye irritation
Other (please specify) Nosebleed

163
Symptom diary
What date did you start dipping? Did you feel ill on the day before dipping? � Yes Please describe your symptoms � No
Day 1 Day 2 Day 3 Day 4 Day 5 Day 6 Day 7
Date
am Temperature
pm
Feeling generally ill
Feeling unusually tired
Headache
Sweaty, shivery, feverish, hot or cold
Pain in your muscles or joints
Runny, stuffy, blocked or irritated nose
Hoarse voice or sore throat
Cough, shortness of breath or wheeze
Nausea, poor appetite, vomiting, abdominal pain or diarrhoea
Eye irritation
Other (please specify)

Information about dipping
We would also like you to complete a table that will allow us to gather more information about the length of time you spent dipping and your role in the dipping process. The first table contains an example of how to record your details.
Example
Date of dipping
How many sheep did you dip?
How long did dipping take? All morning / all afternoon / all dayOR number of hours
What was your main task? Plunger or Dipper/Chucker/ Helper/Other (please specify)
15/05/04
17/05/04
300
170
All day
All afternoon
Plunger
Plunger
In this example, the farmer started dipping on 15/05/04, and it took him all day to dip 300 sheep. The farmer did not dip on the 16/05/04, but started again on the afternoon of the 17th, when he dipped 170 sheep. On both days the farmer’s main task was as a plunger.
Please complete the following table, using one row for each day you dipped.
Date of dipping
How many sheep did you dip?
How long did dipping take? All morning / all afternoon / all day OR number of hours
What was your main task? Plunger or Dipper/Chucker/ Helper/Other (please specify)
Thank you
164

Appendix 16 Instructions for collecting a urine sample
Please read these instructions carefully
Instructions for collecting a urine sample
Using the sterile 20ml specimen container given to you by the nurse, allow the first part of the urine stream to be passed down the toilet, and then catch the rest in the sample bottle.
Give your sample to the nurse when they visit. Please inform them if the sample is from the first passing of the day.
165

Appendix 17 Instructions for measuring your temperature
Instructions for measuring your temperature
Please read these instructions and the leaflet with the thermometer carefully as these are designed to acquaint you with the features of your new thermometer and also help you record your temperature accurately.
How to take your temperature
Depress the on/off button on the oral digital thermometer. The display will read 188.8ºE, and a beeping sound will be heard.
Upon releasing the on/off button, the last measured temperature will be shown for two seconds and then either LºC or LºF will be displayed.
Check that the symbols are showing on the LCD display for a few seconds as this is a means of checking that the thermometer is functioning correctly. If the readout does not register the equipment is faulty and should not be used.
It is best to take your temperature first thing in the morning before you have had any hot or cold drinks, which may affect the accuracy of the reading.
Place the thermometer tip (bulb) under your tongue, positioning it on the left side at the back (the sensor tip must remain in good contact with your tongue in order to obtain an accurate oral temperature reading). Gently close your mouth and breath evenly through your nose to prevent the measurement being influenced by inhaled/exhaled air.
Keep the thermometer in place until you hear an audible tone. If you do not hear an audible sound after approx. one minute it may because contact between the thermometer and your tongue has been lost. If this is the case, reposition the sensor tip and continue.
When you hear the audible tone remove the thermometer sensor tip and immediately note the temperature displayed.
Wash the thermometer with water, or disinfect with an alcohol swab (if available).
The unit will automatically turn off in ten minutes, but it is best to press the on/off button once the temperature has been noted, as this action will prolong the life of the battery.
Store the electronic oral digital thermometer in a safe place.
166

Appendix 18 Instructions for collecting dip samples
Instructions for Collecting Dip Samples
Equipment required
l i i i i
Di le l i il l
1. 1 x 100m nner non-pyrogen c conta ners, and one outer conta ner
2. sposab ong N tr e g oves
Procedure
i
l i i i i i ii
i l l i i li id i i i ll i i
i l l li id i iti
i ll i i i icoll i i
i ill l
Act on
Take two samp es of sheep d p by mmersing the conta ners nto the d pp ng bath as nstructed:
Sample 1 Take approx mate y 20-60m of the d pp ng bath qu prior to dipping and store n a freezer. Wr te the date and t me of co ect on on the conta ner.
Sample 2 Take approx mate y 20-60m of the qu from under the surface of the dipping bath when dipping has finished, and store n a freezer, wr ng the date and t me of co ect on on the conta ner. Wr te the date and t me of
ect on on the conta ner.
If you forget to take sample 1, sample 2 s st required and should be col ected.
167

Appendix 19 Interviewers checklist Visit 1
ID label
* You do not need to complete the shaded boxes
Interviewer Checklist – Visit 1
Interviewer:
Task Tick when completed
Time / Date *
Participant telephoned to arrange the first visit
First visit conducted
General Questionnaire completed
Nurses Research Form completed
Health Questionnaire completed
Blood samples obtained
Urine sample obtained
Study pack, with instructions, given to participant Blood and urine samples posted to relevant laboratories
Laboratory phoned to check delivery
Date the participant is planning to treat their sheep (approx.): (Ask the participant to contact you if they change this date)
Number of days the dipping/pouring will continue for:
168

Appendix 20 Biological samples log Visit 1
ID label
Biological Samples Log - Visit 1
Blood samples
i /Til)
li l le
l le
Test Conta ner Date me taken
Amount (m
Comments
Butyrylcho nesterase 3m purpEDTA
Back up 3m purpEDTA
Urine samples
i /Ti l)
li l ii
Test Conta ner Date me taken
Amount (m Comments
OP metabo tes 20m ur ne conta ner
169

Appendix 21 Ascertaining caseness
Health and Sheep Dipping Study
Script to follow when telephoning participants to ascertain caseness following
treatment of sheep for ectoparasites
Please contact all participants within 48 hours of the day they started to treat their sheep.
Study No.
Hello <Name of participant>, this is <Name of nurse> from Manchester University. Have you
treated your sheep yet?
� Yes
� No
ill?
�
�
i
� ≤
�
/
i i ici
1) Do you feel
Yes
No
2) What has your temperature been s nce dipping?
37.4°C
>37.4°C
If the participants answers ‘Yes’ to question 1 and or their
temperature has been >37.4°C, they are a CASE . Please inform
Manchester, who will provide you with 5 controls.
Ask when treatment s to take place, and rem nder the part pant to
contact you when they have treated.
170

Appendix 22 Health Questionnaire Visit 2
i il l
i i lDate of d pp ng ID abe
HEALTH QUESTIONNAIRE - VISIT 2
Date quest onna re comp eted
This questionnaire asks about your health SINCE YOU DIPPED. We need to find out the pattern of health of everyone taking part in Dippers Flu Study to see which symptoms are part of the general wear and tear of farming life and which may be due to sheep dips. Please fill the questionnaire in carefully, following the example below. Place a tick in the relevant box for each question. Please don’t miss any questions out.
Example
Since you dipped, have you been troubled by the following?
Loss of appetite x Gain in weight x
In this example the person has been troubled by loss of appetite, but as you might expect, not at all by gain in weight.
171

Since you dipped, have you been troubled by the following?
Never Some of the time
Most of the time
All of the time
1 Fever 2 Paleness of the skin 3 Trouble sleeping 4 Sore throat 5 Pins and needles 6 Mouth ulcers 7 Forgetting things 8 Feeling down or depressed 9 Blurred vision 10 Coughing 11 Diarrhoea 12 Earache 13 Bothered by the smell of perfume
or aftershave 14 Ankle swelling 15 Shivering 16 Headache 17 Muscle twitching 18 Sweating (without physical
exercise) 19 Stiffness in the joints 20 Ringing or buzzing in the ears 21 Feeling hot or cold 22 Waking up feeling tired and worn
out 23 Stomach pain 24 Reddening of the face or neck
(flushing) 25 Problems seeing 26 Sleep walking 27 Nausea – feeling sick 28 Sore hands 29 General aches and pains 30 Light headedness 31 Runny nose 32 Difficulty getting an erection 33 Coughing up phlegm 34 Numbness of toes 35 Heartburn 36 Pain in your muscles 37 Hallucinating 38 Peeling or flaky skin 39 Upset stomach 40 Tingling of toes 41 Losing track of time 42 Nosebleeds 43 Weeping for no apparent reason
172

Never Some of the time
Most of the time
All of the time
44 Feeling dizzy 45 Tiredness 46 Dry mouth 47 Problems with judging distance 48 Skin eruptions 49 Coughing up blood 50 Experiencing difficulty speaking 51 Generally feeling unwell 52 Vomiting – being sick 53 Feeling of weakness in muscles 54 Loss of sexual appetite 55 Pain in your joints 56 Difficulty breathing 57 Shakiness 58 Losing the thread of your
thoughts 59 Feeling lethargic, or slowed down
generally 60 Feeling of weakness 61 Increased sensitivity for smell of
sheep dip chemicals 62 Stomach cramps 63 Feeling aggressive 64 Sore feet 65 Tight feeling in the upper part of
the stomach 66 Increased saliva in the mouth 67 Stuffy or blocked nose 68 Experiencing difficulty reading 69 Bluish discolouration of parts of
the skin 70 Inability to control bowel
movements 71 Itching or skin rashes 72 Feeling irritated for no particular
reason 73 Cramps other than in the
stomach 74 Sneezing 75 Slowing down of heart beat 76 Eye irritation – redness, watering,
burning 77 Chest pain 78 Sleeping a lot 79 Hoarse voice 80 Loss of appetite 81 Stiffness in the muscles 82 Speeding up of heart beats 83 Wheezing chest
END OF QUESTIONNAIRE – THANK YOU 173

Appendix 23 Nurse Research Form Visit 2
i i
l l
iTi i iDate of nterv ew
ID abe
Interv ewer me of nterv ew
NURSES RESEARCH FORM - VISIT 2
174

Recent Illnesses
1a. Have you had any illnesses since I last visited?
Yes � No � Don’t know �
1b. If YES, what symptoms did you have?
1c. Did you go to see your GP?
Yes � No � Don’t know �
Symptom Diary
If the participant has tick any symptoms on the Symptom Diary, ask at what point in the day each symptom started (morning/afternoon/evening/don’t know).
For the last day of each symptom, ask when the symptoms stopped (morning/afternoon/evening/don’t know).
Please ensure that the day the symptoms stopped is made clear.
Date
Feeling unwell/tired
Headache
Sweaty etc.
Pain in muscles
Runny nose etc.
Hoarse voice/sore throat Cough, sob, wheeze
Nausea etc.
Eye irritation
Other
175

Dipping
I’m now going to ask you some further questions about the dipping you have just done.
If the participant has specified on the ‘Information about dipping’ part of the symptom diary that they were a Plunger or Dipper, ask:
2. What did you use to submerge the sheep? (a) Implement / tool � (b) Hands � (c) Feet � (d) Other method (specify) � (e) Don’t know �
3a. Are you the person that handled the concentrate? Yes � No �
3b. If YES, what system did you use for handling the concentrate?
(a) Liquid poured in dip � (b) Sachet � (c) Closed mixing transfer system �
4. How many people were involved in sheep dipping?
1 � 2 � 3 � 4 � More than 4 � Don’t know �
5a. Did you use safety / protective equipment during sheep dipping?
Yes � No �
5b. If YES, what?
(a) Waterproof leggings/waders/ overtrousers �
(b) Wellington boots � (c) Gloves � (d) Bib apron � (e) Waterproof coat � (f) Goggles � (g) Plastic face shield � (h) Other (specify) �
176

6a. During dipping, did any dip get on your skin?
Yes � No � Don’t know �
If YES:
6b. Was the dip that wet your skin….
(a) Concentrated � (b) Diluted � (c) Both � (d) Don’t know �
6c. How wet did you get (ask participant to mark on line with a cross)
Slightly splashed I-------------------------------------------------------------------------I Soaked
6d. On which part of your body did you get wet (ask participant to mark on manikin area that got
wet)?
BACK FRONT
177

6e. How did you get wet?
(a) Through routine dipping � (b) By purposely entering bath (e.g. rescue sheep) � (c) Accidentally (e.g. by falling into bath) � (d) Other reason �
(e) Don’t know �
6f. Did you wash the sheep dip off?
Yes � No � Don’t know �
If YES:
6g. When did you wash it off?
(a) Immediately after every splash � (b) Before meal breaks � (c) Before smoking � (d) At the end of the day � (e) Other interval � (f) Don’t know �
6h. Did you change your clothes?
Yes � No � Don’t know �
7. What washing facilities did you have access to?
(a) No washing facilities � (b) Open tank � (c) Bucket � (d) Cold running water � (e) Hosepipe � (f) Hot and cold running water � (g) Shower � (h) Soap � (i) Other washing facilities � (j) Don’t know �
178

ID label
Appendix 24 Interviewers checklist Visit 2
Interviewer Checklist – Visit 2
Interviewer:
Til
Ti /
i lpl i i i l
i l i ii ill
i l i ii ill (i
i ldi i i ill
i l
i
l
l i i l
Bl l i
i l i
Bl i l ll i
li
Task ck when comp eted
me Date *
Part cipant te ephoned approx. 1 week before anned date of d pp ng to conf rm actua date
Part cipant te ephoned the day after d pp ng to ask f they are Part cipant te ephoned two days after d pp ng to ask f they are f necessary) Part cipant te ephoned seven days after
pp ng to ask f they are
Is a second v sit to take p ace?
Second v sit conducted
Nurses Research Form comp eted
Hea th Quest onna re comp eted
ood samp es obta ned
Ur ne samp e obta ned
ood and ur ne samp es posted to re evant aborator es
Laboratory phoned to check de very
If this participant has been interviewed a second time, please confirm their status:
Case
Referent
* You do not need to complete the shaded boxes
179

Appendix 25 Biological samples log Visit 2
ID label
Biological Samples Log - Visit 2
i /Til)
ll
i
il
Albumi i
l lli
l lli
ll bll l
i
li
l l
i
Test Conta ner Date me taken
Amount (m
Comments
Sero ogy 10m red-top vacuta ner tube
C-react ve protein, LFT, Amy ase,
n, Creat nine
4m ye ow-top vacuta ner tube (citrate)
IgE 4m ye ow-top vacuta ner tube (citrate)
Fu ood count 3m purp e-top vacuta ner tube
Butyrylcho nesterase
3m purp e-top (EDTA) vacuta ner tube
Urine samples
i /Ti l)
li l ii
Test Conta ner Date me taken
Amount (m Comments
OP metabo tes 20m ur ne conta ner
le /Ti l)
i i
i i
Samp Date me taken
Amount (m Comments
1: Before d pp ng
2: After d pp ng
180

Appendix 26 Nurse Visit 3 Confirmation Letter
«title» «firstinitial» «surname»«address1»«address2»«address3»«town»«county»«postcode»Study Number: «idno»
Dear «title» «surname»
Re: Health and Sheep Dipping Survey
This letter is to confirm that the research nurse will visit you for your final interview on at
Thank you once again for your help and co-operation.
Yours sincerely
Research Nurse
181

Appendix 27 Health Questionnaire Visit 3
Date questionnaire completed ID label
HEALTH QUESTIONNAIRE - VISIT 3
This questionnaire asks about your health SINCE I LAST VISITED. We need to find out the pattern of health of everyone taking part in Dippers Flu Study to see which symptoms are part of the general wear and tear of farming life and which may be due to sheep dips. Please fill the questionnaire in carefully, following the example below. Place a tick in the relevant box for each question. Please don’t miss any questions out.
Example Since I last visited, have you been troubled by the following?
Loss of appetite x Gain in weight x
In this example the person has been troubled by loss of appetite, but as you might expect, not at all by gain in weight.
182

Since I last visited, have you been troubled by the following?
Never Some of the time
Most of the time
All of the time
1 Fever 2 Paleness of the skin 3 Trouble sleeping 4 Sore throat 5 Pins and needles 6 Mouth ulcers 7 Forgetting things 8 Feeling down or depressed 9 Blurred vision 10 Coughing 11 Diarrhoea 12 Earache 13 Bothered by the smell of perfume
or aftershave 14 Ankle swelling 15 Shivering 16 Headache 17 Muscle twitching 18 Sweating (without physical
exercise) 19 Stiffness in the joints 20 Ringing or buzzing in the ears 21 Feeling hot or cold 22 Waking up feeling tired and worn
out 23 Stomach pain 24 Reddening of the face or neck
(flushing) 25 Problems seeing 26 Sleep walking 27 Nausea – feeling sick 28 Sore hands 29 General aches and pains 30 Light headedness 31 Runny nose 32 Difficulty getting an erection 33 Coughing up phlegm 34 Numbness of toes 35 Heartburn 36 Pain in your muscles 37 Hallucinating 38 Peeling or flaky skin 39 Upset stomach 40 Tingling of toes 41 Losing track of time 42 Nosebleeds 43 Weeping for no apparent reason
183

Never Some of the time
Most of the time
All of the time
44 Feeling dizzy 45 Tiredness 46 Dry mouth 47 Problems with judging distance 48 Skin eruptions 49 Coughing up blood 50 Experiencing difficulty speaking 51 Generally feeling unwell 52 Vomiting – being sick 53 Feeling of weakness in muscles 54 Loss of sexual appetite 55 Pain in your joints 56 Difficulty breathing 57 Shakiness 58 Losing the thread of your
thoughts 59 Feeling lethargic, or slowed down
generally 60 Feeling of weakness 61 Increased sensitivity for smell of
sheep dip chemicals 62 Stomach cramps 63 Feeling aggressive 64 Sore feet 65 Tight feeling in the upper part of
the stomach 66 Increased saliva in the mouth 67 Stuffy or blocked nose 68 Experiencing difficulty reading 69 Bluish discolouration of parts of
the skin 70 Inability to control bowel
movements 71 Itching or skin rashes 72 Feeling irritated for no particular
reason 73 Cramps other than in the
stomach 74 Sneezing 75 Slowing down of heart beat 76 Eye irritation – redness, watering,
burning 77 Chest pain 78 Sleeping a lot 79 Hoarse voice 80 Loss of appetite 81 Stiffness in the muscles 82 Speeding up of heart beats 83 Wheezing chest
END OF QUESTIONNAIRE – THANK YOU 184

Appendix 28 Nurse Research Form Visit 3
i i
l l
iTi i iDate of nterv ew
ID abe
Interv ewer me of nterv ew
NURSES RESEARCH FORM - VISIT 3
185

Recent Illnesses
1a. Have you had any illnesses since I last visited?
Yes � No � Don’t know �
1b. If YES, what symptoms did you have?
1c. Did you go to see your GP?
Yes � No � Don’t know �
Symptom Diary
If the participant has tick any symptoms on the Symptom Diary, ask at what point in the day each symptom started (morning/afternoon/evening/don’t know).
For the last day of each symptom, ask when the symptoms stopped (morning/afternoon/evening/don’t know).
Please ensure that the day the symptoms stopped is made clear.
Date
Feeling unwell/tired
Headache
Sweaty etc.
Pain in muscles
Runny nose etc.
Hoarse voice/sore throat Cough, sob, wheeze
Nausea etc.
Eye irritation
Other
186

Dipping
2. Have you dipped since I last visited you? Yes � No � Don’t know �
3a. Have you used any other pesticides since I last visited you?
Yes � Continue with questionnaire No � End of Don’t know �
3b. If YES, please complete details
Date used Name of pesticide Reason for use
3c. Did you feel unwell or have any symptoms after using these pesticides?
Yes � No � Don’t know �
Please list symptoms if YES
If the participant has specified on the ‘Information about dipping’ part of the symptom diary that they were a Plunger or Dipper, ask:
4. What did you use to submerge the sheep? (a) Implement / tool � (b) Hands � (c) Feet � (d) Other method (specify) � (e) Don’t know �
5a. Are you the person that handled the concentrate? Yes � No �
187

5b. If YES, what system did you use for handling the concentrate? (a) Liquid poured in dip � (b) Sachet � (c) Closed mixing transfer system �
6. How many people were involved in sheep dipping?
1 � 2 � 3 � 4 � More than 4 � Don’t know �
7a. Did you use safety / protective equipment during sheep dipping?
Yes � No �
7b. If YES, what? (a) Waterproof leggings/waders/
overtrousers �(b) Wellington boots � (c) Gloves � (d) Bib apron � (e) Waterproof coat � (f) Goggles � (g) Plastic face shield � (h) Other (specify) �
8a. During dipping, did any dip get on your skin?
Yes � No � Don’t know �
If YES:
8b. Was the dip that wet your skin….
(a) Concentrated � (b) Diluted � (c) Both � (d) Don’t know �
8c. How wet did you get (ask participant to mark on line with a cross)
Slightly splashed I-------------------------------------------------------------------------I Soaked
188

8d. On which part of your body did you get wet (ask participant to mark on manikin area that got
wet)?
BACK FRONT
8e. How did you get wet?
(a) Through routine dipping � (b) By purposely entering bath (e.g. rescue sheep) � (c) Accidentally (e.g. by falling into bath) � (d) Other reason � (e) Don’t know �
8f. Did you wash the sheep dip off?
Yes � No � Don’t know �
If YES:
8g. When did you wash it off?
(a) Immediately after every splash � (b) Before meal breaks � (c) Before smoking � (d) At the end of the day � (e) Other interval � (f) Don’t know �
189

8h. Did you change your clothes?
Yes � No � Don’t know �
9. What washing facilities did you have access to?
(a) No washing facilities � (b) Open tank � (c) Bucket � (d) Cold running water � (e) Hosepipe � (f) Hot and cold running water � (g) Shower � (h) Soap � (i) Other washing facilities � (j) Don’t know �
190

Appendix 29 Interviewers checklist Visit 2
ID label
Interviewer Checklist – Visit 3
Interviewer:
Task Tick when completed
Time / Date *
Participant telephoned to arrange the third visit
Third visit conducted
Nurses Research Form completed
Health Questionnaire completed
Blood samples obtained
Blood samples posted to relevant laboratories
Laboratory phoned to check delivery
* You do not need to complete the shaded boxes
191

Appendix 30 Biological samples log Visit 3
ID label
Biological Samples Log – Visit 3
Blood samples
i /Til)
l l
Test Conta ner Date me taken
Amount (m
Comments
Sero ogy 10m red-top
192

Appendix 31 Treatment completed questionnaire
Date questionnaire completed ID label
TREATMENT COMPLETED QUESTIONNAIRE
This questionnaire is for study participants who have completed the general questionnaire and have already treated their sheep this year. By answering these questions you will be providing us with important information so we can see if there are any factors that make some people more likely to get ill than others.
193

The following questions are about parasite treatments you have carried out on your sheep this year only.
1. What is the size of your flock?
2. How many pesticide treatments have you carried out this year?
3. How many days did you treat this year?
4. Please tick which method(s) you used, and tell us the product or trade name.
Method Tick if used Product/trade name
Dips
Showers
Injectables
Pour-on’s
5. Did you handle or work with the concentrate for the treatment of any external sheep parasite?
Yes � No � Don’t know �
6. If you dipped, please answer the following questions. If not, go to question7 on the next page.
(a) Where was the dipping bath located?
� Outside � Within a building � Within a mobile trailer � Covered area (roofed but open sides) � Other (please specify)
(b) Where you the person who poured the concentrate or added it to the bath?
Yes � No � Don’t know �
(c) Did you spill the concentrate on yourself?
Yes � No � Don’t know �
194

(d) Did you enter the dipping bath accidentally or purposely (e.g. to rescue a sheep)?
Yes � No � Don’t know �
(e) What task did you perform? Please tick all that apply.
� Plunger/dipper/paddler � Chucker � Helper � Other (please specify)
If you have ticked more than one, which task did you perform most?
(f) Did you have to man-handle the sheep immediately after dipping, i.e. before the dip had dried off?
Yes � No � Don’t know �
7. Did you use gloves? Yes � No � Don’t know �
8. Did you use any other protective clothing? Yes � No � Don’t know �
If yes, what did you use? (a) Waterproof leggings/waders/overtrousers � (b) Wellington boots � (c) Gloves � (d) Bib apron � (e) Waterproof coat � (f) Goggles � (g) Plastic face shield � (h) Other (specify) �
9. Did you have any illnesses after using pesticides? Yes � No � Don’t know �
10. Did you suffer from dippers’ flu? Yes � No � Don’t know �
11. Do you currently hold a certificate of competence for dipping?
Yes � No � Don’t know �
If yes, what year did you obtain it?
12. Are you a contract dipper? Yes � No � Don’t know �
13. What breed of sheep do you have?
195

196
The next set of questions are about organophosphorous (OP) based sheep dips. Please consider the following statements, and indicate whether you agree or disagree with the statement, or if you are not sure.
Statement Agree Not sure Disagree
1. Sheep dip can’t be that bad for humans, because it doesn’t affect the sheep very much
2. I have never met anyone who has been affected by sheep dip
3. I think sheep dip is unlikely to affect my health in the future
4. Using sheep dip makes a lot of farmers feel ill
5. I am very worried about using sheep dip
6. Sheep dip in its diluted form is not particularly dangerous
7. I think there is too much fuss about the health effects of sheep dip
8. Using sheep dip does not bother me
9. Using sheep dip is very bad for your health
10. You get used to sheep dip, so it doesn’t affect you
11. A few farmers get affected by sheep dip, but most are OK
12. I worry about my health when using sheep dip
END OF QUESTIONNAIRE – THANK YOU

Appendix 32 General questionnaire – Treatment completed
Date questionnaire completed ID label
GENERAL QUESTIONNAIRE – TREATMENT COMPLETED
This questionnaire asks about your past medical history, lifestyle factors and occupational history. We need to know these details for everyone taking part in the Health and Sheep Dipping Study to see if any of these factors make some people more likely to get ill than others.
197

198
1. Would you describe your general health as:
Very good � Good � Average � Poor � Very poor � Don’t know � 2. Do you suffer from, or have you ever suffered from any of the following illnesses?
Yes No Don’t know Condition
(Please tick relevant box)
A) Bone or joint disorders e.g. osteoarthritis, arthritis, rheumatism, rheumatoid arthritis, osteoporosis, back problems
B ) Bladder or kidney disorders e.g. frequent infections, blood in urine, renal failure
C) Skin disorders e.g. eczema, psoriasis, rashes
D) Blood disorders e.g. anaemia
E) Gland disorders e.g. diabetes, thyroid disease
F) Nervous system disorders e.g. multiple sclerosis, epilepsy, chronic fatigue syndrome (M.E.), depression, anxiety, schizophrenia
G) Intestinal disorders e.g. ulcers, Crohn’s / colitis, jaundice, diverticulosis
H) Serious infectious illnesses e.g. TB, rheumatic fever, hepatitis, jaundice
I) Allergies e.g. Hay fever, food, dustmite
J) Dippers flu
K) Infectious illnesses through working with animals e.g. leptospirosis
L) Heart or circulation problems e.g. high blood pressure, angina, stroke, thrombosis, chest
pain
M) Respiratory problems e.g. chest infections, sinusitis, tonsillitis, asthma, farmers’
lung, flu, pneumonia, bronchitis, emphysema
MEDICAL HISTORY

MEDICAL HISTORY continued
3. Have you had any of the following vaccinations within the past year?
(a) Flu Yes � No � Don’t know � (b) Pneumococcal Yes � No � Don’t know �
4. Are you currently taking any medication?
Yes � No � Don’t know �
5. Have you ever had any surgical operations or procedures?
Yes � No � Don’t know �
ALCOHOL CONSUMPTION
6a. Do you currently drink alcohol?
Yes � (go to question 6b)
No � (go to question 7a)
6b. Please put a tick in the appropriate frequency column, and write down quantity (e.g. number of
pints or glasses) drunk on each occasion. Please do not write in the shaded boxes.
Type of drink
Frequency Total Quantity per week
Most days
3-4 times per week
1-2 times per week
Less than once per week
Never Pints Glasses
Beer, lager, stout or shandy
Wine
Sherry, Martini, fortified wines Spirits or Liqueurs
199

TOBACCO USE
7a. Do you currently smoke? (e.g. at least 1 cigarette per week)
Yes � (go to question 7b)
No � (go to question 7e)
7b. Do you smoke: Cigarettes � Cigars � A pipe �
7c. When did you start smoking?
Age OR Year
7d. On average, how many cigarettes/cigars or oz/grams of pipe tobacco, do you smoke per day?
7e. Have you ever smoked? (e.g. at least 1 cigarette per week)
Yes � (go to question 7f)
No � (go to question 8)
7f. Did you smoke: Cigarettes � Cigars � A pipe �
7g. Please complete the following table for each time you have smoked:
/ i
1
2
3
4
Age OR year started smoking
Age OR year stopped smoking
Average number of cigarettes/cigars or oz grams of p pe tobacco smoked per day
200

CAFFEINE INTAKE
8a. Do you currently drink tea or coffee?
Yes � (go to question 8b)
No � (go to question 9a)
8b. How many cups per day do you drink?
9a. Do you currently drink any other drinks containing caffeine, e.g. cola, red bull?
Yes � (go to question 9b)
No � (go to Occupational History section)
9b. How many cups / cans per day do you drink?
OCCUPATIONAL HISTORY
The following question is about your working history as a farmer since 1950. On the next two pages, all you have to do is to put a tick or a line in the relevant boxes, as in
the following example:
Year Sheep Cattle Other livestock Other work Please specify Please specify
1980 � 1981 EXAMPLE 1982 1983 � Driver 1984 � Driver 1985 Retired
Please include any time spent helping out as a child. By ‘Other work’ we mean any work outside the farm either on a casual, part-time or full-time basis. In this example, this farmer started working in 1980, was a sheep farmer from 1980 to 1984 but also kept cattle in 1980, and was a driver, part-time, between1983 and 1984. This person retired in 1985.
If you started working between 1950 – 1980, please start at question 10.1 on page 6, and continue to question 10.2 on page 7. If you have started working since1981, start at question 10.2 on page 7.
201

1
2
3
4
5
6
7
8
9
10a. Work history from 1950 to 1980
Year Sheep Cattle Other livestock Other work (Please specify) (Please specify)
1950
1951
1952
1953
1954
1955
1956
1957
1958
1959
1960
1961
1962
1963
1964
1965
1966
1967
1968
1969
1970
197
197
197
197
197
197
19 7
197
197
1980
202

10b.
Other work (Please specify)
Work history from 1981 to present date
Year Sheep Cattle Other livestock (Please specify)
1981
1982
1983
1984
1985
1986
1987
1988
1989
1990
1991
1992
1993
1994
1995
1996
1997
1998
1999
2000
2001
2002
2003
2004
203

204
Please fill in as much detail as you can remember about your parasite control activities for the following years.
What method did you use? (please tick relevant columns)
Did you use gloves? (please tick)
Did you use other protective clothing?
(please tick)
Did you have any illnesses after using
pesticides (please tick) Year
Size of flock
(approx.)
Number of pesticide
treatments per year
Dips Showers Injectables Pour-on’s No Yes Don’t Know No Yes Don’t
Know No Yes Don’t Know
1950s
1960s
1970s
1980s
1990s
2000
2001
2002
2003
2004
PREVIOUS EXPOSURE TO PESTICIDES

205
The following questions are about organophosphorous (OP) based sheep dips. Please consider the following statements, and indicate whether you agree, or you are not sure, or you disagree with each, by ticking the relevant box. Please tick only one box for each statement.
Statement Agree Not sure Disagree
1. Sheep dip can’t be that bad for humans, because it doesn’t affect the sheep very much
2. I have never met anyone who has been affected by sheep dip
3. I think sheep dip is unlikely to affect my health in the future
4. Using sheep dip makes a lot of farmers feel ill
5. I am very worried about using sheep dip
6. Sheep dip in its diluted form is not particularly dangerous
7. I think there is too much fuss about the health effects of sheep dip
8. Using sheep dip does not bother me
9. Using sheep dip is very bad for your health
10. You get used to sheep dip, so it doesn’t affect you
11. A few farmers get affected by sheep dip, but most are OK
12. I worry about my health when using sheep dip
END OF QUESTIONNAIRE – THANK YOU
Organophosphorus-based Sheep Dips

Appendix 33 Continuing participation postcard
Study number:
The Health and Sheep Dipping survey will continue this year until May/June. We may wish to contact you to see whether you would like to participate again. If you wish to take part again please tick the appropriate box.
I would like to take part again in the Health and Sheep Dipping Survey
I do not want to take part again in this survey.
After the survey has finished, we plan to have the results analysed by the end of August/September. If you wish to receive a summary of the results please tick the appropriate box.
I would like to received a summary of the results
I would not like to receive a summary of the results
Thank you for taking the time to complete this postcard. Please return it to us via Freepost. No stamp is required.
206

Appendix 34 Ineligible letter
«title» «firstinitial» «surname»«address1»«address2»«address3»«town»«county»«postcode»Study Number: «idno»
Dear «title» «surname»
Thank you for returning your forms and agreeing to take part in the Health and SheepDipping Survey. I am sorry for the delay in replying but many people have expressed aninterest in taking part.
This survey involves completing an initial questionnaire and then potentially having the studynurse come to visit you up to three times over the dipping period. Therefore the nurse willvisit some farmers in the study and others will only complete the questionnaire.
Farm visits have had to be restricted to those farmers in the 18 – 70 age range and thosewho are actively dipping this year. For these reasons you will only have to complete theenclosed initial questionnaire. As a token of our appreciation, you will receive £20 when wereceive this. I would like to stress that by completing the questionnaire you are still providingthe study team with important information.
I have included a copy of the questionnaire with this letter. If you have any difficultiescompleting the questionnaire please call the study team on the free phone number: 0800 1951667 and they will be pleased to help you.
I hope that you are willing to participate and I look forward to receiving your completedquestionnaire.
Yours Sincerely
Dr Andy Povey
Lead Investigator Phone: 0161 275 5232 Email: [email protected]
207

Appendix 35 Ineligible questionnaire
i i lDate quest onna re comp eted
HEALTH AND WORK QUESTIONNAIRE
Thank you for agreeing to complete this short questionnaire. Please return it to us in the freepost envelope provided.
Personal details
Title (e.g. Mr/Mrs/Ms)
First name Surname
Address
Postcode
Tel. No. (Home) (Mobile)
Date of birth (dd/mm/yyyy)
Sex � Male � Female
208

209
MEDICAL HISTORY
1. Would you describe your general health as: Very good � Good � Average � Poor � Very poor � Don’t know �
2. Do you suffer from, or have you ever suffered from any of the following illnesses?
Condition Yes – please enter the name of the condition
No Don’t know
A) Bone or joint disorders e.g. osteoarthritis, arthritis, rheumatism, rheumatoid arthritis, osteoporosis, back problems
B ) Bladder or kidney disorders e.g. frequent infections, blood in urine, renal failure
C) Skin disorders e.g. eczema, psoriasis, rashes
D) Blood disorders e.g. anaemia
E) Gland disorders e.g. diabetes, thyroid disease
F) Nervous system disorders e.g. multiple sclerosis, epilepsy, chronic fatigue syndrome (M.E.), depression, anxiety, schizophrenia
G) Intestinal disorders e.g. ulcers, Crohn’s / colitis, jaundice, diverticulosis
H) Serious infectious illnesses e.g. TB, rheumatic fever, hepatitis, jaundice
I) Allergies e.g. Hay fever, food, dustmite
J) Infectious illnesses through working with animals e.g. leptospirosis
K) Heart or circulation problems e.g. high blood pressure, angina, stroke, thrombosis, chest pain

MEDICAL HISTORY continued
3. Have you ever had any surgical operations or procedures?
Yes � No � Don’t know �
If YES, please give details:
i i i i
i
i/
i
Operat on 1 Operat on 2 Operat on 3 Operat on 4
Name of operat on
Reason for operat on Age year of operat on
Please answer questions 4 and 5 ONLY if you are actively dipping this year. If you are not actively dipping, go to question 6.
4. Have you had any of the following vaccinations within the past year?
(a) Flu Yes � No � Don’t know �
(b) Pneumococcal Yes � No � Don’t know �
5. Are you currently taking any medication?
Yes � No � Don’t know �
If YES, please give details:
i i i i
i
i
iill
i i
Med cine 1 Med cine 2 Med cine 3 Med cine 4
Name of med cine
Reason for taking med cine
Dose
Date started taking med cine Are you st taking th s med cine?
If NO, date stopped
210

ALCOHOL CONSUMPTION
6a. Do you currently drink alcohol?
Yes � (go to question 6b)
No � (go to question 7a)
6b. Please put a tick in the appropriate frequency column, and write down quantity (e.g. number of
pints or glasses) drunk on each occasion. Please do not write in the shaded boxes.
Type of drink
Frequency Total Quantity per week
Most days
3-4 times per week
1-2 times per
week
Less than once per
week Never Pints Glasses
Beer, lager, stout or shandy
Wine
Sherry, Martini, fortified wines Spirits or Liqueurs
211

TOBACCO USE
7a. Do you currently smoke? (e.g. at least 1 cigarette per week)
Yes � (go to question 7b)
No � (go to question 7e)
7b. Do you smoke: Cigarettes � Cigars � A pipe �
7c. When did you start smoking? Age OR Year
7d. On average, how many cigarettes/cigars or oz/grams of pipe tobacco, do you smoke per day?
7e. Have you ever smoked? (I.e. at least 1 cigarette per week)
Yes � (go to question 7f)
No � (go to question 8)
7f. Did you smoke: Cigarettes � Cigars � A pipe �
7g. Please complete the following table for each time you have smoked:
/ i
1
2
3
4
Age OR year started smoking
Age OR year stopped smoking
Average number of cigarettes/cigars or oz grams of p pe tobacco smoked per day
212

CAFFEINE INTAKE
8a. Do you currently drink tea or coffee? Yes � (go to question 8b)
No � (go to question 9a)
8b. How many cups per day do you drink?
9a. Do you currently drink any other drinks containing caffeine, e.g. cola, red bull?
Yes � (go to question 9b)
No � (go to Occupational History section)
9b. How many cups / cans per day do you drink?
OCCUPATIONAL DETAILS
The following question is about your working history as a farmer from 1950 to 2003. On the next two pages, all you have to do is to put a tick or a line in the relevant boxes, as in the following example:
Historical Occupational Details
Year Sheep Cattle Other livestock Other work Please specify Please specify
1980 � 1981 1982 EXAMPLE 1983 � Driver 1984 � Driver 1985 Retired
• Please include any time spent helping out as a child. • By ‘Other work’ we mean any work outside the farm either on a casual, part-time or
full-time basis. • In this example, this farmer started working in 1980, was a sheep farmer from 1980 to
1984 but also kept cattle in 1980, and was a driver, part-time, between1983 and 1984. This person retired in 1985.
• If you started working between 1950 – 1980, please start at question 10.1 on page 6, and continue to question 10.2 on page 7. If you have started working since1981, start at question 10.2 on page 7.
213

1
2
3
4
5
6
7
8
9
10a. Work history from 1950 to 1980
Year Sheep Cattle Other livestock Other work (Please specify) (Please specify)
1950
1951
1952
1953
1954
1955
1956
1957
1958
1959
1960
1961
1962
1963
1964
1965
1966
1967
1968
1969
1970
197
197
197
197
197
197
19 7
197
197
1980
214

10b.
Other work (Please specify)
Work history from 1981 to present date
Year Sheep Cattle Other livestock (Please specify)
1981
1982
1983
1984
1985
1986
1987
1988
1989
1990
1991
1992
1993
1994
1995
1996
1997
1998
1999
2000
2001
2002
2003
215

Details of external parasite treatment on sheep in 2004
1. Last year, which method(s) did you use to treat external sheep parasites in your flock? (please tick each method used) � Plunge dips � Injectables � Pour-on’s � Shower � No treatment
2. Please write down the names of the products that you used: Plunge dips: Injectables: Pour-on’s: Shower:
3. Were you personally involved in treating your sheep? � Yes Go to question 4 � No Go to question 8
4. Did you wear gloves? � Yes � No
5. Did you use other protective clothing? � Yes � No e.g. Wellington boots, apron, face shield
6. Did you feel ill whilst treating your sheep, or in the day or so that followed? � Yes Go to question 7 � No Go to question 8
7. What symptoms did you have? (please tick all that are relevant) � Felt generally ill � Felt unusually tired � Headache � Sweaty, shivery, feverish, hot or cold � Pain in your muscles or joints � Runny, stuffy, blocked or irritated nose � Hoarse voice or sore throat � Cough, shortness of breath or wheeze � Nausea, poor appetite, vomiting, abdominal pain or diarrhoea � Eye irritation � Other (please specify)
8. Were you ever personally involved in treating external parasites on sheep before 2004? � Yes Go to question 9 � No Go to question 10
216

217
9. Please fill in as much detail as you can remember about your parasite control activities for all the years that are relevant:
What type of control did you use? (please tick relevant columns)
What type of product was it? (please tick) Name of product
Year Size of flock
(Approx.)
Number of dips
per year
Dips Showers Injectables Pour-on’s
Organo-phosphates
Organo-chlorines Pyrethroids
Other (specify)
1950s
1960s
1970s
1980s
1990s
2000
2001
2002
2003
Continued on next page…

218
Question 9 continued…
Did you have any illnesses after dipping (please tick) Year
No Yes Don’t Know
If you did feel unwell after dipping, please list the symptoms that you had
1950s
1960s
1970s
1980s
1990s
2000
2001
2002
2003

219
Organophosphorous-based sheep dips 10. Please consider the following statements, and tick the relevant column depending upon
whether you agree, are not sure, or you disagree with each.
Statement Agree Not sure Disagree
Sheep dip can’t be that bad for humans, because it doesn’t affect the sheep very much
I have never met anyone who has been affected by sheep dip
I think sheep dip is unlikely to affect my health in the future
Using sheep dip makes a lot of farmers feel ill
I am very worried about using sheep dip
Sheep dip in its diluted form is not particularly dangerous
I think there is too much fuss about the health effects of sheep dip
Using sheep dip does not bother me
Using sheep dip is very bad for your health
You get used to sheep dip, so it doesn’t affect you
A few farmers get affected by sheep dip, but most are OK
I worry about my health when using sheep dip
Thank you for completing this questionnaire Please return to: The Health and Sheep Dipping Survey, Centre for Occupational and Environmental Health, 4th Floor Humanities Building, University of Manchester, Devas Street, Manchester M13 9PL.

Appendix 36 Volunteer letter
«title» «firstinitial» «surname»«address1»«address2»«address3»«town»«county»«postcode»Study Number: «idno»
Dear «title» «surname»
Thank you for telephoning us and expressing an interest in taking part in the Health andSheep Dipping Survey. I am sorry for the delay in replying but many people have expressedan interest in taking part.
This survey involves completing an initial questionnaire and then potentially having the studynurse come to visit you up to three times over the dipping period. Therefore the nurse willvisit some farmers in the study and others will only complete the questionnaire.
Farm visits have had to be restricted to those farmers in the 18 – 70 age range and thosewho are actively dipping this year, and to those who we had previously sent a letter. Forthese reasons you will only have to complete the enclosed initial questionnaire. However Iwould like to stress that by completing the questionnaire you are still providing the studyteam with important information.
I have included a copy of the questionnaire with this letter. If you have any difficultiescompleting the questionnaire please call the study team on the free phone number: 0800 1951667 and they will be pleased to help you.
I hope that you are willing to participate and I look forward to receiving your completedquestionnaire.
Yours Sincerely
Dr Andy Povey
Lead Investigator Phone: 0161 275 5232 Email: [email protected]
220

221
Appendix 37 Dipper’s flu definition derived from the symptom diarya
Dipper’s flu definition Symptom
This study Textbook Research Report Web-based
Feeling generally ill + +
Feeling unusually tired + +
Headache + + + +
Sweaty, shivery, feverish, hot or cold + +
Pain in your muscles or joints + + + +
Runny, stuffy, blocked or irritated nose + +
Hoarse voice or sore throat +
Cough, shortness of breath or wheeze +
Nausea, poor appetite, vomiting, abdominal pain or diarrhoea + +
Eye irritation +
a Defined either a priori (this study), or from a textbook (Baxter et al, 2000), a research report (Stephens et al, 1995a) or
a website (DoctorMyhill.co.uk, 2006) and matched, as best possible, to symptoms used on symptom diary

Appendix 38 Dipper’s flu definition derived from the health questionnairea
Q In the past four weeks have you been troubled by the following
1 Fever 2 Paleness of the skin 3 Trouble sleeping 4 Sore throat 5 Pins and needles 6 Mouth ulcers 7 Forgetting things 8 Feeling down or depressed 9 Blurred vision 10 Coughing 11 Diarrhoea 12 Earache 13 Bothered by the smell of perfume or
aftershave 14 Ankle swelling 15 Shivering 16 Headache 17 Muscle twitching 18 Sweating (without physical exercise) 19 Stiffness in the joints 20 Ringing or buzzing in the ears 21 Feeling hot or cold 22 Waking up feeling tired and worn out 23 Stomach pain 24 Reddening of the face or neck (flushing) 25 Problems seeing 26 Sleep walking 27 Nausea – feeling sick 28 Sore hands 29 General aches and pains 30 Light headedness 31 Runny nose 32 Difficulty getting an erection 33 Coughing up phlegm 34 Numbness of toes 35 Heartburn 36 Pain in your muscles 37 Hallucinating 38 Peeling or flaky skin 39 Upset stomach 40 Tingling of toes 41 Losing track of time
Dipper’s flu definition This
study Text Book
Research Report
Web-based
+ +
+
+ +
+ + + + +
+ +
+ + +
+
+ + + + + + + +
+
+ + + +
222

42 Nosebleeds 43 Weeping for no apparent reason 44 Feeling dizzy + + 45 Tiredness + + 46 Dry mouth 47 Problems with judging distance 48 Skin eruptions 49 Coughing up blood 50 Experiencing difficulty speaking 51 Generally feeling unwell + + 52 Vomiting – being sick 53 Feeling of weakness in muscles + + 54 Loss of sexual appetite 55 Pain in your joints + + 56 Difficulty breathing + 57 Shakiness 58 Losing the thread of your thoughts + 59 Feeling lethargic, or slowed down
generally + +
60 Feeling of weakness + + + 61 Increased sensitivity for smell of sheep
dip chemicals 62 Stomach cramps 63 Feeling aggressive 64 Sore feet 65 Tight feeling in the upper part of the
stomach 66 Increased saliva in the mouth 67 Stuffy or blocked nose + + 68 Experiencing difficulty reading 69 Bluish discolouration of parts of the skin 70 Inability to control bowel movements 71 Itching or skin rashes 72 Feeling irritated for no particular reason 73 Cramps other than in the stomach 74 Sneezing + + 75 Slowing down of heart beat 76 Eye irritation – redness, watering, burning 77 Chest pain + 78 Sleeping a lot + 79 Hoarse voice + 80 Loss of appetite + + 81 Stiffness in the muscles + + 82 Speeding up of heart beats 83 Wheezing chest +
a Defined either a priori (this study), or from a textbook (Baxter et al, 2000), a research report (Stephens et al, 1995a) or a website (DoctorMyhill.co.uk, 2006)
and matched, as best possible, to symptoms used on symptom diary
223

224
Appendix 39 Case definitions derived a priori from the symptom diary
Symptom Respiratory Infection
Lethargy/ myalgia Gastroenteritis Solvent
effects Cholinergic
effects
Mild cholinergic
effects
Feeling generally ill + + +
Feeling unusually tired + + +
Headache + +
Sweaty, shivery, feverish, hot or cold
+ +
Pain in your muscles or joints +
Runny, stuffy, blocked or irritated nose
+ + + +
Hoarse voice or sore throat + +
Cough, shortness of breath or wheeze
+ + + +
Nausea, poor appetite, vomiting, abdominal pain or diarrhoea
+ +
Eye irritation + +

Appendix 40 Case definitions derived from the symptom diary using published definitionsa
Symptom Pesticide symptoms
Somatic symptoms COPIND
Feeling generally ill
Feeling unusually tired +
Headache +
Sweaty, shivery, feverish, hot or cold
+ +
Pain in your muscles or joints +
Runny, stuffy, blocked or irritated + nose
Hoarse voice or sore throat
Cough, shortness of breath or wheeze
+ +
Nausea, poor appetite, vomiting, abdominal pain or diarrhoea
+ +
Eye irritation
a Matched as best possible to the symptoms described in Coggon (pesticide symptoms), Solomon (somatic symptoms and COPIND
225

123456789
Appendix 41 Case definitions derived a priori from the Health Questionnaire (I)
In the past four weeks have you been troubled by the following
Respiratory Infection
Lethargy/ myalgia
Gastroenteritis
Solvent effects
1 Fever + 2 Paleness of the skin 3 Trouble sleeping 4 Sore throat + + 5 Pins and needles 6 Mouth ulcers 7 Forgetting things 8 Feeling down or depressed + 9 Blurred vision 10 Coughing + + 11 Diarrhoea + 12 Earache 13 Bothered by the smell of perfume or
aftershave 14 Ankle swelling 15 Shivering 16 Headache + 17 Muscle twitching 18 Sweating (without physical exercise) 19 Stiffness in the joints 20 Ringing or buzzing in the ears 21 Feeling hot or cold 22 Waking up feeling tired and worn out + 23 Stomach pain + 24 Reddening of the face or neck
(flushing) +
25 Problems seeing 26 Sleep walking 27 Nausea – feeling sick + 28 Sore hands + 29 General aches and pains + 30 Light headedness + 3 Runny nose + + 3 Difficulty getting an erection 3 Coughing up phlegm + 3 Numbness of toes 3 Heartburn 3 Pain in your muscles + 3 Hallucinating 3 Peeling or flaky skin 3 Upset stomach + 40 Tingling of toes 41 Losing track of time 42 Nosebleeds
226

43 Weeping for no apparent reason 44 Feeling dizzy + 45 Tiredness + + 46 Dry mouth 47 Problems with judging distance 48 Skin eruptions 49 Coughing up blood + 50 Experiencing difficulty speaking 51 Generally feeling unwell + 52 Vomiting – being sick + 53 Feeling of weakness in muscles + 54 Loss of sexual appetite 55 Pain in your joints 56 Difficulty breathing + + 57 Shakiness 58 Losing the thread of your thoughts 59 Feeling lethargic, or slowed down
generally + +
60 Feeling of weakness + 61 Increased sensitivity for smell of sheep
dip chemicals 62 Stomach cramps + 63 Feeling aggressive 64 Sore feet 65 Tight feeling in the upper part of the
stomach 66 Increased saliva in the mouth 67 Stuffy or blocked nose + + 68 Experiencing difficulty reading 69 Bluish discolouration of parts of the skin 70 Inability to control bowel movements 71 Itching or skin rashes + 72 Feeling irritated for no particular reason 73 Cramps other than in the stomach 74 Sneezing + + 75 Slowing down of heart beat 76 Eye irritation – redness, watering,
burning +
77 Chest pain 78 Sleeping a lot + 79 Hoarse voice + + 80 Loss of appetite + 81 Stiffness in the muscles + 82 Speeding up of heart beats 83 Wheezing chest + +
227

Appendix 42 Case definitions derived a priori from the Health questionnaire (II)
In the past four weeks have you been troubled by the following
Pyrethroid Effects
Cholinergic effects
Mood Depression
Joint pain/ Stiffness
1 Fever 2 Paleness of the skin 3 Trouble sleeping + 4 Sore throat 5 Pins and needles + 6 Mouth ulcers 7 Forgetting things + 8 Feeling down or depressed + 9 Blurred vision + 10 Coughing + 11 Diarrhoea + 12 Earache 13 Bothered by the smell of perfume or
aftershave 14 Ankle swelling 15 Shivering 16 Headache + + 17 Muscle twitching + 18 Sweating (without physical exercise) + 19 Stiffness in the joints + 20 Ringing or buzzing in the ears 21 Feeling hot or cold 22 Waking up feeling tired and worn out + 23 Stomach pain + 24 Reddening of the face or neck
(flushing) +
25 Problems seeing + 26 Sleep walking 27 Nausea – feeling sick + 28 Sore hands + 29 General aches and pains 30 Light headedness 31 Runny nose + 32 Difficulty getting an erection 33 Coughing up phlegm + 34 Numbness of toes 35 Heartburn 36 Pain in your muscles 37 Hallucinating 38 Peeling or flaky skin 39 Upset stomach 40 Tingling of toes + 41 Losing track of time 42 Nosebleeds
228

43 Weeping for no apparent reason + 44 Feeling dizzy 45 Tiredness + 46 Dry mouth 47 Problems with judging distance 48 Skin eruptions + 49 Coughing up blood 50 Experiencing difficulty speaking 51 Generally feeling unwell + + 52 Vomiting – being sick + 53 Feeling of weakness in muscles + 54 Loss of sexual appetite 55 Pain in your joints + 56 Difficulty breathing + 57 Shakiness 58 Losing the thread of your thoughts + 59 Feeling lethargic, or slowed down
generally +
60 Feeling of weakness + 61 Increased sensitivity for smell of
sheep dip chemicals 62 Stomach cramps + 63 Feeling aggressive 64 Sore feet 65 Tight feeling in the upper part of the
stomach 66 Increased saliva in the mouth + 67 Stuffy or blocked nose 68 Experiencing difficulty reading + + 69 Bluish discolouration of parts of the
skin 70 Inability to control bowel movements + 71 Itching or skin rashes + 72 Feeling irritated for no particular
reason +
73 Cramps other than in the stomach 74 Sneezing 75 Slowing down of heart beat + 76 Eye irritation – redness, watering,
burning +
77 Chest pain 78 Sleeping a lot + 79 Hoarse voice 80 Loss of appetite + 81 Stiffness in the muscles 82 Speeding up of heart beats + 83 Wheezing chest +
229

Appendix 43 Published case definitions identified in the Health questionnaire (I)
Q In the past four weeks have you been troubled by the following
Pesticide Symptoms
Somatic symptoms
COPIND
1 Fever + 2 Paleness of the skin 3 Trouble sleeping 4 Sore throat 5 Pins and needles + 6 Mouth ulcers 7 Forgetting things + 8 Feeling down or depressed 9 Blurred vision + 10 Coughing 11 Diarrhoea + 12 Earache 13 Bothered by the smell of perfume or
aftershave +
14 Ankle swelling 15 Shivering 16 Headache + 17 Muscle twitching 18 Sweating (without physical exercise) + 19 Stiffness in the joints 20 Ringing or buzzing in the ears 21 Feeling hot or cold + + 22 Waking up feeling tired and worn out + 23 Stomach pain 24 Reddening of the face or neck (flushing) 25 Problems seeing + 26 Sleep walking 27 Nausea – feeling sick + 28 Sore hands 29 General aches and pains + 30 Light headedness + + 31 Runny nose + 32 Difficulty getting an erection 33 Coughing up phlegm 34 Numbness of toes + 35 Heartburn + 36 Pain in your muscles + 37 Hallucinating 38 Peeling or flaky skin 39 Upset stomach + 40 Tingling of toes + 41 Losing track of time 42 Nosebleeds 43 Weeping for no apparent reason
230

44 Feeling dizzy + + 45 Tiredness + 46 Dry mouth 47 Problems with judging distance 48 Skin eruptions 49 Coughing up blood 50 Experiencing difficulty speaking + 51 Generally feeling unwell 52 Vomiting – being sick 53 Feeling of weakness in muscles + 54 Loss of sexual appetite 55 Pain in your joints + 56 Difficulty breathing + + 57 Shakiness 58 Losing the thread of your thoughts + + 59 Feeling lethargic, or slowed down
generally +
60 Feeling of weakness 61 Increased sensitivity for smell of sheep
dip chemicals +
62 Stomach cramps 63 Feeling aggressive 64 Sore feet 65 Tight feeling in the upper part of the
stomach 66 Increased saliva in the mouth 67 Stuffy or blocked nose 68 Experiencing difficulty reading + 69 Bluish discolouration of parts of the skin 70 Inability to control bowel movements 71 Itching or skin rashes 72 Feeling irritated for no particular reason 73 Cramps other than in the stomach 74 Sneezing 75 Slowing down of heart beat 76 Eye irritation – redness, watering, burning 77 Chest pain + 78 Sleeping a lot 79 Hoarse voice 80 Loss of appetite 81 Stiffness in the muscles 82 Speeding up of heart beats 83 Wheezing chest
231

Appendix 44 Published case definitions identified in the Health questionnaire (II)
Q In the past four weeks have you been IOH Factor troubled by the following 1 2 3
1 Fever 2 Paleness of the skin + 3 Trouble sleeping 4 Sore throat 5 Pins and needles 6 Mouth ulcers 7 Forgetting things 8 Feeling down or depressed + 9 Blurred vision 10 Coughing 11 Diarrhoea + 12 Earache 13 Bothered by the smell of perfume or
aftershave 14 Ankle swelling + 15 Shivering 16 Headache 17 Muscle twitching 18 Sweating (without physical exercise) + 19 Stiffness in the joints 20 Ringing or buzzing in the ears 21 Feeling hot or cold 22 Waking up feeling tired and worn out 23 Stomach pain + 24 Reddening of the face or neck (flushing) 25 Problems seeing 26 Sleep walking 27 Nausea – feeling sick + 28 Sore hands + 29 General aches and pains + 30 Light headedness + 31 Runny nose 32 Difficulty getting an erection 33 Coughing up phlegm 34 Numbness of toes + 35 Heartburn 36 Pain in your muscles 37 Hallucinating + 38 Peeling or flaky skin 39 Upset stomach + 40 Tingling of toes 41 Losing track of time 42 Nosebleeds + 43 Weeping for no apparent reason +
232

44 Feeling dizzy + 45 Tiredness 46 Dry mouth + 47 Problems with judging distance 48 Skin eruptions 49 Coughing up blood + 50 Experiencing difficulty speaking 51 Generally feeling unwell 52 Vomiting – being sick + 53 Feeling of weakness in muscles 54 Loss of sexual appetite 55 Pain in your joints 56 Difficulty breathing 57 Shakiness + 58 Losing the thread of your thoughts 59 Feeling lethargic, or slowed down
generally +
60 Feeling of weakness 61 Increased sensitivity for smell of sheep
dip chemicals 62 Stomach cramps 63 Feeling aggressive + 64 Sore feet 65 Tight feeling in the upper part of the
stomach +
66 Increased saliva in the mouth 67 Stuffy or blocked nose 68 Experiencing difficulty reading + 69 Bluish discolouration of parts of the skin 70 Inability to control bowel movements 71 Itching or skin rashes 72 Feeling irritated for no particular reason 73 Cramps other than in the stomach 74 Sneezing 75 Slowing down of heart beat 76 Eye irritation – redness, watering, burning 77 Chest pain 78 Sleeping a lot + 79 Hoarse voice 80 Loss of appetite + 81 Stiffness in the muscles 82 Speeding up of heart beats 83 Wheezing chest
233

234

REFERENCES
Arnold, E. 1990. Cyromazine Pesticide residues in food:1990 evaluations Toxicology. Available from http://www.inchem.org/documents/jmpr/jmpmono/v90pr06.htm. Accessed 26/9/2008
Ballantyne, B. & Marrs, T.C. eds., 1992. Clinical and experimental toxicology of organophosphates and carbamates. London: Butterworth Heinemann.
Barabás, K. 1998. Diazinon: IPCS environmental health criteria 198. Geneva: IPCS/WHO. Available form http://www.inchem.org/ documents/ehc/ehc/ehc198.htm. [Accessed 26/9/2008].
Baxter, P.J., Adams P.H., Aw, T.C., Cockcroft, A. & Harrington, J.M. eds., 2000. Hunter’s diseases of occupations. 9th ed. London: Arnold.
Booth, N.J. & Lloyd, K. 1999. Stress in farmers. Int J Psychiatry, 46, 67-73.
Bradberry, S.M., Cage, S.A., Proudfoot, A.T. & Vale, J.A. 2005. Poisoning due to pyrethroids. Toxicol Rev , 24, 93-106.
Buchanan, D., Pilkington, A., Sewell, C., Tannahill, S.N., Kidd, M.W., Cherrie, B. & Hurley, J.F. 2001. Estimation of cumulative exposure to organophosphate sheep dips in a study of chronic neurological health effects among United Kingdom sheep dippers. Occup Environ Med, 58, 694-701.
Cage, S.A., Bradberry, S.M., Meacham, S. & Vale, J.A. 1998a. Alpha-Cypermethrin. IPCS Intox Databank UKPID Monograph. Available from http://www.intox.org/databank/documents/chemical/cypermet/ukpid32.htm [Accessed 24/9/2008]
Cage, S.A., Bradberry, S.M., Meacham, S. & Vale, J.A. 1998b. Deltamethrin IPCS Intox Databank UKPID Monograph. Available from: http://www.intox.org/databank/documents/chemical/deltamet/ukpid62.htm [Accessed 24/9/2008]
Communicable Disease Report Weekly 2005. 15 (40). Available from http://www.hpa.org.uk/cdr/archives/2005/cdr4005.pdf Accessed 26/9/2008
Communicable Disease Report Weekly 2006. 16 (14) Available from http://www.hpa.org.uk/cdr/archives/2006/cdr1406.pdf Accessed 26/9/2008.
Chamberlain, P.L. 2006. Toxicological evaluation of certain veterinary drug residues in food. Doramectin WHO JEFCA food additives series 49. Available from http://www.inchem.org/documents/jecfa/jecmono/v49je02.htm Accessed 24/9/2008
Chen, S.Y., Zhang, Z.W., He, F.S., Yao, P.P., Wu, Y.Q., Sun, J.X., Liu, L.H. & Li, Q.G. 1991. An epidemiological study on occupational acute pyrethroid poisoning in cotton farmers. Brit J Ind Med, 48, 77-81.
Cocker, J., Mason, H.J., Garfitt, S.J. & Jones, K. 2002. Biological monitoring of exposure to organophosphate pesticides. Tox Lett, 134, 97-103.
235

Committee on Toxicity of Chemicals in Food, Consumer Products and the Environment. 1999. Report on Organophosphates. London: Department of Health.
Cook, R.R. 1992. Health effects of organophosphate sheep dips. Brit Med J, 305, 1502-3.
Cookson, W.O., Craddock, C.F., Benson, M.K., & Durham, S.R. 1989. Falls in peripheral eosinophil counts parallel the late asthmatic response. Am Rev Respir Dis, 139, 458-62.
Cooper, J.F., Weary, M.E. & Jordan, F.T. 1997. The impact of non-endotoxin LAL-reactive materials on Limulus Amebocyte Lysate analysis. PDA J Pharm Sci Technol, 51, 2-6.
Das, P.K. & Liddell, J. 1970. Value of butyrylcholinesterase assay for identification of cholinesterase variants. J Med Genetics, 7, 351-5.
Davenport, A. 2003. Clinical investigation of renal disease. In: Warrell D.A., Cox, T.M., Firth, J. & Benz, E.J. eds. Oxford textbook of medicine. 4th ed. Oxford: Oxford University Press. pp 235 – 247.
Davies, D.R. 1995. Organophosphates, affective disorders and suicide. J Nutrition Env Med , 5, 367-74.
Davies, D.R., Ahmed, G.M & Freer, T. 1999. Chronic organophosphate induced neuropsychiatric disorder (COPIND): results of two postal questionnaire surveys. J Nutr Environ Med, 9, 123-34.
Department for Environment, Food and Rural Affairs. 2005. Agriculture in the UK 2005 Available from https://statistics.defra.gov.uk/esg/publications/auk/2005/Chapter3.pdf Accessed 26/9/2008.
Department for Environment, Food and Rural Affairs. 2006. Zoonoses report, United Kingdom 2006. Available from http://www.defra.gov.uk/animalh/diseases/zoonoses/zoonoses_reports/zoonoses2006.pdf Accessed 26/9/2008.
Department for Environment, Food and Rural Affairs 2008. Historical Data. Available from . http://www.defra.gov.uk/esg/work_htm/publications/cs/farmstats_web/2_SURVEY_DATA_ SEARCH/HISTORICAL_DATASETS/HISTORICAL_DATASETS/PIG/PIG_83-2005_UK.XLS Accessed 26/9/2008.
Desai, S., Zhao, H., Cooke, M.K., Joseph, C.A., Ellis, J., Zambon, M., Fleming, D.M., & Watson, J.M. 2006. Surveillance of influenza and other respiratory viruses in the United Kingdom: October 2005 to May 2006. CDR Weekly Supplement. Available from http://www.hpa.org.uk/cdr/archives/2006/flu_2006.pdf Accessed 26/9/2008
Diel, F., Detscher, M., Schock, B. & Ennis, M. 1998. In vitro effects of the pyrethroid Sbioallethrin on lymphocytes and basophils from atopic and nonatopic subjects. Allergy, 53, 1052-9.
DoctorMyhill.co.uk. 2006. Organophosphate Poisoning – symptoms and treatment. Available from http://www.drmyhill.co.uk/article.cfm?id=291 Accessed 26/9/2008.
Donham, K., Haglind, P., Peterson, Y., Rylander, R. & Belin, L. 1989. Environmental and health studies of farm workers in Swedish swine confinement buildings. Brit J Ind Med, 46, 31-7.
236

Douwes, J., Mannetje, A. & Heederik D. 2001. Work related symptoms in sewage treatment workers. Ann Agric Environ Med, 8, 39-45.
Eisner, C.S., Neal, R.D. & Scaife, B. 1998. Depression and anxiety in farmers. Prim Care Psychiatry, 4, 101-5.
Ellman ,G.L., Courtney, K.G. Andres, V. Jr & Feather-Stone, R.M. 1961. A new and rapid colorimetric determination of acetylcholinesterase activity. Biochem pharmaco, 7, 88-95.
Epstein, Y., Keren, G., Udassin, R. & Shapiro, Y. 1981. Way of life as a determinant of physical fitness. Eur J Appl Physiol Occup Physiol, 4,1-5
Fletcher, T., MacLehose, R., Hurley, F., Cherrie, J. Cowie, H., Jamal, G. & Julu, P. 2005. SHAPE: Survey of Health and Pesticide Exposure: the telephone survey. Available from http://cot.food.gov.uk/pdfs/tox200721researchreports.pdf Accessed 26/9/2008
Foudrinier, F., Villena, I., Jaussaud, R., Aubert, D., Chemla, C., Martinot, F. & Pinon, J.M. 2003. Clinical value of specific immunoglobulin E detection by enzyme-linked immunosorbent assay in cases of acquired and congenital toxoplasmosis. J Clin Microbiol, 41, 1681-6.
Gallo, M.A. & Lawryk, N.J. 1991 Organic Phosphorus Pesticides. In: Hayes, W.J. & Laws, E.R. Jnr. eds., Handbook of pesticide toxicology, Volume 2. London: Academic Press. pp 917-1053.
Garfitt, S.J., Jones, K., Mason, H.J. & Cocker, J. 2002. Exposure to the organophosphate diazinon: data from a human volunteer study with oral and dermal doses. Tox Lett, 134, 10513.
Gerrard, C.E. 1998. Farmers’ occupational health: cause for concern, cause for action. J Adv Nursing, 28,155-63.
Greenland, S., Schwartzbaum, J. A. & Finkle, W.D. 2000. Problems due to small samples and sparse data in conditional logistic regression analysis. Am J Epidemiol, 151, 531-9.
Gregus, Z. & Klaassen, C.D. 2001. Mechanisms of toxicity. In Klaassen, C.D. (ed) Casarett and Doull’s toxicology. 6th ed. London: McGraw-Hill. pp. 35 – 82.
Gwlad 2007. Advice needed on the correct treatments for external parasites in sheep. Gwlad 64, pp 19. Available from http://new.wales.gov.uk/depc/publications/environmentandcountryside/farmingandcountrysid e/gwlad/gwlad64-e.pdf?lang=en Accessed 26/9/2008
Hamscher, G., Pawelzick, H.T., Sczesny, S., Nau, H., & Hartung, J. 2003. Antibiotics in dust originating from a pig-fattening farm: a new source of health hazard for farmers? Environ Health Perspect, 111, 1590-4.
Hardt, J. & Angerer, J. 2003. Biological monitoring of workers after the application of insecticidal pyrethroids. Int Arch Occup Environ Health, 76, 492-8.
He, F., Wang, S., Liu, L., Chen, S., Zhang, Z., & Sun, J. 1989. Clinical manifestations and diagnosis of acute pyrethroid poisoning. Arch Toxicol, 63, 54-8.
237

Health and Safety Laboratory 2005. Guidance on Laboratory Techniques in Occupational Medicine. Tenth Edition. Sheffield: HSL.
Heath, A.C., Cooper, S.M., Cole, D.J. & Bishop, D.M. 1995. Evidence for the role of the sheep biting-louse Bovicola ovis in producing cockle, a sheep pelt defect. Vet Parasitol, 59, 53-8.
Health Protection Agency. 2008. Laboratory reports of faecal isolates reported to the Health Protection Agency Centre for Infections by month England and Wales 1992 – 2006. Available from http://www.hpa.org.uk/webw/HPAweb&HPAwebStandard/HPAweb_C/1195733758997?p=1 191857566471 Accessed 24/9/2008
Hazardous Substance Database 2003. Cyromazine. Available from http://toxnet.nlm.nih.gov/cgi-bin/sis/search/f?./temp/~krZUvY:1 Accessed 26/9/2008
Jackson, C.A. & Spurgeon, A. 2001. Symptom reporting following occupational exposure to organophosphate pesticides in sheep dip. Contract research report 371/2001. London: HSE.
Jamal, G.A., Hansen, S. & Julu, P.O. 2002. Low level exposures to organophosphorus esters may cause neurotoxicity. Toxicology, 181, 23-33.
Karalliedde, L., Feldman, S., Henry, J. & Marrs, T. eds., 2001. Organophosphates and health. London: Imperial College Press.
Klaassen, C.D. ed., 2001. Casarett and Doull’s toxicology. 6th ed. London: McGraw-Hill.
Krieger, R.I. ed., 2001. Handbook of pesticide toxicology. 2nd ed. London: Academic Press.
Lakka, T.A, Kauhanen, J. & Salonen, J.T. 1996. Conditioning leisure time physical activity and cardiorespiratory fitness in sociodemographic groups of middle-aged men in eastern Finland. Int J Epidem, 25, 86-93.
Lantero, S., Spallarossa, D., Silvestri, M., Sabatini, F., Scarso, L., Crimi, E., & Rossi, G.A. 2002. In allergic asthma experimental exposure to allergens is associated with depletion of blood eosinophils overexpressing LFA-1. Allergy, 57, 1036–43.
Lessenger, J.E. 2005. Fifteen years of experience in cholinesterase monitoring of insecticide applicators. J Agromedicine, 10, 49-56.
Leverton, K., Cox, V., Battershill, J. & Coggon, D. 2007. Hospital admission for accidental pesticide poisoning among adults of working age in England, 1998 – 2003. Clin Toxicol 45, 594-7.
Levin, J. & Bang, F. 1968. Clottable protein in Limulus: its localisation and kinetics of its coagulation by endotoxin. Thromb Diath Haemorrh 19, 186.
Liddell, J.S. 2000. Sheep ectoparasite use in the UK 1993, 1997 and 1999. Proceedings of the 5th international sheep veterinary congress. Stellenbosch: Stellenbosch University.
Llewellyn, D.M., Brazier, A., Brown, R., Cocker, J., Evans, M.L., Hampton, J., Nutley, B.P. & White J. 1996. Occupational exposure to permethrin during its use as a public hygiene insecticide. Ann Occup Hyg, 40, 499-509.
238

Mason, H.J. & Lewis, P.J. 1989. Intra-individual variation in plasma and erythrocyte cholinesterase activities and the monitoring of uptake of organophosphate pesticides. J Soc Occup Med, 39, 121-4.
Meier, E.P., Dennis, W.H., Rosencrance, A.B., Randall, W.F., Cooper, W.J. & Warner, M.C. 1979. Sulfotepp: a toxic impurity in formulations of diazinon. Bull Environ Contam Toxicol 23, 158-64.
Moffatt, S., Mulloli, T.P., Bhopal, R., Foy, C. & Phillimore, P. 2000. An exploration of awareness bias in two environmental epidemiology studies. Epidemiology, 11, 199-208.
Murray, V.S.G., Wiseman, H.M., Dawling, S., Morgan, I. & House I.M. 1992. Health effects of organophosphate sheep dips. Brit Med J 305, 1090.
Neubauer, O., Konig, D. & Wagner, K.H. 2008. Recovery after an Ironman triathlon: sustained inflammatory responses and muscular stress. Eur J Appl Physiol , 104, 417-26.
Nieuwenhuijsen, M.J., Noderer, K.S, Schenker, M.B., Vallyathan, V. & Olenchock, S. 1999. Personal exposure to dust, endotoxin, and crystalline silica in California agriculture. Annals Occ Hygiene, 43, 35-42.
Niven, K., Scott, A.J., Hagen, S., Waclawski, E.R., Lovett, M.R., Cherrie, B., Bodsworth, P.L., Robertson, A., Elder, A., Cocker, I., Nutley, B. & Roff, M. 1993. Occupational hygiene assessment of sheep dipping practices and processes. TM/93/03 Edinburgh: Institute of Occupational Medicine.
Niven, K.J.M., Robertson, A., Hagen, S., Scott, A.J., Waclawski, E.R., Cherrie, B., Topliss, R., Lovett, M.R., Bodsworth, P.L. & Mcwilliam M. 1996. Occupational hygiene assessment of exposure to insecticides and the effectiveness of protective clothing during sheep dipping operations. TM/94/04. Edinburgh: Institute of Occupational Medicine.
National Office of Animal Health. 2000. Compendium of data sheets for veterinary products. London: Datapharm Publications Ltd.
Nutley, B.P. & Cocker, J. 1993. Biological monitoring of workers occupationally exposed to organophosphorus pesticides. Pesticide Sci, 38, 315-22.
Ohayo-Mitoko, G.J.A., Kromhout, H., Simwa, J.M., Boleij, J.S. & Heederik, D. 2000. Self reported symptoms and inhibition of acetylcholinesterase activity among Kenyan agricultural workers. Occup Env Med, 57, 195-200.
Parkes W.R. ed., 1994. Occupational lung disorders. London: Butterworth-Heinemann.
Parry, J., Barnes, H., Lindsey, R. & Taylor, R. 2005. Farmers, farm workers and work-related stress. HSE research report 362. London: HSE.
Pepys M.B. 2003. The acute phase response and C-reactive protein. In Warrell D.A., Cox, T.M., Firth, J. & Benz, E.J. eds., Oxford textbook of medicine. 4th ed. Oxford: OUP. pp. 1506.
Perkio-Makela, M.M. 2000. Finnish farmer’s self-reported morbidity, work ability, and functional capacity. Ann Agric Environ Med, 7, 11-6.
239

Petrie, K.J., Broadbent, E.A., Kley, N., Moss-Morris, R., Horne, R. & Rief, W. 2005. Worries about modernity predict symptom complaints after environmental pesticide spraying. Psychosom Med, 67, 778-82.
Pilkington, A., Buchanan, D., Jamal, G.A., Gillham, R., Hansen, S., Kidd, M., Hurley. J.F. & Soutar, C.A. 2001. An epidemiological study of the relations between exposure to organophosphate pesticides and indices of chronic peripheral neuropathy and neuropsychological abnormalities in sheep farmers and dippers. Occup Environ Med, 58, 70210.
Pomorska, D., Larsson, L., Skórska, C., Sitkowska, J. & Dutkiewicz, J. 2007. Levels of bacterial endotoxin in air of animal houses determined with the use of gas chromatography – mass spectroscopy and Limulus test. Ann Agric Environ Med, 14, 291-8.
Portengen, L., Preller, L., Tielen, M., Doekes, G. & Heederik, D. 2005. Endotoxin exposure and atopic sensitisation in adult pig farmers. J Allegy Clin Immunol, 115, 797-802.
Ray, D. 1998. Organophosphorus esters: an evaluation of chronic neurotoxic effects. Leicester: Institute for Environment and Health.
Rees, H. 1996. Exposure to sheep dip and the incidence of acute symptoms in a group of Welsh sheep farmers. Occup Env Med, 53, 258-63.
Reynolds S.J., Donham K.J. Stookesberry, J., Thorne, P., Subramanian, P., Thu, P. & Whitten, P. 1997. Air quality assessments in the vicinity of swine production facilities. J Agromedicine, 4, 37-45.
Ringsberg, K. 1993. Muscle strength differences in urban and rural populations in Sweden. Arch Phys Med Rehabil, 12, 1315-8
Roberts, G. 2006. Doramectin. WHO JEFCA Monograph on Food Additives 36. Available from http://www.inchem.org/documents/jecfa/jecmono/v36je02.htm Accessed 26/9/2008.
Rodgers, K.E. Devens B.H. & Imamura, T. 1992. Immunotoxic effects of anticholinesterases. In Ballantyne, B. & Marrs, C.T. eds., Clinical and experimental toxicology of organophosphates and carbamates. London: Butterworth Heinemann. pp. 211-22.
Rylander, R., Bake, B., Fischer, J.J. & Helander, I.M. 1989. Pulmonary function and symptoms after inhalation of endotoxin. Am Rev Respir Dis, 140, 981-6.
Sewell, C., Pilkington, A., Buchanan, D., Tannahill, S.N., Kidd, M.W., Cherrie, B. & Robertson, A. 1999. Epidemiological study of the relationships between exposure to organophosphate pesticides and indices of chronic peripheral neuropathy, and neuropsychological abnormalities in sheep farmers and dippers. Phase 1, development and validation of an organophosphate uptake model for sheep dippers. TM/99/02a Edinburgh: Institute of Occupational Medicine.
Sharma, R.P. & Tomar, R.S. 1992. Immunotoxicology of anticholinesterase agents. In Ballantyne, B. & Marrs, C.T. eds., Clinical and experimental toxicology of organophosphates and carbamates. London: Butterworth Heinemann. pp. 203-10.
Simkin, S., Hawton, K., Fagg, J. & Malmberg, A. 1998. Stress in farmers: a survey of farmers in England and Wales. Occup Environ Med, 58, 729-34.
240

Soliman, S.A., Sovocool, G.W., Curley, A., Ahmed, N.S., El-Fiki, S. & El-Sebae, A.K. 1982. Two human poisoning cases resulting from exposure to diazinon transformation products in Egypt. Arch Environ Health, 37, 207-12.
Solomon, C., Poole, J., Palmer, K.T., Peveler, R. & Coggon, D. 2007a. Acute symptoms following work with pesticides. Occup Environ Med, 57, 505-11.
Solomon, C., Poole J., Palmer, K.T., Peveler, R. & Coggon, D, . 2007b. Neuropsychiatric symptoms in past users of sheep dip and other pesticides. Occup Environ Med, 64, 259-66.
Stephens, R., Spurgeon, A., Beach, J., Calvert, I., Berry, H., Levy, L., & Harrington, J. 1995a. An investigation into the possible chronic neuropsychological and neurological effects of occupational exposure to organophosphates in sheep farmers. HSE contract research report 74/1995. London: HSE.
Stephens, R., Spurgeon, A., Calvert, I.A., Beach, J., Levy, L.S., Berry, H. & Harrington, J.M. 1995b. Neuropsychological effects of long-term exposure to organophosphate in sheep dip. Lancet, 345, 1135-9.
Stephens, R. & Sreenivasan, B. 2004. Neuropyscholgical effects of long-term low-level organophosphate exposure in orchard sprayers in England. Arch. Environ Health,59,566-74.
Stevens, J. & Breckenridge, C. 2001. The Avermectins: insecticidal and antiparasitic agents. In Krieger, R.I. ed., Handbook of pesticide toxicology. 2nd ed. London: Academic Press. pp. 1157-67.
Stroud, M.A. 2003. Enviromental extremes – heat. In Warrell D.A., Cox, T.M., Firth, J. & Benz, E.J. eds., Oxford textbook of medicine. 4th ed. Oxford: OUP. pp.966-7.
Sund-Levander, M., Forsberg, C. & Wahren L.K. 2002. Normal oral, rectal, tympanic and axillary body temperature in adult men and women: a systematic literature review. Scand J Caring Sci, 16, 122-8.
Szczepura A., Gumber A., Clay, D., Davies, R., Elias, P., Johnson, M., Walker, I. & Owen, D. 2004. Review of the occupational health and safety of Britain’s ethnic minorities. HSE research report 221. London: HSE.
Tahmaz, N., Soutar, A. & Cherrie, J.W. 2003. Chronic fatigue and organophosphate pesticides in sheep farming. Ann Occ Hyg, 47, 261-7.
Thomas, H.V., Lewi,s G,. Thomas, D.R., Salmon, R.L., Chalmers, R.M., Coleman, T.J., Kench, S.M., Morgan-Capner, P., Meadows, D., Sillis, M. & Softley, P. 2003. Mental health of British farmers. Occup Environ Med, 60, 181-6.
Thorn, J. & Rylander, R. 1998. Inflammatory response after inhalation of bacterial endotoxin assessed by the induced sputum technique. Thorax, 53, 1047-52.
Trainor, M., Mason, H., Cocker, J., Chambers, H., Guiver, R. & Wright, S. 2002. Risk assessment for acute toxicity from sheep ectoparasite treatments, including organophosphates (OP’s) used in plunge dipping. HSL/2002/26. Sheffield: Health and Safety Laboratory.
UK Biobank. 2006. Report of the integrated pilot phase. http://www.ukbiobank.ac.uk/docs/IntegratedPilotReport.pdf. Last accessed 29/04/09.
241

United Nations Environment Programme/ International Labour Organisation/World Health Organisation. 1986. Environmental Health Criteria 63, organophosphorous insecticides. Geneva: WHO.
Veterinary Medicines Directorate. 2003. Veterinary medicinal products authorised in the UK for use against ectoparasites in sheep. Surrey: Veterinary Medicines Directorate .
Veterinary Medicines Directorate. 2004. Veterinary medicinal products authorised in the UK for use against ectoparasites in sheep. Surrey: Veterinary Medicines Directorate.
Veterinary Medicines Directorate. 2005. Veterinary medicinal products authorised in the UK for use against ectoparasites in sheep. Surrey: Veterinary Medicines Directorate .
Veterinary Medicines Directorate. 2006. Veterinary medicinal products authorised in the UK for use against ectoparasites in sheep. Surrey: Veterinary Medicines Directorate .
Veterinary Medicines Directorate. 2008. Suspected Adverse Reaction Surveillance Scheme Available from http://www.vmd.gov.uk/human.DOC Accessed 26/9/2008
Veterinary Products Committee. 2003. Appraisal Panel for Human Suspected Adverse Reactions to Veterinary Medicines Annual Report 2003. Available from http://www.vpc.gov.uk/Public/AR/vpcapar03.pdf . Accessed 26/9/2008
Waclawski, E.R., Cullen, R.T., Niven, K.J.M. & Brown, D.M. 1994. A pilot study to investigate exposure to endotoxin in farmworkers performing sheep dipping. TM/94/02 Edinburgh: Institute of Occupational Medicine.
Warburton, D.E., Welsh, R.C., Haykowsky, M.J., Taylor, D.A. & Humen, D.P. 2002. Biochemical changes as a result of prolonged strenuous exercise. Brit J Sports Med, 36, 3013.
Warrell D.A., Cox, T.M., Firth, J. & Benz, E.J. eds., 2003. Oxford textbook of medicine. 4th
ed. Oxford: OUP.
Weatherall D.J. 2002. Disorders of the blood, introduction. In: Warrell D.A., Cox, T.M., Firth, J. & Benz, E.J. eds., Oxford textbook of medicine. 4th ed. Oxford: Oxford University Press. pp. 501–7.
World Health Organisation. 2006. Ivermectin JEFCA Monograph on Food Additives 27. Available from http://www.inchem.org/documents/jecfa/jecmono/v27je03.htm. Accessed 26/9/2008
Woodward, K. 2006. Moxidectin WHO JEFCA Monograph on Food Additives 36 Available from http://www.inchem.org/documents/jecfa/jecmono/v36je03.htm. Accessed 26/9/2008.
Woollen, B.H., Marsh, J.R., Laird, W.J. & Lesser, J.E. 1992. The metabolism of cypermethrin in man: differences in urinary metabolite profiles following oral and dermal administration. Xenobiotica. 22, 983-91.
Zejda, J.E., Barber, E., Dosman, J.A., Olenchock, S.A., McDuffie, H.H., Rhodes, C. & Hurst, T. 1994. Respiratory health status in swine producers relates to endotoxin exposure in the presence of low dust levels. J Occup Med, 36 49-56.
Zhou, Z.J., Zheng, J., Wu, Q.E. & Xie, F. 2007. Carboxylic esterase and its associations with long-term effects of organophosphorus pesticides. Biomed Environ Sci 20, 284-90.
Published by the Health and Safety Executive 01/10

Executive Health and Safety
Prospective cohort study of sheep dip exposure and ‘dipper’s flu’
A prospective study was carried out to investigate the nature, frequency and signs of ill-health among farmers treating sheep for ectoparasites. Farmers were interviewed by a study nurse before and after treatment and also kept a symptom diary and measured their body temperature for 7 days following treatment. Blood and urine samples were collected. Blood samples were analysed for butyrylcholinesterase activity, clinical biochemistry and haematology parameters as well as serology for infectious pathogens. Urine samples were analysed for pesticide metabolites. Farmers reporting and not reporting symptoms following treatment were compared to examine the extent to which pesticide and other exposures were associated with ill-health.
This report and the work it describes were funded by the Health and Safety Executive (HSE). Its contents, including any opinions and/or conclusions expressed, are those of the authors alone and do not necessarily reflect HSE policy.
RR775
www.hse.gov.uk