Property tax in changing environment: Selected state studies.
316
AN INFORMATION REPORT SELECTED STATE STUDIES ADVISORY COMMISSION ON INTERGOVERNMENTALRELATIONS WMI)(IWQy PC, MARCH 1074 M-83
-
Upload
khangminh22 -
Category
Documents
-
view
0 -
download
0
Transcript of Property tax in changing environment: Selected state studies.

AN INFORMATION REPORT
SELECTED STATE STUDIES
ADVISORY COMMISSION ON INTERGOVERNMENTAL RELATIONS W M I ) ( I W Q y PC, MARCH 1074
M-83


AN INFORMATION REPORT
-
SELECTED STATE STUDIES
ADVISORY COMMISSION ON INTERGOVERNMENTAL RELATIONS WASHINQTON, D.C. MARCH, 1974
M-83'
For sale by the Superintendent of Documents. US. Government Printing ORice
Washington. D.C. 20402 - Price $3.60 Stock Number 5204-00057


PREFACE
This report, like its predecessor of over a decade ago, The Role of the States in Strengthening the Property Tax, and the recent action packet The Property Tax-Reform and Relief deals exclusively with the property tax and how it is administered. While questionnaire evidence which we have reported in Revenue Sharing and Taxes -A Survey of Public Attitude and Financing Schools and Property Tax Relief: A State Responsibility indicate that the property tax is the least popular of all major tax sources, this tax still generates nearly $50 billion in revenue annually. Most efforts to shift a large portion of the tax load from property to income and sales have not been successful so it is clear that the property tax will remain the primary revenue source for local governments in years to come.
Additional motivation for doing this study comes from several sources. Because the property tax is such a basic part of our present system of fiscal federalism, ACIR con- tinually monitors State action in this area. Since many of the changes in recent years run in opposition to the public's disenchantment with the property tax, it was felt that an up- dating of a 1963 State-by-State report on recent changes in property tax administration was particularly appropriate. Moreover significant reform is taking place. Thus we wish to share some of the important changes and rich diversity of our Federal system.
This report is also an outgrowth of the President's request to ACIR in his State of the Union message of January 20, 1972 that we study ways to improve the financing of public schools.
Thus this report is designed to reaffirm the Commission's 1963 recommendations on property tax reform that call on States to strengthen assessment administration so as to make the tax a more effective and equitable instrument of local government; and it is designed to report on the progress of selected States in changing their property tax struc- tures.
Robert E. Merriam Chairman
iii

ACKNOWLEDGMENTS
Like most ACIR research reports, this study was prepared by the Commission staff who in this instance were assisted by State practitioners. Jacob M. Jaffe guided the project until his retirement in June 1973. Various portions of the study were written by John 0. Behrens, Robert E. Berney, Jacob M. Jaffe, and Allen D. Manvel and the statistical tables were prepared by Frank Tippett. Organization and editing of the report in its final form was done by Robert E. Berney. Overall supervision was provided by John Shannon, As- sistant Director.
The Commission appreciates the assistance of the following persons who supplied data, made helpful suggestions and/or reviewed the individual State commentaries:
Karen Baker, Minnesota Department of Taxation. E. D. Ballard, Director, Property and Inheritance Tax, State of Kentucky. Warren H. Barton, Director, Operations, Pennsylvania State Tax Equalization Board. Joe T. Burlingame, former Director, Assessment Coordination Division, Arkansas
Public Service. T. S. Cady, Administrative Assistant, Washington Department of Revenue. Raymond E. Carper, Property Tax Administrator, State of Colorado. Freely B. Cook, Director, Division of Property Tax Assessments, State of Tennessee. J. Morley Cooper, Chairman, Montana Board of Equalization. Wallace 0. Dahl, Director, Research and Planning Division, Minnesota Department of
Taxation. Werner W. Doering, Special Assistant to the Administrator, Division of State/Local
Finance, Wisconsin Department of Revenue. S. Robert Dozier, State Assessor, Alaska Department of Community and Region Af-
fairs. Allan E. Garber, Assessment and Equalization Supervisor, Illinois Department of
Local Government Affairs. Sidney Glaser, Director, New Jersey Division of Taxation. James W. Guest, Director, Bureau of Policy Planning and Information, Pennsylvania
Department of Community Affairs. W. B. Harvie, Division of Research, Department of Taxation, Commonwealth of
Virginia. William G. Herzel, Director, Program and Research Staff, Kentucky Department of
Revenue. Robert Houk, Research Director, Arizona Tax Commission. James K. Hunter, Jr., Director, Research and Statistics, Ohio Department of Taxation. Ernest H. Johnson, Maine State Tax Assessor. Edward W. Kane, Secretary, Michigan Tax Commission. Harry J. Loggan, Assistant Administrator, Assessment and Appraisal Division, Oregon
Department of Revenue.

Henry W. Luther, North Dakota Supervisor of Assessments. Thomas McGrath, Counsel, New York State Board of Equalization. James W. McGrew, Executive Director, Texas Research League. Stanley T. Ooska, Assistant Director, Hawaii Department of Taxation. Luther I . Passmore, Chairman, Idaho State Tax Commission. Ralph Pavek, Appraisal Supervisor, Minnesota Department of Taxation. Louis Plutzer, Minnesota Department of Taxation. Peggy Purdy, Minnesota Department of Taxation. L. L. Qualls, Legislative Economist, Florida State Senate. William H. Riley, Chief Supervisor of Assessments, Maryland Department of Assess-
ments and Taxation. Clyde B. Rose, Assistant Director for Property Taxes, Washington Department of
Revenue. Tom Sangster, Director, Property Equalization and Local Services, Georgia Depart-
ment of Revenue. Hydson C. Stansbury, Director of the Tax Research Division, North Carolina Depart-
ment of Revenue. Professor Frederick D. Stocker, Ohio State University. Carrol H. Stough, Ad Valorem Division, Alabama Department of Revenue. Hollis A. Swett, Director, Property Valuation Division, New York State Board of
Equalization and Assessment. John F. Tarrant, Director of Research, Connecticut Tax Department. Ronald B. Welch, Assistant Executive Secretary for Property Taxes, California State
Board of Equalization. George Winckler, CAE, Director, Property Tax Division, South Dakota Department of
Revenue. Donald T. Wood, Associate Commissioner, Massachusetts Department of Corpora-
tions and Taxation.
Full responsibility for content and accuracy rests with ACIR's Taxation and Public Finance Staff.
William R. MacDougall Executive Director
John Shannon Assistant Director

CONTENTS Part I
RECENT DEVELOPMENTS IN PROPERTY TAX POLICY AND ADMINISTRATION
Page
. . . . . . . . . . . . . . . . . . . . . . . . . . . . . . . . . . . . . . . . . . . . . . . Major Findings and Conclusions 1 . . . . . . . . . . . . . . . . . . . . . . . . . . . . . . . The Principal Foundations of Property Tax Reform 3
TheRecordoftheLastDecade . . . . . . . . . . . . . . . . . . . . . . . . . . . . . . . . . . . . . . . . . . . . . . . . 3 . . . . . . . . . . . . . . . . . . . . . . . . Legitimacy -The Legalization of Assessment Practices 3 . . . . . . . . . . . . . . . . . . . . . . . . Openness -Providing Full Information to the Taxpayer 13
Technical Proficiency-Assuring the Quality of Assessors . . . . . . . . . . . . . . . . . . . . . . . . . . . . . . . . . . . . . . . . . . . . . . . . . . and their Assessments 15
. . . . . . . . . . . . . . . . . . . Compassion-Reducing Extraordinary Property Tax Burdens 20 . . . . . . . . . . . . . . . . . . . . . . . . . . . . . . . . . . . . . . . . Future Prospects for Assessment Reform 21
. . . . . . . . . . . . . . . . . . . . . . . . . . . . . . . . . . . . . . . . . . . . . . . . . . The Courts as a Catalyst 23 . . . . . . . . . . . . . . . . . . . . . . . . . . . . . . . . . . . . . . . . . . . . . . . Leaders in Property Tax Reform 23
The Way We Were: Four Decades of Change in the Property Tax by Ronald B . Welch. Assistant Executive Secretary. Property Taxes. California State Board of Equalization . . . . . . . . . . . . . . . . . . . . . . . 29
PART II PROPERTY TAX DEVELOPMENTS IN SELECTED STATES
StudyMethodology . . . . . . . . . . . . . . . . . . . . . . . . . . . . . . . . . . . . . . . . . . . . . . . . . . . . . . . . . . 37 Alabama . . . . . . . . . . . . . . . . . . . . . . . . . . . . . . . . . . . . . . . . . . . . . . . . . . . . . . . . . . . . . . . . . . . 40 Alaska . . . . . . . . . . . . . . . . . . . . . . . . . . . . . . . . . . . . . . . . . . . . . . . . . . . . . . . . . . . . . . . . . . . . . 43 Arizona . . . . . . . . . . . . . . . . . . . . . . . . . . . . . . . . . . . . . . . . . . . . . . . . . . . . . . . . . . . . . . . . . . . . 47 Arkansas . . . . . . . . . . . . . . . . . . . . . . . . . . . . . . . . . . . . . . . . . . . . . . . . . . . . . . . . . . . . . . . . . . . 51 California . . . . . . . . . . . . . . . . . . . . . . . . . . . . . . . . . . . . . . . . . . . . . . . . . . . . . . . . . . . . . . . . . . 56 Colorado . . . . . . . . . . . . . . . . . . . . . . . . . . . . . . . . . . . . . . . . . . . . . . . . . . . . . . . . . . . . . . . . . . . 67 Connecticut . . . . . . . . . . . . . . . . . . . . . . . . . . . . . . . . . . . . . . . . . . . . . . . . . . . . . . . . . . . . . . . . . 72 Delaware . . . . . . . . . . . . . . . . . . . . . . . . . . . . . . . . . . . . . . . . . . . . . . . . . . . . . . . . . . . . . . . . . . . 78 Florida . . . . . . . . . . . . . . . . . . . . . . . . . . . . . . . . . . . . . . . . . . . . . . . . . . . . . . . . . . . . . . . . . . . . . 80

Georgia . . . . . . . . . . . . . . . . . . . . . . . . . . . . . . . . . . . . . . . . . . . . . . . . . . . . . . . . . . . . . . . . . . . . 86 Hawaii . . . . . . . . . . . . . . . . . . . . . . . . . . . . . . . . . . . . . . . . . . . . . . . . . . . . . . . . . . . . . . . . . . . . . 90
. . . . . . . . . . . . . . . . . . . . . . . . . . . . . . . . . . . . . . . . . . . . . . . . . . . . . . . . . . . . . . . . . . . . . . Idaho 96 . . . . . . . . . . . . . . . . . . . . . . . . . . . . . . . . . . . . . . . . . . . . . . . . . . . . . . . . . . . . . . . . . . . . . Illinois 99
Kentucky . . . . . . . . . . . . . . . . . . . . . . . . . . . . . . . . . . . . . . . . . . . . . . . . . . . . . . . . . . . . . . . . . . 104 Maine . . . . . . . . . . . . . . . . . . . . . . . . . . . . . . . . . . . . . . . . . . . . . . . . . . . . . . . . . . . . . . . . . . . . . 110 Maryland . . . . . . . . . . . . . . . . . . . . . . . . . . . . . . . . . . . . . . . . . . . . . . . . . . . . . . . . . . . . . . . . . . 116 Massachusetts . . . . . . . . . . . . . . . . . . . . . . . . . . . . . . . . . . . . . . . . . . . . . . . . . . . . . . . . . . . . . 123 Michigan . . . . . . . . . . . . . . . . . . . . . . . . . . . . . . . . . . . . . . . . . . . . . . . . . . . . . . . . . . . . . . . . . . 128 Minnesota . . . . . . . . . . . . . . . . . . . . . . . . . . . . . . . . . . . . . . . . . . . . . . . . . . . . . . . . . . . . . . . . . 135 Montana . . . . . . . . . . . . . . . . . . . . . . . . . . . . . . . . . . . . . . . . . . . . . . . . . . . . . . . . . . . . . . . . . . . 143 NewJersey . . . . . . . . . . . . . . . . . . . . . . . . . . . . . . . . . . . . . . . . . . . . . . . . . . . . . . . . . . . . . . . . 148 NewYork . . . . . . . . . . . . . . . . . . . . . . . . . . . . . . . . . . . . . . . . . . . . . . . . . . . . . . . . . . . . . . . . . . 154
. . . . . . . . . . . . . . . . . . . . . . . . . . . . . . . . . . . . . . . . . . . . . . . . . . . . . . . . . . . . . NorthCarolina 163 . . . . . . . . . . . . . . . . . . . . . . . . . . . . . . . . . . . . . . . . . . . . . . . . . . . . . . . . . . . . . . NorthDakota 169
. . . . . . . . . . . . . . . . . . . . . . . . . . . . . . . . . . . . . . . . . . . . . . . . . . . . . . . . . . . . . . . . . . . . . . Ohio 174 . . . . . . . . . . . . . . . . . . . . . . . . . . . . . . . . . . . . . . . . . . . . . . . . . . . . . . . . . . . . . . . . . . . . Oregon 182
. . . . . . . . . . . . . . . . . . . . . . . . . . . . . . . . . . . . . . . . . . . . . . . . . . . . . . . . . . . . . . Pennsylvania 189
. . . . . . . . . . . . . . . . . . . . . . . . . . . . . . . . . . . . . . . . . . . . . . . . . . . . . . . . . . . . . . SouthDakota 194 . . . . . . . . . . . . . . . . . . . . . . . . . . . . . . . . . . . . . . . . . . . . . . . . . . . . . . . . . . . . . . . . . Tennessee 198
. . . . . . . . . . . . . . . . . . . . . . . . . . . . . . . . . . . . . . . . . . . . . . . . . . . . . . . . . . . . . . . . . . . . . Texas 203 . . . . . . . . . . . . . . . . . . . . . . . . . . . . . . . . . . . . . . . . . . . . . . . . . . . . . . . . . . . . . . . . . . . Virginia 211
. . . . . . . . . . . . . . . . . . . . . . . . . . . . . . . . . . . . . . . . . . . . . . . . . . . . . . . . . . . . . . . . Washington 216 . . . . . . . . . . . . . . . . . . . . . . . . . . . . . . . . . . . . . . . . . . . . . . . . . . . . . . . . . . . . . . . . . Wisconsin 224
PART Ill MODEL LEGISLATION
Property Tax Organization and Administration . . . . . . . . . . . . . . . . . . . . . . . . . . . . . . . . . . 235 . . . . . . . . . . . . . . . . . . . . . . . . . . Assessment Notification. Review and Appeal Procedure 243
Real Estate Transfer Tax . . . . . . . . . . . . . . . . . . . . . . . . . . . . . . . . . . . . . . . . . . . . . . . . . . . . 249 Property Tax Relief for Overburdened Families
(The "Circuit Breaker) . . . . . . . . . . . . . . . . . . . . . . . . . . . . . . . . . . . . . . . . . . . . . . . . . . . 252
PART IV STATISTICAL APPENDIX
Summary Table on Data Appearing in State Reports . . . . . . . . . . . . . . . . . . . . . . . . . . . . . 260 Selected Information on Property Taxation . . . . . . . . . . . . . . . . . . . . . . . . . . . . . . . . . . . . . 264
LIST OF TABLES AND FIGURES Tables
. . . . . . . . . . . . . . . . . . . 1 State Progress in Strengthening the Property Tax. 1963-1973 4 2 Local Residential Property Assessment Levels and State
LegalStandards. 1971 . . . . . . . . . . . . . . . . . . . . . . . . . . . . . . . . . . . . . . . . . . . . . . . . . 7 . . . . . . . . . . . . . . . . . . . . . . . . . . 3 Residential Assessment Levels. 1961. 1966 and 1971 9
4 State Abandonment of Full-Value Assessmeent Standards. 1961t01971 . . . . . . . . . . . . . . . . . . . . . . . . . . . . . . . . . . . . . . . . . . . . . . . . . . . . . . . . . . . 11
5 Value Reported for Excluded (Totally Exempt) Property. by Type of Exemption. for Selected States. 1971 . . . . . . . . . . . . . . . . . . . . . . . . . . . . . . 16
... V l l l

6 Principal Features of State "Circuit-Breaker" Programs, byState,1973 . . . . . . . . . . . . . . . . . . . . . . . . . . . . . . . . . . . . . . . . . . . . . . . . . . . . . . . . 18
. . . . . . . . . . . . . . . . . . . . . 7 State Action on Property Tax Relief Plans for the Elderly 22 . . . . . . . . . . . . . . . . . 8 Selected Indicators of Property Tax Assessment Quality, 1971 24
9 Selected Indicators of Property Tax Assessment Change, 1961t01971 . . . . . . . . . . . . . . . . . . . . . . . . . . . . . . . . . . . . . . . . . . . . . . . . . . . . . . . . . . 25
. . . . . . . . . . . . . . . . . . . . . . . . . . . . . . . . . . . . . A- 1 Summary Property Tax Data, by State 260 B- 1 Key Features of the States' Property Tax Administration
. . . . . . . . . . . . . . . . . . . . . . . . . . . . . . . . . . . . . . . . . . Systems As of November 1971 264 B- 2 Who Pays the Local Property Tax? -Estimated Local
. . . . . . . . . . . . . . . . . . . . . . . . . . . . . . . . Property Tax Collections by Source, 1971 .267 B- 3 Average Effective Property Tax Rates, Existing Single-
Family Homes With FHA Insured Mortgages, 50 Largest SMSA's by Region, Selected Years, 1958-1971 . . . . . . . . . . . . . . . . . . . . . . . . . . . . . 268
B- 4 Principal State Property Tax Relief Policies for Homeowners . . . . . . . . . . . . . . and Renters-Detailed Program Features, as of January 1,1974 269
B- 5 Property Tax as a Percentage of Total State-Local Taxes, . . . . . . . . . . . . . . . . . . . . . . . . . . . . by State and Region, Selected Years, 1942-1971 277
B- 6 State-Local Property Taxes Per $1,000 of State Personal Income, by State, Selected Years, 1942-1971 . . . . . . . . . . . . . . . . . . . . . . . . . . . . . . . 278
B- 7 Per Capita State-Local Property Tax Collections-Amount and Average Rate of Increase, by State, Selected Years,1942-1971 . . . . . . . . . . . . . . . . . . . . . . . . . . . . . . . . . . . . . . . . . . . . . . . . . . . . . . 279
B- 8 Real Estate Taxes as a Percentage of Family Income, Owner- Occupied Single-Family Homes, by Income Class and by Region, 1970 . . . . . . . . . . . . . . . . . . . . . . . . . . . . . . . . . . . . . . . . . . . . . . 280
B- 9 Real Estate Taxes as a Percentage of Family Income for Elderly and Non-Elderly Single-Family Homeowners, by Income Class, 1970 . . . . . . . . . . . . . . . . . . . . . . . . . . . . . . . . . . . . . . . . . . . . . . . . . 281
B-10 Taxes Levied on Farm Real Estate as a Percentage of Total Personal Income of Farm Population, United States, 1935-1971 . . . . . . . . . . . . . . . . . . . . . . . . . . . . . . . . . . . . . . . . . . . . . . . 282
B-11 States With Differential Farmland Assessment Provisions, January1,1973 . . . . . . . . . . . . . . . . . . . . . . . . . . . . . . . . . . . . . . . . . . . . . . . . . . . . . . . 283
B-12 The Extent of Residential Assessment Variation for Property in a Single Area, 1971 . . . . . . . . . . . . . . . . . . . . . . . . . . . . . . . . . . . . . . . . . 284
B-13 The Extent of Residential Assessment Variations, l961,1966,and1971 . . . . . . . . . . . . . . . . . . . . . . . . . . . . . . . . . . . . . . . . . . . . . . . . . . . 285
B-14 State Legislation Exempting Business Personalty from Taxation or Reducing the Business Personal Property Tax, July 1,1972 . . . . . . . . . . . . . . . . 286
B-15 State and Local Real Estate Transfer Taxes, July 1,1973 . . . . . . . . . . . . . . . . . . . . . . 291
Figures
1 Legalizing The Assessment Process: One "Given" and Two Basic Choices Face State Legislatures . . . . . . . . . . . . . . . . . . . . . . . . . . . . 294
2 The Property Tax-Reform and Relief . . . . . . . . . . . . . . . . . . . . . . . . . . . . . . . . . . . . . 295 3 A Checklist for Rating State Property Tax Provisions . . . . . . . . . . . . . . . . . . . . . . . . . 296 4 Principal State Property Tax Relief Policies for
Homeowners and Renters-Growing State Concern . . . . . . . . . . . . . . . . . . . . . . . . 298


PART I
RECENT DEVELOPMENTS I N PROPERTY TAX POLICY AND ADMl NlSTRATlON
MAJOR FINDINGS AND CONCLUSIONS Some ten years ago ACIR published The Role of the States in Strengthening the Prop-
erty Tax, encouraging the States to take an active role in property tax reform. While the recommendations of that report were well received, few changes were initially forth- coming because of the political costs of tax reform. Because the property tax is essentially a local levy, State directed reform is often viewed as an infringement on the powers of local government. In addition, property tax reform invariably shifts the tax load among property owners. The achievement of uniform assessments becomes even more difficult in those jurisdictions in which farm and residential property have been assessed at a lower percentage of market value than commercial and utility property. Under such cir- cumstances, it becomes very difficult to secure the necessary political support for assess- ment reform.
Recently, however, the clamor for property tax relief and reform has reached such magnitudes that States are taking remedial action. As the Governor of Wisconsin recently said:'
Today, the State perspective on property tax reform is changing, and changing rapid- ly. In the spring of 1973, more than 30 Governors promised significant property tax re- lief in their "State of the State" messages; and many coupled this promise with pro- posals to reform the administration and incidence of the tax itself. The political and practical pressures behind these initiatives are clear: a continuing taxpayer's revolt, which has focused on the property tax because of its visibility, regressivity and in- equitable administration; a series of court decisions which has attacked the consti- tutionality of existing systems of school finance, based on the property tax; the de- mand of a growing environmental lobby for an effective State role in local land-use

decisions; the unprecedented budgetary surpluses enjoyed by many States this year, as a result of revenue sharing, inflation and an expanding economy.
These factors explain why, after a decade of relative inactivity, many States now are actively working to change their tax systems.
Improving the enforcelhent of legal standards by bringing valuation law and assess- ment practice into closer alignment. In the last decade:
l Over one-third of the States have taken action to bring their assessments up to legal standards.
F o u r States have abandoned the full-value standard for a classified system where utilities, commercial and industrial properties are assessed at higher ratios than farm and residential properties.
.Oregon and Kentucky have shown dramatic increases in their assessment sales ratios as they move toward their legally required full-value assessments.
*After making a significant increase in its assessment sales ratio approaching the constitutionally mandated fraction, Washington now will be requiring full-value assessments. North Carolina also adopted in 1973 a requirement for full-value assessments.
0 Illinois, Montana and North Carolina have rewritten the property tax provisions in their constitutions.
Opening the assessment process to public scrutiny. In the last decade:
15 States have begun to notify taxpayers of changes in assessment levels.
l Eight States have begun to notify taxpayers of appeals procedures.
l Hawaii and Idaho have established small claims procedures for taxpayer appeals.
l 18 States have either started conducting assessment-sales ratio studies or have im- proved their ratio studies.
1 7 States have enacted legislation requiring assessors to list and set values of ex- empt properties.
Improving the quality of assessors.
l 16 States now require certification of assessors or appraisers on the basis of qualify- ing examinations.
l 17 States now have assessor training programs.
l 17 States now provide technical assistance to assessors and exercise strong general supervision of assessors.
0 1 2 States have taken steps to consolidate local assessing jurisdictions in the last decade.
0 Over one-third of the States have reorganized and strengthened their property tax supervisory agencies in the last decade.
0 In 1973, Montana became the second State to centralize property tax assessment at the State level.
l The State of Maryland will take over the assessment function from the county gov- ernments by 1975.
Tax relief for those with excessive tax burdens:

Every State now has some form of tax relief for the elderly.
22 States have adopted the "circuit-breaker" form of tax relief for the elderly.
@Five States have extended "circuit-breaker" coverage for all low-income home- owners and renters.
In 1973 alone:
Nine States adopted "circuit-breaker" laws.
..Over 30 States made some improvement in their property tax relief programs.
By 1974, 30 States were financing portions of their property tax relief programs.
THE PRINCIPAL FOUNDATIONS OF PROPERTY TAX REFORM
Some ten years ago 29 recommendations were made by ACIR to the States for im- proving their property tax assessment systems. These recommendations were recently re- printed in ACIR's Real Property Tax Reform, an action packet designed to assist and en- courage the re-evaluation of existing property tax laws (See Figure 3 in Appendix B.)2 The critical elements for improving the existing property tax fall under four key headings:
1. Legitimacy-assessment practices should be legalized by either raising local as- sessment standards to the level required by law or by changing State law to vali- date current assessment practices.
2. Openness - all valuation information needed to enable the taxpayer to easily judge the fairness of his assessment should be sent to the taxpayer and a simple, informal appeal procedure should be established.
3. Technical Proficiency-the assessor should have the ability and the necessary equipment to make accurate market value estimates of all properties he is respon- sible for and he should be required to keep his assessment rolls current.
4. Compassion - tax relief for those taxpayers carrying extraordinary property tax burdens in relation to current income should be provided and financed by the State.
THE RECORD OF THE LAST DECADE
To summarize the State-by-State descriptions found in Part I1 of this report, the changes which have occurred since the publication of Volume 2 of The Role of the States in Strengthening the Property Tax are presented in Table 1. Contrary to the bad press the property tax has been receiving from many sources in recent years, this table shows that numerous improvements have been made in many States in the past decade. Considering the political and economic obstacles to reforming assessment administration, the record of change is impressive even though numerous reform measures are still required by most States to bring the property tax to an acceptable level of administration and equity.
LEGIT1 MACY-THE LEGALIZATION OF ASSESSMENT PRACTICES
A basic problem of property tax administration in most States is the divergence be- tween the assessment practice required by State constitution or statute and the practice of the local assessor. Most States require property to be assessed at market value or some specific percentage of market value. Unless required by judicial mandate or closely supervised by State authorities, local assessors have, in general, listed properties signifi- cantly below what is required by law.
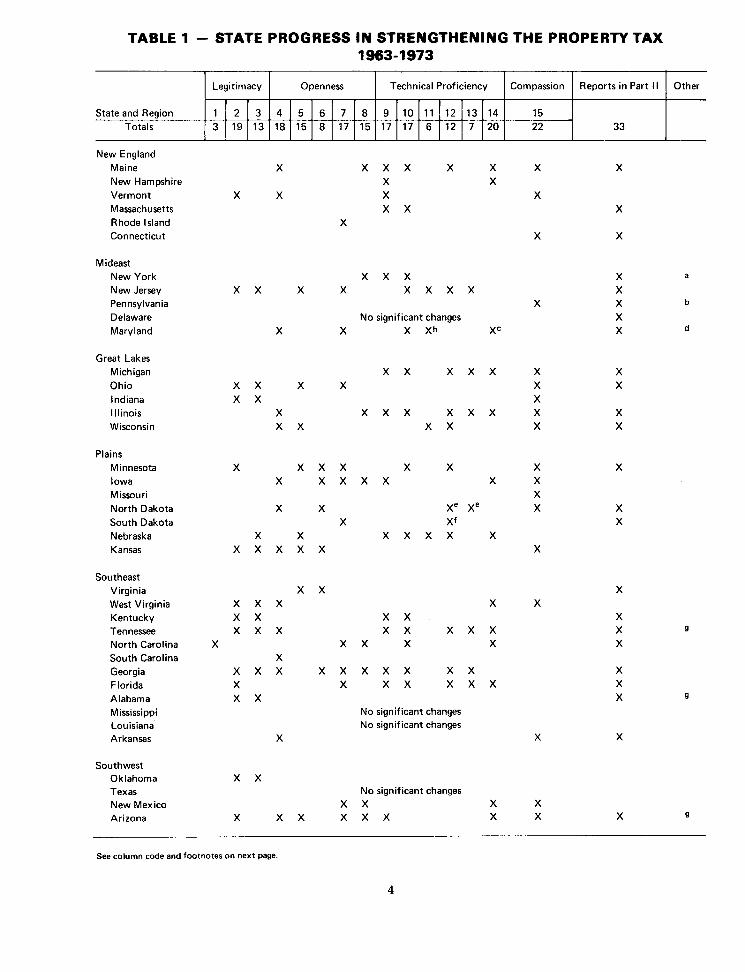
TABLE 1 - STATE PROGRESS I N STRENGTHENING THE PROPERTY TAX 1963-1973
State and Region Totals
New England Maine New Hampshire Vermont Massachusetts R hode l sland Connecticut
X X X X X X X X X X
X X X X X X X
X X X
Legitimacy
Mideast New York X X X New Jersey X X X X X X X X Pennsylvania Delaware No significant changes Maryland X X X Xh XC
Great Lakes Michigan X X X X X X Ohio X X X X X Indiana X X X Illinois X X X X X X X X Wisconsin X X X X X
Openness
Plains Minnesota X X X X X X X Iowa X X X X X X X Missouri X North Dakota X X Xe xe X South Dakota X Xf Nebraska X X X X X X X Kansas X X X X X X
Southeast Virginia West Virginia Kentucky Tennessee North Carolina South Carolina Georgia Florida Alabama Mississippi Louisiana Arkansas
Technical Proficiency
X X X X X X X X X X X X X X X X X X X
X X X X X X
X X X X X X X X X X X X X X X X X X X
No significant changes No significant changes
X X
Southwest Oklahoma X X Texas No significant changes New Mexico X X X X Arizona X X X X X X X X X 9
Compassion
-
See column code and footnotes on next page.
Reports in Part I I Other

Rocky Mountain Montana Idaho X Wyoming Colorado Utah X
TABLE 1 - STATE PROGRESS IN STRENGTHENING THE PROPERTY TAX 1963-1 973 (Cont'd)
Far West Washington X X Oregon X X Nevada California
Alaska X
State and Region Totals
Hawaii
Column Code
Technical Proficiency
Adopt a full value assessment standard. Statewide reassessment program to bring levels up to legal ratios. Control of statewide reassessment program. Assessment ratio studies as means of judging quality of assessments. Notification of taxpayers as to assessment level. Notification of taxpayers as to appeal rights. Listing and valuation of exempt properties. Establishment o f independent State and/or local appeals agency. Supervision of and assistance t o local assessors. Training and certification of local assessors. State assessment of complex property. Consolidation of assessing jurisdictions. Authorization for joint assessment. Reorganization generally by replacing multimember commission with single commission or director; separation of supervisory agency from appeals agency; and/or establishment of separate property tax supervisory agency. Adoption of the circuit breaker form of property tax relief.
Compassion
15 22
Legitimacy
a~al i fo rn ia pioneered in applying EDP technology to mass appraisals. I n 1973 New York conducted an EDP based mass appraisal pilot program i n one jurisdiction with a view to extending it t o others. b ~ a j o r assessment reform program may be enacted by the 1974 legislature. CCentralization of assessment at State level scheduled t o be completed by 1975. d l f reassessment results in an increase of 36% or more, increased property taxes that result f rom the reassement may be paid w e r a three-year period. BAppointment of qualified county equalization directors and authorization for joint appointment of such officials by counties. f ~ o v e d completely t o county assessor system (plus 5 cities of 5,000 and over). Previously elected aaescors are now appointed. SEstablished property tax classification with higher ratios for commercial and industrial properties than for farmers and homeowners. h ~ l l assessment moved to the State level. 'New State Board of Tax Appeals established a small claims division. j ~ a x Appeal Court authorized t o initiate small claims procedure to expedite claims amounting to $1,000 or less. klnitiated modified site-value system.
Openness
9 17 3
Source: AClR staff compilation,
Reports in Part I I
33 4 18 7
Other
17 20 1 2
19 3 13
5 15 6
7 17
6 8
1 0 1 1 1 2 1 3 1 4 12
8 15

Assessment law and practice can be harmonized in numerous ways; four are pre- sented below: (See Figures 1 and 2 in Appendix B.)
(1) Statewide full-value assessment and appraisal. Briefly the advantages are:
-Full market value appraisal reduces the possibility of sloppy, politically oriented or corrupt assessments.
-Full market value appraisal increases uniformity thereby reducing inequities be- tween taxpayers and tax districts.
-Full market value appraisal reduces costs because it makes maximum use of market information.
-Full appraisal and assessment is administratively efficient since both values are the same.
-Full appraisal and assessment promotes taxpayer understanding since the tax- payer is most likely to be aware of his market value.
Disadvantages are:
-High start-up cost since most States are a long way from full-value assessment.
-Increased work loads for assessors and their staffs to keep records current.
-A significant disruption in existing State-local relations as a government function and corresponding political power is shifted from the local assessor's office to a State assessor's office.
-Taxpayer fears that the large increases in the property tax base which would occur in most taxing districts would not be accompanied by a commensurate reduction in tax rates. (Several States have adopted mandatory rate reduction statutes or freeze laws to reduce this concern. As an example, see the report on Washington in Part 11.1
As shown in Tables 2 and 3, Kentucky and Oregon are the only States approaching full-value assessment for all real property. (Rapidly changing land values in Alaska which lowered their assessment ratio to 75 percent caused Alaska to be dropped from this select list of States.) Kentucky's dramatic improvement between the 1962 and 1967 Census was primarily due to a court order requiring assessments to approximate the full-value legal standard. (For other examples of reappraisals being required by the courts see the re- ports on Alabama, Arizona, Florida, Tennessee, and Washington in Part 11.) Oregon's im- provement between the 1967 and 1972 Census was due to a legislative decision to move to a full-value standard from a fractional legal standard of 25 percent. The legislature simul- taneously empowered the State Tax Department to insure conformance to the full-value standard. (See the text in Part I1 for a more detailed discussion.)
In 1973, Washington changed its legal standard to full-value from 50 percent of market value. Prior to 1973, however, Washington's assessment ratio was significantly improved due to a court decision requiring officials to assess at 50 percent of market value. At the same time, State aid was made available to carry out a statewide reassess- ment which was only partially complete when the Census was taken. Based on this experi- ence, it is reasonable to assume that Washington's assessment ratio in 1976 will approxi- mate the ratios achieved in Oregon and Kentucky.
A new law in North Carolina invalidates the authority of county boards of commis- sioners to set some uniform percentage of appraised value in arriving at assessments and requires assessment at true market value. If this new provision is enforced, North Caro- lina will show a significant increase in its assessment ratio by the next Census.

TABLE 2 - LOCAL RESIDENTIAL PROPERTY ASSESSMENT LEVELS AND STATE LEGAL STANDARDS, 1971
Ratio of
Ratio of Legal Assessment Standard' actual level assessed value to legal
to sales priceZ Level standard State (%) (%I Valuation Concept (%I
Oregon Kentucky Alaska New Hampshire Florida Maine Massachusetts Maryland District of Columbia Wisconsin Delaware West Virginia Virginia New Mexico Pennsylvania
New York Missouri Texas Mississippi South Carolina
Tennessee Georgia l owa Michigan California Nebraska
Nevada Hawaii l llinois Ohio
Washington Kansas Indiana Colorado Alabama Arkansas South Dakota Arizona Idaho Oklahoma Utah North Dakota Minnesota Montana
(Full-Value Standard States)
True cash value Fair cash value Full and true value in money Full and true value in money Full cash value A t just value in compliance with the laws of the state Fair cash valuation Full cash value less an allowance for inflation Full and true value in lawful money Full value at private sale True value in money True and actual value Fair market value Assessed in proportion to its value Actual value (the price for which the property would
sell) Full value True value in money Full and true value in money Assessed in proportion to its value True value in money
(Fractional Value Standard States)
Actual cash value Fair market value Actual value Full cash value Full cash value Required to be valued at its actual value and assessed
at 35% Full cash value Fair market value or a percentage thereof Fair cash value True value
True and fair value Fair market value True cash value Actual value Fair and reasonable market value True market value in money True and full value in money Full cash value Market value Fair cash value Reasonable fair cash value Full and true value in money Market value True and full value
- See footnotes on following page.

TABLE 2 - LOCAL RESIDENTIAL PROPERTY ASSESSMENT LEVELS AND STATE LEGAL STANDARDS, 1971 (Cont'd)
Ratio of Ratio of actual level
assessed value Legal Assessment standard1 to legal to sales price2 Level standard
State (%I (%) Valuation Concept (%I
(Varying valuation - Determined Locally)
Connecticut 47.8 Up to Uniform % of market value within local district n.c. 100
Louisiana 13.1
New Jersey 58.3 North Carolina 44.6 Rhode Island 50.5 Vermont 33.3
Not be- Actual cash value (land at not less than $1 per acre) n.c. low 25 20-1009 Uniform percentage at true value n.c.
10 True value in money n.c. 10 Full and fair cash value n.c.
Up to Fair market value n.c. 10o1O
(Value Determined By State Tax Commission)
Wyoming 16.6 11 Fair value n.c.
n.c.-Not computed he "Legal Standard" rates shown are appl~cable generally. There are numerous exceptions In several states. 'Aggregate assessment - sales price ratlo. Residentlal single-family property. 31n 4 t h t o 8 t h class counties, real property must be assessed at a predetermmed ratlo no t t o exceed 75 percent. 4,. Fair cash value" is defined as 50% of the actual value o f real and personal property, except i n counties of more than 200,000 where real property is
classified for tax purposes. 5 ~ t a t e Board o f Tax Appeals authorized t o set a fractlon for statewide appllcatlon. In 1972, this fraction was set at 35 percent. 6 ~ e g a l standard varies f rom 1 8 t o 60 percent depending on class o f property. 7~s t imated . Legal standard varles by class o f property. Residential homesteads are assessed at 25% on 1st. $1 2,000 of market value. 40% on excess. ' ~ e g a l standard vanes f rom 1-100% depending on class of property. 91n a multiple of 10 established b y each county board of taxation. I f a county fails toestabhsh a uni form %. 50% level IS employed unt i l action is taken
' 'uniform percentage, determined locally. " A t a fair value In conformity w i th valuesand procedures prescribed by the State Tax Comm~sslon.
Source: AClR staff compilation based on data f rom Commerce Clearing House, State Tax Reporter;and U.S. Bureau of the Census, Governments Division.

TABLE 3 - RESIDENTIAL ASSESSMENT LEVELS, 1961,1966, and 1971
State
Ratio of assessed value to sales price (%I ' Percentage-point change
1971 1966 1961 1966-1971 1961-1971
Oregon Washington Michigan New Hampshire District of Columbia New Mexico Tennessee North Dakota Kansas Virginia Vermont California Massachusetts
Ohio Idaho Iowa Utah South Carolina South Dakota Mississippi North Carolina Indiana Maryland Minnesota Nevada Alabama Oklahoma West Virginia Arkansas Wyoming Texas Illinois Georgia Nebraska Missouri Louisiana Montana Maine Rhode Island New York Pennsylvania Colorado Connecticut Kentucky New Jersey Arizona Wisconsin Hawaii Alaska Florida Delaware
(States with Increased Level, 1966-1971)
(States with Decreased Level, 1966.1971)
ma.-Not available. 'Residential single-family property. Source: ACIR staff compilatton based on U.S. Bureau of the Census, 1972 Census of Governments, Vol. 2, Taxable Property ValuesandAssessment-
Sales Price Ratios.

To achieve compatibility with local assessment administration 14 States since 1961 have abandoned the full-value standard in favor of a politically more realistic frac- tional standard. (See Table 4.) Where there were 34 full-value States in 1961, the figure was reduced to 20 by 1972. The recent adoption of the full-value standard by Washington and North Carolina will bring the total to 22.
Generally, the abandonment of the full-value standard was in response to judicial proceedings involving the difference between assessment law and practice. In most of the 14 States, therefore, this statutory move to conform assessment practice with law was ac- companied by a statewide full-value reappraisal program.
(2) Statewide full-value appraisal and uniform fractional assessment. The primary advantage of this approach over full-value appraisal and assessment appears to be a minimum amount of public misunderstanding as this approach requires a smaller increase in assessed values and thus relieves taxpayer fears about tax increases. The disadvantages are:
-continued administrative complexity because assessed values differ from appraised values,
-continued taxpayer confusion because assessed value is not market value, and
-continued probability of assessments disparities.
As the data in Table 2 show, six States have assessment ratios that are approximately equal to their legal fractional assessments (80 percent or above).
(3) Statewide full-value appraisal and statewide classification of properties allowing assessments to vary with types of property. The primary advantage of this approach is that it legalizes existing State averages thereby minimizing significant shifts in property tax burdens.
There are two arguments in favor of State adoption of a classified system of assess- ment:
-By designating lower assessment levels for farmers and homeowners than for cer- tain classes of income-producing property, State legislators can legalize local as- sessment practices while minimizing political controversy. Controversy is mini- mized because the relative tax loads currently borne by various classes of property are locked in, avoiding the unpopular burden shifts.3
-The classification schemes in use conform with the popular notion that business property owners are somehow in a better position to absorb or pass on property taxes than are farmers or the homeowners.
Five arguments can be marshalled in opposition to classification and in favor of the uniformity principle.
-A State legislative decision to discriminate against business can have a bad eco- nomic development announcement effect. Businessmen are keenly concerned about State policies that single them out for extra tax burdens-a factor that could influ- ence their decisions to locate or to enlarge their operations.
-There is no persuasive economic rationale to justify a policy of deliberately biasing property tax assessments against income-producing property.
-Because there is no sound theoretical basis for singling out various classes of in- come-producing property for heavier tax burdens there also is no logical stopping place once the State has embarked on a classification scheme; this makes the clas- sified property tax especially vulnerable to political bargaining. Those taxpayers

TABLE 4 - STATE ABANDONMENT OF THE FULL VALUE ASSESSMENT STANDARD, 1961 TO 1973
State
Legal Assessment Standard
196 1
- - --
Revised Legal Assessment Standard
Ratios Date
Arizona California Colorado Georgia Idaho Illinois Indiana Kansas Michigan Nevada New Jersey Ohio Rhode Island Tennessee
' Depending on class of property. 2~e tween 20 and 25 percent of fu l l cash value from 1968 through 1970; thereafter, 25 percent. 31n a multiple of 10 as is established by each county board of taxation. If a county fails t o establish a uniform
percentage, a 50 percent level of assessment is employed unti l action is taken. 4 ~ n i f o r m percentage, determined locally.
Source: AClR staff compilation based on Commerce Clearing House, State Tax Reporter.

with the inclination and resources can be expected to place heavy pressure on the legislature for preferential assessment treatment by the creation of classes.
-The framers of most State constitutions have made the uniformity principle (not classification] a part of the tax provisions.
-Classification is more cumbersome and time consuming-and therefore more costly -to administer than a uniform system of assessments.
Minnesota's classified property tax system dates from 1913, and that State's experi- ence offers insights that should cause other States to think long and hard before under- taking classification. Rolland Hatfield, speaking in 1966 as Minnesota State Tax Commis- sioner, concluded an address on property classification on the following note:
I would like to sum up by saying that I have observed in respect to the classified property tax system that it cannot work equitably; that it has no effective brake on it; and that it leads to changes in the property tax law which are inspired by politics rather than by economics. In general, I think it is a hazardous experiment to start.4
As discussed in more detail in the State summaries in Part 11, Alabama, Arizona, Illinois and Tennessee have 'also abandoned the full-value standard for a classified sys- tem where utilities, commercial and industrial properties are assessed at higher ratios than farm and residential properties. The practical effect of these changes is to legalize existing assessment practices, although the Illinois change occurred as part of a larger constitutional revision.5
(4) Statewide full-value appraisal and locally set assessment levels. This approach maximizes local freedom and avoids a need for rate adjustments to offset valuation changes.
The disadvantages of this approach are:
-continued administrative complexity because State-level equalized values would be needed for State uses,
-continued taxpayer confusion, and
-continued likelihood of large assessment disparities between taxing regions and be- tween taxpayers.
Primary Prerequisite for Assessment Reform. No matter which of the above options are selected, the key to a good property tax is 100 percent appraisal. Once reliable market value appraisals are available, assessment is relatively simple; all that is required is the application of a stipulated percentage to the full-value appraisal. Also, the starting point for taking the mystery out of the property tax-making the tax open to public under- standing-is revealing the assessor's estimate of the property's market value. Without this first step, assessed value has little meaning. To get good appraisals, a technically profi- cient staff of well trained professionals is mandatory. Both these topics are discussed in more detail in later sections of Part I.
Need for Legalization of Assessment Practices. Most States have legal assessment standards which are significantly different from existing assessment-sales ratios. As was shown in Table 2, 18 States show a 50 percentage point difference between their legal requirements and their 1971 assessment ratios. South Carolina leads the nation in the differences between the legal requirement and the current assessment ratio with a dif- ferential of over 90 percentage points; Mississippi and Texas have over an 80 percentage point differential.
The average assessment ratio for the entire U.S. has increased from 29.5 to 34.0 since

the 1962 Census. Such an increase is often assumed to mean an increase in the quality of assessments. It should be noted, however, that between the 1967 and 1972 Census where the national average increased by 1 .2 percentage points the assessment ratio of 38 States declined while only 12 States had higher ratios. The increase in the national average was primarily caused by the large increases in the assessment ratio of four States: Michigan, New Hampshire, Oregon and Washington, with Oregon showing a spectacular gain of 65 percentage points.
Over a third of the States have taken action over the last decade to legitimatize their assessment with their valuation standards. (See Table 1, column 2.) Over a quarter of the States have increased their control of the reassessment programs. (See Table 1, column 3.)
Current assessment practices appear to be under legal attack from a new front. A court in Maryland recently decided that the assessors would have to follow the legal standard which requires annual review of assessments. Reappraisal on a three-year basis, which had been the practice, was not adequate. (For more detail see the Maryland report in Part 11.)
Illinois, Montana and North Carolina have recently rewritten their constitutional provisions dealing with the property tax to bring them more in line with current opera- tions as well as allowing legislative action which has generated some tax reform. (See the reports in Part 11.)
OPENNESS-PROVIDING FULL INFORMATION TO THE TAXPAYER
The property tax too often is shrouded in secrecy and is viewed by most taxpayers as a mystery. This has two undesirable effects: (a) taxpayers fail to understand how their property taxes are determined, and therefore, tend to resent the tax; and (b) extra- legal assessments can be worked out behind closed doors, effectively hidden from the public. As a means of overcoming these effects, ACIR recommends openness in property tax administration via a policy of full disclosure to taxpayers.
When the mystery is taken out of assessing-when each taxpayer is informed of the assessment on his property and how it relates both to other assessments and the legal standard-the taxpayer will be in a position to evaluate the fairness of the tax. Moreover, he will be able to monitor the performance of the tax administrators and, if guaranteed a prompt decision on appeal, he will become a vital force in upgrading the level of property tax administration. The main actions that should be taken to bring about openness in property tax administration are the following:
-Each property taxpayer should receive a notice in sufficient time before the tax roll becomes final. The notice should include:
a) the estimated market value of the property being taxed,
b) the assessed value of the property,
C) the ratio of assessed value to market value for the taxpayer's property and for similar properties in the taxing jurisdiction as estimated by a State ratio study (see below), and
d) a statement of the taxpayer's right to appeal together with instructions as to how, where, and when appeals are to be made.
-The appeals procedure should be readily accessible, with emphasis upon infor- mality, convenience, and low cost.
-State assessment ratios should be admissible as evidence to support an appeal, al- though a "tolerance zone" should be provided because property appraisal is not an exact science.

-The State tax department should conduct and publish annual studies of the relation- ship between assessed values and sales prices to arrive at assessment ratios for each type of property in each assessing jurisdiction.
-Accurate assessment of fully and partially exempt properties should be made on the same time interval as taxable properties. Publication of these data by owner and class of property should occur in each taxing district.
-Copies of the tax roll should be available at public libraries in the taxing district.
Taxpayer Notification-When the taxpayer is given full access to information on as- sessment ratios and is kept informed of the processes by which his assessment is deter- mined-when the mystery is taken out of assessing-he will know whether or not he is being treated fairly relative to his neighbor. He will then understand why assessments must be kept current.
Fifteen States have adopted a policy of notifying taxpayers as to assessment levels or changes in assessment levels during the past decade. (See Table 1, column 5.) For ex- amples in Part I1 see the reports on California, Idaho, Virginia, Washington, and Wiscon- sin.
Taxpayer Appeals-Recent State actions to establish property tax agencies have called for the separation of the appeals machinery from the assessment process. Fifteen States since 1962 have moved in this direction at the State level, the local level, or both. (See Table 1, column 8.) This is a definite improvement over the system in which an assessor initially sits in judgment over his own work when an appeal is entered by a tax- payer.
Hawaii and Idaho established small claims procedures for appeals in 1968 and 1971, respectively. Oregon enacted such legislation in 1961. A further step to help taxpayers initiate appeals was taken by eight States that require the assessment notice to include a statement regarding the taxpayer's appeal rights and the procedure for bringing an appeal. (See Table 1, column 6.)
Ratio Studies-Studies that relate assessed values to sales prices (assessment ratios) are vital to understanding the property taxation process; operating without such studies is like trying to cross the ocean without a compass. Only with assessment-sales ratio data can taxpayers (or tax administrators) know whether actual property tax administration meets legal standards and treats taxpayers equitably.
Since 1963, 18 States have either started to conduct assessment ratio studies or strengthened such activities as a means of measuring the quality of assessment and pin- pointing trouble spots. (See Table 1, column 4.) Over 40 States now conduct periodic as- sessment ratio studies. Although a few of them (for example, Florida, Indiana, and Penn- sylvania) conduct these studies only for the purpose of equalizing school aid, the majority of such studies are used as a means of measuring the quality of appraisals and assess- ments. The Louisiana tax agency was required by a 1964 constitutional amendment to con- duct ratio studies, and the Wyoming tax agency was authorized in 1968 to do so-but neither is conducting such a study yet. Oklahoma discontinued its ratio studies in 1971.6
In connection with their assessment ratio studies, many States are now making use of the sales-price information that becomes available under their real estate transfer tax laws. There are now 35 States and local governments in two other States with such taxes, three times as many as a decade ago. (See Table B-15.)
Discussion of various ratio studies can be found in Part I1 of this report under the following States:
Alaska Arkansas
Illinois New Jersey Maine Ohio
Washington Wisconsin

Kentucky Maryland South Dakota
Information on Tax Exemptions-Another aspect of openness relates to information on tax exemptions. (See Table 5.) In the last decade, 17 States have enacted legislation requiring local assessors to list and set values on exempt properties which will enable these exemptions to receive more public scrutiny. For examples of States which assess exempt properties, see the following State reports in Part 11:
California Hawaii New Jersey South Dakota Colorado Maryland Ohio Florida Minnesota Oregon
The South Dakota statute is perhaps the most desirable; it requires publication of exempt properties in each taxing jurisdiction.
Availability of Tax Rolls-One way to reduce the likelihood of politically motivated or corrupt assessments is to insure that the property tax rolls are readily available for public inspection. Properties listed by owner's name and address rather than lot number, and with estimated market value as well as assessed value would facilitate comparisons between properties and with average State assessment ratios. Limiting the availability of tax rolls to the assessor's office, as is the case in some States, discourages the research efforts of interested parties. Tax rolls could be made available at the public libraries in each taxing district in the interest of taxpayer convenience and public knowledge.
TECHNICAL PROFICIENCY-ASSURING THE QUALITY OF ASSESSORS AND THEIR ASSESSMENTS
Property appraisal requires (a) well trained, professional personnel, (b) appropriate tools and techniques, and (c) an administrative framework that permits effective and efficient statewide coordination. The States must play a greater role in property appraisal than most now do. The basic choices are complete centralization or strong State coordi- nation of local appraisers.
Uniform statewide treatment of all properties can be achieved only if the same ap- praisal techniques are applied in all parts of the State. Even if a State opts for complete local freedom in allowing each locality to set its own assessed values, the starting point- full-value appraisal-must be the same in all areas. This means that a State level unit must have the authority to prescribe and enforce uniform appraisal procedures statewide. As shown in Table 1, columns 9 and 10, 17 States have initiated or strengthened the general supervision of assessors or have provided for technical assistance; 17 States have either established or strengthened existing assessor training programs and all but one of this group (Massachusetts) now provide for certification of assessors or appraisers on the basis of qualifying examinations. Assessor certification by a State agency was almost non-existent a decade ago.
Discussion of required State certification of assessors can be found in the following State reports i n Part 11:
California Maine New York Washington Georgia Michigan North Carolina Illinois Minnesota Oregon Kentucky New Jersey Tennessee
Discussion of required assessor training programs can be found in the following States:
California Georgia
Maine Massachusetts
New York Tennessee

TABLE 5 - VALUE REPORTED FOR EXCLUDED (TOTALLY EXEMPT) PROPERTY, BY TYPE OF EXEMPTION, FOR SELECTED STATES, 1971
(Millions of dollars)
Total , a l l types -
c h a r i t a b l e ' Governmental1 Other o r
una l locab le l
Local ly valued r e a l t y
Locall] va lued r e a l t y
Locally valued r e a l t y
S t a t e
va lue A l l
va lue A l l
v a lue
l o c a l l y valued r e a l t y
A l l va lue
b c a l l y ralued r e a l t y
va lued r e a l t y
Tota l , 17 S t a t e s
( inc luding D.C. ) '87,648
......... Arizona.. . . ........ Cal i fo rn i a . .
D i s t r i c t of Columbia Flor ida . . ........... Hawaii . . . . . . . . . . . . . . Indiana . . . . . . . . . . . . . Kansas..... . . . . . . . . . Louisiana. . . . . . . . . . .
Massachusetts..... . . Minnesota..... . . . . . . Nevada.............. New Jersey .......... New York............ Ohio. . . . . . . . . . . . . . . . Oregon .............. Rhode I s l and . . . . . . .
...... South Dakota..
Note: De ta i l may no t add t o t o t a l s , because of rounding.
- Represents zero o r rounds t o zero . ' In some in s t ances d a t a a r e not shown because t h e r e were no t o t a l l y exempt values , o r because t h e aggregates involved
were not i d e n t i f i e d i n r epo r t ed d a t a . ' ~ o t a l inc ludes $7,188 m i l l i o n i n pe r sona l ty , no t c l a s s i f i e d by type . J ~ n c l u d e s " r e l ig ious ." ' includes i nven to r i e s . ' ~ e l i ~ i o u s , educat ional , and c h a r i t a b l e inc luded wi th f i g u r e s shown. ' ~ u b l i c u t i l i t i e s . 7 ~ e l i g i o u s , educat ional , c h a r i t a b l e , and governmental inc luded with f i g u r e s shown. ' ~ i ~ u r e shown includes r e a l t y and pe r sona l ty of new i n d u s t r i e s . 'value f o r educat ional i nc ludes $3,957 m i l l i o n f o r pub l i c s choo l s ; not inc luded with governmental . 1 0 ~ n c l u d e s indeterminate po r t i ons of t h e $1,167 m i l l i o n shown a s t h e t o t a l of l o c a l l y valued r e a l t y , a l l t ypes .
Swrce: US. Bureau of the Census, 1972 Census of Governments, Vol. 2, Taxable Property VaIuesmd Asressmnt-Sales P r m Ratios.

Three States, New Jersey, Nebraska, and Washington provide State assessors to appraise complex properties. (See Table 1, column 11.) Two States are now joining Hawaii in centralizing property tax assessment at the State level. Montana became the second State to move all assessing to the State level on July 1, 1973, following ratification of a constitutional amendment to make this possible. And Maryland, which has long had a highly centralized system-but operating through the counties-will be taking over the assessment function by 1975. Wisconsin is taking over the assessment of all manufacturing properties. (See the report in Part 11.)
A dozen States have taken steps to consolidate local assessment jurisdictions, and seven have authorized localities to establish joint assessing agencies. (See Table 1, column 1 2 and 13.) This makes possible more efficient and effective assessment at the local level. Examples of States which allow for consolidation or inter-county contracting of the as- sessing function are found in the following State reports in Part 11:
Illinois Michigan
New Jersey Tennessee
Wisconsin
Twenty States have reorganized and strengthened their property tax supervisory agencies. (See Table 1, column 14.1 Mainly, this has taken the form of replacing multi- headed commissioners with a single director, appointed by and directly responsible to the Governor. In addition, several States have established separate property tax valua- tion units within the tax department or some other cabinet level agency.
State supervision of local appraisers requires that the State have authority to set professional staffing standards and levels, as well as require uniform appraisal techniques and manuals. The State also must have the power to reject any locality's tax list if the re- sults are unsatisfactory (assessment levels too low and/or insufficiently uniform), and to take over the appraisal function for any locality failing to rectify the deficiency within a reasonable (and stated) period of time. Oregon and Arkansas have the authority to im- pound funds going to the unit of government making the assessments if its performance is unsatisfactory and if the State uses its resources in accomplishing the necessary reap- praisal. (See the report in Part I1 for the details.)
To make assessors more technically proficient obviously will cost more money. The cost increase can be reduced if the assessment districts are consolidated into large enough units to take advantage of assessor specialization, automatic data processing, and other kinds of scale economies. In a recent speech by Ronald B. Welch of California's State Board of Equalization describing the characteristics of good assessment administration, the following cost estimates were made:
My assignment was to describe a high quality assessment system and evaluate its attainability. . . . But it cannot be attained at little or no cost. In a high tax State like California, the current cost of a top quality assessor's office in a medium sized county is currently about 1.2 percent of the proceeds of the tax. The total cost of property tax administration in the country is around 1.5 percent of tax collections. Judging by the costs of tax administration generally, I don't think this is too much.'
Presently, Hawaii is the only State whose annual budget for State administration of the property tax approaches 1.2 percent of the total amount of State and local property tax revenues. The distribution of States by percentage spent on State administration is shown below. (These totals do not include what is spent by the local assessing districts.)

TABLE 6 - PRINCIPAL FEATURES OF STATE "CIRCUIT-BREAKER" PROGRAMS,' BY STATE. 1974 (Januanr 1)
l ncome Rent Type of Relief State h e Z ceiling3 ~ q u i v . ~ orm mu la' Benefit imitation^
Arizona
Arkansas
California
Colorado
Connecticut
Illinois
Indiana
lowa
Kansas
Maine
Michigan
Minnesota
Missouri
Nevada
New Mexico
North ~ako ta l '
Ohio
Oregon
Pennsylvania
Vermont
West Virginia
Wisconsin
65
65
62
65
65
65
65
65
60
62
all
65
65
62
all
65
65
all
65
all
65
all
$3,500 S 5,000 M
5,500
10,000 net 20.000 gross
5,400 S 6,300 M
7,500
10.000
5,000
6,000
8,192
4,500 S 5,000 M
none
6,000
7,500
5,000
6,000
3,500
10.000
15,000
7,500
none
5,000
7.000
25
-
-
10
20
25
208
20
- 25
17
20
18
15
implicit
20
-
17
20
25
12
25
Minnesota
Vermont (O-5%)
Minnesota
Other
Vermont (5%)
Vermont (6.7%)
Minnesota
Minnesota
Vermont (0-13%)
Vermont (2.16%)
Vermont (3.5%)9.10
Minnesota
Vermont (3-4%)
Vermont (7%)
Other
Vermont (5%)
Minnesota
Other
Minnesota
Vermont (4.6%)
Vermont (.5-4.5%)''
Other1'
Credit Limit of $400 7
Credit Limit of $270
Credit Limit of $500
Credit Limit of $500
First $500 of Tax
First $600 of Tax
First $400 of Tax
Credit Limit of $400
Credit Limit of $500
First $800 of Tax
First $400 of Tax
Credit Limit of $350
Credit Limit of $133
Credit Limit of $350 7
Credit Limit of $490
Credit Limit of $200
Credit Limit of $500
First $125 of Taxes
First $500 of Taxes
'A circuit-breaker is a Statefinanced property tax relief program in which thestate rebates that part of the tax deemed excessive in relation t o house 2hold income.
Minimum age applicable t o most beneficiaries; many States extend the program t o persons at lower ages that are disabled, blind, or widowed. :"s" indicates income ceiling for single persons, and " M indicates income ceiling for married persons.
Renters in these States receive property tax relief using the given percentage of rent as the property tax equivalent. he "Vermont" formula defines taxes in excess o f a given percentage or percentages of household income as excessive and such taxes form the basis
for relief. Connecticut and Michigan are two examples of States using a single percentage t o define excess burden. I n Connecticut, property taxes in excess o f 5 percent of income are deemed excessive and are rebated t o the taxpayer. I n Michigan, property taxes i n excess o f 3.5 percent o f income are deemed excessive and 60 percent of such taxes are refunded. Vermont formerly used a single percentage bu t now. Uses different percentages of in- come for different income ranges. The following is the Vermont statute:
I f Household Income Then the Taxpayer is Entit led t o Credit (rounded t o the for Property Tax Paid in Excess of nearest dollar) is: This Percent of That Income.
5 0 -5 3,999.00 4.0% 4.000.00- 7.999.00 4.5 8,000.00- 11,999.00 5.0 12,000.00- 15.999.00 5.5 16,000.00- and u p 6.0
The "Minnesota" formula refunds a given percentage of a person's property tax, whether large or small, wi th the percentage depending upon the person's income. The following is the lowa statute, which u ~ e s the Minnesota formula.
I f Household Income is: Percent of Property Taxes Allowed as a Reimbursement.
5 0 -$ 999.99 95.0% 1,000.00- 1.999.99 80.0 2.000.00- 2,999.99 65.0 3,000.00- 3,999.99 50.0 4,000.00- 4,999.99 35.0 5,000.00- 5,999.99 25.0

TABLE 6 - PRINCIPAL FEATURES OF STATE "CIRCUIT-BREAKER" PROGRAMS, BY STATE, 1974 (January 1 ) (Cont'd)
The "other" formulas are as follows:
Colorado: Relief 1s 50 percent o f tax and cannot exceed $270. Relief is reduced by 10 percent of income over $2,700 for single persons and by 10 per- cent of income over $3,600 for married persons.
Wisconsin: Excess taxes are taxes In excess of 14.3 percent of mcome In excess of $3,500. Cred~t IS 80 percent of excess taxes
Oregon: Property taxes are refunded in fu l l up t o a given maximum. The maximum depends upon income and declines as income rises.
New Mexico: Person receives a c red~ t based on all State and local taxes w h ~ c h he 1s presumed to have paid. Credit depends upon income and number of personal exemptions; individual's own property tax or rent is not used In determining amount of relief.
6 ~ e n e f i t s under these programs are generally limited In one o f two ways:
1. I f the computed credit exceeds a given dollar amount, then the actual cred~t wil l be that dollar amount. Thls is shown i n the table asUcredit limited t o $
2. I f the property tax liability exceeds a given dollar amount, then the property tax liability wil l be deemed t o be that dollar amount for purposes o f computing the credit. This is shown in table as "first $ of tax."
Somestate provide that the benefit limitation becomes lower as income rises.
'~ r i zona , California, and Ohio have a l imitation expressed in terms of the amount of assessedvalue that can be used in computing thecredit. California and Ohio exclude renters while Arizona limits them t o $225.
'Indiana uses 15% for renters if the dwelling is furnished or utilities are provided. 9~ersons over 65 receive benefits under another schedule of the Vermont type, wi th the threshold rangmg from zero percent of Income t o 3.5 percent
of income. The credit IS equal t o 100 percent of the excess tax. 'Oln Michigan, relief is given for 6 0 percent o f the excess taxes (except that persons over 65 receive 100 percent). I n Wisconsin, relief is given for 80 per-
cent of excess taxes. I n West Virginia, relief is given for 75, 60, 45, or 30 percent of excess taxes, depending upon the person's income. '~ i r cu~ t -b reaker i n North Dakota is for renters only. Homeowners in North Dakota (over 65, wi th incomes below $3.500) receive a small homestead exemption.
Source: AClR staff compilation based on Commerce Clearing House. State Tax Reporter

No. of States
1 1 5 7
15 16 45
Percent of Property Tax Spent on State Administration
over 1 percent .75 to .99 .50 to .74 .25 to .49 .10 to .24 below .10
No data were available in Connecticut, Delaware, Nevada, Rhode Island, and Texas.
Computerized Models for Updating Assessments-The use of sophisticated statistical approaches for valuing certain types of real estate represents a significant new step towards current and uniform assessments. This new approach is a significant advance over traditional assessing methods, since it cuts the cost and effort involved and improves the accuracy and timeliness of the resulting valuations.8
With strong technical support from the Board of Equalization, a number of California counties are now using multiple regression analysis for the mass appraisal of single- family houses. The process begins with the collection of data items (ranging up to a hun- dred or more per single residence] that help to explain price differentials. These data are then fed into a computer model designed to explain the relationship between property characteristics and the sales price for the single-family residences in a defined area. The equation is then applied to all such residences in the area, whether recently sold or not. The estimated selling prices that are derived are supplied to appraisers who view the prop- erties and check the computer-produced values to see that they are reasonably accurate.9
The Board of Equalization and Assessment in New York is now beginning to experi- ment with a similar computerized valuation procedure.10 It has been developing a computer capability and providing technical services to local assessing jurisdictions in- terested in conducting mass appraisals. A test program recently completed in one town was apparently successful both from a technical and a public relations point of view. More New York communities will be taking advantage of this program in the near future. (For more details see the reports on both States in Part 11.)
COMPASSION-REDUCING EXTRAORDINARY PROPERTY TAX BURDENS
Current extra-legal property tax classification systems typically favor the home- owner and the farmer. Where this situation exists, any move to establish uniform assess- ment of all real property will shift tax burdens from business property (See Table B-14) toward residential and agricultural property. A shift of major proportions would be un- popular, and it could make more unconscionable the property tax burdens on some fami- lies. (See Tables B-8 through B-10.)
An effort to achieve fundamental assessment reform intensifies the need for a State property tax relief program to relieve excessive property tax burdens. Indeed a property tax relief program can reduce the political obstacles in the path of assessment reform while increasing the equity of the tax.
A recent study by ACIR, Financing Schools and Property Tax Relief -A State Respon- sibility, considered the various methods of providing property tax relief to those with low income. (See Table B-4 and Figure 4 in Appendix B.) It identified the most efficient method of providing relief as the "circuit-breaker." The property tax circuit-breaker prevents a household's property tax from exceeding a percentage of income that the State finds to constitute an extraordinary burden. As shown in Table 1, column 15, 22 States now have this form of property tax relief. (The details being outlined in Table 6 . ) Except for five States, the tax relief is restricted to the elderly. In Michigan, Vermont,

and Wisconsin, States where "super circuit-breakers" were adopted in 1973, all low-in- come individuals are provided with tax relief. In Oregon, the super circuit-breaker was originally adopted in 1971 and revised in 1973. New Mexico extends its credit for all State and local taxes to persons of all ages.
Wisconsin enacted the first circuit-breaker in 1964 and at that time it was restricted to the elderly; California and Minnesota passed their relief measures in 1967; Vermont's came in 1969. All the others were adopted in the 1970's. (See Table 7 and the various re- ports in Part 11.)
Descriptive examples of homestead exemptions for the elderly, a less efficient form of tax relief, can be found in Part I1 under the following States:
Alabama Kentucky Minnesota Texas Delaware Maryland Tennessee Florida Massachusetts South Dakota Idaho Michigan (now replaced) Washington
An example of other special preferences for the elderly can be found in the reports on Connecticut, Montana, and Oregon.
Examples of general homestead exemptions can be found in the reports on:
Alabama Florida
Georgia Hawaii
Texas
Examples of the special treatment of farmland, timber land, and/or open spaces can be found in the following State reports (See also Table B-11.):
Illinois Massachusetts North Carolina Kentucky Montana Ohio Maine New Jersey Oregon Maryland New York Texas Washington
For an example of a State which taxes land more heavily than improvements see the report on Hawaii."
The following examples of changes which attempt to make the property tax better fit the popular conceptions of equity can be found in more detail in Part I1 under the fol- lowing State reports:
-California, Connecticut, Florida, and South Dakota require in lieu payments from the State to local government to cover lost revenues from State mandated tax ex- emptions.
-New York and Virginia allow local governments to collect service .charges from cer- tain exempt properties.
-Minnesota tried a limited multi-jurisdictional sharing of part of the tax revenue from new commercial and industrial properties. A somewhat similar but broader proposal was before the Maryland legislature.
FUTURE PROSPECTS FOR ASSESSMENT REFORM Rapidly growing property tax burdens focus attention on assessment inequities. As
tax burdens grow demands for property tax relief are accompanied by demands for property tax reform. The courts have been a primary catalytic agent in obtaining rapid and effective assessment reform as well as requiring a re-thinking of the proper role of the property tax in the State and local tax structure.

TABLE 7 - STATE ACTION ON PROPERTY TAX RELIEF PLANS FOR THE ELDERLY
;Number of States by Type of Plan As of-
Kind of Relief Jan. 1, 1970 Jan. 1, 1973 July 1, 1973
StateFinanced Circuit-Breaker
StateFinanced Other Plans
StateMandated Locally-Financed
StateAuthorized Locally-F inanced
TOTAL
Source: ACI R staff compilation based on Commerce Clearing House, State Tax Reporter.

THE COURTS AS THE CATALYST
Two kinds of judicial action in the past 15 years have had, and will continue to have, a profound effect on property tax reform. One set of cases, which has already been mentioned, dealt directly with the failure of assessors to comply with the legal mandates concerning assessment levels. The other set-the Serrano-type cases-questioned the role of the local property tax in financing elementary and secondary education.
Beginning with a 1957 New Jersey case,12 the courts have indicated a growing ten- dency to insist that the assessors meet legal assessment standards. Some cases dealt specifically with the varying fractional assessments applied by local assessors in direct contradiction to constitutional or statutory mandates. Others dealt with the question of discriminatory assessments. The end result has been to force States like Georgia, New Jersey, Kentucky, Florida, and Washington to raise their assessment levels considerably as they attempt to conform to their legal standards. Other States reduced their legal stan- dards to conform to general assessment practice, and at the same time adopted measures to enforce those standards. And still others adopted classification systems (Alabama and Tennessee by amending their constitutions and Arizona by statute) in response to judicial mandates.
One significant consequence of the Serrano-type school cases, even though not specifically upheld by the Supreme Court, is the likelihood that some States may turn to uniform statewide property tax levies as one way of smoothing out the fiscal peaks and valleys of local school property tax financing. Recommendations for State general proper- ty taxes have been under active consideration in a number of States, including California, New Jersey, and New York. Wisconsin again led the nation by adopting a program of pow- er equalization for property tax rates in 1973. This provision equalizes the ability of each taxing district to raise property tax revenues for each mill of tax rate. Other States will surely be considering this and other proposals to provide horizontal equity between taxing districts.
Once a State adopts a significant statewide property tax, it will necessarily take on a strong supervisory role regarding property tax assessment procedures. It will have to take steps either to see that all local jurisdictions apply substantially the same assessment level-whether at full value or at a legislatively mandated uniform fraction-or that the State rate is varied with differential assessment levels. To take either course will require the States to measure these differentials accurately by means of well conceived and scientifically conducted assessment ratio studies. These studies will inevitably lead to the establishment of stringent assessment and personnel eligibility standards as well as full disclosure policies regarding assessment levels. With a heavy stake in the property tax, as most States had prior to the 19301s, there will be a return to the kind of State con- cern for effective property tax assessment administration that impelled the establishment of State property tax agencies early in the century.
LEADERS IN PROPERTY TAX REFORM Tax reform has taken place in the past decade and is taking place now. Credit needs
to be given to those States which are leading the nation in the reform of their property taxes. The following States, which are listed alphabetically, have made significant changes that are discussed in their reports in Part 11:
California Maine Minnesota Tennessee Florida Maryland Montana Washington Kentucky Michigan Oregon Wisconsin
State rankings relative to selected indicators of property tax assessment quality and property tax assessment change can be found in Tables 8 and 9.

TABLE 8 - SELECTED INDICATORS OF PROPERTY TAX ASSESSMENT QUALITY, 1971
Assessment levels
Percentage of assessed value to sales price of sold properties (aggregate assessment-sales price ratio) Assessment uniformity-single-family nonfarm houses
Singlefamily nonfarm Composite coefficient of intra-area Coefficient of interarea All types of property houses dispersion (percent) dispersion (percent)
State Ratio State Ratio State Percent State Percent
Kentucky Oregon Alaska New Hampshire New Jersey Florida Hawaii Rhode lsland Dist. of Columbia Maine
Massachusetts Maryland Connecticut Wisconsin North Carolina Michigan Illinois South Dakota Ohio Washington
West Virginia Delaware Georgia Virginia New York Tennessee Vermont Nebraska Pennsylvania Nevada
New Mexico lndiana l owa Missouri Kansas California Alabama Colorado Texas Wyoming
Oklahoma North Dakota Utah Mississippi Louisiana Arizona Arkansas ldaho Minnesota Montana South Carolina
Oregon Kentucky Alaska New Hampshire Flordia New Jersey Hawaii Maine Rhode lsland Massachusetts
Connecticut Maryland Dist. of Columbia Wisconsin North Carolina Michigan Illinois Ohio Delaware South Dakota
West Virginia Washington Georgia Virginia Vermont Tennessee Nebraska New Mexico Nevada Pennsylvania
New York lndiana l owa Missouri Kansas Colorado California Alabama Oklahoma Texas
Wyoming North Dakota Utah Mississippi Louisiana Arkansas Arizona ldaho Minnesota Montana South Carolina
Not computed. Med~an coefficient of intra-area disperr~on is 14.5.
Ave.-Median 22.5 -Mean not computed
Kentucky Nevada Michigan New Hampshire California North Dakota Connecticut Oregon Colorado New Jersey
Virginia Hawaii Florida Massachusetts Maine Nebraska Ohio Maryland Vermont Tennessee
Alaska Minnesota South Dakota Kansas North Carolina New Mexico lowa Illinois lndiana Montana
Georgia Washington Rhode lsland Utah Arizona Louisiana Mississippi Texas West Virginia Wyoming
Oklahoma Missouri New York South Carolina Alabama Delaware Pennsylvania Arkansas ldaho Wisconsin Dist. of Columbia
12.5 13.4 14.6 15.0 15.7 15.7 16.0 16.5 16.9 16.9
17.0 17.2 18.1 18.2 18.5 18.9 19.5 19.6 21.2 21.4
21.5 22.2 22.3 22.5 22.5 22.8 22.9 23.0 23.1 23.3
23.6 23.9 24.1 24.1 24.7 25.1 25.6 25.7 25.7 25.8
26.1 26.5 26.8 27.9 28.1 30.0 30.0 30.2 31.6
1
not applicable
Utah lowa Maryland Nevada Oregon Montana California Nebraska Ohio Arizona
lndiana Kentucky Colorado Illinois South Dakota Florida Hawaii Michigan New Mexico ldaho
Alaska Kansas West Virginia Delaware Minnesota Oklahoma Tennessee Wyoming
Connecticut Missouri
New Hampshire Arkansas Rhode lsland Texas New Jersey Vermont Washington North Carolina North Dakota Maine
Wisconsin South Carolina Alabama Pennsylvania Georgia New York Mississippi Virginia Massachusetts Louisiana Dist. of Columbia
14 not computed
4 5 5 5 5 6 8 8 8 9
9 9
10 10 10 11 11 11 11 12
13 13 13 14 14 14 15 15 16 17
17 18 18 19 2 1 2 1 2 1 22 23 24
24 25 26 26 29 32 33 35 40 42
not applicable
Source: AClR staff compilation based on U.S. Bureau of the Census. 1972 Census of Governments, Vol. 2, Taxable Property Vaffiesand Assessment- Sales Price Ratios.

TABLE 9 - SELECTED INDICATORS OF PROPERTY TAX ASSESSMENT CHANGE, 1961 to 1971
Percent increase or decrease (-1 Percentage increase or decrease (-) Percentage increase or decrease (-) Percentage increase or decrease (-1 in sales-based assessment-sales
in per capita locally assessed in median intra-area coefficient of in inter-area coefficient of ratio for all real properties -
taxable real property values, dispersion, 1961 -1971 dispersion, 1961- 1971 1961-1971 1961 t o 1971 1966 to 1971 (single-family nonfarm houses) (single-family nonfarm houses)
State % change State % change State % change State % change State % change
Ave.-Median -Mean
Oregon Kentucky New Jersey Georgia Washington Mississippi New Hampshire Florida Vermont Alaska
Maine New Mexico Hawaii Tennessee North Carolina Virginia Massachusetts Michigan West Virginia lndiana
Wisconsin District of Columbia Nevada Nebraska Maryland Connecticut Alabama California Texas Idaho
Ave.-Median -Mean
Oregon Kentucky Washington New Jersey Georgia New Mexico New Hampshire Florida North Carolina Michigan
Massachusetts Virginia Nevada Vermont California Hawaii Montana Maine Tennessee Kansas
West Virginia Ohio Maryland Nebraska District of Columbia lndiana Utah Texas lowa Alabama
Ave.-Median -Mean
Oregon Washington Michigan New Mexico North Dakota Tennessee New Hampshire Virginia District o f Columbia Maryland
Kansas Nevada California Massachusetts Ohio Kentucky Georgia South Dakota Nebraska Maine
Mississippi New Jersey lowa Alabama lndiana Vermont Rhode Island West Virginia Illinois Utah
Ave.-Median -Mean
New Jersey Kentucky Oregon New York Georgia Oklahoma lndiana Hawaii Mississippi Vermont
Wyoming Illinois Michigan California Tennessee Louisiana Missouri Massachusetts Nevada Kansas
Mary land Minnesota Florida South Carolina New Hampshire Ohio North Carolina Nebraska Pennsylvania Virginia
(17.2) not computed
(52.2) (42.5) (42.11 (38.3) (35.7) (33.3) (31.2) (30.5) (29.9) (29.9)
(29.2) (28.4) (27.8) (27.6) (27.1) (26.4) (25.2) (24.5) (23.2) (22.8)
(22.5) (18.9) (18.8) (18.5) ( 17.3) ( 1 7.0) (16.5) (16.4) (14.3) (12.9)
Nevada Utah Maine Montana Tennessee Florida Maryland Oregon North Dakota Arizona
l owa Michigan Kentucky New Jersey New Hampshire West Virginia New Mexico California Nebraska Ohio
South Dakota Texas North Carolina Colorado Wisconsin Minnesota Arkansas Kansas lndiana Vermont
(22.6) not computed
(76.2) (73.3) (64.7) (64.7) (62.5) (56.0) (54.5) (54.5) (51.1) (50.0)
(50.0) (47.6) (47.1) (46.2) (41.4) (38.1) (35.3) (33.3) (33.3) (33.3)
(33.3) (32.1) (24.1) (23.1) (22.6) (22.2) (21.7) (18.8) (18.2) (16.0)
- See footnotes at end of table.

TABLE 9 - SELECTED INDICATORS OF PROPERTY TAX ASSESSMENT CHANGE, 1961 TO 1971 (Cont'd)
Percent increase or decrease(-) Percentage increase or decrease I-) Percentage increase or decrease (-) Percentage increase or decrease (-) in sales-based assessment-sales
in per capita locally assessed in median intra-area coefficient of in inter-area coefficient of ratio for all real properties -
taxable real property values, dispersion, 1961- 1971 dispersion, 1961-1971 1961-1971 1961 to 1971 (single-family nonfarm houses) (single-family nonfarm houses) 1966 to 1971
State % change State % change State % change State % change State % change
Arkansas lowa Kansas South Carolina South Dakota M~nnesota Montana Oklahoma Illinois Utah
Wyoming Pennsylvania Missouri
N m Arizona
New York North Dakota Colorado Ohio Delaware Rhode lsland Louisiana
Wisconsin ldaho Mississi~oi
(6.0) Connecticut (9.4) (9.3) Alaska (9.6) (9.3) Hawaii (10.1) . .
North Dakota (11.51 Texas Connecticut (12.7) Idaho South Dakota (12.7) North Carolina Illinois (13.6) New York Minnesota (14.6) Wyoming Wyoming (15.0) Pennsylvania Missouri (16.7) Oklahoma
Pennsylvania Oklahoma Rhode lsland Arkansas Arizona Colorado New York South Carolina Louisiana Delaware Alaska
(16.71 (21.2) (22.7) (26.9) (28.2) 128.5) (30.0) (32.1) (34.4) 135.7)
not computed
Wisconsin Missouri Florida Arizona South Carolina Minnesota Louisiana Delaware Montana Colorado Arizona
Texas ldaho Wisconsin Connecticut Arkansas Montana Colorado New Mexico Alabama Arizona
Washington West Virginia Maine Rhode lsland South Dakota lowa District of Columbia North Dakota Utah Delaware Alaska
Georgia South Carolina Illinois ldaho New York Rhode lsland Pennsylvania Mississippi Wyoming Virginia
Connecticut Oklahoma Missouri Alabama Louisiana Washington Massachusetts Hawaii Delaware Alaska
6.7 16.7 30.8 36.8 50.0 61.5 81.8 83.3
133.3 not computed
not computed District of Columbia not computed -
Source: ACIR staff co rnp~ la t~on based o n U.S Bureau of the Census, 1972 Census o f Governments. Vo l . 2. Taxable Property Va!r/esandAssessment-Sales Price Ratios

-- -
'Patrick J. Lucey, "Property Tax Reform: A Governor's Perspective", Property Tax Reform, Proceedings of a seminar sponsored by the International Association of Assessing Officers and the Fund for Public Policy Re- search (Washington, D.C., July 19731, p. 22.
ZSee also Part I1 of ACIR's Financing Schools and Property Tax Relief-A State Responsibility (1973). 3Another approach to classification, used in West Virginia, applies differential tox rotes to uniform assessed
values. 4Rolland F. Hatfield, "Minnesota's Experience With Classification," The Property Tax: Problems and
Potentials, Proceedings of a symposium of the Tax Institute of America, November 1966 (Princeton, New jersey, Tax Institute of America, 1967). p. 244.
5For another discussion on classification, see ACIR's Financing Schools and Property Tax Relief-A State Responsibility, pp. 71-74.
6In 1971, 41 States conducted ratio studies, the following nine did not: Alabama, Connecticut, Delaware, New Mexico, North Carolina, South Carolina, Oklahoma, Texas, and Wyoming.
7Ronald B. Welch, "Characteristics and Feasibility of a High-Quality Assessment Administration," Property Tax Reform, Proceedings of a seminar sponsored by the International Association of Assessing Officers and the Fund for Public Policy Research (Washington, D.C., July, 19731, p. 50.
8For a good discussion of this topic, see John B. Rackham, "New Technology: Its Management and Use by the Assessor," Property Tax Reform, Proceedings of a seminar sponsored by the International Association of As- sessing Officers and The Fund for Public Policy Research (Washington, D.C., July 1973), pp. 68-75.
9F0r a detailed description of the methodology, see Robert H. Gustafson, "Developing a Central EDP Sys- tem," in International Property Assessment Administration, Proceedings of the 35th Annual Conference of the International Association of Assessing Officers (19693, pp. 34-58; and "Computers and Statistics as an Aid to the Appraiser of Single-Family Residences," The Application of Econometric Methods to the Appraisal Process, International Association of Assessing Officers (1971).
loFor a more detailed description, see H. S. Swett, "A Case Study in State-Local Cooperation in Computer Assisted Valuation Project," presented to the 38th Annual Conference on Assessment Administration (1972).
"For a discussion of land taxes, see ACIR's Financing Schools and Property Tax Relief-A State Respansi- bility, pp. 77-80, and 223-242.
'2Switz V. Township of Middletown.


The Way We Were: Four Decades of Change in the Property Tax
by Ronald B. Welch,
Assistant Executive Secretary, Property Taxes, California State Board of Equalization1
There is a French saying that the more things change the more they remain the same. Many people think that this is an apt description of the property tax. There is some truth in that view-and a lot of untruth, as I hope to convince you by reviewing some of the important changes in property tax institutions in the last 40 years.
I was selected for this assignment not just because of my maturity but mainly beciuse I was employed in 1936 by what was then called the National Association of Assessing Of- ficers (hereinafter called IAAO). This Association had been formed two years before; it will reach its 40th anniversary this fall. What I know about property taxes in 1934 was largely learned during the five years I worked for the association.
Over the four decades 1934 to 1974, the property tax in the United States: has all but disappeared as a State revenue source,
has declined relatively as a source of local governments' general revenue from 68 percent to less than 40 percent,
has increased in dollar amount from $8 billion to $47.25 billion,
has become considerably less "general" as the result of (1) classification, especially of farm land, and (2) exemptions, especially of household personality and business inventories, and
has become much better administered. I will direct my remarks mostly to the last of these changes-the improvement in property tax administration and more specifically the improvement in assessment administration.
LOCAL ASSESSMENT Dl STR I CTS A significant change has occurred since 1934 in the number of local governments con-
ducting the assessment function. When we in IAAO made the first census of assessment districts in 1941, we found 26,034 primary districts and 6,354 overlapping districts in the then 48 Statesz-a number which would have differed very little had the census been taken in 1934. There has been no subsequent census of overlapping districts, but the Bureau of the Census identified 14,496 primary districts in 1966.3 Part of this 45 percent re- duction may have resulted from a difference in definitions,4 but most of it reflected changes in laws or in practices that transferred power from minor local governments to counties.
If IAAO were to make a new census with the same standards we employed in 1941, the count might be even less than 14,496. Five Midwestern States-Iowa, Kansas, Minne- sota, Nebraska, and South Dakota-which in the aggregate had 10,196 districts in 1941 now have only 486; counties and a few large cities have assumed the assessment responsibili- ties in these States that were previously assigned to townships and municipalities. Wis-

consin had 1,791 districts in 1941 and has 49 more today, but a change may be anticipated as the result of recent legislation that makes county assessment districts optional and pro- vides financial incentives for their creation. The counties in New York play a much larger role in property tax administration than they did four years ago and may be ready to as- sume assessment responsibilities before long. There are similar stirrings in several other States that still cling to antiquated assessment districting patterns.
In addition to the emergence of the county as the predominant or exclusive assess- ment district in several States, reductions in the number of districts of inadequate size are beginning to occur by creation of multi-jurisdiction districts. A few such joint districts exist in New Jersey. Michigan local jurisdictions and Tennessee and Kansas counties have legal authority to join together for assessment administration. The big news about joint assess- ment districts, however, comes from Maine, where the State Tax Assessor is directed to create "primary assessing areas" by July 1, 1977, each such area to consist of one or more municipalities.
Montana has just joined Hawaii and will soon be joined by Maryland to make a three- some of States that supposedly have no local assessment districts. However, the county assessors in Montana who are designated as agents of the State tax department are elected to office, and I question whether this is truly State assessment.
There is still room for a reduction of another 10 or 11,000 in the number of pri- mary assessment districts in the country. That would leave us with some 1,500 city and town or multi-municipal districts in the New England States and parts of Alaska, where counties are either non-existent or relatively unimportant, and 2 to 3,000 county or multi- county districts in the rest of the country that is not committed to statewide districts.
A considerable reduction in overlapping assessment districts has also been achieved, but no one to the best of my knowledge has quantified this reform. In California, mainly as the result of improvements in county assessment procedures, persuasive efforts of the State Board of Equalization, and a series of legislative actions sponsored by the Board and endorsed by the League of California Cities, we have practically eliminated the separate city assessment rolls that were almost universal in 1934.5 Several other States-notably Florida, Georgia, Kentucky, and Tennessee -have made great strides in the elimination of this wasteful duplication of effort, but Texas, by far the biggest contributor to the pre- World War I1 total, has made very little p r ~ g r e s s . ~
SELECTION OF ASSESSMENT PERSONNEL
Three changes in the selection of local assessors are noted. There has been a modest reduction in the number of boards of assessors and a corresponding increase in the asses- sors serving as single department heads. New York and Rhode Island have been in the forefront of this change, and Maine will be completely converted by 1977. There has been an increase in the number of assessors who are appointed rather than elected to office, mainly in the midwest -in Iowa, Minnesota, South Dakota, Wisconsin, and, prospectively, Kansas. And there has been a remarkable change in qualifications for the office of assessor.
In 1934, there was one State, Kentucky, in which persons seeking election to the office of county assessor (then called "county tax commissioners" and now "property valuation administrators") had to pass an examination prepared by the State tax commission. This law had been enacted in 1918. There were also a very few cities throughout the United States in which the assessors held civil service positions for which they were examined be- fore appointment. All told, there were probably not over 200 assessors in 1934 who had met formal qualifications other than age, residence, citizenship, sanity, and occasional prop- erty ownership tests.
Aside from some spread of civil service, there was virtually no tightening of assessors' qualifications until 1947. In that year, Iowa revolutionized its assessment institutions. It

converted 1,600 elected township, town, and city assessors' positions into 99 appointive county and 21 appointive large city positions. All candidates for appointment were re- quired to pass an examination given by the State tax department before being selected by local officials. New Jersey, in 1971, required that all assessors, whether elected or ap- pointed to office, be college graduates and hold assessor's certificates granted by the State Division of Taxation. In addition, assessors in Georgia, Michigan, Nebraska, North Caro- lina, and some parts of Illinois must now be certificated by their State tax departments.' Minnesota's assessors must be certified by December 1974, Maine's by 1980. In Kansas, by 1976 or 1977, all assessors are to be certified by the State Director of Property Valuation or are to hold IAAO's CAE designation or a designation by one of the private appraiser societies. A Utah assessor may appraise property worth more than $2,000 only if he holds a certificate from the State tax commission.
In addition to these mandatory assessor certification laws, there are several states in which appraisers in the assessors' offices must be certified. California, Oregon, and Wash- ington require this of all such appraisers, and most assessment personnel in New York must complete a basic course of training and be certificated by the State Board of Equali- zation and Assessment during their first year in office.8 Iowa deputy assessors must be qualified in much the same way assessors in that State are. Civil service laws which ac- complish the same purpose as certification laws are applicable to assessment personnel in Hawaii and will be applicable in Maryland by 1975.
VOLUNTARY CERTIFICATION
These mandatory certification laws were the outgrowth of voluntary certification that has been available in recent years to those who have expended the effort to obtain a pro- fessional designation. The American Institute of Real Estate Appraisers established the prototype certification program in 1932. IAAO instituted its first certification program in 1953 and now offers three professional designations. Twelve State associations of assessors and four State tax departments award certificates to qualifying applicants.9
The State of Wisconsin pays half the cost of assessing in a jurisdiction whose assessor is certified.10 In four other States where certification is voluntary, higher salaries are of- fered as incentives to obtain the State associations' professional designations. An equal number of States offer higher salaries for those who obtain IAAO's Certified Assessment Evaluator award. These bonuses range from $500 to $2,000 a year."
TRAl N I NG Forty years ago there was almost no training available for assessment personnel. For
that matter, there was almost no training available for appraisers of any type. Fee ap- praisers made little or no pretense of professionalism, and assessment work was little more than a clerical function. Today there is almost a plethora of training opportunities al- though exploitation of the opportunities leaves much room for progress. The professional appraisal societies provide numerous opportunities in their conferences, seminars, and formal classroom offerings. Many State tax departments and most large assessment offices have training programs. Education is apparently the major objective of the International Association of Assessing Officers, which offers many courses throughout the country either independently or in collaboration with State tax departments and local educational insti- tutions.
Several State legislatures have made periodic training mandatory for assessment personnel. In California, every State and local property tax appraiser other than elected officers must undergo 24 hours of training annually. Georgia assessors must complete 40 hours of training biennially. Basic training is mandatory for most New York assessment personnel during the first year of employment. To retain eligibility for office, Kansas county assessors (called "county appraisers") will have to complete "recognized" ap-

praisal courses or courses provided by the State Director of Property Valuation at inter- vals determined by the Director.
IAAO reports that annually recurring course offerings are available in 38 other States, often under joint sponsorship of the State association of assessors, the State tax depart- ment, and one of the State's educational institutions.12
LOCAL ASSESSM ENT REV1 EW AGENCl ES There has been a slow but readily perceptible change in the composition of local
assessment appeals agencies. In 1941, I estimated that there were between 55 and 60,000 members of such agencies and that all but about 10,000 of them served ex-officio, mainly by reason of election to a local governing body.13 In several States, the county governing bodies which were the local appeals agencies in pre-World War I1 days are now allowed to appoint members to independent boards. California, Pennsylvania, and Washington have made this change. In Iowa the change to appointed county and large city assessors was accompanied by the transfer of assessment review functions from local governing bodies to appoint independent boards. Georgia board members are no longer appointed by county commissioners; the grand juries have been given this duty. Wisconsin cities and villages may now have boards comprised of appointed citizens in lieu of ex-officio mem- bers. New York has moved away from appeal to boards of assessors themselves or boards of ex-officio membership to boards which have majorities who do not serve ex-officio. Under a revolutionary 1973 law, Maine property owners will soon appeal to a State Board of Assessment Review or a Forestry Appeal Board instead of the county commissioners. l 4
Whether these citizen boards have improved the appellate process much is probably unascertainable, but I am confident that appellants think they have more impartial tribu- nals than the governing bodies and other ex-officio boards that they replaced.
SECOND LEVEL REVIEW AGENCIES There has been a major change in second level assessment appeals agencies over the
last few decades. In 1934, a considerable number of State tax commissions heard appeals from local assessment review or equalization agencies, but I don't recall that there was a single independent State administrative appeal board or specialized tax court in those days. By "independent," I mean in this context that the appellate agency does not have assessment supervisory duties and therefore is not hearing appeals from assessments for which it has some responsibility. Now there are a baker's dozen such agencies.
Concurrent with this growth in boards of tax appeals has been the conversion of as- sessment supervisory agencies from departments headed by boards of 3-to-5 members to departments headed by single administrators. There were a few State tax departments not headed by boards in 1934, but most of them had only vestigial property tax functions that were left after the separation-of-tax-sources movement had taken its toll. When State concern over the property tax was reawakened during the Great Depression and in the post-World War I1 era, the single headed State agency coupled with a multi-member State appeals board became popular. Today some 30 States have property tax agencies headed by individuals instead of boards.
RATIO FINDINGS One of the most dramatic changes in the property tax activities of the State tax depart-
ments has been in the area of assessment ratio studies. In 1934, I doubt there were a half dozen State agencies that were making credible ratio studies-maybe none at all. Some 39 State agencies had inter-district equalization powers,15 but these powers had completely atrophied or were exercised arbitrarily and even clandestinely. In contrast, a recent sur- vey of the Bureau of the Census identified 40 States in which ratio studies were being conducted with some degree of continuity16 and I'm sure with at least a fair degree of

sophistication, thanks in no small part to NATA's Guide for Assessment-Sales Ratio Stud- ies. There is some evidence of greater inter-area equalization to support the view that change has meant progress. In 38 States out of 49 surveyed by the Bureau of the Census in both 1961 and 1971, the coefficient of inter-area dispersion was better in the later year than a decade earlier.''
FULL DISCLOSURE Perhaps the most heartening development of recent years is the compilation and
disclosure of information that a property owner must have to protect himself against over- assessment. The essential information is the average ratio of assessed value to full taxable value in the assessment district in which one's property is located. Lack of information of this type was less of a problem in 1934 than it was in the early post-war years because av- erage assessment levels were closer to the levels prescribed by law in the Great Depres- sion than they were in the inflationary post-war, Korean War, and recent periods. When actual assessed values are far below legal standards, taxpayers may find it very difficult to obtain equity because neither they nor the agencies to whom they can appeal their as- sessed values know at what ratio of full value their properties should be assessed.
Many of the States have coped with this problem to some extent by reducing their statutory assessment standards. In 1941, when IAAO published its first survey of statutory standards, there were only nine States whose assessors were directed or permitted by law to assess real property at fractions of full value.18 Today, after the recent deletion of North Carolina and Washington from the list, there are 29 such States.19 There is nothing magic, however, in legalized fractional assessment standards unless they are enforced. When enforcement is imperfect, as it always has been and probably always will be though in varying degrees, taxpayers have to know what the de facto assessment level is to know whether they are paying more or less than their proper share of the property tax levy. Most of the State agencies which measure assessment levels are publishing their findings. While my own experience in a State where the statutory 25 percent assessment level is comparatively well enforced tells me that the published data do not receive as much at- tention as they should, chances that taxpayers will be misled are reduced by ratio publica- tion.
I am happy to be able to report that assessors recognize the virtues of full disclosure. I think it can safely be said-if for no other reason than that few who were assessors in 1934 will hear me or read what I have said-that you could hardly have mustered a corporal's guard of assessors who would have voted for assessment ratio disclosure 40 years ago. In a survey by IAAO just a few months ago, in answer to the question "Do you favor public disclosure of assessment procedures, most assessment records and assessment ratio study findings?" 84 percent responded in the affirmative.
APPRAISAL AND ASSESSMENT PRACTICES In 1934, there was no assessor in the United States who was using punch cards. (We
called them Hollerith cards in those days.) Pens were the tools used to write many as- sessment rolls, including some of the largest rolls in the United States; typewriters were used for some; and address plates were just beginning to come into vogue. Today hundreds of assessment rolls are written by computers. Sophisticated data processing equipment is also being used by many assessors for a variety of analytical purposes, including the heart of the assessment process, the appraisal of real property.
I wish I could tell you more about developments in the appraisal of property by as- sessment personnel, but I have not been in close enough touch with assessors outside Cali- fornia to have a broad knowledge of current techniques throughout the nation. I do know that even the most advanced assessors were using summation appraisals almost exclu- sively in 1934, with standardized land valuation and building cost estimating techniques in urban areas (euphemistically called "scientific" assessment methods) and classification of

land for application of uniform acreage values in rural areas. Understandably but unjusti- fiably, sales prices were given little credence in this depression wracked period. Income capitalization was practiced intuitively in the appraisal of farm land, but it was seldom used for other income properties and was little understood by assessors or even by the emerging private appraisal profession. More often than not, "appraising" by assessors con- sisted of copying last year's figures or transcribing self-serving declarations by property owners.
Are assessors' appraisal practices much different today? My experience in California and my knowledge of the educational efforts of IAAO and other agencies tell me that they are. The most important turnaround has been the credence given to sales prices. For several decades it was popular in assessors' circles to pontificate on the difference be- tween prices and values. Prices were what gullible persons paid for properties; values were what assessors in their omniscience decided the properties were worth. There a re still some assessors who subscribe to this nonsense, but most of the assessors I know con- cede that sales prices, with all their imperfections, a re the best evidence of value in most instances.
The fruits of this change in philosophy are found in the Bureau of Census ratio studies. The data a re largely limited to single-family non-farm houses. In the first of these studies, which dealt with 1956 assessments, 7.9 percent of all areas for which the data were pub- lishable had coefficients of ratio dispersion of less than 15 percent. Fifteen years later the percentage was 24.7-over three times as large. At the other extreme, 17 percent of the areas had coefficients of 50 percent or more in 1956, while only 3.9 percent-less than a quarter a s many-had this much inequality in 1971. I am confident that data for other types of property would show considerable improvement if they were available.
CONCLUSION
To whom is credit due for the many changes that have occurred in assessment admin- istration? At the risk of omitting some who are deserving of mention, let m e conclude with this list of major contributors:
The International Association of Assessing Officers and its chief executives, the late Carl Chatters, Al Noonan, Ken Back, and Paul Corusy, the mainspring of the move- ment for better assessment administration. The Association's Committee on Assessment Organization and Personnel, which surveyed the path that most of the changes I have described have followed, and es- pecially the committee's chairman, James W. Martin, renowned educator, adminis- trator, and writer. Dr. Frederick L. Bird, who brilliantly illuminated that path in the landmark publi- cation of the Advisory Commission on Intergovernmental Relations, The Role of the States in Strengthening the Property Tax. The staff of the Advisory Commission-William Colman, William MacDougall, Las- zlo Ecker-Racz, and John Shannon, who have imaginatively and eloquently pro- moted the statutory environment in which good property tax administration flour- ishes.
a Allen Manvel, who personally conceived and enthusiastically directed the Bureau of Census studies of the composition and quality of the property tax base in the several States. State tax administrators too numerous to name who have worked patiently and dip- lomatically with local tax administrators too numerous and too self-reliant to be coerced. Several scores of assessors throughout the country and especially in my adopted State who have manned the front lines of tax administration with courage and determination.

~Prepared for delivery at the 42nd Annual Meeting of the National Association of Tax Administrators in Portland, Oregon, June 3, 1974.
2Assessment Organization and Personnel, National Association of Assessing Officers (1941), pp. 38, 63. 3Primary Assessing Areas for Local Property Taxation, G-SS-No. 50 (April 1966). Compare, for example, the numbers for Pennsylvania in the two sources cited. 5111 1935, the first year for which official data are available, 154 out of California's 280 cities were extending
their taxes on rolls that differed from their portions of their county rolls. Today only two cities do this though we now have 130 more cities than we had in 1935.
GSee "Texas," part 11. 'Ibid; IAAO Research and Information Service, The Education and Certification of Assessment Personnel
in the United States (February 1974). 81AAO Research and Information Service, op. cit. glbid; Subcommittee on Intergovernmental Relations of the Committee on Government Operations, U.S.
Senate, Status of Property Tax Administration in the States (March 23, 1973), passim. 'OACIR, State Actions 1973: Toward Full Partnership, p. 27. "IAAO Research and Information Service, op. cit. 12IAAO Research and Information Service, op. cit. '3Assessment Organization and Personnel, p. 246. 1"Subcommittee on Intergovernmental Relations, op. cit., passim. 15Assessment Organization and Personnel, pp. 298, 300. 16Property Assessment Ratio Studies, State and Local Government Special Studies No. 52, p. 8. "Taxable Property Values, 1961, p. 98; 1971, p. 27. In one other State the coefficient was unchanged. In ten of
the States whose coefficients improved and three in which they deteriorated there is no need, as far as I am aware, to equalize local assessment levels; these States use the "variable ratio" method of equalization.
TaAssessors' News Letter (February 19411, p. 13. '9Bureau of the Census, 1972 Census of Governments, Taxable Property Values and Assessment-Sales Price
Ratios, Part 2, pp. 4-5. There are two or three States whose standard is so ill-defined that it is impossible to clas- sify them with certainty.


PART I I
PROPERTY TAX DEVELOPM ENTS I N SELECTED STATES
STUDY METHODOLOGY This report, like Volume 2 of The Role of the States in Strengthening the Property
Tax, presents descriptions by States of some of the recent developments in property tax policy and administration. An attempt has been made to recognize what many States have been doing since that 1963 publication. The majority of the State reports were written in 1972, but were updated through October 1973 taking into account recent legislative action and the availability of portions of the 1972 Census of Governments.
Rather than just presenting compilations on certain property tax measures as has been the format for a number of recent studies,l this study, like its predecessor of a decade earlier and like Status of Property Tax Administration in the States (prepared by the Subcommittee on Intergovernmental Relations of the Committee on Government Opera- tions, U.S. Senate) attempts to capture some of the rich diversity in our system by report- ing the actions of individual States. While similarities are reported in some instances, the differences and unique features receive more consideration. An advantage of this ap- proach is that interested persons can compare States more readily and at a greater depth than other available sources permit.
The following summaries of selected States are based on a survey jointly sponsored by the Federation of Tax Administrators and the Advisory Commission on Intergovern- mental Relations which asked property tax . administrators to report the significant changes which have occurred in their States since the end of 1962 in the following areas:
1. Distribution of assessing responsibilities: a. Nature of State agency concerned with property taxation,

b. Types of property assessed directly by the State agency, c. Governmental placement of primary local assessing agencies (county, city,
township, etc.), d. Number of primary local assessing jurisdictions, and e. Methods for selection of local assessing officials (elections, appointment, etc.).
2. Coverage and application of the property tax: a. Exemptions or special treatment provisions (including property classification), b. State restrictions on local property tax rate or levies, c. Property tax "relief" provisions not covered by "a" or "b," and d. Application or coverage of State-imposed property tax.
3. State supervision of and assistance to local assessors: a. State agency powers to supervise local assessment, establish and enforce stan-
dards of appraisal and assessment performance, or equalize local assessments, b. Reassessment programs mandated or sponsored by the State, c. State requirements as to local assessment records' (tax maps, forms etc.), d. State imposed requirements as to qualifications of local assessment personnel, e. State technical assistance programs (training, mapping, reappraising, etc.), and f . Availability of State agency personnel to appraise complex properties legally
subject to local assessment.
4. Assessment levels and variations: a. Legal requirements as to level of assessment, b. State conducted assessment ratio studies (extent, nature, frequency, application
of findings, etc.), c. Actual assessment performance (statewide average level, inter-area differences,
intra-area dispersion, etc.), and d. Arrangements for inter-area "equalization" of assessed valuations.
5. Availability of property tax data for taxpayers and the general public: a. Information provided directly to individual property owners or taxpayers, b. Data on assessed valuation of taxable property, c. Data on value of exempt classes of property, d. Statistics on property tax levies and/or collections, and e. Data on assessment levels and variations for particular areas.
6. Review and appeal of particular assessments: a. Organization of review agencies, local and State, b. Conditions needed to obtain review or adjustment of assessments, c. Admissibility of State assessment ratio data as evidence for taxpayer appeals,
and d. Notification of taxpayers concerning appeal rights.
Data on budget and personnel were also requested. In addition, the survey asked for the tax administrators' impressions of the significance of the specific changes mentioned in serving the objectives of good property tax administration.
The survey materials were supplemented by correspondence, official reports, legis- lative bills, and other published materials such as the State Tax Reporter of Commerce Clearing House, the recent Census of Governments, and Governmental Finances of the Bureau of the Census.
Because of budget and staff limitations, this report is not completely comprehensive, so it is worth repeating the introductory comments from the study of a decade ago:

Because of the limited nature of this exploratory study, a policy has been fol- lowed of selecting representative situations for special attention and of concentrating mainly on what appear to be especially significant features of the various State pro- grams. Thus, in some instances the emphasis may be on a particularly effective tax study; in others, on pertinent policies or technical procedures; and in still others, on important administrative features. The scope of the project has not permitted comprehensive study of the property tax in any State; thus some notable develop- ments may have been omitted.
The variation in length of the summaries is not necessarily indicative of the rela- tive importance of the programs, but rather reflects the policy of selecting repre- sentative developments of particular interest for special attention. Nor does the mention of activities in one State and not in another necessarily mean that they are not carried on in the latter, since no attempt has been made to present uniform, all- inclusive report^.^
1For instance, see Education Commission of the States, Property Assessment and Exemptions: They Need Reform (1973); Property Taxation Committee of the National Tax Association-Tax Institute of America, The Erosion of the Ad Valorem Real Estate Tax Base (1973); and the Advisory Commission on Intergovernmental Relations, Federal-State-Local Finances: Significant Features of Fiscal Federalism, 1973-74 Edition.
2Advisory Commission on Intergovernmental Relations. The Role of the States in Strengthening the Prop- erty Tax, Vol. 2 (19631, p. 1.

from which a crop is harvested.] In addition, the prohibition against granting senior citi- zen property tax relief to households receiving public assistance grants containing a prop- erty tax allowance was removed.
According to the latest Census of Governments available (1967 budget limitations prevented its collection in 1972) there were 1.2 million pieces of locally assessed realty in Alabama. Of these parcels, 54 percent were non-farm residential and they accounted for 57 percent of the total assessed value of real estate. Acreage and farms comprised 30 per- cent of the parcels but only 17 percent of the assessed value, and vacant lots accounted for 11 percent of the number of properties but less than 2 percent of the value. Commer- cial and industrial properties, with less than 4 percent of the number of realty parcels, contributed almost 24 percent of the local assessed value of real estate.
ASSESSMENT RESPONSIBI LIT1 ES
There have been no significant changes during the past decade in Alabama's organiza- tional structure for property tax assessment administration.
Primary assessing responsibility is lodged with 67 elected county assessors. Although almost half of the counties have fewer than 25,000 inhabitants, none have less than 10,000, so that the local organizational structure is considered marginally viable.
The State Department of Revenue, through its Ad Valorem Tax Division, is responsi- ble for supervising and providing technical assistance to the county assessors. The Ad Valorem Tax Division is also responsible for assessing railroads and other utility prop- erty, as well as equalizing the county assessment rolls. As the result of a landmark de- cision of the U.S. District Court,2 the Department of Revenue was ordered to supervise a complete property reappraisal and legislation was enacted to carry out this decision. Act 160, passed in the third special session of the legislature in 1971 requires a statewide re- appraisal program and gives the Department of Revenue the responsibility for supervising the program. The Department is required to prescribe procedures and set standards for the appraisal firms. The Department may itself take over the reappraisal job in any county where the assessor fails to undertake the job. The law provides for an annual appropriation of $250,000 to the Department of Revenue to carry out its reappraisal duties. A fund was also established from which counties can borrow in order to finance their re- appraisal programs at 5 percent interest to be repaid over a ten-year period.
Except for its responsibilities with respect to the current statewide reappraisal pro- gram, there has been no significant change in the State's supervisory duties during the past decade. The Department of Revenue assists county assessors with their appraisal duties, requires that they maintain maps, and provides an assessment manual. It does not conduct training programs, nor does it certify local assessors as to their qualifications.
The Ad Valorem Tax Division has a professional staff of 28 appraisers. Its regular 1971-72 budget was $690,000, about 0.5 percent of State-local property tax collections.
ASSESSMENT LEVELS AND VARIATIONS Legal basis. As a result of a series of court actions challenging the inequities of
Alabama's property tax assessments, the constitution was amended in May 1972 to pro- vide for classification of property.
Between 1960 and 1967, the statutory assessment level was 60 percent of reasonable and fair value. The Louisville and Nashville Railroad Company brought suit against the State of Alabama, challenging its assessment-which was established by the Department of Revenue at 40 percent-on the grounds that local assessments for non-utility property were generally at a much lower ratio. The circuit court upheld the plaintiff and ordered the Department to reduce the assessment of utilities to 30 percent.3

ALABAMA' Alabama's organization for property tax administration remains substantially as it
was a decade ago. A series of court cases, however, have resulted in a constitutional amendment that changes completely the legal basis for assessment. To bring assessments into conformity with the new mandate, the State Department of Revenue has been given additional supervisory authority for the conduct of a statewide reappraisal program. It is anticipated that this effort will result in a uniformity of assessments within property classes such as the State has not been able to achieve previously.
FINANCING ROLE OF THE PROPERTY TAX As in the South generally, property taxation is not an important revenue source in
Alabama. In 1970-71, State and local property taxes yielded a little less than $41 per capita and $14 per $1,000 of personal income-the lowest in the nation-compared with a nation- al average of $184 per capita and $47 per $1,000. Property taxes comprised only 10 percent of all own-source general revenue of State and local governments, and local property taxes were 22 percent of total general revenue raised by local governments, the latter being the lowest in the nation. These figures cpmpare with nationwide averages of 32 and 64 percent, respectively.
ACIR estimated in Measuring the Fiscal Capacity and Effort of State and Local Areas that Alabama's property tax effort, relative to State-local capacity, was only 37 percent of the national average, again the lowest figure for all the States. Taking account of all State and local taxes, however, Alabama's composite "effort" index was only 11 points below the average for all States.
Alabama's low property tax burden is attributable to the State government's domi- nance in the financing of education and other public services. The State finances more than 70 percent of the cost of elementary and secondary education, largely from consumer and income taxes. In fiscal 1971, 74 percent of Alabama's State-local taxes was raised at
the State level while the average State share was 54 percent.
THE PROPERTY TAX BASE
The State constitution requires the exemption of real and personal property of the State, counties and municipalities, as well as property devoted exclusively to religious, ed- ucational or charitable purposes. Statutory exemptions also apply to many other types of property, including special industrial exemptions and a $2,000 homestead exemption (from State ad valorem taxes only). A 1971 statute increased the homestead exemption to $5,000 for homeowners aged 65 and over.
In 1973, numerous provisions extending Alabama's compassion exemptions were made. First, the $5,000 homestead exemption was extended to those permanently and totally disabled and the blind. Second, a total exemption is granted to those 65 and older or to the totally disabled if their gross income was $5,000 or less for the preceding year. (Also totally exempt from property taxes is any tree, bush, vine or other growing thing

The 1967 legislature subsequently changed the statutory ratio to "not to exceed 30 percent of its reasonable and fair market value." This law was challenged in the U.S. District Court on the grounds that it was too vague (i.e., assessments could vary from 0-to-30 percent). The Court found for the plaintiffs, enjoined the State from enforcing the law, and ordered the Commissioner of Revenue to equalize all taxable property in the State.4 As evidence of the lack of uniformity of assessments the Court cited a 1969 assessment ratio of the Department of Revenue, which indicated a range in median county assessment ratios of from 6.7 percent to 26.8 percent, with a statewide median of 16.9 per- cent.
In a special session called by the Governor, the 1971 legislature enacted a classifica- tion amendment which established three classes of property: (1) public utilities-to be assessed at 30 percent of market value, (2) all property not otherwise classified-25 per- cent; and (3) all agricultural, forest and residential property-15 percent. The amendment also limits the total amount levied on property to 1.5 percent of market value, replacing previous specific limitations on millage levied against assessed value.
This amendment was approved by the electorate in May 1971, and, as noted above, a statewide reappraisal program is now being conducted to bring the assessed values of all properties into conformity with the new classification requirement.
State assessment ratio study. There is no statutory requirement for the conduct of periodic assessment ratio studies. As noted above, the Department of Revenue conducted a fairly extensive study in 1969 in response to the claims of inequitable assessments. Its results can only be considered as indicative of assessment ratios for urban residential and rural farm real estate since there were insufficient sales of commercial and industrial properties. Although the 1969 study was not published as such, it was made available to all interested parties-and was admitted as evidence in the Susan Lee case.
Assessment variations. The 1969 assessment ratio study of the State Department of Revenue indicated a median ratio of 16.9 percent-not appreciably different from the median area ratio of 17.7 percent reported for non-farm houses in the 1967 Census of Governments. Since the 1967 Census data were for 1966 assessments, that measurement was taken at a time when the legal standard in Alabama was still 60 percent.
The State study did not report measures of dispersion, either between counties or within counties. It does, however, indicate a considerable scatteration of county median ratios as described above. The 1971 Census of Governments indicated similar scattera- tions. The coefficient of inter-area dispersion calculated by the Census Bureau for 1971 was 26 percent. The intra-area dispersion-the scatteration of ratios for non-farm houses within a county-was 28 percent, much higher than the 20 percent average for all sample areas in the nation.
REVIEW AND APPEAL OF PARTICULAR ASSESSMENTS
There has been no significant change during the past decade in the mechanics for appeal of a particular assessment. Appeals are initially taken to a three-member county board of equalization and from there to a Circuit Court of Appeals in the county.
'Part of the information for this report was provided by Carrol H. Stough, Ad Valorem Tax Division, Ala- bama Department of Revenue.
%usan Lee. et 01 v. Boswell, June 29, 1971. JLouisville and Nashville RR Co. v. State of Alabama, April 5, 1967. *Susan Lee, et a1 v. Boswell, June 29, 1971.

Alaska is unique among the States in having organized local government for only a minor fraction of its total territory. Lacking any State property tax, it has also made ex- tremely limited provision for any central supervision or coordination of property taxa- tion by its local governments. However, the State does annually conduct and publish results from a n assessment-sales ratio study. The findings suggest a relatively close rela- tion between assessed and market value of transferred realty, and less variation of assess- ment level within and among assessing areas than appears in numerous other States.
FINANCING ROLE OF THE PROPERTY TAX
Like States in the South, property taxation in Alaska is relatively less important in the State and local revenue structure. For instance, the property tax yielded $106 per capita and almost $24 per $1,000 of Alaskan personal income while the national average was $184 per capita and $47 per $1,000. Property taxes in Alaska amount to only 10 percent of all general revenue raised by State and local governments, which was the lowest figure for all the States. Property taxes amount to 40 percent of the revenues raised by Alaska's local governments. (The national averages were 32 and 64 percent, respectively.) In con- siderable degree this lack of emphasis on the property tax reflects the predominant fi- nancing role of the State government which does not use the property tax. The State does generate more than 70 percent of all State-local tax collections as compared to a national average of 54 percent in fiscal 1970-71. In turn, this situation partly reflects the fact that nearly one-fourth of Alaska's inhabitants reside in areas without organized local govern- ment. Such "unorganized" territory, most of it publicly owned, comprises 85 percent of Alaska's land area. A considerable number of residents, making up one-sixth of the State's total population in 1970, live on Federal military sites.
In an ACIR study, Measuring the Fiscal Capacity and Effort of State and Local Areas, it was estimated that Alaska's property tax load, relative to capacity, was less than two- thirds of the national average, the lowest figure in the U.S.; its composite effort index for all types of State and local taxes, however, was slightly above average.
Alaska has far fewer local governments than most other States-a total of 125, con- sisting of 75 very small municipalities which lack property taxing power and 50 other jurisdictions which have the power to levy property taxes. The latter group includes 40 municipalities, eight "organized boroughs" (corresponding generally to county govern- ments in most other States), and two composite municipal-borough governments. Former- ly independent school and public utility districts are now part of the borough type gov- ernments and of the larger municipalities. Local use of property taxation for school fi- nancing, however, tends to be limited both by substantial State aid for schools and by authorized local government general sales taxes.
THE PROPERTY TAX BASE
Alaska's constitution and laws provide for the usual kinds of "complete exemptions" for property holdings of governments, churches, and other charitable and educational agencies. Statewide exemption is provided also for oil or gas produced (including petro- leum mineral rights), but there is a State 'excise tax which applies to oil and gas produc- tion.
Under a 1967 law, owners of farm land may obtain an assessment which varies with the land's value in farming. If such land is sold, leased, or otherwise disposed of for non- farm uses, the owner is liable for any additional tax which would have been due in the absence of such farm-use valuation for the current tax year and two preceding years. (In

1971, local assessors received 28 applications for such preferential assessment, and ap- proved 12.)
Aside from the foregoing provisions, the State's legal provisions permit an unusual (if not unique) degree of local option in regard to personal property. Some jurisdictions exempt such property entirely while others exempt such components as aircraft, boats, motor vehicles, and household property. There is also variation in the local property tax coverage of timber with alternative kinds of taxes being used in some jurisdictions. In 1965, local exemptions of property owned by nonprofit organizations used "exclusively for community purposes" was authorized. In 1971 local exemption of "historic sites, build- ings, and monuments" was provided. Two boroughs have provided localized "property tax relief" for elderly homeowners by granting a deduction against taxes due on their residences.
Since January 1, 1973, there has been a statewide exemption for senior citizen house-, holds if their gross annual income is $10,000 or less. As of January 1, 1974, the gross in- come eligibility provision was removed.
In 1971, locally assessed real estate accounted for a little more than 80 percent of the statewide total of assessed valuation with personal property making up the rest. These percentages have remained constant over the last ten years.
The 1967 Census of Governments (updated data were not collected for the 1971 Census) identified 77,000 parcels a - t axab le realty in Alaska, of which 42 percent were non-farm residential properties, 44 percent were vacant lots, and 11 percent were acreage or farm properties. Business realty, though making up only 3.7 percent of all the parcels, accounted for 29 percent of all assessed valuations of taxable realty.
Between 1961 and 1971, the statewide total of assessed valuations multiplied fourfold, while Alaska's population increased about one-third. The net result was nearly a tripling in the per capita amount of taxable values from about $2,600 in 1961 to nearly $7,800 in 1971. This resulted partly from a geographic enlargement of areas subject to property taxation and partly from an increase in assessment levels during the earlier part of the decade. Accordingly, the full value of realty and personal property potentially subject to property taxation went up about 260 percent between 1961 and 1971.
Assessing Responsibilities
Administration of the property tax in 1971 was delegated entirely to the 24 local assessing jurisdictions-the ten boroughs (including two composite city-boroughs) and 14 cities located outside the organized boroughs. All except one of the former have an as- sessing officer appointed by the borough chairman or manager. One borough and the 14 cities located outside boroughs have authority to appoint assessors but instead have thus far utilized services of private assessment firms by contract.
Sixteen of these local assessing areas have fewer than 5,000 inhabitants apiece and nine have less than 1,000. Only one of the areas (Greater Anchorage Area Borough, with one-third the State's population] has more than 100,000 inhabitants, and only one other has as many as 25,000 people. An additional borough with a population of approxi- mately 3,000 was incorporated in 1972.
No State office in Alaska has explicit power to supervise local assessment work. How- ever, within the Division of Local Government Assistance, Department of Community and Regional Affairs, a three-person staff headed by the State Assessor does carry on some closely related operations. In particular, as more fully described below, it conducts an assessment-sales ratio study which is used to adjust the State's equalizing grants for public school support. In addition, besides providing some advice and assistance to local

assessors, it regularly assembles and publishes information on local property valuations and tax rates. The 1972 budget for the Office of State Assessor is $74,000-equal to 0.22 percent of the statewide amount of annual property tax revenue.
With technical help obtained from a private appraisal firm, the Local Affairs Agency in 1963 developed a Property Appraisal Manual for Alaska Assessors. The residential section of the manual has been used by most local assessing jurisdictions. Updated man- uals for residential appraisal have also been developed and supplied to local assessors, but funds needed for revision and updating of the commercial part of the manual are not yet available. Other services by the Office of the State Assessor (in the Department of Community and Regional Affairs) have included the provision of several training semi- nars for appraisal personnel, research and preparation of fiscal notes on proposed legis- lation, interpretation of relevant statutes, assistance in administration of mapping and re-assessment, projects, tax base surveys of areas proposed for annexation, conducting natural disaster damage surveys, locating qualified local assessment personnel, and re- questing opinions of the attorney general.
The State Assessor has expressed the view that:
To achieve the greatest equity and equalization of assessments statewide, incen- tives should be provided by the legislature which would lead to local adoption of uniform standards of assessment methods and procedures concerning the adminis- tration of the property tax.
ASSESSMENT VARIATIONS
For nearly a decade, the Local Affairs Agency and its successor, the Department of Community and Regional Affairs, has conducted an annual assessment-sales ratio study covering all parts of Alaska having organized local government. The findings are pub- lished, and by law provide a basis for adjustment of State grants for local school support. Being shared in detail with local assessors, the ratio study also provides background for their specific appraisal efforts with regard to taxable realty.
The study involves an effort to assemble sales-price and assessed value information concerning all ordinary arms-length transfers of taxable realty, and includes a mail can- vass of the parties to such transactions for needed data, including the total price involved in each transfer. This undertaking lacks the benefit available in numerous other States of price information that would result from a tax on real property transfers. Attempts to enact such a tax have thus far failed.
Annually published findings include a distribution by assessment ratio of measured transfers in each assessing jurisdiction and their respective cities or other local areas (including the "service districts" within the more populous boroughs]. Computed medians and dispersion measures for each such area, with figures usually shown separately for im- proved and unimproved properties, are also available. Resulting median ratios are ap- plied to the assessed valuations of the respective areas to arrive at estimates of the full value of taxable realty. In turn, these amounts are added to figures concerning the as- sessed and estimated full value of personal property for each assessing jurisdiction to derive an estimate of total taxable value and an overall assessment ratio which enters into the calculation of State grants for local public schools. (For this purpose, local as- sessments of personal property are treated as having been made at a 100 percent rate.)
The findings appear to indicate a -relatively close approach to the legal mandate that "property shall be assessed at its full and true value." The estimated statewide average ratio for 1971 was 90.4 percent, having dropped off from an estimated 1968 average of 93.8 percent. According to the Department of Community and Regional Affairs this trend

reflects additional locally provided exemptions of personal property rather than any significant lag in the level of real property valuations. The Department estimated that the 1971 average ratio of realty was 94.6 percent.
The published data also suggest relatively limited variation of assessment levels for taxable realty insofar as this may be inferred from measurable sales. In 1971, for all but one of the ten boroughs and three of the 13 smaller assessing areas, the median ratio shown for transferred realty was within a few points of the statewide average of 94.6 percent. Furthermore, of the 79 specific coefficients of dispersion reported (generally re- lating separately to transfers of unimproved properties in particular local areas), seven were more than 30 percent, nearly one-third were less than 15 percent, and another third between 15 and 20 percent. These distributions are confirmed by an inter-area co- efficient of dispersion estimate of 13 recorded in the 1972 Census of Governments. The detailed distributions show some transferred properties with an assessment ratio differing considerably from the prevailing local valuation level. (The intra-area coefficient of dispersion estimated by the 1972 Census of Governments was 24.) However, the overall record seems to confirm that variations can be minimized where there is an official effort at full-value assessment.
AVAILABILITY OF PROPERTY TAX DATA
The Department of Community and Regional Affairs publishes annually the findings of its regular assessments ratio study in considerable detail. For 1971, the resulting data appeared in a report entitled Alaska Taxable, which also included background infor- mation on some significant aspects of property taxation and the State's property tax arrangements, statistics on the bonded indebtedness of local governments, and a descrip- tion of various items of proposed legislation that would affect local financing or property taxation, including a draft "model" bill for a real estate transfer tax.
This agency also issues annually a.three-year summary of local property and sales tax rates.
REVIEW AND APPEAL OF PARTICULAR ASSESSMENTS
Local governing bodies in Alaska (the borough assemblies or city councils) have traditionally served ex-officio as boards of equalization to consider taxpayers' assessment appeals. By a 1971 enactment, the legislature authorized any borough assembly to delegate this authority to a board appointed by it for that purpose. There is no State body for re- view of particular assessments. Any appeal from a determination by a local board of equalization must be taken directly to the courts.
'Part of the information for this report was provided by S. Robert Dozier, State Assessor, Alaska Depart- ment of Community and Regional Affairs.

In 1967, the Arizona legislature reorganized the State structure for supervising assess- ment administration. It established two independent agencies-a State Department of Property Valuation and a State Board of Property Tax Appeal. The powers and responsi- bilities of the Department of Property Valuation were strengthened considerably, giving the State of Arizona the potential for vastly improved property tax administration. Al- though the potential is there, the State still has a long way to go toward equalizing assess- ments within and among property classes and keeping taxpayers informed regarding as- sessments levels.
FINANCING ROLE OF THE PROPERTY TAX
Arizona makes somewhat lower than average use of property taxation. In 1970-71, property taxes comprised 30 percent of all general revenue paid to the State and its local governments, and local property taxes were 58 percent of locally raised general revenue. These figures compare to nationwide averages of 32 percent and 64 percent respectively. The per capita property tax yield was $178 while the yield per $1,000 of personal income was $51 in Arizona. The national averages were $184 and $47 respectively. Arizona is one of only a dozen States that levy a general property tax for State purposes with State prop- erty taxes amounting to about 20 percent of total State-local property tax revenue in 1970- 71.
A recent ACIR study (Measuring the Fiscal Capacity and Effort of State and Local Areas) indicated that Arizona's property tax effort relative to capacity was 14 percent above the national average. Because per capita property tax collections have been grow- ing at a slower rate than the State's economy since the estimates were made, the effort index would probably be close to the U.S. average now.
THE PROPERTY TAX BASE
Arizona provides the usual full exemptions for governmental, charitable, and educa- tional property. In addition, all household personalty is exempt from property taxation. Although motor vehicles are exempt from local general property taxes, they are subject to an annual uniform statewide tax of 4 percent of value (based on depreciated manu- facturer's list price]. The "uniform auto lieu tax" is administered by the county assessors and the proceeds are shared by both State and local governments. Since 1967, mobile homes have been subjected to local general property taxes rather than to a uniform auto lieu tax.
Veteran's homestead exemptions, which were available to all veterans and their widows prior to 1972, now apply only to World War I veterans, disabled veterans, and veterans' widows.
In 1973, Arizona enacted a one-time 25 percent reduction in taxes on owner-occupied residential property applicable only to the 1972 tax year.2 The major portion of the cost (about $40 million) is to be financed by the State's share of Federal revenue sharing.
During the same year the legislature also established a property tax circuit-breaker program for the low-income elderly homeowners and renters (age 65 and older) to take effect in 1974. A State income tax credit is available for those with property valued at less than $5,000 of assessed value. For a married couple the schedule is as follows:

Household Income $ 0-2,500
2,500-3,000 3,000-3,500 3,500-4,000 4,000-4,500 4,500-5,000
Percent of Tax on $2,000 of Assessed Value
100% 90% 70% 50% 40 % 30 %
Renters can count 25 percent of gross rent as an accrued property tax up to a limit of $2 25.
Arizona is one of the few States that compile data on the valuation of fully exempt properties. For 1971 the total in Arizona was equivalent to 22.5 percent of the total taxable valuation. Of the total exempt valuation:
a) 25 percent was for governmental bodies;
b) 12 percent was for educational institutions;
c) 63 percent was for religious, charitable, hospital, cemetery, and related or- ganizations.
Almost 38 percent of Arizona's taxable valuation in 1971 represented State assessed railroad and utility property, producing mines, mining claims, and standing timber. This is a much higher proportion than in most States; the national average is 8 percent. Under the Arizona property tax classification system, in effect since 1967, such properties are assessed at a much higher ratio to market value than is locally assessed commercial, in- dustrial, residential, and farm property.
Locally assessed realty accounted for 55 percent of all taxable values and personalty only 8 percent.
The 1967 Census of Governments reported 643,000 (more current data are not avail- able) parcels of locally assessed real estate in Arizona. Residential property comprised 53 percent of the number of parcels and 68 percent of the gross assessed value, while acreage and farms accounted for 10 percent of the properties and only 7 percent of the assessed value. Vacant lots, with 36 percent of the number of properties had less than 4 percent of the value, and commercial and industrial properties comprised only 1 percent of the number but 21 percent of the value.
ASSESSMENT RESPONSIBI LIT1 ES
As was noted in the ACIR study, The Role of the States in Strengthening the Property Tax, steps were being taken at the time that study was underway to change dramatically Arizona's State organizational structure for dealing with property tax assessment admin- istration.
The Arizona Supreme Court held in a January 1963 decision that property tax assess- ments were inequitable because the Arizona constitution provides a basis for property tax classification by stipulating that, "all taxes shall be uniform upon the same class of property within the territorial limits of the authority levying the tax . . ."3 The court ruled that the legislature should either bring all assessments to full value or that it "exercises its authority and establishes classifications of property which permit an assessment at a different percentage of full value . . ."4 The legislature acted soon thereafter, establishing 26 property classes and calling for a revaluation of all property subject to taxation.

In 1967, the legislature consolidated 26 classes into four, as follows:
Class 1 5
25
Type of Property Railroads, producing mines and mining claims, flight property, private car companies. Public utilities and pipelines.
Commercial and industrial property (including apartment houses). Agricultural, owner-occupied residential and any other prop- perty not included in classes 1-3.
Percent of Full Cash Value
A significant part of the 1963 legislation called for the establishment of an independ- ent Division of Appraisal and Assessment Standards within the State Tax Commission. The director was appointed by the Governor, rather than by the Commission, and was charged with the following duties:
I) to ascertain the methods and procedures followed by the Tax Commission and each of the county assessors;
2) to ascertain the percentage of full cash value at which the various types of prop- erty were assessed by the Commission and each of the assessors;
3) to proceed with the preparation of uniform maps, assessment records, appraisal manuals, and training programs for county assessors and their staff;
4) to proceed with the classification, revaluation, and reassessment of property throughout the State;
5) to assist the Commission and the county assessors in performance of their duties.
The legislature appropriated $1.5 million to finance the Division's work.
In 1967, all major responsibility for property tax administration was removed from the State Tax Commission when the legislature redesignated the Division as the Depart- ment of Property Valuation.' The Department assesses the property of railroads, public utilities and pipeline companies, as well as standing timber. In 1973, a Department of Revenue was created and the powers and duties of the Department of Property Valuation were to be transferred to it effective July 1974.
The 14 counties are the primary local assessing jurisdictions, each with an elected assessor who is closely supervised by the Department of Property Valuation. In 1971-72, the Department had 101 employees with a budget of $1.7 million-about 0.4 percent of State and local property tax collections. (In fiscal 1962, the State Tax Commission had only one staff member responsible for property tax matters and acting as liaison between the Commission, the State Board of Equalization and the local assessors.)
Inter-county equalization is now the function of the State Board of Tax Appeals, which was also established in 1967. This Board is independent of both the State Tax Com- mission and the Department of Property Valuation. Its three members are appointed by the Governor and are required to be selected on the basis of knowledge and experience in the use of property valuation and appraisal procedures.
The State Department of Property Valuation exercises strong supervisory responsi- bility over the work of the county assessors. It prescribes and requires local assessors to

maintain uniform maps and records, prepares and maintains assessment manuals, and re- quires the use of compatible data systems. The Department has its own electronic data processing equipment which it has made available to 11 of the 14 counties.
The Department does not itself conduct assessor training programs nor are local assessors required to be certified by it. It has, however, made available to its own per- sonnel and to personnel of the county assessors' offices the facilities of the International Association of Assessing Officers' educational program to enable them to receive profes- sional certification from the Association.
A new supervisory measure passed by the State legislature in 1973 requires that the county assessor notify the property owner of any increase in property values on the tax roles or change in classification from the preceding year.
ASSESSMENT VARIATIONS Although the Department of Property Valuation conducts continuous ratio studies, it
does not publish the results. It makes the information available to county assessors as a tool for updating assessments.
According to the 1972 Census of Governments, the statewide average assessment-sales ratio for locally assessed real estate (based on measurable sales) was about 11 percent. Residential property indicated a ratio of 19 percent, while agricultural and commercial and industrial property were assessed at much lower levels. This bears out the evidence from the 1972 Census of considerable intra-area variation in assessments-a coefficient of intra-area dispersion for non-farm residential property of 36 percent compared with a U.S. average of 20 percent. There was considerably less variation among the various counties. The coefficient of inter-area dispersion was only 9 percent.
REVIEW AND APPEAL OF PARTICULAR ASSESSMENTS
Taxpayers may appeal their assessments initially to a county board of supervisors, which acts as a board of equalization. Subsequent appeals may be taken to the State Board of Property Tax Appeal, which was established in 1967 as a completely independ- ent body. Effective in July 1974, the duties of the Board of Property Tax Appeals will be assumed by a General Board of Tax Appeals. Appeals may also be taken to the Superior Court.
'Part of the information for this report was provided by Robert Houk, Research Director of the Arizona Tax Commission.
2Laws of 1973, H.B. 2311, Chapter 182. 3Constitution of Arizona, Art. XI, Sec. 1. 'Southern Pacific Company v. Cochise County, et a]. assessed by the Arizona Department of Property Valuation. 6A 1973 statute (H.B. 2311) established a fifth class by separating out owner-occupied residential property
to be assessed also at 18 percent. 7Laws of 1967, Art. 2, Chap. 107.

ARKANSAS' In recent years, Arkansas has continued the State-local collaboration in property tax
administration which was reported a decade ago in ACIR's, The Role of the States in Strengthening the Property Tax. Arkansas laws give important powers and responsibilities to county assessors. The State agency regularly conducts an extensive statewide study of assessment levels and uses the resulting data in its efforts to promote more uniform valu- ation of taxable property. These efforts, however, continue to be handicapped by the limited resources of many local assessing jurisdictions and the absence of any legal re- quirements as to the professional qualifications of county assessors. Because of the stringency of constitutional provisions, there have been relatively few recent changes in the legal scope of the property tax base. Arkansas, like numerous other States, has recent- ly authorized a departure from the market value assessments of farm and timber lands which is legally required for all other types of taxable property.
FINANCING ROLE OF THE PROPERTY TAX
The State-local revenue system of Arkansas involves relatively limited reliance on property taxation. Only 19 percent of all the general revenue raised in fiscal 1970-71 by State and local governments came from property taxes; the corresponding nationwide proportion was 32 percent. In an ACIR study, Measuring the Fiscal Capacity and Effort of State and Local Areas, it was estimated that the average property tax rate in Arkansas was less than half the U.S. norm. On a per capita basis the property tax yields $69 com- pared to a national average of $184; and it yields $25 per $1,000 of personal income com- pared to a national average of $47.
In part, Arkansas' limited use of the property tax reflects the predominant revenue raising role of the State government, which in fiscal 1970-71 collected nearly three-fourths (73 percent) of all State-local taxes; the all-State average is 54 percent. Arkansas' State government is constitutionally barred from levying a general property tax, but receives relatively minor amounts from "special" property taxes on multi-county transportation companies.
Local general property tax levies provide over half of all locally raised general rev- enue in Arkansas; the corresponding nationwide proportion is considerably higher-64 percent in fiscal 1970-71. Some 900 of the 1,283 local governments in Arkansas have prop- erty taxing power.
During the 1960's, per capita property tax yields increased at an annual rate of 6.4 percent, generally paralleling the growth rate of the State's economy, as measured by personal income.
THE PROPERTY TAX BASE
Of all taxable valuations in Arkansas in 1971, about 60 percent consisted of locally assessed real estate, 24 percent of locally assessed personal property, and 16 percent State assessed real and personal property.
The Arkansas constitution (dating from 1874) provides for a broad application of property taxes, outlawing any statutory exemptions and expressly exempting only "public property used exclusively for public purposes; churches used as such; cemeteries used ex- clusively as such; school buildings and apparatus; libraries and grounds used exclusively for school purposes; and public buildings and grounds and materials used exclusively for public charity." Hence, the legal base here comprises kinds of personal property which in many other States have been exempted constitutionally or by statute, such as automobiles,

household personalty, crops, business inventories, and intangible personal property. However, as common in other States having such a broad legal mandate, most intangible personal property is not actually assessed or taxed, and the same is true of much non- business tangible personal property.
The broad constitutional reach of the property tax has also been modified by a number of legal provisions. One is a 1960 law, implementing a 1957 constitutional amend- ment. This law was designed to encourage industrial development. Counties and cities are authorized with voter approval to issue bonds to purchase land and construct industrial properties to be sold or rented to business firms. Any such property has been held to be exempt from property tax while it remains in governmental ownership as being devoted to a "public purpose."
In 1969 the Arkansas legislature also provided by statute that lands actively devoted to farms, agricultural, or timber use should be assessed for property taxation solely according to their value for such use. This law, broadening similar provisions enacted in 1963, requires an application for such preferential assessment by the owner of the land involved. The law further provides that assessors shall record valuations according to both the current use and the estimated market worth of land accorded such classification, but (unlike similar laws in some other States) makes no provision for recapture of addi- tional or "deferred tax" amounts when a change in land use occurs.
Another 1969 enactment provided for the effective exemption of personal property in transit through the State, and of tangible personal property manufactured in Arkansas and stored for shipment elsewhere, by declaring that such property "does not acquire situs" for property tax purposes.
In 1973, the State legislature passed a circuit-breaker proposal to give tax relief to homeowners who are 65 years of age or older if they have been a resident of the State for at least two years and if they have lived in their home for one year or more. If the ad valorem property tax is greater than a given percentage of income, then a credit is available. The amount of the credit is equal to the tax less the percentage of income with dollar maximums which are shown below:
Household Income $ 0-1.500 1,500-2,500 2,500-3,500 3,500-4,500 4,500-5,500
Percent of Tax to Income
1% 2% 3 70 4% 5%
Amount of Maximum Credit Credit
Tax - 1% $400 Tax - 2% $370 Tax - 3% $325 Tax - 4% $260 Tax - 5% $175
The credit is to be used against one's income tax liability but if greater than that lia- bility, the State will pay the claimant a rebate equal to the unused portion.2
The 1967 Census of Governments (the 1972 Census did not update this data) reported a little over 1.4 million pieces of locally assessed realty in Arkansas. Of these, 40 percent were acreage and farm properties, which accounted for 35 percent of all realty valuations. Non-farm residential properties were 23 percent of the parcels on the assessment rolls, but contributed 43 percent of the realty valuations. Vacant lots made up 30 percent of all realty parcels assessed, but contributed only 3 percent of all valuations. Business real estate accounted for 17 percent of all valuations of locally assessed realty.
The increase of assessed valuations in Arkansas during the past decade lagged behind the growth of the State's economy (as measured by personal income) and the rise in prop-

erty tax levies. Accordingly, there was a material increase in the rates applied to official valuations.
ASSESSMENT RESPONSIBI LIT1 ES
Like most States, the task of valuing property is assigned mainly to local agencies, but the State plays a major role in the total process.
Locally, responsibility for property valuation rests with 75 county assessors, each subject to election for a two-year term. Many of these jurisdictions are too small to afford a full-time professionalized assessing operation. More than two-thirds of the coun- ties have populations less than 25,000, including 16 counties of less than 10,000 population, and seven others of 50,000 to 100,000.
As indicated by the earlier ACIR report, Arkansas laws assign relatively broad pow- ers for central supervision of assessors to the State Public Service Commission (a three- member appointive body), and provide for the exercise of these powers through an As- sessment Coordination Division. The Commission has a staff of 35 (as compared with 28 a decade ago). Its appropriation of $422,500 for fiscal 1971-72 equalled about 0.32 percent of the total of property tax revenues.
During the past decade the Assessment Coordination Division has maintained the relatively extensive program for training and assistance to county assessing agencies which was described in the earlier ACIR report. It has updated and reissued its assess- ment manuals, and conducted training programs in cooperation with professional as- sessors' organizations. It reports further progress-though still incomplete success-in promoting more adequate and uniform local assessment records.
One important expression of the Division's supervisory role has to do with reapprais- als carried out on a contract basis for individual counties by private firms. The Assess- ment Coordination Division must examine and approve the final reappraisal before the appraisal contractor can be paid in full for his services. A separate Tax Division of the Commission is responsible for the valuation of public utility and carrier properties sub- ject to assessment at the State level. There is no statewide general property tax levy, and most major State taxes are administered by another agency, the Department of Finance and Administration.
With 15 appraisers now on its staff, the Division has been able to furnish increased technical assistance to the county assessors in their valuation of relatively large or com- plex properties.
ASSESSMENT VARIATIONS Legal requirements. Constitutionally, all taxable property is supposed to be taxed
uniformly "according to its value . . . to be ascertained in such manner as the General As- sembly shall direct." The related statutes call for assessment at 20 percent of actual market value, but as noted above, authorize distinctive assessment for farm, agricultural, and timber lands.
State assessment ratio studies. Arkansas has conducted annual Statewide assessment ratio studies since 1957. Unlike such undertakings in most other States that make such studies, the Arkansas operation does not rely upon data from recently sold realty (al- though the State has for several years'had a realty transfer tax), but instead it is based up- on appraisals made by personnel from the Assessment Coordination Division. By law, the survey must deal with a sample comprising at least 3 percent of all the items of tax- able real and personal property on each county's assessment rolls. For sample selection, properties are grouped by type (e.g., realty as residential, commercial industrial, farm-

land, pasture land, timberland, and personalty such as farm equipment, motor vehicles and merchants' stocks, etc.).3
Resulting assessment ratios are regularly published for each county by property class-residential, rural, commercial, and industrial realty, personal property, and public utility property (State assessed at the statutory 20 percent fraction). Average ratios are also developed for individual municipalities and school districts. These data are used to equalize assessments and as factors in measuring relative local taxing effort for the allo- cation of various State-local grants. Furthermore, the Assessment Coordination Division is legally required to order the impoundment of certain State grant funds to any county where its findings indicate an average local assessment level of less than 18 percent (i.e., one-tenth of the statutory fraction of 20 percent), until the assessments have been appro- priately revised.
Assessment levels and variations. The Assessment Coordination Division's recent annual studies have indicated the statewide average is very close to the target statutory level. For 1971, a 19.6 percent overall average ratio was reported, and all 75 counties were close to this figure, with only one below 18 percent. (The 1972 Census of Governments lists a statewide assessment ratio of 16-percent.) Calculated ratios for the several property clas- ses were similar, although in most counties the rural realty ratio was below the ratios calculated for other property classes.
The 1967 Census report showed for "acreage and farms" a statewide average ratio based on measurable sales of only about 7 percent. Most of this divergency undoubtedly reflects the high prices at which many rural properties change hands (the basis for the Census reported data) and may exceed appraised valuation of rural parcels designed to reflect the capitalized value of their productivity, "under average management," in farm use (the governing standard for farmland assessment in Arkansas both for local assessors and the State's appraisers).
The Director of the Assessment Coordination Division, Joe T. Burlingame, in a letter commenting on the State's ratio study findings, has observed:
Even though the State average is acceptable, the study discloses some bad spots in our assessment process. Rural properties are, in a lot of places, below the satis- factory ratio. . . .
We now publish for each county in the State price schedules based on soils, soil capability, production cost and other factors that might enter into the income ap- proach to value rural lands, crop lands, pasture land and timber land. We further take into consideration in our schedules sales data where we have information regarding comparable land, comparable improvements, and comparable soils. . . .
REVIEW AND APPEAL OF PARTICULAR ASSESSMENTS
The Tax Division of the Public Service Commission publishes annually assessed valu- ations on a county-by-county basis, and the Assessment Coordination Division, as noted above, regularly publishes results of its assessment ratio studies. Extensive local finance data, including figures on property tax revenue, also appear in other annual State reports.
Arkansas laws call for the annual filing by property owners of a listing of their hold- ings, with their current values. The laws also require assessors to notify owners specifi- cally of any changes made in the valuations of their property, and to advise them of their right to appeal the official assessments. As is common elsewhere, the assessment rolls are public records, available for taxpayer reference.
Arkansas' arrangements for assessment appeals, which have not been materially al-

tered during the past decade, may be briefly summarized. Property owners can appeal - - - - - locally set valuations to the county equalization board. In each county this is an ap- pointive body of three, five, or nine resident property owners, serving three-year terms and including a member named by the county judge (or three in the case of nine-member boards), and other members designated respectively by directors of school districts and council members of municipalities within the county. An appeal from the board's deter- mination may be taken to the county court. Decision on equalization and State assessed property can be appealed to the State Public Service Commission, from which a further appeal can be made to the Circuit Court.
'Part of the information for this report was provided by Joe T. Burlingame, former Director of the Assess- ment Coordination Division of the Arkansas Public Service Commission.
2Laws of 1973, Act 63 (H.B. 19). 3Arkansas' appraisal operation uses a random sample of various types of assessed properties in about one-
third of the counties and thus covers the entire State each three years. It involves handling about 25,000 items a year, of which two-thirds are real estate parcels. This is several times the number of assessment items dealt with annually under California's appraisal effort, which similarly operates on a triennial cycle. California's operation, covering a scientifically designed size stratified sample that statewide involves only about 5,000 items a year, is about six times as costly as the Arkansas measurement effort. Although part of this striking divergence is undoubtedly the result of pay-rate differences between the two States, most of it probably re- flects far more intensive and detailed valuation of individual sample properties by California's State appraisers. In turn, this results in part from the greater than average representation of high value properties in the sample selected there for examination.
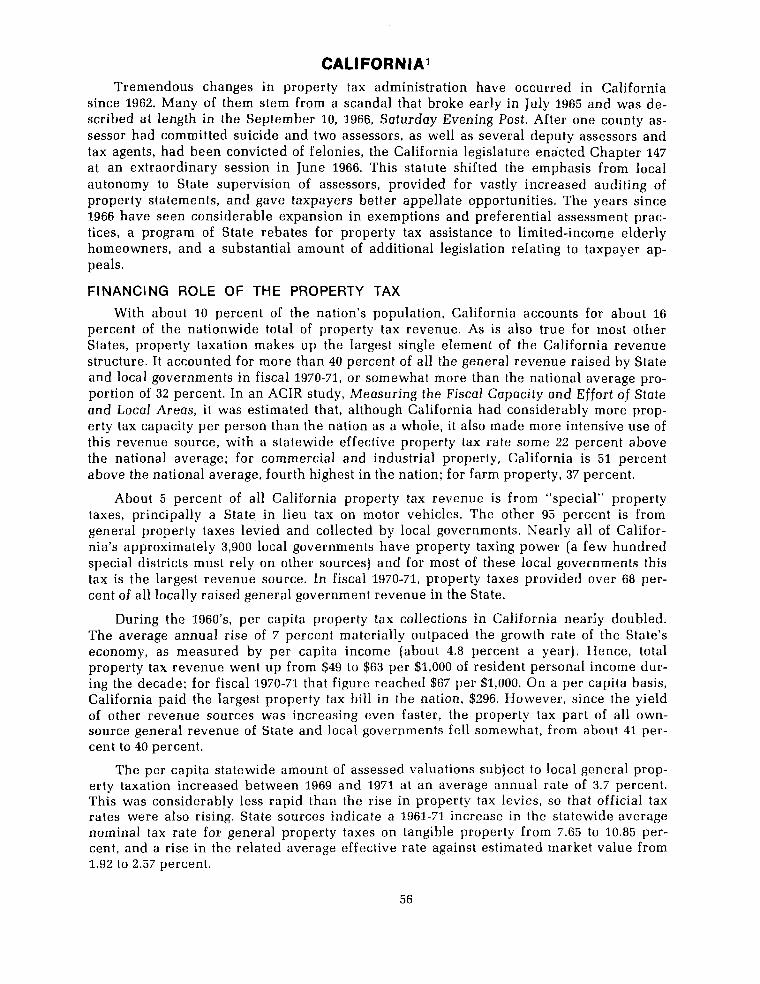
Tremendous changes in property tax administration have occurred in California since 1962. Many of them stem from a scandal that broke early in July 1965 and was de- scribed at length in the September 10, 1966, Saturday Evening Post. After one county as- sessor had committed suicide and two assessors, as well as several deputy assessors and tax agents, had been convicted of felonies, the California legislature enacted Chapter 147 at an extraordinary session in June 1966. This statute shifted the emphasis from local autonomy to State supervision of assessors, provided for vastly increased auditing of property statements, and gave taxpayers better appellate opportunities. The years since 1966 have seen considerable expansion in exemptions and preferential assessment prac- tices, a program of State rebates for property tax assistance to limited-income elderly homeowners, and a substantial amount of additional legislation relating to taxpayer ap- peals.
FINANCING ROLE OF THE PROPERTY TAX
With about 10 percent of the nation's population, California accounts for about 16 percent of the nationwide total of property tax revenue. As is also true for most other States, property taxation makes up the largest single element of the California revenue structure. It accounted for more than 40 percent of all the general revenue raised by State and local governments in fiscal 1970-71, or somewhat more than the national average pro- portion of 32 percent. In an ACIR study, Measuring the Fiscal Capacity and Effort of State and Local Areas, it was estimated that, although California had considerably more prop- erty tax capacity per person than the nation as a whole, it also made more intensive use of this revenue source, with a statewide effective property tax rate some 22 percent above the national average; for commercial and industrial property, California is 51 percent above the national average, fourth highest in the nation; for farm property, 37 percent.
About 5 percent of all California property tax revenue is from "special" property taxes, principally a State in lieu tax on motor vehicles. The other 95 percent is from general property taxes levied and collected by local governments. Nearly all of Califor- nia's approximately 3,900 local governments have property taxing power (a few hundred special districts must rely on other sources] and for most of these local governments this tax is the largest revenue source. In fiscal 1970-71, property taxes provided over 68 per- cent of all locally raised general government revenue in the State.
During the 1960's, per capita property tax collections in California nearly doubled. The average annual rise of 7 percent materially outpaced the growth rate of the State's economy, as measured by per capita income (about 4.8 percent a year). Hence, total property tax revenue went up from $49 to $63 per $1,000 of resident personal income dur- ing the decade; for fiscal 1970-71 that figure reached $67 per $1,000. On a per capita basis, California paid the largest property tax bill in the nation, $296. However, since the yield of other revenue sources was increasing even faster, the property tax part of all own- source general revenue of State and local governments fell somewhat, from about 41 per- cent to 40 percent.
The per capita statewide amount of assessed valuations subject to local general prop- erty taxation increased between 1969 and 1971 at an average annual rate of 3.7 percent. This was considerably less rapid than the rise in property tax levies, so that official tax rates were also rising. State sources indicate a 1961-71 increase in the statewide average nominal tax rate for general property taxes on tangible property from 7.65 to 10.85 per- cent, and a rise in the related average effective rate against estimated market value from 1.92 to 2.57 percent.

THE PROPERTY TAX BASE
Here, as in most other States, the official base for local general property taxation involves three major components. In 1971, State set valuations for public utility property made up 8 percent of all taxable assessments, locally valued personal property accounted for 10 percent, and locally valued real estate made up the remaining 82 percent. A decade earlier, the respective percentages were 13, 15 and 73. The shift in proportions resulted mainly from a reduction in the ratio that the State Board of Equalization applied to its market value estimates, the exemption of household furnishings and personal effects, and a partial exemption of business inventories.
California's property tax base reflects not only the usual kinds of exemptions pro- vided for property owned by governments, churches, and other charitable and education- al bodies, but also certain "partial" exemptions which, in 1971, altogether reduced by 5.7 percent the gross valuations set on otherwise taxable property. More than half of this was the result of a homestead or homeowners' exemption enacted in 1968; most of the balance reflected exemptions for a portion of business inventory values and for prop- erty of veterans. (See also "Availability of Property Tax Data.").
The 1967 Census of Governments (similar data for 1972 were not collected) showed some 6 million pieces of taxable realty on California's local assessment rolls. More than two-thirds of these were non-farm residential properties (mainly single-family houses), about one-sixth vacant lots and one-twelfth rural acreage or farm properties. Although far less numerous, commercial and industrial properties accounted for about one-fourth of the total real property valuations on local assessment tolls. It should be noted, how- ever, that "business" also accounts for most of the personal property valuations, as well as for State set utility valuations. Taking account of such factors, the previously men- tioned ACIR study estimated that about 43 percent of all California property tax revenue (excluding the special motor vehicle tax) was from business, and about 47 percent from non-farm residential realty, with farms and vacant lots accounting for the other 10 per- cent.
Exemptions and special treatment provisions. Enactments since 1962 have resulted in five significant erosions of the general property tax base and repeal of one special proper- ty tax. The latter action eliminated a lcngstanding low rate local tax on "solvent credits," the last vestage of intangible property taxation in California.
By far the largest curtailment of the general property tax base resulted from a home- stead allowance, approved by the electorate in 1968, by which a tax exemption is granted for $750 of assessed value for each owner-occupied dwelling (including condominium and cooperative apartment dwellings). Assessed values thus exempted in 1971 amounted to nearly 4 percent of the gross total of local assessments of otherwise taxable realty (i.e., exclusive of complete exemptions). Local governments are reimbursed by the State for tax losses from this exemption which presently totals $232 million a year. The 1973 legislature increased the tax exemption to $1,750 commencing with the 1973-74 fiscal year.
Another exemption ratified by the electorate in 1968 dropped from the tax base 30 percent of the assessed value of business inventories. This figure increased to 45 percent in 1973 and will be raised to 50 percent in 1974. The 30 percent exemption involved a re- duction of nearly 17 percent in the valuations of tangible personal property. The result- ing tax losses to local governments-a little over $100 million a year-are reimbursed by the State.
Complete exemption was also granted in 1968 for household furnishings and personal effects, previously taxable except for limited partial exemptions. This assessed value re- duction cut the statewide tax base by about $450 million and thereby occasioned a reduc- tion of around $45-to-$50 million in annual property tax liabilities. There is no State re- imbursement for this tax base change.

In 1966, the constitution was amended to authorize taxation of enforceably restricted open space land used for agricultural, recreational, natural resource, or scenic purposes on the basis of its restricted use. The legislature subsequently provided for assessment of land in the open space program on the basis of capitalized income from the restricted use. It has been unofficially estimated that the 9.5 million acres of land in the program during the 1971-72 fiscal year occasioned a loss of $475 million in assessed value and a tax shift to other property taxpayers or reduction of tax revenues of around $40 million.
A similar constitutional amendment was passed in 1972 which authorized the legis- lature to provide for the assessment of single-family owner-occupied residence at current use rather than best use if the land is zoned exclusively for single-family residences or zoned for agricultural use where single-family homes are permitted.
Several less significant property tax exemptions have been added in the past decade, including: $10,000 of the assessed value of homes of blind or double amputee veterans; works of art offered for display in publicly owned galleries; certain off-highway vehicles used on public land; wine and brandy after it has been taxed in the year following its production; beef cattle and sheep that are subject to a newly enacted head-day tax (the tax is prorated on a daily basis); and racehorses that are subject to a new annual head tax.
Senior citizens tax assistance. Under a 1967 enactment, which was considerably broadened in 1971, limited-income elderly home owners are entitled annually to rebate of a portion of their residential property tax. Under this arrangement, which operates through the State's personal income tax system, homeowners 62 years of age or older with gross household income not over $10,000 ($30,000 for farm income) may not be reimbursed for up to 96 percent of their property taxes on assessed values up to $7,500. The declining rate structure is shown below.
If the total The percentage of If the total The percentage of household income tax on the first household income tax on the first (as defined in $7,500 of value (as (as defined in $7,500 of value (as this part) is not determined for tax this part) is not determined for tax more than: purposes) used to more than: purposes) used to
provide assistance is: provide assistance is: $1,400 . . . . . . . . . . . . 96 70 $ 4,800 . . . . . . . . . . . . 58%
. . . . . . . . . . . . 1,800 . . . . . . . . . . . . 94 5,000 54 2,200 . . . . . . . . . . . . 92 5,200 . . . . . . . . . . . . 5 0
. . . . . . . . . . . . 2,400 . . . . . . . . . . . . 90 5,400 45
. . . . . . . . . . . . 2,600 . . . . . . . . . . . . 88 5,600 40
. . . . . . . . . . . . 2,800 . . . . . . . . . . . . 86 5,800 36
. . . . . . . . . . . . 3,000 . . . . . . . . . . . . 84 6,000 3 2
. . . . . . . . . . . . 3,200 . . . . . . . . . . . . 82 6,500 26
. . . . . . . . . . . . 3,400 . . . . . . . . . . . . 80 7,000 21
. . . . . . . . . . . . 3,600 . . . . . . . . . . . . 78 7,500 16
. . . . . . . . . . . . 3,800 . . . . . . . . . . . . 76 8,000 12
. . . . . . . . . . . . 4,000 . . . . . . . . . . . . 74 8,500 8
. . . . . . . . . . . . 4,200 . . . . . . . . . . . . 7 0 9,000 6
. . . . . . . . . . . . 4,400 . . . . . . . . . . . . 66 9,500 5
. . . . . . . . . . . . 4,600 . . . . . . . . . . . . 62 10,000 4
The cost of this program in fiscal 1972-73 has been estimated at $56 million, averaging about $200 per claimant or $3 per capita.
ASSESSING RESPONSIBILITY
Property tax assessment in California is supervised by the State Board of Equaliza- tion. This is a constitutional agency, dating from 1879, which is responsible for adminis- tering a range of State imposed taxes as well as for facilitating and supervising various

aspects of local property taxation. The Board includes four members, elected by dis- tricts for four-year terms, plus the State Controller serving ex-officio. Its sizable opera- tions are administered through an Executive Secretary. One of the agency's primary units is its Property Tax Department, headed by an Assistant Executive, appointed on a merit basis. This Department assesses public utility property, measures local assessment levels, and supervises and assists local assessing agencies.
The Board of Equalization has nearly 200 employees concerned directly with prop- erty tax matters (including the staff of the Office of Appraisal Appeals as well as of the Property Tax Department), but this is only a few more than were so employed a decade ago. Including also the cost of "central services" provided by other board units, the fiscal 1972 budget for property tax work amounted to $4.2 million, or about 0.07 of the statewide total of general property tax revenue.
There are 58 primary local assessment jurisdictions, one for each of the State's coun- ties (including San Francisco City-County). Before 1969, all California cities were em- powered to do their own property tax assessing and collection, and a decade ago more than 50 cities were doing so. Such power is now available only to charter cities, and at present only four of the 75 such cities utilize this option, while the rest rely upon the counties for assessment and collection services, as do all other property taxing jurisdic- tions in the State.2
Each county assessing agency is headed by an assessor subject to election for a four- year term. Vacancies are filled by appointment of the county board of supervisors and most such appointees survive the next general election. Nearly half of the county as- sessors now serving first entered office by appointment. Reelection is common, and many of the incumbents have served in their present offices for lengthy periods.
Although some of the counties are sparsely populated (some half dozen having fewer than 10,000 inhabitants), most are clearly large enough to maintain an effective assess- ment organization; about half of them have populations of over 100,000. The most popu- lous, Los Angeles, has the distinction of dealing with nearly 2 million parcels of taxable realty-more than any other assessing jurisdiction in the nation.
ASSESSMENT RESPONSI 61 LIT1 ES
Statutory powers. Mainly by a 1966 law (Chapter 147, Statutes 1966, 1st Extra Session) but also by other enactments, the authority and responsibility of the State Board of Equal- ization with regard to local property assessment has been greatly strengthened in recent years. Major changes in this direction include the following:
1. The Board's duty to issue rules to govern assessors and county boards of equali- zation was declared "mandatory."
2. The Board was directed to prescribe the content of property statements "in detail."
3. The Board was directed to survey assessment practices in each county "at least once in six years" and to report the extent to which intra-county uniformity of as- sessment level has been achieved, with the assessor required to respond to the re- port.
4. State certification of all State and local government employees engaged in prop- erty tax appraisal work was made mandatory, with certification to be based on ex- aminations compiled or approved by the board.
5. Certificated appraisers are required to receive 24 hours of training annually, either through courses provided (without charge) by the Board, or through Board approved courses provided by other agencies.

6. The Board may provide auditing and appraising personnel for post-audits of per- sonal property upon request, at county expense, and must report to the legislature all requests for such services.
Reassessment programs. The type of reassessment program once common in the United States-massive revaluation efforts often followed by years of roll copying-is a thing of the past in California. Every county now has a continuing reassessment program. This has resulted from a number of major developments which are still under way invol- ving pioneering technical efforts by some local assessors and the staff of the State Board of Equalization and involving a great deal of State-local collaboration and inter-county sharing of experience.
A decade ago most California counties were using a plan in which the appraisers worked in one part of the county one year, another the next, and made the rounds in four to six years. The cyclical plan increasingly was supplanted by programs involving a more selective allocation of appraisal effort, using sales ratio studies to identify areas with especially out-of-line assessment levels or a marked dispersion of assessment ratios, and applying appraisal resources to those areas.3
By the mid-1960's the use of computers as an appraisal tool was opening up new avenues to equalized assessments. The first direct application of computers in the ap- praisal process was their use to make replacement cost less depreciation calculations (previously done by ordinary desk calculators). This computer application is now found in at least eight California counties, where it is broadly used for current updating of cost indicators of value.
A second use of computers as an appraisal tool was an outgrowth of the sales ratio studies previously mentioned. Average ratios were computed for one or more classes of property in clearly defined areas, and the computer was used to factor existing as- sessed values to the extent necessary to raise or lower the averages to the selected target. This was only a blunt tool when the ratio dispersion was large within the group to which a single factor was applied, but a fairly sharp one where the dispersion was small.
The most recent and much the most promising development is the use of regression analysis to obtain tentative appraised values whose acceptability can be very rapidly checked by property inspection.* This approach was pioneered in 1965 by the assessor of Orange County, with advice and assistance from the principal statistician of the State Board of Equalization. The first large scale application of the method was in San Francis- co, where the assessor who took office in the wake of the 1965 scandals was eager to re- appraise all properties for the 1967 assessment roll. He, too, called upon the State Board's statistician. The reappraisal was completed in less than nine months, and relied mainly on multiple-regression analysis for the reevaluation of most single-family residences, altogether some 67,000 properties, which was a large proportion of all real estate on the roll.
As applied to single-family residential properties, the multiple regression approach involves:
1) collecting and recording for each such property numerous items of information (up to a hundred or more) that may influence its value;
2) relating such information to the sales prices of single-family properties recently sold within a defined area, and computing a multiple-regression equation express- ing the particular combination and weighting of available recorded factors that best explain the sold properties' respective prices;
3) applying this equation to all such residential properties in the defined area (in- cluding both those used to derive the equation and those not recently sold) to ob- tain an estimated sales price for each; and

4) supplying these price estimates to appraisers who view the properties and check the computer produced values to see that they have apparent validity or that they are superseded if they do not pass inspection.
In five California counties, regression analysis was used for substantial numbers of single-family residential assessments on the 1972 rolls. Nearly twice as many additional counties have taken important steps to implement such a program.
California assessors using multiple regression are enthusiastic about it. It is reputed to reduce appraisal costs by about two-thirds, thus freeing appraisers for use on property types not yet adapted to the system. It demonstrably reduces coefficients of dispersion and ratios of assessed value to sale price well below the best results obtainable by con- ventional appraisal methods. And it permits annual revision of assessments where com- puter derived values have changed by more than a selected minimum.
Requirements as to local assessment records. As noted above, the Board's powers were strengthened in 1966. As new exemptions were added, they were covered by new or revised directives. The Board now prescribes all property statements, mineral production, and exemption application forms and requires their submission by assessors for approval by designated dates. Assessment roll forms as well as forms for notice of assessed value changes are also reviewed and approved under long standing statutory authority that was treated somewhat lightly in pre-1966 days.
Required qualifications for local assessment personnel. As noted above, State certi- fication of all State and local government employees engaged in property tax appraisal work is now required. Certification examinations are conducted by the State Personnel Board two or three times a year. (Temporary certification is permitted for up to a year.) The examinations are prepared by the State Board of Equalization, with the advice and assistance of a committee of five assessors chosen by the assessors generally. Passage of a State or local government civil service or merit system examination whose scope is approved by the Board may be substituted for passage of the Board's examination.
Certification of State and local government employees performing property tax auditor or auditor-appraiser duties is also required. This certificate is available only to those who hold a degree with specialization in accounting from a recognized institution of higher education, or is a California licensed accountant, or has passed a State or local government civil service or merit system examination for an accountant or auditor posi- tion.
Those employed on October 6, 1966, (effective date of the 1966 Reform Act) could qualify for certification as an appraiser up to October 1, 1971, or as an auditor or auditor- appraiser up to October 1, 1972.
Technical assistance programs. The Board provides mandatory annual training for about 1,200 of the 2,700 certificated appraisers and auditor-appraisers and approves the training courses provided the other 1,500 by educational institutions, professional socie- ties, or county training agencies.
As indicated in the foregoing discussion of "Reassessment programs," Board per- sonnel have worked closely with a number of counties in efforts to computerize certain sizable portions of their assessment work.
An activity thought to be unique to California, at least in its scope and intensity, is the State Board's conduct of county assessment practices surveys. Initiated in 1949 by legislative directive, these surveys were revitalized by the 1966 assessment reform legis- lation.
The initial round of surveys in the 58 counties, completed in 1956, produced reports which were comparatively bland but which appear in retrospect to have been instrument- al in bringing most of the State's county assessment offices to a high level of technical

proficiency. Support from the County Supervisors Association of California helped to implement recommendations for expanded assessors' staffs, improved salaries for as- sessors and appraisers, and installation of efficient parcel maps and comprehensive appraisal records.
Production of survey reports was desultory for a decade after the first series was completed, but the 1966 legislation required that each county be surveyed at least once in six years, and nearly all counties have since been intensively surveyed. The new series, by legislative directive, includes detailed reports on the average ratio and dispersion findings of the last completed inter-county equalization appraisal surveys (described in the section below on "Assessment Variations"). The assessor of a surveyed county is required to respond within a year of the survey report indicating the manner in which he has implemented or intends to implement the Board's recommendations. The response is addressed to the county grand jury and assessment appeals board, as well as various State officials.
In a detailed review of this program in late 1961, the Chairman of the State Board of Equalization stated?
The current crop of survey reports spells out what the assessor now does in ad- ministering his appraisal program, writing the assessment roll, granting exemptions, and handling his organization, personnel, and communications. And the assessor must later tell just what he has done about it. It may sound like a tough program- and perhaps it is-but the program has been pretty well received and has been possi- bly the most effective tool that California has devised to provide equitable assess- ment.
Appraisal and audit assistance. Statutory authorization for the Board to contract with counties to do appraisal work at not less than cost (and to report all requests for such services to the legislature) has discouraged provision of free appraisal assistance except as training exercises. No appraisal contracts have been written since this section of the law was rewritten in 1966. On the other hand audit work (relating to property tax returns) has been performed on contract by Board personnel for about half the counties of the State each year. Some 450-550 audits are performed annually at a cost of about $100,000 a year and after additional effort by county personnel have produced assessments that yielded some 1 2 times the State charge.
ASSESSMENT VARIATIONS
Legal requirements. For more than a century prior to 1967, California operated with an ostensible legal requirement that property be assessed for taxation at its full market value, but with actual assessment levels considerably lower. There was judicial accept- ance of such fractional valuation if uniformly applied. In 1966, each county assessor was authorized to value property during the assessment years 1967 through 1970 at any an- nounced fraction between 20 and 25 percent of his estimate of its full value (but without authority to reduce any such fraction in a succeeding year). Ten county assessors an- nounced ratios of less than 25 percent in 1967-by 1970 the number was down to eight, '
beginning in 1971, 25 percent was mandatory for all counties. These statutory requirements specifically excluded the utility property valuations
set by the State Board of Equalization. The Board has been reducing the assessment ratio i t applied to such valuations since 1959, although it did not announce that ratio until 1968, when it was 35 percent as compared with 50 percent in 1958. In subsequent years the ratio has been lowered by 2 percentage points each year, reaching 29 percent in 1971 and thus is approaching the fraction legally set for locally assessed property.

State assessment ratio studies. California's program for measuring the level of and variations in locally set assessments is undoubtedly the most sophisticated and significant- ly utilized State effort of this kind in the entire nation. As reported in the 1963 ACIR study, The Role of the States in Strengthening the Property Tax, this program originated in 1951, was first used for the State's issuance of equalization orders in 1955, and has been gov- erned since 1959 by statutory provisions as to procedures and the public availability of findings. The program has continued during the past decade substantially as described in detail in that earlier ACIR report (see especially Volume 2, pp. 14-16), except that a statutory provision was passed in 1966 for an "Office of Appraisal Appeals" reporting directly to the executive director of the State Board of Equalization. This office was estab- lished to help the Board decide disputes between local assessors and the appraisers of the Inter-County Equalization Division which conducts the appraisal program on which assessment ratio findings are based.
Findings from this program have a significant impact not only upon many aspects of the property tax system including the application of tax and debt limits and tax exemp- tions, but also upon allocations made under various grant-in-aid programs that involve State expenditures of more than a billion dollars annually.
Local assessment ratio studies. The State Board of Equalization is by no means the only agency in California that is engaged in ratio studies. Almost all county assessors are making such studies of varying degrees of sophistication. One of the newer sections of the State Board's monumental Assessors' Handbook provides guidance for these efforts, which range from data manipulated on desk calculators in the smaller counties to massive collections of information on sold properties processed by complicated com- puter programs in a dozen or more of the large counties. Although California lacks the ideal type of transfer tax from which to obtain sales price information (the 1967 law authorizing local taxes of this nature was modeled very closely on the former Federal law), the assessors have designed questionnaires which are mailed to grantees or occa- sionally to grantors. With statutory authority to exact the information, some assessors are sufficiently demanding to obtain returns of 80 percent or more.
Actual assessment levels and variations. State study findings indicate only minor changes in the weighted statewide average assessment level for locally assessed property during the past decade. The 1971 level is estimated at 24.2 percent compared with 23.8 per- cent in 1962 and somewhat lesser averages in the intervening years (the lowest having been 21.8 percent in 1965). The unweighted mean of average assessment ratios for the 58 counties similarly shows relatively little change during the decade but with the 1971 figure somewhat higher than those of preceding years. It is more significant that the dispersion of individual county averages has been reduced; in 1971, the standard deviation of the 58 individual county averages was 1.21 as compared with standard deviations of at least 1.64 in seven of the previous nine years. The 1972 Census of Governments supports these statistics recording a statewide assessment ratio of 20.
Inter-county differences of assessment level in California are of rather limited con- sequence because of various adjustment actions [based on the Board's ratio findings) which take them into account. It is far more significant that there has been marked im- provement in the uniformity of within-county assessment levels. As reported by Ronald B. Welch, the head of the Board's Property Tax Department:
There have been dramatic improvements in the degree of intra-county equaliza- tion according to our estimates. Since we make appraisals in any one county only once in three years we have comparisons of county assessed values with State ap- praised values for a given county only every third year. For all 58 counties, the unweighted mean coefficients of dispersion (about the median) and standard devi- ations of the coefficients were as follows:

Mean Standard Coefficient Deviation
31.22% 14.81 29.24 12.14 27.64 11.04 24.21 11.39 20.43 10.08 18.02 9.06
Inter-area equalization of assessments. The Board has constitutional authority to order a blanket increase or reduction in any county's assessments. But the Attorney General has held that the Board can exercise administrative discretion as to the precision which it seeks in equalization of assessment levels, so it has for many years "tolerated" individual county levels that are within 4 percentage points of the statewide average. Since 1962, only two counties (one in 1969 and one in 1970) have been ordered to raise their assessments by flat percentage amounts. Since most objectives of inter-county equalization are achieved by application of "Collier factors" (the Board's statewide as- sessment ratio findings divided by its county assessment ratio finding), the Board does not consider precise inter-county equalization of assessment levels essential.
Coefficients of Dispersion. The 1972 Census of Governments reports that the inter- area coefficient of dispersion was eight and the intra-area coefficient was 16, lower than the national average of 20. Six States have lower inter-area coefficients while only Con- necticut, Oregon, and Wisconsin have lower intra-area coefficients. The 1967 Census re- ported for California an inter-area coefficient of nine while the intra-area coefficient was 15 percent.
AVAILABILITY OF PROPERTY TAX DATA
Information provided to individual property owners. Legislation enacted in 1966 and subsequent years has considerably increased requirements as to information that must be supplied directly to property owners or taxpayers. Owners must be notified on or before completion of the secured assessment roll7 of the assessed and full values of their real properties on this roll if they are higher than last year's values, of the date and place to file applications for local equalization, of the ratio the assessor applies to his full-value estimates, and of the opportunity to stipulate to an assessed value change that is accepta- ble to the assessor and county counsel.
Persons who received the homeowner's exemption in the previous years and do not sell their dwellings and all who acquire eligible dwellings between March 1 (the assess- ment date) of the prior year and January 1, must be sent homeowner's exemption claim forms together with a notice of the availability of senior citizens property tax relief to low-income owner-occupants. Tax bills must be accompanied by the same notice on the senior citizens relief and must show both full cash value and assessed value, assessment ratio, the homeowner's exemption (if applicable), and a breakdown by government unit of the tax rate or tax amounts.
Data on assessed valuations of taxable property. Assessment rolls have always been open to public inspection; now, by a 1971 enactment, they may be kept on microfilm if viewing equipment is made available. Separate values must be shown for land, improve- ments, inventories, and other tangible personal property.
Data on tax exempt valuations. California has for years been one of the limited num- ber of States that enforce requirements for local recording of the assessed value of cer- tain exempt real estate. Such data have traditionally been assembled and summarized by county in annual reports of the State Board of Equalization. For 1971, that source show-

ed locally assessed valuations for exempted property holdings of churches, educational, hospital, and welfare agencies totalling nearly $1.5 billion, or about 3 percent of gross local assessments for taxable realty. The data cover practically all kinds of wholly ex- empt real estate other than governmental holdings which are not specifically assessed.
As recent enactments have provided for new types of "partial" property tax exemp- tions, requirements for local assessment records and the State Board's own statistical re- ports have been adjusted to provide explicit data regarding them.
Data on property tax levies and collections. For many years, tax levy data have been summarized for each county, by type of government, in the annual report of the State Board of Equalization and figures on the property tax revenue of individual counties, municipalities, and school and special districts have been included in regular annual publications issued by the State Comptroller with regard to the finances of such govern- ments.
Data on assessment levels and variations for particular area. As previously noted, local assessors and property tax collectors are required to notify property owners that the assessor uses a 25 percent ratio of assessed to full value, and the Board's assessment ratio findings are made publicly available through its regular statewide reports as well as the studies it issues from its periodic survey of assessment operations in the several coun- ties. The latter publications especially are likely to deal intensively with the question of the extent of apparent variation of assessment level as among various properties.
REVIEW AND APPEAL OF PARTICULAR ASSESSMENTS
Organization of review agencies. There is but one level of administrative review- the county-and judicial review only on legal issues. Since 1966, any county (not just those with populations over 400,000, as in the years 1963 to 1966) may, by county ordi- nance, supplant the traditional county board of equalization (which consists of the mem- bers of the county board of supervisors acting ex-officio) with one or more assessment appeal boards. The first boards were created in Los Angeles County in 1963 (only one other county was then empowered to create them). Now there are assessment appeal boards in 16 of the State's 58 counties. Each board consists of three members, either se- lected by lot from lists of nominees submitted by county supervisors or directly ap- pointed by the board of supervisors. Alternate board members may also be appointed. Members serve for three years and may be removed by the board of supervisors for cause. Board members are usually paid over $100 a day and often conduct hearings over many months if not throughout the entire year.
Under a 1970 law, a board of assessment appeals or traditional board of equalization may appoint one or more hearing officers or contract with the State's Office of Adminis- trative Procedures for services of such officers. Such officers may hear appeals informally on property assessed at not more than $12,500 ($50,000 full value). The board may adopt or reject the hearing officer's recommendation and must conduct a hearing if requested by the applicant.
Conditions needed to obtain assessment review or adjustment. Applications must be filed within specified periods that differ for different counties and range from 56 days to 76 days. Applicants must be present or represented at hearings unless the assessor and county counsel and the applicant agree to a reduction in assessed value. The applicant may obtain a transcript of proceedings at his own expense and written findings not to exceed $10 a parcel. The applicant may cause an exchange of information with the assessor by supplying his comparable sales, income, or cost data to which the assessor must respond with like data. If the equalization agency changes an assessed value as enrolled or stipu- lated to by the assessor, there is a rebuttable presumption for the next two years that the

value set by the agency is correct except when there has been a change in zoning, a build- ing or land change requiring a permit, or a change ordered by the State Board pursuant to its interqounty equalization duties.
Relevance of State ratio findings. The Board's findings as to the average assessment ratio of locally assessed taxable property in each county are published annually before the close of the period allowed for the appeal to the county equalization agency for reduc- tion of particular assessments. These Board findings may be relied upon in such proceed- ings, since under the 1966 statute the equalization agency must find the property's full value and then apply the lowest of:
1) 25 percent,
2) 115 percent of- the Board's ratio findings for the county, or
3) "the ratio of assessed to full cash value of all property in the county [both locally and State assessed] established without reference to the Board's ratio for the county."
The quoted third alternative is designed to satisfy the constitutional mandate of complete rather than only substantial uniformity, but calls for evidence that is so difficult or costly to develop that it has only rarely been invoked in taxpayer appeals.
?Part of the information presented here, was provided by Ronald B. Welch, Assistant Executive Secretary for Property Taxes of the California State Board of Equalization.
2There are, however, about 100 special districts that may levy what are legally deemed ad valorem special assessments that apply to land or to land and improvements according to valuations determined by district assessors.
=See Ronald B. Welch, "Maintenance of Appraisals", Assessors' News Letter, International Association of Assessing Officers (December 1961). pp. 147-151; (January 1962), p. 1.
'For more detail than appears here, see Robert H. Gustafson, "Developing a Central EDP System," Inter- national Property Assessment Administration, Proceedings of the 35th (1969) Annual Conference of the Inter- national Association of Assessing Officers, pp. 34-58; and "Computers and Statistics as an Aid to the Appraiser of Single-Family Residences," in The Application of Econometric Methods to the Appraisol Process, Internation- al Association of Association of Assessing Officers (1971).
5Richard Nevins, "California's Assessment Practices Surveyed" a paper delivered at the International Asso- ciation of Assessing Officers' Conference (Boston, Massachusetts, September 20,1971).
6In each triennium, two-thirds of the county coefficients are carried forward from the preceding triennum and only one-third are new coefficients.
7The "secured assessment roll" includes all taxable valuations other than those for "unsecured" property defined as property "the taxes on which are not a lien on real property sufficient to secure payment of the taxes."

As was true a decade ago, responsibility for property valuation in Colorado is dele- gated mainly to local jurisdictions-most of which are too small to afford a professional organization. The State property tax agency has continued to operate with relatively slim resources and limited supervisory powers, but it has developed a useful program for the measurement of assessment levels and variations. Recent legislation has included laws providing for preferential assessment of agricultural lands, for a phased reduction in property taxation of business inventories, for new restraints on local property tax levies, and for a State financed arrangement for "property tax relief" to low-income elderly resi- dents.
FINANCING ROLE OF THE PROPERTY TAX
Colorado's State-local revenue system has traditionally involved somewhat greater than average reliance on property taxation. Coloradans paid $187 per capita in property taxes compared to the national average of $184. Their tax payment per $1,000 of per- sonal income was $51 compared to the national average of $47.
During the 1960's per capita property tax revenue in Colorado increased at an annual rate of 4.1 percent, or somewhat less than the growth rate of the State's economy as measured by personal income. Nationally, per capita property taxes went up 6.3 percent annually during the decade and outpaced the average yearly 5.5 percent rise in per capi- ta personal income.
Of all the own-source general revenue raised here in fiscal 1970-71 by the State and local governments, 32 percent was from property taxes-similar to the national average. However, this reflects a considerable drop from ten years earlier when the property tax proportion in Colorado was 42 percent. One factor in this development was the discon- tinuance after 1965 of the State government's general property tax levy which had previ- ously accounted for about 5 percent of all property tax revenue. (Relatively minor amounts are still collected through a State imposed special property tax on motor vehi- cles.)
At the local government level, property taxation is a predominant financing source in Colorado. It accounted in 1970-71 for 64.5 percent of all locally raised general revenue here, similar to the nationwide proportion of 64 percent. Over 1,000 of the State's 1,319 local governments have property taxing power.
In an ACIR study, Measuring the Fiscal Capacity and Effort of State and Local Areas, it was estimated that Colorado's average property tax was 22 percent above the national norm and 34 percent above the national norm for property taxes on commercial and in- dustrial property. Colorado, however, was 5 percent below the national norm on farm property taxes.
THE PROPERTY TAX BASE
In 1971, 79 percent of the statewide total of assessed valuations for general property taxation in Colorado was locally assessed real estate while locally assessed tangible per- sonal property on businesses accounted for 13 percent and State assessed utility property for 10 percent. These figures reflect some legally authorized differentials in the level of valuation for particular classes of property, as more fully discussed below. The proportion contributed by locally assessed business personal property has diminished from over 17 percent a decade earlier. This reduction was the result of legally authorized changes such

as the 1967 enactment which provided for a phased reduction in the valuation of business inventories from 30 percent of market value in 1967 down to 5 percent in 1973 and there- after.
Specific exemptions from the general property tax in Colorado include: intangible personal property, nonprofit cemeteries, irrigation facilities, household furnishings, and personal effects not used for the production of income. Colorado also provides for the usual "complete exemption" of the property holdings of governments and property owned and used for defined religious, educational, and charitable purposes. Under recent legislation authorizing greater central control over the allowance of various types of claimed exemptions, the State property tax agency has accumulated records for some 6,000 exempt properties (other than governmental holdings) and plans to develop and is- sue data concerning them by type of ownership or use.
Legislation enacted in 1971 and then amended in 1973 provides for rebates or credits, through the State's income tax system, for a portion of residential property tax liabilities of persons over 65 who have net worth of less than $30,000 and limited annual income- i.e., less than $5,400 for a single person or less than $6,300 for a married couple. The maxi- mum benefit subject to a limit of $270 is one-half of the property tax paid on the claim- ant's owner-occupied residence; in the case of renters, half of a "tax equivalent amount" equal to 10 percent of the annual property rental; for mobile homeowners, half the specific ownership tax. The actual benefit is scaled down according to the claimant's in- come. For a single person the reduction amounts to 10 percent of income over $2,700 and for a married couple, 10 percent of income over $3,600.
ASSESS1 NG RESPONSIBILITIES
Assessing in Colorado is a joint State-local function, as it was a decade ago. However, legislation effective in 1971 eliminated the former three-member State Tax Commission and provided for a Division of Property Taxation within the Department of Local ~ f f a i r s . The Division is headed by the Property Tax Administrator, who is appointed by the Direc- tor of the Department of Local Affairs; subject to the rules of the Personnel Board (civil service]. The law specified that the person so appointed "shall possess knowledge of the subject of property taxation and of the laws of this State relating thereto, and shall have demonstrated ability and experience in the field of property taxation."
This State agency is responsible for assessing taxable utility property, for determining tax exemptions, and for assistance to local assessors. However, it lacks the legal authority for actual supervision of local assessment work which formerly rested with the Tax Com- mission.
The Division of Property Taxation has a total staff of 32, which reflects little change from the number of persons similarly engaged by the Tax Commission a decade earlier. Its 1972 budget of $490,000 amounts to less than 0.1 percent of statewide property tax rev- enue.
Local assessing responsibilities are assigned to an officer in each of Colorado's 63 counties (including Denver City-County). Except for Denver, where the assessor is ap- pointed by the mayor, each of these county assessors is subject to popular election for a four-year term. Relatively few of these jurisdictions are populous enough to afford a full- time professionalized assessment operation. Three-fifths of Colorado's counties have fewer than 10,000 inhabitants each, including 25 counties of less than 5,000. Nearly three- fourths of the State's population, however, resides in the seven largest jurisdictions- those having at least 100,000 inhabitants apiece.
The 1967 Census of Governments (not updated in the 1972 edition) reported some 780,000 parcels of taxable realty on Colorado's local assessment rolls, of which 60 per- cent were non-farm residential properties, 18 percent were vacant lots, 13 percent were acreage or farm properties, and about 6 percent were separately assessed mineral rights.

Though less numerous, commercial and industrial properties contributed 25 percent of the total assessed value of taxable realty.
Valuation provisions. Although most taxable property is legally subject to assessment at 30 percent of its "actual value," there are exceptions. The law provides that oil and gas leaseholds and land be assessed at 87.5 percent of the value of annual production; "free- port" merchandise at 5 percent of the average investment involved; other business inven- tories (as noted above) at 5 percent in 1973 and producing mines at 25 percent of gross or net annual proceeds, whichever is greater.
As a result of 1967 and 1971 legislation, agricultural lands are also subject to distinc- tive valuation according to "the earning or productive capacity of such lands during a reasonable period of time capitalized at commonly accepted rates." The 1971 amendments of the original enactment clarified and tightened the requirements for such preferential assessment.
Reappraisal programs. In 1968, the Division sponsored complete reappraisals in six counties, and in 1969, five additional counties were completely reappraised. Division staff also engaged in a statewide agricultural land study, using the income approach called for by recent legislation and a formula authorized by the State Board of Equalization.
Assessment record requirements. The Division of Property Taxation can prescribe the form of all personal property schedules, forms and notices, and the form of all field books, plat and block books, maps, appraisal cards, etc. The State.has developed a map- ping program which is now installed in approximately ten counties and which involves a 12-digit system to locate individual properties geographically.
Qualifications and training of assessment personnel. There are no State imposed re- quirements as to qualifications of local assessment personnel. However, the State agency does conduct an annual school for assessors in collaboration with Colorado State Uni- versity. This is a three-year certificated course. As an example, in October 1971, six courses were provided concerning various phases of appraisal.
ASSESSMENT VARIATIONS
State assessment ratio studies. As reported in the ACIR property tax study of a decade ago, Colorado conducted several statewide assessment ratio studies in the late 1950's and early 1960's making use of information from a realty recording act which was repealed in 1963. In 1967, a new basis for such measurement became available from a State imposed realty recording tax. Annually since then, the State property tax agency has conducted a sales ratio study in which findings are developed, county-by-county, for certain classes of taxable real estate.
The published 1971 report summarized ratio results for four property classes:
1) improved residential,
2) unimproved residential (i.e., residentially zoned vacant lots),
3) improved commercial, and
4) unimproved commercial.
The sales ratio study does not deal with sales involving agricultural land presumably because of the limited relevance of "current market value" for the assessment of such property. (As previously noted, however, rural properties account for a significant part of all real property values in Colorado; about one-sixth of the market value of all taxable

realty.) Beginning in 1972, the study developed sales ratios in additional detail by class of property, by area, and by age-of-improvement groups.
To compensate for the paucity of measurable transfers in most of the counties, the State study combines information for a number of recent years. Even so, many individual counties have relatively few relevant transfers, except for improved residential proper- ties, the predominant category.
The published study reports by county for each property class, for measures of average assessment level (mean and adjusted mean) and of variation (deviation, adjusted deviation, and coefficient of dispersion). It also uses the adjusted means to estimate from each county's assessed valuation for the several property classes the county's "projected valuations" at the statutory 30 percent level of assessment. However, the findings are not used (as are such data in various other States) to adjust grants to local governments.
Actual assessment levels and variations. The 1972 Census of Governments estimated for Colorado a statewide average assessment ratio (as indicated by measurable sales of ordinary real estate) of 21 percent; the inter-area coefficient of dispersion was 10 percent while the intra-area coefficient was 23 percent. The latter coefficient was close to the national average of 20 percent. There has been a widespread lag in the adjustment of official valuations to rising property values.2 The Division of Property Taxation is well aware of this problem, as well as of the persistence in many parts of the State of material differences of assessment level among various properties or property classes. Following are some observations that appeared in the brief "conclusions" section of the Division's 1971 assessment ratio report:
Unimproved urban land in the State of Colorado is receiving [preferentially] favorable assessment in all but three counties. . . . There has been little, if any, at- tempt on the part of the county assessors to improve the quality of assessments of this subclass over the past four years.
[Only] Five counties have an acceptable assessment ratio and good uniformity in the improved residential subclass. In general assessment-sales ratios of this sub- class have declined over the past four years.
There is an apparent reluctance on the part of most assessors to recognize the increasing demand and corresponding higher prices of residential property.
[Only] Three of the 63 counties are assessing commercial improved property at or near 30 percent of actual value with any degree of uniformity.
In general, it can be concluded that residential and commercial land has a fair degree of uniformity between properties. Land, however, is grossly underassessed. The assessments in most cases should be considerably increased to achieve 30 percent of actual value.
Improvements statewide are assessed closer to 30 percent of actual value than land, but with little or no uniformity between properties.
REVIEW AND APPEAL OF ASSESSMENTS
The 1971 legislation which created the Division of Property Taxation also established a Board of Assessment Appeals as a quasi-judicial tribunal in place of the former State Tax Commission. The three members of this body are appointed by the Governor for six- year terms. Each must be "experienced in property valuation and taxation" and one member must be (or have been within the five years before his appointment) "actively engaged in agriculture." The members are compensated on a per diem basis for periods

of actual service up to 90 days per year. The members can hold hearings individually, but final decisions require action by a majority of the Board.
The Board of Assessment Appeals is authorized to consider taxpayers' appeals from decisions made with regard to particular local assessments by county boards of equali- zation (which, except in Denver, consist of individuals from the county governing bodies serving ex-officio). This Board is also empowered to hold hearings on complaints filed by the Property Tax Administrator concerning local assessments for particular property classes or any alleged dereliction of duty by a local assessor and to consider appeals re- garding utility valuations made by the Property Tax Administrator, and regarding orders and decisions of the Property Tax Administrator.
This Board can issue orders applicable to county assessors or boards of equalization, except that any order regarding the valuation of classes of property is subject to review by the State Board of Equalization.
The laws provide an explicit set of deadlines for the filing of and action on appeals to the Board. In its first six months of existence, the Board heard 63 cases, of which 61 involved local assessments, including two subsequently appealed to the District Court.
'Part of this report is based on information provided by Raymond E. Carper, Property Tax Administrator of Colorado.
2In the absence of such a lag, one might reasonably expect to observe something like a 67 percent increase in Colorado's real estate assessments between 1966 and 1971 (the proportionate growth of the State's economy, as measured by personal income), rather than the 32 percent increase actually reported.

CONNECTICUT Property taxation has continued during the past decade to represent an extremely
important element in Connecticut's State-local revenue structure. This State has main- tained without material change its decentralized arrangements for property tax adminis- tration but has enacted a number of measures that significantly affect the tax base. Several of these provide for State reimbursement of all or part of the local governments' revenue losses. Connecticut has also provided for in lieu payments to local jurisdictions for the property tax revenue of which they are deprived as a result of the exempt status of State owned realty (other than for highways). And most recently senior citizens have been pro- vided with a circuit-breaker program of property tax relief.
FINANCING ROLE OF THE PROPERTY TAX
Local property taxation represents by far the largest single component of Connecti- cut's revenue system. In fiscal 1970-71, it accounted for 44 percent of all the revenue raised by State and local governments. While declining from 47 percent a decade earlier, this percentage was considerably above the nationwide proportion of 32 percent. Further- more, property tax yields in Connecticut have been rising strongly. The amount per capita more than doubled during the 1960's and outpaced the growth in the State's econo- my as measured by per capita income. In 1970-71 fiscal year the per capita tax was $273, third higbest in the U.S., and comparable to the national average of $184 per capita. Prop- erty tax revenue moved from $41 to $57 per $1,000 of personal income within the decade.
In an ACIR study, Measuring the Fiscal Capacity and Effort of State and Local Areas, Connecticut's average property tax rate was estimated to be about 19 percent above the national norm for non-farm residential property, 44 percent above for farm property, but equal to the norm for commercial and industrial property. Its overall composite effort ratio for all State and local taxes, however, was 7 percent below the nationwide average.
Eighty percent of the State's approximately 428 local governments have property tax- ing power, and most of them rely mainly on this source for their financing. In fact, 87 percent of all the general revenue raised by Connecticut local governments in fiscal 1970- 71 was from the property tax.
The property tax base, as represented by assessed valuations, has been growing about 5 percent a year, but since levies have been going up even more rapidly (about 7.2 percent annually), the past decade has seen a general increase in tax rates.
THE PROPERTY TAX BASE
Nearly 80 percent of all taxable valuations in Connecticut during 1971 involved local- ly assessed real estate, with the balance representing locally assessed personal property. Certain types of public utility operating property which are State assessed elsewhere are exempt from property taxation in Connecticut. (Gross receipts taxes are applied to such utilities instead).
The 1967 Census of Governments (data were not updated in the 1972 Census) identi- fied 838,000 pieces of taxable real estate in Connecticut, of which 77 percent were non- farm residential properties, and only about 4 percent were acreage or farm properties. The urban residential parcels accounted for nearly 73 percent of the assessed valuations of taxable realty, with business real estate making up 22 percent, rural property 13 per- cent, and vacant lots the remaining proportion of realty values.
The tax base is somewhat curtailed by certain partial exemptions provided for the
blind, certain veterans, business inventories, and low-income elderly persons. The State also provides the usual kinds of complete exemptions for property holdings of govern- ments, churches, educational and charitable bodies, etc.; but with one unique exception: under legislation enacted in the mid-1960's each town (the primary type of local govern- ment) is granted an annual in lieu payment based upon its overall local tax rate and the assessed value of State owned realty (other than highways) within its boundaries. The fiscal 1972 appropriation for such in lieu payments amounted to $1.9 million.
In 1973, Connecticut added to its freeze on property tax rates for senior citizens a circuit-breaker type of tax relief. The freeze works as follows:
1) if the real property owner or his spouse is over 65,
2) if he or his spouse resided in Connecticut for at least 5 years, and
3) if Federal adjusted gross income is less than $3,000 if single and $5,000 if married.
The property tax will be frozen at the level when the taxpayer first became qualified. (1967 was the first year of eligibility.) The tax base will be the assessed value less $1,000. The tax rate will be that which existed when the taxpayer became eligible unless the rate is subsequently reduced. If so, the reduced rate will apply. The Governor's Commission on Tax Reform in its December 1972 report complained that the freeze law did "not treat all elderly households the same way."
Elderly households which rent rather than own their homes receive no relief even though a portion of their rent undoubtedly goes towards property taxes. And, because of the freeze provision, elderly households who have recently qualified for relief will not receive the same level of benefits as those who qualified in earlier periods even though there are no other differences between households.2 Consequently, the Commission recommended the senior citizens circuit-breaker which was adopted. This measure allows residents 65 or over who have lived in the State for at least five years a payment from the State determined by deducting from previously paid property hold income but subject to the following limits:
Income $ 0-3,000
3,000-3,500 3,500-4,000 4,000-4,500 4,500-5,000
Benefits received
Maximum Refund Income
$500 $5,000-5,500 450 5,500-6,000 400 6,000-6,500 350 6,500-7,000 300 7,000-7,500
under the freeze were deductible from the
taxes 5 percent of house-
Maximum Refund
$250 200 150 100 50
direct payment under the circuit-breaker form of tax relief up until June 1973. After that, claims under the freeze law were not accepted.
Elderly mobile homeowners and renters are entitled to similar rebates with the prop- erty tax assumed to be 20 percent of rent and utility charges.
Municipalities are also authorized to grant tax relief to homesteads of persons 65 or over provided that such relief together with the freeze provisions and circuit-breaker provisions do not exceed 75 percent of the property tax bill of the senior citizen.
Another type of tax base curtailment is also under way involving business inventories. A 1965 enactment provided for the exemption of inventories of manufacturers on a staged basis extending over a ten-year period. In 1973, accordingly, 70 percent of the value of such property was tax exempt, and by 1967 such valuations will drop completely from the local rolls. A 1969 enactment extended similar treatment on a staged 12-year basis to

wholesaler and retailer inventories. In 1973, three-twelfths of the value of such property was exempt and this proportion will grow annually until 1982 when these inventories will also drop out of the tax base. The lost local government revenues from these tax base curtailments are being replaced by State appropriations. (The total amount for fiscal 1972 was $7.3 million.)
Like numerous other States, Connecticut has enacted (in 1963) legislation providing for a distinctive assessment approach for certain rural lands. The law provides that, upon application by the property owners "farm, forest and open space lands" are to be sepa- rately classified and the assessment of such land is to be made by reference to "its current use without regard to neighborhood land use of a more intensive nature."
ASSESS1 NG RESPONSI BI LIT1 ES
As i t was a decade ago, the task of property valuation is still assigned to 169 local units. In some of these units (especially the larger ones), the assessor is appointed while in others he is an elected official. Most of these assessing jurisdictions have a small popu- lation. More than half of them have fewer than 10,000 inhabitants, only about one-fifth have populations of 25,000 or over, and only five (altogether accounting for less than one- fourth of the State's total population) have at least 100,000 inhabitants apiece.
As indicated in the ACIR report on property tax administration, the State's relatively limited role operates mainly through a Municipal Tax Division in the State Tax Depart- ment. The Tax Department is headed by an appointive State Tax Commissioner, and is mainly concerned with the administration of various major State imposed taxes. There has apparently been little recent change in the property tax activities of the Municipal Tax Division, except for administration of State reimbur,sements for the various new prop- erty exemptions described above. Appropriations for such payments are made to the State Tax Commissioner and local claims for reimbursement are subject to his approval.
Significant changes in assessing responsibilities may be forthcoming in the near future. The Governor's Commission on Tax Reform presented the following findings and recommendations:3
This Commission has found many deficiencies in the present assessing practices as detailed in this report. A list of major findings is as follows:
1. The assessment percentage of value is not equal between classes of property.
2. The assessed value of undeveloped land is grossly below the percentage of value for other real estate.
3. Many assessors have not been properly trained to carry out the duties of their office.
4. Some revaluation companies are not using qualified personnel or ideal proce- dures resulting in poor revaluations.
5. There is substantial loss in tax revenues from owners of unregistered vehicles avoiding a tax.
6. Much special equipment is underassessed.
7. Public utilities require special attention for assessment values.
8. There is a need for statewide sales studies to determine proper assessment values.
9. Local assessors need State assistance in the valuation of special properties.

10. There is a need for revising some existing laws and enforcing other laws to insure equalized assessment values.
11. Charges for building permits are insufficient and many contractors fail to disclose the true value of their construction.
COMMISSION RECOMMENDATIONS
I. Enact a State Uniform Assessment Law.
A. Organization: Create a State Board of Assessment Supervision with responsibility for all property assessment functions throughout the State, including supervision of all local property assessments.
B. Board Responsibilities: Establish and administer policies designed to insure ac- curate and equitable assessments of property throughout the State, including specifi- cally [but not limited to) the following:
1. Establish a uniform assessment date and a uniform fiscal year.
2. Establish a uniform percent assessment.
3. Establish a system of certification of local assessors.
4. Review the assessments of all major commercial and industrial properties.
5. Establish a system of supervision of revaluation companies.
6. Establish uniform operating procedures for initial assessment and revaluation of property.
7. Require annual computer assisted sales ratio studies.
8. Establish a system of assessment-sales ratio studies.
9. Prepare an assessment of tax exempt property.
10. Require all towns to assess by personal inspection one-fifth of the property each year and the entire town in a five-year period.
11. Public Act 490 (Preservation of Farms, Forest, and Open Space).
A. Tighten the definition of forest lands.
B. Tighten the definition of open space.
VI. Require towns to convert to 100 percent valuation with an annual computer revalua- tion of the grand list and to adopt a uniform assessment data and fiscal year within two years.
State Board of Appeal.
The Commission is proposing a State Board of Appeal composed of a chairman, who is the State regional supervisor and three professional members selected from out- side the region in which the appeal property is located. These three professional members would be appointed by the Director of Local Assessment from a list of qualified valuation professionals. A taxpayer may make an appeal to the State Board of Appeal at no cost to himself, and it will not be necessary for either the taxpayer or the assessor to be represented by counsel. Assessors would have the right to ap- peal the reduction of a valuation by the local board of tax review under this program.

Director of Local Assessment.
The Director of Local Assessment would be required to promulgate rules and regu- lations to:
I. Mandate uniform guidelines for assessing administration, including granting of exemptions and special assessments.
2. Prepare, issue and periodically revise guides for local assessors in the form of cost manuals, handbooks or rules and regulations, appraisal manuals, special manuals and studies, news and reference bulletins, and digest of property tax laws suitably annotated.
3. Require each tax jurisdiction to maintain tax maps in accordance with standards specified by the State. Here again uniform standards would be established and followed throughout the State. All parcels would be identified through a standard- ized parcel number system which would be related to the assessors' map books.
4. In cooperation with local assessment jurisdictions devise, prescribe, and require the use of all forms deemed necessary for effective administration of the property tax. It is intended that these forms shall be uniform throughout the State.
5. Establish standards for revaluations and revaluation firms. Maintain a list of certified revaluation companies and approve contracts between local jurisdictions and those revaluation companies.
6. Develop, maintain, and enforce a uniform system of statewide preparation of assessment rolls, tax rolls, and tax bills.
7. Establish unit prices for lands value under Public Act 490 (1963 Session- "An Act Concerning the Taxation and Preservation of Farm, Forest, and Open Space Land").
8. Provide technical assistance to assessors when requested, for assessing special- ized properties.
9. Administer the sales ratio studies and provide towns with assessment-sales ratio studies and appraisals.
10. Establish a system of statewide current valuations through annual computer up- dating.
11. Value all real and personal property of public utilities.
12. Maintain listing of approved professional valuation experts for Board of Appeal. * * * * *
ASSESSMENT VARIATIONS There is no legal mandate for statewide uniformity in assessment levels in Connecti-
cut. Since 1957, each local assessing area has been authorized to set the ratio of fair market value it will apply in determining taxable assessments.
Unlike a majority of other States, Connecticut has no ongoing official program for measuring the relationship between assessed and market value of taxable property. Some of the conditions which make such measurement especially important elsewhere are not found here. For example, as already noted, there is no statewide property tax levy, nor any central assessment of utility property, which in most other States involves the allo- cation of such State set values to the tax rolls of various local areas. Neither does Con- necticut impose tax rate limits related to local assessed valuations; nor does it provide

the type of "equalizing" grants for schools or other purposes, as do many States, that involve efforts to measure the comparative financing effort made by various local areas on behalf of the functions being aided.
At least one enactment of the past decade has reduced even further the State's direct concern for inter-area differences in assessment level. This law altered the limitations set on local bonding power, which previously were based on assessed valuations, so that they now are related to actual tax receipts of the local borrowing jurisdiction plus its reimbursements from the State for various property tax losses, as previously described.
Nonetheless, inter-area differences of assessment level presumably still influence the actual worth to particular property owners of the partial exemptions granted to the blind, veterans and the needy elderly. And, of course, the extent of uniformity of assessment level within particular local taxing areas is of continuing significance from the point of view of tax equity.
In the absence of recurrent State developed data, the assessment ratio findings of the Census of Governments are especially pertinent. The 1972 Census estimated a Con- necticut average assessment ratio of 48 percent for taxable realty (above the national average of 37 percent), with the ratio for residential property somewhat higher, the ratio for commercial and industrial property slightly lower, and the statewide ratios for vacant lots and rural property considerably below the overall average. The estimated overall statewide ratio was below that calculated by the Census both five and ten years earlier.
In each of the four Censuses of Governments that have supplied such data, Connecti- cut has shown up relatively well as far as the intra-area coefficient of dispersion is concerned. For instance, in 1967, half of the sample areas in Connecticut showed a disper- sion coefficient of less than 1 2 compared to the national average of 19. The 1972 Census shows, however, that the current coefficient of dispersion is 23, compared to the national average of 20.
'Part of this report is based on information provided by John F. Tarrant, Director of Research, Connecticut Tax Department.
ZState of Connecticut, The Report of the Governor's Commission on Tax Reform, Volume 11, Local Govern- ment, Schools and Property (1972), p. 28-30.
SIbid, pp. 94-104.
DELAWARE During the past decade, Delaware has maintained its tradition of relatively limited
reliance on property taxation and its assignment of assessing responsibility to agencies of its three counties. It has, however, authorized some new provisions for tax exemption or preferential assessment.
FINANCING ROLE OF THE PROPERTY TAX
The revenue structure of Delaware involves less use of property taxation than most other States. Property taxes supplied only 13 percent of all the general revenue raised by the State and local governments in fiscal 1970-71, down by 1 percent from the previous year; the corresponding property tax proportion in the nation as a whole was 32 percent. On a per capita basis, the people from Delaware pay only $88 in property taxes as com- pared to the national average of $184; they pay only $21 per $1,000 of personal income (the national average is $47). This contrast reflects the predominant financing role of the State government, which in Delaware accounts for about 80 percent of all State-local tax revenue, the highest such percentage in the nation; the national average is 57 percent for 1971.
Except for a relatively minor levy on intangibles, the Delaware State government it- self makes no use of property taxation. Local general property taxes accounted in fiscal 1971 for 50 percent of all locally raised general revenue in Delaware, less than the com- parable nationwide average of 64 percent.
In an ACIR study, Measuring the Fiscal Capacity and Effort of State and Local Areas, Delaware's property tax load relative to capacity was estimated to be 58 percent less than the national average, with only one other State [Alabama) showing a lower index of property tax effort. Commercial and industrial property was 76 percentage points below the national average, the lowest for all States. Farm property was 59 percent below and non-farm residential was 38 percent below the national average.
Even with these new exemptions, per capita property tax collections in Delaware approximately doubled during the past decade, reflecting an average annual rise of 7.2 percent, outpacing the growth in the State's economy, as measured by per capita resident income. There was an even faster increase in other State-local revenues, so that the pro- portion supplied by the property tax diminished during this interval.
THE PROPERTY TAX BASE
General property taxation in Delaware applies only to real estate and mobile homes with other personal property wholly exempted. Delaware also provides for the usual complete exemptions commonly available for the property holdings of governments, churches, and educational and charitable agencies, as well as for exemption of nonprofit housing for elderly persons.
Two significant adjustments of the tax base have been enacted during the past dacade. One of these concerns a homestead exemption provision to benefit limited-income elder- ly homeowners. The State law exempts from State or county property taxes up to $5,000 of the assessed value of a residence owned and occupied by a person aged 65 or over who has lived in the State for three years and who has annual income of $3,000 or less. Mobile homeowners are also covered by these provisions. Municipalities may enact similar tax relief provision.
A 1968 enactment provided, upon application of the property owner, for the distinc- tive valuation of land (comprising at least five acres) which is and has been for at least

two previous years "actively devoted to agricultural, horticultural, or forest use." The assessor is to value such land according to its worth for such uses, and for this purpose to consider the recommendations on value of the State Land Evaluation Advisory Com- mittee. The latter is a three-member body including the Dean of the College of Agricul- tural Sciences of the State University and two other members appointed by the Governor from lists submitted by the State Grange and the Delaware Farm Bureau. If the land is sub- sequently used for other than farming, a roll back tax is assessed which amounts to the difference between full value and use value.
The 1967 Census of Governments identified about 175,000 parcels of taxable realty in Delaware. Two-thirds of these were non-farm residential properties, one-sixth were vacant lots, and about one-tenth were acreage or farm properties. Although relatively small in number, commercial and industrial properties accounted for about one-fourth of the statewide total of assessed valuations. Because of budget limitations more current information from the 1972 Census was not available.
Delaware's taxable valuations have grown during the past decade, but their increase has lagged considerably behind the growth of the State's economy, which in turn, as noted above, has been outpaced by the rise in property tax revenue. Thus, there has been a considerable increase in the prevailing local tax rates applied to official valuations.
ASSESSING RESPONSIBILITIES
The State government of Delaware has no active role in assessment or other aspects of general property taxation except as noted above with regard to certain rural land. Basically, the task of setting assessed valuations is legally assigned to agencies of the State's three counties: three-member boards appointed by the respective governing bodies in Kent and Sussex Counties, and the Department of Finance (headed by an appointive official) in New Castle County. In Kent and Sussex the boards also serve as review bodies to consider appeals of particular assessments while in New Castle this duty rests with a separately appointed board.
New Castle County, where Wilmington is located, has nearly 400,000 inhabitants, or nearly three-fourths of the total State population. Each of the other two counties has a population of a little over 80,000.
ASSESSMENT LEVELS AND VARIATIONS
Delaware laws contemplate the assessment of taxable realty (except recently for certain rural lands) at its "true and actual value." However, actual practice here, as in most other States, has traditionally involved assessment at only a fraction of current market worth.
In the absence of any State agency with assigned concern for local property tax administration, Delaware also lacks any program for recurrent measurement of assess- ment ratios, such as is carried on in numerous other States.
The 1972 Census of Governments estimated a statewide average assessment ratio of approximately 37 percent. This figure is lower than the corresponding ratios of the 1962 and 1967 Census of Governments, which showed an overall average of 33 and 46 percent, respectively. The 1972 Census reports an inter-area coefficient of dispersion for single family non-farm housing of 1 4 and an intra-area coefficient of 29 percent.

FLORI DA1 Numerous important improvements have been made in the Florida property tax sys-
tem during the past decade. Earlier provisions which permitted municipalities to perform their own duplicative assessing and tax collection work have been eliminated, and such duties now rest entirely with county agencies, most of which serve a large enough popu- lation to afford effective operations. Legal provisions for State supervision have been considerably strengthened. As a result of judicial prodding there has been a marked in- crease in prevailing levels of property assessment, and also widespread improvements in the uniformity of assessments. The property tax laws have been considerably simpli- fied, and provisions as to exemptions have been clarified. On the other hand, the budget and staff resources of the State's central agency for supervision of property taxation seem relatively meager, and there has been only partial progress toward the full-value standard of valuation legally specified for most taxable property. The latter problem is undoubtedly related to the absence of an effective ongoing program for recurrent meas- urement of local assessment levels and variations by the State's property tax agency.
Some new exemptions and preferential assessment provisions have been enacted, but the drastic increase in property values, as officially assessed, has sharply reduced the extent to which the State's property tax base is eroded by its constitutionally based and relatively generous homestead exemption.
FINANCING ROLE OF THE PROPERTY TAX
In its State-local revenue system, Florida places heavier reliance on property taxa- tion than do most other States in the South, but less than most States elsewhere. In fiscal 1970-71, property taxes provided 26 percent of all general revenue raised by the State and local governments as compared to the average nationwide percentage of 32. For property taxes as a percent of locally raised general revenue, the Florida proportion is 51 com- pared to a nationwide average of 64 percent. Similarly the lighter use of the property tax is shown in the per capita and per $1,000 of income figures with Florida residents paying $127 and $36 compared to the national averages of $184 and $47, respectively. Per capita property tax yields in Florida nearly doubled during the 1960's, nearly keeping pace with the rise in per capita personal income.
Local levies account for the bulk of property taxes in Florida. The State government has for many years imposed no general property tax levy, but it does apply a special tax on intangible personal property, 55 percent of which is shared with the counties. This tax on intangibles accounted for 4 percent of the statewide total of all tax revenues in 1970-71. About four-fifths of Florida's 865 local governments (as of 1972) have property taxing power, and for most of them property taxes are a major revenue source. However, Florida municipalities have traditionally made much more use of alternative revenue sources than do municipal governments in most other States.
In an ACIR study, Measuring the Fiscal Capacity and Effort of State and Local Areas, it was estimated that Florida's property tax effort (its property tax revenue as compared with its property tax capacity) was 79 percent of the national average, while farm land was taxed at 92 percent of the national average. Florida's overall effort index for all State and local taxes was 84 percent.
THE PROPERTY TAX BASE
In 1971, locally set valuations of real estate accounted for some 84 percent of the base with locally assessed personal property contributing 15 percent, and State set valuations

of certain public utility property (mainly railroads) the remaining 1 percent. This re- flects an increase in the real estate share from a decade before (when it was 82 percent), and a drop of the other components.
As in numerous other States, the personal property portion of the general property tax base is limited here to tangible personalty used for business or agricultural purposes. Intangible personalty, as previously noted, is subject separately to a State imposed special property tax: motor vehicles and household property are entirely exempt as are growing crops, and business inventories are taxable on only 25 percent of their gross assessed value.
Florida is one of the limited number of States that regularly assemble data on the assessed value of wholly exempt property. In 1971, the statewide total of assessments for such property was $10.2 billion, or nearly one-fifth as much as the gross assessments for taxable property. Nearly three-fourths of the wholly exempt values involved publicly owned property, with the balance involving holdings of religious, educational, and chari- table bodies.
Constitutional and statutory enactments of the past decade have materially affected the scope and impact of property taxation in Florida. Even greater changes have resulted from the striking growth in assessed valuations partly as a result of increased actual values but particularly because of a major 1965 court decision which stimulated a drastic rise in the prevailing assessment ratio. Before those developments, a large proportion of all single-family homes in the State (including the bulk of owner-occupied houses] was wholly or substantially tax free under the constitutional $5,000 homestead exemption of assessed value. Now, however, most homes are at least partially taxable, and the cur- tailment of gross assessed valuations resulting from the homestead exemption (13.5 per- cent in 1971) is less than before the mid-1960's (28 percent in 1961, and 34 percent in 1956).
Following is a brief report of some of the most significant changes in the coverage of the general property tax that have been enacted by Florida during the past decade.
I. A 1963 law provided for the complete exemption of growing crops.
2. The previous partial exemption of household personal property and personal ef- fects was initially raised (from $500 to $1,000) and then replaced by a complete exemption, beginning with 1967.
3. Provisions for preferential assessment of agricultural lands relative to their use was amended in 1972. Under the present law, property owners must file an annual request for classification of any particular property as agricultural land, together with relevant information assuring that the land is being farmed commercially. Assessors are provided with certain statutory guidelines for their classification decisions. The land is reclassified when the land is no longer used for commercial agriculture, when the owner records a subdivision plot or when it is sold for three times its agricultural value. The same 1972 law provides for preferential assess- ment of property dedicated to recreational or park purposes, and provides for a recoupment of tax savings, with interest, if development rights are reconveyed to the owner during the period of the dedication.
4. Pursuant to a constitutional amendment approved by the electorate in 1966, the legislature authorized fractional assessment of business inventories, initially at a 50 percent rate for 1968 and thereafter at 25 percent.
5 . Under a constitutional authorization, approved in 1968, the legislature in 1971 provided for an additional $5,000 of homestead exemption for persons aged 65 or more who have been Florida residents for at least five years, with respect to taxes levied for local school operations. (Such levies make up almost half of all

local property taxes in Florida.) The law contemplateg annual State reimbursement of the local school districts for the tax revenues they lose as a result of this addi- tional homestead exemption. Homesteads of totally disabled exservicemen or their widows, if not remarried, were totally exempt.
6. An important 1971 enactment was designed to overhaul previous scattered pro- visions regarding property tax exemptions. It provides criteria as to the "education- al, literary, scientific, religious, or charitable purposes" for which property may be exempt under the constitution, and standards for county assessors to determine whether and to what extent particular properties are used for exempt purposes. Except for certain governmental and religious holdings, the law makes such ex- emptions conditional upon the filing of an annual application by property owners. In addition to providing for the complete exemption of property used exclusively for exempt purposes as defined, this measure provides that property used pre- dominantly for exempt purposes shall be exempt to the extent of the ratio that the predominant use bears to the total use.
7. By a 1972 enactment, the legislature vastly simplified the laws pertaining to local property taxation, eliminating many out-of-date provisions and generally putting into more orderly and understandable form numerous provisions of continuing relevance.
8. Various statutory changes were also made in the State's special tax on intangible personal property, and in 1971 responsibility for its administration-previously vested mainly in county agencies-was placed with the State Department of Rev- enue.
As mentioned earlier, Florida taxes intangible personal property. Exempt from the tax are Federal, State, and local government bonds, property owned by religious, educa- tional, and charitable organizations, intangibles in employee welfare plans, and money. Stocks, bonds, and other intangibles are taxed at a one-mill rate annually. A non-recurring tax of two mills is on all paper secured by mortgage, deed of trust or other lien on Florida realty. This latter tax is payable at the time of recordation.
The 1967 Census of Governments which is the latest data available showed 2.9 million parcels of taxable realty on Florida's local assessment rolls. Slightly over half of these were non-farm residential properties which made up 62 percent of the gross amount of local real estate valuations. Acreage and farms accounted for 10 percent of the taxable parcels and 13 percent of gross realty valuations. The far less numerous commercial and industrial properties contributed 18 percent of gross realty values.
ASSESS1 NG RESPONSIBILITIES
Locally, the task of property valuation is assigned to the county assessor, a consti- tutional official elected for a four-year term in each of Florida's 67 counties. There are only 13 counties of less than 10,000 inhabitants, altogether including less than 2 percent of the State's population. A majority of the population is in counties of at least 250,000 and all but a minor fraction in counties of at least 50,000.
Recent legislation (1969 and 1972) has eliminated earlier arrangements by which dupli- cative assessment and collection work were performed by numerous municipalities. Under these provisions, all municipalities as well as other local governments are served by county assessors and tax collectors.
Supervision of local assessment work is provided by the State Department of Revenue (the agency that is also responsible for administering most of the State's taxes), which is headed by an Executive Director subject to appointment by the Governor and his cabinet.

Prior to 1969, the duty of property tax supervision rested with the elective State Comp- troller.
Property tax work of the Department of Revenue is handled by the Ad Valorem Tax Division. Its operations during fiscal 1972 involved a budget of $344,000 or about 0.04 percent of statewide property tax revenue. In early 1972, this Division had a total staff of 27 persons.
By statute, the State Department of Revenue has broad powers to supervise assess- ment work (as well as property tax collection). It is responsible for:
1) approving the annual budgets of county tax assessors and collectors,
2) setting standards for assessment and collectors,
3) prescribing rules and regulations governing property valuation,
41 prescribing and supplying forms and maps to be utilized by county assessors,
5) conducting continuing research into property taxation within the State,
6) investigating local assessment and tax collection operations, and
7) recommending to the Governor the removal of any official deemed wilfully dere- lict in the performance of his duties.
Although some of these responsibilities date from earlier years, many of them have been clarified, strengthened, or added by legislation enacted since 1967.
Unlike similar agencies in a growing number of other States, the Department of Revenue lacks specific authority to set or enforce qualification standards for local as- sessment personnel. It has, however, initiated a certification program to recognize per- sons considered to be especially well qualified in the field of assessing.
In 1973, several property tax laws were amended which shift the ultimate control over assessments from the county assessor to the Department of Revenue to insure as- sessment uniformity. For example:
1. The Department shall set up uniform standards and procedures for assessment.
2. County assessment rolls will be evaluated annually by the Department. If defects are noted the assessor must notify the Department what corrective action is being taken or may appeal the decision to a newly created Assessment Administration Review Commission.
3. In-depth audits of the assessment rolls of each county will be made no less fre- quently than once every three years by the Auditor General.
In addition, as part of its rule making function, the Department, through its Ad Valor- em Tax Division, has issued a set of definitions and regulations which include a potenti- ally valuable feature found in only a limited number of other States; a set of categories for the classification by use of the various items of property entered on local assessment rolls. The classification system, only recently introduced, is to become fully mandatory for local application beginning with 1973 assessments. Assessment rolls will not be ap- proved by the Department after 1973 unless proper use classification is used.
ASSESSMENT VARIATIONS The Florida constitution calls for a just valuation of all property subject to general
property taxation, subject to provisions authorizing fractional assessment of business in- ventories and livestock and special treatment of agricultural land and land used for com- mercial recreational purposes. Just valuation has generally been held by the courts to be full current market value. However, this standard has been found to be less compelling

in some Florida decisions compared to those rendered by courts in other States, because the law specifies a number of considerations in addition to "present cash value" that tax assessors shall consider in appraising particular properties.
As in most other States, Florida assessments of taxable realty in the mid-1960's typi- cally were at a fraction of current market value. In several important cases (especially Walter vs. Schuler, et al, in 1965 and Burns vs. Butscher, et al, in 19661, the Florida Su- preme Court called for an end to such disregard of the constitutional mandate, by holding that just valuation was legally synonymous with fair market value. Prodded by the State Comptroller, the county assessors carried out widespread reassessment efforts which resulted in a material increase in prevailing valuation levels for taxable realty. The 1972 Census of Governments estimated a statewide average assessment ratio of 63 per- cent, as compared with 41 percent ten years earlier and 30 percent five years before that.
The 1967 Census reported some individual county measures of assessment level and variation for single-family houses, as indicated by sample sales of such properties. Al- though the figures showed a considerable range among the 21 major Florida counties with assessment ratios of from over 90 to less than 50 percent, they indicated less divergence than had been found five and ten years earlier. Perhaps more important, the Census data indicated considerable progress toward more uniformity of assessments for houses within most of these individual major counties. Two-thirds of them showed a dispersion coeffici- ent of less than 15 percent-a standard achieved by only one of the 17 major counties which reported five years earlier, and by less than one-third of all the nation's assessing areas of over 50,000 population. The 1972 Census of Governments showed an increase in the intra-county coefficient of dispersion to 18 while the inter-county coefficient was 11 percent.
Despite this record of progress, Florida has been seriously handicapped in its efforts toward more equitable property taxation by the lack of an ongoing program for State measurement of local assessment levels and variations, such as is found in numerous other States.
As one phase of school aid enactments in 1969, the Florida Legislature required the State Auditor General to develop measures annually of the average assessment level for taxable realty in the respective counties. (So far as is known, this is the only State where such a measurement task has been assigned to an agency other than the one directly con- cerned with other aspects of property taxation.)
A private appraisal firm was engaged by the Auditor General to perform the initial ratio study, pertaining to 1970 valuations, and the results were released in December of that year. They confirmed earlier Census findings by showing marked inter-county dif- ferences of assessment ratios of from 51 to 99 percent, with the statewide ratio estimated at 83 percent.
The sharp impact of the findings on various aspects of local school financing led to extensive litigation, invalidation of the ratio study, and further State legislation-including a 1972 enactment which includes a provision that the ratio study findings "shall not be used to supersede the procedure called for in subsection 193.114(5) relating to certifica- tion of the tax rolls by the Department of Revenue." (Subsection 193.114(5) is a portion of the law that grants the Department of Revenue broad powers to determine whether the rolls meet legal requirements, including their reflection of just value.) This apparently conforms explicitly to the legislature's intention to limit the impact of the Auditor Gen- eral's official ratio findings to matters of school financing and county sharing of motor fuel taxes, rather than to permit them to affect directly the administration of property taxation, as supervised by the Department of Revenue. This, of course, contrasts sharply with provisions found in numerous other States regarding the official measurement of assessment levels and variations.

Such provisions generally direct or authorize the use of ratio findings by the State property tax agency in its efforts to promote local compliance with legal standards of property valuation, as well as for other purposes, sometimes including specific' authority for the citation of such findings by property owners who believe their property has been inequitably assessed.
'Part of the information for this report was provided by L. L. Qualls, Legislative Economist, Florida State Senate.

After a decade of carrying out a vigorous State aided reappraisal program, Georgia in 1972 enacted a property tax reform package, which, according to John Blackmon, State Commissioner of Revenue, "when fully implemented will bring about the most com- prehensive and far-reaching changes in the ad valorem tax field in Georgia in the past 100 years."
The new program, which is intended to be put into effect over a three-year period beginning January 1, 1973, calls for strong leadership on the part of the State Department of Revenue in establishing and enforcing standards as to the qualifications and pay scale of local assessors; developing a training program and requiring local assessing personnel to attend courses to qualify for certification; standardizing records; and developing modern appraisal tools. The legislation provides for State grants to counties to help them with the new statutory requirements. It also calls for elimination of duplicative city and county appraisals and opens the way for the smallest counties to consolidate assessing offices. In addition, appeals procedures are simplified and modernized.
FINANCING ROLE OF THE PROPERTY TAX
Although property taxation is more important in the Georgia revenue structure than in most of the Southeastern States, it is still low relative to national averages. In 1970-71, only 24 percent of the general revenue raised by the State and local governments came from property taxes, and 51 percent of locally raised general revenue was from that source. The comparable national averages were 32 percent and 64 percent, respectively. Similar relationships are found when comparing the per capita tax level ($107) and per $1,000 of income ($33) to the national averages of $184 and $47, respectively.
An ACIR report, Measuring the Fiscal Capacity and Effort of State and Local Areas, estimated that Georgia's property tax effort was 68 percent of the national average. Com- mercial and industrial properties are taxed at somewhat higher rates at 81 percent of the national average. For all State-local taxes, Georgia's composite effort index was 8 percent- age points below the average for all States.
THE PROPERTY TAX BASE
In 1971, 89 percent of the taxable value of property was assessed locally; but 11 per- cent was State assessed railroad and public utility property. Georgia relies more heavily on personal property for its tax base than do most other States; 26 percent of the assessed valuations is in personalty. Only household furnishings and goods are exempt. Business inventories, machinery, motor vehicles and intangibles are all taxable.
In addition to the usual exemptions for property used for governmental, educational, religious, and charitable purposes, Georgia provides a number of homestead exemptions, exempts household goods and furnishings and also air and water pollution equipment. There are no veterans' exemptions nor does Georgia provide preferential treatment for farmland.
Georgia has had a longstanding constitutional homestead exemption of $2,000 assessed value. A 1964 constitutional amendment provides for the exemption of $4,000 in assessed value of homeowners aged 65 and over with household incomes of $4,000 or less. And, in November 1972, the voters approved two amendments authorizing school districts to provide homestead exemptions from all school taxes of homeowners aged 62 and over with household incomes of $6,000 or less. Several school districts have enacted legislation providing the latter exemption. There is no provision, however, for reimbursement by the

State for tax losses experienced by local governments as a result of these homestead exemptions.
Disabled veterans have been exempted from all property taxes. Assessors are required to list and appraise all exempt property under 1972 legisla-
tion. Such appraisal data were not yet available as of this writing but should be available in the near future. Homestead exemptions were 17.4 percent of the assessed value of locally assessed real estate in 1971.
The following are the intangible personal properties taxed along with the current tax rate:
a) net worth of saving and loan (building and loan) associations at the local ad val- orem rate;
b) long term notes secured by real estate at the time of recording at a rate of $3 per $1,000 with a $10,000 maximum tax on any single note;
c] short term notes secured by real estate, accounts receivable, notes not secured by real estate, all other intangibles at $0.10 per $1,000;
d) loans held by brokers at $0.25 per $1,000; and
e) bonds and debentures of all corporations and stocks in all foreign corporations $1.00 per $1,000.
Exemptions for governments and charitable organizations are similar to those for the property tax on realty. The basis for the tax is fair market value rather than 40 percent of market value as with the tax on tangible property.
According to the 1967 Census of Governments, the latest data available, there were 1.3 million parcels of locally assessed real estate with a gross assessed value of $4.7 bil- lion. Sixty-two percent of the number and almost the same proportion of the value was residential non-farm property. Acreage and farms comprised 20 percent of the number and 16 percent of the value. Commercial and residential property, which made up only 4 percent of the parcels, accounted for 21 percent of the value. Conversely, vacant lots were 14 percent of the number of properties but only 2 percent of the valuation.
ASSESSMENT RESPONSIBI LIT1 ES There has been no basic change in the past decade in the organizational structure for
property tax assessment. State supervisory responsibilities, although considerably strengthened (see below) remain in the Department of Revenue. That agency continues to assess railroad and utility property. Effective January 1, 1973, the Department also assess- es airline flight property. An independent State Board of Equalization was established in 1972 as an appellate body in connection with State assessed properties. It has not equal- ization functions in regard to local assessments.
The counties are the primary local jurisdictions; most of them have three-member boards of assessors appointed by the county commissioners. The 1972 legislature did, however, eliminate the overlapping assessments of municipalities, which, except for Atlanta, are now required to use the county appraisal of properties within their borders. It also authorized the smallest counties (those with fewer than 3,000 parcels) to contract with a contiguous county or with a professional appraisal firm, if they cannot them- selves employ at least one full-time qualified appraiser. Such covnties are also authorized to join with one or more contiguous small counties and by a contractual arrangement establish a joint property appraisal staff. Sixty counties (almost 40 percent) have fewer than 10,000 inhabitants and 11 counties have fewer than 5,000, making good assessing difficult.

Prior to enactment of the 1972 reform package, while the Department of Revenue had general supervisory responsibility over local assessors, its major activity was in connection with a State aided county-by-county reassessment program that was initiated in 1961. In order to qualify for interest free loans under this program, counties must adhere to standards promulgated by the State Department of Revenue and use a standard contract which stipulates specifications for the work to be done, qualifications of staff and other details relating to the reassessment task. All contracts and appraisal firms must be approved by the Department.
The 1972 legislation established minimum qualifications to be met by county asses- sors and their staffs and required that assessors be certified by the Department of Reve- nue. The statute established minimum staffing patterns (according to size of assessing jurisdiction) and also required the Department of Revenue to establish a minimum salary scale. The Department is also authorized to prescribe uniform standards, manuals, proce- dures, and forms. In cooperation with the University of Georgia, the Revenue Department conducts training sessions for assessors and their staffs. County appraisal staffs are now required by law to attend such courses.
A State aid program was initiated by the 1972 legislature to help counties staff asses- sors' offices and improve assessment procedures. Such aid is contingent on the county employing the required minimum qualified staff and maintaining the required records.
ASSESSMENT VARIATIONS
The statutory assessment level in Georgia is 40 percent. This level was established for State and county (including school) taxes in 1968 and extended to municipal taxes in 1972.
The extensive decade long reappraisal program has been effective in raising the general assessment level in the State. According to both the 1972 and 1967 Census of Governments, the statewide average assessment ratio was 35 percent, up from 21 percent in 1961. The Revenue Commissioner is required to equalize assessments annually and is authorized to adjust the assessment level or to return the assessment roll to the county for adjustment.
The State Auditor has been conducting annual ratio studies since 1964 in connection with the State's school equalization aid program. There is no requirement that the results of these studies be made available to the public. Under the 1972 legislation, county as- sessors are now required to compile sales ratio data, which they are to furnish to the State Department of Revenue. The Department is to prescribe procedures for conducting sales ratio studies. Again, the law does not require disclosure of the results of ratio studies to the property taxpayers.
While there has been a substantial rise in the average statewide level of assessments there is still considerable inter-county variation in assessment ratios. For single-family homes, as reported by the 1967 Census of Governments, the inter-area coefficient of dis- persion was 34 percent-considerably higher than for most States; by the 1972 Census this figure has been reduced to 29 percent, but it was the fifth highest coefficient in the nation. More important, however, is the record in regard to intra-area dispersion. At least so far as non-farm houses are concerned, Georgia moved from an extremely inequitable situa- tion in 1961-when the coefficient of intra-area dispersion was 31 percent-to one of comparative uniformity in 1966, when the coefficient had dropped to 17 percent. By 1971 this figure had increased to 20 percent.
REVIEW AND APPEAL OF PARTICULAR ASSESSMENTS
The 1972 legislation simplified the previously cumbersome system of arbitrators in connection with appeals. Each county is to establish at least one three-member board of

equalization, to be appointed by the county grand jury. These boards are completely in- dependent of the assessment process. Large counties (with more than 25,000 parcels) may establish more than one board in order to serve taxpayers more conveniently. Notice to taxpayers must include both the current and prior year's assessment and a reference to the taxpayer's appeal rights.
The county board of equalization can request relevant information, including pre- sumably the findings of State assessment ratio studies, in determining the question of assessment uniformity. Appeals from the ruling of the county boards of equalization may be taken to Superior Court. There is no provision for appeals to a State administrative or quasi-judicial body.
The 1972 legislation also established an independent State Board of Equalization to hear appeals on State assessed property.
Tart of the information for this report was provided by Tom Sangster, Director, Property Equalization and Local Services, Georgia Department of Revenue.

HAWAII I
During the past decade, Hawaii's long-standing but unique arrangement, by which all property tax assessments are set by a State agency, though providing a base only for locally imposed levies, continued to operate effectively and without drastic change. The property tax still plays a lesser role here than in the financing structure of most other States, although its yield and relative importance have been increasing. Since 1965, the property tax laws have included provision for somewhat higher levies on land than on improvement values for certain types of property, but the differential is relatively limited in scope and extent. Other enactments have considerably enlarged earlier exemptions and provided many new tax preference provisions, including a number which utilize a system for owners' explicit dedication of properties to particular defined uses for ex- tended periods of time in exchange for tax exemption or preferential assessment.
FINANCING ROLE OF THE PROPERTY TAX
Given the uniqueness of this island State's geography, economy, and historical background, it should not be surprising that Hawaii also differs from most other States in important aspects of governmental structure and financing. Hawaii's State government has a relatively larger financing role than other States. (It ranks fourth after Delaware, New Mexico, and South Carolina.) In fiscal 1970-71, State imposed taxes made up 76 percent of the State-local total, as compared with an average of 54 percent for the nation as a whole, and property taxes which are unique because they are all locally imposed supplied only 15 percent of all the general revenue raised by the State and local govern- ments.
On the other hand, the property tax proportion has been growing-it was only 11 percent a decade earlier-while in most other States it has been dropping.
Per capita property tax collections in Hawaii more than tripled during the 1960's reaching their present level of $111 (1972 Census). They showed an average annual in- crease of about 12 percent, considerably outrunning the growth of the State's economy, as measured by an annual growth of about 7 percent in per capita personal income. The tax per $1,000 of personal income was $26 relative to the national average of $47.
In an ACIR study, Measuring the Fiscal Capacity and Effort of State and Local Areas, it was estimated that Hawaii's property tax load, relative to its capacity as defined accord- ing to the usual scope of property taxation, was only 60 percent of the national average. Its composite effort index for all State and local taxes however, was estimated at 35 percent above the U.S. norm, ranking second among all the States.
At the local government level, property taxation in Hawaii is a primary financing source. I t accounted in fiscal 1970-71 for 63 percent of all locally raised general reve- nue, close to the national average proportion of 64 percent. The amounts involved fi- nanced only four local governments: the City and County of Honolulu (which has over 80 percent of the State's population) and three other county governments that serve popu- lations respectively of 30, 46, and 63,000. (The only other local government units in Hawaii are some 15 financially insignificant soil conservation districts, which lack taxing power.) Although these four major local governments have a broad range of other responsibilities, they have only a limited concern for public education and public welfare, since the costly functions are subject to direct State administration and financing.

THE PROPERTY TAX BASE
Property taxation in Hawaii applies only to realty, with all personal property exempt- ed. Moreover, as pointed out in the ACIR study of a decade ago, the taxable real property base is limited to an unusual degree by legal exemptions. Public utility property is not subject to property taxation; instead, utilities are taxed by reference to their gross operat- ing revenues.
Hawaii also provides for the usual kinds of complete exemptions of the property holdings of governments, churches, educational, and charitable organizations. It main- tains records of the assessed value of wholly exempt property, which is unusually great in relation to the value of taxable realty, in large part because of the sizable holdings of the Federal government.
A homestead exemption is also provided, which in 1971 eliminated from the tax base 14.4 percent of the valuations set on otherwise taxable realty. A decade earlier, with less generous provisions, the proportion was 8.4 percent. Additional legislation, as dis- cussed below, will undoubtedly result in a considerable further increase in the portion of the potential base that is tax free through homeowners' allowances.
During the past decade, the legislature of Hawaii passed numerous laws affecting the application of the property tax laws. Some of the most significant provisions are close- ly tied to the State's highly developed system for land classification and zoning.2
Differential land value taxation. Act 142 of the 1963 Legislature provided for a modi- fied version of a land value tax, which went into effect in 1965. The primary purpose of this law was to spur the development of vacant land by placing a heavier tax burden on land than on structures. To do this, the land was first classified upon consideration of its highest and best use into six general classes:
I) single-family and two-family residential; 41 industrial;
2) three-or-more-family apartment, hotel, and resort; 5) agricultural; and
3) commercial; 6) conservation. The law provided for the setting of tax rates separately for each class of property by resolution of the governing body of each of the four local taxing jurisdictions. Then for the first four property classes (i.e., excluding agricultural and conservation property), the law specified a building tax factor, in order to obtain differential tax rates for land and for buildings. Beginning in 1965, the building tax factor was 90 percent; i.e., the building rate was 90 percent of the rate on land. At present the building tax rates are 80 percent of the land tax rates. If further changes go the full course authorized by law to take effect over a several-year period, the building tax factor would eventually reach a low of 40 percent.
By a 1969 amendment, application of the differential tax rate provision was signifi- cantly curtailed, on the ground that its application in the residential class tended to shift tax burdens from newer and more expensive homes to older and lower valued ones. Ac- cordingly, "improved" residential properties were separate from the "unimproved," and differential rates are no longer applied to the "improved" residential class (which, as suggested by the summary Census data provided later, accounts for a large proportion of all real property valuations).
Homeowners' exemptions. Long-standing homestead exemptions have been succes- sively extended and increased by various amendments, including laws making such bene- fits available to owner-occupants of cooperative apartments (1963) and condominiums (1967). A recent change (19711 eliminated the homestead exemption schedule which pro-

vided varying amounts of exemption depending on the value of the property. Now, an owner-occupied dwelling is totally exempt if its assessed value is not in excess of $8,000 (or, according to recent assessment ratio findings, about $13,000 of current market value). For an owner-occupied dwelling with a higher assessed value, there is a flat $8,000 ex- emption. However, the homestead exemption for elderly taxpayers is $16,000 of assessed value for a homeowner 60 to 70 years of age and $20,000 for a homeowner aged 70 or over. (These preference provisions for the elderly as first enacted in 1966 were on a graduated basis, related to the taxpayer's income and number of personal exemptions. A 1969 amendment eliminated the personal exemption and income qualifications.)
Redefinition of real property. In 1967, Act 120 amended the definition of real prop- erty by including all machinery and equipment whose use is necessary for the utility of the property and whose removal cannot be accomplished without substantial damage to the property. However, another section was added, exempting from real property taxation all fixtures used in the manufacture or production of tangible personal products.
Taxation of Federally leased property. Effective in 1964, real property owned by the Federal government and leased to and used by a private person in connection with a busi- ness was made subject to property taxation.
Exemptions for the handicapped. The property tax exemption for blind or deaf per- sons was increased to $15,000 in 1966, and a similar exemption was made available in 1970 to the deaf and totally disabled. In 1973, the exemption was extended to those with leprosy (Hansen's disease). Disabled veterans are totally exempt from property taxes.
Exemptions for orchards and "tree farms." One 1963 law provided exemption of orchard property from the initial time of planting through two years beyond the normal period of development of the orchard crop. Another 1963 enactment provided for ex- emption of a property (of at least 30 acres) which at the owner's application is officially classified as a tree farm and is so used under an agreement covering a period of at least 30 years, for the duration of the agreement.
Preferential treatment of "dedicated" lands. Several recent laws have authorized either complete exemption or (more commonly] preferential assessments of properties which have been specifically dedicated by their owners to certain uses. With an approved dedication, the owner forfeits any right to change the use of the land for a relatively extended period. Generally under these laws a dedication agreement is renewable indefi- nitely, subject to cancellation by either the owner or the State Director of Taxation upon several-years' notice after the end of a prescribed period. Failure to observe the use restriction cancels the preference, retroactive to the date of the owner's petition, where- upon all tax savings that resulted from the dedication, together with interest, become pay- able.
Under a 1961 law, the owner of land within an agricultural, rural or conservation dis- trict could dedicate his land for a specific ranching or agricultural use and have the land assessed at its value in such use. In 1965, the law was broadened to permit similar dedi- cation and special assessment of land used for agricultural purposes in urban districts. if the land had been substantially and continuously in an intensive agricultural use for five years immediately preceding the dedication request.
In 1965, dedication laws were also enacted relating to landscaping, open space, public recreation areas, and other similar uses in urban areas. Properties dedicated to these uses for a minimum period of ten years become tax exempt upon approval of the dedica- tion.
A wasteland dedication law was also enacted in 1965 to encourage the reservation of property normally considered as wasteland, under which qualifying property is assessed at its value as wasteland for the first five years.

Under a 1969 enactment, the owner of a golf course can dedicate his parcel of land for a golf course and the land is to be assessed according to this actual use rather than on the market basis of highest and best use.
A 1971 law extended the dedication approach to certain residential properties located in urban districts where the land use is changing to a higher use. The owner-occupant, aged 60 years or over, of a single-family residence located on a parcel of not more than 10,000 square feet can dedicate his land for residential use and have the land assessed at such use rather than the higher use. This dedication is for a minimum period of ten years.
Other exemptions. A 1965 law, as later amended, provides for a seven-year exemption from tax of any increase in building value that results from alterations or repairs made by the owner-occupant of a structure in order to comply with the requirements of rehabil- itation or urban renewal projects. Other exemptions have recently been provided for property owned by Federally chartered credit unions (1966); for regulated nonprofit housing that qualifies for loans under Section 221(d)(3) of the National Housing Act (1968); for housing projects that qualify for loans under Sections 202 and 236 of the Na- tional Housing Act (1967 and 1969); for crop shelters (hot houses) with coverings of plastic or fiber glass (1970); and for certain State certified facilities for control of air or water pollution (1971).
Components of the tax base. The 1967 Census of Governments reported 218,000 par- cels of realty on the State's assessment rolls including those benefiting by homestead exemptions but not other wholly exempt properties. Non-farm residential properties made up nearly 47 percent of the total number, and accounted for 60 percent of the gross (pre-exemption) assessed valuations, including 50 percent of the total for single-family homes. Vacant lots were similar in number but accounted for less than 10 percent of the assessed valuations. Commercial and industrial properties, though relatively few in number, contributed 27 percent of the gross valuations, while acreage and farm properties accounted for 3 percent of the parcels and 4 percent of the valuations. These data were not updated with the 1972 Census.
ASSESSING RESPONSIBILITIES
Although property taxation in Hawaii involves only locally imposed levies, these apply to assessed valuations determined entirely by the State Department of Taxation, which also makes the collections on behalf of the local taxing jurisdictions. This arrange- ment-still without a parallel in any other State, as was the case when it was discussed at some length a decade ago in the ACIR study, The Role of the States in Strengthening Property Tax-originated long before Hawaii's statehood. Drs. Frederick L. and Edna T. Bird, who prepared that study, were most favorably impressed with this system of clearly focused responsibility for property tax assessment. They commented:3
Since central administration of the property tax is traditional procedure in Hawaii, the State's citizens probably are not so fully aware of its advantages, actual and potential, as they would be if the system were a new product of progres- sive civic effort. These advantages become obvious, however, when comparison is made with the various arrangements in the other States.
Under Hawaii's system of State assessment, a reasonable degree of statewide equity among classes and within classes of property is being worked for through a professional assessing staff following uniform methods and procedures under central supervision, reinforced by the valuation research work of a central technical staff. These professional and technical resources are just as available for rural areas as for

urban areas. Decentralization of assessment would require an expensive duplication of some of these facilities, or their downgrading in rural counties that might find it difficult to meet the expense. This system also can obtain inter-county equalization without the creation of a special State organization for this purpose. Not to be over- looked are the economies and efficiencies resulting from the availability of the re- sources of a large central tax department. . . . . . . The importance of a sound system of central assessment can hardly be over- emphasized. It removes local fiscal capacity from obscurity, avoids the economic and fiscal weaknesses of competitive underassessment, and obviates the need for the complex and costly regulatory organization and machinery to which other States are turning in order to salvage the property tax.
The Hawaii Department of Taxation, which administers various State taxes as well as the locally imposed property tax, is headed by a Director appointed by the Gover- nor. It was materially reorganized in 1963-64, to provide a clearer separation of staff and line functions. Staff functions were concentrated in distinct headquarters units, one of which is particularly concerned with technical aspects of property taxation, including tax maps. Personnel of the Department is under the State's civil service system.
The Department's staff for property tax assessment work (including mapping) has grown only moderately in the past decade, from 82 to 100. The 1972 appropriation for as- sessment work was $1.1 million, equal to about 1 .2 percent of annual property tax reve- nue. The total cost of the State's administration of the property tax, including computer usage and collection work, is estimated at $1.7 million for fiscal 1972, or about 1.8 per- cent of the resulting revenue.4 This percentage relationship has dropped materially during the past decade; although spending for assessment activity has risen, there has been a considerably greater rise in property tax levies and collections.
Prior to 1965, the costs of property tax administration were borne by the State gov- ernment. Since then, by statute, the four local governments involved have been required to reimburse the State for these expenses.
ASSESSMENT VARIATIONS
As reported in the ACIR study of a decade ago, Hawaii statutes specifically authorize the Director of Taxation to "use as the tax base a percentage of fair market value," but require him to certify to each county annually the ratio represented by its taxable assessed valuations. The importance of this certification was reduced by a 1963 enact- ment which removed earlier statutory limitations on local tax rates (which had taken into account the indicated relationship between assessed and full market values). Neither is the certification pertinent for the application of legal limitations on local government debt, which are expressed as a percentage of assessed value (rather than market value).
Although there is no legal requirement for the conduct of assessment ratio surveys, the Department of Taxation carries out such a study each year. The results are issued in an annual publication which includes measures of indicated assessment level and dis- persion, for the several counties and by class of property. In this statistical undertaking, the Department benefits by information available under a State tax on real estate trans- fers, enacted in 1966. For 1970, the study showed a statewide average assessment ratio for non-agricultural properties of 59 percent which compares favorably with the 54 percent figure found in the 1972 Census of Governments. It also indicated an average deviation of assessments for such property of 10 points, or a coefficient of dispersion of 14 percent. The 1972 Census reports an intra-area coefficient of dispersion of 19 and an inter-area coefficient of 11.

REVIEW AND APPEAL OF PARTICULAR ASSESSMENTS
A property owner may appeal his assessments, or handling of a claim for exemption, either to a local board of review or directly to the Tax Appeal Court. Each of the four counties has a board of review composed of five residents appointed by the Governor for overlapping four-year terms.
Effective in 1968, the Tax Appeal Court was placed within the Circuit Court system and the former three-member body was replaced by a judge of the First Circuit, ap- pointed by the Chief Justice, to serve full time in this capacity. The same act authorized the Tax Appeal Court to establish by rules a small claims procedure, to expedite hearings of appeals involving a tax liability of less than $1,000. This approach is available to the taxpayer for a filing fee of $3.
1Part of the information for this report was provided by Stanley T. Ooska, Assistant Director, Hawaii Department of Taxation in charge of the Property Technical Office.
2Especially in considering dollar amounts cited below for certain exemptions, the reader should remember that residential and other land values in Hawaii are generally higher than those in most other States. This is illustrated by various sets of data. For example, the 1970 Census of Housing reported that the median value of owner-occupied homes in Hawaii was $35,000 or more than twice the nationwide median of $17,000.
sop. cit., Voi. 2, pp. 39-40. 4This percentage, obviously, is not directly comparable to those reported elsewhere in this study for other
States. Typically in other States, the bulk of property tax administration is handled at the local government level, although in some instances with considerable State sharing of the costs involved.

Like most sparsely populated States where the task of property valuation is assigned mainly to local agencies and only slim resources are available for central assistance and supervision, Idaho has a difficult task in achieving an equitable and effective property tax system. However, it has experienced some important developments in recent years. These include the statutory exemption of business inventories from property taxation; require- ments for a gradual reordering to a common base (by 1982) of the presently divergent levels of assessment for State set and locally set valuations; and improved arrangements for property tax appeals, including provision for informal and expeditious handling of cases that involve relatively small value properties.
FINANCING ROLE OF THE PROPERTY TAX
Property taxation represents a sizable but relatively diminishing element of Idaho's State-local revenue structure. Although per capita property tax collections in the State in- creased during the 1960's at an average rate of 3.7 percent annually and reached $140 in 1971, collections were still well below the national average of $184. The yields from sources other than the property tax were rising even faster so that the property tax part of all reve- nue raised by the State and local governments dropped off from 38 to 28 percent. Property tax yields also lagged behind the rise in per capita personal income (up 4.9 percent a year during the decade), so that in fiscal 1970-71 property tax revenue amounted to less than $44 per $1,000 of personal income as compared with $49 per $1,000 a decade earlier.
Except for a minor State levy for certain debt service requirements, Idaho .property tax revenue is entirely from local levies. There are 730 local governments with property tax power and most of these rely primarily on this source for their financing.
THE PROPERTY TAX BASE
Of Idaho's statewide total of taxable valuations in 1971, locally assessed real estate accounted for 65 percent; locally assessed personal property for 11 percent; and State set valuations of public utility property for 24 percent. This denotes a marked drop in the per- sonal property component (which was nearly 16 percent of the total in 1966) mainly as a result of legislation which provided for the exemption from the property tax base of all business inventories (including livestock and other products for human consumption) over a four-year period ending with 1971.
The tax base was also reduced by a number of partial exemptions (in addition to the usual kind of complete exemptions allowed for the property holdings of governments, churches, charitable, and educational bodies). These include relatively long-standing provisions on behalf of the blind, widows, orphans, and certain veterans exempting $1,250 of full cash value as long as the market value of the property does not exceed $25,000 and net income does not exceed $4,800. A homestead exemption exists for the elderly (age 65 and over) who have been real property taxpayers for ten years. Two limits exist:
1. If the property's cash value is greater than $15,000 the exemption is not available.
2. The property tax relief can not be greater than $75.
In 1973, a general hardship exemption was passed. If the market value of all property does not exceed $15,000 a taxpayer who because of unusual circumstances which affect his ability to pay the ad valorem tax can be relieved of his taxes for a one-year period. Claim- ants must apply each year to the Board of Equalization. Altogether, such partial exemp- tions curtail locally set assessed valuations by less than 1 percent. Like numerous other

States, Idaho has in recent years provided tax exemption for the value of facilities to con- trol air or water pollution.
Further changes in the composition of the property tax base are in prospect as Idaho moves to implement 1967 and 1969 laws under which, by 1982, all taxable property is re- quired to be valued at 20 percent of its market value for assessment purposes. The present fraction for State set utility values is considerably higher than this, while local assess- ments are below the 20 percent level.
According to the Tax Commission, "(each) county assessor determines the annual ratio to be applied on all real and personal property under his jurisdiction. Most county de- clared ratios are less than the legally prescribed 20 percent and are being annually ad- justed upward." The Commission conducts an annual ratio study based on verified open market transfers of taxable realty and appraisals by its staff. Findings from this effort are not published, but are available for the Commission's review and possible equalization of market value for assessment purposes in determining each county's proportion of pay- ment to the State for State bond retirement. They are used also to adjust schooi aid grants to the respective counties. The Commission estimates a statewide average ratio of approxi- mately 12 percent. Similarly, the 1957, 1962, 1967, and 1972 Census of Governments esti- mated statewide average ratios for taxable real estate in Idaho to be approximately 11 percent.
The periodic Census studies also showed considerable variation in assessment level for single-family houses within the sample Idaho counties they covered, with the intra- area coefficient of dispersion falling from 35 in 1957 to 26 in 1966. However, in the 1972 Census the intra-area coefficient increased to 27, higher than the national average of 20. (The inter-area coefficient of dispersion was 12 increasing from 8 in the 1967 Census.)
The 1967 Census of Governments, the latest available Census gathering of this informa- tion, counted approximately 295,000 parcels of taxable realty on Idaho's local assessment rolls. Of these, about 45 percent were non-farm residential properties and 37 percent were acreage or farm properties. Although far less numerous, commercial and industrial prop- erties made u p a significant fraction of all local real estate valuations (33 percent), some- what more than all residential realty and nearly as much as all acreage and farm realty (35 percent).
ASSESS1 NG RESPONSIBI LIT1 ES
As is true in numerous other States, the task of property valuation in Idaho is divided between a State agency and county offices. Responsibility begins with the State Tax Com- mission, a four-member body appointed by the Governor, which not only deals with prop- erty tax matters but also administers various other major State imposed taxes. The Com- mission assesses public utility property and is responsible for overseeing local assessment work. Although approximately doubled during the past decade, the resources applied to the property tax work of the Commission appear extremely modest, amounting to $306,000 in fiscal 1972, or only about 0.3 percent of the statewide revenue from property taxation.
Each of the State's 44 counties is served by an elected assessor. Most of the counties are sparsely populated a dozen having fewer than 5,000 inhabitants and another dozen from 5,000 to 10,000. Only four of the 44 counties have a population of over 50,000.
The Tax Commission reports that.Idaho counties are in the third year of a program instituted under recent legislation which requires that all properties be reappraised at least once each five years. About two-thirds the total number of parcels within the State have been dealt with thus far.
The Commission conducts an appraisal course annually supplemented by several area seminars for couhty commissioners and assessors. The Commission also provides various

appraisal manuals and supplies limited assistance to the counties for mapping and platting properties on aerial photography maps.
AVAILABILITY OF PROPERTY TAX DATA The State Tax Commission has authority to prescribe the form of local real property
assessment rolls and taxpayer statements concerning personal property. By law, the county tax collectors must notify property owners in an annual billing of "the full market value, the assessed valuation, and the amount of taxes due" (with a breakdown by taxing jurisdiction) for each taxable property. The respective counties issue annual financial re- ports which include data on property tax revenue. Also, the State Tax commission's Annual Report includes county-by-county figures on assessed valuations, including sepa- rate data as to the value of land, improvements, and taxable personal property by type.
REVIEW AND APPEAL OF PARTICULAR ASSESSMENTS
The county commissioners serve as a board of equalization to consider assessment appeals in each county. In 1969, the legislature provided for a State Board of Tax Appeals (an appointive three-member body), which is empowered to consider taxpayers' appeals from decisions of the county boards of equalization and of the State Tax Commission (on various State imposed taxes as well as property tax matters). A 1971 amendment provided for a small claims division of the,Board of Tax Appeals, which is authorized to consider, through informal hearing procedures, property tax cases that involve real estate with a market value of not over $25,000 or personal property worth not over $10,000.
'This report is based partially upon information provided by Luther I. Passmore, Chairman, Idaho State Tax Commission.
Even though Illinois recently joined the ranks of income taxing States, its overall reve- nuestructure still involves considerable reliance upon local property taxation. New con- stitutional provisions have legitimitized, for major urban counties that include a majority of the State's population, previously extra-legal practices involving differential assessment of various types of taxable realty. During the past decade, the legislature also provided sta- tutory authority for the widespread practice of fractional assessment and enacted a num- ber of changes in the legal tax base. Changes were also made by statute in the organiza- tional placement of the State agency concerned with property taxation and, more impor- tantly, in the assignment of local assessment duties. The latter action has granted signifi- cant responsibility at the county level in appointive offices which can be filled only by per- sons whose qualifications are certified by the State Department of Local Affairs. The
. State's role in the property tax system has continued to include some extremely useful elements but, as a decade ago, is handicapped by limitations of staff and resources.
FINANCING ROLE OF THE PROPERTY TAX
Property taxation has traditionally been of major importance in the revenue system of Illinois. Of all general revenue raised here by the State and local governments in fiscal 1970-71, property taxes supplied 33 percent. However, the Illinois proportion ten years earlier was considerably higher -about 46 percent.
It was estimated in ACIR's Measuring the Fiscal Capacity and Effort of State and Local Areas, that the Illinois property tax load averaged 6 percent below the national average; however, it was 31 percent over on farm land, 1 percent over in non-farm residential prop- erty, and 18 percent below the national average for commercial property. Illinois' compos- ite effort index for all State and local taxes was 16 points below the U.S. norm.
Substantially all property tax revenue in Illinois is from local levies; the State has im- posed no general levy for 40 years, but obtains a nominal amount of revenue from a spe- cial property tax on certain utility property. Some 5,337 of the State's 6,385 local govern- ments have property taxing power, and for most of them this is a major financing source. Altogether, property taxes made up 69 percent of all the general revenue raised by Illinois local governments in fiscal 1970-71, more than the corresponding nationwide proportion of 64 percent.
During the 1960's, per capita property tax revenue in Illinois went up 6.3 percent a year, outpacing the 5.2 percent growth rate of per capita personal income. By 1971, per cap- ita property tax revenues were $200, higher than the national average of $184, but property taxes per $1,000 were below the national average ($45 vs. $47). Official valuations of tax- able property were increasing far less rapidly than revenues-only about 2 percent a year -so that there have been widespread increases in tax rates.
THE PROPERTY TAX BASE
The composition of the property tax base is in process of change as a result of various legal developments summarized below. Of statewide assessments for general property tax- ation, as set in 1971, locally assessed real property made up 82 percent, locally assessed personal property 16 percent, and State assessed property, 2 percent.
Prior to adoption of a new constitution in 1970, Illinois legally required uniform valua- tion of all taxable property as well as a relatively comprehensive general property tax base. As in other States with similar provisions, some kinds of taxable personalty in Illi-

nois (including most intangibles) were not actually assessed or taxed and the bulk of the personal property on the assessment rolls consisted of tangible business and farm hold- ings.
The new constitution adopted by the electorate in 1970, and effective in mid-1971, granted authority-subject to possible statutory limitations-for distinctive classification of real property by any county having a population of over 200,000 but stated that "any such classification shall be reasonable and assessments shall be uniform within each class." It further specified that the maximum within-county variation among property classes in level of assessment or rate of tax should,not be more than 2.5-to-1, and that farm realty should not be assessed at a higher level than single-family residences. This provi- sion applies initially to the eight most populous counties which have nearly two-thirds of the State's total population. It presumably will afford a legal sanction for differential assessment practices long customary in Cook County and, at least, some other counties in this group.
A related 1971 statute, pertaining only to the counties of 200,000-plus, provides for the assessment of land used for agricultural purposes according to its value for such use (rath- er than in relation to fair market value as in the case of other property). This procedure applies to tracts in excess of 40 acres and is contingent on annual application of the owner of such lands for such treatment. The law provides that when any such land ceases to be used for farming, the owner is liable for the additional taxes he would otherwise have been charged for the three preceding years, plus interest at 5 percent.
Recent legislation has also provided for various property tax exemptions on a state- wide basis. One statute exempted all personal property owned by individuals, another exempts the first $5,000 of the remaining personal property assessments made in 1972. An- other law granted a homestead exemption of up to $1,500 of equalized value to certain qualified persons aged 65 years or over; however, the Illinois Supreme Court held this exemption invalid for the years 1970 and 1971; its validity for later years has now been sustained by the State Supreme Court.
The 1972 legislature provided additional property tax relief to elderly and disabled homeowners and renters by enacting a circuit-breaker program, effective January 1, 1973. Domiciled residents over 65 and the disabled can claim a monetary grant equal to property taxes paid (or 25 percent of gross rent) less the sum of 6 percent of the first $3,000 of household income and 7 percent of income in excess of $3,000. The grant is limited to $500 less $5 for each $100 in household income; thus the limit goes to zero at $10,000. Illi- nois grants the usual kinds of complete exemptions for property holdings of governments and religious, educational, and charitable organizations, but does not assemble data as to the value of such tax exempt property.
The 1967 Census of Governments (not updated in the 1972 Census) reported some 3.8 million locally assessed parcels of real estate on Illinois' assessment rolls. Of these, 57 per- cent were non-farm residential properties and 19 percent were acreage or farm properties. The far less numerous commercial and industrial properties, accounting for only 3 percent of all realty parcels, contributed 24 percent of realty valuations.
ASSESS1 NG RESPONSI BI LIT1 ES
Recent enactments have altered, at both the State and local government levels, the Illinois assessment arrangements described in some detail in the ACIR report of a decade ago.2
Since 1970, under legislation enacted in 1969, all property tax responsibilities formerly assigned to the State Department of Revenue and conducted through its Property Tax Di- vision have been vested in a new Department of Local Government Affairs. This agency

has 63 employees engaged in property tax administration, which reflects a material in- crease from the staffing ten years earlier. However, the Department's fiscal 1971-72 budget of $837,000 amounts to only 0.04 percent of statewide property tax revenue.
As its name suggests, the Department's duties are not limited to matters of property valuation. Particularly through its Office of Community Services, it conducts various train- ing and research programs to aid local government officials with regard to their budgets, appropriation requests, ordinances, the determination of property tax levies and rates, and purchasing methods. Matters of property tax assessment are dealt with mainly through the Department's Office of Financial Affairs. Like its predecessor Property Tax Division, the Department maintains offices in both Chicago and Springfield.
Illinois laws still provide for elected assessors to serve each of the 1,400 townships found in the 85 counties having such governmental units. However, earlier laws providing for county and State oversight of local assessing were significantly extended and strength- ened by a 1969 enactment, effective at the beginning of 1971. Now, except for Cook County (with an elected assessor] and St. Clair County (with a five-member elected board of as- sessors) all counties have either a county assessor or a "county supervisor of assess- ments," who are subject to appointment by the county governing body to serve for a four- year term and until a qualified successor is appointed. (In the 85 township counties, the elected township assessors are in effect deputies of the assessment supervisors.) A vacancy in any one of these county positions can be filled only by a person having at least two years' appropriate experience and who is one of the three top ranking applicants found qualified by an examination conducted by the Department of Local Government Affairs. Previously, county governing bodies had the option of appointing a county assessor or su- pervisor of assessments, and some did so, but a majority of counties had until the recent enactment relied upon the elected county treasurer to serve ex officio as the assessor or assessment supervisor.
The revised arrangement apparently makes it appropriate to regard counties as the primary assessing areas of Illinois, despite the continuance of elected township assessors in much of the State. Many of the 102 counties are too small in population and resources to sustain on their own a full-time professional assessing operation. For those, the provision for State underwriting of one-half the salary of the top county assessing official is particu- larly helpful. There are 16 counties with less than 10,000 residents, and another 35 with populations of 10,000 to 25,000. On the other hand, 80 percent of all Illinois residents are in the 17 counties with populations of at least 100,000 (including Cook County, which alone has nearly half of the statewide total).
The 1969 law concerning county assessors also authorized any two or more counties, by action of their governing bodies, to share the services of a single county assessor or as- sessment supervisor, subject to approval by the Department of Local Government Af- fairs. Thus far, however, no such cooperative arrangement has been established. -
Except with regard to the examination and certification of applicants for county as- sessing positions, as noted above, there have been no significant recent changes in the supervisory powers of the State property tax agency. The agency has prepared and dis- tributed a new real estate appraisal manual, and has provided training courses for local assessors with regard to its use. It has also continued its recurrent survey of assessment- sales ratios, as described below. Limitations of staffing and budgetary resources have re- sulted in only minimal direct assistance by State personnel for the appraisal of complex properties legally subject to local assessment. The State agency has, however, maintained its long-standing program for the mapping of taxing district boundaries for each of the 102 counties-an especially important and useful operation in view of the multiplicity and geographic layering of local governments.

ASSESSMENT VARIATIONS
Legal requirements. Prior to 1971, the Illinois constitution and statutes generally con- templated valuation of all taxable property in full at its fair cash value, although con- siderably lower assessment levels were prevalent and, in fact, were implicitly recognized by the Department of Revenue in its recurrent equalization of assessments. In 1971, the legislature altered the standard to define fair cash value as meaning "50 percent of the actual value of real and personal property," except for the major counties constitutionally authorized to classify real property for assessment purposes, as reported above.
State assessment ratio studies. Illinois has conducted annual statewide surveys of assessment-sales ratios since the 1930's. This operation has recently benefited from sales- price information becoming available under the real estate transfer tax effective January 1, 1968. The taxing statute included specific provision for a transfer declaration showing the consideration for the real estate being transferred, and its assessed value, to be sub- mitted to the State agency for use in making sales ratio studies.
Findings from this measurement effort appear, with other data, in an annual publica- tion, Illinois Property Tax Statistics. Most of the assessment ratio results consist of data by county and for certain sizable cities and townships, showing the median assessment level, measures of dispersion, and distributions of assessment ratios, in most cases separately for rural and urban realty. For Cook County, similar data are developed for a set of relatively detailed type-of-property classes, separately for Chicago and the remainder of the county, and for the four "assessment quadrants" that make up the entire county.
Findings from this recurrent effort are used by the Department to determine the aver- age assessment level of each county, and the resulting amounts of equalized assessed valuations enter into the determination of relative local tax effort for the distribution of State aid for public schools, as well as for the application of legal limitations on local borrowing and property tax rates, and the equalization of taxes imposed by inter-county jurisdictions. Because of the time lag in sales ratio findings, they cannot be directly uti- lized for these purposes, but are trended forward by consideration of post survey changes in local assessments indicated by a random sample of properties in each county, obtained by the field staff of the State agency.
Assessment levels and variations. The 1957, 1962, 1967, and 1972 Census of Govern- ments indicated about 40 percent for a statewide average assessment ratio for taxable realty. There was some downward drift during the 1960's. Taking account of the State's adjusted valuations, the Census showed substantial uniformity of average assessment lev- els for single-family houses among the counties it sampled-suggesting a high degree of inter-county equalization accomplished by the State agency effort. The inter-county co- efficient of dispersion for 1971 was ten.
Less than half of the 41 Illinois counties in the 1967 Census sample data had a within- county coefficient of dispersion for single-house assessments of less than 20 percent. Al- though considerably better than Illinois' showing in the Census of five years earlier, this was somewhat less favorable than the nationwide average for all sample assessing juris- dictions. The intra-area coefficient of dispersion for the 1972 Census was 21 for Illinois, while the national average was 20, showing little change over the last five years.
The recurrent censuses also showed relatively marked differences in prevailing as- sessment levels for various types of property in Illinois, with vacant lots and acreage and farms apparently receiving more favorable treatment than non-farm residential property (as is the case in most other States), and business realty receiving less favorable treatment. Illinois' own sales ratio studies have provided similar evidence of material divergence of assessment level among various types of taxable realty, and of considerable dispersion within some counties. As noted above, constitutional sanction has recently been given to

the foregoing kind of differential treatment, insofar as the State's more populous counties are concerned.
REVIEW AND APPEAL OF PARTICULAR ASSESSMENTS
There has been no recent significant change in Illinois' arrangements for appeal of as- sessments at the local level. Aggrieved property owners may obtain a hearing in each county from a review body. In two counties, Cook and St. Clair, this is an elective body of two and three members respectively. In non-township counties it is the county board of commissioners, acting ex officio. In the remaining majority of counties, it is a board of re- view consisting of the chairman or another member of the county governing body plus two other persons appointed by the circuit judge.
Taxpayer appeals from decisions by county review agencies, other than those of the Cook County Board of Appeals, may be taken to the State Property Tax Appeal Board. This agency was created by 1967 legislation. It consists of three members appointed by the Gov- ernor, with the advice and consent of the Senate. The law directed the Board to provide by rule for an informal procedure for consideration of appeals, and authorized the conduct of hearings by single members of the Board or by designated hearing officers. A property owner can, if he prefers, appeal a local assessment decision directly to the courts rather than initially to the State Board.
'Part of the information for this report was provided by Allan E. Garber, Assessment and Equalization Super- visor, Illinois Department of Local Government Affairs.
T h e Role of the States in Strengthening the Property Tax (1963), Vol. 2, pp. 42-45.

The past decade's major development affecting property taxation here was a 1965 court ruling which called for compliance with the long-standing legal requirement for full- value assessment, and prompt elimination of practices by which taxable property was being valued at minor and widely varying proportions of its market worth. This court decision led to a dramatic increase in valuations and considerably more uniform assess- ment, as well as statutory action which substantially "froze" effective rates of property taxation.
Even though its property tax load is relatively light-about half the national average - Kentucky recently adopted by popular referendum a homestead exemption which will curtail its property tax base. Like numerous other States, Kentucky has recently-also by popular referendum-provided for preferential assessment of farm land.
Although vested with broad legal powers, the State Department of Revenue continues to face an especially difficult task in promoting local assessment work of high quality, since so many of the numerous county jurisdictions involved are relatively small in popu- lation. In this effort, however, the Department has benefited greatly by the landmark court decision of 1965 which led Kentucky to its present place as one of the two States where assessments of taxable realty are near actual market value of such property. (According to the 1972 Census of Governments, the assessment ratio in Kentucky is 84 and in Oregon it is 86; the next closest State is Alaska with a ratio of 77 percent.)
FINANCING ROLE OF THE PROPERTY TAX
The revenue system of Kentucky, like that of most Southern States,.involves relatively limited reliance on property taxes, even though such taxes are levied here not only by local governments but also by the State. For instance, on a per capita basis individuals in Kentucky paid $70 while the national average was $184; per $1,000 of personal income they paid $23 while the national average was $47 according to the 1972 Census. Of all general revenue raised by Kentucky governments in fiscal 1970-71, only 17 percent was from prop- erty levies, as compared with the nationwide average proportion of 32 percent. A decade before, property taxes had supplied 28 percent of all own-source general revenue of Ken- tucky governments. The State government's predominant financing role is reflected in the fact that 73 percent of all State-local tax revenue in Kentucky is raised by the State. This percentage is far more than the nationwide average (54 percent in fiscal 1970-71).
Some 800 of Kentucky's 1,135 local governments have property taxing power, and for many of them this is a major revenue source. Altogether, however, property taxation sup- plied in 1970-71 only 44 percent of all locally raised general revenue in Kentucky, as com- pared with 64 percent in the nation as a whole, or only 25 percent of the general revenue of Kentucky's local governments from all sources, including intergovernmental receipts, as compared with a national average proportion of 40 percent. To a considerable extent this reflects the widespread imposition of income taxes (primarily on payrolls) by Kentucky municipalities.
In an ACIR study, Measuring the Fiscal Capacity and Effort of State and Local Areas, it was estimated that Kentucky's property tax load, relative to its capacity, was only half the national average, although its overall effort index for all State and local taxes was within 15 points of the U.S. norm.2
During the 1960's Kentucky's per capita property tax revenue rose at an annual rate of 5 percent, and thus lagged materially behind the State's economic growth, as indicated by

a 6.4 percent a year rise in per capita personal income. This contrasts with trends in the nation as a whole, involving a 6.3 percent annual rise in per capita property taxes and a 5.5 percent growth in per capita personal income.
THE PROPERTY TAX BASE
As was true a decade ago, Kentucky has a broadly based classified property tax system that includes various special property taxes that apply to certain intangible personal property and some types of tangible personalty. Such special property taxes account for the bulk of the State's property tax revenue and a trace of local yields. About 88 percent of overall property tax revenue, however, is from general property taxes and nearly all of this is from local levies.3
In 1971, locally assessed real property made up 71 percent of the statewide general property tax base subject to full local rates, locally assessed tangible personal property contributed nearly 15 percent, State set valuations of public service companies (utilities) 12 percent, and other State set valuations (for distilled spirits) 3 percent. During the past decade, the proportion represented by State set valuations has diminished materially, from 23 percent in 1961 to 16 percent in 1966 and to 14 in 1971. Nearly half of the local val- uations of personal property pertain to motor vehicles, which accounted for 7 percent of the statewide general property tax base in 1971. (Most other States exempt motor vehicles from general property taxation, and subject them to a special property tax or only to other types of taxes.)
Exemptions and special treatment provisions. Two major changes in coverage of Kentucky general property taxes have recently been enacted, in each instance pursuant to constitutional amendments approved by the electorate.
Under a 1970 law, first effective in 1971, land which has been devoted for at least five years to farm use but which has potentially greater value for some other use shall upon annual application by the owner be taxed solely according to its value for farm use. When land so assessed and taxed is converted to any other use, the owner is subject to deferred taxes (but without interest or penalties) on the difference between the agricultural use value and full fair cash value for the current tax year and two preceding tax years. The law specified minimum areas eligible for such assessment: ten acres for agricultural use, and five acres for horticultural use. In 1971, 333 applications were filed in 40 counties; 150 were denied and 183 approved. For land covered by those approved, the estimated market value was $23.6 million, and agricultural value was $13.3 million.
A 1972 statute exempts from general property taxes the first $6,500 of assessed valua- tion on each owner-occupied single-family residence maintained as his home by a person 65 years of age or over (including condominium units). No income requirements or limita- tions are provided. Preliminary reports on 1972 assessments indicate that perhaps one- fourth of the 475,000 owner-occupied homes reported in the 1970 Census of Housing will be affected. The average exemption is somewhat under $6,000. The resulting reduction in the property tax base seems likely to be some $600-to-$800 million. This reduction will approx- imate 3 percent of the total property subject to full local rates (including taxable person- alty). For real estate alone, the reduction is approximately 5 percent. Many assessments were increased to actual full value before the exemption was allowed, thereby reducing the effect of the exemption.
COMPONENTS OF THE TAX BASE The 1967 Census of Governments (the 1972 Census did not update this) reported
slightly more than a million parcels of locally assessed taxable real estate in Kentucky. Of these, nearly two-thirds were non-farm residential properties, which contributed 55 per- cent of the statewide total of realty valuations; 22 percent were acreage or farm properties,

contributing 27 percent of realty valuations. The far less numerous commercial and indus- trial properties (4 percent) supplied 17 percent of all assessed values of taxable realty, considerably less than the corresponding nationwide proportion of 25 percent for business realty.
TAX RATE RESTRICTIONS
As more fully described below, a 1965 court ruling required a drastic statewide in- crease in the level of property tax assessments, beginning with 1966. To allay popular con- cern lest this result in a marked rise in property tax levies, the legislature enacted a roll- back law. With only minor exceptions, this limited the effective rates for levies by all local property taxing units to those which had applied to 1965 valuations, except that during the first two' years rate increases of up to 10 percent were permitted after an ad- vertised public hearing by the local levying body. Except for a 1970 amendment redefining "net assessment growth" to permit new revenue from all growth in assessments and a 1972 amendment to permit adjustment of local tax rates to offset homestead reductions in the property tax base, this law has since continued unchanged. The amendment apparently imposes a continuing freeze on effective local property tax rates, other than for debt service, at the 1965 level (or the rate level of 1966 or 1967, where there was local action within the authorized 10 percent leeway provisions).
Another part of the 1965 rollback law reduced by 70 percent the applicable rates of the statewide taxes on real property and tangible personalty, to hold their effective rates at their earlier levels despite the major increase in the assessed valuations of such property which took effect in 1966. A partial example of the State rate structure effective at the time of writing is:
a) real property-1.5 cents per $100;
b) intangible personal property with a Kentucky situs-25 cents per $100;
c) intangible personal property with a non-Kentucky situs-1.5 cents per $100;
d) tobacco and unmanufactured agricultural products-1.5 cents per $100; and
e) farm implements, machinery, livestock and domestic fowl -0.1 cent per $100.
There have been few recent significant changes in Kentucky's organizational arrange- ments for property tax administration. Central administrative responsibility continues to rest with the Department of Revenue, headed by a Commissioner appointed by the Gover- nor. The Department administers various State imposed taxes, and deals with property tax matters mainly through the Property and Inheritance Tax Division. In 1964, the Depart- ment's property tax powers were broadened when the former State Tax Commission was replaced by a three-member appointive Board of Tax Appeals. This body inherited the former Commission's tax appeal responsibilities but not its power to issue orders for blanket equalization adjustments of local assessments; that authority was assigned to the Department of Revenue.
As a decade ago, local assessment responsiblity was mainly assigned to 120 county offices, headed by a property valuation administrator (formerly designated the "county tax commissioner") who was subject to election for a four-year term. Any candidate for such an office must hold a certificate issued by the Department of Revenue evidencing that he has been examined and found qualified. Similar State certification requirements apply to other technical personnel in the county assessing offices; the State finances most of the expenditures of these offices and has detailed control over their budgets.

Altogether, as these and other features of the structure indicate, there is considerably more State collaboration or supervision in Kentucky's local assessment operations than is found in a majority of other States.
Such a collaborative arrangement is especially needed here, since most Kentucky counties have too sparse a population to provide for adequate professional assessment services. More than one-fourth have fewer than 10,000 inhabitants, and three-fourths have fewer than 25,000 inhabitants. There are only three counties of over 100,000, and altogether these include less than one-third of all the State's population.
The 1971 budget for the State's direct participation in property valuation work was approximately $900,000, equal to about 0.4 percent of the statewide total of property tax revenue. In addition, however, the State provided $3.3 million of the $3.9 million spent by county assessing offices. (These amounts do not include costs of property tax collection.)
Kentucky laws permit municipalities to do their own assessing work. However, an increasing number, including some of the largest and most of the small cities, utilize valua- tions established for county and State purposes. Since the Department of Revenue lacks supervisory control over such overlapping assessment districts, there is limited informa- tion about them.
State supervisory powers. As detailed in the ACIR study of a decade ago, the Kentucky Department of Revenue has a broad range of statutory authority with regard to local as- sessment personnel and operations. A recent decision by the State Court of Appeals specifically affirmed its power to require county assessors to comply with its directives and orders. This decision involved a case where the Department's authority to reject and require revision of a particular county's assessment had been challenged.
Assessment personnel. After the full-value ruling in 1965, the field staff of the Revenue Department's general property tax section was materially increased to provide greater assistance to the counties. It now operates through eight areas which have 24 subdistricts. The State's pay rate schedules for county property valuation administrators have been adjusted upward repeatedly since 1962. The 1972 legislature again amended the compen- sation statute and placed all of the 120 administrators under a grade system. The classifi- cations range from a (smallest county) grade 11 with a starting salary of $5,760 up to (largest county) grade 20 with a starting salary of $13,860. The average 1972 salary for the 120 county administrators is $9,745, as compared with a 1961 average of $5,035.
Actions toward equalization at a high assessment level. As noted above, a court decision of June 1965 directed that all property be assessed for taxation at its full cash value, as specified constitutionally and by statutory provisions. At that time, according to the Department's estimates, the statewide average ratio was about 27 percent and indi- vidual county averages ranged from about 1 2 to 35 percent. To accomplish the major changes indicated, the Department organized a strenuous assessment revision effort, reaching all the counties with an enlarged field staff.4 Procedures varied according to the quality of available local records. Time did not permit detailed reappraisal of individual properties. To the extent possible there was heavy reliance on recent sales which were used as "comparables" to set values for similar properties. The net result was that the statewide total of assessed valuations for taxable realty rose nearly fourfold between 1965 and 1966. Assessments for property of various types and in various areas moved up by widely differing proportions-as would be expected in view of the situation for which the correction had been ordered.
Nearly all of the 1965-1966 valuation change resulted from local action or collaborative local and State action; only a little more than 1 percent of the statewide rise in realty assessments resulted from blanket increases in response to State equalization orders, although such orders were applied to 21 counties. In 1968 the Department of Revenue again

issued equalization orders to require blanket increases in 17 counties. Since then, the Department has adopted a policy of rejecting county assessments and requiring local action for their adjustment where the Department finds that the assessment level, either overall or in part, is not in compliance with the fair cash value criteria.
Backed by a court ruling which recognized that perfection was not possible and some leeway was permissible, the Department has not fixed a minimum level of acceptability but generally expects assessment ratios to be within the 85 to 90 percent area, and hopes for continuing efforts "to keep the overall level above the 90 percent mark;" in 1970, the Department rejected the assessments of 33 counties.
Mapping services. During the past decade the Department of Revenue concen- trated its effort on the production of property identification maps. To date, such maps have been completed for 68 of the State's 120 counties. In 1972, the legislature enacted a mandatory mapping law, calling for completion of the entire State by 1982. Previously the Department could provide this service only at the request of the county governing bodies. Local request or approval is no longer necessary.
ASSESSMENT VARIATIONS
Legal requirements. The far reaching 1965 court decision mentioned above (Russman v. Luckett, Ky. 39 S. W. 2d 694) called for implementation of the long-standing provision of the Kentucky constitution that all taxable property be assessed at its "fair cash value, estimated at the price it would bring at a fair voluntary sale." This requirement still stands, except to the extent that it has recently been modified by constitutional and legislative enactments providing for the valuation of farm land according to its value for such use.
State assessment ratio studies. Kentucky was among the earliest States to conduct a regular annual statewide sales ratio study, and has carried on such studies since 1938. The findings have not always been published, but those for recent years have been summarized in annual reports of the Department of Revenue. The presentation there includes a brief description of concepts and methodology, together with data by county as to the number of real estate transfers used, median assessment ratios, and (except where precluded by the paucity of measurable sales) for each of the three classes of realty: farm, residential, and commercial. From 1966 through 1970, a fourth class, rural non-farm, was used. Since 1968, the survey has been able to utilize sales-price information available under the realty transfer tax enacted that year. The assessment ratio findings not only are used by the Department in its supervision of local assessments, but also, by law, enter into the calcu- lation of State grants for local schools.
Assessment levels and variations. The court mandated effort toward full-value assess- ment produced striking and highly desirable results. The statewide average assessment level for taxable realty was multiplied over threefold, to about 90 percent according to the State's sales ratio study. Average realty ratios of individual counties, which previously had ranged widely around a midpoint of about 25 percent, approached 100 percent in most instances. For two-thirds of the 120 counties the State's sales ratio study estimated a 1967 level of at least 85 percent, and only three counties were reported below 75 percent.
At least as striking as the marked change in assessment level, was the marked curtail- ment of assessment variations within individual counties (which is considerably more important from the standpoint of tax equity). Practically every county showed such im- provement. Whereas the State's ratio study of 1965 assessments had reported 65 counties with residential coefficients of dispersion of at least 30 percent (many of them far higher than this), the corresponding 1967 study showed only 1 2 such counties. The number of counties with dispersion coefficients of under 20 percent went up from six to 59, including 21 counties with a coefficient of under 15 percent-commonly regarded as a highly accep-

able standard of assessment uniformity. Presently the intra-area coefficient of dispersion as reported in the 1972 Census of Governments is 16 compared to the national average of 20, while the inter-area coefficient is nine.
It is thus clear that the widespread adjustments made in the months following the 1965 court ruling, despite the crash nature of the program, brought considerably more assessment uniformity as well as a higher level of valuation.
Like assessors elsewhere, those in Kentucky have, since 1966, faced the hard challenge of adjusting their valuations upward to take account of the strong inflationary trend in market value of much taxable realty. The State's successive ratio studies have usefully traced developments on this score, subject to the problem of scanty sales evidence in sparsely populated counties. The findings suggest some lag of assessments behind market trends-though considerably less than the corresponding lag in numerous other States. The estimated statewide average for 1971 was 86 percent, about five points below that estimated for 1967. Moreover, the number of counties below the 85 percent level had grown from 39 to 54 during this four-year period of generally rising prices. On the other hand, most counties showed relatively little change up or down in the assessment level indicated by measurable sales, and only 19 of the entire 120 showed a drop of ten points or more, including a number of areas where the paucity of measurable sales is likely to result in variable findings.
REVIEW AND APPEAL OF PARTICULAR ASSESSMENTS
For many years, as described in the ACIR report of a decade ago, Kentucky has pro- vided for a special appointive three-man body in each county, the county board of super- visors, to consider appeals of particular valuations. By a 1968 enactment, the composition of such boards was altered to provide that their members be appointed by the county judge (the county's top administrative official) for staggered four-year terms, rather than on a year-to-year basis, as before. The law also authorized the appointment of panels, also composed of three members each to assist the regular board with the approval of the Department of Revenue, where the number of appeals filed in a particular county exceeds 100. Board members are paid on a daily basis, at a locally determined rate not to exceed $25 per day, and their compensation is financed on a 50-50 basis by the State and the county.
.- -- - - - At the State level, as previously noted, the Kentucky Tax Commission was replaced in
1964 by a three-member appointive Board of Tax Appeals, which inherited the Tax Com- mission's tax appeal responsibilities. Although the Commission had also been regarded as organizationally distinct from the Department of Revenue, the Commissioner of Revenue had been one of its three members. Hence, the change involves a more complete separa- tion of the administrative and appeal aspects of Kentucky's tax system.
?Part of the information for this report was provided by E. D. Ballard, Director of the Property and Inheri- tance Tax Division, and William G. Herzel, the former Director of the Program and Research staff, Kentucky Department of Revenue.
ZIt may be noted, however, that "property tax effort" for that study was defined by reference to the prevail- ing form of property taxation, with property taxes on motor vehicles and intangibles (which Kentucky does tax) counted in other categories.
T h e ACIR study of a decade ago included a considerably more detailed egplanation of the makeup of the Kentucky property tax system, and of the State-local distribution of responsibility for assessing various types of taxable property. (See The Role of the States in Strengthening the Property Tax (19631, Vol. 2, pp. 56-57.)
'For a description of this effort and comments on the results, see J. E. Luckett (then Kentucky Commission- er of Revenue). "The Administrator's Response to Full-Value Assessment," Proceedings of the Sixtieth Meeting of the National Tax Association (Columbus 1967).

As was true a decade ago, Maine's revenue system involves greater than average use of property taxation, although legislation was adopted in 1973 to reduce the proportion of public school costs financed from property taxes from approximately two-thirds to one- half, and beginning in 1977 to exempt business inventories and livestock from property taxation. Also the effective tax burden on the elderly was reduced with the adoption, in 1971, of a circuit-breaker.
Up to now there has also been relatively little change in Maine's arrangements for property tax adniinistration, under which most responsibility for property valuation rests with 496 local jurisdictions, of which relatively few are large enough to sustain a full-time professionalized assessing operation. While there has been some enlargement of the broad powers for supervision and assistance legally vested in the State Bureau of Taxa- tion, and some increase in staffing for property tax work of the Bureau, the resources for this purpose have been inadequate to deal with the problems inherent in the local assess- ment system.
Under a 1973 law, however, Maine took an initial step needed for substantive tax reform. The law:
1) creates a separate Property Tax Bureau within the Department of Finance and Administration, significantly expanding the present Property Tax Section in the Bureau of Taxation;
2) provides for the consolidation of existing assessing jurisdictions into primary as- sessing areas by 1977;
3) provides that by 1980 assessing areas must be staffed by certified assessors and must have tax maps meeting minimum standards; and
4) provides for a statewide appeal board to replace the existing boards of assessment review or county commi'ssioners.
Unfortunately, it appears that the Bureau is presently underfinanced to meet the proposed time schedule; but even if this schedule is not met, significant tax reform appears likely in the future.
FINANCING ROLE OF THE PROPERTY TAX
Like other New England States, Maine relies very heavily upon property taxation. For instance, the State receives $186 per capita and $58 per $1,000 personal income in property tax revenue. Comparable national averages are $184 and $47, respectively. Of all general revenue raised here by the State and local governments in fiscal 1970-71, property taxes supplied 38 percent-more than the nationwide proportion of 32 percent-though down from Maine's 48 percent of ten years earlier.
It was estimated in ACIR's study Measuring the Fiscal Capacity and Effort of State and Local Areas that Maine's property tax load, relative to its capacity, was 29 percent above the national average. Its relative effort on farm property was 114 percent above the average, 41 percent above on commercial and industrial property and only 1 2 percent above on non-farm residential property. The State's relative effort for all State and local taxes, however, was only 5 points above the U S . norm.
During the 1960's, per capita property taxes in Maine grew about 5.1 percent a year, or somewhat less rapidly than per capita personal income. Official property valuations were
going up much faster-about 10 percent annually, with much of the change apparently re- flecting a rise in the relation of assessed to current market value-so that rates applied to the official valuations generally diminished.
Most of Maine's local governments have property taxing power, and for most this form of taxation is by far the predominant financing source. Property taxes made up 88 percent of all own-source general revenue raised by local governments in fiscal 1970-71, second only to Vermont with 89 percent and significantly above the nation's average of 64 percent. Local levies account for about 98 percent of all property tax yields in Maine. The other 2 percent are mainly from a State imposed general levy that applies to sparsely populated territory lacking organized township-type governments.
THE PROPERTY TAX BASE Real estate makes up over 80 percent of the base for locally assessed general property
taxes in Maine. Locally assessed tangible personal property accounts for another 17 per- cent. Household personalty is exempt, as is intangible personalty, while motor vehicles are subject to a special property tax, locally collected at a uniform statewide rate. Business holdings account for most of the personalty subject to general property tax levies, with business equipment and furnishings making up over 9 percent of the total base, and inven- tories about 7 percent. (This latter portion of the tax base will be exempted in 1977.) The bulk of taxable realty is locally assessed, but about 3 percent of the valuations are set directly by the State Tax Assessor. This involves property in areas without organized town governments.
Three recent enactments have important implications for the property tax base or the distribution of the resulting tax load.
Farm and open space lands. Pursuant to an authorizing constitutional amendment approved by the electorate in 1970, the legislature provided in 1971 for the assessment of certain farm and open space land solely on the basis of its current use, without regard for its possibly greater market worth. The landowner must apply for such special valuation treatment, and certify to actual qualifying use as legally defined. If approved by the assessor (and in the case of open space land by the planning board in any area subject to a comprehensive land-use plan), the differential treatment continues until revoked at the owner's request or by a change in use of the land. When there is a change in use (other than by eminent domain proceedings) that would disqualify the land for special treatment, the owner becomes liable for the added taxes which would otherwise have been due during the period of preferential assessment up to ten years for farmland or 15 years for open space lands, plus interest at 8 percent annually.
It may be noted that these deferred tax provisions are more stringent than those in many other States with generally similar preferential provisions for rural land (as is true also for the timberland provisions mentioned below), but their implementation depends upon local assessors' regularly maintaining dual valuations (according to both market worth and current use value) for the individual properties involved.
Timber land. The "Tree Growth Tax Law" of 1972 which was also enacted pursuant to the 1970 constitutional amendment provides for special local assessment of land which the owner certifies is being used primarily for timber production. Assessors must apply acreage values set by the State Tax Assessor, as based on the capitalization of prospective returns from estimated growth rates for various types of timber. When any timber land is withdrawn from such use, the owner is liable for additional property taxes equal at least to the extra amount which would have been due during the period of special valuation, up to five years, if the land had instead been assessed at its fair market value at the time of the withdrawal, plus interest.

Tax relief.2 A 1971 enactment, revised in 1973, does not directly affect assessments or property tax levies, but provides benefits designed to limit the direct or indirect property tax load of low-income elderly persons. Residents (a) who are 62 or older, (b) who own or rent a homestead, (c) whose individual income is not over $4,500 or whose household in- come is not over $5,000, and (d) whose net assets excluding the homestead are not over $20,000 are entitled to tax relief of the amount of tax (or 25 percent of gross rent) less:
2 percent of income not over $1,000, 4 percent of income not over $2,000, 8 percent of income not over $3,000,
12 percent of income not over $4,000, 16 percent of income not over $5,000,
with a maximum claim limit of $400. This circuit-breaker program operates directly through the State Bureau of Taxation, involving no participation by local assessors or property tax jurisdictions.
Persons receiving aid to the blind have been entitled to $3,500 assessed value exemp- tion since 1971. Recently (1973), a bill was passed to allow other blind property owners of real estate valued up to $10,000 a $3,000 exemption, and real estate valued between $10,000- $20,000 a $2,000 exemption.
Tax exemptions and the distribution of the tax base. One of the duties of the newly created Bureau of Property Taxation will be to show separately for each municipality and unorganized place the estimated value of all real estate which is exempt.
The 1967 Census of Governments (not updated in the 1972 Census) reported some 453,000 parcels of locally assessed realty in Maine, of which 61 percent were non-farm residential properties, accounting for 64 per cent of the valuation involved. Acreage and farm properties were about 17 percent of the fotal number of properties, but contributed only 2 percent of local realty valuations. The far less numerous commercial and industrial parcels (4 percent) accounted for 31 percent of all local valuations of realty. This relatively high proportion partly reflects the fact that taxable public utility property in Maine is subject to local rather than State assessment, contrary to practice in other parts of the country.
ASSESS1 NG RESPONSI BI LIT1 ES
As noted above, taxable realty in those parts of Maine which lack organized town governments is subject to valuation by the State, while all other valuations for general property taxation are made by 496 local assessing agencies. Of these, 22 are associated with cities, which operate under charters governing their respective assessing arrangements. The other 474 are township-type governments officially known as towns or plantations. Each of these is served by a board of assessors consisting of several members subject to annual election, unless by local option the jurisdiction chooses instead to have the select- men (the governing body) serve in this capacity, or to engage only a single assessor. Three- fifths of all these areas have populations of less than 1,000, and about 95 percent have less than 10,000 inhabitants apiece. There is only one assessing jurisdiction (Portland) of over 50,000, and only two others of 25,000 to 50,000. Accordingly, in the overwhelming majority of all the local assessing areas tbe assessors are engaged and paid on only a part-time basis. However, there are 53 full-time assessors in the State and they are responsible for assessing 55 percent of the value of locally taxable property.
At the State level, property tax responsibilities rest mainly with the Bureau of Taxa- tion, a Department headed by the appointive State Tax Assessor, which also administers major State imposed taxes. Through a Property Tax Division, this agency sets values on taxable property in areas without organized town governments and supervises local assess-

ment work elsewhere. The Division's staff has increased somewhat during the past decade to a total of 24, including a field staff of 11 "property assessment advisors" who deal regu- larly with local assessors. The division's 1972 appropriation of $311,000 equals about 0.17 percent of statewide property tax yields. The assigned tasks of the Division have been materially increased since 1962, most recently by the "Tree Growth Tax Law" under which the State Tax Assessor (with the assistance of an appointive advisory body] is to determine acreage values for timber land, which must be used by local assessors. As noted elsewhere in this report, 1973 legislation transfers this Division to the new Property Tax Bureau.
The State Tax Assessor (the Director of Property Taxation in the future) has the statutory duty of determining bi-annually the just value of taxable property in each of the many local areas. Prior to 1969, this duty rested with a board of equalization consist- ing of the State Tax Assessor and two other appointed members. Since 1969, there has been instead an appointive "municipal valuations appeals board" of five members (which must include two former town assessors and two former city assessors) to which local govern- ments may appeal the State Tax Assessor's determinations. The ultimate just value amounts provide a basis for the application of levies made by counties and some school districts, and for measuring local property tax effort in relation to various State-local grants, particularly for schools. Beginning in 1974, the just value estimates will be used as the basis for a uniform statewide property tax levy for financing public schools.
The ACIR report of a decade ago, The Role of the States in Strengthening the Property Tax, pointed out that although broad supervisory powers are legally vested in the State Tax Assessor, their effective exercise in the context of a highly decentralized pattern for local assessment had been chronically handicapped by inadequate budgetary support.3 Despite some subsequent expansion of the Property Tax Division, a similar comment still seemed highly pertinent until the 1973 passage of Maine's property tax administration reform bill. The most recent biennial report of the Bureau of Taxation observed that "If [property tax] administration is to be improved, it is evident that more effective direction toward improvement must be given at the State level."
As reported a decade ago, the State Bureau of Taxation has for many years-subject to budgetary and staff limitations-provided technical assistance to local assessors. Its broad powers and responsibilities on this score were further extended by a 1969 enactment which specified that the State Tax Assessor "shall establish a program of training to meet the needs of the State of Maine for a sufficient supply of completely trained assessors . . . shall hold qualifying examinations for assessors at least twice a year [and] . . . shall issue a certificate of eligibility to any applicant who has demonstrated through appropriate exami- nation that he is qualified to perform the assessing function." Local governments were also authorized to finance the costs of assessor training.
However, the law provided no sanctions or specific incentives that might encourage widespread local participation in such training efforts, and the legislature made little financial provision for them until 1973. (The initial annual appropriation was only $15,500.) Even with the limited funding, 216 local assessors have taken advantage of some classroom instruction, 52 have received provisional certificates based upon course completion and 30 have obtained certificates of eligibility through examination.
As outlined in the introduction, significant changes in property tax administration are likely to be forthcoming with the passage of legislation reorganizing the State property tax administration and creating primary assessment districts. The Director of Property Taxa- tion, head of the newly created Bureau of Property Taxation, will assume the powers and responsibilities relating to property taxes from the State Tax Assessor, head of the Bureau of Taxation. The Director has been given the additional responsibility of preparing recom- mendations and specific legislation to improve property tax administration at the State and local levels. The Bureau is authorized to provide a continuing program of property tax research to improve present laws and practices.

A single assessing district will be created for all areas of the State which lack organ- ized local governments, with the Bureau of Property Taxation performing the assessing function. Organized assessing areas will be consolidated into primary assessing units utilizing the following criteria:
-existing municipal and school district lines, but not county lines;
-geography, distance, number of parcels, urban characteristics, sales activity, and other factors deemed important by the Director.
Hearings will be held on establishing the assessing district and once established their boundaries will be reviewed at least once every ten years.
The Bureau, besides its duties of preparing manuals, assisting in the assessing of difficult properties, preparing tax maps and making biennial statistical reports on as- sessment practice, will conduct qualifying examinations. After 1980, passage of the exam will be required of all assessors. Certificates of eligibility will be issued after successful completion of the exam and will remain in force for five years provided that the assessor completes at least 16 hours of additional classroom training each year.
A recent reflection of the legislature's recognition of the prevalence of fractional valuation appears in a 1969 enactment, under which each local assessor was required, in reporting assessment data to the State Tax Assessor, to include a statement of "the ratio, or percentage of current just value, upon which the assessment is based. . . ."The ratio is then admissable as prima facie evidence in taxpayer appeals of assessed value. Upon establish- ment of primary assessing areas under the 1973 legislation, the ratio will be determined by the Bureau of Property Taxation.
State assessment ratio studies. Although the Bureau of Taxation has conducted rela- tively extensive statewide sales ratio studies regularly for more than 15 years, its work on this score has been seriously handicapped by numerous factors, including limited re- sources, the paucity of relevant property transfers in the overwhelming majority of the 496 local assessing areas, and the lack of sales-price information that in numerous other States becomes available under real estate transfer taxes or recording requirement provisions.
Maine enacted a transfer tax in 1967, but its usefulness for ratio studies is severely limited, since (like the former Federal documentary tax repealed some years ago) it is based only on the value of the interest being transferred-exclusive of the amount of any remaining encumbrance-in terms of $500 intervals of such value. There is also no require- ment that transfer tax stamps be affixed to the deed prior to recording or that the deed be accompanied by any statement as to consideration.
Field representatives of the State Bureau of Taxation (and in the future, the Bureau of Property Taxation) biennially develop sales ratio estimates from all usable transfers in each of the assessing areas where the number of sales is large enough to yield meaningful results. For each such area, the sales ratio findings are an important factor in the Bureau's estimation of the just value of taxable property. (For numerous smaller areas, the esti- mating process mainly considers average per acre values of taxable land.) The ratio find- ings a re also used by the State field personnel in counseling local assessors.
Assessment levels and variations. The 1967 Census of Governments estimated Maine's statewide average assessment ratio for ordinary real estate at slightly over 50 percent-up materially from the 43 percent indicated by the 1962 Census and the 36 percent shown by the 1957 Census. In view of the subsequent trend in assessed valuatibns relative to the trend in personal income, it is not surprising that the 1972 Census shows an assessment ratio of 55 percent.
The 1967 Census provided data on the intra-area coefficient of dispersion. Of the 44

most populous areas of Maine reflected in the data, nearly three-fourths showed a disper- sion coefficient of assessment ratios for single-family houses of under 20 percent, while approximately half of all the similarly reported local assessment areas in the nation did this well. The 1972 Census shows some slippage in this relationship with the intra-area coefficient at 21 for the State while the nation's average was 20. Maine's inter-area co- efficient is 24.
REVIEW AND APPEAL OF PARTICULAR ASSESSMENTS
Legislation enacted in 1973 provides for a State Board of Assessment Review which ultimately will replace existing administrative appeal agencies (i.e., local boards of assess- ment review and county commissioners) to which appeals are made from the local assessor and from which appeals may be taken to the courts. As already noted, assessment ratio data since 1969 have been available to aggrieved taxpayers as admissable evidence in appeal proceedings.
'Part of this report is based on information supplied by Ernest H. Johnson, Maine State Tax Assessor. Tor a more detailed discussion of the development of the Maine circuit-breaker see, ACIR Financing
Schools and Property Tax Relief-A State Responsibility (1973), pp. 188-193. 30p. Cit., Vol. 2, pp. 66-67.

During recent years, Maryland has maintained, built upon, and benefited by its closely coordinated State-local arrangements for property tax administration, which were so favorably commented upon in the ACIR property tax study of a decade ago. The State property tax agency has continued to exercise close supervision of local assessment activi- ties, and has increased the frequency with which it specifically measures assessment ratios and variations throughout the State. With the passage of House Bill 531 (Chapter 784 of the Laws of Maryland), the State over the next three years will take over the full responsibility for assessing and appeals thereto. Recent developments have also included additional exemptions designed to ease the property tax load of elderly homeowners with a limited income, as well as some changes in the system for preferential assessment of farm land which Maryland inaugurated more than a decade ago.
FINANCING ROLE OF THE PROPERTY TAX
As in most other States, property taxation is an extremely important element of Maryland's revenue structure. Of all general revenue raised by the State and its local governments in fiscal 1970-71, property taxes provided 27 percent. However, this was considerably less than the proportion of ten years earlier (35 percent), and was also some- what below the nationwide average of 32 percent in fiscal 1970-71.
Local levies account for the bulk of property taxation in Maryland-over 95 percent; the remaining 5 percent is a levy for the servicing of certain State indebtedness. Approxi- mately 200 local governments have property taxing power, but most of the statewide aggre- gate of local levies is accounted for by the 23 county governments and Baltimore City, which are responsible for administering and providing local revenues for operating schools, as well as for other public services. Local property taxes supplied more than half of all the general revenue raised by Maryland local governments in fiscal 1970-71, or about one-third of their total general revenue including intergovernmental receipts.
In an ACIR study, Measuring the Fiscal Capacity and Effort of State and Local Areas, Maryland's tax capacity was estimated to be a few points above the national average, both for all State-local taxes and for property taxes considered alone. But for the taxation of farm property, the State's tax effort is 20 percent below the national average.
THE PROPERTY TAX BASE
In 1971, 79 percent of the official base for local general property taxation in Maryland consisted of locally determined assessments, with nearly all of this consisting of real estate. Only 0.8 percent was locally assessed tangible personal property. State set valua- tions of public utility property contributed 13 percent of the total, and other State set valuations, covering tangible personal property of ordinary business corporations, pro- vided the remaining 7 percent.
On a statewide basis, Maryland has long exempted motor vehicles from property taxation, as well as substantially all intangible personal property. It also provides for the usual exemptions of property holdings of governments, churches, educational and charitable institutions of various types. (See also "Availability of Property Tax Data," below.)
Maryland authorizes its counties (and Baltimore) to exempt from local taxation (either wholly, or partially by fractional valuation) various kinds of personal property which are part of the base for the relatively minor statewide general property tax. A 1967 enactment enlarged such county powers, and localized exemptions have grown in recent years.

Thus the taxable base for the statewide general property tax is somewhat larger, by nearly 9 percent in 1971, since it includes certain personal property various counties have exempted from local taxation under State laws permitting such action. Accordingly, al- though non-utility personal property (both State and locally assessed) made up only 7 per- cent of the 1971 base subject to local general property taxes, it represented 15 percent of the larger base for the minor statewide tax.
Further curtailments of the tax base are the result of a 1967 enactment providing for the complete statewide exemption of livestock (previously taxable unless locally ex- empted) and from a 1968 law exempting the personal property and shares of stock of financial institutions.
Tax credits. A number of recent Maryland enactments reduced the tax liabilities of certain property owners by means of tax credits. The most significant relate to elderly and disabled homeowners having a limited income. A person who is at least 65 years of age (60 in Baltimore County) or is wholly disabled and who has annual family income of less than $5,000 a year exclusive of Social Security or Railroad Retirement benefits ($7,000 in Baltimore County) can claim relief from payment of all taxes levied by the county (or Baltimore City). The credit is equal to one-half, but not over $4,000 ($5,000 in Baltimore County), of the assessed value of the owner-occupied residence. This provision does not apply to levies by municipalities other than Baltimore and by local special districts, but such levies in general are relatively minor in Maryland. As previously noted, Baltimore and the various counties levy property taxes for schools as well as other purposes. State- wide, there were 60,385 approved claims for tax credits against 1971-72 property taxes under this provision. These involved benefits of $6.74 million, averaging $112 per claim or about $1.70 per capita. (The total per capita property tax in Maryland for 1970-71 was $167.)
Another provision authorizes any county or municipality to make additional or more generous provisions for tax credits to homeowners, based on the taxpayer's age, income or means, or on property value. Some counties, like Baltimore County, have acted under this authority to establish less restrictive arrangements than those that apply under the state- wide provisions, but comprehensive data concerning such local optional credits are not available.
Similar types of arrangements have also been authorized for the local allowance of credits for open space land which the owner has covenanted with certain public agen- cies to reserve from development, and on the added value resulting from private owners' expense for "the restoration and preservation of structures having historic or architectural value."
Claims for any such tax credits must be filed by the property owner with the local assessing jurisdiction. There is no specific State review of such claims, nor any State reim- bursement for resulting property tax losses to the local jurisdictions affected.
Preferential assessment for farm land. Maryland set a precedent in 1956 which has since been emulated in some fashion by many other States in enacting provisions calling for the assessment of agricultural land according to its value for farm use rather than according to the prevailing market value (highest and best use). The ACIR study of a decade ago reviewed in some detail Maryland's first few years of experience with this approach to farm land assessment and it has continued to be a subject of considerable c o n t r ~ v e r s y . ~
In 1969, the applicable law was amended to provide for some prospective recapture of part of the tax benefits it confers to the owners of preferentially valued land. Since then, the law has provided:
I) that assessors shall regularly ascertain both farm use value and full cash value

for farm lands that have been zoned for more intensive use at the owner's insis- tence or that are covered by a recorded subdivision plot;
2) that tax levies are to apply to the farm use assessments while such use continues; and
3) that upon sale of a part of such land or its conversion to non-farm use, the owner is liable for the added tax that would have been due (but with no interest or penalty added) on the difference between the two valuations for the period covered by such dual assessment up to three years.
Provision was made also for corresponding dual assessment of land in zoned "new town" developments of at least 500 acres, with deferral for ten years of the tax difference (limited to 10 percent of the full cash value assessment, or, at Maryland assessing levels, about 5 percent of the land's actual final market value).
Another law, passed by the 1972 legislature, replaces (except for "new towns") the foregoing provisions by another type of adjustment which apparently does not require continuing dual assessment. Under this law, farm use assessment could not apply to any land that, before July 1972, was zoned at the owner's insistence for industrial, commercial, or multi-family residential use, or was subdivided into lots, nor to land that from July 1972 was rezoned at the owner's insistence for any more intensive use. The law also prohibits the development for non-agriculture use, and any construction (other than for an owner's residence) on land assessed for farm use for a period of three years following such assess- ment, unless the owner pays "two times the difference between the t a x . . . applicable to the land if assessed on its full value in the year development is to commence and the tax applicable to the land if assessed on the basis of the most recent agricultural use assess- ment."
Components of the tax base. Maryland is unusual (if not unique among the States) in maintaining statewide data not only as to assessed valuations but also as to the number of pieces of taxable realty on the assessment rolls. The reported 1969 total was 1,153,301. The 1967 Census of Governments reported 1,066,000 parcels of locally assessed realty on the 1966 assessment rolls. Of these, 72 percent were non-farm residential properties (71 percent by value), 17 percent were vacant lots (2 percent by value), and 7 percent were acreage or farm properties (7 percent by value). The far less numerous commercial and industrial properties (4 percent) accounted for about 20 percent of the statewide total of real property assessed values. State-reported data on 1969 assessed valuation of taxable realty show residential property contributing nearly 71 percent, business realty 24 percent, and agricul- tural property 5.6 percent.
A new approach to the sharing of the higher value commercial properties among all taxing districts is being discussed by the legislature in Maryland. The bills (HB 866 and 1091) provide for the sharing of the increases in commercial and industrial assessed values between the taxing district where the property is located (40 percent) and the Maryland Industrial and Commercial Growth Pool (60 percent). The tax rate applied to the State's portion will be the weighted State average rate for commercial properties. The monies will be allocated, if the bill becomes law, on a per capita formula related to the relative amount of residential property in each taxing district.
ASSESS1 NG RESPONSI BI LIT1 ES
Up to 1973, there had been no major changes in Maryland's organizational framework for assessment and property tax administration since the ACIR report of a decade ago. As was then reported in considerable detail, the present arrangements were established in 1959, when the legislature provided for a State Department of Assessments and Taxation, headed by a Director appointed by the Governor but serving as a career officer under the

State's merit system, and for a separate Maryland tax court of five appointive judges to consider tax case appeals.
The main function of the Department of Assessments and Taxation is property tax administration, but it is also a legal custodian of corporate records and administers various special taxes. The Department is responsible not only for supervising local assessment work, as more fully described below, but also for assessing railroad and other public utility operating property (exclusive of land] and the personal property of corporations. It has a total staff of 90 persons. Counting also the Maryland Tax Court, State personnel concerned mainly with property taxation totals 99, as compared with 72 a decade ago. Appropriations specifically for operations of the Department and the Tax Court in fiscal 1972 totaled $935,000, equal to about one-eighth of 1 percent of statewide property tax revenue. How- ever, the State also provided $1.4 million to finance 60 percent of the statutory salaries of local assessing personnel, raising the percentage of cost to tax revenues to about one-third of 1 percent.
Local assessing responsibilities were assigned to an agency in each of the State's 23 counties plus Baltimore City. Seven cf these areas have more than 100,000 inhabitants and these seven include more than four-fifths of Maryland's total population. Most of the other counties are also relatively populous, although four of them have only between 15,000 and 20,000 inhabitants. Close oversight of local valuation work is provided through a super- visor of assessments for each county, who is appointed by the State Department from a list of nominees submitted by the county commissioners (or the mayor, in the case of Balti- more City). Although paid partly by the State, these supervisors are not counted in the foregoing figures as employees of the State property tax agencies.
As previously reported a decade ago, the State established statutory minimum salary standards for all grades of assessors, and reimbursed the local governments for 60 percent of their statutory salaries. Pay rates higher than those specified by the State could be pro- vided by county action. Professional personnel of local assessing offices were appointed by the county governing bodies from lists of applicants who had been examined, graded, and certified by the State property tax agency, and are subject to removal for cause only after a hearing by the State.
Tax maps are prepared and maintained on the State level, and supplied to local assess- ing officers as well as to other State and local agencies. The State property tax agency prescribes all local assessment forms and establishes procedures for their use.
Annual five-day training programs are a requirement for all Maryland assessing personnel. The training program is sponsored jointly by the State property tax agency, the State Department of Education, University of Maryland, and the Maryland Assessor's Association. In addition, a program was recently established for intensive training of newly appointed assessors. This includes one week of class instruction and two or more weeks of actual field appraisal work, after which the new assessor continues routine appraisal work with periodic reviews by the training officer.
House Bill 531, passed in 1973, will effectively "nationalize" the assessment functions in Maryland. The State will appoint, from a list of five qualified applicants submitted by the county government or Baltimore City, the supervisor of assessment for that unit of government. He shall hire the professional assessors he needs; all of whom will be State employees. As stated in the Act: .
It is the intention of the General Assembly that the cost of the maintenance, opera- tion, and administration, and the cost of providing necessary facilities and equipment, including capital costs, of the system of assessment for each county and the City of Baltimore shall be borne exclusively by the State, and shall be provided for in the annual State budget in the following manner:

1. Effective July 1, 1973, the annual salaries of the supervisors of assessments in each county and Baltimore City and incidental expenses as they may incur, and the per diem and expenses of the several property tax assessment appeal boards;
2. Effective July 1, 1974, the annual salaries and administrative costs of the assessors in each county and Baltimore City;
3. Effective July 1, 1975, all remaining costs relating to personnel, administration, operation, and maintenance of the assessment system of each county and Baltimore City; and
4. Effective July 1, 1975, the data processing costs of each county and Baltimore City relating to the assessing function shall be borne by the State, subject to the approval of the Secretary of Budget and Fiscal Planning.
Thus by 1975, Maryland will be the second State (next to Hawaii) to have the State responsible for property tax assessment.
The State Department had required, by regulation, that every parcel of taxable realty be physically inspected for reassessment at least once each three years. To a large extent, however, the updating and revision of valuations involves a continuing rather than a periodic reassessment process, making use of findings from the State's regular program for measurement of assessment ratios.
Recently (September 1973), a Maryland judge ruled that the State must conform to the law by annually assessing the value of its more than one million residential properties. Presently, the State has only been reviewing the tax rolls annually while reassessing on a three-year cycle. The State was given 30 days to submit "a detailed description of how they propose to discharge fully their obligations."
ASSESSMENT VARIATIONS Legal Requirements. Although Maryland laws provide generally for the assess-
ment of property at its full cash value, they further specify that for real property (though specifically not for personal property) this term shall mean "current value less an allow- ance for inflation, if in fact inflation exists." Under this language, the State property tax department has, for many years, directed all local assessors to ascertain the full cash value of real property and make a 40 percent allowance for inflation-i.e., to set taxable as- sessed valuations at 60 percent of current market value.
State assessment ratio studies. Biennially from 1962 through 1968 and annually since 1970, the State Department of Assessments and Taxation has conducted a statewide assess- ment ratio study. The present annual schedule was specifically authorized by a 1969 enact- ment recommended by the Department. Annual timing permits the conduct of this opera- tion by a permanent full-time staff, rather than borrowing personnel from county assessing offices, as was the practice under the biennial arrangement.
The study involves a comparison of the assessed values and the relevant full value of a cross section sample of various types of property in each county. For frequently traded kinds of property, it makes use of sales price information for a sample of recently sold parcels, available under the State's realty transfer tax. However, for sample commer- cial and industrial properties, agricultural properties, and numerous other parcels con- sidered in the study (the bulk of the sampled parcels in sparsely populated counties), full- value amounts are determined by specific appraisal. Land and improvement elements of agricultural properties are considered separately, and the land component is appraised according to its value for farm use.
Summary results are published from this undertaking in the Department's annual (previously biennial) report, in the form of average assessment ratios (weighted by the

dollar amount of the three broad property classes: residential, agricultural, and commer- cial-industrial), for the State and each county, and county-by-county measures of assess- ment variation. The county average ratios are, by law, used as a factor in the calculation of certain State grants to local governments for public schools, health, and law enforcement. The findings of the survey are also intensively used by the Department of Assessments and Taxation in its supervision of local assessment work.
Assessment performance. The statewide average ratios reported for the four even numbered years 1962 through 1968 were remarkably uniform. They ranged only between 54 and 55 percent, and were thus only a few percentage points below the ostensible tar- get valuation level of 60 percent. The 1969 average was somewhat down, to 52 percent, and the 1970 average was further off at 51 percent.
Maryland averages reported by the periodic Census of Governments (based entirely on a sample of measurable sales, and hence involving very limited representation of business property) were 48 percent for 1957, 45 percent for 1962, 43 percent for 1967 and 48 percent for 1972. One factor in the somewhat lower Census reported averages is their in- clusion of rural property ratios calculated by reference to current sales prices rather than to farm use value, as in the State's more intensive surveys. The successive Censuses throw some light on the impact of Maryland's arrangement for the preferential assessment of such property. The Census ratios for acreage and farms, as indicated by measurable sales, moved from over 34 percent in 1957 (before the present valuation system took effect) to 21 percent in 1962, and to 19 percent in 1967. The latter ratio was less than half as large as the Census estimated assessment ratios for residential and business realty in Maryland.
The State's 1970 ratio study indicated a relatively limited range -10 percentage points -between the highest and lowest average county assessment ratios. This reflected a con- siderable improvement from the previous year, when the earlier trend toward increased inter-county uniformity had apparently been reversed, and a spread of over 18 points had been indicated.
The significance of inter-county differences of assessment level is considerably lim- ited by the adjustment of various State grants to take them into account, as previously noted. However, there is no such adjustment with regard to the application of the state- wide general property tax levy.
Within-county uniformity, however, is of even greater significance, and on this score Maryland's performance continues to afford a chellenge to most other States, as was the case a decade ago.
The most recent published figures (for 1969) show only three of Maryland's counties with an estimated coefficient of dispersion of assessment ratios for locally assessed real property of more than 20 percent; for four counties the figure was less than 10 percent, and for another ten it was between 10 and 15 percent. The 1972 Census figures for inter- and intra-area coefficients of dispersion were five and 17 respectively, one of the lowest sets of coefficients in the nation.
The availability of property tax data. In Maryland, as generally elsewhere, assessed valuations set for individual parcels of taxable realty are a matter of public record, avail- able locally at cost. The annual (formerly biennial) reports of the State Department of Assessments and Taxation provide assessed valuation figures by type of property, state- wide and by county, as well as tax rate data for the respective counties and Baltimore City. Beginning in 1976, the Department is to make available at reasonable cost the assess- ment books and assessment work sKeet where value classifications have changed. In addition, annual reports that are issued by the State's Department of Fiscal Services in- clude figures on the revenue received from property taxes and other sources by individual counties, municipalities, and special districts. As previously noted, Maryland does not

have independent school districts, but the State Department of Education also reports data annually on the finances of the school systems associated with Baltimore and the respec- tive counties.
Tax exempt property. Records as to tax exempt real property a re maintained in each local assessment office, and the State has assembled county-by-county data as to the assessed valuations of such property. In 1969, the recorded amounts equalled about 30 percent of the statewide total for locally assessed taxable realty, with more than three- quarters of this involving governmental holdings and most of the rest involving religious property holdings.
The State property tax agency, pursuant to a law enacted in 1971, is in the process of making a n intensive and detailed appraisal of all tax exempt real property. It also expects to implement another recent enactment which strengthens requirements as to local records concerning tax exempt property, and to publish regularly, in its annual report, data con- cerning such property, by type.
REVIEW AND APPEAL OF PARTICULAR ASSESSMENTS
As reported in the ACIR report of a decade ago, Maryland pioneered in providing (in 1959) for the separtion of administrative and appellate aspects of property assessment, by creating the Maryland Tax Court and authorizing counties to provide for a review agency to consider assessment appeals (in lieu of the county commissioners serving ex-officio as a local equalization body). Now, with the passage of HR 531, the three members of the county property tax assessment appeals board will be appointed by the Governor from lists of three names submitted for each vacancy by the mayor of Baltimore City or appropriate county officials. Per diem will be paid out of the State budget.
Under the new law the first level of appeal is to the supervisor of assessment. Further appeals go to the property tax assessment appeals board. If the case is not settled, the next level of appeals is to the Maryland Tax Court.
TPart of this report is based upon information supplied by William H. Riley, Chief Supervisor of Assess- ments, Maryland Department of Assessments and Taxation.
2For a review of developments from 1955 to 1969, see William H. Riley, "Maryland's Farm Law," Inter- national Property Tax Assessment Administration, Vol. 2, Proceedings of the 35th Annual International Confer- ence on Assessment Administration (Chicago: International Association of Assessing Officers, 1970), p. 246-259.

With a State-local revenue system that involves very heavy reliance on local property taxation, Massachusetts has a relatively decentralized arrangement for local assessment, under which nearly half of the primary assessing areas have fewer than 5,000 inhabitants. In recent years, arrangements developed in the 1950's for State supervision of local assess- ing have been extended to many additional areas and now directly apply to jurisdictions that include three-fifths of the State's population. The Massachusetts' legislature has recently enacted a number of laws providing partial exemptions or tax preferences to cer- tain property holdings including the aged, veterans, and widows of firemen and police- men.
FINANCING ROLE OF THE PROPERTY TAX
Local property taxation is by far the largest single component of Massachusetts' reve- nue system, and accounted in fiscal 1970-71 for 46 percent of all general revenue raised by the State and local governments. Although reflecting some decrease from Massachusetts' proportion of a decade earlier (52 percent), this was considerably above the nationwide proportion of 32 percent. Massachusetts' per capita property tax revenue went up 6.2 per- cent a year in the 1960's, outpacing the 5.5 percent growth rate of the State's economy as measured by per capita personal income. On a per capita basis, property taxes were $286 in 1971, second highest in the nation and comparable to the national average of $184. The State has the third highest tax burden per $1,000 of personal income at $66, compared to the national average of $47.
Massachusetts is one of the limited number of States where assessed valuations have risen during the past decade at a faster pace than the growth of the State's economy (as measured by personal income) and the increase in property tax revenue. Apparently, there has been some reduction in the average ratio of tax applied to official valuations.
In Measuring the Fiscal Capacity and Effort of State and Local Areas, a recent ACIR study, Massachusetts' average property tax effort was estimated to be about 41 percent above the national norm-higher than that of all other States except Minnesota. The State was 130 percent above the national norm on the taxation of farm property -the highest in the nation. On the other hand, its overall composite effort ratio for all State and local taxes was only 21 percent above the nationwide average.
About three-fourths of the State's 682 local governments have property taxing power, and most of them rely mainly on this source for their financing. In fact, about 86 percent of all the general revenue raised by Massachusetts' local governments in fiscal 1970-71 was from the property tax-considerably above the corresponding nationwide figure of 64 percent.
THE PROPERTY TAX BASE
Of total taxable valuations for general property taxation, as officially set in Massa- chusetts in 1971, a little over 1 percent consisted of State assessed amounts for certain public utility property and State owned land, 93 percent involved locally assessed realty, and 6 percent locally assessed personalty. Motor vehicles and forest lands are exempt from the genera1 property tax but are subject to special property taxes which account for about one-eighth of all property tax revenue.
Complete exemptions from general property taxation include intangible personal property, business inventories, household furniture and effects, livestock, and commercial fishing boats and equipment to a value of $5,000, as well as registered motor vehicles and

forest lands (both subject to special property taxes as noted above). There is provision also for the usual complete exemptions of property holdings of governments and of religious, educational, and charitable organizations. Massachusetts is one of the relatively few States that regularly assemble assessed value data for the latter types of exemptions. The statewide amount so estimated in 1971 was $6.2 billion, or more than a quarter as much as the gross assessed value of all property subject to general property taxation. Of this amount, 65 percent involved governmental holdings, 18 percent property of educa- tional institutions, and the other 17 percent religious, charitable, and miscellaneous other types of holdings.
The general property tax base in Massachusetts is somewhat reduced (by 2.4 percent in 1971) by a number of partial exemptions that apply to the owner-occupied residences of certain property owners. The most significant of these, accounting for three-fifths of the allowed exemptions, is for limited-income elderly homeowners; other provisions benefit veterans and their survivors, certain widows, blind persons, and various other groups.
Under a law first enacted in 1963 and successively amended thereafter, an elderly homeowner can claim either exemption from the property tax due on $4,000 of the assessed valuation of his residence or a tax abatement of $350, whichever is greater, provided that:
1) he is at least 70 years of age,
2) he has lived in Massachusetts at least ten years,
3) he has annual income of less than $6,000 if single or $7,000 if married, and
4) he has property holdings (other than household effects) worth less than $40,000 if single or $45,000 if married.
Under an earlier enactment, an alternate less generous partial exemption or deduction is available to long resident homeowning persons aged 70 or over as well as to homeowning widows and fatherless minors. These persons can claim an exemption of $2,000 or an abatement of $175, whichever is greater, as long as the value of their real estate and personal property is not greater than $20,000. Blind persons can similarly claim $4,000 or $350; veterans, their spouses, widows, and parents either $2,000 or $175 and $10,000 or $875 depending on whether they are disabled or not, and the extent of the disability, as long as their property is not greater than $20,000. Widows of policemen or firefighters killed in the line of duty $8,000 or $700. (H.B. 6216 passed in 1973 raises the exemption level for the blind to $5,000 and the abatement level to $437.50.)
In November 1972, the electorate approved a constitutional amendment that provides for preferential assessment of farm land. The amendment authorizes statutory provision for assessment of land parcels of at least five acres which are actively devoted to agricul- tural or horticultural use, according to their value for such use, rather than according to their market value.
In addition there has been recent legislation also to authorize tax exemption for State certified facilities designed to curb water pollution and to revise various earlier provisions for property tax exemptions or preferences. Other recent changes have eliminated earlier requirements for annual filing of claims as a condition for the granting of certain property tax preferences and the 1972 legislation provided for complete exemption of household furniture and effects from the personal property tax.
The 1967 Census of Governments (not updated in the 1972 Census] reported 1.9 million pieces of taxable real estate in Massachusetts. Of these, 70 percent were non-farm residential properties, 21 percent were vacant lots, 5 percent were commercial or indus- trial properties, and 4 percent were acreage or farm properties. Urban residential proper- ties accounted for 70 percent of gross assessed valuations of taxable realty, with commer-

cia1 and industrial properties contributing 27 percent, and vacant lots and rural properties accounting for the small remainder.
ASSESS1 NG RESPONSIBILITIES
As indicated above, practically all valuations for general property taxation in Massa- chusetts are set by local assessors. These number 351, 39 for cities and 312 for towns. (Despite their designation, the latter are not necessarily areas of concentrated population; geographically, they resemble units known in numerous other States as townships, but are responsible for the bulk of local government services-including public schools- within their respective areas.)
Most of these jurisdictions have small populations. Only five have at least 100,000 residents (including Boston with over 600,000) and these account for only about one-fifth of the State's population; another 19-mostly cities-have populations of 50,000 to 100,000. Nearly half the assessing areas have fewer than 5,000 inhabitants, and another 60 have populations of 5,000 to 10,000. In the 37 cities and also ten towns, the assessor is appointed, while in the other 304 towns valuation responsibilities rest with assessors elected for three-year terms-in each jurisdiction either a single afficial or member of a three- or five-person board. Understandably, in many of the smaller jurisdictions assessment work is handled by local officials who also have other assigned responsibilities.
At the State level, property tax matters are dealt with by the Department of Corpora- tions and Taxation, which is headed by an appointive Commissioner and comprises the three-member State Tax Commission plus several divisions. The Department's Local Finance Division sets and allocates to local jurisdictions tax valuations (at full and fair cash value) for transmission pipe lines, telephone and telegraph companies, and certain State owned land; through its Bureau of Local Taxation it assists local officials on tax collection matters and advises assessors on legal matters; and through its Bureau of Local Assessment it aids local assessors in other aspects of their valuation work.
The Bureau of Local Assessment was set up in 1955, pursuant to a law under which any city or town may petition the State for installation of a "State assessment system," which is thereafter to be locally applied unless the jurisdiction votes to withdraw. Local participa- tion now extends to 15 cities and 197 towns, together comprising about 60 percent of the State's population. The present total of 212 jurisdictions under this system compares with 58 at the end of 1962, and only 20 in late 1960.
The Massachusetts Bureau of Local Assessment has less explicit powers of super- vision than are vested in similar agencies of many other States since it deals mainly with local jurisdictions which have elected to come under the State assessment system al- though its services are also available to others. During the past decade, it has maintained and expanded the kinds of technical aid described in the ACIR report of a decade ago.2 The Bureau recommends local record systems, maps, and other assessment tools, and supervises their preparation and use in State system jurisdictions.
On occasion the Bureau proposes complete revaluations, and where this is done, the staff of the Bureau supervises the revaluation, whether carried out by local government personnel or private firms. From 1966 to early 1972, revaluations were carried out in some 159 cities and towns.
The State's supervisory role has been made somewhat more explicit by two 1971 enactments. One act made it a specific duty of the Commissioner of Corporations and Taxation to "conduct or sponsor" assessors' training programs, and empowered him to require attendance by local assessors. The other act gave the Commissioner the explicit duty of preparing an assessment manual, revising it each year, and making it available to local assessors. (As previously reported, the Bureau of Local Assessment, acting under less
explicit provisions, has for more than a decade sponsored training conferences and pre- pared manuals for the guidance of local assessment work.)
The Bureau's budgeted resources for 1971 amounted to $159,000, about four times the amount ten years earlier, but only a miniscule portion of statewide property tax revenue.
ASSESSMENT VARIATIONS
Legal requirements. The Massachusetts constitution calls for the valuation of taxable property in full at its fair cash value; however, recent attempts at legislation requiring 100 percent valuation to enforce the constitution have failed.
State assessment ratio studies. The State Tax Commission must report to the legislature every two years the' equalized valuation of taxable property in each of the cities and towns. In arriving at these figures, it has since 1959 conducted a statewide biennial sales ratio survey which extends to all usable transfers during the two-year period, supple- mented by some appraisal data for industrial and commercial property.
These studies produce an equalized value-full value-figure for each of the 351 cities and towns by applying the estimated assessment ratio to the assessment roll. The results of these studies are not published, but are presented to the legislature as required by law. The equalized values are used to apportion State aids and to allocate county taxes among the cities and towns-a necessary step in view of the tremendous inter-area differ- entials in assessment levels, as discussed below. The equalization report to the legislature does not include measures of central tendency, either among assessing jurisdictions or among properties within assessing jurisdictions.
Assessment levels and variations. The average assessment ratio of real property has been rising in Massachusetts. During the decade 1957-1967, the average ratio for all types of property, as measured by sales transactions, rose from 43 to 46 percent; the 1972 Census showed a continuation of this trend, up to 48 percent. For non-farm single-family houses, the average ratio jumped 9 percentage points-from 40 percent to 49 percent during the 1957-67 decade.
The average assessment ratio figure conceals a tremendous variation in levels among assessing jurisdictions. The 1967 Census of Governments indicates the highest inter-area coefficient of dispersion in the nation in respect to assessments for single-family homes- 53 percent. By the 1972 Census, there was some improvement as the coefficient declined to 40 percent; second highest in the nation following Louisiana at 42 percent. This dispersion is borne out by the spread that appears in the most recent report on equalized valuations of the State Tax Commission, which deals with all types of realty. According to that report, assessment ratios range from 13 percent in one town to well over 90 percent in a con- siderable number of cities and towns. Nevertheless, local assessors would appear to be doing an excellent job in maintaining an equitable relationship among properties in assess- ing single-family homes. As measured by the 1967 Census of Governments, the coefficient of intra-area dispersion for the median area was 15 percent, with 78 percent of all the assessing jurisdictions on the Census sample reported as having coefficients of less than 20 percent. For the nation as a whole, only 53 percent of the sample jurisdictions performed as well. Conditions remained approximately the same in 1972 with the intra-area coeffi- cient still at 15, compared to a national average of 20 percent.
REVIEW AND APPEAL OF PARTICULAR ASSESSMENTS There have been no major changes in Massachusetts' arrangements for property tax
appeals. As reported a decade ago, aggrieved property owners may appeal assessments in the first instance either to the county commissioners or to the State Appellate Tax Board. (This five-member appointive body, established in 1937, is not part of the State Department

of Corporations and Taxation). The appeal system also provides a special simplified arrangement for hearings that involve relatively low value assessments.
'Part of the information for this report was provided by Donald T. Wood, Associate Commissioner, Massa- chusetts Department of Corporations and Taxation.
2The Role of the States in Strengthening the Property Tax (A-17). 1963.

While retaining its highly fractionated structure of local assessment districts (over 1,500 primary assessing jurisdictions), Michigan has taken some significant steps in the past decade toward improving assessment administration.
Under the Executive Organization Act of 1965, the functions of the State Board of Equalization and the State Board of Assessors were transferred to the State Tax Commis- sion which now has general supervisory responsibility for property tax assessment admin- istration, including the State assessment of certain utility properties. Local assessors are now required to be certified as to their qualifications by a State Assessors Board, which was established in 1969. That Board also develops and supervises assessor training pro- grams. The equalization and review functions of the State Tax Commission have been ex- panded as has its field organization for carrying out its responsibilities.
Each county is now required to establish a department of equalization which provides assistance to local assessors and equalizes the assessment rolls of cities and townships under its jurisdiction. The county equalization agency is also required to take over the assessment function of any township or city without a certified assessor. Provision is made for small counties to establish joint equalization departments and for small townships and cities to employ assessors jointly.
Not only did Michigan pioneer property tax reform in the 1960's, it, along with Oregon, Vermont and Wisconsin, led the way in 1973 in adopting the "super circuit-breaker" where all low-income individuals are provided with tax credits or rebates if overburdened by property taxes.
FINANCING ROLE OF THE PROPERTY TAX
Although its relative proportion has dropped somewhat more in Michigan than in the nation as a whole in the past decade, property taxation remains a major source of State and local revenue.' Of total general revenue raised by the State and local governments in fiscal 1970-71, property taxes accounted for 33 percent, slightly above the national average. In fiscal 1959-60, the respective proportions were 41 percent for Michigan and 38 percent for the nation. Both on a per capita and per $1,000 of personal income, Michigan relies more heavily on the property tax relative to the national average ($202 vs. $184 and $50 vs. $47.)
In an ACIR study, Measuring the Fiscal Capacity and Effort of State and Local Areas, estimates indicated that the property tax load in Michigan averaged 3 points above the national norm for all property, 3 points below on non-farm residential property, but 45 points above for the taxation of farm property. The composite index for the State, how- ever, with all State and local taxes considered, was on a par with the average for the nation as a whole.
Operating property of railroads, telephone and telegraph companies is subject to assessment and taxation by the State at an average rate that is derived by dividing the previous year's State total equalized valuation into total ad valorem taxes. Of property tax revenue levied and collected by the State, 58 percent came from a special property tax on intangibles and 41 percent from the special levy on utilities.
Of Michigan's 2,649 local governments, 2,523 had property taxing power. About 67 per- cent of the general revenue raised by local governments in fiscal 1970-71 came from prop- erty taxes, which is slightly higher than the national average, which was 64 percent.

THE PROPERTY TAX BASE
Locally assessed realty makes up about three-fourths of the total in Michigan. On a statewide basis such realty amounted to 76 percent in 1971, up from 73 percent in 1961.
All real and personal property in the State is subject to taxation unless expressly exempt. Real property includes all land, plus "all buildings and fixtures thereon," and "appurtenances thereto," except those expressly exempted.
Personal property exemptions include household property and agricultural equip- ment, machinery, live stock, fruit trees, etc.
Michigan fully exempts property owned and used by charitable, religious, educa- tional, and benevolent institutions, as do other States, but the State does not estimate the value of such exempted property.
Homestead exemptions. There are several homestead exemptions. The homestead of a blind person is exempt on the first $3,500 of State equalized valuation, regardless of total value. Prior to 1972, the amount was limited to $2,500, and the exemption excluded anyone owning realty worth more than $10,000. Veterans and their widows are eligible for home- stead exemptions ranging from $2,500 to $4,500, depending on, among other things, the degree of disability. Except for veterans receiving government assistance for a service connected disability, the exemption is available only to those with homesteads valued at less than $10,000 State equalized value and with annual incomes of less than $7,500.
Senior citizens' homestead exemptions have been in effect since 1965. Anyone 65 years or over and a Michigan resident for five out of the last ten years, qualifies for a homestead exemption of up to $2,500 of State equalized value, provided the income of the qualifier and spouse in the preceding year did not exceed $6,000. Senior citizens qualifying for the veterans9 exemption may choose only one exemption.
A person who qualifies for the blind exemption, however, can receive the benefit of the veteran or senior citizen exemption if he so qualifies.
A separate unrelated exemption applies to non-profit housing. If such housing is owned and operated by a non-profit corporation or by a governmental unit for use by elderly persons, defined as 62 years or older, the housing is exempt from all property taxation.
Circuit-breaker tax relief. Michigan allowed a homestead property tax credit against its income tax for residential property taxes paid.3 Renters were allowed the credit as well as homeowners and 17 percent of gross rent was considered property taxes paid for this purpose. Individuals, partnerships, estates, and trusts were entitled to the following credits and in no case could the amount of credit exceed amount of income tax liability:
Property
Not over
tax bill
$100 Over $100, but not over $150 Over $150, but not over $200 Over $200 Over $10,000
Amount of credit, expressed as percent of amount of property tax 20 % $20.00, plus 10% of excess over $100 $25.00, plus 5% of excess over $150 $27.50, plus 5% of excess over $200 4
In 1973, the various homestead exemptions and credits were replaced by circuit- breaker type income tax credits, where if the credit were larger than the tax liability re- funds would be paid to the taxpayer. A claimant who is not a senior citizen, eligible serviceman, veteran, widow or blind person is entitled to a credit equal to 60 percent of the amount by which property taxes on a homestead exceed 3.5 percent of total household income, with a maximum credit of $500.

The senior citizen's credit is equal to the amount property taxes exceed a variable percentage of household income calculated as follows:
Not over $3,000 0% $3,000- 4,000 1.0 4,000- 5,000 2.0 5,000- 6,000 3.0 over 6,000 3.5
Thus for incomes of less than $3,000, a credit or rebate is equal to the total amount of tax paid subject to a maximum credit of $500.
For the eligible serviceman, veteran or widow, the credit is the percentage of the property tax not in excess of 100 percent of the homestead determined as follows:
1. Divide the State equalized' value allowance (which varies between $2,500 and $4,500 depending on the extent of disability and the war involved) by the State equalized value of homestead.
2. Multiply the property taxes on the homestead by the percentage calculated in (1).
A maximum credit of $500 exists here, also.
A claimant who is blind is entitled to a credit for a percentage of property taxes de- termined as follows:
1. If State equalized value is $3,500 or less-100 percent of property taxes.
2. If State equalized value is more than $3,500 the percentage that $3,500 bears to the equalized value.
Again, a maximum of credit of $500 exists.
Other exemptions. Michigan law also contains provisions exempting all or part of property in specified classes, or provides separate methods of assessment. Working tools of a mechanic are exempt up to a State equalized value of $500. Farm implements are entirely exempt, along with farm products used by the farm owner. Specific tax provisions sub- ject iron ore beneficiating plants to a tax equal to the larger of 1 percent of rated capa- city or 2 percent of the past five-year average production in tons multiplied by the F.O.B. mine or plant site value of Lake Erie base grade ore. Oil and gas rights are subject to a severance tax in lieu of all taxes. Air and water pollution control facilities are exempt from property taxes for as long a period as they qualify under their exemption certificates. In 1973, provisions were added to the property tax law which require the assessor to con- sider the value of farm structures and the present income derived from farm land when establishing the cash value of the property.
Taxation of intangibles. Michigan imposes a special property tax on intangibles for State purposes, based on income or value. The rate on income producing intangibles is 3.5 percent of the income, but not less than 0.1 percent of the value. The rate on non-income- producing intangibles is 0.1 percent of face value. Cash on hand or in banks along with shares in savings and loan associations is taxed at 50 cents per $1,000.
Tax Rates. The Michigan constitution (Article IX, Section 6) limits general ad valorem taxes on real and personal property to 15 mills on each dollar of assessed valuation as finally equalized. Separate additional limitations may be voted for individual counties, townships, and school districts, the amounts varying from 15 to 18 mills combined. In addition, these limitations may be increased by vote to an aggregate not exceeding 50 mills excluding charter taxing units. A constitutional provision effective in 1964 (Article IX,

Section 16) allows school districts to tax without limit for repayment of bonds or State loans.
Components of the tax base. There were approximately 3.4 million parcels of locally assessed realty in the State, as reported in the 1967 Census of Governments, the most cur- rent data available. Of the total, 62 percent were non-farm residential properties, of which only 3 percent were multi-family. Acreage and farms comprised 16 percent of the total number, vacant lots 18 percent, commercial and industrial parcels (combined) 4 percent. The distribution of assessed value was similar to that for the number of parcels-61 percent for all residential value, and 58 percent for single-family homes. Commercial and industrial assessed value, however, slightly exceeded 27 percent. Acreage and farms added 7 percent and the assessed value of vacant lots accounted for only 3 percent of the total.
ASSESSING RESPONSIBILITIES
While there were notable changes in the structure of county and State assessment administration, the organizational patterns of primary assessing jurisdictions remain essentially as they were a decade ago.
Rimary assessing jurisdictions. On the local level, assessors are as numerous as they were in 1962. Latest available figures show that for the 1,517 primary assessing areas there are 1,247 township assessors, 264 city assessors, plus at least two boards of assessors-one in Detroit and one in Dearborn. The great majority of the assessing jurisdictions are ex- tremely small with about 85 percent of them serving populations of less than 5,000 inhabi- tants.
Township supervisors, elected for a two-year term, perform the assessment function at the township level. Most city assessors are appointed, in accordance with State statutes and city charters. A few of the latter authorize cities to have elected assessors, and this occurs in at least five cities, all with relatively small populations. There are also an unde- termined number of village assessors, elected or appointed as underlying laws and options permit, but none of these has primary assessing responsibility. A village assessor must use the township assessment as his value. His primary function is to prepare the tax roll and spread the taxes thereon.
A 1972 law, effective March 31, 1973, authorizes townships, villages, cities, and coun- ties to enter into agreements for joint assessment and collection of property taxes. This, together with the requirement that local assessors be certified and receive training (see below) should provide a basis for more efficient local property tax administration, particu- larly for the smaller jurisdictions.
County responsibilities. Counties are responsible for equalizing the assessment rolls of the cities and townships within their jurisdiction and may assist local assessors in per- forming their duties. Since 1969, each county has been required to establish a county department of equalization (previously the establishment of such departments was per- missive). Most of the 83 counties have now established such departments, although there are still a few small rural counties that have not, according to a recent legislative commit- tee rep01-t.~ On the recommendation of that committee, the 1972 legislature enacted a pro- vision authorizing two or more counties to establish a joint equalization department.5 The county equalization departments were strengthened further by a 1972 statute that gives them or the State Tax Commission the ability to prepare the assessment rolls for a local assessing district that does not have an assessor certified by the State Assessor's Board.8
State responsibilities. At the State level, placement of responsibilities for assessments has changed somewhat during the past ten years. Since the Executive Organization Act of 1965, the State Tax Commission has absorbed the functions of the State Board of Equaliza- tion, which was abolished in 1966. Under the same legislation the State Board of Assessors

was transferred as a unit to the State Tax Commission. The Commission, created in 1927, has three members, not more than two from the same political party and each appointed by the Governor for a six-year term. Each Commissioner is required to have at least five years experience in assessment or appraisal of realty and personalty.
The State Tax Commission is now charged with general administrative and super- visory responsibilities for enforcement of the property tax law throughout Michigan. It has the power to review individual assessments, equalize assessments between counties, in- spect local assessment rolls, and examine the books and records of individual taxpayers for purposes of determining true cash value of property subject to assessment. Commis- sion members are ex-officio members of the State Board of Assessors which assesses operating property of railroads, telephone and telegraph companies, and other transporta- tion companies subject to the State specific property tax.
In fiscal 1962, the State Tax Commission operated with an annual budget of $642,000 and 59 employees. Expansion of functions and responsibilities during the decade is re- flected in the 1971-72 budget of $2.1 million-about 0.1 percent of total property tax collec- tions in the State. Staff has increased by 62 percent to 88 employees. The Commission has absorbed all inter-county equalization functions of the previous seven-member Board of Equalization.
State supervision of and assistance to local assessors. The State Tax Commission has supervisory power over assessment administration throughout the State, although it spon- sors or mandates no reassessment programs (The Commission may, however, accept or reject local petitions for reassessment). The Commission prescribes the design of forms to be used by assessors, and directs use (mandatory since 1964) of the assessors' manual which the Commission developed. A completely new manual was published in 1973. The Commission establishes unit values for utilities annually, for insertion in the manual and use by assessors. The manual contains recommended percentage deductions to be used to estimate depreciation for residential, agricultural and commercial structures and for personal property.
The Commission actively assists local assessors, dispatching appraisers to value com- plex property and assisting with the implementation of equalization directives. Field districts of the Commission throughout the State have increased from eight to 14 in the past ten years, with each district staffed by qualified appraisers.
Training activity, sponsored in part by the State Tax Commission, includes a short course in appraising, held annually at the University of Michigan. Duration is now five in- stead of the former three days, and the 1973 session is the 27th to be held. Proceedings for- merly were published but this practice has been discontinued because the participants are each provided with the workshop materials prior to the school. The same workshop text is provided for each regional short course.
The Commission also holds assessors' schools annually at a location in the Upper Peninsula, to concentrate on area problems like timber land and mineral property assess- ments. An annual assessors' conference in middle Michigan has the same purpose of directing attention to distinctive area concerns. In 1972, a fourth short course was estab- lished in Grand Rapids to serve southwestern Michigan.
In 1969, Michigan created the State Assessor's Board (not to be confused with the State Board of Assessors) to conduct training courses, review and approve courses con- ducted elsewhere, give examinations to local assessors and certify qualifying assessors as competent to perform the assessing function.
The Assessor's Board has five members appointed by the Governor. Each member is to represent one of the following groups: the State Tax Commission, the township super- visors, the city assessors, the county equalization directors, and the State colleges and

universities. The Board may qualify an assessor on the basis of his having at least five years experience, or passing required examinations.
Under the provisions of a 1969 statute, assessors were to have been qualified or lose appointment by December 31, 1971, but this was extended to December 31, 1972, with actual extension, in effect, to June 30, 1973. The certification provision requires the county equalization department or the State Tax Commission to take over the assessment function from any assessing district that does not employ a certified assessor.
As of March 1972, the State Assessor's Board had certified assessors in 707, or 47 per- cent, of the assessing jurisdictions. It has established four levels of assessing officers; level four consisting of those qualified to meet appraisal and administrative requirements of all levels. Written examination, submission of a narrative appraisal of an income-producing property, plus an oral examination are required for level four certification. The Board has been cautious about qualifying assessors under the five-year experience, or "grandfather clause" provision. In 1972, the Board conducted 15 separate examinations for the purpose of certifying assessors successfully completing requirements.
ASSESSMENT VARIATIONS
Legal basis. Article IX, Section 3 of the Michigan constitution directs that the legisla- ture shall provide for the determination of true cash value of real and personal property not exempt by law. It states further that the proportion of true cash value at which prop- erty is to be uniformly assessed shall not exceed 50 percent after ]anuary 1,1966.
By statute, true cash value means the usual selling price at the time of assessment, the price which could be obtained for the property at private sale, not at forced or auction sale. The assessor is to consider location, soil quality, zoning, existing use, present eco- nomic value of structures, quantity and quality of standing timber, water power, mines and minerals, and other deposits which may relate to the subject property. Statutes also ex- plicitly provide that property be assessed at 50 percent of true cash value, in accordance with the constitution.
State assessment ratio studies. Both county equalization departments and the State Tax Commission examine sales and make appraisals, on a sample basis. The objective is not a ratio study as such, but rather study of enough relationships between assessed values and sales prices, or appraisal estimates, to improve assessment practices and to support equalization action. The Commission provides county and township ratio data on request but does not publish a ratio study as such.
Each county board of commissioners equalizes local rolls to effect intra-county equalization. County equalization departments are required to publish the assessment ratios and tentative equalization multipliers for each city and township in their jurisdic- tion in a newspaper of general circulation within the county. Moreover, each tax bill must include the State equalized value of the property. The State Tax Commission equalizes county equalized rolls to accomplish inter-county equalization. The State equalization factor is multiplied by each assessment and the resultant State equalized valuation for each piece of property is entered on the tax roll and on the tax bill.
Actual assessment ratios and variations. According to the 1972 Census of Governments the average assessment ratio for all "ordinary real estate" was 42 percent as opposed to 28 percent in 1967. Clearly, the assessment ratios have been moving toward the statutory 50 percent ratio. According to the 1972 State equalization data, average assessment ratios were between 45 and 50 percent in 51 of 78 counties for which final equalization factors were available, and between 40 and 45 percent in 14 counties. In only three of the counties were the average ratios below 25 percent. In the five-year period between 1966 and 1971, total assessed value of real estate rose 77 percent.
There was considerable inter-area variation in assessment ratios. In 1966, Michigan's

coefficient of inter-area dispersion for single-family homes was 31 percent, as measured by the Bureau of the Census. By 1971, this ratio had fallen to 11 percent. The application to each parcel's assessed value of a uniform multiplier (to carry out the equalization process) does not eliminate assessment level variations between properties that may occur in the initial assessment process. In fact, this procedure can magnify the dollar effect of assess- ment inequities. It is important, therefore, that inter-parcel variations are kept at a minimum.
Coefficients of intra-area dispersion as developed by the Census Bureau provide a rough measure of assessment quality (or equity). In general, a coefficient of 15 percent or less is an indication of good quality assessment. In 1971, the Census Bureau's coefficient for Michigan was 18 percent, slightly below the average for all States. As has been true generally, Michigan's intra-area dispersion coefficient has been dropping in recent years (26 percent in 1956, 21 in 1966).
REV1 EW AND APPEAL OF PARTICULAR ASSESSMENTS
Initial appeals are made to a three-member board of review appointed by the town- ship board of supervisors. No member of the township board may sit on the board of review. City boards of review may be appointed by city councils, but some members may hold office as public officials in some other capacity. In Detroit, the city council is the board of review. Appeals may be made to the State Tax Commission and subsequently to the courts. The State Tax Commission must make available to the taxpayer and the assess- or all material in the appeal file and must also provide expert witnesses from the commis- sion staff who have examined property that is subject to appeal. Equalization factors, as determined by county and State studies, are admissible as evidence in appeals.
'Some of the information for this report was provided by Edward W. Kane, Secretary of the Michigan Tax Commission.
There is no State tax levied on the local ad valorem tax rolls. The State ad valorem tax is levied on rail- roads, telephone, and telegraph companies as a specific tax, exempting them from local ad valorem taxation. The revenue from this specific tax goes into the State general fund.
3For an extended discussion, see G. H. Miller, "The Tax Credit as a Tool for Coordinating Governmental Fiscal Policy in Michigan," Revenue Administration 1970, National Association of Tax Administrators, 38th Annual Conference (Detroit).
'House of Representatives, Subcommittee on Assessment Practices, Findings and Recommendations (Lan- sing: March 1972). p. 23.
SMichigan Compiled Laws, Sec. 211.34b. BMichigan Compiled Laws. Sec. 211.10d.

Even as it continues to insist on close scrutiny of its property tax system, Minnesota, during the past ten years, has taken major steps to simplify and improve property valua- tion, narrow and yet complicate its classified property tax base, relieve property tax burdens, and expedite initial review of assessments.
Effective with valuations for 1972, the State requires that market value be the basis for assessed values. The previous tolerance of assessments at 33 percent of market value no longer applies. Application of partially revised statutory classification percentages re- mains. On the basis of 1971 legislation, 14 individual classes of real property and 11 of personal property still exist. To promote the achievement of uniform market value esti- mates, Minnesota now requires a county assessor for each county (rather than permitting the option of a county supervisor), and firmly stimulates a reduction in the number of city, village, and township assessors. Significantly, Minnesota created a Board of Assessors in 1971 which, by December 1974, must have certified as qualified each active assessor.
Minnesota has taken major action within the last ten years with respect to the dis- tribution of the property tax burdens and the allocation of its revenue among local govern- ments. It relieves the homestead occupying property owner of 35 percent of his liability (up to $2501, supplements that relief for limited income senior citizens and aids tenants as well as owners. Moreover, the State now has an impressive aid program for local school districts and local general government units. Minnesota is using sales, income and other tax revenue to relieve the pressure on local property taxes and to get more money to local school districts and local governmental units.
FINANCING ROLE OF THE PROPERTY TAX
In Minnesota, as in other States, property taxes retain a dominant role among State and local revenue sources. As elsewhere, however, that dominance has diminished during the past decade. For fiscal 1970-71, property taxes yielded 33 percent of general revenue raised by State and local governments. This is significantly below the figure in 1959-1960, when 43 percent of such general revenue came from property taxes. The trend is likely to continue as a result of legislation such as Minnesota's Tax Reform 'and Relief Act of 1967 and the Omnibus Tax Act of 1971.2 The former exempted certain previously taxable classes of property, stipulated favorable valuation standards for others, and began signifi- cant property tax relief initiatives. The 1971 Act increased the State's sales, income and other levies, and at the same time further contracted the property tax base by, among other things, completely exempting most personal property except that of public utilities.
A recent ACIR study, Measuring the Fiscal Capacity and Effort of State and Local Areas, estimated that the property tax load for Minnesota averaged 55 percent above the national average and was the highest for the nation. Non-farm residential property was 69 percent above, farm property 41 percent, and commercial and industrial property 32 per- cent above. The State's composite effort index for all State and local taxes, however, was 19 points above the U.S. norm. As noted above, the extremely heavy property tax load has been mitigated considerably since these calculations were made.
As reflected for the first time in collections for fiscal 1969, all general property tax revenue in Minnesota now comes from local levies. Until 1967, the State levied a property tax (some $36 million in its last year) to finance a teachers' retirement fund and a State building program.
On the local level, 3,262 of the State's 3,395 local governments have property taxing power. For most of these units property taxes constitute the preemkent revenue source,

bringing in 71 percent of the locally raised total in fiscal 1970-71. This proportion exceeds the corresponding national average by about 11 percentage points.
Between 1960 and 1970, per capita property tax revenues increased at an average rate of 3.8 percent per year reaching the $211 level in 1970-71 (the national average was $184). This growth rate was considerably less than the annual average of 5.9 percent by which per capita personal income increased during the same period. Property taxes per $1,000 of personal income reached $56 in 1970-71 relative to the national average of $47. The same decade exhibited an annual average increase of 2.4 percent per year in official valuations of all taxable property. Increases in the locally assessed realty portion averaged 4.2 per- cent annually, a rate almost twice as high. The difference reflects legislative action that removed substantial amounts of personal property from the tax rolls in 1967 and 1971.
The 1967 law created a property tax relief fund designed to effect the homestead, senior citizen, and business taxpayer relief detailed later. Other relief fund disbursements financed the State teachers' retirement program, per capita aid payments to school dis- tricts and other local governments, and reimbursement payments to compensate for per- sonal property removed from the base.
Property tax relief fund receipts came from a new 3 percent sales tax; a I percent in- crease in the corporate income tax rate; an increased tax on real property transfers; one- half of the revenue collected from c! gross earnings tax on railroad and telephone com- panies; and transfers of $25 million each from the general revenue fund and the income tax school funds in each of two fiscal years, 1968 and 1969.
The 1971 law, broader in scope and more comprehensive, calls for disparity reducing aid to school districts, per capita aid to cities and counties, and more property tax relief, both in direct payments to individuals and in exemption of formerly taxable personal property. At the same time, the Act contains levy limitations designed to moderate further local dependence on the property tax.
Funds to finance property tax relief now come from general appropriations. Sources of such funds continue to include the sales tax (increased to 4 percent in 1971) and the corporate income tax (increased from 11.33 percent to 1 2 percent and no longer allowing deduction of the Federal income tax on State returns).
Additional revenue comes from increases in the cigarette tax (13 cents to 18 cents per package in 1972), iron ore and taconite occupation and royalty taxes (14.25 percent to 15.5 percent), and from a change in inheritance tax due dates. An important feature of the 1971 law is that any local unit that increases its property tax levy by more than 6 percent over that for the previous year loses portions of its State aid payments. Legislation passed in 1973 but not related to the 1971 law restricts the increase in property values to 5 percent per year on certain classes of property (e.g., agricultural land and residential real estate).
THE PROPERTY TAX BASE
Assessed valuation totals set in 1971 include the following components: locally as- sessed real property, 92 percent of the total; locally assessed personalty, 7 percent; State assessed property (iron ore, certain utility property and certain airport property], 1 per- cent. Ten years earlier the corresponding elements of the base were 80 percent, 19 percent and 1 percent, respectively.
The decline in personal property aggregates stems from the 1967 Act which gave manufacturers, retailers and others the option to exempt either inventories held for resale, or tools and machinery. The Act also completely exempted livestock and machinery used for agricultural purposes. In 1971, the legislature extended the exemption to all personal property except mobile homes, certain leasehold improvements, and personalty of utilities not subject to gross earnings taxation. At the same time it specifically defined real prop-

erty so as to include attached machinery and other improvements not easily removed without substantial damage. In 1973, agricultural products were added to the list of exempt properties.
Ecology has also influenced the size of the base since 1967. In that year the State exempted all real and personal property (installed after May 31, 1967) used exclusively (changed to "primarily" in 1969) for the abatement and control of air and water pollution.
The concept of metropolitan sharing of the tax base reached reality in 1971, when the new fiscal disparities law provided, in part, that 40 percent of assessed value increases in commercial and industrial property be allocated to assessing jurisdictions within the seven-county Minneapolis-St. Paul metropolitan area. The base year is 1971, and the seven counties are Anoka, Carver, Dakota, Hennepin, Ramsey, Scott and Washington. Other action in 1971 increased the base by removing from exempt status property owned or leased by hospitals for use as recreational or rest areas.
The most typical fully exempt categories exist in Minnesota as elsewhere. These in- clude property of religious, education, charitable and governmental entities. Assessors estimate a value for such property once every six years. This occured most recently in 1968, with the following results:
(in millioiis) Religious $114.3 Educational 301.8 Charitable 21.0 Governmental 307.9
Total $744.9 In addition to the above, assessors in 1968 reported that exempt personal property in-
cluded $137.4 million in commercial property and $80 million in agricultural property.
Classification of the tax base. Sixty-four years ago the Minnesota State Tax Commis- sion stated explicitly in its first biennial report (St. Paul, 1908) that all property should not be treated alike, but should be classified according to "uses to which it is put, its produc- tiveness and its desirability in a public sense."3
In 1913, four staturory assessment level percentages were established. Classification survived court tests and assorted opposition to undergird not only existing homestead coverage but also other property tax aspects of Minnesota's important Omnibus Tax Act of 1971.
The Minnesota classificatim system now encompasses 14 individual real property classes and 11 personal property classes, calling for assessed values ranging from 5 to 50 percent of market value.
Homestead classifications now affect three real property classes and two personal property classes. Among realty types, the agricultural homestead (Class 3b) is subject to assessment at 20 percent of market value for the first $12,000, and 33-1/3 percent of any excess over $12,000. Non-agricultural homesteads (Class 3c) are assessed at 25 percent of the first $12,000, and 40 percent of the excess. The homestead of a paraplegic veteran or a blind person is assessed at 5 percent of the first $24,000 and 40 percent of the excess, except that the latter percentage is 33-1/3 percent if the property is agricultural. In all the above instances, the lower percentage formerly applied to 33-1/3 percent of the amount stated (i.e., $12,000 and $24,000) because the base was not market value but adjusted market value (see below). Homestead percentages apply to any owner-occupied residence used as a homestead, even if on leased land. The latter type is treated as personal property.
Mobile homes, also classified as personal property, are subject to local assessment and taxation for the first time in 1972. Previously, owners of mobile homes paid a license fee in

lieu of property taxes. Owner-occupied mobile homes can also be homesteads. As such they receive treatment identical with that for realty homesteads (25 percent of the first $12,000, 40 percent of the excess). A mobile home which is not a homestead is assessed at 40 percent of market value for the entire amount.
A new classification for realty emerged in 1969, applicable to housing funded for the elderly and for low- or moderate-income level families under Title I1 of the National Housing Act. This housing is to be assessed, for a period of 15 years from completion, at 20 percent of market value in cities of 10,000 or more, and 5 percent of market value in cities of less than 10,000.
Homestead tax credit. Since 1968, direct property tax relief as well as assessment level classification has influenced the property tax impact on homestead owners or tenants and senior citizens. The homestead property tax credit reduces the property tax levied on real property used as homestead by 35 percent, up to a maximum credit of $250 per year. In 1973, these limits were raised to 45 percent and $325. The exemption does not apply to that part of the levy [averaging about 12 percent) used for paying principal and interest on bonded debt. For agricultural homesteads, any reduction in real property was limited to the first 80 acres, again with a credit maximum of $250. In 1973, the acreage limit was increased to 120 and the percentage to 45.4
Effective after the end of 1973, a property tax credit is available to those 65 and older owning homesteads equal to the increase in tax from the preceding year.
Circuit-breaker tax relief. Senior citizens can get circuit-breaker tax relief on prop- erty tax bills of up to $800 per year, providing their household income does not exceed $5,000, the amount of credit varying with income. The senior citizen credit cannot exceed the amount of property tax due, and the homestead credit is deducted from the gross tax before the senior citizen credit is determined. The senior citizen credit began in 1968, with a household income limit of $3,500 and a property tax liability limit of $300.5 Senior citizen tenants can secure similar circuit-breaker relief. They establish equivalent prop- erty tax liability by taking 20 percent of annual rental paid (exclusive of any charges for utilities, furniture, and services provided by the landlord). Senior citizens may choose be- tween property tax renter relief (7.5 percent of rent payment, $90 maximum credit) or the circuit-breaker income tax credit, but may not receive both.
Preferential treatment of open spaces. In addition to the multiplicity of statutory assessment level classifications, two tax deferment laws have been in effect since 1969. The "Green Acres" law requires that for any land used in agriculture, as homestead or in the same ownership for seven years, the assessor estimate not only the market value but also the value based solely on agricultural use. He must use the latter as assessed value until the property is sold or no longer qualifies under the law, at which time taxes become due on the property, based on the difference between the two values, for the three ter- minal years of eligiblity.
The "Open Space" law, which applies to certain golf, skiing or recreational land, re- quires deferment of taxes due on the difference between use-based value and market value, with deferred taxes payable for the seven terminal years of eligibility after qualify- ing status ends.
Components of the tax base. According to the 1967 Census of Governments [the 1972 Census did not update these figures), Minnesota had 1.35 million parcels of taxable realty. Non-farm residential properties accounted for 52 percent of the total number of parcels, but only 44 percent of total assessed value. Farms and other acreage parcels made up 31 percent of the total number and 27 percent of the total assessed value. Vacant lots added 13 percent of the total number but only 1.2 percent of total assessed value. In contrast, com-

mercial and industrial properties amounted to 5 percent of the total number and 28 percent of total assessed value.
ASSESS1 NG RESPONSIBI LIT1 ES Ten years ago assessing in Minnesota was done by approximately 2,600 assessors at
county or municipal levels. Counties had the option of employing a county assessor or a county supervisor who would supervise township, village, or city assessors, all appointive at the local level. In 1966, the State contained 721 primary assessing areas. These included 70 counties, 218 municipalities, and 433 townships,
The Tax Reform and Relief Act of 1967 required that, effective January 1, 1968, each board of county commissioners must appoint a county assessor (basing the choice on the candidate's knowledge of property taxation), at a salary based on population size. The State Commissioner of Taxation must approve the county board's choice. The county as- sessor, assisted by deputy and local assessors, must assess all property except that as- sessed by the State. A further exception is that any first class city (population 100,000 or more, e.g., Minneapolis, St. Paul, Duluth), or city with 30,000 population or more, may employ a city assessor with the same powers and duties within city boundaries that the county assessor has in the balance of the county.
Action by the respective counties pursuant to the 1967 Act converted officials serving as county supervisors of assessments to county assessors. There a re now 87 county as- sessors, 77 of whom have direct responsibility for all assessments within the county af- fected. Ten city assessors, serving cities of 30,000 or more, have authority commensurate with that of a county assessor. Thus the existing pattern under the new legislation in- cludes 97 primary assessing areas.
Governing bodies of all other local units (townships, villages, cities, boroughs) were required to certify to the Commissioner of Taxation by April 1, 1972, if they wished to retain their local assessors. Failure to certify such intent abolished the office of local assessors as of November 30, 1972. In each such instance the county assessor is to assume responsibility for assessing as of December 1, 1972. The county assessor would also as- sume responsibility in any instance where a vacancy existed and remained unfilled on December 1 following occurence of the vacancy. As of September 1, 1971, Minnesota had 87 county assessors, 10 equally powerful city assessors, and 2,366 smaller a rea asses- sors responsible to county assessors. The smaller area group included 717 city or village assessors (some full time, some part time] and 1,649 township assessors (most of them part time). Certifications of intent to retain 1,894 of the 2,366 smaller area assessors had reached the Commissioner of Taxation by April 1, 1972. All assessors who remain, at all levels, must be certified as qualified before the end of 1974 by the new Board of As- sessors, whether or not they successfully complete prescribed training courses (see be- low). Failure to achieve certification by that time will terminate appointment.
As the 1963 ACIR report indicates,= Minnesota has evidenced a n interest in improving property tax administration for a long time. The State Department of Taxation, usually in cooperation with the university, holds an accredited course annually at the university. There a re also annual regional courses at county and municipal sites. Tuition for assessors attending courses approved by the Commission can be paid from a tuition fund, for which $40,000 was appropriated to cover 1971 and 1972.
In 1965, a Property Appraisal Division was created within the Department of Taxation. The Division exercises general supervision over locally appointed assessors. It investi- gates taxpayer grievances, supplies appraisal expertise to local jurisdictions, develops training materials for assessors, supervises and assists the State Board of Equalization. To help finance county assessment programs, the Division has access to the State re- assessment fund, which was increased from $500,000 to $1,000,000 in 1971. Counties have

two years in which to reimburse the fund for advances required to accomplish reassess- ment.
The Omnibus Tax Act of 1971 created a State Board of Assessors, consisting of seven members appointed by the Governor. Appointees must come from the following groups: two from the Department of Taxation, two from among the county assessors, two from local assessing jurisdictions (one a township assessor), and one from the private appraisal firms.
The Board conducts and reviews training courses, establishes criteria for judging assessors' qualifications, and certifies qualifying county and local assessors. As mentioned earlier, all assessors currently in office must be certified prior to December 1974 in order to remain in their positions. After that time none will be employed unless certified by the Board, subject to an extension to allow a sufficient number of qualified assessors to become available.
ASSESSMENT VARIATIONS
Legal requirements. Statutes provide that all property be valued at market value (auction or forced sale prices a re specifically excluded as criteria of value). Prior to 1971, the practice was to estimate market value and then take 33-1/3 percent of the esti- mate to arrive at what was termed adjusted market value. The latter figure became the basis for application of the assessment level percentage specified for the type of property involved in the lengthy statutory classification schedule discussed earlier. Adjusted market values a re no longer being used, beginning with assessments for 1972. Classification percentages, some revised in recent legislation, will now apply directly to market value itself. The law also requires separate valuation of land and improvements.
State assessment ratio studies. Minnesota's Equalization Aid Review Committee7 (EARC), established in 1951, continues to conduct assessment-sales ratio studies annually, although up to the present they have not been readily available to the public. Nor can they be used as evidence in court in a valuation case, except with regard to school aids. Neither the Commissioner of Taxation nor any of his staff need respond to a subpoena seeking such data. These restrictions became explicit in laws of 1965 and 1967.
In Minnesota, the ratio derived is that of adjusted market value [AMV] to the sale price. The purpose of the studies is to identify differences in local assessment levels which become the basis for compensating adjustments in State equalization aid to school districts. Each of the studies has focused on arms-length transactions over a three-year period. As mentioned above, adjusted market value was intended to be 33-1/3 percent of selling price. In 1971, the percentage ranged from 22 to 35.
In its 1970 study, EARC developed more statistical detail than ever before. For each county and major local area within it, the study included mean, median, and weighted aggregate AMV-sale ratios, as well as an index of regression and coefficients of disper- sion and variation.8 Results were also stratified according to value range. Five types of property were covered: residential, commercial, industrial, farm, and seasonal resi- dential.
Assessment levels and variations. The State's 1970 study showed median ratios, grouped according to value ranges, that varied from 24.6 percent (properties selling for $50,000 and over) to 37.3 percent (properties selling for $5,000 and over). Corresponding spreads were 24.5 percent to 38.4 percent among mean ratios, and 24.4 percent to 37.4 percent among weighted aggregate ratios.
Ratios developed in the Census of Governments for Minnesota differ from EARC ratios. In its studies for the 1962 and 1972 surveys, the Census of Governments compared assessed values with selling prices, in order to maintain conceptual compatibility of Minnesota results with those for other jurisdictions around the country.9

The Census studies show that the ratio of all locally assessed realty in Minnesota jurisdictions sampled increased from 10 percent in 1962, to 11 percent in 1967, but fell to 9 percent in 1972, which was the third lowest in the nation following South Carolina and Montana.
With respect to single-family residences, the intra-area coefficient of dispersion for the median area declined from 34 in the 1962 study to 23 in the 1967 study, but rose to 28 in the 1972 study. (In the 1967 study, 74 percent of the areas sampled showed a coefficient of dispersion between 20 and 40). For the nation as a whole, the coefficient of dispersion for the median area in 1967 was 19, in 1972 i t was 20.
Review and appeal of particular assessments. Action in 1971 made specific in the law the requirement that an assessor notify the taxpayer in writing of any change in assessed valuation. Written notice had not formerly been the practice. The notice must be sent at least ten days prior to the meeting of the local board of review or equalization. It must show the amount of the increase in terms of market value, and it must contain dates, places, and times set for meetings of the local board of review or equalization, and the county board of equalization. The assessor must state on his assessment roll that any required notices have been mailed. If funds available to him locally will be insuf- ficient to pay the costs of such notices, the assessor can secure financial assistance from the Commissioner of Taxation for this purpose.
The assessment calendar was modified by the 1971 legislation to give the county audi- tor more time for spreading the taxes on the roll. This plus written notices makes likely some increase in taxpayer appeals. Initial review in towns and cities is the province of the town or municipal board, except in those cities authorized by charter to have a board of equalization. Effective in 1972,'local boards of review are to meet from May 1 through June 30, rather than June 1 through July 15. County boards of equalization now meet immediately thereafter and can review individual objections as well as equalize entire local rolls. The State Board of Equalization (actually the Commissioner of Taxation) now meets between August 15 and October 15 to equalize assessment rolls among coun- ties, rather than from the second Tuesday in September through November 15. The State Board can increase an individual assessment, within the context of overall equaliza- tion and proper notice to the persons concerned, but it may not decrease an individual assessment below the valuation placed by the county board of equalization.
Any person feeling aggrieved by the assessed value placed on his property may come before the local board of review. A majority of board members present for the hearing can change the assessed value of the property involved in any way deemed necessary. The assessor must be present at each such hearing with his records, but he may not vote. Taxpayer appeal following review by the county board of equalization can be to the State Board of Equalization and then to the District Court of the county in which the tax involved is levied.
'Some of the information on which this report is based was supplied by Wallace 0. Dahl, Minnesota Director of the Research and Planning Division; Ralph Pavek, Appraisal Supervisor; Karen Baker, Peggy Purdy and Louis Plutzer, Minnesota Department of Taxation.
although the initial impact of the 1967 Act was to diminish the importance of the property tax (it had dropped to about 30 percent by 1969-701, sharply increased local rates began to be reflected in relatively higher property tax yields by 1970-71. The 1971 legislation was aimed at again reversing the trend. For summaries of 1971 legislative intent and action, see ACIR, State-Local Finances: Significant Features and Suggested Legislation, 1972 Edition, pp. 6-8; also State Action on Local Problems-1971 (April 1972). p. 20.
3Quoted in report to Governor's Minnesota Property Tax Study Advisory Committee by Rolland F. Hat- field, Director (November 19701, pages 11-13.
4A related credit allows a tenant to deduct 7.5 percent of his rent payment against his State income tax li- ability rather than his property tax, up to a maximum of $90. The credit began at 3.75 percent in 1969 and was in- creased in 1971. Any excess over income tax liability is refundable in cash.

5F0r a more detailed discussion of the development of the Minnesota circuit-breaker, see ACIR, Financing schools and Property Tax Relief -A State Responsibility, (1973), p. 175-187.
eACIR, The Role of the States in Strengthening the Property Tax, Vol. 2 (1963). ?Its three members are the Commissioners of Administration, Education, and Taxation. q h e weighted aggregate ratio is the sum of AMV's divided by the sum of selling prices. The coefficient
of dispersion is the sum of deviations from the median ratio, divided by the median ratio. The coefficient of variation is the standard deviation divided by the mean ratio. The index of regression is the mean ratio divided by the weighted-aggregate ratio.
oThe assessed value used by the U.S. Bureau of the Census is that for county tax purposes. In Minnesota this is the value resulting after application of the statutory percentages.

Montana continued during the past decade to make relatively heavy use of the prop- erty tax. It also maintained its rather unusual system under which various types of prop- erty are legally subject to differential valuation for property tax purposes. In recent years, that system has been used to extend some additional tax preferences, including especially an assessment discount for the owner-occupied homes of limited-income elderly house- holders, assessing of agricultural lands according to current productivity, and adopting freeport legislation. A new constitution, recently approved by the electorate, requires State assessment which in the past was constitutionally assigned to county offices. Conse- quently, property tax administration is presently in a state of rapid change.
FINANCING ROLE OF THE PROPERTY TAX
The State-local revenue structure of Montana-one of the very few States without a general sales tax-involves heavy reliance upon property taxation. For instance, the tax per capita is $235-seventh highest in the nation-compared to the national average of $184. The tax per $1,000 of personal income is $71-second highest in the nation. South Dakota is highest with $76 while the national average is $47. Montana is also one of the few States imposing a general property levy for State government purposes, receiving 44 percent of its own-source revenue from the property tax-fifth highest in the nation. The State receiving the greatest share from the property tax is New Hampshire with 48 per- cent. The national average is 32 percent. Local property tax levies are more important, accounting for about 95 percent of all property tax collections.
In an ACIR study, Measuring the Fiscal Capacity of State and Local Areas, it was esti- mated that Montana's property tax load, relative to capacity, was about 13 percent above the national average; commercial and industrial properties were taxed at 65 percent above the national average-the highest in the nation while non-farm residential properties were 13 percent below the national average and farm properties were 21 percent below the national average. Montana's relative composite effort index for all types of State and local taxes was 7 percent below the U.S. norm. Present changes in property tax laws could possibly change these relationships, but at this early date it is impossible to predict how the changes will effect the role of property taxes in Montana's revenue system.
Some 86 percent of Montana's 992 local governments have property taxing power, and formost of them this is the predominant financing source. Overall in fiscal 1970-71, prop- erty taxes provided more than three-fourths of all the revenue raised that year by Mon- tana local governments.
During the 1960's, per capita property tax yields increased at an average annual rate of 5.5 percent, somewhat outpacing the growth of the State's economy, as measured by per capita personal income. Taxable assessed valuations increased only 3 percent a year, so that there was a considerable rise in official tax rates.
THE PROPERTY TAX BASE
Only half Montana's statewide total of taxable assessed valuations involves locally assessed real estate, a considerably smaller proportion than in most other States. About 30 percent consists of locally assessed personal property, while the balance represents State assessed property-12 percent involving public utilities and 8 percent involving valuations placed on annual mining proceeds.
These proportions reflect taxable assessments after the application of various legally specified fractions to true and full value. Under Montana's rather complex classified property provisions, such fractions range from 100 percent to 7 percent. For example:

Class Percent
Net proceeds of mines and mining claims; Household goods and apparel, automobiles, tools and property of cor-
porations; Livestock, poultry, and stocks of merchandise and fixtures; Lots and improvements, mobile homes, and manufacturing and mining
equipment; Money and credits and homesteads of totally disabled veterans; New industrial property during first three years, and air pollution con-
trol equipment; Improvements on real property and equipment, mobile homes not over
$17,000 owned by pensioners and certain widows and widowers; All property not included in one of the classifications or explicitly
exempt.
No doubt because of this long standing system for differential valuation, property tax preferences operate here mainly through the statutory placement of various kinds of property in particular fractional classes, rather than through the kind of partial exemp- tions often found elsewhere. For example, during the past decade, new preferences were provided for owner-occupied residences of wholly disabled veterans (and their widows) by providing for their tax valuation at 7 percent instead of the previously applicable 30 percent; and freeport merchandise (now legally exempt), which was subject to as- sessment at 1 percent, and before that 33-1/3 percent. More important, a substantial valuation discount was also recently enacted for owner-occupied homes of low-income elderly persons, whereby the improvement value part of such residences is to be assessed at 15 percent of its full value, rather than at the 30 percent fraction which would other- wise apply. In 1973, unprocessed perishable foods were moved from Class 5 to complete exemption.
Political pressures in Montana required adoption of statutes similar to those adopted in other States. For instance Chapter 519 of the Supplementary Session Laws of 1973 pro- vided for the special assessment of agricultural lands according to their productive capa- city rather than values attributable to urban or speculative influences. To qualify, land must:
1) be actively devoted to agriculture, 2) not be less than five contiguous acres, and 3) must produce at least 15 percent of the owner's annual gross income.
Application for special assessment must be filed with the county assessor before October 1. If the land is taken out of farming a rollback tax is assessed which amounts to the tax saving on the land not to exceed four years.
The 1967 Census of Governments, the latest available data as the figures were not updated in the 1972 Census, reported some 351,000 parcels of taxable realty in Montana. Of these, 41 percent were non-farm residential properties, and 43 percent were acreage or farm properties. Although far less numerous (4 percent), business properties accounted for about 23 percent of the statewide total of locally set taxable real estate valuations, with non-farm residential property contributing 42 percent and rural real estate 34 percent of that aggregate.
ASSESSING RESPONSIBILITIES
Montana had a three-member State Board of Equalization, appointed by the Gover- nor. In 1971, legislation was enacted which provides for a Department of Revenue, headed by the Board but with a Director of Revenue who serves as the chief administrative offi-

cer of the Department under the direction of the Board. The Department administers various State imposed taxes, and mainly through a Property Tax Division, assesses public utilities and mine proceeds for property taxation and exercises supervision over local assessment work. The budget of the Property Tax Division has grown considerably during the past decade, and its present staff of 11 is nearly twice that of ten years earlier. How- ever, its total appropriation of $205,000 for fiscal 1972 equals only about one-eight of l percent of the statewide total of property tax revenue. In 1973, the State Board of Equali- zation was abolished, with the Department of Revenue becoming the sole tax administra- tion agency.
Each of Montana's 56 counties was served by an elected assessor, an office provided for in the pre-1972 constitution. None of these areas has as many as 100,000 inhabitants, and only three have more than 50,000. Twenty-one of the 56 counties have populations of less than 5,000, and another 15 have 5,000 to 10,000 inhabitants. It may also be noted that 40 Montana counties experienced some population loss between 1960 and 1970.
A new State constitution approved by the voters in 1972, to become effective July 1, 1973, requires the following:
Section 3. Property tax administration. -The State shall appraise, assess, and equalize the valuation of all property which is to be taxed in the manner provided by law.
Section 4. Equal valuation.-All taxing jurisdictions shall use the assessed valuation of property established by the State.
Section 5. Property tax exemptions. -
1. The legislature may exempt from taxation:
a) property of the United States, the State, counties, cities, towns, school districts, municipal corporations, and public libraries, but any private interest in such property may be taxed separately;
b) institutions of purely public charity, hospitals and places of burial not used or held for private or corporate profit, places for actual religious worship, and property used exclusively for educational purposes;
c) any other classes of property.
2. The legislature may authorize creation of special improvement districts for capital improvements and the maintenance thereof. It may authorize the assess- ment of charges for ~ u c h improvements and maintenance against tax exempt property directly benefited thereby.
Section 7. Tax appeals. -The legislature shall provide independent appeal proce- dures for taxpayer grievances about appraisals, assessments, equalization, and taxes.
The legislature shall include a review procedure at the local government unit level. These sections of the new constitution remove previous obstacles to legislation providing for the increased (or complete] centralization of basic assessing responsibilities at the State level.
State supervision of and assistance to local assessors. The previous ACIR property tax study described Montana's earlier efforts which were maintained and somewhat ex- panded. Assistance to local authorities in classifying and appraising property was pro- vided through seven trained appraisers, including one concerned mainly with land classi- fication and another with classifying and valuing timber lands. The Board participated in the annual meeting of the County Assessors Association and conducted an annual apprais-

a1 school in cooperation with the Bureau of Business and Economic Research and the School of Business Administration of Montana State University.
Changes in the laws of Montana passed in 1973 established the Department of Rev- enue as the property tax administrative agency for the State. County assessors a re desig- nated agents of the Department for locating and describing all property within the county, but the appraising will be done by the Department. Land and improvements will be sep- arately assessed. The application of the percentages to the various classes of property will be done by the Department. To finance the State administration, three mills is added to the State tax levy for 1973 and 1974.
ASSESSMENT VARIATIONS
As previously noted, Montana statutes call for the property tax assessment of most taxable real estate at 30 percent of its true and full value. In actual practice, however, locally recorded amounts typically reflected the usual phenomenon of fractional assess- ment, so that the final "taxable values" averaged less than one-tenth of market value. The Board of Equalization has sought by regulation (upheld in various court cases) to achieve a 40 percent ratio of taxable to market value (i.e., [0.4]x[0.3]=0.12). However, Census of Governments findings for 1957, 1962, 1967, and 1972 suggest that these efforts have not been entirely successful, for overall statewide ratios for taxable reality of less than 9 percent were estimated for each of those years; for 1972, the ratio declined to 8 percent, the second lowest ratio in the nation (South Carolina is 4 percent). This downward drift, at least for rural property can be explained as follows: the State's taxable valuations for farm land rose only 1 percent, although the U.S. Department of Agriculture estimated a 21 percent rise during the 1966-70 interval.
The State Board of Equalization had been successful in efforts to obtain enactment of a real estate transfer tax, which would aid it in attempting to measure assessment levels and variations. It had nevertheless developed a regular though limited program of this nature. The results a re not published, but a re shared with local assessors and equalization bodies. (As in other sparsely populated States, the relative paucity of real estate transfers tends to limit the usefulness of assessment ratio studies based solely on sales. The 1967 Census of Governments indicated for the entire State only about 4,200 measurable sales of ordinary real estate for a six-month period, of which fewer than 800 involved rural properties.)
Partly because of its restricted sample coverage, the periodic Census of Governments has provided only limited evidence about the variation of assessment levels in this State. However, the available data suggest a considerable degree of intra-area variation. In only six of the 20 Montana counties did the 1962 Census report a dispersion coefficient for assessments of single-family houses of less than 20 percent; and in only four of the ten Montana counties for which the 1967 Census gave such data was this standard of perform- ance indicated. For the State as a whole, the 1967 coefficient of dispersion was 23 percent. By the 1972 Census, this figure increased to 24 percent, compared to the national average of 20.
Unlike numerous other States, Montana does not provide for adjustment of equal- izing grants for local schools to take account of inter-area differences in assessment level. In its 24th Biennial Report, dated December 9, 1970, the Board of Equalization commented on this matter as follows:
The incentive for underassessment by counties created by the school foundation pro- gram could be eliminated by basing State school foundation payments on values determined by the State Board of Equalization, rather than upon taxable values determined by county officials. . . . Implementation of such a law would require much expansion of the State's sales-assessment ratio studies and appraisal program. Up-

grading of local assessment by professionalizing the county assessment function would still be needed.
Review and appeal of particular assessments. As in numerous other States each county board of commissioners serves ex-officio as a board of equalization to deal in the first instance with assessment appeals. The new constitutional provisions, however, open the way to basic revision of the appeals procedures. Now the taxpayer has the right to appeal the percentage assignments of the Department of Revenue to the county tax appeals board, the same as he now has on valuations. Further appeal is to the newly created (1973) State Tax Appeal Board whose findings are final except for the right of review in the proper court. Previously, equalization had been the responsibility of the State Board of Equalization which had the power to supervise the assessment and assessors as well as being part of the equalization process.
Availability of property tax data. The biennial report of the State Board of Equaliza- tion included data by county on taxable assessed valuations for various property classes, as well as figures on amounts and rates of property taxes levied for the several types of local governments in each county.
The Department of Revenue is now required to show each property owner the per- centage class and taxable value it assigns to each piece of property when it makes its assessments.
'Some of the informstion in this report was provided by J. Morley Cooper, Chairman, Montana Board of Equalization.

NEW JERSEY1 New Jersey's tradition of very heavy reliance on property taxation has continued
during the past decade. Although it has materially reduced its taxation of business owned personal property, New Jersey still ranks high among the States in effective property tax rates for real estate.
Court rulings and resultant legislation in the early 1960's led to a widespread major increase in prevailing assessment levels, and in much of the State, taxable realty is now being valued at 75 percent or more of its market worth. New Jersey's highly decentralized arrangements for local assessment have substantially continued, but the State's property tax role has been broadened in several ways, including a statutory provision for State examination and certification ~f local assessors and State approval for reassessment con- tracts. Extensive regular assessment-sales ratio studies have continued to contribute to efforts toward more efficient and equitable property valuation. Although the study find- ings show that some assessing jurisdictions in the State still fall short of standards of assessment uniformity which have been established as a goal, there has been widespread improvement.
FINANCING ROLE OF THE PROPERTY TAX
By any of various standards of comparison-property taxes per capita, in relation to personal income, as a proportion of all State-local tax revenue, or in relation to estimates of property tax capacity-New Jersey consistently appears at or near the top of State rankings. For instance, in fiscal 1970-71, the property tax burden per capita was $273- third highest in the nation, following California and Massachusetts. The nation's average was $184. On a per $1,000 of personal income the burden was somewhat lower with New Jersey ranking ninth with $60; the nation's average being $47.
In fiscal 1970-71, property taxes accounted for 46 percent of all the general revenue raised by the State and local governments, a proportion half again higher than the national average of 32 percent, and exceeding the property tax share in every State except New Hampshire. New Jersey's property taxes represented 55 percent of all State and local taxes as compared to a national average of 40 percent.
During the 1960's, per capita property tax revenue in New Jersey increased at an aver- age annual rate of 6.1 percent, and thus outpaced the 5 percent growth rate of the State's economy as measured by per capita personal income. Other State-local revenue sources were going up even more rapidly, however, so that there was some diminution-from 55 to 46 percent -in the property tax share.
In an ACIR study, Measuring the Fiscal Capacity and Effort of State and Local Areas, it was estimated that New Jersey's overall property tax load, relative to its capacity, was 37 percent above the national average, 76 percent above for both non-farm residential and farm properties, but 9 percent below for commercial and industrial properties. The State's effort index for all State and local taxes, however, was a little below (3 percent) the U.S. norm.z By law, however, New Jersey's property tax base is considerably narrower than that of the average State. For instance, public utilities were taxed mainly through other kinds of levies, rather than by property taxes. Hence, the property tax load for real estate is higher than the aggregate index for property taxation might suggest.
This heavy reliance on the property tax is related to the relatively limited financial role of the New Jersey State government, reflecting its lack of a general personal income tax.3 In fiscal 1970-71, only 41 percent of all State-local tax revenue was provided by State imposed levies, as compared with a national average of 54 percent. No other State showed a lower proportion than New Jersey. (New Hampshire had the same proportion.)

Some 1,238 of the 1,456 local governments in New Jersey have property taxing power, and for most of them this is a primary financing source. Of all general revenue raised in fiscal 1970-71 by New Jersey local governments, 78 percent was from property taxes, con- siderably above the average U.S. proportion of 64 percent. The property tax part of all local general revenue (including intergovernmental receipts) was 56 percent in New Jersey, as compared with 40 percent for the nation as a whole.
THE PROPERTY TAX BASE
Local general property taxes account for 97 percent of all New Jersey property tax revenue; the balance represents the yield of uniform special rate State levies upon certain railroad property, bank shares, and the equipment of non-utility businesses.
Partly because of those special State property taxes, the base for local general prop- erty taxation consists nearly entirely of real estate. However, 2 percent of the statewide total consists of the personal property (other than inventories) of telephone, telegraph and messenger system companies. Such property is subject to local assessment at one- half of its original cost and is taxed at the local general property tax rates.
These proportions reflect a considerable change from a decade earlier (before cer- tain enactments discussed below) when locally assessed realty contributed 87 percent of the general property tax base, locally assessed personal property 1 2 percent, and State set valuations for certain railroad property 1.6 percent.
The State's data indicate that New Jersey's general property tax rests 60 percent upon residential real estate, 35 percent upon business real estate and personal property of tele- phone and telegraph companies, and 5 percent upon farms and vacant land. The busi- ness portion includes 7 percent of the overall total for apartments of four or more units. If this is counted with other residential realty, the residential share is 67 percent of all local general property taxes, and the other business portion 28 percent.
Besides substantially excluding personalty from local property taxation, New Jersey provides for the usual complete exemptions of the property holdings of governments, churches, educational and charitable bodies, etc. An intensive and detailed inventory of such property was made in 1971. The results, as summarized by the Division of Taxation, identified 92,147 parcels of such tax exempt realty: having an estimated value of $9.9 billion or nearly one-fourth as much as the assessed value of all taxable realty. Govern- mental holdings made up three-fourths of these exempt property values, with a major part of the balance accounted for by holdings of religious organizations.
Major curtailments of the general property tax base. Several 1966 enactments ex- empted from local property taxation certain railroad property and nearly all business personalty except for non-inventory holdings of telephone and telegraph companies, and a complete property tax exemption for business inventories. However, statewide levies were imposed on the locally exempt railroad property and (at an effective rate of 0.65 percent) on the original cost of non-inventory personal property of businesses other than public utilities. To compensate for the resulting local revenue losses, the State is providing reimbursements to respective taxing jurisdictions. Total 1972 appropriations for both sets of State in lieu payments amounted to $115 million. This is equal to about 5 percent of all local property tax revenue.
The Director of the State Division of Taxation has observed that, with non-inventory personalty now taxed at a considerably lower rate than business realty, ". . . it has become increasingly important that firm distinctions must be made between real property and personal property. It is becoming increasingly clear that remedial legislation is necessary. Basically, the question concerns whether the traditional law of fixtures should apply or whether legislation should establish guidelines similar to those in use in Ohio wherein

property, although affixed to the realty, if used in pursuance of the business would be regarded as personal property."
Tax preference for veterans and the elderly. Pursuant to constitutional amendments adopted in 1963, the legislature enacted new tax relief provisions for veterans and limited- income elderly householders. Previously, certain veterans and veterans' widows were exempt from tax on up to $500 of assessed value of their property holdings. The new law substituted a dollar tax deduction of up to $50 annually. In 1971, deductions under this provision were granted to 440,000 persons, a total sum of $22 million or 1.7 percent of all taxes on real estate. The homestead of the totally disabled veteran with income less than $5,000 is totally exempt from property taxation.
The 1963 law similarly eliminated the exemption previously available on up to $800 of assessed value of the owner-occupied residence of a householder aged 65 or over who had less than $5,000 annual income. Under the new provision, as subsequently amended, instead of an exemption a specific tax deduction is allowed: up to $160 of annual property tax on the domicile of such a limited-income householder. Beginning in 1971 (when the dollar limit was raised from $80 to $160, and the income limitation was modified to ex- clude Social Security benefits and in 1972 to exclude benefits from other Federal pro- grams and State pensions or disability payments for people not covered by Social Se- curity), the State undertook to finance half the cost involved to local governments. Such allowances in 1971 altogether amounted to $24.4 million, or about 1.9 percent of statewide property taxes on real estate.
Housing projects for the elderly are totally exempt for the first 50 years.
Preferential treatment of open spaces. In 1964, New Jersey (like numerous other States during the 1960's) enacted provisions under which farm land grossing a minimum of $500 in sales and over five acres in size is, upon application by the owner, to be assessed according to its value for such use. The law provides for a partial recapture of benefits thus conferred; when a change is made to non-farm use, the owner is liable for the addi- tional tax that would have been paid under normal assessing for the year of change and the two preceding years. A 1973 amendment allows a farm of less than five acres to be assessed at the preferential rate if it grosses over $500 in sales. Land over five acres must receive a gross of $5.00 per acre. The minimum for woodlands and wetlands is $0.50 per acre.
Components of the tax base. In the 1967 Census report, New Jersey had 2.1 million parcels of taxable real estate. Of this number, 72 percent were residential properties. Although commercial and industrial real estate accounted for 24 percent of all real estate assessed values, it involved only 6 percent of the number of parcels of taxable realty. Farms and vacant land accounted for 23 percent of the number of taxable parcels but only 6 percent of the total assessed value.
ASSESS1 NG RESPONSIBI LIT1 ES
As was the case a decade ago, the assessing function in New Jersey is shared by State and local governments. However, there has been a material shift in their respective roles, since most business personal property which previously was subject to local assessment and taxation has been removed from the general property tax base and is now dealt with directly by the Division of Taxation of the State Department of the Treasury, and certain railroad property which formerly was also subject to local levies (though according to State set valuations) is now taxed only by the State at a uniform statewide rate.
Accordingly, local assessors now have the initial responsibility for valuing all prop- erty subject to local levies but their assignment has been narrowed to eliminate concern for any kind of personal property except the non-inventory holdings of telephone and

telegraph companies. Their efforts are backed by information, assistance and supervision provided by the Local Property Tax Bureau of the State Division of Taxation. The Bureau has a staff of 65, which is a few less than its complement of a decade ago. Its 1972 budget of $1 million amounts to less than 0.05 percent of statewide general property tax revenues.
Although New Jersey is one of the most urbanized States in the nation, it has an extremely decentralized arrangement for local property tax assessment. This responsibil- ity is mainly assigned to 567 jurisdictions, of which three-fifths are incorporated cities, towns, boroughs, and villages, and the rest are townships. The entire group includes only six areas with populations over 100,000 (together accounting for less than one-sixth of the State's population), and another 14 with 50,000 to 100,000 inhabitants each. At the other extreme are nearly 250 assessing jurisdictions of less than 5,000, as well as about 120 with only 5,000 to 10,000 inhabitants each.4
Most of these offices are headed by a single assessor, but about 150 of them (includ- ing a majority of the more populous cities) have an appointive three-member board of assessors. Altogether in 1971 there were 867 local assessors of whom 280 had been elected in single assessor jurisdictions and the balance had been appointed in other jurisdictions. (General law ~ rov ide s for the election of the assessor by townships and cities of certain classes but by local option the office can be filled by appointment.)
In each of New Jersey's 21 counties the primary assessing areas are supplemented by a county board of taxation. These are appointive three-member bodies (except in the most populous counties where the boards have five members). The Governor designates their membership with the advice and consent of the State Senate. Salaries of the board mem- bers are paid by the State at rates depending on the population of the county. Local assessors file their assessment rolls with the county boards, who are responsible for examining, revising, and correcting the rolls and for equalizing assessments among the several areas within each county.
In 1967, there were two enactments having an important potential impact on local assessment administration. One law required all local assessors, whether elected or ap- pointed, to be certified by the Director of the State Division of Taxation, with certifica- tion to be contingent (except as to incumbent assessors who completed certain designated training courses) upon a specified background and successful completion of an examina- tion given by the Division of Taxation. The law also provided greater tenure for certified assessors generally providing that after four years of service they should be subject to removal "only for good cause" and after a hearing by the Division. The law also author- ized the Division of Taxation to revoke or suspend the certification of a local assessor for cause, subject to hearing after notice.
Of the 1972 total of 860 local assessors, 519 held State certificates issued under these provisions. Altogether 819 certificates have been issued since inception of this program. According to the Director of the Division of Taxation, "It is believed that this new legisla- tion places New Jersey in a prominent position among States with established profes- sional qualifications for assessors coupled with greater tenure security. After five years of experience, we believe that this new law has provided a stimulus to improved compe- tence in this important area of tax administration."
Another 1967 law provided authority for any two or more presently assessing juris- dictions within a county to provide for a joint tax assessor. Thus far only a few jurisdic- tions have taken such action.
The ACIR report of a decade ago, The Role of the States in Strengthening the Property Tax, included a detailed discussion (see Vol. 2, pp. 101-105) of the duties and activities of the Local Property Tax Bureau of the New Jersey Division of Taxation.
As was then pointed out, "emphasis on complete revaluation by private appraisal firms is a notable part of the State's program" to promote uniform local assessment. Such

emphasis has continued during the past decade, and a 1971 enactment has strengthened the State's supervisory role in this connection. The law authorizes the Director of the Divi- sion of Taxation to establish standards and qualifications within New Jersey and requires his approval of all contracts made with such firms by local assessing agencies for the re- valuation of taxable properties. As previously noted, recent legislation has also con- siderably enhanced the role of the Division of Taxation by providing for its examination and certification of local assessors.
ASSESSMENT VARIATIONS
Legal requirements. A series of court decisions in the 1950's led to adoption of the present statutory provisions-which became fully applicable in 1964-as to the level of local property tax assessments. These authorize each county board of taxation to specify the fraction of true value which is to be applied throughout the county to assessments of taxable property at any ten point interval from 20 to 100. If a county board fails to take such action, the applicable fraction is to be 50 percent. (For certain farm property as pre- viously noted true value is legally subject to unique determination.)
State assessment ratio studies. One of the most important activities of the Local Prop- erty Tax Bureau since its establishment in 1953 has been the annual conduct of a statewide survey on the relation of assessed value to market value of taxable realty as indicated by measurable arms length sales. Since 1968, this operation has benefited by information available under the realty transfer tax enacted that year. The survey covers all usable transfers but involves no supplementation by appraisals. To compensate for the paucity of measurable sales in numerous small jurisdictions each year's assessment ratio findings are based on two year's transfers. New Jersey's laws provide for "line item" appeal by local taxing jurisdictions-i.e. taxing districts may appeal the inclusion or exclusion of any example sale used in their respective assessment ratio calculations.
Assessment levels and variations. The litigation and enactments of the early 1960's led to a widespread drastic increase in prevailing assessment levels. The periodic Censvs of Governments indicated more than a doubling of the statewide average assessment ratio for taxable realty as measured by measurable sales from 29 percent for 1961 assessments to 61 in 1966. The 1971 assessment ratio was 60 percent. This increase from 1961 to 1966 followed action taken by most county boards of taxation and assessors in the respective counties to apply considerably higher valuation levels than had previously prevailed. However, such action has not been universal nor has assessment practice always met the ostensible target levels. The most recent Annual Report of the State Division of Taxation shows a statewide average assessment ratio of 68 percent as calculated from measurable sales of taxable realty and corresponding average ratios for individual counties ranging from 38 to 94 percent. In this presentation 15 of the county averages are clustered around 80 percent, but six counties show average ratios of less than 50 percent (i.e. from 38 to 45 percent).
The published tabulation also reflects material differences of average assessment ratio among the assessing areas of some counties. The importance of such differences is considerably limited by various adjustments involving countywide taxes, State grants to local governments, and local debt limits. It is far more significant that the sales ratio study shows significant variations of assessment levels for particular properties within most local assessing (and taxing) jurisdictions.
To obtain detailed information on this subject, special tabulations were prepared for the previously cited study of the New Jersey Tax Policy Committee, based on measured realty transfers of the years 1967 through 1970. Statewide averages of intra-area coeffi- cients of variation were reported for four property classes. For the most homogenous

class, involving residential property other than apartments, the average coefficient of variation in each of these years was over 20 percent. (The 1972 Census records an intra- area coefficient of dispersion at 15 with the national average at 20 percent.) Still greater variation appeared for the other property classes. Of the 522 local jurisdictions for which corresponding coefficients could be calculated for 1970 assessments of residential prop- erty, only two-fifths were below the 20 percent level, about a third were between 20 and 30 percent, and more than one-fourth were above 30 percent. Available data indicated even higher statistics for other classes of taxable realty. For example, of the 161 areas where the variation of 1970 assessment ratios of business realty could be measured, nearly half showed a coefficient of variation of at least 30 percent. The study also found a wide- spread regressiveness of assessment levels-i.e. a tendency for high value properties to be assessed at a lower proportion of their market worth than less valuable properties of a similar type. For residential property, this tendency appeared in two-thirds of the local areas subject to analysis.
REVIEW AND APPEAL OF PARTICULAR ASSESSMENTS
Since the landmark 1971 decision of the New Jersey Supreme Court (Kent 2124 Atlan- tic Avenue, 34 N.J. 211, assessment ratio findings from the recurrent State studies have frequently been cited in individual taxpayer appeals and the admissibility of the data as evidence has been upheld in various court rulings.
There has been no major statutory change during the past decade in New Jersey's arrangement for tax appeals. As reported in the ACIR study of a decade ago, assessments can initially be appealed to county boards of taxation, and from there to the Division of Tax Appeals, an appointive seven-member body which is located within the New Jersey Department of the Treasury, but completely separate from the Division of Taxation in that Department. A 1973 act allows the Division of Taxation to prescribe regulations and procedures governing the county boards of taxation. The recent report of the New Jersey Tax Policy Committee recommended that administrative duties of the county boards of taxation be eliminated by statute, so that they would operate solely as appeal bodies. It also proposed legislation for a "simplified appeals procedure in which established assess- ment ratios may be used as conclusive evidence." The Committee suggested that "a proven deviation of 10 percent or more from the county ratio should be substantial evidence of an incorrect assessment."
1Part of this report is based upon information provided by Sidney Glaser, Director of the New Jersey Divi- sion of Taxation.
T h e same report estimated that by two years later, New jersey's composite index had moved up to exactly the U.S. average.
3Recommendations for a considerable increase in the State's financing role, involving new tax enactments and other changes, including the central assumption of some financing responsihilities now assigned to local governments, appear in a detailed Report of the New jersey Tax Policy Committee, submitted to the Governor early in 1972. In this report, it was estimated that the statewide effective rate for local government property taxation was 3.61 percent in 1971, with some areas having materially higher effective rates than this.
'The report cited in the preceding footnote proposed that the State replace the present local pattern by a set of assessing areas (to be recommended by the State Division of Taxation) of which each would be large enough "to justify the employment of at least one full-time professionally qualified assessor," and would be headed by an assessor appointed by the State Director of Taxation, from a list of persons found qualified by State exami- nation and certification.

NEW YORKi New York's property tax arrangements still exhibit many of the characteristics de-
scribed in an ACIR report of a decade ago.' These include: a highly decentralized pattern of local assessing jurisdictions, most of which are sparsely populated; a long-established State agency concerned with property tax matters which carries on a large-scale program to measure relative local assessment levels; marked geographic differences in assessment levels; and relatively heavy reliance on property taxation particularly for local govern- ment financing. Developments of the past decade have included a number of minor statu- tory changes that affect the scope of the property tax base. More significant was the enact- ment in 1970 of a law designed to improve the quality of local assessment work, including provisions:
1) for a "real property tax service agency" in each county with subcounty primary assessing areas,
2) for the preparation of tax maps in every county,
3) for increased local selection of assessors by appointment rather than election,
4) for increased State training of local assessors and property appraisers, and
5) for appointive independent local boards of review to consider assessment appeals.
The State's statistical findings on relative local assessment levels are relied upon for many important applications, but this measurement effort is vastly complicated by the large number of local areas for which it is expected to provide accurate data. Assessed valua- tions have generally lagged far behind recent trends in market value of taxable realty, so that the statewide average assessment fraction is now about 29 percent [as measured by the U.S. Bureau of the Census) as compared with more than 60 percent 20 years ago.
FINANCING ROLE OF THE PROPERTY TAX
Although New York's State-local revenue structure involves heavy reliance on sales and income taxes, the property tax is still the major tax source. In fiscal 1970-71, property taxes-nearly entirely from local general levies-accounted for 32 percent of all the gen- eral revenue raised by the State and local governments, the same as the national aver- age. In an ACIR study, Measuring the Fiscal Capacity of State and Local Areas, it was estimated that New York's statewide property tax load, relative to its capacity as defined according to the national average use of property taxation, was 25 percent above the national average; only seven other States showed a higher statistic. Farm property is taxed at 160 percent of the national average; only six States have higher statistics. For all State and local taxes, New York has the highest relative tax effort for all States, 38 percent above the national average.
During the 1960's, per capita property tax revenue in New York State rose 6.1 percent a year, reaching $259 in 1970-71, the fifth highest State in the nation. Growth in this area is outpacing the 5.4 percent growth rate of per capita personal income. Per $1,000 of per- sonal income, the State tax burden was $55, significantly above the national average of $47. As in other States, however, non-property tax revenue has been growing even faster, so that the property tax share of State-local tax revenue has been diminishing.
Nearly all (99.7 percent) of New York's 3,306 local governments (as defined by the U.S. Bureau of the Census for 1971) have property taxing power, and for most of them this is the primary local financing source. Property taxes accounted in fiscal 1970-71 for 60 per-

cent of all own-source general revenue raised by local governments, but for upstate New York-i.e., excluding New York City-the property taxes were approximately 75 percent of general revenue. (The corresponding nationwide proportion was 64 percent.)
THE PROPERTY TAX BASE
In New York (as also in Delaware, Hawaii, and Pennsylvania) the legal base for gen- eral property taxes completely excludes tangible and intangible personal property. It con- sists almost entirely of locally assessed real property, which in 1971 accounted for nearly 96 percent of the statewide total of taxable assessed valuations. The remainder of the tax base involves certain non-railroad utility valuations which are determined by the State and (as adjusted to conform to estimated local assessment levels) are geographically allo- cated for local property tax levies.
The 1967 Census of Governments (these figures were not updated in the 1972 Census) identified about 4.1 million parcels of real estate on New York's local assessment rolls. Seventy percent of these were non-farm residential properties, which accounted for 58 percent of the statewide total of local realty valuations. (Single-family houses alone were 56 percent of all the parcels but represented only 25 percent of all local assessed values.) Acreage and farm properties were about one-twelfth of all the assessed parcels of realty; vacant lots were a somewhat larger proportion. Commercial and industrial properties, though only 6 percent of all listed real estate parcels, made up nearly 38 percent of state- wide realty valuations.3
New York's laws provide for the usual complete exemptions of property holdings of governments, churches, and educational and charitable organizations. Assessed valua- tions for such property in 1971 amounted to $23.4 billion, or about 40 percent as much as the aggregate for all taxable property. Over three-fifths of these wholly exempt values involved governmental holdings (other than for public schools); educational holdings, including those for public schools, made up 24 percent. Property of religious bodies rep- resented 6 percent of the total, with miscellaneous kinds of other exempt holdings making up the remaining 8 percent.
The property tax base is somewhat curtailed (about 5 percent in 1971) by partial , exemptions granted for certain realty. Over half the statewide amount involved is for limited-income housing developments, about one-seventh involves authorized benefits for financially distressed commuter railroads, and the balance includes partial exemp- tions for elderly householders, veterans, and various other property owners.
Residential exemptions. Up to June 1968, cities were authorized to exempt from the property tax base part of the increase in value resulting from improvements made in sub- standard multi-family residential property. Such provisions now cover local actions taken until mid-June 1972, and improvements made up to the end of 1974. Numerous adjustments also have been made in earlier provisions providing or authorizing assessment pref- ences for limited-income and non-profit housing developments.
Agricultural and horticultural structures. A 1968 law required assessors to exempt for five years, upon the filing of a satisfactory claim, increases in assessed value attrib- utable to newly constructed or reconstructed "structures and buildings essential to the operation of lands actively devoted to agricultural use" and actually so used.
Agricultural land. A 1971 law provides for preferential assessment of agricultural lands located in an agricultural district established by county or State initiative or com- mitted to continued agricultural production, provided the agricultural land comprises ten or more acres and the owner can establish gross sales of agricultural products of $10,000 or more. The State Board establishes average value per acre of various classes of agricul- tural land which, when equalized, serve as a ceiling for the assessment of qualified par-

cels, regardless of market value (which reflects highest and best use). Conversion to non- agricultural use results in the recapture of taxes which would have been due for a limited period. Where districts are established by State initiative, the State will pay one-half of the taxes on the exempt portion. The 1971 law was subsequently amended to postpone the effective date of the preferential assessments to 1973.
Pollution abatement facilities. Under a 1965 law, exemption was granted for the as- sessed value of any State mandated industrial waste treatment facilities installed prior to March 31, 1972. A 1966 law authorized local governments, by local law or resolution, to exempt the taxable value resulting from State certificated facilities for control of air pollution.
Property of non-profit organizations. Running counter to the usual trend for addi- tional or increased property tax preferences, a 1971 enactment authorized local govern- ments to eliminate property tax exemptions that were formerly required for certain types of non-profit organizations (or to impose in lieu service charges on such organizations). The scope of such mandatory exemptions was limited to property used exclusively for religious, charitable, hospital, education, and cemetery purposes, and also for the purpose of moral and mental development of individuals.
Low-income elderly homeowners. Under a 1966 law, as later amended, local govern- ments may reduce by one-half the property tax normally due on the owner-occupied residence of a person aged 65 or over who has annual household income of not over $3,000-or up to $6,000 if the local law so provides. It may be noted that this locally op- tional tax preference-unlike the long-standing and financially much more significant tax preference mandated for certain property holdings of veterans-is not directly influenced by the local assessment level.
Veterans. A 1973 amendment exempts property up to $5,000 in value for veferans and up to $22,500 for the disabled veteran on property purchased from Federal funds (pension, bonuses, insurance, refunds, etc.) or from funds granted by the State.
ASSESS1 NG RESPONSIBILITIES
In New York, the task of property valuation is vested mainly in local agencies but important related duties are assigned to the State Board of Equalization and Assessment, a quasi-independent agency in the Office of Local Government in the Executive Depart- ment.4 The Board is composed of the Commissioner for Local Government and four other members appointed by the Governor with the consent of the Senate. An Executive Direc- tor supervises the Board's operating functions, which include the determination of certain public utility valuations, the establishment of equalization rates designed to reflect the level of realty assessments in various local areas, and the rendering of supervision and assistance to local assessing agencies.
The ACIR report of a decade ago included a relatively detailed description of the State Board's activities. The Board has traditionally emphasized its advisory relationship to local assessing agencies, rather than placing strong emphasis on detailed control or supervision. Its substantial statutory powers and responsibilities were materially en- hanced by the 1970 "assessment equality" measure mentioned above. However, that law dealt almost entirely with upstate New York, and apparently did not contemplate any ex- pansion of the Board's historically rather limited concern for assessment operations of New York City.
The Board has 274 employees (as of May 1972), nearly double its complement of a decade earlier. Its fiscal 1972-73 appropriation of $5.3 million was about one-fourth more than the resources available that year for property tax work of the California State Board

of Equalization, the only other State agency that approaches this scale of financing. The New York Board's appropriation, however, equals only about one-ninth of 1 percent of statewide property tax revenue.
There has been little change since 1962 in the number of primary local assessing juris- dictions in New York State. They number 982 altogether, including two counties, 61 cities, and 919 towns. The latter, despite their designation, are not typically areas of concen- trated population, but correspond geographically to units known as townships in most other States with similar local governments. More than half of New York's population resides in two of these areas-New York City and Nassau County-and another 7 percent live in the five additional cities of at least 100,000. Thus, seven major assessing jurisdic- tions serve three-fifths of the State's population, while the other 975 jurisdictions operate for the remaining two-fifths of the population. Many of these areas have fewer than 1,000 residents, over half of them fewer than 5,000, and about four-fifths of them fewer than 10,000. The great majority are thus obviously far too small to afford full-time profes- sionalized assessing operations.
In May 1970, the legislature adopted an "Assessment Equality Bill" which included numerous features designed to curtail problems inherent in this highly decentralized and largely part-time assessing arrangement. This measure was described in a publication of the State Board of Equalization and Assessment as "the first major change in the adminis- tration of the real property tax in New York State in over 50 years." Two features of the measure are especially pertinent to local assessment organization. (Certain other fea- tures are more fully discussed later.)
The law specified that, by October 1, 1971, the governing body of each city and town subject to this provision (i.e., excluding New York and the five other cities of over 100,000) should appoint as its assessor a person meeting minimum qualifications established by the State, to serve initially for a six-year term. In order to continue in office, each appointed assessor must complete a series of training courses conducted by the State during the first year of his term. However, the measure also authorized any such unit having three elected assessors to continue the popular election arrangement for filling this office by resolution of its governing body, if approved by a local referendum. As of mid-1972, 481 of the 976 jurisdictions subject to this feature of the law had appointive assessors subject to State Board certification of their qualifications. The other 495 jurisdictions in the group have chosen to maintain the earlier practice of popular election for this position. (However, New York City and the other most populous areas mentioned above, as well as Tompkins County, are each served by an appointive assessor. Hence, the appointment method of designation involves a preponderant share of the number and value of properties that are assessed in the State.)
A second important structural feature of the 1970 law is provision for the establish- ment of a real property tax service agency in each of the 55 counties where cities and towns are the primary assessing units. Each such agency operates under a director, ap- pointed by the county governing body for a term of six years. The director must meet qualifications established by the State Board and must complete during his first year in office a training course prescribed by the Board. Each county director is required, among other things, to prepare and maintain tax maps for use by the local assessing jurisdictions and to assist them, upon request, in the appraisal of complex properties. It may be noted that most of these county agencies are potentially concerned with relatively small popu- lations: only 20 of the 54 counties involved have more than 100,000 residents, and 15 have fewer than 50,000. The original law was amended in early 1972 to provide that any county director named thereafter should be placed in the non-competitive class of the civil serv- ice unless the county governing body requested competitive classification.
Reassessment programs. The 1970 law does not mandate reassessment programs, but

in recent years the State Board has been more active in recommending such programs and in assisting localities that undertake them. Contracts with appraisal firms for reassess- ment are subject to local negotiation, with Board assistance available upon request.
The State Board is presently engaged in developing a computer based system of data management for use by local governments. The goal is to provide reasonably accurate and current property values for the assessor and to provide the Board with accurate informa- tion for assessment ratios and other information needed for advising and supervising local property tax administration. After a two year research effort in Ramapo, a commuter suburb of New York, the Board is convinced their computer assisted valuation project is the only feasible way to generate and maintain accurate property tax rolls.5 The project is being extended with additional appropriations from the State's 1973 supplemental budget and is being expanded to Erie County.
The key is to have a computer large enough to efficiently handle large quantities of data and to collect accurate data to go into the model. Initial estimates of value are ob- tained which are checked against sales and assessment data. The assessor is presented with several value estimates from which he can choose the value which to him seems most appropriate. The computer will then select five properties which will support the esti- mated value. This information, along with the full-value assessment, is sent to the tax- payer. The validity of the assessment can be determined with the traditional appeal pro- cedures without the testimony of professional statisticians. The list of supporting prop- erties is a unique feature of New York's computer model which undoubtedly will facili- tate its acceptance by tax administrators and taxpayers.
State mandated assessment records. The Board has the power to prescribe the form of local assessment rolls, notices, and reports. By a 1970 enactment, it was specifically di- rected to establish standards, specifications, and procedures for the preparation of tax maps and to advise and assist counties in their preparation and maintenance. It has issued a set of regulations and various manuals and guides under this directive. By mid-1972, 23 counties were actively engaged in the preparation of tax maps, at a total cost of some $30 million. State assistance is payable to counties upon Board approval of their tax maps, at a rate of $1.00 per parcel. (Total costs are estimated at around $10 to $12 per parcel).
Requirements as to local assessors' qualifications. The 1970 enactment, as noted above, required the Board to set minimum qualification standards for the newly author- ized county directors of real property tax services and also-subject to some specific and other locally optional exceptions-for city and town assessors. The law further required Board set qualification standards for locally employed real property appraisers and re- quired all local assessors to take Board provided training courses. The Board has promul- gated standards which designate four classes of assessors, based on the number of par- cels of realty with which each are concerned. (Presumably the Assessor I class-up to 3,500 parcels- will comprise a majority of the assessors.)
State advisory appraisal services. The 1970 enactment also provided for explicit State assistance to local assessors in their valuation of certain properties. In response to a written request from the chief executive officer or assessor of a city or town, the Board provides "advisory appraisalw-which must be considered but need not be directly uti- lized by the local assessors-for sizeable forest plots, taxable public utility property, and other highly complex properties (as more explicitly defined by the Board). Under the law, the Board has until 1976 to comply fully with this directive. Also, if requested by the chief executive officer or assessor of a city or town, the Board is to review and report its (non-binding) determination concerning any advisory appraisal made by the county director of real property tax services of a particular property within the local assessing jurisdiction.

ASSESSMENT VARIATIONS
Legal requirements. New York's laws call for the valuation of taxable real property (except, effective beginning in 1973, for certain agricultural land and, under a long- standing provision, certain timber land) at its full value. This term has been construed by the courts to mean market value. However, numerous statutory provisions and court rulings take cognizance of the long-standing widespread practice of fractional assessment. Many of these provisions are designed to limit the damaging effects that would result from the marked geographic differences in assessment levels in the absence of some offsetting action.
State assessment ratio studies. The ACIR report of a decade ago included a highly detailed explanation of the State Board's recurrent effort to develop measures of relative assessment level for each of more than 2,000 local areas-specifically including not only all of the 980 cities and towns but also each county (by appropriate summation of smaller- area data) and all individual villages. This is the most extensive and costly assessment ratio effort in the nation, and engages a major proportion of the State Board's resources. It has been continued essentially along the lines reported a decade ago.
This biennial study deals with a sample of assessed parcels for each local area se- lected from property classes that account for a high proportion of the area's total realty valuations. For each sample property, a market value figure is obtained either by an appraisal made by Board personnel or by reference to sales-price data for recently transferred properties.6
To obtain adequate representation for certain property classes which in most of the local areas involved are very sparsely reflected by recent transfers, a high proportion of the total sample must utilize appraisals. For each area, assessment ratios calculated for the several sampled classes are used to derive a value weighted overall average ratio for the sampled portion of the assessment roll. In turn, this is applied to the aggregate of local assessed valuations (including the minor unsampled portion of the roll) to derive a market value estimate for the particular survey year.
To arrive at an official equalization rate for each area, the market value estimates for two successive studies are averaged, and the result is compared with the area's total of local realty assessments for the second year to obtain a preliminary ratio. This figure is then adjusted to take account of post-survey-year revisions in the local assessment level, as indicated by changes in aggregate valuations other than those resulting from property improvements and the like. Thus, in June 1972, the Board was nearing comple- tion of its work on a detailed survey of market value ratios based on 1970 price levels. This study will be averaged with the Board's 1968 survey in establishing State equalization rates for 1972 assessment rolls. Adjustments will be made to take account of changes in local assessment practices which may have occurred between the completion of the rolls on which each of these studies was based and the completion of the 1972 rolls.7
These data are published in the Board's annual report of official equalization rates, which, as noted above, includes a single average figure for each of many hundreds of local areas. Far more detailed data, including computer printouts that reflect information by property class for each of these areas, are regularly prepared in unpublished form.
This operation includes the extensive calculation of dispersion measures needed to determine the minimum appropriate number of various kinds of properties that need to be sampled in various areas in order to arrive at a reasonably representative average assessment ratio. However, unlike corresponding undertakings in a number of other States, the New York study does not yield explicit measures of variations of assessment level for individual assessing jurisdictions or other local areas (except insofar as such

variations are reflected by the averages calculated separately for various property classes).
The Board determined equalization rates are, by statute, used for a great variety of important purposes, including the determination of relative local property tax effort in connection with various State-local grants for public schools and other purposes, the ap- plication of constitutional limitations on local taxing and borrowing powers, the alloca- tion of certain State set valuations, and the equalization of property tax levies of school districts that comprise all or parts of two or more single assessing areas.8 Some 45 coun- ties also use State equalization rates to apportion their real property taxes.
Actual assessment levels and variations. As indicated by the foregoing description, the Board's official equalization rates are not likely to reflect actual current levels of property assessment unless market values of taxable realty remain substantially un- changed for several years. In a period of general inflation, these rates are likely to involve a material overstatement of actual current assessment levels for most reported areas. The rates lag behind current prices by two years.
Subject to this reservation, it may be noted that the Board determined for 1971 a statewide average equalization rate of 46 percent, with New York City at 64 percent and upstate averaging 32 percent. Corresponding data for 1970 showed county averages rang- ing from 15 to 84 percent. Only 15 of the 58 counties (including New York City as a single jurisdiction) were at or about 50 percent; 13 counties were under 30 percent and 18 were in the 30-40 percent range. As would be expected, the published data show an even wider range of rates among the far more numerous town, city, and village areas.
The 1967 Census reported a statewide average ratio of 35 percent, based on sample sales of ordinary real estate. The 1972 Census reported an assessment ratio of 29. Although statewide averages are not particularly useful because of the marked divergence between the respective valuation practices of New York City and upstate, there is no question that there has been a considerable downward drift in the fraction of market value represented by official valuations in most of the State. More explicitly, assessments have generally lagged behind actual market trends. (New York's average assessment level was reported by the 1957 and 1962 Censuses at 62 percent and 47 percent).
The 1967 Census, in reporting sales based assessment ratios for single-family houses in 43 sampled New York counties, verified the State's own findings of marked inter-county differences in average assessment levels, with a coefficient of 38. Only nine States showed a larger coefficient of inter-area dispersion of local assessment ratios for such property. By 1971, the coefficient had declined to 32, but now only four States had higher coeffi- cients. Such differences in New York are undoubtedly offset to a considerable extent by the various applications made by the State Board's equalization rate data. It is therefore much more significant that the Census also found for most of the sampled New York areas a relatively high degree of intra-area variation of assessment-sales ratios for single-family houses. The average for the State was 34 percent in 1966. The 1972 Census showed signifi- cant improvement with the coefficient declining to 21 percent, only 1 percent higher than the nation's average. Significantly, however, the 1967 Census revealed that each of the two counties that have a single assessing agency (Nassau and Tom~kins ) showed up very well, respectively at 15 percent and 11 percent, and most of the major cities also were reported at least close to the 20 percent level that is often cited as a minimum reasonable standard for assessment uniformity.
REV1 EW AND APPEAL OF PARTICULAR ASSESSMENTS
The 1970 "Assessment Equality Law" included important new provisions for appeals. The law requires the governing body of each city and town to appoint a board of review, consisting of from three to five members. The members are to serve staggered terms of

five years commencing October 1, 1971. They must be local residents familiar with local property values. Neither the assessor nor members of his staff can be named, but other officers or employees of the local government may be, so long as they do not constitute a majority of the board.
This provision supplants earlier diverse arrangements under which, in much of the State, valuation appeals were heard only by the assessor or by a body of which h e was a member.
New York laws, unlike those of many other States, make no provision for a special court or quasi-judicial agency with statewide jurisdiction to consider appeals from local valuation decisions. Accordingly, aggrieved property owners must take any such issue directly to the courts.
As indicated by the ACIR report of a decade ago, a 1961 statute authorized taxpayers to introduce as evidence the State equalization rate for the particular a rea involved. However, a 1967 decision of the State's highest court severely limited the potential useful- ness of this provision for taxpayers attempting to demonstrate discriminatory assessment. The law was then further amended in 1969 in a manner which the State Board believed would permit substantial taxpayer reliance upon the official State rate as a measure of the local level of assessment. In a 1972 decision by a lower court, it was held that the method of determining the State equalization rate for a particular city is the only one of the three alternative methods utilized in an assessment review case with any statistical validity. The State equalization rate , supported by testimony of the Board's staff and the introduction of survey data, was admitted as evidence and used by the court in determining an appro- priate assessed valuation for the property in question. Presently (September 1973) the case is being appealed to a higher court for review. Should the lower court holding be sustained, the result should be a considerable gain for taxpayers who believe their prop- erty holdings are inequitably assessed, and enable them to avoid some of the costs and difficulties they have previously encountered in providing acceptable evidence on this score. Even so, the extended time lag involved in the State Board's recurrent development of official equalization rates seems likely to limit their usefulness.
%iuch of the information on assessment administration for this report was supplied by Thomas F. McGrath, Counsel, and Hollis A. Swett, Director, Property Valuation Division, New York State Board of Equalization and Assessment.
2The Role of the States in Strengthening the Property Tax, Vol. 2 (1963), pp. 109-115. 3Als0, according to the 1967 Census, half of the statewide dollar total of assessed valuations for taxable
realty was accounted for by less than 1 percent of all the properties on the assessment rolls. In most other States, it took generally some 8 to 15 percent of all listed items to account for half the statewide valuation total. In part, New York State's unusual showing on this score reflects the high actual values represented by some properties in New York City, as well as the fact that the local real estate rolls in this State include assessments for railroads' operating property, which elsewhere are subject to distinctive State assessment. Much of the striking difference, however, reflects the application of a considerably higher level of tax valuations in New York City, especially for business property, than prevails in upstate New York. Within New York City itself, according to the 1967 Census, half of all realty valuations were provided by the most valuable 3.6 percent of all parcels on the city's assessment rolls.
probably more than any such State agency elsewhere, the Board's role reflects the impact over an extended period of a single individual-Frank C. Moore, its present chairman and long-time member. Moore in the past served as State Comptroller and Lieutenant Governor, was a member of numerous other State commissions concerned with local government and fiscal matters, and was for many years Executive Secretary of the New York State Association of Towns.
5For a more extended discussion see, H. A. Swett, "A Case Study in State-Local Cooperation in Computer Assisted Valuation Project," presented to the 38th Annual Conference on Assessment Administration (Dallas, Texas, October 17, 1972).
6New York lacks the advantage of a realty transfer tax applying to the total value of mortgaged properties; like the former Federal transfer tax, its law exempts the portion of the value represented by any outstanding encumbrances.
This final adjustment step works in the opposite direction from trending calculations that are applied in assessment ratio studies of some other States. such as California and Washington. Their earlier year estimates of market value of taxable property are trended forward to obtain a current year estimate of market value

which can be compared with the current year amount of assessed valuations in order to obtain an assessment ratio for the current year. In a period of rising values, that type of trending calculation reduces the ratio initially calculated for a prior period, rather than, as in the case of New York's adjustments for post-study-year changes in local assessed valuations, increasing the percentage initially calculated from prior-year data.
8At the time of the 1967 Census of Governments, only 59 of the State's 916 school districts were directly coterminous with a particular county, city, or town.

NORTH CAROLINA1 North Carolina's property tax system has not been drastically altered during the past
decade. It still reflects primary reliance for assessment work upon county jurisdictions, which range widely in their capability, and a very limited State government role.
There have, however, been some important developments. These include a complete recodification of the property tax laws, incorporating numerous desirable adjustments; assignment to a State agency of substantial responsibility for assessing public utility prop- erty; some provision-though still extremely limited-for the staffing that is essential for adequate central oversight of property tax administration; and some statutory changes in the property tax base, including a new homestead exemption designed to benefit low- income elderly householders.
A recent report by the Commission for the Study of Property Tax Exemptions and Classifications to the Governor and the General Assembly of 1973 may affect future prop- erty tax legislation in the State. The report recommends:
I) that the State not abandon the principle of uniform appraisal at fair market value,
2) that preferential treatment of farm land has not been effective in preventing the conversion of farm land to other uses,
3) that requests for exemption be supported by a clear demonstration that the ex- emption will provide a genuine benefit to a significant segment of the people of the State and that the benefits should be substantially greater than the revenue loss to the taxing units, and
4) that uniform and consistent treatment of owners of similar property ought to be of paramount importance.
North Carolina is one of the ten or so States which still lack an ongoing official pro- gram to measure the level of, and variations in, local assessments of taxable realty.
FINANCING ROLE OF THE PROPERTY TAX
North Carolina's revenue structure, like those of most Southern States, involves rela- tively limited reliance on property taxation. For instance, per capita property tax is only $85 relative to the national average of $184 and $26 per $1,000 of personal income relative to an average of $47. Of all the own-source general revenue raised by the State and local governments in fiscal 1970-71, only 20 percent was thus obtained-considerably less than the average nationwide proportion of 32 percent. This limited use of the property tax reflects the predominant financing role of the State government, which itself makes only limited use of property taxation (through special levies on certain intangible personalty and utility property of which most of the revenues are sent back to local governments).
In an ACIR study, Measuring the Fiscal Capacity and Effort of State and Local Areas, it was estimated that North Carolina's property tax load, relative to its capacity, was only 55 percent of the national average, although its composite effort index for all State and local taxes was only 6 points below the U S . norm.
North Carolina has a relatively simple local government structure. Public school sys- tems operate as county government agencies and receive substantial State support. Ac- cording to the 1967 Census of Governments, there were only 568 local governments with property taxing power, including the 100 counties, 437 municipalities, and 31 special districts. (Another 184 special districts were dependent on other means of financing.) By

1971 the number of local governments with taxing power increased to 590 out of 802 local governmental units. The importance of property taxation at the local level has been lim- ited by this State's relatively broad grant-in-aid arrangements, as well as by extensive local reliance upon various types of non-tax charges. In fiscal 1970-71, local property taxes supplied only 28 percent of all the general revenue of local governments in North Caro- lina (including their intergovernmental receipts), as compared with a corresponding nationwide proportion of 40 percent.
Per capita property tax revenue in North Carolina more than doubled during the 1960's, growing at an average annual rate of 7.7 percent, somewhat outpacing the 7.1 per- cent growth rate of per capita personal income.
THE PROPERTY TAX BASE
About 6 percent of all property tax revenue in North Carolina is from certain state- wide special property taxes, as noted above. In recent years, nearly all of the valuation base for local general property levies has consisted of locally set assessments, with the small remainder involving certain State set utility values. The 1971 statewide proportions were 66 percent for locally assessed realty, 30 percent for locally assessed personal prop- erty, and 4 percent for State assessed utility values. Beginning with 1972, however, sub- stantially all public utility property will be subject to State valuation, so that these pro- portions will be altered.
The legal base for local general property taxes is relatively broad, extending to motor vehicles, to household property above a $300 value, and even to some types of intangible personal property not taxed by the statewide intangibles tax. Under constitutional provi- sions permitting classification on a statewide basis, some kinds of tangible personalty (mainly baled cotton and certain North Carolina farm produce) are taxable at statutory fractions of the general rates applicable to other property. Inventories awaiting trans- shipment and, effective in 1974, standing timber and pulpwood are also classified.
The laws also provide for the usual kinds of complete exemptions for property hold- ings of governments, churches, and non-profit charitable and educational bodies.
CHANGES IN COVERAGE AND APPLICATION OF THE PROPERTY TAX
Recodification. A complete recodification of North Carolina's property tax laws was accomplished by "The Machinery Act of 1971," the first such broad-ranging legislation since 1939.2 This Act marks further progress in the direction spelled out by constitutional amendments adopted in 1962 (and reaffirmed in the new State constitution of 1971), to eliminate variations in the scope and application of property taxes which had proliferated under the legislative practice -common also in other Southern States - of enacting local laws that apply only to particular named jurisdictions. Although the Machinery Act specifically preserved some kinds of earlier local enactments (as to specially authorized county boards of equalization and review, tax commissions and similar agencies, and- but only temporarily-statutes of limitations on tax claims), it repealed all other localized property tax provisions. Presumably, the long-term value of this aspect of the recodifica- tion will depend on the extent to which the legislature will exercise restraint, with regard to property tax matters, in the enactment of special local laws in the future.
- -
The Commission which developed this measure considered problems of property classification and exemptions to be outside its assigned duty, but a few relatively minor changes in exemption provisions were included in the measure before its enactment.
Exemptions. Another 1971 law will have a significant effect upon the property tax base. It provides for the exemption of $5,000 of the appraised value (presumably approxi-

mating full market value) of property used i s the principal residence of an owner (and spouse, if the owner is married), who is retired, at least 65 years of age, and has less than $3,500 per year of broadly defined "disposable income." First effective in 1972, the law provides for the annual submission of claims for such homestead exemptions, and the State Board of Assessment has prepared forms for use by local assessors in dealing with such claims. An amendment effective in 1974 provides for the exemption of $5,000 of as- sessed real and personal property as long as disposable income is under $5,000.
A more detailed set of exemptions has been recommended by the Commission for the Study of Property Tax Exemptions and Classification.
Income
$3,500 or less 3,500-4,000 4,000-4,500 4,500-5,000
Exemption
A number of other changes in the scope of the general property tax-most of them relatively minor-have been enacted during the past decade. These include exemptions provided in 1965 for property of "religious educational assemblies," in 1967 for State certificated installations designed to limit air pollution, and in 1971, for property of non- profit water or sewer associations and of humane societies. On the other hand, property of electric membership corporations, previously exempt, was made taxable beginning in 1967 and is now subject to State assessment like other such public utility property.
Special classification of agricultural and forest lands. In 1973 North Carolina adopted a special classification of farm and forest lands. To be eligible the land must:
1) be ten acres in size (20 acres for forest land),
2) be individually owned,
3) yield a gross income of $1,000 for last three years, and
4) include the owner's residence for the past seven years.
Eligible land will be taxed at use value rather than true value with the difference in the tax on these two bases becoming a lien on the property. When the property is sold or re- classified the lien must be paid.
The 1971 legislature considered, but did not enact, numerous other proposed kinds of exemptions and tax preference provisions. It did, however, create a temporary Commis- sion for the Study of Property Tax Exemptions and Classifications, with a directive to report by December 1, 1972. The legislature also made permanent a Tax Study Commis- sion first created in 1969. Both these bodies are expected to develop recommendations with regard to the scope of the property tax system.
Out of these study groups came proposed legislation considered by the 1973 legisla- ture. In particular, Chapter 695 (Senate Bill 147) rewrote the exemption and classification procedures to facilitate their administration. For instance, personal and real property tax exemptions were combined and clarified, and in many instances the definitions within the exemption and classification were expanded. Some specific provisions from the nu- merous bills:
I. Persons seeking tax relief must file requests annually and must establish the fact that their property is entitled to.the relief.
2. County and municipal taxing officials must maintain records on all properties which are granted relief with a duplicate copy being sent to the Department of Revenue.

3. The State should establish a freeport seaport terminal handling the transship- ment of goods from foreign countries.
Recommendations to eliminate special interest legislation from the property tax laws, however, were not successful. Thus action taken in response to the significant changes recommended by the Commission were more in form than in substance.
Other provisions. By popular referendum, North Carolina adopted in 1970 a new constitution and a number of separate amendments, one of which provides for a new finance article to be effective in 1973. This article included two new property tax provi- sions which are in accord with official recommendations of the Advisory Commission on Intergovernmental Relations. One of these removes a long-standing constitutional limita- tion on certain property tax rates of counties (which in actual practice had not been par- ticularly restrictive). The other authorizes the legislature to provide by general law for counties or municipalities to define supplemental tax rate areas for the financing of addi- tional services not provided on a jurisdictionwide basis.
The 1967 Census of Governments reported about 1.9 million parcels of locally as- sessed taxable realty in North Carolina. Of these, 58 percent were non-farm residential properties, which contributed 52 percent of the statewide total of realty valuations. Acre- age and farm properties made up 19 percent of both the total number and dollar value of realty assessments. The far less numerous (4 percent) commercial and industrial proper- ties accounted for 27 percent of all local va!uations of taxable realty.
ASSESS1 NG RESPONSIBILITIES
Responsibility for valuing property3 subject to general property taxation was divided between the State Board of Assessment and 100 local agencies, one in each county.
Before 1967, the State Board consisted of four ex-officio members, including the Com- missioner of Revenue as Chairman. As a result of a 1967 enactment, the Board consisted of four appointive members (two named by the Governor and one each by the President of the Senate and the Speaker of the House) plus the Director of the Tax Research Division of the Revenue Department (also appointed by the Governor), serving ex-officio. The Board was part of the Revenue Department, which was headed by an appointive Com- missioner and administers various State taxes through its several line divisions. The Board was subject to the Department's budgetary control, although legally empowered to act independently in its oversight of local assessment work and its valuation of utility prop- erty.
Prior to 1967, the Board had no staff of its own and depended on personnel of the Revenue Department for limited and mainly part-time help. It now has a staff of 12. The Board's 1972 appropriation of $168,000 amounts only to a miniscule twenty-fifth of 1 per- cent of the statewide total of property tax revenue-far less than the comparable fraction for this kind of agency in most other States. As noted in the ACIR study of a decade ago, The Role of the States in Strengthening the Property Tax, the work of the Board was very usefully supplemented by activities of the Tax Research Division of the Revenue Depart- ment, and the Institute of Government of the University of North Carolina.4
State Board authority. As indicated by the ACIR property tax study of a decade ago, the State Board of Assessment had relatively broad authority to supervise local assess- ment work, including power to prescribe record forms, require reports, and recommend standards and rules for property appraisal. The Board's supervisory responsibilities were significantly broadened by a new provision of the 1971 Machinery Act, under which it was made responsible for seeing that training was available for persons seeking the position of county tax supervisor, and, beginning in July 1973, any person appointed to this position (other than those holding office on July 1, 1971) must have been certified by

the Board as properly qualified. However, as of July 1973, the State Board ceased to exist; its appellate duties were assumed by a new agency called the Property Tax Commission, while the other powers were transferred to a newly created Ad Valorem Tax Division in the Department of Revenue.
Revaluations. The Board's staff (now the Ad Valorem Tax Division staff) include sev- eral appraisers who aid local assessors upon request. Such assistance is sought and pro- vided mainly in non-revaluation years for the respective counties. Both by law and in practice, explicit appraisal of most individual pieces of taxable realty occurs only at eight-year intervals, according to a statutory schedule naming the particular counties which are to undertake revaluation in various years. Counties can, by official resolution of their governing boards, authorize an earlier revaluation, and they are also required to review their realty assessments four years after a complete revaluation to make a blanket horizontal adjustment of appraised amounts if that seems needed to "bring values into line with then current values." Otherwise, except where legally specified kinds of changes in the physical nature of particular properties have occurred (e.g., additions, new struc- tures, platting acreage, etc.), interim revisions of individual property appraisals are ap- parently prohibited. Thus the law places great importance on the periodic revaluations and specifically endorses interim "roll copying" of appraised values.
Most counties hire appraisal companies to conduct their required octennial revalua- tions. Each county board must formally adopt and publicize "the schedules of value, standards, and rules to be used" in the revaluation. Local property owners may appeal such county specifications to the Property Tax Commission (formerly the State Board of Assessment) within 30 days, and the Commission has power to confirm, modify, or re- quire changes in the specifications. Aside from this, the State agency has little direct par- ticipation in local revaluation efforts.
ASSESSMENT VARIATIONS
Legal requirements. North Carolina laws call for the appraisal of all taxable property at its true value in money-i.e., its market value-but up to 1973, it specifically required each county board of commissioners to set annually some uniform percentage of ap- praised value to be used in arriving at taxable assessments. Each board was to give ad- vance notice of the prospective fraction to municipal representatives, and notify the State Board of the official assessment ratio adopted. Now, all property must be assessed at true market value. The use of the official assessment ratio is repealed.
Assessment ratio studies. A 1967 enactment gave the State Board the duty "to make continuing studies of the ratio of appraised value of real and personal property to its true value in each county and to publish the results of the studies at least every two years. However, no resources have been appropriated for this purpose and, accordingly, North Carolina is one of the ten or so States which lack any recurrent statewide effort at the statistical measurement of local assessment levels and variations.
Actual assessment levels and variations. The 1967 Census of Governments estimated for North Carolina a statewide average assessment ratio of about 38 percent for ordinary real estate involved in measurable sales, with residential property at 45 percent, com- nearly every county, the auditor employs at least one full-time deputy for assessment reflected some increase from the average level indicated by the Censuses of 1962 and 1957 (around 33 percent). For 44 counties-mainly the more populous ones in the State- the 1967 Census also summarized ratio findings with regard to single-family houses. The data reflect considerable diversity of county averages-from less than 25 percent in three of the 44 areas to more than 50 percent in 11 others. (The 1972 Census recorded a statewide assessment ratio of 45.) The picture as to intra-county variation of house assessments was

generally similar to the nationwide record for all sampled areas: 25 of the 44 North Caro- lina areas showed a dispersion coefficient of less than 20 percent. (In 1972, the intra-county coefficient was 21 in comparison to the national average of 20. The inter-county coeffi- cient of dispersion was a similar value, at 22.)
REVIEW AND APPEAL OF PARTICULAR ASSESSMENTS
The Machinery Act of 1971 in large part reenacted earlier provisions concerning property tax appeals, but clarified requirements as to meeting times for local appeal bodies (county boards of equalization and review) and other aspects of their duties. It spelled out specifications for their recordkeeping and notification of appellants. Another 1971 enactment also expressed a State policy favoring "open hearings, deliberations, and actions," which may influence the handling of taxpayer appeals.
Before 1973, the State Board of Assessment had responsibility for both the appraising of Stateassessed properties as well as deciding any appeals on those assessments. Now, these responsibilities are divided between the Department of Revenue and the Property Tax Commission. The latter group:
1) is constituted as the State Board of Equalization and reviews the valuation and taxation of property in the State, and
2) shall hear appeals from the appraisal and assessment of property of public service companies.
This separation of the assessment and appeals functions was recommended by ACIR in their 1963 report and is being adopted by a growing number of States.
'Some of the information for this report was supplied by Hudson C. Stansbury, Director, Tax Research Division of the North Carolina Department of Revenue.
*An excellent description of this and various other laws was prepared by Henry W. Lewis and others of the Institute of Government of the University of North Carolina, and issued by the Institute as Property Tax Bulle- tin No. 37, under the titles 1971 Legislation Affecting Property Tax Administration and 1973 Legislation Affecting Property Tax Administration (Chapel Hill, September 1971, and June 1973). The latter title is reprinted in Popular Government (lune 1973). pp. 52-72.
=There is legal authority also for municipalities that include parts of two or more counties (of which North Carolina has nearly a score) to do their own assessing rather than use county set valuations. Apparently, no municipalities avail themselves of this option.
*Op. cit., Volume 2, pp. 116-119.

NORTH DAKOTA1 As it was a decade ago, property taxation in North Dakota continues to be what is
probably the nation's most decentralized assessment system. With less than two-thirds of 1 percent of the U.S. total population, North Dakota has one-eighth of all the primary assessing jurisdictions in the country, and applies only very limited resources to State supervision of local assessment work. There have been significant gains, however, in the measurement of assessment levels, and efforts are also being made to provide increased direction and coordination through county "directors of tax equalization."
FINANCING ROLE O F THE PROPERTY TAX
In North Dakota's revenue structure, property taxation has a large but relatively decreasing role. Its proportion of own general revenue raised by the State and local gov- ernments dropped off during the 1960's from 38 to 32 percent (close to the U.S. average in fiscal 1970-71). Per capita property taxes ($188) were close to the national average of $184. North Dakota property taxes per $1,000 of personal income ($64) were substantially above the nation's average ($47). In fact, there were only five States which had higher tax pay- ments per $1,000 of income.
During the 1960's, property tax revenue in North Dakota went up only about 5 percent a year, and thus lagged behind the 7 percent growth rate in income. Assessed valuations were rising even less rapidly-less than 1 percent a year from 1960 to 1969-so that the rates applied to officially set values were moving up materially.
An ACIR study, Measuring the Fiscal Capacity and Effort of State and Local Areas, estimated that the property tax load in North Dakota, relative to capacity, was some 23 percent above the national average, for farm land only 10 percent higher, for non-farm residential and industrial, 32 and 38 percent respectively. The average tax effort for other types of taxes was generally less in North Dakota.
Local governments account for practically all property tax collections in this State. There are some 2,600 local units with property taxing power (including nearly 1,400 townships) -96 percent of all units of local government-and most of these rely mainly on this source for their financing.
THE PROPERTY TAX BASE
One-ninth of the statewide total of taxable valuations in 1971 consisted of State set values for public utility property, with practically all the other 89 percent consisting of locally assessed real estate. This reflects a considerable shift from a decade earlier, when State set utility values contributed 14.2 percent, locally assessed realty 64.9 percent, and locally assessed personal property 20.9 percent, of the property tax base. Legislation first effective in 1970 exempted substantially all (non-utility) personal property. Also during this interval, assessed valuations for public utilities dropped off, while local assessments for real estate were rising about 2.5 percent annually.
The 1967 Census of Governments (the latest available source of this information, which was not updated in 1972) reported some 460,000 pieces of taxable realty on North Dakota's local assessment rolls, of which three-fifths were acreage or farm properties. Such property also, according to the State's reports, contributes about three-fifths of the locally assessed value of taxable realty. This despite a long-standing unique feature of the North Dakota laws, by which farm structures and improvements (including farmers' residences) are exempt, and only the land portion of total farm value is subject to prop- erty taxation. (The Department of Agriculture estimates that structures account for about 15 percent of the total market value of farm real estate in North Dakota.)

Compassionate tax relief. The tax base is also slightly diminished by a law, first effec- tive in 1970, under which a homeowner over 65 who has annual family income of less than $3,000 ($3,500 in 1974) may claim exemption from tax on one-half of the assessment value of his residence with a maximum reduction of $1,000, In 1971, partial exemptions allowed under this provision amounted to only a fraction of 1 percent of gross real property as- sessments. Effective in 1974, a circuit-breaker type amendment makes property tax relief available to persons 65 or older who rent. If income is $3,500 or less and 20 percent of annual rent (deemed to be payment of property taxes) is larger than 5 percent of income, the renter can claim a refund equal to the amount by which the deemed tax exceeds 5 percent of income. The maximum refund is $100.
Personal property in the form of household goods is exempt if the head of the family has income of $1,500 or less if the total amount of property is not over $100 in assessed value. An exemption is also granted for the personal property of persons who receive a major part of their income from public assistance. In addition, personal property is totally exempt for the elderly with income of $3,000 or less.
For the paraplegic disabled veteran, $10,000 of net assessed value of real property is exempt. An exemption is provided for $4,000 of assessed value or, alternatively, for $4,000 of personal property, owned as a homestead by a veteran who is at least 50 percent dis- abled, provided net income is less than $3,000,
Preferential treatment of commercial property. Another type of property tax exemp- tion has also been enacted recently. A 1969 law authorizes counties and cities, with ap- proval by the State Board of Equalization, to provide "partial or complete exemption . . . for a period not exceeding five years" for increases in value resulting from expansion of commercial or industrial property holdings. State Board approval, according to the law, is to depend on its finding that any such particular exemption "will not result in unfair tax reduction competition between political subdivisions . . . [and] is in the best interest of the people of North Dakota." Relatively little evidence has yet developed as to the potential significance of this provision.
In 1973 a new law was enacted which provided that renovation, rehabilitation, and repair of commercial buildings may be exempt from assessment and taxation for three years from the date the improvements began. The owner must file a claim with the as- sessor who must approve it. Decisions of the assessor are appealed like assessments.
ASSESS1 NG RESPONSI BI LIT1 ES
The function of assessing in North Dakota is still, as it was ten years ago, divided between the State Board of Equalization and numerous local assessors, with the Board assessing railroad and other utility property and the local assessors all other taxable property.
The State Board of Equalization is an ex-officio body including the Governor, Tax Commissioner, Treasurer, Auditor, and Commissioner of Agriculture. While the Board makes the official assessment of the property indicated, and has power to raise or lower valuations of property to equalize among counties and among local units and individual property owners, its actions are based on data provided by the Property Tax Division of the Office of State Tax Commissioner.
This Division, which has operated since 1962 under substantially unchanged legal pro- visions, is headed by the State Supervisor of Assessments, who is subject to appointment on a merit basis. Besides valuing public utility property, the Division is responsible for assisting and supervising local assessors, and for developing and reporting various kinds of property tax data. (Valuation of public utility property is also handled in the Office of State Tax Commissioner, but under supervision of a Utility Director.)
Although larger than at its inception a decade ago, the Property Tax Division has a

small staff (only five persons altogether), and an extremely modest budget-$64,000 for fiscal 1971-72, or about six cents per $100 of statewide property tax revenue.
North Dakota continues to be served, as it was a decade ago, by nearly 2,000 local primary assessing agencies. The 1967 Census counted 1,772 such jurisdictions in the State, involving 1,387 elective township assessors, 356 appointive municipal assessors, and 29 elective district assessors who deal with property in the parts of their respective coun- ties that lack township governments. Only a handful of all these jurisdictions have 10,000 inhabitants or more, and about three-fourths of the State's population lives in assessing areas below that population size.
To supplement and complement this highly decentralized arrangement, the State in 1963 authorized the respective county boards of supervisors to appoint a county super- visor of assessments, and in 1969 the legislature moved further, by requiring that each county board appoint a "director of tax equalization who shall be qualified and experi- enced in property appraisals and familiar with assessment and equalization procedures and techniques." The 1969 law also authorized the joint designation of a single such offi- cer by two or more counties. Thus far, however, only a few pairs of the State's 53 counties have taken advantage of this latter option and jointly named a two-county equalization director.
The 1969 enactment did not materially enlarge the assessment supervision powers at the county level, nor did it provide any specific means for assuring the kind of profes- sional qualifications it called for. Moreover, it repeated the earlier provision that the county equalization officer could be engaged on either a full-time or part-time basis. Such a provision is quite understandable, insofar as separate single-county performance is involved. Few of the State's counties are populous enough to sustain a well equipped professional assessing operation. More than half of them have less than 10,000 inhabitants, and only a handful have a population of over 25,000.
The powers of the State Supervisor of Assessments have remained essentially un- changed since 1962. The State has enacted no new requirements concerning property reassessment, local assessing records, or (except as noted above) the availability or quali- fications of local assessing personnel. The Property Tax Division conducts some training programs, including an annual one-week appraisal school, and provides technical help to local assessors in their valuation of complex high value properties.
ASSESSMENT VARIATIONS
For many years, North Dakota laws have specified that property taxes apply to tax- able value equal to 50 percent of assessed value, which in turn is legally supposed to be 100 percent of true and full market value. However, actual levels of taxable value as officially set have long been at a far lower level-historically averaging for real estate less than one-third of the legally specified fraction, or less than one-sixth (instead of one- half) of full market value.
During recent years, North Dakota has had much more extensive and detailed infor- mation than previously about the level of real estate assessments and inter-area and intra-area variations in assessment level. Such data have been regularly developed by the Property Tax Division, which issues a biennial report presenting figures by county and class of property, as well as for sizable municipalities.
This sales ratio measurement effort was authorized (though not mandated) by 1961 legislation. The operation relies on facts gathered in each county concerning arms length sales of property, and the mail canvassing of buyers and sellers for confirming informa- tion and price data. The North Dakota sales ratio effort is handicapped not only by the relative paucity of usable transfers (especially in small counties), but also by the lack of any recordation tax or price certification requirements such as facilitate

studies in other States, and by legal exemption in North Dakota of structural improve- ments on farms. This factor necessitates the exclusion of any sale which involves a farm property having a significant amount of improvement value. A further restriction was also imposed by the legislature in 1965, to exclude from the assessment ratio study any sale of an agricultural property of less than 80 acres.
Weighted county-by-county assessment ratios obtained from this effort a re used to adjust the rate of a required countywide tax for local school purposes, and to calculate State equalizing grants for schools. The findings by property class for individual counties allow the State Board of Equalization to exercise its broad powers to equalize valua- tions among counties and classes of property. Under this authority, the Board ordered a number of significant local changes in assessments in the years 1967 and 1969.
The potential usefulness of the ratio findings is limited by the paucity of measurable property transfers for individual townships, most of which are sparsely populated. In fact, ratio averages a re not actually developed on an individual township basis, but only for the overall rural portion of each county as well as for individual cities.
Successive biennial ratio studies have evidenced a considerable range in the average assessment level of individual counties. Most counties exhibit a material divergence among the three broad types of taxable realty (farm lands, business property, and resi- dential property), and also show a considerable variation in the assessment-sales ratios for particular parcels of transferred property. The 1970 study reported a statewide aver- age ratio of 21 percent for taxable realty, including 24 percent for urban property and 20 percent for rural land, as well as overall ratios for individual counties that ranged from 17 to 26 percent. Since these ratios pertain to ostensible full value which is twice the taxable value against which property taxes are actually levied, the ratios for the latter would be only half as great. In other words, the typical taxed valuation on the assessment rolls would presumably be only a little over one-tenth of market value (half of 21 percent of that value).
These 1970 ratio findings are based on measurable sales that occurred during the four years 1966 through 1969, when actual property values in North Dakota were rising more rapidly than assessments. Hence, they probably overstate to some degree actual 1970 assessment levels. Altogether, the findings suggest a continuance of the earlier trend shown by the periodic Census of Governments, which estimated a statewide average North Dakota ratio (in terms of taxable valuations) of 15 percent in 1956, 1 4 in 1961, 11 in 1966. The ratio for 1971, however, increased to 15 percent.
The evident marked variation of assessment levels within many individual counties is especially damaging to tax equity because most local property taxes in North Dakota are levied by school districts (60 percent) and counties (20 percent). Except for some school districts, the jurisdictions a re geographically larger than the primary assessing areas served by separate township and municipal assessors. Obviously, lacking effective means to assure reasonably uniform assessment among such areas, taxes imposed by a particular county or school district can range considerably in the effective rate applying to various parts of the total jurisdiction. The intra-area coefficient reported in the 1971 Census was 41 percent, the highest in the nation, and comparable to a national average of 20. For the 1967 Census, the coefficient was 27, seventh highest in the nation. The inter- a rea coefficient was 23 in 1972 and 18 in 1967.
Availability of property tax data. Besides the biennial sales ratio study, the Tax Com- missioner publishes an annual statistical report entitled Property Valuation and Property Taxes Levied. This study includes statewide and county-by-county data on assessed valu- ations by class of property, and mill rates of property tax levies in considerable detail by type of government. Related historical data is also included.

REVIEW AND APPEAL OF PARTICULAR ASSESSMENTS
There have been some recent statutory changes affecting assessment appeals. In 1971, legislation provided for notice to the property owner as to the time when his appeal for a revised assessment would be considered by the county appeal body. The law also pro- vided that an assessment reduction which had been rejected by the county board of equalization could be appealed in the first instance to the State Tax Commissioner, rather than directly to the district court, as before. However, since it provided also that no new evidence would be offered in any subsequent appeal to the court, this change (according to the State Supervisor of Assessments, Henry W. Luther) "fell short of its intent to sim- plify appeal procedures for the property owner [since] . . . in order to protect himself he would have to make a detailed presentation at the State Tax Commissioner's hearing" in anticipation of a possible court appeal.
'Some of this report is based on information and background materials supplied by Henry W. Luther, North Dakota Supervisor of Assessments.

Ohio's property tax system has continued in recent years to reflect the situation described in an ACIR report of a decade ago, which noted that, "In sharp contrast to Ohio's strong program for the central assessment of personal property is the State's rather perfunctory concern for the assessment of real property."= More effective action toward statewide uniformity of realty assessment is in prospect, as a result of the 1971 decision of the Ohio Supreme Court requiring curtailment of marked existing differentials. Recent legislation has included measures to reduce the tax load of various types of personal property, to provide a graduated partial homestead exemption to low-income elderly householders, and, most recently, to provide property tax relief from new State taxes on personal and corporate income. Ohio has continued its relatively extensive effort to meas- ure levels and variations of realty assessments, but has made less direct use of the results of this effort'than have many other States.
FINANCING ROLE OF THE PROPERTY TAX
In some respects, property taxation has represented an even more important element of Ohio's revenue system than of those in other States. To a considerable degree, this has resulted from less than average use here of certain other taxes, and especially the lack, until recently, of a State personal income tax. In fiscal 1970-71, property taxes supplied 36 percent of all the general revenue raised by the State and local governments, only a little less than the 40 percent share of a decade earlier. During this period, corresponding property tax proportions in the nation as a whole dropped off from 38 to 32 percent.
In an ACIR study, Measuring the Fiscal Capacity and Effort of State and Local Areas, it was estimated that Ohio's property tax load, relative to its capacity (defined according to the usual scope of property taxation) was 6 percent less than the national average, 15 percent below for non-farm residential property, but 6 and 7 percent above for farm and commercial and industrial properties. Its overall effort index for all State and local taxes was 18 points below the U.S. normi3 however, the recent imposition of a State income tax, coupled with an across-the-board reduction in real estate levies, is expected to alter the Ohio relatives.
While Ohio may use the property tax somewhat more than other revenue sources, the tax burden on a per capita basis and per $1,000 of personal income is below the national averages: $172 vs. $184, and $44 vs. $47, respectively.
Local property tax levies accounted for over three-fifths of all the own-source rev- enue raised by local governments in fiscal 1970-71, or slightly less than the corresponding nationwide average. The property tax part of all general revenue of Ohio local govern- ments, including their intergovernmental receipts, was 45 percent as compared with only 40 percent in the nation as a whole.
Ninety-five percent of Ohio's 3,259 local government units (as of 1972) have property taxing power, and for most of them this is a significant revenue source. However, munic- ipalities here make relatively less use of property taxes than those in most other States; many of them have long depended heavily on local income or earnings taxes. Accord- ingly, school district levies here have accounted in recent years for 70 percent or more of local property tax revenue.
During the 1960's, per capita property tax yields in Ohio grew 6 percent annually, and this outpaced the 5.3 percent growth rate of per capita income. Since official valuations

of taxable property were rising far less rapidly-overall less than 2.5 percent a year, and for real estate only 2 percent-there was a general increase in rates applied to the official base.
Ohio law requires rates to be reduced proportionally whenever valuations are ad- justed upward as the result of a sexennial general reappraisal. As noted by one knowl- edgeable observer of the Ohio tax scene:
The prevailing view in Ohio is that property taxes ought not to be allowed to increase through inflation or general appreciation in property values, but only through a vote of the people. While the vote in a referendum is on the question of levying a certain specified rate, most legislators and even tax administrators accept the view that it is really on a certain dollar amount of revenue and that this amount should be unaffected (in an upward direction) by an "administrative" action such as reappraisal of property. Symmetry would suggest an automatic upward adjustment of rates when valuations are reduced, but no such provision exists.
When rates are reduced to offset the effects of reappraisal, the lower rate applies not only to real estate but to public utility and tangible personal property, which cate- gories are not covered by reappraisal. Consequently local jurisdictions may suffer a reduction in tax revenue when taxable values are increased. The problem is com- pounded for school districts. School foundation aid, being tied (inversely) to taxable valuation, is reduced for districts that suffer an increase in tax base through re- appraisal. In recent years, partial relief has been granted to districts adversely af- fected in this waye4
THE PROPERTY TAX BASE
Ohio is unusual in the extent to which the State plays a direct part in setting valua- tions for certain property. The State role involves not only the assessment of various kinds of intangible personalty subject to special low rate taxes (mainly State imposed and collected) and the assessment of most public utility property (as common in other States), but also the assessment of nearly all the tangible personal property which is part of the general property tax base. Hence, of statewide assessed valuations for general property taxes, the State determined portion makes up nearly three-eighths, the fourth highest ratio in the nation, compared to a national average of 8 percent. Thirteen percent of the 1971 total is in public utilities and 25 percent is personal property or other businesses. Locally assessed valuations (63 percent of the 1971 total) are almost entirely non-utility real estate, but include also a relatively small amount (2 percent) of tangible personal property.
Taxation of tangible personal property is limited to that located and used in business within the State-with household furnishings and registered motor vehicles exempt. Since 1929, when a constitutional amendment authorized special treatment of personal property, tangible personalty has been entered on the rolls at legally specified fractions which differ from those applicable to taxable realty.
Personal property valuations. The statewide proportions of the general property tax base that were cited above reflect the authorized application of differing fractions of true value to various types of personal property. Under legislation enacted in 1967 and 1971, certain of these applicable fractions are in process of reduction: for farm personal property, from 50 percent in 1967 by annual intervals down to 10 percent in 1972 and zero thereafter; for business furniture and fixtures, from 70 percent in 1971 by annual intervals down to 50 percent for 1976 and thereafter; for merchants' and manufacturers' inventories from 70 percent in 1967 by annual intervals down to 50 percent in 1971 and then further by annual intervals to 45 percent in 1974 and thereafter. Personal property of public utilities is still legally subject to assessment at 100 percent of its true value and manu- facturing machinery and equipment at 50 percent. Except for farm personalty, the revised

fractions will be closer to (though still above) the general level of real estate assessments, which is discussed more fully below.
Tax relief for low-income elderly householders. Pursuant to a 1970 constitutional amendment, the legislature in 1971 and 1973 provided tax exemptions for homeowners aged 65 or older who have annual family income (owner and spouse only) of not over $10,000. The authorized reduction in the taxable value of the owner-occupied residence is graduated from the lesser of $5,000 or 70 percent of assessed value where household income is $2,000 or less down to the lesser of $2,000 or 40 percent of the assessed value where household income is from $6,000 to $10,000. Annual claims for the exemption are required.
General property tax relief. In 1971, as part of an omnibus tax program including adoption of new State taxes on personal and corporate income, the Ohio legislature en- acted an across-the-board reduction of 10 percent in all real estate tax bills, effective beginning with second half payments in 1972. Property owners will pay only 90 percent of taxes levied on their real estate holdings, while the State will pay the other 10 percent to the local taxing jurisdictions involved.
Use value of real property. A 1972 statute (S. B. 455) requires that current use of the land without regard to more intensive land use of neighboring properties be used in determining true and taxable value. Also, speculative factors cannot be used in deter- mining value. An Ohio Supreme Court decision later in 1972, however, held the current use provisions unconstitutional. Subsequently, a legislative resolution (H.J.R. 13) pro- posing a constitutional amendment to allow valuation of agricultural property according to current use was proposed, and it was adopted in 1973.
More specifically, H.J.R. 13 allows land devoted exclusively to agricultural use to be valued for taxation at current value for agricultural use. It also authorizes the passage of laws to recoup revenue upon conversion to non-agricultural uses. This constitutional amendment, approved in November 1973, became effective in January 1974 but requires legislation to implement it.
Like other States, Ohio provides complete tax exemption for the property holdings of governments, churches, educational and charitable bodies, and the like, subject usually to a test of usage as well as ownership. The statewide total of such wholly exempt property holdings in 1971, as locally assessed, was about $5 billion, or nearly one-fifth as much as the total for all non-utility real estate valuations subject to tax. About two-fifths of the exempt amount involved governmental holdings, while educational property made up nearly one-third, religious institution holdings nearly one-sixth, and other kinds of tax exempt property the remaining one-eighth.
The 1967 Census of Governments, which is the latest data available since the 1972 Census did not update this data, reported about 3.9 million parcels of taxable realty on Ohio's local assessment rolls. Of these, 60 percent were non-farm residential properties, which contributed 65 percent of statewide realty valuations; 1 2 percent were acreage and farm properties, accounting for 10 percent of the valuation total; and 25 percent were vacant lots, contributing 2.5 percent of realty valuations. The far less numerous commer- cial and industrial parcels accounted for 22.4 percent of all realty valuations-somewhat less than the corresponding nationwide proportion of 24.7 percent.
ASSESS1 NG RESPONSI BI LIT1 ES
Ohio's rather unusual arrangements on assessing responsibilities have continued without major change since they were detailed in the ACIR report of a decade ago. The State's role operates through several units of the State Department of Taxation, an agency headed by a Tax Commissioner appointed by the Governor. The Tax Commis-

sioner was previously subject to appointment for a four-year term but by a 1963 amend- ment the Commissioner's term was changed to be "at the pleasure of the Governor."
Within the Department, a line unit is directly responsible for certain assessments- the Property Tax Division. The Division administers entirely the statewide tax on intangi- ble personalty and also sets and geographically allocates assessments for the bulk of tangible personal property subject to general property taxation. A Departmental staff unit, the Research and Statistics Division, gathers and reports extensive data, including certain property tax statistics. However, responsibility for the measurement of local assessment level is vested, together with other important property tax duties, in the Board of Tax Appeals. This is an appointive three-member bipartisan body, nominally within the De- partment of Taxation but outside of the jurisdiction of the Commissioner.
The Board altogether has a staff of only 32, of which a majority a re concerned with appeal matters; only 11 are in the Division of County Affairs which conducts sales ratio studies and generally oversees local assessment work. Thus, although State activities con- cerned with property taxation involved costs of $2.4 million in fiscal 1972, equal to about one-eighth of 1 percent of statewide property tax revenue, the bulk of this was for ad- ministration of personal property taxes; work of the County Affairs Division involves less than $200,000, or only a miniscule percentage of all local property tax revenue.
Local assessment by the county auditor involves all taxable non-utility real estate and a limited part of taxable personal property. The auditor is subject to popular election for a four-year term. Most jurisdictions a re large enough to justify and sustain a professional assessing operation. There are only 15 counties of less than 25,000 inhabitants, and these altogether include less than 3 percent of the State's population. Conversely, nearly three- fourths of all Ohioans live in the 19 most populous counties, those of over 100,000.
Ohio laws require a complete reappraisal of taxable realty in each six-year period and this feature of the valuation process has been strongly emphasized in practice. All but a f ew Ohio counties engage professional appraisal firms for the sexennial reappraisal, and many even contract with such firms for the interim maintenance of assessment rolls. Hence, there has been less development of technically qualified personnel in the county agencies than might seem indicated by the scale of their assessing responsibilities. In nearly every county, the auditor employs at least one full-time deputy for assessment work. There is no State requirement that h e do so, nor do State law or regulations set up any qualifications, salary schedules, or other conditions for such personnel. The hiring of appraisal f i rms and appraisal plans, however, requires approval by the Sate Board of Tax Appeals.
Since the ACIR property tax study of a decade ago, there has been no material change in the powers vested in the Board of Tax Appeals. A relatively recent review of the Board's supervisory functions included the following high lights:^
In carrying out the assessment function, the county auditor is subject to the super- visory authority of the State Board of Tax Appeals. The Board has authority and responsibility to issue general rules and procedures to be followed in assessment; to review, order adjustments in, and accept the abstract of assessments each year; to review, order necessary changes in, and approve plans for periodic (sexennial) re- appraisals; to receive and act on applications for property tax exemptions; to calcu- late and publish each year the assessment ratios for each class of property, for each county and municipality; to advise county auditors on the assessment of specialized kinds of property; to review and act on proposed budgets of county auditors' of- fices . . .; and to hear and act on appeals regarding individual assessments.
The supervisory authority of the State is thus very broad. Unlike many other States, however, Ohio has not undertaken extensive programs to assist local assessors

in the effective performance of their duties; instead, it has depended on general rules coupled with effective enforcement devices to require certain standards of assess- ment . . . [in order] to place local officials under considerable pressure to develop and maintain acceptable standards of assessment. . . .
As has been noted, the supervisory role of the Board of Tax Appeals with regard to real estate assessment consists primarily of issuing rules and directives, with com- pliance enforced by the Board's power to withhold approval of the tax duplicate or contracts for reappraisal or even to direct the State Auditor to withhold State funds from counties that fail to comply with the Board's orders. Beyond this, the State has little to do with the process of assessment. The State does not train, examine, or certify assessment personnel; i t offers little in the way of technical assistance in eval- uating particularly difficult parcels of property; it prescribes only in general terms the assessment procedures to be used and the form in which records are to be kept; and it issues no assessment manual (although a few counties are reported still to be using one issued in 1937) but leaves it to the county auditor and the appraisal firm with which he contracts to determine the precise assessment techniques to be used. The State does only limited spot-checking of the results of sexennial reappraisals.
The sexennial reappraisal is the cornerstone of the real estate assessment system in Ohio. . . . Today virtually every county in the State is on a six-year reappraisal cycle. A fund is established in each county, consisting of a specified percentage of property tax collections each year, and the money in this fund is used to pay for the sexennial reappraisal.
. . . The Board's Division of County Affairs regularly publishes analyses of aver- age assessment ratios, coefficients of dispersion, average mill rates, and many other aspects of real property taxation.
The Board . . . supplies copies of laws, rules, and regulations but issues no ap- praisal manual, cost, price, or depreciation schedules, or news or reference bulletins. It requires county auditors to maintain tax maps and record systems but does not supervise their establishment.
Professional and technical services supplied by the Board are also limited, con- sisting principally of the consulting services of the Board's one appraiser. . . .
ASSESSMENT VARIATIONS
Legal requirements. The Ohio constitution authorizes statutory provision for the assessment of various classes of taxable personal property at differing fractions of their actual market worth, and, as noted above, the legislature has under this authority pro- vided for diverse treatment of particular kinds of property. In 1965, the legislature revised earlier statutory provisions, which called for assessment of real estate in full at its true value in money, and authorized the Board of Tax Appeals to set an assessment fraction for statewide application at not over 50 percent of full market value, to be applied to all taxable realty. Under this authority, the Board establishes a target ratio for the county assessor. The State also sets 10 percent (4 percentage points) as the tolerable range of deviation from the achieved assessment ratio for appeal purposes.
A series of property tax appeals carried to the Ohio Supreme Court during the 1960's, drawing upon evidence of significant differences in actual assessment level among coun- ties and types of taxable realty, culminated in the Park Investment Company decisions. The Court ordered the Board of Tax Appeals to proceed promptly to bring about sub- stantial uniformity in the level of realty assessments as among counties and property

classes. The legislature reacted by passing a bill to establish uniformity with assessment at the 35 percent level to be achieved over the next six-year cycle.6
State assessment ratio studies. Ohio has conducted statewide sales ratio studies on an annual basis for most of the years since 1946, but there was a hiatus in the mid-1960's after the operation had gotten seriously behind schedule. Since 1969, the development of annual findings has been considerably speeded. Statistical data comes from all measurable transfers of taxable realty, with no supplementation by appraisals. The ratio studies benefit by sales-price information available under the statewide transfer tax enacted in 1967. Resulting sales ratio averages are calculated statewide and for individual counties, municipalities, and townships, and, to the extent permitted by underlying source data, by class of property (residential, industrial, commercial, and agricultural). County-by-county data, by property class, are issued in annual bulletins of the Board of Tax Appeals.
Contrary to the practice in many other States that conduct extensive assessment ratio studies, the Ohio findings are not used directly for inter-jurisdictional equalization of assessments or tax levies, for the application of the State's relatively stringent legal lim- itations upon local tax levies and indebtedness, nor for the measurement of relative local tax effort in connection with equalizing grants for schools or other purposes.7 Hence, it is even more important there be a reasonable uniformity in the levels of real property assessment.
Actual assessment levels and variations. The 1972 Census of Governments estimated the average assessment ratio for taxable realty, as indicated by measurable sales, at 37 percent-a few points above the level indicated by the State's own studies. In recent years, with adjustments of valuations lagging behind market trends of realty, the assess- ment level has been dropping off. The 1972 State study reported an overall average of 31 percent, with residential property at that same level, commercial and industrial realty higher (32 and 37 percent), and rural realty-as in most other States-at a materially lower average level. Similar divergences among the various use classes were indicated for most individual counties. The countywide averages ran from 24 to 36 percent, with nearly one- third of the counties at 28 to 30 percent.
The State's study has increasingly been concerned with intra-county variations. For 1971, it indicated a coefficient of variation of at least 40 percent in more than half the counties, and coefficients of less than 30 percent in only five of the 88 counties. Undoubt- edly, dispersion measures for particular use classes of property would be lower. In fact, most of the 56 Ohio counties for which the 1967 Census of Governments reported 1966 co- efficients of dispersion for single-family house assessments showed up relatively well. For more than two-thirds of them, the figure was less than 20 percent, and for more than one-third it was under 15 percent with a State average dispersion of 16 percent. For 1972, the intra-area coefficient of dispersion increased to 19. As previously noted, since there is no equalization it is important in Ohio that there be substantial statewide uniformity of assessment level among as well as within particular use classes of taxable realty. It is a matter of concern, therefore, that the State's 1971 study showed a statewide coefficient of variation for taxable realty, as measured by measurable sales, of nearly 35 percent and that the Census showed an increasing coefficient of dispersion.
Availability of property tax data. Property owners are notified in writing of any changes in their assessments. Each tax bill also shows the assessed value and the aggre- gate applicable tax (though not the breakdown by taxing jurisdictions).
Data on assessed valuations are compiled by the Board of Tax Appeals and sum- marized in mimeographed tables that are available to the public. These data are also included in the Annual Report of the Ohio Department of Taxation, which reports as- sessed valuations and information on levies and tax rates for individual taxing jurisdic-

tions in each county. Also, as previously noted, average assessment ratios are published annually for individual counties, municipalities, and townships.
REV1 EW AND APPEAL OF PARTICULAR ASSESSMENTS
Despite its designation, the State Board of Tax Appeals is not solely an appellate body. Neither is there a complete divorce at the local level of original assessment and tax appeal responsibilities. Nonetheless, according to the Ohio Tax Study Commission Re- port, 1967, the State's arrangements for review of real property valuations seem to op- erate acceptably. The report described and commented on them as fol1ows:e
In Ohio real estate assessments may be appealed in the first instance to the coun- ty board of revision, consisting of the county auditor, the county treasurer, and the president of the county board of commissioners. A taxpayer may appeal his own valuation or that of another taxpayer or the classification of property as to real or personal. . . . [Under a 1965 enactment] a taxpayer has a prima facie case for tax relief if he can show that he has been assessed more than 10 percent above the common level of assessment in his county.
Further appeal is provided from decisions of the county board of revision to the State Board of Tax Appeals; the Board's decisions may, in turn, be appealed to the Court of Appeals or to the State Supreme Court. Instead of appealing from the coun- ty board of revision to the Board of Tax Appeals, a taxpayer may, if he wishes, carry his case to the Court of Common Pleas in the county in which his property is situated. From there too he has the right of appeal to the Court of Appeals or the State Su- preme Court. The Supreme Court may refuse to review a decision of the Court of Ap- peals but must hear any appeal carried to it from a decision of the Board of Tax Appeals.
Normally the vast majority of assessment protests are made at the conclusion of the sexennial reappraisal when new valuations are entered on the rolls. . . .
If the property owner is not satisfied with the response of the auditor's office to his protest, his complaint goes before the Board of Revision. Here, the taxpayer presents his case, documented with whatever information he has, and the auditor's staff or representa- tives of the appraisal firm defend the valuation they have determined. A formal record is established at this hearing.
While the county auditor himself sits as one of the three members of the Board, there- by, in effect, sitting in judgment on his own work, the political processes are said to work in such a way that the taxpayer receives a sympathetic hearing. Most appeals are settled at this hearing. The few that are carried further, to the Court of Common Pleas or the Board of Tax Revision [sic], consist largely of commercial and industrial properties.
The assessment appeals process in Ohio appears to work well. The process is simple and direct and readily accessible to the taxpayer. There is no fee, not even of nominal amount, involved in filing an assessment appeal; nevertheless, nuisance-type applications are not common. In having a formal record established before the county board of re- vision, with expert testimony received at that stage, Ohio has avoided the worst of the problems that other States have encountered.
'Some of the information for this report was supplied by James K. Hunter, Jr., Chief, Research and Statistics, Ohio Department of Taxation, and Professor Frederick D. Stocker, Ohio State University.
,Advisory Commission on Intergovernmental Relations, The Role of the States in Strengthening the Prop- erty Tax (1963). Vol. 2, p. 127. See also pp. 123-129.
31x1 that computation, in estimating both tax capacity and tax effort, property taxes on intangibles were counted in other categories.

4Correspondence with Professor Frederick D. Stocker, Ohio State University. SThe quoted paragraphs describing the Board's powers and activities do not comprise a single and con-
tinuous passage, but have been taken from: Ohio Tax Study Commission, Ohio Tax Study Commission Report. 1967 (Columbus, Ohio, 1967). pp. 47,49,53, and 54.
%egislation enacted in June 1972, is apparently intended to emphasize the Board's responsibility for assur- ing uniformity, as required by law and directed by the courts.
TAccording to the Ohio Tax Study Commission Report, 1967 (p. 52), " . . . it has been the practice of the Board [of Tax Appeals] to equalize assessments only through the establishment of the assessment level at the time of the sexennial reappraisal. . . . Each county, at the completion of the sexennial reappraisal, must submit the abstract of the full (market) valuations to the Board. The Board then attempts to ascertain through its own independent appraisal of selected properties the extent to which the reappraisal may have overestimated or underestimated market values on the whole or for individual classes of property. This information is then used by the Board to fix a percentage of the appraised value at which property shall be entered on the tax rolls. . . .
Property valuations in each county are thus, in effect equalized every six years. . . ." aOhio Tax. . .. Op. cit., pp. 56-57.

Oregon is one of the relatively few States that drastically raised its level of assess- ments for property taxation during the past decade, and is one of the few States (along with Kentucky and Alaska) where that level now closely approximates actual current mar- ket value. However, it is even more noteworthy that Oregon's legal action to raise assess- ments from 25 percent to 100 percent of market value was taken without the spur of liti- gation or judicial rulings, and that substantial compliance has apparently been achieved without popular uproar or the disruption of pre-existing fiscal arrangements.
A firm ground work for this significant change had been laid mainly in the 1950's and early 1960's, when, as detailed in the ACIR report of a decade ago, Oregon greatly im- proved and strengthened its property tax system. The past decade's developments in Oregon property tax administration-aside from the provision for full-value assessment beginning in 1968-have represented further evolution of institutions and practices pre- viously developed. However, there has been significant legislation affecting the coverage and impact of the property tax, especially including a start on elimination of business inventories from the tax base, provisions for preferential assessment of farm and forest lands, and tax relief provisions for elderly and limited-income homeowners.
FINANCING ROLE OF THE PROPERTY TAX
Oregon's revenue structure involves relatively heavy reliance upon property taxation, although the State government itself has not imposed a general property tax levy for sev- eral decades. More than one-third (37 percent) of all the general revenue raised by the State and local governments in fiscal 1970-71 was provided by property taxation, re- flecting no change from the share of a decade before. (During the same interval, in the nation as a whole, the property tax proportion dropped from 38 percent to 32 percent.) For instance, the per capita property tax is $204 relative to the national average of $184 and the tax per $1,000 of personal income is $56 relative to the average of $47.
In an ACIR study, Measuring the Fiscal Capacity and Effort of State and Local Areas, it was estimated that Oregon's property tax load, relative to its capacity, was about 13 percent above the U.S. norm; farm properties were 58 percent above the norm, commer- cial and industrial properties were 21 percent higher, while non-farm residential property was 1 percent below the norm. The State's overall index of State-local tax effort how- ever was only a point above the national average.
Seventy-eight percent of the State's 1,446 local government units (as of 1972) have property taxing power, and for most of them this is a major financing source. It supplied over 72 percent of all the general revenue raised by Oregon local governments in fiscal 1970-71, or nearly half of their total general revenue including intergovernmental receipts.
THE PROPERTY TAX BASE
The dollar total of assessed valuations for general property taxation in Oregon mul- tiplied some fivefold between 1961 and 1971, with much of the change resulting from a marked increase in the prevailing assessment level, as more fully described below. There was relatively little shift, however, in the shares represented by the three major compo- nents: locally assessed personal property, which in 1971 made up 12 percent; State assessed public utility property, 10 percent; and real estate subject mainly to valuation by local assessors, 78 percent. Of this real estate portion, about one-fifth consisted of valua- tions actually set by the State property tax agency on industrial improvements and tim- ber in certain counties. Taking these valuations into account, the State set proportion of

the statewide property tax base was a little over one-fourth, which is considerably more than the corresponding proportion in most other States.
The foregoing percentages refer to the net taxable assessed value base after deduction of various allowable partial exemptions, which in 1971 equaled 3.9 percent of the gross pre-exemption total. Somewhat over one-third of these allowances resulted from home- stead exemptions provided for certain elderly persons and veterans, with the balance mainly involving various types of personal property, particularly business inventories, livestock, and agricultural products.
Farm land valuation. Under a succession of enactments from 1961 on, farm land com- prising a considerable and growing proportion of the State's rural areas must be assessed for taxation solely by reference to its value for farm use. This development began in 1961, when the legislature authorized county zoning commissioners to designate exclusive "farm use zones" and provided that land actually used for farming in such zones be as- sessed solely according to such use and without reference to its value for other prospec- tive uses. Subsequent legislation provided for the same valuation approach for land actually used for farm purposes outside of farm use zones, but only upon application by the owner and subject to his becoming liable, when the land becomes disqualified for farm use assessment, for the additional taxes which would have been due in the absence of such preferential valuation, plus interest, for the period involving farm use assessment up to a maximum of five years.
Recent enactments specify certain guidelines for the official valuation of farm lands. Thus, if recent sales are used as comparables, they shall be under conditions that justify the purchase of such agricultural land by a prudent investor for farm use-i.e., a person who purchases with the reasonable expectation that he will be able to realize an average annual return on his capital not less than the current rate of interest charged by the Fed- eral Land Bank on first mortgages of farm land in the county. Furthermore, when com- parable sales figures cannot be utilized, the assessed values of agricultural lands shall be arrived at by utilizing an income approach applying the typical capitalization rate used for appraising non-agricultural commercial land in the area in which the agricultural land is located. The Department of Revenue shall determine and specify such rate, and shall certify such rate to the county assessors.
The legislature has also provided for a special board of review in each county to ad- vise the county assessor on the factors he uses for farm land valuation. This is a five- member body of "persons knowledgeable and experienced in agricultural land values and sales figures," two named by the assessor, two by the county governing body, and the fifth member by the other four.
A Department of Revenue study estimated that, in 1970, these preferential assessment provisions resulted in a curtailment of valuations amounting to nearly $600 million, or more than one-fifth of the estimated market value of all taxable land outside of munic- ipalities. About three-fourths of this sum involved property outside of exclusive farm use zones, and thus subject to possible later payment of deferred taxes. The potential added tax thus deferred that year was $9.9 million, or 2.4 percent of the statewide total of property taxes levied; in each of five counties, the proportion was at least 10 percent.
Forest land valuation. Recent legislation also provides for a similar special approach to the assessment of land devoted to growing and harvesting timber. Such land is to be valued solely according to its worth as forest land, but only upon application by the owner, and (as in the case of agricultural land outside of farm use zones) subject to his liability for payment of additional taxes and interest for up to five years of such distinc- tive timberland assessment if the land is taken out of timber production.
Assessment of business property. Taxation of business inventories (including live- stock) is being phased out. Legislation enacted in 1969 provided for its assessment at de-

creasing proportions of full market value, dropping annually (from 100 percent in 1968) by five-point intervals to 80 percent in 1972, and thereafter by ten-point intervals to reach zero in 1980. The 15 percent devaluation that applied to such property in 1971 reduced the statewide aggregate tax base by a little over 1 percent, indicating that when the phasing out process has run its course it will involve an overall tax base reduction of around 8 percent.
A considerably less significant change in business property taxation was provided by a 1967 law authorizing exemption for periods up to 20 years of pollution control facilities constructed from 1967 through 1978, unless the owner elects instead to take a tax credit authorized under the State's corporate excise tax.
Property tax deferral for elderly homeowners. A 1963 law, subsequently amended, authorizes any elderly homeowner (generally, those over 65) to receive, pursuant to an approved request, an indefinite deferral of the current annual property tax levied upon his domicile. The tax continues to be due, and may be paid at any time (with accrued interest at 6 percent) by the property owner or with his concurrence by certain others on his behalf. The deferred amount, with interest, becomes a lien on the property, and must be paid within one year after the death of the taxpayer or a surviving spouse aged 60 years or more, or when the owner sells or moves out of the property. Local taxing juris- dictions are reimbursed by the State, on a current basis, for the taxes thus deferred. Such distributions for the 1971-72 fiscal year amounted to $92,480.
Tax relief for limited-income homeowners. Replacing earlier provisions, the 1971 and 1973 legislatures enacted an arrangement by which the State pays a portion of the annual local property tax due on the owner-occupied residences of limited-income resi- dents. (Parallel benefits are provided for residents of non-profit homes for the elderly.) Refunds are equal to the realty tax on homesteads subject to dollar limits per claim that range inversely according to the taxpayer's income from $100 to $490.
The structure follows:
Household Income
$ 0- 499 500- 999
1,000- 1,499 1,500- 1,999 2,000- 2,499 2,500- 2,999 3,300- 3,499 3,500- 3,999 4,000- 4,999 4,500- 4,999 5,000- 5,499 5,500- 5,999 6,000- 6,499 6,500- 6,999 7,000- 7,499 7,500- 7,999 8,000- 8,499 8,500- 8,999 9,000- 9,499 9,500-14,999
15,000+
Maximum Claim for Owners
$490 475 460 440 420 400 390 375 360 340 320 300 275 250 225 200 175 150 125 100
0
Maximum Claim for Renters
$245 237 230 220 21 0 200 195 187 180 170 160 150 137 125 112 100 8 7 75 62 50
0

Seventeen percent of net rent is assumed to be a payment for property taxes, but the renter is faced with maximum claims of one-half those of homeowners. The State's fiscal 1972 appropriation for the resulting reimbursements to local government (or refunds to taxpayers) amounted to $16.4 million, or about $7.50 per capita for the State's population. (If refunds are less than $66 million before June 30, 1974, for taxes paid in 1973, refunds will be granted to people with income up to $20,000.)
Long-standing complete exemptions from the general property tax base include intangible personal property, motor vehicles, and household goods and personal effects. Oregon also provides for the usual exemptions of property holdings of governments and of property used for defined religious, educational, and charitable purposes. It is one of the few States that maintain valuation records concerning these latter types of exempt property. In 1971, statewide exempt real property valuations amounted to $9.3 billion, nearly three-fifths as much as all taxable real property values, or about 45 percent as much as the assessed valuations for all types of taxable property. Governmental holdings made up $7.7 billion, or about five-sixths, of such recorded complete exemptions.
The latest available Census data (for 1966) reported 835,000 parcels of locally assess- able realty in Oregon. Of these, 58 percent were non-farm residential properties, con- tributing 53 percent of all realty valuations, and 22 percent were acreage or farm prop- erties (including taxable forest lands) that accounted for 22 percent of realty valuations. The far smaller number of commercial and industrial properties (3 percent) contributed 23 percent of all realty valuations, or slightly less than the U.S. average proportion of 25 percent.
ASSESS1 NG RESPONSI BI LIT1 ES
As in most other parts of the nation, the task of property valuation is shared by State and local agencies. For many years, the State's role operated through an appointive three- member Tax Commission. Legislation in 1969 replaced the Commission by a Department of Revenue, headed by a Director appointed by the Governor. The Department was given .all the responsibilities previously assigned to the Commission, plus the duty of adminis- tering the State's inheritance and gift taxes, previously handled by the State Treasurer.2
Property tax work of the Department of Revenue involves a staff of 155 persons, only a few more than the number employed a decade earlier by the predecessor Tax Commis- sion. The Assessment and Appraisal Division's 1972 budget of $2.5 million (principally, though not entirely, for property tax work) is equal to approximately one-half of 1 percent of statewide property tax revenue. This materially exceeds the corresponding percentage for the same type of agency in most other States-no doubt reflecting the very significant degree to which assessment work in Oregon involves collaborative local and State efforts, rather than, as is so common elsewhere, a relatively limited State role.
The need for extensive central agency participation in property valuation efforts is particularly obvious in Oregon, since many of its local assessing jurisdictions are so small in population as to face serious difficulty in providing for competent professionalized assessment. Local responsibility rests with an assessing office in each of the State's 36 counties. Although five of these have populations of over 100,000 (and together include three-fifths of the State's population), there are ten counties with fewer than 10,000 inhabi- tants, another seven with only 10,000 to 25,000 residents, and eight others of 25,000 to 50,000.
Of the State's four home-rule counties, three have an appointive assessor; the fourth, like each of the 32 general-law counties, has an assessor elected for a four-year term. Under legislation dating from 1955, local appraisals of real property can be made only by State certified appraisers.
The State-local distribution of responsibilities has continued essentially as detailed in the ACIR property tax report of a decade ago. The Department of Revenue's responsibili-

ties include central assessment of public utility property and extensive control over and assistance to local assessors with other types of property. The Department has direct statutory responsibility for the property tax assessment of growing timber in the western part of the State (in the eastern counties, timber is subject to a severance tax instead). In addition, the Department appraises certain industrial improvements in all but a few counties, under annual contracts involving 50-50 aost sharing by the State and the coun- ties involved. Such contract appraisal work especially focuses upon major properties, but in the less populous counties is commonly extended to deal with all or the bulk of busi- ness property improvements.
Early in the 1960's, the reappraisal program which had begun a decade before was completed, and attention by the State property tax agency was increasingly devoted to the less dramatic, but no less demanding tasks involved in the maintenance and updating of assessment rolls, including the adjustment of valuations to take account of price level changes as well as property improvements.
Following completion of the reappraisal program in 1964, the Commission began contracting with small counties to maintain their ownership tax maps. At present, the Department is maintaining maps for 15 counties that do not have enough map work to warrant their engaging a full-time draftsman.
During the 1964-66 biennium, the Tax Commission published an industrial property appraisal manual, designed to improve the appraisal of industrial plants by both county and State personnel, and to inform property owners of the valuation methods employed.
Two recent enactments have further strengthened the supervisory role of the State property tax agency. A 1967 law requires the Department of Revenue to examine the assessment ratio for each taxing district. If the ratio deviates by more than 10 percent (5 percent after 1974) throughout the county or in specific areas in the county, the Director can order the assessor to bring the class to 10 percent deviation of cash value. When ap- praisals are not conducted as required by law, the Department of Revenue will make a written report prior to February 1 to the appropriate county officials. The county has until October 1 to correct the problems. If not corrected by that time the Department of Revenue will use "most practicable means to cure the deficiency, including but not lim- ited to the use of its own employees. . . ." The county is required to finance the full ex- penses of the necessary corrective actions. Unless other provisions are made by the county, reimbursement will come from the county's share of the State's cigarette tax and liquor revenues. These provisions give Oregon's Department of Revenue what is probably the most effective supervisory statutes found any place in the nation.
To date, no formal "orders" have been issued under this authority. However, the Department has undertaken each year to examine in particular detail the assessing opera- tions and performance of six counties, and to report its findings and suggestions in written (though not published) form to the county governing bodies, as well as to the assessor.
A 1971 law which was amended in 1973 changed the standards for equalizing property values. The Department of Revenue is now required to determine annually the ratio of assessment for each class of property in each county and to order adjustment of the value on the roll if a class is more than 10 percent above or below the required ratio of 100 percent, After January 1976, the percent deviation is reduced to 5percent. Previously, such action was mdndatory only where the county's overall assessment ratio was out of line by more than 10 percent.
ASSESSMENT LEVELS AND VARIATIONS
Legal requirements. As indicated by the earlier ACIR report, assessment studies con- ducted in the 1950's had shown a considerable range among counties in prevailing levels of assessment for taxable realty-i.e., in 1950, from 68 to 37 percent, with the median

county at 54 percent, and in 1957 from 48 to 22 percent, with the median county at 30 per- cent. The legislature then provided that beginning with 1961 (subject to certain transitional exceptions) the general target assessment ratio should be 25 percent. (Since 1955, the State had required that each county assessor regularly post and publicize his intended assess- ment ratio.) As the transitional provisions gradually became inapplicable and the re- assessment program became effective statewide, the 25 percent level became increasingly prevalent; by 1964 all except one, and by 1966 all, county assessors were posting a 25 per- cent ratio. By the early 1960's also, the assessment fraction for State set valuations had been brought down to conform to the ratio applicable to locally set valuations. These developments provided the background for a major statutory change adopted in 1967, requiring that from 1968 on the general assessment level should be 100 percent of true cash value, except as this is modified by certain specific exceptions or departures.
No doubt one factor which facilitated this drastic shift in the legal general assessment level was the fact that Oregon had traditionally made far less use than some other States of detailed restrictions on local property tax levies in the form of tax rate limits. Instead, it had for many years set restraints mainly in the form of limits on the year-to-year per- centage change in the dollar amount of levies imposed by various taxing jurisdictions; such restrictions were not directly affected by the fourfold multiplication of the property tax base that resulted from the legal change in assessment level.
Assessment-sales ratio studies. Statewide surveys to ascertain the prevailing level of real estate assessment in each county have been conducted annually for many years, in- volving efforts both by the county assessors and the State Department of Revenue. As explained in the Department's 1971 sales ratio report, "in those counties that have a well planned sales confirmation program, the sales data used by the Department is based pri- marily upon the sales records maintained by the assessor. However, independent studies are made by Department personnel in those counties when compliance studies (under Oregon Revised Statutes 308.061) are being made or where there is questionable sales data. In some instances, the independent study will be on a single class of property and in other cases it will include all property classes. To measure the reliability of the as- sessor's study, Department personnel check the quality and quantity of sales data in each county throughout the year. . . ." These studies take advantage mainly of sales-price infor- mation concerning recent property transfers that becomes available under a State law which requires that any instrument of transfer must carry a statement of the considera- tion involved in the transfer. Such information is supplemented by prior year sales data, and sample appraisals, in areas and for types of property which are considered to be in- sufficiently represented by current sales information. Recent statewide surveys have typically dealt each year with some 25-30,000 relevant transfers.
Findings from these recurrent studies appear in an annual Department publication which includes, for each county by class of taxable real property, information as to the number of sales used, the indicated average assessment ratio (the arithmetic mean), aver- age deviation, coefficient of dispersion, and weights reflecting the proportions of all tax- able realty assessments represented by particular property classes. The report also shows for each county the composition of the local assessment roll by broad property classes, and the true cash value overall and for various classes, as derived from the assessed valuations and the ratio findings for locally assessed realty.
As previously noted, assessment ratios for most farm land and timberland must be calculated according to value standards that apply uniquely to such property classes. Local assessments of taxable property enter into the estimate of true cash value at a full 100 percent rate, and this is true also for any State set valuations of industrial improve- ments and of timber that may be part of the assessment roll.
Assessment levels and variations. Findings from the recurrent studies have indicated

a lessening of both inter-county and intra-county variations of assessment level during the past decade. In 1971, the estimated statewide average ratio was very close to 100 percent, with most counties within a few points of this. There was a range for locally assessed realty of only 9 points in the individual county averages (from 92 to 101 percent) and for all taxable property (exclusive of State set utility valuations) from 93 to 101 percent. As would be expected, materially greater differences often appear in the average 1971 assessment ratios of particular classes of property in particular counties, but even these are generally quite close to the county's overall average, except for relatively minor prop- erty classes. Intra-county measures of dispersion, as reported for 1971, also suggested in most instances a respectable uniformity of assessment for property classes that involved a considerable volume of measurable sales. For urban residential property-nearly every- where the largest class in terms of valuation and number of measurable sales-the re- ported coefficient of dispersion was less than 20 percent for all except six of the 36 coun- ties; in five cases it was less than 10 percent, and in another 16 counties it was between 10 and 15 percent. Using 1972 Census data, the intra-area coefficient of dispersion at 14 was the lowest in the nation, tied with Connecticut, Nevada and Wisconsin. The inter-county coefficient was five, second only to Utah with four. (The comparable figures in the 1967 Census were 19 and five.)
Application of study findings. Under long-established legal provisions the State's determined assessment level enters into the calculation of certain State grants for schools and other purposes, as well as the inter-county equalization of taxes levied by multi- county local governments. Within-county findings for particular classes of property have also been used by the Department of Revenue in its efforts to promote improved local assessment work. The Department's powers on this score, as noted above, have been materially increased by a 1971 enactment authorizing it to require a county to revise the valuations for any particular class of property that is found to be materially out of line. Under the new law, such orders may be made applicable on either a countywide basis or for specific areas of the county.
Availability of property tax data. As reported in the ACIR study of a decade ago, Oregon's laws and practices have traditionally evidenced concern for adequate reporting and public information with regard to property taxes. This continues to be illustrated by the reports and issuances of the Department of Revenue, including its annual assessment ratio study. According to the Department, the county assessors and tax collectors also have, in recent years, improved their related informational reporting through tax sum- maries, code area rate sheets, and informational bulletins to taxpayers.
There has been only one material recent change in legal provisions on this score. A 1971 law requires the assessor to give a personal property taxpayer a specific notice of increased value if he increases the assessed value of personal property reported on the taxpayer's return by more than $1,000 or 5 percent. The assessor must also give specific notice in any instance where he assesses personal property for taxation without the bene- fit of a personal property return having been filed.
'Some of the information for this report was supplied by Harry J. Loggan, prior to his recent retirement as Assistant Administrator, Assessment and Appraisal Division, Oregon Department of Revenue.
2Although not directly involving property assessment, another activity with an important bearing on local government finances has developed during the past decade. In 1964, the State Tax Commission activated a Local Budget Section to administer a 1963 law which made the Commission responsible for providing instructional material and forms to aid municipal corporations in the preparation of their budgets. As continued in the De- partment of Revenue, this effort is receiving increased attention. The Local Budget Section reviews budgets of the various municipalities for conformity with good accounting practices and statutory requirements, and pro- vides advice for their correction and improvement.

Pennsylvania's property tax arrangements have not been materially altered during the past decade, although proposals now before the legislature contemplate important changes, including provision for the exercise of State oversight of local assessment work through an agency having the kinds of supervisory powers provided for in numerous other States. Recent statutory developments may grant an assessment preference to im- provements made in blighted area residential property, for a system of State financed property tax relief for low-income elderly homeowners and for flood damaged proper- ties. The long-standing and significant program for statewide measurement of assessment- sales ratios has continued, but has not been used in statistical efforts to measure and cur- tail assessment variations within particular local areas.
Changes in property tax administration may be forthcoming in 1974 with a bill in com- mittee which (1) replaces the present State Tax Equalization Board with a Department of Community Affairs, (2) requires certification of county directors of assessment and as- sessors, and (3) allows for two or more counties to jointly appoint a director of assessment.
FINANCING ROLE OF THE PROPERTY TAX
Property taxation contributes a considerably smaller share of State-local revenue in Pennsylvania than in most other States outside the South. It accounted for only 25 percent of all own-source revenue raised by the State and local governments in fiscal 1970-71, which compares with an average nationwide proportion of 32 percent. The difference reflects extensive use of non-property taxes by local governments, as well as the rela- tively restricted legal base for general property taxation, discussed below. Relative tax burdens on a per capita and income basis are also below national averages with the State receiving $131 in per capita property taxes (relative to $184) and $34 per $1,000 of personal income (relative to $47).
In the ACIR study, Measuring the Fiscal Capacity and Effort of State and Local Areas, it was estimated that Pennsylvania's overall property tax load relative to its capacity was 18 percent below the national average. However, non-farm residential properties were 21 percent over the national average and farms were 9 percent over, while commercial and industrial properties were 53 percent under the national average. The State's composite effort index for all State and local taxes was about the same as the U.S. norm. This prop- erty tax showing largely reflects the fact that the legal base here excludes some kinds of business property commonly taxable in other States.
About 3,200 of the 4,935 local governments have property taxing power, and for most of them this is a major revenue source. However, for several decades the State has author- ized local governments to use various kinds of non-property taxes. Relatively low rate but still productive personal income taxes are imposed by some 3,100 local jurisdictions in Pennsylvania, including Philadelphia, Pittsburgh, and a dozen other sizable cities, as well as many smaller municipalities, townships, and over 500 school districts.
The bulk of all property tax revenue in Pennsylvania is from local general levies, but there are also statewide special taxes on public utility property and certain intangible personalty.
During the 1960's, per capita property tax yields in Pennsylvania increased 6.9 percent a year, outpacing the 5.8 percent growth rate of per capita personal income. Official valua- tions for property taxation were increasing far less rapidly-under 3 percent annually-so that rates applied to the officially valued tax base were generally rising.

THE PROPERTY TAX BASE
Local general property tax levies in Pennsylvania apply to real estate, exclusive of that used for railroad or other public utility purposes. All personal property is legally exempt, but the applicable definition is somewhat narrower than often applied, so that some kinds of business equipment that elsewhere would be considered personal property are part of the real estate tax base in Pennsylvania. All valuations are set by local asses- sors; hence, unlike the situation usually found elsewhere, the general property tax base includes no State set valuations.
Utility property tax. A 1970 law provided for a special statewide tax on the defined real estate (lands and structures, but not equipment) of public utilities, exclusive of rail- road rights-of-way and right-of-way structures. The law applies a uniform 3 percent tax on the "State taxable value" of such property, defined as its cost less reserves for depreciation and depletion. The law also makes more explicit and comprehensive the previous substantial exemption of such utility real estate from local general property tax- ation. Proceeds from this tax ($31 million in fiscal 1970-71) are distributed to local govern- ments in proportion to their respective receipts from all locally imposed taxes.
Residential improvements in blighted areas. Under a 1971 enactment, local taxing jurisdictions are empowered by ordinance to exempt from property taxation, on a de- creasing proportion basis over a period of up to ten years, increases in assessed valua- tion attributable to improvements made in deteriorated neighborhoods. The law sets a ceiling on the improvement costs eligible for such treatment-initially, $10,000 per dwell- ing unit, unless the local government sets a lower maximum. A property owner who wishes to obtain such an exemption must file a request at the time he obtains a building permit or begins construction work.
Tax relief for low-income elderly homeowners. Another 1971 law, as amended in 1973, although it does not directly affect property tax assessments or levies, has a signifi- cant potential effect on tax burdens. The 1971 law provided for State rebates of all or part of local property taxes paid on homesteads for certain eligible persons who have annual household income, broadly defined, of less than $7,500. Subject to the income limit, a per- son aged 65 or over (or living with a spouse aged 65 or over), a widow aged 50 or over, or a permanently disabled person was able to claim tax relief. In 1973, the elderly homeowner provisions were extended to renters who can consider 20 percent of their rent as property taxes. Widowers age 50 and over were also allowed the low-income tax relief under the following schedule:
Household Percent lncome Allowed
Household Percent Income Allowed
The maximum claim is $200.
TAX ABATEMENT FOR FLOOD DAMAGED REAL PROPERTY
Passed by the first special session of 1972 and amended in 1973, this act authorizes local taxing units to abate 1971 and 1972 taxes on real property which has been damaged or destroyed by floods. The abatement is in proportion to the damage measured by re- duced assessed valuations with a limit of $25,000 for each unit of property. The flood

damage change in value is deemed to have occurred at the first of the assessment year. If taxes had already been paid, they may be refunded or credited against future property taxes.
Pennsylvania provides for the usual kinds of exemptions for property holdings of governments, churches, educational and charitable organizations, but does not accumulate data concerning the value of such property holdings.
The 1967 Census of Governments (but not updated in the 1972 Census) identified about 3.8 million parcels of taxable realty in Pennsylvania. Of these, 73 percent were non-farm residential properties, which accounted for 66 percent of the statewide valuation total. Acreage and farm properties made up 7 percent of all the parcels and 4 percent of all valuations. Commercial and industrial properties accounted for 28 percent of statewide assessed valuations.
ASSESS1 NG RESPONSI BI LIT1 ES
Like Delaware, Pennsylvania lacks any State agency with assigned responsibility for oversight of local assessment administration, although some activities of the kind handled elsewhere by such agencies are carried out by the State Tax Equalization Board and the Department of Community Aff airs.2
As was true a decade ago, the task of property valuation is mainly assigned to a chief assessor in each of the State's 67 counties. These officials are appointed by the county governing bodies. They are supplemented by several thousand borough and township as- sessors-most of whom are subject to popular election for four-year terms, and compen- sated on a per diem basis.
Most Pennsylvania counties are large enough to justify and afford a full-time profes- sional assessing operation. Nearly half of them have populations of over 100,000 (includ- ing Allegheny and Philadelphia City-County, each with over 1.6 million residents), and these comprise 85 percent of the State's total populations. There are only nine counties with less than 25,000 population.
As indicated in the ACIR report of a decade ago, the State Tax Equalization Board was set up in 1947, primarily to provide data needed for equitable distribution of State school aid.3 Its work is briefly described below under "Actual Assessment Levels and Variations."' The Board itself is a three-member appointive body. It has 43 employees, the same as its staffing a decade ago. Its 1972 budget of $560,000 amounted to only about one- thirtieth of 1 percent of statewide property tax revenues.
ASSESSMENT VARIATIONS
Legal requirements. One Pennsylvania statute calls for the assessment of taxable property at its actual value, but another long-standing provision authorizes counties of the fourth to eighth classes (i.e., those of less than 150,000 population] to specify and apply a fraction of up to 75 percent of actual value for assessments. (By a 1965 amend- ment, authority to set the applicable fraction was vested with the respective county gov- erning bodies rather than, at least implicitly, the assessors.) Furthermore, cities in such counties are authorized to apply to the actual value of taxable realty within their bounda- ries an assessed value fraction for the application of city tax levies which is different from that set by the county board (but also subject to a 75 percent limit).
State assessment ratio studies. Since its establishment in 1974, the State Tax Equaliza- tion Board has conducted annual statewide sales ratio studies. This effort applies to a11 measurable arms length realty transfers, and benefits from property value information becoming available under the State real estate transfer tax, dating from 1951. (Numerous local governments in Pennsylvania also impose such taxes.)

Results of this effort are summarized in an annual Board publication, which shows statewide, by county, and for individual school districts, the locally assessed valuation of all taxable realty, the estimated market value of such property, and the related percent- age ratio of assessment to market value. Another Board annual report gives similar data for individual municipalities. These presentations do not include measures of assessment level dispersion for the reported areas. The ratio developed for each area is a weighted average. The weighting process involves accumulation of data separately for various classes of taxable realty (generally similar to those reflected in the property tax reports of the periodic Census of Governments), and for individual municipalities and balance of county areas.
As indicated by the ACIR report of a decade ago, this undertaking developed mainly as a means for measuring relative local tax effort in connection with State equalizing grants for public schools. That is still the most important statutory application of the find- ings, although they are also used as factors in various other State-local grants, as well as in the application of legal limits on local taxes imposed by school districts that cross county lines or the boundaries of municipalities which use a different assessment fraction than that of the county in which they are located.
Actual assessment levels and variations. The State Board study of 1970 assessments reported a statewide average assessment ratio of 42 percent, with averages for individual counties ranging from 18 percent (Wayne County) to 67 percent (Philadelphia City- County) and mainly clustering around 30 percent. The 1957, 1962, and 1967 Censuses showed statewide Pennsylvania averages in the low 301s, and subsequent trends in as- sessed valuations suggest, if anything, some subsequent downward drift in assessment level. The 1972 Census ratio was 27.
The 1967 Census also reported on variations of assessment ratios (as indicated by sample sales) for single-family houses in 49 Pennsylvania counties. Only three of these showed a coefficient of dispersion of less than 15 percent, and less than one-third were below 20 percent, as compared with more than half of the entire nationwide Census sam- ples of assessing areas similarly reported. For one-fifth of the sampled Pennsylvania coun- ties, in fact, the dispersion measure was at least 40 percent-a degree of variation found in only one-tenth of the nationwide Census sample. The median value intra-area coefficient of dispersion was 26 percent. By the 1972, Census this figure had declined to 25. The inter- area coefficient of dispersion was 23 percent in 1967 and had increased to 26 percent in 1972.
REVIEW AND APPEAL OF PARTICULAR ASSESSMENTS
As common in other States, taxpayers' assessment appeals are brought to local boards of assessment. Such boards are either appointed by the county commissioners or (in counties of the fourth to eighth class) are composed of the county commissioners them- selves). There is no State body for. review of particular assessments. Appeals from deci- sions of the local boards may be taken to the courts.
'Much of the information for this report was provided by James W. Guest, Director. Bureau of Policy Plan- ning and Information, Pennsylvania Department of Community Affairs, and Warren H. Barton, Director of Op- erations, Pennsylvania State Tax Equalization Board.
2An extensive study by a Special House Committee on Real Estate Taxation resulted in the introduction in the 1972 legislative session of a proposed "Consolidated Real Estate Assessment Law." This legislation would assign broad and explicit powers for assessment supervision to the Department of Community Affairs. It also contemplates numerous other major changes, including provision for an appointive director of assessments in each county, State examination and certification of such directors and their subordinate appointive assessors, an appointive board of assessment appeals in each county, and the valuation of realty for property taxation at its

full market value. Although it was not enacted, it is anticipated that this move toward assessment reform will be given serious consideration in future sessions of the legislature.
3The Role of the States iil Strengthening the Property Tax (19631, Vol. 2, pp. 142-143. Tunctions and procedures of the Board are detailed in a recurrently updated report, "The Equalization
Board Story."

SOUTH DAKOTA1 South Dakota has significantly moved to simplify and improve its property tax ad-
ministration during the past decade. It has reduced the number of local assessing areas from several hundred to 72, and all such jurisdictions are now served by appointive rather than elective assessors. The State has maintained its long-standing and highly useful program for the measurement and publication of assessment ratios and continues to pro- vide important technical guidance and assistance to local assessors.
Tax relief has been granted the elderly and new structures or additions can be assessed at reduced value for the first two years following institution.
FINANCING ROLE OF THE PROPERTY TAX
The State-local revenue structure of South Dakota involves very heavy reliance on property taxation.2 In an ACIR study, Measuring the Fiscal Capacity and Effort of State and Local areas, it was estimated that the property tax load, relative to capacity, was 38 percent above the national average-a level exceeded by only a handful of other States; it was 81 percent above the national average for non-residential properties, the highest in the nation; 57 above for commercial and industrial properties; and 11 percent above for farm properties. In contrast, the State is only 7 percent above for all taxes.
Property taxes accounted for 42 percent of all the general revenue raised by the State and local governments in fiscal 1970-71. (This compares with a national average propor- tion of 32 percent.) The State government itself levies no property tax, but the property tax accounted for 80 percent of all own-source general revenue for local governments in the State. Nearly all of South Dakota's 1,770 local governments have property taxing power.
During the past decade, the per capita yield from this tax source nearly doubled in South Dakota, rising at nearly 7 percent a year. (By 1971, the per capita yield reached $240-$56 above the national average.) This change equalled the growth rate of the State's economy, as measured by personal income, so there was relatively little change in the relation of property tax revenue to personal income ($76 per $1,000 in fiscal 1970-711, which is the highest tax burden on personal income among all the States. (For comparison, the national average is $47.) The official tax base represented by assessed valuations was moving up at a slower pace (about 3.4 percent annually], so that applicable tax rates rose considerably.
THE PROPERTY TAX BASE
As in most other States, the tax base here involves three major components, which in 1971 made up the following proportions of the statewide total: locally assessed real estate, 74 percent; locally assessed personal property, 22 percent; and State assessed public utility property, 4 percent. The local real estate share has been growing; a decade earlier it made up 70 percent of the total while the other components were 25 and 6 percent, respectively.
Until recently, South Dakota had no financially significant partial exemptions such as are granted by some other States to veterans, homeowners, or elderly property owners. However, in February 1972, the legislature provided tax exemption of $1,000 off the assessed value of owner-occupied single-family dwellings of low-income elderly individ- uals and married couples if:

1) they are 65 or older;
2) their Federal taxable income is less than $4,000 ($2,400 for single persons);
3) they have owned their home for three years or have been residents for five years.
Legislati~n also exempts the dwelling of a paraplegic veteran or his widow.
This State authorizes the usual complete exemptions commonly allowed for prop- erty holdings of governments, churches, charitable, and educational institutions, and the like. On this score, however, South Dakota is unusual in two respects: (1) it makes in lieu payments to certain local governments for the property tax revenue of which they are deprived as a result of the exempt status of certain State land; and (2) it regularly assem- bles data as to the assessed value of wholly exempt real estate, by ownership class. State- wide data for 1970 valued such property at over half the aggregate for taxable realty. Gov- ernmental holdings made up more than 70 percent of the exempt total, religious property about 1 2 percent, and other components smaller proportions.
Unique among the States is a 1973 law which requires the county auditor to annually publish in county newspapers a list of all tax exempt property showing the legal owner, a description of the property as well as its use.
A number of other curtailments of the property tax base have been authorized by enactments of the past decade. These include provision made in 1966 for the freeport exemption of tangible personal property (exclusive of livestock] destined for out-of-State shipment, and power granted in 1970 and 1971 for individual counties to provide partial exemptions for two years (75 percent the first, 50 percent the second] on the otherwise taxable value of new structures or structural additions.
Of far more potential significance was the 1970 enactment of a provision whereby agricultural land (which has been used as such for at least five preceding years) is to be appraised according to its worth for agricultural purposes only, and thus presumably without regard to its possible future use for higher value purposes.
The 1967 Census of Governments, which provides the latest statistics available, re- ~ o r t e d 525,000 parcels of locally assessed taxable realty in South Dakota, of which 59 per- cent were acreage or farm properties and 27 percent were non-farm residential properties. These major categories accounted for similar proportions of the statewide total of tax- able valuations of locally assessed realty. Commercial and industrial real estate ac- counted for only about a tenth of the total-far less, as would be expected for this mainly rural State, than the nationwide average proportion of 25 percent.
ASSESS1 NG RESPONSI BI LIT1 ES As common elsewhere, the task of property valuation is divided between a State
agency and local assessors. The State's role operates through the Property Tax Division of the State Department of Revenue. The Department, headed by a Commissioner appointed by the Governor, also administers various State imposed taxes. The Division appraises public utilities and allocates their value for the application of local property taxes; it also supervises and assists local assessors.
Since 1955, when it had some 1,900 local assessors, most of them elected and nearly all serving only part-time, South Dakota has made major changes in local assessing arrange- ments. By 1966, the number of primary assessing areas had been cut to about 400 (most of them townships in about one-fourth of the State's counties). Legislation enacted in 1967 substantially completed the transition to countywide assessing areas. The present total of primary areas is 72, involving the State's 67 counties and 5 cities of over 5,000 population. (There are 8 other first class cities empowered to do their own assessing, but which do not utilize this option.) The 72 assessors are subject to appointment by their respective county boards or municipal governing bodies.

In this sparsely populated State, even countywide assessment mainly involves dealing with areas of relatively small population. More than one-third of South Dakota's 67 coun- ties have less than 5,000 inhabitants, and another 25 have only 5,000 to 10,000. There are only two counties with a population of over 50,000.
The Property Tax Division has maintained and extended the kinds of services de- cribed in the earlier ACIR report, The Role of the States in Strengthening the Property Tax (see especially pages 150-151 of Volume 2). By a 1963 law, this agency was specifically authorized to appraise any particular class of property within a local assessing jurisdic- tion upon request of the area's governing body and on a cost sharing basis. The Division has five field men with specialized appraisal background to provide these and related services. It has recently issued an updated real property appraisal manual and is now developing specific guidelines for local assessors' application of the recent legislation affecting the valuation of agricultural land.
Although the staffing and budget of'the Property Tax Division have been increased during the past decade, its resources (involving a fiscal 1972 appropriation of $145,000, or less than 0.1 percent of statewide property tax revenue) still seem extremely modest, especially in view of the obvious difficulty of developing adequate professionalized assessment within small local jurisdictions.
ASSESSMENT VARIATIONS
Since 1957, State law has called for the assessment of taxable property uniformly at 60 percent of full value. Presumably, the recent legislation calling for special treatment of agricultural land contemplates a relaxation of this requirement to the extent that the cur- rent value of such land for agricultural use may be less than its actual market worth.
The State has maintained its regular annual survey of assessment-sales ratios as de- scribed in the earlier ACIR study, and publishes annually in relatively detailed form its findings on assessment levels and variations. It makes use of information available locally under a State real estate transfer tax imposed in 1968; but as in other thinly populated States, this effort is understandably handicapped by the relative paucity of measureable sales of real estate.
Real property assessments in South Dakota have historically averaged well below the legally specified 60 percent fraction and although such assessed valuations have been rising, their growth has lagged behind the trend in actual market values. The periodic Census of Governments estimated statewide South Dakota averages of 44 percent, 41 per- cent, and 34 percent respectively for 1957, 1962, and 1967. The downward slide was tem- porarily reversed in 1972 when the precent increased to 37. The Censuses also showed (as in most other States) a tendency for urban residential property and business property to be assessed at a somewhat higher level than acreage and farm property. The State's own ratio findings similarly reflect a downward drift in the general assessment level, as well as an increasing spread between the percentages for urban and rural property.
It should be recognized, of course, that these developments involved a period when real estate values (and especially land values] were rising rapidly, making it especially difficult for assessors to keep pace with market developments. For example, the U.S. Department of Agriculture has estimated a 54 percent rise between 1961 and 1971 in the value of farm real estate in South Dakota-a very large element in its property tax base.
There is apparently less inter-county diversity of assessment levels in South Dakota than is found elsewhere. The State's 1971 sales ratio study reported for two-thirds of the 67 counties weighted county assessment ratios within five points of the indicated state- wide average (38 percent). The picture as to intra-county variations, however, is f a r less encouraging. For urban properties involved in measurable sales, the study showed only

nine counties with a coefficient of dispersion (relative to the median ratio) of less than 20 percent, and only 12 others where this figure was less than 30 percent. Comparable Census figures for 1972 were: coefficient of inter-area dispersion ten, coefficient of intra-area dispersion 26. Five years earlier the comparable figures were 16 and 22.
Rural property transfers reflected somewhat widespread variations, with 20 counties showing a coefficient of dispersion under 20 percent. At the other extreme, however, were 18 counties for which this figure was over 30 percent. The more populous counties gen- erally do much better than this overall record might suggest, and for most of them the ratio study indicates less spread of assessment level between urban and rural properties than is found in other South Dakota counties.
It should be noted that the significance of inter-area differences in assessment level is limited by use of the State's ratio study to measure local tax effort for school aid pur- poses, as well as for inter-county equalization of taxes imposed by multi-county school districts (of which there were 67 in 1967).
AVAILABILITY OF PROPERTY TAX DATA
Besides publishing results from its sales ratio study, the Department of Revenue issues an annual report which includes relatively detailed data by class of property as to as- sessed valuations for each county and figures on tax rates and levies by type of gov- ernment.
A law passed in 1972 authorizes the publication and distribution of personal property tax information so relative assessments can be compared. The law, however, repealed a provision which allowed for the mailing of the assessment list in lieu of publication.
REV1 EW AND APPEAL OF PARTICULAR ASSESSMENTS
There have been no significant recent statutory changes affecting assessment appeals. According to the Department of Revenue, the results of its regular ratio studies are com- monly cited in tax appeal cases.
'Much of the information for this report was provided by George Winckler, CAE, Director, Property Tax Division, South Dakota Department of Revenue.
2An initiative based effort was made in 1970 to provide for State taxation of individual and corporation income, the yield of which was to be applied primarily to property tax relief. However, this proposal was de- feated at the polls.

TENNESSEE' ACIR's report of a decade ago, The Role of the States in Strengthening the Property
Tax, described many serious limitations of Tennessee's property tax system. Since then there have been important and generally promising developments in this State. Court rulings in 1966 led to the enactment of a number of laws designed to promote more effec- tive and uniform assessment of taxable property, and the State has taken significant steps in that direction. In particular, major efforts have been devoted to a statewide mapping and reappraisal program which should provide a basis for needed further progress. A constitutional amendment, approved by the electorate on August 3, 1972, is also expected to have a major influence on future property tax developments.
FINANCING ROLE OF THE PROPERTY TAX
The State-local revenue system of Tennessee, like those of most other southern States, involves less than average reliance on property taxation. For instance, property tax per capita is $85 relative to the national average of $184, while per $1,000 of income taxes are $28 relative to the national average of $47. There are no State property tax levies, and local property taxes supply one-fifth of all the general revenue raised by the State and local governments (21 percent in fiscal 1970-71, as compared with the national average of 32 percent). Although property tax collections have been rising, they have lagged some- what behind the rate of growth in the State's economy as measured by resident personal income and even further behind the rise in other State-local revenues.
In an ACIR study, Measuring the Fiscal Capacity and Effort of State and Local Areas, it was estimated that Tennessee's property tax load, relative to capacity, was only about two-thirds of the national average, non-farm residential was about three-quarters and farm properties only one-half the national average. The State's overall tax effort index, however, was considerably closer, 87 percent of the relevant U.S. norm.
Nevertheless, the general property tax is an important financing source for Tennessee local governments. It accounted in fiscal 1970-71 for nearly half of their general revenue from local sources and 28 percent of their total general revenue including intergovern- mental receipts. The State has more than 400 local governments with property taxing power-less than half of its local governmental units-but the counties and sizable mu- nicipalities account for most of the local levies. (Nearly all school systems are associated with such multi-purpose governments, rather than being independent districts.)
THE PROPERTY TAX BASE
Locally assessed real estate makes up a predominant part of taxable assessed valua- tions, In 1971, it contributed 81 percent of the tax base, with State assessed utility property accounting for 9.5 percent and locally assessed personal property for the other 9.5 per- cent. The share represented by State set utility valuations has dropped considerably (from 13 percent in 1966) largely as a result of developments more fully discussed below under "assessment variations."
The Tennessee constitution provides for a comprehensive general property tax, ex- tending it to certain intangible personal property and to motor vehicles (both exempt from property taxation in most other States). However, the actual scope of the tax has traditionally been circumscribed to a considerable extent by statute or common assessing practice, or both. A constitutional amendment that was approved by the electorate in 1972 and implemented by the Property Assessment and Classification Act of 1973 provides a specific constitutional basis for nearly c o ~ p l e t e exemption of non-business holdings of personal property (up to $7,500).

The amendment is designed, among other things, to establish a classified property system under which different levels of assessment relative to actual market value would be specified. For example:
1) state assessed public utilities (real and personal property] 5 5 O/O
2) commercial and industrial real estate 40
3) commercial and industrial personal property
4) other real estate (mainly residential and farm properties)
5) non-business tangible personal property in excess of $7,500 per owner 5
Intangible personal property may be classified and assessed in such manner as the legislature may determine. These assessment levels were legally applicable beginning with 1973.
The amendment and its implementing law (Public Chapter 752) also affords property tax relief to limited-income elderly homeowners (65 and over) and the totally disabled. Under its terms, an eligible person with annual income of less than $4,800 will be entitled to claim reimbursement from the State of State, county and municipal property taxes paid on the first $1,250 of assessed value (or $5,000 of full market value) of his owner-occupied residence based on assessments made after the beginning of 1973. Discussions are already taking place about the possibility of extending this homestead exemption to renters as well as converting the exemption to a circuit-breaker type. The reasoning for expanding the coverage to renters is to reduce the capriciousness of the exemption by covering all the elderly; the reasoning for shifting to the circuit-breaker is that the homestead exemp- tion being constant for many of the elderly does not reduce the regressivity of the prop- erty tax, only the absolute burden. For those with small amounts of property (less than $5,000) the homestead exemption makes the tax even more regressive. Total cost of the current program is estimated at $3.3 million; if extended to renters, the cost will increase by $900,000. Various circuit-breaker proposals raise the cost to $6 million.?
A number of relatively minor curtailments of the property tax base have been legis- lated in recent years. These include exemptions granted for gas injected underground for storage, for business inventories in transit through the State, and for equipment designed to control water or air pollution, as well as an increase in the valuation ceiling to $25,000 for the partial exemption granted for owner-occupied residences of disabled veterans.
The 1967 Census of Governments, the latest available data, identified about 1.3 million parcels of locally assessed realty in Tennessee. Of these, 57 percent were non-farm resi- dential properties, 26 percent were acreage and farm properties, and 15 percent were vacant lots. The far less numerous commercial and industrial properties accounted for about one-fourth of the statewide total of assessed valuations for taxable realty.
ASSESSING RESPONSIBILITIES
Particularly as a result of 1967 and 1973 legislation, major changes have recently occurred with regard to the assignment of assessment duties in Tennessee.
The task of property valuation still exists with the State Board of Equalization. This is a seven-member body chaired by the Governor, with two members appointed by him plus the Comptroller, Treasurer, Commissioner of Revenue, and Secretary of State. The small staff previously serving this agency has been considerably expanded and now operates as a Division of Property Assessments, established by law within the office of the Comp- troller of the Treasury. The head of the Division is appointed by the Comptroller with the approval of the Board. The Division presently has 60 employees, and an annual budget of $956,000 (equal to about a quarter of 1 percent of statewide property tax collections).

The 1967 law creating the Division vested i t with extensive powers to supervise and assist local assessors, as described below. However, responsibility for central assessment of public utility property is still assigned to the Public Service Commission, with its valua- tion subject to review and approval by the State Board of Equalization.
Local assessment responsibilities are still, as a decade ago, assigned primarily to an official in each of the State's 95 counties (including the metropolitan government of Nashville-Davidson). A 1967 law provides that each county assessor continues to be popu- larly elected unless the county governing body proposes and the local electorate approves making the office appointive. Thus far, no counties have moved in that direction. The 1967 law also authorized inter-county contracting for assessment services where the State Board of Equalization found this to be desirable for efficient administration. Such a pro- vision seems especially appropriate for Tennessee, since there are 19 counties with less than 10,000 inhabitants each, and another 37 counties with only 10,000 to 25,000 inhabitants. To date, however, there has been no specific action toward multi-county contracting for assessments.
The 1967 legislation also contemplated an early end of the previous situatio; by which charter municipalities were empowered to assess property locally for the application of municipal taxes. There has been progress in this direction, and all local assessing work in more than half of the State's counties is now handled by a county assessor's office. How- ever, consolidation is still pending in numerous counties, including some that have sizable municipalities. It seems unlikely that separate municipal assessment operations will be completely eliminated for some years to come.
Two major court decisions in 1966, which condemned Tennessee's long-standing fail- ure to comply with its constitutional requirement for uniform and non-discriminatory valuation of various types of property, led to the adoption in 1967 of several laws provid- ing for much more active and effective State supervision of local property tax adminis- tration.
Legal powqrs. A broad range of duties were assigned to the newly established Divi- sion of Property Assessments in the Office of the Comptroller, including:
I) to direct a statewide program for reappraisal of all real and personal property subject to local assessment;
2) to prepare and promulgate assessment manuals to be used by local assessors;
3) to prescribe schedules and reports for local assessors;
4) to require reports from local assessors; and
5) to conduct sales ratio studies and assemble statistics regarding property tax as- sessments.
In addition, the State Board of Equalization was directed to: (1) establish and enforce qualification requirements for certification of local assessors and deputies and property appraisers; (2) to prescribe and arrange for educational and traincng courses to be taken by assessment personnel.
According to a recent report by the Division of Property Assessments:
Concurrent with the reappraisal program, the Division in conjunction with the University of Tennessee's Center for Training and Career Development, continues an extensive training program designed to upgrade the professional qualifications of local assessors throughout the State. Training courses, seminars and workshops have been held in every area of the State and standardization of assessment procedures has been pursued through close guidance and constant review by the Division. These

schools are held for assessors, deputy assessors, local boards of equalization and Division personnel each year. In addition, there have been six schools conducted un- der the supervision of the International Association of Assessing Officers.3
The Board was also authorized to administer a program for State financed "incentive increases of compensation" for assessors and deputy assessors, based on their training and performance.
Reappraisal programs. Much of the work of the Division of Property Assessments since its creation in 1967 has involved the administration of the statewide reappraisal program that was required by law to be carried out over a five-year period (since ex- tended to eight years]. This program is financed in the first instance from State appro- priations, with half the cost repayable by the respective counties on an installment basis. An initial major step (actually authorized by the legislature in 1966) involved a statewide mapping operation, which made use of aerial photography and provided some 60,000 sheets of planimetric maps. These are at differing scales, respectively for rural, urban, and highly congested areas.
This mapping operation provided a starting point for the actual reappraisal program which was done under contract with private appraisal firms in accordance with specifica- tions developed by the Division of Property Assessments. The effort included the con- struction of area ownership maps that delineate particular parcels, the preparation of property ownership index cards, and the appraisal of individual parcels subject to local assessment for property tax purposes. (Utility and tax exempt p r ~ p ~ r t i e s also were identi- fied though not specifically appraised.)
By September 1973, mapping and reappraisal programs had been completed in 72 counties, and were under way in 15 others, while eight counties were still awaiting con- tracts.
The full-value appraisals developed under this program were adjusted to fractional valuation levels as discussed above.
ASSESSMENT VARIATIONS
Legal requirements. As previously noted, the recent constitutional amendment pro- vides for a classified property tax system beginning in 1973. The requirements as to assess- ment levels which previously applied to all types of taxable property (except for certain personal property) were set by 1967 legislation. It specified uniform minimum fractions as follows: 15 percent for 1968; 25 percent for 1969; 30 percent for 1970; 35 percent for 1971; 40 percent for 1972; and 50 percent for 1973 and thereafter. Authority was granted for counties that had completed their reappraisal programs to move ahead of this schedule in raising their assessments and several did so. Official State reports on 1971 valuations show four counties with a "county assessment level" of 50 percent for locally assessed property, two counties at 40 percent, and the other 89 counties at the specified statewide minimum of 35 percent.
Assessment ratio studies. Tennessee has a long established tax on real estate transfers which would facilitate the conduct of assessment ratio studies. Moreover, the Division of Property Assessments was expressly authorized by 1967 legislation to make such studies. It has not thus far developed a recurrent statewide assessment ratio program, but has done some sales ratio work, especially at the early stage of the reappraisal program.
Actual assessment levels. The 1967 Census of Governments showed a statewide aver- age assessment level as indicated by measurable sales of ordinary real estate of 21 per- cent, with residential property several points higher than this; but rural property was only 11 percent. (The 1972 Census showed an increase in the assessment ratio to 32 percent.)
The 1967 Census reported ratios for non-farm houses in 23 sample Tennessee counties

that reflected a considerable inter-county range of average assessment levels and marked variation of assessment level within some of these counties. Nonetheless, several counties showed up relatively well in this regard (including the most populous, Shelby County, with a dispersion coefficient of only 10 percent for assessments of single-family houses). In the 1972 Census, both the inter- and intra-area coefficients of dispersion showed a sig- nificant improvement, dropping to 15 and 20 percent, respectively.
'Much of this report is based on information supplied by Freely B. Cook, Director, Tennessee Division of Property Tax Assessments.
ZK. E. Quindry, Property Tax Concessions for Senior Household Heads in Tennessee: A Summary (Knox- ville, Center for Business and Economic Research, University of Tennessee, 1972).
Tennessee Division of Property Assessments, Property Revaluation and Reassessment Program Status as of March 1, 1972 (processed).

. . . The current system of financing public education in Texas discriminates on the basis of wealth by permitting citizens of affluent districts to provide a higher quality edu- cation for their children, while paying lower taxes, (and) this court concludes . . . that the plaintiffs have been denied equal protection of the laws under the Fourteenth Amend- ment to the United States Constitution. . . .
Now it is incumbent upon the defendants . . . to determine what new form of financing should be utilized to support public education. The selection may be made from a wide variety of financing plans so long as the program adopted does not make the quality of public education a function of wealth other than the wealth of the State as a whole.
-Rodriguez, et a1 v. San Antonio Independent School District, et al
Even though the Rodriguez decision was not upheld by the U.S. Supreme Court, it has stimulated a degree of reflection about property assessment and taxation in Texas. The Rodriguez case says simply that the present system, financed in large measure by the property tax, does not provide equity. In its wake, many questions have arisen about the property tax and how it is administered. What follows is a discussion of the assessing structure, assessment administration, and the efficiency of the tax in Texas.
FINANCING ROLE OF THE PROPERTY TAX
Property taxation remains a principal element in the Texas revenue system. Of rev- enues raised by the State and local governments combined, property taxes comprised 30 percent in fiscal 1970-71, slightly less than the nationwide average of 32 percent. Ten years earlier the relationship between Texas and all other States was essentially the same, but at a level 7 percentage points higher.
A recent ACIR study, Measuring the Fiscal Capacity and Effort of State and Local Areas, shows that the property tax load in Texas averaged 11 percent below the national average; farm property, however, was 45 percent below the national average while com- mercial and industrial property was only 6 percent below. In terms of a composite effort index for all State and local taxes, Texas was 25 percent below the level for the nation as a whole.
The State public school levy has dropped from 35 cents per $100 of assessed value in 1968 to 15 cents in 1972. Existing legislation prohibits any State levy after 1976 except for a separate 10 cents per $100 for support of college buildings.
As of 1972, Texas had 3,624 local governmental units, 3,005 of which had property tax- ing power. When all local units are considered together, property taxes comprised 61 percent of all locally raised revenue, slightly under the corresponding nationwide pro- portion of 64 percent.
On a per capita basis, property taxes in Texas increased from $78 in 1960 io $128 in 1970, an increase of 74 percent or an average of 5.7 percent a year. (The 1971 figure was $137, a 7 percent increase over the previous year.) This exceeded slightly the per capita average growth in Texas personal income of 5.6 percent. In contrast, the average annual increase in assessed valuations of taxable property was merely 3.8 percent between 1961 and 1971. Property tax rates, then, have been increasing significantly.

THE PROPERTY TAX BASE In 1971, locally assessed real property constituted 75 percent of total assessed value.
Locally assessed personal property, tangible and intangible, amounted to 24 percent of the total, and State assessed public utilities added only about one-half of 1 percent. Rela- tive shares have not changed much since 1961.
Texas laws state that all property of any type is subject to assessment unless ex- pressly exempted. Major exempt types include household furnishings up to $250, prop- erty owned by governments or by charitable, educational, and religious institutions, and farm products and supplies not placed in the market. In addition, a $3,000 homestead exemption applies to the State and county property tax and county farm road levies only. Despite these exemptions significant aggregates of property are taxable, including tangible and intangible personalty. All motor vehicles, for example, are taxable, but relatively few among the State's property tax levying jurisdictions achieve more than token enforce- ment. One city assessor-collector assessed the situation (if not the cars) candidly: "Peo- ple . . . are just not inclined to pay an automobile tax and we don't have the staff to collect it. . . . " 2
Assessment of intangible personalty is even more difficult to enforce on a local basis, except where taxpayer recordkeeping and equanimity endure it.
Homestead exemptions. Assessments for the gradually diminishing State tax are subject to a homestead exemption of $3,000. This has county tax ramifications because the State tax, along with the county tax, is levied against county assessed values. This accounted in the past for a plethora of $2,950 homesteads on county assessment rolls.
In November 1972, a constitutional amendment was approved by the electorate to en- able any local unit to grant a homestead exemption of at least $3,000 for persons 65 or older by action of its governing board, or by calling an election to decide by majority vote in any instance where 20 percent or more of the voters petition for such action. As enacted, the provision contains some basic problems?
1. The exemption is optional with each local governing body. While it appears that many local governments are providing or are preparing to provide the exemption, it bears no resemblance to a statewide policy commitment to relieve the elderly from the burden of excessive property taxation.
2. The exemption is set in terms of assessed valuation and this, in itself, creates an inequity. Depending upon the level of assessment, an elderly homeowner may be relieved of all local property taxes while a similarly situated elderly homeowner residing in another jurisdiction may be relieved of only a minor part of his taxes. Local governments can adjust the exemption given (as long as it is not less than $3,000), but most are opting for the minimum exemption allowed under the constitu- tional amendment.
3. The exemption does not take into account the income of the elderly homeowners- it is as available to the 65-year-old millionaire as it is to the elderly person eking out an existence on social security.
4. Because it is tied to the constitutional definition of a homestead, the exemption cannot now be made available to elderly unmarried homeowners. To correct this, another constitutional amendment was passed by the voters in November 1973.
5. Finally, the burden of the exemption falls upon the local governments, hence upon the other property taxpayers in the jurisdictions that adopt it. Presumably, this objec- tion was partially met by making it a local option matter, and this probably is pre- ferable to simply having the State act unilaterally at local expense.

A 1973 enabling law provided the following schedule of exemptions for disabled vet- erans and their widows which was authorized by constitutional amendment in 1972.
Extent of Disability
less than 10% 10 to 30 31 to 50 51 to 70
more than 70
Exemptions From Assessed Value
None $1,500
2,000 2,500 3,000
1. If over 65, the first $3,000 is exempt. 2. If disability is one or more limbs or vision, the first $3,000 is exempt. 3. For the surviving spouse, the first $2,500 is exempt.
Preferential treatment of farm property. In 1966, the Texas electorate approved a constitutional amendment providing for the special treatment of farm property. This law has been difficult to enforce because the amendment was wholly selfenacting and did not confer any authority on the legislature to qualify it. The basic provisions include:
I. Lands designated for agricultural use are to be assessed on the basis of factors relative to such use.
2. The land must be owned by natural persons and must have been exclusively and continuously used for agricultural purposes for the three years preceding the assessment date. The term "agricultural use" is defined in some detail.
3. The owner must derive the primary portion (51%) of his income from agriculture.
4. Qualification is for one year at a time; the owner must requalify each year.
5. If the land is taken out of agricultural use, there is a three-year rollback tax.
Attempts to extend these provisions to timber land and other open space have failed.
Special Treatment for industrial districts. Under a 1963 statute, any city may designate all or any part of its "extraterritorial jurisdiction" as an industrial district, an area to be treated as the property owners and city mutually agree by contract. The latter immunizes the land involved from annexation for a period of up to seven years. In exchange, the property owners agree to pay the city a sum stipulated in the contract. Certain municipal services are not available in the areas covered. Extraterritorial jurisdiction in the unin- corporated area contiguous to a city varies in extent as follows:
City population
Less than 5,000 5,000 to 24,999 25,000 to 49,999 50,000 to 99,999
100,000 or more
Extraterritorial Jurisdiction
Within one-half mile Within one mile '
Within two miles Within three and one-
half miles Within five miles
The apparent purpose of an industrial district is for a city to obtain control and some revenue from an area it has grown toward, without actually annexing it . On the other hand, the property owners, usually large industrial plants, have as much to gain, probably more. By entering into industrial district agreement, they protect themselves from

annexation for up to seven years by paying what invariab1.y is less than what they would pay as property taxes if annexed. Some authorities believe that at least 200 industrial district agreements exist, primarily in Gulf Coast areas.
Components of the tax base. Results from the 1967 Census of Governments, which are the latest available since the figures were not updated in the 1972 Census, reveal that Texas assessment rolls included 6 million parcels of taxable realty. Of the total, 42 per- cent was non-farm residential, a category which accounted for 39 percent of total assessed value. There were 1.3 million acreage and farm parcels, 21 percent of the total number but only 13 percent of total assessed value. Vacant lots comprised 17 percent of total parcels and 2 percent of total assessed value. Commercial and industrial parcels ac- counted for 21 percent of total assessed value and 2 percent of the total number of parcels. Other parcels, primarily separately assessed mineral rights (oil and gas reserves), made up 18 percent of the total number and 26 percent of total assessed value.
ASSESS1 NG RESPONSI BI LIT1 ES
Assessing in Texas remains a triad, similar in most respects to the structure prevailing ten years ago. The 254 counties constitute the primary assessing jurisdictions, each has an elected official, the county assessor-tax collector, who holds office for four years. His assessed values constitute the tax base for the county, the State, and in many cases, any special districts in the county that levy a property tax. In a few instances, even cities and independent school districts will use his values. More generally, however, cities and inde- pendent school districts appoint rather than elect their own assessors who provide sepa- rate sets of assessed values for properties within their respective boundaries.
As of 1967, there were 1,310 independent school districts, 883 municipalities, and 1,001 special districts in the State, all with property taxing power except for 477 of the special districts. Each of the property tax levying units may have its own assessor-collector. Indications are that only 1,250 actually do, since the estimated total of separate tax offices in Texas, including the 254 counties, stand at about 1,500.
A partial explanation of the large and growing number of taxing districts is found in the following:4
Texas has a complex system of property tax rate limits covering all types of local government. These tax rate limits overlap one another, and when combined with the legal presumption that property will be assessed at its market value, create a prac- tical situation in which the legal limit of taxation is very high. The legal tax on a $20,000 home located in an area where the maximum tax is imposed by all jurisdic- tions (city, county, school, hospital district, junior college district, and airport author- ity] could be as high as 8.7 percent of the market value of the property. Clearly, this is not what the proponents of tax rate limitation intend.
If the tax rate limits have not proven to be an effective restraint on property tax levies, they have been a major contributing factor to the proliferation of special dis- tricts and the complexity of property tax administration in Texas.
It must be remembered that the tax rate limits have existed side-by-side with a statewide property tax levied on county valuations. To the extent that counties have been able to hold down the level of assessments, they have reduced the amount of State tax their property owning constituents have had to pay. Since the counties have relatively modest tax needs, it has been entirely feasible for most of them to live with- in the constitutional limits for county rates and still have a relatively low level of assessment.

The results:
1. Whenever it became apparent that the people of a county wanted a new and costly countywide service, such as a hospital or a junior college, there were two possible responses: (a) increase county valuations so that the new service could be financed without exceeding the county tax rate limit; or (b) create a special district which could use the present county valuations but which had its own extra taxing powers not subject to the county limits. Choice of (a) would mean not only higher taxes to finance the new service, but also higher State taxes on the higher valuations. Invariably, local officials have opted for (b) and, thus, for a further complication of local government through the proliferation of special dis- tricts. 2. Cities and school districts, except those with small populations, could not pro- vide the expected level of service within the combination of county valuations and the constitutional tax rate limits. For example, the City of Dallas imposes a tax rate of $1.87 per $100 of assessed value, which produces a tax levy of $93.4 million. If the city were forced to use county valuations, the constitutional maxi- mum rate ($2.50 per $100 of assessed value) would produce a levy of under $60 million. Consequently, the City of Dallas and nearly all other home rule cities and independent school districts have been forced to set u p their own property tax administration machinery to produce valuations large enough to meet their needs and stay within the rate limits, hence, increasing the complexity of proper- ty tax administration in Texas compared with that of many States that have a unitary administrative system.
Some voluntary consolidation of the assessing function has occured since 1961. In several instances, for example, the city assessor-collector will serve under contract con- currently as the independent school district assessor-collector. Sometimes the county as- sessing official will have a dual role. Other informal data sharing arrangements also oc- cur. Assessors for city, county, and school district will share appraisal data for properties located within all three units.
Formal consolidation on a State or county basis, however, still lies in the future. Moreover, the extent of voluntary joint effort does not match the extent of local com- petition and rivalry in the determination of assessments. Some units reportedly annex peripheral land to thwart neighboring units, and then use low assessment levels in such areas to obviate demands for municipal services.5 In another case, the county commis- sioners dealt with a drainage problem by threatening condemnation and informing the owners that assessed valuations on their properties would be reviewed unless there was agreement on the drainage issue. Taxpayers are given the runaround where county assess- ments are based on city appraisals, if the city increases its values and an affected taxpayer asks the county to explain, he is told the city is at fault. In a variant of this the county may base its assessments on city provided values but exclude elements of value from assess- ments for properties located outside the city.6
While the existing "system" of many independent, often overlapping, assessment dis- tricts remains very much alive in Texas, there is now a ferment that reflects not only the possibility but the need for something better. In 1967, a legislative committee put things in perspective:
. . . A multiplicity of small districts denies an efficient base and adequate re- sources for effective assessment systems; each o n e . . . . seldom can afford both the quality and quantity of professional skills essential to competent assess- ments.
This is not to suggest that "economy" will result from an efficiently organized
and professionally staffed assessment office with a territorial area large enough to warrant it. The plain fact is that direct costs for such an assessment office may well be higher than the sum of the inefficient and overlapping offices it replaces. Even so, it is suggested the higher cost is a relatively small price to pay to rehabil- itate an assessment process which is unreliable and often unjust.'
The committee made only one recommendation-that a 15-member property tax study commission be formed to study all aspects and then recommend constitutional and statu- tory changes. No commission has resulted, but the committee also set forth alternatives for improving administration, and one or a combination of these may well emerge in the wake of Rodriguez. They are:
1) centralized assessments of all taxable properties by a State agency;
2) centralized assessments by a State agency only for particular types of property (utilities, railroads, minerals, etc.);
3) State supervision of local assessments; and
4) areawide local assessment districts.8
Similar suggestions appear in a recent interim report of the Texas Research League. First, the report calls the property tax a local option levy in Texas, and cites some reasons:
Some districts tax land and improvements separately; others . . . on a single valu- ation. Some. . . attempt to tax furniture, automobiles, boats and other types o f . . . personal property; others tax only business owned personalty. Some . . . regularly reappraise real property . . . other districts depend almost exclusively on the owner's statement (or renditionj.9
The report goes on to say that if Rodriguez is upheld, and a joint State-local tax sys- tem is maintained, "local option" will necessarily cease, and a framework like the follow- ing will likely develop:
1) clear definition of the tax base, limited to types of property that can actually be located, appraised, and assessed;
2) insistence on compliance with the law;
3) improved property tax administration within larger, more efficient assessment jurisdictions; and
4) State supervision and control over assessment and collection.l0
The State Comptroller retains the responsibility for designing prescribed assessment forms, auditing tax rolls (but only with respect to collection of State taxes) and providing a manual for assessors. The current edition of the manual has been in use for several years. Its contents include regulations, opinions of the Attorney General, excerpts from statutes, and instruction in assessing procedure. It is not a cost manual for appraisers. Aside from the Comptroller's functions, the State is not directly involved with the work of local assessors.
The Texas Association of Assessing Officers (TAAO) continues to conduct training schools and promote attainment of professional status by local assessors, in association with the Institute of Public Affairs of the University of Texas. TAAO administers the certification program through which assessors can pass required examinations, qualify for the designation, Certified Texas Assessor, a rating somewhat similiar, within Texas, to that of Certified Assessment Evaluator granted by the International Association of Assessing Officers.

Increasingly during the 1960's, legislative committees, the Texas Research League and other groups have taken note of the need for materially broadened State supervision of assessment administration.
ASSESSMENT VARIATIONS Legal requirements. The Texas constitution (Article VIII, Section 20) provides that
no property of any kind may be assessed for ad valorem taxes at a value greater than its fair cash market value. In addition, the constitution (Article VIII, Section 1) states that all property "shall be taxed in proportion to its value, which shall be ascertained as may be provided by law." A statute, however, provides that property, real or personal, shall be valued at true and full value in money. The latter is defined as fair market value, in cash, at the place where the property is located at time of assessment, with the value reflecting the price obtainable at a private sale that is neither forced nor stimulated by auction.
It is a fact of life that Texas property tax jurisdictions do not follow the consti- tutional and statutory presumption that property will be assessed and taxed on the basis of its actual market value. Despite the law, fractional assessing is recognized by both taxpayers and public officials, including the courts.
Nearly every local taxing jurisdiction admits to fractional assessing. It is almost always possible to obtain, either as an official or unofficial figure a so-called "claim- ed ratio" of assessed value to true value, and these are expressed, almost without ex- ception, as a percentage less than 100. The claimed ratios, however, bear little resem- blance to the actual assessment ratios."
State assessment ratio studies. The State at present does not make assessment ratio studies. In 1967, the Governor's Committee on Public School Education commissioned a study by a private consultant in an attempt to discover the market value of property in every school district in Texas. The methodology and results of the study, completed in 1968, have been defended and attacked by various individuals and groups.
The Texas Tax Commissioners Association, a group composed of tax representatives of railroads, other public utilities, and commercial firms, conducted ratio studies on a fairly regular basis prior to 1968 when repeal of the Federal documentary stamp tax on real estate transfers took effect. The Association depended heavily on sales value indica- tions revealed by the documentary stamps. The Property Tax Committee, legislatively created in 1969, has recommended a State real estate transfer tax but thus far there has been no action on this proposal. Texas is one of 13 States without such a tax.
Some ratio studies are conducted at the local level. Prominent among them is the annual study for the Houston area by the Tax Research Association of Harris County. This group accumulates sales data from a commercial listing service and supplements this with individual inquiries.
Actual assessment levels and variations. The methodology of Census of Governments studies requires use of the county assessed values as the basis for assessment level and dispersion calculations. This, in the Texas situation, obscures the fact that independent assessed values also exist for cities and school districts. Moreover, there are indications from some of the ratio studies done within the State, that at least some of the city and school district assessor-collectors achieve greater intra-area uniformity among their as- sessed values than do the county assessors among theirs.
Census results show that the statewide average assessment sales ratio, using county assessments, has inched upward over three survey periods, going from 18 percent in 1956, to 20 in 1961, to 22 in 1966. In 1972, however, the ratio declined to 18. (The national aver- age for 1972 was 34.)

In the 1962 Census, the intra-area coefficient of dispersion (for assessed values of single-family houses] for the median area was 29, compared with a national median of 26. The 1967 study showed 29 for the median area in Texas versus 19 nationally. The 1972 coefficient was somewhat improved at 26, compared to the national figure of 20.
REVIEW AND APPEAL OF PARTICULAR ASSESSMENTS
The property owner in Texas has recourse to one or two, or possibly three, boards of equalization in the event that he is dissatisfied with the various assessed values placed on his property.
Each city or town incorporated under the general laws of the State may create a three-member board of equalization. A home rule city is not limited to three members.
The board of trustees of an independent school district may create its own board of equalization to review and equalize school district assessed values. One instance is known of legislative authority for a board of trustees to designate its own membership as a board of equalization, but this is an exception. It is common, however, for independent school districts to use a statutory option which allows them to authorize the city assessor, city collector, and city board of equalization to act for the school district in the performance of assessment, collection, and equalization functions. In any such situation, no property may be assessed at a higher value for the school district roll than it is for the city roll.
In each county, the commissioners' court sits as a county board of equalization.
Any of the boards of equalization may increase or decrease an individual assessment in its own jurisdiction as well as equalize all assessed values of the particular jurisdic- tion. A county board must give notice of intent to increase any individual assessment by publication in a newspaper or (if there is no newspaper) by posting on the court house door. The taxpayer is given ten days to appear at the meeting set to act on the increase. A city board must notify the taxpayer, by mail, of intent to increase, at least ten and not more than fifteen days prior to the meeting set to act on the matter. There is no statutory provision requiring the assessor to give written notice of individual assessments prior to convening of boards of equalization.
There is also no statutory provision for appeal from action by a board of equaliza- tion. A taxpayer still feeling aggrieved, however, may initiate action in the District Court.
Common school districts (in contrast to independent school districts) use county assessment, collection, and equalization facilities. Municipal school districts use city assessment, collection, and equalization. Rural high school districts apparently use the same collection unit used by common school districts but may have their own assessors.
JPart of the information for this report was provided by James W. McGrew, Executive Director, Texas Research League.
2Quoted in The Texas Property Tax, Institute of Urban Studies, University of Texas at Arlington (April 1970). p. 25.
Texas Research League, The Texas Property Tax: Background for Revision, Texas Advisory Commission on Intergovernmental Relations (1973), p. 66.
4Ibid. property Tax Assessing in Texas, Report of the Texas Committee on State and Local Tax Policy, 59th Legis-
lature (Austin, January 1967), p. 5. Slbid., pp. 8 and 9.
8lbid.l pp. 31-37. 9Public School Finance Problems in Texas. An Interim Report by the Texas Research League (Austin, June
19721, p. 25. lOIbid., pp. 25-26. llTexas Research League, Op. cit., p. 66.

Virginia's property tax remains basically the same as described a decade ago, in Volume 11, of ACIR's, The Role of the States in Strengthening the Property Tax (p. 162- 64). The State concentrated its efforts on the original assessment, or reassessment, recog- nizing that review and equalization are totally inadequate substitutes for a good original assessment. Initial assessments, poorly made, inevitably find their way into the tax roles irrespective of the diligence and care exercised by the reviewing agency. Thus, in the early postwar period, Virginia concentrated its efforts on improving the quality of local assessment by State assistance in mapping, training and providing ratio studies; these efforts have continued with some expansion.
As in other States, recent changes in the Virginia property tax laws have been concen- trated in the area of tax relief of four types;
1) elderly homeowners,
2) special treatment of open spaces,
3) property damaged by common disaster, and
4) exemption of pollution control equipment.
The State has granted the authority to local governments to impose service charges on certain classes of exempt properties.
FINANCING ROLE OF THE PROPERTY TAX
Virginia, like other Southern States, puts a- minimum reliance upon the property tax. Only 23 percent of own-source State and local government revenue came from the prop- erty tax in fiscal 1970-71 in comparison to a 32 percent national average. In 1960, the percentage of revenue from the property tax was 30. Property taxes on a per capita basis increased by 105 per cent over the last decade reaching $109 in fiscal 1970-71. The rate of increase in Virginia was slightly faster than the rate of increase for the nation as a whole as the State per capita property tax is now 59 percent of the national average of $184. Its average was 54 percent a decade earlier. The property tax burden on the basis of $1,000 of personal income increased by 55 percent over the past decade reaching $31 in fiscal 1970-71. The national average in 1970-71 was $47.
The ACIR study, Measuring the Fiscal Capacity and Effort of State and Local Areas, estimated that Virginia's property tax effort relative to the average national effort was 59 percent. Similar percentages were found in the State's taxation of two component parts: non-farm residential property and commercial and industrial property. Farm prop- erties, however, were only 28 percent below the national average. The effort index for all taxes at 90 was much closer to the national average.
Even at the local government level, property taxes are of limited importance bringing in only 55 percent of own-source revenue, compared to the national average of 64 percent. According to the 1972 Census of Governments, 85 percent of the State's 385 taxing units have property taxing powers. These local governments have the responsibility of assess- ing all but 9 percent of the State's taxable property: 77 percent being locally assessed real property and 14 percent personal property. Over the past decade, real property has in- creased relative to personal property.

THE PROPERTY TAX BASE
At the State level, the general categories of property subject to taxation are:
1) railroad rolling stock; and
2) a business capital tax on
a) inventories,
b) excess of accounts receivable over accounts payable, and
c) certain other tangible personal property found chiefly in manufacturing, mining, radio, television, broadcasting and dairy business.
At the local level the categories are:
1) real estate,
2) mineral lands,
3) tangible personal property including public service corporations (except rolling stock), and
4) capital of merchants.
Of the 1,682,000 pieces of locally assessed realty, 51 percent are in non-farm resi- dential property, 26 percent in vacant lots, 20 percent in acreage and farms, and 2 percent in commercial and industrial properties. Of total value, residentiai properties made up 75 percent, commercial-industrial properties 22 percent, farms 9 percent, and vacant lots 3 percent.
Virginia provides the traditional tax exemptions to governmental, religious, charita- ble, educational, cemetery, and youth oriented properties. In 1971, as amended in 1972 and 1973, however, local governments were authorized to collect a service charge from all owners of exempt properties except church properties used exclusively for religious worship or the minister's residence, or properties used for non-profit educational or charitable purposes. The service charge was based on the net cost of providing such serv- ices as police, fire protection, and refuse coilection; the charge was distributed relative to assessed values of such properties with a maximum charge being 20 percent of the real estate tax rate. In addition, the State exempts the intangible personal property of domestic corporations which do no business in the State.
Recent exemption changes are as follows:2 1. A 1973 act allows local governments to exempt all or portions of all pollution
control equipment.
2. A 1971 constitutional revision permitted the State to classify agricultural, horti- cultural, forest, and open space lands and allow local governments to exempt or defer taxes on these properties. A 1971 law allows any county, city or town with a land-use plan to tax (a) agricultural and horticultural properties with at least five acres and gross sales of at least $500 for the past three years; (b) forest and lands with a minimum of 20 acres, and (c) open space lands with a minimum of 5 acres, upon application of the owner, at current use value rather than market value. To qualify for use-value assessment, the land must meet standards set by the respon- sible State agency commission for agricultural, horticultural, forest, and open space land. By 1973, four localities had adopted use-value ordinances for open- space lands. When the use of the land is changed a rollback tax is authorized. The tax will equal the difference between what would have been paid to what was paid over the five preceding years. A 1973 amendment added a simple interest payment

of 6 percent to this rollback tax liability and dropped the gross income limit for agricultural and horticultural lands.
3. By 1970 legislation, amended in 1973, counties, cities or towns may, upon applica- tion, relieve properties of taxes if they have been either completely or partially destroyed by natural causes. To be eligible, the Governor must declare that a com- mon disaster has occurred. The amount of relief will be in relation to the change in assessed value. If taxes were already paid, they can be ~ c f u n d e d .
4. In the extra session of 1971, the General Assembly passed an act to provide for tax relief of the elderly. Counties, cities or towns may provide for the exemption or deferral of real estate taxes if:
a ) the property is the sole dwelling of the person and is limited to one acre;
b) the owner is age 65 or older;
c) combined net household income does not exceed $7,500; and
d) net worth does not exceed $20,000, excluding the value of the home.
When the house is sold or the person dies the deferred tax comes due.
Localities may set lower net worth and/or income figures. A 1973 amendment allows relatives living with the owner of the exempt property to earn up to$2,500 before being added into combined income. At present (19731, 13 cities and five counties have passed the necessary ordinances allowing tax relief for the elderly.
ASSESSING RESPONSIBILITIES
Assessing responsibilities remain essentially as outlined in ACIR's 1963 property tax study. The Real Estate Appraisal and Mapping Division of the Department of Taxation still provides assistance to local government when requested. In 1964, this Division was expanded to increase its capability in the Advisory Aid and Assistance Program. The serv- ices provided now include the assessment of minerals and mineral lands as well as machinery and tools used in mining, manufacturing, processing or reprocessing, radio- television broadcasting or the dairy business. In fiscal 1971-72, 30 out of the 95 counties and two out of the 39 cities with assessing responsibility received assistance. Much of this help was for the assessing of out-of-the-ordinary real estate. The mapping section com- pleted one county map, revised 53 local government maps, furnished photographic assist- ance to 82 localities and prepared field work maps for 41 counties and cities undergoing reassessment. Additional mapping work was done in 36 counties and cities. The annual budget has increased some 292 percent over the last decade reaching $353,000 in fiscal 1971-72. Over the same time, the number of personnel has more than doubled (to 35). Presently the expenditures of this division amount to about 0.07 percent of total State and local property tax revenues. The Research and Statistics Division of the same Depart- ment prepares the ratio studies for the State.
Cities and counties with populations of more than 2,000 per square mile are required to reassess every four years with certain exceptions which were pointed out in our 1963 report. Other counties generally reassess every six years. A 1973 law allows county gov- ernments to establish a department of real estate assessments and to make annual assess- ments.
Like most States, Virginia has more primary assessing units than its population would support for efficient administration. Thirty-four units have populations of under 10,ooo. Another 90 units have populations between 10,000 and 100,000. Only seven units have populations over 100,000 and these seven account for one-third of the total population. In 1973, only 19 cities and 6 counties employed full-time assessors.

ASSESSMENT VARIATIONS
City or county assessors are required to assess at fair market value all buildings and improvements while the local commissioners of revenue are required to assess personal property at fair market value. The relationship of fair market value to true market value varies significantly between taxing units. The only requirement, which is established by the constitution, is that "all taxes shall be uniform upon the same class of property within the territorial limits of the authority levying the tax. . . ." Public service properties as- sessed by the State were valued at 40 percent of market value; but beginning in 1966 and during a 20-year transition period these ratios are being reduced to those effective in the local unit.
Assessment ratios are estimated every two years by the Department of Taxation. The ratio is estimated from a sample of real estate parcels sold and in 1971 approximately 35,000 sales throughout the State were used. The assessed value divided by the selling price becomes the assessment ratio. The median assessment ratio per county in 1971 ranged from 6 percent to 34 percent with a weighted State average of 24 percent. For cities, the range was 14 percent to 88 percent with an average of 50 percent. In 1962, the county range was between 6 percent and 36 percent with a State average of 24 percent. The cities ranged between 12 and 85 percent, with an average of 47 percent.
The assessment ratios for non-farm residential property of Census of Governments for 1962, 1967 and 1971 were as follows: 31, 33 and 36 percent. The State does not estimate intra- or inter-area coefficients of dispersion which are needed to get an estimate of the quality of assessments. The intra- and inter-area coefficients for the 1972 Census were 20 and 35 respectively; for the 1967 Census, the respective figures were 16 and 33.
Assessment Reform.3 Realizing that the lack of uniformity in assessments imposes an unfair burden on some taxpayers while giving others a windfall, the Governor's Com- mittee on State-Local Cooperation in 1971 proposed eight measures to strengthen property tax administration. Subsequently, the Revenue Resources and Economic Study Commis- sion recommended that the Governor and General Assembly give serious consideration to these measures which are listed below:
1. The Department of Taxation should have the power to set and enforce adequate criteria for the efficient appraisal of property. This would include the setting of qualifications for and the certifying of local assessors and appraisers; the power to prescribe and require the use of all forms deemed necessary for effective prop- erty tax administration; the power to require all localities to acquire and maintain property identification maps; the sponsoring of in-service, pre-entry, and intern training programs on the technical, legal, and administrative ,aspects of the assess- ment process; and the inspection of local procedures to ascertain that all laws are being carried out.
2. The Department of Taxation should prepare an annual study of assessment ratios and average dispersion by class of property for the counties and cities in the State. If the ratios are found to vary significantly from the sales prices or if the average dispersion is too high, the Department of Taxation should call for and enforce equalization of values within the locality. This would enable the State to measure local effort and to allocate State funds fairly when the processes require a knowl- edge of the value of local real property.
3. A board of equalization should be made mandatory for every county and city in the State and should meet annually.
4. Counties and cities should have annual, continuing reassessments rather than the general reassessments permitted every four or six years. This would allow parcels

in areas of rapidly changing values to be reappraised annually while parcels in areas of stable values are being reviewed annually and reappraised when neces- sary to keep assessments up to date.
5. Counties and cities should be allowed to form multi-locality assessment districts to enable them to perform their assessment duties more efficiently. This would permit certain areas to maintain more efficient offices and to use more sophis- ticated methods such as data processing, which may not be feasible for a single locality.
6. The local assessing office should be made independent of the office of the county or city commissioner of revenue, and the chief assessor should be appointed by the local governing body or by the chief executive officer if he has appointive power.
7. The Department of Taxation should be assigned the duty of equalizing at 100 per- cent of fair market value, the official assessment ratios of all the counties and cities in the State by January 1, 1974. This would require that all cities and coun- ties meet the constitutional mandate.
8. Several topics related to property taxes, such as property exempt from taxation and taxes on machinery and tools or personal property, should be studied further to bring about a more uniform system of taxation.
REV1 EW AND APPEAL OF PARTICULAR ASSESSMENTS
A 1973 act requires that the taxpayer be notified by mail when an increase in assess- ment occurs at least 15 days prior to the date of appeal hearings. The statement must show the value of the real estate, the value of improvements, the proposed increase in assess- ment and the time and place to appeal the reassessment. Each county and city has a board of equalization to hear complaints and equalize assessments. If satisfaction is not forthcoming the county Circuit Court or city Court of Record would hear the appeal. The State Tax Commissioner is the first level of appeal for State assessed properties before the court system.
- -
'Some of the information for this report was supplied by W. B. Harvie, Division of Research, Department of Taxation, Commonwealth of Virginia.
2For an excellent two-volume study of existing exemptions with recommendations on how the system of exemptions can be improved, see Rountrey and Associates, Real Property Tax Exemptions and Relief, A Study of Policies, Practices and Impact on the Commonwealth of Virginia (1973).
T h e material in this section comes from Barry E. Lipman, et al, Fiscal Prospects and Alternatives: 1974, a staff report to Virginia's Revenue Resources and Economic Study Commission (June 19731, pp. 300-302.

WASHINGTON1 Many important developments have affected property taxation in Washington during
the past decade. These include, as in numerous other States, the enactment of some additional exemptions or special treatment provisions, tax limitations, and other types of property tax relief. More significantly, however, Washington:
1) is far along in a statewide program of revaluation of taxable realty (largely fi- nanced from State appropriations);
2) conducts a highly sophisticated program for measurement of assessment levels and variations;
3) is enforcing professional standards for local appraisal personnel;
4) has prepared and disseminated highly informative studies concerning the prop- erty tax system;
5) has greatly improved its arrangements for property tax appeals;
6) will be switching from fractional assessment to full-value assessment beginning in 1974.
FINANCING ROLE OF THE PROPERTY TAX
In Washington's State-local revenue structure, property taxation is an extremely im- portant element, though less so than in many other States. Its role has been dampened historically by Washington's intensive use of the general sales tax and, at the local govern- ment level, by greater than average reliance on various types of non-tax revenue sources. However, per capita property tax yields more than doubled in the 1960's, outpacing the growth in the State's economy, as measured by personal income. In fiscal 1970-71, Wash- ington's property tax burden per $1,000 of personal income was $43 relative to the national average of $47. Per capita property taxes were also below the national average ($169 vs. $184). A decade earlier similar differentials existed: per $1,000 of income, $32 for Wash- ington, $43 for the U.S. average; per capita, $76 and $98. In fiscal 1970-71, property taxes provided 26 percent of all own-source revenue raised by the State and local governments as compared with 23 percent a decade earlier. (The corresponding nationwide average proportion moved down from 38 to 32 percent during that interval.)
In ACIR's Measuring the Fiscal Capacity and Effort of State and Local Areas, it was estimated that Washington's property tax load, relative to capacity, was only about two- thirds of the national average; non-farm residential properties were 52 percent of the national average; commercial and industrial properties, 67 percent, and farm properties, 95 percent. The State's overall effort index for all types of taxes, however, was six points above the nationwide norm.
Washington is one of the relatively few States where State imposed levies account for a consequential part of all property tax revenue. Most of this State revenue, however, is from special property taxes (mainly from a statewide property tax on motor vehi- cles). Local levies account for more than 95 percent of general property tax yields. Nearly 1,400 of the State's 1,682 local governments have property taxing power, (the remainder being special districts that must rely on other means of financing), and for most of these the property tax is a highly significant revenue source. However, in fiscal 1970-71, prop- erty taxes provided only 53 percent of all locally raised general revenue in Washington, as compared with a national average proportion of 64 percent; the property tax part of all

local governments' general revenue (including their intergovernmental receipts) was only 31 percent as compared with a national average proportion of 40 percent. At least in part, these differences undoubtedly reflect Washington's use, ever since 1932, of a relatively stringent constitutional limitation upon local property tax rates.
THE PROPERTY TAX BASE
Locally assessed real estate in 1971 made up 78 percent of the statewide total of valu- ations for the general property tax, with locally assessed personal property contributing 17 percent, and State assessed utility property 6 percent. The proportion represented by State set utility valuations has dropped materially in the past decade partly as a result of litigation which led to a material raising of the assessment fraction for locally set values, as more fully discussed below.
Washington provides for the usual kinds of complete exemptions from tax of the property holdings of governments, churches, and educational and charitable bodies. Also long since exempted from the general property tax are intangible personal property, household goods and personal effects, and motor vehicles (the latter being subject to a State property tax). A number of new exemptions, preferential provisions, or tax relief provisions were enacted in recent years, the more significant of which are reviewed below.
In a 1973 special session, the legislature passed a unique law (SSB-2959) to bring about the uniform treatment of exempt properties. Effective for property taxes payable in 1974, administration of exemptions shifts from the county assessor to the State Department of Revenue. The Department will annually examine existing and new accounts to determine eligibility. Annual filing of an exemption claim with the payment of a $35 fee is required. Failure to file will cause the property to be placed on the tax roll.
A study by the Department of Revenue in 1971 estimated the combined value of prop- erty in Washington at $70 billion; $34 billion was exempt from taxation. The latter figure included $21 billion in intangible wealth, $9 billion in public ownership, and $3 billion exempt as household goods and personal effects. The property owned by churches was placed at $341 million, by hospitals $220 million, private schools $204 million, retirement and nursing homes $899 million, and non-sectarian and youth activities $55 million.
New exemptions and special treatment provisions. The 1971 legislature provided that standing timber be phased out of the ad valorem system of taxation over a three-year period (with 1972 values based on 75 percent of 1970 assessments, 1973 values based on 45 percent of 1970 assessments and 1974 complete exemption), and made timber growers subject instead to an excise tax based on stumpage value collected at the time of harvest. Forest land remains subject to the general property tax. The Department of Revenue was given responsibility for developing stumpage values and for administering the excise tax on timber, and also for determining bare forest land values to be used by the county assessors.
A 1970 enactment as amended in 1973 pursuant to a constitutional amendment which was approved in 1968, provides for special treatment of open space, agricultural, and timber lands. Owners of such land willing to leave their land open for at least ten years may enter into a contract with either the county or city legislative body (depending upon the location of the property) and receive property assessments based upon current use, rather than highest and best use as is the case of other types of taxable realty. Beginning in 1973, farmers' applications will be reviewed by the county assessor rather than the leg- islative body. Property which is withdrawn from open space use is subject to a compensat- ing tax consisting of the difference between the highest and best use and current use value times the tax rate for the preceding seven years plus interest and a penalty of 2 percent of additional taxes due. After the eighth year of the land-use contract, two year notice

must be given before the land use can be changed. If proper notice is not given an addi- tional 20 percent penalty is added to the compensating tax.
Successive legislatures from 1967 to 1972 enacted and broadened provisions by which limited-income homeowners aged 62 or over or the disabled may deduct a percentage of the property tax otherwise due on their residences. The allowed deduction is 100 per- cent if income is $4,000 or less and 50 percent if income is between $4,000 and $6,000. At higher income levels there is no deduction. The deduction is limited to voter approved levies beyond the overall statutory rate limit, but not less than $50 for a claimant having annual household income less than $4,000. For property taxes due in 1973, there were 85,908 approved claims under this program, involving approximately $7.9 million in tax reductions (an average of $92 per claim).
Washington voters in 1973 were asked to approve a constitutional amendment (HJR 19) which would allow for the circuit-breaker form of tax relief. Among many significant tax reform provisions, the amendment allowed the legislature to grant property tax relief on residences by limiting the property tax to a fixed percentage of income, not to exceed 5 percent. The implementing legislation (H.B. 508) entitled homeowners and renters a rebate from the Department of Revenue by the amount which their taxes exceed 5 percent of household income, with a limit of $300. Renters would be able to claim that 15 percent of their gross rent was a tax payment. It was anticipated that 184,600 taxpayers would obtain $25 million in tax relief under this legislation if it had been approved by the voters; the measure failed, however.
Other property tax related provisions of the reform package which was voted down by the Washington taxpayers in 1973 included:
a) the prohibition of excess property tax levies for the maintenance and operation of public schools; and
b) the phasing out of property taxes on business inventories over five years begin- ning with a 20 percent exemption in 1975 and running to a 100 percent exemption in 1977.
A 1972 enactment provides for the exemption for three assessment years of the value of any physical improvement to a single-family dwelling to the extent that the improve- ment represents 30 percent or less of the value of the original structure. A taxpayer desir- ing this exemption must file advance notice of intention to make the improvement and may claim the exemption no more than once in a five-year period. (The constitutionality of this provision is in question.)
Components of the tax base. The 1967 Census of Governments, which was not updated by the 1972 Census, counted about 1.8 million pieces of locally assessed taxable realty in Washington. Half of these were non-farm residential properties, 21 percent were rural properties, and 28 percent were vacant lots. Though business properties made up only 2 percent of the total number, they accounted for nearly a quarter (22 percent) of the dollar total of local valuations of taxable realty.
ASSESS1 NG RESPONSI BI LIT1 ES
Washington's previous Tax Commission (a three-member appointive body) was abol- ished by 1967 legislation, and its property tax duties were assigned, along with other tax collection responsibilities, to a new Department of Revenue. This Department is headed by a Director of Revenue appointed by the Governor. One of its primary units is a Prop- erty Tax Division, headed by an Assistant Director for Property Taxes, who is subject to the State merit system, as are all other Division employees.
With a staff of 54 and a fiscal 1972 budget of $854,000, the Division reflects considera-

ble expansion from 1962, when corresponding duties of the State Tax Commission en- gaged a staff of 29 persons. Even so, its resources amount to only about one-eighth of 1 percent of total property tax levies in the State, or about the same proportion as a decade ago.
Local assessing responsibilities in Washington are placed with elective county as- sessors. The 39 counties range widely in size. King County, where Seattle is located, in- cludes one-third of the State's total population; six other counties, with populations of over 100,000, include another 40 percent. At the other extreme are five counties with less than 5,000 inhabitants apiece, and three with between 5,000 and 10,000 inhabitants.
Changes in legal limits and the assessment ratio. Reacting to a court ordered require- ment that property be assessed at the constitutionally mandated 50 percent of true and fair value which more than doubled the locally set assessed valuations in 1970, the legis- lature approximately halved the 40 mill tax rate limitation which had previously applied. For 1971 and later years, the overall local levy limit is 18 mills per dollar of assessed value, which can be exceeded only by local popular referendum in the areas affected. Since there was also a four mill State levy, the overall rate in the absence of voter ap- proval could exceed 22 mills. An initiative passed in 1972 reduced the limit to 20 mills; a constitutional amendment passed at the same time set the limit at 1 percent of market value. These measures were consistent since the 20 mill limit was based on assessments at 50 percent of market value.
Under another 1971 enactment, effective beginning in 1973, and also subject to excep- tion by local referendum action, a dollar amount limit will apply to the total property tax levy of all local taxing units other than school districts. For each such unit, the total levy for any year cannot (unless approved by the electorate) exceed by more than 6 percent the highest levy of the three preceding years plus the calculated yield, at the past year's applicable rate, from assessed valuations arising from construction and property im- provements.
Other property tax relief provisions. As more fully outlined below, Washington is completing a long-term program to update local assessments. This effort has sometimes resulted in a significant disparity of assessment levels between the revalued and non- revalued portions of particular counties. To deal with this problem, the 1971 legislature allowed county boards of equalization to rollback assessments in the revalued areas by a uniform percentage to the countywide average assessment level indicated by State ratio studies wherever there is a divergence of over 10 percent. This law affected only those counties with State approved revaluation plans, and will no longer apply after the revaluation program is completed in 1973.
Reassessment program. Since 1955, Washington laws have provided that all taxable property should be specifically revalued at least once each four years. In many counties, however, actual performance lagged far behind this standard, despite intensive promo- tional efforts by the State supervisory agency. Accordingly, the Governor proposed in 1969 a State financed program of grants to counties for the purpose of conducting com- plete revaluation programs to deal with all real property in each county over a four-year period. The legislature adopted the recommendation and the 1969 and 1971 legislatures appropriated a total of $10.6 million for such grants. The legislation placed responsibility with the Department of Revenue for allocating funds and supervising the program. Of the State's 39 counties, 35 have participated fully. These 35 counties comprise more than 95 percent of all assessed valuations in the State. Five were completed in 1971 but are con- tinuing reappraisal work with local funds; four choose to bypass the State financed pro- gram completely. The revaluation program has added an additional $5 billion to the 1969 tax base of $9 billion.

To be eligible for State funding, each county assessor was required to submit a com- prehensive revaluation plan to the Department of Revenue showing how the work would be accomplished over a four-year period. Counties were given the option of adding to existing staffs, employing contract appraisal firms, or a combination of the two to achieve their goal.
The Department of Revenue is responsible for monitoring the quality of work being done, and certifies to the State Treasurer each quarter those counties eligible for con- tinued funding from the State. This program is now approximately complete with the statewide real property assessment ratio over 43 percent. In 1969, at the beginning of the revaluation cycle, the ratio was 19 percent.
Qualifications for local assessment personnel. A 1967 law provided for the establish- ment by the State Department of Personnel of a classification and salary plan to be op- tionally available to counties for their appraisal personnel. The same act provided for Department of Revenue participation in determining local staffing requirements for prop- erty revaluation. In 1971, the legislature established statutory requirements to be met by any person responsible for assessment of real estate. The basic qualifications are gradua- tion from an accredited high school and at least one year of experience in selling, apprais- al, or assessment of real property, knowledge of basic appraisal methods, and successful completion of a written examination given by the State Department of Personnel. About 300 county appraisers have been certified since the law became effective in 1971.
Training. In-service training schools sponsored jointly by the Department of Revenue and the Washington State Association of Assessors annually cover a wide variety of subjects. A five-day real property appraisal course comprised of three levels of instruc- tion is presented annually. A school for members of county boards of equalization is also conducted each year. Special seminars covering land valuation, appraisal of pos- sessory interests, office and administrative procedures, special valuation problems, and a wide variety of other subjects are also presented. The Department of Revenue has, since 1968, maintained an educational unit directed by its educational coordinator to plan and present the in-service training programs.
Special appraisal assistance. Department of Revenue appraisers are available on a first-come, first-served basis to help counties appraise complex properties. At the present time, the Department's staff is not large enough to make all of the appraisals requested by the counties. However, its industrial appraisers have provided service in the valuation of refineries, pulp and paper mills, saw mills, aluminum reduction plants, chemical plants, and other difficult property types in various parts of the State. Personal property auditor- appraisers employed by the Department have also been available on a limited basis to conduct audits of large companies, particularly those headquartered outside the State.
ASSESSMENT VARIATIONS Legal requirements. Washington's constitution called for the assessment of taxable
property uniformly at 50 percent of true and fair value (except for the special treatment recently authorized for certain open space land, as noted above). Prior to 1970, however, the actual level for locally assessed real estate was generally about two-fifths of the legally specified percentage, and personal property valuations commonly were around 25 percent of market value (or half of the proportion constitutionally called for).
Continued tolerance of this situation was outlawed by a recent decision of the State Supreme Court, which ordered compliance with the constitutional 50 percent require- ment, and defined true and fair value as market value. Formal action was accordingly taken in 1969 by the Department of Revenue, requiring all counties to adjust their 1970

assessed valuations materially upward to the prescribed 50 percent level. This involved a doubling of locally set assessments in each county, and a corresponding expansion of the statewide total of such valuations.
With the passage of a constitutional amendment in 1972 limiting levies to 1 percent of air market value rather than the previous 40 mills at 50 percent of true and fair value, the legislature was free to mandate full-value assessment. In the first special sessicn of 1973, H.B. 186 was passed (Chap. 195) which changed the 50 percent requirement to a 100 percent requirement. Thus, Washington becomes the second State (following its neighbor, Oregon) to mandate full-value assessment from a fractional assessment.
State assessment ratio studies. During the past decade, Washington has vastly strength- ened, refined, and improved its program for the regular statistical measurement of assess- ment levels and variations. Results of this effort are published annually in a report which includes, for each county, average ratios for taxable real estate and personal property as well as a composite indicated ratio covering both, and a coefficient of dispersion for real estate assessments.
Procedures for this operation resemble in some respects those of California's long established program. For example:
1. Ratio estimates are developed for both real estate and personal property, utilizing a size-stratified sample.
2. The study deals with a sample of taxable personal property annually in every county, but with a specific sample of real estate parcels in only about one-third of the counties each year.
3. Market value amounts are related to the last preceding official assessed valuation (rather than, as in some States, to a subsequent official valuation). The resulting initial findings are accordingly trended forward for each county to the particular assessment year for which an official ratio measure is needed. The trend is estab- lished by multiple regressions based on relevant statistical data for each county.
In at least one important respect, the Washington program differs from California's. Washington makes extensive direct use of information concerning recent market sale of taxable realty, taking advantage of filings required by the State's real estate transfer tax, and supplementing these by appraisals to the extent needed to carry out the sample design. California's program is based entirely on appraisals.2
The individual county assessment ratio averages thus developed have many impor- tant applications. By law, they are taken into account in the allocation of State set valu- ations for utility property, the application of the State's general property tax levies, and the calculation of local effort for the distribution of equalizing grants for public schools and other purposes. They also provide background for specific official action on tax- payer appeals.
Assessment performance. As previously noted, there was a mandatory statewide doubling of locally set assessed valuations in 1970 and a reassessment program. The re- sults are reflected in the 1973 average assessment ratio for both real and personal proper- ty of approximately 44 percent, as compared with 20 percent in 1969. The change in as- sessed value for residential properties between the 1967 and the 1971 Census of Govern- ment was equally dramatic as the percentage increased from 17 to 36.
Department's ratio findings for 1973 showed a considerable reduction of dispersion among counties in average assessment levels for all property (from 26 to 47 percent) as compared to 1969 when the range was 11 to 25. Since such inter-county differences are substantially dealt with by equalization, they are less damaging from the standpoint of tax equity than intra-county variations in the valuation level for particular pieces of

taxable property. The Department's published findings on that score for 1969-the last assessment year before the revaluation program got under way-indicated only three of the 39 counties had a dispersion coefficient for real property of less than 20 percent and one-third of the total number showing a dispersion coefficient of at least 40 percent.
Marked reduction in such intra-county variations can reasonably be expected with the completion of the revaluation program. There is encouraging evidence that the pro- gram is operating strongly in that direction. Testing 1970 data for the revalued portions of 17 counties, the Department of Revenue calculated a dispersion coefficient of less than 20 percent in 16 instances, including eight cases where the dispersion coefficient was less than 10 percent. In the previous year, in contrast, only one of these 17 counties had shown a countywide dispersion coefficient of under 20 percent and for more than half of them the figure was 3Q percent.
The statewide coefficient of dispersion for real estate assessments dropped from 35 in 1969 to 29 in 1970. Further curtailment of variations in assessments is occurring as the revaluation program is finished.
Contradictory results are obtained when comparing the 1967 and 1972 Census coeffi- cients of dispersion which imply the quality of assessment had declined from 13 to 21 for the inter-area coefficient and 22 to 25 for the intra-area coefficient.
AVAILABILITY OF PROPERTY TAX DATA
Information to individual property owners. Under a 1967 enactment, the assessor must give notice of any change in his determination of the true and fair value of a taxable parcel of real property to the property owner by June 15 each year. This notice includes a brief statement of the procedure for appeal to the county board of equalization, includ- ing information on the time and place for filing the appeal and an indication of the date when the board of equalization will meet for the purpose of reviewing petitions. Deci- sions of a county board of equalization also contain information on the procedure for appealing to the State Board of Tax Appeals. (In addition, of course, the property owner receives an annual tax statement from the county treasurer, and both the tax roll and assessment roll are public records open to inspection.)
Bills passed in 1973 provide that the assessor's records, with the exception of con- fidential income data, be open for public inspection, the assessor furnish the taxpayer who petitions the board of equalization with a compilation of comparable sales data used in establishing the taxpayer's property value, and that tax levies be expressed in dollars per $1,000 of assessed valuation rather than mills.
Published data. The Department of Revenue issues an annual ratio study, presenting detailed information on the findings and methodology of its assessment ratio program. Its regular Biennial Report includes significant data, by county, regarding assessed valua- tions and property tax levies and collections. It also releases intermittently a "Revenue Newsletter" which includes highlight information about developments involving the property tax and other taxes administered by the Department.
In 1970, the Department issued as "a progress report on achievements in property tax administration in the State of Washington," a 183-page volume entitled Property Taxes in the '70s: The Road to Equity. This extremely informative presentation, which deals with a wide range of subjects in highly readable fashion, affords an invaluable reference not only for readers concerned with Washington's property tax arrangements, but also for those interested more generally in particular aspects of property tax administration, in- cluding for example utility valuation, the conduct of assessment ratio studies, and com- puterized methods for the mass appraisal of certain types of real estate.

REVIEW AND APPEAL OF PARTICULAR ASSESSMENTS
Review agencies. The composition of county boards of equalization was modernized by 1970 legislation, which removed the county assessor from his position as clerk of the county board of equalization and gave the county commissioners the option of either con- stituting the board themselves or appointing a totally independent board. The new law also gives county boards of equalization authority to hire clerical and appraisal assistants, and requires the Department of Revenue to conduct an in-service training school for board members.
Property tax appeals formerly handled by the State Tax Commission are now heard by an independent State Board of Tax Appeals, a separate body formed in 1967 at the time the Department of Revenue was created. Any taxpayer or county assessor aggrieved by an action of the county board of equalization may appeal to the State Board of Tax Appeals, which consists of three members appointed by the Governor. This Board also utilizes hearing officers who travel to the various counties to consider locally scheduled appeals, thereby lessening inconvenience to appellants.
Admissability of State ratio data. Findings from the Department's assessment ratio studies have been used as evidence in appeals before the State Board of Tax Appeals and in the Superior Court.
>Part of the information in this report was provided by Clyde B. Rose, Assistant Director, Property Taxes, Washington Department of Revenue, and his administrative assistant, T. S. Cady. More detailed information on many of the subjects briefly mentioned here appears in a 1970 publication of the Department, Property Taxes in the '70s.
T o r two years-until this procedure was judicially rejected-the Washington operation had involved a final upward adjustment of the statistically developed average assessment ratios of individual counties that were conducting an approved revaluation program, based upon the extent of their accomplishment under that pro- gram.

Wisconsin's property tax system still exhibits the principal features which were re- viewed by an ACIR study a decade ago. These include:
1) heavy reliance upon property taxation,
2) a relatively broad and well defined property tax base,
31 an extremely decentralized pattern for local assessment (involving more primary assessing jurisdictions than are found in any other State),
4) a State property tax agency with broad powers of supervision over local property tax administration and a historical tradition of professional competence.
5) heavy reliance upon that agency's operations to minimize the inefficiencies that would likely result from the highly decentralized local assessment system and marked differences in assessment levels.
Important recent developments have included (a) considerable broadening of steps that began a decade ago to reduce the relative role of property taxation, and (b) efforts to provide a significant measure of tax relief to persons with limited incomes. Unlike many other States, Wisconsin has granted fewer new property tax exemptions or assess- ment preferences during this period, but has instead provided for various State financed tax credit arrangements which are designed to benefit local taxing jurisdictions and tax- payers who own particular types of property or are subject to relatively high local tax rates.
FINANCING ROLE OF THE PROPERTY TAX
The State-local revenue structure of Wisconsin involves very heavy reliance on prop- erty taxes, although their relative importance has been diminishing. In fiscal 1970-71, property taxation provided 36 percent of all the general revenue raised by the State and local governments. The corresponding fraction a decade earlier was 45 percent. In the 1960's. Wisconsin enacted a general sales tax (having previously relied mainly on income taxes), and has since raised rates on it and various other major State taxes. Much of the additional revenue is being used to finance increased aid to local governments, including two sizable programs for general support grants designed in part to reduce the heavy reliance of local governments on property taxation.?
- -
Despite such developments, per capita property tax yields in Wisconsin nearly dou- bled during the 1960is, reflecting an annual increase of 6.8 percent, reaching $231 in fiscal 1970-71. (The national average was $184.) This growth rate materially outpaced the growth of the State's economy as indicated by an average yearly increase in per capita personal income of about 5 percent. Consequently, the property tax per $1,000 personal income increased by $5 in the last decade reaching $63 in fiscal 1971. (The nation's average is $47 which is $4 higher than a decade earlier.) Published data by the State Department of Revenue indicate a rise in the effective rate of the general property tax (after allow- ance for certain State financed tax credits) from 2.64 percent in 1966 to 3.2 percent in 1970.
In the ACIR study, Measuring the Fiscal Capacity and Effort of State and Local Areas, it was estimated that Wisconsin's property tax load, relative to its capacity, was 28 percent above the national average-higher than that of all but six other States. It was 75 percent higher on farm properties, 21 percent higher on non-farm residential and only 9 percent

higher on commercial and industrial properties. The same study estimated that Wiscon- sin's effort index for all types of State and local taxes was 24 percent above the U.S. norm.
Property taxation in Wisconsin is a major element of local government financing. In fiscal 1970-71, it accounted for 76 percent of locally raised general revenue, or 43 percent of all general revenue of local governments, including their intergovernmental receipts. The corresponding nationwide proportions were 64 and 40 percent. Nearly all of Wiscon- sin's 2,448 local governments (as of 1972) have property taxing power, and for many of them this is the predominant financing source. School districts account for about three- fifths of all local levies, with the balance about evenly divided between county govern- ments and others (cities, villages, towns, and special districts).
The State government also imposes a relatively low rate general property tax, but most of its property tax revenue is from a special statewide levy on certain utility proper- ty (more fully described in an ACIR report of a decade ago).3 Altogether, about 7 percent of all property tax revenue in Wisconsin is from State imposed levies, which is higher than the proportion found in most other States.
THE PROPERTY TAX BASE
As described in the ACIR study cited above, Wisconsin's property tax system is rela- tively broad in application, and involves fewer exemptions than those of many other States. The operating property of railroads and most types of public utilities is assessed by the State on a unitary basis and taxed only by a statewide levy for which the rate is determined annually by reference to the statewide average effective rate of levies against other taxable property. Hence, the base for all local levies (and of the State's low rate gen- eral levy) consists entirely of property subject in the first instance to valuation by local assessors.
Both in terms of locally set assessments and estimated full-value measures, personal property accounts for 16 percent of the statewide general property tax base-a propor- tion which has shown relatively little change during at least the past decade. Most of the taxable personal property consists of business holdings, including inventories as well as machinery, fixtures, and the like; however, livestock makes up more than one-sixth. As in most other States, intangible personal property, motor vehicles, and household furnish- ings and personal effects are completely tax exempt. Beyond this, in lieu of partial or complete exemptions for particular types of economically productive personal property (as granted in some other States), Wisconsin provides for credits by which the State gov- ernment pays a major fraction (originally 50 percent and, beginning in fiscal 1973, 65 per- cent) of the property taxes otheraise due on livestock, merchants' inventories, and manu- facturers' materials and finished products. The tax credit was increased from $55.4 million to $79.9 million for the distributions made in 1973. Effective with the May 1974 assessment, manufacturing machinery and processing equipment will be exempt from property taxes; and in May 1977, merchants' stock in trade, manufactured materials and finished products and livestock will be exempted, as the credits will reach 100 percent of the tax.
As is true in many States, pollution control equipment has been exempted from prop- erty taxes.
Compassion for the low-income taxpayer. The other major tax relief measures, first effective in fiscal 1965 and successively liberalized thereafter, are described in Table 1. Originally the tax relief was restricted to the elderly, but in 1973 this measure of compas- sion was extended to all householders (both homeowners and renters) over 18 years of age. Assistance was restricted to those with income of less than $3,000 originally, but this has been liberalized to $7,000 with the 1973 amendments.4
Through the State's income tax system, eligible persons may claim an income tax

TABLE 1 INCREMENTAL EXPANSION OF WISCONSIN HOMESTEAD TAX RELIEF
For Taxes Paid in Calendar Year 1964 1966 1968 1970 1972 1973
Eligibility Minimum age 65 62 18 Breakeven income $3000 $3500 $3700 $5000 $7000 Maximum farm (acres) 1 40 80
Computation "Reasonable tax" (% of income for $500 0-5-10- 0-3-6-9 0-0-5-10 0-0-0-0- increments) 15-20-20 12-15-15 14.3-14.3- 0-0-0-14.3-
. . .-14.3 14.3-. . .-14.3 Maximum Excess Tax $300 $330 $500 7 0 of Excess Tax Relieved 75%/50% 75%/60% 80%
Relief Granted Claims allowed 30,700 58,700 67,400 70,400 300,500 Average relief
Current $ $59.56 $88.59 $90.94 $95.73 $143 Constant $* $59.56 $85.02 $84.91 $82.53 $111
Total cost Current $ million $1.8 $5.2 $6.1 $6.7 $ 43 Constant $ million* $1.8 $4.9 $5.7 $6.0 $ 33
Source: March Bendick, Jr., "Designing Circuit-Breaker Tax Relief," National Tax Journal 27 (I), (March 1974), p. 20. *Deflated by consumer price index to 1964. s
credit for cash refund for part of the amount by which their annual residential property tax (up to a statutory maximum] exceeds a graduated proportion of their income which varies directly with income levels. For this purpose, the law provides that 25 percent of gross rent paid shall be considered as the property tax liability of renters.
For 1972, the homestead tax credit was as follows:
Household Income
Under $1,000 Over $1,000
Credit
75% of accrued property tax. 60% of the amount that accrued tax exceeds:
5% of income between $1,000-$1,500 10% of income between $1,500-$2,000 14% of income over $2,000
The maximum limit for accrued property taxes was $500. With the 1973 amendments, the above schedule was changed as follows:
Household Income
Under $3,500 Over $3,500
Credit
80% of accrued property tax. 80% of the amount that accrued taxes exceed
14.3% of income over $3,500.
Components of the tax base. The 1967 Census, of Governments, the latest available data since the figures were not updated in 1972, reported over 2.1 million parcels of tax-

able realty in Wisconsin of which 43 percent were non-farm residential properties, ac- counting for 61 percent of the statewide total of assessed realty valuations; 38 percent were acreage or farm properties, contributing 11 percent of realty valuations. The far less numerous commercial and industrial properties (4 percent) accounted for 26 percent of statewide realty valuations; vacant lots, which were 15 percent of all parcels, contributed 1.7 percent of all assessed realty valuations.
ASSESS1 NG RESPONSIBILITIES
As was true a decade ago, Wisconsin maintains three levels of assessment administra- tion involving numerous primary assessment districts (cities, towns and villages), the 72 counties, and a State tax agency. The latter was changed in name in 1967, from the Depart- ment of Taxation to the Department of Revenue. More significantly, it is now headed by a Secretary of Revenue who serves at the pleasure of the Governor, whereas the former Commissioner of Taxation served a six-year term which could and sometimes did overlap the terms of more than one Governor.
The Department of Revenue administers the State's major taxes, and carries out its property tax responsibilities through a Bureau of Property and Utility Tax. By recent ac- tion, this unit and the Bureau of Municipal Audit (previously part of the Department of Administration) were grouped in a newly designated Division of State-Local Finance. Al- though the Bureau of Municipal Audit is not directly concerned with property assess- ments, its organizational grouping with the property tax unit reflects the important interre- lations which have developed between local property taxation and the Wisconsin revenue system as a whole.
The Bureau of Property and Utility Tax has, in addition to its central staff, a field staff assigned to six offices, each having jurisdiction over a group of counties. Its 1972 appropri- ation of $1.1 million equals about 0.1 percent of statewide property tax yields-consid- erably less than would seem desirable in view of the scope and complexity of the Bureau's responsibilities. Its personnel has been moderately increased during the past decade, from 54 to 77.
Wisconsin has a larger number of primary local assessing jurisdictions than any other State-a total of 1,840, of which nearly one-third are cities or villages and the rest are towns. (Despite their designation, the latter are not municipalities of concentrated pop- ulation, but principally rural units of the kind termed towsnhips in most other States having such governmental units.) Of all the primary assessing areas, two-thirds have fewer than 1,000 inhabitants each, and, altogether, these more than 1,200 jurisdictions have less than one-sixth of the State's population. At the other extreme, there are only two (city) as- sessing areas with more than 100,000 population, another eight with 50,000 to 100,000 popu- lation and a dozen with 25,000 to 50,000 population. Thus, little more than 1 percent of all the assessing jurisdictions (22 of the entire 1,840) have populations of at least 25,000; how- ever, this limited group includes about 45 percent of the State's population.
As would be expected with such an arrangement, the overwhelming majority of local assessors work only on a part-time basis, and are correspondingly paid. In 1971, nearly half (44 percent) of the total number had annual salaries for assessment work of $550 or less, and less than 4 percent were paid at least $6,000. Of the 68 assessors paid $6,000 or more, 57 were engaged by cities, which, of course, are the more populous jurisdictions. Nearly three-fourths of all the local assessors are popularly elected (for two-year terms); however, about two-thirds of the 203 city assessors are appointed rather than elected.
A modest gesture toward a less highly decentralized arrangement was made by a 1969 statute which authorized the board of supervisors of any county, by a two-thirds vote of its entire membership, to provide for an appointive county assessor to supplant present smaller-area assessors within the county. (Wisconsin county boards are relatively large;

in 1967 they averaged 27 members per county.) The law also provided that any county tak- ing such action should provide for a five-member board of assessment review. To date, the Department of Revenue has been asked by at least a dozen counties to estimate the cost of such a county assessor system. The question has been brought to a formal vote in only two instances, and one county has adopted the system to become effective in 1973. To stimulate further voluntary consolidations, the State legislature in 1973 passed a new law reducing the vote needed for passage from a two-thirds majority to a 60 percent ma- jority and for State payment of 75 percent of the cost of the county assessor system. Even a statewide conversion to county assessment would result in relatively few jurisdictions with populations large enough to support efficient assessment organizations. Of Wiscon- sin's 72 counties, only nine have populations of at least 100,000 and only 21 have popula- tions of at least 50,000. Conversely, nine counties have fewer than 10,000 inhabitants, and 32 have fewer than 25,000.
As more fully explained in the ACIR report of a decade ago, the State's property tax responsibilities involve not only the assessment of certain utility property (for application of a statewide levy) but also supervision of local assessing work and the equalization of locally set valuations, i.e., its annual determination of "the full value according to its best judgment" of all property subject to general property taxation in each county, city, village, and town. Its figures are presented to the county boards of supervisors and (with only very rare exceptions in recent decades) are accepted and directly used by the respective county boards for use in intra-county equalization-i.e., to apportion among the respec- tive local assessing areas the general property taxes levied by the county government. The Department's full-value determinations also are the basis for application of school district levies and of the statewide general property tax and are used to establish the average statewide effective rate of general property taxation (which determines the rate for the levy on utility operating property) as well as in numerous other ways.
The 1973-75 budget bill requires that the assessment of all manufacturing propzrty be transferred to the State level due to the complexities involved in assessing such property. It was felt that creating a statewide staff of industrial appraisers;
1) would eliminate the cost of duplicating such expertise in each of the numerous counties and municipalities where such property is located,
2) would permit an industrywide approach to valuation which would reflect chang- ing statewide economic conditions in each industry.
3) would guarantee a more uniform approach to valuation irrespective of location in town, village, or city and thereby isolate the valuations from actcal or potential local tax policy objectives.
This change in assessment practices was suggested by the Governor's Task Force on Educational Financing and Property Tax Reform. The following extended quote is taken from their report.=
To provide property tax reform, the Task Force recommends that ultimately there be established a statewide system of property assessment. Progress toward that goal will be provided by the establishment of uniform State assessment standards to be ap- plied by county assessors trained and certified by the State.
1. Improving the Equalization Process
The employment of better techniques, including sales analysis, would increase tax equity between taxing units, although inequities in assessments within a munici- pality would continue to exist.

2. Certification and Supervision of all Local Assessors
This supervision would require all property to be assessed at full valu'e. If the State level supervisors review assessments closely, using modern sales appraisal and oth- er techniques to assure the equity of assessments, this option will permit a shift from a dual to a single system of property values. However, this cannot be accom- plished when the assessing responsibilities are divided among 1,870 taxing units.
3. Moving the Assessment Responsibility to Larger Governmental Units
County assessment is a third proposal which serves the objective of accurate as- sessment because a county taxing district can employ more qualified staff, provide better training and maintain better information than a municipality. Unless county assessment is combined with State certification and supervision, however, there would still be a dual system of property values.
4. State Assessment of Manufacturing and Commercial Property
Moving the assessment of manufacturing property to the State level would remove the inequities resulting from local assessment and make it easier for local units (such as counties) to concentrate on the assessment of the remaining property.
Reassessment of the taxable property in any district may be obtained upon a written appeal to the Department of Revenue by owners of not less than 5 percent of the as- sessed value of property in the district, upon public hearing and proof that the assessment complained of is not in substantial compliance with law. During the period July 1, 1972, through June 30, 1973, the Bureau of Property and Utility Tax processed 27 petitions for re- assessment. The disposition of these was as follows:
Supervised assessment ordered by State Resolved by local initiative after State hearing Denied as being without merit Jursidiction not taken (defective petition, etc.) Pending as of June 30, 1973
The property tax agency has continued to provide local assessors with revised and up- dated assessment manuals. This activity included a major revision in 1965 and another, providing an expanded three-volume issuance, in 1972. Local assessors are instructed in the use of the manual by Department of Revenue personnel through the annual assessors' conferences and various vocational school offerings throughout the State.
ASSESSMENT VARIATIONS.
Legal requirements. Wisconsin laws call for assessment of taxable property at its mar- ket value, though in slightly different terms for realty ("at the full value which could ordi- narily be obtained therefore at private sale") and personal property (true cash value). However, the courts have long countenanced fractional valuation by local assessors, in the absence of a showing of significant variation as among various properties. Under a 1969 law, each assessor is now required to include, in transmitting his assessment roll to the local board of review, a sworn certification of the "percent level of fair market value" he has sought to apply.
State assessment ratio studies. Wisconsin was one of the earliest States to develop an- nual estimates of assessment level for local assessing areas. For many years, this effort was handled by district offices of. the State property tax agency, but it has recently been centralized in the headquarters office, utilizing computer facilities there. Since 1969, this operation has been able to draw upon price information for recently sold properties that

became available under a State real estate transfer tax enacted that year. The effort in- volves no sampling; all usable transactions are dealt with. The Bureau of Property and Utility Tax reports that:
Output consists of a statement regarding "sufficient size sample" with respect to predetermined reliability and confidence limits; coefficient of dispersion; mean, ratio, median ratio, ratio of aggregates and price related differential. Also various strata are set forth separately, such as residential, commercial, agricult- tural and manufacturing and within each of these strata is capability for further stratification such as vacant land and land with improvements. For the first time this year (April 1972), each one of the 1,840 local assessors will receive a summary sheet containing the results of the automated sales analysis [for his area].
Results of this statistical effort have been drawn upon for many years by the Depart- ment of Revenue (and the predecessor Department of Taxation) in developing its legally required estimates of the full value of locally assessed property. However, as noted in the earlier ACIR report, such full-value estimates must be and are developed not only in considerable detail by property classes for taxable realty, but also for personal proper- ty, on which the sales ratio study affords no information. Except for the limited number of rather large assessing jurisdictions, few if any usable transactions are likely to be avail- able for some classes of realty in any particular year, and for each of hundreds of the smallest jurisdictions even the total number of transactions is relatively sparse. Therefore, it is essential for the Department, in order to obtain a basis for its detailed full-value estimates, to supplement the sales ratio calculations with selective spot appraisals and property checks carried out by its field staff. The earlier ACIR report included a brief description of these field staff activities.
Assessment levels and variations. The Department of Revenue's published data indi- cate practically no change in the statewide average assessment level in recent years -con- sistently about 61 percent for both realty and taxable personal property. This is the com- posite result, however, of highly diverse averages in local areas. In 1970, according to the Department, the 72 counties ranged in average assessment ratio for real estate from 40 to 100 percent, with ten counties at or above 80 percent and another 20 between 70 and 80 percent. The estimates of overall assessment ratio (including personal property) reflected a similar pattern, and for most counties the indicated average levels for the two com- ponents were quite close to each other. The Department also publishes estimates of over- all assessment ratio for all of the State's 1,868 local tax districts (somewhat exceeding as- sessment jurisdictions in number because of a few inter-county municipalities). These fig- ures reflected for 1970 a considerable difference in assessment level as among various parts of many counties and, of course, a wider extreme range than the county averages- in 1970, from 10 up to 128 percent. Most counties show inter-district differences in esti- mated assessment levels of 3-to-1 or more, and in many counties the range is considerably greater than this. As pointed out in the ACIR report of a decade ago, at least the more sizable of Wisconsin's assessing jurisdictions have long been credited with unusually good performance. This was confirmed again by the 1967 and 1972 Census of Governments, which for a limited sample of areas-most of them relatively populous-showed in most instances quite uniform assessment ratios for single-family houses. The assessment ratio in 1972 was 46 and in 1967, 55 percent. Computerization of the State's sales ratio operation is increasing the amount of information developed about within-area assessment varia- tions. However, for many hundreds of small areas that comprise a large proportion of all the jurisdictions involved, the development of objective measures on this score is serious- ly handicapped by the paucity of relevant property transfers. In any case, the State's in- tra-area coefficient of dispersion was 16 in 1967. This coefficient declined to 14 in 1972, the

lowest in the nation. The inter-area coefficient declined substantially from 55 percent in 1967 to 24 percent in 1972.
Application of study findings. Department of Revenue estimates of the full value of taxable property -which draw heavily upon results of the annual sales ratio study-have a very wide range of applications. The number of statutory uses has increased from the "over 80" cited for 1961 in the previous ACIR study to a recent count of 97 applications, in- cluding 54 involving the apportionment of taxes (the State forestation tax, county and school district levies, etc.), 15 relating to tax rates, nine involving debt limits, and a score of others. The more detailed information on assessment ratios indicated by recent sales of realty is intensively utilized, of course, by the Department of Revenue in its review and supervision of local assessments.
AVAILABILITY OF PROPERTY TAX DATA
During the past decade, Wisconsin has maintained and strengthened its unusually ex- tensive program for annual publication of data on property tax valuations (both as locally set and in terms of full value) by type of property, tax levies, assessment levels, and tax rates (both as locally set and on an effective rate or full-value basis). Various annual bulletins deal with these subjects statewide, by county, and, in lesser detail, for each of the more than 1,868 local taxing districts. Understandably, there is a considerable time lag in the publication of these bulletins; for example, the two most detailed statewide re- ports of 1970 property tax data were issued in late 1971 and early 1972. The Department of Revenue furnishes its available findings as to levels of assessment in advance of publica- tion, upon request.
Under a law first effective in 1964, each local assessor is required to send a notice of increased assessment to the property owner in any instance where the assessed valuation of a real estate parcel is at least $100 more than the preceding year (unless the change re- sults from a general reassessment or from a blanket percentage change in valuations for all or particular classes of taxable realty). The notice must indicate the date of the meet- ing of the local board of review.
In 1968, the Department published a highly readable pamphlet on "The General Prop- erty Tax in Wisconsin," which has been since successively adjusted and reissued. In non- technical question-and-answer fashion this pamphlet deals with such subjects as the as- sessment process, appeals, tax levies and rates, collection methods, and reassessment.
REVIEW AND APPEAL OF PARTICULAR ASSESSMENTS
There has been no material change in Wisconsin's arrangements for assessment ap- peals, as described in the earlier ACIR report. During the past decade, however, the courts appear to have taken increased cognizance of the Department's assessment ratio findings and related full-value estimates, in rendering judgments on tax appeals. Also, as previ- ously noted, each county board of supervisors now has the power (which none has exer- cised) to replace smaller assessing jurisdictions by a single county assessing office, subject to the requirement that a new county board of review would then also become responsible for the appeal duties presently exercised by the county clerk and county board acting ex- officio.
'Part of the information for this report was supplied by Werner W. Doering. Special Assistant to the Admin- istrator, Division of State-Local Finance, Wisconsin Department of Revenue.
2For many years, Wisconsin has shared a material fraction of its personal and corporate income tax revenue with local governments on a return-to-origin basis, and in the 1960's it added property tax relief grants. Under recent legislation, the shared tax arrangement has been considerably broadened, with much of the distribution placed on a straight per capita basis ($35 annually per resident). For calendar 1972, the general support distribu-

tions will total $363 million, or about $80 per capita and equal to more than one-third of per capita property tax levies.
3The Role of the States in Strengthening the Property Tax. Pages 174-179 of Volume I1 of that report provide a relatively detailed description of Wisconsin's property tax system, most of which is still applicable. However, express companies are now subject to local property taxation, rather than being subject to State assessment and taxation.
'For a more detailed discussion of the development of the Wisconsin circuit-breaker, see ACIR, Financing Schools ond Property Tax Relief-A State Responsibility, A-40 (1973), pp. 175-187; Marc Bendick. Jr., "Designing Circuit-Breaker Tax Relief," National Tax Journal, 27(1), (March 1974).
=The Governor's Task Force on Educotionol Financing and Property Tax Reform: Final Report (February 1973).

PART Ill MODEL LEGISLATION

Model Statute A
PROPERTY TAX ORGANIZATION AND ADMINISTRATION
State and local governments share responsibility for property assessment administration in all States but Hawaii. Efforts at improving the quality of property assessment therefore must concentrate on knitting this two level system into a well-coordinated, smoothly functioning operation. The draft proposal seeks to achieve this difficult, but by no means impossible, goal by clearly spelling out the responsibilities of each level and by providing effective machinery for the coordination of assessment standards and procedures.
The prevailing pattern for State-local property tax administration - subject to innumerable variations - provides a four-step process:
- local assessment districts, which are responsible for the bulk of primary assessing;
- local or county boards of review;
- county boards of equalization; and
- one or more State agencies which are responsible for functions such as supervision of local assessing, technical aid to local assessors, taxpayer appeals hearings, interarea equalization of assessment, central assess- ment of some classes of property, and valuation research.
The suggested legislation coordinates State-local administrative organization under a central directing authority.
It provides for a single State agency which is professionally organized and equipped for the job. Ade- quate powers of supervision and regulation are clearly defined by law. The State agency has responsibility for assessment supervision and equalization, assessment of all State-assessed property, and valuation research.
At the local level, the suggested legislation provides that no assessment districts be less than countywide. If counties are too small to be efficient assessment districts - as often is the case - the bill authorizes the creation of multicounty assessment districts. To avoid wasteful duplication of assessment effort, it elimi- nates all overlapping assessment districts (township and municipal). It also provides for county assessors to be appointed on the basis of demonstrated merit and be subject to removal for good cause by the appointing official.
The suggested act seeks to encourage the employment of assessors and appraisers on a professional basis. Therefore, no residence requirement is included. To omit a residence requirement, some States may find it necessary to amend the relevant general personnel statutes or write an affirmative exemption into this statute.
This draft legislation draws on Oregon, Maryland and Kentucky experience, particularly as it relates to the provision of State technical assistance to local assessment jurisdictions. In 1969, Nebraska enacted prop- erty tax organization and administration statutes closely parallel to this draft bill.

Suggested kgislation
/Title should con form to state requirements. The following is a suggestion: "An act establishing a division of property taxation within the f state tax agency); providing for the qualifications, duties, and responsibilities of county assessors and related personnel; providing for state-county relations in respect of assessment and appraisal of property, and for related purposes. "J
(Be it enacted, etc.)
Section 1. Division of Property Taxation. ' (a) There shall be in the [state tax agency] a divi-
sion of property taxation, hereinafter called the "division." The head of the division shall be the
director, appointed by the [head of the state tax agency] in accordance with the provisions of the
[state merit system law]. The director shall serve in accordance with provisions of the law. He shall
have experience and training in the fields of taxation and property appraisal.
(b) The employees of the division shall be in the [state merit service] . The director may con-
tract for the services of expert consultants to the division.
(c) In addition to any duties, powers, or responsibilities otherwise conferred upon the division,
it shall administer and enforce all laws related to the state supervision of local property tax administra-
tion and the central assessment of property subject to ad valorem taxation. The director shall have
rulemaking authority [in accordance with the state administrative procedures act] . Whenever the
division assesses or appraises property, or provides services therefor, it shall prescribe the methods and
specifications for such assessment or appraisal.
Section 2. Assessors and Appraisers, Qualifications and Certification. (a) Except as expressly
permitted by statute, [no person shall be eligible for election to the office of assessor and] no person
shall perform the duties or exercise the authority of an assessor or appraiser of property in or on
behalf of any county unless he is the holder of an assessor's or appraiser's certificate, as the case may be,
issued by the division.
(b) The division shall provide for the examination of applicants for such certificates. No certif-
icate shall be issued to any person who has not demonstrated to the satisfaction of the division that he
is competent to perform the work of an assessor or appraiser, as the case may be; but any applicant for
a certificate who is denied the same shall have a right to a review of the denial [in accordance with the
state administrative procedure act] [by a court of appropriate jurisdiction] .
'As an alternative for states in which organization for tax administration is diffused, the agency should be given prominence as a separate department or bureau. It may be desirable to have the career administrator serve under a multi- member commission appointed for overlapping terms.

Section 3. Collection and Publication of Property Tax Data. (a) The division annually shall
make and issue comprehensive assessment ratio studies of the average level of assessment, the degree of
assessment uniformity, and overall compliance with assessment requirements for each major class of
property in each county in the state. In order to determine the degree of assessment uniformity and
compliance in the assessment of major classes of property within each county, the division shall com-
pute measures of central tendency and dispersion in accordance with appropriate standard statistical
analysis techniques. [As used in this section, "average dispersion" means the percentage which the
average of the deviations of the assessment ratio of individual sold [or appraised] properties bears to
their median ratio.]
(b) The division may require assessors and other local officers to report to it data on assessed
valuations and other features of the property tax as the division shall require. The division shall con-
struct and maintain its system for the collection and analysis of property tax facts so as to enable it to
make intra-jurisdictional comparisons as well as intercounty comparisons based on property tax and
assessment ratio data [compiled for other states by the United States Bureau of the Census, or any
agency successor thereto].
(c) The [state tax agency] shall publish annually the findings of the division's assessment ratio
studies together with digests of property tax data.
(d) The county assessor shall post annually in his office the assessment ratio as found in his
county as determined by the division.
Section 4. Tax Exemption Information The county assessor regularly shall assess all tax exempt
property within the county, calculate the total assessed valuation for each type of exemption, and com-
pute the percentages of total assessed valuations exempted. The totals and computations made and
obtained, together with summary information on the function, scope and nature of exempted activities,
shall be published annually by the county.
Section 5. Forms. The division shall devise, prescribe, [supply,] and require the use of all forms
deemed necessary for effective admir~ibtration of the property tax laws. The division may provide forms
on a reimbursable basis. So far as practicable the forms shall be uniform, but nothing herein shall be
deemed to prevent the prescribing of substitute or additional forms where special circumstances require.

Section 6. Tax Maps. The division shall require each county assessor to maintain tax maps in
accordance with standards specified by the division. Whenever necessary to correct mapping deficien-
cies, the division shall install standard maps or approve mapping plans and supervise map production.
The [state tax agency] [shall] [may] require the county to reimburse the state for tax maps installed
by the division. The amount or amounts of such reimbursement shall be deposited in the [state treas-
ury] to the account of the [state tax agency] .2
Section 7. Provision of Tau Manuals and Guides. The division shall prepare, issue, and periodi-
cally revise guides for local assessors in the form of handbooks of rules and regulations, appraisal man-
uals, special manuals and studies, cost and price schedules, news and reference bulletins and digests of
property tax laws suitably annotated.
Section 8. Uniform system of preparation of assessment rolls, tax bills, etc. for statewide use.
The division shall develup, maintain, and enforce a uniform system of statewide applicability for the
preparation of assessment rolls, tax rolls, tax bills and all other county revenue functions through data
processing facilities as required by the county or multicounty assessment district pursuant to rules and
regulations. To insure system compatibility and uniformity while a uniform system of statewide appli-
cability is developed, any utilization of data processing facilities by counties or multicounty assessment
district shall be subject to approval from the division.
Section 9. Provision of Engineering, Professional and Technical Services. Whenever a county by
or pursuant to action of its [governing board] requests the [state tax agency] to provide engineering,
professional or technical services for the appraisal or reappraisal of properties, the [state tax agency]
may, within its available resources, and in accord with its determination of the need therefor, provide
these services. The county shall pay to the [state tax agency] the actual cost of the services in accord-
ance with a schedule of standard fees and charges furnished and, from time to time, revised by the
[state tax agency]. All payments received by the [state tax agency] pursuant to this section shall be
deposited in the [state treasury] to the account of the [state tax agency].
Section 10. Appraisal of Industrial and Commercial Properties The division shall provide to
each county or multicounty assessment district the services of certified appraisers for the appraisal of
major industrial and commercial properties. The properties to be appraised shall be determined by the
division after consultation with the county assessor. In making these determinations, the division shall
take into account the ability of the county assessor to perform appraisals with the resources at his dis-
posal. [Provide for reimbursement or county charge as may be appropriate.]
2 ~ n place of the last two sentences of section 6 , a state may prefer the following: Costs of map production and installation incurred pursuant to this section shall be charged to the county.
238

[Alternative Secrion 10. Appraisal of Industrial Property. (a) Notwithstanding other provisions
of the law, industrial property in this state whether real estate or personal property shall be valued and
assessed by the [state tax agency].
(b) Industrial property as used herein means a combination of land, improvements, and machinery
functioning as a unit: in the assembly, fabrication, processing, manufacture, and distribution of finished
or partly finished products from raw materials (including agricultural products) or fabricated parts; in
the processing of natural resources, including minerals and gravel.
(c) The [state tax agency] shall assess industrial property as provided by law, and on or before
[insert date] shall certify to the [insert appropriate official] of each county in which the property is
located the amount of the assessment made against each description.
(d) The [state tax agency] may request the assistance of county assessing officers and local
assessors in valuing any industrial property .]
Section 11. Inspections, Investigations and Studies. The division may make the necessary
inspections, investigations and studies for the adequate administration of its responsibilities pursuant
to this act. These may be made in cooperation with other state agencies, and, in connection therewith,
the division may utilize reports and data of other state agencies.
Section 12. Training Programs The division shall conduct or sponsor in-service, preentry, and
intern training programs on the technical, legal, and administrative aspects of the assessment process.
For this purpose it may cooperate with educational institutions, local, regional, state, or national asses-
sors: organizations, and with other organizations interested in improving assessment practices. The
division may reimburse the participation expenses incurred by assessors and other employees of the
state and its subdivisions whose attendance at in-service training programs is approved by the division.
The counties, from the county general fund, shall reimburse the expenses incurred by the county asses-
sor when the division does not reimburse him for attending the programs contemplated in this section.
Section 13. Enforcement of Assessment and Appraisal Standards. (a) In order to promote com-
pliance with the requirements of law, the division shall issue and, from time to time, may amend or
revise rules and regulations containing minimum standards of assessment and appraisal performance.
Such standards shall relate to: (1) adequacy of tax maps and records; (2) types and qualifications of
personnel; (3) methods and specifications for the appraisal or reappraisal of property; and (4) adrninis-
tration. For failure to meet the standards contained in the rules and regulations the division may sus-
pend, in whole or in part, performance of the assessment or appraisal function by a county.
3 ~ t a t e s that consider direct state assessment of industrial property desirable (rather than strong state supervision over local administration of the tax on such property) may wish to consider alternative section 10.
239

(b) If the division finds that a county has failed or is failing to meet the standards contained in
the rules or regulations in force pursuant to subsection (a) of this section, it shall notify the county
assessor of the fact and nature of the failure. The notice shall be in writing and shall be served upon
the county assessor and the [county governing board].
(c) If within one year from the service of the notice the failure has not been remedied, the
division may, at any time during the continuance of the failure, issue an order requiring the county
assessor and [county governing board] to show cause why the authority of the county with respect to
assessments or any matter related thereto should not be suspended, shall set a time and place at whlch
the &rector of the division shall hear the county assessor and [county governing board] on the order,
and after the hearing shall determine whether and to what extent the assessment function of the county
shall be so suspended.
(d) During the continuance of a suspension pursuant to subsection (c) of this section, the divi-
sion shall succeed to the authority and duties from.which the county has been suspended and shall
exercise and perform them. The exercise and performance shall be a charge on the suspended county.
The suspension shall continue until the division finds that the conditions responsible for the failure to
meet the minimum standards contained in the rules and regulations of the division have been corrected.
(e) Any county aggrieved by a determination of the division made pursuant to this section or
alleging that its suspension is no longer justified may have a review of the determination or continued
suspension [as provided in the state administrative procedure act] [by a court of appropriate jurisdic-
tion].
Section 14. Counry Assessor. (a) On and after [January 1, 19 [ ] ] the county assessor shall
be appointed by the [county executive or governing board] and shall hold office [for an indefinite
term] [for a term of five years]. No person shall be eligible for appointment as county assessor who
does not hold an assessor's certificate issued by the division pursuant to section 2 of this act.
(b) A county assessor may be removed from office by the [county executive or governing board]
or by the commissioner of the [state tax agency]. The [county executive or governing board] may
not remove the assessor, except for cause. Upon specification in writing to the assessor and the [county
governing board], the commissioner may remove the assessor for failure to comply with the orders of
the division. [Add provision making appropriate statute relating to hearings and appeals applicable, or
supply procedural detail.]
(c) Notwithstanding any provision of this section, any county assessor holding office on the
effective date of this act by virtue of election by the people shall be entitled to complete the term for
which he was elected.

[(d) If other statutes or provisions of local law do not affirmatively empower county assessors
to assess, appraise and classify property, use this subsection to confer such power.]
Section 15. Governing Valuations. [Each local taxing unit] shall be bound by the assessed
valuations established by the county assessor for all property subject to its taxing power.
Section 16. Multi-County Assessment district^.^ (a) Any two or more contiguous counties may
enter into an agreement for joint or cooperative performance of the assessment function.
(b) The agreement shall provide for:
(1) the division, merger, or consolidation of administrative functions between or among
the parties, or the performance thereof by one county on behalf of all the parties;
(2) the financing of the joint or cooperative undertaking;
(3) the rights and responsibilities of the parties with respect to the direction and super-
vision of work to be performed under the agreement;
(4) the duration of the agreement and procedures for amendment or termination thereof;
and
(5) any other necessary or appropriate matters.
(c) The agreement may provide for the suspension of the powers and duties of the office of
county assessor in any one or more of the parties.
(d) Unless the agreement provides for the performance of the assessment function by the asses-
sor of one county for and on behalf of all other counties party thereto, the agreement shall prescribe
the manner of appointing the assessor, and the employees of his office, who shall serve pursuant to
the agreement. Each county party to the agreement shall be represented in the procedure for choosing
the assessor. Except to the extent made necessary by the multi-county character of the assessment
agency, qualifications for employment as assessor or in the assessment agency, and terms and condi-
tions of work shall be similar to those for the personnel of a single county assessment agency. Any
county may include in any one or more of its employee benefit programs an assessor serving pursuant
to an agreement made under this section and the employees of hls assessment agency. As nearly as
practicable, the inclusion shall be on the same basis as for similar employees of a single county only.
An agreement providing for the joint or cooperative performance of the assessment function may pro-
vide for the assessor and employee coverage in county employee benefit programs.
(e) No agreement made pursuant to this section shall take effect until it has been approved in
writing by the head of the [state tax agency] and the [attorney general].
4 ~ h e possibility of including this paragraph may depend in a particular state on constitutional or statutory consider- ations. Furthermore, references to counties in this paragraph should be changed in states where other units of local govern- ment are the basic assessing jurisdictions.

(f) Copies of any agreement made pursuant to this section, and of any amendment thereto, shall
be filed in the office of the [secretary of state] and the [state office of local government] . Section 17. State Performance of County Assessment Function. The [governing board) of a
county may, [by resolution], request the [state tax agency] to assume the county assessment function
and to perform the same in and for the county. If the commissioner of the [state tax agency] finds
that direct state performance of the function is necessary or desirable to the economic and efficient
performance thereof, he may direct the division to undertake its performance pursuant to the request.
Unless otherwise authorized by law, the division shall undertake and perform the function only after
the execution of a suitable agreement between the county and the [state tax agency] providing for
responsibility for costs. During the continuance of performance of the county assessment function by
the division, the office and functions of the county assessor shall be suspended, and the performance
thereof by the division shall be deemed performance by the county assessor.
Section 18. Discontinuance of Certain Assessors' Offices. Assessment of property for purposes of
taxation on and after [date], unless pursuant to agreement as authorized in section 16 of this act,
shall be only by the county and state in accordance with law. However, any assessor in office on
[datej who is serving a fixed term as provided by statute or local law may continue in office until the
expiration of the term, and the jurisdiction of which he is the assessor shall continue to have the assess-
ment function previously conferred upon it until the office is vacated or the assessor's term expires.
Section 19. Tau Commissioner Revolving Fund created. There is hereby created a fund to be
known as the Property Tax Revolving Fund to which shall be credited all money received by the divi-
sion for services performed to county and multicounty assessment districts as provided for in this act.
The county or multicounty assessment district shall be billed by the division for services rendered as
provided for in this act. Reimbursements to the division shall be credited to the fund and expenditures
shall be made, subject to legislative appropriation, only when such funds are available. The division
shall only bill for the actual amount expended in performing the service.
Section 20. Separability. [Insert separability clause.]
Section 21. Effective Date. [Insert effective date.]
Model Statute B
ASSESSMENT NOTIFICATION, REVIEW AND APPEAL PROCEDURE
Many States provide an elaborate hierarchy of administrative and judicial review and appeal agencies for the protection of property taxpayers. But actual protection frequently is illusory, because:
- the property owner has no standard by which to compare his assessment with those on other properties;
- the tribunals to which the taxpayer must appeal frequently are ill constituted or staffed for the purpose ; and
- the burden of providing his case is too onerous and costly.
The small taxpayer, in particular, is helpless if he has no simple inexpensive, and dependable recourse. Numerous States have undertaken a variety of steps to improve assessment administration, but most have tended to ignore the need to inform property owners of assessment standards and the procedure for assess- ment review and appeal. This suggested legislation would provide such procedures.
Under t h s bill, assessors would be required to inform property owners of the assessed value of their property as it appears on the roll and the latest assessment ratio findings of the State tax department. Pro- tests would be heard by county assessors or local boards of property tax review. In the case of State asses- sed property, the commissioner of the State tax agency would hear the protest. Appeal could be taken from these initial review agencies to the State tax court, established by the suggested act.
Emphasis is placed on informality of procedure at each level of review. At the State tax court level a small claims procedure is established.
The legislation specifically provides that the parties to an assessment protest proceeding may make use of data contained in assessment ratio studies. In any proceeding relating to a protested assessment the court or other review agency is directed to accept as conclusive evidence of inequitable assessment a proven devia- tion of 10 percent or more from the relevant county assessment ratio and grant appropriate relief.
Since other provisions of the suggested legislation make assessment ratio studies freely available, the result should be a simplification of evidence gathering and presentation in litigation relating to assessments. The appeals procedure is patterned along the general lines of the Maryland and Massachusetts review system. The notification procedure is patterned along the general lines of the California requirement.
Suggested Legislation
[Title should con form to state requirements. The following is a suggestion: "An act providing for protests o f assessments, establishing a state tax court, and for related purposes. '7
(Be it enacted, etc.)
243

Section 1. Information by Assessors. (a) The assessor shall, upon or prior to completion of the
local roll, inform each property owner of real property on the roll of the assessed value of his real
property as it shall appear on the completed local roll. The information given by the assessor shall also
include the most recent assessment ratio for the county as determined by the division of property
taxation [of the state tax agency]. The information shall be in a form substantially as follows:
"The assessed value of your property is $ . In its latest assessment ratio
study the [state tax agency] found that property in this county is being assessed
generally at % of its current market value." [In states where the law specifies
an assessment level other than current market value the notice should also specify
what this level is, e.g., "State law requires that property be assessed at % of its
current market value ."I (b) The assessor shall include a notification of the period duringwhich assessment protests will be
accepted and the place where they may be filed.
(c) This information shall be furnished by the assessor to the property owner or hls designee by
regular United States mail directed to him at hls latest address known to the assessor. Neither the
fdure of the property owner to receive this information nor the failure of the assessor to inform the
property owner shall in any way affect the validity of any assessment or the validity of any taxes
levied.
Section 2. Jurisdiction to Hearprotest. A taxpayer who desires to protest an assessment of his
property may protest in the manner provided by this act. Jurisdiction to hear and determine protest of
assessments shall be only in the courts and agencies upon whom jurisdiction is conferred by this act.
Section 3. Assessors and Boards of Review. (a) In all counties of less than [ ] population ,
according to the last decennial census there shall be a [local board of property tax review] to consist
of [specify membership, method of appointment, and term] . The board shall hear and determine
assessment protests, and shall have power to alter or modify any protested assessment in order that it
conform to law. The board may review assessments and order equalization thereof as may be neces-
sary. Whenever the county assessor has in his regular employ [three] or more appraisers holding
appraiser's certificates issued by the division of property taxation [of the state tax agency] , herein-
after called "division," one of the appraisers shall sit with and advise the board, but no appraiser shall
sit with the board on its hearing of, or advise the board concerning any protest of, an assessment of
property previously appraised by him.

(b) In counties of [ ] or more population according to the last decennial census.
the county assessor shall have in his regular employ at least [three] appraisers holding appraiser's
certificates issued by the division and the county assessor shall have the functions and jurisdic-
tions of a [local board of property tax review] and there shall be no board. In hearing
and determining a protest of an assessment the assessor shall be assisted by an appraiser regu-
larly employed in his office who has not previously appraised the property in question.
(c) In a county in which the assessment function is performed by an assessor acting for
and on behalf of more than one county as provided in an agreement made pursuant to [cite
appropriate section of state statute authorizing multi-county assessment districts], a protest of
assessment shall be heard and determined by either the assessor's office functioning under
the agreement if the office has in its regular employ at least [three] appraisers holding apprais-
er's certificates from the division or a [local board of property tax review] established by the
agreement.
(d) In the case of property assessed by the state, the protest shall be heard and deter-
mined solely by the [head of the state tax agency].
(e) Review of determinations of a [local board of property tax review], a county
assessor when acting on a protest of assessment, and of determinations of the [head of the
state tax agency] when acting on a protest of assessment, may be had only in the state [tax
court or court of appropriate jurisdiction] as established in section 5 of this act.
Section 4. Initiation of Protests. (a) Withm [thirty] days of his receipt of a notice of
assessment or reassessment of property, the owner thereof may protest his assessment or re-
assessment. The protest shall be in writing on a form provided by the [county assessor]
[division]. The protest may include or be accompanied by a written statement of the
grounds for the protest, and may include a request for a hearing. The protest, together with
the accompanying statement, if any, shall be filed with the county assessor having jurisdiction
to hear the protest or the [local board of property tax review], as the case may be. There-
upon, the county assessor or [local board of property tax review], if a hearing has been re-
quested, shall fix the time and place where the protest shall be heard and shall serve a notice
thereof on the protesting taxpayer.
(b), At, or in connection with any hearing held pursuant to this section, the protesting
taxpayer shall be entitled to the assistance of an agent and other persons as he may wish.
(c) Any agent who appears for or with a taxpayer at a hearing held pursuant to this section
shall not be deemed to be engaged in the practice of any licensed trade or profession by reason of his
appearance.

(d) If the taxpayer has requested a hearing, he may appear in person or by an agent. An agent
shall have power to appear for and act on behalf of the protesting taxpayer only if the protest clearly
identifies the taxpayer's agent.
Section 5. Tux Court. * (a) There is hereby established the state tax court which, for adminis-
trative purposes only, shall be in the [state tax agency], but which shall be an independent administra-
tive tribunal. The court shall consist of a chief judge and [four] associate judges, appointed from
members of the bar by the governor [with the consent of the state senate] [with the consent of the
state legislature]. The term of each judge of the court shall be [six] years. The initial appointments
shall be as follows: the chief judge for a term of [six] years; one associate judge for a term of [two]
years; one associate judge for a term of [three] years; one associate judge for a term of [four] years;
and one associate judge for a term of [five] years. Vacancies on the court shall be filled for the un-
expired term in the same manner as appointments to full terms. During his continuance in office
neither the chief judge nor an associate judge shall have any other employment, but shall devote full
time to his duties as judge.
(b) Subject only to review by the [state supreme court], the state tax court shall have juris-
diction to determine all appeals from determinations of the [local board of property tax review], the
county assessor, and the [head of the state tax agency] relative to protested assessments. The state tax
court may affirm, reverse, or modify any determination of the [local board of property tax review],
county assessor when acting on a protested assessment, or the [head of the state tax agency] when
acting on a protested assessment.
(c) Any taxpayer dissatisfied with the disposition of his protested assessment by the [local
board of property tax review] , county assessor, or [head of the state tax agency] may appeal it to the
state tax court by filing with the court a written notice of appeal and serving on the appropriate
county assessor or the [head c f the state tax agency], as the case may be, a certified copy of the notice.
In order to be valid and effective, the notice shall be filed and served within [thirty] days of the dis-
position from which the appeal is to be taken.
(d) Consistent with this act and [cite statutes applicable to proceedings of administrative tri-
bunals], the state tax court shall provide by rule for practice before it and the conduct of its proceed-
ings.
(e) The state tax court may hear and determine all issues of fact and of law, but a determination
of a [local board of property tax review], county assessor, or the [head of the state tax agency] shall
be affirmed unless contrary to substantial evidence.
* States may wlsh to extend thc jurisdiction of the taw court to all matters involving the administration of state taxes. Atternatlvely States may wish to create a simple, efficient tax appeal process in an existing state judicial system.
246

(f) If a protested assessment cannot otherwise be brought into conformity with law, the state
tax court may order such adjustments with respect to other assessments of property as are necessary
to produce full conformity with law.
(g) The state tax court may allow a rehearing on the facts of its determinations.
(h) Appeals from determinations of the state tax court may be taken to the [state supreme
court] only on questions of law. [Provide procedures for appeals t o the state supreme court.]
Section 6. Taking of Testimony. (a) Any judge of the state tax court, or any employee of the
court, designated in writing for the purpose by the chiefjudge, may administer oaths, and the court
may summon and examine witnesses and require by subpoena the production of any returns. books,
papers, documents, correspondence, and other evidence pertinent to the matter under inquiry, at any
designated place of hearing, and may authorize the taking of a deposition before any person c.ompetent
to administer oaths. In the case of a deposition, the testimony shall be reduced to writing by the per-
son taking the deposition or under his direction and the deposition shall then be subscribed by the
deponent.
(b) The protesting taxpayer whose assessment is in question and the county assessor or [head of
the state tax agency] may obtain an order of the state tax court summoning witnesses or requiring the
production of any returns, books, papers, documents, correspondence and other evidence pertinent
to the matter under inquiry in the same manner in which witnesses may be summoned and evidence may
be required to be produced for the purpose of trials in the [court of appropriate jurisdiction]. Any
witness summoned or whose deposition is taken shall receive the same fees and mileage as witnesses in
the [court of appropriate jurisdiction] . Section 7. SmaN Claims. (a) The state tax court shall establish by rule a small claims procedure
which, to the greatest extent practicable, shall be informal. The court shall take special care to provide
all protesting taxpayers, wherever located within the state, reasonable and convenient access to the
court, and shall sit at the time and place as may be appropriate to promote accessibility.
(b) Any protesting taxpayer who, pursuant to the action on his protest by the county assessor,
[local board of property tax review] , or [head of the state tax agev cy] , would incur a tax liability of
less than $ [1,000.00] by reason of the protested assessment in the first year to which the assessment
applies may elect to employ such procedure to appeal from the action on his protest upon payment of
a $ [2.00] filing fee.
(c) The appellant shall file with the state tax court a written statement of the facts in the case,
together with a waiver of the right to appeal to the [state supreme court]. The state tax court shall
cause a notice of the appeal and a copy of the statement to be served on the county assessor or [head

of the state tax agency] whose assessment is in question. if the sole defense offered is that the prop-
erty was not over-assessed, no further pleadings shall be required.
Section 8. Appeal to [State Supreme Court]. [Use this section to provide procedure for appeal
of tax court determinations to state supreme court.]
Section 9. Effect of Assessment Ratio Evidence. (a) Unless a party to the proceedings estab.
lishes that the assessment ratio for a county contained in reports of assessment ratio studies of the
division is not supported by facts or was derived or established in a manner contrary to law, the
division's ratio shall be conclusive evidence of what the reported ratio is in fact.
(b) In any proceeding relating to a protested assessment, a proven deviation of ten percent or
more from the relevant county assessment ratio shall be substantial evidence that the protested assess-
ment is incorrect.
Section 10. Separabilify. [Insert separability clause.]
Section I I. Effective Date. [Insert effective date.]

Model Statute C
REAL ESTATE TRANSFER TAX
More than thirty States, the District of Columbia, and a number of local governments impose a tax on the transfer of real estate. In addition to the revenue produced this tax yields information on real estate prices that can be used in conjunction with assessed values to determine the level and uniformity achieved in assessment administration.
The accompanying suggested legislation is based in part on the West Virginia "Realty Transfer Tax" statute (W. Va. Code, Ch. 11, Art. 22). The suggested draft language includes, in addition to the usual pro- visions for imposition and collection of the tax, with definitions and exemptions, a provision (Section 4) re- quiring that a sworn statement of the actual selling price or current market value of the transferred property be attached to each deed presented for recordation. A provision of this kind would strengthen administra- tion of the tax and facilitate the ready availability of sales price data for sales-assessment ratio studies in con- nection with property tax administration.
Suggested Legislation
[Title should conform to state requirements. The following is a suggestion: "An act imposing a real estate transfer tax. '7
(Be it enacted, etc.)
Section 1. Definitions. As used in this act:
(1) "Deed" means [insert the definition applied in the state's law pertaining to real estate].
(2) "Registrar" means [insert title of local official responsible for recording deeds] .
(3) "Value" means: (i) in the case of any deed not a gift, the amount of the full actual consid-
eration therefor, paid or to be paid, including the amount of any lien or liens thereon; and (ii) in the
case of a gift, or any deed with nominal consideration or without state consideration, the estimated
price the property would bring in an open market and under the then prevailing market conditions in
a sale between a willing seller and a willing buyer, both conversant with the property and with pre-
vailing general price levels.
Section 2. Imposition o f Tax. A tax is imposed at the rate of [$ for each $ of value or
fraction thereof] [ per centum of the value], which value is declared in the affidavit required by
Section 4, upon the privilege of transferring title to real property.
Section 3. Collection of Tax.
(a) If any deed evidencing a transfer of title subject t o the tax herein imposed is offered for
recordation, the [Registrar] shall ascertain and compute the amount of the tax due thereon and shall
collect such amount as prerequisite to acceptance of the deed for recordation.
(b) The amount of tax shall be computed on the basis of the value of the transferred property
as set forth in the affidavit required by Section 4 of this act.
249

Section 4. Declaration of Value.
(a) Each deed evidencing a transfer of title subject to the tax as herein provided shall have ap-
pended thereto an affidavit of the parties to the transaction or their legal representatives declaring the
value of the property transferred. If the transfer is not subject to the tax as herein provided, the af-
fidavit shall specify the reasons for the exemption.
(b) The form of affidavit shall be prescribed by the [state tax agency] which shall provide an
adequate supply of such forms to each [Registrar] in the state.
(c) The [Registrar] shall transmit two true copies of the affidavit to the [Assessor] who shall
insert the most recent assessed value of each parcel of the transferred property on both copies and shall
transmit one copy to the [state tax agency].
Section 5. Disposition of Proceeds. [Insert appropriate language as to disposition of proceeds.] ' Section 6. Powers and Duties o f [state tax agency].
(a) The [state tax agency] may prescribe such rules and regulations as reasonably necessary to
facilitate and expedite the imposition, collection, and administration of the tax imposed pursuant to
this act.
(b) [If not already provided by applicable statutes insert additional subsections conferring such
powers and imposing such duties as the [state tax agency] may need to compel the production of tax-
payer records, to extend the time for the filing of the declaration of value, and to provide for refund-
ing erroneous payments.]
Section 7. Penalty for Recording Without Tax. Any [Registrar] who willfully shall record any
deed upon which a tax is imposed by this act without collecting the proper amount of tax required
by this act based on the declared value indicated in the affidavit appended to such deed shall, upon
conviction, be fined [fifty dollars ($SO)] for each offense.
Section 8. Penalty for Falsioing Value. Any person who shall willfully falsify the value of
transferred real estate on the affidavit required by Section 4 of this act shad, upon conviction, be
subject to a fine of not more than [$1,000 or to imprisonment of not more than one year, or to both
such fine and imprisonment] for each offense.
Section 9. Exemptions. The tax imposed by this act shall not apply to a transfer of title:
(1) recorded prior to the effective date of this act;
(2) to the United States of America, this state, or any instrumentality, agency, or subdivision
thereof;
(3) solely in order to provide or release security for a debt or obligation;
' ~ i s ~ o s i t i o n of the proceeds is a matter for state policy determination. Some states will wish to use the entire proceeds for state purposes. Others will wish to share the real estate transfer tax with their local governments; itill others will make the entire proceeds available to their local governments.

(4) which confirms or corrects a deed previously recorded;
(5) between husband and wife, or parent and child with only nominal actual consideration
therefor;
(6) on sale for delinquent taxes or assessments;
(7) on partition;
(8) pursuant to mergers of corporations;
(9) by a subsidiary corporation to its parent corporation for no consideration, nominal consid-
eration, or in sole consideration of the cancellation or surrender of the subsidiary's stock.
Section 10. Effective Date. [Insert effective date.]

Model Statute D
PROPERTY TAX RELIEF FOR OVERBURDENED FAMILIES
(The "Circuit Breaker")
The property tax can quickly create a disproportionate claim on a family's financial resources once retirement, the death or physical disability of the bread-winner, or unemployment reduces sharply the flow of income. Local governments as a rule have neither the legal authority nor the fiscal capacity to alleviate the potential property tax over-burden situations, but States have both. Twenty-two States now have an efficient tax relief mechanism designed to avoid the special hardships frequently experienced by low-income property owners, pioneered by Wisconsin in 1964. Low-income elderly homeowners, and frequently renters, in these States can claim a State-financed tax credit, rebate, or reduction in tax for that portion of their property tax liability deemed by the legislature to be excessive in relation to their household income. Because the program becomes effective when the property tax is high in relationship to income and thus prevents property tax overloads without cutting off the flow of revenue from those able to pay, this concept is known as the circuit-breaker.
In a number of States, the homestead exemption, a durable by-product of the 1930's Depression, offers some protection from undue property tax burdens on low-income occupants of dwellings and farms. This method, however, bestows property tax relief on all homeowners, not just those with low incomes, and misses completely the low-income families in rented properties. The policy of granting homestead exemptions involves a 'substantial amount of injustice among individual taxpayers and taxing jurisdictions at a large and usually unwarranted sacrifice of local property tax revenue. If the exemption privilege is restricted to low-income households and the State reimburses local governments for the cost of this program, the more obvious defects of the exemption approach could be minimized. I t is not, however, flexible enough to alleviate extraordinary tax burdens that may be experienced indirectly by low-income households in rented quarters.
To the extent that landlords can shift the property tax to tenants, low-income households in rented quarters also feel the pinch of extraordinary property tax burdens in relation to current income. Most of the circuit-breaker States have recognized this by establishing a percentage of gross rent constituting property taxes accrued. This percentage serves as the property tax equivalent which renters may use in computing their credit or rebate.
As a means of preventing fiscal overburdens, the circuit-breaker has unique advantages. Because this tax relief program is financed from State funds, it neither erodes the local tax base nor interferes in any way with the local assessment or rate-setting processes. It can be designed to maximize the amount of aid extended to low-income homeowners and renters while minimizing loss of revenue. I t operates to reduce intergovernmental fiscal disparities between high and low-income communities as well as reducing disparities between high and low-income persons; because the poor tend to be clustered together, the major portion of the relief will redound to the benefit of both low-income households and low-income communities.
The suggested legislation contains two alternative methods of determining an extraordinary property tax burden. Both approaches use the Vermont method of defining the extraordinary burden as the amount in excess of a specified percentage or percentages of household income. A common alternative approach is the Minnesota method where the extraordinary burden is defined as a specified percentage (depending upon income size) of the property tax.

Some States specify the maximum amount of property taxes or rent constituting property taxes that can be used in claiming the credit or rebate. More often, States specify the maximum size of credit.
The suggested legislation contains three alternative methods of administering the property tax relief pro- gram. The income tax credit approach, used by many States, provides that overburdened homeowners and renters file a claim with the State tax department and receive a credit against their State income tax liability. If the credit exceeds the income tax liability, the claimant receives a rebate from the State. The second approach, also used by many States, provides an outright rebate to those who qualify. As in the first approach, claimants file with a State agency and receive a rebate. Unlike the first approach, the process is distinct from the income tax. The third approach, suggested by Ohio practice, provides for a straightforward reduction in the tax bill. The claimant makes application with a local tax official who computes the amount of relief to which the claimant is entitled by law. The tax bill is then reduced by that amount and the local property tax collector bills the State for reimbursement of the revenue foregone.
The local abatement approach has the advantage of automatically providing timely relief, while the State administered system has the advantage of confidentiality. When the program is administered by the State tax department and the refund is sent through the mails, no more stigma attaches to it than when a Federal income taxpayer receives a tax reduction because he incurred extraordinary medical expenses. Local social welfare workers and county courthouse clerks are bypassed. Even when the circuit-breaker is State-adminis- tered, the State can provide that the applicant does not have to pay his property tax bill and then wait until in- come tax filing time to get his refund. The State can provide that as soon as the property tax bill arrives, the claimant may file a claim and receive his rebate before the property tax becomes due.
For purposes of this legislation, income means not only income as defined for income tax purposes but also social security, pension and annuity payments, nontaxable interest, workman's compensation, and the gross amount of "loss of time" insurance. To protect the State against "doubling-up" on the charge against public funds, any person who is a recipient of public funds for the payment of taxes or rent during the period for which the claim is filed may not claim tax relief under the act.
Suggested Legislation
[Title should conform to State requirements. The following is a suggestion: "An Act to Provide State Relief to Householders for Extraordinary Property Tax Burdens':]
(Be it enacted, etc.)
Section 1. Short Title. This act may be cited as the "Extraordinary Property Tax Relief Act."
Section 2. Atrpose. The purpose of this act is to provide property tax relief, through a system of
tax credits and refunds and appropriations from the general fund, to certain persons who own or rent
their homestead.
Section 3. Definitions. As used in this act:
(a) "income" means the sum of Federal adjusted gross income as defined in the Internal Revenue
Code of the United States and all nontaxable income, including but not limited to the amount of
capital gains excluded from adjusted gross income, alimony, support money, nontaxable strike benefits,

cash public assistance and relief (not including relief granted under this act), the gross amount of any
pension or annuity (including Railroad Retirement Act benefits and veterans disability pensions), all
payments received under the Federal Social Security and State unemployment insurance laws, non-
taxable interest received from the Federal government or any of its instrumentalities, workman's
compensation, and the gross amount of "loss of time" insurance. "Income" does not include gifts from
non-governmental sources, or surplus foods or other relief in kind supplied by a public or private
agency.
(b) "Household" means the association of persons who live in the same dwelling, sharing its fur-
nishings, facilities, accommodations and expenses. The term does not include bona fide lessees, tenants,
or roomers and boarders on contract.
(c) "Household income" means all income received by all persons of a household in a calendar
year while members of the household [less an amount equal to ($750.00) multiplied by the number of
persons who constitute the household. However, for purposes of this act, "household" income shall not
be less than zero] .
(d) "Homestead" means the dwelling, whether owned or rented, and so much of the land surround-
ing it, not exceeding one acre, as is reasonably necessary for use of the dwelling as a home, and may
consist of a part of a multi-dwelling or multi-purpose building and a part of the land upon which it is
built. ("Owned" includes avendee in possession under a land contract and one or more joint tenants in
common.) It does not include personal property such as furniture, furnishings or appliances, but a
mobile home or a houseboat may be a homestead.
(e) "Claimant" means a person who has filed a claim under this act and was domiciled in this
State for the entire calendar year for which he files claim for relief under this act. When two or more
individuals of a household are able to meet the qualifications for a claimant, they may determine among
them as to who the claimant shall be. If they are unable to agree, the matter shall be referred to the [tax
commissioner] and his decision shall be final.
(f) "Property taxes accrued" means property taxes (exclusive of special assessments, delinquent
interest, and charges for service) levied on a claimant's homestead in this State in [calendar year] or any
calendar year thereafter. For purposes of this paragraph property taxes are "levied" when the tax roll is
delivered to the local [treasurer] for collection. If a claimant owns his homestead on the levy date
"property taxes accrued" means taxes levied on such levy date, even if claimant does not own his home-
stead for the entire year.
When a household owns and occupies two or more different homesteads in this State in the same
calendar year, property taxes accrued shall relate only to that property occupied by the household as a
homestead on the levy date. If a homestead is an integral part of a large unit such as a farm, or a multi-
purpose or multi-dwelling building, property taxes accrued shall be that of percentage of the total

property taxes accrued as the value of the homestead is of the total value. For purposes of this para-
graph, "unit" refers to the parcel of property covered by a single tax statement of which the homestead
is a part.
(g) "Gross rent" means rental actually paid in cash or its equivalent solely for the right of occu-
pancy (at arms-length) of a homestead, exclusive of charges for any utilities, services, furniture, furnish-
ings or personal appliances furnished by the landlord as a part of the rental agreement. When a claimant
occupies two or more homesteads in the year and does not own his homestead as of the levy date, gross
rent shall mean the total rent paid for the homestead most recently rented multiplied by a number
whose numerator is twelve and whose denominator is the number of months said homestead has been
rented by the claimant.
If the landlord and tenant have not dealt with each other at arms-length, and the [tax commissioner]
is satisfied that the gross rent charged was excessive, he may adjust the gross rent to a reasonable amount
for purposes of this act.
(h) "Rent constituting property taxes accrued" means [20 or 251 percent of the gross rent.
Section 4. Claim is Personal. The right to file a claim under this act shall be personal to the claim-
ant and shall not survive his death, but such right may be exercised on behalf of a claimant by his legal
guardian or attorney-in-fact. If a claimant dies after having filed a timely claim, the amount thereof
shall be disbursed to another member of the household as determined by the [tax commissioner]. If the
claimant was the only member of his household, the claim may be paid to his executor or administrator,
but if neither is appointed and qualified within two years of the filing of the claim, the amount of the
claim shall escheat to the State.
Section 5. Claim as Income Tax Credit or Rebate. Subject to limitations provided in this act, a
claimant may claim in any year as a credit against [name of State] income taxes otherwise due on his
income, property taxes accrued or rent constituting property taxes accrued in the preceding calendar
year. If the allowable amount of such claim exceeds the income taxes otherwise due on claimant's in-
come, or if there are no [State] income taxes due on claimant's income, the amount of the claim not
used as an offset against income taxes, after certification by the [tax commissioner] , shall be paid to
claimant from balances retained by the [treasurer] for general purposes. No interest shall be allowed on
any payment made to a claimant pursuant to this act.
OR
Section 5. Claim as Rebate from State Funds. Subject to the limitations provided in this act, a
claimant may claim in any year a rebate for property taxes accrued or rent constituting property taxes
accrued in the preceding year. The amount of the rebate, after audit or certification by the [tax
commissioner] shall be paid to claimant from balances retained by the [treasurer] for general purposes.

OR
Section 5. Claim as CLedit Against fioperty Tax. Subject to the limitations provided in this act, a
claimant shall have his property tax liability reduced by the amount determined in Section 9. If claim-
ant rents his homestead and does not own taxable property in the same tax jurisdiction, he shall file a
claim with the [property tax collector] for relief due him with respect to rent constituting property tax-
es for that year. The [property tax collector] shall pay such claim from available funds. The [property
tax collector] shall determine the amount of property tax collections foregone and the amount of pay-
ments to renters mandated by this act and shall certify same to the [State treasurer] . The [State
treasurer] shall draw upon the general fund of the State and remit to the [property tax collector] a sum
equal to such taxes foregone and payments to renters.
Section 6. Filing Date. No claim with respect to property taxes accrued or with respect to rent
constituting property taxes accrued shall be paid or allowed, unless the claim is actually filed with and
in the posession of the [tax department] on or before [date for filing initial claim] . Subject to the same
conditions and limitations, claims may be filed on or before (income tax filing date or other specified
date) with respect to property taxes accrued of the next preceding calendar year.
Section 7. Btisfaction of Outstanding Tax Liabilities. The amount of any claim otherwise pay-
able under this act may be applied by the [tax department] against any liability outstanding on the
books of the department against the claimant, or against his or her spouse who was a member of the
claimant's household in the year to which the claim relates.
Section 8. One Claim per Household. Only one claimant per household per year shall be entitled
to relief under this act.
Section 9. Computation of CLedit. The amount of any claim made pursuant to this act shall be
determined as follows:
(a) (Based on previous Vermont statute.) For any taxable year, a claimant shall be entitled to a
credit equal to [60] percent of the amount by which the property taxes or rent constituting property
taxes upon the claimant's homestead for the taxable year exceeds [S] percent of the claimant's total
household income for that taxable year.2
OR
(a) (Based on present Vermont statute.) For any taxable year, a claimant shall be entitled to a
credit equal to [60] 1 percent of the amount by which the property taxes, or rent constituting property
taxes, upon the individual's homestead for the taxable year exceeds a percentage of the individual's in-
come for the taxable year determined according to the following schedule:
'Relieving only part of the "excess" property tax provides a form of co-insurance that assures the State will not have to finance all locally voted tax increases once the threshhold amount has been reached.
2~ichigan relieves 60 percent of taxes in excess of 3.5 percent of income for the nonelderly. The elderly receive re- lief for aN taxes in excess of various percentages of income, ranging from zero up to 3.5 percent depending on income.
2 56

If Household Income (Rounded to the
Nearest Income) is: $ 0- 3,999.00
4,000.00- 7,999.00 8,000.00-1 1,999.00
12,000.00-1 5,999.00 16,000.00-and up
Then the Taxpayer is Entitled to Credit for Property Tax Paid in
Excess of this Percent of that Income. 4.0% 4.5 5 .o 5.5 6.0
[The 1973 Michigan statute exemplifies the flexibility of the circuit-breaker. Two schedules are
provided, one for the elderly and one for the non-elderly. For the elderly, the threshhold ranges from
zero to 3.5 percent of income, depending upon the level of income with 100 percent of the property
tax in excess of the threshhold relieved by the State. For the non-elderly the threshhold is a constant
3.5 percent of income, regardless of income level, but the State relieves only 60 percent of the property
tax above the threshhold level. For both elderly and non-elderly renters, 17 percent of rent is defined as
the property tax equivalent. In no case may the credit-rebate exceed $500.1
(b) No credit or grant under this act shall exceed [$SO01 .
(c) The [tax commissioner] shall prepare a table under which claims under this act shall be de-
termined. The table shall be published in the department's official rules and shall be placed on the appro-
priate forms. The amount of claim as shown in the table for each bracket shall be computed only to
the nearest dollar.
(d) The claimant, at his election, shall not be required to record on his claim the amount claimed
by him. The claim allowable to persons making this election shall be computed by the department, which
shall notify the claimant by mail of the amount of his allowable claim.
Section 10. Administration. The [tax commissioner] shall make available suitable forms with in-
structions for claimants, including a form which may be included with or as part of the individual income
tax blank. The claim shall be in such form as the [tax commissioner] may prescribe.
Section 11. Proof of Claim. Every claimant under this act shall supply to the [department of tax-
ation] , in support of his claim, reasonable proof of rent paid, name and address of owner or managing
agent of property rented, property taxes accrued, changes of homestead and a statement that the
property taxes accrued and used for purposes of this act have been or will be paid by him and that there
are no delinquent property taxes on the homestead.
Section 12. Audit of Claim. If on the audit of any claim filed under this act the [tax commissioner]
determines the amount to have been incorrectly determined he shall redetermine the claim and notify
the claimant of the redetermination and his reason for it. The redetermination shall be final unless
appealed within 30 days of notice.
Section 13. Denial of Claim. If it is deteri~ined that a claim is excessive and was filed with fraudu-
lent intent, the claim shall bedisallowed in full, and, if the claim has been paid or a credit has been
allowed against income taxes otherwise payable, the credit shall be canceled and the amount paid may

be recovered by assessment (as income taxes are assessed), and the assessment shall bear interest from the
date of payment of the claim, until refunded or paid, at the rate of one percent per month. The claim-
ant in such case, and any person who assisted in the preparation or filing of such excessive claim or
supplied information upon which such excessive claim was prepared, with fraudulent intent, is guilty of
a misdemeanor. If it is determined that a claim is excessive and was negligently prepared, 10 percent of
the corrected claim shall be disallowed, and if the claim has been paid or credited against income taxes
otherwise payable, the credit shall be reduced or canceled, and the proper portion of any amount paid
shall be similarly recovered by assessment (as income taxes are assessed), and the assessment shall bear
interest at one percent per month from the date of payment until refunded or paid.
Section 14. Rental Determination. If a homestead is rented by a person from another person un-
der circumstances deemed by the [tax commissioner] to be not at arms-length, he may determine rent
constituting property taxes accrued as at arms-length, and, for purposes of this act, such determination
shall be final.
Section 15. Appeals. Any person aggrieved by the denial in whole or in part-of relief claimed un-
der t h s act, except when the denial is based upon late filing of claim for relief or is based upon a rede-
termination of rent constituting property taxes accrued as at arms-length, may appeal the denial to the
[appropriate State agency] by filing a petition within 30 days after such denial.
Section 16. Public Welfare Recipients Excluded. No claim for relief under this act shall be allowed
to any person who is a recipient of public funds for the payment of the taxes or rent during the period
for which the claim is filed.
Section 17. Disallowance of Certain Claims. A claim shall be disallowed, if the department finds
that the claimant received title to his homestead primarily for the purpose of receiving benefits under
this act.
Section 18. Extension of Time for Filing Claims. In case of sickness, absence, or other disability,
or if, in his judgement, good cause exists, the [tax commissioner] may extend for a period not to exceed
six months the time for filing a claim.
Section 19. Separability. [Insert separability clause.]
28 Section 20. Effective Date. [Insert effective date clause.]

Part I I I
Statistical Appendix

TABLE A-1 - SUMMARY PROPERTY TAX DATA. BY STATE
State-local property Relative State-local tax effort, 1966-67' Property taxes as a taxes, 1971 percent of general Property taxes revenue from own Per $1,000 All State- Local taxes on -
sources, 197 1 of State local Per personal orooertv Nonfarm Commercial . . .
State State-local Local capita income taxes residential and industrial -
United States
Alabama Alaska Arizona Arkansas California
Colorado Connecticut Delaware Dist. of Columbia Florida
Georgia Hawaii Idaho Illinois Indiana
Iowa Kansas Kentucky Louisiana Maine
Maryland Massachusetts Michigan Minnesota Mississippi
Missouri Montana Nebraska Nevada New Hampshire
New Jersey New Mexico New York North Carolina North Dakota
Ohio Oklahoma Oregon Pennsylvania Rhode Island
South Carolina South Dakota Tennessee Texas Utah
Vermont Virginia Washington West Virginia Wisconsin Wyoming
Al l State- Farm local taxes
See footnotes at end of table.
260

TABLE A-1 - SUMMARY PROPERTY TAX DATA, BY STATE (Cont'd)
State tax revenue. 1971 Real Personal State assessed Total tax authority
United States
Alabama Alaska Arizona Arkansas California
Colorado Connecticut Delaware District of Colun Florida
Georgia Hawaii Idaho Illinois l ndiana
l owa Kansas Kentucky Louisiana Maine
Maryland Massachusetts Michigan Minnesota Mississippi
Missouri Montana Nebraska Nevada New Hampshire
New Jersey New Mexico New York North Carolina North Dakota
Ohio Oklahoma Oregon Pennsylvania Rhode Island
South Carolina South Dakota Tennessee Texas Utah
Vermont Virginia Washington West Virginia Wiscc-)sin Wyoming
See footnotes at end of table

TABLE A-1 - SUMMARY PROPERTY TAX DATA, BY STATE (Cont'd)
State
United States
Alabama Alaska Arizona Arkansas California
Colorado Connecticut Delaware Dist. of Columbia Florida
Georgia Hawaii Idaho Illinois Indiana
Iowa Kansas Kentucky Louisiana Maine
Maryland Massachusetts Michigan Minnesota Mississippi
Missouri Montana Nebraska Nevada New Hampshire
New Jersey New Mexico New York North Carolina North Dakota
Ohio Oklahoma Oregon Pennsylvania Rhode Island
South Carolina South Dakota Tennessee Texas Utah
Vermont Virginia Washington West Virginia Wisconsin Wyoming
Number (000)
74,832
1,199 7 7
643 1,441 5,965
779 838 175 146
2,913
1,318 218 295
3.806 2,287
1,727 1,389 1,030 1,073
453
1,066 1.900 3,386 1,354
81 2
1,826 351 707 180 432
1,999 376
4,076 1.899
459
3,940 1,565
835 3,822
307
774 525
1,313 5,987
384
188 1,682 1,760
902 2,146
108
Locally assessed taxable real properties, 1966
I
-
Percent distribution of number of properties and of gross assessed value, by type of property
Commercial and Residential (nonfarm) Acreage and farms Vacant lots industrial
Number Value Number Value Number Valve Number Value
See footnotes at end of table.
262

TABLE A-1 - SUMMARY PROPERTY TAX DATA, BY STATE (Cont'd)
State supervisory agency budget related to State~local property taxes Statewide as-
State-local Annual budget Coefficient of dispersion sessment ratio,
property tax as a percent of from median assessment 1971 (aggregate
Statelocal ratio, 1971 Annual budget receipts, 1970-71 - assessment sales State
United States
Alabama Alaska Arizona Arkansas California
Colorado Connecticut Delaware Dist. of Columbia Florida
Georgia Hawaii Idaho Illinois Indiana
Iowa Kansas Kentucky Louisiana Maine
Maryland Massachusetts Michigan Minnesota Mississippi
Missouri Montana Nebraska Nevada New Hampshire
New Jersey New Mexico New York North Carolina North Dakota
Ohio Oklahoma Oregon Pennsylvania Rhode Island
South Carolina South Dakota Tennessee Texas Utah
Vermont Virginia Washington West Virginia Wisconsin Wyoming
1971-72' (millions) property taxes lnterarea Intra-area price ratio)
n.a.-Data not avatlable Percent relatlon of actual revenue to revenue capaclty estmated at nattonal average rates.
' ~ a t a In ~arenthesls are f rom "Status of Prooertv Tax Adm~n~strat ion In the States." ~. ~ ~.~~~ Source: ACIR staff compllatlon based on U:S. &re& of the Census, Governments Dwislon: 1972 Census of Governments, Vol. 1, Governmental
Organization, and Vol. 2, Taxable Property Values and Assessment-Sales Price Ratios; Governmental Finances in 1970.71; 1967 Census of Governments, Vol. 2. Taxable Property Values; US. Senate, Subcommittee o n I ntergovernmental Relations, Status o f Property Tax Adm,nistrat,on in the States; 93 Cow. 1st Sea. (19731; Federation of Tax Administrators-ACIR questionna~re; and AClR Information Report M-58, Measuring the Fiscal Capacity and Ef for t of State and Local Areas.

TABLE B-1 - KEY FEATURES OF THE STATES' PROPERTY TAX ADMINISTRATION SYSTEMS AS OF NOVEMBER 1972
How Loca l U s e of Assessment A s s e s s o r s C e r t i f i c a t i o n L o c a l i t i e s h i r i n g a s s e s s o r s Use o f un i form s a l e s r a t i o a r e o r t r a i n i t a x maps a ~ ~ r a i s f ) -::::,, 97 S t a t e chosenLi r e q u i r e d - r e q u i r e d m a n u a l s
Alabama Alaska Arizona
County C i t y , Borough County, One S p e c i a l
District County C i t y , County
Arkansas C a l i f o r n i a
Colorado Connec t icu t Delaware F l o r i d a
County C i t y , Town C i t y , Town, County County
Georgia Hawaii Idaho I l l i n o i s I n d i a n a
C i t y , Town, County Four S t a t e Districts County Township, County Township, County
Iowa Kansas Kentucky Louis iana Maine
C i t y , County County C i t y , Town, County P a r i s h C i t y , Town
Mary land Massachuset ts Michigan Minnesota
County C i t y , Town C i t y , V i l l a g e , Township. C i t y , V i l l a g e , Township,
County C i t y , County M i s s i s s i p p i

TABLE B-1 - KEY FEATURES OF THE STATES' PROPERTY TAX ADMINISTRATION SYSTEMS AS OF NOVEMBER 1972 (Cont'd)
How Loca l Use o f Assessment A s s e s o r s C e r t i f i c a t i o n L o c a l i t i e s h i r i n g a s s e s s o r s U s e o f un i form s a l e s r a t i o a r e o r t r a i n i n g t a x maps a p p r a i s a l s t u d i e s
S t a t e chosen:' r e q u i r e d r e q u i r e d manuals" c o n d u c t e d
Missouri Montana Nebraska Nevada New Hampshire
Township, C i t y , County County County County C i t y , Town
New J e r s e y
New Mexico New York
North C a r o l i n a North Dakota
C i t y , Town, V i l l a g e , County
County C i t y , Town, V i l l a g e ,
County County C i t y , Township
Ohio Oklahoma Oregon Pennsy lvan ia
County County County C i t y , Town, Township,
County C i t y , Town, F i r e
D i s t r i c t s Rhode I s l a n d
South Caro l ina South Dakota Tennessee Texas
C i t y , County X C i t y , County X County, Some Towns, C i t y X C i t y , Town, School D i s t r i c t ,
County x County X Utah

TABLE B-1 - KEY FEATURES OF THE STATES' PROPERTY TAX ADMINISTRATION SYSTEMS AS OF NOVEMBER 1972 (Cont'd)
How Local Use of Assessment Assessors Certification Localities hiring assessors Use of uniform sales ratio are or training tax maps appraisal studies
State chosen l' required?' required manuals " conducted
Vermont Virginia Washington West Virginia Wisconsin Wyoming
City, Town City, County County X County X City, Village, Town, County County
L/ A = appointed, E = elected Z/ € = certification, T = training 3/ P = published, - R = use required
4/ In Hawaii, the primary assessment function is performed by State employed assessors. Montana and Maryland are in the - process of adopting a similar system.
5/ Oregon and California certify appraisers. California requires training of appraisers. - N Q, Q, SOURCE: Education Commission of the States, Property Assessment and Exemptions: They Need Reform, Denver, 1973.

TABLE 6-2 - WHO PAYS THE LOCAL PROPERTY TAX? Estimated Local Property Tax Collections
By Source, 19721
Source
Nonbusiness Nonfarm residential realtyZ Farm realty3 Vacant lots
Total nonbusiness realty
Nonfarm personalty4 Farm personalty
Total nonbusiness personalty
Total nonbusiness
Business Farm realty5 Vacant lots Other realty6
Total business realty
Farm personalty7 Other personalty8
Total business personalty
Public utilities
Total business
Total
Amount (millions)
Percentage distribution
ACIR staff estimates based on estimated 1972 collections distributed on basis of 1967 Census data, latest available statistics. Includes both single-family dwelling units and apartments. An estimated $14 billion or 36 percent of all 1 0 c a l ' ~ r o ~ e r t ~ taxes was derived from single-family homes; about $5 billion or 12 percent of property tax revenue came from multi-family units. Estimated collections from the taxation of the "residential" element of the farm. The collections produced through the taxation of furniture and other household effects. Estimated collections from the taxation of land and improvements actually used in the production of agricultural products-this is exclusive of the land and buildings used in a residential capacity by the farmer. Commercial and industrial real estate other than public utilities. The estimated collections from the taxation of livestock, tractors, etc.
b s t i m a t e d collections from the taxation of merchants' and manufacturers' inventory, tools and machinery, etc. This is the estimated grand total for local property tax receipts. In addition, there is an estimated $1.3 billion in State property taxes. The data needed for a similar distribution of State receipts is not available. However, it is estimated that approximately $450 million of the State receipts are derived from general property taxes and could probably be distributed among the various sources of revenue in the same proportion as local receipts. The remaining $850 million in State receipts consists mainly of State special property taxes on business personal property, but includes a substantial amount from special property taxes on motor vehicles, most of which is collected by the State of California.
Source: ACIR compilation.
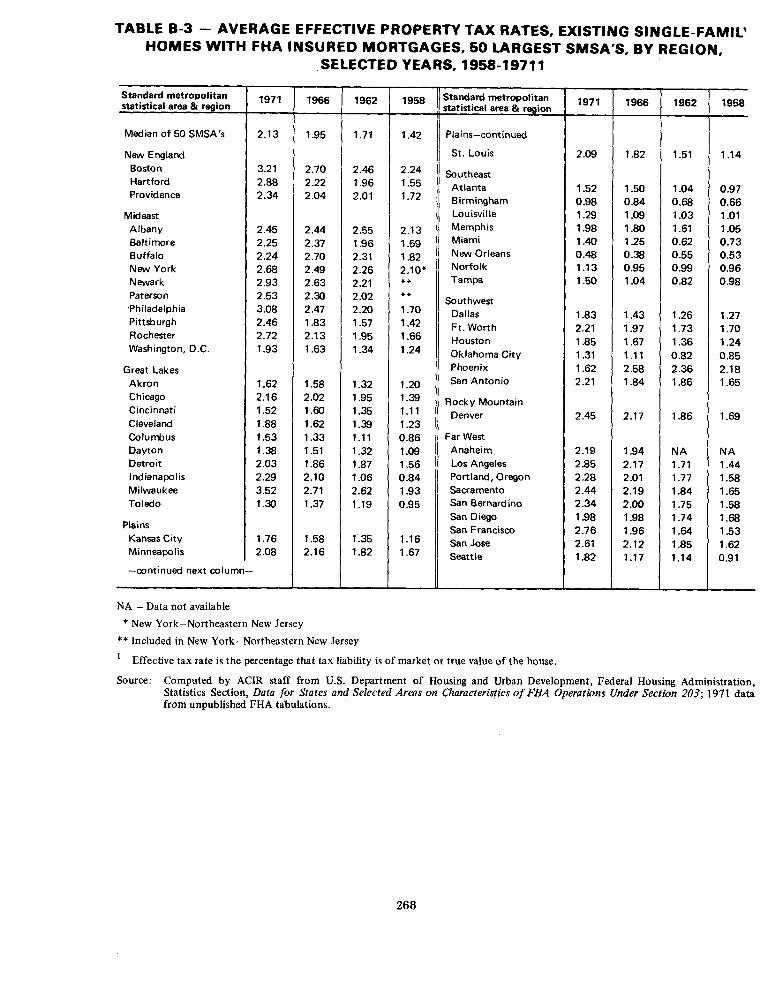
TABLE B-3 - AVERAGE EFFECTIVE PROPERTY TAX RATES, EXISTING SINGLE-FAMIL' HOMES WITH FHA INSURED MORTGAGES. 60 LARGEST SMSA'S, BY REGION,
SELECTED YEARS. 1958-1971 1
Standard metropolitan statistical area & region
Median o f 50 SMSA's
New England Boston Hartford Providence
Mideast Albany Baltimore Buffalo New York Newark Paterson .Philadelphia Pittsburgh Rochester Washington, D.C.
Great Lakes Akron Chicago Cincinnati Cleveland Columbus Dayton Detroit Indianapolis Milwaukee Toledo
Plains Kansas City Minneapolis
-continued next column-
1958 Standard metropolitan 1971 statistical area & region
11
/ st. Louis I
Southeast Atlanta
I Birmingham I Louisville
Memphis Miami New Orleans Norfolk Tampa
Southwest Dallas F t . Worth Houston Oklahoma City Phoenix San Antonio
Rocky Mountain Denver
Far West Anaheim Los Angeles Portland, Oregon Sacramento San Bernardino San Diego San Francisco San Jose
N A - Data not available
* New York-Northeastern New Jersey
** Included in New York-Northeastern New Jersey
Effective tax rate is the percentage that tax liability is o f market or true value o f the house.
Source: Computed b y ACIR staff from U.S. Department o f Housing and Urban Development, Federal Housing Administration, Statistics Section, Data for States and Selected Areas on Characteristics of FHA Operations Under Section 203; 1971 data f rom unpublished FHA tabulations.

TABLE B 4 - PRINCIPAL STATE PROPERTY TAX RELIEF POLICIES FOR HOMEOWNERS AND RENTERS-DETAILED PROGRAM FEATURES (As of January 1,1974)
Description of Beneficiaries Form of Relief
Date of (estimated number Tax Relief Formula (estimated per State Financed by Adoption of claimants) Income Ceiling (or general remarks) capita cost)
Alabama Localities 1973 (mandated)
State (exemption 1971 applies to state taxes only)
State 1972 1973 rev.
State (circuit- 1973 breaker)
Homeowners 65 and over
Total exemption. No tax liability (N.A.)
Homeowners 65 and over (N.A.)
None The $2,000 general exemption of assessed value for State ad valorem taxes only is increased to $5,000 for homeowners, 65 and over.
Reduced in tax bill (N.A.)
Alaska
Arizona
No tax liability ($1.54)
Homeowners 65 and over (1,000)
None Total exemption.
Homeowners and renters 65 and over
$3,500 single $5,000 married (value of prop erty not to ex- ceed $5,000)
$5,000
A percentage of tax is returned as a credit, per- centage declines as income rises. Only taxes on first $2.000 of assessed value are considered. (25% of rent = tax equivalent, not to exceed $225)
State income tax credit or rebate
Arkansas State (circuit- breaker)
Homeowners 65 and over (90.000)
Taxes exceeding various percentages of income are remitted; percentages range from 1% on in- comes below $1,500 to 5% on incomes above $4,500.
State income tax credit or rebate ($1.39)
California 1967 1972 rev.
State rebate ($2.931
State (circuit- breaker)
Homeowners 62 and over (292.9991
$1 0,000 net $20,000 gross
Relief ranges from 96% of tax payment on first $7,500 of value if net household income is less than $1,400 to 4% of tax payment if net house- hold income is $10,000 (in addition to a state financed homestead exemption of $1,750 for all homeowners).
All renters (N.A.) None Relief ranges from $25 if adjusted gross income , is less than $5.000 to $45 on income of $8,000
and over.
State income tax credit or rebate (N.A.)
State
Colorado State (circuit- breaker)
1971 1973 rev.
Homeowners and renters 65 and over ( 1 1,000)
$5,400 single $6,300 married (Net worth less than $20,000)
Relief limited to 50% of the tax payment and cannot exceed $270. The credit or refund is reduced by 10% of income over $2,700 for in- dividuals and 10% of income over $3,600 for husband and wife. (10% of rent = tax equivalent).
State income tax credit or rebate 6.32)
State (circuit- breaker) [replaces 1965 state financed program.]
Homeowners and renters 65 and over
Taxes exceeding 5% of income. Maximum refund ranges up to $500 for incomes below $3,000 (20% of rent = tax equivalent).
Reduction in tax bill
Connecticut

TABLE 6 4 - PRINCIPAL STATE PROPERTY TAX RELIEF POLICIES FOR HOMEOWNERS AND RENTERS-DETAILED PROGRAM FEATURES (As of January 1,1974) (Cont'd)
Description of Beneficiaries
Date of (estimated number State Financed by Adoption of claimants) Income Ceiling
Tax Relief Formula (or general remarks)
Form of Relief (estimated per capita cost)
Delaware Localities 1965 Homeowners 65 (mandated) 1967 rev. and over (N.A.)
Localities 1969 (optional) 1970 rev.
State 1971 Homeowners 65 and over (362,000)
$3,000 Exemption of $5,000 assessed value from State or Reduction in County property taxes. tax bill (N.A.)
(Same Provisions As Above, For Municipal Taxes)
Florida None The locally financed general homestead exemption Reduction in of $5,000 for all homeowners is increased to tax bill ($1.47) $10,000 for homeowners 65 and over for taxes levied by district school boards for current operating purposes (state financed).
The general homestead exemption of $2,000 for all homeowners is increased to $4,000 for home- owners 65 and over (additional state financed homestead relief is provided to all homeowners equivalent to a $1,000 exemption).
Georgia Localities (mandated)
1964 1972 rev.
Homeowners 65 $4,000 and over (100,OM))
Reduction in tax bill ($1.48)
Localities (mandated)
Homeowners 62 and over (N.A.)
$6,000
None
Reduction in tax bill (N.A.)
Exemption of ad valorem taxes for educational purposes levied on behalf of school districts.
Hawaii 1969 1972 rev.
Homeowners 60 and over ( 180,000)
Localities (mandated)
The general homestead exemption of $8,000 for all homeowners is increased to $16,000 for homeowners of age 60 to 69.
Reduction in tax bill ($4.40)
Exemption of $20,000 of assessed value for homeowners age 70 or more.
Idaho
Illinois
Localities (mandated)
1969 1973 rev.
Homeowners 65 and over (N.A.)
$4,800 (value of property not to exceed $1 5,000)
Elderly homeowners are exempt from property tax up to $75.
Reduction in tax bill ($.72)
State (circuit- breaker)
Homeowners and renters age 65 and older or disabled (290,000)
$10,000 Implicit Relief based on amount by which property tax (or rent constituting property tax) exceeds 6 percent of household income for that year on the amount of such income between zero and $3,000 plus 7% on that amount in excess of $3,000. Relief limit is $500 less 5% of house- hold income. (25% of rent = tax equivalent).
State rebate ($2.58)

TABLE 8-4 - PRINCIPAL STATE PROPERTY TAX RELIEF POLICIES FOR HOMEOWNERS AND RENTERS-DETAILED PROGRAM FEATURES (As of January 1,1974) (C&'
Description of Beneficiaries
Date of (estimated number State Financed by Adoption of claimants)
Illinois Localities 1971 Homeowners 65 (Continued) (mandated) and over (N.A.)
Form of Relief (estimated per capita cost)
Tax Relief Formula (or general remarks)
Maximum reduction of $1,500 from assessed value.
Income Ceiling
None Reduction in tax bill (N.A.)
Reduction in tax bill ($1.59)
Indiana Localities 1957 Homeowners 65 (mandated) 1971 rev. and over (80,000)
$6.000 (realty value not in excess of $6,500)
Exemption of $1,000 assessed value.
Relief ranges from 75% of property tax for in- comes below $500 to 10% for incomes above $4,000. Limitation on amount of property tax liability considered for relief is $500. (20% of rent = tax equivalent, [15% if furnished or utilities provided] ).
State (circuit- 1973 Homeowners and breaker) renters. 65 and
over
[In addition, all homeowners, regardless of age or income, receive a general credit financed by the State.]
Homeowners and $6.000 renters 65 and over or totally disabled (N.A.)
Relief ranges from 95% of property tax for incomes below $1,000 to 25% for incomes above $5,000. Not more than $600 con- sidered for relief. (20% of rent = tax equivalent)
State rebate State (circuit- breaker) [replaces 1967 state financed program]
[In addition, all homeowners, regardless of age or income, receive a general credit financed by the State.]
Kansas State (circuit. breaker)
1970 Homeowners 60 1973 rev. and over (N.A.)
State rebate ($2.88)
Taxes in excess of various percentages of income. ranging from zero percent for incomes below $3,000 to 13% for incomes above $8,000. Limita- tion on amount of property tax liability con- sidered for relief is $400.
Reduction in tax bill ($3.12)
Kentucky
Louisiana
Localities mandated)
1971 Homeowners 65 and over ( 125,000)
None Exemption of $6,500 assessed value, except for assessment of special benefits.
Homestead exemption of $2,000 of assessed value for all homeowners is mandated by State. No reimbursement to local government.

TABLE 8-4 - PRINCIPAL STATE PROPERTY TAX RELIEF POLICIES FOR HOMEOWNERS AND RENTERS - DETAILED PROGRAM FEATURES (As of January 1,1974) (Cont'd)
Description of Beneficiaries
Date of (estimated number State Financed by Adoption of claimants) Income Ceiling
Tax Relief Formula (or general remarks)
Form of Relief (estimated per capita cost)
Maine State (circuit- 1971 Homeowners and breaker) 1973 rev. renters 62 and
older 116,000)
$4,500 single $5,000 married ( in addition net assets must not exceed $20,000)
$5.000
Taxes in excess of various percentages o f income, ranging from 2% for income below $1,000 to 16% for incomes above $4,000. (20% of rent = tax equivalent) (at least 35% of household income must be attributable t o claimant).
- - -
State rebate only ($1.60)
1967 Homeowners 65 1969 rev. and over (61.000)
Credit of 50% o f assessed value or $4,000, which- ever is less, multiplied by the local property tax rate.
Reduction in tax bi l l ($1.81)
Maryland Localities (mandated)
Localities (mandated)
1968 Homeowners 65 1972 rev. and over (Females
62 and over i n Cecil Co.)
Varies by County
Relief varies from an increase in the credit pro- vided by the State mandated law to a lessening or modification of conditions of eligibility for such credit.
Reduction in tax bi l l ($5.18)
Massachusetts Localities (mandated)
1963 Homeowners 70 1971 rev. and over (74,000)
$6.000 single $7,000 married (Maximum estate: $40,000 single $45,000 married)
Exemption o f $4,000 assessed value or the sum of $350 whichever would result in an abatement of the greater amount of taxes due.
Reduction in tax bill ($5.18)
Michigan State (circuit- breaker1
Al l homeowners and renters
None Excess taxes are taxes above 3.5% of income [various lower percentages for elderly with incomes below $6.0001.
State income tax credit or rebate ($27.53)
[replaces 1965 statef inanced program1
Credit = 60% o f excess taxes [ 100% for all elderly1 .
Maximum relief is $500.
[17% of rent = property tax equivalent].
1967' Homeowners and $6.000 1973 rev. renters 65 and
over (95,000)
Minnesota State (circuit. breaker)
A percentage of tax is given back as a credit, percentage declines as income increases. Not more than $800 tax considered. (20% of rent = tax equivalent.)
State income tax credit or rebate ($2.38)
[ In addition, all homeowners, regardless of age or income, receive a general credit financed by the State.]
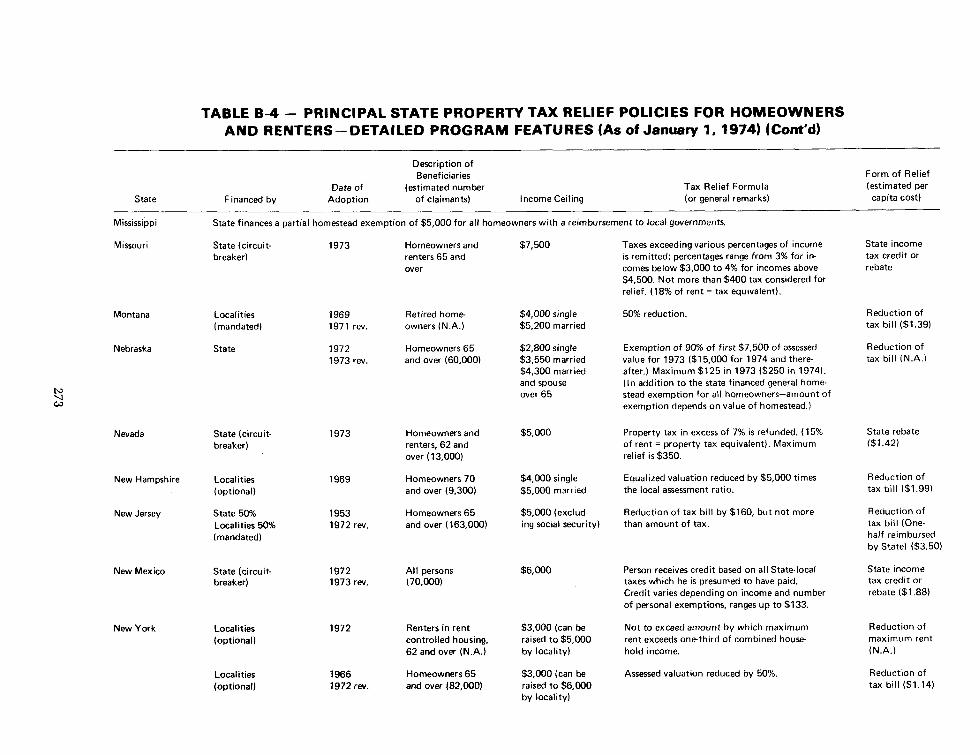
TABLE 8-4 - PRINCIPAL STATE PROPERTY TAX RELIEF POLICIES FOR HOMEOWNERS AND RENTERS-DETAILED PROGRAM FEATURES (As of January 1,1974) (Cont'd)
Description of Beneficiaries Form of Relief
Date of (estimated number Tax Relief Formula (estimated per State Financed by Adoption of claimants) Income Ceiling (or general remarks) capita cost)
~ i s s i s s i ~ ~ i State finances a partial homestead exemption of $5,000 for all homeowners with a reimbursement to local governments.
Missouri State (circuit- 1973 Homeowners and $7,500 breaker) renters 65 and
over
Taxes exceeding various percentages of income State income is remitted; percentages range from 3% for in- tax credit or comes below $3,000 to 4% for incomes above rebate $4,500. Not more than $400 tax considered for relief. (18% of rent = tax equivalent).
Montana
Nebraska
Localities (mandated)
1969 1971 rev.
Retired home $4,000 single owners (N.A.) $5,200 married
50% reduction. Reduction of tax bill ($1.39)
Homeowners 65 $2.800 single and over (60,000) $3,550 married
$4,300 married and spouse over 65
Exemption of 90% of first $7,500 of assessed value for 1973 ($15,000 for 1974 and there- after.) Maximum $125 in 1973 ($250 in 1974). (In addition to the state financed general home- stead exemption for all homeowners-amount of exemption depends on value of homestead.)
Reduction of tax bill (N.A.)
State 1972 1973 rev.
Property tax in excess of 7% is refunded. (15% of rent = property tax equivalent). Maximum relief is $350.
State rebate ($1.42)
Nevada State (circuit- breaker)
Homeowners and renters, 62 and over (1 3,000)
Equalized valuation reduced by $5,000 times the local assessment ratio.
Reduction of tax bill ($1.99)
New Hampshire Localities (optional)
Homeowners 70 and over (9.300)
$4.000 single $5,000 married
New Jersey State 50% Localities 50% (mandated)
1953 1972 rev.
Homeowners 65 and over (163,000)
$5,000 (exclud- ing social security)
Reduction of tax bill by $160, but not more than amount of tax.
Reduction of tax bill (One- half reimbursed by State) ($3.50)
Person receives credit based on all Statelocal taxes which he is presumed to have paid. Credit varies depending on income and number of personal exemptions, ranges up to $133.
State income tax credit or rebate ($1.88)
New Mexico State (circuit- breaker)
1972 1973 rev.
All persons (70.000)
New York Localities (optional)
Renters in rent controlled housing, 62 and over (N.A.)
$3,000 (can be raised to $5,000 by locality)
$3,000 (can be raised to $6,000 by locality)
Not to exceed amount by which maximum rent exceeds one-third of combined house- hold income.
Reduction of maximum rent (N.A.)
Localities (optional)
1966 1972 rev.
Homeowners 65 and over (82,0001
Assessed valuation reduced by 50%. Reduction of tax bill ($1.14)

TABLE 8-4 - PRINCIPAL STATE PROPERTY TAX RELIEF POLICIES FOR HOMEOWNERS AND RENTERS-DETAILED PROGRAM FEATURES (As of January 1,1974) (Cont'd)
Description of Beneficiaries
Date of (estimated number State Financed by Adoption of claimants) Income Ceiling
Form of Relief (estimated per capita cost)
Tax Relief Formula (or general remarks)
North Carolina Localities 1971 Homeowners 65 $5.000 Assessed valuation reduced by $5,000. Reduction of (mandated) 1973 rev. and over (retired) tax bill ($.16)
( 19,000)
North Dakota Localities (mandated)
1969 Homeowners 65 1973 and over ($5,000)
Assessed valuation reduced by $1,000. Reduction in tax bill ($.47)
State (circuit- 1973 Renters 65 and breaker) over
Property tax in excess of 5% of income is re- State rebate funded. (20% of rent = tax equivalent). Max- imum relief is $350.
Ohio State (circuit- 1971 Homeowners 65 breaker) 1973 rev. and over (N.A.)
Benefits range from reduction of 70% or $5,000 Reduction of assessed value (whichever is less) for incomes tax bill ($2.78) below $2,000 to 40% or $2,000 for incomes above $6,000.
N 'a I& Oklahoma Homestead exemption of $1,000 of assessed value for all homeowners is mandated by State. No reimbursement to local government.
State rebate Oregon State (circuit- 1971 All homeowners $1 5,000 breaker) 1973 rev. and renters
( 100,000)
Refund of all property taxes, up to various maximums that depend on income ($490 for incomes below $500) (1 7% of rent = tax equivalent).
Pennsylvania State (circuit- 1971 Homeowners breaker) 1973 rev. and renters
65 and over, and totally disabled
100% of tax for income less than $3,000 (max. State rebate rebate $200). 10% of tax for income greater than $7,000. (20% of rent = tax equivalent).
Rhode Island
South Carolina
South Dakota
Tennessee
Localities (optionall
1960 Homeowners 65 1973 rw. and over (19,0001
$4.000 ($5,000 Various formulas; most reduce assessed valuation Reduction in in one locality) by $1,000. [Also a tax freeze.] tax bill ($1.02)
State 1971 Homeowners 65 1973 rw. and over (78,000)
None Not related to income. Assessed valuation re- Reduction in duced by $10,000. tax bill ($1.31)
1972 Homeowners 65 and over (N.A.)
$4,000 married Assessed valuation reduced by $1,000. Reduction in $2.400 single tax bill ($5.15)
Localities (mandated)
State 1972 Homeowners 65 and over (81,000)
Equivalent to reduction of assessment by $5,000.
State rebate to taxpayer ($.74)

TABLE 8 4 - PRINCIPAL STATE PROPERTY TAX RELIEF POLICIES FOR HOMEOWNERS AND RENTERS- DETAILED PROGRAM FEATURES (As of January 1.1974) (Cont'd)
Description of Beneficiaries Form of Relief
Date of (estimated number Tax Relief Formula (estimated per State Financed by Adoption of claimants) Income Ceiling (or general remarks) capita cost)
Texas Localities (optional)
1972 Homeowners 65 - and over (N.A.)
None Assessment reduced by $3,000. Reduction in tax bill ($4.29)
Utah Localities (optional)
1967 Indigent homeown- $2,500 single Taxes may be reduced by $100 or 50%, which- Reduction in tax 1973 rev. ers (Presumed to be $3,000 married ever i s less. bill ($.16)
65 and over) (N.A.)
Vermont State (circuit- 1969 All homeowners None breaker) 1973 rev. and renters (60,000)
Refund of Taxes Exceeding Following Percent State rebate of Income (or income tax
l ncome Percentage credit for 0-$3,999 4% elderly) ($23.38)
$4.000-$7,999 4.5% $8,000-1 1,999 5.0%
$1 2,000-1 5,999 5.5% $16,000- 6.0%
Maximum relief is $500. (20% of rent = tax equivalent)
Homeowners 65 $7,500 ($20,000 At discretion of locality. and over asset test)
Reduction in tax bill
Virginia Localities (optional)
1971 1973 rev.
Homeowners 62 $6,000 and over or disabled (72,000)
Income Percentage of excess levies abated Reduction in tax bill ($1.81)
0-$4,000 100% $4,000-$6,000 50%
(minimum relief of $50 for income below $4,000)
Washington Localities (mandated)
State rebate 6.84)
West Virginia State (circuit- breaker)
Homeowners and $5,000 renters 65 and over (N.A.)
Taxes exceeding a given percent of income is r e mitted. These percents range from .5% to 4.5%. Not more than $125 tax considered for relief. (12% of rent = tax equivalent.)
Reduction of tax bill
Localities (mandated)
Homeowners, None 65 and over
Exemption of $5.000 assessed value.
All homeowners $7,000 and renters (79,000)
Excess taxes are taxes above 14.3% of income exceeding $3,500. Credit = 80% of excess taxes. Not more than $500 tax considered for relief. (25% of rent = tax equivalent.)
State income tax credit or rebate
Wisconsin State (circuit- breaker)
1964 1973 rev.
[In addition, all homeowners, regardless of age or income, receive a general credit financed by the State.]

TABLE B-4 - PRINCIPAL STATE PROPERTY TAX RELIEF POLICIES FOR HOMEOWNERS AND RENTERS-DETAILED PROGRAM FEATURES (Cont'd)
(As of January 1, 1974)
State
Description of Beneficiaries
Date (estimated number Financed by Adoption of claimants) Income Ceiling
Tax Relief Formula (or general remarks)
Form of Relief (estimated per capita cost)
Wyoming State 1973 Homeowners 65 $2,000 single Exemption of $1,000 assessed value. and over (8,000) $2,500 married
Reduction in tax bill ($1.16)
N.A. - Data not available Circuit-breaker - A State financed program of property tax relief in which the amount of tax relief phases out as household Income rises. "Rev." indicates the year of the most recent l~beraliration of the above property
tax relief program.
Source: ACIR Staff compilation based on Commerce Clearing House. State Tax Reporter; State of Washington, Department of Revenue, Property Tax Relief in Washington, October, 1972; and telephone and letter survey of the various States.

TABLE B-5 -PROPERTY TAX AS A PERCENTAGE OF TOTAL STATE-LOCAL TAXES, BY STATE, AND REGION, SELECTED YEARS, 1942-1971
State and Reg~on 1971 1970 1967 1962 1957 1942
United States
New England Maine New Hampshire Vermont Massachusetts Rhode Island Connecticut
Mideast New York New Jersey Pennsylvania Delaware Maryland District of Columbia
Great Lakes Michigan Ohio Indiana Illinois Wisconsin
Plains Minnesota Iowa Missouri North Dakota South Dakota Nebraska Kansas
Southeast Virginia West Virginia Kentucky Tennessee North Carolina South Carolina Georgia Florida Alabama Mississippi Louisiana Arkansas
Southwest Oklahoma Texas New Mexico Arizona
Rocky Mountain Montana Idaho Wyoming Colorado Utah
Far West Washington Oregon Nevada California Alaska Hawaii n.a.
Note: Re@ionsl amounts are unweighted averages. n... - Not wailsble.
'fxcluding Almke and Hawaii Souru: AClR staff computations based on various reports of US. Bureau of the Canws, Govsrnmants Division

TABLE B-6 - STATE-LOCAL PROPERTY TAXES PER $1,000 OF STATE PERSONAL INCOME, BY STATE, SELECTED YEARS, 1942-1971
State and Region
United States
New England Maine New Hampshire Vermont Massachusetts Rhode Island Connecticut
Mideast New York New Jersey Pennsylvania Delaware Maryland District of Columbia
Great Lakes Michigan Ohio Indiana Illinois Wisconsin
Plains Minnesota Iowa Missouri North Dakota South Dakota Nebraska Kansas
Southeast Virginia West Virginia Kentucky Tennessee North Carolina South Carolina Georgia Florida Alabama Mississippi Louisiana Arkansas
Southwest Oklahoma Texas New Mexico Arizona
Rocky Mountain Montana Idaho Wyoming Colorado Utah
Far West1 Washington Oregon Nevada California Alaska Hawaii
1971 -- 1967 1962 1957 1942
As % of As % of As % of As % of As % of U. S. U. s. U.S. U. S. U. S.
Amount Average Amount Average Amount Average Amount Average Amount Average
Note: Regional dollar amounts are unweighted averages. n.a. - N o t available.
'~xcluding Alaska and Hawaii.
Source: Compiled by ACIR staff from various reports of US. Bureau of the Census. Governments Div~sion.

TABLE 8-7 - PER CAPITA STATE-LOCAL PROPERTY TAX COLLECTIONS-AMOUNT, AND AVERAGE RATE - -- - - OF - - - INCREASE, BY STATE, SELECTED YEARS, 1942-1971
Per Caplta Collect~ons Average Annual Rate of Increase
State and Reg~on 1971 1967 1962 1957 1942 1967 71 1962-67 1957-62 1942-57
United States Average
New England Maine New Hampshire Vermont Massachusetts Rhode Island Connecticut
Mideast New York New Jersey Pennsylvania Delaware Maryland District of Columbia
Great Lakes Michigan Ohio Indiana Illinois Wisconsin
Plains Minnesota Iowa Missouri North Dakota South Dakota Nebraska Kansas
Southeast Virginia West Virginia Kentucky Tennessee North Carolina South Carolina Georgia Florida Alabama Mississippi Louisiana Arkansas
Southwest Oklahoma Texas New Mexico Arizona
Rocky Mountain Montana Idaho Wyoming Colorado Utah
Far west' Washington Oregon Nevada California Alaska Hawaii
5.5%
(5.1) 4.6 5.5 5.9 5.3 4.3 5.2
(4.4) 3.8 4.1 3.1 4.9 5.4 5.7
(5.91 6.1 6.0 6.0 5.6 5.7
(6.0) 5.8 6.3 6.2 4.1 5.8 7.1 6.9
16.1) 6.8 4.3 6.3 5.2 6.0 4.5 7 .O 5.6 5.8 6.0 5.4 7.6
(6.3) 6.1 7.4 4.9 5.8
(5.6) 5.3 4.9 7 .O 5.7 5.0
(5.41 5.8 6.1 3.5 6.5
N.A. N .A.
- - --- Note: Regional collections are unweightsd averapss. N.A. - Data not wailable.
'~xcluding Alaska and Hawaii. Source: Compilsd by AClR naff from various repom of the Governments Division. US. Bureau of the Census.

TABLE B-8 - REAL ESTATE TAXES AS A PERCENTAGE OF FAMILY INCOME, OWNER- OCCUPIED SINGLE-FAMILY HOMES, BY INCOME CLASS AND BY REGION, 1970
Exhibit:
United North- North- No. and distribution of homeowners Family income' States east central South West
Total Region Region Region Region No. (000) % d i ~ t . ~
Less than $2,000 $2,000 - 2,999 3,000 - 3,999 4,000 - 4,999 5,000 - 5,999 6,000 - 6,999 7,000 - 9,999 10,000 - 14,999 15,000 - 24,999 25,000 or more
All incomes Arithmetic mean Median
Census definition of income (income from all sources). Income reported received in 1970.
Cumulated from lowest income class.
Source: U.S. Bureau of the Census, Residential Finonce Survey, 1970 (conducted in 1971), special tabulations prepared for the Advisory Commission on Intergovernmental Relations. Real estate tax data were compiled for properties acquired prior to 1970 and represent taxes paid during 1970.Medians were computed by ACIR staff.

TABLE B-9 - REAL ESTATE TAXES AS A PERCENTAGE OF FAMILY INCOME FOR ELDERLY AND NON-ELDERLY SINGLE-FAMILY HOMEOWNERS, BY INCOME CLASS,
Family income1
Less than $2,000 $2,000 - 2,999 3,000 - 3,999 4,000 - 4,999 5,000 - 5,999 6,000 - 6,999 7,000 - 9,999 10.000 - 14,999 15,000 - 24,999 25,000 or more
All incomes
T Real estate tax as a % of family income 11 Exhibit: Number of homeowners (000)
Elderly
age 65 and over)
Elderly Nonelderly
(under 65)
18.9 10.1 7.2 5.5 5.1 4.3 4.1 3.7 3.3 2.9
4.12
Number Total
1,719 1,289 1,398 1,343 1,365 1,530 5,377 8,9 10 6,337 1,877
31,145
' Census definition of income (income from all sources). Income reported received in 1970.
Arithmetic mean.
% of total
Nonelderly
Number % of total
Source: U.S. Bureau of the Census, Residential Rnnnce Survey, 1970 (conducted in 1971), special tabulations prepared for the Advisory Commission on Intergovernmental Relations. Real estate tax data were compiled for properties acquired prior to 1970 and represent taxes paid during 1970.

TABLE 8-10 . TAXES LEVIED ON FARM REAL ESTATE AS A PERCENTAGE OF TOTAL
PERSONAL INCOME OF FARM POPULATION.
. UNITED STATES. 1935-1971 1
Taxes as Year Percentage
of Income
Taxes as Year Percentage
of Income 1955 . . . . . . . . 4.7 1956 . . . . . . . . 4.8 1957 . . . . . . . . 5.1 1958 . . . . . . . . 4.8 1959 . . . . . . . . 5.5 1960 . . . . . . . . 5.7 1961 . . . . . . . . 5.7 1962 . . . . . . . . 5.8 1963 . . . . . . . . 6.0 1964 . . . . . . . . 6.2 1965 . . . . . . . . 6.0 1966 . . . . . . . . 5.9 1967 . . . . . . . . 6.6 19682 . . . . . . . 7.0 1 96g2 . . . . . . . 7.1 19702 . . . . . . . 7.5 19712 . . . . . . . . 7.6
'Total personal income before deduction of farm real estate taxes includes net rent paid to nonfarm landlord .
Source: U.S. Department of Agriculture. Economic Re- search Service. Farm Real Estate Taxes (Washington. Feb- ruary 1973 . RET-12). Table 7 .

TABLE B-11 - STATES WITH DIFFERENTIAL FARMLAND ASSESSMENT PROVISIONS, JANUARY 1,1973
State
Alaska
Arkansas
California
Colorado
Connecticut
Delaware
Florida
Hawaii
Illinois
Indiana
Iowa
Kentucky
Maine
Maryland
Massachusetts4
Minnesota
Nebraska4
New Hampshire5
New Jersey
New Mexico
New York
Oregon
Pennsylvania
Rhode Island
South Dakota
Texas
Utah
Vermont
Virginia
Washington
Contracts
Preferential Deferred and Assessment1 Taxatlonl Agreements'
Total 8 15 Exhibit: No. of States in 1960 and 1970
1970 9 5 1960 3 -
'Preferential assessment: Land to be assessed at value in agricultural use, with no penalty if it is later converted to another use. Deferred taxation: Additional taxes collected if use of land changes. Contracts and agreements: Local government and landowner agree on restrictions on land use in return for lower property taxes. Typically there are penalties for not complying with the agreement. ZConnecticut does not collect a deferred tax upon a change in land use but imposes a special real estate transfer tax on the total sales price at rates ranging from 1 to 10 percent. depending on the length of time the land was held subsequent to its classification as farm land (up to 10 years). The tax applies also if the use is changed by the original owner during the 10 year period. =Applies only to counties with more than 200,000 population. 'A constitutional amendment was approved recently. The actual method of differential assessment has not yet been formulated by the legislature. 5New Hampshire's law is temporary, pending the report of the Open Space Land Study Commission. BNew York's deferred tax law is based chiefly on the estab- lishment of agricultural districts, though land not in agricul- tural districts may be eligible for agricultural use assessment if the landowner enters into an agreement with the local government. 'Oregon collects deferred taxes on farmland which is not zoned for farm use. Land which is zoned for farm use gets preferential assessment. BSouth Dakota limits preferential assessment for agricultural property to independent school districts. Wermont has provided for contracts between farmers and local government to fix the tax rate for land. Vermont also enables local governments to purchase rights and interests in farmland, with the farmer being taxed according to the value of the rights and interests left him. '"Virginia's law enables local governments to enact a de- ferred tax ordinance.
Source: US. Department of Agriculture. Rural Development Service. For further details, see Thomas F. Hady, "Differential Assessment of Farmland on the Rural-Urban Fringe," Ameri- can Journal of Agricultural Economics (vol. 52, No. 1, February 1970). p. 25. See also, John Kolesar and Jaye Scholl, Misplaced Hopes, Misspent Millions, A Report on Farmland Assessments in New Jersey (Princeton: The Center for Analysis of Public Services, 1972).

TABLE B-12 - THE EXTENT OF RESIDENTIAL ASSESSMENT VARIATION FOR PROPERTY I N A SINGLE AREA, 1971
-. - Ratio of assessed Exhibit: Uniformity of assess-
value t o sales price Uniformity of assessments within areas ments between areas (Interarea - State (%) (Intra-area coefficient of dispersion-%)' coefficient of dispersion-%)
(Greatest Assessment UniformityJ3
Kentucky Nevada Michigan New Hampshire California North Dakota Connecticut Oregon Colorado New Jersey Virginia Hawaii Florida Massachusetts Maine Nebraska Ohio Maryland Wisconsin
Vermont Tennessee Alaska Minnesota South Dakota Kansas North Carolina New Mexico l owa Illinois Indiana Montana Georgia Washington Rhode Island Utah Arizona
Louisiana Mississippi Texas West Virginia Wyoming Oklahoma Missouri New York South Carolina Alabama Delaware Pennsylvania Arkansas Idaho
(Moderate Assessment uniform it^)^
(Least Assessment Uniformity) 3

TABLE 6-13 - THE EXTENT OF RESIDENTIAL ASSESSMENT VARIATIONS, 1961,1966, AND 1971
Degree to which houses in the same area were assessed uniformly (intra-area coefficient
of dispersion-%)' Percentage-Point ChangeZ
State 1971 1966 1961 1966-1971 1961-1971
(States where uniformity increased, 1966-71)
New York South Carolina Hawaii Nevada Oregon Mississippi Texas New Jersey Missouri Michigan Kansas Wisconsin Vermont Pennsylvania Nebraska Maryland Kentucky Massachusetts
North Dakota Arkansas Utah Arizona Delaware Iowa Alaska District of Columbia Maine Minnesota West Virginia Louisiana Wyoming South Dakota Florida Virginia Washington Colorado New Mexico R hode Island Ohio Georgia North Carolina New Hampshire Idaho Alabama Connecticut Montana California Illinois Tennessee Oklahoma Indiana
(States where uniformity decreased. 1966-71 )
n a -Not ava~lable I ~ e d l a n coef fment for sjngle farndy (nonfarm) houses 'A negative percentage-polnt change ~ndicates a galn In un i fo rm~ty . Source: ACIR staff compilation based on U.S. Bureau of the Census, 1972 Census of Governments, Vol. 2. Taxable Property Valuesand ~ssesrmenr -
Sales Price Ratios.

TABLE B-14 - STATE LEGISLATION EXEMPTING BUSINESS PERSONALTY FROM TAXATION OR REDUCING THE BUSINESS PERSONAL PROPERTY TAX, JULY 1,1973
State Type of Leglslatlon Legal C ~ t a t ~ o n
Arizona
California
Colorado
Alabama 1. Exempts manufactured articles, including pig iron, in the hands of the producer or manufacturer for 12 months after their production or manufacture.
2. Exempts raw materials used in textile manufacturing. 3. Exempts nuclear fuel assemblies used i n the production of electricity.
1. Exempts wholesalers' and retailers' inventories 2. Freeport Law.
Exempts 45% o f the assessed value o f business inventories for the fiscal year 1973-74 and 50% thereafter.
1. Reduces the assessment of freeport merchandise to 5% (assessment ratio for all other taxable property standardized at 30%).
2. Reduces the assessment of the stocks of merchandise of a manufacturer or merchant by 5% a year (from 30% in 1968) t o 5% for 1973 and each year thereafter.
Connecticut 1. Gradually exempts manufacturers' inventories (assessments reduced by 10% a year, from 40% in 1970 until fully exempt by 1976).
2. Exempts the monthly average quantity of goods of any wholesale and retail busi- ness to the extent of 1/12 of the value of the goods for the purposes of assessment in the year 1971. increasing by 1/12 each year unti l fully exempt in 1982 and each year thereafter.
3. Freeport Law.
4. Exempts business equipment and machinery newly acquired after the 1973 muni- cipal assessment date; and business equipment and machinery having an aggregate value of less than $500 owned by any one person.
Delaware All tangible and intangible personal property is exempt.'
Dist. of Col. 1. Freeport Law. 2. For the 1973-74 fiscal year business inventories are taxed at 1/3 of the general
personnal property tax rate for the 1972-73 fiscal year. Effective July 1, 1974. the tax on business inventories is repealed.
Florida Inventories are assessed at 25% of just valuation.
Georgia 1. Motor vehicles in dealers' inventories are assessed at 75% of the assessed value of other motor vehicles.
2. Freeport Law.
Alabama code of 1940, Title 51, Sec. 2 (m).
Act 2405, Laws of 1971. Act 2488, Laws of 1971.
Amendment of Constitution, Art. 9, Sec. 2, adopted 11/3/64, Arizona Revised Statutes, Sec. 42-631.
S.C.A. 1. 1st. Spec. Sess., Laws of 1968 (Chap. 1526, Laws of 1969); Chap. 1406, Laws of 1972.
Chap. 290, Laws of 1965 (Colorado Revised Statutes, Sec. 137-1-4).
Chap. 370, Laws of 1967 (Colorado Revised Statutes, Sec. 137-5-9).
Chap. 461, Laws o f 1965 lGeneralStatutes of Connecticut, Revision o f 1958, Sec. 12-81 ); Chap. 630, Laws of 1969.
Chap. 657, Laws of 1969.
Chap. 603, Laws of 1965 (General Statutes o f Connecticut, Sec. 12-19.1- 12-91.3).
Act 351, Laws of 1973 (Sec. 12-72a).
Delaware Code o f 1953, Sec. 8102, Tit le 9 and Sec. 102 (a). Title 30.
District o f Columbia Code of 1951, Sec. 47-1204. Dist r ic tof Columbia Code of 1951, Sec. 47-1207 (P.L. 92-196, Laws of 1971).
Chap. 367, Laws of 1967 (Florida Statutes, Sec. 192.05).
Act 52, Laws of 1967 (Georgia Code o f 7933, Sec. 92-1 11A).
Act 693. Laws of 1969 (Georgia Code o f 1933, Secs. 92- 107.1 and 92- 107.2).
See footnote at the end of table.
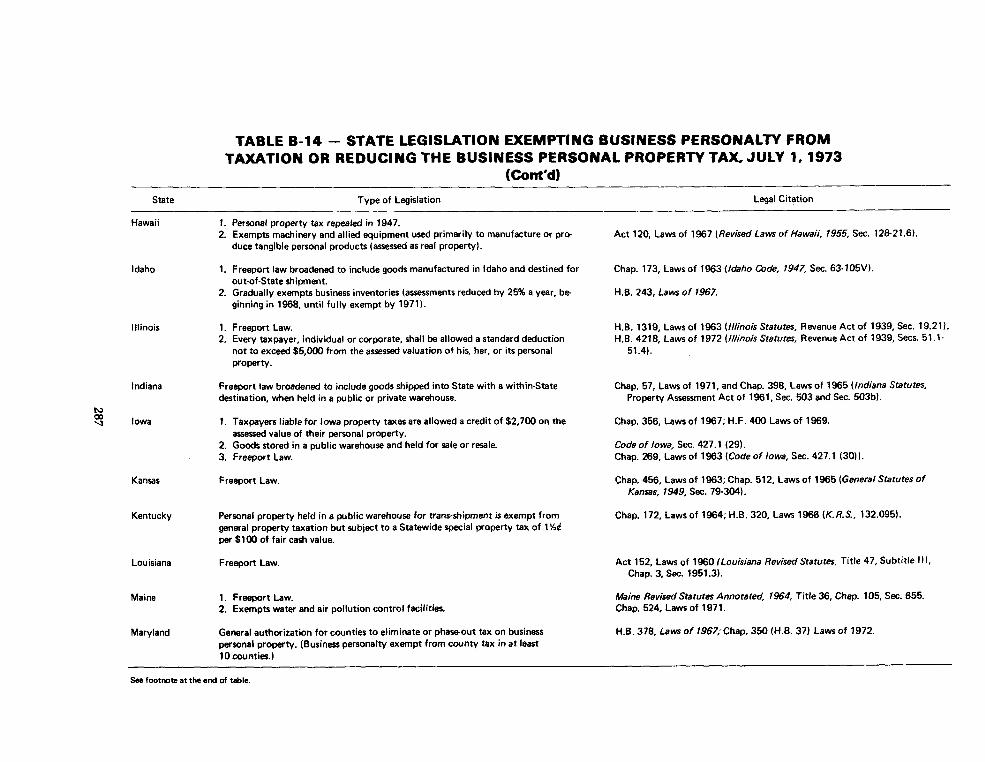
TABLE 6-14 - STATE LEGISLATION EXEMPTING BUSINESS PERSONALTY FROM TAXATION OR REDUCING THE BUSINESS PERSONAL PROPERTY TAX, JULY 1,1973
(Cont'dl
State Type of Legislation Legal Citation
Hawaii
ldaho
I llinois
Indiana
N lowa
Kansas
Kentucky
Louisiana
Maine
Maryland
1. Personal property tax repealed in 1947. 2. Exempts machinery and allied equipment used primarily to manufacture or p r e
duce tangible personal products (assessed as real property).
1. Freeport law broadened to include goods manufactured in ldaho and destined for out-of-State shipment.
2. Gradually exempts business inventories (assessments reduced by 25% a year, be- ginning in 1968, until fully exempt by 1971).
1. Freeport Law. 2. Every taxpayer, individual or corporate, shall be allowed a standard deduction
not to exceed $5,000 from the assessed valuation of his, her, or its personal Property.
Freeport law broadened to include goods shipped into State with a within-State destination, when held in a public or private warehouse.
1. Taxpayers liable for lowa property taxes are allowed a credit of $2,700 on the assessed value of their personal property.
2. Goods stored in a public warehouse and held for sale or resale. 3. Freeport Law.
Freeport Law.
Personal property held in a public warehouse for trans-shipment is exempt from general property taxation but subject to a Statewide special property tax of 1 x 1 wr $100 of fair cash value.
Freeport Law.
1. Freeport Law. 2. Exempts water and air pollution control facilities.
General authorization for cwnties to eliminate or phaseout tax on business personal property. (Business personalty exempt from county tax in at least 10 counties.)
Act 120, Laws of 1967 (Revised Laws o f Hawaii, 1955, Sec. 12821.6).
Chap. 173, Laws of 1963 (ldaho Code, 7947, Sec. 63-105V).
H.B. 243. Laws o f 1967.
H.B. 1319, Laws of 1963 (Illinois Statutes, Revenue Act of 1939, Sec. 19.21). H.B. 4218, Laws of 1972 (Illinois Statutes, Revenue Act of 1939, Secs. 51.1-
51.4).
Chap. 57, Laws of 1971, and Chap. 398, Laws of 1965 (Indiana Statutes, Property Assessment Act of 1961, Sec. 503 and Sec. 503bl.
Chap. 356, Laws of 1967; H.F. 400 Laws of 1969.
Code o f lowa, Sec. 427.1 (29). Chap. 269, Laws of 1963 (Code o f lowa, Sec. 427.1 (30) 1.
Chap. 456, Lawsof 1963; Chap. 512, Lawsof 1965 (General Statutes o f Kansas, 1949, Sec. 79-304).
Chap. 172, Laws of 1964; H.B. 320, Laws 1966 (K. R.S., 132.095).
Act 152, Laws of 1960 (Louisiana Revised Statutes, Title 47, Subtitle 111, Chap. 3, Sec. 1951.3).
Maine Revised Statutes Annotated, 1964, Title 36, Chap. 105, Sec. 655. Chap. 524, Laws of 197 1.
H.B. 378, Laws o f 1967; Chap. 350 (H.B. 37) Laws of 1972.
Sea footnote at the end of table.

TABLE 8-14 - STATE LEGISLATION EXEMPTING BUSINESS PERSONALTY FROM TAXATION OR REDUCING THE BUSINESS PERSONAL PROPERTY TAX, JULY 1,1973
(Cont'd)
State Type of Legislation Legal Citation
Massachusetts 1. Freeport Law. 2. Individuals and partnerships operating as merchants are taxable, but business
corporations operating as merchants are exempt from taxation on most all types of tangible personal property including merchandise except machinery used in the conduct of the business.
Michigan
Minnesota
Mississippi
Missouri
Montana
Nebraska
1. Exempts special tools used in manufacturing (dies, fixtures, molds, patterns, gauges, etc.1.
2. Exempts mechanic tools up to $500 and personal property of a householder used in business up to $500.
3. Freeport Law.
1. Taxpayers may elect to have exempt inventories or tools and machinery which by law are considered personal property.
2. Freeport Law
1. Exempts manufactured products owned by or remaining in the hands of a manu- facturer, if ultimately to be shipped or sold to other than the final consumer and not at retail.
2. F reeport Law.
1. Freeport Law. 2. Exempts Commission merchants with respect to unmanufactured articles, con-
signed for sale, in which they have no interest other than their commission.
1. Freeport Law. 2. Stocks of merchandise of all sorts together with furniture and fixtures used there-
with, except mobile homes, and all office or hotel furniture and fixtures are assessed at 33 113%.
1. Freeport Law. 2. Exempts 12%% of the actual value of business inventory effective January 1, 1973
and an additional 12%% each January 1st (thru) 1977 when 62%% will become exempt.
Nevada 1. Exempts inventories of farm machinery and equipment dealers. 2. Freeport Law.
New Hampshire 1. Exempts goods held for out-of-State delivery by a manufacturer when title has passed to the purchaser.
2. Personal property taxes on stock in trade repealed effective March 31, 1970.
Massachusetts General Laws o f 1932, Chap. 59, Sec. 2. Massachusetts General Laws of 1932, Chap. 59, Sec 5(16).
Act 197, Laws of 1964 (Compiled Laws, State o f Michigan, 1948, Sec. 21 1.9b).
Compiled Laws, State o f Michigan, 1948, Sec. 21 1.9(81 and ( 1 1 ).
Compiled Laws, State o f Michigan, 1948, Sec. 21 1.9( 12).
Chap. 32, Art. IV, Laws of 1967, 1st Sp. Sess. (M.S.A., Sec. 272.01 (1 1)).
Minnesota Statutes Annotated, Sec. 272.022 and 272.023.
Mississippi Code of 1942, Sec. 9697.7( 1 ), (3). and (4).
Mississippi Code of 7942, Sec. 9699-02.
Missouri Revised Statutes o f 1949, Sec. 137.093. Missouri Revised Statutes o f 1949, Sec. 150.040.
H.B. 321, Laws of 1973. Revised Codes o f Montana, 1947, Secs. 84-301 and 84-302.
RevisedStatutes o f Nebraska, 1943, Sec. 77-1226.01. Revised Statutes o f Nebraska, 1943, Secs. 77.202.25-77.202.29.
Chap. 162, Laws of 1969. Revised Statutes o f Nevada, 1957, Sec. 36 1.160.
Chap. 239, Laws of 1963 (Revised Statutes Annotated of New Hampshire, 1955, Sec. 72: 15).
Chap. 5, Laws of 1970, 1st Sp. Sess.
See footnote at the end of table.

TABLE 8-14 - STATE LEGISLATION EXEMPTING BUSINESS PERSONALTY FROM TAXATION OR REDUCING THE BUSINESS PERSONAL PROPERTY TAX, JULY 1,1973
(Cont'd)
State Type of Leg~slation Legal C~tation
New Jersey 1. Exempts business inventories and all other business personal property, except that used in telephone and telegraph systems, from local property taxation. Subjects certain kinds of business personalty, but not business inventories, to a Statewide tax of $1.30 per $100 of taxable value.
2. Exempts personal property stored in a public warehouse.
New York All tangible and intangible personal property is exempt1
New Mexico 1. Freeport Law. 2. Personal property held by a person as part of his inventory except (a) livestock and
(b) inventories held by a person whose property used in connection with the maintenance of personal property inventories is subject to assessment.
North Carolina Freeport Law (beginning July 1, 1969. until then a freeport exemption is provided only for property held at seaports awaiting shipment to foreign countries).
North Dakota 1. Exempts all personal property not required to be assessed by the state board of equalization, beginning in 1970, except property taxed in lieu of property taxes, property subject to taxation under any other provision of law and property of non-prof it corporations.
2. Freeport Law broadened to include goods acquired or manufactured in North Dakota and destined for out-of-State shipment.
Ohio 1. All inventories to be assessed at 49% in 1972, 47% in 1973, and 45% in 1974 and thereafter; business furniture and fixtures at 66% in 1972, 62% in 1973, 58% in 1974, 54% in 1975, and 50% in 1976 and thereafter; machinery and equipment at 50%.
2. Freeport Law.
Oklahoma Freeport Law.
Oregon 1. An exemption is provided for a percentage of the true cash value of inventories for each tax year beginning July 1 as follows: for 1969, 5%; 1970, 10%; 1971, 15%; 1972, 20%; exemption increased by 10% for 1973 and each year thereafter until inventories become fully exempt for tax years beginning on July 1, 1980 and thereafter.
2. Freeport Law.
Pennsylvania All tangible personal property is exempt.
Rhode Island Exempts manufacturers' inventories.
Chap. 136 and Chap. 138, Laws of 1966 (Revised Statutes o f New Jersey, 1937, Secs. 54:4-1 and 54: 1 1 A-2).
Revised Statutes o f New Jersey, 1937, Sec. 54:4-3.20.
New York Consolidated Laws, Chap. 50-a, Sec. 300.
Chap. 60, Laws of 1963 (New Mexico Statutes, 1953, Sec. 72-2-1.1 ). Chap. 374. Laws of 1973; Sec. 72-1-22.
Chap. 1185. Laws of 1967 (North Carolina Statutes, Sec. 105281 1.
H.B. 1185, Laws of 1971, and S.B. 137, Laws of 1969 (North Dakota Century Code, Sec. 57-02-08).
S.B. 302, Laws of 1967 (North Dakota Century Code, Sec. 57-02-42).
H.B. 480, Laws of 1967 and H.B. 475, Laws of 1971 (Ohio Revised Code, Sec. 5711.22).
Ohio Revised Code, Sec. 5701.08.
Chap. 501, Laws of 1965 (Oklahoma Statutes Annotated, Title 68, Sec. 2425).
Chap. 604, Laws of 1965 (Oregon Revised Statutes, Sec. 310.608; Chap. 612 Laws of 1969).
Oregon Revised Statutes, Sec. 307.8 10.
Act of May 18, 1937, P.L. 633; and Act of June 19, 1939, P.L. 413.
Chap. 245, Laws of 1966 (General Laws o f Rhode Island, 1956, Sec. 44-3-3 (20)).
See footnote at the end of table,

South Carolina 1. Reduces assessment for merchants' personal property to 10%. 2. Exempts manufacturers' inventories (except manufactured articles offered or
available for sale at retail). 3. Freeport Law. 4. Exempts new, unused agricultural machinery or equipment if: (1) exempt from
sales tax, (2) wholesale cost to the retail dealer is $500 or more, and (3) such machinery or equipment has been separately listed and included in the dealer's inventory for ad valorem tax purposes for some previous tax year.
South Dakota Freeport Law.
Tennessee 1. Exempts articles manufactured from the produce of this State in the hands of the manufacturer.
2. Freeport Law.
TABLE 8-14 - STATE LEGISLATION EXEMPTING BUSINESS PERSONALTY FROM TAXATION OR REDUCING THE BUSINESS PERSONAL PROPERTY TAX, JULY 1,1973
(Cont'd) State Type of Leg~slat~on Legal C~ta t~on
Texas
Utah
Freeport Law.
1. Free~ort Law.
2. The assessment and taxation of the inventory of retailers, wholesalers, manufac- turers, farmers or livestock owners is reduced as follows: on January 1, 1970, such property is assessed at 20%; on January 1, 1971, 14%; on January 1, 1972, 8%; on January 1, 1973 and thereafter such property is wholly exempt.
Vermont
Washington
wisconsin2
1. Exempts tools and implements of a mechanic or farmer, and motorized highway. building equipment and road-making appliances.
2. Exempts real and personal property of industrial facilities used principally for the processing of whey or other cheese by-products.
Freeport exemption repealed and replaced with a partial exemption for each separately assessed stock of merchandise.
1. Increases credit for property taxes on merchants' inventories and manufacturers' materials and finished products from 50% to 60% (5090 credit first enacted in 1961)
2. Exempts mechanics' tools, farm, orchard and garden machinery and tools, and new farm mashinery stocked and owned by a retailer.
3. Freeport Law.
Wyoming 1. Exempts certain manufacturers' and merchants' inventories after 1/1/72. 2. Freeport Law.
Code o f South Carolina, 1962, Sec. 65-1647.4. Code o f South Carolina, 1962, Sec. 65-1663.
Code of South Carolina, 1962, Sec. 65-1655. H.B. 2303, Laws of 1970.
S.B. 26, Laws of 1966 (South Dakota Code of 1939, Sec. 57.031 1 ).
Tennessee Code Annotated, Sec. 67-502.
Tennessee Code Annotated, Sec. 67-502.
Chap. 208, Laws of 1963 (Revised Civil Statutes, 1925, Art. 71 50.9).
S.J. R.5, Laws of 1963, Amends Constitution, Art. XI I I, Sec. 2; Chap. 120, Laws of 1965 (Utah Code Annotated, 1953, Sec. 59.2-18).
S.B. 8, Laws of 1969 (Utah Code Annotated, 1953, Sec. 59.2-241.
Vermont Statutes Annotated, 1959, Title 32, Sec. 3802.
Chap. 220, Laws of 1970.
Chap. 124. Laws of 1969.
Chap. 163, Laws of 1965 (Wisconsin Statutes, Sec. 77.64).
Wisconsin Statutes, Sec. 70.1 1 1 (9).
Wisconsin Statutes, Sec. 70.11 1 ( 10(a) and 1 O(b)).
Chap. 199, Laws of 1967. Wyoming Statutes of 1957, Sec. 39-106.
'However, the law defines property of utilities t o include as "real," much equipment which under standard concepts of property tax law would be personal. 2~xempts machtnery and specific processtng equipment used excluswely and d~rect ly In manufacturing tangible Personal property effective wlth the May 1, 1974 assessment. The cred~t against personal property taxes
patd on ~nventories IS Increased by steps unti l the property tax on mventorles IS e l~m~nated as of May 1. 1977.
Source. AClR compllat~on based on Commerce Clearing House, State Tax Reporter.

'A')
'U 'X
' U ' X
'UI'X
'A.4
'A')
'W.X
'A')
'W'X
'A')
'U 'X
'A')
'A')
'W'X
'A.4
'A')
' W'X
'A')
'A')
'W'X
'W'X
'W'X
'A'J
'A')
'A')
'A')
'W'X
'A.4
'W'X
. . . . . . . . . . . . . . . . . ' I l e m l ) O!YO
. . . . . . . . . . (a le is ) e u ! l o q WJON
. . . . . . . . . . . . . . . . . . . ' leao l
. . . . . . . . . . . . . . . . . . . awls :(lesol pue a l e i s ) ~ J O A M a N
. . . . . . . . . . . . (a le is ) A a s q M ~ N
. a m s a leal 40 JajsueJl uo x e m s . . . . . . . . . . . . . . .
(a te ls ) e p ! q j . . . . . . .
(le3ol) e ! q~n103 40 1 3 ! w ! a . . . . . . . ,(le301 pue a l e l ~ ) a ~ e ~ e l a a
. . . . . . . . . . . . ( a l e x ~ ) 1n3!13auuo3
lln4 . 'A')
aseg
EL61 '1 Alnr 'S3XVl WdSNVUI 3lWlS3 1V3U 1V301 QNV 3.lVIS - QL-8 3 1 8 V l

TABLE 8-15 - STATE AND LOCAL REAL ESTATE TRANSFER TAXES, JULY 1.1973 (Cont'd)
Base f.v. - ful l value; x.
m. -exclusive Year of assumed Rate
State and government imposing enacted mortgages 7/1/73
Oklahoma (State). . . . . . . . . . . . . . Pennsylvania (Stateand local)18 . . . . Rhode Island (State). . . . . . . . . . . . South Carolina (State and local):
State . . . . . . . . . . . . . . . . . . . . County . . . . . . . . . . . . . . . . . .
South Dakota (State). . . . . . . . . . . . Tennessee $State) . . . . . . . . . . . . . Vermont (State). . . . . . . . . . . . . . . Virginia (State and local):
State and local2' . . . . . . . . . . . . State . . . . . . . . . . . . . . . . . . . .
Washington (State and local)21 . . . . . West Virginia (State and local):
State . . . . . . . . . . . . . . . . . . . . County . . . . . . . . . . . . . . . . . .
Wisconsin (State) . . . . I . . . . . . . . .
Distribution of receipts
--
State 95% State1 State
State local
local State State
State2" State 1/2
State2 ' State local State 1/2
State collections
1972' ($000)
Administrative features
Use of stamps2
Provision for automatically
Provision for transmitting recording ful l sales price sales priceZ information3 --
n.a.-Data not avatlable. '~xc ludes amounts collected and retatned by local governments (other than the D ~ s t . of Columbba) 'X denotes "Yes"; ---denotes "No." 3~ - "State agency": L - "local assessor or sim~lar local off lc~al." 41ncludes documentary taxes other than real estate transfer taxes. 2~ransfers under $100 are exempt. '~ountles, or a city and a county are author~zed t o Impose a tax on real estate transfers. Clties wlthln a county which has already Imposed the tax may levy a tax of '/2 the rate w ~ t h a credlt betng glven agalnst the county
tax for the city tax. 7~ransfers of $500 or less are exempt. he c ~ t y of Wllmington also levles a 1% realty transfer tax. 9Rate is $1 for the first $1,000 or fract~on, and 10d for each add~t~ona l $100 or fraction. Transfers of $100 or less are exempt.
L O ~ ~ ~ t r l b u t e d tn the same proportton that revenues derwed f rom the tax imposed by the Act provldlng for the levy of taxes on certam classes of lntangtble personal property, approved December 27. 1937 (Ga. L. 1937.38. P. 156) as now or may hereafter be amended, are div~ded.
he tax is applicable only to corporations subject t o gross rncome tax. he city of Baltimore and spec~fted countles are authorized to supplement the State tax. at rates ranging f rom $1.101$500 to 1 '/2 percent of the actual cons~derat~on paid. I3€xcept that tax on recordation of Instruments granting encumbrances on property sltuated In two or more countles as securlty for corporate bonds of publdc u t~ l t t~es , are p a ~ d t o the State. ' 4 ~ l u s an add~tional 14% surtax.
Rate 1s $2.20 on flrrt $1,000. I 6 ~ e w York C ~ t y Imposes a tax of 14 on transfers of real property where the cons~derat~on exceeds $25.000. ' h he rate shown is the statew~de county rate. The mmimum tax 6 $1, wtth transfers under $100 exempt. An additional tax. not t o exceed 30d on each $100 of value of real property, may also be levled by any county, ' 8 ~ ~ c a l governments are author~zed to impose a real estate transfer tax up to 1 % and about 1,850, tncluding more than 1.000 school d~strlcts, have done so. ' 9~epealed and reenacted In 1968. 20~oun t les and cltles levy a tax of 113 the State recordation tax (5dl$100l. '' Countles are authortzed to levy a 1 % real estate sales tax; all 39 counties have done so.
Source: AClR staff compllatlon based on Commerce Clearing House, State Tax Reporter; and U.S. Bureau of the Census, Governments D~vlsion.

FIGURE 1 - LEGALIZING THE ASSESSMENT PROCESS: ONE "GIVEN" AND TWO BASIC CHOICES FACE STATE LEGISLATURES
any assessment policy. I I
L~~~~~ BASIC CHOICE: should all' property be assessed a t a uniform percentage o r appraised (market) value, o r should a classified tax sys-
UNIFORMITY : All property C LASSIFICA TION : Variotis is assessed for taxation at classes of rea l property a r e the same percentage of ap- - VS. defined and each is assessed praised (market) value. a t a different percentage of
appraised o r market value (generally, residential and agricultural properties a r e assessed lower than busi- ness property. 1 /
SECOND BASIC CHOICE: Should the assessment level be determined by the State o r by individual localities ?
STATE DETERMINATION: LOCAL DETERMINATION: the State legislature mandates Each local district selects that the same percentage of ap- the percentage of appraised praised value be used for - VS. (market) value it prefers to tax purposes throughout the use fo r local tax assess - State. ment purposes (subject on-
ly to guidelines a s to min- imum assessment level and interclass relationships, i f classification is used).
1 / For more desirable, albeit less conventional, forms of preferential tax Treatment, see pages 8 and 9.

FIGURE 2 - THE PROPERTY TAX-REFORM AND RELIEF
The Pour Elements Required State Action
1. Legitimac : Adopt an en- forcea -El-+ e ate valuation poli- cy dedicated to ending the con- flict between assessment law and practice. No matter which of the options on the r i ht i s g selected, an essential o r 'giv- en" f irst step is insistence on full marke t-value appraisal.
2 . Openness: Provide each taxpayer valuation information to enable him to judge the fair - ness of his assessment, and establish a simple taxpayer appeal system a s a remedy for improper assessment.
3. Technical Prgficiency: Re - quire that appraisers have the ability to establish and main- tain accurate estimates of the market value for every class of taxable property and that the administrative structure facilitate this objective.
4. Compassion: Extend relief to those taxpayers carrying extraordinary burdens in r e - lation to income.
F i r s t Option: Adopt and enforce a state- wide full-value assessment standard for all property. Second Option: Adopt and enforce a state- wide fractional assessment standard that i s uniform for all types of real property. Third Option: Allow each local assess- ment district to set i ts own assessment level (subject to State -required uniformi- ty among types of real property and a minimum level). Fourth Option: Codify existing de facto classification by establishing and en- forcing different statewide assessment levels for various types of real property.
a. Annual State assessment ratio studies. b. Full disclosure of the findings of as -
sessment ratio studies - -with the lo- cal results printed on assessment no- tices.
c. Accessible and inexpensive taxpayer appeal system, separate from the assessing function.
a; Centralize primary appraisal at the State level or, failing this, consolidate appraisal districts into units at least countywide to permit efficient use of specialized personnel and equipment.
b. Strong State supervision and coordi- nation of appraisal, incluing technical assistance to local districts, where appraisal remains a State -local func- tion.
c. State training programs and certifi- cation for appraisers.
State -financed relief targeted to those whose property tax burdens a r e greatest relative to income, and phasing out a s in- come r i ses (circuit -breaker),

FIGURE 3 - A CHECKLIST FOR RATING STATE PROPERTY TAX PROVISIONS
Openness: Keeping the Taxpayer Informed
A State should:
Conduct annual studies of the relationship between assessed val- ue and sales price, and publish such assessment-sales ratios.
Require assessors to send each real property taxpayer, before preparation of the final property assessment l is ts , a notice con- taining the assessment information the taxpayer needs to judge the fairness of his assessment, and also telling him how, when, and where to appeal an assessment he feels is unfair.
Provide an assessment appeals procedure that is readily acces- sible, utilizes rather informal procedures, and is staffed by professionally qualified persons who can exercise independent judgment about the accuracy of an assessment.
Provide that State assessment-sales ratios a r e admissible a s evidencp in support of an assessment appeal (with a prescribed 1 1 tolerance zone" o r margin of e r r o r that recognizes that proper- ty appraisal is not an exact science).
Technical Proficiency: Organization for High-Quality Appraisal
A State should:
1 . Assign responsibility for primary appraisal of rea l property to jurisdictions that a r e large enough to make effective and effi- cient use of specialized personnel and equipment (at least coun- ty-wide).

Select appraisal personnel on the basis of their professional qualifications and ability to administer (and to keep current) a market value, mass -appraisal system.
Conduct State training and certification programs for apprais - e r s at both the entry and advanced levels.
Provide strong State -level guidance and technical assistance to local appraisal districts (if appraisal is not completely centra- lized a t the State level).
Commit sufficient fiscal resources to real property appraisal to (a) permit each parcel of property to be physically inspected and appraised at least every three years and (b) make adjust- ments of appraisals and assessments between major reapprais- a l efforts to keep them current with market developments.
Compassion: Relief from Extraordinary Property Taxes
A State should:
Relieve extraordinary property tax burdens for renters a s well a s for homeowners.
Relieve extraordinary property tax burdens for the non-elderly a s well as for the elderly.
Relieve extraordinary property tax of moderate -income, a s well a s destitute, households.
Provide some relief to fa rmers (either circuit-breaker o r tax deferral) to keep rising property taxes from forcing premature conversion of agricultural land to non-agricultural uses.
Mandate such relief on a statewide basis.
Fund such relief at the State, rather than.loca1, level.


a U. S. GOVERNMENT PRINTING OFFICE : 1974 0 - 558-035


what The Advisory Commission on inter- governmental Relations (ACIR) was
7 created by Congress in 1959 to monitor . a m . the operatlm of the American federal system and to recommend improvements. AClR is a permanent natioyl bipartisan body representing the executive and legbrative branches of Federal, State and local government and the public
Of the 26 Commission members, nine represent. the Federal government, 14 represent State and local gov- ernments and three represent the general public. Twenty members are appointed by the President. He names three private citizens and three Federal execu- tive officials directly and selects four governors, three State legislators, four mayors and three elected county officials from slates nominated, respectively, by the Na- tional Governors' Conference, the Council of State Governments, the National League of Cities/U.S. Con- ference of Mayors, and the National Association of Counties. The other six are Members of Congress- three Senators appointed by the President of the Senate and three Representatives appointed by the Speaker of the House. Commission members serve two-year terms and m y be reapp~fnted. The Commission names an Executive Director who heads the small professional staff. i
After selecting specific intergovernme~~tal issues for investigation, AClR fdlows a multi-step procedute that assures review and cammanr by representatives of all points of view, all affected levels uf ggqvernment, tech- nical experts and interested grau$s. The Commission then debates each issue and formulaas its policy posi- tions. Commission findings and recommendations are published and draft bills and executive orders are developed to assist in implementing AClR policies.

commission members 1973