Project Evaluation Report - Girls' Education Challenge
277
Project Evaluation Report Report title: Impact Evaluation of the Making Ghanaian Girls Great Project (MGCubed) Evaluator: Social Impact GEC Project: Making Ghanaian Girls Great (MGCubed) Country Ghana GEC window GEC-Transition Evaluation point: Baseline Report date: May 2018 Notes: Some annexes listed in the contents page of this document have not been included because of challenges with capturing them as an A4 PDF document or because they are documents intended for programme purposes only. If you would like access to any of these annexes, please enquire about their availability by emailing [email protected].
-
Upload
khangminh22 -
Category
Documents
-
view
3 -
download
0
Transcript of Project Evaluation Report - Girls' Education Challenge

Project Evaluation Report Report title: Impact Evaluation of the Making Ghanaian Girls Great Project
(MGCubed)
Evaluator: Social Impact
GEC Project: Making Ghanaian Girls Great (MGCubed)
Country Ghana
GEC window GEC-Transition
Evaluation point: Baseline
Report date: May 2018
Notes:
Some annexes listed in the contents page of this document have not been included because of challenges with capturing them as an A4 PDF document or because they are documents intended for programme purposes only. If you would like access to any of these annexes, please enquire about their availability by emailing [email protected].

IMPACT EVALUATION OF THE MAKING GHANAIAN GIRLS GREAT PROJECT (MGCUBED) BASELINE REPORT | MAY 2018
PROJECT NUMBER 7045
This report was prepared by Social Impact at the request of the Varkey Foundation. It was written by Andrew Carmona, Basab Dasgupta, Braden Agpoon, Corinna Bordewieck, Mary-Jo Robinson, and Euphonise L’Oiseau.


WORD CLOUD Based on frequency of responses in qualitative interviews

“Our grandfathers and mothers said that a girl’s place of stay is in the kitchen, but we have now learned that it’s not. Now everybody wants his or her child to attend school.”
-38-year-old mother in Kadjebi
________________________
“I help my girl child to do her homework. There was a saying that only boys are allowed to go to school, but in these days, things have changed.”
-44-year-old father in Adenta
________________________
“We care so much about the schooling of our daughters because they can do what their brothers can do.”
-85-year-old male care taker in Nkwanta South
________________________
“It is equally good for boys and girls to be educated for a transformed future” -15-year-old 7th grade girl from Ada West
________________________
“I like MGCubed classes because my mind is able to explore or learn about things abroad.”
-16-year-old 7th grade girl from Ada West
________________________
“If you educate a woman you have educated a whole nation, so people should think to educate their girl child.”
-13-year-old 6th grade boy from Ningo Prampram
________________________
“The MGCubed program is a good and laudable program which needs to be sustained. It occupies the children and teachers. It adds value to teachers’ methodology. It has built their actions and knowledge system so even when they leave the school to join another
school, they can still use what they have acquired.” -GES Monitoring and Supervision Unit staff member, Ada East

Treatment schools Control schools
SAMPLED SCHOOLS OF THE BASELINE EVALUATION

ACKNOWLEDGMENTS The Evaluation Team (ET) would like to acknowledge a few key individuals without whose support the production of this report would not have been possible. We wholeheartedly thank Emmanuel Bossman and his team at the NEA unit for their strong collaboration on a very tight timeline. The authors are extremely appreciative of the efforts of Osman Mensah and the team at JMK Consulting, along with the 122 enumerators, supervisors, and field managers who worked tirelessly over a 4-week period to successfully carry out a high-quality data collection effort. The team would like to further acknowledge Muniratu Issifu and Emma Broadbent of the Varkey Foundation for their support, input to the report, and responsiveness to our requests. Finally, we offer our full gratitude to the students, teachers, school directors, caregivers, and departmental-level GES officials who graciously gave their time to take learning tests and surveys, participate in observations, and give candid feedback for this report. It is for them and all the students in Ghana that we continue to work hard to ensure that every child everywhere has the chance to succeed on their educational journeys.
-The Evaluation Team Basab Dasgupta (Principal Investigator) Andrew Carmona (Senior Program Manager) Corinna Bordewieck (Program Manager) Justice Agyei-Quartey (Local Education Specialist) Mike Duthie (Senior Statistical Advisor) Braden Agpoon (Senior Program Assistant) Euphonise L’Oiseau (Program Assistant) Mary-Jo Robinson (Qualitative Specialist)

GEC-T Baseline Report – Making Ghanaian Girls Great Project 2
TABLE OF CONTENTS EXECUTIVE SUMMARY .................................................................................................................................................. 9
1. BACKGROUND TO PROJECT .................................................................................................................... 15
1.1 PROJECT CONTEXT .................................................................................................................................. 15
1.2 PROJECT THEORY OF CHANGE .......................................................................................................... 22
1.3 TARGET BENEFICIARY GROUPS AND BENEFICIARY NUMBERS .............................................. 32
2. BASELINE EVALUATION APPROACH AND METHODOLOGY ...................................................... 35
2.1 KEY EVALUATION QUESTIONS & ROLE OF THE BASELINE ...................................................... 35
2.2 OUTCOMES AND INTERMEDIATE OUTCOMES ............................................................................. 37
2.3 EVALUATION METHODOLOGY ........................................................................................................... 44
2.4 BASELINE DATA COLLECTION PROCESS ......................................................................................... 46
2.5 LIMITATIONS AND MITIGATION MEASURES OF THE BASELINE EVALUATION ................ 57
3. KEY CHARACTERISTICS OF BASELINE SAMPLES ................................................................................. 61
3.1 PROJECT BENEFICIARIES .......................................................................................................................... 61
3.2 REPRESENTATIVENESS OF THE LEARNING AND TRANSITION SAMPLES ACROSS REGIONS, AGE GROUPS, GRADES, IMPAIRMENT STATUS AND SEX OF THE BENEFICIARIES 61
3.3 BARRIERS ........................................................................................................................................................ 66
3.4 INTERSECTION BETWEEN KEY CHARACTERISTICS AND BARRIERS .................................... 68
3.5 APPROPRIATENESS OF PROJECT ACTIVITIES TO THE CHARACTERISTICS AND BARRIERS IDENTIFIED .......................................................................................................................................... 69
4. KEY OUTCOME FINDINGS .......................................................................................................................... 76
4.1 LEARNING OUTCOME ............................................................................................................................. 76
COMPARING MGCUBED AND NATIONAL SCORES: A NOTE FROM THE EVALUATOR ON GRADE-LEVEL ACHIEVEMENT .......................................................................................................................... 89
4.2 SUBGROUP ANALYSIS OF THE LEARNING OUTCOME .............................................................. 92
4.3 TRANSITION ................................................................................................................................................ 96
4.4 SUB-GROUP ANALYSIS OF THE TRANSITION OUTCOME ..................................................... 100
4.5 COHORT TRACKING AND TARGET SETTING FOR THE TRANSITION OUTCOME .... 102
4.6 VALIDATION OF THE THEORY OF CHANGE .............................................................................. 105
4.7 SUSTAINABILITY OUTCOME............................................................................................................... 114
5. KEY INTERMEDIATE OUTCOME FINDINGS ....................................................................................... 132
5.1 ATTENDANCE .......................................................................................................................................... 132
5.2 SCHOOL GOVERNANCE AND MANAGEMENT .......................................................................... 140
5.3 QUALITY OF TEACHING ...................................................................................................................... 147
GEC-T Baseline Report – Making Ghanaian Girls Great Project 3
5.4 COMMUNITY-BASED ATTITUDES AND BEHAVIOUR CHANGE ........................................... 155
5.5 SCHOOL-RELATED, GENDER-BASED VIOLENCE ........................................................................ 161
5.6 ECONOMIC EMPOWERMENT ............................................................................................................ 161
5.7 LIFE SKILLS .................................................................................................................................................. 162
5.8 GIRLS’ SELF-ESTEEM ................................................................................................................................. 174
6. CONCLUSION & RECOMMENDATIONS ............................................................................................ 178
6.1 CONCLUSIONS ........................................................................................................................................ 178
6.2 RECOMMENDATIONS ........................................................................................................................... 185
ANNEX 1: LOGFRAME .............................................................................................................................................. 190
ANNEX 2: OUTCOMES SPREADSHEET .............................................................................................................. 191
ANNEX 3: KEY FINDINGS ON OUTPUT INDICATORS ............................................................................... 192
ANNEX 4: BENEFICIARY TABLES .................................................................. Error! Bookmark not defined.
ANNEX 5: MEL FRAMEWORK ............................................................................................................................... 207
ANNEX 6: EXTERNAL EVALUATOR’S INCEPTION REPORT ..................................................................... 208
ANNEX 7: DATA COLLECTION TOOLS USED FOR BASELINE ................................................................ 209
ANNEX 8: DATASETS, CODEBOOKS AND PROGRAMS ............................................................................. 210
ANNEX 9: LEARNING TEST PILOT AND CALIBRATION ............................................................................ 230
ANNEX 10: SAMPLING FRAMEWORK ................................................................................................................ 231
ANNEX 11: CONTROL GROUP APPROACH VALIDATION ...................................................................... 232
ANNEX 12: EXTERNAL EVALUATOR DECLARATION ................................................................................ 237
ANNEX 13: PROJECT MANAGEMENT RESPONSE ......................................................................................... 238
ANNEX 14: FOUNDATIONAL SKILL GAPS: BY TREATMENT STATUS ................................................... 250
ANNEX 15: TEACHING QUALITY AND SCHOOL MANAGEMENT DISAGGREGATION ............... 258
ANNEX 16: DISAGGREGATION BY SCHOOLS WITH REMEDIAL COURSES ....................................... 263
ANNEX 17: FULL REPORT REFERENCES ............................................................................................................ 266
ANNEX 18: SOCIAL IMPACT CHILD PROTECTION POLICY .................................................................... 268

GEC-T Baseline Report – Making Ghanaian Girls Great Project 4
TABLES AND FIGURES
Table 1: Project design and intervention ................................................................................................................... 26 Table 2: Beneficiary calculations for MGCubed ....................................................................................................... 33 Table 3: Outcomes and Intermediate Outcomes of the Baseline Evaluation ................................................... 37 Table 4: Outcomes for measurement......................................................................................................................... 38 Table 5: Sustainability outcome for measurement................................................................................................... 41 Table 6: Revised ICCs with districts and schools .................................................................................................... 47 Table 7: Distribution of boys and girls to be tested with learning assessments per school .......................... 48 Table 8: Distribution of grades and subtasks for SeGRA and SegMA ................................................................ 49 Table 9: Data Collection Instruments ......................................................................................................................... 50 Table 10: Data collection instrument sample realized ............................................................................................ 55 Table 11: Risks and mitigation measures ................................................................................................................... 57 Table 12: Evaluation sample breakdown (by region) .............................................................................................. 62 Table 13: Evaluation sample breakdown (by grade) ................................................................................................ 62 Table 14: Evaluation sample breakdown (by age) .................................................................................................... 63 Table 15: Evaluation sample breakdown, by impairment ....................................................................................... 64 Table 16: Girls' characteristics ..................................................................................................................................... 65 Table 17: Potential barriers to learning and transition ........................................................................................... 67 Table 18: Examples of barriers to education by characteristic............................................................................. 68 Table 19: Project response to characteristics and barriers identified by the evaluator Error! Bookmark not defined. Table 20: Reading assessment subtask descriptions ................................................................................................ 77 Table 21: Literacy (EGRA/SeGRA) .............................................................................................................................. 79 Table 22: Numeracy subtask descriptions ................................................................................................................. 80 Table 23: Numeracy (EGMA/SeGMA) ........................................................................................................................ 81 Table 24: Foundational numeracy skills gaps among girls (%) ............................................................................... 83 Table 25: Foundational numeracy skills gaps among boys (%) .............................................................................. 84 Table 26: Foundational literacy skills gaps among girls ........................................................................................... 85 Table 27: Foundational literacy skills gaps among boys .......................................................................................... 86 Table 28: Grade level achievement methodology .................................................................................................... 87 Table 29: Numeracy grade level achievement by gender ...................................................................................... 87 Table 30: Literacy grade level achievement descriptions ....................................................................................... 88 Table 31: Literacy grade level achieved by gender .................................................................................................. 89 Table 32: Learning scores of key subgroups (marginalisation characteristics) ................................................. 93 Table 33: Learning scores of key barriers ................................................................................................................. 95 Table 34: Transition pathways ...................................................................................................................................... 97 Table 35: Transition rates among cohort girls ......................................................................................................... 97 Table 36: Benchmarking for the Transition Outcome ............................................................................................ 99 Table 37: Transition target setting ........................................................................................................................... 105 Table 38: Regression analysis of aggregate literacy and numeracy scores ...................................................... 106 Table 39: Groups of the Decomposition Analysis ................................................................................................ 110 Table 40: Sustainability indicators ............................................................................................................................. 114 Table 41: Changes needed for sustainability ............................................................................................................... 128 Table 42: Attendance outcomes ............................................................................................................................... 132 Table 43: Recorded attendance by grade ............................................................................................................... 133

GEC-T Baseline Report – Making Ghanaian Girls Great Project 5
Table 44: Recorded attendance by school ............................................................................................................. 134 Table 45: Attendance by grade and gender ............................................................................................................ 135 Table 46: Headcount as a percentage of students marked as present by grade and gender ..................... 136 Table 47: Attendance headcount as a percentage of enrolled students by grade and gender................... 137 Table 48: Community-involvement at the school level ....................................................................................... 143 Table 49: Cane usage ................................................................................................................................................... 144 Table 50: Teaching quality index components ....................................................................................................... 147 Table 51: Primary caregiver’s desired schooling for girls .................................................................................... 156 Table 52: Primary caregivers’ value of education views ...................................................................................... 158 Table 53: Housework and attendance ..................................................................................................................... 158 Table 54: Future technology stewardship ............................................................................................................... 161 Table 55: Recommendations on design and sustainability .................................................................................. 185 Table 56: Recommendations on measurement (Outcome and IO indicators) ............................................. 187 Table 57: Recommendations on sustainability indicators ................................................................................... 188 Table 58: Output indicators ................................................................................... Error! Bookmark not defined. Table 59: Baseline status of output indicators ..................................................... Error! Bookmark not defined. Table 60: Output indicator issues.......................................................................... Error! Bookmark not defined. Table 61: Direct beneficiaries ............................................................................ Error! Bookmark not defined. Table 62: Other beneficiaries ............................................................................ Error! Bookmark not defined. Table 63: Target groups - by school ................................................................ Error! Bookmark not defined. Table 64: Target groups - by age ...................................................................... Error! Bookmark not defined. Table 65: Target groups - by sub group .......................................................... Error! Bookmark not defined. Table 66: Target groups - by school status .................................................... Error! Bookmark not defined. Table 67: Quantitative data codebook .................................................................................................................... 210 Table 68: Categorization of KIIs and FGDs ............................................................................................................ 221 Table 69: Qualitative Codebook ............................................................................................................................... 225 Table 70: Balance between treatment and control schools for matching covariates .............................................. 233 Table 71: Balance across treatment and control schools ................................................................................... 234 Table 72: Balance across treatment and control girls and households ........................................................... 235
Figure 1: Key barriers to girls’ education ........................................................ Error! Bookmark not defined. Figure 2: Relation of Outputs to Intermediate Outcomes ......................... Error! Bookmark not defined. Figure 3: Power calculations and sample sizes to achieve an MDES of 0.25 SD ...................................................... 46 Figure 4: Revised Effect size from Baseline data ................................................................................................... 48 Figure 5: Quartile distribution of ORF scores of girls of the cohort .................................................................. 91 Figure 6: Transition rates among cohort girls, by age and treatment status ..................................................... 98 Figure 7: Transition rates among benchmark girls, by age and treatment status .......................................... 100 Figure 8: Decomposition analysis of key outcomes ............................................................................................. 111 Figure 9: Sustainability scorecard .............................................................................................................................. 116 Figure 10: Transition school plan ownership ......................................................................................................... 119 Figure 11: Technology functionality (%) .................................................................................................................. 122 Figure 12: Percent of head teachers reporting problems with equipment ..................................................... 123 Figure 13: Reason for last absence as reported by girls (%)............................................................................... 138 Figure 14: Reason for last absence as reported by caregivers (%) ............................................................................ 139 Figure 15: School management quality as reported by caregivers, by treatment status ............................. 141

GEC-T Baseline Report – Making Ghanaian Girls Great Project 6
Figure 16: School management quality as reported by caregivers, by gender of head teacher ................. 142 Figure 17: Cane visibility ............................................................................................................................................. 144 Figure 18: Percentage of classrooms where a teacher was observed using physical punishment ............ 145 Figure 19: Percentage of girls reporting teachers’ use of cane in class, by grade ......................................... 145 Figure 20: Girls reporting usage of physical punishment in past week, by impairment status (%) ............ 146 Figure 21: Teaching quality of observed teachers by treatment status (%) .................................................... 148 Figure 22: Teaching quality of observed teachers, by gender (%) ..................................................................... 149 Figure 23: Teaching quality of observed teachers in treatment schools, by facilitator status (%) ............ 150 Figure 24: Teaching quality as reported by girls (%) ............................................................................................ 151 Figure 25: MGCubed techniques prevalence in observed classrooms, by treatment and facilitator status (%) .................................................................................................................................................................................... 153 Figure 26: Primary caregivers’ consideration of girls’ views on education ..................................................... 157 Figure 27: Technology stewardship .......................................................................................................................... 160 Figure 28: Agency index scores by grade ................................................................................................................ 163 Figure 29: Agency by treatment status (%) ............................................................................................................. 163 Figure 30: Agency index scores by impairment status ......................................................................................... 164 Figure 31: Agency by impairment status (%) .......................................................................................................... 164 Figure 32: Self-efficacy index scores ......................................................................................................................... 165 Figure 33: Self-efficacy by treatment status (%) ..................................................................................................... 166 Figure 34: Self-efficacy index scores by impairment status ................................................................................. 166 Figure 35: Self-efficacy by impairment status (%) .................................................................................................. 167 Figure 36: Financial literacy life skills as reported by girls by treatment status (%) ...................................... 168 Figure 37: Financial literacy life skills as reported by girls, by impairment status ......................................... 169 Figure 38: Financial literacy life skills as reported by girls, by grade (%) ......................................................... 170 Figure 39: Girls' views on sexual and reproductive health (%) .......................................................................... 171 Figure 40: Changes in body development cited by girls by treatment status and impairment .................. 171 Figure 41: Changes in body development cited by girls by grade ..................................................................... 172 Figure 42: Girls' knowledge of menstruation by treatment status and impairment (%) .............................. 172 Figure 43: Girls' knowledge of menstruation by grade (%) ................................................................................ 173 Figure 44: Self-esteem index scores by grade and treatment status ................................................................ 175 Figure 45: Self-esteem answers by treatment status (%) .................................................................................... 175 Figure 46: Self-esteem index scores by grade and impairment status ............................................................. 176 Figure 47: Self-esteem responses by impairment status (%) .............................................................................. 176

GEC-T Baseline Report – Making Ghanaian Girls Great Project 7
ACRONYMS CEM Coarsened Exact Matching DDD Triple Difference DEO District Education Officers DFID Department for International Development
DID Difference in Difference DQA Data Quality Assurance
EGMA Early Grade Mathematics Assessment EGRA Early Grade Reading Assessment EMIS Education Management Information System
ET Evaluation Team ESP Education Strategic Plan
FCUBE Free Compulsory Universal Basic Education FGD Focus Group Discussion
FM Fund Manager GBP Great British Pound GDP Gross Domestic Product
GEC-1 Girls’ Education Challenge – First Round (2014-2017) GEC-T Girls’ Education Challenge - Transition
GEN Girl Education Network GEO Girls Education Officer
GES Ghana Education Service GESI Gender Equality and Social Inclusion GEU Girls Education Unit GEO Girls Education Officer GHS Ghanaian Cedi GPI Gender Parity Index GPS Global Positioning System HHS House Hold Survey HOH Head of Household
ICC Intra Cluster Correlation ICT Information and Communication Technology IRB Institutional Review Board IRR Inter-Rater Reliability JHS Junior High School KII Key Informant Interview
LOI Language of Instruction LSAS Language Spoken at School
MDES Minimum Detectable Effect Size MEL Monitoring, Evaluation, and Learning
MGCubed Making Ghanaian Girls Great
GEC-T Baseline Report – Making Ghanaian Girls Great Project 8
MOE Ministry of Education NAEP National Assessment of Educational Progress
NAR Net Attendance Ratio NCTM National Council of Teachers of Mathematics NEAU National Education Assessment Unit
NER Net Enrolment Rate NGO Non-Governmental Organization NIH National Institutes of Health NPP National Patriotic Party ODK Open Data Kit
OOSG Out-of-School Girls ORF Oral Reading Fluency PCG Primary Care Giver PTA Parent Teacher Association RCT Randomised-Control Trial RTI Response to Intervention
SeGMA Secondary Early Grade Mathematics Assessment SeGRA Secondary Early Grade Reading Assessment
SI Social Impact, Inc. SMC School Management Committee SRH Female Sexual Reproductive Health
STEM Science, Technology, Engineering and Math TIMSS Trends in International Mathematics and Science Study
ToC Theory of Change T-TEL Transforming Teacher Education and Learning TVET Technical Vocational Education and Training
UNESCO United Nations Educational, Scientific and Cultural Organisation UNICEF United Nations Children’s Fund
USAID United States Agency for International Development VF Varkey Foundation
GEC-T Baseline Report – Making Ghanaian Girls Great Project 9
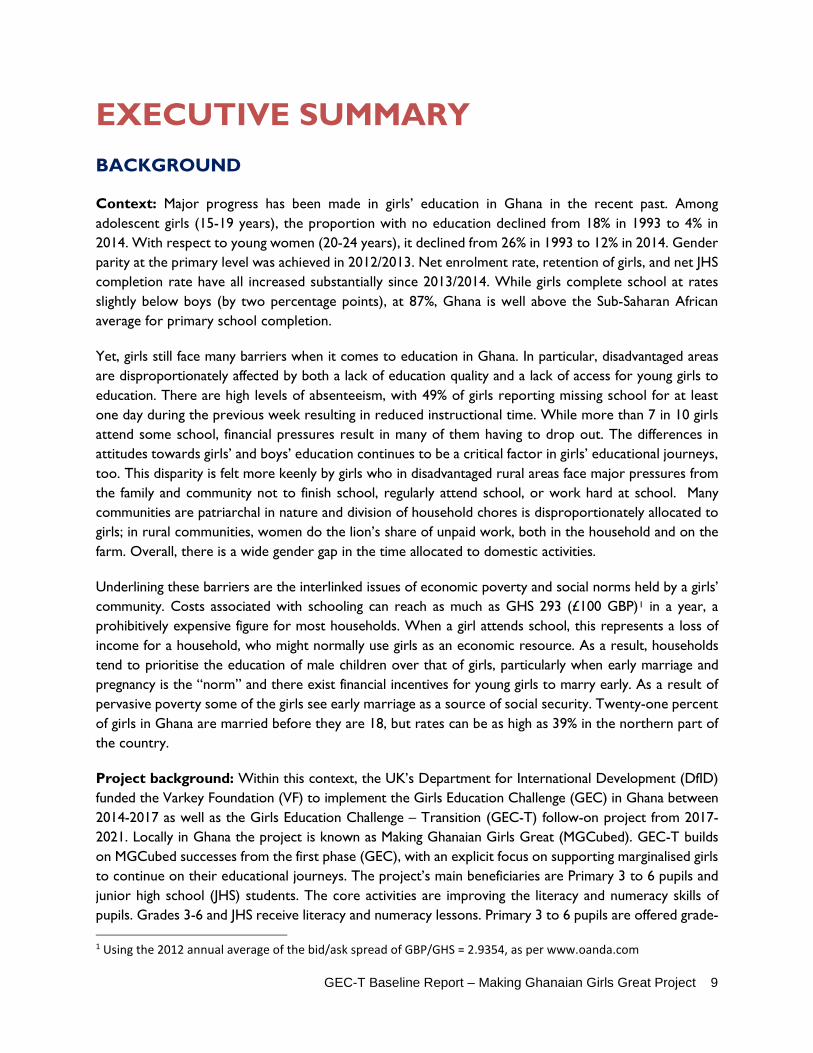
EXECUTIVE SUMMARY BACKGROUND
Context: Major progress has been made in girls’ education in Ghana in the recent past. Among adolescent girls (15-19 years), the proportion with no education declined from 18% in 1993 to 4% in 2014. With respect to young women (20-24 years), it declined from 26% in 1993 to 12% in 2014. Gender parity at the primary level was achieved in 2012/2013. Net enrolment rate, retention of girls, and net JHS completion rate have all increased substantially since 2013/2014. While girls complete school at rates slightly below boys (by two percentage points), at 87%, Ghana is well above the Sub-Saharan African average for primary school completion.
Yet, girls still face many barriers when it comes to education in Ghana. In particular, disadvantaged areas are disproportionately affected by both a lack of education quality and a lack of access for young girls to education. There are high levels of absenteeism, with 49% of girls reporting missing school for at least one day during the previous week resulting in reduced instructional time. While more than 7 in 10 girls attend some school, financial pressures result in many of them having to drop out. The differences in attitudes towards girls’ and boys’ education continues to be a critical factor in girls’ educational journeys, too. This disparity is felt more keenly by girls who in disadvantaged rural areas face major pressures from the family and community not to finish school, regularly attend school, or work hard at school. Many communities are patriarchal in nature and division of household chores is disproportionately allocated to girls; in rural communities, women do the lion’s share of unpaid work, both in the household and on the farm. Overall, there is a wide gender gap in the time allocated to domestic activities.
Underlining these barriers are the interlinked issues of economic poverty and social norms held by a girls’ community. Costs associated with schooling can reach as much as GHS 293 (£100 GBP)1 in a year, a prohibitively expensive figure for most households. When a girl attends school, this represents a loss of income for a household, who might normally use girls as an economic resource. As a result, households tend to prioritise the education of male children over that of girls, particularly when early marriage and pregnancy is the “norm” and there exist financial incentives for young girls to marry early. As a result of pervasive poverty some of the girls see early marriage as a source of social security. Twenty-one percent of girls in Ghana are married before they are 18, but rates can be as high as 39% in the northern part of the country.
Project background: Within this context, the UK’s Department for International Development (DfID) funded the Varkey Foundation (VF) to implement the Girls Education Challenge (GEC) in Ghana between 2014-2017 as well as the Girls Education Challenge – Transition (GEC-T) follow-on project from 2017-2021. Locally in Ghana the project is known as Making Ghanaian Girls Great (MGCubed). GEC-T builds on MGCubed successes from the first phase (GEC), with an explicit focus on supporting marginalised girls to continue on their educational journeys. The project’s main beneficiaries are Primary 3 to 6 pupils and junior high school (JHS) students. The core activities are improving the literacy and numeracy skills of pupils. Grades 3-6 and JHS receive literacy and numeracy lessons. Primary 3 to 6 pupils are offered grade-
1 Using the 2012 annual average of the bid/ask spread of GBP/GHS = 2.9354, as per www.oanda.com

GEC-T Baseline Report – Making Ghanaian Girls Great Project 10
based lessons in maths and English. Basic and Advanced afterschool remedial sessions are delivered to girls and boys, as are afterschool life skills sessions in the form of Wonder Women, Boys Boys, and mixed-gender clubs, where both girls and boys are introduced to a variety of role models. Out of school girls also participate in the sessions and are given the opportunity to join in the appropriate level of numeracy and literacy lessons to support their return back to mainstream schooling. To enhance teaching quality and school leadership, the project offers training for teachers and school heads. Ghana Education Service (GES) officials are trained to enhance their capacity and support system strengthening. Parents and communities are engaged to create sustained buy-in to the project and enable attitudinal change to girls’ education. The project estimates that it will reach about 4,500 direct beneficiaries and 3,600 indirect beneficiaries.
Theory of change: The project’s Theory of Change (ToC) operates on the assumption that transition to secondary school is the key to marginalised girls furthering their education and subsequently living healthy, fulfilled lives with the ability to sustain themselves materially and socially. To ensure this transition occurs and is sustained, key actors involved in the educational journey of a girl need to gain the capacity, opportunity and motivation to support this process. The project’s activities are designed to address the key barriers to girls fulfilling their education potential. These barriers have a direct impact on enrolment, retention, attendance, and learning outcomes for girls in later years. In order to summarise these barriers, the project distinguishes between “demand-side” and “supply-side” barriers which act to prevent girls from accessing and completing a quality education. At base, financial barriers act as a constraint to both investment in education at household and system levels, impacting access and learning environment quality, respectively.
The ToC holds that if the project increases the quality and provision of educational content, enhances in-school teaching in core subjects through the use of modern pedagogy, enables school leaders to create and sustain positive learning environments through well-managed schools that provide teachers with the opportunity to teach to the best of their ability, supports girls to continue their education through increased empowerment, focusing on improving levels of self-esteem, including self-belief and self-efficacy, targets community-based barriers to girls’ transition and academic achievement through attitudinal and behavioural change, supports the development of sustainable government capacity at district level to develop and sustain systems to facilitate school management and transition, and sustain the cycle so that intergenerational change can be maintained, then the quantity and quality of education provision will increase and attendance and learning outcomes will improve.
DESIGN
Evaluation Approach: The evaluation team (ET) employed a quasi-experimental, longitudinal panel design that tracked a “joint sample” (a cohort) of control and treatment girls over three years. The ET selected the statistical matching method known as coarsened exact matching (CEM) to construct a valid counterfactual control group, and utilised a difference in difference approach (DID) to calculate the outcomes of interest. The evaluation sampled 19 girls and 7 boys in each of 72 treatment schools and 72 control schools, for a total sample size of 3,744. Students were sampled based on four marginalization criteria: the number of siblings, distance traveled to school, overage for their grade, and significant absences in the past school term. The ET employed a multitude of different quantitative data collection

GEC-T Baseline Report – Making Ghanaian Girls Great Project 11
instruments including four learning assessments (two in reading, two in mathematics), a survey for girls, a household survey, a survey for head teachers of schools, a classroom observation tool, and an attendance spot check tool. Qualitative data collection was carried out in the form of focus group discussions (FGD) with girl and boy students, and female and male caregivers, as well as key informant interviews (KII) with teachers and Ghana Education Services (GES) officials. Data collection was carried out in seven districts of Volta and Greater Accra regions over four weeks in February-March 2018.
OUTCOMES
Learning: Girls and boys in treatment and control schools in the cohort do about the same on learning tests though generally, students do much better overall in maths than in reading. There is wide variation in performance across maths and reading subtasks, with students doing well in number identification and quantity discrimination (EGMA) and familiar words (EGRA) subtasks, and doing particularly badly in missing numbers and subtraction (EGMA) and letter sound identification and invented word (EGRA) subtasks. Though students strongly progress in scores with age, girls and boys are well behind in their grade-level for literacy and numeracy, with most falling several grade levels below where they should be, according to GEC-T-designed grade-level cutoffs. When it comes to barriers to learning, students with the lowest scores are those with disabilities, who are poor, who are mothers, or who have a mother tongue different from the language of instruction. Regression analysis conducted on learning scores shows statistically significant positive associations between aggregate learning scores and various non-cognitive abilities (self-esteem, self-efficacy, and agency), encouragement from a teacher in the classroom, reading at home, a safe school environment, computers at school, active PTAs at a school, school-level extracurricular activities, and more visits by a District Circuit Supervisor. Factors that have statistically significant negative associations with learning included cognitive impairment, differential treatment of girls and boys at school, low support to continue to study, having an illiterate head of household or caregiver, being a mother, poverty, and when a teacher used a language other than the language of instruction in class. Among observable factors, grade progression, non-cognitive skills, district-level factors, and school management are the strongest drivers of learning scores among girls.
Transition: Just over four in five girls (82-83%) in both the cohort and the benchmarked community samples successfully transition in school each year, though persistent barriers remain. Girls transition at increasing rates until a peak of about 93% transition at age 14, at which point transition begins to decline. Unsuccessful transition is largely due to remaining out of school and repeating a grade. Qualitative events elucidated the major barriers to transition which were, first and foremost, poverty followed by household duties. Pregnancy and early marriage were two themes that came up throughout qualitative and quantitative data collection and represent a not insignificant barrier to transition as well. Of slightly lower importance, distance to school and impairment were cited as barriers to transition. Regression analysis shows that cognitive impairment, a high chore burden, and increased agency are all associated with lower transition, while active PTAs are associated with higher transition. Girls in Kadjebi, Ningo Prampram, and Nkwanta South all transition at significantly lower rates than girls in other districts. Among observable factors, impairment, school environment, and school management are the strongest drivers of transition.
Sustainability: Given the baseline status of the program, the MGCubed project scores a 1.0/4.0 at the community, school, and system levels on the Sustainability Scorecard. Though many of the baseline levels

GEC-T Baseline Report – Making Ghanaian Girls Great Project 12
of the sustainability indicators are relatively high, the MGCubed project has the potential to increase these levels and achieve sustainability in many areas. Qualitative and quantitative data analysis shows high levels of knowledge retention among beneficiaries of MGCubed trainings, particularly GES officials and teachers. While support for girls’ education in the community remains very high, girls’ agency may not matter as much as previously though and support to attend school remains relatively low. Thirty-eight percent of MGCubed schools had a transition plan in place, though the exact nature of these plans was informal and highly variable across schools. Head teachers, as opposed to PTA/SMC and parents, report that they themselves are overwhelmingly responsible for developing and executing transition plans as well as managing the MGCubed technology. Qualitative and quantitative data suggests technology breakdowns are not infrequent and security-related issues were reported among 10% of treatment schools. Finally, though GES officials have strongly positive views of MGCubed, there are mixed feelings about the sustainability of policy and programmatic gains after the program ends.
KEY GESI ANALYSES
Gender analysis: Findings in the report show that the project is doing well to address gender issues and barriers, evidenced by learning data that show relatively similar results between boys and girls, and supplemented by qualitative data that suggests girls are being considered more in the community when it comes to education than they have been in the past. However, differential treatment of girls and boys at school matters. In regression analyses, if a girl stated that she felt girls and boys were treated differently at school by teachers, it was associated significantly with lower learning scores. The ET finds that female sexual and reproductive health (SRH) issues are being well communicated. Large proportions of girls are aware of changes to their bodies, know who to speak to when they have questions, and have increased knowledge of SRH issues as they age. However, Pregnancy remains a barrier in the community. Among teachers, male teachers are associated with better quality teaching. This finding does not necessarily mean that men are better teachers or directors, but may indicate that female teachers have disproportionate access to training, materials, and/or the support that they need compared to their male counterparts. While caregivers report that male-headed schools have higher management quality, female-headed schools have better community involvement indicators. As far as school management, The cane is used more on boys than on girls; cane use on girls is astoundingly low in MGCubed schools.
Impairment analysis: Analysis of sampled girls of the baseline evaluation shows that 6.85% of the sample is considered impaired, or impaired. The vast majority of these girls fall under “cognitive impairment,” which in many cultures may not be considered impaired, as it is difficult to physically detect. Key findings include the fact that impaired girls face more barriers on average than their non-impaired counterparts. They had the highest percentage of having high chore burdens, not receiving support to stay in school, and attending school less than half the time. Limited qualitative data demonstrated that some impaired girls feel shame in attending school. Further, cognitive impairment, in particular, has strong negative associations with learning and transition in regression models. When looking at the decomposition model, among all observable factors that affect transition, impairment was one of the strongest. Classroom management disfavors impaired girls. In the classroom, an impaired girl reported that she was twice as likely to be caned compared to a non-impaired girl in the past week. Finally, impaired girls have lower agency, especially around education-related decisions.

GEC-T Baseline Report – Making Ghanaian Girls Great Project 13
Age analysis: There is a strong learning score progression with age. As expected, as girls and boys get older, their learning scores improve significantly. However, transition peaks at age 14. Given that 14 is the average age for the critical transition point between primary and JHS, this indicates that transition point remains a critical time in a girl’s educational journey. The cane is used much more in P4-P5 and then again in JHS1. Knowledge of life skills, such as financial literacy and sexual reproductive health, improves with age. Further, as they age, girls have stronger agency and self-efficacy.
INTERMEDIATE OUTCOMES
Attendance: Attendance taking processes and attendance itself were generally good, but there was important variation among gender and type of class. Girls had better attendance than boys across treatment and control, grade, and grade-level or MGCubed classes. One in every eight MGCubed classes was over-attended – more students attended than were officially recorded in class registers.
School management: According to caregivers, control schools and schools with male head teachers have better management quality than treatment and female-headed schools; however, treatment and female-headed schools have substantially better indicators around community involvement in school. Female-headed schools are more likely to have PTAs and SMCs, and they meet more often. Use of the cane among school type, sex, and grade varied substantially: it was twice as likely to be used in control schools compared to treatment schools. The cane was used in 12.5% of treatment schools, but nearly double that rate for control schools. Qualitative data from students suggests that use of the cane is frequent and considered acceptable.
Teaching quality: Most parents and students characterize teaching quality as high; control schools and male teachers performed better at baseline. The largest differences in teaching quality where control outperformed treatment schools were in a teacher making eye contact with students, successfully managing unruly behaviour, including boys and girls equally in class, using different teaching resources and strategies, possessing lesson notes, and appearing to feel comfortable while teaching. Among treatment schools, non-facilitators have higher teaching quality indicators than facilitators. Facilitators performed worse than non-facilitators in most of the same ways that treatment schools performed badly when compared to control schools, but they also performed worse on indicators such as reading well in front of the class, increasing student participation, and being understandable by the students.
Community attitudes: Community attitudes towards girls’ education are very strong; nevertheless, qualitative data suggest barriers such as pregnancy, financial constraints, and household duties remain high. More than 7 in 10 caregivers would like their girls to achieve a university degree or higher and also believe it is worth investing in a girl’s education even when funds are limited.
Life skills: There was wide variation among girls’ financial literacy and SRH knowledge; however, this improves significantly as a girl ages. In the area of non-cognitive abilities, girls have substantial agency over the educational decisions in their lives, though much less so for impaired girls. All girls have relatively high self-efficacy and self-esteem. Half of girls said they are involved in the decision as to whether to go to school or continue studying, and this increases significantly when it comes to what they will do with their lives after they finish their studies.
GEC-T Baseline Report – Making Ghanaian Girls Great Project 14
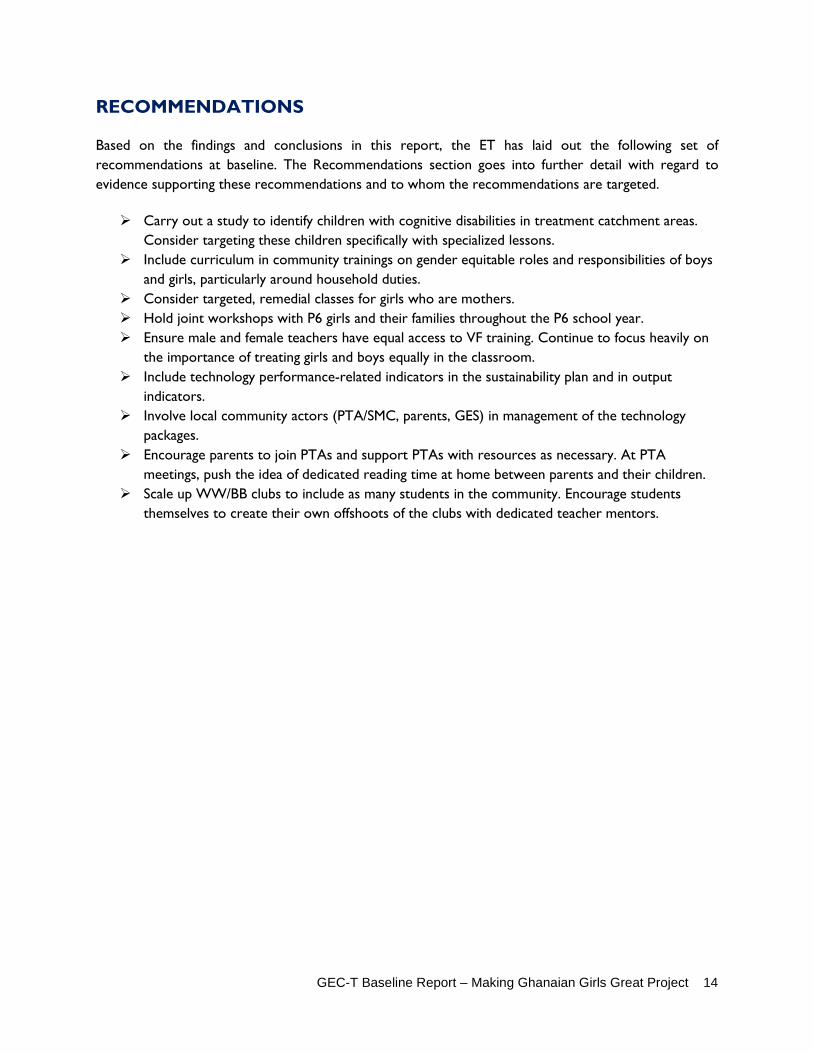
RECOMMENDATIONS
Based on the findings and conclusions in this report, the ET has laid out the following set of recommendations at baseline. The Recommendations section goes into further detail with regard to evidence supporting these recommendations and to whom the recommendations are targeted. Carry out a study to identify children with cognitive disabilities in treatment catchment areas.
Consider targeting these children specifically with specialized lessons. Include curriculum in community trainings on gender equitable roles and responsibilities of boys
and girls, particularly around household duties. Consider targeted, remedial classes for girls who are mothers. Hold joint workshops with P6 girls and their families throughout the P6 school year. Ensure male and female teachers have equal access to VF training. Continue to focus heavily on
the importance of treating girls and boys equally in the classroom. Include technology performance-related indicators in the sustainability plan and in output
indicators. Involve local community actors (PTA/SMC, parents, GES) in management of the technology
packages. Encourage parents to join PTAs and support PTAs with resources as necessary. At PTA
meetings, push the idea of dedicated reading time at home between parents and their children. Scale up WW/BB clubs to include as many students in the community. Encourage students
themselves to create their own offshoots of the clubs with dedicated teacher mentors.

GEC-T Baseline Report – Making Ghanaian Girls Great Project 15
1. BACKGROUND TO PROJECT 1.1 PROJECT CONTEXT
Project summary
The second phase of the Making Ghanaian Girls Great! (MGCubed) GEC-T project runs over a four-year period from May 2017 – August 2021. Following the project’s Inception Phase (May – September 2017) project implementation started at the beginning of the 2017/18 academic year in Ghana. GEC-T builds on the MGCubed pilot’s success, with an explicit focus on supporting marginalised girls to continue on their educational journeys.
The project’s main beneficiaries are Primary 3 to 6 pupils (boys and girls) and girls junior high school (JHS) grade 1. The core offering are improving the literacy and numeracy skills of pupils. Grades 3 – 6 receive basic and intermediate numeracy and literacy lessons, while JHS also receives literacy and numeracy lessons. Primary 3 to 6 pupils are offered grade-based lessons in maths and English. Basic and Advanced after school sessions are delivered to girls in both primary school and JHS. Afterschool life skills sessions are delivered in the form of Wonder Women, Boys Boys, and mixed-gender sessions, where both girls and boys are introduced to a variety of role models. Out of school girls also participate in the sessions and are given the opportunity to join in the appropriate level of numeracy and literacy lessons to support their return back to mainstream schooling.
Through a comprehensive understanding of the barriers to transition (in this project understood variously as any transition from one school year to the next or a return to mainstream education), the second phase of MGCubed extends targeted support to key stakeholders within the education ecosystem. The project recognises that while individual-level attitudinal and behavioural factors (such as academic achievement, the ability to construct a plan for the future, and financial management) play a critical role in facilitating the life chances of marginalised girls, it is essential to engage with the less tangible and harder-to-measure systemic and community-level attitudes and behaviours which prevent marginalised girls from realising their potential. To enhance teaching quality and school leadership, the project offers training for teachers and school heads. Ghana Education Service (GES) officials are trained to enhance their capacity and support system strengthening. Parents and communities are engaged to create sustained buy-in to the project and enable attitudinal change to girls’ education. Cash support will be provided to families through girls to ensure they transition to secondary school.
Project context
Major progress has been seen in girls’ education in Ghana. According to the UNFPA2, among adolescent girls (15-19 years), the proportion with no education declined from 18% in 1993 to 4% in 2014. With respect to young women (20-24 years), it declined from 26% in 1993 to 12% in 2014. The
2 UNFPA (2016) Situation Analysis of Adolescent Girls and Young Women in Ghana – Synthesizing Data to Identify and Work with the Most Vulnerable Young Women. New York: UNFPA.
GEC-T Baseline Report – Making Ghanaian Girls Great Project 16
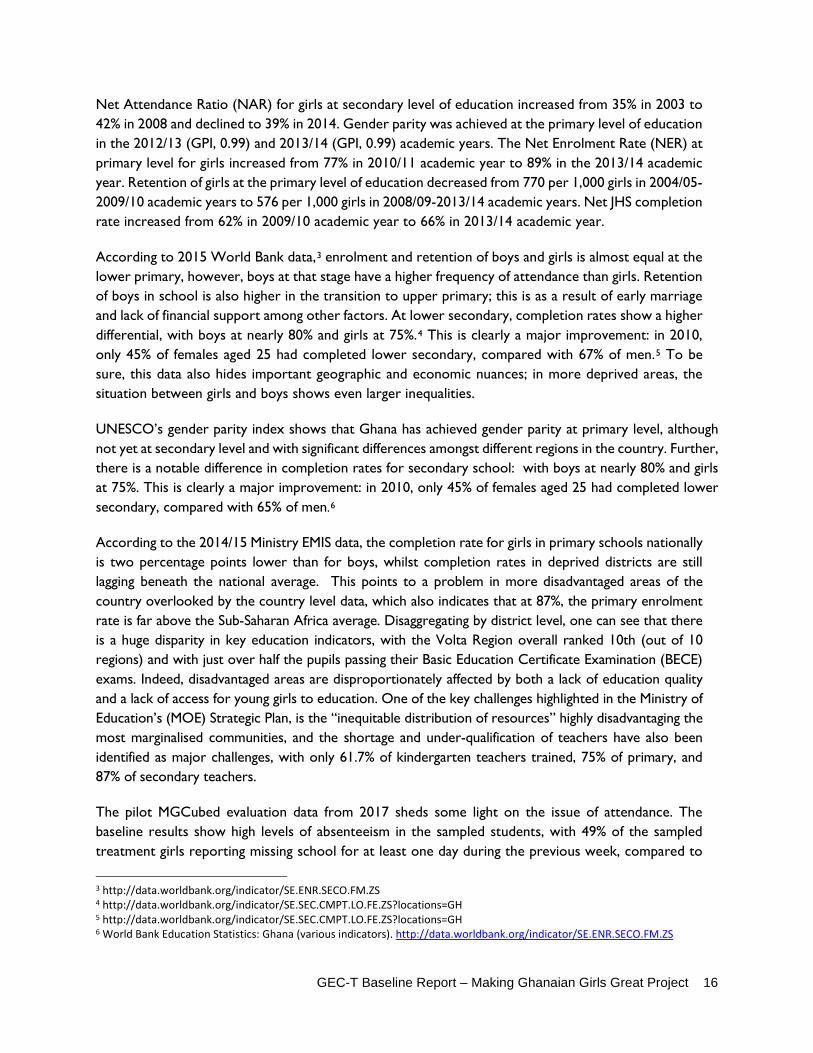
Net Attendance Ratio (NAR) for girls at secondary level of education increased from 35% in 2003 to 42% in 2008 and declined to 39% in 2014. Gender parity was achieved at the primary level of education in the 2012/13 (GPI, 0.99) and 2013/14 (GPI, 0.99) academic years. The Net Enrolment Rate (NER) at primary level for girls increased from 77% in 2010/11 academic year to 89% in the 2013/14 academic year. Retention of girls at the primary level of education decreased from 770 per 1,000 girls in 2004/05-2009/10 academic years to 576 per 1,000 girls in 2008/09-2013/14 academic years. Net JHS completion rate increased from 62% in 2009/10 academic year to 66% in 2013/14 academic year.
According to 2015 World Bank data,3 enrolment and retention of boys and girls is almost equal at the lower primary, however, boys at that stage have a higher frequency of attendance than girls. Retention of boys in school is also higher in the transition to upper primary; this is as a result of early marriage and lack of financial support among other factors. At lower secondary, completion rates show a higher differential, with boys at nearly 80% and girls at 75%.4 This is clearly a major improvement: in 2010, only 45% of females aged 25 had completed lower secondary, compared with 67% of men.5 To be sure, this data also hides important geographic and economic nuances; in more deprived areas, the situation between girls and boys shows even larger inequalities.
UNESCO’s gender parity index shows that Ghana has achieved gender parity at primary level, although not yet at secondary level and with significant differences amongst different regions in the country. Further, there is a notable difference in completion rates for secondary school: with boys at nearly 80% and girls at 75%. This is clearly a major improvement: in 2010, only 45% of females aged 25 had completed lower secondary, compared with 65% of men.6
According to the 2014/15 Ministry EMIS data, the completion rate for girls in primary schools nationally is two percentage points lower than for boys, whilst completion rates in deprived districts are still lagging beneath the national average. This points to a problem in more disadvantaged areas of the country overlooked by the country level data, which also indicates that at 87%, the primary enrolment rate is far above the Sub-Saharan Africa average. Disaggregating by district level, one can see that there is a huge disparity in key education indicators, with the Volta Region overall ranked 10th (out of 10 regions) and with just over half the pupils passing their Basic Education Certificate Examination (BECE) exams. Indeed, disadvantaged areas are disproportionately affected by both a lack of education quality and a lack of access for young girls to education. One of the key challenges highlighted in the Ministry of Education’s (MOE) Strategic Plan, is the “inequitable distribution of resources” highly disadvantaging the most marginalised communities, and the shortage and under-qualification of teachers have also been identified as major challenges, with only 61.7% of kindergarten teachers trained, 75% of primary, and 87% of secondary teachers.
The pilot MGCubed evaluation data from 2017 sheds some light on the issue of attendance. The baseline results show high levels of absenteeism in the sampled students, with 49% of the sampled treatment girls reporting missing school for at least one day during the previous week, compared to
3 http://data.worldbank.org/indicator/SE.ENR.SECO.FM.ZS 4 http://data.worldbank.org/indicator/SE.SEC.CMPT.LO.FE.ZS?locations=GH 5 http://data.worldbank.org/indicator/SE.SEC.CMPT.LO.FE.ZS?locations=GH 6 World Bank Education Statistics: Ghana (various indicators). http://data.worldbank.org/indicator/SE.ENR.SECO.FM.ZS

GEC-T Baseline Report – Making Ghanaian Girls Great Project 17
only 42% of the treatment boys. According to the evaluation, this appears to confirm that instructional time is for girls (and boys) generally reduced. Regular attendance by students in a sample of 10 schools was measured officially within school register records at 84.2% for girls and 80.2% for boys, although these are likely to be inflated. Random spot-checks performed during January 2014 in a sample of schools confirmed that girls’ school attendance on average was 82%.
Girls clearly face problems in remaining in school. The pilot evaluation findings saw that of the OOSG sample, 94% of the girls expressed a desire to go back to school, although 9% of the respondents (aged 14 years and younger) already have a child. Twenty-eight percent of the sampled respondents had never been to school previously, suggesting that the majority of out-of-school girls do have some history of education but cannot always afford to complete their studies. Thirty-five percent of respondents cited “lack of finances” as the main reason for not being in school, although 19% cited the fact that their “parents did not want them in school.” The differences in attitudes towards girls’ and boys’ education continues to be a critical factor in girls’ educational journeys.
This disparity is felt more keenly by girls who in disadvantaged rural areas face major pressures from the family and community not to finish school, regularly attend school, or work hard at school. The communities MGCubed operates in are predominantly patriarchal and division of household chores is disproportionately allocated to girls. It is an acceptable norm and routine for girls in the community to complete all house chores linked with girls before going to school each day. Girls are obliged to complete about two-thirds of domestic tasks in the morning before going to school, and are required to complete about 80% of domestic tasks after school. The workload in most cases is enormous and has the potential to make the girl either late to school or miss school for such days. This was oft-cited as a reason for girls not to attend Wonder Women, and arguably why the provision of snacks at Wonder Women was so popular – this loss of labour time was a cost that was offset by the receipt of food.
In rural communities, women do the lion’s share of unpaid work, both in the household and on the farm. Overall, there is a wide gender gap in the time allocated to domestic activities: while 65% of men spend from 0 to 10 hours per week on domestic activities, 89% of women spend 10 hours per week or more. The average amount of time that women spend per week on domestic activities is greater than that of men, even if women spend almost the same amount of time as men on productive activities. This pattern is also found in Ghanaian youth: nearly two-thirds of young rural men spend between 0 and 10 weekly hours on domestic work, whereas over a quarter of young rural women spend 50 or more hours on domestic work.7
Underlining these barriers are the interlinked issues of economic poverty and social norms held by a girls’ community. The former acts as a tangible constraint on a household’s ability to send a girl to school: the costs associated with schooling can reach as much as around GHS 293 (£100 GBP) in a year,8 a figure most households in disadvantaged areas struggle to afford. Secondly, when a girl attends school this represents a loss of income for a household, who might normally use girls as an economic resource. As a result,
7 Gender, Equity and Rural Development Division, FAO (2012), Gender Inequalities in Rural Employment in Ghana: An Overview, Rome: FAO 8 Ibid

GEC-T Baseline Report – Making Ghanaian Girls Great Project 18
households tend to prioritise the education of male children over that of girls, particularly when early marriage and pregnancy is the “norm” and there exist financial incentives for young girls to marry early.
As a result of pervasive poverty some of the girls see early marriage as a source of social security. Twenty-one percent of girls in Ghana are married before they are 18, but rates can be as high as 39% in the northern part of the country,9 though this rate has seen a significant decrease from the 1990s.10 Early marriage is attractive as parents will be saved the burden of paying fees and catering for a girl’s basic school needs. Further, it is a way of avoiding shame within the community associated with pre-marital pregnancy.11 (Note that 14% of girls aged 15-19 in Ghana have begun having children,12 and girls from poor households are nearly four times more likely to be married before the age of 18.13) The vast majority of these communities still practice exchange marriage or still adhere to an outmoded practice where families engage in mutual promise or contract for future marriage of their girls, particularly in the Volta Region. This consequently provides a seemingly inevitable path for girls, cutting short their aspiration and expectations. Boys on the other hand do not feel the same societal pressure of early marriage. Boys are required to reach a certain age and bear the responsibilities of parents and a potential wife before beginning to discuss issues about marriage. This leads to an asymmetry in the age of married couples, with older men taking young girls as their wives.
Regional focus
In Ghana, there are existing donor and NGO girls’ education interventions (e.g. USAID, UNICEF, DFID, Camfed), but these are heavily concentrated in the north of the country. MGCubed concentrates on seven districts in two specific regions –Volta (Nkwanta South and Kadjebi districts) and Greater Accra (Ada East, Ada West, Ningo Prampram, Adenda, and Shai Osu-Doku districts). These districts appear on the government’s list of most deprived communities and were approved by the Ghana Education Service during consultation as meriting additional inputs.
The Greater Accra region covers the smallest area of all the regions, with 1.4% of the total land area of Ghana. It is the second most populated region (second to the Ashanti Region), with a population of over 4 million (2010), accounting for 16.3% of Ghana’s total population. It is also the most urbanized region in the country with 87.4% of its total population living in urban centres including the capital Accra and port city Tema. The predominant languages are Ga and Dangme (of the Ga-Dangme family), with Akan (the country’s de facto lingua franca) widely understood. The Volta Region, situated along the Togolese border, is home to the Ewe (73.8%) and Guan (8.1%) ethnic groups (with Guan encompassing the Lolobi, Likpe, Akpafu, Buem, and Nkonya linguistic sub-groups), and also the Gurma, originating from Burkina Faso (11%). It is a predominantly rural region, with just over 20% of the population living in urban areas centred around Keta, Ho, and Hohoe.
9 UNICEF, State of the World’s Children, 2016. 10 Ghana, Demographic Health Survey, 2014 11 Women in Law and Development in Africa (WiLDAF Ghana) Scoping study for Parliamentary Advocacy Programme on Combating Early and Forced Marriage in Ghana, March 2014 12Ghana, Demographic Health Survey, 2014 13 Ghana, MICS, 2011

GEC-T Baseline Report – Making Ghanaian Girls Great Project 19
Families in the Volta districts are chiefly subsistence farmers, while those in Greater Accra districts are largely subsistence fishermen and/or farmers. School gender parity is 0.78 and 0.87 in the Nkwanta South and Ada districts, respectively. Drop-out rates are higher for girls (46% vs. 34% in Nkwanta),14 driven by frequent early marriage, child labour, and youth pregnancy. Another major barrier facing students in the selected districts is the scarcity of teachers (both trained or untrained).
UNICEF’s District League Table, which presents an annual multi-sectoral, integrated assessment of how Ghana is developing across all its 216 Districts, indicates that Volta is the second worst performing region, and Greater Accra is the second best.15 Behind the high level statistics lie major variations within regions, however. Greater Accra is home to two major cities (Accra, Tema) but also encompasses marginalised coastal communities who are poorly served by bad roads. All the districts MGCubed operates in are classified as underperforming in the BECE examinations by the Ministry of Education, with 2011 data indicating that Greater Accra has a far lower proportion of underperforming districts (25%) than Volta (86%). When broken down by school, these figures are 56% and 80%. There are clear differences in performance in school based on gender: in Volta 1 in 3 boys graduates from primary school, while for girls this figure is 1 in 10.16
Policy context
The Government of Ghana spends just over 20% of its national expenditure on education (approximately 6% of GDP). The 1992 Constitution of the Republic of Ghana (Article 25) guarantees the right of all persons to equal educational opportunities and facilities; free primary education was introduced in Ghana in 1995 under the Free Compulsory Universal Basic Education (FCUBE) programme.
In more recent times, the Government of Ghana’s education strategy was outlined in the Education Strategic Plan (ESP) 2003-15, and more recently the ESP 2010-2017. The 2003-2015 ESP focused on four key areas: equitable access, quality of education, education management, and science and technology education and training. A 2004 White Paper on Education Reforms aimed to build upon the ESP commitments, to ensure that high quality free basic education is provided to all children and that “secondary education is more inclusive and appropriate to the needs of young people and the demands of the Ghanaian economy.” Ghana was also a recipient of Fast Track Initiative financing ($19m USD) between 2007 and 2010. This is in line with the National Vision for Girls’ Education, published in 2002.
The education system in Ghana is decentralised, with District Education Offices (DEOs) performing the district-level responsibilities of the Ghana Education Services (GES). The establishment of the Girls Education Unit (GEU) in 1997, structured from the national through the regional to the district under Ghana Education Service, is a demonstration of a determination to focus on girl’s education. At decentralized levels, every region and district has a Girls’ Education Officer (GEO). In practice however, the GEU and its respective GEOs are very under resourced and unable to carry out their mandate effectively despite high-profile partnerships with UNICEF.
14 Ghana Education Service EMIS database 15 UNICEF Ghana (2016) District League Table 2017. Accra: UNESCO/MoE 16 Ministry of Education (2011), Policy Evaluation Studies in GES Public Basic Schools (Underperforming Schools and Tracking of Poverty), Monitoring and Evaluation Unit. Accra: UNESCO/MoE

GEC-T Baseline Report – Making Ghanaian Girls Great Project 20
The education policy context is closely related to the domains of the Ministry of Gender, Children, and Social Protection, including: child labour, sexual violence and abuse, and acute poverty. It is responsible for the National Gender Policy (2015). In addition to the international laws related to children’s rights that protect girls and boys from discrimination and physical and sexual abuse that apply to Ghana, there are comprehensive laws, statutes, and regulations in Ghana that protect children from any form of sexual abuse. These include the 1992 Constitution, the Children’s Act (1998, Act 560), the Criminal Code (Amendment) Act (1998, Act 554), and the Code of Professional Conduct of the Ghana Education Service (GES). Each of these legal frameworks contains provisions for the protection of children against sexual abuse and violence.
In Ghana, teacher training and teacher recruitment are recognised by the government, though a specific focus on female teachers is not a mainstream concern. National-level statistics on women in school leadership roles do not exist; however, in the field of education in general, there are clear imbalances. The 2015 Labour Statistics report17 shows that more men are employed in educational professions than women (54% to 45%), and that these men earn 1.25 times what women earn on a cash basis. On an in-kind basis, men's earnings climb to more than 7 times what women are paid. This points to disincentivisation of and potentially even hostility toward women working in the field of education. On a regional basis, the Varkey Foundation’s data on female leadership in the Eastern Region demonstrates that men far outnumber women in school leadership roles.
In Ghana, the proportion of trained female secondary teachers is higher than male trained teachers (92% compared with 87.5%), though at primary level this figure is lower for both groups at 65% (female) and 48% (male), according to the government’s latest statistics.18 UNESCO figures for 2016 suggest this is slightly higher for male teachers at 50%.19 The 2010-2020 ESP does not highlight a lack of female teachers as a barrier to learning, though it does refer to the need for trained teachers under the Quality of Education pillar. However, in some parts of the country, civil society organisations have identified the need to recruit and retain more female teachers, particularly in Northern Ghana where educational outcomes are at their lowest.20 This issue is linked to the more general problem of some areas not attracting enough trained teachers.
Following the election of the National Patriotic Party (NPP) in January 2017 the political context in which the pilot project functioned has changed considerably. The new Minister of Education, Hon. Matthew Opoku Prempeh, has led reforms to establish free access to secondary education at the senior level, an initiative that began in September 2017. In June 2017, the a network of organisations, Girls’ Education Network (GEN), was formed which will work with the GEU to promote girls’ education in Ghana. The GEN, with the support of the Girls’ Education Advisory Body, will support the GEU in the implementation of its activities and functions. The GEN, made up of officials of government agencies, civil society organisations, donor partners, educational and research institutions, and girls’ education practitioners, is premised on the fact that education, including girls’ education, is fundamental to the promotion of the
17 Ghana Statistical Service 2015 Labour Force Report, http://www.statsghana.gov.gh/docfiles/publications/Labour_Force/LFS%20REPORT_fianl_21-3-17.pdf 18 SHS National Profile – 2014/ 2015 School Year Data 19 http://data.worldbank.org/indicator/SE.PRM.TCAQ.MA.ZS?locations=GH 20 http://www.ghananewsagency.org/education/recruit-female-teachers-to-enhance-academic-performance-educationist-81131

GEC-T Baseline Report – Making Ghanaian Girls Great Project 21
human rights of the child and it is the key to breaking the cycle of poverty in Ghana. In March 2018, Hon. Prempreh announced a new partnership with the Varkey Foundation to design and roll out a nationwide school leadership program beginning that year and initially focusing on secondary level school leaders before moving to primary.
Government support for girls’ education
In terms of support to girls’ education, the free Compulsory and Universal Basic Education (FCUBED) policy, the Quality Education for All policy, and other policies that encourage out of school girls (OOSG) to return to mainstream schooling are all aimed at ensuring gender equality in education. The National Vision for Girls’ Education was published by the GEU in 2002 and its principal goals are to increase enrollment, retention, and achievement of girls, particularly in the sciences, technology, and mathematics.
The National Gender Policy is relatively new but provides a solid platform to mainstream gender issues in education. It identifies inequalities in education and gender stereotyping as national development problems. Its goal is to mainstream gender equality and women’s empowerment concerns into the national development process in order to improve the social, legal, civic, political, economic and cultural conditions of the people of Ghana, particularly women and men, and boys and girls, in an appreciable manner and as required by National and International Frameworks. In particular, the policy identifies the following objective as a core part of its strategy: “To transform inequitable gender relations in order to improve women’s status relative to that of men.”
Having identified early pregnancy as a major challenge to equitable learning outcomes and completion rates, the GEU established a Girls Education Re-entry Policy to ensure that girls who become pregnant can resume their education after they give birth. The re-entry process involves the use of the girls’ old school admission number for re-admission, ensuring girls remain in school once they are re-admitted, offering counselling services to girls, and ensuring that the girls feel accepted and free from stigmatisation. This is, however, not implemented by all schools. Some schools refuse to accept such girls because they believe they will become a bad influence for the remaining girls. On the demand side, a 2015 GEU study on girls’ re-entry to school showed that few girls participate in the process but eventually return to school after pregnancy anyway.21
The Varkey Foundation works at the national, regional, and district level to support the existing work of the GES, and will shape its policy and advocacy activities around influencing the Gender in Education Policy, currently in draft form. The project focuses on policy implementation and enforcement, supporting the ESP 2010-2017 National Gender Policy, Girls Education Re-entry Policy and decentralisation. In the first phase of MGCubed the project consulted extensively with district level GEU officials and developed productive working relationships with Circuit Supervisors, Girls Education Officers, and District Directors.
21 GEU (2015), Report for a three day consultative meeting in ten districts across the country on re-entry into school after pregnancy, Accra: Girls Education Unit.

GEC-T Baseline Report – Making Ghanaian Girls Great Project 22
1.2 PROJECT THEORY OF CHANGE Overview
The project’s Theory of Change (ToC) holds that the lives of marginalised girls can be transformed through an education system that promotes inclusive, quality learning and enables girls to go as far as they can on their educational journey. Thus, the project assesses its success on whether GEC cohort girls: 1) have been able to improve their performance in literacy and numeracy; 2) transition to the next stage of their educational journey. A transformed life for these girls means a healthy and fulfilled life whereby girls have a higher degree of agency than they would otherwise have had.
The project does not stop at the level of the individual cohort girls, however. The project’s ToC holds that in creating the conditions for (1) and (2) the project is also able to ensure these conditions are sustainable, i.e. they are scaled to wider system, community, and school level change which not only scales the impact of the project geographically but extends the project’s reach to future generations of girls.
Phase 1 of the project worked largely with pupils, targeting the intervention towards the provision of Studio-based interactive distance learning maths and English lessons. In Phase 2 the project has extended its scope, intending to use the technology packages to build sustainable capacity development in schools and communities. Based on lessons learned in Phase 1, from which the project has concreate evidence on the key barriers and enablers of improved learning outcomes, the project identified key changemakers (School leaders, Teachers, Caregivers, wider community members) and now provides adult training content to support the alignment of these actors with the project’s aims.
The project’s activities are therefore designed to address the key barriers to girls fulfilling their education potential. These barriers have a direct impact on enrolment, retention, attendance, and learning outcomes for girls in later years. In order to summarise these barriers, the project distinguishes between “demand-side” and “supply-side” barriers which act to prevent girls from accessing and completing a quality education (Figure 1). These barriers are not easily distinguishable, nor are the mechanisms by which they interrelate always clear. At base, financial barriers act as a constraint to both investment in education at household and system levels, impacting access and learning environment quality, respectively.
This is not to say that boys do not also face many of these challenges. Boys are impacted by household poverty and a prioritisation of immediate labour needs over the long-term gains schooling may bring; they are also disadvantaged by an under-resourced education system that lacks quality instruction. However, these barriers disproportionately affect girls, who also must navigate gendered vulnerabilities which see a complex interplay of self-perpetuating socio-cultural norms and beliefs shaping both the household and school environment. This sees girls often lacking protection from physical and emotional threats; it also sees girls failing to engage fully in their studies (and subsequently their futures) as a result of low self-esteem, and characterised by poor self-belief and self-efficacy.
Figure 1: Key barriers to girls’ education

GEC-T Baseline Report – Making Ghanaian Girls Great Project 23
Key assumptions
The project’s Theory of Change is based on a several key assumptions, of which a number were tested as part of the research component to GEC-1. Building on this logic, which stated that by improving both the quantity and quality of education provision in literacy and numeracy, and by enhancing the self-esteem of targeted girls, it is expected that there will be both increased attendance at school and improved learning outcomes, for GEC-T, the evaluation holds that:
1. It is desirable that a girl lives a happy, fulfilled life in which she is able to use her skills and knowledge to make a decent living (intended impact on beneficiaries), despite her level of marginalisation in her early years.
2. The completion of secondary education helps to facilitate this and overcome the disadvantages of marginalisation.
3. This is further supported by the acquisition of non-academic skills and knowledge, which are also a major influence on learning outcomes.
4. Therefore, (i) it is important that girls’ transition from primary (P6) to secondary school (JHS1) and that (ii) girls can acquire relevant life skills and knowledge in a safe and supportive space.
5. Currently the barriers to transition are numerous, particularly amongst girls from low-income households in rural areas. The barriers include: low attendance, low academic achievement, a lack
Marginalised girls do not fulfil their educational potential post-primary

GEC-T Baseline Report – Making Ghanaian Girls Great Project 24
of quality teaching and supportive learning environment, a lack of parental support, early marriage and pregnancy, and a lack of motivation in continuing education.
6. The project therefore (iii) needs to address these barriers through targeted interventions which: Increase the quality and provision of educational content (Output 1) Enhance in-school teaching in core subjects through the use of modern pedagogy
(Output 2) Enable school leaders to create and sustain positive learning environments through well-
managed schools that provide teachers with the opportunity to teach to the best of their ability (Output 2 and 5)
Support girls to continue their education through increased empowerment, focusing on improving levels of self-esteem, including self-belief and self-efficacy (Output 3)
Target community-based barriers to girls’ transition and academic achievement through attitudinal and behavioural change (Output 4 and 6)
Support the development of sustainable government capacity at district level to develop and sustain systems to facilitate school management and transition (Output 5).
And finally, it is desirable that this cycle is sustained so that intergenerational change can be maintained (intended impact on sustainability, Outcome 3).
These targeted interventions constitute the project’s six outputs, as indicated above. These Outputs have been mapped to the project’s Intermediate Outcomes (IOs) in Figure 2. They reflect points 1-5 which identify attendance, teaching quality, non-cognitive skills, community support, and school governance as central drivers towards girls’ learning outcomes and transition.

GEC-T Baseline Report – Making Ghanaian Girls Great Project 25
Figure 2: Relation of Outputs to Intermediate Outcomes
Assumptions being tested
There are clearly a number of assumptions present in the anticipated actor-based changes presented in Table 1. The MEL research is designed to test through a rigorous external evaluation a more limited number of assumptions. The project’s Theory of Change contains the following assumed key relationships between variables (Figure 2) which the MEL system will test:
1. Learning (Outcome 1) will be directly increased through attendance (IO1), quality of teaching (IO2), and self-esteem (IO3).
2. Transition (Outcome 2) will be directly increased through Learning (Outcome 1). 3. Transition (Outcome 2) will be directly increased through an increase in girls’ self-esteem (IO3),
a supportive well-governed school environment (IO4), and community support and/or reduction of community-based barriers (IO5 and IO6).
4. Sustainability (Outcome 3) includes both the sustainability of Outcomes 1 and 2 in the current area of operation, but also refers to scale-up. Scale-up will be directly affected by levels of national buy-in to the model, which in turn will be directly affected by both demonstration effects (Outcomes 1 and 2 and IOs 1-5) and of the quality of the project’s relationships with key actors (listed below)
These assumptions, or hypotheses, link to the external evaluation’s research questions presented later in this report.
Project activities
A sustainable change
The GECT project’s vision is to transform the equipped school classrooms into a community-wide hub, through which additional training content can be channelled and cascaded for the maximum benefit of new stakeholders. This project intends to permanently upgrade the pedagogy of all teachers and school leaders within the 72 treatment schools and other District schools in which it works, while building the capacity of the District GES staff in monitoring and teacher coaching skills. Similarly, each month the project will invite community members into the classrooms and engage them directly in gender awareness training – amongst other issues - to alleviate barriers preventing girls’ attending and thriving in school, with the goal of permanently changing widely held community attitudes and behaviours in support of girls’ education.
As girls transition to JHS, their households will be provided with support to stay in school. The project re-engaged with current beneficiaries in the first year and will subsequently follow girls currently in primary school after they move to JHS. Afterschool and vocation lessons support girls most at risk of dropping

GEC-T Baseline Report – Making Ghanaian Girls Great Project 26
out, and the most marginalised are invited to the afterschool girls’ clubs where they are introduced to inspirational female role models from similar backgrounds. To reinforce this, the project will support JHS girls to see themselves as role models and will implement a mentoring system between them and primary girls. Out of school girls are also invited to afterschool clubs and vocation lessons to give them the skills and confidence to transition back into formal or informal education or skills training.
GEC-1 reinforced the project’s understanding of the importance of the teachers in schools to the improvement of literacy and numeracy outcomes, and to the support of girls as they progress. GEC-T includes structured training to school staff to ensure the sustainability of the intervention and give teachers the skills to engage their students and support their retention in school. Through technology infrastructure the project will offer continuous professional development on a fortnightly basis to all teachers in student-centred, gender-responsive and activity-based pedagogy, and target training on how to support girls’ transition to JHS. The project trains head teachers in school leadership and management , including child protection. To complement these activities, training for parents and communities is provided, focusing on the importance of girls’ education and forming partnerships with organisations running enterprise training in order to target the economic barriers some girls face.
The project supports all of these activities with distance training for teachers of Kindergarten and Primary 1 and 2 teachers, whose students will not be receiving MGCubed lessons directly. This will give P1 and P2 students a foundation for the interactive lessons beginning in P3. The project also runs science training for JHS teachers to encourage girls with STEM subjects, a Ghanaian government priority.
Following the Varkey Foundation’s successful engagement of the Ghana Education Service (GES) during GEC-1, and the benefits incurred as a result of their support, the project offers capacity building training for GES staff through the distance learning technology. This formalises the link and ensures project sustainability. Directors of Supervision and Circuit Supervisors will receive training alongside the teachers they are responsible for, as well as structured monitoring training to support them in their work in schools and allow them to reinforce take-up of activities. Girl Child Officers receive training to equip them to support girls in transition, including lessons on child protection and the running of clubs that focus on transition.
The project stresses that all interventions will be accessible to people with disabilities, in line with the intervention school’s own accessibility policies. Where the project has identified disabled pupils, District Coordinators ensure that pupils are seated comfortably and safely, and are able to see and/or hear the lesson. The project actively liaises with school leaders to monitor developments amongst disabled pupils, and tailors afterschool content to address disability issues.
Table 1: Project design and intervention
Intervention types
What is the intervention?
What Intermediate Outcome will the intervention will contribute to and how?
How will the intervention contribute to achieving the learning, transition
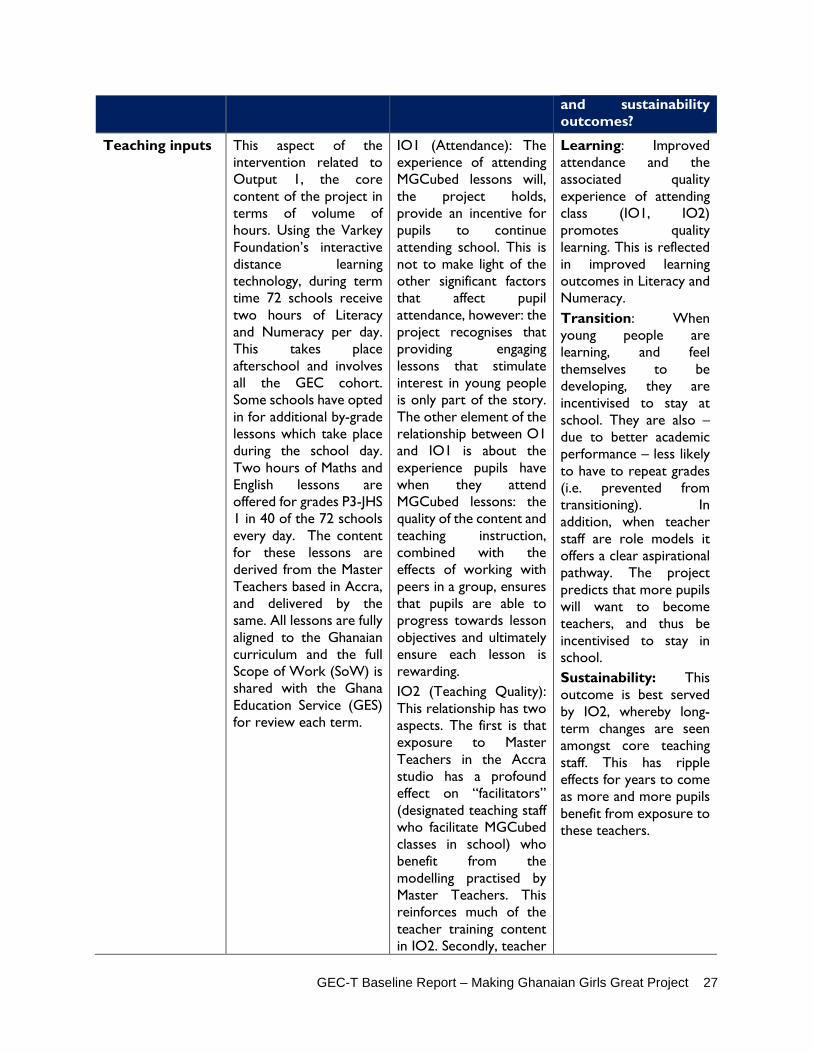
GEC-T Baseline Report – Making Ghanaian Girls Great Project 27
and sustainability outcomes?
Teaching inputs This aspect of the intervention related to Output 1, the core content of the project in terms of volume of hours. Using the Varkey Foundation’s interactive distance learning technology, during term time 72 schools receive two hours of Literacy and Numeracy per day. This takes place afterschool and involves all the GEC cohort. Some schools have opted in for additional by-grade lessons which take place during the school day. Two hours of Maths and English lessons are offered for grades P3-JHS 1 in 40 of the 72 schools every day. The content for these lessons are derived from the Master Teachers based in Accra, and delivered by the same. All lessons are fully aligned to the Ghanaian curriculum and the full Scope of Work (SoW) is shared with the Ghana Education Service (GES) for review each term.
IO1 (Attendance): The experience of attending MGCubed lessons will, the project holds, provide an incentive for pupils to continue attending school. This is not to make light of the other significant factors that affect pupil attendance, however: the project recognises that providing engaging lessons that stimulate interest in young people is only part of the story. The other element of the relationship between O1 and IO1 is about the experience pupils have when they attend MGCubed lessons: the quality of the content and teaching instruction, combined with the effects of working with peers in a group, ensures that pupils are able to progress towards lesson objectives and ultimately ensure each lesson is rewarding. IO2 (Teaching Quality): This relationship has two aspects. The first is that exposure to Master Teachers in the Accra studio has a profound effect on “facilitators” (designated teaching staff who facilitate MGCubed classes in school) who benefit from the modelling practised by Master Teachers. This reinforces much of the teacher training content in IO2. Secondly, teacher
Learning: Improved attendance and the associated quality experience of attending class (IO1, IO2) promotes quality learning. This is reflected in improved learning outcomes in Literacy and Numeracy. Transition: When young people are learning, and feel themselves to be developing, they are incentivised to stay at school. They are also – due to better academic performance – less likely to have to repeat grades (i.e. prevented from transitioning). In addition, when teacher staff are role models it offers a clear aspirational pathway. The project predicts that more pupils will want to become teachers, and thus be incentivised to stay in school. Sustainability: This outcome is best served by IO2, whereby long-term changes are seen amongst core teaching staff. This has ripple effects for years to come as more and more pupils benefit from exposure to these teachers.

GEC-T Baseline Report – Making Ghanaian Girls Great Project 28
quality amongst Master Teachers improves as a result of the Varkey Foundation’s ongoing quality assurance mechanisms. These are designed to ensure the quality of every class delivered, and to support each member of the instructional team in their professional development journey. As the quality of Master Teachers is both assured and developed, so is quality learning and the professional development of in-school teaching staff.
Teacher education
This aspect of the intervention related to Output 2. Using the Varkey Foundation’s interactive distance learning technology, during term time 72 schools receive 2 hours of teacher training centred around student-centred learning per week. The content for the training is derived from the Train for Tomorrow (T4T) project; and adapted and delivered by the Master Teachers based in Accra, and delivered by the same. Further, School Leaders are offered an average of one hour of training per week specifically to develop School Leadership and
IO1 (Attendance): Quality teaching – which occurs as a result of teacher education – is a critical factor in driving attendance and ensuring young people are incentivised to attend school. IO2 (Teaching Quality) and IO4 (School Governance) : The inputs in Output 2 are assumed to have a direct effect on teaching quality and the quality of school leadership. Training offered aims to transform classroom-based pedagogy, in order to promote student-centred gender-equitable classroom environments. This is supported by school leaders, who drive continuous school improvement which has
Learning: Without attending school and without quality teaching within well-managed schools pupils will struggle to learn. The project therefore relies heavily on these two IOs to guarantee the OI learning targets of 0.25 sd. Transition: Schools have a major role to play to promoting education, particularly for marginalised girls. A core part of the training content in Output 2 is designed to help teachers and school leaders develop ways to promote the continued education of girls, with a particular focus on transition to JHS from P6.
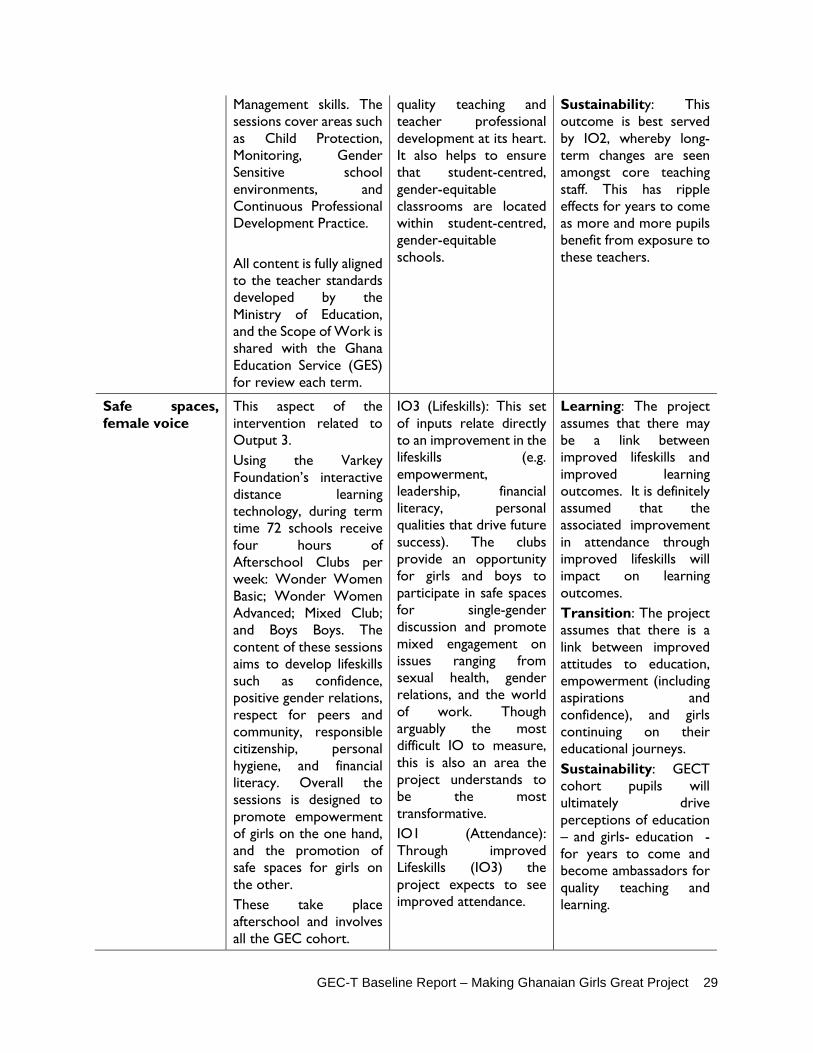
GEC-T Baseline Report – Making Ghanaian Girls Great Project 29
Management skills. The sessions cover areas such as Child Protection, Monitoring, Gender Sensitive school environments, and Continuous Professional Development Practice. All content is fully aligned to the teacher standards developed by the Ministry of Education, and the Scope of Work is shared with the Ghana Education Service (GES) for review each term.
quality teaching and teacher professional development at its heart. It also helps to ensure that student-centred, gender-equitable classrooms are located within student-centred, gender-equitable schools.
Sustainability: This outcome is best served by IO2, whereby long-term changes are seen amongst core teaching staff. This has ripple effects for years to come as more and more pupils benefit from exposure to these teachers.
Safe spaces, female voice
This aspect of the intervention related to Output 3. Using the Varkey Foundation’s interactive distance learning technology, during term time 72 schools receive four hours of Afterschool Clubs per week: Wonder Women Basic; Wonder Women Advanced; Mixed Club; and Boys Boys. The content of these sessions aims to develop lifeskills such as confidence, positive gender relations, respect for peers and community, responsible citizenship, personal hygiene, and financial literacy. Overall the sessions is designed to promote empowerment of girls on the one hand, and the promotion of safe spaces for girls on the other. These take place afterschool and involves all the GEC cohort.
IO3 (Lifeskills): This set of inputs relate directly to an improvement in the lifeskills (e.g. empowerment, leadership, financial literacy, personal qualities that drive future success). The clubs provide an opportunity for girls and boys to participate in safe spaces for single-gender discussion and promote mixed engagement on issues ranging from sexual health, gender relations, and the world of work. Though arguably the most difficult IO to measure, this is also an area the project understands to be the most transformative. IO1 (Attendance): Through improved Lifeskills (IO3) the project expects to see improved attendance.
Learning: The project assumes that there may be a link between improved lifeskills and improved learning outcomes. It is definitely assumed that the associated improvement in attendance through improved lifeskills will impact on learning outcomes. Transition: The project assumes that there is a link between improved attitudes to education, empowerment (including aspirations and confidence), and girls continuing on their educational journeys. Sustainability: GECT cohort pupils will ultimately drive perceptions of education – and girls- education - for years to come and become ambassadors for quality teaching and learning.

GEC-T Baseline Report – Making Ghanaian Girls Great Project 30
The content for the sessions are derived from the Master Teachers based in Accra, and delivered by the same.
Community Initiatives
This aspect of the intervention related to Output 4. Using the Varkey Foundation’s interactive distance learning technology, during term time the community members in communities where the 72 MGCubed schools are located receive an average of one hour of training per week. The sessions aim to drive community-based attitudinal and behavioural change amongst community members, who act as the gatekeepers to a girl’s education. Areas covered as part of the training include Child Protection, Girls’ Education, and Gender Equality. The content for the sessions are derived from the Master Teachers based in Accra, and delivered by the same.
IO5 (Community Attitudes and Perceptions): Through targeted training designed to build awareness and understanding of the importance of education and ways in which parents can support their children to navigate their educational journeys, Output 4 has a direct impact on community attitudes and perceptions about education, addressing the multiple barriers these attitudes and perceptions pose to young people. As a result of changed attitudes and perceptions the project assumes that community members will support pupils in their education.
Learning: Learning outcomes are potentially improved if pupils have the support of caregivers and the community, for instance they are encouraged to attend school, to study at home, and not to drop out of school. Transition: Transition is promoted if pupils have the support of caregivers and the community, by being encouraged not to drop out of school. If learning outcomes are improved, the project holds that so might the likelihood of transition. Sustainability:
Government capacity building
This aspect of the intervention related to Output 5. Using the Varkey Foundation’s interactive distance learning technology, the Varkey Foundation offers leadership training to officials in the 7 district level GES offices where the project is operational. For an
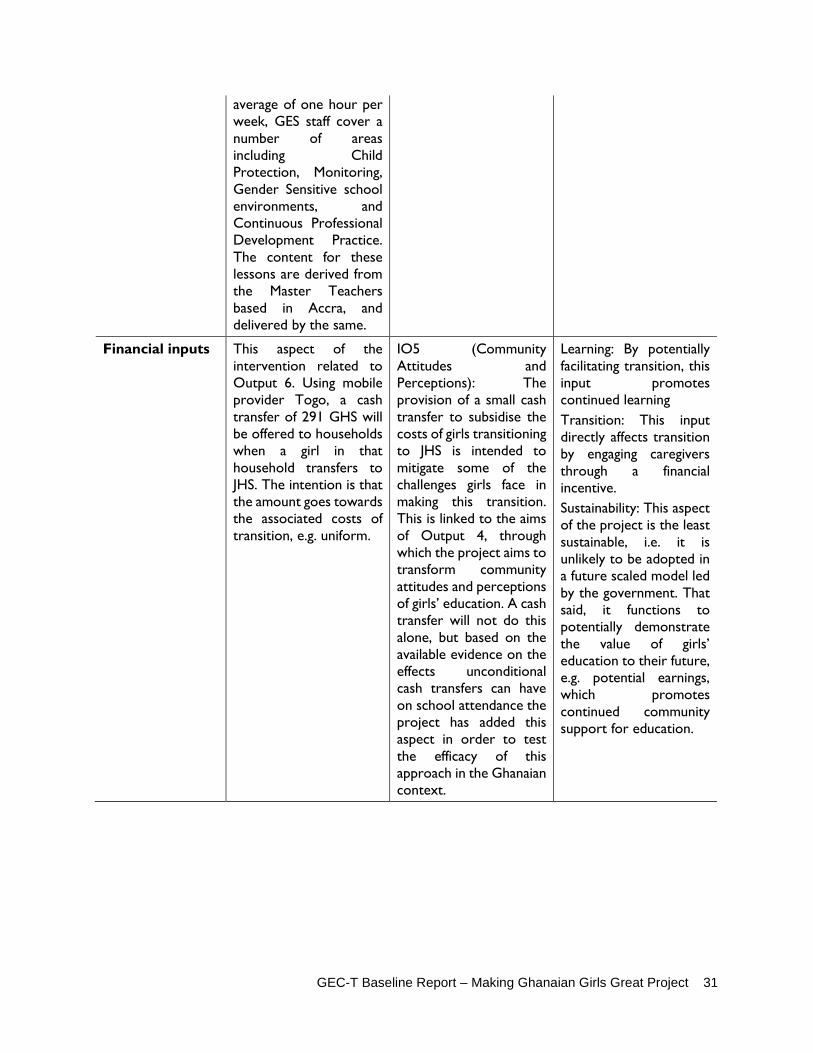
GEC-T Baseline Report – Making Ghanaian Girls Great Project 31
average of one hour per week, GES staff cover a number of areas including Child Protection, Monitoring, Gender Sensitive school environments, and Continuous Professional Development Practice. The content for these lessons are derived from the Master Teachers based in Accra, and delivered by the same.
Financial inputs This aspect of the intervention related to Output 6. Using mobile provider Togo, a cash transfer of 291 GHS will be offered to households when a girl in that household transfers to JHS. The intention is that the amount goes towards the associated costs of transition, e.g. uniform.
IO5 (Community Attitudes and Perceptions): The provision of a small cash transfer to subsidise the costs of girls transitioning to JHS is intended to mitigate some of the challenges girls face in making this transition. This is linked to the aims of Output 4, through which the project aims to transform community attitudes and perceptions of girls’ education. A cash transfer will not do this alone, but based on the available evidence on the effects unconditional cash transfers can have on school attendance the project has added this aspect in order to test the efficacy of this approach in the Ghanaian context.
Learning: By potentially facilitating transition, this input promotes continued learning Transition: This input directly affects transition by engaging caregivers through a financial incentive. Sustainability: This aspect of the project is the least sustainable, i.e. it is unlikely to be adopted in a future scaled model led by the government. That said, it functions to potentially demonstrate the value of girls’ education to their future, e.g. potential earnings, which promotes continued community support for education.

GEC-T Baseline Report – Making Ghanaian Girls Great Project 32
1.3 TARGET BENEFICIARY GROUPS AND BENEFICIARY NUMBERS The primary beneficiaries for the GECT project are the existing marginalised girls supported by the GEC1 MGCubed project within 72 government schools across the Volta and Greater Accra regions. All 72 schools receive Remedial afterschool classes in literacy and numeracy; while 41 receive Remedial and In-grade classes which align with the Government of Ghana’s curriculum for maths and English and are conducted during school time. The project’s activities cover pupils from grades P3-JHS1 (where only girls in JHS1 receive the intervention), from the ages 7-17. In addition to this, the GECT project has a number of other primary beneficiary groups, a summary of which is presented below.
GEC-T target groups
Target Group 1: In-school Marginalised girls. These girls as defined as (i) pupils who are over-age in their class, (ii) pupils who travel more than 30 minutes to school, (iii) pupils who have been absent from school for more than 10 times in a term, and (iv) and/or pupils who have more than four siblings. In the treatment group, they receive targeted remedial courses in MGCubed schools, and some of them also are invited to after school Wonder Women and Mixed Club activities afterschool. These girls are sampled from the 72 treatment schools as well as an equal number of control schools. Sample sizes are presented in Section 3 of this report.
Target Group 2: Girls at risk of dropping out of school. VF targets a specific group of in-school girls who are at particular risk of dropping out of school due to economic reasons. These are P6 girls transitioning into JHS as well as out of school girls (OOSG) transitioning into mainstream school. To address this, the project offers cash transfers to households with the idea that the extra money will be used to help girls transition to the next grade. This is particularly useful for households of girls who will be transitioning from primary to junior high school. Though these girls were not tracked at baseline. a selection of girls receiving cash transfers (and their households) may be sampled from intervention catchment areas and tracked as part of measurement of the transition outcome at midline.
Target Group 3: Out-of School Girls. Girls who have dropped out of school or never attended school. The project aims to support out-of-school girls to transition back into mainstreaming schooling, and offers afterschool Wonder Women classes as a means of reaching this group.
Target Group 4: In-school marginalised boys. This population is similarly targeted by VF and the MGCubed project and uses the same marginalization status as girls. They too are invited to participate in remedial courses and some also participate in after school Boys Boys activities. While boys are not a primary focus of the GEC project, boys’ learning outcomes are tracked in order to provide a comparison to girls. While SI will not specifically follow-up with households over boys who do not transition, SI will analyse average transition rates of boys (when attempting to re-contact them at midline and endline at school) and compare those to girls’ rates for further analysis.
Target Group 5: Teachers in MGCubed schools. The project targets both primary and JHS teachers in all 72 schools. The Headteacher and Deputy Headteacher will also be targeted.

GEC-T Baseline Report – Making Ghanaian Girls Great Project 33
Target Group 6: District and circuit-level GES personnel. The project targets six District Education Offices, including circuit-level GES personnel. This includes the District Education Officer, Circuit Supervisors, and Girl Child Education Officer.
Target Group 7: Community members. Community members include the following sub-groups, which will be disaggregated: Parents and other family members; Community representatives; Religious leaders.
Current totals and assumptions made in calculating the totals are presented in Table 2 below.
Table 2: Beneficiary calculations for MGCubed
Target group # Identification In-school girls 4847 A Pupil Verification exercise was undertaken in October 2017 to verify
the pupils who were: a) Still in school; b) Still wanted to be part of the project (known as “Active” in the data management system). District Coordinators visited each of the 72 schools to gather information from Headteachers, using school enrolment records and registers. Where pupils could not be found, reasonable follow ups were made to verify the pupil's status and provide a reason for absence. Data was entered into the Salesforce contact management system and updated in accordance with the pupil's grade and impairment. This is reviewed as part of the Varkey Foundation's termly attendance record checks and changes are reflected in the system. Note on in-school girls and boys: Afterschool lesson numbers are fixed, and assume attendance from all registered cohort pupils. In-grade lesson numbers are calculated using pupil population numbers. Note: a remobilisation exercise was carried out at the beginning of Term 3 to reconnect with girls and boys who had not been validated as Active at the beginning of the project but who have registered attendance at MGCubed sessions. DCs visited schools and re-validated the project’s pupil lists, particularly identifying inactive pupils who had shown signs of being active during the first two terms of the project. This has meant that the pupil numbers have been revised since the beginning of the project’s implementation and updated accordingly.
Out-of-school girls (Includes OOSGs who have returned to school in GEC1) 115
In-school boys 4235
Teachers and Headteachers 981
A Staff Verification exercise was undertaken in October 2017, designed to do the following: 1) Update contact details of existing participating staff members (MGCubed Facilitators and Headteachers); 2) Create new contact details of the new Facilitators entering the project; 3) Create new contact details of the wider teaching staff, i.e. those who will be offered teacher training. DCs visited each school and first gather official data from Headteachers, based on existing staff lists. This is then validated through face-to-face interaction to ensure official staff numbers reflect the number of practicing staff. Where this is not possible, for instance if a teacher is absent on the day of the validation, a follow up visit is made. Data was entered into the Salesforce contact management system and updated in accordance with the teacher's status in the project. This is reviewed as part of the Varkey Foundation's termly checks and on a

GEC-T Baseline Report – Making Ghanaian Girls Great Project 34
case-by-case basis throughout the term, and changes are reflected in the system. The project cannot, however, verify that all staff contained within the system attend MGCubed training, though it is assumed that they do.
Community members 576
The Varkey Foundation does not collect contact data on all community members in the 72 communities it works in. Assumptions of reach are therefore made based on the average attendance at community training in each school. This is calculated though the Salesforce platform using Technical Logs. Studio Technicians record the number of participants during broadcasts. The relatively low number of participants makes this exercise easier than with pupils, where this method is not the primary way means of monitoring attendance.
DEO Officials 101
The Varkey Foundation conducted an initial contact gathering exercise at the beginning of the project’s implementation in October. This established the contact details of staff members in each District Education Office, including: Director; Deputy Director; Girl Child Officer; Circuit Supervisors. The data is based on staff lists contained at the GES office, and validated through face-to-face interaction. Contact records are managed in Salesforce and updated as staff leave or new members of staff begin working.
The External Evaluator has reviewed the calculation of beneficiaries and concurs with the methodology used. School enrolment numbers collected in the School Survey and household composition data collected in the Household Survey helped further to triangulate and verify the calculations.

GEC-T Baseline Report – Making Ghanaian Girls Great Project 35
2. BASELINE EVALUATION APPROACH AND METHODOLOGY
2.1 KEY EVALUATION QUESTIONS & ROLE OF THE BASELINE In this section, we lay out the evaluation questions of the baseline evaluation. The following questions are a combination of GEC-T mandated (marked as GEC Q#) and MGCubed specific (marked as MG#) evaluation questions. While the higher-level GEC-T questions cover the three outcomes of the evaluation (learning, transition, and sustainability), MGCubed’s intermediate outcomes (IOs) guide the development of project-specific sub-questions. The five mandatory GEC-T programme evaluation questions and supporting MGCubed-specific sub-questions are as follows:
GEC Q1: Was the GEC successfully designed and implemented? Was the GEC good Value for Money? (This needs to be answered with specific reference to GEC Q4 findings, below.)
GEC Q2: What impact did the GEC Funding have on the transition of marginalised girls through education stages and their learning?
o MG3 2.1. How have marginalised girls’ learning outcomes changed in comparison to: a) a non-treatment group; b) their male counterparts?
o MG3 2.2. What impact has the GEC funding had on marginalised girls’ transition rates at the various stages of their education?
GEC Q3: What works to facilitate transition of marginalised girls through education stages and increase their learning?
o MG3 3.1. To what extent has improved attendance contributed to transition and learning outcomes?
o MG3 3.2. How has teacher quality affected transition and learning of marginalised girls? o MG3 3.3. What impact has life skills training had on transition and learning of marginalised
girls? o MG3 3.4. What impact do school-level governance and management changes have on
attendance, transition and learning of marginalised girls? o MG3 3.5. What impact do cash transfers have on transition rates of marginalised girls to
Junior High School? GEC Q4: How sustainable were the activities funded by the GEC and was the programme
successful in leveraging additional interest and investment? o MG3 4.1. To what extent has school governance and management been strengthened as
a result of the project? o MG3 4.2. To what extent are community members’ and girls’ attitudes and perceptions
of girls’ education changing? o MG3 4.3. To what extent is teacher quality changing? o MG3 4.4. To what extent have public-sector educational actors and institutions been
strengthened in relation to supporting quality learning and girls’ transition? GEC Q5: Was the project’s approach to learning fit-for-purpose?

GEC-T Baseline Report – Making Ghanaian Girls Great Project 36
o MG3 5.1. How effective were the project’s learning and adaptation mechanisms, and were they used to inform evidence-based changes to the project?
o MG3 5.2. How inclusive was the project’s learning and adaptation process, and were participants able to engage with the project in a meaningful way?
o MG3 5.3. Has the project ensured the integrity of a robust research process? o MG3 5.4. How has the project contributed to the GEC learning process and what value
has it added to the sectoral evidence basis? o MG3 5.5. Has the project adequately captured and learnt from any unintended effects?
The ET added to the initial mandatory GEC-T questions to ensure that key GEC-T outcomes were captured in the baseline evaluation. To that end, the addition of the project-specific sub-questions ensures that the effect of the various MGCubed interventions at the school, community, and system levels on higher level outcomes of learning, transition, and sustainability are taken into account. The questions themselves are further structured so that they are inclusive of MGCubed’s key intermediate outcomes of attendance, teacher quality, life skills, school governance, and attitudes and perceptions, which are in turn intermediate outcomes of the GEC-T project as a whole thus ensuring that results are comparable across GEC-T projects.
By answering these evaluation questions, the baseline evaluation will ultimately seek to set a baseline reference point for the MGCubed outputs, outcomes, and intermediate outcomes, against which subsequent data collection periods can be compared. Quantitative data collected at baseline will allow the ET to better estimate for midline and endline targets, and the inclusion of qualitative data collection will help paint a more nuanced picture of the level of improvement of girls’ education since project inception. Baseline data also helps all involved parties better understand the profile of the typical girl targeted by MGCubed programming as well the barriers that she faces with regard to key educational outcomes such as learning and transition. Further, the baseline will help to validate MGCubed’s theory of change, in particular by looking at the linkages between outputs and outcomes. Data collection at the baseline phase is expected to elucidate important gender equality indicators, such as the gap between boys and girls in learning, and to ultimately provide the Fund Manager with standardised data that can be aggregated and analysed more easily at the portfolio level. The baseline evaluation of MGCubed also represents an opportunity to validate the changes made by VF between GEC-1 and GEC-T. The Varkey Foundation’s work on reducing poverty as a barrier to education, improving teacher quality, and strengthening child protection – all as a result of findings from GEC-1 – have become foci in GEC-T. Ensuring that the evaluation focuses on these parts in particular to verify the effectiveness of targeted programmatic changes will be essential. Overall, findings and analysis from the baseline evaluation could and should be used to validate and review the project’s logic and make changes as necessary.

GEC-T Baseline Report – Making Ghanaian Girls Great Project 37
2.2 OUTCOMES AND INTERMEDIATE OUTCOMES As part of the baseline evaluation, the ET collected data on three key outcomes and five intermediate outcomes. These are presented below and in project Log Frame. The Outcome and IO indicators are assessed with alternative indicators proposed in the Recommendations section of this report.
Table 3: Outcomes and Intermediate Outcomes of the Baseline Evaluation
No.
Outcome/ IO
Indicator
Outcome 1: Learning
Number of marginalised girls supported by GEC with improved learning outcomes
1.1 Improvement in marginalised girls' literacy outcomes 1.2 Improvement in marginalised girls' numeracy outcomes
Outcome 2: Transition
Number of marginalised girls who have transitioned through key stages of education, training or employment
2.1 Percentage of marginalised girls who have made a transition to the next stage of their educational journey
Outcome 3: Sustainability
The project has the buy-in of key stakeholders and has created a transformation in attitudes and behaviours towards girls' education
3.1 Community level: Community actively supports girls' education beyond primary school 3.2 School level: School actively attempts to sustain the project System level: 3.3 Government of Ghana adopts the project approach for scale-up
Intermediate Outcome 1: Attendance
Marginalised girls are incentivised to attend school more regularly, and OOSG are incentivised to return to/begin attending school.
IO1.1. Improvement in marginalised girls' attendance in schools throughout the life of the project IO1.2 Marginalised girls report being motivated to attend school as a result of the project
Intermediate Outcome 2: Teaching Quality
Teaching quality is improved as a result of engagement with and support from MGCubed Studio Teachers and teacher training
IO2.1. Percentage of observed lessons where facilitators are assessed as "Highly Satisfactory" or "Outstanding" in MGCubed and Afterschool sessions IO2.2. MGCubed facilitators can satisfactorily demonstrate MGCubed strategies being used in non-MGCubed lessons IO2.3. MGCubed facilitators and teachers can describe how they are applying MGCubed in non-MGCubed lessons IO2.4. Varkey Foundation actively reflects on the level of teaching quality improvement and mechanisms contributing to it and participates in policy and research discussion teaching quality and learning outcomes and identifiable non-cognitive outcomes
Marginalised girls build transformative non-cognitive
IO3.1. Percentage of sampled girls demonstrating an improvement in non-cognitive skills across multiple

GEC-T Baseline Report – Making Ghanaian Girls Great Project 38
Intermediate Outcome 3: Life Skills
skills which allow them to make the most of their education
areas (self-efficacy; self-conceptualisation; peer relations) IO3.2. Percentage of sampled girls demonstrating an improvement in knowledge and understanding of 1) Health and Sanitation; 2) Financial Literacy IO3.3. Community members report changes in girls' attitudes and behaviours
Intermediate Outcome 4: School Governance
School leaders introduce sustainable school-level changes that support girls' learning and transition, supported by the DEO
IO4.1. Percentage of schools assessed as having "Highly satisfactory" or "Outstanding" school leadership and management IO4.2. Percentage of schools where the cane is either used or its use permitted.
Intermediate Outcome 5: Attitudes and Perceptions
Community members show increased awareness and understanding of the benefits of girls' education and transition
IO5.1. Community members demonstrate an understanding of the importance of girls' education IO5.2. Community members express support for Afterschool club content IO5.3. Community acts as guardians for technology packages in schools
To measure the outcome and IO indicators at baseline, the ET employed a host of qualitative and quantitative tools and data collection techniques. Table 4 below lays out how each outcome and IO are measured, at which level, by which tool, for what reason, and how often.
Table 4: Outcomes for measurement
Outcome Level at which measurement will take place
Tool and mode of data collection
Rationale Frequency of data collection
Learning (Literacy)
School Learning assessment (EGRA plus relevant SeGRA frameworks)
Per GEC guidance BL; ML; EL
Learning (Numeracy)
School Learning assessment (EGMA plus relevant SeGMA frameworks)
Per GEC guidance BL; ML; EL
Transition Household HH survey to caregiver (primary method); FGDs with parents, teachers, and Community Committees (secondary); EMIS transition data (tertiary);
The caregiver is in the most appropriate place to answer about enrollment status of girls; results triangulated by qualitative events with all relevant school and community-level stakeholders to better understand the nuances of transition.
BL; ML; EL;
Potential cohort of cash transfer girls measured at ML and EL
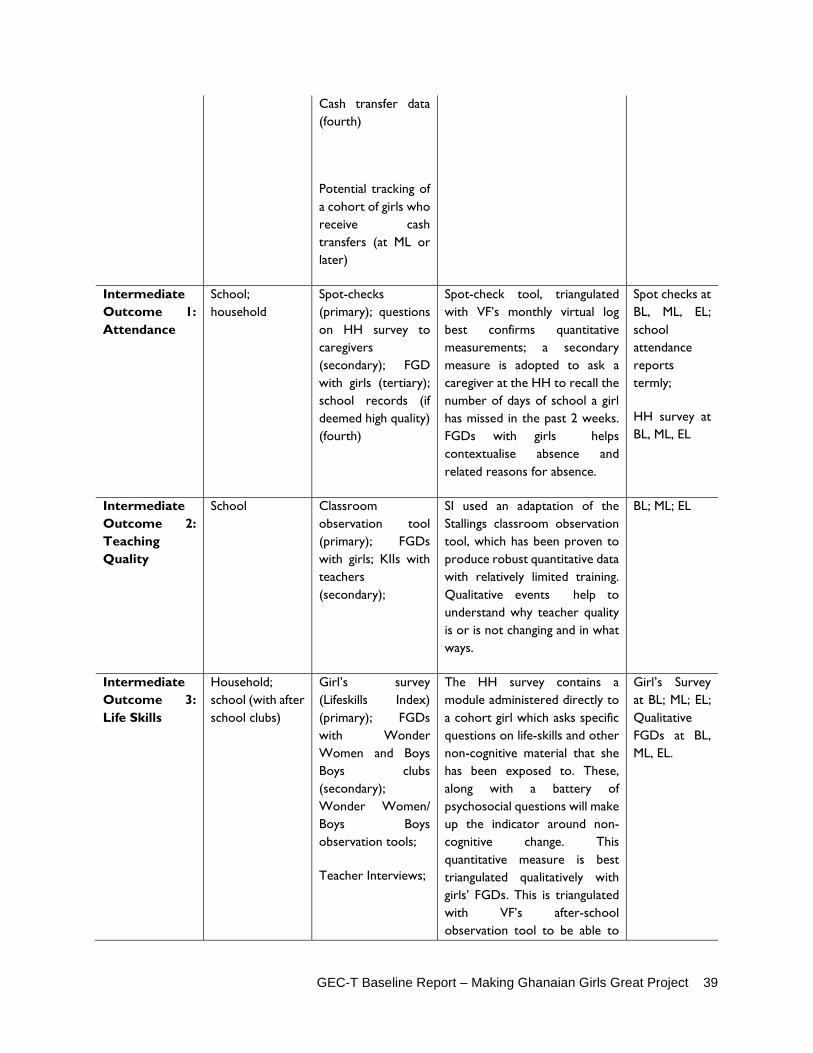
GEC-T Baseline Report – Making Ghanaian Girls Great Project 39
Cash transfer data (fourth)
Potential tracking of a cohort of girls who receive cash transfers (at ML or later)
Intermediate Outcome 1: Attendance
School; household
Spot-checks (primary); questions on HH survey to caregivers (secondary); FGD with girls (tertiary); school records (if deemed high quality) (fourth)
Spot-check tool, triangulated with VF’s monthly virtual log best confirms quantitative measurements; a secondary measure is adopted to ask a caregiver at the HH to recall the number of days of school a girl has missed in the past 2 weeks. FGDs with girls helps contextualise absence and related reasons for absence.
Spot checks at BL, ML, EL; school attendance reports termly;
HH survey at BL, ML, EL
Intermediate Outcome 2: Teaching Quality
School Classroom observation tool (primary); FGDs with girls; KIIs with teachers (secondary);
SI used an adaptation of the Stallings classroom observation tool, which has been proven to produce robust quantitative data with relatively limited training. Qualitative events help to understand why teacher quality is or is not changing and in what ways.
BL; ML; EL
Intermediate Outcome 3: Life Skills
Household; school (with after school clubs)
Girl’s survey (Lifeskills Index) (primary); FGDs with Wonder Women and Boys Boys clubs (secondary); Wonder Women/ Boys Boys observation tools;
Teacher Interviews;
The HH survey contains a module administered directly to a cohort girl which asks specific questions on life-skills and other non-cognitive material that she has been exposed to. These, along with a battery of psychosocial questions will make up the indicator around non-cognitive change. This quantitative measure is best triangulated qualitatively with girls’ FGDs. This is triangulated with VF’s after-school observation tool to be able to
Girl’s Survey at BL; ML; EL; Qualitative FGDs at BL, ML, EL.

GEC-T Baseline Report – Making Ghanaian Girls Great Project 40
objectively evaluate the afterschool activities as well.
To measure the effect of cash transfers on transition, SI tracks the transition outcomes of a cohort of girls who receive cash transfers.
Intermediate Outcome 4: School Governance
School School Survey and School Assessment Conduct Checklist (primary); Classroom observation tool (secondary); KIIs with school heads, teachers, GES officials; FGDs with girls (tertiary)
School assessments and conduct checklists are already developed by VF and have appropriate scope to quantitatively measure this IO. Indicators around use of the cane are best answered objectively (via classroom observation) and qualitatively in safe spaces, such as through FGDs with girls or KIIs with teachers. KIIs with Circuit Supervisors are used to measure this IO as well.
BL; ML; EL
Intermediate Outcome 5: Attitudes and Perceptions
Household; community
HH survey (Core Survey to caregivers and girls) (primary); FGDs with girls, teachers, caregiver Focus Group Discussions (secondary)
This IO is measured at the girl level and community level (among parents). The HH survey includes quantitative measurements for both girls and parents and allows us to measure the IO in one event. The nuances around attitudes and perception are best interpreted through qualitative events with girls, parents, and teachers, and further supplements and explain the quantitative findings.
BL; ML; EL
Sustainability
Sustainability is one of the three GEC-T high-level outcomes and is measured at three levels in society: school, community, and system. Sustainability at the school level looks at plans, systems, and processes put in place by school-level actors, such as head teachers, teachers, and PTAs, to ensure that girls’ learning and transition are sustained in the future. At the community level, sustainability may refer to changes in community attitudes and behaviours towards girls’ education, especially among community religious and

GEC-T Baseline Report – Making Ghanaian Girls Great Project 41
civic leaders, as well as parents of girls. And finally, sustainability at the system level refers to institutional change in the public education system, at sub-regional, regional, and/or national level, typically in the form of policy change and local ownership. The ET developed a Sustainability scorecard which gives scores of 0-4 to various sustainability indicators at the three societal/geographic levels. Measurement of indicators was conducted at baseline and will be conducted again at midline and endline using quantitative and qualitative data collection methods, carried out by a combination of SI and VF, and evaluated under the 0-4 scoring system. The following table lays out VF’s sustainability indicators and how, where, why, and at what frequency they are measured. The Sustainability Scorecard itself can be found in the transition outcome section (4.3) of this report.
Table 5: Sustainability outcome for measurement
Sustainability Level / Indicator
Where Measurement source Rationale – use of quality with quantity
Frequency of data collection
Community 1.1. Girls report that family members are supportive of their education and/or does not provide a barrier to attendance or achievement
Households; community meeting spots
HH survey (caregiver’s module) (primary); KIIs with community members; parents; PTA; school heads; and teachers
Triangulation with HH survey asking caregivers their thoughts on girls’ education (quant), and FGDs/KIIs with parents, teachers, and others (qual) will help inform the change in community support for girls’ education
Annual: BL; ML; EL
2.1. Community members are not found to act as a barrier to girls going to girls' transition
Households; schools
HH survey (girl’s module) (primary); FGDs with girls and boys
Several questions on the HH survey to a girl (quant), triangulated with in-depth FGD questions (quant) will better understand changes in community support for girls’ education from the perspective of girls and boys
Annual: BL; ML; EL
School Indicator 1: Schools develop and adopt plans to
Schools School survey (primary); KIIs with school heads, teachers, PTAs; FGDs with girls
Question in school survey to verify plans, triangulated with in-depth KII and FGDs
Annual: BL; ML; EL

GEC-T Baseline Report – Making Ghanaian Girls Great Project 42
facilitate transition to secondary school
to school-level stakeholders on the details of school plans will clarify sustainability around transition. Girls’ FGDs will add a layer of triangulation and supplementation.
Indicator 2: School leaders actively encourage student-centered gender-sensitive education
Schools School survey (primary); KIIs with school heads, teachers, PTAs; FGDs with girls; Classroom observation
Question in school survey to verify plans and implementation, triangulated with in-depth KII and FGDs to school-level stakeholders on the details of school plans will clarify awareness and understanding of gender-sensitive pedagogy. Girls’ FGDs will add a layer of triangulation and supplementation; Classroom observation of teachers’ teaching techniques (quant), triangulated with KIIs with teachers will better clarify the extent to which teacher training is changing the way teachers teach, impacting sustainability of that model.
Annual: BL; ML; EL
System Indicator 1: DEO staff collaborate with the Varkey Foundation to update and review school and classroom
DEO offices; Circuit Supervisor school visits
KIIs with DEOs (primary), Monitoring tools
Qualitative data via KIIs with DEOs will be the primary source of data for this indicator, triangulated with monitoring tools and further qual KIIs with community and
Annual: BL; ML; EL
GEC-T Baseline Report – Making Ghanaian Girls Great Project 43
monitoring tools
school level stakeholders to verify and understand systemic-level impact. The # of DEOs who engage the project to inform monitoring tools will be ascertained through KII with DEO officials and audit of monitoring tools
Indicator 2: Varkey Foundation supports the Ministry of Education in the translation of lessons learnt in GEC to inform policy and practice
DEO offices; GES; GEU; Varkey Foundation
KIIs with DEOs, national level GES officials, MoE, Varkey Foundation staff; Written evidence of submissions/correspondence/meeting minutes
Qualitative data via KIIs with DEOs and national level GES officials, and MoE officials Written evidence of the Varkey Foundation’s influence will support data obtained through interviews.
Annual: BL; ML; EL
Indicator 3: Government officials formerly recognise the GEC project and its contribution to promoting girls' education in Ghana
DEO offices; GES; GEU; Varkey Foundation
KIIs with DEOs, national level GES officials, MoE, Varkey Foundation staff (primary), school heads, teachers, Written evidence of submissions/correspondence/meeting minutes Media content – print, radio, Television, online
Qualitative data via KIIs with national level GES officials, and MoE officials will be the primary source of data for this indicator, triangulated with further qual KIIs with community and school level stakeholders to verify and understand systemic-level impact. Public announcements made via the media will also be considered.
Annual: BL; ML; EL

GEC-T Baseline Report – Making Ghanaian Girls Great Project 44
2.3 EVALUATION METHODOLOGY In GEC-1, the external evaluator (EE) implemented a randomised-control trial (RCT) in 140 schools to evaluate the MGCubed program. At the beginning of GEC-1, girls and boys in both the control (not receiving the interventions) and treatment schools (receiving the interventions) were similar across observed characteristics, and the program effect was the simple difference in outcomes between the control and treatment groups.
The situation was somewhat different in the case of GEC-T. The fixed selection of 70 treatment schools from GEC-1 meant a new randomised school selection was not possible for the GEC-T evaluation. In GEC-T, the Varkey Foundation targeted the same girls and boys targeted at GEC-1.22 These beneficiary boys and girls (project participants) have been exposed to three years of programming from GEC-1 treatment schools and now have, on average, higher learning levels than the girls and boys in schools that did not receive MGCubed interventions in GEC-1 (the control group). These schools also have the advantage of classroom technology, teacher training (provided to two teachers in GEC-1 and all teachers at a school in GEC-T), and other benefits conferred by participation in GEC-1. Given this reality, finding a robust control group of schools was relatively complex: the ET ended up selecting new control schools via statistical matching techniques.
Design: In general, the GEC-T evaluation follows a quasi-experimental, longitudinal panel design that tracks a cohort of control and treatment girls over three years. The ET selected the statistical matching method known as coarsened exact matching (CEM) to construct a valid counterfactual control group, and utilised a difference in difference approach (DID) to calculate the outcomes of interest.23 The indicators used for matching (from EMIS data) and a corresponding table with balance of these indicators between treatment and control groups are given in Annex 11. The tables also include several additional variables from the same EMIS data to check balance among excluded variables. A detailed discussion on the methodology of CEM and DID is also provided in Annex 11 as well as two additional tables to validate balance between treatment and control groups on school, student, and household-level characteristics derived from baseline data.
Target beneficiaries: The evaluation tracks a “joint sample” as defined by GEC, as opposed to a “split sample.” In this case, learning and transition will be linked as will cohort girls and their households. In practice, this meant that a girl was tested at school, followed by an interview at her household with the head of household (HOH) and/or the girl’s caregiver. Linking learning and transition in this manner not only facilitated data collection and analysis, but it also allowed the ET to better understand the influence of key household and demographic characteristics on cohort girl outcomes in subsequent regression analysis models, which assisted in answering the evaluation questions. The ultimate targeted beneficiaries of this evaluation are the cohort girls and boys, marginalised students identified in GEC-1 in the 72 schools in which MGCubed operates. Indirect beneficiaries include the broader student body who attend the same schools but do not attend MGCubed classes, teachers and principals in the MGCubed schools, parents
22 With the addition of new pupils who make up the wider school population in 41 schools that have opted to receive in-grade lessons during the school day in addition to the afterschool classes. These pupils are part of the direct beneficiary numbers but are not counted as part of the sampled cohort for this study. 23 Initially, the Varkey Foundation considered involving the same control group as in the pilot, employing a triple difference (DDD) design to ensure contamination effects are teased out. After discussions with the FM, this option was discarded.

GEC-T Baseline Report – Making Ghanaian Girls Great Project 45
and caregivers in the community, and district-level GES officials, all of whom receive some type of MGCubed intervention be it trainings, workshops, or educational lessons.
Addressing IOs and GESI standards: In order to successfully track, measure, and validate the linkages of intermediate outcomes and outcomes, the ET developed and piloted several different quantitative and qualitative tools that integrated IO specific questions in order to inform outcomes. Analysis of data from these instruments will not only yield interesting baseline descriptive and balance statistics, but also provide important explanatory variables to include in quantitative regression models with the goal of teasing out the effect of various factors (at the household, school, classroom, and community levels) on the outcomes of interest (learning and transition). With these tools, the ET will also be able to adequately and accurately address the GESI minimum standards, ensuring to disaggregate by and conduct meaningful analysis of impairment, sex, grade/age, and other interesting sub-groups. All outcome and intermediate outcome-level reported data in this report follows GESI standards where applicable and relevant.
Qualitative data collection: To supplement the quantitative data, the ET collected qualitative data about the program’s impacts. Whereas the quantitative data elucidates the program’s impact, qualitative data provided deeper insight into the mechanisms for how and why these impacts took place. At baseline, qualitative data was collected via two methods— focus group discussions (FGDs) and key informant interviews (KIIs). FGDs and KIIs were carried out with six distinct populations: boy students, girl students, mothers of students, fathers of students, teachers at school, and MENFP departmental-level officials. Approximately six to 10 participants were chosen for each FGD via convenience sampling. KIIs consisted of one to two respondents. To the extent possible, qualitative events were carried out at both control and treatment schools at baseline.
Creating benchmarks: As part of the evaluation design, the ET created benchmarks against which future (midline and endline) treatment girls and boys in the cohort could be compared. Benchmarks act as a counterfactual, demonstrating what future cohort grades would have scored without the intervention in the treatment area. To create these benchmarks, at baseline, the ET tested two girls and two boys in JHS 2 and JHS3 (future grades for current cohort girls and boys) from each of the 72 treatment schools and analysed their data. For transition, the ET employed the Benchmark Transition tool, which randomly selected up to 6 girls in households of catchment areas of treatment and control schools in order to establish the current transition rates in communities. At midline and endline, learning and transition scores and rates will be compared to these benchmarks to assist in the overall picture of distinguishing the impact of the program.

GEC-T Baseline Report – Making Ghanaian Girls Great Project 46
2.4 BASELINE DATA COLLECTION PROCESS
Sampling
Power analysis: Prior to data collection, the evaluation team estimated the sample size required to address the impact evaluation questions using the proposed matching evaluation design for MGCubed. As per the Fund Manager (FM) guidelines, sample sizes for the MGCubed evaluation are defined for learning outcomes measured as continuous variables and set to measure a target of a 0.25 standard deviations (SD) minimum detectable effect size (MDES) per year. An analytical power of at least 80% and statistical confidence level of 95% (or significance level of 0.05) were also considered. When designing the evaluation, the ET used schools as clusters and estimated an intra cluster correlation (ICC) of 0.23. The ET used GEC-1’s endline learning score data to estimate the ICC.
Figure 3: Power calculations and sample sizes to achieve an MDES of 0.25 SD
Note: The ET considered alpha=0.05, Power=0.08, MDES=0.25 SD, and ICC =0.23. Optimal Design software was used for the estimation.
Based on these considerations, the estimates indicate that 16 girls per school are adequate for the specifications mentioned earlier and a total of 144 schools. Our estimates of power with ICC for aggregate learning scores (0.23) are depicted in Figure 3.
Sample size for girls and attrition. Given the above power calculations and the need to use cluster sampling, the ET calculated that 16 girls per school (not accounting for attrition) were needed to achieve appropriate power. Based on GEC-1 endline data, the ET estimated an attrition of 15 percent with a growth rate of 15 percent between baseline and endline. Given this information, the team decided to

GEC-T Baseline Report – Making Ghanaian Girls Great Project 47
create a buffer of 17.25 percent more marginalised girls from each school. This increased the sample size of girls per school from 16 to 19 and led to a total of 2,736 girls sampled from the two regions.
Revised calculations of ICC and MDES based on baseline data. Based on the baseline data collected, the ET re-estimated the ICC to examine whether the previous estimated sample size was sufficient enough to maintain internal validity for a suggested MDES of 0.25 SD. The ET used aggregate scores24 in numeracy and literacy based on all subtasks in EGRA and SeGRA (for literacy scores) and EGMA and SeGMA (for maths). Unlike the consideration during pre-data collection, the revised estimates of ICC in Table 6 adjust the value of ICC for two levels of clusters— districts and schools— which means the school level ICC takes into account district level variation as well. Among the three ICC values, the ET considered the highest value that represents ICC from aggregate scores in literacy (0.25).
Table 6: Revised ICCs with districts and schools
Cluster level ICC Std. Err. Confidence interval
Average of literacy and numeracy aggregate score District 0.14 0.068 0.053 0.331 District and school 0.24 0.061 0.147 0.383 Aggregate Literacy score District 0.14 0.068 0.052 0.329 District and school 0.25 0.060 0.157 0.390 Aggregate numeracy District 0.11 0.056 0.042 0.278 District and school 0.19 0.053 0.107 0.315 Note: The ET used the mixed command in STATA for an intercept-only model with random effects at two levels: districts and schools. The ICC values at the school level are adjusted for ICC at the district level as well.
Figure 4 shows revised ICC values. The two curves in the figure are drawn based on the maximum (red for literacy) and minimum (blue for numeracy) ICCs. Considering no change in other parameters including analytical power (at 80 percent), and number of schools (144), with 19 girls from each school, Figure 4 shows that the minimum detectable effect size (MDES) is 0.253 SD which is marginally above the MDES considered by the FM.
24 We used the same methodology suggested by FM to calculate aggregate literacy and numeracy scores. It is discussed later in the findings section.
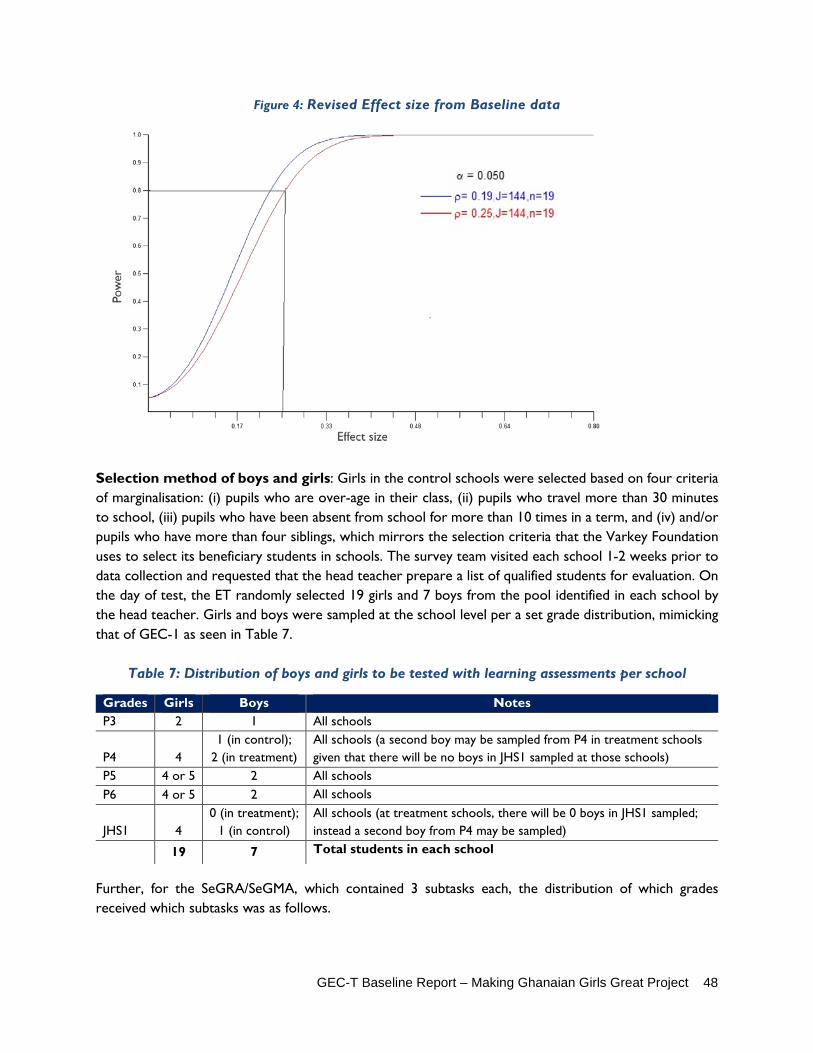
GEC-T Baseline Report – Making Ghanaian Girls Great Project 48
Figure 4: Revised Effect size from Baseline data
Selection method of boys and girls: Girls in the control schools were selected based on four criteria of marginalisation: (i) pupils who are over-age in their class, (ii) pupils who travel more than 30 minutes to school, (iii) pupils who have been absent from school for more than 10 times in a term, and (iv) and/or pupils who have more than four siblings, which mirrors the selection criteria that the Varkey Foundation uses to select its beneficiary students in schools. The survey team visited each school 1-2 weeks prior to data collection and requested that the head teacher prepare a list of qualified students for evaluation. On the day of test, the ET randomly selected 19 girls and 7 boys from the pool identified in each school by the head teacher. Girls and boys were sampled at the school level per a set grade distribution, mimicking that of GEC-1 as seen in Table 7.
Table 7: Distribution of boys and girls to be tested with learning assessments per school
Grades Girls Boys Notes P3 2 1 All schools
P4 4 1 (in control);
2 (in treatment) All schools (a second boy may be sampled from P4 in treatment schools given that there will be no boys in JHS1 sampled at those schools)
P5 4 or 5 2 All schools P6 4 or 5 2 All schools
JHS1 4 0 (in treatment);
1 (in control) All schools (at treatment schools, there will be 0 boys in JHS1 sampled; instead a second boy from P4 may be sampled)
19 7 Total students in each school
Further, for the SeGRA/SeGMA, which contained 3 subtasks each, the distribution of which grades received which subtasks was as follows.
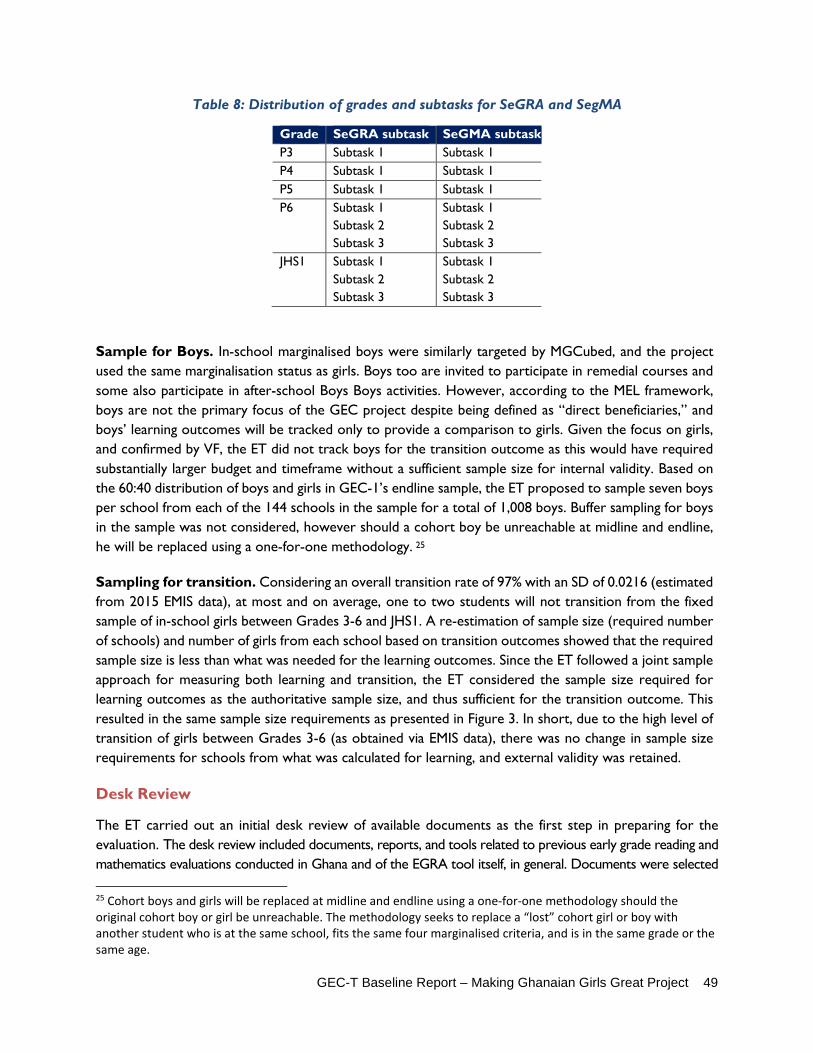
GEC-T Baseline Report – Making Ghanaian Girls Great Project 49
Table 8: Distribution of grades and subtasks for SeGRA and SegMA
Grade SeGRA subtask SeGMA subtask P3 Subtask 1 Subtask 1 P4 Subtask 1 Subtask 1 P5 Subtask 1 Subtask 1 P6 Subtask 1
Subtask 2 Subtask 3
Subtask 1 Subtask 2 Subtask 3
JHS1 Subtask 1 Subtask 2 Subtask 3
Subtask 1 Subtask 2 Subtask 3
Sample for Boys. In-school marginalised boys were similarly targeted by MGCubed, and the project used the same marginalisation status as girls. Boys too are invited to participate in remedial courses and some also participate in after-school Boys Boys activities. However, according to the MEL framework, boys are not the primary focus of the GEC project despite being defined as “direct beneficiaries,” and boys’ learning outcomes will be tracked only to provide a comparison to girls. Given the focus on girls, and confirmed by VF, the ET did not track boys for the transition outcome as this would have required substantially larger budget and timeframe without a sufficient sample size for internal validity. Based on the 60:40 distribution of boys and girls in GEC-1’s endline sample, the ET proposed to sample seven boys per school from each of the 144 schools in the sample for a total of 1,008 boys. Buffer sampling for boys in the sample was not considered, however should a cohort boy be unreachable at midline and endline, he will be replaced using a one-for-one methodology. 25
Sampling for transition. Considering an overall transition rate of 97% with an SD of 0.0216 (estimated from 2015 EMIS data), at most and on average, one to two students will not transition from the fixed sample of in-school girls between Grades 3-6 and JHS1. A re-estimation of sample size (required number of schools) and number of girls from each school based on transition outcomes showed that the required sample size is less than what was needed for the learning outcomes. Since the ET followed a joint sample approach for measuring both learning and transition, the ET considered the sample size required for learning outcomes as the authoritative sample size, and thus sufficient for the transition outcome. This resulted in the same sample size requirements as presented in Figure 3. In short, due to the high level of transition of girls between Grades 3-6 (as obtained via EMIS data), there was no change in sample size requirements for schools from what was calculated for learning, and external validity was retained.
Desk Review
The ET carried out an initial desk review of available documents as the first step in preparing for the evaluation. The desk review included documents, reports, and tools related to previous early grade reading and mathematics evaluations conducted in Ghana and of the EGRA tool itself, in general. Documents were selected
25 Cohort boys and girls will be replaced at midline and endline using a one-for-one methodology should the original cohort boy or girl be unreachable. The methodology seeks to replace a “lost” cohort girl or boy with another student who is at the same school, fits the same four marginalised criteria, and is in the same grade or the same age.

GEC-T Baseline Report – Making Ghanaian Girls Great Project 50
for their relevance to the evaluation, such as those presenting best practices in early grade reading and mathematics evaluations, EGRA/EGMA usage, and supplemental tools for evaluating issues such as teacher training and the school environment. The review identified current data gaps and informed the development of the data collection tools that would be used to gather the primary data for answering the EQs. The ET primarily reviewed and adapted tools used in previous EGRA/EGMA studies.
Scoping Trip
To better prepare for and facilitate a smoother, higher quality baseline study, the ET undertook a brief scoping trip in early December 2017. The goals of the scoping trip were to: (1) obtain a better sense of the geographic and programmatic scope of MGCubed, including viewing and touring the Accra-based studio, (2) interview key Varkey Foundation staff to inform process-related indicators around implementation of MGCubed, (3) coordinate with the Varkey Foundation, GES, and other local education sector stakeholders on the creation of the SeGRA and SeGMA tools (4) organised a SeGRA/SeGMA validation workshop and pilot. All information gathered during the scoping trip was utilised to inform and update the MEL Framework.
SeGRA/SeGMA validation workshop and pilot
The SeGRA and SeGMA tools were first drafted in early December 2017 by the ET in concert with local Ghanaian education experts. To ensure validation by all parties and context appropriateness, the ET carried out a validation workshop in mid-December 2017. Over the course of three days, the tools were discussed and adapted with input from key stakeholders including GES, Varkey Foundation, and Social Impact. The tool was then piloted in three schools with 150 children, the pilot data was analysed, and the tool was further revised based on the findings. Workshop results led to refinement of several SeGMA subtasks to ensure grade and difficulty level appropriateness. The ET subsequently analysed data from the pilot to identify potential floor and ceiling effects and to confirm calibration across test versions. Upon finalization of the tools, the entire research protocol was submitted to a local Institutional Review Board (IRB) in Ghana as well as Social Impact’s IRB. Both institutions subsequently approved the research. Findings from the SeGRA/SeGMA pilot can be found in Annex 9.
Data collection instruments
All data collection instruments are explained below and listed in Table 9. The full tools are included in Annex 7 and are also described in greater context in the MEL Framework in Annex 5.
Table 9: Data Collection Instruments
Quantitative instruments Qualitative instruments Learning assessments (EGRA/EGMA and SeGRA/SeGMA) Girls FGD guide Household Survey Boys FGD guide School Survey Female caregivers FGD guide Classroom Observation Male caregivers FGD guide Attendance Spot Check GES officials KII guide Girl’s Survey Teacher KII guide Benchmark Transition
GEC-T Baseline Report – Making Ghanaian Girls Great Project 51
Learning assessments: EGRA and EGMA. The Early Grade Reading Assessment (EGRA) and Early Grade Mathematics Assessments (EGMA) were administered at baseline at school to all cohort girls and boys in control and intervention groups. Girls and boys in grades P3-P6 and JHS1 received the tests over a two-day period, with the EGRA and EGMA administered on the first day, and the SeGRA and SeGMA (described below) on the second day. Boys and girls were chosen based on a specific distribution across grades which mirrored the distribution used in GEC-1. Further, students chosen for testing must have met the “marginalisation” criteria consisting of four characteristics including distance travelled to school, number of siblings in the households, age, and frequency of absence. Selection criteria and sampling procedures for the learning tests are displayed in the Sampling section earlier in this report. The EGRA and EGMA are oral tests and were administered by an enumerator face-to-face with a student. The EGRA tool contained the following key sub-tasks: (1) familiar word reading, (2) letter sound identification, (3) non-familiar work reading, (4) reading comprehension, and (5) listening comprehension. The EGMA tool contained the following subtasks: (1) Number identification, (2) Quantity discrimination, (3) Missing numbers, (4) Addition (Level 1 & 2), (5) Subtraction (Level 1 & 2), and (6) Word problems. EGRA and EGMA took approximately 25 minutes each to administer. While one version of EGRA and EGMA was used at baseline, the ET will employ slightly different, calibrated versions at midline and endline to mitigate against the risk of students remembering questions. In order to benchmark learning assessment scores for midline and endline, EGRA and EGMA were also administered at baseline to a boy and a girl in each of JHS2 and JHS3 in every treatment school. The students chosen from JHS2 and JHS3 were not exclusively marginalised students. By doing this, the ET created a benchmark (or the average score of students in a school in particular grades who are not necessarily marginalised) against which marginalised students could be compared. While the control group will provide a valid counterfactual against which treatment marginalised girls will be compared, JHS2 and JHS3 scores constitute an additional interesting comparison between marginalised and average student body scores for JHS2 and JHS3. These girls and boys in JHS2 and JHS3 were not considered part of the cohort or the sample and will not be tested again after baseline.
Learning assessments: SeGRA and SeGMA. The Secondary EGRA (SeGRA) and Secondary EGMA (SeGMA) were developed by the ET, validated, and piloted in December 2017 as supplementary learning tests to better measure higher level reading maths skills. SeGRA and SeGMA are written tests and were administered in a group setting with enumerators overseeing the exam. The tests consist of 3 progressively harder sub-tasks each: For SeGRA, this included (1) Short reading comprehension with straightforward inferential questions, (2) Longer reading comprehension with complex inferential questions, and (3) Short essay construction. For SeGMA, the subtasks were (1) Procedural questions on multiplication and division, fractions and proportions, and geometry and measurement, (2) Algebra, and (3) Sophisticated word problems. Given that subtasks were developed in line with grade-specific curriculum, not all students were given all 3 subtasks; the distribution of which grades received which subtasks can be found in the Sampling section earlier in this report. At baseline, three different versions of SeGRA and SeGMA were developed, piloted and calibrated. Version 1 was used at baseline, while Versions 2 and 3 will be used at midline and endline. Each subtask took 15 minutes to complete; SeGRA and SeGMA thus took between 15-45 minutes of a student’s time, depending on how many subtasks a student was given. As with EGRA and EGMA, a small group of JHS2 and JHS3 students were chosen to receive SeGRA and SeGMA in order create benchmarks for future data collection.

GEC-T Baseline Report – Making Ghanaian Girls Great Project 52
Household survey. In the catchment areas of intervention and control schools, a household survey (HHS) was administered orally to the caregiver of a cohort girl to gather pertinent information to inform intermediate outcomes. Since the same household of a sampled girl was chosen for the household survey, the full sample was considered a “joint sample.” The survey took approximately one hour to administer and included several modules on household demographics, caregiver demographics, selected cohort girl demographics, attitudes on education, and attitudes on school. For this evaluation, households are tracked longitudinally, as are cohort girls, and thus enumerators will follow up with the same households at midline and endline. In the case a cohort girl must be replaced, her replacement’s household will also replace the lost cohort girl’s household. The primary respondent of the HHS was the caregiver for a cohort girl in the household. A standard consent form was read to the caregiver prior to starting the survey. If the caregiver indicated consent for the survey, the enumerator administered the survey. If the cohort girl had not already completed the Girl’s Survey at school, then at the end of the HH survey, the enumerator asked the caregiver to give consent to talk to the cohort girl, and subsequently administered the Girl’s Survey.
Attendance spot checks. Attendance spot checks were completed by enumerators in classrooms at control and treatment schools as part of the baseline evaluation. Enumerators randomly chose one regular classroom in each grade (P3-JHS1 at baseline) per treatment and control school to conduct a spot check of attendance on that day, noting several different things about the classroom. This included the number of girls and boys in attendance in the class on that day, the number of girls and boys in attendance in the class the previous day, the number of MGCubed boys and MGCubed girls in attendance in the class on that day, the number of girls and boys who have dropped out of the class in the current term, and the number of days in the past 5 days that a teacher has recorded attendance in class. At MGCubed schools (treatment schools), enumerators also randomly chose two MGCubed after-school clubs (Basic, Intermediate, or Advanced) in which to carry out spot checks. This constituted a total of up to 5 spot checks per control school and up to 7 spot checks per treatment school. Spot checks took approximately 5-10 minutes to complete. Before conducting a spot check, enumerators obtained permission from both the school director and the teacher of the class.
School assessment survey (Head Teacher Survey). The School Survey, or Head Teacher Survey, captured school-based factors that may affect the quality of education and appeal of the school to local students. The primary respondent was the principal or head teacher. The survey included information on school conditions such as the number of teachers and classrooms, quality of facilities including construction materials and electricity, the availability of water, sanitation, and hygiene facilities and separation of latrines by gender, teachers’ attendance at trainings on education quality or gender-based issues, and the presence of feeding programs or interventions from other groups. The survey also captured current enrolment numbers of students in all grades, separated by gender. The questionnaire also contained a school condition assessment, which employed observations of school facilities to determine whether school administrators maintain classroom, equipment, and water, sanitation, and hygiene facilities. School directors were interviewed at a convenient time for them, typically upon arrival of the data collection team first thing in the morning, or after the close of the school day. The survey took approximately one hour to complete. School directors were notified 1-2 weeks ahead of the visit and were asked to consent to and sign an in loco parentis form prior to data collection. An enumerator read a consent script and obtained approval from the director to continue before administering the survey.

GEC-T Baseline Report – Making Ghanaian Girls Great Project 53
Classroom observation tool. A classroom observation tool was used to help enumerators capture descriptions of a variety of practices in pedagogy and classroom management. The classroom observation tool used in this evaluation was modelled after the Stallings’ Tool and was adapted to ensure specific teaching and gender sensitivity techniques. Observations were carried out in two classrooms per treatment and control school, for a total of approximately 144 data points for treatment schools and 144 for control schools. Upon arrival at a school, an enumerator obtained consent from the principal and randomly chose two classrooms P3-JHS1 to be observed, stratified by gender of teacher. At MGCubed schools, one observed classroom would be taught by an MGCubed-trained teacher and the other was to be taught by an MGCubed-trained facilitator. Each classroom received approximately 40 minutes of observation, stratified into four blocks of time, where the first block of ten minutes was considered a “waiting period” with no observation. Enumerators observed a class and evaluated teaching practices, giving particular attention to gender-sensitive practices. Enumerators marked a yes or no for a set of observed practices or tally occurrences of repeating practices. The observations were recorded by a single enumerator per classroom, sitting to the side or in the back of the class to minimize disruption. The tool was not meant be prescriptive in that it remains agnostic to “good” and “bad” teaching practices in the Ghanaian context or more generally. The tool was ultimately used to track certain behaviours of interest, such as encouraging a student or corporal punishment and adopting student-centered pedagogical approaches. Each classroom observation took approximately 60 minutes to complete.
Girl school survey. Originally intended as part of the Household Survey, the Girl’s Survey was extracted as a standalone instrument at baseline to facilitate logistics around interviewing a girl at school. The survey was administered to each cohort girl, both treatment and control, at baseline at the school after administration of learning tests (EGRA/EGMA or SeGRA/SeGMA). If a girl was unable to receive the survey at school, she could be administered the survey at her home later in the day. The Girl’s Survey asked pertinent questions on school management, teacher quality, life skills, and attitudes toward education. Before beginning a learning assessment (EGRA/EGMA), a girl was read an assent script; her subsequent assent, combined with the in loco parentis consent from the head teacher, qualified for consent to administer the Girl’s Survey as well. Girls surveys took approximately 20 minutes to administer.
Benchmark transition tool. At baseline, a random selection of approximately 3 households per intervention and control catchment areas was briefly sampled and administered a baseline transition survey in order to set transition benchmarks; these households will not be visited again after baseline. The baseline transition survey got at the status of children in the household with regard to enrollment in school currently and in years prior. The survey was administered to the caregiver or head of household and carried out up to two times in the same household (for two randomly selected children in the household), only for girls. To select a household, enumerators employed the random walk method from a central landmark in the community, such as a church, mosque, or community center. Enumerators randomly chose households using this method until they had reached the total targeted sample size of 6 girls per catchment area. An eligible girl in the household was one who was between 8-18 years of age, inclusive, and did not attend P1 or P2. Each baseline transition survey took approximately 10 minutes to complete.
GEC-T Baseline Report – Making Ghanaian Girls Great Project 54
Focus group discussions. Focus group discussions were held with girls, boys, female caregivers, and male caregivers. For female and male caregivers, FGDs provided meaningful programmatic data on perceptions towards GEC-T programming at the community level and general community support for girls’ education. FGDs with girls and boys helped better contextualize the school environment and its friendliness towards girls’ learning, teaching quality, and corporal punishment. FGDs with boys and men (male caregivers) also helped to better understand the impact of girl-only programming, be it positive or not. Girls were also asked about Wonder Women afterschool activities, barriers to learning and transition, attendance, life skills programming, and/or other pertinent topics that related to key evaluation outcomes and intermediate outcomes. Participants for FGDs (girls, boys, female and male caregivers) were chosen purposively by school directors to facilitate logistics and ensure convenience of the qualitative events. Where possible, participants were combined from several different schools to ensure a range of contexts. Highly trained enumerators facilitated FGDs, paired gender to gender, and utilizing a structured interview guide and roster sheet. FGDs were to the extent possible split between control and treatment schools, and typically lasted 1.5-2 hours. A total of 16 FGDs were carried out, four of each type of FGD.
Key informant interviews. As part of the evaluation, key informant interviews (KII) helped to inform quantitative findings for various outcomes and intermediate outcomes. KIIs were held with teachers and District Education Officers (DEO) personnel to understand attitudes about girls’ education and barriers to change, challenges around teaching, utility of GEC trainings, as well as perceptions of GEC implementation and management. Teachers for KIIs were selected by enumerators visiting a school after consultation with school principals and were, to the extent possible, stratified by gender. KIIs with DEO officials and teachers involved 2-3 participants per KII to ensure a wide range of opinions and data were collected. All KIIs were guided by semi-structured interview guides and facilitated by a highly trained enumerator. Like FGDs, KIIs were digitally recorded, transcribed, translated, and analysed using the digital software Dedoose. KIIs for teachers were to the extent possible split between control and treatment schools and typically lasted 1-1.5 hours. A total of 14 FGDs were carried out, one per teacher and one per DEO official per district.
Training, piloting, and pre-testing tools
From February 12-18, 2018, the ET worked with a local data collection firm, JMK Consulting, to facilitate a six-day training in Accra for all enumerators, supervisors, and managers in preparation for baseline data collection. The training introduced the program and evaluation goals and touched upon the following specific aspects: the sampling approach, data collection methodologies, data collection ethics, introduction to the various tools (both qualitative and quantitative), and hands-on, field-based practice. A day of field-testing was conducted with students, teachers, head teachers, and community members in 3 local schools (schools not involved in the study) and their respective communities. The tools, especially the head teacher survey, classroom observation tool, and household survey, were revised based on findings from the training and pre-test. JMK Consulting was competitively chosen among several firms that applied to conduct data collection, in part due to its extensive experience in the education field and both quantitative and qualitative data

GEC-T Baseline Report – Making Ghanaian Girls Great Project 55
collection. Field managers and supervisors of the data collection firm had worked several years with JMK Consulting and had managed several major evaluations. When it came to the enumerators themselves, the minimum qualification for an enumerator was a degree/diploma in Basic Education (the minimum professional certificate for teachers in Ghana) or a degree in social science or a related discipline, with at least four major data collection experiences. All enumerators underwent a final test in which their EGRA/EGMA inter-rater reliability (IRR) scores were compared to ensure consistency across marking of the various tools. The lowest performing enumerators were not selected to continue with the full fieldwork. In total, 122 enumerators, supervisors, and managers were trained over the six-day training and continued on to conduct data collection.
Data collection
Baseline data collection took place between February 19 and March 19, 2018, in the seven targeted districts. In total, 11 teams of 11-12 enumerators and supervisors each were dispatched across the seven districts, managed by two to three field coordinators. Most of data collection was completed by Friday, March 16, with a small number of additional “mop-up” activities completed the following week. Enumerator teams faced some challenges during data collection, notably heavy rains and school closures due to a 2-day holiday in early March. In total, -8 control schools of the originally chosen 72 schools (11 percent) were replaced due to either insufficient sample sizes, refusal of a head teacher to participate, or inability to access the school. These schools were replaced from the buffer of matched control schools. Administration of all quantitative tools was completed on electronic tablets using Open Data Kit (ODK) software and Tangerine software (for EGRA and EGMA), with the exception of the SeGRA/SeGMA, which were administered on paper with subsequent marking completed on a tablet.
All qualitative events were digitally recorded and later transcribed and translated. During the four weeks of data collection, the data collection firm, JMK Consulting, reached nearly 100% of all targeted planned activities. Table 10 lays out the expected sample to be reached by instrument/activity, the actual sample realized, and the overall percentage.
Table 10: Data collection instrument sample realized
Instrument/activity Targeted sample Sample realized Percentage EGRA/EGMA 4,084 4,060 99.4% SeGRA/SeGMA 4,084 3,999 97.9% Girl’s Survey 2,774 2,735 98.6% Household survey 2,774 2,706 97.5% Benchmark transition survey 876 941 107.4% School Survey/ Head Teacher Survey 144 146 101.4% Classroom Observation 288 289 100.3% Attendance Spot Checks 864 827 95.7% FGDs 16 16 100.0% KIIs 14 14 100.0%

GEC-T Baseline Report – Making Ghanaian Girls Great Project 56
Child protection
All data collectors, supervisors, field managers, and others involved in the baseline evaluation were required to adhere to Social Impact’s Child Protection Policy and Data Security Policy throughout all evaluation tasks. All personnel involved received a brief training during the full data collection training and signed the policy. All personnel were offered copies of the policy. The policy highlighted key definitions of child protection including physical, sexual, and emotional abuse, exploitation and neglect. The policy also detailed unacceptable behaviours of SI employees and affiliates and what should be done to establish a safe environment for children. Finally, the policy discussed trafficking in persons. All personnel were instructed as to what should be done and who should be contacted should a report need to be filed about child protection. Lastly, all eight members of the evaluation team were certified in Child Protection protocols from the National Institutes of Health. SI’s Child Protection Policy can be found in Annex 18.
Data cleaning and analysis
At baseline data collection, the ET conducted several types of analysis with quantitative and qualitative data. Quantitative data analysis was conducted in Stata software and included: (1) CEM matching and balancing, (2) summary statistics for outcomes and covariates by treatment and control groups, in part to determine the statistical balance of the control and treatment groups at baseline, (3) descriptive statistics of outcome variables and covariates, with the objective of determining if there were any pre-existing gaps in outcomes between treatment and control groups, (4) regression and decomposition analyses of potential explanatory variables on the outcomes of interest (reading and maths scores), and (5) additional analyses as required in this report. Qualitative data analysis was conducted in Dedoose software. The analysis included: (1) development of a codebook, (2) initial reviews of imported transcribed (and sometimes translated) qualitative data, (3) coding of transcripts based on the pre-defined codebook, and (4) Grouping, tallying, and content and pattern analysis to analyse the qualitative data as it pertained to the EQs.
Data Quality Assurance
The ET observed a set of stringent DQA measures throughout the data collection process. For instance, to minimize data entry errors and obtain data quickly for verification, the ET utilised electronic data collection tools to collect most of the data. The ET vetted, tested, and re-tested the data collection instruments, and then trained, tested, and supervised enumerators. Additionally, the ET programmed the tablets with internal quality checks— skip patterns and logic checks— and drop-down menus to ensure accuracy of certain key fields. Further, timestamps and GPS point verification were used to ensure that enumerators were administering surveys at appropriate speeds and that surveys took place where they were supposed to. The data was uploaded to servers directly from each tablet daily for real time review. The ET also hired an external consultant who conducted surprise spot visits on enumerator teams to verify protocols were followed. The consultant and the ET conducted daily data verifications for all four weeks of data collection.

GEC-T Baseline Report – Making Ghanaian Girls Great Project 57
2.5 LIMITATIONS AND MITIGATION MEASURES OF THE BASELINE EVALUATION
Challenges experienced during the baseline phase (pre-, post-, and during data collection) as well as potential and remaining risks and their respective mitigation measures are presented below.
Table 11: Risks and mitigation measures
Theme Risk Mitigation measures CEM approach limitations
There is a potential trade-off between matching precision and sample size in the two regions particularly when the previous GEC-1 control schools are to be excluded. There is always the risk of the inability to find exact match from the limited number of remaining schools in order to create comparable groups.
By gaining access to Ghana’s rich EMIS dataset, the ET was able to adequately sample comparable schools in the districts in which MGCubed implements its activities. Further, baseline balance statistics at school and student level show good balance between treatment and control groups. Matching characteristics for schools are found in Annex 11.
Biased data Current MGCubed schools will have already benefited from activities for the past three years, leading to a situation where students at treatment schools have imbalanced baseline scores compared to control schools.
To avoid this issue, the ET Proposed to exclude the previous control schools from GEC-1 and matched new comparison schools from remaining schools. Exact matching is expected to identify close one to one match. In addition, the use of the DID method will also help in eliminating initial imbalance between treatment and control groups.
Incomplete sample
Due to the complex nature of administering the EGRA/EGMA and SeGRA/SeGMA over the course of two days, there were inevitably some cohort students who were not able to complete both due to being absent.
JMK Consulting and the ET worked to carry out mop-up activities to ensure that the sample sizes between learning assessments and follow-up activities were as high as possible. In the end, 98.2% of the sample completed all learning assessment types.
Bias in sample selection
Head teachers in control schools pushed back on selecting disproportionate amounts of girls, expressing that boys too should have equal weight in the sample. The ET feared selection bias might occur due to head teachers’ identifying of students.
JMK Consulting worked closely with DEOs and Circuit Supervisors to explain the study and the four marginalisation criteria to head teachers. While some expressed frustration, there were no reported instances of head teachers not complying. Sample selection was done per protocol and the final sample was well balanced between treatment groups.
Coordination between data collection teams
To complete data collection on time, teams were split into school-based and community-based sections. Delays in communication between the teams led to confusion as to which households to visit and which surveys to administer.
JMK Consulting and the ET were in close communication on WhatsApp and email on a daily basis throughout data collection and addressed these issues in real time. Further, the ET hired a local consultant to oversee data collection and ensure teams were following correct protocols. Mop-up activities ensured that the full sample sized was reach, even after a team had left a catchment area.
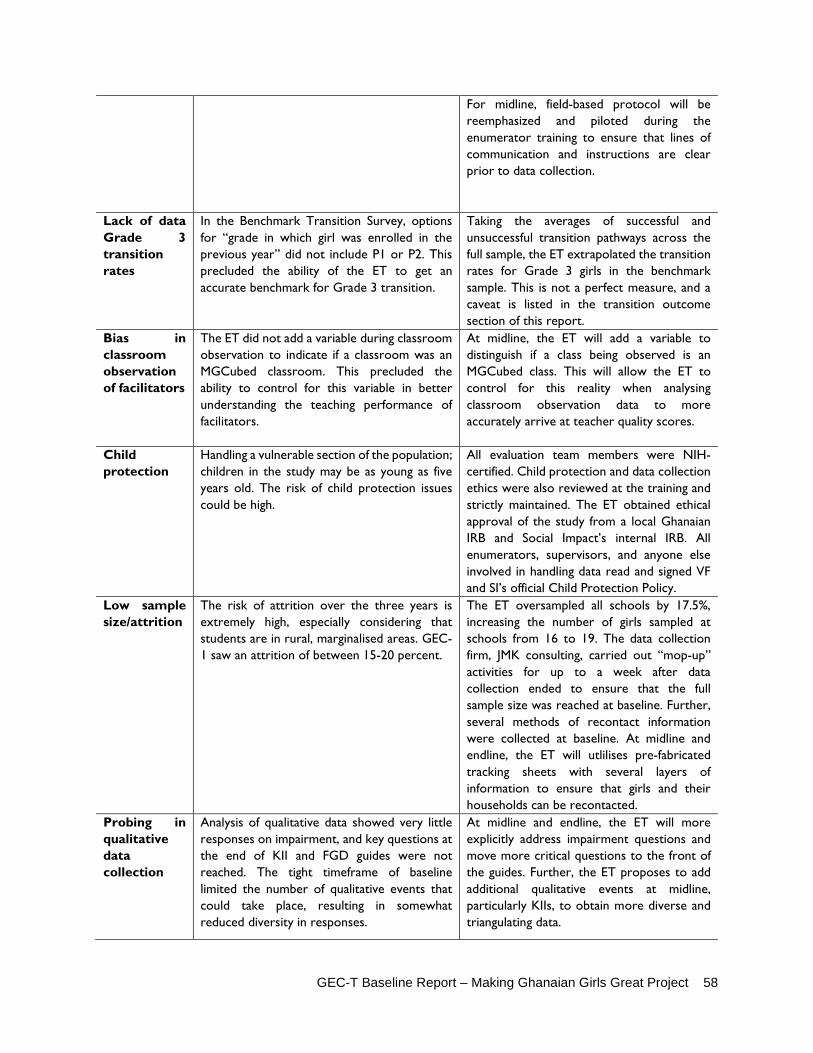
GEC-T Baseline Report – Making Ghanaian Girls Great Project 58
For midline, field-based protocol will be reemphasized and piloted during the enumerator training to ensure that lines of communication and instructions are clear prior to data collection.
Lack of data Grade 3 transition rates
In the Benchmark Transition Survey, options for “grade in which girl was enrolled in the previous year” did not include P1 or P2. This precluded the ability of the ET to get an accurate benchmark for Grade 3 transition.
Taking the averages of successful and unsuccessful transition pathways across the full sample, the ET extrapolated the transition rates for Grade 3 girls in the benchmark sample. This is not a perfect measure, and a caveat is listed in the transition outcome section of this report.
Bias in classroom observation of facilitators
The ET did not add a variable during classroom observation to indicate if a classroom was an MGCubed classroom. This precluded the ability to control for this variable in better understanding the teaching performance of facilitators.
At midline, the ET will add a variable to distinguish if a class being observed is an MGCubed class. This will allow the ET to control for this reality when analysing classroom observation data to more accurately arrive at teacher quality scores.
Child protection
Handling a vulnerable section of the population; children in the study may be as young as five years old. The risk of child protection issues could be high.
All evaluation team members were NIH-certified. Child protection and data collection ethics were also reviewed at the training and strictly maintained. The ET obtained ethical approval of the study from a local Ghanaian IRB and Social Impact’s internal IRB. All enumerators, supervisors, and anyone else involved in handling data read and signed VF and SI’s official Child Protection Policy.
Low sample size/attrition
The risk of attrition over the three years is extremely high, especially considering that students are in rural, marginalised areas. GEC-1 saw an attrition of between 15-20 percent.
The ET oversampled all schools by 17.5%, increasing the number of girls sampled at schools from 16 to 19. The data collection firm, JMK consulting, carried out “mop-up” activities for up to a week after data collection ended to ensure that the full sample size was reached at baseline. Further, several methods of recontact information were collected at baseline. At midline and endline, the ET will utlilises pre-fabricated tracking sheets with several layers of information to ensure that girls and their households can be recontacted.
Probing in qualitative data collection
Analysis of qualitative data showed very little responses on impairment, and key questions at the end of KII and FGD guides were not reached. The tight timeframe of baseline limited the number of qualitative events that could take place, resulting in somewhat reduced diversity in responses.
At midline and endline, the ET will more explicitly address impairment questions and move more critical questions to the front of the guides. Further, the ET proposes to add additional qualitative events at midline, particularly KIIs, to obtain more diverse and triangulating data.

GEC-T Baseline Report – Making Ghanaian Girls Great Project 59
Difficulty in measuring system-level sustainability outcome
System-level sustainability outcomes around DEO/GES are not measurable quantitatively, as directed by the Sustainability Scorecard.
The ET worked with VF to triangulate qualitative data at baseline to come up with quantitative scores for these indicators. The ET worked with VF to revise the indicators as necessary to facilitate their measurement at midline and endline. Where indicators were not measurable at baseline, they were noted with an N/A.
Consent Students were interviewed at school for the majority of the data collection events. Obtaining parental consent was deemed to be infeasible.
During the pre-data collection phase, JMK Consulting and the ET worked together to reach out to each school to obtain to let them know of data collection activities ahead of time. School directors were asked to provide in loco parentis consent. All children were read an assent form and enumerators were trained extensively on how to identify and confirm assent from children. All unwilling schools were excluded from the sample frame. Two schools that refused during data collection were replaced.
Bias in classroom teaching
Classroom observation is inherently biased as it is expected that most teachers, upon having an observer in the back of the classroom, will teach differently than they typically would.
Triangulation of classroom observation with the Girl’s Survey and FGDs helped to clarify and isolate bias at baseline and will be further employed in future data collection rounds.
Self-reporting response Bias
While test scores are expected to be free from reporting bias by design, some of the marginalisation characteristics, barriers, and IOs (such as community attitudes towards education) reported by participants may be biased due to reporting error. An example of this was that information on impairment collected from both the beneficiary girls and their caregivers mostly did not match.
According to the literature, reporting bias is an upshot of participant’s demographics such as, gender, age, race/ethnicity and location etc. To isolate the effects of these characteristics on hypothetical relationships presented in theory of change, we control for these respondent specific characteristics when we validate the theory of change (regression analysis). Treatment status is considered to be another source of reporting bias and we will test its magnitude in the midline and endline to capture changes in bias across time (by comparing pre-post intervention).
Clarity in qualitative data collection
At baseline, some FGD transcriptions did not consistently identify which respondents were speaking. In such cases, it was impossible in to break the data down to the individual level. Further, it appears that all FGDs took place at treatment schools at baseline, even though the methodology called for some control schools. It was unclear whether all participants were from treatment schools.
At midline, the ET will work with the data collection firm to hone the protocols around note-taking and identification of individuals in FGDs. Further, if deemed relevant, the ET will revisit the idea of visiting control schools to conduct qualitative data collection.
Weather and delays
Heavy rain delayed data collection in several areas as did a 2-day holiday in early March. The ET ran the risk of not completing data
JMK consulting increased their numbers of enumerators to ensure that data collection was completed within the time frame given.
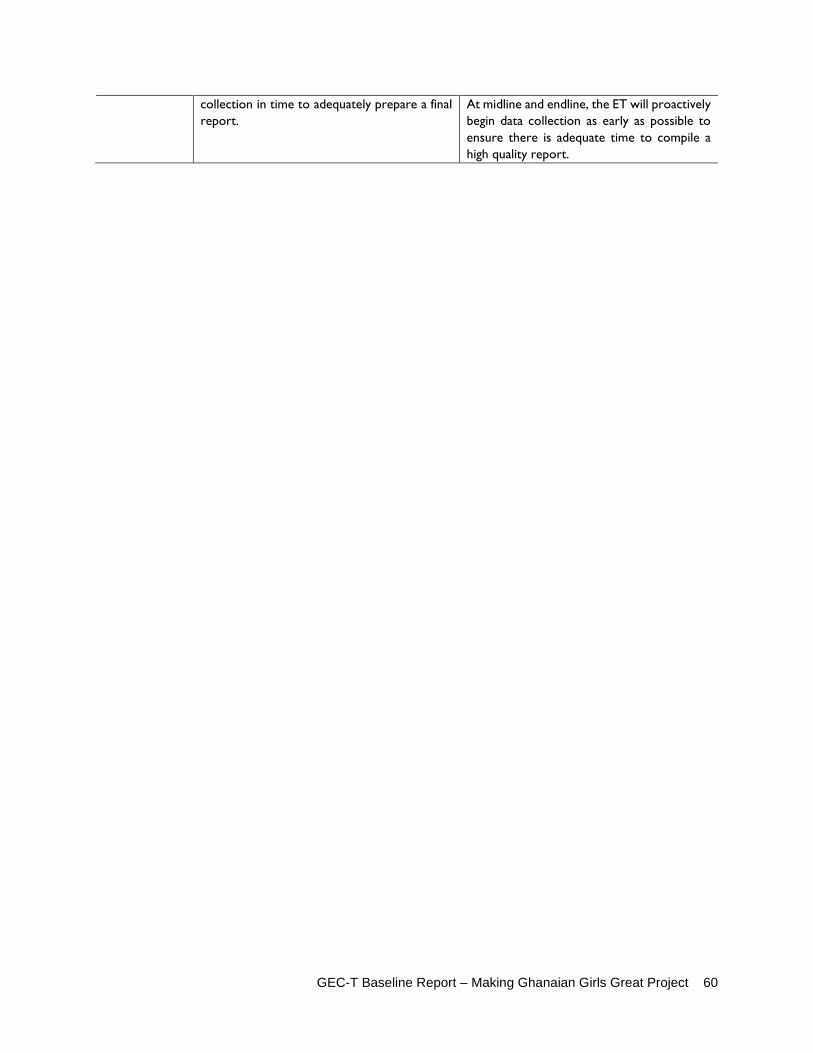
GEC-T Baseline Report – Making Ghanaian Girls Great Project 60
collection in time to adequately prepare a final report.
At midline and endline, the ET will proactively begin data collection as early as possible to ensure there is adequate time to compile a high quality report.

GEC-T Baseline Report – Making Ghanaian Girls Great Project 61
3. KEY CHARACTERISTICS OF BASELINE SAMPLES
3.1 PROJECT BENEFICIARIES The ultimate targeted beneficiaries of this evaluation are the cohort girls—those marginalised girls identified in GEC-1 in the 72 schools in which MGCubed operates. Girls are defined as “marginalised” if they possess the four criteria mentioned in the Sampling section earlier in this report. Additional beneficiaries include teachers and principals in the treatment schools, parents and caregivers in the community, and district-level GES officials, all of whom receive some type of MGCubed intervention be it trainings, workshops, or educational lessons. The targeted groups of this evaluation are in-school marginalised girls, girls at risk of dropping out of school, in-school marginalised boys, teachers in treatment schools, district and circuit-level GES personnel, and community members. These groups were described in greater detail in Section 1.3, earlier in this report.
3.2 REPRESENTATIVENESS OF THE LEARNING AND TRANSITION SAMPLES ACROSS REGIONS, AGE GROUPS, GRADES, IMPAIRMENT STATUS AND SEX OF THE BENEFICIARIES Table 12, Table 13, and Table 14, lay out the distribution of sampled girls and boys across the two regions (Greater Accra and Volta), the five grades (P3 through JHS1), and seven categorical age groups from 6-20+ years of age. A total of 2,721 girls and 967 boys were sampled for the evaluation. The actual realized sample sizes at baseline are slightly less than the earlier estimates but sufficient enough to maintain the desired analytical power.
Sample size by region
Table 12 shows that 56% of girls were sampled from Greater Accra region and the remaining 44% of girls were selected from Volta region. Equal proportion of boys were also sampled from these two regions.26 The beneficiary girls in the treatment group are divided almost equally (50.6% and 49.4% respectively) across regions, while a disproportionate distribution is found for the comparison group. A total of 61% of comparison girls were selected from Greater Accra while the remaining 39% of comparison girls were selected from Volta region. The regional distribution of boys across treatment and comparison groups follows a similar pattern.
26 Boys sample size was ad hoc and is based on overall distribution of boys and girls in an average class. The whole objective of including boys in the sample is to gauge relative performance of girls with respect to boys.
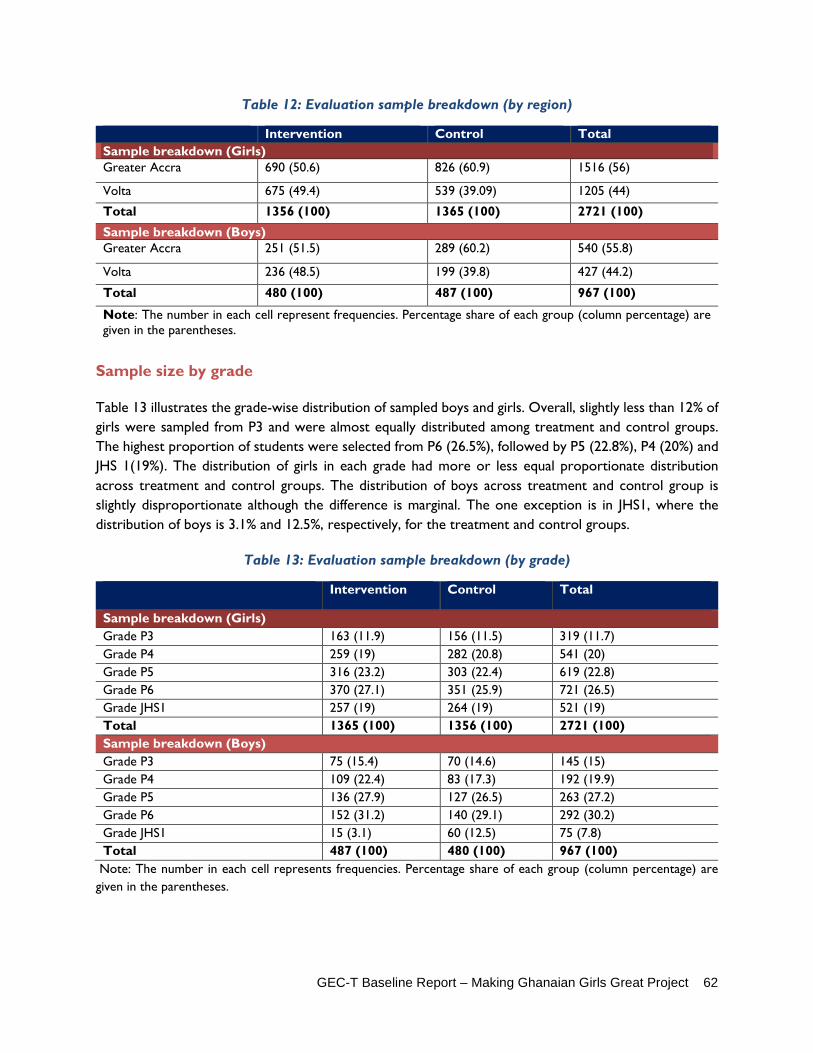
GEC-T Baseline Report – Making Ghanaian Girls Great Project 62
Table 12: Evaluation sample breakdown (by region)
Intervention Control Total Sample breakdown (Girls) Greater Accra 690 (50.6) 826 (60.9) 1516 (56)
Volta 675 (49.4) 539 (39.09) 1205 (44)
Total 1356 (100) 1365 (100) 2721 (100) Sample breakdown (Boys) Greater Accra 251 (51.5) 289 (60.2) 540 (55.8)
Volta 236 (48.5) 199 (39.8) 427 (44.2)
Total 480 (100) 487 (100) 967 (100)
Note: The number in each cell represent frequencies. Percentage share of each group (column percentage) are given in the parentheses.
Sample size by grade
Table 13 illustrates the grade-wise distribution of sampled boys and girls. Overall, slightly less than 12% of girls were sampled from P3 and were almost equally distributed among treatment and control groups. The highest proportion of students were selected from P6 (26.5%), followed by P5 (22.8%), P4 (20%) and JHS 1(19%). The distribution of girls in each grade had more or less equal proportionate distribution across treatment and control groups. The distribution of boys across treatment and control group is slightly disproportionate although the difference is marginal. The one exception is in JHS1, where the distribution of boys is 3.1% and 12.5%, respectively, for the treatment and control groups.
Table 13: Evaluation sample breakdown (by grade)
Intervention Control Total
Sample breakdown (Girls) Grade P3 163 (11.9) 156 (11.5) 319 (11.7) Grade P4 259 (19) 282 (20.8) 541 (20) Grade P5 316 (23.2) 303 (22.4) 619 (22.8) Grade P6 370 (27.1) 351 (25.9) 721 (26.5) Grade JHS1 257 (19) 264 (19) 521 (19) Total 1365 (100) 1356 (100) 2721 (100) Sample breakdown (Boys) Grade P3 75 (15.4) 70 (14.6) 145 (15) Grade P4 109 (22.4) 83 (17.3) 192 (19.9) Grade P5 136 (27.9) 127 (26.5) 263 (27.2) Grade P6 152 (31.2) 140 (29.1) 292 (30.2) Grade JHS1 15 (3.1) 60 (12.5) 75 (7.8) Total 487 (100) 480 (100) 967 (100)
Note: The number in each cell represents frequencies. Percentage share of each group (column percentage) are given in the parentheses.

GEC-T Baseline Report – Making Ghanaian Girls Great Project 63
Sample size by age group The distribution of girls by age shows that around 98% of sampled girls belong to the broader age group between 9 to 17 years (Table 14). Among these, approximately 37% of girls in the sample are 12 to 13 years old followed by girls within the age bracket of 14 to 15 years (26.2%) and 9 to 11 years (23.6%). Girls in higher age groups, for example 16 to 17 years and 18 to 19 years, constitute only 11% to 12% of the total sample of marginalised girls. Very few students (less than 1%) in the sample are older than 19 years. Girls in each age group are almost equally distributed in treatment and control groups, demonstrating between-group (treatment and control) balance in terms of age.
Table 14: Evaluation sample breakdown (by age)
Intervention (Baseline) Control (Baseline) Total (Baseline)
Sample breakdown (Girls) n (%) n (%) N (%) Aged 6-8 22 (1.6) 18 (1.3) 40 (1.5) Aged 9-11 347 (25.4) 296 (21.8) 643 (23.6) Aged 12-13 530 (38.8) 481 (35.5) 1011 (37.2) Aged 14-15 338 (24.8) 375 (27.7) 713 (26.2) Aged 16-17 107 (7.8) 151 (11.1) 258 (9.5) Aged 18-19 20 (1.5) 33 (2.4) 53 (2) Aged 20+ 1 (0.07) 2 (0.15) 3 (0.11) Girls (sample size) 1365 (100) 1356 (100) 2721 (100) Sample breakdown (Boys) Aged 6-8 2 (0.41) 6 (1.25) 8 (0.83) Aged 9-11 156 (32.0) 94 (19.6) 250 (25.9) Aged 12-13 183 (37.6) 154 (32.1) 337 (34.9) Aged 14-15 96(19.7) 137 (28.5) 233 (24.1) Aged 16-17 44 (9) 52 (10.8) 96 (9.9) Aged 18-19 6 (1.2) 32 (6.7) 38 (3.9) Aged 20+ 0 (0) 5 (1) 5 (0.5) Boys (sample size) 487 (100) 480 (100) 967 (100)
Note: The number in each cell represent frequencies. Percentage share of each group (column percentage) are given in the parentheses.
Sample size by impairment
Table 15 lays out the distribution of students based on impairment. Data in the first column and the third column summarise caregivers’ responses about their girls’ impairment. In the household survey, these questions were asked about any cohort girl irrespective of her age. The second and fourth columns represent information from the Girl’s Survey where the same questions were asked to girls above 12 years of age only. Based on the Washington Groups’ definition, the ET considered vision impairment, hearing impairment, mobility impairment, cognitive impairment, selfcare impairment, and communication impairment. A girl was defined as impaired if she had “a lot of difficulty” with one of the above activities or “could not do an activity at all.”

GEC-T Baseline Report – Making Ghanaian Girls Great Project 64
Table 15 shows the overall distribution of marginalised students with impairment as reported by caregivers and girls themselves separately. The distribution from the two different surveys yields similar results. Table 15 shows that around 7.5 percent of sampled girls in treatment schools have some form of impairment. The incidence is slightly lower in the control group (6.2%). On average, the proportion in the entire sample is 6.85%. There is no difference found in responses between the caregivers and girls for the control group, though the ET found almost one-fourth of a percentage point difference between the caregivers’ response and the girls’ response in the treatment group. One interesting point to note here is that in most of the cases, a caregiver’s response is slightly lower than the girl’s response. Conversely, cognitive impairment reported by a caregiver is much higher than the girl’s response. This may be due to the fact that a caregiver is better poised to diagnose a non-apparent cognitive impairment in a girl while the girl herself may consider herself no more or less different than her counterparts in cognitive skills. When comparing a girl’s answer on impairment to her caregivers, there was only an 8.5% overlap in accuracy; that is to say that in only 1 of 12 cases, a girl’s answer matched that of her caregiver. Given these discrepancies, the ET considered the caregiver-reported impairment rates as the most authoritative as the caregiver was thought to be more objective in answering about challenges that a girl faced.
Table 15: Evaluation sample breakdown, by impairment
Sample breakdown (Girls)
Intervention Control
Caregiver’s response
Girl’s response Caregiver’s response
Girl’s response
Girls with impairment (% overall)
7.5% 6.2% 6.2% 6.1%
Information per impairment Vision impairment 1.1% 1.3% 0.4% 0.7% Hearing impairment 0.3% 0.7% 0.4% 0.5% Mobility impairment 0.0% 0.4% 0.0% 0.5% Cognitive impairment 5.8% 4.1% 5.2% 4.0% Self-care impairment 0.1% 0.8% 0.1% 0.5% Communication impairment 1.1% 0.8% 0.1% 1.0%
Note: Based on information received from caregivers (household data) and girls (Girl’s Survey data)
Educational Marginalisation
According to the GESI addendum on marginalisation, “the universal (e.g., age, gender, impairment and ethnicity) and contextual characteristics (e.g., language, geography, orphan status, migration, parental education, marital status etc) marginalise girls and impede their educational achievements. These marginalised characteristics, together with social immobility and poverty, create an unsurmountable barrier to achieve higher outcomes.”27 The following paragraphs summarize some of the baseline descriptive characteristics of the sample in the context of the GESI-defined main barriers to educational achievement.
27 GESI addendum provided by the FM in January 2018.

GEC-T Baseline Report – Making Ghanaian Girls Great Project 65
Situational challenges: Table 16 presents girls’ marginalisation status in terms of socio-economic background, extent of parental care at home, marital status, and their language difficulties to cope with instructions in schools. Baseline survey data shows that both treatment and comparison groups are well balanced in terms of proportion of girls with similar characteristics. For example, the survey data shows that around 11-12% of girls in each group have either lost one or both parents, around 18% from each group live without both parents, and almost 40% of students live in female-headed households.
Economic Challenges: In terms of economic conditions, almost 3 in every 4 households in each treatment and comparison group reported that it is difficult for them to afford girls’ education. Around half of the families in each group do not possess any land for themselves. About 15% of households are unable to meet their basic needs, and slightly less than one in every ten girls went to sleep hungry for “many” days in the past year.
Illiteracy: While socio-economic challenges are stark, levels of education among heads of household and caregivers is also significantly challenging for a girl’s educational development. As the baseline survey data shows, more than one-third of girls are from households where the head of the household does not have any education. The proportion is much lower for caregivers at 3%. In terms of balance between treatment and control, survey data shows that these characteristics are evenly distributed across treatment and control groups.
Language gap: Table 16 also reports the language gap as one of the drivers of lower educational achievement. In a majority of the cases, the language of instruction is English. The language gap captures two main components: if the language of instruction is different from the language spoken at home, and if the girls do not speak the language of instruction at all. The proportion of the latter is very small. The baseline survey data shows that around 93-94% of girls in both control and treatment groups do not speak English at home even though it is the official language of instruction in school. Among these girls, more than 70% (treatment) to 75% (control) do not speak the language well, or do not speak it at all (4%).
Table 16: Girls' characteristics
Intervention (Baseline)
Control (Baseline)
Sample breakdown (Girls) Orphans (%) - Single orphans 11% 11% - Double orphans 0.6% 0.9% Living without both parents (%) 18% 18% Living in female headed household (%) 39% 36% Percent of female household heads with no education 51% 49% Married (%) 0.8% 0.9% Mothers (%) - Under 18 0.7% 0.5% - Under 16 0.5% 0.3% Poor households (%) - Difficult to afford for girl to go to school 73% 73% - Household doesn't own land for themselves 47.9% 50.6%

GEC-T Baseline Report – Making Ghanaian Girls Great Project 66
- Material of the roof (is mud, thatch, wood, grass/straw, cardboard, or tarp) 28
9.3% 12.7%
- Household unable to meet basic needs 13% 15% - Gone to sleep hungry for many days in past year 7% 7%
Language difficulties: - LoI different from mother tongue (%) 93% 94% - Girl doesn’t speak LoI well (%) 70.2% 75.2% Parental education - HoH has no education (%) 37% 35% - Primary caregiver has no education (%) 3% 3% Ethnicity/language group - Akan 3.4% 5.3% - Ga 0.5% 1.5% - Ewe 18.8% 24.3% - Dangme 37.7% 37% - Guan 0.3% 0.4% - Likpakpa 2.0% 1.5% - Other 35.2% 27.5% Note: Information in each cell is calculated based on girls in P3 through JHS1.
3.3 BARRIERS Table 17 below lists potential barriers to learning and transition. These barriers span the categories of parental/caregiver support, attendance, school facilities, and teacher behaviour. Qualitative data on barriers to transition and learning can be found in the section on Transition, 4.3.
The prevalence of each barrier (count and percent) in the overall sample is shown in the “Total” column of Table 17. The table also displays the prevalence of each barrier across treatment and control schools/communities and disaggregates each group by impairment status. Comparing the sub-groups to the overall sample indicates whether any of these groups show a greater (or smaller) prevalence of a reported barrier than the sample as a whole. The total number of students who were determined to have some form of impairment (vision, hearing, cognition, mobility, self-care, and/or communication) was 183, or 6.73% of respondents.
The potential barriers with the largest prevalence overall (not disaggregated into sub-categories) were inability to access drinking water facilities (29.28%), low support at home for staying in school and doing well (26.14%), teachers often being absent from class (25.98%), inadequate seats to accommodate all the students in a classroom (24.94%), teachers treating boys and girls differently in the classroom (22.09%), and attending school less than half the time (22.05%). In general, the prevalence of many of these barriers was higher among students in control group schools, and students with disabilities. Control group girls with disabilities saw a higher prevalence of barriers than any other group (Table 17).
28 Schreiner, Mark and Woller, Gary. “A Simple Poverty Scorecard for Ghana.” 16 March 2010, www.microfinance.com/#Ghana.

GEC-T Baseline Report – Making Ghanaian Girls Great Project 67
Impaired girls feel disproportionately more unsafe traveling to/from school when compared to their counterparts, as reported by caregivers. Of select importance are large differences between key sub-groups with respect to certain barriers. For example, when asked if it was fairly or very unsafe to travel to schools in the area, caregivers of girls in control schools were nearly 80% more likely to answer affirmatively (15.85% compared to 8.95%). Further, the percentage of caregivers of impaired girls who answered that it was unsafe to travel to schools in the area was nearly seven times the average (14.46% compared to 2.1%). Similarly, 22.9% of caregivers of impaired girls answered that their girl did not feel safe traveling to/from school, a rate which was nearly double the overall average (13.71%).
Table 17: Potential barriers to learning and transition
Barrier Intervention
N=1240
Intervention: Impairment
n=100
Control
N=1249
Control: Impairment
n=83 Total N
Fairly or very unsafe travel to schools in the area (%) 111 (8.95) 11 (11.00) 198
(15.85) 19 (22.89) 339 (12.46) N=2656
Doesn’t feel safe travelling to/from school (%) 136 (10.97) 8 (8.00) 200
(16.01) 19 (22.89) 370 (13.71) N=2698
Sufficient time to study: High chore burden 41 (3.31) 8 (8.00) 26 (2.08) 2 (2.41) 77
(2.83) N=2621
Doesn’t get support to stay in school and do well (%) 335 (27.02) 47 (47.00) 297
(23.78) 32 (38.55) 711 (26.14) N=2720
Attends school half the time (%) 5 (5.26) 2 (15.38) 13
(16.05) - 20 (10.26) N=195
Attends school less than half time (%) 22 (23.16) 3 (23.08) 16
(19.75) 2 (33.33) 43 (22.05) N=195
Doesn’t feel safe at school (%) 17 (1.37) 2 (2.00) 26 (2.08) 12 (14.46) 57
(2.10) N=2698
No seats for all students (%) 307 (24.76) 16 (16.00) 315
(25.22) 22 (26.51) 673 (24.74) N=2698
Difficult to move around school (%) 98 (7.90) 8 (8.00) 148
(11.85) 11 (13.25) 268 (9.85) N=2698
Not able to access drinking water facilities 351 (28.31) 27 (27.00) 374
(29.94) 21 (25.30) 790 (29.04) N=2698
Not able to access toilet at school 110 (8.87) 11 (11.00) 165
(13.21) 12 (14.46) 303 (11.14) N=2698
Not able to access areas where children play/ socialise
75 (6.05) 3 (3.00) 87 (6.97) 6 (7.23) 175 (6.43) N=2698
Disagrees teachers make them feel welcome 52 (4.19) 5 (5.00) 44 (3.52) 5 (6.02) 107
(3.93) N=2698
Agrees teachers treat boys and girls differently in the classroom
275 (22.18) 21 (21.00) 269 (21.54) 11 (13.25) 569
(21.91) N=2698
Agrees teachers often absent from class 345 (27.82) 27 (27.00) 302
(24.18) 15 (18.07) 701 (25.77) N=2698

GEC-T Baseline Report – Making Ghanaian Girls Great Project 68
3.4 INTERSECTION BETWEEN KEY CHARACTERISTICS AND BARRIERS This section explores the intersection between key characteristics and barriers as presented in Table 16 and Table 17 separately and present the most prevalent barriers for different subgroups of girls (Table 18). The cross-tab in matrix format is used to understand and inform the most significant barriers for key subgroups that may exist at the home, school, and at the system level. Qualitative data on main barriers to learning and transition can be found in the Transition outcome section of this report (4.3).
When looking at cross-tabbed data between marginalisation criteria and barriers, marginalised girls have higher barriers to climb than their non-marginalised counterparts. This is particularly true for girls who do not speak the language of instruction well and for impaired girls. High chore burdens were reported at higher rates by mothers (6.67%), married girls (4.35%), and girls whose household was headed by someone with no formal education (3.57%), than in the general sample, where a high chore burden was reported by 3.14% of respondents.
Low support for staying in school and doing well was reported at higher rates in virtually all marginalisation categories than in the general sample. For example, girls who do not speak the language of instruction (28.3%) do not get support to stay in school and do well at a rate approximately 2 percentage points higher than the average. A similar hurdle is observed for girls who come from poor backgrounds. As the table suggests, girls who belong to a household that finds it difficult to afford girls’ education and who have gone to sleep hungry many days in the past year, do not receive support to stay in school and do well at a higher rate than the average. The same is true of girls who have a impairment.
Most dimensions of marginalisation are also associated with higher than average rate of feeling unwelcome by the teacher. As Table 18 shows, girls who come from a family where the caregiver has no education (5.95%), does not speak the language of instruction well (4.58%), who finds it difficult to afford schooling of the girl (4.34%), is materially poor (4.15%), or girls with some form of impairment (5.46%), are more likely to report that they are not welcome by teachers in the school as compared to the average (3.93%). The highest percentage is found among married girls (8.7%) and mothers of a child (13.3%). Girls from most of these groups attend school less than half time (Table 18).
Table 18: Examples of barriers to education by characteristic
Barriers
CHARACTERISTICS
Caregiver has
no educati
on
Girl does not
speak LOI, or
does not
speak LOI well
Household is poor
Girl is marri
ed
Girl is a
mother
Girl is impair
ed
Difficult to
afford for
girl to go to
school
Household
doesn't own land
Material of the
roof (is mud,
thatch, wood,
grass/straw,
cardboard, or tarp)
Household
unable to meet
basic needs
Gone to
sleep hungry for many days
in past year
Avg. Rate 3.14% 71.86
% 72.46
% 45.47% 11.00% 13.96% 7.19% 0.86% 0.56% 6.85%

GEC-T Baseline Report – Making Ghanaian Girls Great Project 69
Parental/caregiver support:
High chore burden
2.88% 3.57% 3.65% 3.15% 3.29% 4.84% 3.75% 4.69% 4.35% 6.67% 5.46%
Doesn’t get support to stay in school and do well
26.61% 23.81% 28.33
% 28.20% 25.35% 26.99% 27.88% 31.77% 17.39% 6.67% 43.17%
School Level:
Teachers make them feel unwelcome
3.93% 5.95% 4.58% 4.34% 3.79% 4.15% 5.09% 2.60% 8.70% 13.33% 5.46%
Attends school less than half time
1.61% 2.38% 1.82% 1.70% 1.81% 1.73% 1.61% 1.04% 0% 0% 2.73%
Note: data points in red are higher than the sample average.
3.5 APPROPRIATENESS OF PROJECT ACTIVITIES TO THE CHARACTERISTICS AND BARRIERS IDENTIFIED Response from the Varkey Foundation
The baseline mapping of marginalised girls’ characteristics has been very helpful for the project, and while there is a clear line of agreement between what the project’s own mapping of characteristics shows, the data provides additional layers of critical information which will support both better targeting, beneficiary engagement, and content development. Thus, the project does not contest any of the findings presented and welcomes the opportunity to understand the situation of its primary beneficiaries and their households in a more detailed manner.
The table below identifies the key areas where the External Evaluator has pinpointed a critical characteristic and its implications for the Theory of Change.
Table 19: Project response to characteristics and barriers identified by the evaluator
Characteristic Evidence Comment on issue Implications for the Theory of Change
Disability - identification (Characteristic)
7.5% (205) of the beneficiary sample of marginalised girls (and 6.85% of the overall sample) has a physical or cognitive disability. This figure is derived from caregiver identification.
This proportion is far higher than the project’s own mapping, which indicates that of the core GEC cohort there 16 girls (and 12 boys) with a disability (0.5%).
This is covered in detail in the row below.
The implications of this finding in terms of the identification of disability within the beneficiary sample are two-fold. Overall, the project must invest time and staff effort

GEC-T Baseline Report – Making Ghanaian Girls Great Project 70
The breakdown of disability types is as follows:
Vision disability: 1.1%
Hearing disability: 0.3%
Mobility disability: 0.0%
Cognitive disability: 5.8%
Self-care disability: 0.1%
Communication disability: 1.1%
The breakdown of disability types is as follows:
Vision disability: 0.12%
Hearing disability: 0.09%
Mobility disability: 2.16%
Cognitive disability: 0.03%
Communication disability: 0.03%
We see that the starkest difference is in the identification of cognitive disability (5.8% vs. 0.03%).
There are reasons for the discrepancy. The first reason is that the project’s field team do not explicitly look for disability relating to cognition, communication, or self-care, which account for 80% disability cases identified in the beneficiary sample at Baseline. When taking this into account there is only a variation of one percentage point.
The fact that this data is based on an identification exercise by caregivers is interesting. The project would normally assume that caregivers would rather deny instead confirm a child’s disability, largely
into ensuring a more comprehensive identification of disability through:
1. Establishing a more comprehensive definition of disability, and socialising this amongst both teachers and District Coordinators. 29
2. Supporting teachers to better identify disability.
3. Establishing a clearer process for District Coordinators to communicate any new identifications to the MEL Team and ensure pupil contact records are updated.
The project plans to do the following:
•Design and deliver a community session on ‘How to support children with disability’, delivered to teachers and community members. •The Education Team will attend a training course on special education in order to ensure all types of learners are being catered for as best as possible. Not only will this be reflected in the MGCubed class content delivered to pupils but this will enable the Education Team to better deliver adult training in this area.
29 Currently the disability categories are as follows: Arm disability, Leg disability, Vision loss/Blindness, Hearing loss/Deafness, Chronic Illness, Autism

GEC-T Baseline Report – Making Ghanaian Girls Great Project 71
due to the stigma attached. This situation might be influenced by the perceived gaining of a cash or in-kind benefit, however. Thus, the framing of the questions used in the identification exercise are important as they could potentially influence the responses obtained.
If we assume the identification exercise was not biased in any way, the project concludes that caregivers are potentially better able to identify disability better than teachers, who the project’s Community Team relies on for identification purposes, and also the project’s field officers (District Coordinators) who review the disability lists on a termly basis and update the project’s pupil contact records if disability is identified.
Disability (Barrier)
In considering the interaction between characteristics and barriers the report concludes that disabled girls are disproportionately affected by educational barriers compared with girls without a disability.
In particular:
“Disabled girls feel disproportionately more unsafe traveling to/from school when compared to their
Given that there is a far higher number of disabled girls than the project had accounted for, this finding is pertinent because it indicates that a higher proportion of girls are disproportionately affected by critical barriers, notably a feeling of safety on their journeys to school and feeling welcome at school. This differential experience, compared with girls without an
This evidence reinforces – rather than changes – what the project had already held to be the case: that multiple and overlapping levels of marginalisation act to constrain a girl’s ability to fulfil her educational potential.
The project recognises the need to better tackle disability issues across its educational content, particularly in terms of creating attitudinal and behavioural change amongst educators within schools.
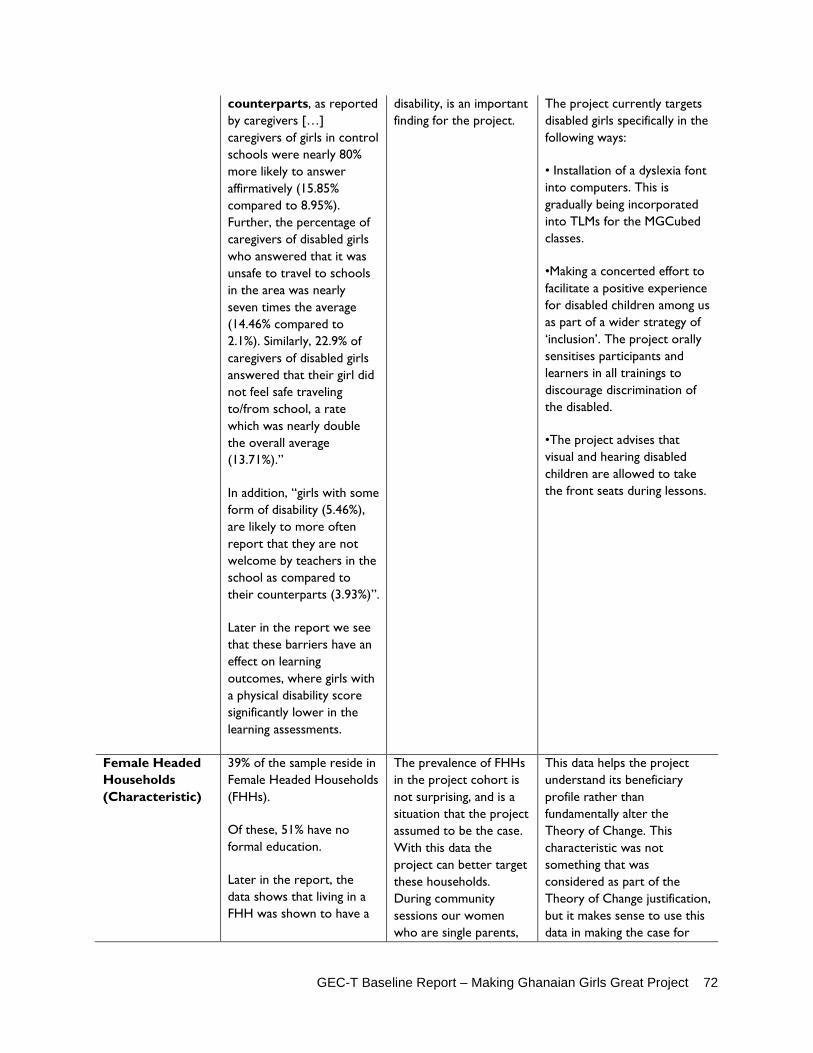
GEC-T Baseline Report – Making Ghanaian Girls Great Project 72
counterparts, as reported by caregivers […] caregivers of girls in control schools were nearly 80% more likely to answer affirmatively (15.85% compared to 8.95%). Further, the percentage of caregivers of disabled girls who answered that it was unsafe to travel to schools in the area was nearly seven times the average (14.46% compared to 2.1%). Similarly, 22.9% of caregivers of disabled girls answered that their girl did not feel safe traveling to/from school, a rate which was nearly double the overall average (13.71%).”
In addition, “girls with some form of disability (5.46%), are likely to more often report that they are not welcome by teachers in the school as compared to their counterparts (3.93%)”.
Later in the report we see that these barriers have an effect on learning outcomes, where girls with a physical disability score significantly lower in the learning assessments.
disability, is an important finding for the project.
The project currently targets disabled girls specifically in the following ways:
• Installation of a dyslexia font into computers. This is gradually being incorporated into TLMs for the MGCubed classes.
•Making a concerted effort to facilitate a positive experience for disabled children among us as part of a wider strategy of ‘inclusion’. The project orally sensitises participants and learners in all trainings to discourage discrimination of the disabled.
•The project advises that visual and hearing disabled children are allowed to take the front seats during lessons.
Female Headed Households (Characteristic)
39% of the sample reside in Female Headed Households (FHHs).
Of these, 51% have no formal education.
Later in the report, the data shows that living in a FHH was shown to have a
The prevalence of FHHs in the project cohort is not surprising, and is a situation that the project assumed to be the case. With this data the project can better target these households. During community sessions our women who are single parents,
This data helps the project understand its beneficiary profile rather than fundamentally alter the Theory of Change. This characteristic was not something that was considered as part of the Theory of Change justification, but it makes sense to use this data in making the case for
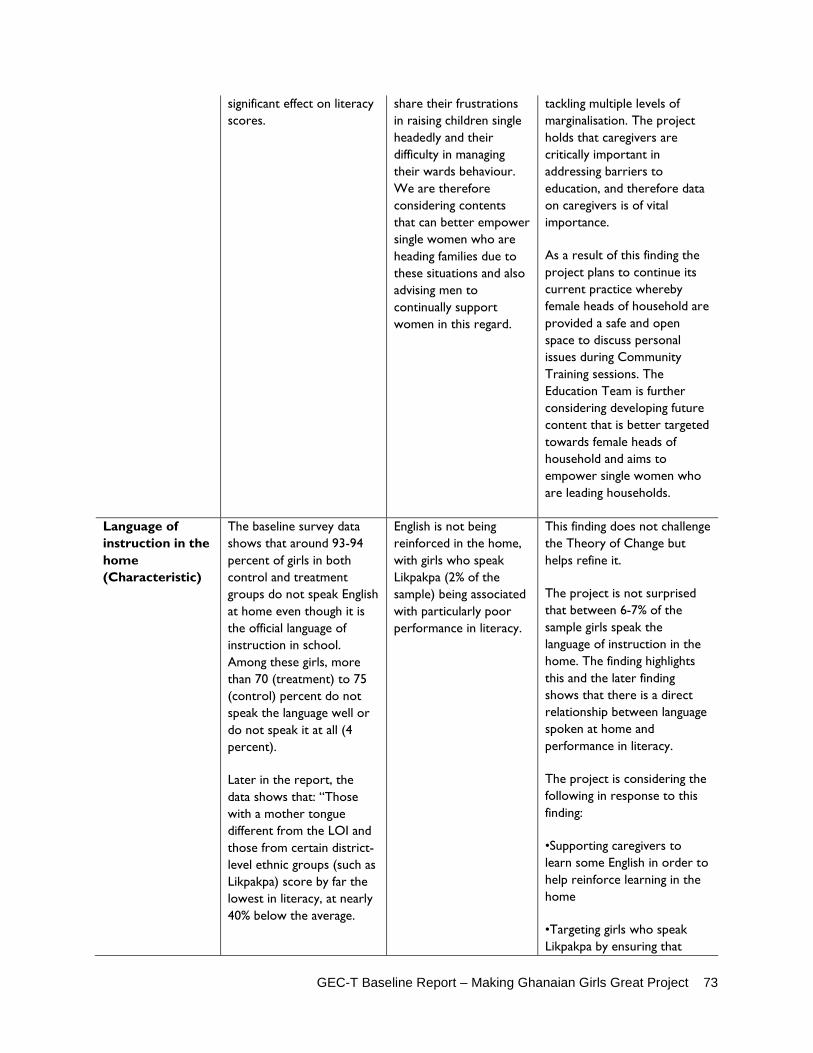
GEC-T Baseline Report – Making Ghanaian Girls Great Project 73
significant effect on literacy scores.
share their frustrations in raising children single headedly and their difficulty in managing their wards behaviour. We are therefore considering contents that can better empower single women who are heading families due to these situations and also advising men to continually support women in this regard.
tackling multiple levels of marginalisation. The project holds that caregivers are critically important in addressing barriers to education, and therefore data on caregivers is of vital importance.
As a result of this finding the project plans to continue its current practice whereby female heads of household are provided a safe and open space to discuss personal issues during Community Training sessions. The Education Team is further considering developing future content that is better targeted towards female heads of household and aims to empower single women who are leading households.
Language of instruction in the home (Characteristic)
The baseline survey data shows that around 93-94 percent of girls in both control and treatment groups do not speak English at home even though it is the official language of instruction in school. Among these girls, more than 70 (treatment) to 75 (control) percent do not speak the language well or do not speak it at all (4 percent).
Later in the report, the data shows that: “Those with a mother tongue different from the LOI and those from certain district-level ethnic groups (such as Likpakpa) score by far the lowest in literacy, at nearly 40% below the average.
English is not being reinforced in the home, with girls who speak Likpakpa (2% of the sample) being associated with particularly poor performance in literacy.
This finding does not challenge the Theory of Change but helps refine it.
The project is not surprised that between 6-7% of the sample girls speak the language of instruction in the home. The finding highlights this and the later finding shows that there is a direct relationship between language spoken at home and performance in literacy.
The project is considering the following in response to this finding:
•Supporting caregivers to learn some English in order to help reinforce learning in the home
•Targeting girls who speak Likpakpa by ensuring that

GEC-T Baseline Report – Making Ghanaian Girls Great Project 74
Master Teachers speak some Likpakpa
This is not to devalue the importance of mother tongue oracy in the home – the project recognises the benefits of mother tongue mastery – aside from the core cultural and communicative value it represents – in promoting the acquisition of other languages. Thus, the project does not see mother tongue and Language of Instruction as mutually exclusive but potentially complementary.
Feeling unwelcome in the classroom/school (Barrier)
Most dimensions of marginalisation are also associated with higher than average rate of feeling unwelcome by the teacher. Girls who come from a family where the caregiver has no education (5.95%), does not speak the language of instruction well (4.58%), who finds it difficult to afford schooling of the girl (4.34%), is materially poor (4.15%), or girls with some form of disability (5.46%), are more likely to report that they are not welcome by teachers in the school as compared to the average (3.93%). The highest percentage is found among married girls (8.7%) and mothers of a child (13.3%). Girls from most of these groups attend school less than half time.
Later in the report we see that not feeling welcome at school by a teacher was associated with the lowest literacy and numeracy
The evidence suggests that there are some teachers within the sample that do not make girls feel welcome, and that this correlates with particular sub-groups of girls whose marginalisation status is multi-layered. It also suggests that to raise learning outcomes amongst these girls the role of the teacher is key.
In line with the Theory of Change, this highlights how educators potentially reinforce and sustain marginalisation status. In response, the project wishes to re-emphasise the role of the teacher in providing a supportive learning environment and, in doing so, overcoming multiple levels of marginalisation experiences by girls.
The project’s focus on inclusive education, modelled by Master Teachers, is designed to change the behaviour of teachers who may – perhaps unwittingly – make certain pupils feel unwelcome.

GEC-T Baseline Report – Making Ghanaian Girls Great Project 75
scores of girls (based on cross-tabulations rather than the Decomposition Analysis which did not see any significant relationship between learning outcomes and this barrier).

GEC-T Baseline Report – Making Ghanaian Girls Great Project 76
4. KEY OUTCOME FINDINGS 4.1 LEARNING OUTCOME
Early Grade Reading Assessment (EGRA)
The learning test for GEC-T is composed of two components. The subtasks under the first component, EGRA, test the reading ability or literacy skills of a student in terms of speed, accuracy, and fluency at least at the level of 3rd and 4th Grades, while the second component, Secondary Grade Reading Assessment (SeGRA), is mostly geared towards the higher grades and measures a student’s analytical and inferential ability. One of the reasons for including the EGRA tool is to directly link student’s ability to advances in both reading and cognitive development research. EGRA is designed to be a method-independent approach to assessment. For this evaluation, performance of students is measured in terms of percentage correct responses instead of the usual per-minute counts of correct words, letters, or sounds.
Letter sound identification: This subtask of EGRA measures phonological awareness. The subtask is presented to the students with a word orally and the student is asked to isolate and pronounce the first sound of the word. The letter sound identification subtask tests children’s ability to recognize the graphemic features of each letter and accurately map it to its corresponding sound. A set of 100 letters including both upper case and lower case were given to the students. The score is calculated as the percentage of letter sounds that the student correctly identified.
Oral vocabulary of familiar word reading: This subtask presents a list of words that children are expected to be able to identify at their grade level and will have likely encountered before. The subtask has eight words to correctly identify. The score in this subtask was calculated based on percentage of correct responses.
Nonword reading: This subtask is a core EGRA subtask that provides indirect insight into children’s ability to decode unfamiliar words. The nonword reading subtask presents the children with a written list of pseudowords that follow the phonological and spelling rules of the language but are not actual words in the language. This subtask on invented words is a step up in skill difficulty. It is used to test students’ mastery of the letter–sound correspondences to decode words. A set of 50 non-words were given to the students and the score was calculated as the percentage of correct responses out of 50.
Oral reading fluency: This subtask, along with the comprehension subtask, is EGRA’s most direct measurement of fluency. Given the importance of fluency for comprehension, it is the core component of the instrument. Students from P3 through JHS3 were given a short-written passage on a familiar topic and asked to read it out loud “quickly but carefully.” A passage with 60 words was given to the students to read and the score was calculated as the reading of correct words per minute. This score was then standardised to a value between 0 and 100.
The above EGRA subtasks are all timed and scored for speed and accuracy in terms of correct letters (or sounds) or words per minute. Because readers become increasingly more fluent as their reading skills

GEC-T Baseline Report – Making Ghanaian Girls Great Project 77
develop, timed assessments help to track progress across all these measures and show where children are on the path to skilled reading.
Reading Comprehension: The last subtask of EGRA is reading comprehension. EGRA measures reading comprehension through the reading comprehension subtask, based on the passage that students read aloud for the oral reading fluency subtask. After children read the passage aloud, they are asked five comprehension questions, both explicit and inferential. Reading comprehension is not a timed subtask and the students’ performance is measured based on how many questions (out of 5) they can answer correctly.
Table 20: Reading assessment subtask descriptions
EGRA/SeGRA Subtasks EGRA Subtask 1 Oral vocabulary of familiar
words Subtask 2 Letter Sound Identification Subtask 3 Invented Word Subtask 4 Oral Reading Fluency Subtask 5 Reading Comprehension
SeGRA Subtask 1 Comprehension (+ analytical)
Subtask 2 Comprehension (+inferential) Subtask 3 Short essay
Secondary Grade Reading Assessment (SeGRA)
The SeGRA is a new test to assess the reading ability among secondary grade students. Unlike the Early Grade Reading assessment which is tested orally, SeGRA tests are designed to be written tests with three components. The first two subtasks, Subtask 1 and 2 are long, complicated comprehension paragraphs. These are longer and more complicated than the reading comprehension passage in the EGRA test. The only difference between SeGRA subtasks 1 and 2 is the degree of difficulty. Subtask 1 focuses more on analytical questions while Subtask 2 focusses on more inferential questions. Subtask 1, by design, is geared for Grade 4 and 5 while subtask 2 is a higher order test and geared towards Grade 6 and 7. The final Subtask 3 is of the highest level of difficulty and tests student’s ability to construct a short essay based on a given topic. This subtask is geared to the level of Grade 8 and 9 or JHS2 and 3, keeping in mind that in the endline in 2021 many of the current students will have moved to JHS3.
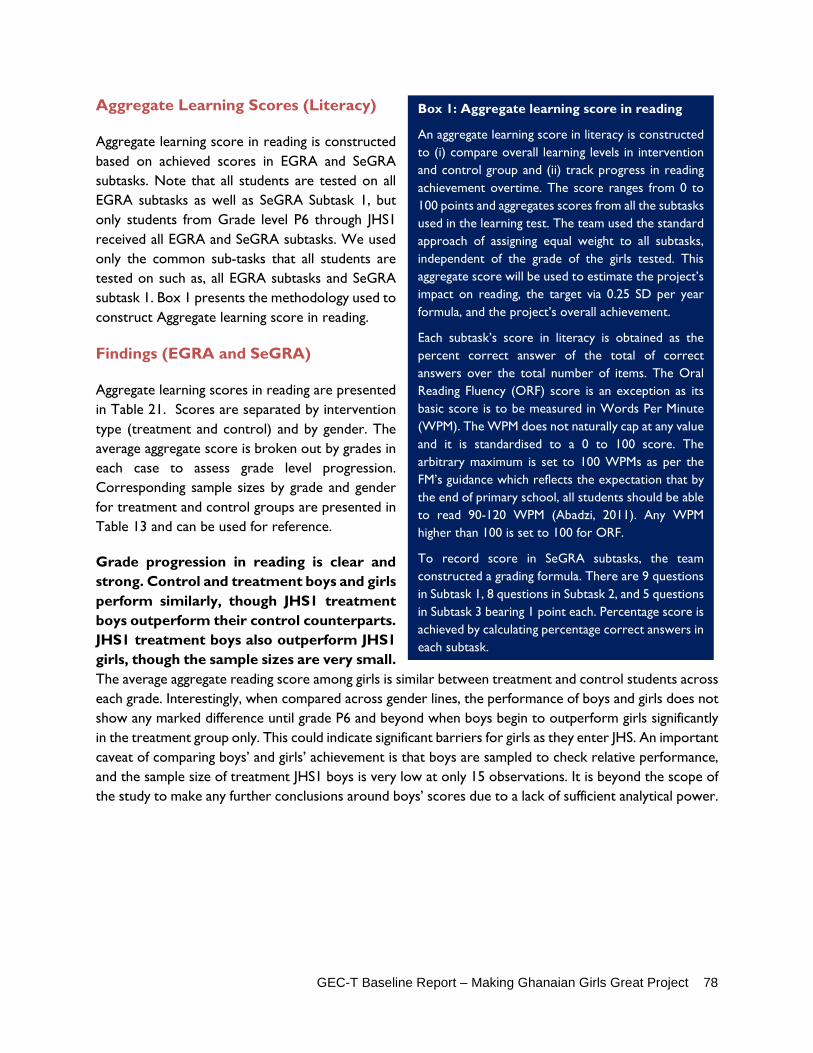
GEC-T Baseline Report – Making Ghanaian Girls Great Project 78
Aggregate Learning Scores (Literacy)
Aggregate learning score in reading is constructed based on achieved scores in EGRA and SeGRA subtasks. Note that all students are tested on all EGRA subtasks as well as SeGRA Subtask 1, but only students from Grade level P6 through JHS1 received all EGRA and SeGRA subtasks. We used only the common sub-tasks that all students are tested on such as, all EGRA subtasks and SeGRA subtask 1. Box 1 presents the methodology used to construct Aggregate learning score in reading.
Findings (EGRA and SeGRA)
Aggregate learning scores in reading are presented in Table 21. Scores are separated by intervention type (treatment and control) and by gender. The average aggregate score is broken out by grades in each case to assess grade level progression. Corresponding sample sizes by grade and gender for treatment and control groups are presented in Table 13 and can be used for reference.
Grade progression in reading is clear and strong. Control and treatment boys and girls perform similarly, though JHS1 treatment boys outperform their control counterparts. JHS1 treatment boys also outperform JHS1 girls, though the sample sizes are very small. The average aggregate reading score among girls is similar between treatment and control students across each grade. Interestingly, when compared across gender lines, the performance of boys and girls does not show any marked difference until grade P6 and beyond when boys begin to outperform girls significantly in the treatment group only. This could indicate significant barriers for girls as they enter JHS. An important caveat of comparing boys’ and girls’ achievement is that boys are sampled to check relative performance, and the sample size of treatment JHS1 boys is very low at only 15 observations. It is beyond the scope of the study to make any further conclusions around boys’ scores due to a lack of sufficient analytical power.
Box 1: Aggregate learning score in reading
An aggregate learning score in literacy is constructed to (i) compare overall learning levels in intervention and control group and (ii) track progress in reading achievement overtime. The score ranges from 0 to 100 points and aggregates scores from all the subtasks used in the learning test. The team used the standard approach of assigning equal weight to all subtasks, independent of the grade of the girls tested. This aggregate score will be used to estimate the project’s impact on reading, the target via 0.25 SD per year formula, and the project’s overall achievement.
Each subtask’s score in literacy is obtained as the percent correct answer of the total of correct answers over the total number of items. The Oral Reading Fluency (ORF) score is an exception as its basic score is to be measured in Words Per Minute (WPM). The WPM does not naturally cap at any value and it is standardised to a 0 to 100 score. The arbitrary maximum is set to 100 WPMs as per the FM’s guidance which reflects the expectation that by the end of primary school, all students should be able to read 90-120 WPM (Abadzi, 2011). Any WPM higher than 100 is set to 100 for ORF.
To record score in SeGRA subtasks, the team constructed a grading formula. There are 9 questions in Subtask 1, 8 questions in Subtask 2, and 5 questions in Subtask 3 bearing 1 point each. Percentage score is achieved by calculating percentage correct answers in each subtask.

GEC-T Baseline Report – Making Ghanaian Girls Great Project 79
Table 21: Literacy (EGRA/SeGRA)
Grade Intervention Group Mean aggregate Score
Control Group Mean aggregate
score
Standard Deviation in the intervention group
Sample breakdown (Girls) Grade P3 26.3 27.3 17.5 Grade P4 33.8 30.8 19.2 Grade P5 43.1 42.8 22.2 Grade P6 50.9 50.1 22.3 Grade JHS1 56.1 56.5 21.3 Girls (sample size)
1365 1356
Sample breakdown (Boys) Grade P3 24.2 26.1 15.7 Grade P4 35.9 33.0 19.5 Grade P5 41.9 42.0 22.0 Grade P6 51.0 47.6 22.0 Grade JHS1 68.2 56.8 22.1 Boys (sample size)
487 480
Note: Table is based on aggregate score created from all EGRA/SEGRA subtasks.
Learning Benchmarks
The evaluation design will primarily use the control group to judge impact at midline and endline. The evaluation by design will compare marginalised beneficiaries with marginalised control group girls. The ET collected data on learning benchmarks from marginalised and non-marginalised students (in particular, randomly chosen JHS2 and JHS3 girls and boys) to gauge the difference in learning outcomes between marginalised girls and the larger general school population (which may be marginalised or not). With that objective in mind, the learning benchmark group consists of JHS2 and JHS 3 students irrespective of their marginalisation status. The ET selected 2 girls (1 each from JHS2 and JHS 3) from all treatment schools. Control schools are not considered since there will be no treatment effect. One caveat of this approach is that the sample size is relatively small; margin of error estimates are 8 percent30 -- which is, however, within the acceptable range of 4 to 8 percent with 95% confidence interval.
Early and Secondary Grade Mathematics Assessment (EGMA and SeGMA)
The numeracy test is composed of the following subtasks from EGMA and SeGMA assessments:
The number identification exercise occurs in the beginning of the EGMA test to establish an understanding of children’s knowledge and identification of written symbols. In this subtask, students orally identify 20 printed number symbols that are randomly selected and placed in a grid. The score is then calculated as the percent correct responses.
30 Total sample size for learning benchmark, n =72X 2=144; the z value =1.96. Proportion, p=.5.

GEC-T Baseline Report – Making Ghanaian Girls Great Project 80
Quantity discrimination in EGMA measures children’s ability to make judgments about differences by comparing quantities in object groups. This is done by using numbers or by using objects such as circles and asking which group has more objects. Quantity discrimination in early grades demonstrates a critical link to an effective and efficient counting strategy for problem solving. Students were given 10 questions and the percent of correct responses was then taken as the score.
Identification of missing numbers subtask asks children to name a missing number in a set or sequence of numbers. Based on the objectives set by NCTM (2008) and national and international assessments (e.g., NAEP, TIMSS), children need to be familiar with numbers and able to identify missing numbers (USAID, 2009).31,32 Similar to the previous subtask, students were given 10 questions and the percent of correct responses was then taken as the score.
The students were also given 20 addition and 20 subtraction questions for two subtasks considered as Level 1, and 5 questions each for Level 2 addition and subtraction in two additional subtasks. In each case percent correct answers represented the score.
Word problems analyse children’s informal concepts of addition and subtraction by following the strategies children use to solve certain items presented to them. Children’s exposure to oral word problems in the mathematics curriculum enhance their ability to apply mathematics concepts they had already learned to analyse problems. The word problem subtask consisted of 6 questions. Similar to other subtasks, the score was calculated as the percent correct response.
SeGMA Subtask 1 tested students on advanced multiplication and division, proportions (fractions, percentages), space and shape (geometry), and measurement (distance, length, area, capacity, money) presentation questions, while Subtask 2 focused mostly on testing students’ ability in algebra. Subtask 3, on the other hand, included data interpretation and sophisticated word problems solved using complex, multiple operations including algebra. SeGMA Subtask 1 contained 15 questions, while Subtasks 2 and 3 contained 8 questions carrying 3 points each. Percent correct responses in each subtask was considered as the score for these subtasks.
Table 22: Numeracy subtask descriptions
EGMA/SeGMA subtasks EGMA Subtask 1 Number Identification
Subtask 2 Quantity Discrimination Subtask 3 Missing Numbers Subtask 4A Addition (Level 1) Subtask 4B Addition (Level 2) Subtask 5A Subtraction (Level 1) Subtask 5B Subtraction (Level 2) Subtask 6 Word problems
SeGMA Subtask 1 Advanced multiplication, division etc. Subtask 2 Algebra Subtask 3 Data interpretation; word problems
31 Early Grade Reading Assessment Tool kit, 2nd Edition. USAID, March 2016.

GEC-T Baseline Report – Making Ghanaian Girls Great Project 81
Findings (EGMA and SeGMA)
Aggregate numeracy scores are presented in Table 23. Similar to the aggregate score in literacy, the aggregate score in numeracy is separated by intervention type and by gender. The average aggregate score is broken out by grades to assess grade level progression.33 Aggregate numeracy score is constructed using achieved scores in all EGMA and SeGMA subtasks based on the method indicated in Box 2. All students were tested on all EGMA subtasks and SeGMA Subtask 1. Only students from Grade level P6 thorough JHS1 received SeGMA Subtasks 2 and 3. Table 23 presents aggregate learning scores in numeracy by grade and treatment status.
Similar to aggregate learning scores in reading, the ET constructed aggregate learning scores in math based on all EGMA subtasks and SeGMA subtasks. Box 2 presents the methodology used to construct Aggregate learning score in math.
Mathematics scores show the same pattern as reading: grade progression is strong, and girls and boys perform similarly until P6 at which point treatment boys begin to score significantly better than girls. Average aggregate score in numeracy among girls is very similar between treatment and control students across each grade in the sample, suggesting substantial balance between the two groups in the evaluation sample. Further, the ET observed a similar pattern among boys, except for JSH1. The JHS1 boys in treatment schools outperformed JHS1 girls in treatment schools by nearly 10 points on average, however, it must be noted that the sample size of JHS1 treatment boys was very low (15 observations).
Table 23: Numeracy (EGMA/SeGMA)
Grade Intervention Group Mean aggregate score
Control Group Mean aggregate
score
Standard Deviation in the intervention group
Sample breakdown (Girls) Grade P3 42.6 43.5 15.5 Grade P4 49.7 46.1 16.4 Grade P5 54.4 53.7 17.0 Grade P6 60.8 57.8 16.5 Grade JHS1 63.7 63.5 16.6 Girls (sample size)
1365 1356
33 The realized sample by grade, gender and treatment status is presented in Table 13.
Box 2: Aggregate learning score in Mathematics
An aggregate learning score in mathematics is constructed to (i) compare overall learning levels in intervention and control groups and (ii) track learning progress over time. The score ranges from 0 to 100 points and aggregates scores from all EGMA and SeGMA subtasks used in the numeracy test. The team used the standard approach of assigning equal weight to all subtasks, independent of the grade of the girls tested. This aggregate score was used to estimate the project’s impact on learning, the learning target of 0.25 SD per year formula, and the project’s overall achievement.
Each subtask’s score is obtained as the percent correct answers over the total number of items.
To record score in SeGMA subtasks, the team constructed a grading formula. There were 15 questions in Subtask 1, 8 questions in Subtask 2, and 8 questions in Subtask 3 bearing 1 point each. Percentage score was achieved by calculating percentage correct answers in each subtask.

GEC-T Baseline Report – Making Ghanaian Girls Great Project 82
Sample breakdown (Boys) Grade P3 45.9 41.4 17.1 Grade P4 51.8 52.7 15.1 Grade P5 55.7 54.0 17.2 Grade P6 62.5 57.5 16.8 Grade JHS1 72.7 63.5 13.3 Boys (sample size)
487 480
Note: Table is based on aggregate score created from all EGMA/SEGMA subtasks.
A diagnosis of the learning scores by subtask
This section aims at identifying the gaps in literacy and numeracy skills, particularly the foundational ones, across control and intervention group. Figures for subtask breakdown by gender can also be found in Annex 14.
For numeracy, most girls and boys are established learners on the EGMA subtasks, though the opposite is true of SeGMA subtasks. Table 24 and Table 25 present subtask specific scores for literacy and numeracy for girls and boys. Scores are grouped into four bands as defined in Box 3. For each subtask, the score is standardized between 0 and 100. Each cell represents percentages of students from P3 through JHS1 who received a score within that band. Subtasks are ordered from 1 to 6 based on their degree of difficulty, with SeGRA ordered 1 through 3. While all students were tested on all subtasks of EGMA and Subtask 1 of SeGMA, students from P6 and JHS1 also received SeGMA Subtasks 2 and 3. The same is true of EGRA and SeGRA. Average scores are calculated accordingly.
The percentage distribution of scores in the four bands clearly shows that an increasingly low proportion of girl students were able to achieve “Established” or “Proficient” learner status for higher level subtasks. For example, more than 50 percent of girls reached the “Proficient” learner category for EGMA Subtasks 1 and 2, number identification, and quantity discrimination, while only 3.4% were proficient in the next level. Girls’ performance is poorest in the subtask of missing number identification (Subtask 3). Around 90% of girls are either “Emergent” or “Established” learners. Girls perform best in addition, subtraction, and word problems.
Disaggregated by control and treatment girls (Annex 14), EGMA and SeGMA subtask bands among girls were very similar, however, of particular note were the subtasks on number identification and number
Box 3: Subtask scores bands
For a diagnosis of the gaps in literacy and numeracy skills, the subtask scores are cut into bands of achievements as follows: (i) Non-learner: 0% of items; (ii) Emergent learner: 1%-40% of items; (iii) Established learner: 41%-80% of items, and (iv) Proficient learner: 81%-100% of items. It is understood that the bands are set arbitrarily.
The Oral Reading Fluency score (Words Per Minute) is again an exception. The four learning categories should be taken as follows: (i) Non-reader: 0-5 WPMs; (ii) Emergent reader: 6-44 WPMs; (iii) Established reader: 45-80 WPMs; and (iv) Proficient reader: 80 WPMs plus.
Based on this categorisation, the distribution of P3 to JHS1 students across the categories is provided in the tables below. The table presents (i) Percent of students who are non-learners; (ii) Percent of students who are emergent learners; (iii) Percent of students who are established learners; and (iv) Percent of students who are proficient learners in all Subtasks.
For comparison purposes, the team calculated average scores of boys and girls separately.
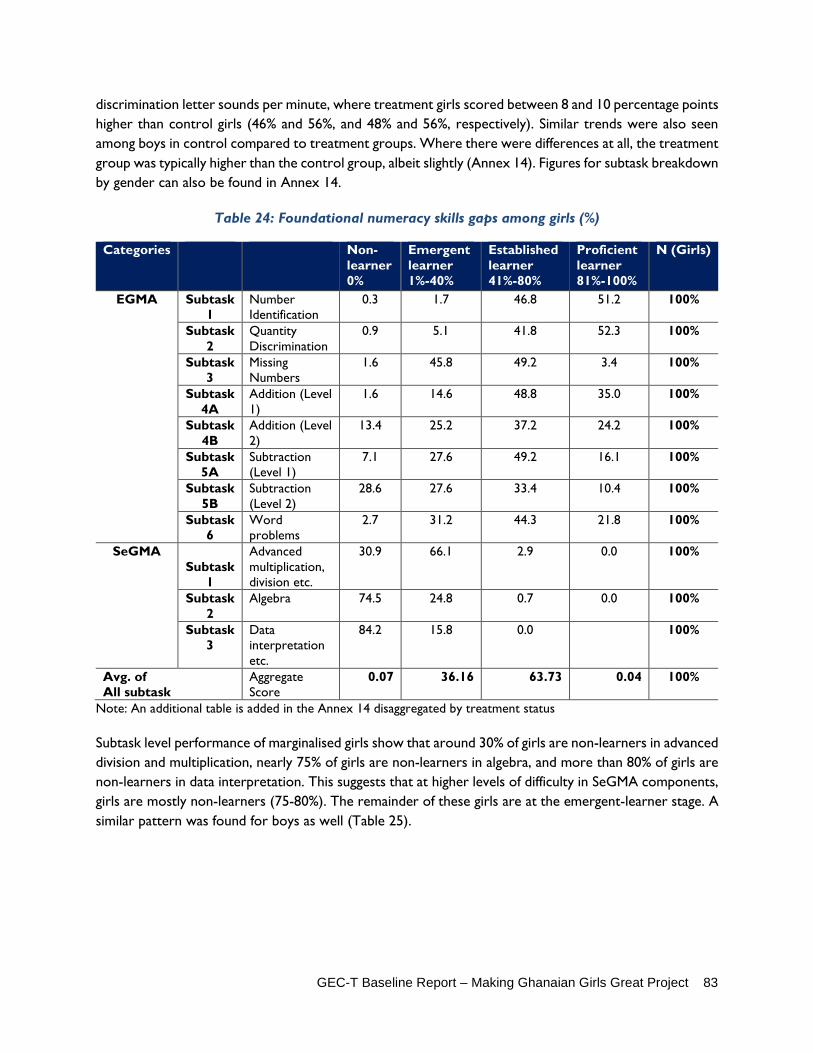
GEC-T Baseline Report – Making Ghanaian Girls Great Project 83
discrimination letter sounds per minute, where treatment girls scored between 8 and 10 percentage points higher than control girls (46% and 56%, and 48% and 56%, respectively). Similar trends were also seen among boys in control compared to treatment groups. Where there were differences at all, the treatment group was typically higher than the control group, albeit slightly (Annex 14). Figures for subtask breakdown by gender can also be found in Annex 14.
Table 24: Foundational numeracy skills gaps among girls (%)
Categories Non-learner 0%
Emergent learner 1%-40%
Established learner 41%-80%
Proficient learner 81%-100%
N (Girls)
EGMA Subtask 1
Number Identification
0.3 1.7 46.8 51.2 100%
Subtask 2
Quantity Discrimination
0.9 5.1 41.8 52.3 100%
Subtask 3
Missing Numbers
1.6 45.8 49.2 3.4 100%
Subtask 4A
Addition (Level 1)
1.6 14.6 48.8 35.0 100%
Subtask 4B
Addition (Level 2)
13.4 25.2 37.2 24.2 100%
Subtask 5A
Subtraction (Level 1)
7.1 27.6 49.2 16.1 100%
Subtask 5B
Subtraction (Level 2)
28.6 27.6 33.4 10.4 100%
Subtask 6
Word problems
2.7 31.2 44.3 21.8 100%
SeGMA Subtask
1
Advanced multiplication, division etc.
30.9 66.1 2.9 0.0 100%
Subtask 2
Algebra 74.5 24.8 0.7 0.0 100%
Subtask 3
Data interpretation etc.
84.2 15.8 0.0 100%
Avg. of All subtask
Aggregate Score
0.07 36.16 63.73 0.04 100%
Note: An additional table is added in the Annex 14 disaggregated by treatment status
Subtask level performance of marginalised girls show that around 30% of girls are non-learners in advanced division and multiplication, nearly 75% of girls are non-learners in algebra, and more than 80% of girls are non-learners in data interpretation. This suggests that at higher levels of difficulty in SeGMA components, girls are mostly non-learners (75-80%). The remainder of these girls are at the emergent-learner stage. A similar pattern was found for boys as well (Table 25).

GEC-T Baseline Report – Making Ghanaian Girls Great Project 84
Table 25: Foundational numeracy skills gaps among boys (%)
Categories Non-learner 0%
Emergent learner 1%-40%
Established learner 41%-80%
Proficient learner 81%-100%
N (Boyss)
EGMA Subtask 1
Number Identification
0.6 1.3 41.9 56.2 100%
Subtask 2
Quantity Discrimination
0.8 5.2 34.7 59.3 100%
Subtask 3
Missing Numbers
2.6 43.4 50.4 3.6 100%
Subtask 4A
Addition (Level 1)
1.3 13.8 55.2 29.7 100%
Subtask 4B
Addition (Level 2)
12.7 25.0 36.2 26.1 100%
Subtask 5A
Subtraction (Level 1)
7.1 26.0 53.7 13.2 100%
Subtask 5B
Subtraction (Level 2)
29.2 27.4 33.7 9.7 100%
Subtask 6
Word problems
3.4 33.1 42.8 20.7 100%
SeGMA Subtask
1
Advanced multiplication, division etc.
29.7 66.0 4.2 0.10 100%
Subtask 2
Algebra 81.1 17.4 1.4 0.1 100%
Subtask 3
Data interpretation etc.
87.2 12.6 0.2 100%
Avg. of all subtasks
Aggregate Score
0.00 35.99 63.60 0.41 100%
Note: An additional table is added in the Annex 14 disaggregated by treatment status
Foundational Literacy Skill gap
For literacy, girls and boys perform worse in EGRA subtasks compared to how they do in EGMA, with most as emergent learners. They perform better on SeGRA subtasks, however, as compared to SeGMA. Performance of girls in literacy is provided in Table 26. As Table 24 and Table 25 show, for SeGRA and SeGMA Subtask 1, which is compulsory to all students, around 32% are non-learners (a score of zero), 44.5% of girls are emergent learners (scored 1-40%), slightly less than 20% are established (between 41 and 80) and only 4% are proficient (80-100%). In contrast, a significantly large proportion, around 66%, are emergent learners in SeGMA Subtask 1 while the proportion of non-learners is almost the same. The proportion of established learners in this Subtask is 3% followed by less than 1% who are proficient learners. A similar distribution among boys is found as well.
Disaggregated by control and treatment girls (Annex 14), EGRA and SeGRA subtask bands among girls were very similar, however, of particular note was the subtask on correct letter sounds per minute, where more than twice as many treatment girls were established learners compared to control girls (38% versus 19%). Among boys, similar trends were seen in control compared to treatment groups; on correct letter sounds per minute, boys in treatment schools scored nearly twice as well as boys in control schools.

GEC-T Baseline Report – Making Ghanaian Girls Great Project 85
Where there were differences at all, the treatment group was typically higher than the control group, albeit slightly (Annex 14). Figures for subtask breakdown by gender can also be found in Annex 14.
Table 26: Foundational literacy skills gaps among girls
Categories Non-learner 0%
Emergent learner 1%-40%
Established learner 41%-80%
Proficient learner 81%-100%
EGRA Subtask 1
Oral vocabulary (Familiar word) 0.99 2.98 26.64 69.39 100%
Subtask 2
Letter Sound Identification 10.58 59.90 29.03 0.48 100%
Subtask 3
Invented Word 37.23 41.16 16.46 5.15 100%
Subtask 4
Oral Reading Fluency 15.67 30.79 24.74 28.80 100%
Subtask 5
Reading Comprehension 36.46 18.12 30.54 14.88 100%
SeGRA
Subtask 1
Comprehension (+ analytical) 32.41 44.58 19.04 3.97 100%
Subtask 2
Comprehension (+inferential) 68.06 27.78 4.08 0.07 100%
Subtask 3
Short essay 88.57 7.68 3.42 0.33 100%
Aggregate Learning Score For Reading
0.48 58.47 40.57 0.48 100%
Note: An additional table is added in the Annex 14 disaggregated by treatment status

GEC-T Baseline Report – Making Ghanaian Girls Great Project 86
Table 27: Foundational literacy skills gaps among boys
Categories Non-learner 0%
Emergent learner 1%-40%
Established learner 41%-80%
Proficient learner 81%-100%
EGRA Subtask 1
Oral vocabulary (Familiar word) 0.41 2.69 23.68 73.22 100%
Subtask 2
Letter Sound Identification 12.20 61.53 25.75 0.52 100%
Subtask 3
Invented Word 35.68 38.57 20.89 4.86 100%
Subtask 4
Oral Reading Fluency 16.87 35.82 24.95 22.36 100%
Subtask 5
Reading Comprehension 40.95 17.68 30.51 10.86 100%
SeGRA
Subtask 1
Comprehension (+ analytical) 35.26 44.98 15.82 3.93 100%
Subtask 2
Comprehension (+inferential) 76.84 20.37 2.38 0.41 100%
Subtask 3
Short essay 90.69 6.00 2.90 0.41 100%
Aggregate Learning Score For Reading
0.10 62.87 36.30 0.72 100%
Note: An additional table is added in the Annex 14 disaggregated by treatment status
Grade level achieved in numeracy
The literacy and numeracy subtasks have been designed to be grade level appropriate for the foundational skills and difficulty levels that are to be achieved by students across primary and lower secondary school, per the Ghanaian national curriculum. The EGRA and EGMA subtasks were adapted from 2013 and 2015 nationally conducted EGRA/EGMA tests in Ghana, administered by the Ghana Education Service, National Education Assessment Unit in 2013 and 2015. SeGRA And SeGMA subtasks were prepared in close consultation with the experts from National Education Assessment Unit of the Ghana Education Services of the Ministry of Education and adapted in the context of Greater Accra and Volta regions based on textbooks used in these two regions. Therefore, it should be fair to describe the learning levels achieved by girls at the end of each grade through their scores on subtasks, as this should represent their grade-level knowledge. While this estimated grade-level achievement can be considered a snapshot of Accra and Volta regions, it should not be used as a benchmark to compare with other regions’ standards or projects across regions.
To report on the grade achieved by girls and boys, the ET followed the methodology suggested by the Fund Manager to develop and provide a conversion grid to map proficiency levels from the tests to the grades according to the national curriculum. An example of a conversion grid from grades to proficiency levels and subtasks is provided below. Table 28 shows the methodology used to calculate actual grade level achieved by students in numeracy.

GEC-T Baseline Report – Making Ghanaian Girls Great Project 87
Table 28: Grade level achievement methodology
Relevant subtasks Numeracy Grade 1 achieved
Subtask 1 and 2 (EGMA)
Proficient in Number Identification and in Quantity Discrimination
Grade 2 achieved
Subtask 3 and 4 (EGMA)
Proficient in Missing Numbers and Additions
Grade 3 achieved
Subtask 5 and 6 (EGMA)
Proficient in Subtractions and Words Problem
Grade 4 achieved
SeGMA Subtask 1 Established in Advanced multi and division etc.
Grade 5 achieved
SeGMA Subtask 1 Proficient in Advanced multi and division etc.
Grade 6 achieved
SeGMA Subtask 2 Established in Algebra
Grade 7 achieved
SeGMA Subtask 2 Proficient in Algebra
Grade 8 achieved
SeGMA Subtask 3 Established in Data Interpretation etc.
Grade 9 achieved
SeGMA Subtask 3 Proficient in Data Interpretation etc.
According to grade level cut-offs suggested by the FM for numeracy, girls and boys are well below their grade level, with the vast majority of girls and boys scoring at No Grade or P1 grade levels. Table 29 presents grade level achievements in numeracy by boys and girls separately without breaking it up further by their actual grade level. 34 For example, the grade level achieved of 61.3% of all control students is below P1. The incidence is relatively lower, around 53%, among treatment girls. Similarly, 56% of control school boys and 42% of treatment boys achieve no grades. A steady and drastic decline is observed for higher grades. Performance of boys is relatively higher than girls, however the difference is marginal.
Table 29: Numeracy grade level achievement by gender
Numeracy Girls Boys Highest Grade achieved Control Treatment Total Control Treatment Total
Below P1 F 836 786 1,622 275 248 523 % 61.3 52.9 56.9 56.4 41.5 48.2
P1 F 436 594 1,030 176 273 449 % 31.9 40.0 36.1 36.1 45.7 41.3
P2 F 10 17 27 4 6 10 % 0.7 1.1 1.0 0.8 1.0 0.9
P3 F 38 27 65 8 13 21 % 2.8 1.8 2.3 1.6 2.2 1.9
P4 F 29 47 76 18 27 45
34 A detailed breakdown of grade-level achieved by students from grades P3 through JHS3 by treatment status and gender is included in Annex 14. For brevity, the ET includes only disaggregation of grade-level achieved by gender in the body of the report.

GEC-T Baseline Report – Making Ghanaian Girls Great Project 88
% 2.1 3.2 2.7 3.7 4.5 4.1 P5 F
%
P6 F 16 11 27 6 23 29
% 1.2 0.7 1.0 1.2 3.9 2.7 JHS1 0 1 1
0.0 0.2 0.1 JHS2 F 0 4 4 1 7 8
% 0 0.3 0.1 0.2 1.2 0.7 JHS3 F
% Total F 1,365 1,486 2,851 488 598 1,086
% 100 100 100 100 100 100
Grade level achieved in Literacy
The ET used the following methodology to calculate grade level achieved by students in literacy.
Table 30: Literacy grade level achievement descriptions
Relevant subtasks Literacy Grade 1 achieved
Subtask 1, 2 and 3 (EGRA)
Proficient in Letter Sound Identification, Familiar Word, Invented Word
Grade 2 achieved
Subtask 4 (EGRA) Established in Oral Reading Fluency
Grade 3 achieved
Subtask 5 (EGRA) Proficient in Comprehension of short fluency paragraph
Grade 4 achieved
SeGRA Subtask 1 Established in Comprehension using simple inferences
Grade 5 achieved
SeGRA Subtask 1 Proficient in Comprehension using simple inferences
Grade 6 achieved
SeGRA Subtask 2 Established in Comprehension using complex inferences
Grade 7 achieved
SeGRA Subtask 2 Proficient in Comprehension using complex inferences
Grade 8 achieved
SeGRA Subtask 3 Established in Short Essay construction
Grade 9 achieved
SeGRA Subtask 3 Proficient in Short Essay construction
According to grade level achievement cut-offs for literacy, more than 50% of girls and boys in treatment and control schools do not possess Grade 1 proficiency. Unlike numeracy, girls do better than boys in reading. Table 31 lays out grade level achieved by students in literacy. The table shows that around 55% of girls from grades P3 through JHS3 did not achieve P1 level of proficiency. More than 17% of all sampled girls achieved grade level 2. Among them, 18.6% were from treatment schools while 16% were from control schools. The following table shows that while no girl has achieved

GEC-T Baseline Report – Making Ghanaian Girls Great Project 89
grade level JHS1 in particular, the relative achievements of treatment girls are better than control school girls, in particular for grade levels P6 through JHS3. The overall proportions are however relatively small.
Table 31: Literacy grade level achieved by gender
Literacy Girls Boys Highest Grade achieved Control Treatment Total Control Treatment Total
0 F 703 758 1,461 265 307 572 % 51.5 51.0 51.3 54.3 51.3 52.7
1 F
% 2 F 222 276 498 91 93 184
% 16.3 18.6 17.5 18.7 15.6 16.9 3 F 88 66 154 20 26 46
% 6.5 4.4 5.4 4.1 4.4 4.2 4 F 225 216 441 73 90 163
% 16.5 14.5 15.5 15.0 15.1 15.0 5 F 38 31 69 13 15 28
% 2.8 2.1 2.4 2.7 2.5 2.6 6 F 32 58 90 9 16 25
% 2.3 3.9 3.2 1.8 2.7 2.3 JHS1 0 3 3
0.0 0.5 0.3 JHS2 F 50 72 122 15 40 55
% 3.7 4.9 4.3 3.1 6.7 5.1 JHS3 F 7 9 16 2 8 10
% 0.5 0.6 0.6 0.4 1.3 0.9 Total F 1,365 1,486 2,851 488 598 1,086
% 100 100 100 100 100 100
COMPARING MGCUBED AND NATIONAL SCORES: A NOTE FROM THE EVALUATOR ON GRADE-LEVEL ACHIEVEMENT
While grade level achievement results presented in the section above do not appear impressive, it may not be a true reflection of the overall situation. Results from two recent nationally conducted EGRA/EGMA tests in Ghana, administered by the Ghana Education Service, National Education Assessment Unit in 2013 and 2015, show that most pupils in Ghana at the end of P1 and P2 were not yet able to read with fluency and accuracy. By the end of P2, irrespective of language of the test, the majority of public school pupils “struggled with even foundational reading skills and could not yet read with comprehension.” The report cited that typically more than half of students could not read a single word in any language they were tested in. The same 2015 report underscored that “some pupils did have the ability to recognize a few words, but this was not sufficient to be able to comprehend what they read.”

GEC-T Baseline Report – Making Ghanaian Girls Great Project 90
Findings showed that two percent of the students assessed achieved a score sufficient for “fluency and comprehension.” The report pointed out that there was some variation among the different Ghanaian languages, but generally, the vast majority of pupils struggles with essential early-reading skills such as letter sounds, decoding, and comprehension. The results are drastically worse for students from rural areas than their urban counterparts (NEAU and RTI, 2015).35
When compared to these previous national EGRA tests in Ghana, the overall achievement of marginalised students from this baseline study shows better performance in many subtasks. For example, 28% of the marginalised girls from treatment schools achieved proficiency level of more than 80 words per minute and above in ORF, around 26% scored between 45 to 80 words per minute and 32% scored between 6 to 44 words per minute. Only 14% could not read a single word. In comparison with the 2015 national EGRA test findings, which show that more than 50% could not read a single word, this demonstrates a marked difference among marginalised girls in the intervention schools from the two regions.
The ET found similar evidence by comparing 2015 national EGMA test scores with the MGCubed baseline findings. The EGMA results reported in the same 2015 study show that as a whole, Ghana’s pupils “do not have the foundational skills required to grasp the basic concepts in mathematics, or to use these skills in situations that require them to understand these basic concepts.” Evidence from the study shows that 26.7% of students could correctly identify a missing number, 19.2% could correctly perform addition at Level 2 and 9.7% could correctly answer subtraction Level 2 questions. The report also shows that these numbers are very close to the EGMA tests conducted in 2013. In comparison, the MGCubed baseline report shows that around 56% of treatment school students are established learners who scored between 40 and 80 in the subtask on missing numbers, around 38% are establish learners in addition Level 2, and 35% scored above 40% in subtraction Level 2.
Yet, while it has been established that MGCubed students sampled and tested in this baseline report (who are from grades P3-JHS1) perform substantially better than the P1 and P2 students from the 2015 national EGRA/EGMA study, they are scoring by far and large in the Below-P1 and P1 grade-level achievement range (as shown in the previous section of this report), estimated per FM cut-off protocols. This should not be so, especially considering the fact that the EGRA/EGMA tests taken during this baseline and the 2015 national study are the exact same. Given these findings, combined with the generally low performance of P1 and P2 students in the 2015 study, the ET believes the FM grade-level achievement cut-offs of 80% for proficiency to be fairly ambitious for the Ghanaian context, particularly when considering marginalised students. Further, EGRA and EGMA are intended to measure fluency and not designed to be a high-stake accountability measure to determine student grade promotion. According to the EGRA Toolkit “all subtasks under EGRA and EGMA are designed to complement, rather than replace, existing curriculum-based written assessments” (EGRA Tool Kit, 2nd Ed, USAID and RTI, 2015, pp15-16).36 Lastly, evidence from the baseline data shows that more than 60% of girls in numeracy and 40% in literacy are established learners, and most of them are near the cut-off point of high proficiency required
35 Ghana Education Service, National Education Assessment Unit and RTI International Education Assessment and Research Centre (2015): GHANA 2015 Early Grade Reading Assessment and Early Grade Mathematics Assessment: Report of Findings November 2016 36 RTI International (2015). Early Grade Reading Assessment (EGRA) Toolkit, Second Edition. Washington, DC: United States Agency for International Development.

GEC-T Baseline Report – Making Ghanaian Girls Great Project 91
to qualify for grade level achievement. The cut-off does not reflect these near-misses; assuming that the intervention is effective, it is highly likely that a majority of them may be able to cross the threshold.
To look at a different angle on learning scores, the ET produced a quartile distribution of ORF scores, analysed in their original measurement of words per minute (WPM) and displays this distribution in Figure 5. The distribution, which does not standardize the score into a 0-100% bracket as presented in the grade-achievement section earlier, shows median values of WPM at around 50, a measure considered to be high enough for functional fluency by many standards, and at least at somewhere between a Grade 1 and 2 level.37 Analysed as they should be, the ORF measure shows that girls of the cohort (and treatment girls slightly more so than control girls) are achieving functional fluency, with grade levels above the average findings in the earlier section that showed the majority at a Pre-P1 or P1 level.
Figure 5: Quartile distribution of ORF scores of girls of the cohort
While this report uses the established FM cut-offs, the ET recommends that they be revisited by the FM at future data collection periods in order to establish more contextually accurate grade-level comparison mechanisms. It is recommended that the reader keep these findings in mind when reviewing the results in the section on grade-level achievement.
37 Abadzi, H. (2006). Efficient learning for the poor: Insights from the frontier of cognitive neuroscience. Washington, DC: The World Bank.
0
50
100
150
200
OR
F_ac
tual
control Treatmentl d t id l

GEC-T Baseline Report – Making Ghanaian Girls Great Project 92
4.2 SUBGROUP ANALYSIS OF THE LEARNING OUTCOME
This section focuses on drawing out trends in learning for key subgroups and to understand the characteristics and barriers associated with the lowest levels of learning. In particular, this section sheds light on differences in learning levels of girls across key subgroups on marginalised characteristics of girls (Table 32) and barriers experienced (Table 33).
To identify learning by marginalisation characteristics, Table 32 below uses the characteristics that identify proportions of girls who are orphans, have disabilities of some kind, or are living in a household where the head of household or the primary caregiver is illiterate. The table also compares aggregate numeracy and literacy scores across multi-dimensional poverty indicators such as difficulty to afford for the household to send a girl to school, unable to meet basic needs, or girls go to bed hungry most of the time. Instead of creating a poverty index, the ET kept all multidimensional aspects separate given that a major disadvantage of a poverty index is that it will assign equal weight to all components; a decision that might not be technically accurate. Among other marginalisation characteristics, the table includes ethnicity to analyse how it plays out in a student’s overall achievement. The objective is to understand which subgroups might be left behind (or are excelling) in terms of learning and inform projects to determine what adaptations to the design might be needed to ensure inclusion of girls with particular characteristics. To confine the analysis in wider scales of achievement, the report presents average scores but discusses it in terms of bands created from the subtasks in Table 26 and Table 27.
Girls with disabilities and who speak a language other than that spoken at school score the lowest on aggregate literacy and numeracy. Other notable sub-groups with low scores include mothers, those with illiterate HOH/caregivers, and those from the poorest households. Girls from the Likpakpa and Guan ethnic groups score much worse than other ethnic groups. Table 32 shows that average literacy scores of all marginalised girls identified under each category fall within the band of 1-40 percent score indicating average achievement of an “emergent learner.” Overall, the average score for all girls in literacy was 43.5%, which is slightly higher than the upper limit of the band. On the contrary, marginalised girls are mostly established learners, on average, for numeracy where the average score was around 54.8%. With regard to language, six MGCubed schools exist in catchment areas where the Likpakpa language is spoken; most teachers in these catchment areas do not speak the local language and therefore have difficulty in explaining concepts for pupils to understand.
Scores by group suggests that the average lowest score in literacy is achieved by girls with selfcare impairment (21.1%), followed by girls with Likpakpa ethnic background (26.2%). Girls who speak different languages at home than the language of instruction scored 27.9% on an average. Those who are above these marginalised groups in the lowest rung of the ladder in the literacy test scores are mainly girls with physical impairments. For example, girls with a communication impairment have an average literacy score of 36.1%, those with cognitive impairment scored 36.9%, and those with a hearing impairment scored 37.2%. Overall, girls with any kind of physical impairment scored 38.2% on average for literacy.
While girls with impairments are the most marginalised group, girls who became a mother under the age of 18 (31.9%) or girls who are growing up with an illiterate head of the household or caregiver (32-33%)
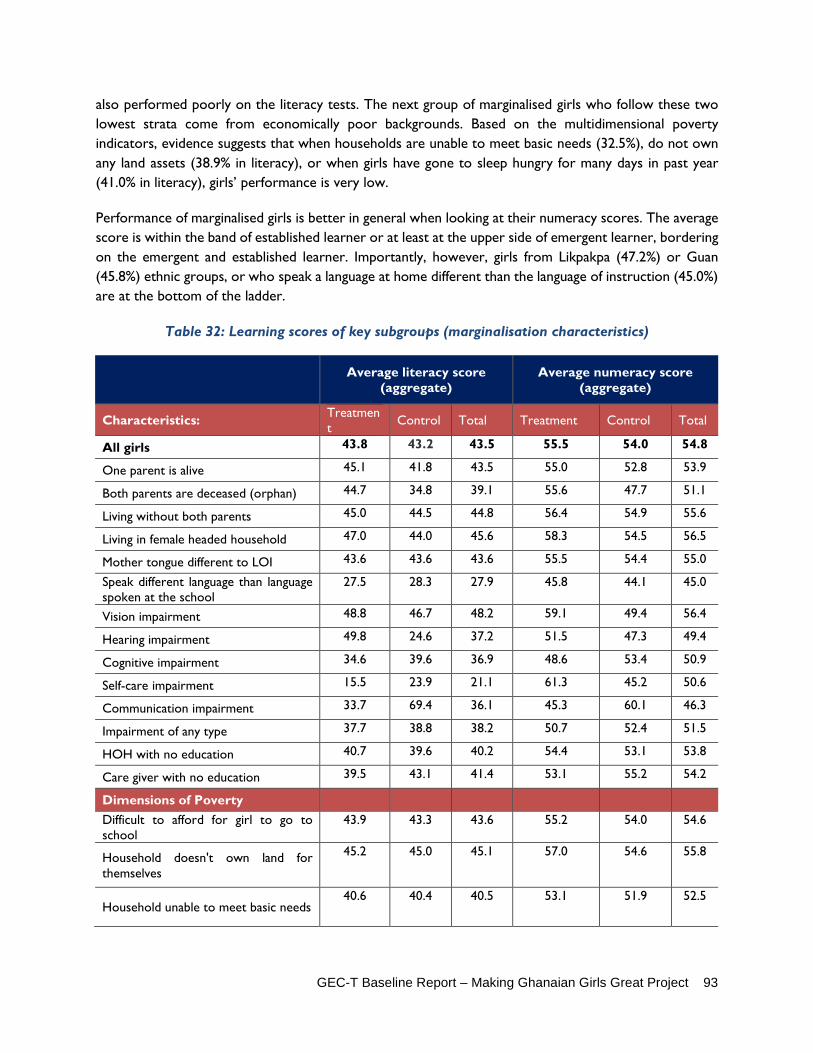
GEC-T Baseline Report – Making Ghanaian Girls Great Project 93
also performed poorly on the literacy tests. The next group of marginalised girls who follow these two lowest strata come from economically poor backgrounds. Based on the multidimensional poverty indicators, evidence suggests that when households are unable to meet basic needs (32.5%), do not own any land assets (38.9% in literacy), or when girls have gone to sleep hungry for many days in past year (41.0% in literacy), girls’ performance is very low.
Performance of marginalised girls is better in general when looking at their numeracy scores. The average score is within the band of established learner or at least at the upper side of emergent learner, bordering on the emergent and established learner. Importantly, however, girls from Likpakpa (47.2%) or Guan (45.8%) ethnic groups, or who speak a language at home different than the language of instruction (45.0%) are at the bottom of the ladder.
Table 32: Learning scores of key subgroups (marginalisation characteristics)
Average literacy score (aggregate)
Average numeracy score (aggregate)
Characteristics: Treatment Control Total Treatment Control Total
All girls 43.8 43.2 43.5 55.5 54.0 54.8
One parent is alive 45.1 41.8 43.5 55.0 52.8 53.9
Both parents are deceased (orphan) 44.7 34.8 39.1 55.6 47.7 51.1
Living without both parents 45.0 44.5 44.8 56.4 54.9 55.6
Living in female headed household 47.0 44.0 45.6 58.3 54.5 56.5
Mother tongue different to LOI 43.6 43.6 43.6 55.5 54.4 55.0
Speak different language than language spoken at the school
27.5 28.3 27.9 45.8 44.1 45.0
Vision impairment 48.8 46.7 48.2 59.1 49.4 56.4
Hearing impairment 49.8 24.6 37.2 51.5 47.3 49.4
Cognitive impairment 34.6 39.6 36.9 48.6 53.4 50.9
Self-care impairment 15.5 23.9 21.1 61.3 45.2 50.6
Communication impairment 33.7 69.4 36.1 45.3 60.1 46.3
Impairment of any type 37.7 38.8 38.2 50.7 52.4 51.5
HOH with no education 40.7 39.6 40.2 54.4 53.1 53.8
Care giver with no education 39.5 43.1 41.4 53.1 55.2 54.2
Dimensions of Poverty
Difficult to afford for girl to go to school
43.9 43.3 43.6 55.2 54.0 54.6
Household doesn't own land for themselves
45.2 45.0 45.1 57.0 54.6 55.8
Household unable to meet basic needs 40.6 40.4 40.5 53.1 51.9 52.5

GEC-T Baseline Report – Making Ghanaian Girls Great Project 94
Gone to sleep hungry for many days in past year
38.5 43.5 41.0 52.5 51.2 51.8
Married 41.5 39.4 40.3 54.8 53.3 54.0
Mother (under16 years of age) 53.3 32.3 41.8 56.4 53.4 54.8
Mother (under 18 years of age) 43.9 30.1 38.9 53.8 37.1 47.7
Ethnicity
- Akan 48.0 41.6 44.1 55.9 50.8 52.8
- Ga 47.8 51.0 50.2 56.7 56.7 56.7
- Ewe 44.8 42.8 43.6 55.0 53.2 54.0
- Dangme 51.3 50.9 51.1 62.3 60.5 61.4
- Guan 35.8 33.2 34.3 49.2 43.6 45.8
- Likpakpa 32.9 17.2 26.2 52.8 39.7 47.2
- Other 35.1 35.1 35.1 48.6 47.8 48.3
Note: Proportional distribution of girls with each marginalised characteristic is given in Table 16
The findings presented in Table 33 contribute to understanding which barriers may have the most impact on levels of learning, ultimately informing projects about the most pertinent barriers to girls’ learning. In this section, the report triangulates the learning outcomes of marginalised girls who face certain barriers in order to assess the barriers’ relative effects on outcome score. The relationships are more rigorously analysed in following section in terms of regression analysis.
In cross-tabulations, not feeling welcome at school by a teacher was associated with the lowest literacy and numeracy scores of girls. An unsafe school environment is also associated with lower scores. Evidence from Table 33 suggests that overall, marginalised girls are at least in the established learner band in numeracy even with major barriers. However, they are mostly emergent learners in literacy. Not feeling welcome by teachers is associated with the lowest scores for girls’ learning (34.3% in literacy and 48.7% in numeracy). While the causality of this finding is potentially ambiguous (a child might feel less welcomed by a teacher if he or she does not do well in learning rather than the other way around), evidence from regression analysis later in this report suggests that teaching quality (measured as a teacher giving encouragement to a child) is positively significantly associated with learning scores. Restricted movement within school and safety issues are major barriers for performance in literacy, though not as much in numeracy. Infrastructure, such as the existence of a drinking water facility or a toilet does not have any major correlation with learning outcomes.

GEC-T Baseline Report – Making Ghanaian Girls Great Project 95
Table 33: Learning scores of key barriers
Barriers: Average literacy score (aggregate)
Average numeracy score (aggregate)
Treatment Control Overall Treatment Control Overall All girls 43.8 43.2 43.5 55.5 54.0 54.8 Difficult to move around school
39.3 37.5 38.2 53.5 50.7 51.8
Doesn't use drinking water facilities
47.3 44.7 45.6 57.7 54.5 55.7
Doesn't use toilet at school 51.7 41.9 45.9 61.1 55.3 57.6 Doesn’t use areas where children play/ socialise
38.5 41.9 40.3 49.8 51.7 50.8
Doesn’t feel safe at school 39.9 40.5 40.3 49.6 56.2 54.0 Doesn’t feel safe travelling to/from school
45.4 39.5 41.8 56.8 52.6 54.2
Not allowed to play together with boys
37.2 37.6 37.4 50.3 48.9 49.6
Disagrees teachers make them feel welcome
35.0 33.5 34.3 48.6 48.7 48.7
Agrees teachers treat boys and girls differently in the classroom
42.5 43.8 43.1 54.3 53.2 53.8
Agrees teachers often absent from class
45.8 42.9 44.4 57.4 53.0 55.3
Note: Scores in red are below the average.
Qualitative data in FGDs suggests that barriers to attendance act as barriers to learning. More specifically, lack of money, lack of parental support, and household or work responsibilities were most frequently cited as barriers to attendance, leading to decreases in learning. Sixty percent of responses to questions about why girls are unable to attend school regularly indicated lack of money as the main barrier. Twenty percent of responses indicated the main barrier being lack of parental support, and twenty percent suggested household and work responsibilities. Several FGD participants stated that not only do household responsibilities inhibit learning by preventing attendance, but also by diminishing focus and attention due to exhaustion and stress.
Qualitatively, all students in FGDs indicated approval of the distance learning classes. Students most commonly stated that the distance learning classes have improved learning and understanding of topics (60% of responses). Additionally, students shared that the distance learning classes give them the opportunity to broaden their mindsets by covering topics that are outside of their home environments. Fifty seven percent of responses by female caretakers also indicated that MGCubed classes have improved learning and attendance when asked what changes have been observed regarding girls education in the last few years. Challenges cited by students regarding distance learning classes were network problems, equipment problems, and students skipping class.
Absenteeism and tardiness was most mentioned as a challenge to teaching and learning. Five teachers mentioned that students who live far from school would often arrive late and sometimes miss days of

GEC-T Baseline Report – Making Ghanaian Girls Great Project 96
schools. Two more reported that students would often ask permission to buy food in the afternoon and fail to return, and two others mentioned that some students would often skip MGcubed classes. Ten boy and girl FGD respondents also indicated that MGCubed classes are easier to skip or leave early, and students do so more frequently. However, these challenges were much less frequently cited than the resounding positive feedback.
All teachers reported that the distant learning program is a very innovative method to teaching and has had a great impact on their students. One specifically mentioned that some of their shy students have been able to interact more in classroom activities. Three teachers reported that during distance-learning sessions, professionals appeared on screen and were instrumental in acting as role models to boost girls’ self-esteem. One teacher specifically said that she appreciates how the distance learning only focuses on one subject at a time, rather than multiple. Despite the positive comments, some teachers were critical about the program. Two teachers indicated that the program conflicts with their schools’ morning schedule and it would be more effective as an afterschool program for a few days a week – it was not clear if they were referring to in-grade daytime classes or after-school remedial classes. Three more reported that students have difficulty paying attention after sitting for too long watching the screen. All teachers interviewed indicated there were technical problems with the technology. These qualitative findings are not significantly different from what is found in VF’s own triangulation methods and is further displayed in Annex 3. The results on technical issues are presented in the Sustainability section later in this report.
Setting learning targets
The literacy and numeracy targets for evaluation point 2 and evaluation point 3 are to be set based on the length of year between evaluation points and the annual MDES of 0.25 SD as proposed by the FM. For example, the total duration of school year between baseline and evaluation point 2 is 0.833 years (February 2018 to November 2018). Based on this information, the target for evaluation point 2 is [0.8333*0.25SD= 0.208 SD] where 0.208 SD is the standardized gap in scores between treatment and comparison students at midline. Similarly, for evaluation point 3 (endline), the target is [1.0*0.25 SD=0.25 SD] where 0.25 SD is the standardized gap in scores in evaluation point 3 between treatment and comparison students and length of time is one full year. The EE will use weights, or the share of each grade in the total overall number of beneficiaries, to more accurately determine the total overall score. Weighting will also be used to determine the targets of the transition indicator.
4.3 TRANSITION Transition is the second key outcome of the GEC-T evaluation and focuses on a girl’s journey as she progresses through school. Table 34 below sets out what defines a successful and unsuccessful transition from one part of a girl’s scholastic journey to the next. In the case of MGCubed, the ET is particularly interested in tracking in-school girls who progress from one grade to the next, who repeat a grade, and who drop out. For out-of-school girls, the ET will look at re-enrolment into school. There are also times in a girl’s educational journey known as key transitional points. These refer to her enrolment in lower primary, movement into upper primary, movement into secondary school, and graduation itself (though the duration of the project will not be long enough to see large-scale impact on graduation). It is at these

GEC-T Baseline Report – Making Ghanaian Girls Great Project 97
key transition points that a girl is most likely to stop going to school and thus careful attention is placed on the rates at which she can transition at key transition points, and the barriers that keep her from continuing on with her studies.
Table 34: Transition pathways
Baseline point Successful Transition Unsuccessful Transition Lower primary school
Enrolled in Grade 1, 2 ,3
In-school progression Drops out but is enrolled into alternative learning programme
Drops out of school Remains in same grade
Upper primary
Enrolled in Grade 4, 5, 6
In-school progression Moves into secondary school
Drops out of school Remains in same grade Moves into work, but is below legal age
Secondary school
Enrolled in Grade 7, 8, 9
In-school progression Enrols into technical & vocational education & training (TVET) Gainful employment
Drops out of school Remains in same grade Moves into employment, but is paid below minimum wage
Out of school (age A to B)
Dropped out Re-enrol in appropriate grade level in basic education
Remains out of school
The current cohort had a transition rate of 82.5% from last year to the current year. Repeat grade is responsible for the vast majority of non-transition. The MGCubed evaluation utilised a “joint sample” approach, which follows the same cohort at both the school and in the community (in households). Given that the transition indicator is measured at the household level, and all cohort students are in-school at the time of baseline (100% enrolment), transition data derived from the current cohort is somewhat biased. A true measure of transition data would include current out of school girls. Nevertheless, by utilizing a number of questions asked to a caregiver in the HH survey, the ET was able to find out the transition rate of cohort girls from the previous to the current year. Questions included the enrolment status of the girl in the previous year and the grade of the girl in the previous year. Table 35 shows an overall transition rate of 82.5%, 80.7% of which was from single-grade progression and 1.8% was re-enrolment into school. Seventeen-point-five percent of girls did not successfully transition from the previous year, with 16.5% repeating a grade and 1% enrolment or grade unknown.
Table 35: Transition rates among cohort girls
Disaggregation
Successful transition (%) Unsuccessful transition (%)
n Progressed one grade Re-enrolled
Repeated grade
Enrollment unknown last year
Grade unknown last year
Grade 3 317 80.76 3.47 15.14 0.32 0.32
Grade 4 545 78.9 2.2 18.35 0 0.55
Grade 5 610 81.8 1.64 15.57 0 0.98
Grade 6 612 79.41 1.47 18.63 0 0.49
JHS 1 497 83.9 0.8 14.69 0 0.6
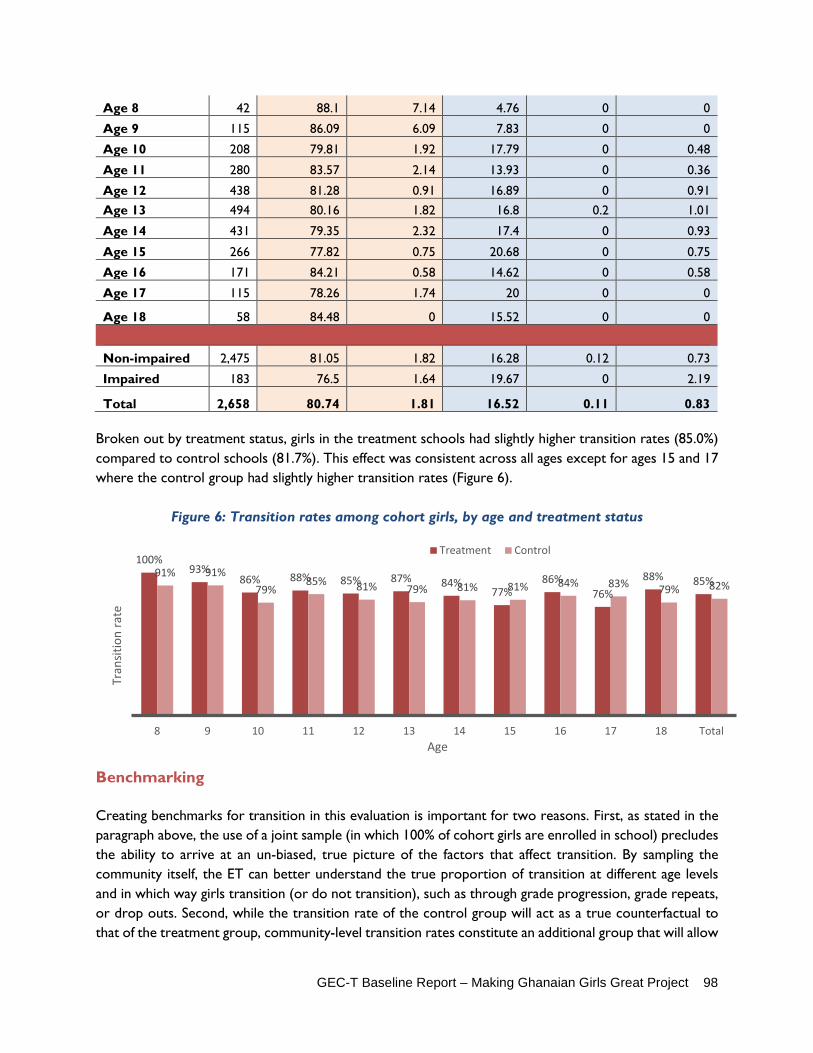
GEC-T Baseline Report – Making Ghanaian Girls Great Project 98
Age 8 42 88.1 7.14 4.76 0 0
Age 9 115 86.09 6.09 7.83 0 0
Age 10 208 79.81 1.92 17.79 0 0.48
Age 11 280 83.57 2.14 13.93 0 0.36
Age 12 438 81.28 0.91 16.89 0 0.91 Age 13 494 80.16 1.82 16.8 0.2 1.01
Age 14 431 79.35 2.32 17.4 0 0.93
Age 15 266 77.82 0.75 20.68 0 0.75
Age 16 171 84.21 0.58 14.62 0 0.58
Age 17 115 78.26 1.74 20 0 0
Age 18 58 84.48 0 15.52 0 0
Non-impaired 2,475 81.05 1.82 16.28 0.12 0.73
Impaired 183 76.5 1.64 19.67 0 2.19
Total 2,658 80.74 1.81 16.52 0.11 0.83 Broken out by treatment status, girls in the treatment schools had slightly higher transition rates (85.0%) compared to control schools (81.7%). This effect was consistent across all ages except for ages 15 and 17 where the control group had slightly higher transition rates (Figure 6).
Figure 6: Transition rates among cohort girls, by age and treatment status
Benchmarking Creating benchmarks for transition in this evaluation is important for two reasons. First, as stated in the paragraph above, the use of a joint sample (in which 100% of cohort girls are enrolled in school) precludes the ability to arrive at an un-biased, true picture of the factors that affect transition. By sampling the community itself, the ET can better understand the true proportion of transition at different age levels and in which way girls transition (or do not transition), such as through grade progression, grade repeats, or drop outs. Second, while the transition rate of the control group will act as a true counterfactual to that of the treatment group, community-level transition rates constitute an additional group that will allow
100%93%
86% 88% 85% 87% 84%77%
86%76%
88% 85%91% 91%
79%85% 81% 79% 81% 81% 84% 83% 79% 82%
8 9 10 11 12 13 14 15 16 17 18 Total
Tran
sitio
n ra
te
Age
Treatment Control
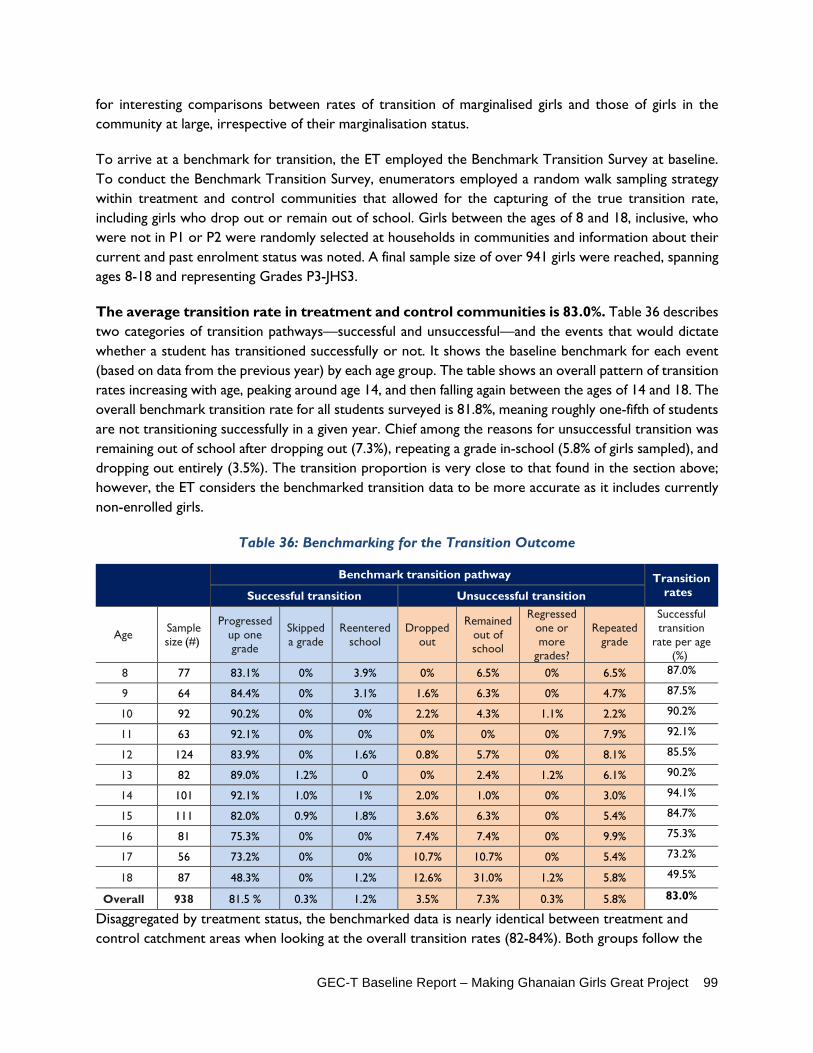
GEC-T Baseline Report – Making Ghanaian Girls Great Project 99
for interesting comparisons between rates of transition of marginalised girls and those of girls in the community at large, irrespective of their marginalisation status.
To arrive at a benchmark for transition, the ET employed the Benchmark Transition Survey at baseline. To conduct the Benchmark Transition Survey, enumerators employed a random walk sampling strategy within treatment and control communities that allowed for the capturing of the true transition rate, including girls who drop out or remain out of school. Girls between the ages of 8 and 18, inclusive, who were not in P1 or P2 were randomly selected at households in communities and information about their current and past enrolment status was noted. A final sample size of over 941 girls were reached, spanning ages 8-18 and representing Grades P3-JHS3.
The average transition rate in treatment and control communities is 83.0%. Table 36 describes two categories of transition pathways—successful and unsuccessful—and the events that would dictate whether a student has transitioned successfully or not. It shows the baseline benchmark for each event (based on data from the previous year) by each age group. The table shows an overall pattern of transition rates increasing with age, peaking around age 14, and then falling again between the ages of 14 and 18. The overall benchmark transition rate for all students surveyed is 81.8%, meaning roughly one-fifth of students are not transitioning successfully in a given year. Chief among the reasons for unsuccessful transition was remaining out of school after dropping out (7.3%), repeating a grade in-school (5.8% of girls sampled), and dropping out entirely (3.5%). The transition proportion is very close to that found in the section above; however, the ET considers the benchmarked transition data to be more accurate as it includes currently non-enrolled girls.
Table 36: Benchmarking for the Transition Outcome
Benchmark transition pathway Transition
rates Successful transition Unsuccessful transition
Age Sample size (#)
Progressed up one grade
Skipped a grade
Reentered school
Dropped out
Remained out of school
Regressed one or more
grades?
Repeated grade
Successful transition
rate per age (%)
8 77 83.1% 0% 3.9% 0% 6.5% 0% 6.5% 87.0%
9 64 84.4% 0% 3.1% 1.6% 6.3% 0% 4.7% 87.5%
10 92 90.2% 0% 0% 2.2% 4.3% 1.1% 2.2% 90.2%
11 63 92.1% 0% 0% 0% 0% 0% 7.9% 92.1%
12 124 83.9% 0% 1.6% 0.8% 5.7% 0% 8.1% 85.5%
13 82 89.0% 1.2% 0 0% 2.4% 1.2% 6.1% 90.2%
14 101 92.1% 1.0% 1% 2.0% 1.0% 0% 3.0% 94.1%
15 111 82.0% 0.9% 1.8% 3.6% 6.3% 0% 5.4% 84.7%
16 81 75.3% 0% 0% 7.4% 7.4% 0% 9.9% 75.3%
17 56 73.2% 0% 0% 10.7% 10.7% 0% 5.4% 73.2%
18 87 48.3% 0% 1.2% 12.6% 31.0% 1.2% 5.8% 49.5%
Overall 938 81.5 % 0.3% 1.2% 3.5% 7.3% 0.3% 5.8% 83.0%
Disaggregated by treatment status, the benchmarked data is nearly identical between treatment and control catchment areas when looking at the overall transition rates (82-84%). Both groups follow the

GEC-T Baseline Report – Making Ghanaian Girls Great Project 100
same pattern of slightly rising transition rates from eight years of age through 11, a some volatility at 12 and 13, a peak around 14, and then a steady decline afterward. A large difference, however, can be seen at the 12 and 13-year age marks, where control catchment areas are 9 percentage points higher than treatment (12 years old) and treatment are 14 percentage points higher than control (13 years old) (Figure 7).
Figure 7: Transition rates among benchmark girls, by age and treatment status
4.4 SUB-GROUP ANALYSIS OF THE TRANSITION OUTCOME Quantitative analysis of the transition outcome for sub-groups is presented in the section on validating the theory of change later in this report. In its absence, in this section the report displays qualitative findings as it relates to barriers to transition, and factors that facilitate successful transition. Female and male caregivers, teachers, and boys and girls were all asked questions about transition, typically about the types of students who do and do not attend school or who drop out and why.
Poverty: While a number of factors inhibiting learning, attendance, and transition were cited in the qualitative data, poverty is by far the most persistent and pervasive barrier as indicated by FGD and KII respondents. A large proportion of FGD respondents (slightly over 60%) indicated poverty as a major barrier to a girl’s ability to attend school and focus on school, often preventing successful transition. According to teacher interviews, poverty is one of the main contributing factors. Two other teachers mentioned that some of their students have great difficulties paying attention in class when they haven't eaten in the morning and often have to leave class early. Qualitative data also identified three major impacts of poverty on learning and transition: students often cannot attend school because they must work, students often do not come to school because they cannot afford the basic school necessities, and impoverished students who attend school are often unable to focus on school work. One ten-year-old fifth grader indicated that she missed four days of school because she could not afford to fix her ripped uniform. When asked what causes them to be absent from school the majority of male and female students (57% of responses) indicated financial constraints. These findings validate pieces of VF’s theory of change around poverty and barriers to education, and provide important support for cash transfers.
89% 88% 86%93%
81%
96% 94%85%
77% 73%
49%
82%88% 87%
94% 92% 90%82%
94%84%
75% 73%
50%
84%
8 9 10 11 12 13 14 15 16 17 18 Total
Tran
sitio
n ra
te
Age
Treatment Control

GEC-T Baseline Report – Making Ghanaian Girls Great Project 101
Household Responsibilities: Household responsibilities were the second most cited barrier to attendance, learning, and transition across all FGDs. Nearly 75 percent of girl FGD responses indicated that a necessity to work and complete additional household responsibilities were the only cause for their absence from school. Several female students indicated that they will not be absent or late to school if they consistently wake up early enough to complete all of their chores before school. A large number of female students indicated that they will not be absent or late to school if they wake up early enough to complete all of their chores before school. Several FGD respondents indicated that girls are too tired and also too worried about their household responsibilities to be able to focus in class. They also often do not have time to complete school work due to household responsibilities, according to qualitative data. Four out of the fifteen teachers noticed that girls are often pulled out of class by their parents or miss days of schools to go work or perform household chores. Additionally, several FGD respondents indicated that girls are often required to go to work outside of the home to help support the family. One teacher specifically mentioned that girls who work after school are often too tired to complete assignments when they arrive home and are too tired to focus in class. Although most of the responses of both male and female teachers were similar, there were slight differences in responses when discussing household chores as a prominent barrier to transition. Out of the seven teachers who commented on household chores as an impediment to transition, three male teachers mentioned that girls overburdened by household chores often miss class or drop out, but the four female teachers who commented on the barrier of household chores mentioned that the girls are over-burdened because the work is not evenly divided amongst boys and girls at home.
Pregnancy and early marriage: In all FGDs, pregnancy was cited among the top three barriers to learning and transition. A large proportion (45%) of respondents indicated that teenage pregnancy is one of the main reasons that girls drop out of school. Troublingly, several respondents indicated that impoverished girls whose parents cannot provide for them often seek out help from men. In return for providing help, such as money for school, these men demand sex, often leading to pregnancy and dropping out of school. As one father stated, “as a result of poverty or joblessness, parents are not able to properly care for their children, so their daughters resort to other males who can provide their needs, which leads to pregnancy.” Another barrier to transition discussed included early age marriage. Two teachers mentioned that in the Kadjebi Muslim community, girls are offered off for marriages and they often do not complete JHS as they have to withdraw from school. There is no direct evidence that pregnant girls or girl-mothers are actively barred from school; in fact, given that girl-mothers represented a part of the sample, there is evidence that they do indeed return to school after pregnancy. One teacher mentioned that parents have become more involved in the daughters’ lives even when they become pregnant prematurely. After their daughters give birth, they re-enroll them into school within six months to a year.
Distance from School: Another contributing factor affecting transition mentioned by teachers is distance from school. Two teachers from Adenta mentioned that they have students who have missed some class or who have dropped out because their parents moved far away and attending school has been difficult. One teacher mentioned that in her P6 class, if a student is absent for more than three times in a term, the student is forced to repeat the grade. In addition to the distance from school, three teachers have also noticed that the students who live with non-relative caregivers are often abused and they drop out.
GEC-T Baseline Report – Making Ghanaian Girls Great Project 102
Note on Impairment: Impairment was only referenced by two respondents across all FGDs and KIIs. A fifth-grade boy stated that “Some boys and girls think that they will be made fun of which prevents people with disabilities from coming to school.” A teacher mentioned that his student with a learning impairment wants to leave school because she feels humiliated, but he encouraged her to stay in school. Aside from these two mentions, impairment was not discussed in the qualitative data. However, lack of motivation, attention, and/or studying was frequently indicated by caretakers and students of both genders. It is possible that cognitive impairment is misperceived as lack of motivation, attention, and/or studying. At midline, moderators will further prompt respondents to discuss whether or not impairment is a barrier to learning and transition.
Mitigating dropout risk: In addition to child protection policies, special attention has been given to girls who have left school or who plan on leaving school. Five teachers said that they always follow up with the parents when they believe that their female student will drop out and sometimes visits the girls’ home to address the issue. Two others mentioned that they sometimes provide financial assistance to girls who cannot afford school materials and fees. One teacher specifically said that she advises parents on delegating some household chores to the boys to alleviate the girls work, so that they may not be so tired when they come to school. Three others said that they educate their female students about early pregnancy. One teacher commented on the fact that their communities have tried to limit girl and boy interaction in school and in the community to reduce premature dating. He said that when a community member notices girls and boys “walk together in the town a night,” some form of corporal punishment is administered.
4.5 COHORT TRACKING AND TARGET SETTING FOR THE TRANSITION OUTCOME
The joint sample in the evaluation required that the ET track girls from school to home. This was essential in order to successfully complete the household survey, enabling the linking of a girl’s learning and her key demographic and household characteristics. Further, following up with the household was also imperative to better understand the transition outcome should a girl be out of school at follow-up data collection points.
To successfully track girls from school to the household, the ET designed its data collection travel schedule and logistics around spending two full days in a catchment area, and splitting enumerator teams into two: a community-based team and a school-based team. In the morning, the school-based enumeration teams concentrated fully on the school, carrying out all learning tests, Girl’s surveys, interviews with school-level actors, and any other qualitative events at the school. The community-based team was on a one-day lag behind the school-based team. Once the school-based team had successfully sampled and administered learning tests to girls at school, they relayed the girls’ information to the community-based team, who was tasked with locating the girls’ households later that day or the following day.
This process ran into many hurdles in practice. Community-based teams were sometimes unaware of who and where they should be visiting, and without local knowledge of the area, many houses were difficult to locate. It became evidently clear that obtaining a phone number of a caregiver from the girl
GEC-T Baseline Report – Making Ghanaian Girls Great Project 103
student herself or the director would greatly facilitate tracking the girl back to her household and successfully completing the community-based activities. Once a phone number was attained, enumerators made appointments ahead of time and were able to more efficiently conduct their activities.
Tracking the cohort at midline and endline will not be without challenge. The logistics system set up by JMK Consulting and the ET worked well after trial and error and will be repeated at further data collection periods. To ensure that the cohort can be tracked and attrition minimized, a number of processes were put in place at baseline and/or will be conducted at midline. These include:
• Use of GPS to triangulate household location and, if necessary, create maps to guide enumerators.
• Collection of two cell phone numbers of caregivers to increase chances of making contact. • Collection of contact information of a neighbor of the caregiver, including name and phone
number. • Consulting other students as to the whereabouts of a cohort girl; classmates are often times the
best source of information. • Phoning caregivers days ahead of time to set appointments and ensure that girls are available for
testing • Working with head teachers to identify girls’ households and caregivers; liaise with head teachers
to arrange meetings with caregivers as necessary. Work with head teachers to get participants ahead of time for qualitative events as well.
• Printing and use of a specialized tracking sheet which lists all pertinent information of a cohort girl, including key instructions about one-for-one replacement, if necessary.
Tracking transition: Following up with all households at midline and endline will be critical for the transition indicator. Locating a girl at school at midline or endline will probably mean she has successfully transitioned to the next grade; the ET will follow up with this girl to understand her transition status better as being in school does not necessarily mean that she has successfully transitioned (for example, repeating a grade does not count as successful transition). In the case of non-transition where a cohort girl cannot be easily located (for example, a cohort girl is no longer at school where she was at baseline) in subsequent data collection periods, the ET will follow up with her household to better understand the transition outcome (if she moved on to another school, dropped out, etc.). If the ET is unable to locate a household, the ET will consult others at the school and community-level, such as classmates, teachers, head teachers, and other community leaders to get information on the lost cohort girl. A cohort girl that is lost to attrition in this manner, will be replaced utilizing a 1-for-1 replacement strategy, though her status will be marked as non-transition. If she is eventually found, she will continue to be tracked throughout the project to update and better inform the transition outcome. If in the case that a head of household, caregiver, or girl is not available to complete the full HHS, enumerators will return up to 3 separate times to confirm a date and time to carry out the HHS.
Setting transition targets
In setting targets for transition, the ET considers the benchmarking data as well as the project and local context. Prior to data collection, in order to calculate sufficient sample sizes to arrive at 80% statistical power, the ET reviewed the Ghana EMIS database, looking specifically at transition rates. Rates were calculated based on 2015-2016 enrolment data, and showed average transition rates of 97%, taking into

GEC-T Baseline Report – Making Ghanaian Girls Great Project 104
account repeat grades, dropouts, and flows of students in and out of schools. While the quality of the EMIS data was uncertain, it is important to note that MGCubed project areas are mostly rural and by definition, marginalised in nature. The 81.8% transition rate calculated from benchmark data is a conservative rate and probably one somewhat lower than rates in urban areas that are less marginalised in Greater Accra and Volta regions. It is also higher than expected and seeing large increases when the transition rate is already over 80% is unlikely. The ET conducted a secondary review of Ghana national level data gathered and organised by FHI360,38 UNESCO,39 and the World Bank.40 The data, which came from a range of years between 2015-2017, tracked transition rates from primary to secondary school and among girls, and helped to both triangulate the ET’s findings among the cohort and benchmark samples, and ultimately inform transition target setting. FHI360 data projected a 95% secondary transition rate of female students for 2018 while UNESCO and the World Bank each reported a 93.4% secondary transition rate (2016). The sources also report primary completion rates of 83% (projected 2018 in the FHI360 paper) and actual primary completion rates of 83% (2016) for females. With these considerations in mind, the ET has strong confidence in its findings at baseline which show an overall transition rate of between 82-83% in the cohort and the community, and a transition rate to JHS1 of 84.7% (in the cohort) and between 85-96% in treatment communities, assuming a 13-15 years old age range for JHS1. Given these numbers, the ET proposes a target at midline of a full sample weighted average of 84.5% that is equal to the weighted average between an expected primary completion rate of 84.5% (or two percentage points above the actual rate in both the data collected and the secondary literature). These rates are in line with projected rates put forth in the FHI paper and take into account that the sample are marginalised girls, potentially worse off than the averages reported in the literature. Further, a larger proportion of the cohort will be in JHS at midline, the implications of which are unclear on overall transition rates. The ET believes that a two percentage point increase at midline is a conservative estimate. At endline, the ET proposes an additional 3 percentage point increase to a final overall transition rate of 87.5%. Table 37 reflects these expected targets. Boys are not tracked under the transition indicator; however, given that boys sampled as part of the cohort will be re-contacted at midline, the midline report will report the proportion of sampled boys that transitioned. Albeit non statistically significant or externally valid, reporting the boys’ transition could prove an interesting data point for comparison purposes. In its guidance on setting transition targets, the Fund Manager suggests an increase of 5% for a corresponding value of between 80-89%. The increase from 82.5% at baseline to 87.5% at endline is a 5-percentage point increase, or 6% overall increase. Thus, the two proposed targets nearly match, aligning with both evidence-based research, findings from primary data collection, and overall guidance.
38 https://www.epdc.org/sites/default/files/documents/Ghana_trends_2013.pdf 39 http://uis.unesco.org/country/GH 40 https://data.worldbank.org/indicator/SE.SEC.PROG.FE.ZS?locations=GH
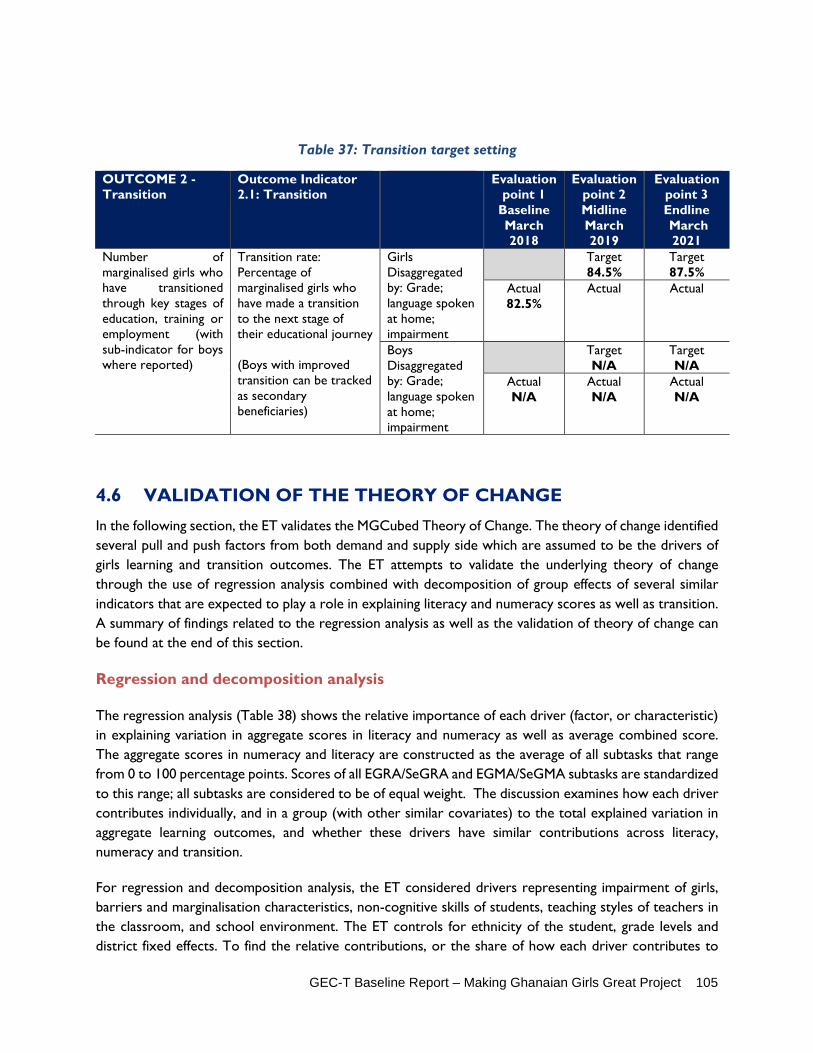
GEC-T Baseline Report – Making Ghanaian Girls Great Project 105
Table 37: Transition target setting
OUTCOME 2 - Transition
Outcome Indicator 2.1: Transition
Evaluation point 1
Baseline March 2018
Evaluation point 2 Midline March 2019
Evaluation point 3 Endline March 2021
Number of marginalised girls who have transitioned through key stages of education, training or employment (with sub-indicator for boys where reported)
Transition rate: Percentage of marginalised girls who have made a transition to the next stage of their educational journey (Boys with improved transition can be tracked as secondary beneficiaries)
Girls Disaggregated by: Grade; language spoken at home; impairment
Target 84.5%
Target 87.5%
Actual 82.5%
Actual Actual
Boys Disaggregated by: Grade; language spoken at home; impairment
Target N/A
Target N/A
Actual N/A
Actual N/A
Actual N/A
4.6 VALIDATION OF THE THEORY OF CHANGE In the following section, the ET validates the MGCubed Theory of Change. The theory of change identified several pull and push factors from both demand and supply side which are assumed to be the drivers of girls learning and transition outcomes. The ET attempts to validate the underlying theory of change through the use of regression analysis combined with decomposition of group effects of several similar indicators that are expected to play a role in explaining literacy and numeracy scores as well as transition. A summary of findings related to the regression analysis as well as the validation of theory of change can be found at the end of this section.
Regression and decomposition analysis
The regression analysis (Table 38) shows the relative importance of each driver (factor, or characteristic) in explaining variation in aggregate scores in literacy and numeracy as well as average combined score. The aggregate scores in numeracy and literacy are constructed as the average of all subtasks that range from 0 to 100 percentage points. Scores of all EGRA/SeGRA and EGMA/SeGMA subtasks are standardized to this range; all subtasks are considered to be of equal weight. The discussion examines how each driver contributes individually, and in a group (with other similar covariates) to the total explained variation in aggregate learning outcomes, and whether these drivers have similar contributions across literacy, numeracy and transition.
For regression and decomposition analysis, the ET considered drivers representing impairment of girls, barriers and marginalisation characteristics, non-cognitive skills of students, teaching styles of teachers in the classroom, and school environment. The ET controls for ethnicity of the student, grade levels and district fixed effects. To find the relative contributions, or the share of how each driver contributes to
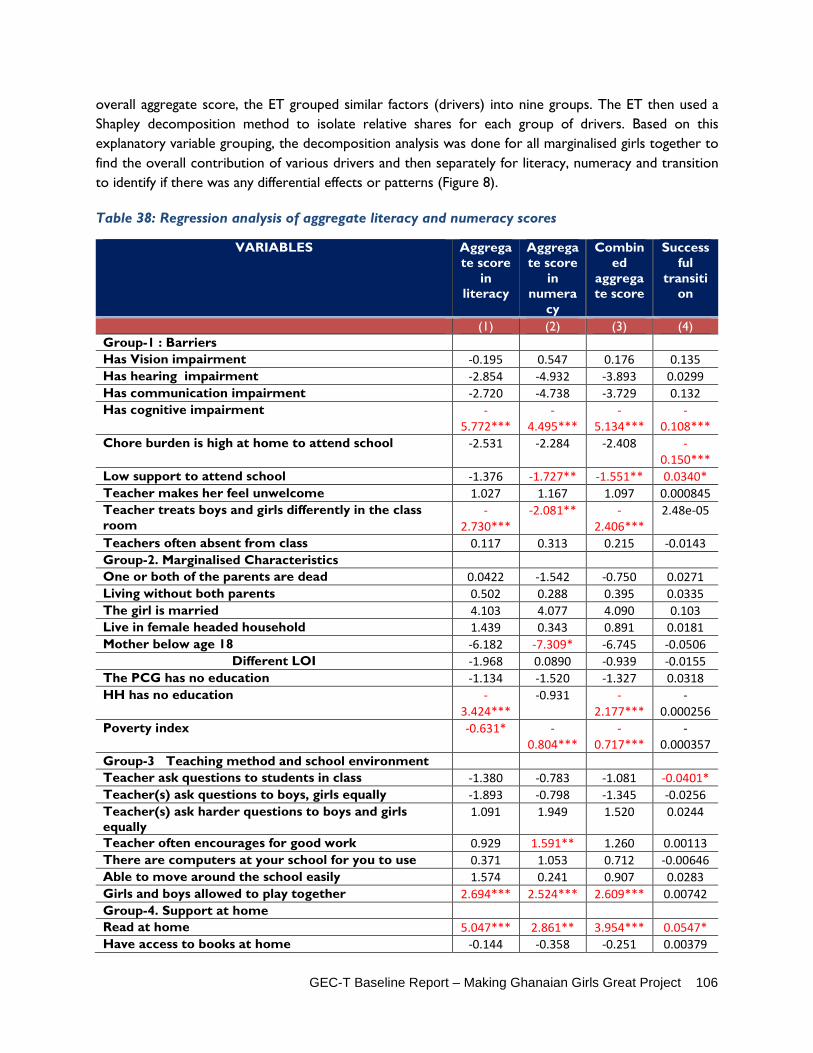
GEC-T Baseline Report – Making Ghanaian Girls Great Project 106
overall aggregate score, the ET grouped similar factors (drivers) into nine groups. The ET then used a Shapley decomposition method to isolate relative shares for each group of drivers. Based on this explanatory variable grouping, the decomposition analysis was done for all marginalised girls together to find the overall contribution of various drivers and then separately for literacy, numeracy and transition to identify if there was any differential effects or patterns (Figure 8).
Table 38: Regression analysis of aggregate literacy and numeracy scores
VARIABLES Aggregate score
in literacy
Aggregate score
in numera
cy
Combined
aggregate score
Successful
transition
(1) (2) (3) (4) Group-1 : Barriers
Has Vision impairment -0.195 0.547 0.176 0.135 Has hearing impairment -2.854 -4.932 -3.893 0.0299 Has communication impairment -2.720 -4.738 -3.729 0.132 Has cognitive impairment -
5.772*** -
4.495*** -
5.134*** -
0.108*** Chore burden is high at home to attend school -2.531 -2.284 -2.408 -
0.150*** Low support to attend school -1.376 -1.727** -1.551** 0.0340* Teacher makes her feel unwelcome 1.027 1.167 1.097 0.000845 Teacher treats boys and girls differently in the class room
-2.730***
-2.081** -2.406***
2.48e-05
Teachers often absent from class 0.117 0.313 0.215 -0.0143 Group-2. Marginalised Characteristics
One or both of the parents are dead 0.0422 -1.542 -0.750 0.0271 Living without both parents 0.502 0.288 0.395 0.0335 The girl is married 4.103 4.077 4.090 0.103 Live in female headed household 1.439 0.343 0.891 0.0181 Mother below age 18 -6.182 -7.309* -6.745 -0.0506
Different LOI -1.968 0.0890 -0.939 -0.0155 The PCG has no education -1.134 -1.520 -1.327 0.0318 HH has no education -
3.424*** -0.931 -
2.177*** -
0.000256 Poverty index -0.631* -
0.804*** -
0.717*** -
0.000357 Group-3 Teaching method and school environment
Teacher ask questions to students in class -1.380 -0.783 -1.081 -0.0401* Teacher(s) ask questions to boys, girls equally -1.893 -0.798 -1.345 -0.0256 Teacher(s) ask harder questions to boys and girls equally
1.091 1.949 1.520 0.0244
Teacher often encourages for good work 0.929 1.591** 1.260 0.00113 There are computers at your school for you to use 0.371 1.053 0.712 -0.00646 Able to move around the school easily 1.574 0.241 0.907 0.0283 Girls and boys allowed to play together 2.694*** 2.524*** 2.609*** 0.00742 Group-4. Support at home
Read at home 5.047*** 2.861** 3.954*** 0.0547* Have access to books at home -0.144 -0.358 -0.251 0.00379
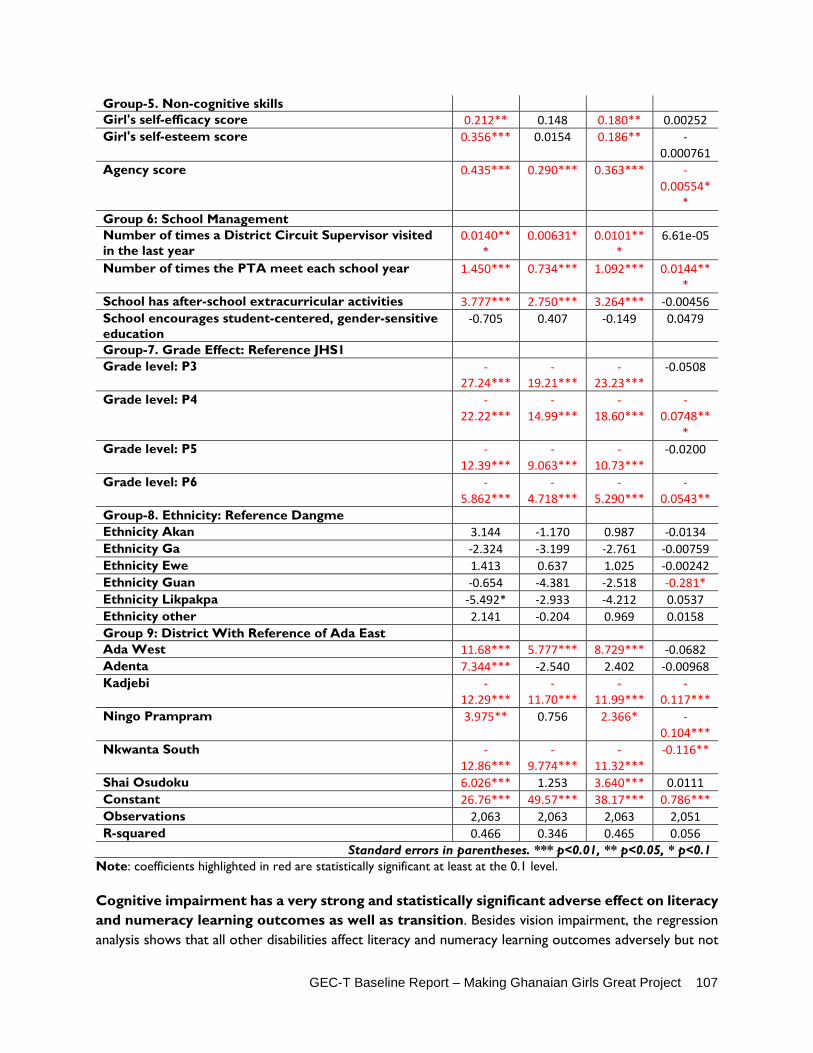
GEC-T Baseline Report – Making Ghanaian Girls Great Project 107
Group-5. Non-cognitive skills
Girl's self-efficacy score 0.212** 0.148 0.180** 0.00252 Girl's self-esteem score 0.356*** 0.0154 0.186** -
0.000761 Agency score 0.435*** 0.290*** 0.363*** -
0.00554**
Group 6: School Management
Number of times a District Circuit Supervisor visited in the last year
0.0140***
0.00631* 0.0101***
6.61e-05
Number of times the PTA meet each school year 1.450*** 0.734*** 1.092*** 0.0144***
School has after-school extracurricular activities 3.777*** 2.750*** 3.264*** -0.00456 School encourages student-centered, gender-sensitive education
-0.705 0.407 -0.149 0.0479
Group-7. Grade Effect: Reference JHS1
Grade level: P3 -27.24***
-19.21***
-23.23***
-0.0508
Grade level: P4 -22.22***
-14.99***
-18.60***
-0.0748**
* Grade level: P5 -
12.39*** -
9.063*** -
10.73*** -0.0200
Grade level: P6 -5.862***
-4.718***
-5.290***
-0.0543**
Group-8. Ethnicity: Reference Dangme
Ethnicity Akan 3.144 -1.170 0.987 -0.0134 Ethnicity Ga -2.324 -3.199 -2.761 -0.00759 Ethnicity Ewe 1.413 0.637 1.025 -0.00242 Ethnicity Guan -0.654 -4.381 -2.518 -0.281* Ethnicity Likpakpa -5.492* -2.933 -4.212 0.0537 Ethnicity other 2.141 -0.204 0.969 0.0158 Group 9: District With Reference of Ada East
Ada West 11.68*** 5.777*** 8.729*** -0.0682 Adenta 7.344*** -2.540 2.402 -0.00968 Kadjebi -
12.29*** -
11.70*** -
11.99*** -
0.117*** Ningo Prampram 3.975** 0.756 2.366* -
0.104*** Nkwanta South -
12.86*** -
9.774*** -
11.32*** -0.116**
Shai Osudoku 6.026*** 1.253 3.640*** 0.0111 Constant 26.76*** 49.57*** 38.17*** 0.786*** Observations 2,063 2,063 2,063 2,051 R-squared 0.466 0.346 0.465 0.056
Standard errors in parentheses. *** p<0.01, ** p<0.05, * p<0.1 Note: coefficients highlighted in red are statistically significant at least at the 0.1 level.
Cognitive impairment has a very strong and statistically significant adverse effect on literacy and numeracy learning outcomes as well as transition. Besides vision impairment, the regression analysis shows that all other disabilities affect literacy and numeracy learning outcomes adversely but not

GEC-T Baseline Report – Making Ghanaian Girls Great Project 108
in a significant way. Similar to learning outcomes, cognitive impairment together with a high burden of household chores pose a significant adverse effect on successful transition. Although many indicators are not individually significant, the decomposition analysis suggests that as a group, barriers and disabilities contribute almost 18% in explaining successful transition to higher grades.
A feeling of differential treatment of boys and girls by teachers, and low level of support to continue to study are found to have highly significant adverse effects on girls’ performance in learning outcomes. The individual effects of each indicator at the school level show that most of the chosen indicators have adverse effects, however, most significant among them are the feeling of differential treatment of girls and boys by teachers, and low level of support to continue to study. The decomposition results in Table 39 show that together as a group with all types of disabilities, these barriers explain 2-3% of literacy and numeracy – supporting the hypothesis in the theory of change that social barriers and physical impairments adversely affect numeracy skills more than literacy outcomes.
Having an illiterate head of household has a very significantly strong adverse effect on girls’ scores in literacy and numeracy. In the theory of change, marginalisation characteristics of a girl are a set of features that raises the most concern about her prospect of transition and learning achievements. Among them, the ET considered indicators such as living without parents, parents are no longer living, girl is married or became a mother underage, as well as other basic characteristics of the head of the household, such as female-headed households and the head of household’s level of education. The model shows that when parents are no longer living or a girl is a mother underage, there are adverse effects on literacy and numeracy scores but the effects are weakly significant. On the contrary, girls do significantly better when they are in a female-headed household.
A composite index of poverty measures is significantly associated with poor performance of girls in numeracy and literacy. Poverty is considered to be one of the main components of marginalisation. Based on different components of multidimensional poverty, the ET created an index to represent poverty. In this index, the group of indicators that the ET used to define multi-dimensional poverty were whether the household finds it difficult to afford girls’ education, cannot find ways to fulfil basic needs, does not possess land, and if a girl goes to bed hungry more often than never. The model also included another indicator based on the materials used for roofing, such as mud or plastic or boards, and thatch. Decomposition results show that poverty along with other marginalisation indicators as a group explain around three percent of total variation in learning outcomes. While evidence from the regression analysis does not show any specific significant effect of poverty characteristics on transition, the decomposition analysis shows that together as a group, poverty explains six percent of the variation in transition outcomes as compared to three percent in literacy, numeracy, and overall learning score.
Non-cognitive skills of a girl have a strong positive significant effect on her performance in literacy and numeracy. The model includes three indices constructed to measure non-cognitive indicators of self-esteem, self-efficacy, and agency (explained further in Sections 5.5 and 5.8). The ET hypothesized that self-efficacy, self-esteem, and a girl's level of agency will have positive impacts on a girl’s learning and transition outcomes as they relate to her motivation to do well in school, ability to attend school and continue in her studies, and belief that she can succeed in various life situations. Evidence from the regression analysis suggests that individually, all three measures of non-cognitive skills have very strong

GEC-T Baseline Report – Making Ghanaian Girls Great Project 109
and significant effects on scores in literacy and numeracy. In groups, they contribute 6-8% of explained variation in literacy and numeracy.
A girl’s agency is unexpectedly significantly associated with lower transition levels. One plausible explanation could be that even though agency rises with age, it does not necessarily mean that a girl might want to go to school or has the power to do so. Even if her opinion is considered more and more as she ages, she could be unduly influenced by cultural or financial pressures to the point that she does not transition. This could signify the extreme pressure of cultural norms, such as taking care of family members, or it could mean that the importance of girls' education is not getting through to girls as much as previously thought. This is supported by qualitative findings that indicate the necessity of finding work over continuing with education. Additionally, thirty percent of FGD responses to questions regarding barriers to learning and transition cited social norms and lack of motivation for education as major barriers, supporting the quantitative finding that increased agency may not indicate improvements in rates of transition. Overall, the non-cognitive skills of a girl explain five percent of the variation in the transition outcome, which is almost two percentage points lower than the group effect on learning scores.
Encouragement from teachers for good work matters significantly to perform better in numeracy and overall, but not as much in literacy. Equitable treatment by teachers in the class appears to matter as well, a central tenet in VF’s theory of change. When teachers treat boys and girls equally it affects girls’ performance positively, although the effect is not significant. Students also perform significantly better in literacy and numeracy if the school has a positive gender unbiased environment. Evidence from the above regression analysis shows that if girls are allowed to play with boys together, they perform significantly better overall in learning. As decomposition analysis shows, the combined effect of the indicators in this group (school-level management) explain 4-6% of the variation in literacy and numeracy. In the case of transition, the evidence suggests that a transition rate is significantly lower when a teacher asks question in the class. Individually, other factors from the group of factors that represent teaching quality do not have significant effects as they do in the learning outcomes. However, their overall group effect shows that they explain six percent of successful transition, as compared to 4-6% of aggregate learning scores.
When a girl has the opportunity to read at home, she performs significantly better in literacy and numeracy. Her transition levels are also higher. Students perform significantly better when they read at home. While regression analysis shows the two indicators’ individual importance, together they explain approximately 3-4% of literacy and numeracy scores. Similar to its effect on learning outcomes, reading at home is significantly associated with transition to higher grades, albeit weakly. The model suggests that the overall group effect of these household characteristics is five percent as compared to 3-4% on the learning outcome.
Better school management affects girls’ literacy and numeracy scores significantly. More frequent PTA meetings at schools is significantly positively associated with transition. The relationship of literacy and numeracy scores with school level indicators such as number of monitoring visits, frequency of PTA meetings, and availability of after-school extracurricular activities is strongly positive. The presence of student-centred gender-sensitive education, however, does not provide any evidence of significant effects on learning. The group effect of these school-level indicators explains 6-9% of literacy and numeracy scores. When it comes to transition, many school-level indicators see a positive

GEC-T Baseline Report – Making Ghanaian Girls Great Project 110
association. School management indicators as a group explain 17% of total variation in the transition outcome. It is probable that when PTAs are more active, they are also more likely involved with ensuring and facilitating educational transition in their communities.
The evidence from the decomposition analysis suggests a strong positive association between grade progression and learning scores, but there is no clear relationship with transition. Compared to JHS1, as a student progresses and continues to study, her relative performance in learning scores increases significantly. As the decomposition results suggests, overall, grade progression explains 35-38% of the variation in literacy and numeracy scores. From the perspective of transition, however, decomposition analysis shows that grade progression explains only eight percent of transition, suggesting an almost equal rate of dropouts and class repeats across grades.
Ethnicity does not have a significant effect on learning scores or transition. Girls belonging to Akan, Guan, Ewe, Likpakpa, and “Other” ethnicity perform similar to girls from Dangme and Ga ethnicities. As a group, they explain 8-11% of literacy and numeracy achievements, suggesting a strong but similar influence of ethnic background. The effect of ethnicity on transition is similar to what is seen with learning outcomes. According to the relative shares as found through decomposition analysis, ethnicity explains six percent of transition.
Unobservable district-level factors explain large amounts of learning and transition outcomes. The ET controlled for district-level unobservable factors by introducing dummy variables for each district. The decomposition analysis shows that together all seven districts explain 26-27% of total variation in numeracy and literacy, an effect that is stable across literacy and numeracy learning outcomes, as well as 30% of the variation in transition.
Table 39: Groups of the Decomposition Analysis
Group Name Group Composition
Transition
Aggregate learning scores
Numeracy Literacy
Group 1: Barriers
Impaired vision, impaired hearing, impaired communication, impaired cognitive ability, impaired communication, impaired mobility, chore burden, low support, unwelcome by teacher, unequal treatment by teacher, agree that teacher is absent frequently
18% 2% 3% 2%
Group2: Marginalisation
single orphan, double orphan, living without both parent, married, female headed household, mother under16, mother under 18, HH illiterate, PCG uneducated; Poverty index, Different LOI.
6% 3% 3% 3%
Group 3: Teaching method
Teacher ask question to all equally; Teacher ask hard question equally; teacher provide encouragement; Teacher often encourages for good
6% 4% 6% 4%
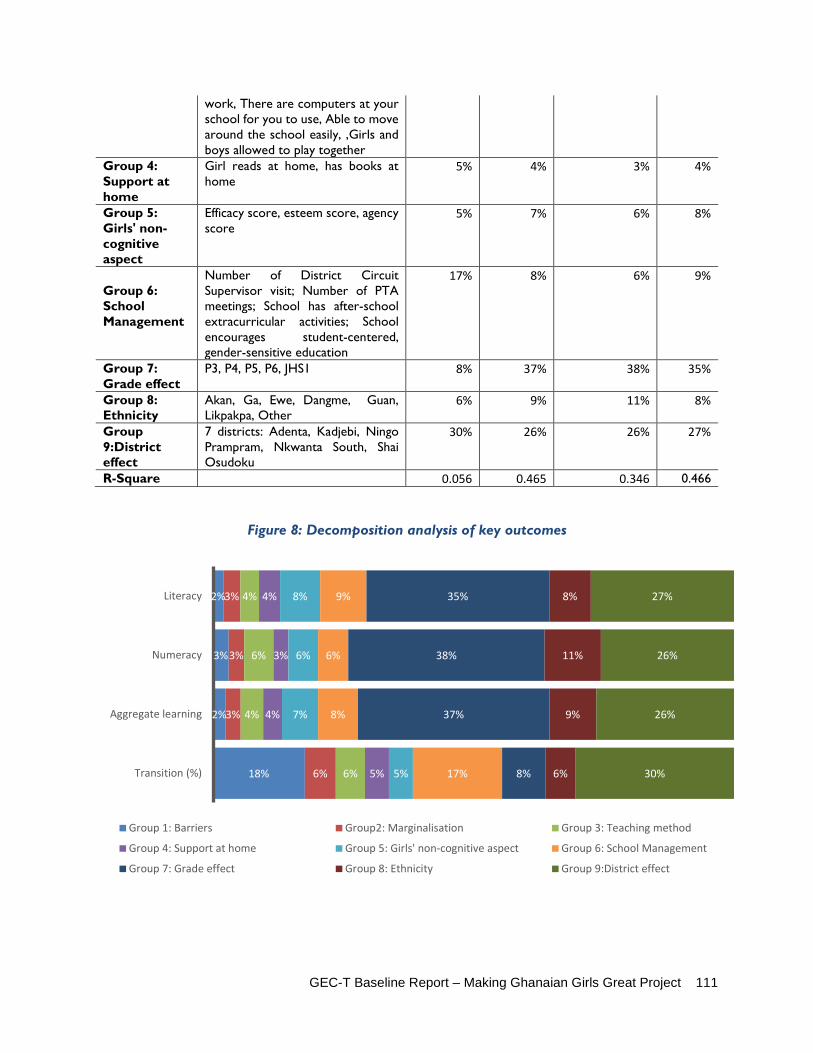
GEC-T Baseline Report – Making Ghanaian Girls Great Project 111
work, There are computers at your school for you to use, Able to move around the school easily, ,Girls and boys allowed to play together
Group 4: Support at home
Girl reads at home, has books at home
5% 4% 3% 4%
Group 5: Girls' non-cognitive aspect
Efficacy score, esteem score, agency score
5% 7% 6% 8%
Group 6: School Management
Number of District Circuit Supervisor visit; Number of PTA meetings; School has after-school extracurricular activities; School encourages student-centered, gender-sensitive education
17% 8% 6% 9%
Group 7: Grade effect
P3, P4, P5, P6, JHS1 8% 37% 38% 35%
Group 8: Ethnicity
Akan, Ga, Ewe, Dangme, Guan, Likpakpa, Other
6% 9% 11% 8%
Group 9:District effect
7 districts: Adenta, Kadjebi, Ningo Prampram, Nkwanta South, Shai Osudoku
30% 26% 26% 27%
R-Square 0.056 0.465 0.346 0.466
Figure 8: Decomposition analysis of key outcomes
18%
2%
3%
2%
6%
3%
3%
3%
6%
4%
6%
4%
5%
4%
3%
4%
5%
7%
6%
8%
17%
8%
6%
9%
8%
37%
38%
35%
6%
9%
11%
8%
30%
26%
26%
27%
Transition (%)
Aggregate learning
Numeracy
Literacy
Group 1: Barriers Group2: Marginalisation Group 3: Teaching method
Group 4: Support at home Group 5: Girls' non-cognitive aspect Group 6: School Management
Group 7: Grade effect Group 8: Ethnicity Group 9:District effect

GEC-T Baseline Report – Making Ghanaian Girls Great Project 112
GEC-T Baseline Report – Making Ghanaian Girls Great Project 113
The project’s Theory of Change (ToC) operates on the assumption that transition to secondary school is the key to marginalised girls furthering their education and subsequently living healthy, fulfilled lives with the ability to sustain themselves materially and socially. Motivation to change occurs in the presence of opportunity to change such as supportive teaching staff, supportive community, and supportive family members. These actors play a catalytic role for the marginalised girls with respect to capacity to change (in particular, in the form of attentiveness and improved non-cognitive skills). Social norms and economic constraints often hinder change and lead to inferior outcomes in the form of low level of achievements in learning outcomes, dropping out, or increased absence from school. To ensure that this transition occurs and is sustained, key actors involved in the educational journey of a girl need to gain the capacity, opportunity, and motivation to support this process.
The regression and distributional analysis from baseline data validates the MGCubed theory of change with respect to learning scores and transition. For example, evidence from regression analysis shows that barriers to education for marginalised girls do have a direct and significant adverse effects on learning outcomes. Among the demand side barriers, for example, households’ financial and socio-cultural norms affect these educational outcomes. Alternatively, from the supply side, the lack of gender equitable treatment or a friendly and safe environment in school discourages girls. Further, the regression analysis suggests that most of the chosen barriers, identified by both VF and the ET in its data collection, have adverse effects on the learning outcomes of literacy and numeracy scores. From the supply side, these include a feeling of differential treatment of girls and boys by teachers and low level of support to continue to study.
From the demand side, the regression analysis validates that most of the financial barriers, referred to as poverty indicators, affect learning outcomes adversely. Among all factors inhibiting learning, attendance, and transition, poverty is by far the most persistent and pervasive barrier as indicated by FGD and KII respondents in qualitative events. A large proportion of FGD respondents indicated poverty as a major barrier to a girl’s ability to attend school and focus in school, often preventing successful transition. Poverty not only causes inferior learning outcomes, it also lowers a girl’s morale and ultimately leads to dropping out. A large proportion of respondents in FGDs indicated that teenage pregnancy is one of the main reasons that girls drop out of school. Troublingly, several respondents indicated that impoverished girls whose parents cannot provide for them often seek out help from men. This relationship often leads to pregnancy and dropping out of school. Evidence from regression analysis validates this claim, showing that mothers under 18 perform worse than their counterparts, controlling for all other important factors.
To address social norms and its effects on girls’ overall development, the theory of change underscores a complex interplay of self-perpetuating socio-cultural norms and beliefs shaping both the household and school environment. From the demand side, when girls lack protection from physical and emotional threats, they fail to engage fully in their studies and subsequently their futures due to low self-esteem, poor self-belief, and low self-efficacy. The evidence from regression results validates this assumption and shows that a girls’ level of self-esteem, self-efficacy, and agency are strongly related to their learning achievements. Findings also suggest that when schools provide a supportive and gender-sensitive environment, girls do significantly better. For example, when girls can move around school easily, have access to better infrastructure such as computers for study, or are allowed to play with boys at school,
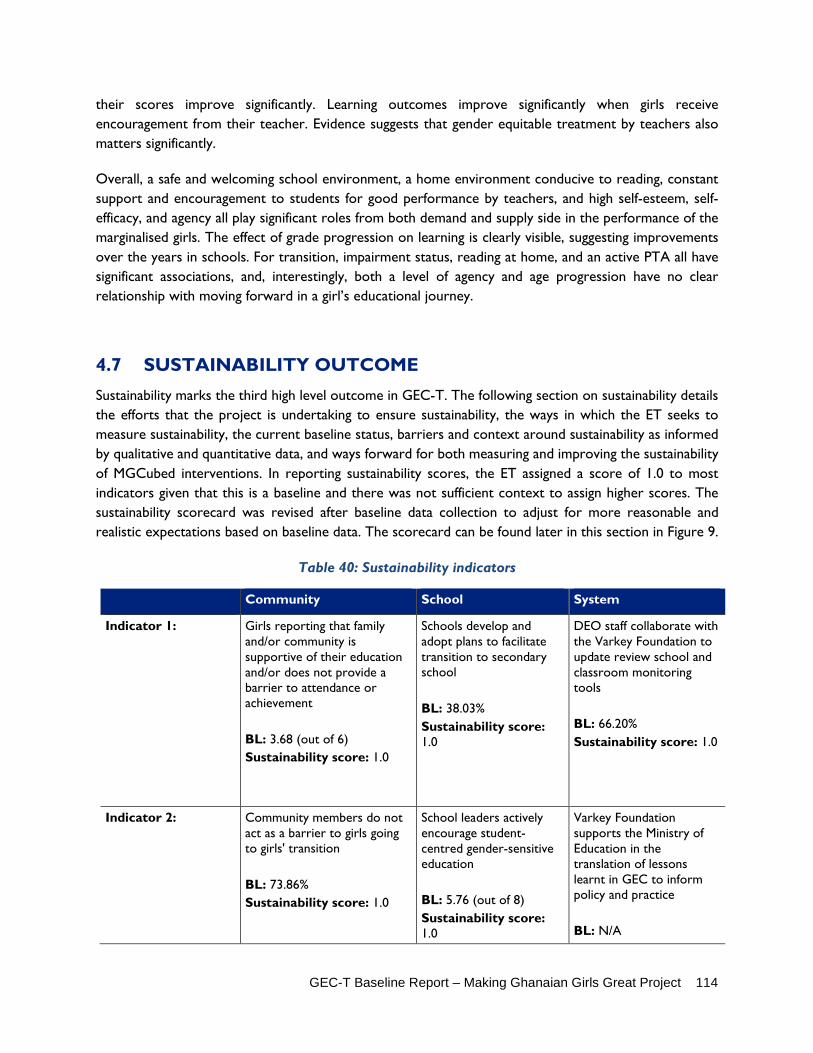
GEC-T Baseline Report – Making Ghanaian Girls Great Project 114
their scores improve significantly. Learning outcomes improve significantly when girls receive encouragement from their teacher. Evidence suggests that gender equitable treatment by teachers also matters significantly.
Overall, a safe and welcoming school environment, a home environment conducive to reading, constant support and encouragement to students for good performance by teachers, and high self-esteem, self-efficacy, and agency all play significant roles from both demand and supply side in the performance of the marginalised girls. The effect of grade progression on learning is clearly visible, suggesting improvements over the years in schools. For transition, impairment status, reading at home, and an active PTA all have significant associations, and, interestingly, both a level of agency and age progression have no clear relationship with moving forward in a girl’s educational journey.
4.7 SUSTAINABILITY OUTCOME Sustainability marks the third high level outcome in GEC-T. The following section on sustainability details the efforts that the project is undertaking to ensure sustainability, the ways in which the ET seeks to measure sustainability, the current baseline status, barriers and context around sustainability as informed by qualitative and quantitative data, and ways forward for both measuring and improving the sustainability of MGCubed interventions. In reporting sustainability scores, the ET assigned a score of 1.0 to most indicators given that this is a baseline and there was not sufficient context to assign higher scores. The sustainability scorecard was revised after baseline data collection to adjust for more reasonable and realistic expectations based on baseline data. The scorecard can be found later in this section in Figure 9.
Table 40: Sustainability indicators
Community School System
Indicator 1: Girls reporting that family and/or community is supportive of their education and/or does not provide a barrier to attendance or achievement BL: 3.68 (out of 6) Sustainability score: 1.0
Schools develop and adopt plans to facilitate transition to secondary school BL: 38.03% Sustainability score: 1.0
DEO staff collaborate with the Varkey Foundation to update review school and classroom monitoring tools BL: 66.20% Sustainability score: 1.0
Indicator 2: Community members do not act as a barrier to girls going to girls' transition BL: 73.86% Sustainability score: 1.0
School leaders actively encourage student-centred gender-sensitive education BL: 5.76 (out of 8) Sustainability score: 1.0
Varkey Foundation supports the Ministry of Education in the translation of lessons learnt in GEC to inform policy and practice BL: N/A

GEC-T Baseline Report – Making Ghanaian Girls Great Project 115
Sustainability score: N/A
Indicator 3: Government officials formally recognise the GEC project and its contribution to promoting girls' education in Ghana BL: 57.57% Sustainability score: 1.0
Baseline Sustainability Score (0-4) 1.0 1.0 1.0
Overall Sustainability Score (0-4, average of the three level scores)
1.0
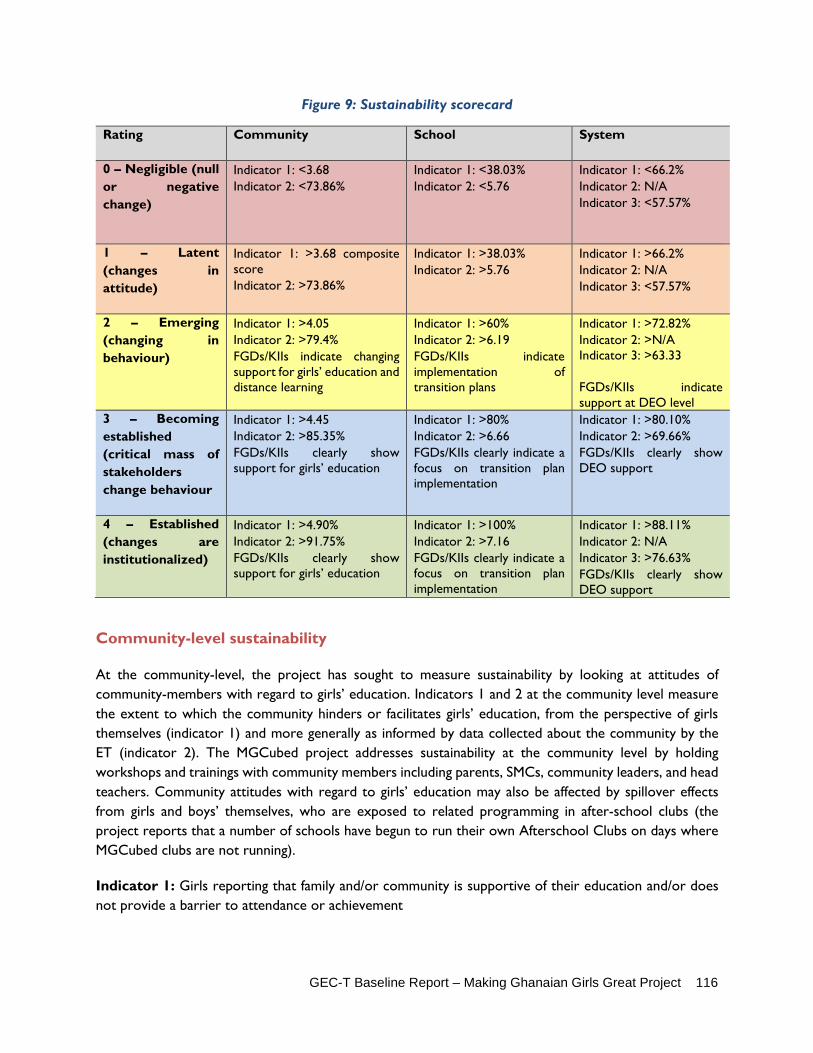
GEC-T Baseline Report – Making Ghanaian Girls Great Project 116
Figure 9: Sustainability scorecard
Rating Community School System
0 – Negligible (null or negative change)
Indicator 1: <3.68 Indicator 2: <73.86%
Indicator 1: <38.03% Indicator 2: <5.76
Indicator 1: <66.2% Indicator 2: N/A Indicator 3: <57.57%
1 – Latent (changes in attitude)
Indicator 1: >3.68 composite score
Indicator 2: >73.86%
Indicator 1: >38.03% Indicator 2: >5.76
Indicator 1: >66.2% Indicator 2: N/A Indicator 3: <57.57%
2 – Emerging (changing in behaviour)
Indicator 1: >4.05 Indicator 2: >79.4% FGDs/KIIs indicate changing
support for girls’ education and distance learning
Indicator 1: >60% Indicator 2: >6.19 FGDs/KIIs indicate
implementation of transition plans
Indicator 1: >72.82% Indicator 2: >N/A
Indicator 3: >63.33
FGDs/KIIs indicate support at DEO level
3 – Becoming established (critical mass of stakeholders change behaviour
Indicator 1: >4.45 Indicator 2: >85.35% FGDs/KIIs clearly show
support for girls’ education
Indicator 1: >80% Indicator 2: >6.66 FGDs/KIIs clearly indicate a
focus on transition plan implementation
Indicator 1: >80.10% Indicator 2: >69.66% FGDs/KIIs clearly show
DEO support
4 – Established (changes are institutionalized)
Indicator 1: >4.90% Indicator 2: >91.75% FGDs/KIIs clearly show
support for girls’ education
Indicator 1: >100% Indicator 2: >7.16 FGDs/KIIs clearly indicate a
focus on transition plan implementation
Indicator 1: >88.11% Indicator 2: N/A Indicator 3: >76.63% FGDs/KIIs clearly show
DEO support Community-level sustainability
At the community-level, the project has sought to measure sustainability by looking at attitudes of community-members with regard to girls’ education. Indicators 1 and 2 at the community level measure the extent to which the community hinders or facilitates girls’ education, from the perspective of girls themselves (indicator 1) and more generally as informed by data collected about the community by the ET (indicator 2). The MGCubed project addresses sustainability at the community level by holding workshops and trainings with community members including parents, SMCs, community leaders, and head teachers. Community attitudes with regard to girls’ education may also be affected by spillover effects from girls and boys’ themselves, who are exposed to related programming in after-school clubs (the project reports that a number of schools have begun to run their own Afterschool Clubs on days where MGCubed clubs are not running).
Indicator 1: Girls reporting that family and/or community is supportive of their education and/or does not provide a barrier to attendance or achievement

GEC-T Baseline Report – Making Ghanaian Girls Great Project 117
For indicator 1, the ET proposes to use questions from the Girl’s Survey, particularly ones that ask a girl to describe her level of agency in education-related matters. Indicator 1 utlilisess two questions from the agency composite index created and displayed in the Life Skills section of Intermediate outcomes (Section 5 of this report). The questions ask a girl who decides “whether or not you will go to school” and “whether or not you will continue in school past this year.” Answer choices include the girl herself (a value of 3), jointly between the girl and her family (2), and the family alone decides (a value of 1). The ET hypothesizes that if a girl’s agency is increased around her scholastic future, this bodes well for community-level sustainability of educational gains. Increased agency shows, in a way, that a family supports a girl’s right to decide about her education and that the family has increasingly less sway in acting as a barrier. The range of total scores went from 1-6; on average at baseline, MGCubed girls scored a 3.68. Given that this is a baseline measure with little context, we assign it a Sustainability score of 1.0 (Latent changes in attitude). We estimate a target at midline and endline of an increase by 10 percent at each data collection phase, which corresponds with an increase in one point on the Sustainability scorecard. If the average number (score) increases above a total of 4.5 (or 75% agency on education-related matters), it will signify a 4.0 on the scorecard.
Indicator 2: Community members do not act as a barrier to girls going to girls' transition. Similarly to indicator 1, this indicator deals with community members acting as barriers to girls’ transition. The ET measured this sustainability indicator using questions from the Household survey. A caregiver was asked if, in the following situations, a girl should be kept at home or allowed to go to school. The situations presented included: “The child needs to work,” “The child needs to help at home,” “The child is married/is getting married,” “The child is too old,” “The child has physical or learning needs that the school cannot meet,” “The child is unable to learn,” “Education is too costly,” and “The child is a mother.” If a caregiver indicated in any of these cases that a child should stay home from school, this signified a barrier to transition. In analysis of baseline data, the ET found that 26.14% of caregivers chose at least one of the above answers. The indicator score at baseline was thus the inverse, or 73.86%, for a sustainability score of 1.0. Given the relatively high proportion of 73.86%, the ET set targets of increases of 7.5% over midline and endline, corresponding to 1 point increases in the Sustainability Scorecard. If at any time the score exceeded 85.35%, it would reach a 4.0 score.
At the community level, most teachers feel that educational gains will be sustained after the MGCubed program ends. Teachers also provided insights into the girls’ ability to succeed following the completion of the GEC-T project. Out of the fifteen teachers interviewed, thirteen teachers noted that girls will continue to attend school following the completion of the project. Specifically, six noted that as long as the community lends its support, government provides financial assistance, and role models such as nurses, police and teachers continue to exist, girls will attend school and even excel. Four others mentioned that frequent guidance and counselling are other factors which will encourage girls to attend school. In addition to these type of assistance, one teacher seemed to believe that churches and other NGOs assistance in improving poor school infrastructure will provide a significant impact. Two reported that the GEC-T project laid a very sturdy foundation for the schools and community to build on and was very optimistic about girls attendance in school. Only two believed that girls’ attendance would decrease without the support of the Varkey Foundation. They mentioned that even with the MGCubed classes, the

GEC-T Baseline Report – Making Ghanaian Girls Great Project 118
technological equipment, and training, the schools and community would be incapable of motivating girls to come to school and many girls would drop out after the program ends.
School-level sustainability
At the school-level, VF has chosen to measure sustainability by looking at the existence of transition plans as well as student-centered, gender-sensitive education. To address sustainability at the school level, the MGCubed project works with Head Teachers to discuss the importance of girls’ education and girls’ transition with the hope that school-level actors subsequently develop plans, systems, and processes to help facilitate the transition of girls in their educational journey. An important piece of this work is the inclusion of other community-level actors alongside the Head Teacher, such as parents, PTA, and SMC members, to ensure that the work receives important and diverse input and is sustainable. The ET recommends the addition of a third indicator focused on the sustainability of the MGCubed technology itself, the description of which can be found below.
Indicator 1: Schools develop and adopt plans to facilitate transition to secondary school.
This indicator is measured by looking at the proportion of schools that have a plan in place to facilitate girls’ transition. A question is asked directly to the school director on the School Survey about the existence of such plans, as well as follow-up questions on what the plan itself looks like, why or why not the school does not have a plan, if they expect to have one in the future, who helps develop the plan, and who executed the plan. The question about the existence of a plan was asked only to MGCubed schools and yielded a rate of 38.03% of schools at baseline. Having a plan for transition at school is only one piece of sustainability, however. Ensuring that relevant parties are involved in the development and execution of the plan, and that the plan had adequate resources to be executed in the future will further bolster the school-level sustainability with regard to transition. To that extent, the ET looked at the proportion of different actors’ involvement in development and execution of the plan, as well as who will support it in the future. The questions involved in scoring this indicator come from the School Survey and are the following: Do you have a plan for transition at this school? Will the school be able to support this plan in the future? Why will you be unable to support the plan? Who will continue to support this plan in the future?
The Sustainability score at baseline is a 1.0; at midline and endline the ET will examine changes not only in the proportion of schools with a plan, but also who develops, executes, and supports the plans. Increases in Sustainability score will correspond to increases in schools with plans, as well as increases in community members’ (parents and PTA/SMC) involvement in a plan’s development, execution, and future support. The ET believes it is feasible and expected that all MGCubed schools have a plan for transition. To that extent, midline and endline targets are ambitious for this indicator. A measure of 60% will score a 2.0 on the sustainability scorecard, 75% will score a 3.0, and 100% will score a 4.0. To receive an increase in the sustainability score at midline or endline, the project must cross these thresholds and also have any

GEC-T Baseline Report – Making Ghanaian Girls Great Project 119
increase (over the previous data collection phase) in the proportion of PTA/SMC or parents that are involved in developing, executing, and supporting the plan.
Figure 10: Transition school plan ownership
To investigate this further, the ET asked head teachers about the exact nature of their transition plans. Eight of 27 school head teachers answered that it was some form of counselling or education to a girl on transition, four cited direct material support, four indicated after-school girls’ clubs, three said it was the occasional visit of a Girl Education Officer or other role model, and two cited the MGCubed program itself. VF’s own triangulation methods reported that no school had yet documented any plans to facilitate girls’ transition to secondary school. In articulating their school improvement priorities (a proxy for whether girls’ transition is high on the agenda) internal monitoring by VF through head teacher interviews showed that only two school leaders had expressed an explicit concern with regard to girls (to “make the girls in the community go higher” and “to help the girls set up and move up and in education”). Considering these findings, the ET will delve more deeply into the idea of “transition plans” at midline, ensuring that VF and school head teachers have a clearer picture on what constitutes a transition plan.
Indicator 2: School leaders actively encourage student-centred gender-sensitive education.
To answer this indicator, originally the ET planned to utlilise a question in the School Survey which asked a head teacher whether the school practiced student-centred gender-sensitive education. At baseline,
69%
40%
17%
7%
17%
2%
17%
81%
38%
12%
12%
10%
0%
12%
85%
65%
18%
26%
9%
3%
18%
School headmaster/director
PTA/School management committee members
Parents (non-PTA/school management committeemembers)
Community leaders (civil, religious, etc.)
NGO/Community-based organization
Private sector
Local government (DEO)
Who will support plan in thefuture?
Who executes the plan tofacilitate transition?
Who developed the plan tofacilitate transition?

GEC-T Baseline Report – Making Ghanaian Girls Great Project 120
94.37% of MGCubed school directors responded affirmatively. However, if head teachers cannot define how they put the concepts into practice, this proportion does not hold as much weight. Further, this indicator is wholly measured by one answer from a head teacher, with little to no explanation or investigation into if the Head Teacher understands the concept or not. A school leader may encourage the teaching, but if teachers themselves are not implementing it on a regular basis, sustainability is threatened. If the indicator looks at classroom level implementation of student-centered gender-sensitive education, it may indicate a more lasting change. In light of these assumptions, the ET proposed a different way to measure the indicator as well as a slight change to the indicator itself. At baseline, the ET used the teaching quality index displayed in the IO section on Teacher Quality to answer this indicator. In particular, the ET will use the four questions on gender equity and report the average index value. The four questions are:
GIRLS have equal access to desks, learning materials, etc. (e.g. girls share the same amount of books, desks as boys).
Does the teacher call on BOY students more than GIRL students? Does the teacher use a harsh tone with BOYS more than GIRLS? Observer: In your opinion, did the teacher try to include girls and boys equally?
The four questions yielded a maximum possible score of 8, from which at baseline an average score of 5.76 was noted in MGCubed schools. Given this relatively high value at baseline, sustainability scorecard increases of one point in future data collection rounds will be achieved with every 7.5 percent increase from the baseline score.
In its own internal monitoring, the Varkey Foundation found that some school leaders were already supporting gender-sensitive school environments, evidenced by the large proportion of schools where concrete measures are in place to support girls. For example:
• In only two schools pregnant girls were found to be penalised either by being asked to pay a fine or by being asked to leave the school. In 60 cases the school leader articulated an explicitly positive attitude towards welcoming pregnant girls to school until they gave birth.
• In 58% of schools, there was a plan to enforce the Girls Re-Entry Policy introduced by the GES to ensure that girls who have given birth return to school. Details on these plans were quite vague, however.
• In 74% of schools, there is an identified Girls’ Focal Point whose role it is to coordinate all gender-focused interventions and to act as a gender champion within the school.
However, internal monitoring using Playground Observations in each of the 72 MGCubed schools found that girls and boys playing together in only 7% of schools. Despite this, school environments appear to be free from threats and intimidation and girls and boys share good relations. As Output Indicator 3.3 found, at the classroom level: “In 50% of the Mixed Club observations (16), girls led discussions, and in all observations, boys were found to listen to girls. In 68.7% of observations, boys and girls were sitting together. This was much higher than expected. There were no cases of intimidation against girls recorded. This was much lower than expected.”

GEC-T Baseline Report – Making Ghanaian Girls Great Project 121
In 6 of the 19 observations of afterschool clubs where boys were present, VF District Coordinators noted references to women and girls. In some cases, this was positive (“whatever men can do, women can do it better”), while in others boys were noticing inequalities (“'girls are always burdened at home”). In two examples, there was evidence that this is changing (“some of the pupils have their breadwinners of the family as their mothers”), but that traditional stereotypes remain (“we’re are given equal opportunities at home to choose what we can do except cooking which is set aside for girls”). Boys also used generic statements about women and girls (“sometimes our girls are lazy”), and associated women with domestic beating when they have done something wrong at home.
More widely, school leaders showed a huge commitment to ensuring their staff were orienting themselves to the training they receive and in monitoring their professional progress in implementing student-centred gender-sensitive education in the classroom. This was not reflected in reports by teachers however, with only 6 of 17 reporting that they had been observed by and received feedback from the school leader or another teacher during the term.
Additional school-level sustainability indicators around technology: While VF has proposed two indicators for the school-level sustainability outcome, the ET strongly recommends the addition of a third indicator focused on technology. Given the nature of the MGCubed intervention – the use of a projector, modem, computer, and solar charger – questions around the upkeep, maintenance, and security of these components are critical when examining the sustainability of the system. For instance, at the time of baseline data collection, one MGCubed school’s technology had been stolen and was not functioning. While this did not affect baseline data collection, the inability to replace stolen or non-functional technology will inevitably bias results. Adding a third indicator at midline and endline would capture the situation around the sustainability of the technology itself. Adding an indicator around the sustainability of technology would be rather simple, given that questions to answer it are already in existing survey instruments and can be found in the points below. An indicator that captures the sustainability could include some combination of the following questions included in the School Survey: Do you receive training to operate the technology for the distance learning? Who pays for the upkeep of the technology? Who is responsible for fixing the technology if it breaks? Who manages the technology? Will you be able to manage the technology in the future? Why will you be unable to manage the technology? Who will manage the technology in the future?
With this in mind, at baseline, the ET analysed several of the above questions related to technology and displays their data in the School Management IO section. Below is a summary of the quantitative and qualitative findings with regard to sustainability of the technology.
School directors cite themselves as the major caretakers of the technology now and in the future. Findings from that analysis show that at baseline, nearly 80% of school directors said that the Varkey Foundation pays for the technology and fixes the technology. Seventy percent of head teachers said it is they who currently manage the technology, 16% said it was the PTA/SMC, and 10% said it was parents. When asked who will manage the technology in the future, 77% of head teachers said they would

GEC-T Baseline Report – Making Ghanaian Girls Great Project 122
manage it, 46% said the PTA/SMC, 23% said the community, and 14% mentioned that parents would manage the technology. Seven and 13% of directors said that VF currently manages the technology and will manage it in the future, respectively.
Qualitatively, teachers report technical difficulties with the technology. Seventy-nine percent of Head Teachers indicated having problems with at least one piece of technology and 28% indicated that at least one piece of the technology “did not work often” or “did not work every time it was used.” All fifteen teachers interviewed in qualitative events said that they experienced technical difficulties with the network and equipment. Four specifically mentioned that class time is often wasted to fix problems with the equipment or network. Further, some data collection enumerators, while conducting classroom observations, noted that the lessons were oftentimes hard to see due to bright conditions in the classrooms and the inability to block out light. They reported that students oftentimes had to crowd around a teacher’s laptop to see what was happening because the projector was not viewable. Figure 11 and Figure 12 show critical results on sustainability of technology. Just under three quarters (72.2%) of Head Teachers that were surveyed in the School Survey report that there were no problems or that the technology works most of the time. Among Head Teachers reporting at least one piece of equipment did not function most or all of the time (27.8%), 19% cited the solar charger, 17% cited the projector, 12% cited the satellite modem, and 7% cited the computer (Figure 11). The average response time to fix a broken piece of equipment was 6.7 days, with a median of 3 days.
Figure 11: Technology functionality (%)
127
27
38
55 2 0
27
61
56 6 6
34
43
510 7
1
31
44
5
It does not workevery time we use it
It does not workoften
It works about halfthe time
It works nearly allthe time
There are noproblems
NA
Solar charger Computer Satellite modem Projector
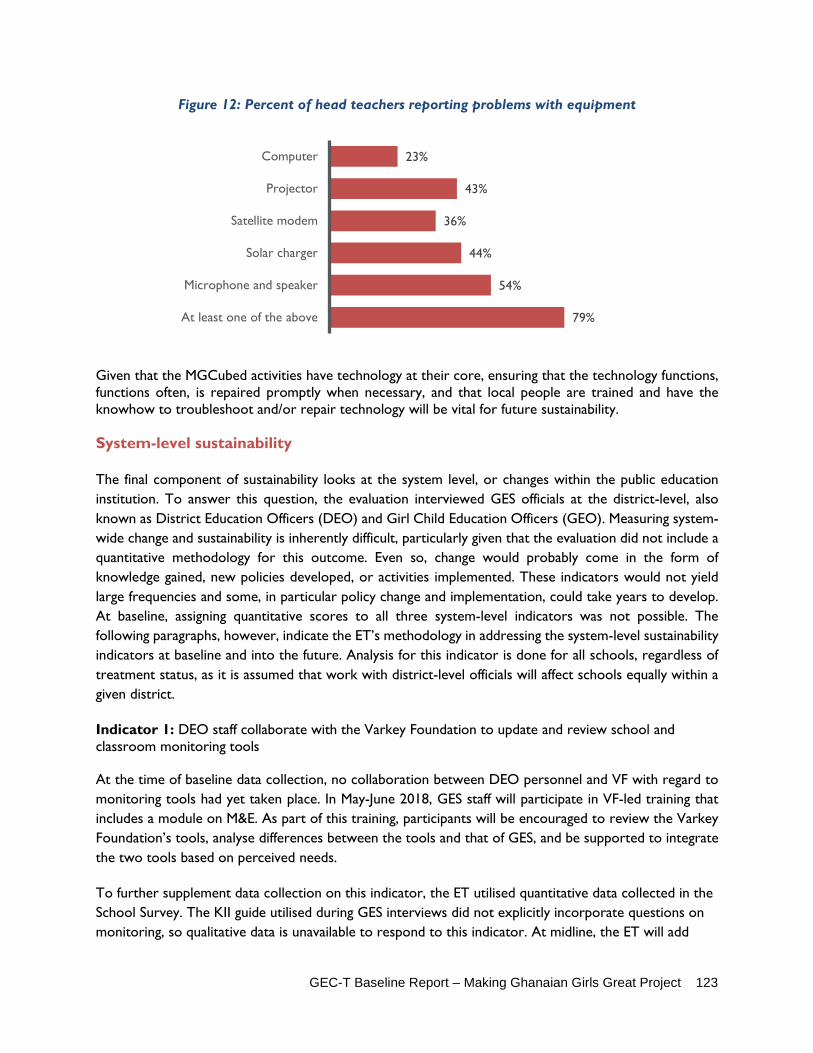
GEC-T Baseline Report – Making Ghanaian Girls Great Project 123
Figure 12: Percent of head teachers reporting problems with equipment
Given that the MGCubed activities have technology at their core, ensuring that the technology functions, functions often, is repaired promptly when necessary, and that local people are trained and have the knowhow to troubleshoot and/or repair technology will be vital for future sustainability.
System-level sustainability
The final component of sustainability looks at the system level, or changes within the public education institution. To answer this question, the evaluation interviewed GES officials at the district-level, also known as District Education Officers (DEO) and Girl Child Education Officers (GEO). Measuring system-wide change and sustainability is inherently difficult, particularly given that the evaluation did not include a quantitative methodology for this outcome. Even so, change would probably come in the form of knowledge gained, new policies developed, or activities implemented. These indicators would not yield large frequencies and some, in particular policy change and implementation, could take years to develop. At baseline, assigning quantitative scores to all three system-level indicators was not possible. The following paragraphs, however, indicate the ET’s methodology in addressing the system-level sustainability indicators at baseline and into the future. Analysis for this indicator is done for all schools, regardless of treatment status, as it is assumed that work with district-level officials will affect schools equally within a given district.
Indicator 1: DEO staff collaborate with the Varkey Foundation to update and review school and classroom monitoring tools
At the time of baseline data collection, no collaboration between DEO personnel and VF with regard to monitoring tools had yet taken place. In May-June 2018, GES staff will participate in VF-led training that includes a module on M&E. As part of this training, participants will be encouraged to review the Varkey Foundation’s tools, analyse differences between the tools and that of GES, and be supported to integrate the two tools based on perceived needs.
To further supplement data collection on this indicator, the ET utilised quantitative data collected in the School Survey. The KII guide utilised during GES interviews did not explicitly incorporate questions on monitoring, so qualitative data is unavailable to respond to this indicator. At midline, the ET will add
79%
54%
44%
36%
43%
23%
At least one of the above
Microphone and speaker
Solar charger
Satellite modem
Projector
Computer

GEC-T Baseline Report – Making Ghanaian Girls Great Project 124
questions to KII guides in order to acquire qualitative data to better triangulate quantitative data for this indicator. Within the School Survey, Head Teachers were asked several questions about monitoring visits. These included:
Has a member of the District Education Office come to the school in the past year to monitor facilities, teaching quality, or teacher attendance?
What did they monitor? How many times has a District Circuit Supervisor visited in the last year? Has there been an increase in monitoring visits from the year before? After the MOE/GES officials leave, do you receive any feedback or reports about these
monitoring visits? What did you receive?
One hundred percent of all schools responded that they had received a visit, with an average of 8.4 visits per year (8.8 for treatment and 7.9 for control). If inspectors are supposed to visit schools monthly, as dictated by GES policy, these numbers appear to be a good sign. It is encouraging that monitoring visits happen at schools and happen at a regular frequency, however, if a school is not made aware of its weaknesses or successes, it cannot improve. To that end, the ET looked at the extent to which schools received feedback from GES officials after a visit. Among all schools, 66.2% received some type of feedback after a visit. This rate is used for Indicator 1 and was assigned a sustainability score of 1.0 at baseline. Ten percent increases over midline and endline will earn 1-point increases, respectively, in the sustainability score. If at any point the proportion clears the 80% threshold, it will score a 4.0. It is important to note that the use of the question on feedback received does not directly answer the indicator as currently worded. The ET strongly recommends that this indicator is changed to facilitate more accurate measurement and actual sustainability. Simply reviewing and updating tools is only one piece; carrying out frequent and effective monitoring visits and subsequently communicating findings of those visits to schools will go a long way to ensuring sustainability. If this indicator were to stay as is, it would have a binary measurement of not completed or completed, garnering a sustainability score of either 0 or 4 in the Scorecard, respectively.
When it comes to implementation of practices such as monitoring, qualitatively, 3 out of the 7 GES representative interviewed by the ET mentioned that the training they received has helped improve their abilities to collect information regarding schools’ performance. Two more indicated that they have utilised their leadership training to improve their relations with their colleagues and teachers. Out of these two GES representatives, one specifically mentioned that during monitoring visits, he no longer engaged in shouting matches with the teachers as a result of leadership training he had received. Another one said that her leadership training has shown her how to involve her colleagues in making decisions.
Conversely, of the 8 focus group discussions the Varkey Foundation had so far undertaken as part of its government engagement and general monitoring, there was a clear appetite from all offices to better formalise and streamline the approach of Circuit Supervisors to observing and supporting school staff within schools in the district. All DEOs were engaged in monitoring teachers, including during MGCubed lessons. However, DEO staff were not forthcoming in identifying particular areas in which they struggle when it comes to their monitoring activities. Key challenges were cited – including a lack of means of transportation and inadequate desk space to undertake report writing – though no reference to capacity

GEC-T Baseline Report – Making Ghanaian Girls Great Project 125
to plan and carry out data collection activities or use data was made. This indicates that a critical appreciation of where capacity may be lacking is not a prominent area of discussion or reflection at the DEO level.
Indicator 2: Varkey Foundation supports the Ministry of Education in the translation of lessons learnt in GEC to inform policy and practice.
The Varkey Foundation reported that it has not yet engaged the Ministry of Education in discussions regarding lessons learned from GECT, however a number of evidence translation activities are planned for Year 2 of the project (prior to the midline), based on internal learnings from monitoring data. This includes:
• Using GEC-T data to inform the design of the national School Leaders programme, in partnership with the Ministry of Education,
• Sharing GEC-T data on adult learner and young learner attendance and achievement with district level GES officials
• Sharing GEC-T monitoring data on key challenges and issues in schools with district level GES officials to ensure the project is informing local level planning and prioritisation
As currently worded, indicator 2 is extremely difficult to measure. The development and practical application of policies will not only be infrequent, it may not happen within the lifetime of the project. The ET proposes transforming the indicator to be more specific, measurable, and attainable within a realistic time frame. Potential changes to the indicator that take into account the goals of MGCubed activities on a system-level (promotion of gender-centered practice, investment in ICT, teacher training) could include: Percentage of GEC officials collecting data on gender-centered indicators during monitoring
visits Percentage of schools that have received budget from GES to maintain and/or invest in ICT
infrastructure Percentage of Girl Child Education Officers who can demonstrate knowledge gained in gender-
centered pedagogical approaches
Due to the ambiguous nature of this indicator, it received an N/A score at baseline. In discussions with VF, both VF and the ET were in agreement on altering this indicator before midline data collection. Output 5.2 in Annex 3 refers specifically to VF-led activities that address this indicator.
Across the board, GES officials were able to cite MGCubed training learnings and elucidate how they put these learnings into practice. Though the ET was unable to measure this indicator quantitatively at baseline, there was a wealth of qualitative data to triangulate changes in policy and practical implementation from a system-level. All seven GES representative interviewed mentioned they implement their professional development goals centered around child protection policies and gender equality, particularly by working closely with teachers and the communities within their districts. Two GES representative said they coordinate with school directors to ensure that their faculty is gender balanced and ensure that more female teachers are employed in far distant communities. Two GES representative said that Circuit supervisors and Girl Education Officers coordinate to create activities geared towards girl education an encouraging girl to stay in school. Additionally, three more said that

GEC-T Baseline Report – Making Ghanaian Girls Great Project 126
they work with teachers to encourage girls to attend school, organise after school activities for girls and more PTA meetings to educate parents about the importance of girls’ education.
All 7 GES officials interviewed said that they have received child protection training. All GES representatives indicated that they utilised their child protection training to assist the children in the district they oversee. Three GES interviewed mentioned that they worked closely with teachers to report cases of child abuse and worked with schools to reduce the use of corporal punishment such as caning and substitute it for other methods of punishment such as writing assignments. Another GES respondent mentioned that washrooms have been made available to encourage girls to come to school during menstrual cycle. Another GES representative indicated that policies which provide protection from child abuse, including verbal abuse, sexual abuse and physical abuse or “anything that endangers the life of a child”, have been enforced in their district. One respondent specifically mentioned that he had been able to rescue a child from abuse and mentioned a new protection policy which includes assisting parents in providing for their children's basic school needs such as school uniforms. Another one indicated that GES officials encourage teachers to create mixed gendered seating arrangements and put a focus on gender for all subjects, especially those typically geared for boys like math.
One GES official mentioned that GES officials organised STEM programs for girls in various schools which focused on subjects such as mathematics, science, ICT, and other technical subjects. One GES representative from Ada West mentioned that the GES provided a scholarship which encourages girls to engage in STEM subjects. Another one mentioned that teachers are becoming more computer literate, and that the government is working on policies to provide more laptops and other materials for teachers. Only one GES indicated that he was not aware of any policy geared towards ICT education. Three mentioned that the government is working on new policies regarding improving girls’ education, and guidelines for re-enrolling girls who have dropped out.
Indicator 3: Government officials formally recognise the GEC project and its contribution to promoting girls' education in Ghana.
As with Indicator 2, this indicator is poorly worded to accurately measure. To be able to measure it quantitatively, the ET interpreted the indicator as one that measures support for MGCubed and the desire and ability to take up the activities of MGCubed once the program ends. With this in mind, two questions were used from the School Survey to arrive at a quantitative measurement:
What do district level education officials think of the distance-learning technology? What have district level education officials (DEO) said about continuing support for the
distance-learning technology?
Head Teachers in MGCubed schools were asked generally about what district-level education officials thought of the program and if they had ever expressed anything about future support for the program. Answer options for the first question ranged from “They have said very positive things” to “They have said very negative things” to “They have said nothing at all.” For the second question, Head Teachers could respond with “They said they wanted to extend support,” “They have said they do not want to extend support,” “They are not sure,” or “They have not said anything.” The measurement for this indicator was calculating by averaging the percentage of respondents who had chosen the best possible

GEC-T Baseline Report – Making Ghanaian Girls Great Project 127
answer for both questions: “They have said very positive things” and “They said they wanted to extend support.” At baseline, this amounted to 68.18% and 46.97%, respectively, for an average measurement of 57.57%. This achieved a 1.0 sustainability score. In future data collection rounds, one-point increases in the sustainability score will be associated with every 10 percent increase in average measurement.
Most GES officials have strong positive opinions of MGCubed. Qualitatively, six GES official mentioned that the MGCubed program is a good program because it provides teacher training, and has improved school leadership abilities, improved their self-esteem and prepared them for the future. Out of the six, one indicated that the snacks provided during the MGCubed courses encourage the children to attend and that the program has helped the girls improve their communication skills and their performance in math and literacy courses. Another GES official mentioned that the program provides the distant village communities access to the same resources as those in the cities. Three believed that it provides good life skills trainings and provides good role models for the girls, and Varkey Foundation provides teaching that is not included in the typical GES syllabus. Another one believed that the program was very helpful and believed that all students should benefit from the program. Only one mentioned that the program was not useful because parents still believe that girls can be married, have children, and attend school.
GES officials have mixed feelings on the sustainability of educational policy and programmatic gains after MGCubed terminates. Six mentioned that GES will not be able to financial sustain the continuation of the project after the program. Out of the six, one said that school enrollment will decline, and the children who are performing poorly will eventually drop out. Two others believes that GES will continue to promote gender equality, organise more school supervision and educate parents about the importance of education, but doubts that GES will have enough funds to provide some of the resources that Varkey Foundation is currently providing. Two specifically mentioned that although they do not believe that all the content of the project will continue due to lack of funds, but they believe that the GES can build on the training that the teachers have gained such as “icebreakers” to engage student in class, and believe that the sessions should be recorded so that they could be used after the program ends. Another one mentioned that after the program ends, GES will not continue the project because some of her colleagues will not participate without some financial incentives. Only one believes that the program will be able to continue with the support of the community. He believes that the government can continue to assist in providing school uniforms and other school materials, but the communities needs to be educated about the importance of children education. Information from the Varkey Foundation on its engagement with the Ministry of Education at the national level indicates that MGCubed continues to influence the government. At the Global Education and Skills Forum (GESF) in Dubai in March 2018, the Minister of Education of Ghana announced a major partnership with the Varkey Foundation. The partnership seeks to design and implement a nationwide training programme for School Leaders, beginning with secondary level leaders. The programme is informed by the results of both the MGCubed pilot and Train for Tomorrow endline evaluations. Together these results demonstrated that:
1. Quality of instruction is a major determinant in improved learning outcomes amongst pupils, and

GEC-T Baseline Report – Making Ghanaian Girls Great Project 128
2. The Varkey Foundation’s approach to designing and delivering programs of support to transform the quality of instruction in Ghanaian schools provides a large value-add, and has a significant effect on participants.
In addition to the recognition afforded to the Varkey Foundation as part of the partnership announcement, the Government of Ghana also recognised the MGCubed project in the following ways:
• Formal request for Varkey Foundation input on a number of consultations, including T-TEL and the Girls’ Education Network.
• Senior Ministry of Education representatives attended the GEC-T launch • The Ministry of Education leadership communicated with the Varkey Foundation to provide ad
hoc, informal advice on more than ten separate occasions since the beginning of the GEC-T project.
Table 41: Changes needed for sustainability
Community School System
Change: what change should happen by the end of the implementation period
1.Community members show attitudinal change towards girls’ education , demonstrating an awareness of its importance and their support 2. Increased support for girls education is evidenced by changed behaviours, sch as encouraging girls to transition and offering from home-based support to learning
1. Teaching quality improves: teaching staff employ student-centred pedagogy 2. School leaders support teaching staff in their professional development and implement clear mechanisms to ensure pupils learn in a safe environment 3. Schools are geared towards supporting pupils to continue on their educational journeys, particularly marginalised girls 4. Schools are engaged with the technology packages and find innovative ways to use the technology to drive education quality
1.District officials play a more active role in supporting teaching quality, in line with the project’s student-centred pedagogical approach 2. District officials play a more active role in supporting school leaders to drive quality learning and transition within their schools, particularly for marginalised girls 3. District officials take an increased interest in and ownership of the project, including the use of MGCubed monitoring tools and knowledge of the technology packages
Activities: What activities are aimed at this change?
Community Training – this involved awareness raising and discourse-changing discussion and reflection Engagement with PTA/SMCs to ensure school-community
Teacher Training School Leader training
School Leader training GES leadership training

GEC-T Baseline Report – Making Ghanaian Girls Great Project 129
relations are functional and that the community is engaged in the direction of the school
Stakeholders: Who are the relevant stakeholders? Members including caregivers,
PTA, SMC, Headteachers. Pupils, Teachers, District Education Community Officials
Community Members including caregivers, PTA, SMC, Headteachers. Pupils, Teachers, District Education Officials
Community Members including caregivers, PTA, SMC, Headteachers. Pupils, Teachers, District Education Officials, Ministry of Education officials, Donors, Private sector actors (Technology, Renewables; Education providers and investors)
Factors: what factors are hindering or helping achieve changes? Think of people, systems, social norms etc.
Financial need drives caregivers to privilege income-based activity over schooling; Community members have low expectations of some girls: early marriage and pregnancy is not actively encourages in all cases yet it is expected; Low aspirations for pupils: hardship experienced by communities means there is a low level of aspiration. Community members are often unable to see a way “out” of a situation. Frustration with schools: Community members often view staff as ineffective, e.g. absenteeism and corruption. Tacit community values and norms: Girls’ education (and education in general) is not championed in the home due to a “business as usual” approach Low education levels of caregivers: Community members often lack formal education themselves. Supporting their children either in word or need is often difficult.
Low expectations: Schools have low expectations of teachers, and communities have low expectations of schools. This means that quality is not prioritized and there is a lack of accountability in the system. Lack of trained teachers: Teachers, particularly in the lower years of primary, are often untrained. Lack of trained School leaders: Headteachers receive no formal training in order to lead schools; Lack of motivation: Educators are not remunerated in a way commensurable with the level of effort required to attract talent or to put in additional effort to drive quality; Policy frameworks on girls’ education: These are often unclear or not enforced. Lack of funds: Schools are woefully under-resourced.
Low expectations: The system has low demands on schools, in practice. This means that quality is not prioritized and there is a lack of accountability in the system. Lack of funds: District level offices are chronically underfunded, and Circuit Supervisors often lack the basics required to their job (e.g. fuel, transportation); Systems and processes for ensuring quality: Officials lack standardised systems for monitoring and reporting, and also the capacity to collect analyse and use data in a meaningful way.
Community School System
Change: what change should happen by the end of
1.Community members show attitudinal change towards girls’ education , demonstrating
1. Teaching quality improves: teaching staff employ student-centred pedagogy
1.District officials play a more active role in supporting teaching quality, in line with the project’s

GEC-T Baseline Report – Making Ghanaian Girls Great Project 130
the implementation period
an awareness of its importance and their support 2. Increased support for girls education is evidenced by changed behaviours, sch as encouraging girls to transition and offering from home-based support to learning
2. School leaders support teaching staff in their professional development and implement clear mechanisms to ensure pupils learn in a safe environment 3. Schools are geared towards supporting pupils to continue on their educational journeys, particularly marginalised girls 4. Schools are engaged with the technology packages and find innovative ways to use the technology to drive education quality
student-centred pedagogical approach 2. District officials play a more active role in supporting school leaders to drive quality learning and transition within their schools, particularly for marginalised girls 3. District officials take an increased interest in and ownership of the project, including the use of MGCubed monitoring tools and knowledge of the technology packages
Activities: What activities are aimed at this change?
Community Training – this involved awareness raising and discourse-changing discussion and reflection Engagement with PTA/SMCs to ensure school-community relations are functional and that the community is engaged in the direction of the school
Teacher Training School Leader training
School Leader training GES leadership training
Stakeholders: Who are the relevant stakeholders? Members including caregivers,
PTA, SMC, Headteachers. Pupils, Teachers, District Education Community Officials
Community Members including caregivers, PTA, SMC, Headteachers. Pupils, Teachers, District Education Officials
Community Members including caregivers, PTA, SMC, Headteachers. Pupils, Teachers, District Education Officials, Ministry of Education officials, Donors, Private sector actors (Technology, Renewables; Education providers and investors)
Factors: what factors are hindering or helping achieve changes? Think of people, systems, social norms etc.
Financial need drives caregivers to privilege income-based activity over schooling; Community members have low expectations of some girls: early marriage and pregnancy is not actively encourages in all cases yet it is expected; Low aspirations for pupils: hardship experienced by communities means there is a low level of aspiration. Community members are
Low expectations: Schools have low expectations of teachers, and communities have low expectations of schools. This means that quality is not prioritized and there is a lack of accountability in the system. Lack of trained teachers: Teachers, particularly in the lower years of
Low expectations: The system has low demands on schools, in practice. This means that quality is not prioritized and there is a lack of accountability in the system. Lack of funds: District level offices are chronically underfunded, and Circuit Supervisors often lack the basics required to their job (e.g. fuel, transportation);
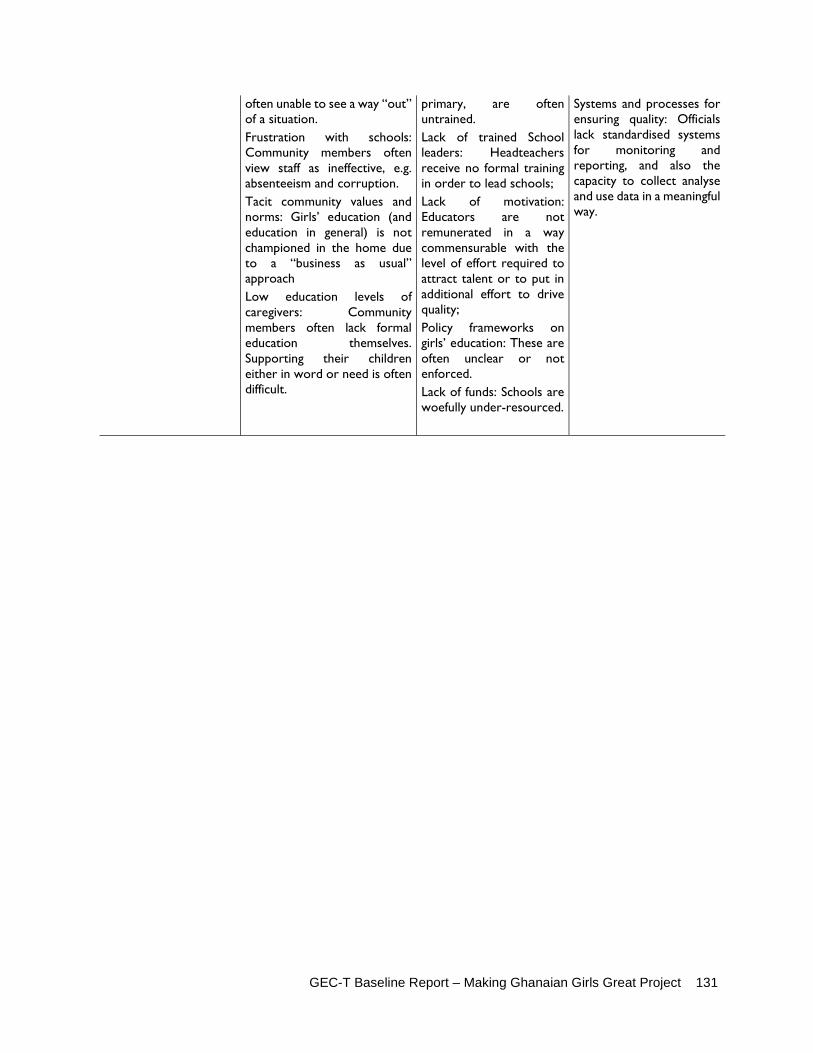
GEC-T Baseline Report – Making Ghanaian Girls Great Project 131
often unable to see a way “out” of a situation. Frustration with schools: Community members often view staff as ineffective, e.g. absenteeism and corruption. Tacit community values and norms: Girls’ education (and education in general) is not championed in the home due to a “business as usual” approach Low education levels of caregivers: Community members often lack formal education themselves. Supporting their children either in word or need is often difficult.
primary, are often untrained. Lack of trained School leaders: Headteachers receive no formal training in order to lead schools; Lack of motivation: Educators are not remunerated in a way commensurable with the level of effort required to attract talent or to put in additional effort to drive quality; Policy frameworks on girls’ education: These are often unclear or not enforced. Lack of funds: Schools are woefully under-resourced.
Systems and processes for ensuring quality: Officials lack standardised systems for monitoring and reporting, and also the capacity to collect analyse and use data in a meaningful way.

GEC-T Baseline Report – Making Ghanaian Girls Great Project 132
5. KEY INTERMEDIATE OUTCOME FINDINGS
Section 5 reports findings on intermediate outcomes (IO). While the section has eight parts (5.1-5.8), the MGCubed project only targets five IOs. The project tracks Attendance (IO1; Section 5.1 in this report), Teaching Quality (IO2; Section 5.3 in this report), Life Skills (IO3; Sections 5.7 and 5.8 in this report), School Governance (IO4; Section 5.2 in this report), and Attitudes and Perceptions (IO5; Section 5.4 in this report).
5.1 ATTENDANCE As a school-based education intervention, the MGCubed project is reliant on regular attendance of its targeted pupils in order to ensure that they are exposed to, can practice, and retain the knowledge from lessons. Girls and boys in treatment schools attend grade-level classes (P3-JHS1) as well as after-school remedial courses (Basic, Intermediate, and Advanced). Through its work in after-school lessons with students and trainings with teachers, directors of schools, parents, and other community members, VF focuses on the important of girls’ education and regular school attendance. Taking attendance in these courses helps VF and the ET better understand if attendance is improving or not, if it poses a barrier to learning, and in which grades and classes it may be most problematic. The following two indicators were developed to measure this IO:
IO1.1 Improvement in marginalised girls' attendance in schools throughout the life of the project (weighted average percentage) IO1.2. Marginalised girls report being motivated to attend school as a result of the project (including OOSG who intend to return to school)
IO 1.1: Improvement in marginalised girls' attendance in schools throughout the life of the project (weighted average percentage)
At the most basic level, the ET looked at the HH survey questions on whether or not a girl had attended school “most of the days” since the school had opened. In Table 42, results show that control and non-impaired students have higher reported attendance rates when compared to their counterparts.
Table 42: Attendance outcomes
Attendance indicator Treat Control Impaired Non-impaired
Total
Since the start of the year, girl attended school on most days the school was open
91.55% 93.17% 89.56% 92.56% 92.35%
To measure this indicator further, the ET used an attendance spot check tool. The tool was administered by an enumerator in each school in a maximum of one grade-level class per grade (P3-JHS1) for a total of 5 spot checks, plus up to two spot checks in afterschool remedial MGCubed classes per treatment school.

GEC-T Baseline Report – Making Ghanaian Girls Great Project 133
Control schools therefore received five spot checks and treatment schools received seven. In the data presented below, grade-level attendance refers to daytime classes in P3-JHS1 (regardless of being an MGCubed distance-learning class) while MGCubed attendance refers to afterschool remedial classes only. The tool looked at the extent to which: Teachers were taking attendance at all Teachers’ attendance records matched the number of students enrolled that day The number of boys in attendance compared to the number of boys enrolled The number of girls in attendance compared to the number of girls enrolled
To answer the first part of this indicator, the ET looked at how frequently over a five-day period attendance was recorded by teachers. The data was examined on a grade-level basis, and on a per-school basis. This metric measured how well attendance records were kept; in other words, it was not indicative of students’ presence in or absence from class, but only whether teachers were taking attendance. However, it is worth considering that less rigorous attendance records could mean lower disciplinary repercussions for students who do miss class. They could also be an indication of how frequently the teacher was present or absent.
Both by grade and by school, attendance was recorded between 4 and 5 of the last five days for all groups, on average. When grade levels were examined, there was virtually no difference (on average) between the intervention and the control groups. Attendance was recorded with the least frequency for the MGCubed afterschool remedial classes. With these classes factored in, attendance for the intervention group was recorded less frequently than for the control group. MGCubed remedial classes meet afterschool: lower attendance could signal that it was more difficult for students, teachers, or both to attend classes at this time rather than during the regular school day.
Table 43: Recorded attendance by grade
Average number of days attendance taken, over the last 5 days
(N in parentheses)
Intervention (Baseline) Control (Baseline) Total
(Baseline)
Grade P3 4.88 (72) 4.82 (74) 4.85
Grade P4 4.85 (71) 4.75 (74) 4.77
Grade P5 4.86 (71) 4.68* (73) 4.59
Grade P6 4.87 (72) 4.71 (73) 4.71
Grade JHS1 4.77 (64) 4.68 (66) 4.65
Weighted Average: Grade levels 4.76 (350) 4.77 (360) 4.77 (710)
MGCubed Basic Class 4.16* (59) - -
MGCubed Intermediate Class 3.96 (50) - -
MGCubed Advanced Class 4.36 (11) - -
Weighted Average: MGCubed Classes 4.09 (120) - -
Weighted Average: Overall 4.58 (470)** 4.78 (360) 4.67 (830)
* Number of missing data points =1 for this group ** 4 intervention classrooms for which grade level data was missing

GEC-T Baseline Report – Making Ghanaian Girls Great Project 134
Table 44: Recorded attendance by school
Number of days attendance taken, over the last 5 days
Intervention (Baseline)
Control (Baseline)
Total (Baseline)
All 5 of the last 5 days 45% (32) 62% (46) 54% (78)
Up to 5 days 39% (28) 35% (26) 37% (54)
Up to 4 days 14% (10) 1% (1) 8% (11)
Up to 3 days 1% (1) 1% (1) 1% (2)
Up to 2 days - - -
Up to 1 day - - -
None of the last 5 days - - -
TOTAL 100% (71) 100% (74) 100% (145) The number in each cell represents percentage share of each group. Frequency (N) is given in parentheses.
The ET then sought to compare how the number of students marked in class on a given day compared with the school’s enrolment numbers. Data presented her comes from the Attendance Spot Check tool as well. The analysis did not include missing data: in other words, if teachers were not taking attendance (as described in the section above), this would not have an impact on these numbers. This metric therefore was a proxy for regular attendance in class by enrolled students. However, with a response rate of around 90-95%, it was also a good measure of attendance overall.
Attendance is better in control schools, among girls (as compared to boys), and in grade-level classes compared to afterschool remedial MGCubed classes. These results are displayed in Table 45 and Table 46 below. MGCubed (remedial afterschool) classes had fewer students marked as present than grade level classes, and MGCubed remedial afterschool class attendance was the lowest for boys. This could be a reflection of the accessibility of the MGCubed afterschool remedial classes: if they were held when students usually were expected to be home or working, it could be more difficult to attend regularly. However, the analysis also found that the headcount of students in MGCubed afterschool remedial classes often exceeded enrolment and teacher-recorded attendance figures. This may indicate that MGCubed afterschool remedial classes are very desirable to attend, and that even children who are not part of the program are attending them.

GEC-T Baseline Report – Making Ghanaian Girls Great Project 135
Table 45: Attendance by grade and gender
"Students marked as present" as a percentage of students enrolled
Intervention (Baseline)
Control (Baseline)
Total (Baseline)
Girls
Grade P3 85% (66) 87% (71) 86% (137)
Grade P4 85% (66) 86% (70) 86% (136)
Grade P5 85% (63) 85% (65) 85% (128)
Grade P6 87% (64) 90% (69) 89% (133)
Grade JHS1 84% (53) 87% (58) 86% (111)
Weighted Average: Grade levels - Girls 85% (350) 87% (360) 86% (645)
MGCubed Basic Class 68% (53) - 68% (53)
MGCubed Intermediate Class 69% (45) - 69% (45)
MGCubed Advanced Class 72% (10) - 72% (10) Weighted Average: MGCubed Classes - Girls 69% (120) - 69% (120)
Weighted Average: Overall - Girls 81% (470) 87% (360) 84% (830)
Boys
Grade P3 83% (66) 84% (71) 84% (137)
Grade P4 83% (65) 83% (70) 83% (135)
Grade P5 85% (63) 85% (65) 85% (128)
Grade P6 84% (64) 87% (69) 85% (133)
Grade JHS1 80% (53) 82% (58) 81% (111)
Weighted Average: Grade levels - Boys 83% (311) 84% (333) 84% (644)
MGCubed Basic Class 61% (53) - 61% (53)
MGCubed Intermediate Class 64% (45) - 64% (45)
MGCubed Advanced Class 64% (8) - 64% (8) Weighted Average: MGCubed Classes - Boys 63% (106) - 63% (106)
Weighted Average: Overall - Boys 78% (417) 84% (333) 81% (750)
Response rate was 90.18% for girls' metrics and 89.82% for boys' metrics
Teacher recorded attendance and headcounts are very similar; notably, 13% of afterschool remedial MGCubed classes saw headcounts that were higher than the officially marked attendance. The next area of attendance analysis examined how the number of students counted as present by the enumerator compared with the number of students marked as present by a teacher in a classroom on a given day. These metrics were high across the board, which could indicate that attendance taken by teachers is accurate. Across all sub-categories, the headcount taken by the enumerator was sometimes greater than the number of students marked present: this occurred in around 5% of cases on average. Disaggregating by grade level classes and MGCubed afterschool remedial classes, this phenomenon was more pronounced: For grade-level classes, the headcount exceeded the number on attendance rolls around 3% of the time for both boys and girls. For MGCubed afterschool remedial classes,
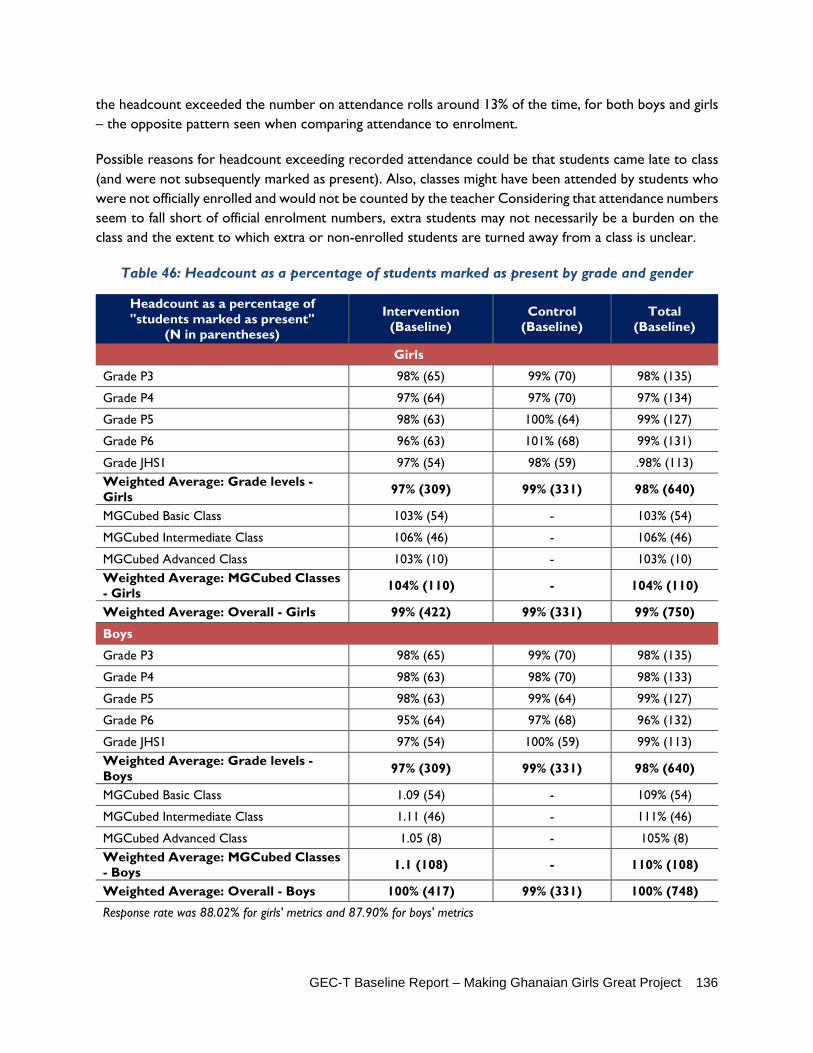
GEC-T Baseline Report – Making Ghanaian Girls Great Project 136
the headcount exceeded the number on attendance rolls around 13% of the time, for both boys and girls – the opposite pattern seen when comparing attendance to enrolment.
Possible reasons for headcount exceeding recorded attendance could be that students came late to class (and were not subsequently marked as present). Also, classes might have been attended by students who were not officially enrolled and would not be counted by the teacher Considering that attendance numbers seem to fall short of official enrolment numbers, extra students may not necessarily be a burden on the class and the extent to which extra or non-enrolled students are turned away from a class is unclear.
Table 46: Headcount as a percentage of students marked as present by grade and gender
Headcount as a percentage of "students marked as present"
(N in parentheses)
Intervention (Baseline)
Control (Baseline)
Total (Baseline)
Girls
Grade P3 98% (65) 99% (70) 98% (135)
Grade P4 97% (64) 97% (70) 97% (134)
Grade P5 98% (63) 100% (64) 99% (127)
Grade P6 96% (63) 101% (68) 99% (131)
Grade JHS1 97% (54) 98% (59) .98% (113) Weighted Average: Grade levels - Girls 97% (309) 99% (331) 98% (640)
MGCubed Basic Class 103% (54) - 103% (54)
MGCubed Intermediate Class 106% (46) - 106% (46)
MGCubed Advanced Class 103% (10) - 103% (10) Weighted Average: MGCubed Classes - Girls 104% (110) - 104% (110)
Weighted Average: Overall - Girls 99% (422) 99% (331) 99% (750)
Boys
Grade P3 98% (65) 99% (70) 98% (135)
Grade P4 98% (63) 98% (70) 98% (133)
Grade P5 98% (63) 99% (64) 99% (127)
Grade P6 95% (64) 97% (68) 96% (132)
Grade JHS1 97% (54) 100% (59) 99% (113) Weighted Average: Grade levels - Boys 97% (309) 99% (331) 98% (640)
MGCubed Basic Class 1.09 (54) - 109% (54)
MGCubed Intermediate Class 1.11 (46) - 111% (46)
MGCubed Advanced Class 1.05 (8) - 105% (8) Weighted Average: MGCubed Classes - Boys 1.1 (108) - 110% (108)
Weighted Average: Overall - Boys 100% (417) 99% (331) 100% (748)
Response rate was 88.02% for girls' metrics and 87.90% for boys' metrics

GEC-T Baseline Report – Making Ghanaian Girls Great Project 137
Headcounts were about 20% lower than official enrolment numbers and varied somewhat by gender of student and class type (grade-level versus MGCubed afterschool remedial). Finally, for attendance, the ET examined how the student headcount taken by the enumerator compared with the school’s enrolment numbers. Considering that headcounts taken by the enumerator were closely matched to teacher-taken attendance, it reasonably followed that similar patterns emerged when comparing teacher-taken attendance to enrolment. Headcounts were lower than enrolment numbers, headcounts of control group students were on average higher than of intervention group students, headcounts of girls were higher than of boys, headcounts of grade level classes were higher than MGCubed afterschool remedial classes, and headcounts of girls in MGCubed afterschool remedial classes were higher than those of boys in the same classes.
Table 47: Attendance headcount as a percentage of enrolled students by grade and gender
Headcount as a percentage of students enrolled
Intervention (Baseline)
Control (Baseline)
Total (Baseline)
Girls
Grade P3 84% (70) 86% (72) 85% (142)
Grade P4 82% (69) 83% (74) 83% (143)
Grade P5 82% (70) 84% (71) 83% (141)
Grade P6 84% (70) 89% (72) 86% (142)
Grade JHS1 82% (63) 84% (65) 83% (128) Weighted Average: Grade levels - Girls 83% (342) 85% (354) 84% (696)
MGCubed Basic Class 72% (57) - 72% (57)
MGCubed Intermediate Class 71% (49) - 71% (49)
MGCubed Advanced Class 74% (10) - 74% (10) Weighted Average: MGCubed Classes - Girls 72% (116) - 72% (116)
Weighted Average: Overall - Girls 80% (458) 85% (354) 82% (812)
Boys
Grade P3 82% (70) 83% (73) 83% (143)
Grade P4 82% (69) 82% (74) 82% (143)
Grade P5 82% (70) 84% (71) 83% (141)
Grade P6 79% (71) 84% (72) 81% (143)
Grade JHS1 79% (63) 81% (65) 80% (128) Weighted Average: Grade levels - Boys .81% (343) 83% (355) 82% (698)
MGCubed Basic Class 60% (55) - 60% (55)
MGCubed Intermediate Class 65% (49) - 65% (49)
MGCubed Advanced Class 66% (8) - 66% (8) Weighted Average: MGCubed Classes - Boys 63% (112) - 63% (112)
Weighted Average: Overall - Boys 76% (455) 83% (355) 79% (810)
Response rate was 95.69% for girls' metrics and 95.57% for boys' metrics
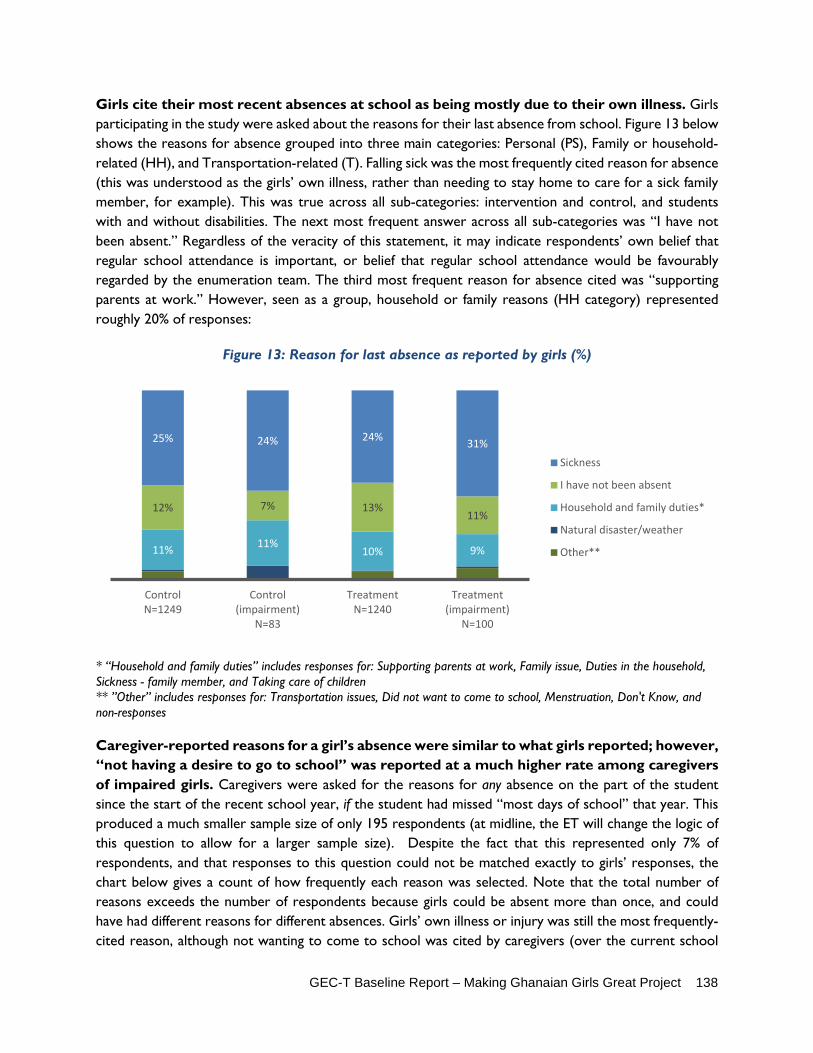
GEC-T Baseline Report – Making Ghanaian Girls Great Project 138
Girls cite their most recent absences at school as being mostly due to their own illness. Girls participating in the study were asked about the reasons for their last absence from school. Figure 13 below shows the reasons for absence grouped into three main categories: Personal (PS), Family or household-related (HH), and Transportation-related (T). Falling sick was the most frequently cited reason for absence (this was understood as the girls’ own illness, rather than needing to stay home to care for a sick family member, for example). This was true across all sub-categories: intervention and control, and students with and without disabilities. The next most frequent answer across all sub-categories was “I have not been absent.” Regardless of the veracity of this statement, it may indicate respondents’ own belief that regular school attendance is important, or belief that regular school attendance would be favourably regarded by the enumeration team. The third most frequent reason for absence cited was “supporting parents at work.” However, seen as a group, household or family reasons (HH category) represented roughly 20% of responses:
Figure 13: Reason for last absence as reported by girls (%)
* “Household and family duties” includes responses for: Supporting parents at work, Family issue, Duties in the household, Sickness - family member, and Taking care of children ** ”Other” includes responses for: Transportation issues, Did not want to come to school, Menstruation, Don't Know, and non-responses Caregiver-reported reasons for a girl’s absence were similar to what girls reported; however, “not having a desire to go to school” was reported at a much higher rate among caregivers of impaired girls. Caregivers were asked for the reasons for any absence on the part of the student since the start of the recent school year, if the student had missed “most days of school” that year. This produced a much smaller sample size of only 195 respondents (at midline, the ET will change the logic of this question to allow for a larger sample size). Despite the fact that this represented only 7% of respondents, and that responses to this question could not be matched exactly to girls’ responses, the chart below gives a count of how frequently each reason was selected. Note that the total number of reasons exceeds the number of respondents because girls could be absent more than once, and could have had different reasons for different absences. Girls’ own illness or injury was still the most frequently-cited reason, although not wanting to come to school was cited by caregivers (over the current school
11% 11%10% 9%
12% 7% 13%11%
25% 24% 24% 31%
ControlN=1249
Control(impairment)
N=83
TreatmentN=1240
Treatment(impairment)
N=100
Sickness
I have not been absent
Household and family duties*
Natural disaster/weather
Other**

GEC-T Baseline Report – Making Ghanaian Girls Great Project 139
year) more frequently. Impaired girls cited not wanting to come to school at a much higher rate than non-impaired girls (Figure 14).
Figure 14: Reason for last absence as reported by caregivers (%)
* “Other household and family duties” includes responses for: Family traveled, Household chores, and Care for siblings ** ”Other” includes responses for: School was too far, Menstruation, and Other According to VF’s own attendance tracking, of girls who had reported missing school in the past term, the primary reason cited was their own illness, with 64% of girls reporting that this was the reason for their absence. Thirty-two percent of girls who had missed school in the past term cited family reasons for missing school, including household duties, family issues such as funerals, and supporting parents at work. Qualitative data indicated that attendance has improved in the recent past. Caregivers believe regular attendance is critical for improved learning and successful transition. Overwhelmingly, male and female caregivers indicated that attendance has improved over the last few years. One father stated that “now, most parents come to the school to visit their children, which has helped improve attendance.” Some mothers credited MGCubed afterschool remedial classes as a catalyst for improved attendance, and therefore, improved learning. Additionally, female and male caretakers feel confident that girls will be able to successfully move forward with education in the future, with the assistance from the Varkey Foundation, and if the girls are supported and provided for their basic needs. However, barriers to attendance, including poverty, household responsibilities, pregnancy, and marriage must be addressed in order for girls to focus on school attendance. IO 1.2: Marginalised girls report being motivated to attend school as a result of the project (including OOSG who intend to return to school)
The ET did not measure this indicator at baseline in a quantitative manner, and OOSG girls were not involved in baseline data collection. At midline, the indicator will be measured via quantitative and qualitative methods.
0%10%20%30%40%50%60%70%80%90%
100%
ControlN=81
Control(impairment)
N=6
TreatmentN=95
Treatment(impairment)
N=13
Sick/injury
Has not been absent
Help in family/business
Other household and family duties*
Financial issues
Don't know
Did not want to come to school
Other**

GEC-T Baseline Report – Making Ghanaian Girls Great Project 140
5.2 SCHOOL GOVERNANCE AND MANAGEMENT School governance is an important part of the MGCubed program. Head Teachers are exposed to studio-based training remotely at their schools via the same distance-learning technology which students are exposed to. Trainings focus among many things on school leadership, management, and child protection. In the MGCubed MEL Framework, school governance is the fourth intermediate outcome. Per the program’s Log Frame, IO4 has two indicators:
IO 4.1: Percentage of schools assessed as having "Highly satisfactory" or "Outstanding" school leadership and management IO 4.2: Percentage of schools where the cane is either used or its use permitted.
IO 4.1: Percentage of schools assessed as having "Highly satisfactory" or "Outstanding" school leadership and management
In order to answer IO4.1, the ET developed a composite index of school management-related questions. The questions that makeup the index come directly from the household survey—the primary caregiver of a girl was asked four questions about the management of the girl’s school. The questions were given point values based on the answer choices possible, points added up, and then sums binned into quartiles. The four questions that make up the index can be found below:
How well is the school that the girl attends managed? Do you know the name of the head teacher/head master/director at the girl's school? How would you rate the performance of the school head teacher or principal? Have you been informed about girl's progress at school in the last 12 months?
Control schools are more likely to have “Outstanding” management than treatment schools. Figure 15 below shows that control schools generally have better management than treatment schools, according to the composite index. Slightly more control schools were deemed outstanding (25%) than treatment schools (22%), though equal amounts of each were highly satisfactory (26%). Twenty-nine percent of treatment schools were deemed “poorly managed” whereas 21% of control schools were found to be the same. When school management index scored are not binned and simply averaged across treatment status, scores are nearly identical at 6.52 (treatment) and 6.53 (control) out of a possible maximum of 8 points.
When looking at the disaggregation of the questions that make up the index, caregivers of control and treatment girls responded nearly identically, with 85% of each group saying that the school their child went to was managed well or excellently, and between 75-76% rating the performance of the head teacher as good. Slightly more caregivers of control girls know the name of their girl’s head teacher compared to caregivers of girls in treatment schools (40% and 38%, respectively), and slightly more control caregivers (64%) said they received feedback from schools on their daughters’ performance compared to treatment schools (61%). While overall the averages of each question of the index do not indicate a large gap in
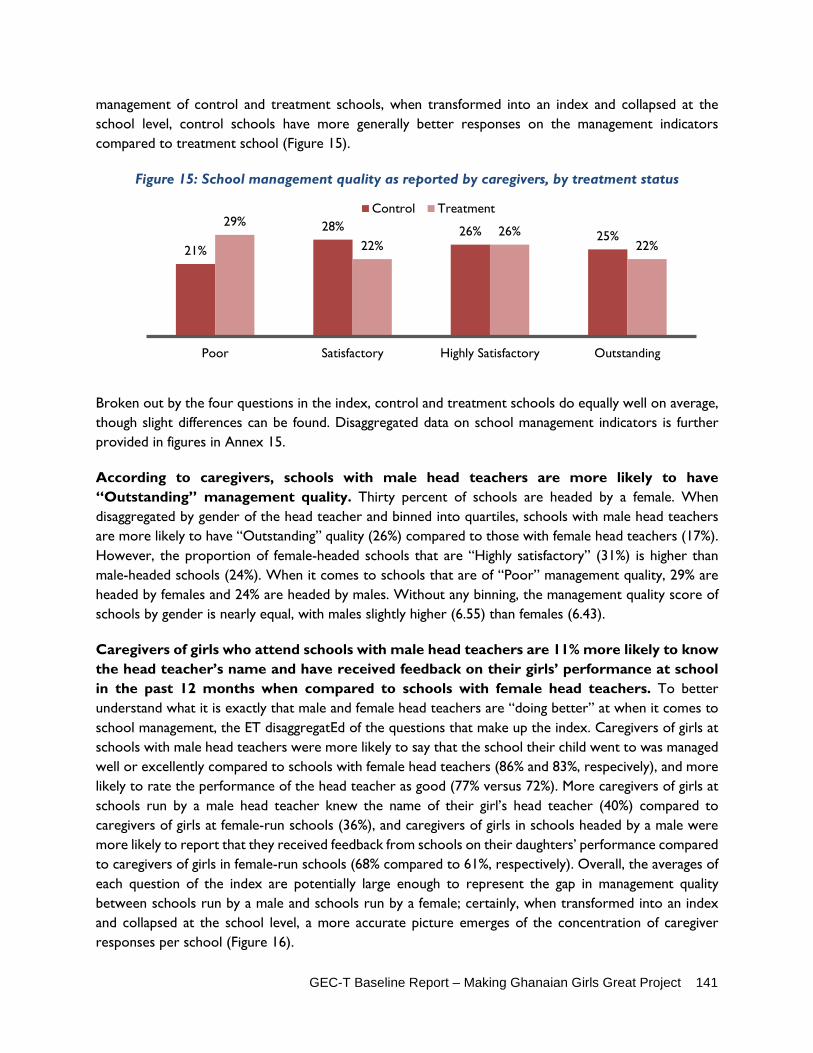
GEC-T Baseline Report – Making Ghanaian Girls Great Project 141
management of control and treatment schools, when transformed into an index and collapsed at the school level, control schools have more generally better responses on the management indicators compared to treatment school (Figure 15).
Figure 15: School management quality as reported by caregivers, by treatment status
Broken out by the four questions in the index, control and treatment schools do equally well on average, though slight differences can be found. Disaggregated data on school management indicators is further provided in figures in Annex 15.
According to caregivers, schools with male head teachers are more likely to have “Outstanding” management quality. Thirty percent of schools are headed by a female. When disaggregated by gender of the head teacher and binned into quartiles, schools with male head teachers are more likely to have “Outstanding” quality (26%) compared to those with female head teachers (17%). However, the proportion of female-headed schools that are “Highly satisfactory” (31%) is higher than male-headed schools (24%). When it comes to schools that are of “Poor” management quality, 29% are headed by females and 24% are headed by males. Without any binning, the management quality score of schools by gender is nearly equal, with males slightly higher (6.55) than females (6.43).
Caregivers of girls who attend schools with male head teachers are 11% more likely to know the head teacher’s name and have received feedback on their girls’ performance at school in the past 12 months when compared to schools with female head teachers. To better understand what it is exactly that male and female head teachers are “doing better” at when it comes to school management, the ET disaggregatEd of the questions that make up the index. Caregivers of girls at schools with male head teachers were more likely to say that the school their child went to was managed well or excellently compared to schools with female head teachers (86% and 83%, respecively), and more likely to rate the performance of the head teacher as good (77% versus 72%). More caregivers of girls at schools run by a male head teacher knew the name of their girl’s head teacher (40%) compared to caregivers of girls at female-run schools (36%), and caregivers of girls in schools headed by a male were more likely to report that they received feedback from schools on their daughters’ performance compared to caregivers of girls in female-run schools (68% compared to 61%, respectively). Overall, the averages of each question of the index are potentially large enough to represent the gap in management quality between schools run by a male and schools run by a female; certainly, when transformed into an index and collapsed at the school level, a more accurate picture emerges of the concentration of caregiver responses per school (Figure 16).
21%
28% 26% 25%29%
22%26%
22%
Poor Satisfactory Highly Satisfactory Outstanding
Control Treatment

GEC-T Baseline Report – Making Ghanaian Girls Great Project 142
Figure 16: School management quality as reported by caregivers, by gender of head teacher
Further indications of well-run schools are the existence of active parent-teacher associations (PTA), school management committees (SMC). Simply having an association or committee is not necessarily enough to guarantee a well-run school; ensuring that the organizations have active, regular meetings and communicate well between schools and parents is essential. In the School Survey, a Head Teacher was asked various questions about the existence of PTAs and SMCs, how frequently they meet, and about communication with these bodies. The following questions were analysed: Does this school have an active parent-teacher association? How many times does the PTA meet each school year? Does this school have an active school management committee? How many times does the school management committee meet each school year? Does the school management committee participate in the preparation of the school budget?
Though caregivers are more likely to rate control schools and male head teachers as having higher management quality, treatment and female-headed schools have stronger community involvement at the school. More treatment schools have active PTAs than control schools (87% compared to 79%), though control schools’ PTAs meet more frequently (4.77 times per year compared to 4.38 times in treatment schools). Similarly, more treatment schools have SMCs but they meet slightly less times per year than in control schools. As far as gender of head teacher, schools with female head teachers have significantly better community involvement statistics when compared to male-headed schools: they are 13 percentage points more likely to have an active PTA and their PTAs meet 24% more often (5.4 times per year compared to 4.1 times per year in male-headed schools). Female-headed schools also have better results on indicators related to SMCs (Table 48).
24% 26% 24% 26%29%
24%
31%
17%
Poor Satisfactory Highly Satisfactory Outstanding
Male Female
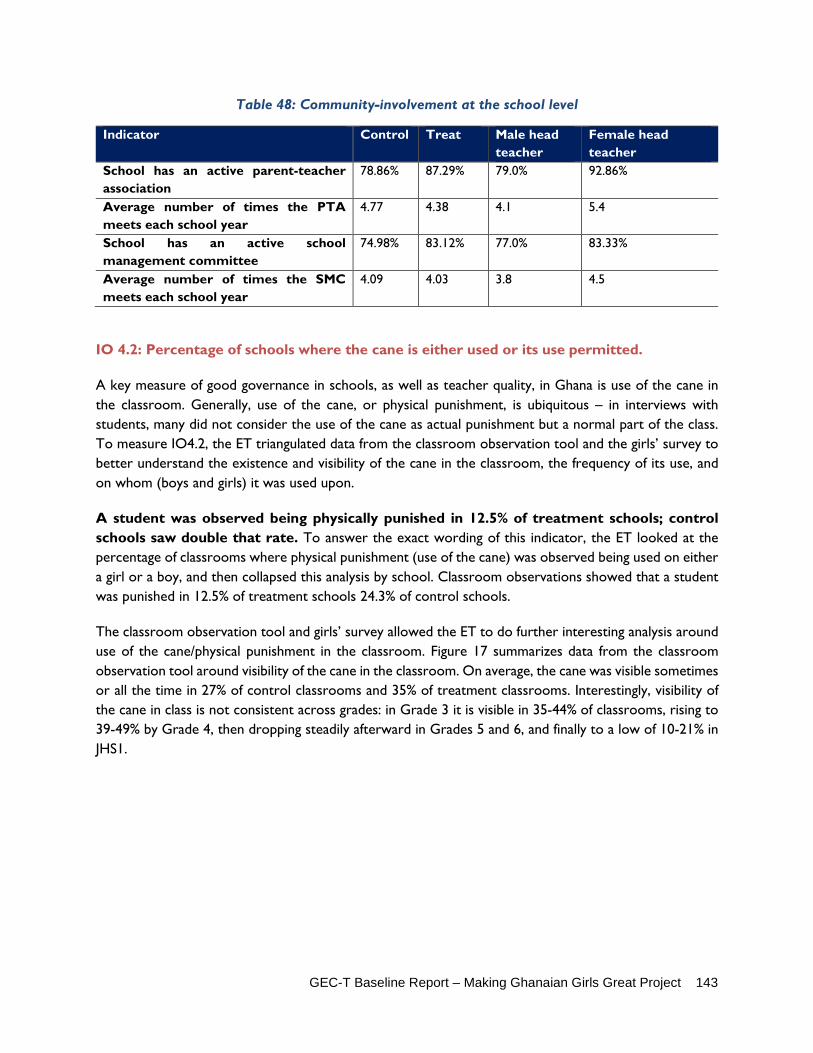
GEC-T Baseline Report – Making Ghanaian Girls Great Project 143
Table 48: Community-involvement at the school level
Indicator Control Treat Male head teacher
Female head teacher
School has an active parent-teacher association
78.86% 87.29% 79.0% 92.86%
Average number of times the PTA meets each school year
4.77 4.38 4.1 5.4
School has an active school management committee
74.98% 83.12% 77.0% 83.33%
Average number of times the SMC meets each school year
4.09 4.03 3.8 4.5
IO 4.2: Percentage of schools where the cane is either used or its use permitted.
A key measure of good governance in schools, as well as teacher quality, in Ghana is use of the cane in the classroom. Generally, use of the cane, or physical punishment, is ubiquitous – in interviews with students, many did not consider the use of the cane as actual punishment but a normal part of the class. To measure IO4.2, the ET triangulated data from the classroom observation tool and the girls’ survey to better understand the existence and visibility of the cane in the classroom, the frequency of its use, and on whom (boys and girls) it was used upon.
A student was observed being physically punished in 12.5% of treatment schools; control schools saw double that rate. To answer the exact wording of this indicator, the ET looked at the percentage of classrooms where physical punishment (use of the cane) was observed being used on either a girl or a boy, and then collapsed this analysis by school. Classroom observations showed that a student was punished in 12.5% of treatment schools 24.3% of control schools.
The classroom observation tool and girls’ survey allowed the ET to do further interesting analysis around use of the cane/physical punishment in the classroom. Figure 17 summarizes data from the classroom observation tool around visibility of the cane in the classroom. On average, the cane was visible sometimes or all the time in 27% of control classrooms and 35% of treatment classrooms. Interestingly, visibility of the cane in class is not consistent across grades: in Grade 3 it is visible in 35-44% of classrooms, rising to 39-49% by Grade 4, then dropping steadily afterward in Grades 5 and 6, and finally to a low of 10-21% in JHS1.

GEC-T Baseline Report – Making Ghanaian Girls Great Project 144
Figure 17: Cane visibility
Girls are caned less than boys, and significantly less in treatment schools compared to control schools. The cane is most likely to be used in P4 and JHS1. According to classroom observations, use of the cane was observed on either a boy or a girl in 10.9% of classrooms, and was found to be slightly higher among boys (8.1%) compared to girls (6.7%). Girls were substantially less likely to be caned in treatment schools (2.1%) than in control schools (11.26%), a fact which was not represented for boys (6.2% and 9.9% respectively). By grade, use of the cane rises from P2 to a high of 13.2% in P4, then drops precipitously down to 6.7% in P6 before shooting back up to 14.8% in JHS1 (Figure 18). Among female and male teachers, use of the cane was nearly equal (10.8% and 10.9%, respectively) (Table 49: Cane usage).
Table 49: Cane usage
Indicator Percentage Indicator Percentage
Girl caned 6.67 Grade 3 8.2 Boy caned 8.07 Grade 4 13.21 Either caned 10.88 Grade 5 12 Girl caned control 11.26 Grade 6 6.67 Girl caned treat 2.1 JHS1 14.81 Boy caned control 9.87 Female teacher canes 10.83 Boy caned treat 6.3 Male teacher canes 10.91
25% 29% 33%45%
18% 24% 26% 24%10% 12%
22% 27%
65% 56% 61%49%
74% 72% 73% 69%89%
79% 72% 65%
Control Treat Control Treat Control Treat Control Treat Control Treat Control Treat
Grade 3 Grade 4 Grade 5 Grade 6 JHS1 Average
Never
Sometimes
All the time

GEC-T Baseline Report – Making Ghanaian Girls Great Project 145
Figure 18: Percentage of classrooms where a teacher was observed using physical punishment
When it comes to reports of cane use, both control and treatment girls were consistent in their responses: on average, over 90% of all girls reported that the teacher uses the cane in class, a finding that was consistent across grades.
Figure 19: Percentage of girls reporting teachers’ use of cane in class, by grade
Impaired girls report being punished “all the time” at nearly double the rate of non-impaired girls. When broken out by impairment status, use of physical punishment on a girl in the past week was about equal among impaired and non-impaired girls (Figure 20). However, though non-impaired girls reported higher rates of being punished “once or twice” in the past week, a higher proportion of impaired girls reported that they were punished “all the time” in the past week (12% of impaired girls compared to 6% of non-impaired girls). Sample sizes, which are reported in the figure, are relatively small for impairment disaggregation.
11%
18%16%
10%
19%
15%
4%
8%10%
3%
11%
7%
Grade 3 Grade 4 Grade 5 Grade 6 JHS1 Average
Control Treatment
95% 94% 91% 89% 93% 93%92% 92% 89% 89% 93% 91%
Grade 3 Grade 4 Grade 5 Grade 6 JHS1 Average
Control Treat

GEC-T Baseline Report – Making Ghanaian Girls Great Project 146
Figure 20: Girls reporting usage of physical punishment in past week, by impairment status (%)
Qualitative data from students suggests that use of the cane is frequent and considered acceptable. Qualitatively, teachers, parents, and students spoke often about corporal punishment. The most frequently cited answer for how teachers make them feel among boys and girls was “unhappy because they cane us.” when boys and girls were asked what they dislike about school, the most frequently cited response was “caning.” Respondents across all FGD types indicated that attendance is negatively affected by fear of caning. Additionally, several students shared that students fear coming to school late or coming to school after being absent, even if the tardiness and absence were unavoidable, for fear of being caned. When asked how their teachers make them feel, one fifteen-year-old girl stated that her teachers make her sad because “at the least provocation, they use the cane on us.” All students interviewed indicated that their teachers use corporal punishment, primarily caning, on both boys and girls. Interestingly given the strong dislike of the use of caning, approximately 80% of all FGD respondents, including girls and boys, indicated that corporal punishment is either always acceptable or acceptable in moderation. One father stated that a lack of corporal punishment has led to bad behaviour, such as substance use, and so any ban on corporal punishment must be lifted. One boy stated, “They want us to learn. That is why they cane us. It is good that we should be obedient, so the teacher should cane us every day.” One mother said that teachers only cane for the betterment of the child. Additionally, one girl stated that caning is “absolutely good because as it is said, ‘spare the rod, spoil the child’.”
41.6 44.81
44.847.72
12 5.77
Impaired (n=125) Non-impaired (n=2,234)
Don't knowAll the timeOnce or twiceNever
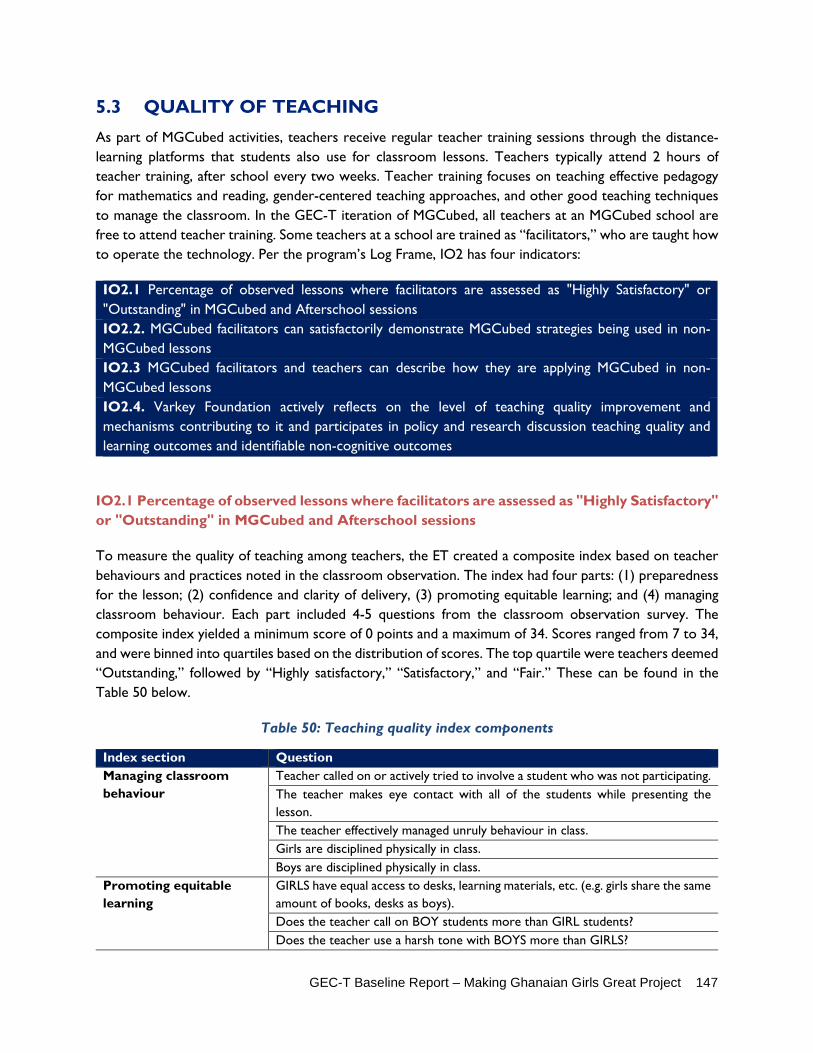
GEC-T Baseline Report – Making Ghanaian Girls Great Project 147
5.3 QUALITY OF TEACHING As part of MGCubed activities, teachers receive regular teacher training sessions through the distance-learning platforms that students also use for classroom lessons. Teachers typically attend 2 hours of teacher training, after school every two weeks. Teacher training focuses on teaching effective pedagogy for mathematics and reading, gender-centered teaching approaches, and other good teaching techniques to manage the classroom. In the GEC-T iteration of MGCubed, all teachers at an MGCubed school are free to attend teacher training. Some teachers at a school are trained as “facilitators,” who are taught how to operate the technology. Per the program’s Log Frame, IO2 has four indicators:
IO2.1 Percentage of observed lessons where facilitators are assessed as "Highly Satisfactory" or "Outstanding" in MGCubed and Afterschool sessions IO2.2. MGCubed facilitators can satisfactorily demonstrate MGCubed strategies being used in non-MGCubed lessons IO2.3 MGCubed facilitators and teachers can describe how they are applying MGCubed in non-MGCubed lessons IO2.4. Varkey Foundation actively reflects on the level of teaching quality improvement and mechanisms contributing to it and participates in policy and research discussion teaching quality and learning outcomes and identifiable non-cognitive outcomes
IO2.1 Percentage of observed lessons where facilitators are assessed as "Highly Satisfactory" or "Outstanding" in MGCubed and Afterschool sessions
To measure the quality of teaching among teachers, the ET created a composite index based on teacher behaviours and practices noted in the classroom observation. The index had four parts: (1) preparedness for the lesson; (2) confidence and clarity of delivery, (3) promoting equitable learning; and (4) managing classroom behaviour. Each part included 4-5 questions from the classroom observation survey. The composite index yielded a minimum score of 0 points and a maximum of 34. Scores ranged from 7 to 34, and were binned into quartiles based on the distribution of scores. The top quartile were teachers deemed “Outstanding,” followed by “Highly satisfactory,” “Satisfactory,” and “Fair.” These can be found in the Table 50 below.
Table 50: Teaching quality index components
Index section Question Managing classroom behaviour
Teacher called on or actively tried to involve a student who was not participating. The teacher makes eye contact with all of the students while presenting the lesson. The teacher effectively managed unruly behaviour in class. Girls are disciplined physically in class. Boys are disciplined physically in class.
Promoting equitable learning
GIRLS have equal access to desks, learning materials, etc. (e.g. girls share the same amount of books, desks as boys). Does the teacher call on BOY students more than GIRL students? Does the teacher use a harsh tone with BOYS more than GIRLS?
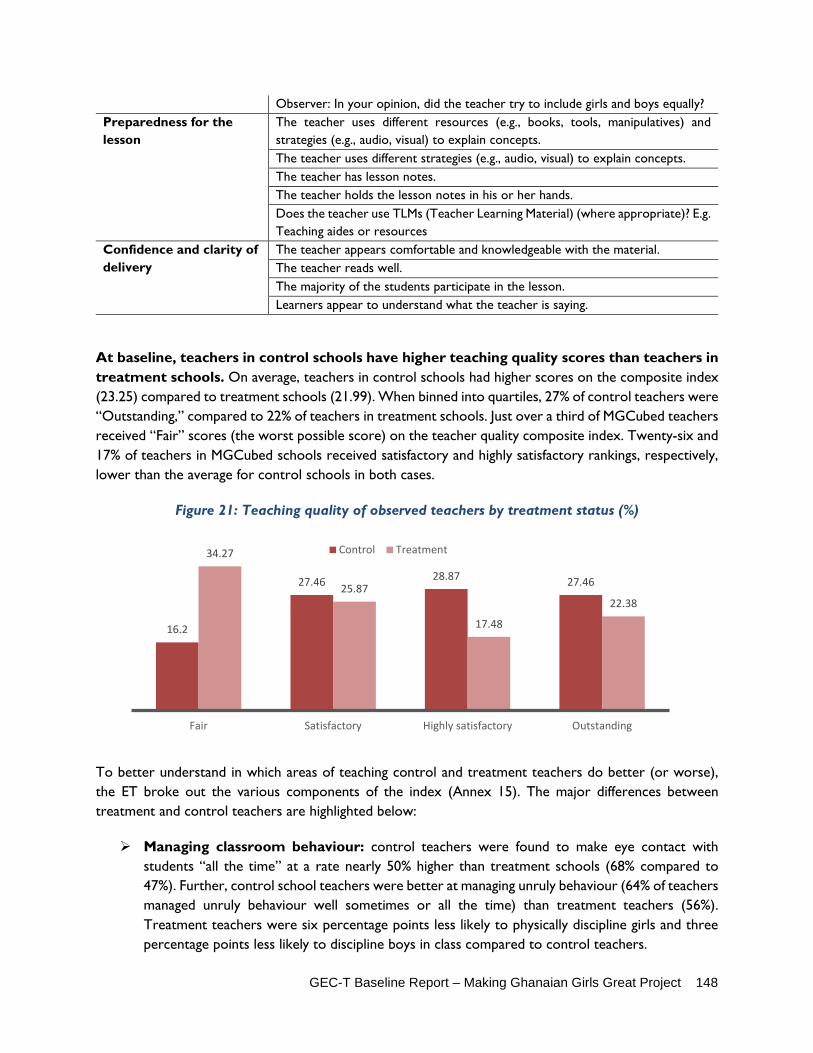
GEC-T Baseline Report – Making Ghanaian Girls Great Project 148
Observer: In your opinion, did the teacher try to include girls and boys equally? Preparedness for the lesson
The teacher uses different resources (e.g., books, tools, manipulatives) and strategies (e.g., audio, visual) to explain concepts. The teacher uses different strategies (e.g., audio, visual) to explain concepts. The teacher has lesson notes. The teacher holds the lesson notes in his or her hands. Does the teacher use TLMs (Teacher Learning Material) (where appropriate)? E.g. Teaching aides or resources
Confidence and clarity of delivery
The teacher appears comfortable and knowledgeable with the material. The teacher reads well. The majority of the students participate in the lesson. Learners appear to understand what the teacher is saying.
At baseline, teachers in control schools have higher teaching quality scores than teachers in treatment schools. On average, teachers in control schools had higher scores on the composite index (23.25) compared to treatment schools (21.99). When binned into quartiles, 27% of control teachers were “Outstanding,” compared to 22% of teachers in treatment schools. Just over a third of MGCubed teachers received “Fair” scores (the worst possible score) on the teacher quality composite index. Twenty-six and 17% of teachers in MGCubed schools received satisfactory and highly satisfactory rankings, respectively, lower than the average for control schools in both cases.
Figure 21: Teaching quality of observed teachers by treatment status (%)
To better understand in which areas of teaching control and treatment teachers do better (or worse), the ET broke out the various components of the index (Annex 15). The major differences between treatment and control teachers are highlighted below:
Managing classroom behaviour: control teachers were found to make eye contact with students “all the time” at a rate nearly 50% higher than treatment schools (68% compared to 47%). Further, control school teachers were better at managing unruly behaviour (64% of teachers managed unruly behaviour well sometimes or all the time) than treatment teachers (56%). Treatment teachers were six percentage points less likely to physically discipline girls and three percentage points less likely to discipline boys in class compared to control teachers.
16.2
27.46 28.87 27.46
34.27
25.87
17.48
22.38
Fair Satisfactory Highly satisfactory Outstanding
Control Treatment

GEC-T Baseline Report – Making Ghanaian Girls Great Project 149
Promoting equitable learning: Eleven percent of enumerators observing treatment teachers said that a teacher did not try to include girls and boys equally, compared to 6% of enumerators in control classrooms.
Preparedness for the lesson: Control teachers used different resources and strategies to explain concepts sometimes or all of the time in 77% of classrooms, compared to 66% of treatment classrooms. The teacher had lesson notes “all the time” in 81% of control classrooms but only 69% of treatment classrooms.
Confidence and clarity of delivery: Treatment teachers were observed as appearing comfortable and knowledgeable about the material “all the time” in 72.5% of treatment classes compared to 79% of control classes.
On average, female teachers have higher teaching quality scores, though male teachers are more likely to be “Outstanding.” When disaggregated by gender of teacher, female teachers have a slightly higher average composite score (22.96) when compared to male teachers (22.37). When broken into quartiles, a higher percentage of male teachers were “outstanding” (26%) compared to female teachers (23%), though the proportion of “Fair” female teachers (17%) was almost half of male teachers in the same category (32%). A substantially larger proportion of female teachers were rated “Highly Satisfactory” (28%) when compared to male teachers (19%), according to the index (Figure 22).
Figure 22: Teaching quality of observed teachers, by gender (%)
Facilitators score lower on the teaching quality index compared to non-facilitators. When disaggregating between facilitators and non-facilitators in treatment schools, non-facilitators have higher average scores on the teaching quality index than facilitators (22.43 compared to 21.23 out of of a maximum of 34). Binning this into quartiles, however, Figure 23 shows a large difference in the distribution of teacher quality. Non-facilitators (n=90) are just over twice as likely to be “Outstanding” compared to facilitators (n=53), and nearly 40% of facilitators fell into the lowest category of “Fair” teaching quality.
An important caveat to note is that the Classroom Observation Tool did not differentiate between teachers who were teaching a regular class and those teaching an MGCubed distance-learning class. There is a much greater chance that an observed facilitator was teaching an MGCubed distance-learning class at the time of observation which could have introduced bias into the teacher quality findings, in particular
31.5
23.019.4
26.1
16.7
31.728.3
23.3
Fair Satisfactory Highly satisfactory Outstanding
Male Female

GEC-T Baseline Report – Making Ghanaian Girls Great Project 150
because a facilitator in an MGCubed class may have not been using the same teaching techniques he or she would have used had it been a regular class. To account for this potential bias the ET sought to better understand in which areas of teaching facilitators and non-facilitators in treatment schools did better (or worse). The ET broke out the various components of the index, which can be found in Annex 15. The major differences between facilitators and non-facilitators are highlighted below:
Managing classroom behaviour: Non-facilitators made eye contact with students “all the time” more than 20% more often than facilitators (50% compared to 41%). Further, facilitators were much worse at managing unruly behaviour, doing so “all the time” in 7% of classrooms compared to 19% of classrooms with non-facilitators. However, facilitators were four percentage points less likely to physically discipline a boy when compared to non-facilitators (98% compared to 94%, respectively).
Promoting equitable learning: Facilitators called on boys and girls equally in 79% of classes compared to 91% of classes observed with non-facilitators. In the opinion of observers, 15% of facilitators did not try to include girls and boys equally in the class, compared to 9% of non-facilitators.
Preparedness for the lesson: Facilitators had lesson notes “all the time” in 63% of classes observed, whereas non-facilitators had lesson notes in 72% of classes observed.
Confidence and clarity of delivery: Observers noted that non-facilitators read well “all the time” in 77% of classes, compared to 65% of facilitators. The majority of students participated in class in 65% of classes with non-facilitators compared to 58% of classes with facilitators, and learners appeared to understand what the teacher was saying “all the time” in 55% of facilitator-taught classes versus 61% of non-facilitator-led classes.
Figure 23: Teaching quality of observed teachers in treatment schools, by facilitator status (%)
Girls overwhelmingly feel welcome in the classroom by their teacher, though nearly a quarter feel that teachers treat girls and boys differently in class. There is very little difference between treatment and control girls. To triangulate the data from the classroom observation tool, the ET also look at responses on teacher quality from the girls’ survey. Girls overwhelmingly agree (over 80%) that teachers make them feel welcome in the classroom. While more than 70% of girls in control and treatment schools disagreed with the statement that “teachers treat boys and girls differently in the classroom,” a notable 22-23% of girls agreed a little bit or agreed a lot with the statement. With regard to the statement “my teachers are often absent for class,” 25-33% of girls agreed
31.1
23.317.8
27.8
39.6
30.2
17.013.2
Fair Satisfactory Highly satisfactory Outstanding
Non-facilitator (n=90) Facilitaor (n=53)

GEC-T Baseline Report – Making Ghanaian Girls Great Project 151
a little or agreed a lot. Over 95% of girls agreed that teachers often or sometimes encourage students to participate in class, about 93% said that teachers ask equal amounts of questions and equally difficult questions to boys and girls, and approximately 90% reported that their teachers provide feedback on school work.
Figure 24: Teaching quality as reported by girls (%)
Parents and children have generally positive feelings about the quality of their teachers. When asked about recent changes with regard to education and schools, several male and female caretakers indicated that improvements in teacher quality and an increase in teacher staffing have played a role in improving learning, attendance, and transition among both boys and girls. Additionally, boys and girls indicated that teachers treat boys and girls equally, and the second most cited answer when asked how teachers make them feel was “very happy.” Students indicated that teachers make them happy because they help them to understand the material, and when they don’t understand, the teacher take the time to explain. One boy stated that he wants “to become a teacher like the one who teaches me.” No caretakers indicated poor teacher quality as a problem. Additionally, only very few boys and girls made negative comment about their teachers, aside from the overwhelming dislike of being caned.
Qualitatively, teachers comment strongly that they use lessons learned from GEC-T trainings. Teachers have reported that classroom management and pedagogy, violence awareness and prevention and gender sensitivity training have helped improve their teaching quality. Three out of fifteen teachers indicated that their violence awareness and prevention training has helped them teach students about playing cordially without harming each other. Three others indicated that they have been able to notice and report child abuse cases. In terms of classroom management, two teachers report their interaction with students has improved especially when they sit together in groups. One specifically mentioned that he has been able to speak with his students more calmly when they misbehave. Another teacher mentioned that she understands her students’ limits and learned to shorten lesson plans and assignments. Four others reported that introductory exercises such as icebreakers have helped to engage their students in class activities. Gender sensitivity training was reported as particularly useful in the classroom as well. Two male teachers reported that they have been able to better manage female-related issues such as menstrual cycles. Five teachers indicated that they have applied their gender sensitive
84.99 82.84
16.86 16.72 16.42 15.16
Control Treat Control Treat Control Treat
My teachers make me feelwelcome in the classroom
My teachers treat boys and girlsdifferently in the classroom
My teachers are often absent forclass
Disagree a lotDisagree a littleAgree a littleAgree a lot

GEC-T Baseline Report – Making Ghanaian Girls Great Project 152
training by providing equal opportunities to both boys and girls to answer questions during lessons and also creating mixed gendered sitting assignments.
External environmental factors still pose large barriers to teaching quality. Although GEC-T trainings have helped teachers improve their teaching quality, poor infrastructure and lack of school materials was reported as a challenge to teaching. Two teachers reported that cracked walls and ceilings have allowed rain to damage school property such as chalkboards. Additionally, four others mentioned that noises from outside the classroom such as motorcycles and people doing business on the road can serve as distractions. Three teachers specifically mentioned that problems with materials related to technology in their MGCubed classroom (such as with the laptop, keyboard, and mouse) also served as a challenge to teaching. Four more mentioned that they found it difficult to teach children who attend classes without their materials or who come to school hungry. One teacher specifically mentioned that many teachers live far away from the community and if they could live closer to schools, they would be able to assist students in the evening.
Full data analysis of all classroom observation indicators can be found in the Annex 15.
IO2.2. MGCubed facilitators can satisfactorily demonstrate MGCubed strategies being used in non-MGCubed lessons
To answer IO2.2., the ET included a limited number of questions in the classroom observation tool on MGCubed specific strategies, based off of the MGCubed curriculum provided to the ET. These included questions on the use of TLMs, Ways of Work, setting class objectives, use of plenaries, and use of assessments. Given that classroom observations were held only in grade-level classes, the data below shows the use of MGCubed strategies in non-MGCubed lessons.
MGCubed teachers utlilises certain specific MGCubed teaching techniques in non-MGCubed classes, particularly Ways of Work and plenaries. There is no clear pattern among facilitators and non-facilitators. Figure 25 shows a clear gap between control and treatment schools for use of “Ways of Work,” With about half of treatment classes using it “All the time” or “Sometimes” compared to less than 20% of control classes. Simiarlly, the use of mini-plenaries is higher in MGCubed schools (about 50%) compared to control schools (30%). More generalized teaching techniques that, although promoted by MGCubed are also general good teaching practices, include sharing lesson objectives, relaying lessons to real life applications, and using assessments. When observing use of those behaviours, control and treatment schools are similar. Figure 25 also disaggregates by facilitator and non-facilitator. In doing so, no clear pattern emerges, however, non-facilitators conduct the MGCubed-specific techniques more often than facilitators in four of the six key indicators measured. To give a quantitative measurement to this indicator, the ET has averaged the sum of “sometimes’ and “all the time” proportions for facilitators in each of the six categories below to arrive at a proportion of 55.8%.

GEC-T Baseline Report – Making Ghanaian Girls Great Project 153
Figure 25: MGCubed techniques prevalence in observed classrooms, by treatment and facilitator status (%)
In line with its provision of weekly teacher training to all teaching staff, as well as additional support to MGCubed classroom facilitators, VF expressed that it expects to see relatively immediate evidence that classroom practice has changed. In Output 2.2 (Annex 3), VF reports that over 60% of teachers said that they had changed their teaching style as a result of training received by MGCubed, and could provide an example of how.
Internal observations undertaken by Varkey Foundation District Coordinators indicated a high rate of uptake of student-centred learning strategies. Of 127 observations undertaken during the first two terms of the project, 83.5% of educators were found to use techniques shared during the MGCubed teacher training.
Though sample sizes are disproportional, VF noted that facilitators and non-facilitators performed differently with regard to the use of specific MGCubed approaches and techniques. In the 22 observations of non-facilitators, 13 (59%) used MGCubed techniques. Non-facilitators who were not exposed to MGCubed studio broadcasts were three times less likely to use a variety of activities and share lesson objectives. With regard to visibility of the cane in class, 32% of facilitators had a cane visible in their regular lessons versus 23% of non-facilitators. Of the facilitators who demonstrated MGCubed techniques, the use of differentiation techniques and the use of plenaries were identified as “inadequate” or requiring improvement in about 5% of cases.
16
50 49 52 37 39 4234
5664 69
5650 47 45 49
2946 50
39
54 59 5959
1 2 2 19 9 10 8
188 8 6
17 15 15 143 2 2 3
21 18 21 14
Cont
rol
Trea
tmen
t
(T) N
o fa
cilit
ator
(T) F
acili
tato
r
Cont
rol
Trea
tmen
t
(T) N
o fa
cilit
ator
(T) F
acili
tato
r
Cont
rol
Trea
tmen
t
(T) N
o fa
cilit
ator
(T) F
acili
tato
r
Cont
rol
Trea
tmen
t
(T) N
o fa
cilit
ator
(T) F
acili
tato
r
Cont
rol
Trea
tmen
t
(T) N
o fa
cilit
ator
(T) F
acili
tato
r
Cont
rol
Trea
tmen
t
(T) N
o fa
cilit
ator
(T) F
acili
tato
r
Teacher sharesWays of Work with
the class
Teacher shareslesson objectives
with pupils
Teacher sharesrelevance/real life
application oflesson content
Teacher uses TLMs(Teacher Learning
Material)
Teacher uses miniplenaries, or a final
plenary (end oflesson)
Teacher conductssome type ofassessment
All the time
Sometimes
Never
GEC-T Baseline Report – Making Ghanaian Girls Great Project 154
IO2.3 MGCubed facilitators and teachers can describe how they are applying MGCubed in non-MGCubed lessons
Data for this indicator (which is also applicable to Output 2.3 in Annex 3) was gathered internally by VF through 107 interviews with facilitators and teachers. Findings indicate that educators in intervention schools have a strong awareness of how they are applying “new” MGCubed-inspired student-centred learning strategies in the classroom (“I make my pupils the centre of the teaching and learning process”) and why this is effective (“It has helped the slow learners to pick up and also made pupils to enjoy class”). Educators were found to be welcoming of approaches that motivate pupils and create optimal conditions for learning. One teacher said “using the MGCubed methods of teaching, lessons are always lively and most pupils are expectant.”
In providing examples of how “new” student-centred pedagogical approaches are being applied following participation in MGCubed trainings, educators reflected on the challenges in doing so. Teachers who are new to the project were very clear that they are engaging with new material, while facilitators who have been part of the project for over three years painted a rosy picture of their own professional skill level. For instance, one facilitator remarked that “the trainings are good [but] for me the changes need to happen with the others [teachers] because we have done this [for a] long time.” This may suggest that facilitators feel the project is more useful for new facilitators and teachers than established facilitators.
While some facilitators have been part of the project for years, they now make up a relatively small proportion of the overall educator participants. Further, facilitators who were part of the project during GEC-1 do show evidence of needing support, established though Varkey Foundation classroom observations and logs which ensure that all out-of-studio support provided to teaching staff in schools is recorded. Logs completed since the beginning of the GEC-T project show support requests ranging from asking advice on managing workload to differentiation techniques when class sizes are large to enthusing pupils who are tired and do not want to learn. Requests were not specific to non-MGCubed classes. They show that facilitators who have been with the project since the beginning of GEC-1 do still require support, but also that they are actively reflecting on how to improve their skills.
According to VF internal reporting, interview responses from educators demonstrate both a conscious effort to employ new strategies and an active reflection on the limitations of their own capacity as well as external constraints. Key themes that emerge include difficulties in employing group activities that requires pens and paper (e.g. Gallery Walk, Marketplace) due a lack of teaching and learning materials, difficulty with the use of phonics approaches due to pupils who are not part of the MGCubed project being unfamiliar with these approaches (“it is difficult to apply because pupils who are not part of MGCubed do not have the basics”), and difficulties due to large class sizes or overcrowding. Further, while educators support student-centred approaches, they note that they “take [much] time,” with one facilitator noting “it is difficult to practice grouping and regrouping; it delays delivery.”
Facilitators are most likely to refer to the modelling they are exposed to through Master Teachers in MGCubed classes as a source of learning. According to one facilitator, “I learnt all their methods in teaching. This improved my teaching skills to teach effectively like a trained teacher, meanwhile I am a community teacher.” Facilitators cite a range of teaching strategies, such as Starter Activities, phonics, and Icebreakers, but also personal attributes and approaches to relationship building with children. For

GEC-T Baseline Report – Making Ghanaian Girls Great Project 155
example, one facilitator noted “I learnt to be patient with pupils, for example from Love [an MGCubed Master Teacher]” and “[I learnt the] polite way of talking to people and how to appreciate every child, wrong or good.” Facilitators also mentioned learnings around lesson management techniques, such as lesson planning and arriving to class on time.
IO2.4. Varkey Foundation actively reflects on the level of teaching quality improvement and mechanisms contributing to it and participates in policy and research discussion teaching quality and learning outcomes and identifiable non-cognitive outcomes
Key learnings derived from MGCubed are yet to be identified and thus no progress has been made on this indicator at baseline. The Varkey Foundation is a member of the three Learning Clusters and plans to have active engagement with the participants of the clusters over the lifetime of the project.
5.4 COMMUNITY-BASED ATTITUDES AND BEHAVIOUR CHANGE The MGCubed project holds workshops and trainings with community members including parents, SMCs, community leaders, and head teachers with the goal of changing their attitudes and behaviours towards girls’ education. To gauge the effectiveness of these trainings, MGCubed includes Community-based attitudes and behaviour change as IO5 in their Log Frame, with the following three indicators:
IO5.1: Community members demonstrate an understanding of the importance of girls' education IO5.2: Community members express support for Afterschool club content IO5.3: Community acts as guardians for technology packages in schools
IO5.1: Community members demonstrate an understanding of the importance of girls' education
Attitudes towards girls’ education are crucial to understanding transition rates. If community members place little value on girls’ education, then they are unlikely to make the necessary investments to keep their girls in school and successfully transitioning each year. Chores around the home or earning money at a job can supersede education. To measure these attitudes, the evaluation team draws mostly from the household surveys administered to girls’ primary care givers. They indicate their desired level of schooling for their girls, the level of their girls’ involvement in education decision-making, and a battery of hypothetical questions designed to probe their evaluation of girls’ education.
Quantifying these attitudes presents a set of unique measurement challenges. Social desirability bias is likely, and it can cause a primary care giver to express higher levels of support for girls’ education than their true beliefs. For example, upon being asked by someone from the organization implementing technological investment in their daughter’s school, a primary care giver may indicate that they want their daughter to graduate from a University when surveyed while believing that girl’s should stop attending after Senior High School. A second measurement problem is that the specific wording of a question can

GEC-T Baseline Report – Making Ghanaian Girls Great Project 156
change how respondents reply. It is important to keep these kinds of measurement challenges in mind while attempting to draw conclusions on a community’s beliefs towards girls’ education. To measure this indicator, the ET took the proportion of caregivers who strongly agreed with the statement “Even when funds are limited, it is worth investing in a girl's education," which was found to be 71% at baseline.
More than 7 in 10 caregivers would like their girls to achieve a university degree or higher. There was little variation across intervention and control groups with respect to attitudes towards girls’ education. This is expected, as the Varkey Foundation programs have not yet had time to cause changes in primary care givers’ beliefs. The majority of both intervention and control caregivers indicated a desire for their girl to graduate from university (70% and 68%, respectively) while 11% and 13% chose “Post-university (Masters or Doctorate)” as indicated in Table 51 below. Asking when a girl should stop attending school, rather than asking what level they hoped she would achieve, caused more caregivers (16% and 18%) to choose “post-university”, highlighting the measurement difficulties described above.
Table 51: Primary caregiver’s desired schooling for girls
Intervention Control
What level of schooling would you like to see (girl) achieve?
According to Primary Care Giver
Lower Primary 0% (4) 1% (8)
Upper Primary 0% (4) 0% (5)
Junior High School 2% (25) 2% (23)
Senior High School 9% (120) 10% (136)
College or university 70% (936) 68% (892)
Post-university (Masters or Doctorate) 11% (145) 13% (171)
At what level do you think (girl) should stop attending school?
According to Primary Care Giver
Lower Primary 0% (1) 0% (3)
Upper Primary 1% (18) 1% (10)
Junior High School 2% (31) 1% (19)
Senior High School 8% (106) 10% (137)
College or university 58% (779) 54% (711)
Post-university (Masters or Doctorate) 16% (216) 18% (232)
Most care givers reported that they considered girls’ opinions in education-related decisions as seen in Figure 26. This mirrors the findings on girls’ agency in the Life Skills section later in this report. Respondents nearly universally indicated that girl’s education is a worthwhile investment even when funds are limited, with 95% of both intervention and control groups either agreeing or strongly agreeing. Disaggregation revealed little variation across primary caregiver gender, grade, impairment, and treatment status.

GEC-T Baseline Report – Making Ghanaian Girls Great Project 157
Figure 26: Primary caregivers’ consideration of girls’ views on education
Rates were similarly universal in response to the statements “A girl is just as likely to use her education as a boy,” and “Even when funds are limited it is worth investing in a girl’s education.” Similarly, when asked whether a girl should go to school or remain at work if they needed to work or help at home, respondents were nearly universal in saying that the girl should go to school. These extremely high levels of expressed support could be indicative of social desirability bias. One in ten girls in the benchmark transition sample had either dropped out or remained out of school in the last year, and national net primary enrolment was 84.6% in 201741.
41 “Ghana - Participation in Education.” UNESCO Institute for Statistics, UNESCO, 12 Apr. 2017, uis.unesco.org/country/GH.
24%22%
34%30%
27%24%26%
23%18%
23%17%
15%19%
32%28%
21%18%18%
11%17%
22%24%
22%28%
53%56%
46%49%
50%54%51%56%
62%53%
59%63%
62%
51%51%
55%62%
56%74%
33%
54%57%
56%53%
23%22%
20%21%
23%22%24%21%20%
24%24%22%19%
17%21%
24%21%
26%16%
50%
24%20%
22%19%
Male Primary Caregiver (n=557)Female Primary Caregiver (n=2065)
8 (n=41)9 (n=116)
10 (n=205)11 (n=276)12 (n=440)13 (n=490)14 (n=430)15 (n=265)16 (n=174)17 (n=125)18 (n=58)
P3 (n=313)P4 (n=542)P5 (n=602)P6 (n=604)
JHS1 (n=490)JHS2 (n=19)JHS3 (n=6)
Control (n=1301)Treatment (n=1321)
No impairment present (n=2443)Impairment present (n=179)
Only consider adult's views Sometimes consider child's views Always consider child's views

GEC-T Baseline Report – Making Ghanaian Girls Great Project 158
Table 52: Primary caregivers’ value of education views
Intervention Control
"Even when funds are limited, it is worth investing in a girl's education"
According to Primary Care Giver
Strongly agree 71% (951) 71% (943)
Agree 24% (324) 24% (325)
Neither agree nor disagree 3% (44) 3% (37)
Disagree 1% (10) 0% (3)
Strongly disagree 0% (4) 0% (4)
"A girl is just as likely to use her education as a boy"
Strongly agree 71% (954) 73% (968)
Agree 24% (327) 23% (304)
Neither agree nor disagree 2% (25) 2% (25)
Disagree 1% (19) 1% (14)
Strongly disagree 0% (5) 0% (6)
Table 53: Housework and attendance
Intervention Control
Does time spent on housework affect attendance?
According to Primary Care Giver
Yes, not enrolled because of this 0% (2) 0% (1)
Yes, stops her often 0% (5) 0% (3)
Yes, stops her sometimes 3% (42) 2% (24)
No, does not stop her 96% (1267) 98% (1270)
Community and parent perceptions toward education, and specifically girls’ education, is resoundingly positive and appears to have increased in recent years. According to qualitative data, across all FGDs, 100% of male and female caretakers, as well as all boys and girls indicated that education is critically important to the development and wellbeing of both genders. Further, 100% of FGD respondents indicated a positive shift in community perceptions of girls’ education in recent years. As one 44-year-old father from Adenta mentioned, “there was a saying that only boys are meant to go to school. But in these days things have changed. I now also help my girl child do her homework.” One ten-year-old, fifth grade female student from Ada West indicated that “the community sees education as the means to making a good life and becoming an acceptable member of society.” The majority of female and male caretakers, when asked how community member and parent engagement in girls’ education has changed, indicated that engagement has increased. Sixty percent of female and male caretakers indicated that parental support is one of the most important factors that will allow girls to continue to attend school and perform well. A substantial number of FGD responses across all FGD types, including girls,

GEC-T Baseline Report – Making Ghanaian Girls Great Project 159
indicated that while community support for girls’ education has improved, girls’ motivation for education is negatively impacted by both cultural and social norms.
Girls still face substantial financial and cultural barriers. While community perceptions around girls’ education have improved substantially, many FGD respondents suggested that perceptions may still present a barrier for some girls. This is evidenced by “lack of parental support for education” being one of the top three most commonly cited barriers to attendance and enrollment. Additionally, when boys were asked if boys or girls are smarter, nearly half of respondents indicated that girls are not as smart as boys, suggesting a persistent cultural belief about girls’ capabilities. Boys most frequently cited girls not participating in class and pregnancy as the reasons why boys are smarter than girls. One fifth grade boy stated that “boys are smarter than girls because if you are a girl and you know the importance of education, you wouldn’t let a boy impregnate you.” When youth were asked why it’s important for boys and girls to go to school, the three most common responses were (1) to create a good life with a good job, (2) to be able to take care of the family, and (3) to avoid pregnancy. Youth FGD respondents also indicated that parents predominantly want girls to get an education so that they can help take care of the family and community and to avoid pregnancy. This does indicate that pregnancy and household duties remain important barriers in the community.
IO5.2: Community members express support for Afterschool club content
The ET did not measure this indicator with any quantitative and qualitative tools at baseline and relies solely on VF’s internal monitoring to report out on baseline findings. VF internal monitoring included interviews with 19 parents in the first two terms of MGCubed, all of whom have girls who are part of the project.
Thus far, all parents interviewed reported that they felt the afterschool club content delivered by the Varkey Foundation was relevant to community needs, and was therefore contributing to wider community development. This buy-in from community members is essential for the long-term sustainability of the project. No complaints about the afterschool club content were received, which to some extent validates some of the programmatic changes that VF took between GEC-1 and GEC-T with respect to afterschool clubs. For example, the project’s decision to split the Wonder Women sessions between Basic and Advanced (dependent on age and grade) was not criticised; it appears to have helped the project better target girls.
Community members demonstrated a high level of engagement and reflection in making suggestions for content focus early on in the project. Respondents were able to identify areas on which they would like the project content to focus. The suggestions were broad and included the following:
Supporting parents’ awareness of the importance of education Teenage pregnancy and returning to school Preventing parental neglect Preventing girls dropping out of school Reducing girls’ work burden in the household How parents can support and monitor pupils’ performance in school Preventing children or girls from entertainment and other distractions during school hours
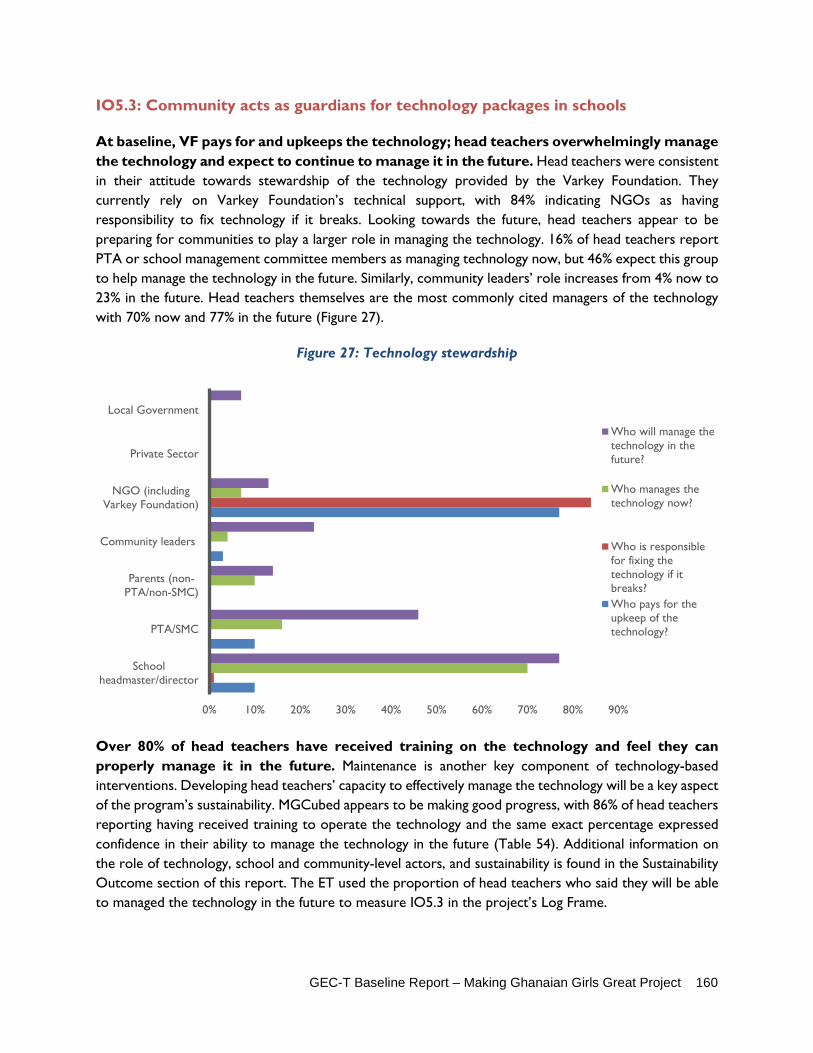
GEC-T Baseline Report – Making Ghanaian Girls Great Project 160
IO5.3: Community acts as guardians for technology packages in schools
At baseline, VF pays for and upkeeps the technology; head teachers overwhelmingly manage the technology and expect to continue to manage it in the future. Head teachers were consistent in their attitude towards stewardship of the technology provided by the Varkey Foundation. They currently rely on Varkey Foundation’s technical support, with 84% indicating NGOs as having responsibility to fix technology if it breaks. Looking towards the future, head teachers appear to be preparing for communities to play a larger role in managing the technology. 16% of head teachers report PTA or school management committee members as managing technology now, but 46% expect this group to help manage the technology in the future. Similarly, community leaders’ role increases from 4% now to 23% in the future. Head teachers themselves are the most commonly cited managers of the technology with 70% now and 77% in the future (Figure 27).
Figure 27: Technology stewardship
Over 80% of head teachers have received training on the technology and feel they can properly manage it in the future. Maintenance is another key component of technology-based interventions. Developing head teachers’ capacity to effectively manage the technology will be a key aspect of the program’s sustainability. MGCubed appears to be making good progress, with 86% of head teachers reporting having received training to operate the technology and the same exact percentage expressed confidence in their ability to manage the technology in the future (Table 54). Additional information on the role of technology, school and community-level actors, and sustainability is found in the Sustainability Outcome section of this report. The ET used the proportion of head teachers who said they will be able to managed the technology in the future to measure IO5.3 in the project’s Log Frame.
0% 10% 20% 30% 40% 50% 60% 70% 80% 90%
Schoolheadmaster/director
PTA/SMC
Parents (non-PTA/non-SMC)
Community leaders
NGO (includingVarkey Foundation)
Private Sector
Local Government
Who will manage thetechnology in thefuture?
Who manages thetechnology now?
Who is responsiblefor fixing thetechnology if itbreaks?Who pays for theupkeep of thetechnology?

GEC-T Baseline Report – Making Ghanaian Girls Great Project 161
Table 54: Future technology stewardship
Intervention
Do you receive training to
operate the technology for the distance learning?
Will you be able to manage the technology in the future?
No 14% (10) 11% (8)
Yes 86% (60) 86% (60) Don’t Know 3% (2)
Vandalism and theft of technology is a reality; 10 percent of treatment schools reported a security incident in the first year of MGCubed. Project data relating to the community’s role in maintaining and guarding equipment was also considered when reporting on this indicator. VF reported that in total, security issues have emerged in seven of the 72 treatment schools. In one incident, the routine termly Asset Verification log stated that “the windows of the classrooms are falling off, exposing the school and MGCubed equipment to security risk. However, the windows are burglar proofed to prevent any entry through the windows.” In another school, the “thieves stole and cut electricity cable that connect the school to the national grid.” In Kadjebi district, one treatment school head teacher reported “the night security guard… failed to report to duty on time and created an opportunity for thieves to break into the classroom... [t]he thieves made away with the PC (system unit), Monitor, Webcam, Keyboard, Mouse and Woofer. Strict adherence to the change-over arrangement was breached. There is a clear plan on how and when to hand over to the next security guard on duty. Key among the rules include, making sure the windows and doors are properly locked, and that there is no trace of risk whatsoever before taking over duty. The security guards failed to comply with the arrangement and that led to the burglary.” A final report noted “schools went on vacation and schools that are outside the township turn to be quiet and isolated. The security guards failed to put in the expected level of attention usually required at such times and created a security gap situation which the thief took advantage of and stole the System Unit, the monitor, the webcam, a woofer and one of the smaller speakers.” All stolen items in these cases were subsequently replaced by the project. By the end of Term 2 (March 2018), 68 schools had security persons in place to help mitigate the risk of vandalism and theft of equipment.
5.5 SCHOOL-RELATED, GENDER-BASED VIOLENCE The MGCubed project does not work directly on school-related, gender-based violence issues.
5.6 ECONOMIC EMPOWERMENT The MGCubed project expects to introduce a cash grant component to its activities at the beginning of the academic year, in the second year of implementation. At midline and endline, the ET will incorporate measurement techniques and data in this section to comment upon the impact of cash grants to families, in particular on the transition outcome.
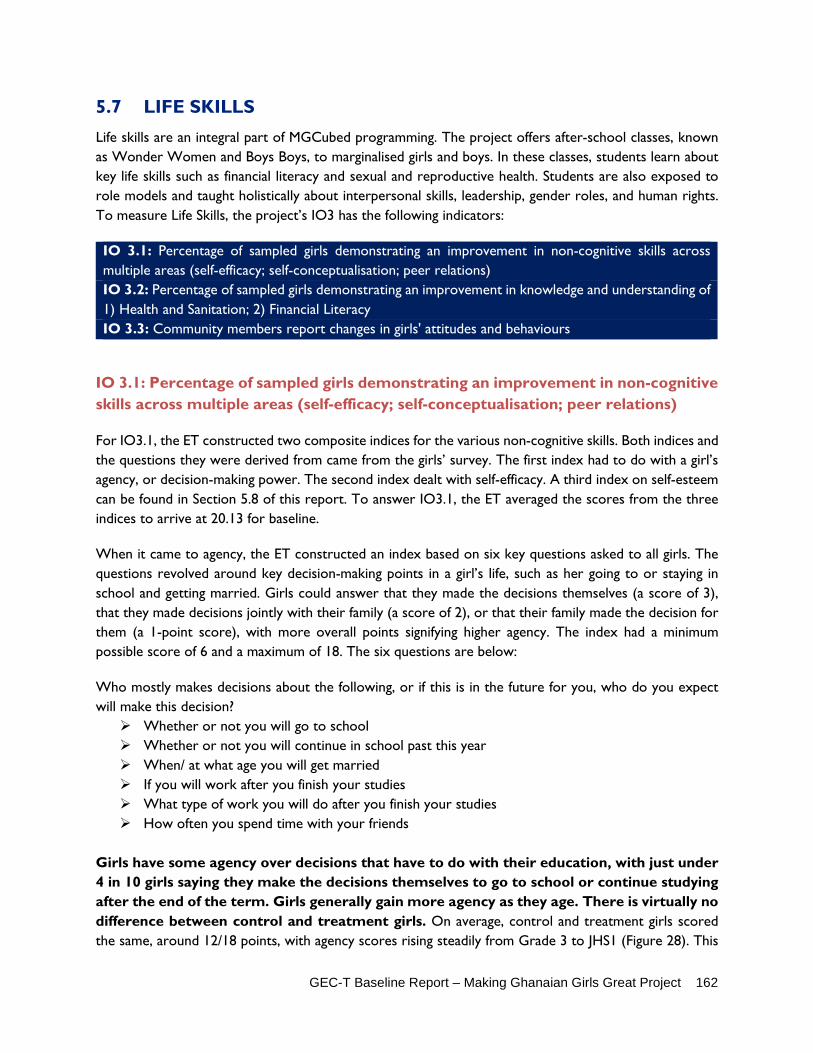
GEC-T Baseline Report – Making Ghanaian Girls Great Project 162
5.7 LIFE SKILLS Life skills are an integral part of MGCubed programming. The project offers after-school classes, known as Wonder Women and Boys Boys, to marginalised girls and boys. In these classes, students learn about key life skills such as financial literacy and sexual and reproductive health. Students are also exposed to role models and taught holistically about interpersonal skills, leadership, gender roles, and human rights. To measure Life Skills, the project’s IO3 has the following indicators:
IO 3.1: Percentage of sampled girls demonstrating an improvement in non-cognitive skills across multiple areas (self-efficacy; self-conceptualisation; peer relations) IO 3.2: Percentage of sampled girls demonstrating an improvement in knowledge and understanding of 1) Health and Sanitation; 2) Financial Literacy IO 3.3: Community members report changes in girls' attitudes and behaviours
IO 3.1: Percentage of sampled girls demonstrating an improvement in non-cognitive skills across multiple areas (self-efficacy; self-conceptualisation; peer relations)
For IO3.1, the ET constructed two composite indices for the various non-cognitive skills. Both indices and the questions they were derived from came from the girls’ survey. The first index had to do with a girl’s agency, or decision-making power. The second index dealt with self-efficacy. A third index on self-esteem can be found in Section 5.8 of this report. To answer IO3.1, the ET averaged the scores from the three indices to arrive at 20.13 for baseline.
When it came to agency, the ET constructed an index based on six key questions asked to all girls. The questions revolved around key decision-making points in a girl’s life, such as her going to or staying in school and getting married. Girls could answer that they made the decisions themselves (a score of 3), that they made decisions jointly with their family (a score of 2), or that their family made the decision for them (a 1-point score), with more overall points signifying higher agency. The index had a minimum possible score of 6 and a maximum of 18. The six questions are below:
Who mostly makes decisions about the following, or if this is in the future for you, who do you expect will make this decision? Whether or not you will go to school Whether or not you will continue in school past this year When/ at what age you will get married If you will work after you finish your studies What type of work you will do after you finish your studies How often you spend time with your friends
Girls have some agency over decisions that have to do with their education, with just under 4 in 10 girls saying they make the decisions themselves to go to school or continue studying after the end of the term. Girls generally gain more agency as they age. There is virtually no difference between control and treatment girls. On average, control and treatment girls scored the same, around 12/18 points, with agency scores rising steadily from Grade 3 to JHS1 (Figure 28). This
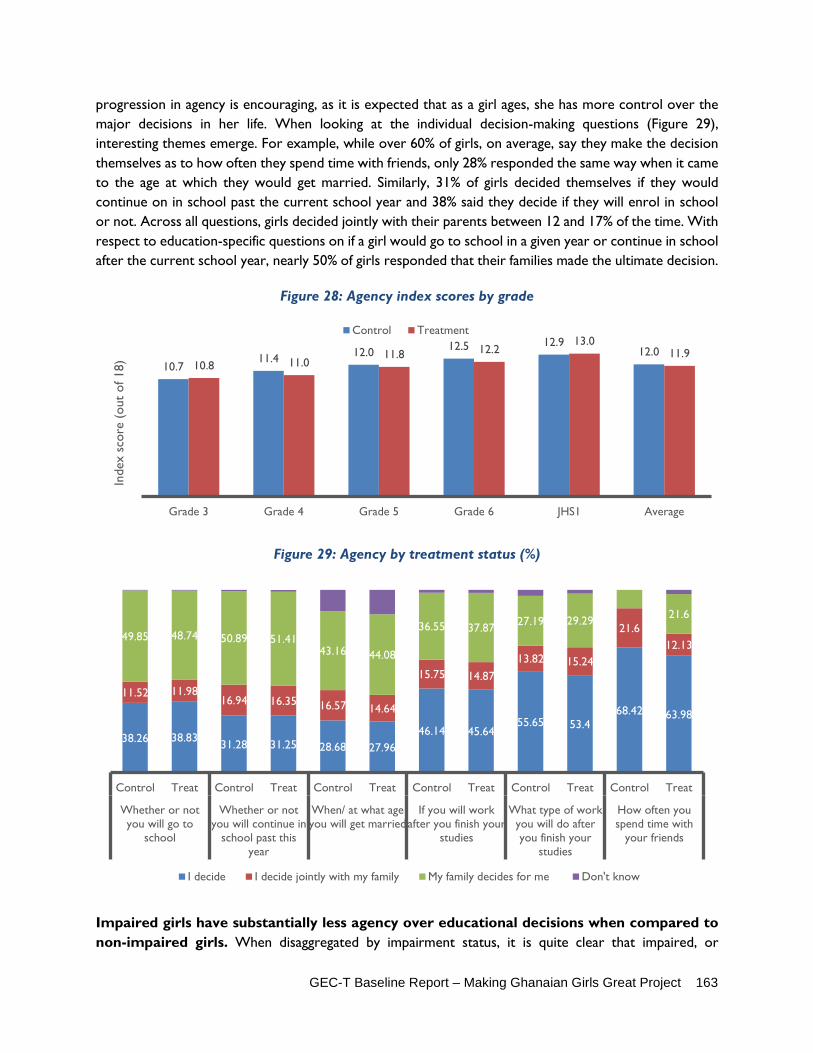
GEC-T Baseline Report – Making Ghanaian Girls Great Project 163
progression in agency is encouraging, as it is expected that as a girl ages, she has more control over the major decisions in her life. When looking at the individual decision-making questions (Figure 29), interesting themes emerge. For example, while over 60% of girls, on average, say they make the decision themselves as to how often they spend time with friends, only 28% responded the same way when it came to the age at which they would get married. Similarly, 31% of girls decided themselves if they would continue on in school past the current school year and 38% said they decide if they will enrol in school or not. Across all questions, girls decided jointly with their parents between 12 and 17% of the time. With respect to education-specific questions on if a girl would go to school in a given year or continue in school after the current school year, nearly 50% of girls responded that their families made the ultimate decision.
Figure 28: Agency index scores by grade
Figure 29: Agency by treatment status (%)
Impaired girls have substantially less agency over educational decisions when compared to non-impaired girls. When disaggregated by impairment status, it is quite clear that impaired, or
10.711.4 12.0 12.5 12.9
12.010.8 11.0
11.8 12.213.0
11.9
Grade 3 Grade 4 Grade 5 Grade 6 JHS1 Average
Inde
x sc
ore
(out
of 1
8)
Control Treatment
38.26 38.83 31.28 31.25 28.68 27.9646.14 45.64
55.65 53.468.42 63.98
11.52 11.9816.94 16.35 16.57 14.64
15.75 14.8713.82 15.24
21.612.13
49.85 48.74 50.89 51.4143.16 44.08
36.55 37.87 27.19 29.29 21.6
Control Treat Control Treat Control Treat Control Treat Control Treat Control Treat
Whether or notyou will go to
school
Whether or notyou will continue in
school past thisyear
When/ at what ageyou will get married
If you will workafter you finish your
studies
What type of workyou will do afteryou finish your
studies
How often youspend time with
your friends
I decide I decide jointly with my family My family decides for me Don't know
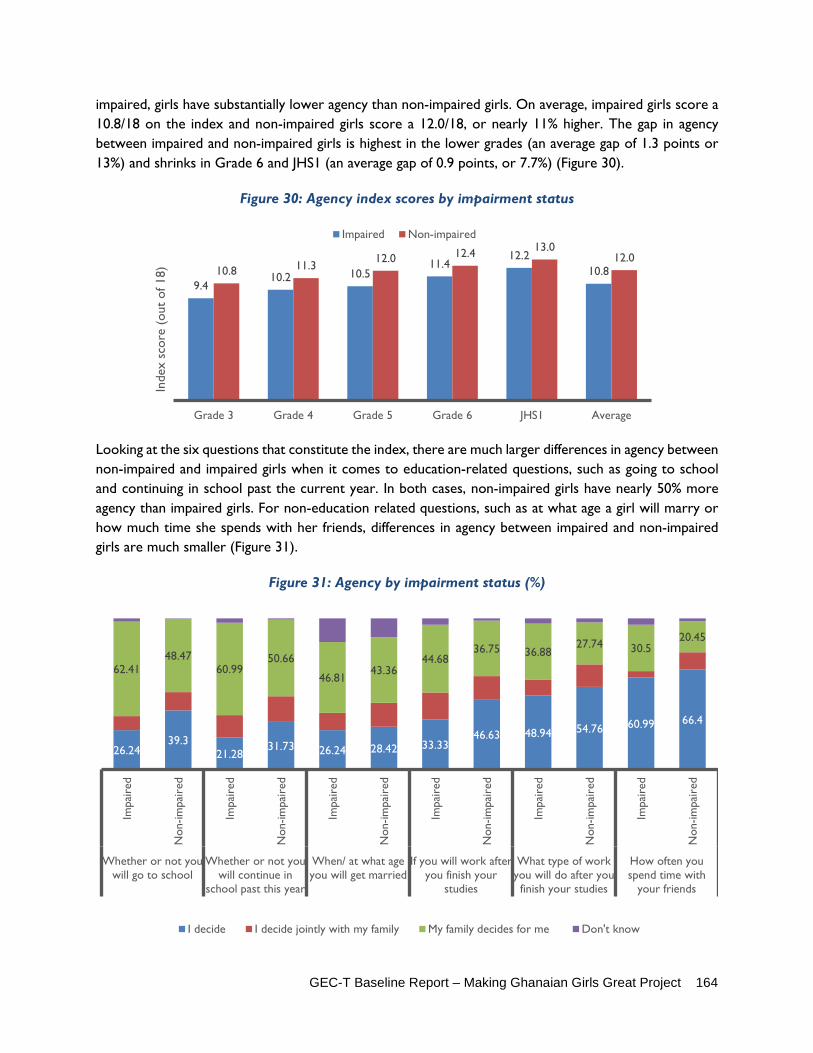
GEC-T Baseline Report – Making Ghanaian Girls Great Project 164
impaired, girls have substantially lower agency than non-impaired girls. On average, impaired girls score a 10.8/18 on the index and non-impaired girls score a 12.0/18, or nearly 11% higher. The gap in agency between impaired and non-impaired girls is highest in the lower grades (an average gap of 1.3 points or 13%) and shrinks in Grade 6 and JHS1 (an average gap of 0.9 points, or 7.7%) (Figure 30).
Figure 30: Agency index scores by impairment status
Looking at the six questions that constitute the index, there are much larger differences in agency between non-impaired and impaired girls when it comes to education-related questions, such as going to school and continuing in school past the current year. In both cases, non-impaired girls have nearly 50% more agency than impaired girls. For non-education related questions, such as at what age a girl will marry or how much time she spends with her friends, differences in agency between impaired and non-impaired girls are much smaller (Figure 31).
Figure 31: Agency by impairment status (%)
9.410.2 10.5
11.412.2
10.810.8 11.312.0 12.4 13.0
12.0
Grade 3 Grade 4 Grade 5 Grade 6 JHS1 Average
Inde
x sc
ore
(out
of 1
8)
Impaired Non-impaired
26.2439.3
21.2831.73 26.24 28.42 33.33
46.63 48.94 54.76 60.99 66.4
62.4148.47
60.9950.66
46.8143.36
44.6836.75 36.88
27.74 30.520.45
Impa
ired
Non
-impa
ired
Impa
ired
Non
-impa
ired
Impa
ired
Non
-impa
ired
Impa
ired
Non
-impa
ired
Impa
ired
Non
-impa
ired
Impa
ired
Non
-impa
ired
Whether or not youwill go to school
Whether or not youwill continue in
school past this year
When/ at what ageyou will get married
If you will work afteryou finish your
studies
What type of workyou will do after youfinish your studies
How often youspend time with
your friends
I decide I decide jointly with my family My family decides for me Don't know
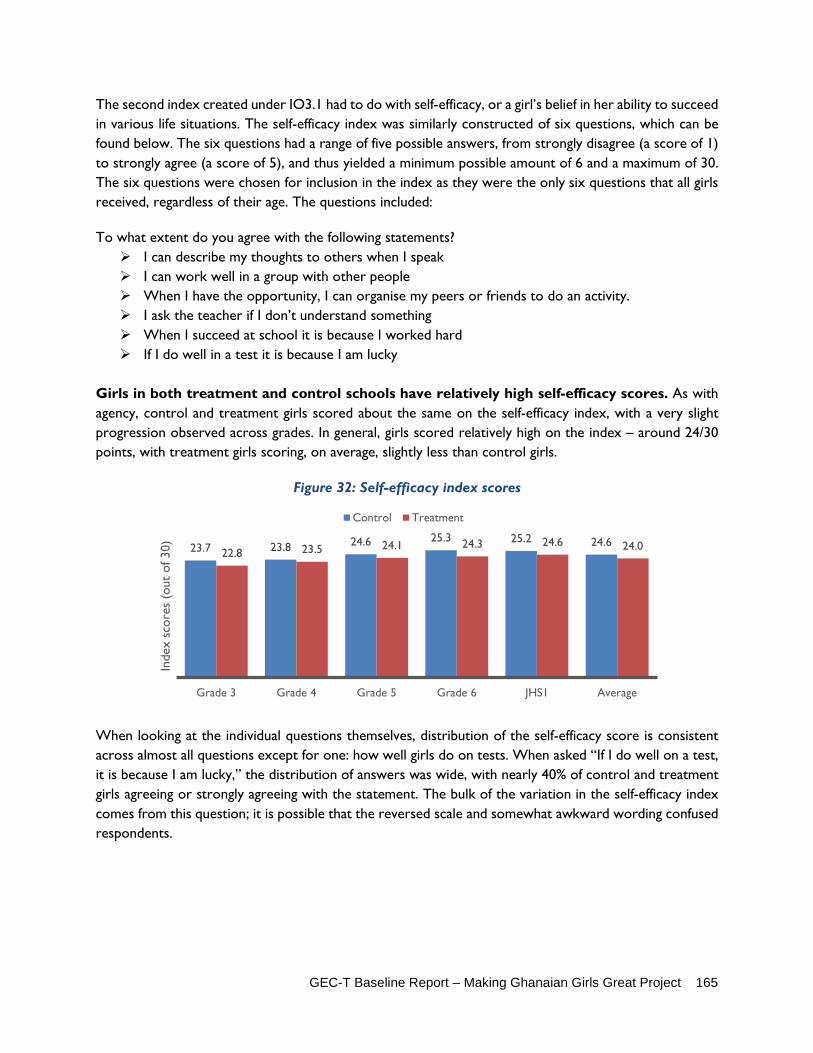
GEC-T Baseline Report – Making Ghanaian Girls Great Project 165
The second index created under IO3.1 had to do with self-efficacy, or a girl’s belief in her ability to succeed in various life situations. The self-efficacy index was similarly constructed of six questions, which can be found below. The six questions had a range of five possible answers, from strongly disagree (a score of 1) to strongly agree (a score of 5), and thus yielded a minimum possible amount of 6 and a maximum of 30. The six questions were chosen for inclusion in the index as they were the only six questions that all girls received, regardless of their age. The questions included:
To what extent do you agree with the following statements? I can describe my thoughts to others when I speak I can work well in a group with other people When I have the opportunity, I can organise my peers or friends to do an activity. I ask the teacher if I don’t understand something When I succeed at school it is because I worked hard If I do well in a test it is because I am lucky
Girls in both treatment and control schools have relatively high self-efficacy scores. As with agency, control and treatment girls scored about the same on the self-efficacy index, with a very slight progression observed across grades. In general, girls scored relatively high on the index – around 24/30 points, with treatment girls scoring, on average, slightly less than control girls.
Figure 32: Self-efficacy index scores
When looking at the individual questions themselves, distribution of the self-efficacy score is consistent across almost all questions except for one: how well girls do on tests. When asked “If I do well on a test, it is because I am lucky,” the distribution of answers was wide, with nearly 40% of control and treatment girls agreeing or strongly agreeing with the statement. The bulk of the variation in the self-efficacy index comes from this question; it is possible that the reversed scale and somewhat awkward wording confused respondents.
23.7 23.8 24.6 25.3 25.2 24.622.8 23.5 24.1 24.3 24.6 24.0
Grade 3 Grade 4 Grade 5 Grade 6 JHS1 Average
Inde
x sc
ores
(ou
t of
30)
Control Treatment

GEC-T Baseline Report – Making Ghanaian Girls Great Project 166
Figure 33: Self-efficacy by treatment status (%)
Impaired girls have slightly lower self-efficacy scores than their non-impaired counterparts. When disaggregated by impairment status, impaired girls have slightly lower self-efficacy scores than non-impaired girls on the composite index (23.6 and 24.3, respectively). However, this imbalance is not consistent across grades: while non-impaired girls have higher self-efficacy in most grades, this pattern is reversed in Grade 6 when impaired girls score 0.4 points higher, on average, on the composite index compared to non-impaired girls. The biggest difference in index scores between the two types of girls is in Grade 4 when non-impaired girls score nearly 2 whole points higher than impaired girls on the index (Figure 34).
Figure 34: Self-efficacy index scores by impairment status
Looking at the six questions that constitute the index for self-efficacy, non-impaired girls choose agree or strongly agree for self-efficacy questions at a higher rate than impaired girls. This is true across the board, except for the statement “When I have the opportunity, I can organise my peers or friends to do an
48.51 40.956.76 48.74 49.63 40.75
52.3 45.9360.48 53.77
20.06 21.01
35.8140.53
37.8244.08 33.88
39.7929.35 36.02
30.3934.62
16.94 19.3
Control Treat Control Treat Control Treat Control Treat Control Treat Control Treat
I can describe mythoughts to others
when I speak
I can work well in agroup with other
people
When I have theopportunity, I canorganize my peersor friends to do an
activity.
I ask the teacher if I don’t understand
something
When I succeed atschool it is because
I worked hard
If I do well in a testit is because I am
lucky
Strongly agree Agree Neither agree nor disagree Disagree Strongly disagree Don't know
22.8 21.923.7
25.1 24.5 23.623.2 23.8 24.4 24.7 24.9 24.3
Grade 3 Grade 4 Grade 5 Grade 6 JHS1 Average
Inde
x sx
ore
(out
of 3
0)
Impaired Non-impaired

GEC-T Baseline Report – Making Ghanaian Girls Great Project 167
activity,” where the two groups score about equal. When comparing only “strongly agree” answers, however, there is no consistent pattern among impaired or non-impaired girls; the questions are split as to which type of girl had a higher proportion of strongly agree answers (Figure 35).
Figure 35: Self-efficacy by impairment status (%)
IO 3.2: Percentage of sampled girls demonstrating an improvement in knowledge and understanding of 1) Health and Sanitation; 2) Financial Literacy
MGCubed after-school clubs, known as Wonder Women (for girls) and Boys Boys (for boys) – as well as mixed-gender clubs – involve a holistic curriculum that focuses, among many things, on practical life skills. Foremost in this area is financial literacy and sexual/reproductive health (SRH). The following section details findings on financial literacy and SRH as they pertain to MGCubed-specific curriculum. To answer IO 3.2, the ET took the average sums of “strongly agree” and “agree” answers for financial literacy (Figure 36), and then separately for SRH (Figure 39 and Figure 42) and reported them in the Log Frame.
There is wide variation in girls’ knowledge around earning money, and less than half of girls know how to earn money without it disrupting their school time. For financial literacy questions, there were no objective questions or tests given that measured financial literacy. Instead, all girls were asked about their knowledge around earning money, saving, and planning for the future. Results from Figure 36 show that control and treatment girls answered about the same. Over 60% agree or strongly agree that they are able to plan their own expenses. Differences in control and treatment groups begin to emerge specifically around earning money. Greater proportions of treatment girls agree or strongly agree that they know how to earn money (53% compared to 49%) and that they know how to earn money without it disrupting their school time (44% compared to 38%). Over 90% of all girls believe agree or strongly agree that going to school will help them earn money in the future.
39.01 45.2460.99 52.17 54.61
44.76 47.52 49.3 43.9757.95
18.44 20.65
33.3338.14
29.08 41.77 28.3737.31 24.11
33.12 34.75
32.28
13.48 18.25
Impa
ired
Non
-impa
ired
Impa
ired
Non
-impa
ired
Impa
ired
Non
-impa
ired
Impa
ired
Non
-impa
ired
Impa
ired
Non
-impa
ired
Impa
ired
Non
-impa
ired
I can describe mythoughts to others
when I speak
I can work well in agroup with other
people
When I have theopportunity, I can
organize my peers orfriends to do an
activity.
I ask the teacher if I don’t understand
something
When I succeed atschool it is because I
worked hard
If I do well in a test itis because I am lucky
Strongly agree Agree Neither agree nor disagree Disagree Strongly disagree Don't know
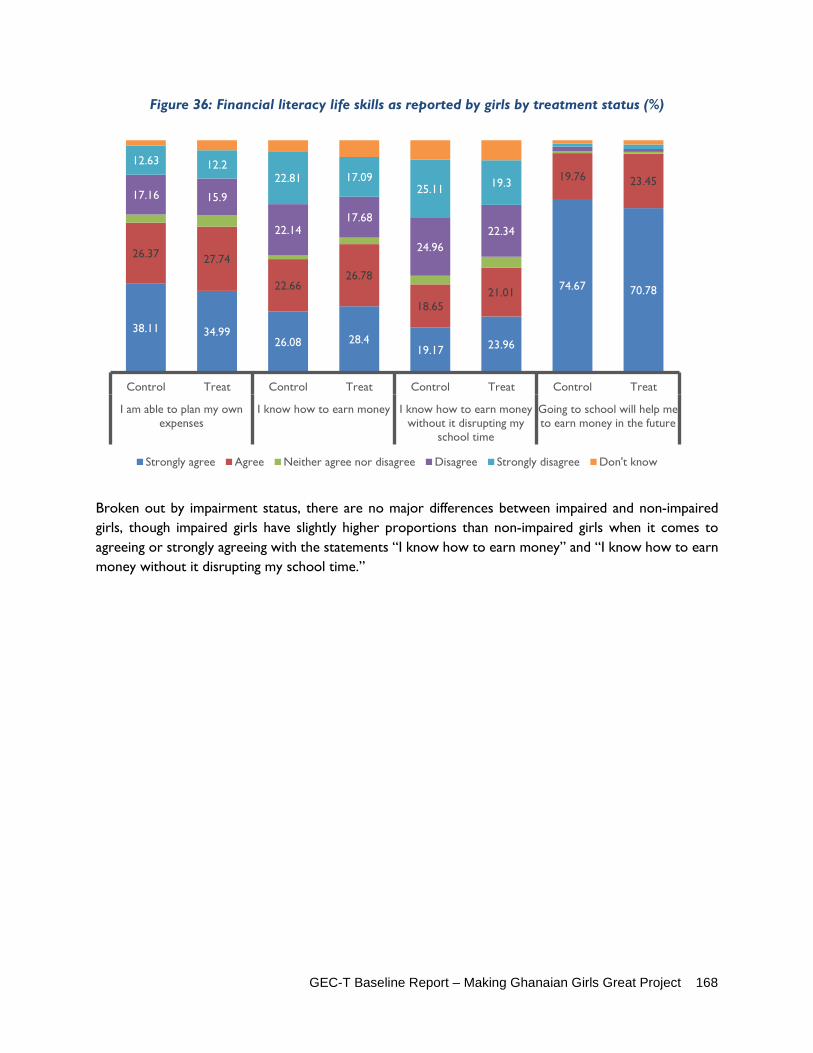
GEC-T Baseline Report – Making Ghanaian Girls Great Project 168
Figure 36: Financial literacy life skills as reported by girls by treatment status (%)
Broken out by impairment status, there are no major differences between impaired and non-impaired girls, though impaired girls have slightly higher proportions than non-impaired girls when it comes to agreeing or strongly agreeing with the statements “I know how to earn money” and “I know how to earn money without it disrupting my school time.”
38.11 34.9926.08 28.4
19.17 23.96
74.67 70.78
26.37 27.74
22.6626.78
18.6521.01
19.76 23.4517.16 15.9
22.1417.68
24.9622.34
12.63 12.222.81 17.09
25.11 19.3
Control Treat Control Treat Control Treat Control Treat
I am able to plan my ownexpenses
I know how to earn money I know how to earn moneywithout it disrupting my
school time
Going to school will help meto earn money in the future
Strongly agree Agree Neither agree nor disagree Disagree Strongly disagree Don't know

GEC-T Baseline Report – Making Ghanaian Girls Great Project 169
Figure 37: Financial literacy life skills as reported by girls, by impairment status
In Figure 38, financial literacy indicators are displayed by grade. The results show a clear pattern of more positive responses with regard to financial literacy skills and knowledge as a girl ages. This makes sense given a girl’s exposure to MGCubed courses as well as work and family business as she ages.
36.88 36.5129.08 27.26 24.82 21.36
75.89 72.74
26.24 27.2626.24 24.75 24.82
19.57
17.73 21.6414.18 16.46
21.2819.41 21.28
23.48
13.48 12.4 17.0220.17 19.86
22.56
Impaired Non-impaired Impaired Non-impaired Impaired Non-impaired Impaired Non-impaired
I am able to plan my ownexpenses
I know how to earn money I know how to earn moneywithout it disrupting my
school time
Going to school will help meto earn money in the future
Strongly agree Agree Neither agree nor disagree Disagree Strongly disagree Don't know

GEC-T Baseline Report – Making Ghanaian Girls Great Project 170
Figure 38: Financial literacy life skills as reported by girls, by grade (%)
With respect to SRH, all girls were asked questions about changes to their bodies as they grow and about how to access help should they have questions about their bodies. Given the sensitive nature of these questions all attempts were made to have female enumerators administer the entire girl’s survey to a girl, or at least have female enumerators administer this portion of the survey.
Girls are generally aware of key sexual and reproductive health issues and gain more knowledge as they age. Impaired girls have slightly lower knowledge than their counterparts. Figure 39 shows that over 80% of girls, regardless of control or treatment status, agree or strongly agree with the statement that “changed to my body is a natural process of growing up” and “If I have a question about my body, I know who to talk to.” When it came to impairment status, impaired and non-impaired girls answer similarly positive, though non-impaired girls have, on average, about 5 percentage points higher proportions of “agree” or “agree strongly” when compared to impaired girls.
0
25
50
75
100G
rade
3
Gra
de 4
Gra
de 5
Gra
de 6
JHS1
Gra
de 3
Gra
de 4
Gra
de 5
Gra
de 6
JHS1
Gra
de 3
Gra
de 4
Gra
de 5
Gra
de 6
JHS1
Gra
de 3
Gra
de 4
Gra
de 5
Gra
de 6
JHS1
I am able to plan my ownexpenses
I know how to earn money I know how to earn moneywithout it disrupting my
school time
Going to school will help meto earn money in the future
Strongly agree Agree Neither agree nor disagree Disagree Strongly disagree Don't know

GEC-T Baseline Report – Making Ghanaian Girls Great Project 171
Figure 39: Girls' views on sexual and reproductive health (%)
When asked about specific changes to their bodies, girls in control, treatment, impaired, and non-impaired groups had similar responses. Notably, however, impaired girls were less likely than the other groups to cite a change to their body and more likely to answer that they didn’t know. Among all types of changes to the body, breast development was mentioned the most frequently (55-68% of girls), followed by menstruation (40-41%), body hair (34-38%), and body odour (10-16%). Between 25-33% of girls could not mention a change to their bodies.
Figure 40: Changes in body development cited by girls by treatment status and impairment
Figure 41 shows that as a girl ages, her knowledge about certain changes to her body increases quickly. This is expected.
63 60.87 63.83 61.78 55.65 55.33 55.32 55.6
21.84 25.07 16.31 23.8327.79 29.14 24.11 28.66
Con
trol
Tre
at
Impa
ired
Non
-impa
ired
Con
trol
Tre
at
Impa
ired
Non
-impa
ired
Changes to my body is a natural process ofgrowing up
If I have a question about my body, I know whoto talk to.
Don't know
Strongly disagree
Disagree
Neither agree nor disagree
Agree
Strongly agree
27%
64%
36%
16%
41%
25%
68%
38%
11%
40%33%
55%
34%
10%
40%26%
67%
37%
13%
40%
Don't know Breast development Body hair Body odor Menstruation
Control Treat Impaired Non-impaired

GEC-T Baseline Report – Making Ghanaian Girls Great Project 172
Figure 41: Changes in body development cited by girls by grade
To gauge knowledge on fundamental SRH processes, the ET asked girls how frequently menstruation occurs. Thirty-seven percent of treatment girls, 41% of control girls, 39% of non-impaired, and 42% of impaired girls answered correctly (monthly), while 27-35% of girls in answered that they didn’t know. Of treatment, control, impaired, and non-impaired girls, impaired girls had the highest proportion of correct answers and the lowest proportion of “don’t know” (Figure 42). Between 9 and 12 percent of girls answered “never” which could indicate that they were underage and had not yet experienced menstruation. The question will be further clarified at midline to ensure that it is understood as a general question about menstruation and not related to a girl herself.
Figure 42: Girls' knowledge of menstruation by treatment status and impairment (%)
As expected, Figure 43 shows that over time, girls’ knowledge of the frequency of when menstruation occurs grows steadily, and the incorrect answers as well as “don’t knows” steadily decline.
0%
25%
50%
75%
100%
Breast development Body hair Body odor Menstruation Don't know
Grade 3 Grade 4 Grade 5 Grade 6 JHS1
41.01
36.98
41.84
38.54
27.64
34.47
26.95
31.41
Control
Treat
Non-impaired
Impaired
Every day Once per week Once per month Once per year Never Does not know what menstruation is Don't know

GEC-T Baseline Report – Making Ghanaian Girls Great Project 173
Figure 43: Girls' knowledge of menstruation by grade (%)
Girls and boys can cite specific learnings from after school clubs. According to 100% of boy and girl respondents in FGDs, Wonder Women and Boys Boys after-school programs have successfully educated them on important life skills. Many respondents shared that these programs have taught them about respect and obedience. One boy stated that “formerly, I didn’t respect my parents and I didn’t help elderly people, but now I do because I learned about respect in Boys Boys.” Respondents indicated that they have learned about puberty, development, and relationships, how to save money and spend money responsibly, how to maintain hygienic practices such as brushing teeth and bathing twice a day, and how to study better. As one girl shared, “initially, I rarely bathed and washed, but now I bathe and wash regularly.” Students said that they benefit by participating in Wonder Women and Boys Boys because they know many important skills that other students who are not in the programs do not know, and these skills will help them be successful in school and life. Negative points raised by two respondents were that the clubs are at an inconvenient time because many students have to work after school, and that it’s not fair that some students are not welcome to participate in the clubs.
Exposure to and learnings from SRH training is also cited by some parents. In qualitative interviews with parents, exposure to SRH training was mentioned. Two fathers indicated that they had participated in a training. They indicated that the trainings taught them about girls’ hygiene topics as well as the importance of treating boys and girls equally in regard to education. One of them said, “Since Wonder Women and Boys Boys came, we have been taught how to take the education of our children serious, and we are doing that.” The remaining male caregivers indicated that they had not heard of a training. Several mothers indicated that they had attended a training in which they learned about child abuse, gender sensitivity, reproductive health, and the importance of girls’ education (numbers to come).
IO 3.3: Community members report changes in girls' attitudes and behaviours
The ET did not collect data on this indicator at baseline and instead relied on internal reporting from the Varkey Foundation. VF internal monitoring included interviews with 19 parents, all of whom have girls who are part of the project. Findings suggest that in the eyes of community members the project is considered a continuation of the pilot phase; identified impacts are cumulative and do not refer only to the changes seen amongst girls over the first two terms of GEC-T. A number of parents talked in terms
0 25 50 75 100
Grade 3
Grade 4
Grade 5
Grade 6
JHS1
Every day Once per week Once per month Once per year Never Does not know what menstruation is Don't know Not applicable

GEC-T Baseline Report – Making Ghanaian Girls Great Project 174
of girls being more responsible members of the community, demonstrating increased levels of confidence, and supporting their parents in the house. One mother said, “now girls are respectful in the community, doing their responsibilities in the house perfectly as compared to that of the boys.” Another remarked “they are more responsible and take care of themselves. They are more obedient and eager to come to school. Teenage pregnancy has reduced.” Another parent noted “she now shares what she learns from school, she is more obedient, and her general attitude has changed” and “the girls have gained much confidence in the course of the year so much that, they are able to talk in public and so do the boys.” Further quotes included “the girls learnt to help their mothers and handle themselves well. They also learnt some skills. The boys stopped following gangs and bad friends” and “now both boys and girls are learning how to perform their house chores.”
A large number of quotes from parents includes references to increased performance of household chores. While there is also evidence that boys are doing this as well, the finding supports the idea that cultural norms of increased household duties as a student ages, in particular for girls, may still represent major transition and learning barriers. Given these findings, VF has stated that they will put more resources into better understanding this reality throughout the course of the project. At midline, the ET intends to add additional questions in quantitative and qualitative instruments to obtain a more accurate picture of the burden of household duties.
5.8 GIRLS’ SELF-ESTEEM While the MGCubed Log Frame does not track a specific indicator on self-esteem, the inclusion of self-esteem questions merits analysis in the baseline report. Further, the ET considers that the following data on self-esteem could be included as part of IO3.1 on non-cognitive life skills. Similar to agency and self-efficacy in IO3.1, the ET constructed a composite index to measure self-esteem. The index included six questions (Figure 44), whose answers ranged from strongly disagree (1) to strongly agree (5). This resulted in a composite score with a minimum of 6 and a maximum of 30. The questions were as follows:
I am able to do things as well as my friends I want to do well in school I get nervous when I have to read in front of others I get nervous when I have to do maths in front of others I feel confident answering questions in class I would like to continue studying/ attending school after this year
Girls have generally high self-esteem, and it stays constant as a girl ages. When it comes to self-esteem, the ET found very little differences between control and treatment girls: almost all girls had relatively high self-esteem (around 24/30) according to the composite index constructed. Interestingly, self-esteem levels stay almost constant from one grade to the next. These findings are contrary to those associated with agency and self-efficacy; as a girl ages, it may not necessarily mean that her self-esteem grows. The onset of puberty, increased household duties, and family/friend relationships may be enough to stymy the growth of self-esteem expected from maturation.

GEC-T Baseline Report – Making Ghanaian Girls Great Project 175
When analysing the six specific questions used to create the index, we find that girls are most confident around their general ability to do well in school and compared to their friends. Their self-esteem is much more varied when asking questions associated with individual actions, such as reading in from of others and answering questions in class.
Figure 44: Self-esteem index scores by grade and treatment status
Figure 45: Self-esteem answers by treatment status (%)
When disaggregated by impairment status, impaired girls have slightly lower self-esteem scores than non-impaired girls on the composite index (23.1 and 23.8, respectively). This imbalance is consistent across grades, except in Grades 5 and JHS1, where it is nearly identical. The largest differences in index scores between the two types of girls are 1.1 and 1.3 points, in Grades 4 and 6, respectively (Figure 46).
23.5 23.4 24.0 24.0 24.0 23.823.0 23.3 23.6 23.8 24.2 23.6
Grade 3 Grade 4 Grade 5 Grade 6 JHS1 Average
Inde
x sc
ores
(ou
t of
30)
Control Treatment
56.76 58.58
77.79 71.82
21.84 20.86 21.47 21.45
43.91 37.57
74.44 72.12
30.53 30.92
21.17 26.7
24.44 24.93 23.63 23.89
28.97 36.02
24.44 25.89
5.79 4.73
25.04 27.59 24.81 27.96
10.48 11.24
Control Treat Control Treat Control Treat Control Treat Control Treat Control Treat
I am able to do thingsas well as my friends
I want to do well inschool
I get nervous when Ihave to read in front
of others
I get nervous when Ihave to do maths in
front of others
I feel confidentanswering questions
in class
I would like tocontinue studying/
attending school afterthis year
Strongly agree Agree Neither agree nor disagree Disagree Strongly disagree Don't know

GEC-T Baseline Report – Making Ghanaian Girls Great Project 176
Figure 46: Self-esteem index scores by grade and impairment status
Looking at the six questions that constitute the index for self-esteem, impaired and non-impaired girls have about equal proportions of answers for most of the questions. The major differences are found for the statements “I feel confident answering questions in class” – where non-impaired girls agree or agree strongly at a rate of nearly 10% more than impaired girls – and “I get nervous when I have to read in front of others,” where impaired girls respond more positively than non-impaired girls, by about 6 percentage points (Figure 47).
Figure 47: Self-esteem responses by impairment status (%)
23.0 22.423.7 22.7
24.0 23.123.2 23.5 23.8 24.0 24.1 23.8
Grade 3 Grade 4 Grade 5 Grade 6 JHS1 Average
Inde
x sc
ores
(ou
t of
30)
Impaired Non-impaired
57.45 57.95
75.89 74.89
26.95 20.92 24.82 21.1235.46 40.81
75.89 73.14
29.08 30.77
21.99 23.91
24.8224.43 20.57 23.87
25.53
33.12
21.28 25.355.67 5.06
18.4426.86 24.82 26.5
12.0610.84
Impa
ired
Non
-impa
ired
Impa
ired
Non
-impa
ired
Impa
ired
Non
-impa
ired
Impa
ired
Non
-impa
ired
Impa
ired
Non
-impa
ired
Impa
ired
Non
-impa
ired
I am able to dothings as well as my
friends
I want to do well inschool
I get nervous whenI have to read infront of others
I get nervous whenI have to do mathsin front of others
I feel confidentanswering questions
in class
I would like tocontinue studying/attending schoolafter this year
Strongly agree Agree Neither agree nor disagree Disagree Strongly disagree Don't know

GEC-T Baseline Report – Making Ghanaian Girls Great Project 177
Project Checks on Intermediate Outcomes
The Project is confident that the External Evaluator has adequately reflected the data requirements for the Logframe. The Project provided internal data where necessary in order to cover all relevant angles for each indicator.

GEC-T Baseline Report – Making Ghanaian Girls Great Project 178
6. CONCLUSION & RECOMMENDATIONS
6.1 CONCLUSIONS In the Conclusions section, the report synthesizes findings presented in Sections 3-5. In addition to focusing directly on high level outcomes and intermediate outcomes, the ET contextualizes conclusions within the GESI standards of marginalization, taking care to highlight interesting sub-group conclusions, particularly around sex, age, and impairment.
The full sample is well-balanced at baseline. Looking at major covariates at the school, student, and household levels, the control and treatment samples are extremely well balanced with statistically significant differences in a few minor indicators. Control and treatment students score about the same in aggregate numeracy and reading and have extremely similar transition rates both within cohort and according to the community-level benchmarked data.
Sampled students of the cohort face a multitude of barriers; those who are poor, don’t speak the language of instruction well, or impaired are the most marginalised. Nearly 3 in 4 girls live in a household where it is difficult to afford to send children to school. Further, over 90% of girls’ language of instruction is different from their mother tongue and rarely spoken at home, and over 70% cannot speak the language of instruction well. When cross-tabbing marginalization characteristics and barriers, girls who do not speak the language of instruction well, girls who are poor, or impaired girls are most likely to face substantial barriers. A high household chore burden is the most common type of barrier faced by the most marginalised girls.
Generally, students do much better overall in maths than in reading. There is wide variation in performance across maths and reading subtasks. For maths, students have mastered number identification, quantity discrimination, and addition, but struggle substantially with missing numbers and subtraction. Less than 4% of boys or girls were able to reach a proficient learner status in missing numbers, a rate significantly lower than any other EGMA subtask. Further, boys and girls perform about half as well on subtraction than they do on addition. When it came to reading, students have mastered oral vocabulary (familiar words), and have a somewhat equal distribution of oral reading fluency scores across the sample. However, students score extremely low on letter sound identification, invented word subtasks, and reading comprehension.
Though students strongly progress in scores with age, girls and boys are well behind in their grade-level for literacy and numeracy, with most falling several grade levels below where they should be. Both boys and girls see strong progression in scores as they age from one grade to the next. While boys do slightly better in math than girls and girls do slightly better in reading than boys, both groups of students performed, on average, at a “no grade” or a P1 level per the FM grade-level cutoffs. These cutoffs, however, consider a student eligible if he or she achieves an 80 percent score for that grade’s materials—a feat which is exceedingly difficult.

GEC-T Baseline Report – Making Ghanaian Girls Great Project 179
Students with the lowest scores are those with disabilities, who are mothers, or who have a mother tongue different from the language of instruction. Among major marginalization characteristics and dimensions of poverty, these three characteristics are most associated with low scores in literacy and numeracy. Those with a mother tongue different from the LOI and those from certain district-level ethnic groups (such as Likpakpa and Guan) score by far the lowest in literacy, at nearly 40% below the average. Marginalised girls generally score better on maths than literacy, though maths scores of these three groups of girls range from 6-20% below the average.
Regression analysis validates several components of the MGCubed theory of change with respect to learning scores. By looking at the effect of various groups of characteristics and barriers on learning outcomes, the ET was able to identify those factors that had the strongest impact as well as the relative force of their impact. The most statistically significant findings on learning scores were:
Impairment: Among girls with any impairment, those with a cognitive impairment are significantly less likely to score well on learning tests.
Barriers: Feeling that girls and boys are treated differently at school, and low support to continue to study were both associated with lower learning scores.
Marginalization characteristics: Having an illiterate head of household or caregiver was strongly negatively associated with learning scores, and being a mother was marginally associated so.
Poverty: Girls who are poor are statistically significantly more likely to do worse on learning tests.
Non-cognitive skills: As a girl’s agency, self-esteem, and self-efficacy increase, so too do her learning scores – a statistically significant finding.
Teacher quality: When a teacher encourages students often, their scores are significantly higher. When a teacher uses a language other than the LOI to explain concepts, scores are lower.
Home environment: When a girl has the opportunity to read at home, she performs significantly better in literacy and numeracy, but not necessarily so if she simply has books at home.
School environment: Girls perform significantly well when girls and boys are allowed to play together at school, able to move around school easily, and have computers to use for study.
School management: Schools that have extracurricular activities, active PTAs, and are visited more often by Circuit Supervisors, are associated with girls having higher learning scores.
District-level factors: Though mostly unobservable, district-level factors play an important role in learning scores; girls from Ada West outperform all others in aggregate, while Kadjebi and Nkwanta South perform significantly worse than the others. Given their correlation with districts, language and ethnicity therefore have strong significant associations with learning scores.
Among observable factors, grade progression, non-cognitive skills, ethnicity, and school management are the strongest drivers of learning scores among girls. Grade progression, or aging over time and the maturation benefits that come with it, explains 37% of the variation among all observable characteristics that impact learning scores. This is followed by ethnicity (9%), the school environment (8%), and non-cognitive aspects (self-esteem, self-efficacy, and agency), which explain 7%. District-level unobservable factors explain approximately 26% of the variation in learning scores.

GEC-T Baseline Report – Making Ghanaian Girls Great Project 180
Among observable factors, impairment, school environment, and school management are the strongest drivers of transition of girls in the cohort. Four in five girls in the cohort and in communities successfully transition in school each year, though persistent barriers remain. According to benchmark figures which give the most accurate representation of transition, girls in communities transition at increasing rates until a peak of 92% transition at age 14, at which point transition begins to decline (transition of cohort girls, which is a biased figure given that 100% of girls are enrolled at baseline, show a consistent rate of about 85% across all ages). Unsuccessful transition is largely due to remaining out of school (9.1%) and repeating a grade (5.9%). Qualitative events elucidated the major barriers to transition which were, first and foremost, poverty followed by household duties. Pregnancy and early marriage were two themes that came up throughout qualitative and quantitative data collection and represent a not insignificant barrier to transition as well. Of slightly lower importance, distance to school and impairment were cited as barriers to transition. Regression analysis shows that cognitive impairment, a high chore burden, and increased agency are all associated with lower transition, while active PTAs are associated with higher transition. Girls in Kadjebi, Ningo Prampram, and Kwanta South all transition at significantly lower rates than girls in other districts.
Given the baseline status of the program, the MGCubed project scores a 1.0/4.0 at the community, school, and system levels on the Sustainability Scorecard. Though many of the baseline levels of the sustainability indicators are relatively high, the MGCubed project has the potential to increase these levels and achieve sustainability in many areas. Qualitative and quantitative data analysis shows high levels of knowledge retention among beneficiaries of MGCubed trainings, particularly GES officials and teachers. While support for girls’ education in the community remains very high, girls’ agency may not matter as much as previously though and support to attend school remains relatively low. Thirty-eight of MGCubed schools had a transition plan in place, though the exact nature of these plans was informal and highly variable across schools. Head teachers, as opposed to PTA/SMC and parents, are overwhelmingly responsible for developing and executing transition plans as well as managing the technology. Qualitative and quantitative data suggests technology breakdowns are not infrequent and security-related issues were reported among 10% of treatment schools. Finally, though GES officials have strongly positive views of MGCubed, there are mixed feelings about the sustainability of policy and programmatic gains after the program ends.
Attendance taking processes and attendance itself is generally good, but there is important variation among gender and type of class. One in every eight afterschool remedial MGCubed classes was over-attended. Teachers overwhelmingly took accurate and consistent attendance on a day to day basis, however, attendance rosters and headcounts were consistently 20% lower than official enrollment numbers per school. Girls had better attendance than boys across treatment and control, grade, and grade-level or MGCubed afterschool remedial classes. Most notably, 13% of MGCubed afterschool remedial classes saw over-attendance: that is, more students were counted in a headcount than officially marked as present or registered in an attendance record.
According to caregivers, control schools and schools with male head teachers have better management quality than treatment and female-headed schools; however, the latter have substantially better indicators around community involvement in school. When looking at management quality of schools according to caregivers of students attending those schools, control

GEC-T Baseline Report – Making Ghanaian Girls Great Project 181
schools are more likely to have “Outstanding” management than treatment schools. Schools with male head teachers are more likely to have “Outstanding” management than schools with female head teachers. Treatment schools are more likely to have a PTA or SMC than control schools, though control schools’ PTAs and SMCs meet slightly more often. PTAs and SMCs are substantially more likely to meet in female-headed schools compared to those with male head teachers.
Use of the cane among school type, sex, and grade varied substantially: it was twice as likely to be used in control schools compared to treatment schools. The cane was used in 12.5% of treatment schools, but nearly double that rate for control schools. Overall, girls are caned less than boys and significantly less in treatment schools compared to control schools. Impaired girls report being physically punished in the past week at double the rate of their non-impaired counterparts. Qualitative data from students suggests that use of the cane is frequent and considered acceptable.
Most parents and students characterize teaching quality as high; control schools performed better at baseline and male teachers were more likely to have “outstanding” quality teaching. At baseline, classroom observation showed that teachers in control schools had higher teaching quality scores than teachers in treatment schools. The largest differences in teaching quality where control outperformed treatment schools were in a teacher making eye contact with students, successfully managing unruly behaviour, including boys and girls equally in class, using different teaching resources and strategies, possessing lesson notes, and appearing to feel comfortable while teaching. While on average female teachers had higher teaching quality scores, male teachers were more likely to be “Outstanding.” Girls overwhelmingly feel welcome in the classroom by their teacher, though nearly a quarter feel that teachers treat girls and boys differently in class – an indicator that had statistically significant associations with lower learning scores in a regression model. Qualitatively, teachers comment strongly that they use lessons learned from GEC-T trainings though external environmental factors still pose large barriers to teaching quality. When observing non-MGCubed classes, MGCubed-trained teachers utilised certain specific MGCubed teaching techniques, particularly Ways of Work and plenaries.
Among treatment schools, non-facilitators have higher teaching quality indicators than facilitators. At baseline, facilitators in treatment schools had lower teaching quality scores than non-facilitators in the same schools. The largest differences in teaching quality where non-facilitators outperformed facilitators were very similar to where control school teachers outperformed treatment schools teachers: a teacher making eye contact with students, successfully managing unruly behaviour, including boys and girls equally in class, and possessing lesson notes. However, facilitators also performed worse when it came to reading well in front of the class, increasing student participation, and being understandable by the students. It is possible that these scores are biased, given that a facilitator was probably more likely to be facilitating an MGCubed distance-learning session when observed and may not have performed the full and normal range of tasks a teacher typically performs.
Community attitudes towards girls’ education are very strong; nevertheless, qualitative data suggest barriers such as pregnancy and household duties remain high. More than 7 in 10 caregivers would like their girls to achieve a university degree or higher and also believe it is worth investing in a girl’s education even when funds are limited. High proportions of caregivers reported that they considered girls’ opinions in education-related decisions and over 95% feel that housework does not
GEC-T Baseline Report – Making Ghanaian Girls Great Project 182
affect a girl’s schoolwork. Qualitative data consistently reported pregnancy, household duties, and financial constraints as major barriers.
When it comes to life skills, there was wide variation among girls’ financial literacy and SRH knowledge; however, this improves significantly as a girl ages. While a majority of girls say they are able to plan their expenses, only half know how to earn money, and less than half know how to do so without it interrupting their school work. With SRH, girls have generally high knowledge about changes to their body and know who they can talk to if they have questions. SRH findings are all slightly lower for impaired girls compared to their non-impaired counterparts.
In the area of non-cognitive abilities, girls have substantial agency over the educational decisions in their lives, though much less so for impaired girls. All girls have relatively high self-efficacy and self-esteem. Half of girls said they are involved in the decision as to whether to go to school or continue studying, and this increases significantly when it comes to what they will do with their lives after they finish their studies. Impaired girls have 50% less agency than their non-impaired counterparts when it comes to education-related decisions. Regression analysis, however, finds that agency may not necessarily have a positive effect on transition, which may indicate that external societal, cultural, and financial pressures and barriers still remain extremely high for girls when transitioning. Girls across the board have high self-efficacy and self-esteem, though it is slightly lower for impaired girls. While self-efficacy and agency slightly rise as a girl ages, self-esteem stays constant no matter the age.
Conclusions on key GESI disaggregation
Gender: By definition, GEC-T and the MGCubed project focus heavily on girls. Yet, given that the intervention is at the classroom level, and classes are not gender-segregated, boys are very much direct beneficiaries of many of the MGCubed activities. Boys and girls benefit from grade-level and MGCubed courses as well as after school clubs and remedial lessons. Further, teachers, parents, school directors, GES officials, and community members benefit from trainings and workshops held by MGCubed, which focus for the most part on supporting girls in their educational journeys. Findings in the report show that the project is doing well to address gender issues and barriers, evidenced by learning data that show relatively similar results between boys and girls, and supplemented by qualitative data that suggests girls are being considered more in the community when it comes to education than they have been in the past. In the baseline evaluation, the ET took care to disaggregate findings wherever possible, appropriate, and relevant, by gender. This included among boys and girls, female and male caregivers, female and male teachers, and female and male school directors, as well as in qualitative events. These analyses were carried out in all sections including the outcomes and intermediate outcomes. Key findings are presented below.
• Differential treatment of girls and boys at school matters. In regression analyses, if a girl stated that she felt girls and boys were treated differently at school by teachers, it was associated significantly with lower learning scores. The way in which a teacher utlilises gender-equitable techniques may matter for a girl’s learning levels.
• Female SRH issues are being well communicated. Large proportions of girls are aware of changes to their bodies, know who to speak to when they have questions, and have increased knowledge of SRH issues as they age. Qualitatively, girls and parents, including fathers, can cite increased learnings about SRH from MGCubed trainings. Further, girls rarely cite menstruation as

GEC-T Baseline Report – Making Ghanaian Girls Great Project 183
a reason for not attending school which could suggest that shame over their bodies does not play a significant barrier to education. This appears to be a GESI transformative area with high potential for sustainability.
• Pregnancy remains a barrier in the community. While quantitative data shows only small numbers related to the role of pregnancy, qualitative data makes clear that it plays a significant and persistent barrier in the community. Mothers and married girls may not be accurately reflected in the quantitative data as they are less likely to be in school. For those mothers in school, child rearing duties will make an obvious impact on their ability to do well in their learning. Poverty appears to be a large driver of pregnancy in the community.
• Male teachers are associated with better quality teaching. This finding does not necessarily mean that men are better teachers or directors, but may indicate that female teachers are attending trainings less frequently or may not have as high access to the materials they need in class compared to their male counterparts. The fact that 70% of school directors are male may also indicate imbalanced gender norms in a community.
• Caregivers report that male-headed schools have higher management quality; however, female-headed schools have better community involvement indicators. When it comes to performance of the head teacher, overall management of the school, knowledge of a head teacher’s name, and having received reports on a child from the school in the past year, caregivers all report higher scores for male-headed schools. However, the data shows that female-run schools are substantially more likely to have PTAs and SMCS, and PTAs and SMCs that meet more often.
• The cane is used more on boys than on girls; cane use on girls is astoundingly low in MGCubed schools. While the cane was used more on boys than girls generally (6.7% versus 8.1%), among girls, the cane was used in only 2.1% of MGCubed schools and 11.3% of control schools. This could demonstrate a GESI transformative milestone for MGCubed, at least in relation to girls and physical punishment.
• The community cites lessons learned from MGCubed activities. Qualitative data demonstrated that beneficiaries of MGCubed activities across the board can cite learnings and have retained knowledge, especially as it pertains to girls’ education. Parents and GES officials spoke highly about the project and its focus on girls. At baseline, sustainability of these gains is uncertain and will be more informed in subsequent data collection periods.
Impairment: Impaired girls in society are typically hard to target as they oftentimes are out of public sight, feel shame and stay home, or have disabilities that are not easily diagnosed due to cultural or other issues. Therefore, targeting these girls is at the same time difficult and extremely important. Analysis of sampled girls of the baseline evaluation shows that 6.85% of the sample is considered impaired, or impaired (7.5% of treatment and 6.2% of control). The vast majority of these girls fall under “cognitive impairment,” which in many cultures may not be considered impaired, as it is difficult to physically detect. Even with such small sample sizes, the ET was able to disaggregate the majority of its analyses in the outcome and intermediate outcome sections to better clarify the situation of impaired girls with respect to their learning, transition, and other education-related areas. Key findings are presented below.
• Impaired girls face more barriers on average than their non-impaired counterparts. In a cross-tab analysis of marginalization and barriers, girls with a impairment were found to have disproportionately high exposure to barriers when compared to the average. They had the highest percentage of having high chore burdens, not receiving support to stay in school, and attending

GEC-T Baseline Report – Making Ghanaian Girls Great Project 184
school less than half the time. Second only to girls who were also mothers, impaired girls also had the highest percentage of feeling unwelcomed by teachers in their classroom. Limited qualitative data demonstrated that some impaired girls feel shame in attending school.
• Cognitive impairment, in particular, has strong negative associations with learning and transition in regression models. Of all types of impairment, girls with cognitive disabilities had significantly lower learning scores and transition rates than other impaired girls and other girls in general. When looking at the decomposition model, among all observable factors that affect transition, impairment was one of the strongest.
• Classroom management disfavors impaired girls. In the classroom, an impaired girl reported that she was twice as likely to be caned compared to a non-impaired girl in the past week. Impaired girls also agree strongly with the statement “my teacher makes me feel welcome” at a rate 10 percentage points lower than their non-impaired counterparts.
• Impaired girls have lower agency, especially around education-related decisions. In particular, when it comes to deciding if they will go to school and if they will continue with their studies after the current school year, girls with impairment have 50% less agency than non-impaired girls. They also have slightly less self-efficacy, though self-esteem scores are similar.
Age: When looking at age related conclusions, the ET has mostly used grade as a proxy, particularly given that the project focuses heavily on grade-standardized activities. Further, the fact that girls are marginalised lends itself to a wide array of age disbursement among grades given late and repeat enrollment. To the extent possible, the ET disaggregated all outcome, intermediate outcome, and other areas by grade to see interesting results as girls progress in age (the assumption being that higher grades have older girls). The results are displayed below.
• There is a strong learning score progression with age. As expected, as girls and boys get older, their learning scores improve significantly.
• Transition peaks at age 14. Successful transition in school – or progressing from one grade to the next or re-enrolling—peaks at a high of 92% at age 14, but then steadily declines (according to transition benchmark figures collected in treatment and control communities). Given that 14 is the average age for the critical transition point between primary and JHS, this indicates that transition point remains a critical time in a girl’s educational journey. Intercepting girls at this point in time will be critical.
• The cane is used much more in P4-P5 and then again in JHS1. Use of the cane among grades is highly variable but may follow a pattern of puberty. Children may be more unruly around the 9-11 year old age group, more docile as they hit puberty, and then more rebellious as they mature and enter JHS.
• Knowledge of life skills improves with age. Over time, as girls age, their financial literacy and SRH knowledge increases significantly. This could because they gain more exposure to those issues as they become more involved with a family business, for example, or go through puberty. Further, they may be exposed to certain MGCubed programming depending on their age.
• As they age, girls have stronger agency and self-efficacy. Girls take a larger role in the decision-making processes in their lives as they get older, though it must be noted that no relationship between agency and transition was found in this report. Over time, there is no change to a girl’s self-esteem; it stays constant from P3-JHS1.

GEC-T Baseline Report – Making Ghanaian Girls Great Project 185
6.2 RECOMMENDATIONS
It is not always best practice to include recommendations in baseline reports. This is mostly due to the fact that the project has not yet begun and there is no implementation data with which to do comparisons and draw conclusions about impact. Though GEC-T is a follow-on to programming begun in 2014, the baseline data presented in this report is treated as if the project had not yet begun. Hypotheses and reflections drawn from quantitative data are just that; theories and conjectures based on what the data tells the reader before enough time has passed to examine potential impact. However, done correctly, a rigorous regression analysis, combined with rich and nuanced qualitative data paints a picture in which the authors can begin to get a sense for the baseline situation and how a project might better structure its programming just as it begins implementation. The recommendations laid out in this section are softer and more generalized in nature than what will be found at midline and endline, though they are action-oriented, targeted at specific actors, and ultimately rooted in evidence set forth in this report.
Table 55: Recommendations on design and sustainability
Recommendation Evidence Targeted Actor
Carry out a study to identify children with cognitive disabilities in treatment catchment areas. Consider targeting these children specifically with specialized lessons.
Cognitive impairment is both the largest type of impairment found in the sample and the most insidious: it is one of the only factors in regression analysis that significantly negatively affects both learning and transition. Given its non-physical appearance, it may be difficult to detect in children.
Varkey Foundation
Include curriculum in community trainings on gender equitable roles and responsibilities of boys and girls, particularly around household duties.
Across the board, all marginalised girls experienced a high burden of household chores. While the regression model demonstrates no significant effect on learning scores, it does have a significant negative effect on transition. The ET hypothesizes that the need to take care of the household after P6 may be a major reason for dropping out of school for many girls. Qualitative data suggests that girls carry the lion share of household duties.
Varkey Foundation
Consider targeted, remedial classes for girls who are mothers.
While mothers did not constitute a major part of the sample, qualitative data suggests that pregnancy and the resulting dropout from school is a major problem in communities. Girl-mothers exist and may not be adequately captured in the sample. Mothers have unique responsibilities that other girls do not; targeting them with special classes at times that that they can attend (perhaps with their babies) may help them to stay on track educationally with respect to their non-mother peers.
Varkey Foundation
Hold joint workshops with P6 girls and their families throughout the P6 school year.
After P6, girls’ transition rates drop precipitously, which, the ET hypothesizes, could be due to cultural norms around helping in the household. Involving parents and
Varkey Foundation

GEC-T Baseline Report – Making Ghanaian Girls Great Project 186
their girl children in conversation together to better understand the barriers to entering and doing well in JHS1 will be worthwhile and inform future programming at this critical juncture.
Ensure male and female teachers have equal access to VF training. Continue to focus heavily on the importance of treating girls and boys equally in the classroom.
Male teachers teach better than female teachers, a sign that female teachers are not benefitting as much from the trainings. This could be due to higher absence, or perhaps a lack of access to materials compared to their male counterparts. Investigating these discrepancies will be important to understand the difference in teaching scores. Further, regression analysis shows that when girls feel there is differential treatment between the sexes by a teacher at school, their learning scores are significantly worse.
Varkey Foundation
Include technology performance-related indicators in the sustainability plan and in output indicators.
Quantitative and qualitative data both demonstrate that the equipment can and does break down from time to time, with 28% of head teachers reporting that at least one piece of equipment does not work most of the time. Average time to fix a broken piece of equipment is 6.7 days, with a median of 3 days. Days lost to broken equipment could be significant for students’ learning. It is important that VF include indicators around the performance of technology to better understand and prepare for what will happen once the project ends.
Varkey Foundation
Involve local community actors (PTA/SMC, parents, GES) in management of the technology packages.
School directors overwhelmingly say that they manage the technology and will manage it in the future. Involving PTA/SMC, parents, and/or other community members may help to create ownership of the technology packages, reducing the risk of vandalism and increasing the knowhow in terms of operation and maintenance. This will be especially important for sustainability after the program ends.
Varkey Foundation; GES
Encourage parents to join PTAs and support PTAs with resources as necessary. At PTA meetings, push the idea of dedicated reading time at home between parents and their children.
Regression analysis clearly shows that when a parent is involved with a PTA and when PTAs meet more frequently, transition and learning scores are significantly higher. Given the national focus on PTAs, GES could be involved in providing funds and marketing for more PTA involvement. Regression analysis showed that when a child reads at home, she has significantly higher learning scores.
Varkey Foundation; GES
Scale up WW/BB clubs to include as many students in the community. Encourage students themselves to create their own offshoots of the clubs with dedicated teacher mentors.
Regression findings show statistically significant positive associations between higher levels of self-esteem and self-efficacy and learning scores. WW/BB clubs provide students with an outlet where they can discuss their issues, learn about their rights, and be exposed to important life lessons and mentors. While participation in WW/BB and higher levels of non-cognitive ability has
Varkey Foundation
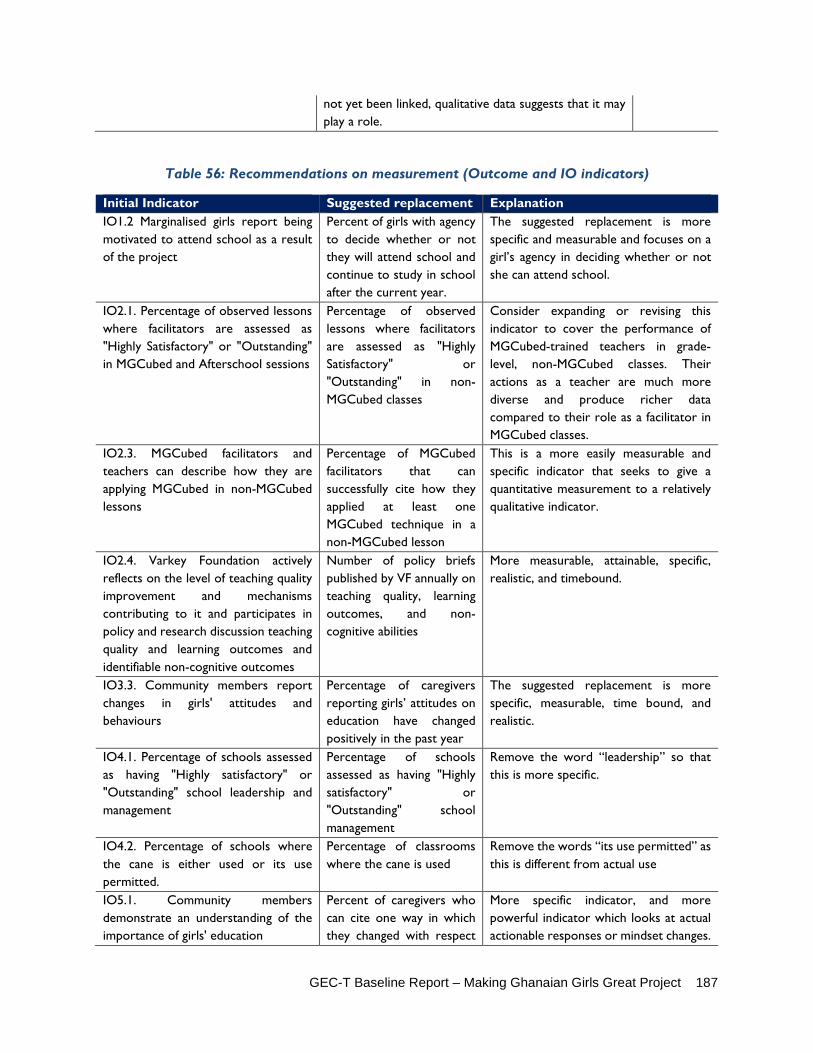
GEC-T Baseline Report – Making Ghanaian Girls Great Project 187
not yet been linked, qualitative data suggests that it may play a role.
Table 56: Recommendations on measurement (Outcome and IO indicators)
Initial Indicator Suggested replacement Explanation IO1.2 Marginalised girls report being motivated to attend school as a result of the project
Percent of girls with agency to decide whether or not they will attend school and continue to study in school after the current year.
The suggested replacement is more specific and measurable and focuses on a girl’s agency in deciding whether or not she can attend school.
IO2.1. Percentage of observed lessons where facilitators are assessed as "Highly Satisfactory" or "Outstanding" in MGCubed and Afterschool sessions
Percentage of observed lessons where facilitators are assessed as "Highly Satisfactory" or "Outstanding" in non-MGCubed classes
Consider expanding or revising this indicator to cover the performance of MGCubed-trained teachers in grade-level, non-MGCubed classes. Their actions as a teacher are much more diverse and produce richer data compared to their role as a facilitator in MGCubed classes.
IO2.3. MGCubed facilitators and teachers can describe how they are applying MGCubed in non-MGCubed lessons
Percentage of MGCubed facilitators that can successfully cite how they applied at least one MGCubed technique in a non-MGCubed lesson
This is a more easily measurable and specific indicator that seeks to give a quantitative measurement to a relatively qualitative indicator.
IO2.4. Varkey Foundation actively reflects on the level of teaching quality improvement and mechanisms contributing to it and participates in policy and research discussion teaching quality and learning outcomes and identifiable non-cognitive outcomes
Number of policy briefs published by VF annually on teaching quality, learning outcomes, and non-cognitive abilities
More measurable, attainable, specific, realistic, and timebound.
IO3.3. Community members report changes in girls' attitudes and behaviours
Percentage of caregivers reporting girls’ attitudes on education have changed positively in the past year
The suggested replacement is more specific, measurable, time bound, and realistic.
IO4.1. Percentage of schools assessed as having "Highly satisfactory" or "Outstanding" school leadership and management
Percentage of schools assessed as having "Highly satisfactory" or "Outstanding" school management
Remove the word “leadership” so that this is more specific.
IO4.2. Percentage of schools where the cane is either used or its use permitted.
Percentage of classrooms where the cane is used
Remove the words “its use permitted” as this is different from actual use
IO5.1. Community members demonstrate an understanding of the importance of girls' education
Percent of caregivers who can cite one way in which they changed with respect
More specific indicator, and more powerful indicator which looks at actual actionable responses or mindset changes.
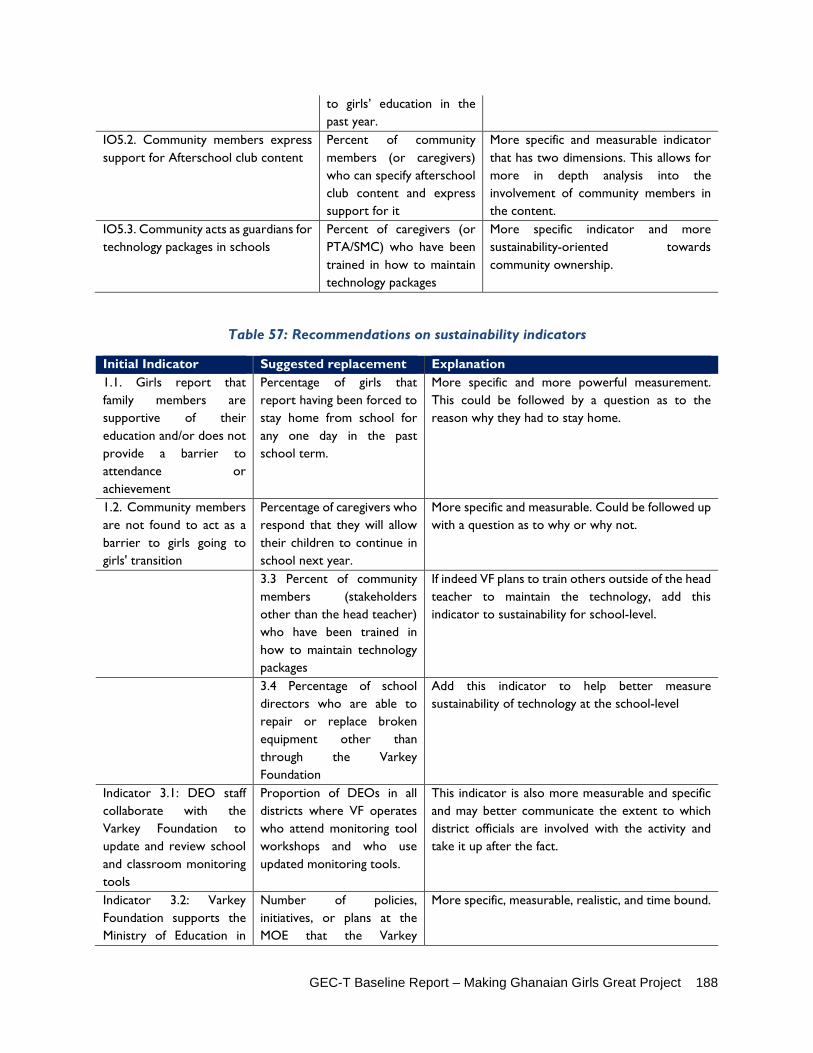
GEC-T Baseline Report – Making Ghanaian Girls Great Project 188
to girls’ education in the past year.
IO5.2. Community members express support for Afterschool club content
Percent of community members (or caregivers) who can specify afterschool club content and express support for it
More specific and measurable indicator that has two dimensions. This allows for more in depth analysis into the involvement of community members in the content.
IO5.3. Community acts as guardians for technology packages in schools
Percent of caregivers (or PTA/SMC) who have been trained in how to maintain technology packages
More specific indicator and more sustainability-oriented towards community ownership.
Table 57: Recommendations on sustainability indicators
Initial Indicator Suggested replacement Explanation 1.1. Girls report that family members are supportive of their education and/or does not provide a barrier to attendance or achievement
Percentage of girls that report having been forced to stay home from school for any one day in the past school term.
More specific and more powerful measurement. This could be followed by a question as to the reason why they had to stay home.
1.2. Community members are not found to act as a barrier to girls going to girls' transition
Percentage of caregivers who respond that they will allow their children to continue in school next year.
More specific and measurable. Could be followed up with a question as to why or why not.
3.3 Percent of community members (stakeholders other than the head teacher) who have been trained in how to maintain technology packages
If indeed VF plans to train others outside of the head teacher to maintain the technology, add this indicator to sustainability for school-level.
3.4 Percentage of school directors who are able to repair or replace broken equipment other than through the Varkey Foundation
Add this indicator to help better measure sustainability of technology at the school-level
Indicator 3.1: DEO staff collaborate with the Varkey Foundation to update and review school and classroom monitoring tools
Proportion of DEOs in all districts where VF operates who attend monitoring tool workshops and who use updated monitoring tools.
This indicator is also more measurable and specific and may better communicate the extent to which district officials are involved with the activity and take it up after the fact.
Indicator 3.2: Varkey Foundation supports the Ministry of Education in
Number of policies, initiatives, or plans at the MOE that the Varkey
More specific, measurable, realistic, and time bound.

GEC-T Baseline Report – Making Ghanaian Girls Great Project 189
the translation of lessons learnt in GEC to inform policy and practice
Foundation supports with technical assistance over the life of the project.
Indicator 3.3: Government officials formally recognise the GEC project and its contribution to promoting girls' education in Ghana
Number of GES officials trained in use of the technology packages and who believe they will be able to implement and maintain technology packages.
The original indicator is not specific and does not measure true sustainability with regard to the ability of the government to take up VF interventions once MGCubed finishes. Training government officials to use and maintain the technology is a step in the right direction. The suggested replacement indicator could be added in addition to other existing indicators.

GEC-T Baseline Report – Making Ghanaian Girls Great Project 190
ANNEX 1: LOGFRAME The log frame is attached separately.
GEC-T Baseline Report – Making Ghanaian Girls Great Project 191
ANNEX 2: OUTCOMES SPREADSHEET The Outcomes Spreadsheet is attached separately.

GEC-T Baseline Report – Making Ghanaian Girls Great Project 192
ANNEX 3: KEY FINDINGS ON OUTPUT INDICATORS
Table 58: Output indicators
Logframe Output Indicator Means of verification/sources
(Expected numbers of surveys per term are indicated in brackets)
Collection frequency
Output 1: Learners access educational content through high-quality remote instruction 1296 hours of educational content in English, maths (P3-P6), literacy and numeracy (basic, intermediate, advanced) delivered to 144 classrooms in 72 schools each year, for 4 years
Output 1.1: Percentage of studio-based lessons that include bespoke digital curriculum content, and lesson objectives mapped to national curriculum student competency levels, are gender-sensitive, and encourage student-centred activity-based learning
Education Team Master Trainer observation
40 per term (three times per year), split between Adult Learning (Community, Teacher, School Leader and GES training) and Young Learners (In-grade Maths and English, Literacy and Numeracy).
Output 1.2: Percentage of sampled pupils who report that lessons are clear, engaging and conducted at an appropriate pace Qualitative: Interview and FGD data from boys and girls will explore particular issues with lesson delivery, and who they impact upon
Girl' Interview (62); Boys' Interview (30) Girls Focus Group Discussion (16); Boys Focus Group Discussion (8)
Termly (three times per year)
Output 2: Teachers and school leaders are trained in classroom pedagogy and school leadership: Up to 95 hours training delivered via satellite to up to 800 teachers and school leaders in 72 schools per year, for 4 years
Output 2.1: # Cumulative hours of studio-based teacher training sessions delivered to 72 schools
Studio Technicians' Log
Daily log, with monthly data cleaning and quality assurance
Output 2.2: Percentage of school leaders who are able to describe a concrete change they have made, informed by the Varkey Foundation training
Headteacher’s Interview (44)
Term 1 and Term 2 (twice per year) Spillover surveys take place in Term 3
Output 2.3: Percentage of teachers who are able to describe a concrete change they have made in classroom practice, informed by the Varkey Foundation training
Teacher Interview (107);
Termly (three times per year)
Output 3: Marginalised young people participate in interactive afterschool sessions designed to address wider barrier to learning and transition: 96 hours interactive Wonder Woman, Boys Boys, mixed club sessions per week in 72 schools per year, for 4 years
Output 3.1: # cumulative hours of studio-based afterschool session content delivered to 72 schools
Studio Technicians' Log Daily log, with monthly data cleaning and quality assurance
Output 3.2: Quantitative: Percentage of sampled afterschool sessions where all or most girls (>= 75%) are actively engaged and willing to discuss content and ask questions
Mixed Session Observation (8); Wonder Women Session Observation (30)
Termly (three times per year)

GEC-T Baseline Report – Making Ghanaian Girls Great Project 193
Output 3.3: Quantitative: Percentage of sampled afterschool sessions where there is evidence that boys are interacting positively with girls, e.g. working well in groups; allowing girls to speak; listening to girls
Mixed Session Observation (8); Wonder Women Session Observation (30); Boys Boys Observation (8)
Termly (three times per year)
Output 4: Community members participate in awareness-raising and skills development sessions: 24 hours life skills and child protection awareness training to 72 communities per year, for 4 years
Output 4.1: Quantitative: # cumulative hours of studio-based training delivered to 72 communities
Studio Technicians' Log
Daily log, with monthly data cleaning and quality assurance
Output 4.2: Quantitative: Percentage of community members able to describe what they have learnt by attending the community training
Parents’ Interview (16) Termly (three times per year)
Output 5: District Education Office: Up to 24 hours of training on management, teacher training and child protection to 7 DEOs per year, for 4 years
Output 5.1: # cumulative hours of training delivered to 7 DEOs
Studio Technicians' Log
Daily log, with monthly data cleaning and quality assurance
Output 5.2: Quantitative: Percentage of DEO staff who can describe how the learning from the DEO training has been applied in practice
District Education Office Staff interview (7)
Termly
Output 6: Safety Net Fund: Cash transfers delivered to families with girls transitioning to JHS
Output 6.1: Quantitative: Households receiving cash transfer, as a percentage of cumulative households with girls transitioning to JHS between 2018-2021
Pupil records (Salesforce) Cash provider records
Annually
Report on the Baseline values/Baseline status of each Output Indicator in the table below. Reflect on the relevancy of the Output Indicator for your Intermediate Outcomes and Outcomes and the wider Theory of Change based on the data collected so far. Are the indicators measuring the right things? What do the Baseline values/Baseline status mean for the implementation of your activities?
Table 59: Baseline status of output indicators
Logframe Output Indicator Relevance of the indicator for the project ToC
Baseline value/status
Output 1: Learners access educational content through high-quality remote instruction 1296 hours of educational content in English, maths (P3-P6), literacy and numeracy (basic, intermediate, advanced) delivered to 144 classrooms in 72 schools each year, for 4 years
Output 1.1: Percentage of studio-based lessons that include bespoke digital curriculum content, and lesson objectives mapped to national curriculum student competency levels, are gender-sensitive, and encourage student-centred activity-based learning
The indicator incorporates two sets of data; both the Output hours and the quality of studio-based lessons as measured through the Master Teachers Observation tool. This indicator is central to the project’s Theory of Change, which holds that VF’s provision of quality teaching and content to young learners is the first step towards both pupil and school level transformation. The indicator therefore reflects the VF’s success in offering quality
This report covers two terms only. The target is derived from calculating delivery over three terms. 574 unique content hours have been developed and delivered in two regions against an Output target of 1296 for the year. The total number of delivered hours is therefore double this amount (1148) because sessions are delivered in Volta and Greater Accra Region.
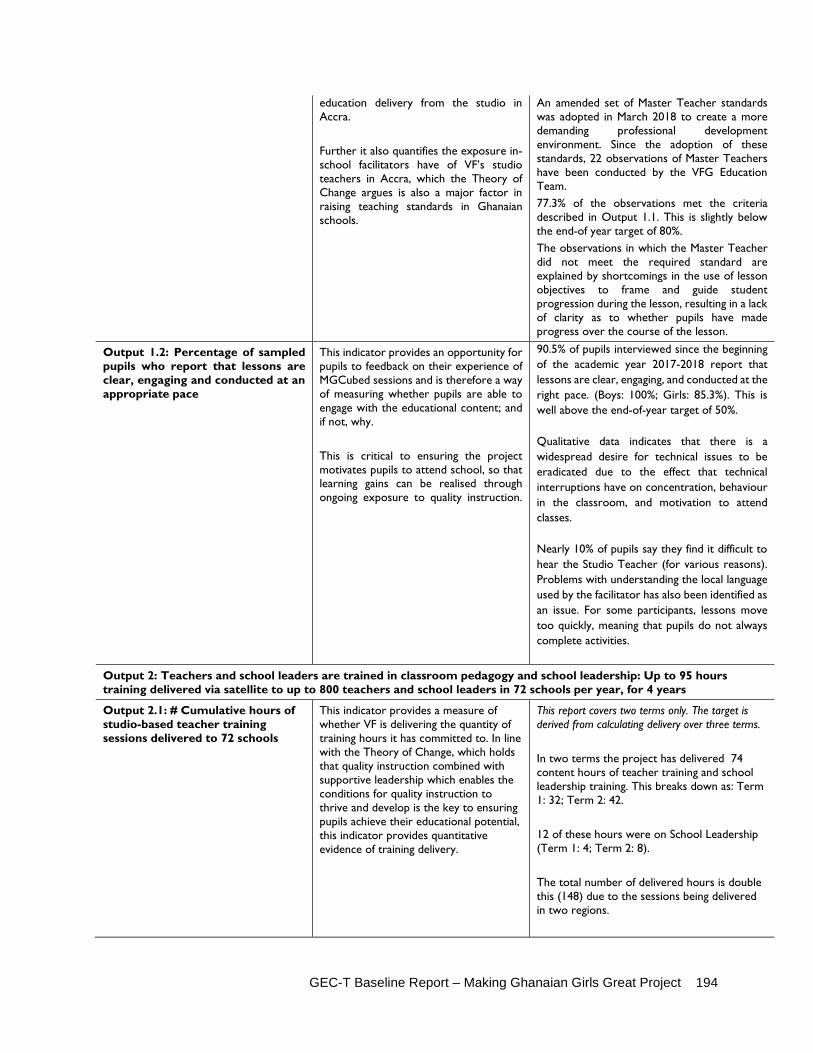
GEC-T Baseline Report – Making Ghanaian Girls Great Project 194
education delivery from the studio in Accra. Further it also quantifies the exposure in-school facilitators have of VF’s studio teachers in Accra, which the Theory of Change argues is also a major factor in raising teaching standards in Ghanaian schools.
An amended set of Master Teacher standards was adopted in March 2018 to create a more demanding professional development environment. Since the adoption of these standards, 22 observations of Master Teachers have been conducted by the VFG Education Team. 77.3% of the observations met the criteria described in Output 1.1. This is slightly below the end-of year target of 80%. The observations in which the Master Teacher did not meet the required standard are explained by shortcomings in the use of lesson objectives to frame and guide student progression during the lesson, resulting in a lack of clarity as to whether pupils have made progress over the course of the lesson.
Output 1.2: Percentage of sampled pupils who report that lessons are clear, engaging and conducted at an appropriate pace
This indicator provides an opportunity for pupils to feedback on their experience of MGCubed sessions and is therefore a way of measuring whether pupils are able to engage with the educational content; and if not, why. This is critical to ensuring the project motivates pupils to attend school, so that learning gains can be realised through ongoing exposure to quality instruction.
90.5% of pupils interviewed since the beginning of the academic year 2017-2018 report that lessons are clear, engaging, and conducted at the right pace. (Boys: 100%; Girls: 85.3%). This is well above the end-of-year target of 50%.
Qualitative data indicates that there is a widespread desire for technical issues to be eradicated due to the effect that technical interruptions have on concentration, behaviour in the classroom, and motivation to attend classes.
Nearly 10% of pupils say they find it difficult to hear the Studio Teacher (for various reasons). Problems with understanding the local language used by the facilitator has also been identified as an issue. For some participants, lessons move too quickly, meaning that pupils do not always complete activities.
Output 2: Teachers and school leaders are trained in classroom pedagogy and school leadership: Up to 95 hours training delivered via satellite to up to 800 teachers and school leaders in 72 schools per year, for 4 years
Output 2.1: # Cumulative hours of studio-based teacher training sessions delivered to 72 schools
This indicator provides a measure of whether VF is delivering the quantity of training hours it has committed to. In line with the Theory of Change, which holds that quality instruction combined with supportive leadership which enables the conditions for quality instruction to thrive and develop is the key to ensuring pupils achieve their educational potential, this indicator provides quantitative evidence of training delivery.
This report covers two terms only. The target is derived from calculating delivery over three terms. In two terms the project has delivered 74 content hours of teacher training and school leadership training. This breaks down as: Term 1: 32; Term 2: 42. 12 of these hours were on School Leadership (Term 1: 4; Term 2: 8). The total number of delivered hours is double this (148) due to the sessions being delivered in two regions.

GEC-T Baseline Report – Making Ghanaian Girls Great Project 195
Output 2.2: Percentage of school leaders who are able to describe a concrete change they have made, informed by the Varkey Foundation training
The Theory of Change holds that the behaviour of School Leaders will change due to their improved capacity as a result of the VF teacher training. The purpose of this indicator is to look beyond whether school leaders report changes on a termly basis, by seeking to obtain an evidenced example of how the training received over the course of the term has been put into practice. Initially, this indicator met some challenges. Headteachers reported changes despite also reporting that they had not attended training. VF’s District Coordinators are now aware of this potential pitfall and a skip pattern has been implemented to ensure that Headteachers who have not attended training that term will not be questioned about the translation of learnings from the training to the school environment.
In the first two terms of the project, 75% of the 60 headteachers interviewed reported that they had begun to implement changes as a result of the MGCubed training. 70% could adequately provide a concrete example of how they have applied learning from the training into practice. This is well above the end-of-year target of 20%. The most frequently cited changes were group work and starter activities. Disaggregated by gender, 77% of male headteachers reported that they had made a change as a result of MGCubed training. 70.8% were able to describe a concrete change. For female headteachers, for which the sample was much smaller (12 compared to 48), 66.7% said that they had made a change and all were able to describe a concrete change.
Output 2.3: Percentage of teachers who are able to describe a concrete change they have made in classroom practice, informed by the Varkey Foundation training
The Theory of Change holds that the behaviour of teachers will change due to their improved capacity as a result of the VF teacher training. The purpose of this indicator is to look beyond whether teachers report changes on a termly basis, by seeking to obtain an evidenced example of how the training received over the course of the term has been put into practice. Initially, this indicator met some challenges. Teachers reported changes despite also reporting that they had not attended training. VF’s District Coordinators are now aware of this potential pitfall and a skip pattern has been implemented to ensure that teachers who have not attended training that term will not be questioned about the translation of learnings from the training to the school environment.
61.6% of teachers interviewed reported that they had changed their teaching style as a result of MGCubed training and could provide an example of how. This is well above the end-of-year target of 20%. In Term 2 the average number of participants in the teacher training was 6, a huge improvement on Term 1 (3). Qualitative data from teachers provided insight into some of the challenges associated with the teacher training. The most prominent is to do with the scheduling of training, which respondents reporting that Friday sessions are inconvenient and Thursday sessions should be scheduled for afterschool. Other issues included technical challenges due to network interruptions, and the need for snacks to aid concentration and motivation.
Output 3: Marginalised young people participate in interactive afterschool sessions designed to address wider barrier to learning and transition: 96 hours interactive Wonder Woman, Boys Boys, mixed club sessions per week in 72 schools per year, for 4 years
Output 3.1: # cumulative hours of studio-based afterschool session content delivered to 72 schools
This indicator provides a measure of whether VF is delivering the quantity of Afterschool club content hours it has committed to. In line with the Theory of Change, which holds that pupils’ non-cognitive abilities are an important determinant of both learning outcomes and transition to secondary schools, this indicator provides quantitative evidence
This report covers two terms only. The target is derived from calculating delivery over three terms. Over the first two terms schools received 49 hours of Afterschool clubs (including Wonder Women, Boys Boys, Mixed Club), against an end-of-year target of 64.

GEC-T Baseline Report – Making Ghanaian Girls Great Project 196
of VF’s efforts to support this aspect of pupil development. Further it also quantifies the exposure in-school facilitators have of VF’s studio teachers in Accra, which the Theory of Change argues is also a major factor in raising teaching standards in Ghanaian schools.
The breakdown of this by term is as follows: Term 1: 18 Term 2: 31 The breakdown of this by session is as follows: Boys Boys: 13 Mixed Club: 12 Wonder Women: 24 The total number of delivered hours is double this (98) due to the sessions being delivered in two regions.
Output 3.2: Percentage of sampled afterschool sessions where all or most girls (>= 75%) are actively engaged and willing to discuss content and ask questions
The Afterschool Clubs provide marginalised girls the opportunity to interact in a safe space where they are encouraged and supported to – often for the first time – form and speak about their own opinions, feelings, and experiences; to take on leadership roles and challenge the status quo; and form their own identity as self-directed individuals. In order for girls to seize this opportunity, we would expect to girls actively participating in these sessions. If they are not participating, it would indicate that they are not able to make the most of the opportunity the sessions afford them. This indicator reflects this, going beyond attendance in terms of numbers of girls in a classroom and instead considering how meaningfully they are engaging with the session content and other girls.
In the first two terms of the project, 87.5% of Wonder Women sessions observed were found to have all or most girls actively engaged in the session. This is well above the end-of-year target of 30%. A common observation is that the use of small groups enables girls to engage with each other and have a role within a group; it is hard to blend into the background in a small group. Barriers to full participation have been identified, including:
• The effects of classrooms overheating, causing discomfort
• Reports of hunger • Reports of tiredness, particularly after
sports practice
Thus far there has been no evidence to suggest that girls have lacked interest in the content of the session, or that facilitators have failed to engage with all girls.
Output 3.3: Percentage of sampled afterschool sessions where there is evidence that boys are interacting positively with girls, e.g. working well in groups; allowing girls to speak; listening to girls
This evidence comes from Mixed Club observations. Over the course of the pilot phase we found that girls were showing overwhelming evidence of empowerment and self-direction in Wonder Women (girls only) sessions. However, we found that boys’ attitudes towards girls required some work in order to reflect the changes occurring amongst the marginalised girls. The GEC-T Theory of Change has placed more of a focus on the need for boys to change their attitudes and behaviours, and for girls to become better equipped at
In 50% of the Mixed Club observations (16) girls led discussions, and in all observations boys were found to listen to girls. In 68.7% of observations boys and girls were sitting together. This was much higher than expected. There were no cases of intimidation against girls recorded. This was much lower than expected.

GEC-T Baseline Report – Making Ghanaian Girls Great Project 197
dealing with interactions with boys. This indicator reflects this, and attempts to capture evidence of harmonious, equitable relations. We propose that this indicator is disaggregated by four components, with the indicator targets expressed in general term and furnished with qualitative and quantitative data from the following: 1) Boys and girls sitting together; 2) Boys listening to girls; 3) Girls lead discussions; 4) Evidence of intimidation of girls. We expect to see an increase in each of these, with the exception of (4) where we expect to see a decrease in incidences. However, with regard to (4) we have seen that the frequency is non-existent, so sub-the indicator is not likely to show a reduction. Instead we expect to see this as fairly constant.
Output 4: Community members participate in awareness-raising and skills development sessions: 24 hours life skills and child protection awareness training to 72 communities per year, for 4 years
Output 4.1: Quantitative: # cumulative hours of studio-based training delivered to 72 communities
This indicator provides a measure of whether VF is delivering the quantity of training hours it has committed to. In line with the Theory of Change, which holds that community members (in particular, family members) enable the conditions for pupils to achieve their educational potential, this indicator provides quantitative evidence of VF’s efforts to target this group of stakeholders.
This report covers two terms only. The target is derived from calculating delivery over three terms. In two terms each school has received 12 hours of community training, against an end-of-year target of 16. The breakdown of this is: Term 1 (4); Term 2 (8). The total number of delivered hours is double this (24) due to the sessions being delivered in two regions.
Output 4.2: Quantitative: Percentage of community members are able to describe what they have learnt by attending the community training
This indicator is designed to reflect general attendance at community training, and going further to identify concrete changes that have taken place as a result of learnings from the training. At first, this indicator was difficult due to the very low level of attendance at community training. This meant that in Term 1 no parents interviewed had attended training. This improved in Term 2, when all parents had attended. However, the selection of interview participants was also biased due to the need to find parents who had attended training. Moving forward, this indicator will not be used to consider attendance; this data will come from the Studio Logs. Further, District Coordinators have needed some orientation on how to
42% of parents interviewed (of 19) were able to clearly articulate what they have learnt in VF’s community training and how this is translated into practice. This is well above the end-of-year target of 20%. The most frequently cited example was supporting a child in education, for instance learning about “the things we can do to help our children at school and home.” Attendance at Community Training is now up to an average of 8, equal between men and women. This is a huge improvement on Term 1 when the project was getting established.

GEC-T Baseline Report – Making Ghanaian Girls Great Project 198
collect specific examples and, where these are not forthcoming, how to probe in order to arrive at a meaningful answer which moves beyond a generic response. This is a major priority for Term 3.
Output 5: District Education Office: Up to 24 hours of training on management, teacher training and child protection to 7 DEOs per year, for 4 years
Output 5.1: # cumulative hours of training delivered to 7 DEOs
This indicator provides a measure of whether VF is delivering the quantity of training hours it has committed to. In line with the Theory of Change, which holds that quality instruction combined with supportive leadership which enables the conditions for quality instruction to thrive and develop is the key to ensuring pupils achieve their educational potential, this indicator provides quantitative evidence of VF’s efforts to engage system-level leadership to support school leaders and drive sustainable change across all schools in their districts.
This report covers two terms only. The target is derived from calculating delivery over three terms. In two terms each DEO has received 12 hours of training, against an end-of-year target of 16. The total number of delivered hours is double this (24) due to the sessions being delivered in two regions.
Output 5.2: Quantitative: Percentage of DEO staff who can describe how the learning from the DEO training has been applied in practice
This indicator reflects the immediate efficacy of the output by considering whether – following VF training - DEO staff are able to translate learnings from training into practice. This considers behaviour change at an individual level, as a prelude to intermediate outcome level systematic change. This reflects the Theory of Change which holds that in order to achieve systemic change in the way girls are supported to pursue their educational journeys, the national education system needs to be capacitated to deliver support mechanisms and also to continue to deliver elements of the MGCubed project in a sustainable way.
In two terms, officials from two districts (Kadjebi and Ningo Prampram) have identified ways in which the training has helped them in their roles at the district level Ghana Education Service offices. This represents 30% of the respondent sample. This is over the end-of-year target of 20%. The common theme was that the training had oriented them to the MGCubed project’s aims in the second phase, and thus helped officials develop a schema of work that aligned with that of MGCubed. In subsequent terms we would expect that these responses will evolve to provide an increased number of more in-depth examples, having moved beyond the initial project orientation phase. In obtaining data for this indicator, VF has noted both the priorities for district officials and the challenges they face in carrying out their work. Transportation and an unwillingness on the part of school leaders and teachers to cooperate are major challenges. Key priorities are various, but common themes include:
Specific supervision mechanisms to improve teacher attendance
Support and coordination with additional projects (e.g. World Vision International’s Literacy Boost)
Preparing a termly scheme of work
Output 6: Safety Net Fund: Cash transfers delivered to families with girls transitioning to JHS

GEC-T Baseline Report – Making Ghanaian Girls Great Project 199
Output 6.1: Quantitative: Households receiving cash transfer, as a percentage of cumulative households with girls transitioning to JHS between 2018-2021
This indicator reflects the effectiveness of VF’s internal tracking and targeting of households with girls in P6 preparing to transition to JHS
No data (Begins August 2018) VF will partner with a mobile service provider to deliver cash transfers to eligible households. Transfers will be made during September, following the sharing of an eligible pupil list in August. Records of receipt will be made available to VF and logged in Salesforce. In order to track fidelity to the use of funds provided VF will provide a short checklist for each school to log instances where girls appear not to have benefitted from the transfer in the way intended.
List all issues with the means of verification/sources or the frequency of data collection which require changes or additions.
Table 60: Output indicator issues
Logframe Output Indicator Issues with the means of verification/sources and the collection frequency, or the indicator in general?
Changes/additions
Output 1: Learners access educational content through high-quality remote instruction 1296 hours of educational content in English, maths (P3-P6), literacy and numeracy (basic, intermediate, advanced) delivered to 144 classrooms in 72 schools each year, for 4 years
Output 1.1: Percentage of studio-based lessons that include bespoke digital curriculum content, and lesson objectives mapped to national curriculum student competency levels, are gender-sensitive, and encourage student-centred activity-based learning
No issues as yet. Leave as is.
Output 1.2: Percentage of sampled pupils who report that lessons are clear, engaging and conducted at an appropriate pace Qualitative: Interview and FGD data from boys and girls will explore particular issues with lesson delivery, and who they impact upon
No issues as yet. The current targets are too low.
Leave as is
Output 2: Teachers and school leaders are trained in classroom pedagogy and school leadership: Up to 95 hours training delivered via satellite to up to 800 teachers and school leaders in 72 schools per year, for 4 years
Output 2.1: # Cumulative hours of studio-based teacher training sessions delivered to 72 schools
No issues as yet
Leave as is
Output 2.2: Percentage of school leaders who are able to describe a concrete change they have made, informed by the Varkey Foundation training
No issue with the wording of the indicator, but District Coordinators need further support to provide sufficient qualitative data regarding the descriptive evidence provided by the headteacher.
Leave as is
Output 2.3: Percentage of teachers who are able to describe a concrete change they have made in classroom practice, informed by the Varkey Foundation training
No issue with the wording of the indicator, but District Coordinators need further support to provide sufficient qualitative data regarding the descriptive evidence provided by the teacher.
Leave as is
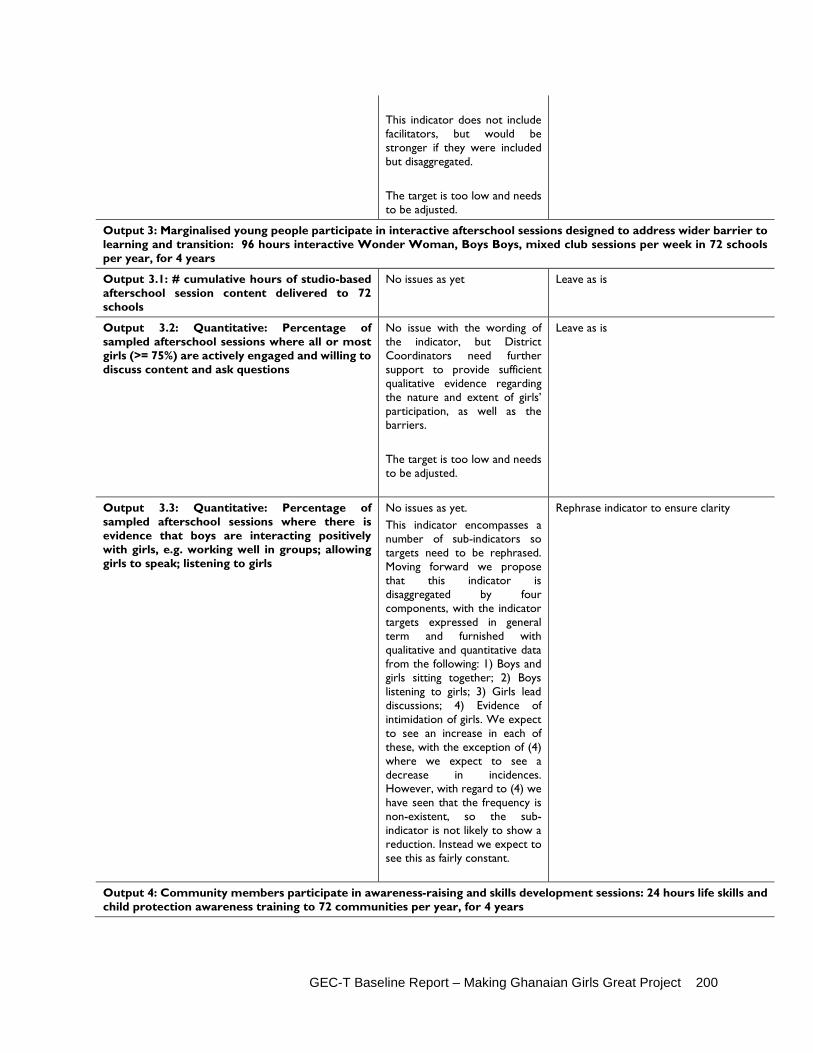
GEC-T Baseline Report – Making Ghanaian Girls Great Project 200
This indicator does not include facilitators, but would be stronger if they were included but disaggregated. The target is too low and needs to be adjusted.
Output 3: Marginalised young people participate in interactive afterschool sessions designed to address wider barrier to learning and transition: 96 hours interactive Wonder Woman, Boys Boys, mixed club sessions per week in 72 schools per year, for 4 years
Output 3.1: # cumulative hours of studio-based afterschool session content delivered to 72 schools
No issues as yet Leave as is
Output 3.2: Quantitative: Percentage of sampled afterschool sessions where all or most girls (>= 75%) are actively engaged and willing to discuss content and ask questions
No issue with the wording of the indicator, but District Coordinators need further support to provide sufficient qualitative evidence regarding the nature and extent of girls’ participation, as well as the barriers. The target is too low and needs to be adjusted.
Leave as is
Output 3.3: Quantitative: Percentage of sampled afterschool sessions where there is evidence that boys are interacting positively with girls, e.g. working well in groups; allowing girls to speak; listening to girls
No issues as yet. This indicator encompasses a number of sub-indicators so targets need to be rephrased. Moving forward we propose that this indicator is disaggregated by four components, with the indicator targets expressed in general term and furnished with qualitative and quantitative data from the following: 1) Boys and girls sitting together; 2) Boys listening to girls; 3) Girls lead discussions; 4) Evidence of intimidation of girls. We expect to see an increase in each of these, with the exception of (4) where we expect to see a decrease in incidences. However, with regard to (4) we have seen that the frequency is non-existent, so the sub-indicator is not likely to show a reduction. Instead we expect to see this as fairly constant.
Rephrase indicator to ensure clarity
Output 4: Community members participate in awareness-raising and skills development sessions: 24 hours life skills and child protection awareness training to 72 communities per year, for 4 years

GEC-T Baseline Report – Making Ghanaian Girls Great Project 201
Output 4.1: Quantitative: # cumulative hours of studio-based training delivered to 72 communities
No issues as yet. Year 1 delivery is less than planned target so needs to be adjusted downwards in Year 1.
Leave as is
Output 4.2: Quantitative: Percentage of community members able to describe what they have learnt by attending the community training
The number of responses is fewer than planned; actions have been taken to ensure that yearly targets are met. No issue with the wording of the indicator, but District Coordinators need further support to ask the survey question/s in the right way, including the appropriate probes.
Leave as is
Output 5: District Education Office: Up to 24 hours of training on management, teacher training and child protection to 7 DEOs per year, for 4 years
Output 5.1: # cumulative hours of training delivered to 7 DEOs
No issues as yet. Year 1 delivery is less than planned target so needs to be adjusted downwards in Year 1.
Leave as is
Output 5.2: Quantitative: Percentage of DEO staff who can describe how the learning from the DEO training has been applied in practice
The number of responses is fewer than planned; actions have been taken to ensure that yearly targets are met. No issue with the wording of the indicator, but District Coordinators need further support to ask the survey question/s in the right way, including the appropriate probes. The target is too low and needs to be adjusted.
Leave as is
Output 6: Safety Net Fund: Cash transfers delivered to families with girls transitioning to JHS
Output 6.1: Households receiving cash transfer, as a percentage of cumulative households with girls transitioning to JHS between 2018-2021
No issue as yet Leave as is

GEC-T Baseline Report – Making Ghanaian Girls Great Project 202
ANNEX 4: BENEFICIARY TABLES Table 61: Direct beneficiaries
Beneficiary type Total project number Total number of girls targeted for learning outcomes that the project has reached by Endline
Comments
Direct learning beneficiaries (girls) – girls in the intervention group who are specifically expected to achieve learning outcomes in line with targets. If relevant, please disaggregate girls with disabilities in this overall number.
Total: 4847 Of which: Remedial pupils: 3574 (GEC1: 4274) In-grade only pupils: 1273
NA Marginalised girls considered to be principal participants in the project and are contained in the VF contact database. Participation include attendance at: In-grade Maths and English lessons, Remedial Literacy and Numeracy, and Afterschool clubs (Wonder Women; Mixed Club). Calculations: There are 3574 remedial pupils. These pupils have been part of the project since the start of GEC1 and are the primary target group for the project. Of these, 1576 are in the 41 schools with in-grade classes. In total, 2849 access in-grade in 41 schools in total. 2849 minus 1576 is 1273. There are therefore 1273 additional (non-cohort) girls who are also directly benefitting from the project. 1273 plus 3547 is 4847. GEC1 to GECT: The project has lost 1300 marginalised in-school girls since Endline. The Project did not track girls from Endline to the beginning of term in the new academic year (2017-2018) and is therefore not able to comment on the status of these girls. The Project conducted a pupil verification exercise at the beginning of term and one in May. The latter exercise identified over 300 GEC1 pupils who had not been present at the beginning of term but who had returned to the project over the course of the academic year. Members of the GEC1 cohort will likely emerge over the course of the project, supported by District Coordinators who
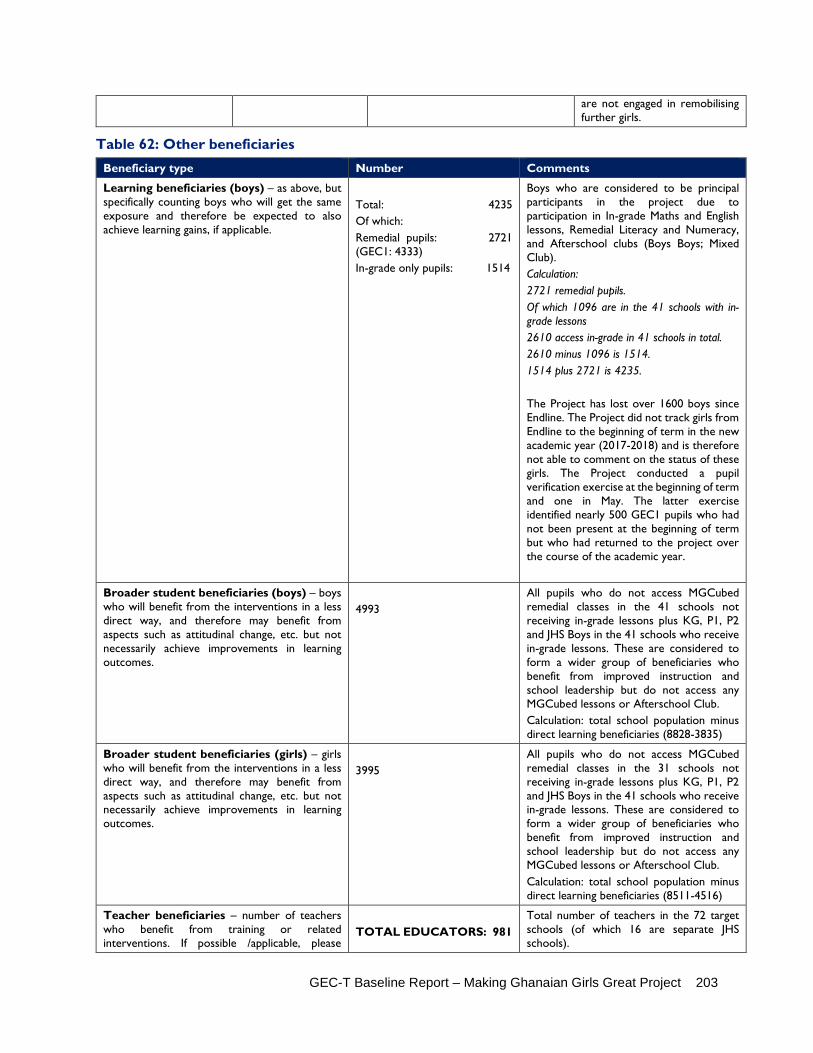
GEC-T Baseline Report – Making Ghanaian Girls Great Project 203
are not engaged in remobilising further girls.
Table 62: Other beneficiaries
Beneficiary type Number Comments
Learning beneficiaries (boys) – as above, but specifically counting boys who will get the same exposure and therefore be expected to also achieve learning gains, if applicable.
Total: 4235 Of which: Remedial pupils: 2721 (GEC1: 4333) In-grade only pupils: 1514
Boys who are considered to be principal participants in the project due to participation in In-grade Maths and English lessons, Remedial Literacy and Numeracy, and Afterschool clubs (Boys Boys; Mixed Club). Calculation: 2721 remedial pupils. Of which 1096 are in the 41 schools with in-grade lessons 2610 access in-grade in 41 schools in total. 2610 minus 1096 is 1514. 1514 plus 2721 is 4235. The Project has lost over 1600 boys since Endline. The Project did not track girls from Endline to the beginning of term in the new academic year (2017-2018) and is therefore not able to comment on the status of these girls. The Project conducted a pupil verification exercise at the beginning of term and one in May. The latter exercise identified nearly 500 GEC1 pupils who had not been present at the beginning of term but who had returned to the project over the course of the academic year.
Broader student beneficiaries (boys) – boys who will benefit from the interventions in a less direct way, and therefore may benefit from aspects such as attitudinal change, etc. but not necessarily achieve improvements in learning outcomes.
4993
All pupils who do not access MGCubed remedial classes in the 41 schools not receiving in-grade lessons plus KG, P1, P2 and JHS Boys in the 41 schools who receive in-grade lessons. These are considered to form a wider group of beneficiaries who benefit from improved instruction and school leadership but do not access any MGCubed lessons or Afterschool Club. Calculation: total school population minus direct learning beneficiaries (8828-3835)
Broader student beneficiaries (girls) – girls who will benefit from the interventions in a less direct way, and therefore may benefit from aspects such as attitudinal change, etc. but not necessarily achieve improvements in learning outcomes.
3995
All pupils who do not access MGCubed remedial classes in the 31 schools not receiving in-grade lessons plus KG, P1, P2 and JHS Boys in the 41 schools who receive in-grade lessons. These are considered to form a wider group of beneficiaries who benefit from improved instruction and school leadership but do not access any MGCubed lessons or Afterschool Club. Calculation: total school population minus direct learning beneficiaries (8511-4516)
Teacher beneficiaries – number of teachers who benefit from training or related interventions. If possible /applicable, please
TOTAL EDUCATORS: 981
Total number of teachers in the 72 target schools (of which 16 are separate JHS schools).

GEC-T Baseline Report – Making Ghanaian Girls Great Project 204
disaggregate by gender and type of training, with the comments box used to describe the type of training provided.
(GEC1: 504) Men: 580 Women: 406 Facilitators total: 211 GEC1 AND GECT 67 GECT ONLY 144 Non-facilitators total: 770 Teachers: 594 Headteachers 88 Assistant Headteachers 88
Broader community beneficiaries (adults) – adults who benefit from broader interventions, such as community messaging /dialogues, community advocacy, economic empowerment interventions, etc.
576 [1440] (GEC1: 360)
The project does not have a full list of community members residing in each of the 72 communities. This number is based on actual numbers of community participants at community training. The projected indirect reach is presented in parentheses, assuming a wider reach of 20 community members per community.
District Education Office officials
101 Registered staff members, including Director, Deputy Director, Girl Child Coordinator, Circuit Supervisors.
Table 63: Target groups - by school
Project
definition of target group (Tick where appropriate)
Number targeted through project
interventions (All groups and
genders)
Sample size of target group at Baseline (Girls)
School Age
Lower primary 10,011 184
Upper primary 7321 896
Lower secondary 828 256
Upper secondary NA 0
Total: 18,070 1336*
* 7 Other, 18 Don’t know, and 3 No Response
Table 64: Target groups - by age
Age Groups
Project definition of target group (Tick where appropriate)
Number targeted
through project interventions
Sample size of target group at Baseline
(percent)
Aged 6-8 (% aged 6-8)
The project is unable to confirm
22 (1.61)

GEC-T Baseline Report – Making Ghanaian Girls Great Project 205
Aged 9-11 (% aged 9-11)
this data due to widespread inaccuracies in reporting age. The project is able to report this data by grade, with assumed ages appropriate to the pupil’s grade.
320 (23.46)
Aged 12-13 (% aged 12-13) 499 (36.58)
Aged 14-15 (% aged 14-15) 333 (24.41)
Aged 16-17 (%aged 16-17) 125 (9.16)
Aged 18-19 (%aged 18-19) 24 (1.75)
Aged 20+ (% aged 20 and over) 0 (0)
Total: 1323*
* 14 (1.03) age and birth year unknown; 27 (1.98) no response
Table 65: Target groups - by sub group
Social Groups
Project definition of target group
(Tick where appropriate)
Number targeted through project
interventions
Sample size of target group at Baseline
Disabled girls (please disaggregate by disability type)
Total: 12
Cognitive disability: 1
Visual disability: 3
Audio disability: 2
Physical disability: 2
Not specified: 4
100
Orphaned girls (double and single*) Unknown 161*
Pastoralist girls Unknown Unknown
Child labourers Unknown Unknown
Poor girls42 357443 1136
Other (please describe)
Total: NA 1236
*The number of “double” orphans, who have lost both parents, is 10. The number of single orphans is 151.
42 Note to FM: The cohort spans different groups, i.e. disabled and poor. The total is therefore not valid due to double-counting. 43 This only takes into account Remedial girls who are part of the GEC1 cohort and who were selected based on marginalisation criteria. Girls who attend By-grade classes are also likely to live in poverty, however the Project cannot confirm the number.

GEC-T Baseline Report – Making Ghanaian Girls Great Project 206
Table 66: Target groups - by school status
Educational sub-groups
Project definition of target group
(Tick where appropriate)
Number targeted through project
interventions
Sample size of target group at Baseline
Out-of-school girls: have never attended school
The project is unable to confirm whether OOSG in the project have ever attended school.
46
0 Out-of-school girls: have
attended school, but dropped out
Returned to school 69
Girls in-school 884244 1364
Total: 8957 1364
44 Includes Direct beneficiaries and wider beneficiaries.

GEC-T Baseline Report – Making Ghanaian Girls Great Project 207
ANNEX 5: MEL FRAMEWORK The MEL Framework is attached separately.

GEC-T Baseline Report – Making Ghanaian Girls Great Project 208
ANNEX 6: EXTERNAL EVALUATOR’S INCEPTION REPORT The MEL Framework (Annex 5) was used in lieu of the Inception Report at baseline.

GEC-T Baseline Report – Making Ghanaian Girls Great Project 209
ANNEX 7: DATA COLLECTION TOOLS USED FOR BASELINE All data collection tools are attached separately.

GEC-T Baseline Report – Making Ghanaian Girls Great Project 210
ANNEX 8: DATASETS, CODEBOOKS AND PROGRAMS
Table 67: Quantitative data codebook
Variable Variable name in dataset Dataset Comments
IDENTIFIERS
Girl ID girl_id hh_girls_merge.dta
2,672 cohort girls were matched using the Girl ID in the household survey and girls survey. 48 appeared in the girls survey only.
Household ID hh_id hh_girls_merge.dta HH survey
Sex sex1 aggregate_reading_math_score.dta
Recoded from “sex” in egra_segra_scores.dta and egma_segma_scores.dta
Region pre_5s hh_girls_merge.dta Matched in both datasets
District pre_6s hh_girls_merge.dta Matched in both datasets
School ID school_id hh_girls_merge.dta EMIS school ID; matched in both datasets
School name pcg_2tc hh_girls_merge.dta HH survey
Intervention group (treatment or control)
treatment hh_girls_merge.dta Girls survey
Girl’s age age, pcg_14g, pcg_18g hh_girls_merge.dta
HH survey; “age” created from pcg_14g, and 2017 minus the year of birth (pcg_15g) if pcg_14g is unknown
Girl’s grade level grade hh_girls_merge.dta Renamed pcg_4tc from HH survey
TRANSITION OUTCOMES
Successful transition outcome (binary) transition matched_HH_w_impair_tr
ansition.dta "Successful” or "Unsuccessful” transition last year
Successful transition outcome (detail) transition_det matched_HH_w_impair_tr
ansition.dta
Progression, Re-enrolment, Repeat Grade, Unknown enrollment status last year, or Unknown grade last year. Built from pcg_5tc, pcg_6tc, and pcg_7tc
CLASSROOM OBSERVATION
Facilitator training type faciliator matched_class_obs_facilitat
or
Teacher received facilitator training during GEC1 and GECT, during GECT only, or not at all

GEC-T Baseline Report – Making Ghanaian Girls Great Project 211
LEARNING OUTCOMES
Grade level equivalent achieved in Numeracy
Highest_grade_numeracy
aggregate_reading_math_score_11.dta
The math level at which the student is performing, as per Table 28: Grade level achievement methodology
Grade level equivalent achieved in Literacy
Highest_grade_literacy
aggregate_reading_math_score_11.dta
The reading level at which the student is performing, as per Table 28: Grade level achievement methodology
Aggregate Literacy Score (percent) agg_LscoreR aggregate_reading_math_sc
ore_11.dta
Mean of percentages correct of all EGRA subtests and SEGRA subtasks
Aggregate literacy score category cat_agg_LscoreR aggregate_reading_math_sc
ore_11.dta
agg_LscoreR recoded into Non-learner, Emergent learner, Established learner, and Proficient learner buckets
Aggregate Numeracy Score (percent) agg_LscoreM aggregate_reading_math_sc
ore_11.dta
Mean of percentages correct of all EGMA subtests and SEGMA subtasks
Aggregate numeracy score category cat_agg_LscoreM aggregate_reading_math_sc
ore_11.dta
agg_LscoreM recoded into Non-learner, Emergent learner, Established learner, and Proficient learner buckets
EGRA
EGRA Literacy Subtest 1: Oral Vocabulary- Familiar Words
st1_EGRA aggregate_reading_math_score_11.dta
Built from the eight Subtest 1 questions, in variable format “EGRA_Subtest1_[1-8]”
EGRA Literacy Subtest 1: percent correct
PCW aggregate_reading_math_score_11.dta
Percent of correct familiar words identified (out of 8) = 100*(st1_EGRA/8)
EGRA Literacy Subtest 1: percent correct by category
cat_PCW aggregate_reading_math_score_11.dta
PCW recoded into Non-learner, Emergent learner, Established learner, and Proficient learner buckets
EGRA Literacy Subtest 2: Letter Sound Identification
st2_EGRA aggregate_reading_math_score_11.dta
Built from the 100 Subtest 2 questions, in variable format “EGRA_Subtest2_[1-100]”
EGRA Literacy Subtest 2: percent correct
PCLS aggregate_reading_math_score_11.dta
Percent of correct letter sounds identified (out of 100) = 100*(st2_EGRA/100)
EGRA Literacy Subtest 2: percent correct by category
cat_PCLS aggregate_reading_math_score_11.dta
PCLS recoded into Non-learner, Emergent learner, Established learner, and Proficient learner buckets
EGRA Literacy Subtest 3: Nonword Reading
st3_EGRA aggregate_reading_math_score_11.dta
Built from the 50 Subtest 3 questions, in variable format “EGRA_Subtest3_[1-50]
EGRA Literacy Subtest 3: percent correct
PCNW aggregate_reading_math_score_11.dta
Percent of correct non-familiar words identified (out of 50) = 100*(st3_EGRA/50)

GEC-T Baseline Report – Making Ghanaian Girls Great Project 212
EGRA Literacy Subtest 3: percent correct by category
cat_PCNW aggregate_reading_math_score_11.dta
PCNW recoded into Non-learner, Emergent learner, Established learner, and Proficient learner buckets
EGRA Literacy Subtest 4A: Oral Reading Fluency
st4A_EGRA aggregate_reading_math_score_11.dta
Built from the 59 Subtest 4A questions, in variable format “EGRA_SubTest4A_[1-59]”
Standardised Oral Reading Fluency ORF aggregate_reading_math_sc
ore_11.dta
Built from ORF_actual and standardised to values between 0 and 100
Raw Oral Reading Fluency score ORF_actual aggregate_reading_math_sc
ore_11.dta
st4A_EGRA score, divided by the proportion of time taken to complete the task. This resulted in scores greater than 100%, which were standardised by setting any scores greater than 100 to 100.
Standardised Oral Reading Fluency by category
cat_ORF aggregate_reading_math_score_11.dta
ORF recoded into Non-learner, Emergent learner, Established learner, and Proficient learner buckets
EGRA Literacy Subtest 4B: Reading Comprehension
st4B_EGRA aggregate_reading_math_score_11.dta
Built from the five Subtest 4B questions, in variable format “EGRA_Subtest4B_Q[#]”, where # = 11, 21, 31, 41, and 51
EGRA Literacy Subtest 4B: percent correct
PRC aggregate_reading_math_score_11.dta
Percent of correct reading comprehension answers (out of 5) = 100*(st4B_EGRA/5)
EGRA Literacy Subtest 4B: percent correct by category
cat_PRC aggregate_reading_math_score_11.dta
PRC recoded into Non-learner, Emergent learner, Established learner, and Proficient learner buckets
EGRA Literacy Subtest 5: Listening Comprehension
st5_EGRA aggregate_reading_math_score_11.dta
Built from the three Subtest 5 questions, in variable format “EGRA_Subtest5_Q[#]”, where # = 11, 21, and 31
EGRA Literacy Subtest 5: percent correct
PLC aggregate_reading_math_score_11.dta
Percent of correct listening comprehension answers (out of 3) = 100*(st5_EGRA/3)
EGRA Literacy Subtest 5: percent correct by category
cat_PLC aggregate_reading_math_score_11.dta
PLC recoded into Non-learner, Emergent learner, Established learner, and Proficient learner buckets
SeGRA
SEGRA Literacy Subtask 1: Comprehension (+ analytical)
st1_SEGRA aggregate_reading_math_score_11.dta
Built from the nine Subtask 1 questions, in variable format “segrav1s1q[1-9]”
SEGRA Literacy Subtask 1: percent correct
pst1_SEGRA aggregate_reading_math_score_11.dta
Percent of correct SEGRA Subtask 1 answers: st1_SEGRA divided by 27 (to account for the fact that questions ranged between having a maximum of 1 to 3 points) and multiplied by 100
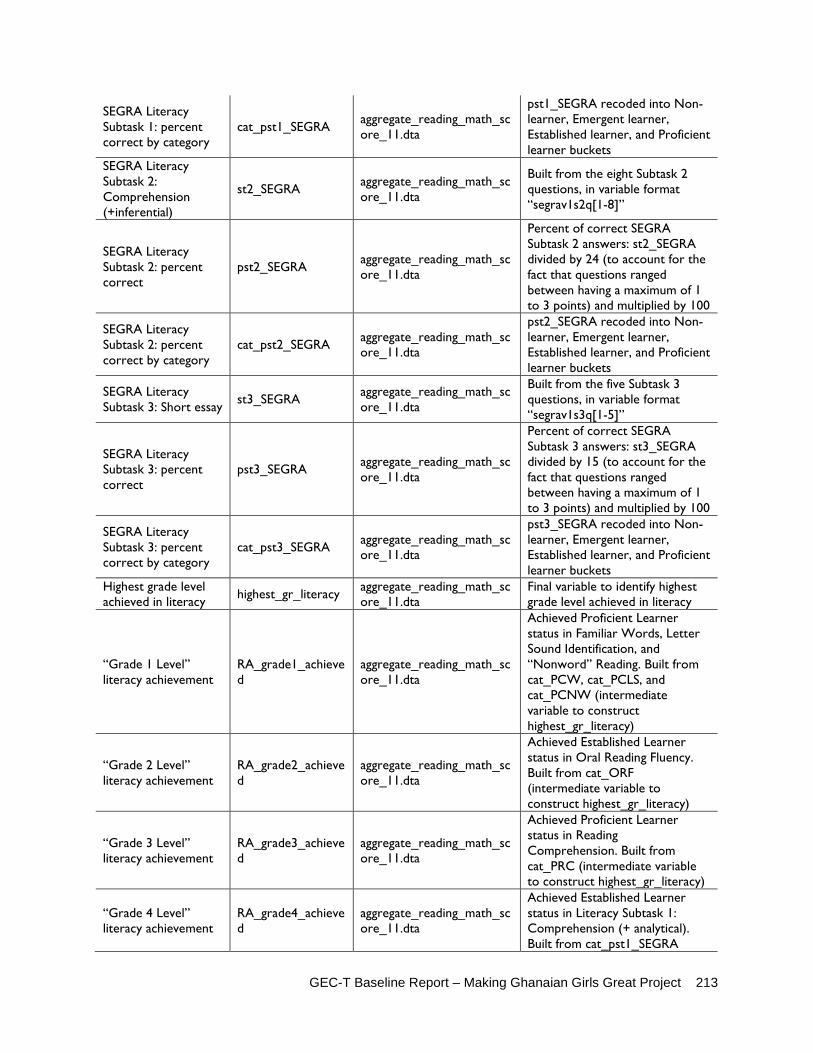
GEC-T Baseline Report – Making Ghanaian Girls Great Project 213
SEGRA Literacy Subtask 1: percent correct by category
cat_pst1_SEGRA aggregate_reading_math_score_11.dta
pst1_SEGRA recoded into Non-learner, Emergent learner, Established learner, and Proficient learner buckets
SEGRA Literacy Subtask 2: Comprehension (+inferential)
st2_SEGRA aggregate_reading_math_score_11.dta
Built from the eight Subtask 2 questions, in variable format “segrav1s2q[1-8]”
SEGRA Literacy Subtask 2: percent correct
pst2_SEGRA aggregate_reading_math_score_11.dta
Percent of correct SEGRA Subtask 2 answers: st2_SEGRA divided by 24 (to account for the fact that questions ranged between having a maximum of 1 to 3 points) and multiplied by 100
SEGRA Literacy Subtask 2: percent correct by category
cat_pst2_SEGRA aggregate_reading_math_score_11.dta
pst2_SEGRA recoded into Non-learner, Emergent learner, Established learner, and Proficient learner buckets
SEGRA Literacy Subtask 3: Short essay st3_SEGRA aggregate_reading_math_sc
ore_11.dta
Built from the five Subtask 3 questions, in variable format “segrav1s3q[1-5]”
SEGRA Literacy Subtask 3: percent correct
pst3_SEGRA aggregate_reading_math_score_11.dta
Percent of correct SEGRA Subtask 3 answers: st3_SEGRA divided by 15 (to account for the fact that questions ranged between having a maximum of 1 to 3 points) and multiplied by 100
SEGRA Literacy Subtask 3: percent correct by category
cat_pst3_SEGRA aggregate_reading_math_score_11.dta
pst3_SEGRA recoded into Non-learner, Emergent learner, Established learner, and Proficient learner buckets
Highest grade level achieved in literacy highest_gr_literacy aggregate_reading_math_sc
ore_11.dta Final variable to identify highest grade level achieved in literacy
“Grade 1 Level” literacy achievement
RA_grade1_achieved
aggregate_reading_math_score_11.dta
Achieved Proficient Learner status in Familiar Words, Letter Sound Identification, and “Nonword” Reading. Built from cat_PCW, cat_PCLS, and cat_PCNW (intermediate variable to construct highest_gr_literacy)
“Grade 2 Level” literacy achievement
RA_grade2_achieved
aggregate_reading_math_score_11.dta
Achieved Established Learner status in Oral Reading Fluency. Built from cat_ORF (intermediate variable to construct highest_gr_literacy)
“Grade 3 Level” literacy achievement
RA_grade3_achieved
aggregate_reading_math_score_11.dta
Achieved Proficient Learner status in Reading Comprehension. Built from cat_PRC (intermediate variable to construct highest_gr_literacy)
“Grade 4 Level” literacy achievement
RA_grade4_achieved
aggregate_reading_math_score_11.dta
Achieved Established Learner status in Literacy Subtask 1: Comprehension (+ analytical). Built from cat_pst1_SEGRA

GEC-T Baseline Report – Making Ghanaian Girls Great Project 214
(intermediate variable to construct highest_gr_literacy)
“Grade 5 Level” literacy achievement
RA_grade5_achieved
aggregate_reading_math_score_11.dta
Achieved Proficient Learner status in Literacy Subtask 1: Comprehension (+ analytical). Built from cat_pst1_SEGRA (intermediate variable to construct highest_gr_literacy)
“Grade 6 Level” literacy achievement
RA_grade6_achieved
aggregate_reading_math_score_11.dta
Achieved Established Learner status in Literacy Subtask 2: Comprehension (+inferential). Built from cat_pst2_SEGRA (intermediate variable to construct highest_gr_literacy)
“Grade 7 Level” literacy achievement
RA_grade7_achieved
aggregate_reading_math_score_11.dta
Achieved Proficient Learner status in Literacy Subtask 2: Comprehension (+inferential). Built from cat_pst2_SEGRA (intermediate variable to construct highest_gr_literacy)
“Grade 8 Level” literacy achievement
RA_grade8_achieved
aggregate_reading_math_score_11.dta
Achieved Established Learner status in Literacy Subtask 3: Short essay. Built from cat_pst3_SEGRA (intermediate variable to construct highest_gr_literacy)
“Grade 9 Level” literacy achievement
RA_grade9_achieved
aggregate_reading_math_score_11.dta
Achieved Proficient Learner status in Literacy Subtask 3: Short essay. Built from cat_pst3_SEGRA (intermediate variable to construct highest_gr_literacy)
EGMA
EGMA Task 1: Number Identification st1_EGMA aggregate_reading_math_sc
ore_11.dta
Built from the 20 Task 1 questions, in variable format “EGMA_Task1_[1-20]”
EGMA Task 1: percent correct PNID aggregate_reading_math_sc
ore_11.dta
Percent of correct number identification answers (out of 20) = 100*(st1_EGMA/20)
EGMA Task 1: percent correct by category
cat_PNID aggregate_reading_math_score_11.dta
PNID recoded into Non-learner, Emergent learner, Established learner, and Proficient learner buckets
EGMA Task 2: Number Discrimination
st2_EGMA aggregate_reading_math_score_11.dta
Built from the 10 Task 2 questions, in variable format “EGMA_Task2_Q[1-10]”
EGMA Task 2: percent correct PNDIS aggregate_reading_math_sc
ore_11.dta
Percent of correct numbers discriminated answers (out of 10) = 100*(st2_EGMA/10)
EGMA Task 2: percent correct by category
cat_PNDIS aggregate_reading_math_score_11.dta
PNDIS recoded into Non-learner, Emergent learner, Established learner, and Proficient learner buckets

GEC-T Baseline Report – Making Ghanaian Girls Great Project 215
EGMA Task 3: Missing number st3_EGMA aggregate_reading_math_sc
ore_11.dta
Built from the 10 Task 3 questions, in variable format “EGMA_Task3_Q[1-10]”
EGMA Task 3: percent correct PMssNum
aggregate_reading_math_score_11.dta
Percent of correct missing numbers identified answers (out of 10) = 100*(st3_EGMA/10)
EGMA Task 3: percent correct by category
cat_PMssNum
aggregate_reading_math_score_11.dta
PMssNum recoded into Non-learner, Emergent learner, Established learner, and Proficient learner buckets
EGMA Task 4A: Addition: Level 1 st4A_EGMA
aggregate_reading_math_score_11.dta
Built from the 20 Task 4A questions, in variable format “EGMA_Task4A_[1-20]”
EGMA Task 4A: percent correct PADDL1
aggregate_reading_math_score_11.dta
Percent of Level 1 additions correctly solved (out of 20) = 100*(st4A_EGMA/20)
EMGA Task 4A: percent correct by category
cat_PADDL1
aggregate_reading_math_score_11.dta
PADDL1 recoded into Non-learner, Emergent learner, Established learner, and Proficient learner buckets
EGMA Task 4B: Addition: Level 2 st4B_EGMA
aggregate_reading_math_score_11.dta
Built from the five Task 4B questions, in variable format “EGMA_Task4B_Q[1-5]”
EGMA Task 4B: percent correct PADDL2
aggregate_reading_math_score_11.dta
Percent of Level 2 additions correctly solved (out of 5) = 100*(st4B_EGMA/5)
EMGA Task 4B: percent correct by category
cat_PADDL2
aggregate_reading_math_score_11.dta
PADDL2 recoded into Non-learner, Emergent learner, Established learner, and Proficient learner buckets
EGMA Task 5A: Subtraction: Level 1 st5A_EGMA
aggregate_reading_math_score_11.dta
Built from the 20 Task 5A questions, in variable format “EGMA_Task5A_[1-20]”
EGMA Task 5A: percent correct PSUBL1
aggregate_reading_math_score_11.dta
Percent of Level 1 subtractions correctly solved (out of 20) = 100*(st5A_EGMA/20)
EGMA Task 5A: percent correct by category
cat_PSUBL1
aggregate_reading_math_score_11.dta
PSUBL1 recoded into Non-learner, Emergent learner, Established learner, and Proficient learner buckets
EGMA Task 5B: Subtraction: Level 2 st5B_EGMA
aggregate_reading_math_score_11.dta
Built from the five Task 5B questions, in variable format “EGMA_Task5B_Q[1-5]”
EGMA Task 5B: percent correct PSUBL2
aggregate_reading_math_score_11.dta
Percent of Level 2 subtractions correctly solved (out of 5) = 100*(st5B_EGMA/5)
EGMA Task 5B: percent correct by category
cat_PSUBL2
aggregate_reading_math_score_11.dta
PSUBL2 recoded into Non-learner, Emergent learner, Established learner, and Proficient learner buckets
EGMA Task 6: Word Problems st6_EGMA
aggregate_reading_math_score_11.dta
Built from the six Task 6 questions, in variable format “EGMA_Task6_Q[1-6]”
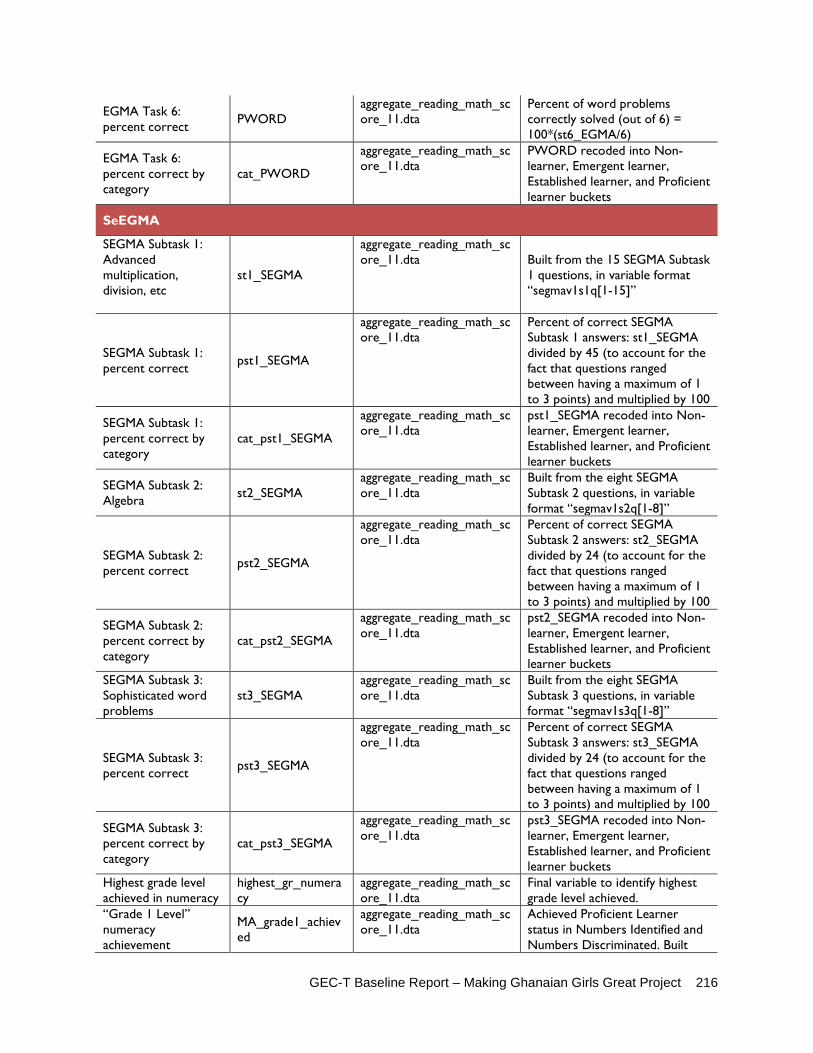
GEC-T Baseline Report – Making Ghanaian Girls Great Project 216
EGMA Task 6: percent correct PWORD
aggregate_reading_math_score_11.dta
Percent of word problems correctly solved (out of 6) = 100*(st6_EGMA/6)
EGMA Task 6: percent correct by category
cat_PWORD
aggregate_reading_math_score_11.dta
PWORD recoded into Non-learner, Emergent learner, Established learner, and Proficient learner buckets
SeEGMA
SEGMA Subtask 1: Advanced multiplication, division, etc
st1_SEGMA
aggregate_reading_math_score_11.dta Built from the 15 SEGMA Subtask
1 questions, in variable format “segmav1s1q[1-15]”
SEGMA Subtask 1: percent correct pst1_SEGMA
aggregate_reading_math_score_11.dta
Percent of correct SEGMA Subtask 1 answers: st1_SEGMA divided by 45 (to account for the fact that questions ranged between having a maximum of 1 to 3 points) and multiplied by 100
SEGMA Subtask 1: percent correct by category
cat_pst1_SEGMA
aggregate_reading_math_score_11.dta
pst1_SEGMA recoded into Non-learner, Emergent learner, Established learner, and Proficient learner buckets
SEGMA Subtask 2: Algebra st2_SEGMA
aggregate_reading_math_score_11.dta
Built from the eight SEGMA Subtask 2 questions, in variable format “segmav1s2q[1-8]”
SEGMA Subtask 2: percent correct pst2_SEGMA
aggregate_reading_math_score_11.dta
Percent of correct SEGMA Subtask 2 answers: st2_SEGMA divided by 24 (to account for the fact that questions ranged between having a maximum of 1 to 3 points) and multiplied by 100
SEGMA Subtask 2: percent correct by category
cat_pst2_SEGMA
aggregate_reading_math_score_11.dta
pst2_SEGMA recoded into Non-learner, Emergent learner, Established learner, and Proficient learner buckets
SEGMA Subtask 3: Sophisticated word problems
st3_SEGMA aggregate_reading_math_score_11.dta
Built from the eight SEGMA Subtask 3 questions, in variable format “segmav1s3q[1-8]”
SEGMA Subtask 3: percent correct pst3_SEGMA
aggregate_reading_math_score_11.dta
Percent of correct SEGMA Subtask 3 answers: st3_SEGMA divided by 24 (to account for the fact that questions ranged between having a maximum of 1 to 3 points) and multiplied by 100
SEGMA Subtask 3: percent correct by category
cat_pst3_SEGMA
aggregate_reading_math_score_11.dta
pst3_SEGMA recoded into Non-learner, Emergent learner, Established learner, and Proficient learner buckets
Highest grade level achieved in numeracy
highest_gr_numeracy
aggregate_reading_math_score_11.dta
Final variable to identify highest grade level achieved.
“Grade 1 Level” numeracy achievement
MA_grade1_achieved
aggregate_reading_math_score_11.dta
Achieved Proficient Learner status in Numbers Identified and Numbers Discriminated. Built

GEC-T Baseline Report – Making Ghanaian Girls Great Project 217
from cat_PNID and cat_PNDIS (Intermediate variable to create highest_gr_numeracy)
“Grade 2 Level” numeracy achievement
MA_grade2_achieved
aggregate_reading_math_score_11.dta
Achieved Proficient Learner status in Missing Numbers Identified, Level 1 Addition, and Level 2 Addition. Built from cat_PMssNum, cat_PADDL1, and cat_PADDL2 (Intermediate variable to create highest_gr_numeracy)
“Grade 3 Level” numeracy achievement
MA_grade3_achieved
aggregate_reading_math_score_11.dta
Achieved Proficient Learner status in Level 1 Subtraction, Level 2 Subtraction, and Word Problems. Built from cat_PSUBL1, cat_PSUBL2, and cat_PWORD (Intermediate variable to create highest_gr_numeracy)
“Grade 4 Level” numeracy achievement
MA_grade4_achieved
aggregate_reading_math_score_11.dta
Achieved Established Learner status in Numeracy Subtask 1: Advanced multiplication, division, etc. Built from cat_pst1_SEGMA (Intermediate variable to create highest_gr_numeracy)
“Grade 5 Level” numeracy achievement
MA_grade5_achieved
aggregate_reading_math_score_11.dta
Achieved Proficient Learner status in Numeracy Subtask 1: Advanced multiplication, division, etc. Built from cat_pst1_SEGMA (Intermediate variable to create highest_gr_numeracy)
“Grade 6 Level” numeracy achievement
MA_grade6_achieved
aggregate_reading_math_score_11.dta
Achieved Established Learner status in Numeracy Subtask 2: Algebra. Built from cat_pst2_SEGMA (Intermediate variable to create highest_gr_numeracy)
“Grade 7 Level” numeracy achievement
MA_grade7_achieved
aggregate_reading_math_score_11.dta
Achieved Proficient Learner status in Numeracy Subtask 2: Algebra. Built from cat_pst2_SEGMA (Intermediate variable to create highest_gr_numeracy)
“Grade 8 Level” numeracy achievement
MA_grade8_achieved
aggregate_reading_math_score_11.dta
Achieved Established Learner status in Numeracy Subtask 3: Sophisticated word problems. Built from cat_pst3_SEGMA (Intermediate variable to create highest_gr_numeracy)
“Grade 9 Level” numeracy achievement
MA_grade9_achieved
aggregate_reading_math_score_11.dta
Achieved Proficient Learner status in Numeracy Subtask 3: Sophisticated word problems. Built from cat_pst3_SEGMA (Intermediate variable to create highest_gr_numeracy)

GEC-T Baseline Report – Making Ghanaian Girls Great Project 218
RESPONDENT AND RESPONDENT HOUSEHOLD CHARACTERISTICS
Girl’s primary caregiver has no formal education
no_cg_ed, noedu_pcg hh_girls_merge.dta Built from pcg_6 in HH survey
Girl does not speak LOI, or does not speak it well
no_loi hh_girls_merge.dta Built from pcg_4enr in HH survey
Girl attends school half the time att_half hh_girls_merge.dta Built from pcg_6enr in HH
survey Girl attends school less than half the time att_lesshalf hh_girls_merge.dta Built from pcg_6enr in HH
survey Girl’s chore burden prevents attendance or enrollment at least some of the time
chore_burden hh_girls_merge.dta Built from pcg_30g in HH survey
Household survey respondent listed pregnancy as a reason girl should not attend school
pregnant hh_girls_merge.dta Built from wg_at2k_1 in HH survey
Household survey respondent gave any of the given reasons girl should not attend school
low_support hh_girls_merge.dta
Built from the following HH survey variables: • wg_at2c: work • wg_at2d: helping at home • wg_at2e: married/getting
married • wg_at2f: too old • wg_at2g: has physical or
learning needs that the school cannot meet
• wg_at2h: is unable to learn • wg_at2i: education is too
costly • wg_at2j: is a mother • wg_at2k_1: is pregnant
Household’s roof is made from mud, thatch, wood, grass/straw, cardboard, or tarp
roof_poverty hh_girls_merge.dta Built from pcg_2econ in HH survey
One of girl’s parents is not alive single_orphan hh_girls_merge.dta Built from pcg_10g2 and
pcg_13g in HH survey Both of girl’s parents are not alive double_orphan hh_girls_merge.dta Built from pcg_10g2 and
pcg_13g in HH survey Girl lives in a different household from both parents
living_wob_parent hh_girls_merge.dta Built from pcg_10g and pcg_12g in HH survey
Girl is married married hh_girls_merge.dta Built from pcg_22g in HH survey
Girl lives in female-headed household female_HH hh_girls_merge.dta Built from hh_8 in HH survey
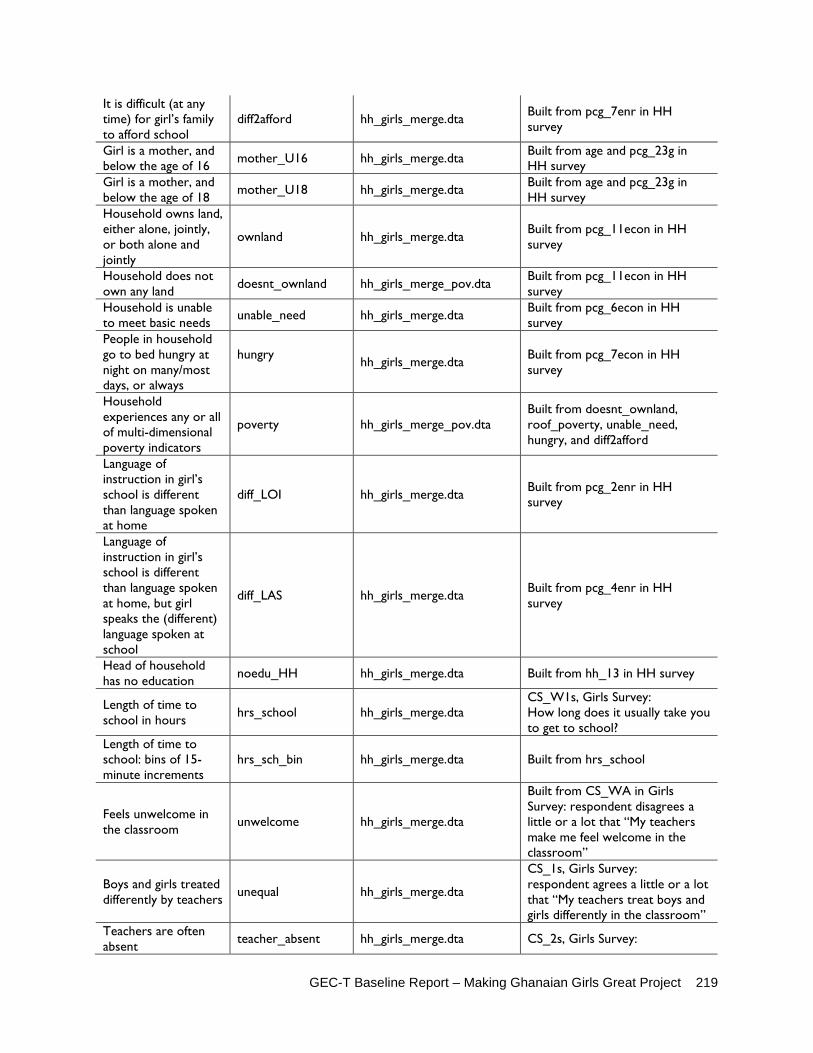
GEC-T Baseline Report – Making Ghanaian Girls Great Project 219
It is difficult (at any time) for girl’s family to afford school
diff2afford hh_girls_merge.dta Built from pcg_7enr in HH survey
Girl is a mother, and below the age of 16 mother_U16 hh_girls_merge.dta Built from age and pcg_23g in
HH survey Girl is a mother, and below the age of 18 mother_U18 hh_girls_merge.dta Built from age and pcg_23g in
HH survey Household owns land, either alone, jointly, or both alone and jointly
ownland hh_girls_merge.dta Built from pcg_11econ in HH survey
Household does not own any land doesnt_ownland hh_girls_merge_pov.dta Built from pcg_11econ in HH
survey Household is unable to meet basic needs unable_need hh_girls_merge.dta Built from pcg_6econ in HH
survey People in household go to bed hungry at night on many/most days, or always
hungry hh_girls_merge.dta Built from pcg_7econ in HH
survey
Household experiences any or all of multi-dimensional poverty indicators
poverty hh_girls_merge_pov.dta Built from doesnt_ownland, roof_poverty, unable_need, hungry, and diff2afford
Language of instruction in girl’s school is different than language spoken at home
diff_LOI hh_girls_merge.dta Built from pcg_2enr in HH survey
Language of instruction in girl’s school is different than language spoken at home, but girl speaks the (different) language spoken at school
diff_LAS hh_girls_merge.dta Built from pcg_4enr in HH survey
Head of household has no education noedu_HH hh_girls_merge.dta Built from hh_13 in HH survey
Length of time to school in hours hrs_school hh_girls_merge.dta
CS_W1s, Girls Survey: How long does it usually take you to get to school?
Length of time to school: bins of 15-minute increments
hrs_sch_bin hh_girls_merge.dta Built from hrs_school
Feels unwelcome in the classroom unwelcome hh_girls_merge.dta
Built from CS_WA in Girls Survey: respondent disagrees a little or a lot that “My teachers make me feel welcome in the classroom”
Boys and girls treated differently by teachers unequal hh_girls_merge.dta
CS_1s, Girls Survey: respondent agrees a little or a lot that “My teachers treat boys and girls differently in the classroom”
Teachers are often absent teacher_absent hh_girls_merge.dta CS_2s, Girls Survey:

GEC-T Baseline Report – Making Ghanaian Girls Great Project 220
respondent agrees a little or a lot that “My teachers are often absent for class”
Impairment impair_all hh_girls_merge.dta
Girl has any or all of the following impairments: vision, hearing, mobility, cognition, communication, self-care (built from impair_3, impair_6, impair_12, impair_13, impair_14, impair_15, impair_16, impair_17, impair_18, and impair_19 in the Household Survey)
School that girl attends is in an urban, peri-urban or rural area
rural_urban hh_girls_merge.dta Renamed Pre_8s from Girls survey

GEC-T Baseline Report – Making Ghanaian Girls Great Project 221
Qualitative Codebook
Qualitative analysis was conducted through a web-based application for mixed method research called Dedoose and using hand-coded methodologies. Using Dedoose, the participants’ information from the KIIs and FGDs were categorised by groups interviewed, region, age, gender, students grades level, caregivers’ children grade level, GES/MOE officials’ titles and positions, and teachers’ level of education. The table below details the categorization.
Table 68: Categorization of KIIs and FGDs
Groups/Individuals Interviewed Region Gender Age
Students’ Grade Level
Caregivers' Children Grade Level
GES/MOE Official Titles /Positions
Teachers Level of Education
Boys FGD Kadjebi Male 8 -15 years old Grade 3 -Grade 7 N/A N/A N/A
Boys FGD Ningo-Prampram Male 10 -19 years old P3 -JHS 1 N/A N/A N/A
Boys FGD Nkwanta South Male
11 - 14 years old P3 - P 6 N/A N/A N/A
Boys FGD Shai Osudoku Male 8 -15 years old P3 - p7 N/A N/A N/A
Male Care-Givers FGD Ada West Male
29 - 57 years old N/A P4 -JHS2 N/A N/A
Male Care-Givers FGD Adenta Male
29 - 52 years old N/A P5 - JHS 1 N/A N/A
Male Care-Givers FGD
NingoPramram Male N/A P4 - JHS 1 N/A N/A
Male Care-Givers FGD
Nkwanta South Male 45 -85 years old N/A
Grade 1 - Grade 6 N/A N/A
Girls FGD Ada West Female 8 - 16 years old Grade ,3 - 7 N/A N/A N/A
Girls FGD Ada East Female 11 - 17 years old Grade 3 - 7 N/A N/A N/A
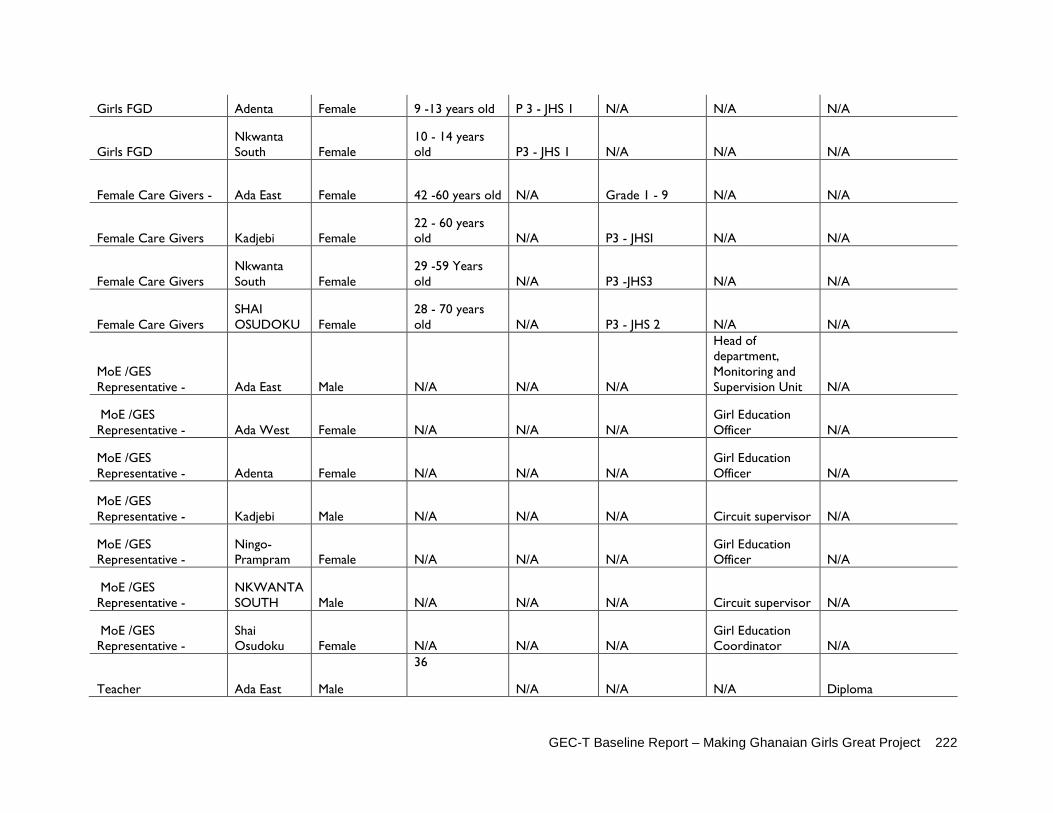
GEC-T Baseline Report – Making Ghanaian Girls Great Project 222
Girls FGD Adenta Female 9 -13 years old P 3 - JHS 1 N/A N/A N/A
Girls FGD Nkwanta South Female
10 - 14 years old P3 - JHS 1 N/A N/A N/A
Female Care Givers - Ada East Female 42 -60 years old N/A Grade 1 - 9 N/A N/A
Female Care Givers Kadjebi Female 22 - 60 years old N/A P3 - JHSI N/A N/A
Female Care Givers Nkwanta South Female
29 -59 Years old N/A P3 -JHS3 N/A N/A
Female Care Givers SHAI OSUDOKU Female
28 - 70 years old N/A P3 - JHS 2 N/A N/A
MoE /GES Representative - Ada East Male N/A N/A N/A
Head of department, Monitoring and Supervision Unit N/A
MoE /GES Representative - Ada West Female N/A N/A N/A
Girl Education Officer N/A
MoE /GES Representative - Adenta Female N/A N/A N/A
Girl Education Officer N/A
MoE /GES Representative - Kadjebi Male N/A N/A N/A Circuit supervisor N/A
MoE /GES Representative -
Ningo-Prampram Female N/A N/A N/A
Girl Education Officer N/A
MoE /GES Representative -
NKWANTA SOUTH Male N/A N/A N/A Circuit supervisor N/A
MoE /GES Representative -
Shai Osudoku Female N/A N/A N/A
Girl Education Coordinator N/A
Teacher Ada East Male
36
N/A N/A N/A Diploma
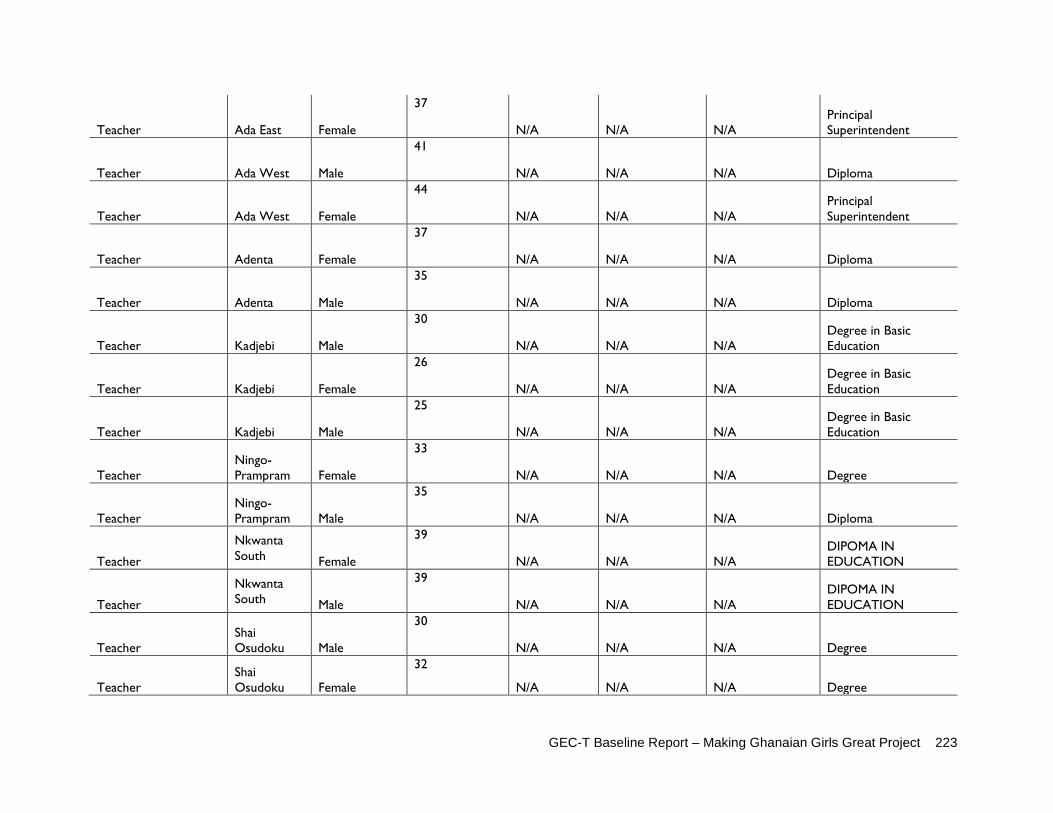
GEC-T Baseline Report – Making Ghanaian Girls Great Project 223
Teacher Ada East Female
37
N/A N/A N/A Principal Superintendent
Teacher Ada West Male
41
N/A N/A N/A Diploma
Teacher Ada West Female
44
N/A N/A N/A Principal Superintendent
Teacher Adenta Female
37
N/A N/A N/A Diploma
Teacher Adenta Male
35
N/A N/A N/A Diploma
Teacher Kadjebi Male
30
N/A N/A N/A Degree in Basic Education
Teacher Kadjebi Female
26
N/A N/A N/A Degree in Basic Education
Teacher Kadjebi Male
25
N/A N/A N/A Degree in Basic Education
Teacher Ningo-Prampram Female
33
N/A N/A N/A Degree
Teacher Ningo-Prampram Male
35
N/A N/A N/A Diploma
Teacher
Nkwanta South Female
39
N/A N/A N/A DIPOMA IN EDUCATION
Teacher
Nkwanta South Male
39
N/A N/A N/A DIPOMA IN EDUCATION
Teacher Shai Osudoku Male
30
N/A N/A N/A Degree
Teacher Shai Osudoku Female
32
N/A N/A N/A Degree
GEC-T Baseline Report – Making Ghanaian Girls Great Project 224
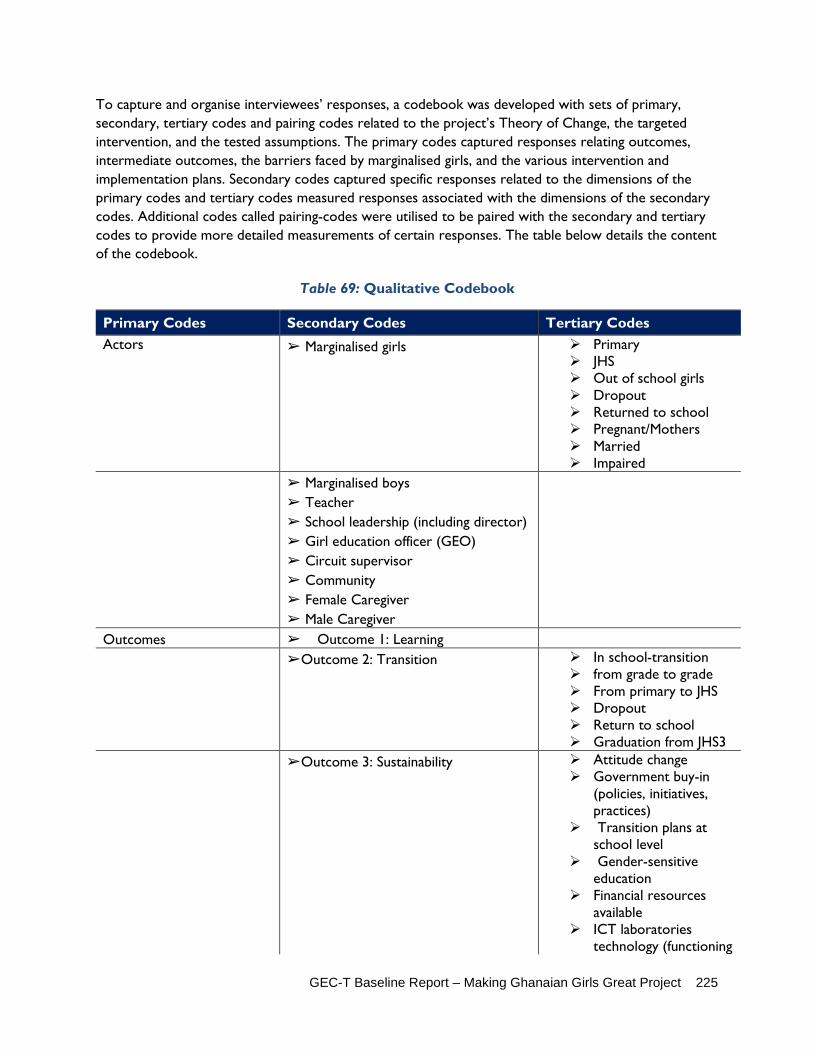
GEC-T Baseline Report – Making Ghanaian Girls Great Project 225
To capture and organise interviewees’ responses, a codebook was developed with sets of primary, secondary, tertiary codes and pairing codes related to the project’s Theory of Change, the targeted intervention, and the tested assumptions. The primary codes captured responses relating outcomes, intermediate outcomes, the barriers faced by marginalised girls, and the various intervention and implementation plans. Secondary codes captured specific responses related to the dimensions of the primary codes and tertiary codes measured responses associated with the dimensions of the secondary codes. Additional codes called pairing-codes were utilised to be paired with the secondary and tertiary codes to provide more detailed measurements of certain responses. The table below details the content of the codebook.
Table 69: Qualitative Codebook
Primary Codes Secondary Codes Tertiary Codes Actors ➢ Marginalised girls Primary
JHS Out of school girls Dropout Returned to school Pregnant/Mothers Married Impaired
➢ Marginalised boys ➢ Teacher ➢ School leadership (including director) ➢ Girl education officer (GEO) ➢ Circuit supervisor ➢ Community ➢ Female Caregiver ➢ Male Caregiver
Outcomes ➢ Outcome 1: Learning
➢Outcome 2: Transition In school-transition from grade to grade From primary to JHS Dropout Return to school Graduation from JHS3
➢Outcome 3: Sustainability Attitude change Government buy-in
(policies, initiatives, practices)
Transition plans at school level
Gender-sensitive education
Financial resources available
ICT laboratories technology (functioning

GEC-T Baseline Report – Making Ghanaian Girls Great Project 226
equipment; knowhow to operate
Intermediate Outcomes ➢Intermediate outcome 1: Attendance Increase in attendance Decrease in attendance
➢Intermediate outcome 2: Teacher Quality
Improved teaching quality
Poor teaching quality Positive comment
about corporal punishment
Negative comment about corporal punishment
➢Intermediate Outcome 3: Life Skills Improved life skills Poor life skills Increase in self-esteem Poor self-esteem Financial literacy
(economic empowerment)
Sexual/reproductive health
➢Intermediate outcome 4: School Governance
Improved school governance
Poor school governance
Supportive school environment
Unsupportive school environment
➢Intermediate outcome 5: Attitudes and Perceptions
Community members attitudes and perceptions – positive
Community members attitudes and perceptions – negative
Girls’ attitudes toward education – positive
Girls’ attitudes toward education – negative
Teachers’ attitudes towards distance learning –positive

GEC-T Baseline Report – Making Ghanaian Girls Great Project 227
Teachers’ attitudes towards distance learning—negative
Government’s perception of the MGCubed program—positive
Government’s perception of the MGCubed program—negative
Boys attitude towards education –positive
Boys attitude towards education –negative
Boys attitude towards girls -positive
Boys attitude towards girls -negative
Barriers ➢Poverty ➢ Impairment (sight, hearing, walking, talking, concentrating, learning impairment etc.) ➢ Large family size ➢ Household responsibilities ➢ Distance from school ➢ Overage for grade ➢ Pregnancy ➢ Early marriage ➢ Poor teaching quality ➢ Lack of financial support ➢ Lack of caregiver support ➢ Need to contribute to income for family/work ➢ Safety ➢ Cultural/religious norms ➢ Social norms ➢Classroom technology challenges

GEC-T Baseline Report – Making Ghanaian Girls Great Project 228
Intervention/Implementation ➢ In-school English lessons ➢ In-school math lessons ➢ After-school remedial English lessons ➢ After-school remedial math lessons ➢ After school club - Wonder Women ➢ After school club—Boys Boys ➢ Distance-learning program ➢ Adult training ➢ Teacher training ➢ Child protection and do no harm training ➢ Child protection awareness raising ➢ Health education ➢ Financial literacy ➢ Classroom technology (computer, projector, solar charger, mouse/mic, modem)
Best Quotes
Pairing-codes:
• Yes • No • Neutral • No change • Improvements

GEC-T Baseline Report – Making Ghanaian Girls Great Project 229
Once responses were coded, the documents which contained the coded information were then linked to the table which contained the respondents’ information. Through this process, Dedoose was able to portray the number of time the codes were utilised, the relationships between each code and each response, and trends within the data were identified. This coding system allowed for an in-depth analysis of each question within the KIIs, including precise quantification of qualitative responses, and these analyses helped address the projects’ evaluation questions.
Given that multiple individuals were interviewed in each FGD, a hand-coding methodology was used to provide a deeper analysis of the data. Much like the methods used in Dedoose, this hand-coded method divided the data by gender, age, and region. The Data was also broken down by topical area – perception, barriers to learning, barriers to attendance, transition, etc. The process involved first combining all FGDs together by actor (i.e. all girls FGDs, all boys FGDs, etc.). Once the FGDs were combined by actors, for each of the FGD interview questions, responses were grouped into categories (i.e. Barriers to Attendance were grouped into the most common responses – household chores, work, pregnancy). These answers were then broken down to the individual level, with age identified, and region identified by colour. This allowed for an in-depth analysis of each question within the FGDs, including precise numbers of responses, and an understanding of differences across age groups and regions.
Additionally, these micro-analyses were then divided into separate documents based on the project’s desired Outcomes and Intermediate Outcomes: Perception, Learning, Attendance, Transition. Interview questions addressing each of these topics were separated appropriately, allowing for all responses addressing each topic area, across all FGD types, to be compiled in one location. These answers were again broken down to the individual level, with age identified and region identified by colour.

GEC-T Baseline Report – Making Ghanaian Girls Great Project 230
ANNEX 9: LEARNING TEST PILOT AND CALIBRATION The learning test pilot and calibration report is attached separately.
GEC-T Baseline Report – Making Ghanaian Girls Great Project 231
ANNEX 10: SAMPLING FRAMEWORK The sampling framework is attached separately.

GEC-T Baseline Report – Making Ghanaian Girls Great Project 232
ANNEX 11: CONTROL GROUP APPROACH VALIDATION Coarsened Exact Matching (CEM) with Difference-in-Difference approach. The evaluation team has adopted Coarsened Exact matching (CEM) approach— a statistical matching approach to select new control schools that would be suitably comparable to GEC-T schools. Matching techniques generally attempt to establish a valid control group by matching observable baseline characteristics of a set of control schools to those of treatment schools such that the differences between treatment and control are minimized and approximate the results of a randomised selection. The advantage of making a new selection of control schools is that it may be possible to find controls with more similar GEC-T baseline characteristics as treatment schools (e.g. better learning outcomes, better equipped school environments).
A CEM approach has several advantages over other quasi-experimental approaches.1 In recent literature, CEM has been shown to be more effective than other common approaches, including propensity score matching (PSM), at reducing model dependence, imbalance, and bias. By using the CEM approach, the evaluation team temporarily ‘coarsen’ the observed variables used for matching into distinct bins/strata. Every combination of coarsened values, for all variables included in the matching, represents a unique stratum, and observations with the same coarsened value on every included variable is placed into the same strata.
Successfully executing CEM, however, requires several additional tasks in terms of sampling. The matching process requires robust school-level data to permit matching of treatment and control schools, assuming enough similar schools exist in a given area. ET used EMIS 2015 data for Ghana to create our sample frame for the Greater Accra and Volta region. Out of a total of more than 5,000 schools in Greater Accra and Volta region the ET restricted the sample frame to 743 schools (including 72 treatment schools) from seven districts from these two regions. The restriction of the sample frame to these seven districts were purposive. To create a set of marginalised comparison girls with similar socio-economic background as we find among marginalised beneficiary girls, ET decided to confine its sample frame within the same seven GEC-1 treatment districts from Greater Accra and Volta region in Ghana. As per the agreement among FM, project and the ET, all GEC-1 control schools were left out of the GEC-T sample frame from ethical stand point.
To execute CEM matching, ET used basic school level characteristics from the EMIS dataset (Table 70 below) that are available across both treatment and control groups. In the process ET coarsened the continuous variables and created categorized (and dummy variables) to come up with a strong matched set of control schools. In the process CEM created 24 strata within which all these treatment and control schools were a distributed. The control schools in each stratum correspond to their exact matches from each treatment group.
Matching with DID: To account for differences in outcomes between control and treatment groups at the start of GEC-T, the evaluation will utlilises a difference-in-difference (double-difference, DID) methodology in mid and end line by adjusting for baseline differences and comparing differences over time. in order to control for time-confounding effects and adjust for any baseline inequivalence. To capture similar socio-economic background of marginalised students as we find in treatment schools, ET decided to confine

GEC-T Baseline Report – Making Ghanaian Girls Great Project 233
its sample frame within the seven treatment districts from Greater Accra and Volta region in Ghana. There is a risk of adopting this approach as contamination among control schools due to teachers training by district education board is a possibility. In that situation ET will implement a triple difference approach (DDD) to statistically eliminate this bias. There is a risk of adopting this approach as contamination among control schools due to teachers training by district education board is a possibility.
BALANCE STATISTICS
Validation of Statistical Balance among Schools from EMIS data
To ensure that control schools are exact matches to the treatment schools, balancing tests was performed across a set of variables measured at baseline to use for matching. ET also used some more variables from EMIS data to avoid excludability bias. The ET used ‘IEBALTAB’ stata command to examine the balance between two groups. In doing so, schools were clustered by district for robust variance and better match. The corresponding p-values in the following table show that the matched groups are well balanced.
Table 70: Balance between treatment and control schools for matching covariates
Control (1)
Treatment (2) (1)-(2)
Variable Mean Mean p-value
Proportion of girls in school 0.486 0.491 0.396
Presence of School Management Committee 1 1 N/A
Class room condition either good or require repair 1.368 1.403 0.459
School has non-tech. admin. staff 0.000 0.014 0.353
Number of days the school is open 20.860 20.847 0.921
School provides special education 0 0 N/A
Functional girls toilet in school (Between 3 and 6) 0.526 0.635 0.106
Functional girls toilet in school (More than 7) 0.018 0.016 0.929
School has computer available for study purpose 0.263 0.264 0.994
Whether there is any feeding program in school 1 1 N/A
Locality type is rural 0.877 0.875 0.981
School has computer for administrative purposes (a) 0.193 0.250 0.342
School has library books available for students (a) 0.351 0.347 0.951
School has performance improvement plan (a) 0.877 0.861 0.861
School has non-tech. library staff (a) 0.035 0.042 0.812
N umber of matched schools 72 72
H0: F-test of joint significance (p-value) 0.000***
F-test, number of observations 144

GEC-T Baseline Report – Making Ghanaian Girls Great Project 234
Note: All variables with (a) in the end indicates variables not used for matching but used to check balance among excluded variables. The covariate variable cem_strata is included in all estimation regressions.
All missing values in balance variables are treated as zero.
***, **, and * indicate significance at the 1, 5, and 10 percent critical level. Data Source: EMIS 2015 Ghana
Validation of Statistical Balance among Schools from Baseline Survey data
Estimated balance statistics in Table 70 shows the balance of key school level characteristics used to gauge the success of school matching as part of the CEM approach. The ET wanted to confirm the validity of the matching in the surveyed schools in baseline by re-examining the balance across treatment and control schools from baseline data. To confirm balance across treatment and control schools, the ET used unequal Welch t-test for a set of school level variables and average aggregate scores of marginalised girls in numeracy and literacy. The detailed list of variables used in Table 71 represents head teacher and other teachers’ information, school infrastructure, school management, other basic information and average aggregate scores in literacy and numeracy.
At baseline, control and treatment sampled are well balanced across school and individual level characteristics. Evidence shows that except for two indicators, “whether the PTA helps students with school levies” and “whether the school has library,” the treatment and control groups are strongly matched across all variables included. For student level information, the ET considered only aggregate measures of literacy and numeracy because these are the two principal indicators of the evaluation. Table 71 also shows that the schools across treatment and control groups have similar school level characteristics and average aggregate scores in numeracy after matching.
Table 71: Balance across treatment and control schools
Mean Treatment
(n=72) Control (n=72)
[Treatment-Control]
P -value
A. Head teachers information
How many total years of experience do you have in the education field 19.9 20.0 -0.2 0.92 B. Teachers' information
How many teachers are employed at this school 16.3 16.6 -0.3 0.79 How many of these full-time teachers are women 7.5 8.6 -1.2 0.28 How many teachers work at this school on part-time 4.0 4.7 -0.7 0.65 How many of these part-time teachers are women 1.3 1.6 -0.3 0.60 How many of these part-time teachers are men 1.2 1.9 -0.8 0.23 What is the average number of hours taught per day 6.4 6.3 0.1 0.52 How many female teachers at this school have received any type of in-service training
5.8 6.6 -0.8 0.41
How many male teachers at this school have received any type of in-service train
6.0 5.6 0.4 0.53
Does the PTA help students with their school levies (Y/N) 0.8 0.6 0.2 0.02 How many times has a District Circuit Supervisor visited in the last year
12.8 11.5 1.4 0.48

GEC-T Baseline Report – Making Ghanaian Girls Great Project 235
C. School Infrastructure
Does the school have a library? (Y/N) 0.5 0.4 0.2 0.03 Does the school have computers that students can use or a computer room (Y/N)
0.4 0.3 0.1 0.17
D. School Management
Does this school have an active parent-teacher association (Y/N) 0.9 0.8 0.1 0.18 How many times does the PTA meet each school year 4.3 4.8 -0.4 0.24 Does this school have an active school management committee (Y/N) 0.8 0.7 0.1 0.22 How many times does the school management committee meet each school year
4.0 4.1 -0.1 0.88
Does the school management committee participate in the preparation of the school (Y/N)
0.9 0.9 0.0 0.62
E. Basic Information
Does the school have after-school extracurricular activities (Y/N) 0.8 0.7 0.1 0.13 Is food provided to students at the school (Y/N) 0.5 0.5 0.0 0.87 Does this school encourage student-centered, gender-sensitive education (Y/N)
1.0 0.9 0.1 0.20
How many days has school been closed this year so far for reasons other than holidays
2.1 1.8 0.3 0.56
Is the language of instruction different from what most students speak at home (Y/N)
0.9 0.9 0.0 0.60
F. Average aggregate scores
Average aggregate score in Numeracy (EGMA + SeGMA) (out of 100) 45.9 44.6 1.2 0.35 Average aggregate score in literacy (EGRA+ SeGRA) (out of 100) 35.3 35.0 0.3 0.86
Note: Table is prepared from Baseline survey data. The ET used Welch t-test for unpaired data. Values of all yes/no questions are a proportions where 1 is equal to yes.
To examine balance at the student level, the ET compared characteristics of household and girls from treatment and control groups of girls based on their individual characteristics. Indicators used for balance at the student level include barriers to education, marginalisation characteristics, and gender equity of a teacher’s teaching. Table 72 shows that girls in both treatment and control schools possess similar characteristics—suggesting treatment and control schools are well balanced. The only exception found is the poverty measure across treatment and control girls in terms of roofing of a home. The incidence of poverty using this measure is significantly higher among control girls.
Table 72: Balance across treatment and control girls and households
Treatment (n=1340)
Control (n=1332)
Difference [T-C]
P value
Language used at home is different than LOI 92% 93% -0.3% 0.80 The PCG has no education 3% 3% -0.6% 0.36 HH has no education 37% 36% 1.7% 0.37 Living without both parents 18% 18% -0.2% 0.90 The girl is married 1% 1% -0.1% 0.82
Live in female headed household 39% 36% 3.3% 0.08 Mother below age 16 1% 0% 0.2% 0.37 Mother at age of 18 or below 1% 0% 0.2% 0.44 Teacher makes her feel unwelcome in the classroom 4% 4% 0.6% 0.43
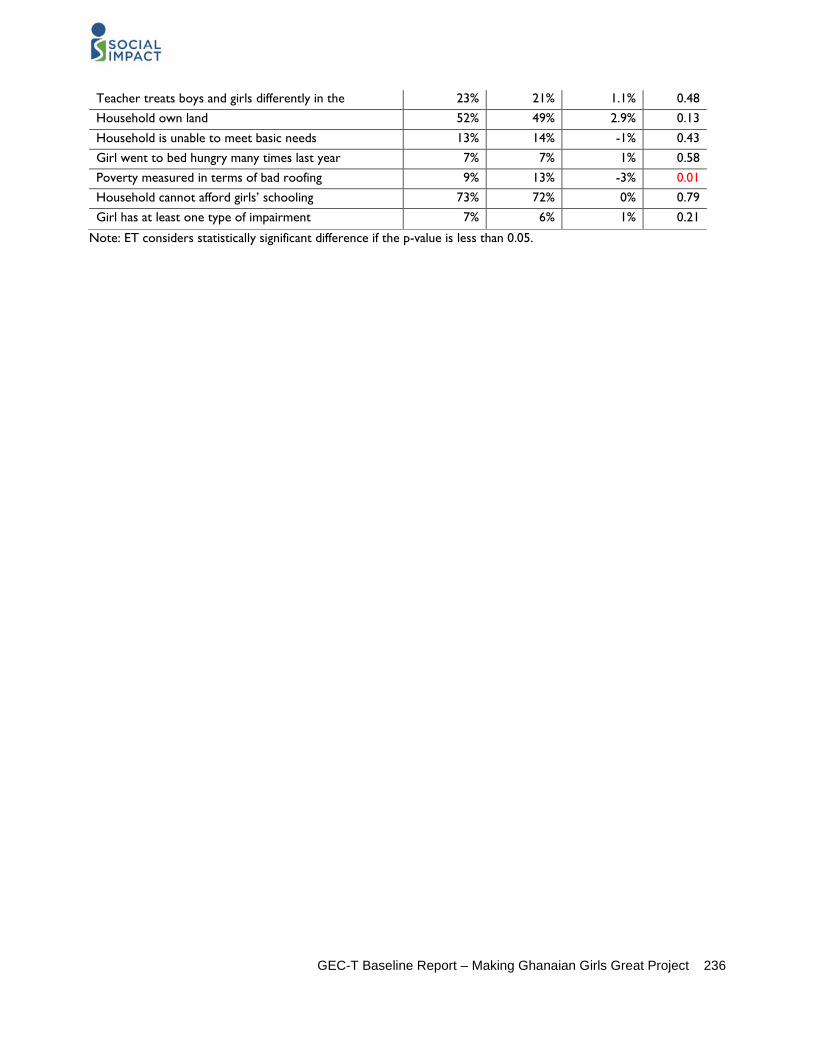
GEC-T Baseline Report – Making Ghanaian Girls Great Project 236
Teacher treats boys and girls differently in the 23% 21% 1.1% 0.48 Household own land 52% 49% 2.9% 0.13
Household is unable to meet basic needs 13% 14% -1% 0.43 Girl went to bed hungry many times last year 7% 7% 1% 0.58 Poverty measured in terms of bad roofing 9% 13% -3% 0.01 Household cannot afford girls’ schooling 73% 72% 0% 0.79 Girl has at least one type of impairment 7% 6% 1% 0.21
Note: ET considers statistically significant difference if the p-value is less than 0.05.
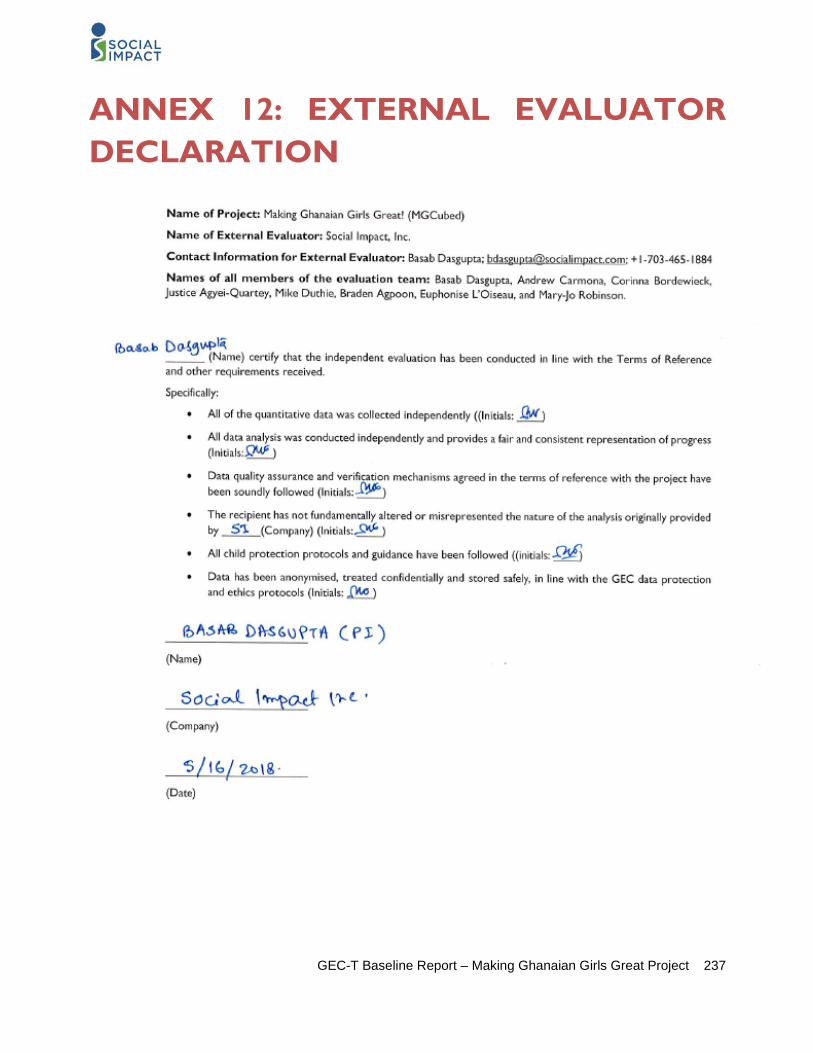
GEC-T Baseline Report – Making Ghanaian Girls Great Project 237
ANNEX 12: EXTERNAL EVALUATOR DECLARATION

GEC-T Baseline Report – Making Ghanaian Girls Great Project 238
ANNEX 13: PROJECT MANAGEMENT RESPONSE This annex gives the project the chance to prepare a short and concise management response to the evaluation report before the report is published.
The project welcomes the External Evaluators thoughtful recommendations and supports the active engagement with the project’s implementation. As articulated in the Project Appropriateness section, there are a number of areas which the project has considered – and will continue to consider – as a result of the Baseline findings. Overall, the project is supportive of the study’s findings and associated recommendations. The first part of this response considers the stated recommendations (Tables 1 , 2, 3), presenting the Varkey Foundation’s response to the recommendation and plans for taking it forward. The second part of the response presents some additional areas which the project would like to highlight and implications for its approach.
Table 73: Recommendations on design and implementation Recommendation Evidence VF response Carry out a study to identify children with cognitive disabilities in treatment catchment areas. Consider targeting these children specifically with specialized lessons.
Cognitive disability is both the largest type of disability found in the sample and the most insidious: it is one of the only factors in regression analysis that significantly negatively affects both learning and transition. Given its non-physical appearance, it may be difficult to detect in children.
The project is in support of this proposal, but would emphasise that – at present – the identification of cognitive disabilities is not an area the team has specialised knowledge of. This area of work would require the engagement of an educational psychologist, and is thus an additional piece of work which the project does not have the funds for.
In terms of specialised lessons, at present the project does not have the capacity to provide specialised, targeted lessons for pupils with cognitive impairments; though through effective differentiation and promotion of inclusive educational approaches the Master Teachers are able to ensure lessons cater for all groups. For instance, the Education Team began using a dyslexia font to support lessons.

GEC-T Baseline Report – Making Ghanaian Girls Great Project 239
Further, the project does recognise that educators in schools need to be supported to implement inclusive practice in their schools, and the project is therefore actively planning to incorporate this content into the planned training sessions with adults.
As articulated in the Project Appropriateness response, the project is keen to develop its expertise in this area however, and would welcome a discussion with the Fund Manager on this issue.
Include curriculum in community trainings on gender equitable roles and responsibilities of boys and girls, particularly around household duties.
Across the board, all marginalised girls experienced a high burden of household chores. While the regression model demonstrates no significant effect on learning scores, it does have a significant negative effect on transition. The ET hypothesises that the need to take care of the household after P6 may be a major reason for dropping out of school for many girls. Qualitative data suggests that girls carry the lion share of household duties.
This recommendation is appropriate, but speaks to an existing part of the project. Through Afterschool Clubs and Adult Training the project explicitly targets attitudinal and behavioural change in these areas. The project has reflected on its current planned content and resolves that it could do more with the community, which it has only recently started offering training content to. In terms of gender, Community training sessions are structured around the following themes
• Importance of education
• Gender sensitivity
• Violence awareness and prevention
Thus far the training content has been well received and the project reports a high level of awareness of gendered differences in education and the
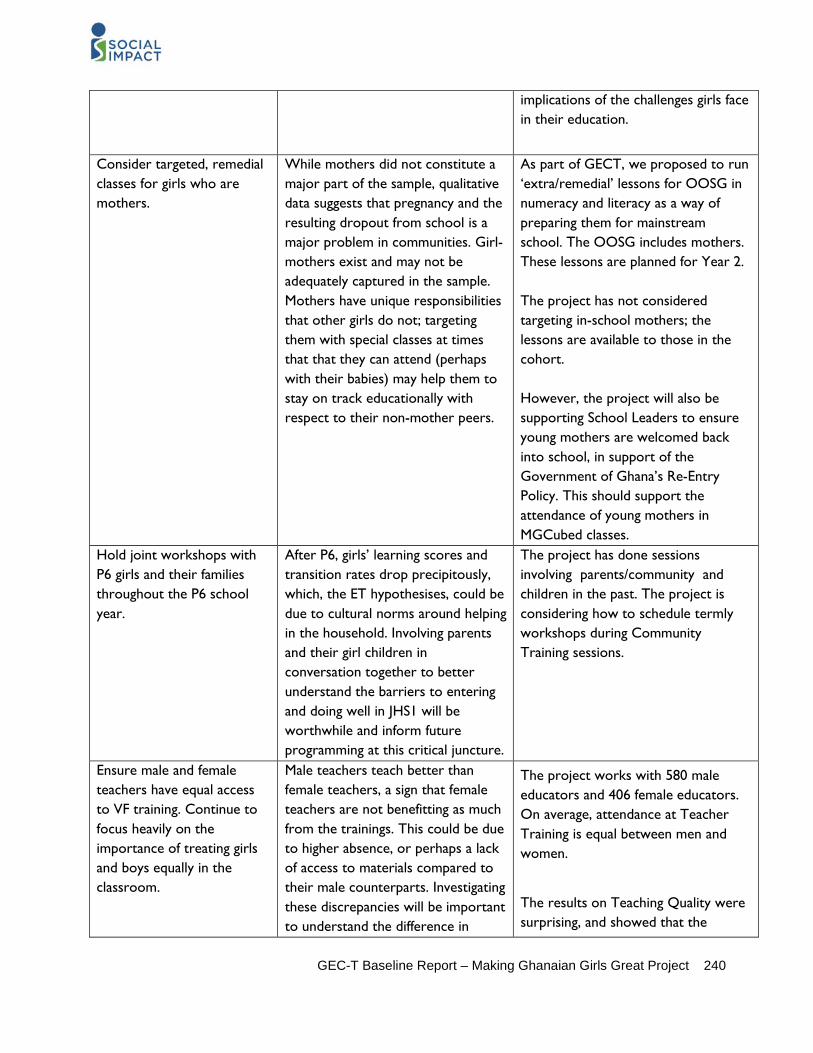
GEC-T Baseline Report – Making Ghanaian Girls Great Project 240
implications of the challenges girls face in their education.
Consider targeted, remedial classes for girls who are mothers.
While mothers did not constitute a major part of the sample, qualitative data suggests that pregnancy and the resulting dropout from school is a major problem in communities. Girl-mothers exist and may not be adequately captured in the sample. Mothers have unique responsibilities that other girls do not; targeting them with special classes at times that that they can attend (perhaps with their babies) may help them to stay on track educationally with respect to their non-mother peers.
As part of GECT, we proposed to run ‘extra/remedial’ lessons for OOSG in numeracy and literacy as a way of preparing them for mainstream school. The OOSG includes mothers. These lessons are planned for Year 2. The project has not considered targeting in-school mothers; the lessons are available to those in the cohort. However, the project will also be supporting School Leaders to ensure young mothers are welcomed back into school, in support of the Government of Ghana’s Re-Entry Policy. This should support the attendance of young mothers in MGCubed classes.
Hold joint workshops with P6 girls and their families throughout the P6 school year.
After P6, girls’ learning scores and transition rates drop precipitously, which, the ET hypothesises, could be due to cultural norms around helping in the household. Involving parents and their girl children in conversation together to better understand the barriers to entering and doing well in JHS1 will be worthwhile and inform future programming at this critical juncture.
The project has done sessions involving parents/community and children in the past. The project is considering how to schedule termly workshops during Community Training sessions.
Ensure male and female teachers have equal access to VF training. Continue to focus heavily on the importance of treating girls and boys equally in the classroom.
Male teachers teach better than female teachers, a sign that female teachers are not benefitting as much from the trainings. This could be due to higher absence, or perhaps a lack of access to materials compared to their male counterparts. Investigating these discrepancies will be important to understand the difference in
The project works with 580 male educators and 406 female educators. On average, attendance at Teacher Training is equal between men and women.
The results on Teaching Quality were surprising, and showed that the

GEC-T Baseline Report – Making Ghanaian Girls Great Project 241
teaching scores. Further, regression analysis shows that when girls feel there is differential treatment between the sexes by a teacher at school, their learning scores are significantly worse.
project needs to invest in raising standards for facilitators especially. A number of existing activities are in the pipeline for this area:
• The project is creating Facilitator standards that align with the Master Teacher standards, and expectations for different facilitator levels of experience (i.e. new to the project or part of GEC1
• The development of more formalised Scopes of Work for the facilitator training that takes place at the beginning of each term
However, the project also notes that despite the Facilitator group performing less well than the non-Facilitator (teacher) group this is in in part due to the fact that of 148 facilitators only 67 (under 50%) are “old” (i.e. they were part of the GEC1 project).
In terms of gender-sensitive instruction, with an emphasis on making girls feel welcome in the school and classroom, this is a core part of the project’s approach to inclusion (as indicated above in relation to disability). However in light of the data on disability numbers the project recognises the need to sharpen focus on disabled pupils, especially girls, for whom a feeling of being unwelcome combined with a disability has been shown to have a

GEC-T Baseline Report – Making Ghanaian Girls Great Project 242
particularly negative effect on learning outcomes.
In terms of encouraging women educators to attend training, the project functions to support all educators. School Leaders are encouraged to ensure all teacher attend training, however the project recognises that for some teachers the training time is inconvenient. There is no immediate reason for why the timing is more inconvenient for women than men, and the attendance data does not indicate a differential between men and women’s attendance (women are actually over-represented at the training). What the project will endeavour to do is carefully target follow-up support to female teachers to ensure the full benefits of the training are being realised.
Include technology performance-related indicators in the sustainability plan and in output indicators.
Quantitative and qualitative data both demonstrate that the equipment can and does break down from time to time, with 28% of head teachers reporting that at least one piece of equipment does not work most of the time. Average time to fix a broken piece of equipment is 6.7 days, with a median of 3 days. Days lost to broken equipment could be significant for students’ learning. It is important that VF include indicators around the performance of technology to better understand and prepare for what will happen once the project ends.
This recommendation has been adopted (see Table 2 below).
Involve local community actors (PTA/SMC, parents,
Headteachers report that they manage the technology and will
This is already happening and is captured as part of Outcome 3

GEC-T Baseline Report – Making Ghanaian Girls Great Project 243
GES) in management of the technology packages.
manage it in the future. Involving PTA/SMC, parents, and/or other community members may help to create ownership of the technology packages, reducing the risk of vandalism and increasing the knowhow in terms of operation and maintenance. This will be especially important for sustainability after the program ends.
(Community acting as guardians of technology). However, these approaches can be strengthened. The data shows that there is a strong assumption that the project will continue to support the technology. The project needs to develop a clearer line of communication on what is expected, and potentially use facilitators to drive orientation on the technology with the GES and PTA/SMC to ensure skills are being transferred in a sustainable manner.
Encourage parents to join PTAs and support PTAs with resources as necessary. At PTA meetings, push the idea of dedicated reading time at home between parents and their children.
Regression analysis clearly shows that when a parent is involved with a PTA and when PTAs meet more frequently, transition and learning scores are significantly higher. Given the national focus on PTAs, GES could be involved in providing funds and marketing for more PTA involvement. Regression analysis showed that when a child reads at home, she has significantly higher learning scores.
Support to the PTA/SMCs is part of the support the Community Team offers. The team is developing a comprehensive package of support to members, through both Community Training but also targeted training delivered within existing PTA/SMC meetings to sensitise members of the community on the need to reduce household chores as part of a supportive approach to girls’ education. Further, DEOs will be making available the services of the training officers to work with VF to strengthen SMCs/PTAs to deliver quality services to the schools. In terms of encouraging parents to read with their children in the home, during Community Training the project encourages those who are in the position to read to support their wards should do so, and for those who cannot read to be able to identify when their child is struggling by following up on their school performance with teachers.
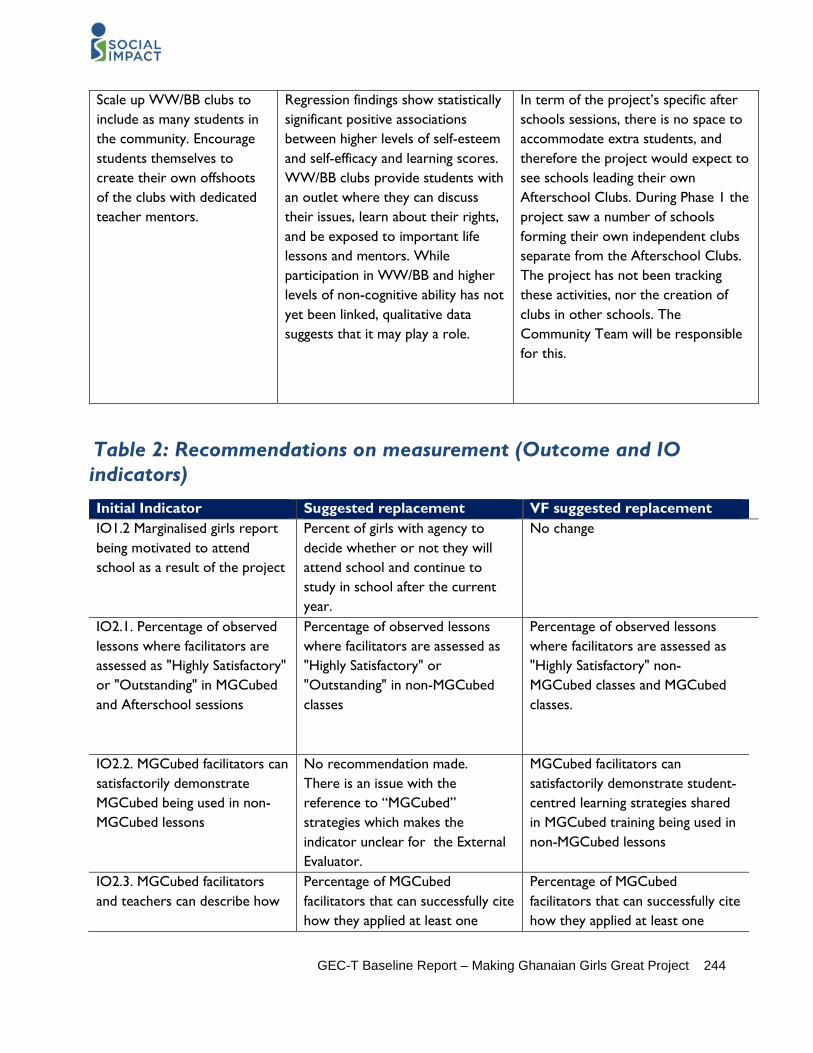
GEC-T Baseline Report – Making Ghanaian Girls Great Project 244
Scale up WW/BB clubs to include as many students in the community. Encourage students themselves to create their own offshoots of the clubs with dedicated teacher mentors.
Regression findings show statistically significant positive associations between higher levels of self-esteem and self-efficacy and learning scores. WW/BB clubs provide students with an outlet where they can discuss their issues, learn about their rights, and be exposed to important life lessons and mentors. While participation in WW/BB and higher levels of non-cognitive ability has not yet been linked, qualitative data suggests that it may play a role.
In term of the project’s specific after schools sessions, there is no space to accommodate extra students, and therefore the project would expect to see schools leading their own Afterschool Clubs. During Phase 1 the project saw a number of schools forming their own independent clubs separate from the Afterschool Clubs. The project has not been tracking these activities, nor the creation of clubs in other schools. The Community Team will be responsible for this.
Table 2: Recommendations on measurement (Outcome and IO indicators) Initial Indicator Suggested replacement VF suggested replacement IO1.2 Marginalised girls report being motivated to attend school as a result of the project
Percent of girls with agency to decide whether or not they will attend school and continue to study in school after the current year.
No change
IO2.1. Percentage of observed lessons where facilitators are assessed as "Highly Satisfactory" or "Outstanding" in MGCubed and Afterschool sessions
Percentage of observed lessons where facilitators are assessed as "Highly Satisfactory" or "Outstanding" in non-MGCubed classes
Percentage of observed lessons where facilitators are assessed as "Highly Satisfactory" non-MGCubed classes and MGCubed classes.
IO2.2. MGCubed facilitators can satisfactorily demonstrate MGCubed being used in non-MGCubed lessons
No recommendation made. There is an issue with the reference to “MGCubed” strategies which makes the indicator unclear for the External Evaluator.
MGCubed facilitators can satisfactorily demonstrate student-centred learning strategies shared in MGCubed training being used in non-MGCubed lessons
IO2.3. MGCubed facilitators and teachers can describe how
Percentage of MGCubed facilitators that can successfully cite how they applied at least one
Percentage of MGCubed facilitators that can successfully cite how they applied at least one

GEC-T Baseline Report – Making Ghanaian Girls Great Project 245
they are applying MGCubed in non-MGCubed lessons
MGCubed technique in a non-MGCubed lesson
MGCubed technique in a non-MGCubed lesson
IO2.4. Varkey Foundation actively reflects on the level of teaching quality improvement and mechanisms contributing to it and participates in policy and research discussion teaching quality and learning outcomes and identifiable non-cognitive outcomes
Number of policy briefs published by VF annually on teaching quality, learning outcomes, and non-cognitive abilities
Varkey Foundation uses learning on how to improve teaching quality to influence policy discussions and the wider policy agenda
IO3.3. Community members report changes in girls' attitudes and behaviours
Percentage of caregivers reporting girls’ attitudes on education have changed positively in the past year
No change. This is an indicator with a qualitative element that the project feels is important to capture.
IO4.1. Percentage of schools assessed as having "Highly satisfactory" or "Outstanding" school leadership and management
Percentage of schools assessed as having "Highly satisfactory" or "Outstanding" school management
No change
IO4.2. Percentage of schools where the cane is either used or its use permitted.
Percentage of classrooms where the cane is used
Percentage of classrooms where the cane is used
IO5.1. Community members demonstrate an understanding of the importance of girls' education
Percent of caregivers who can cite one way in which they changed with respect to girls’ education in the past year.
Percent of caregivers who can cite one way in which they changed with respect to girls’ education in the past year.
IO5.2. Community members express support for Afterschool club content
Percent of community members (or caregivers) who can specify afterschool club content and express support for it
Percent of community members (or caregivers) who can specify afterschool club content and express support for it
IO5.3. Community acts as guardians for technology packages in schools
Percent of caregivers (or PTA/SMC) who have been trained in how to maintain technology packages
No change. This indicator is measured using data from the project, i.e. thefts and security.
Table 3: Recommendations on Sustainability indicators Initial Indicator Suggested replacement VF suggested replacement Indicator 1.1. Girls report that family members are supportive of their education
Percentage of girls that report having been forced to stay home
Percentage of girls that report having been forced to stay home from school

GEC-T Baseline Report – Making Ghanaian Girls Great Project 246
and/or does not provide a barrier to attendance or achievement
from school for any one day in the past school term.
for any one day in the past school term due to a family-related issue.
Indicator 1.2. Community members are not found to act as a barrier to girls going to girls' transition
Percentage of caregivers who respond that they will allow their children to continue in school next year.
Percentage of caregivers reporting that they will allow their children to continue in school next year.
Indicator 2. 1 Schools develop and adopt plans to facilitate transition to secondary school
No recommendation made Number of schools where there is an established process and/or approach to supporting girls’ transition to secondary school
New indicator 2.3. Percentage of school directors who are able to repair or replace broken equipment other than through the Varkey Foundation
NA Percentage of technical issues solved by schools other than through the Varkey Foundation (This requires a definition of what school staff can realistically be expected to solve)
Indicator 3.1: DEO staff collaborate with the Varkey Foundation to update and review school and classroom monitoring tools
Proportion of DEOs in all districts where VF operates who attend monitoring tool workshops and who use updated monitoring tools.
Proportion of DEOs in all districts where VF operates who attend monitoring tool workshops and who use updated monitoring tools as a result of the training.
Indicator 3.2: Varkey Foundation supports the Ministry of Education in the translation of lessons learnt in GEC to inform policy and practice
Number of policies, initiatives, or plans at the MOE that the Varkey Foundation supports with technical assistance over the life of the project.
Number of policies, initiatives, or plans at the MOE/GES that the Varkey Foundation supports with technical assistance over the life of the project.
Indicator 3.3:
Government officials formally recognise the GEC project and its contribution to promoting girls' education in Ghana
Number of GES officials trained in use of the technology packages and who believe they will be able to implement and maintain technology packages.
Number of GES officials and Headteachers who believe they will be able to implement and maintain technology packages in the future.
Additional areas for response
In addition, a number of other areas where the Varkey Foundation feels it can usefully respond are noted below.
Learning Outcomes

GEC-T Baseline Report – Making Ghanaian Girls Great Project 247
The External Evaluator’s conclusions regarding the literacy and numeracy results were supportive of the project’s Theory of Change, with the grade progression clearly aligning with the project’s arrangement of MGCubed classes into ability groups (Basic, Intermediate, and Advanced) as well as in-grade classes during schooltime. Of particular note is the finding that “Girls and boys perform similarly until P6 at which point boys begin to score significantly better than girls” in literacy, and also numeracy. This evidence supports the project’s Theory of Change in as far as girls requiring additional support to stay focused on education at this critical juncture. It is also a reflection of the major barriers girls face as they get older, including the pressure to take on the burden of household chores, the threat of early marriage and attention from men/boys, and the need to generate income for the household.
In addition to the Baseline’s key conclusions regarding Learning Outcomes, the project identifies the following findings as important:
1. Key skills gaps in literacy and numeracy
The Baseline findings point to critical skills gaps amongst both girls and boys. For now, the project will not comment on the SeGRA and SeGMA results, given the limited experience pupils, the project, and the External Evaluator has in administering these assessments. What we can observe is that the inclusion of SeGRA and SeGMA subtasks for pupils brought down the average aggregate score for these pupils quite considerably, despite the subtasks being aligned with the national curriculum.
In literacy, we saw between 30-42% of the treatment sample classed as “Non-learners” in the non-familiar word identification, reading comprehension, and listening comprehension, though in the first two sub-tasks (Familiar word identification and Letter Identification) we saw that treatment pupils performed far better. As a result, this meant that a large proportion of treatment sample pupils were classified as having achieved “No Grade” due to a poor performance in Subtask 3 (Non-familiar word), where for instance the average score for this Subtask was 31.8% amongst JHS1 girls.
The “No Grade” group included over 30% of JHS1 girls, 40% of P6, and nearly 60% of P5, all of whom have benefitted from at least 2.5 years of the project. The project would have expected to see a slightly better performance in the Non-familiar word subtask, along with Reading and Listening Comprehension, but project recognises that this does not take away clearly positive results, for instance more than 60% of girls in numeracy and 40% in literacy are considered “established learners”.
In numeracy we saw higher overall aggregate scores than in literacy, a pattern which mirrors that of the Baseline to Midline trend in the pilot project. The project is heartened to see that treatment pupils performed well on EGMA subtasks 1-3, with performance faltering amongst the higher grades who attempted Subtasks 4 and 5 (Addition Level 2 and Subtraction). That nearly 64% of both treatment boys and girls are considered to be “established learners” is also particularly pleasing.
Again, large proportions of girls in JHS1 (38.1%), P6 (48.1%), and P5 (56.7%) were considered to have “No Grade”, suggesting that while the SeGRA and SeGMA subtasks may have brought down aggregate performance these girls face challenges with the more basic EGMA subtasks (Number Identification, Quantity Discrimination, and Missing Number Identification). While P3 and P4 girls and boys had more trouble with Subtasks 1 and 2 than the higher grades, we see that Subtask 3 (Missing Number) posed a problem for pupils in P5, P6,JHS1. The poor performance in this subtask explains why such a large proportion of pupils failed to receive a grade.

GEC-T Baseline Report – Making Ghanaian Girls Great Project 248
On the face of it, the “No Grade” status was disheartening, but upon a more focused analysis of the grading methodology the team feels these results make sense, particularly given the favourable comparison with the matched control sample. However, the project is agreement with the External Evaluator with regards to the grade targets being ambitious for the Ghanaian context, and there being a need for the evaluation structure to better contextualise the findings in light of similar findings in Ghana (and the region).
Although the results are not unexpected once fully analysed, they can be usefully used to inform the project’s continuous improvement process. In particular, they identify areas where pupils perform worse; these areas will be given particular focus when our Education Team is reviewing lesson content and teaching strategies. The findings also indicate a potential lack of alignment between the GES curriculum and the EGRA and EGMA tests which is an area we propose to investigate further.
2. Key variables affecting Learning Outcomes
These findings have usefully highlighted areas where the project will continue, as a matter of course, to invest in developing the quality of instruction both of the project’s own Master Teachers and also beneficiary teachers in MGCubed schools. They have also highlighted potential pockets of the cohort where learning outcomes are heavily influenced by both characteristics and household variables, namely:
• Girls with disabilities • Mothers • Those with illiterate HOH/caregivers, and those from the • Those from the poorest households • Girls who from the Likpakpa ethnic group (6 schools)
These relationships are not surprising to the project, and indeed form a core part of the projects raison d’ être. The response to the recommendations in Table 2 consider these, in part, while variables such as household poverty and caregiver illiteracy are being targeted through Cash Transfers (Output 6), though only in relation to transition, and Output 4 (Community training).
When it comes to other observable factors the Theory of Change is further validated: the findings indicate that both school management and non-cognitive skills are major factors in improving learning outcomes, with girls feeling welcome at school being identified in the cross-tabulation analysis as another important variable. The Varkey Foundation notes that this coheres with its and the project’s aims to develop inclusive, safe learning environments in which young people feel comfortable participating in, and in investing in the development of girls’ empowerment in order to provide the necessary lifeskills required to successfully navigate the school environment.
Transition The Baseline findings on Transition highlighted a number of interesting points which the project is keen to track further as the project progresses.
On the face of it, we see that the transition rate trend was no different for P6 and JHS1 than in the lower grades, with transition into JHS1 being higher (83.9%) than all other grades. On the contrary, the project’s Theory of Change holds that transition in the upper grades of primary are the lowest as girls drop out of school. This was a surprising
GEC-T Baseline Report – Making Ghanaian Girls Great Project 249
finding, however looking at the transition rates by age presents a different story. Here we see that there is a pattern of rising transition rates from eight years of age through 14, and then a steady decline afterwards.
This is more in line with the project’s Theory of Change, and is furnished by the subsequent regression analysis, which shows that cognitive disability and a high household chore burden have a highly significant effect on a girl’s ability to transition, alongside caregiver support for education and a well-functioning PTA at the school.
Each of these influential variables are directly targeted by the project, with the caregiver attitudinal and behavioural change element being addressed both through training and support to strengthening school PTAs and SMCs, but also through the cash transfer provided to households with girls who have transitioned from P6 to JHS 1.
One particular finding was a surprise to the project, and will be an area which the team will invest in understanding carefully. According to the regression analysis, “A girl’s agency is unexpectedly significantly associated with lower transition levels”. This directly contradicts the assumptions contained in the Theory of Change, i.e. that as empowerment (or agency) is enhanced, so is appetite for schooling and ultimately learning outcomes. This is an important finding for the project and also for the GEC in general, if this finding is borne out in the rest of the evaluation. There is a strong and widespread normative assumption that empowerment equals greater propensity to want to go to school and work hard. This is potentially a far more complex process, and one which the project’s current logic model does not take into account. For now, the project will look towards the Midline to see whether this trend continues.
Teaching Quality
The project has touched on teaching quality in part in the Recommendations. There are a number of further points to make, specifically about the performance of Facilitators (with whom the project has been working with since 2014). However, there are 67 “old” facilitators (joined in GEC1) and 149 “new” facilitators (joined in GECT). The first thing to note is that observations of facilitators were done in both regular classes and in MGCubed classes, the latter of which is a very specific set up that might not have allowed facilitators to demonstrate the full range of their instructional capacity. Further, the project also notes that despite the Facilitator group performing less well than the non-Facilitator (teacher) group this is in in part due to the fact that of 149 facilitators only 67 (under 50%) are “old” (i.e. they were part of the GEC1 project). The External Evaluator’s data has not disaggregated to this level however. The project’s own data suggests that there is a marked distinction between the performance of the two sub-groups, as described under Intermediate Outcome 2. The project data indicates that “old” facilitators are indeed performing better than those that joined in GECT, as the project expects. However, this sample sizes are very uneven, with only a handful of “old” facilitators being observed thus far and therefore no meaningful conclusion can be drawn from what has been collected so far.
However, qualitative data from the Education Team and facilitators themselves indicates that “old” facilitators are susceptible to complacency within the project, with interview data suggesting that there is a risk that the novelty of the project will wane. Master Teachers report a detectable change in attitude amongst facilitators as the project moves into a new phase.
This presents a challenge for the project in keeping the 67 facilitators who joined the project in 2014 motivated and engaged. The project is aware of this emerging challenge and has responded by planning to develop formalised Facilitators Standards to guide their professional development. These standards will be modelled on those of the Varkey Foundation Master Teachers, and will be framed as such in order to generate interest in professional development and reignite any waning motivation for engaging with the project. Secondly, in this phase of the project

GEC-T Baseline Report – Making Ghanaian Girls Great Project 250
the Varkey Foundation intends to gradually reduce the role of the Master Teacher and increase that of the facilitator, with classes becoming far more facilitator centred by the end of Year 3.
Technology
Qualitative reports indicate that technical problems are a source of frustration. This coheres with project monitoring data which indicates that school staff find the technology not only challenging but also disruptive to the flow of a class. The project recognises and accepts that while technology problems are an inevitable risk in an EdTech initiative there is a need to both continue to ensure the technology support teams in Accra and in the field are responding to issues in good time and to focus on the transferring of technical know-how to school staff in order to reduce the number of solvable technical issues the project experiences at present.
ANNEX 14: FOUNDATIONAL SKILL GAPS: BY TREATMENT STATUS Foundational literacy skills gaps among girls
EGRA-SeGRA subtasks
Non-Learner
Emergent Learner
Established Learner
Proficient Learner
Percent Of Correct Familiar Word Identified
Control 0.88 2.95 25.74 70.43 Treatment 1.10 3.00 27.55 68.35
Percent Of Correct Letter Sound Identified
Control 15.63 64.23 19.69 0.44
Treatment 5.57 55.60 38.32 0.51
Percent Of Correct Non-Familiar Word Identified
Control 40.19 40.71 14.45 4.65 Treatment 34.29 41.61 18.46 5.64
Reading Comprehension: Percent of Correct Answers
Control 36.95 15.56 30.83 16.67 Treatment 35.97 20.66 30.26 13.11
Listening Comprehension: Percent of Correct Answers
Control 27.65 17.18 15.27 39.90
Treatment 30.62 17.66 15.60 36.12
Standardized Oral Reading Fluency Percent of correct response
Control 17.31 29.44 23.74 29.51 Treatment 14.04 32.13 25.74 28.09

GEC-T Baseline Report – Making Ghanaian Girls Great Project 251
(Percent Question Answered Correctly In Segra Subtask1)
Control 31.86 43.51 19.76 4.87 Treatment 32.97 45.64 18.32 3.08
Percent of Question Answered Correctly In Segra Subtask2)
Control 67.85 28.47 3.54 0.15 Treatment 68.28 27.11 4.62 0.00
Percent of Question Answered Correctly In Segra Subtask3)
Control 87.02 8.92 3.54 0.52 Treatment 90.11 6.45 3.30 0.15
Foundational literacy skills gaps among boys
EGRA-SeGRA subtasks
Non-Learner
Emergent Learner
Established Learner
Proficient Learner
Percent Of Correct Familiar Word Identified
Control 0.63 1.67 21.67 76.04 Treatment 0.21 3.70 25.67 70.43
Percent Of Correct Letter Sound Identified
Control 18.54 63.33 18.13 0.00 Treatment 5.95 59.75 33.26 1.03
Percent Of Correct Non-Familiar Word Identified
Control 38.75 38.54 18.54 4.17 Treatment 32.65 38.60 23.20 5.54
Reading Comprehension: Proportion Of Correct Answers
Control 39.58 17.29 31.46 11.67 Treatment 42.30 18.07 29.57 10.06
Listening Comprehension: Percent of Correct Answers
Control 27.71 21.88 15.21 35.21 Treatment 32.85 22.59 15.61 28.95
Standardized Oral Reading Fluency ) Percent of correct response
Control 18.13 32.92 26.25 22.71 Treatment 15.64 38.68 23.66 22.02
Percent of Question Answered Correctly In Segra Subtask1)
Control 32.29 46.04 17.29 4.38 Treatment 38.19 43.94 14.37 3.49
Percent of Question Answered Correctly In Segra Subtask2)
Control 72.50 24.79 2.50 0.21 Treatment 81.11 16.02 2.26 0.62
Percent of Question Answered Correctly In Segra Subtask3)
Control 89.38 7.08 3.13 0.42 Treatment 91.99 4.93 2.67 0.41
Foundational numeracy skills gaps among girls
Non-Learner
Emergent Learner
Established Learner
Proficient Learner
Percent Correct Number Identified
Control 0.29 1.40 52.43 45.87
Treatment 0.29 1.98 41.25 56.48
Percent Correct Number Discriminated
Control 0.88 6.34 44.76 48.01
Treatment 0.88 3.81 38.83 56.48
Percent Correct Missing Number Identified
Control 1.40 49.41 45.28 3.91
Treatment 1.83 42.20 53.04 2.93
Percent Level 1 Additions Correctly Solved Control 1.40 15.63 49.48 33.48
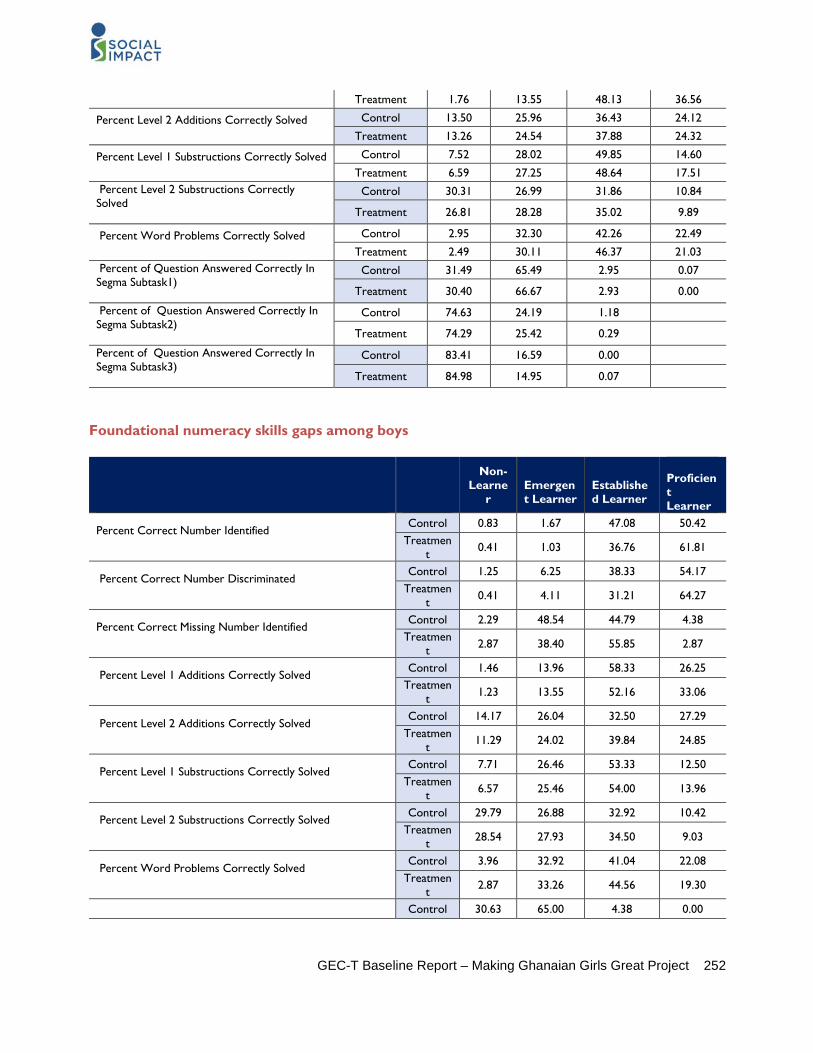
GEC-T Baseline Report – Making Ghanaian Girls Great Project 252
Treatment 1.76 13.55 48.13 36.56
Percent Level 2 Additions Correctly Solved
Control 13.50 25.96 36.43 24.12
Treatment 13.26 24.54 37.88 24.32
Percent Level 1 Substructions Correctly Solved
Control 7.52 28.02 49.85 14.60
Treatment 6.59 27.25 48.64 17.51 Percent Level 2 Substructions Correctly Solved
Control 30.31 26.99 31.86 10.84
Treatment 26.81 28.28 35.02 9.89
Percent Word Problems Correctly Solved
Control 2.95 32.30 42.26 22.49
Treatment 2.49 30.11 46.37 21.03 Percent of Question Answered Correctly In Segma Subtask1)
Control 31.49 65.49 2.95 0.07
Treatment 30.40 66.67 2.93 0.00
Percent of Question Answered Correctly In Segma Subtask2)
Control 74.63 24.19 1.18
Treatment 74.29 25.42 0.29 Percent of Question Answered Correctly In Segma Subtask3)
Control 83.41 16.59 0.00
Treatment 84.98 14.95 0.07
Foundational numeracy skills gaps among boys
Non-Learne
r
Emergent Learner
Established Learner
Proficient Learner
Percent Correct Number Identified
Control 0.83 1.67 47.08 50.42 Treatmen
t 0.41 1.03 36.76 61.81
Percent Correct Number Discriminated
Control 1.25 6.25 38.33 54.17 Treatmen
t 0.41 4.11 31.21 64.27
Percent Correct Missing Number Identified
Control 2.29 48.54 44.79 4.38 Treatmen
t 2.87 38.40 55.85 2.87
Percent Level 1 Additions Correctly Solved
Control 1.46 13.96 58.33 26.25 Treatmen
t 1.23 13.55 52.16 33.06
Percent Level 2 Additions Correctly Solved
Control 14.17 26.04 32.50 27.29 Treatmen
t 11.29 24.02 39.84 24.85
Percent Level 1 Substructions Correctly Solved
Control 7.71 26.46 53.33 12.50 Treatmen
t 6.57 25.46 54.00 13.96
Percent Level 2 Substructions Correctly Solved
Control 29.79 26.88 32.92 10.42 Treatmen
t 28.54 27.93 34.50 9.03
Percent Word Problems Correctly Solved
Control 3.96 32.92 41.04 22.08 Treatmen
t 2.87 33.26 44.56 19.30
Control 30.63 65.00 4.38 0.00

GEC-T Baseline Report – Making Ghanaian Girls Great Project 253
Percent of Question Answered Correctly In Segma Subtask1)
Treatment 28.75 66.94 4.11 0.21
Percent of Question Answered Correctly In Segma Subtask2)
Control 79.58 19.17 1.25 0.00 Treatmen
t 82.55 15.61 1.64 0.21
Percent of Question Answered Correctly In Segma Subtask3)
Control 85.63 14.17 0.21 Treatmen
t 88.71 11.09 0.21
Grade achieved by control Girls across grades in Numeracy Control
Grade achieved P3 P4 P5 P6 JHS1 JHS2 JHS3 Total No Grade 76.3 70.2 64.7 58.7 42.4 60.0 50.0 61.3 P1 23.7 28.0 32.0 34.8 37.5 20.0 25.0 31.9 P2 0.4 0.7 1.1 0.8 20.0 0.7 P3 1.1 2.0 3.1 6.4 25.0 2.8 P4 0.4 0.7 1.7 7.6 2.1
P5 P6 0.6 5.3 1.2 JHS1 JHS2 JHS3
Total 100 100 100 100 100 100 100 100
Grade achieved by treatment Girls across grades in numeracy
Treatment
Grade achieved P3 P4 P5 P6 JHS1 JHS2 JHS3 Total No Grade 73.0 61.8 56.7 48.1 38.1 43.9 41.8 52.9 P1 26.4 38.2 40.5 41.9 50.2 40.9 23.6 40.0
P2 1.6 2.4 1.5 3.6 1.1 P3 0.6 0.6 3.0 2.7 4.6 5.5 1.8 P4 0.6 4.6 7.4 4.6 10.9 3.2 P5 P6 1.2 1.5 12.7 0.7 JHS1
JHS2 0.4 3.0 1.8 0.3 JHS3
Total 100 100 100 100 100 100 100 100

GEC-T Baseline Report – Making Ghanaian Girls Great Project 254
Grade achieved by control Girls across grades in Literacy Control
Grade achieved P3 P4 P5 P6 JHS1 JHS2 JHS3 Total No Grade 80.13 71.63 53.8 37.61 28.79 80 25 51.5 P1 P2 14.74 20.21 17.82 17.09 10.23 0 25 16.26 P3 3.85 3.9 8.91 7.98 6.06 0 0 6.45
P4 1.28 4.26 17.82 25.64 25.38 0 0 16.48 P5 1.65 4.27 6.82 0 0 2.78 P6 3.99 6.44 0 25 2.34 JHS1 JHS2 2.85 14.39 20 25 3.66 JHS3 0.57 1.89 0 0 0.51
Total 100 100 100 100 100 100 100 100
Grade achieved by treatment Girls across grades in Literacy Treatment
Grade achieved P3 P4 P5 P6 JHS1 JHS2 JHS3 Total No Grade 86.5 67.57 59.81 40 31.13 24.24 16.36 51.01 P1
P2 11.04 24.32 21.2 19.73 17.51 9.09 7.27 18.57 P3 1.23 1.16 6.96 6.49 4.67 3.03 1.82 4.44 P4 0.61 6.56 12.03 19.19 23.35 25.76 21.82 14.54 P5 0 0.39 0 2.97 4.67 7.58 3.64 2.09 P6 0 0 0 6.49 8.17 7.58 14.55 3.9 JHS1
JHS2 0.61 0 0 4.86 10.12 19.7 25.45 4.85 JHS3 0 0 0 0.27 0.39 3.03 9.09 0.61
Total 100 100 100 100 100 100 100 100
Subtask specific average score of treatment girls in numeracy by Grade
Grades Subtasks: Numeracy P3 P4 P5 P6 JHS1 Percent correct number identified 79.7 84.5 86.2 87.0 89.5 Percent correct number discriminated 70.5 78.5 79.9 83.9 87.5 Percent correct missing number identified 35.4 42.5 48.3 51.8 55.1 Percent Level 1 additions correctly solved 48.5 59.7 67.5 76.1 79.6 Percent Level 2 additions correctly solved 39.6 51.6 58.9 65.8 68.6 Percent Level 1 subtractions correctly solved 36.0 42.4 48.9 60.3 64.3

GEC-T Baseline Report – Making Ghanaian Girls Great Project 255
Percent Level 2 subtractions correctly solved 28.2 36.4 41.2 49.6 52.7 Percent word problems correctly solved 43.9 47.9 52.6 58.8 59.8 % question answered correctly in SeGMA subtask1 2.0 3.9 6.4 13.9 16.4 % question answered correctly in SeGMA subtask2 0.0 0.0 0.0 6.5 8.5 % question answered correctly in SeGMA subtask3 0.0 0.0 0.0 2.3 3.4
Subtask specific average score of treatment Boys in numeracy by Grade
Grades Subtasks: Numeracy P3 P4 P5 P6 JHS1 Percent correct number identified 81.9 86.7 88.9 89.4 83.7 Percent correct number discriminated 78.4 82.8 85.1 86.2 82.0 Percent correct missing number identified 40.4 46.1 48.7 54.6 55.3 Percent Level 1 additions correctly solved 51.3 63.5 69.3 76.9 90.0
Percent Level 2 additions correctly solved 45.6 54.5 60.3 69.5 85.3 Percent Level 1 subtractions correctly solved 39.5 46.2 51.4 58.9 74.3 Percent Level 2 subtractions correctly solved 29.9 36.1 38.8 52.1 69.3 Percent word problems correctly solved 44.0 45.7 50.2 59.2 77.8 % question answered correctly in SeGMA subtask1 2.4 4.5 8.4 15.8 36.4 % question answered correctly in SeGMA subtask2 0.0 0.0 0.0 7.2 30.0
% question answered correctly in SeGMA subtask3 0.0 0.0 0.0 2.4 11.4
Subtask specific average score of treatment girls in Literacy by Grade
Grade Subtasks: Literacy P3 P4 P5 P6 JHS1 Percent of correct familiar word identified 73.8 79.7 84.8 88.5 89.4
Percent of correct letter sound identified 23.7 31.0 36.9 38.8 35.8 Percent of correct non-familiar word identified 10.5 17.1 24.8 28.6 31.6 Standardized Oral Reading Fluency (%) 22.9 33.8 47.5 60.1 68.7 Reading comprehension: Proportion of correct answers 14.0 26.3 39.0 51.6 59.4 Listening comprehension: Proportion of correct answers 33.5 38.5 52.5 58.2 69.9 % question answered correctly in SeGRA subtask1 5.7 9.9 16.4 30.3 37.8
% question answered correctly in SeGRA subtask2 0.0 0.0 0.0 15.5 18.7 % question answered correctly in SeGRA subtask3 0.0 0.0 0.0 7.1 10.3
Subtask specific average score of treatment Boys in Literacy by Grade
Grade P3 P4 P5 P6 JHS1
Percent of correct familiar word identified (out of 8) 77.7 85.2 85.1 91.0 94.2 Percent of correct letter sound identified (out of 100) 22.0 29.1 37.3 37.1 35.7

GEC-T Baseline Report – Making Ghanaian Girls Great Project 256
Percent of correct non-familiar word identified (out of 50) 9.3 21.7 27.6 34.1 46.8 Standardized Oral Reading Fluency (measured per minute) 16.1 35.4 44.6 57.2 83.0
Reading comprehension: Proportion of correct answers (out of 5)
10.1 28.6 35.6 51.2 70.7
Listening comprehension: Proportion of correct answers (out of 3)
30.2 41.0 45.6 57.7 75.6
% question answered correctly in SeGRA subtask1 4.5 10.3 17.2 28.5 71.4 % question answered correctly in SeGRA subtask2 0.0 0.0 0.0 11.7 38.3 % question answered correctly in SeGRA subtask3 0.0 0.0 0.0 6.0 40.4
0% 10% 20% 30% 40% 50% 60% 70% 80% 90% 100%
Number IdentificationQuantity Discrimination
Missing NumbersAddition (Level 1)Addition (Level 2)
Subtraction (Level 1)Subtraction (Level 2)
Word problemsAdvanced multiplication, division etc.
AlgebraData interpretation etc.
Aggregate Score
Girls' numeracy proficiency level by subtasks, EGMA
Non-learner 0% Emergent learner 1%-40% Established learner 41%-80% Proficient learner 81%-100%
0% 10% 20% 30% 40% 50% 60% 70% 80% 90% 100%
Number IdentificationQuantity Discrimination
Missing NumbersAddition (Level 1)Addition (Level 2)
Subtraction (Level 1)Subtraction (Level 2)
Word problemsAdvanced multiplication, division etc.
AlgebraData interpretation etc.
Aggregate Score
Boys' numeracy proficiency level by subtasks, EGMA
Non-learner 0% Emergent learner 1%-40% Established learner 41%-80% Proficient learner 81%-100%

GEC-T Baseline Report – Making Ghanaian Girls Great Project 257
0% 10% 20% 30% 40% 50% 60% 70% 80% 90% 100%
Oral vocabulary (Familiar word)
Letter Sound Identification
Invented Word
Oral Reading Fluency
Reading Comprehension
Comprehension (+ analytical)
Comprehension (+inferential)
Short essay
Aggregate Learning Score For Reading
Girls' literacy proficiency level by subtasks, EGRA
Non-learner 0% Emergent learner 1%-40% Established learner 41%-80% Proficient learner 81%-100%
0% 10% 20% 30% 40% 50% 60% 70% 80% 90% 100%
Oral vocabulary (Familiar word)
Letter Sound Identification
Invented Word
Oral Reading Fluency
Reading Comprehension
Comprehension (+ analytical)
Comprehension (+inferential)
Short essay
Aggregate Learning Score For Reading
Boys' literacy proficiency level by subtasks, EGRA
Non-learner 0% Emergent learner 1%-40% Established learner 41%-80% Proficient learner 81%-100%

GEC-T Baseline Report – Making Ghanaian Girls Great Project 258
ANNEX 15: TEACHING QUALITY AND SCHOOL MANAGEMENT DISAGGREGATION
0%10%20%30%40%50%60%70%80%90%
100%
Cont
rol
Trea
tmen
t
(T) N
o fa
cilit
ator
(T) F
acili
tato
r
Cont
rol
Trea
tmen
t
(T) N
o fa
cilit
ator
(T) F
acili
tato
r
Cont
rol
Trea
tmen
t
(T) N
o fa
cilit
ator
(T) F
acili
tato
r
Teacher called on or actively tried toinvolve a student who was not
participating
The teacher makes eye contact withall of the students while presenting
the lesson
The teacher effectively managedunruly behavior in class
Managing classroom behaviour I
Never Sometimes All the time

GEC-T Baseline Report – Making Ghanaian Girls Great Project 259
88%
90%
92%
94%
96%
98%
100%
Control Treatment (T) Nofacilitator
(T)Facilitator
Control Treatment (T) Nofacilitator
(T)Facilitator
Girls are disciplined physically in class. Boys are disciplined physically in class.
Managing classroom behaviour II
No Yes
0%
10%
20%
30%
40%
50%
60%
70%
80%
90%
100%
Control Treatment (T) No facilitator (T) Facilitator
Girls have equal access to desks, learning materials, etc. as boys
Promoting equitable learning I
Never Sometimes All the time

GEC-T Baseline Report – Making Ghanaian Girls Great Project 260
0%
10%
20%
30%
40%
50%
60%
70%
80%
90%
100%
Control Treatment (T) Nofacilitator
(T)Facilitator
Control Treatment (T) Nofacilitator
(T)Facilitator
Does the teacher call on BOY studentsmore than GIRL students?
Does the teacher use a harsh tone withBOYS more than GIRLS?
Promoting equitable learning II
Boys more Girls more Equally No questions/NA
0%
10%
20%
30%
40%
50%
60%
70%
80%
90%
100%
Control Treatment (T) No facilitator (T) Facilitator
Observer: In your opinion, did the teacher try to include girls and boysequally?
Promoting equitable learning III
No Yes

GEC-T Baseline Report – Making Ghanaian Girls Great Project 261
0%10%20%30%40%50%60%70%80%90%
100%Co
ntro
l
Trea
tmen
t
(T) N
o fa
cilit
ator
(T) F
acili
tato
r
Cont
rol
Trea
tmen
t
(T) N
o fa
cilit
ator
(T) F
acili
tato
r
Cont
rol
Trea
tmen
t
(T) N
o fa
cilit
ator
(T) F
acili
tato
r
Cont
rol
Trea
tmen
t
(T) N
o fa
cilit
ator
(T) F
acili
tato
r
Cont
rol
Trea
tmen
t
(T) N
o fa
cilit
ator
(T) F
acili
tato
r
The teacher usesdifferent resources
and strategies toexplain concepts
The teacher usesdifferent strategies to
explain concepts
The teacher has lessonnotes
The teacher holds thelesson notes in his/her
hands
The teacher uses TLMswhere appropriate
Preparedness for the lesson
Never Sometimes All the time
0%10%20%30%40%50%60%70%80%90%
100%
Cont
rol
Trea
tmen
t
(T) N
o fa
cilit
ator
(T) F
acili
tato
r
Cont
rol
Trea
tmen
t
(T) N
o fa
cilit
ator
(T) F
acili
tato
r
Cont
rol
Trea
tmen
t
(T) N
o fa
cilit
ator
(T) F
acili
tato
r
Cont
rol
Trea
tmen
t
(T) N
o fa
cilit
ator
(T) F
acili
tato
r
The teacher appearscomfortable and
knowledgeable with thematerial
The teacher reads well The majority of the studentsparticipate in the lesson
Learners appear tounderstand what the
teacher is saying
Confidence and clarity of delivery
Never Sometimes All the time

GEC-T Baseline Report – Making Ghanaian Girls Great Project 262
0
20
40
60
80
100
120
Control Treat Control Treat
How well is the school girl attendsmanaged?
How would you rate the performanceof the school head teacher or
principal?
School management indicators I
Excellent
Good
Fair
Poor
Don’t know
0
20
40
60
80
100
120
Control Treat Control Treat
Have you been informed aboutgirl's progress at school in the
last 12 months?
Do you know the name of thehead teacher/head
master/director at the girl'sschool?
School management indicators II
Yes No Don't know

GEC-T Baseline Report – Making Ghanaian Girls Great Project 263
ANNEX 16: DISAGGREGATION BY SCHOOLS WITH REMEDIAL COURSES Numeracy subtask scores of treatment girls, by schools with in-grade and remedial classes and schools with remedial classes only
Frequency Mean values Numeracy subtasks In Grade +
remedial Remedial
only In Grade + remedial
Remedial only
Difference p value
Correct number identified 765 600 86.6 85.1 1.5 0.079 Correct number discriminated 765 600 81.6 80.3 1.2 0.304 Correct missing number identified
765 600 47.9 47.9 0.1 0.950
Level 1 additions correctly solved
765 600 68.2 68.5 -0.3 0.833
Level 2 additions correctly solved
765 600 60.1 57.4 2.7 0.149
Level 1 subtractions correctly solved
765 600 51.7 52.6 -0.9 0.582
Level 2 subtractions correctly solved
765 600 43.8 42.4 1.4 0.449
Word problems correctly solved
765 600 54.7 52.5 2.2 0.105
Question answered correctly in SeGMA subtask1
765 600 9.9 8.6 1.4 0.029
Question answered correctly in SeGMA subtask2
347 280 7.3 7.3 0.1 0.909
Question answered correctly in SeGMA subtask3
347 280 2.5 3.0 -0.5 0.224
Aggregate learning score for Math
765 600 56.1 55.0 1.0 0.295
Literacy subtask scores of treatment girls, by schools with in-grade and remedial classes and schools with remedial classes only
Frequency Mean values Literacy subtasks In Grade +
remedial Remedial
only In Grade + remedial
Remedial only
Difference p value
Correct familiar word identified (out of 8)
765 600 85.8 82.6 3.1 0.004
Correct letter sound identified (out of 100)
765 600 36.6 31.8 4.8 0.000
Correct non-familiar word identified (out of 50)
762 594 25.5 20.8 4.6 0.001
Oral Reading Fluency 761 596 51.2 46.9 4.3 0.032

GEC-T Baseline Report – Making Ghanaian Girls Great Project 264
Reading comprehension: Proportion of correct answers (out of 5)
765 600 43.0 38.1 5.0 0.014
Listening comprehension: Proportion of correct answers (out of 3)
765 600 53.9 50.4 3.5 0.126
Question answered correctly in SeGRA subtask1
765 600 22.8 20.3 2.5 0.061
Question answered correctly in SeGRA subtask2
347 280 17.0 16.5 0.5 0.726
Question answered correctly in SeGRA subtask3
347 280 7.0 10.2 -3.2 0.028
Aggregate learning score for reading
765 600 45.6 41.7 3.9 0.002
Numeracy subtask scores of treatment boys, by schools with in-grade and remedial classes and schools with remedial classes only
Frequency Mean values Numeracy subtasks In Grade +
remedial Remedial
only In Grade + remedial
Remedial only
Difference p value
Correct number identified 276 211 87.7 86.8 0.9 0.506 Correct number discriminated 276 211 84.9 82.4 2.6 0.198 Correct missing number identified
276 211 49.5 48.1 1.5 0.477
Level 1 additions correctly solved
276 211 68.9 67.3 1.6 0.476
Level 2 additions correctly solved
276 211 61.8 58.5 3.3 0.274
Level 1 subtractions correctly solved
276 211 52.1 50.6 1.5 0.569
Level 2 subtractions correctly solved
276 211 44.1 39.1 4.9 0.120
Word problems correctly solved
276 211 53.8 49.4 4.4 0.052
Question answered correctly in SeGMA subtask1
276 211 11.1 8.1 3.0 0.010
Question answered correctly in SeGMA subtask2
101 66 9.7 8.4 1.3 0.572
Question answered correctly in SeGMA subtask3
101 66 3.3 3.1 0.2 0.806
Aggregate learning score for Math
276 211 57.1 54.5 2.6 0.107
Literacy subtask scores of treatment boys, by schools with in-grade and remedial classes and schools with remedial classes only
Frequency Mean values
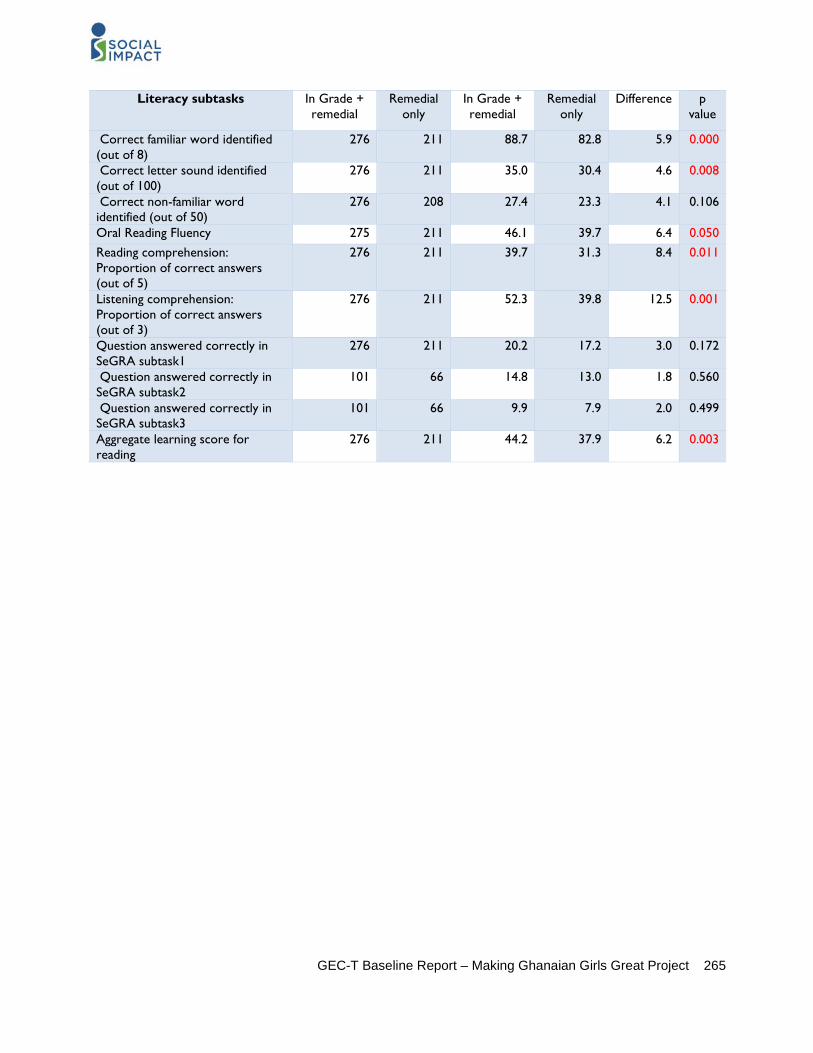
GEC-T Baseline Report – Making Ghanaian Girls Great Project 265
Literacy subtasks In Grade + remedial
Remedial only
In Grade + remedial
Remedial only
Difference p value
Correct familiar word identified (out of 8)
276 211 88.7 82.8 5.9 0.000
Correct letter sound identified (out of 100)
276 211 35.0 30.4 4.6 0.008
Correct non-familiar word identified (out of 50)
276 208 27.4 23.3 4.1 0.106
Oral Reading Fluency 275 211 46.1 39.7 6.4 0.050 Reading comprehension: Proportion of correct answers (out of 5)
276 211 39.7 31.3 8.4 0.011
Listening comprehension: Proportion of correct answers (out of 3)
276 211 52.3 39.8 12.5 0.001
Question answered correctly in SeGRA subtask1
276 211 20.2 17.2 3.0 0.172
Question answered correctly in SeGRA subtask2
101 66 14.8 13.0 1.8 0.560
Question answered correctly in SeGRA subtask3
101 66 9.9 7.9 2.0 0.499
Aggregate learning score for reading
276 211 44.2 37.9 6.2 0.003

GEC-T Baseline Report – Making Ghanaian Girls Great Project 266
ANNEX 17: FULL REPORT REFERENCES Abadzi, H. (2006). Efficient learning for the poor: Insights from the frontier of cognitive neuroscience. Washington, DC: The World Bank. FAO (2012), Gender, Equity and Rural Development Division, Gender Inequalities in Rural Employment in Ghana: An Overview, Rome: FAO FHi360, Education Policy and Data Center (EPDC), Making Sense of Data and Improving Education Development. https://www.epdc.org/sites/default/files/documents/Ghana_trends_2013.pdf Ghana Education Service EMIS database -http://www.ghanaeducationdata.com Ghana News Agency, (2018). Recruit Female Teachers to Enhance Academic Performance - Educationist. http://www.ghananewsagency.org/education/recruit-female-teachers-to-enhance-academic-performance-educationist-81131 Ghana Education Service, National Education Assessment Unit and RTI International Education Assessment and Research Centre (2015): GHANA 2015 Early Grade Reading Assessment and Early Grade Mathematics Assessment: Report of Findings November 2016 “Ghana-Education and Literacy.” UNESCO Institute for Statistics, UNESCO. http://uis.unesco.org/country/GH
“Ghana - Participation in Education.” UNESCO Institute for Statistics, UNESCO, 12 Apr. 2017, uis.unesco.org/country/GH
Ghana Statistical Service (GSS), Ghana Health Service (GHS), and ICF International. 2015. Ghana Demographic and Health Survey 2014. Rockville, Maryland, USA: GSS, GHS, and ICF International. Ghana Statistical Service, 2011. Ghana Multiple Indicator Cluster Survey (MICS) with an Enhanced Malaria Module and Biomarker, 2011, Final Report. Accra, Ghana. “Lower Secondary Completion Rate, Female (% of relevant age group),” 1971 - 2017 | Data, UNESCO Institute for Statistics- https://data.worldbank.org/indicator/SE.SEC.CMPT.LO.FE.ZS?locations=GH “School Enrollment, Primary and Secondary (gross), Gender Parity Index (GPI),” 1970 - 2017| Data. UNESCO Institute for Statistic- https://data.worldbank.org/indicator/SE.ENR.PRSC.FM.ZS Schreiner, Mark and Woller, Gary. “A Simple Poverty Scorecard for Ghana.” 16 March 2010, www.microfinance.com/#Ghana. UNFPA (2016) Situation Analysis of Adolescent Girls and Young Women in Ghana – Synthesizing Data to Identify and Work with the Most Vulnerable Young Women. New York: UNFPA. UNICEF (2016), State of the World’s Children 2016, A Fair Chance for Every child

GEC-T Baseline Report – Making Ghanaian Girls Great Project 267
USAID, RTI International. 2015. Early Grade Reading Assessment (EGRA) Toolkit, Second Edition. Washington, DC: United States Agency for International Development Women in Law and Development in Africa (WiLDAF Ghana) Scoping study for Parliamentary Advocacy Programme on Combating Early and Forced Marriage in Ghana, March 2014. World Bank Databank. Percentage of Male Teachers in Primary Education Who are Trained, Male (%), 1999 – 2017. Accessed on 10 May 2018. https://data.worldbank.org/indicator/SE.PRM.TCAQ.MA.ZS?locations=GH World Bank Databank. Progression to secondary school, female (%). Accessed on 10 May 2018. https://data.worldbank.org/indicator/SE.SEC.PROG.FE.ZS?locations=GH

GEC-T Baseline Report – Making Ghanaian Girls Great Project 268
ANNEX 18: SOCIAL IMPACT CHILD PROTECTION POLICY
Social Impact Code of Conduct for staff Employees and Affiliates
All data collectors, supervisors, managers, and others involved in this evaluation are required to adhere to Social Impact, Inc.’s (SI) Child Protection Policy and Data Security Policy throughout all evaluation tasks. The Child Protection Policy states that as a representative of SI, you are responsible for working to proactively protect children within the scope of the evaluation. The Data Security Policy states that as a representative of SI, you are responsible for working proactively to protect Personally Identifiable Information (PII) within the scope of the evaluation. Evaluation personnel in each country may not be below 18 years of age and must not have prior convictions of child abuse or any other child related crime. All evaluation personnel are responsible to abide by the principles communicated during the ethics training. This includes the informed consent/assent process that is required before each interview. Consent must be obtained or else an interview cannot be conducted. This also includes the requirement to keep all information confidential—whether it is information stored electronically, on paper, or on the mind. All evaluation activities involving children must be conducted in a location visible to others. While it is advised to conduct interviews out of hearing range from others to retain privacy for the sake of the interviewee, evaluation personnel are not allowed to be alone with a child under any circumstances. This rule is in place to protect children and to protect evaluation personnel from the presumption of impropriety. Child Protection/Safeguarding
SI supports the goals of the UN Convention on the Rights of the Child (www.unicef.org), host country and local child welfare and protection legislation or international standards, whichever gives greater protection to children from abuse, exploitation, and violence.
SI is committed to protecting children (defined as those who have not attained 18 years of age) from abuse, exploitation, and neglect:
• Child abuse, exploitation, or neglect constitutes any form of physical abuse; emotional ill- treatment; sexual abuse; neglect or insufficient supervision; trafficking; or commercial, transactional, labor, or other exploitation resulting in actual or potential harm to the child’s health, well-being, survival, development, or dignity. It includes, but is not limited to: any act or failure to act which results in death, serious physical or emotional harm to a child, or an act or failure to act which presents an imminent risk of serious harm to a child.
• Physical abuse constitutes acts or failures to act resulting in injury (not necessarily visible), unnecessary or unjustified pain or suffering without causing injury, harm or risk of harm to a child’s health or welfare, or death. Such acts may include, but are not limited to: punching, beating, kicking, biting, shaking, throwing, stabbing, choking, or hitting (regardless of object used), or burning. These acts are considered abuse regardless of whether they were intended to hurt the child.
• Sexual Abuse constitutes fondling a child's genitals, penetration, incest, rape, sodomy, indecent exposure, and exploitation through prostitution or the production of pornographic materials.
• Emotional abuse or ill treatment constitutes injury to the psychological capacity or emotional stability of the child caused by acts, threats of acts, or coercive tactics. Emotional abuse may include, but is not limited to: humiliation, control, isolation, withholding of information, or any other deliberate activity that makes the child feel diminished or embarrassed.
• Exploitation constitutes the abuse of a child where some form of remuneration is involved or whereby the perpetrators benefit in some manner. Exploitation represents a form of coercion and

GEC-T Baseline Report – Making Ghanaian Girls Great Project 269
violence that is detrimental to the child’s physical or mental health, development, education, or well-being.
• Neglect constitutes failure to provide for a child's basic needs within SI activities that are responsible for the care of a child in the absence of the child's parent or guardian.
SI employees and affiliates shall not undertake abusive, exploitative and neglectful behaviours towards children and shall avoid situations that constitute poor practice and which could contribute towards abusive, exploitative or neglectful behaviour.
SI holds employees and affiliates to the highest of standards - even if a given behaviour or act is not illegal in the host country. The examples and behaviours below are not exhaustive.
Unacceptable behaviours: SI employees and affiliates shall never:
• physically assault children; • physically abuse children; • develop sexual relationships with children; • develop inappropriate relationships with children; • act in ways that could put a child at risk of abuse or exploitation; • use language, make suggestions or offer advice which is inappropriate, offensive or abusive; • behave in a manner which is inappropriate or sexually provocative; • condone, or participate in, behaviour of children which is illegal, unsafe or abusive; • shame, humiliate, belittle or degrade children, or otherwise perpetrate any form of emotional
abuse; • show differential treatment, or favor particular children to the exclusion of others; • discriminate against a child; • view, make or distribute child pornography.
Care of environment: SI employees and affiliates will take special care when working with or around children:
• ensure that a culture of openness exists so that staff, affiliates and others are not afraid to raise concerns;
• ensure that children understand their rights and what is/not acceptable behaviour of adults or other children and know who to contact if they have any concerns;
• plan and organise work to minimize risks; • be aware of and manage situations which may present risks; • exercise the “two adults” rule when working with or around children: ensure that two adults are
present always; • acquire permission of child/parent/caregiver before any image of a child is used for publicity,
fundraising or awareness campaigns; • Ensure that parents or legal guardians are informed and give their authenticated written consent
for the collection of information; • Information that identifies the location of a child and therefore could put them at risk will not be put
in communications.
SI does not allow the recruitment and/or hiring of children in order to carry out SI activities.

GEC-T Baseline Report – Making Ghanaian Girls Great Project 270
Sexual Exploitation and Abuse
Sexual exploitation and sexual abuse constitute acts of serious misconduct and are grounds for disciplinary measures, including dismissal.
• Sexual activity with children (persons under the age of 18) is prohibited regardless of the age of majority or age of consent locally. Mistaken belief in the age of a child is not a defense.
• Exchange of money, employment, goods or services for sex, including sexual favors or other forms of humiliating, degrading or exploitative behaviour, is prohibited by SI employees and affiliates.
• Sexual relationships between SI employees and affiliates and the individuals with whom SI works, since they are based on inherently unequal power dynamics, undermine the credibility and integrity of the work of SI and are strongly discouraged.
• Sexual relations with a direct report or anyone within the reporting line is prohibited. • SI employees and affiliates are obliged to create and maintain an environment that prevents
sexual exploitation and sexual abuse. Managers at all levels have a responsibility to support and maintain this environment.
Trafficking in Persons
SI is committed to protecting vulnerable populations from trafficking.
Trafficking in persons includes the recruitment, transportation, transfer, harboring or receipt of persons, by means of the threat or use of force or other forms of coercion, of abduction, of fraud, of deception, of the abuse of power or of a position of vulnerability or of the giving or receiving of payments or benefits to achieve the consent of a person having control over another person, for the purpose of exploitation.
Exploitation includes, but is not limited to, the exploitation of the prostitution of others or other forms of sexual exploitation, forced labor or services, slavery or practices similar to slavery, servitude or the removal of organs.
Specifically, SI employees and affiliates may not traffic in persons, procure commercial sex acts, use forced labor in the performance of SI activities or engage in acts that directly support or advance trafficking in persons. This includes but is not limited to the following acts:
• destroying, concealing, confiscating, or otherwise denying an employee access to that employee's identity or immigration documents;
• failing to provide return transportation or pay for return transportation costs to an employee from a country outside the United States to the country from which the employee was recruited upon the end of employment if requested by the employee, unless: a) exempted from the requirement to provide or pay for such return transportation by the terms of an award/contract; or b) the employee is a victim of human trafficking seeking victim services or legal redress in the country of employment or a witness in a human trafficking enforcement action;
• soliciting a person for the purpose of employment, or offering employment, by means of materially false or fraudulent pretenses, representations, or promises regarding that employment;
• charging employees recruitment fees; • providing or arranging housing that fails to meet the host country housing and safety standards.

GEC-T Baseline Report – Making Ghanaian Girls Great Project 271
Promise to abide by SI Child Protection and Data Security Policy and ethical guidelines I, _______________________ (print name) promise that I will abide by the SI Child Protection Policy and Data Security Policy and ethical guidelines as listed above and during all research activities. Specifically, I confirm that:
_____ I am at least 18 years of age. _____ I have no prior convictions of child abuse or any other child-related crime. _____ I will never be alone with a child out of sight from others. _____ I will always obtain prior informed consent before interviewing any respondent. _____ I will be vigilant to prevent excess risks to participants in this study.
_____ I will keep all personal information I gather confidential and will not disclose it in verbal, written, or electronic form to anyone other than my manager and approved SI staff
_____ I will not use data collected during the study for any personal or professional purpose. _____ I will not store any data beyond the period of my contract, and will immediately contact the
manager if I become aware of the existence of such data after the contract has ended. _____ I will keep my computer/digital recorder password-protected and will never allow someone
outside the evaluation to use it. _____ I will change my password immediately upon suspecting it has been stolen, and will report this immediately to my superior. _____ I will immediately report to my superior any suspected instance of breach of confidentiality or privacy of respondent data.
_____ I will ask my superior for guidance in any scenario in which my actions or the actions of others participating in data collection may endanger the confidentiality or privacy of respondent data.
_____ If my computer/digital recorder is lost or stolen I will immediately report it to my manager. _____ I will never fabricate data or misrepresent data for any reason. Printed Name: ___________________________ Signature:_____________________________ Date: __________________________________