Progress in Strategic Approach Implementation for 2014-2016
101
SAICM/OEWG.3/INF/4 Dist.: General 15 March 2019 English only Open-ended Working Group of the International Conference on Chemicals Management Third meeting Montevideo, Uruguay 2-4 April 2019 Item 4 (a) of the provisional agenda * Progress towards the achievement of the 2020 overall objective of the sound management of chemicals: Progress report for period 2014 - 2016 Progress in Strategic Approach Implementation for 2014-2016 Note by the secretariat The secretariat has the honour to circulate, for the information of participants, a report on progress in the implementation of the Strategic Approach to International Chemicals Management for 2014–2016 (see annex). The secretariat has prepared the report in order to capture the information available from the reporting process. A summary of the report on progress in the implementation of the Strategic Approach for the period 2014–2016 (SAICM/OEWG.3/5) is also available to participants. The Open- ended Working Group may wish to take note of the information contained therein. The report has not been formally edited. * SAICM/OEWG.3/1
-
Upload
khangminh22 -
Category
Documents
-
view
1 -
download
0
Transcript of Progress in Strategic Approach Implementation for 2014-2016

SAICM/OEWG.3/INF/4
Dist.: General
15 March 2019
English only
Open-ended Working Group of the International Conference
on Chemicals Management
Third meeting
Montevideo, Uruguay 2-4 April 2019
Item 4 (a) of the provisional agenda*
Progress towards the achievement of
the 2020 overall objective of the sound management of chemicals:
Progress report for period 2014 - 2016
Progress in Strategic Approach Implementation for 2014-2016
Note by the secretariat
The secretariat has the honour to circulate, for the information of participants, a report on progress in
the implementation of the Strategic Approach to International Chemicals Management for 2014–2016
(see annex). The secretariat has prepared the report in order to capture the information available from
the reporting process. A summary of the report on progress in the implementation of the Strategic
Approach for the period 2014–2016 (SAICM/OEWG.3/5) is also available to participants. The Open-
ended Working Group may wish to take note of the information contained therein. The report has not
been formally edited.
* SAICM/OEWG.3/1

SAICM/OEWG.3/INF/4
2
Annex
Progress in Strategic Approach Implementation for 2014-2016
Contents
POLICY SUMMARY................................................................................................................................. 3
1. INTRODUCTION ................................................................................................................................. 5
1.1. Data Collection and Analysis ...................................................................................................... 6
2. PROGRESS RESULTS ........................................................................................................................... 7
2.1. Online Questionnaire Responses: SAICM Stakeholders ............................................................ 7
2.2. Results of the Online Questionnaire by Strategic Objective ...................................................... 9
2.2.1. Objective A Risk Reduction ................................................................................................. 9
2.2.2 Objective B Knowledge and Information ........................................................................... 27
2.2.3. Objective C Governance .................................................................................................... 37
2.2.4. Objective D Capacity Building and Technical Cooperation ............................................... 46
2.2.5. Objective E Illegal International Traffic ............................................................................. 56
2.3. Global Overview and Comparison with Previous Progress Reports ........................................ 60
2.4. Progress on GEF Projects: Number of Countries with Projects Supported by GEF ................. 65
3. ANALYSIS OF 20 INDICATORS .......................................................................................................... 67
4. DISCUSSION AND CONCLUSIONS .................................................................................................... 70
4.1. Regional Progress ..................................................................................................................... 71
4.2. Overall Progress on the Indicators ........................................................................................... 73
4.3. Future Work toward the 2020 Goal ......................................................................................... 77
4.4. Looking beyond 2020 ............................................................................................................... 80
5. ANNEXES ......................................................................................................................................... 82
5.1. Annex 1- The Activity Map of the projects funded by QSP trust fund Rounds I-XIV ............... 82
5.2. Annex 2- Indicators for reporting progress in implementation of the Strategic Approach .... 83
5.3. Annex 3- SAICM online questionnaire for the period 2014-2016 ............................................ 84

SAICM/OEWG.3/INF/4
3
POLICY SUMMARY
1. The Overarching Policy Strategy, in paragraph 24, provides that the International Conference on
Chemicals Management (ICCM) will undertake periodic reviews of SAICM.
2. The International Conference on Chemicals Management at its fourth session (ICCM4) from 28
September–2 October 2015 held in Geneva, Switzerland, in resolution IV paragraph 18, requested the
secretariat to develop a third progress report including achievements, strengths and weaknesses on
Strategic Approach to International Chemical Management for the period 2014–2016 and an analysis
of the 20 indicators of progress for consideration by the Open-ended Working Group at its third
meeting.
3. This progress report presents the results of the third SAICM reporting process (PR3) with the data
covering the period 2014-20161 and an analysis of the 20 indicators of progress for consideration by
the Open-ended Working Group.
4. The Conference also directed, in resolution IV paragraph 18, the Open-ended Working Group to
consider the need for a report for the period 2017–2019 for consideration by the Conference at its
fifth session.
5. Submissions from 54 governments, five intergovernmental organizations, four non-governmental
organizations, one civil society and two private sector bodies were received. The overall response rate
for the government responses was 28 per cent. The regional variations were considerably large with
Western Europe and Other Groups and Central and Eastern Europe regions being greatly represented
and the African region being in absolute under-representation.
6. In addition, a comprehensive analysis of data collected by the participation organizations of the Inter-
Organization Programme for the Sound Management of Chemicals (IOMC) on the eight IOMC
indicators of progress on the sound management of chemicals and an analysis of funded projects by
the Global Environment Facility on sound management of chemicals and waste was performed in
order to provide a better picture of global status.
7. In the analysis, a point-based system was applied in order to acquire a score for each respondent for
the 20 indicators of progress and SAICM Strategic Objectives. The average score of the respondents
was then aggregated by regions and development status in order to be able to compare the progress
among the regions and with the previous progress reports.
8. The report uses the SAICM regional groupings for much of the analysis: Africa (AFR), Asia-pacific (ASP),
Central and Eastern European (CEE), Latin American and the Caribbean (LAC), and Western Europe
and Others group (WEOG). In addition, a ‘World’ grouping represents the international organizations
including Organization for Economic Cooperation and Development (OECD), United Nations
Development Programme (UNDP), United Nations Environment Programme (UNEP), The United
Nations Institute for Training and Research (UNITAR), and the World Health Organization (WHO) who
all submitted reports to PR3.
9. The analysis of data in relation to different development categories, non-DAC or DAC (i.e. all countries
and territories eligible to receive Official Development Assistance as determined by the Development
Assistance Committee) showed that even though least-developed countries (LDC), and upper-middle
1 The first SAICM reporting process covered 2009-2010 (PR1) and the second report covered 2011-2013 (PR2).

SAICM/OEWG.3/INF/4
4
income countries (UM) reported a positive growth under the majority of the objectives since the first
progress report (2009-2010), very little improvements for the lower-middle income (LM) countries
was recorded under the Objectives B on knowledge and information and E on illegal international
traffic. The mixed results make it difficult to draw a conclusion on the advancements of DAC countries
as compared to non-DAC countries in regard to chemical management. Given that only three reports
from each of LM and LDC groups were submitted to PR3, the results might not be applicable to all the
countries in the group and therefore not demonstrative of the true status of the group.
10. Overall, the greatest progress since the first progress report in 2009-2010 seemed to have been made
under Objective B on knowledge and information and Objective E on illegal international traffic for
nearly all the regions. Furthermore, the progress toward Objective A since PR1 was significantly large
for all the regions except for the AFR region; between 16 to 26 per cent growth. By merely looking at
the average scores of the objectives, it might seem that the AFR region has had slower progress since
PR1 as compared to the rest of the regions. However, this data on its stand-alone format is misleading
knowing that the available data was submitted by only three respondents (all government
stakeholders) from the AFR region. Thus, a solid comparison with previous reports is unfair if not
impossible. Nevertheless, the AFR respondents showed a positive progress of 9, 10 and 12 per cent
under Objective B, D and E, respectively, since PR1.
11. Nevertheless, each region has strengths in certain area more than the others. The uneven
implementation of the five objectives points out to the priorities set by the countries in implementing
the Strategic Approach. The greatest level of activity reported for the AFR region was under indicator
14 on identification and prioritization of capacity-building needs. The ASP region stood highest under
indicator 3 on hazardous waste management arrangements. The CEE region showed a similar strength
under both indicators of 6 and 9. The LAC region performed similarly well under indicators 3 and
indicator 9 on websites to provide information to stakeholders. Finally, the WEOG region also
reported the highest level of activity under indicator 9.
12. Thirty per cent of the indicators had below-average progress. Indicators 12, 15, 16 and 13 showed an
overall decline in the level of activity across regions when compared with the average scores obtained
in PR1. The largest decline of 26 per cent in the activity level belonged to indicator 12. The activity in
indicator 12 was modified to inquire the significant changes made to the international instruments in
this reporting period rather than the number of countries with mechanisms to implement these
instruments. As a result, a small number of respondents reported on this activity.
13. Notably, indicators 13, 15, and 16 were the concern of a few to none of the projects funded by the
Quick Start Programme trust fund (QSP trust fund) and Global Environment Facility (GEF) both of
which support the countries building the capacity they need for the sound management of chemicals
and waste. Throughout 14 rounds, 171 projects were approved and funded by QSP trust fund out of
which only two projects involved indicator 15 and none addressed indicator 16. Similarly, the projects
approved by GEF only in two instances covered indicator 15 and none of the indicator 13 and 16 in
the period 2014-2016. Further, more substantial work on the aforementioned indicators is perhaps
the most obvious room for improvement for the countries to possibly consider in the future reporting
periods.
14. No progress in the level of activity was recorded for the two indicators of 11 and 14 once the average
scores under these indicators were compared with the average scores in PR1. The reason could

SAICM/OEWG.3/INF/4
5
majorly be associated with the modifications to the re-phrasing of the activities in the questionnaire.
The Indicator 11 on the multi-stakeholder coordinating mechanism was split to two-part activity on
the organizations (not the governments) who have multi-stakeholders or multi-sectoral committees
and the types of these stakeholders (i.e. Academia, civil society, industry, etc.) which seemed to have
negatively influenced the responses because a majority did not respond to this activity. Indicator 14
suffered from a low level of activity as compared to previous progress reports mainly due to the
significantly small pool of data in PR3 submitted by recipient countries (n=28 out of 65) which this
indicator is enquiring in PR3.
1. INTRODUCTION
15. This progress report (PR3) presents the results of the third SAICM reporting process with the data
covering the period 2014-2016. The report provides a comparison of the results of the SAICM online
questionnaire tool with the two previous reports; 2009-2010 progress report (PR1) and 2011-2013
progress report (PR2). It also makes a general comparison with the baseline report (2006-2008), under
the relevant indicators2 to draw a more comprehensive picture of the progress.
16. The results of the report are presented with regional comparisons similar to previous report (i.e. PR2).
Additionally, the report discusses the significance and effects of international financial and technical
assistance by SAICM’s Quick Start Programme trust fund (QSP trust fund) and Global Environment
Facility (GEF) in achieving progress under each objective.
17. The report is structured in four sections; (a) Introduction, (b) Progress Results (c) Analysis of 20
Indicators (d) Discussion and Conclusions
a) The introduction provides details on the background, objectives, methodology and data
analysis
b) The results section is presented in four sections: a) the first part reviews the responses to the
questionnaire and the distribution of the responses across the regions b) the second part
provides a closer analysis and discussion of the data obtained from the SAICM questionnaire
and the progress under each of the 20 indicators of progress. The discussion makes a thorough
comparison with the results from the previous progress reports. The data on eight indicators
of Inter-Organization Programme for the Sound Management of Chemicals (IOMC) is
discussed where there was an interlinkage with the SAICM indicators of progress. The IOMC
data is used to complement or cross-reference the SAICM questionnaire results where it was
applicable. c) the third part gives a global overview of the progress and achievements across
all regions, economic groupings. d) the last part of the results section presents the number of
countries with approved projects by Global Environment Facility on sound management of
chemicals and wastes on a global and regional scale. It also links the projects onto the SAICM
indicators of progress for the period 2014-2016.
c) The section on analysis of indicators provides an in-depth analysis of the SAICM indicators,
the progress achieved using the indicators, the pros and cons in using them, and their
2 The baseline report (2006-2008) presented a baseline for seven of the 20 adopted indicators.

SAICM/OEWG.3/INF/4
6
connection with eleven basic elements based on the overall orientation and guidance
document3.
d) The discussion and conclusions section provide the summary of the achievements toward the
sound management of the chemicals in particular in regional level by comparing the progress
against indicators with the baseline report, exploring and discussing the interlinkages with the
IOMC indicators. In the attempt to do so, it also identifies the challenges and the existing gaps.
It also seeks to provide resolutions and considerations for the upcoming questionnaire and
reports, the thorough analysis of 20 indicators and their usefulness for the governments, and
international and national chemical management agencies.
1.1. Data Collection and Analysis
18. The data on SAICM strategic objectives and the 20 indicators of progress was extracted and analyzed
from the online questionnaire which had been made available to the SAICM stakeholders as a
reporting tool similar to the previous report (PR2). The questionnaire has been updated since the
previous progress report; with the order of indicators under Objective A and D rearranged (Please see
Appendix 2), the activities under the indicators 12, 13 and 15 rephrased, and several new activities
were added under the indicators 1, 2, 3, 5, 9, 11 and 14 (Please see Appendix 4).
19. The online questionnaire for the 2014-2016 reporting period was open from 16 June to 15 September
2017. The secretariat extended the period until 31 October 2017. Following this and on the basis of
guidance from the Bureau of the fifth session of the International Conference on Chemicals
Management (ICCM5 Bureau), at its fourth meeting in Rome 7-8 November 2017, the secretariat
extended that period until 1 December 2017. The SAICM regional focal points played a role in
encouraging all SAICM stakeholders to complete the online questionnaire.
20. The questionnaire consisted of two sections of the general information and contact information
sections and then five sections each covering one of the five Overarching Policy Strategy categories
agreed by ICCM2 (Please see Annex 2 for the complete list of indicators). Certain questions in the
questionnaire are modified and several new questions were added to this reporting period.
21. Two scoring methodology were used in order to quantitatively analyze the responses provided by the
stakeholders. This method was identical to the methodology developed in PR2. The first metric was
the per centage of total respondents who selected a certain activity. The second metric assigned a
point to the answer provided to every activity selected by each respondent. The point system is similar
to the one from PR2 where a completed activity received one point, an activity in progress or under
development received 0.5 point, and no reported activity received zero point (including responses
such as ‘Not applicable’, ‘Not known’, etc.). The average per centage of all possible activities selected
in each question has been expanded by calculating individual respondents’ per centage and
aggregating these ‘scores’ for questions, the indicators and the objectives. The score is presented as
a per centage of the total possible activities and expressed as a number between 0 and 1. Each SAICM
region obtained a score, between 0 and 1, under each of 20 indicators and the five objectives
therefore a comparison of the scores with those of previous reports (PR2, PR1) was made possible.
3 Overall Orientation and Guidance document for achieving the 2020 goal of sound management of chemicals

SAICM/OEWG.3/INF/4
7
22. In order to contribute to tracking future progress of SAICM, at ICCM44, paragraph 39 of section IV on
the progress and challenges towards the achievement of the 2020 goal of sound chemicals
management, the IOMC proposed a set of quantitative indicators from verifiable sources and for
which global data are available. On the IOMC website5 indicator data is displayed in the map form
wherever possible to provide quick access to the country or region of interest. For this current
progress report, data for the eight IOMC indicators (identified as Indicators A to H hereinafter) has
been provided to harmonize as much as possible with the presentation of the 20 SAICM indicators.
23. The data collected on the eight indicators of IOMC are as follows: Indicator A on number of countries
with National Profiles (UNITAR); Indicator B on number of countries with a Pollutant Release and
Transfer Register (PRTR) (UNITAR); Indicator C on number of countries with poison centres (WHO);
Indicator D on number of countries with control for lead in decorative paint (WHO and UNEP);
Indicator E on countries which have implemented pesticide legislation based on the International
Code of Conduct on Pesticide Management of the Food and Agriculture Organization of the United
Nations (FAO) and WHO; Indicator F on number of countries that have achieved core capacities for
chemicals under the International health Regulations (WHO); Indicator G on number of parties to the
Basel, Rotterdam, Stockholm and Minamata conventions (UNEP); Indicator H on implementation of
the Global Harmonized System of Classification and Labelling of Chemicals (GHS) (UNECE and
UNITAR).
2. PROGRESS RESULTS
2.1. Online Questionnaire Responses: SAICM Stakeholders
24. Submitted reports via SAICM online questionnaire were received from the 35 Governments of
Argentina, Austria, Barbados, Belarus, Bosnia Herzegovina, Bulgaria, Canada, Colombia, Costa Rica,
Cote d’Ivoire, Denmark, Finland, Germany, Guyana, Honduras, Italy, Japan, Lesotho, Madagascar,
Malaysia, Monaco, Montenegro, Netherlands, Peru, Russian Federation, Serbia, Republic of Korea,
Spain, Sweden, Switzerland, Thailand, the Former Yugoslav Republic of Macedonia, Trinidad Tobago,
United Arab Emirates, and Yemen. The report of the European Union (EU) and its 28 member States
has been submitted in written form by Estonia which held the Presidency of the Council of the
European Union during this reporting period. The EU report brought the total government responses
analyzed for this report to 54. Two EU member States of Belgium and France submitted additional
reports in the written form to complement the EU report. The reports submitted by some of the
individual EU member States via SAICM online questionnaire (i.e. Austria, Bulgaria, Denmark, Finland,
Germany, Italy, Netherlands, Spain, Sweden), as well as the written reports by Belgium and France
were considered as an additional data to the common report submitted by EU. A further nine
governments registered for the reporting tool but did not complete their submissions and thus were
not included in the analysis.
25. Five Intergovernmental Organizations, OECD, UNDP, UNEP, UNITAR and WHO submitted their full
progress reports via the online questionnaire. Four civil society non-governmental organizations
4 SAICM/ICCM.4/15 5 http://www.who.int/iomc/indicators_saicm/en/

SAICM/OEWG.3/INF/4
8
(NGOs), Armenian Women for Health and Healthy Environment (AWHHE), Central American Institute
for Studies on Toxic Substances, International POPs Elimination Network (IPEN), Pesticide Action
Network (PAN); 2 private sector bodies, American Petroleum Institute (API) and International Council
of Chemical Associations (ICCA); and 1 civil society, Society for Ecological Restoration (SER) submitted
their progress reports.
26. This is an overall response rate of almost 28 per cent of the current 193 government member States
of UN General Assembly. That shows a reduction of 15 per cent of government participation from
PR2. Of the total government responses to PR3, 47 had also submitted responses to PR2: that is, seven
governments responded to PR3 which had not submitted a report to PR2. Thirty-six of the PR2
government respondents did not respond this time around (Figure 1). Seventy per cent of the
respondents who did not submit responses in PR3 were from AFR region, 67 per cent from ASP, and
43 per cent from LAC regions (Figure 2).
Figure 1 Regional distribution of the respondents to only PR2 and to only PR3
Figure 2 Number of total governments submitting (dark shading) and not submitting (light shading) a progress
report in each UN regional group in PR3, PR2 and PR1.
2
3
2
PR3 Only (n=7)
AFR ASP CEE LAC WEOG
7
144
8
3
PR2 Only (n=36)
1810
3
1318
614
18 17 1914
814
23 20
3544
51
43 35
47
95 6
1419
25 15
7 10
0
10
20
30
40
50
60Dark shade- SubmittedLight shade- No submission

SAICM/OEWG.3/INF/4
9
27. The response rates of all the regions have unfortunately decreased since PR2 (Figure 2). However, CEE
and WEOG were highly represented in the PR3 progress report. The CEE region contributed to 31 per
cent of PR3 but accounts for 12 per cent of countries, and WEOG contributed to 37 per cent of the
PR3 sample but accounts for 16 per cent of all countries (Figure 3). The AFR region was significantly
under-represented in PR3 which made up six per cent of the PR3 sample but 28 per cent of all
countries.
Figure 3 Regional breakdown of countries in the progress report (all countries split by region, PR3 (n=54) and PR2
respondents by region (n=83), governments only)
2.2. Results of the Online Questionnaire by Strategic Objective
All respondents, except where stated otherwise, n=65
2.2.1. Objective A Risk Reduction
Indicator 1 Mechanisms to address key categories of chemicals
28%
27%12%
17%
16%
Per centage of all countries (2013)
AFR
ASP
CEE
LAC
WEOG
6%11%
31%
15%
37%
Per centage of countries in PR3
12%
21%
22%17%
28%
Per centage of countries in PR2
0% 20% 40% 60% 80% 100%
Agreements
Policies
Standards
Legislation/ regulations
Programmes
% all respondents
AFR
ASP
CEE
LAC
WEOG
WORLD

SAICM/OEWG.3/INF/4
10
Figure 4 Per cent of respondents with a mechanism in place to address key categories of chemicals
28. Indicator 1 reports on the countries and organizations that have mechanisms to address key
categories of chemicals (Figures 4, 5). Figure 4 shows the per cent of the respondents who selected
the five categories of mechanisms to reduce risks associated with chemicals. A majority of the
respondents indicated that they have at least three mechanisms in place; ‘programmes’ (94 per cent),
‘legislation or regulation’ (91 per cent) and ‘standards’ (82 per cent). The high response rate makes
this indicator one of the most commonly reported activities among all the objectives.
29. The AFR showed a great level of activity by selecting three out of five mechanisms (programmes,
legislation and agreements) by 100 per cent of the respondents. The other two categories of
‘standards’ and ‘agreements’ have been selected by 67 per cent of the AFR respondents (Figure 4). In
addition, 83 per cent of the respondents in the ASP region reported on all the five categories of the
mechanisms in place; with ‘legislation’ being selected by all the ASP respondents. The CEE region
prioritized ‘programmes’, ‘legislation’ and ‘policy’ with 100 per cent response rate for the first two
and 83 per cent response rate for the third. The favorite mechanism was indeed ‘legislation’ with 83
per cent of WEOG respondents and all the respondents from AFR, ASP, CEE, and LAC having selected
this activity.
30. In response to a new activity added to the indicator 1, 92 per cent of all the respondents noted that
they have programmes in place to respectively encourage the mechanisms (e.g. education and
training) identified above. Fifty-eight per cent of the respondents also used other methods such as
the organization of educational sessions for the public. Eighty-six per cent of all the respondents use
some type of enforcement programme (e.g. inspection, sampling/testing) to ensure compliance with
the mechanisms in place. All the country respondents in the regions of LAC, CEE and ASP selected
both encouragement and enforcement programmes to address the key categories of chemicals. Only
three governments did not provide a response to this activity.
31. Figure 5 shows the number of countries (organizations) with mechanisms to address key categories
of chemicals. The response rates to all the categories of chemicals in PR3 were between 14 to 92 per
cent, whereas this range was 43 to 90 per cent in PR2. One government respondent and one industry
respondent did not select any of the categories and another two countries selected only two out of
12 categories of the chemicals. Pesticides, mercury or mercury-containing sources and Persistent
Organic Pollutants (POPs) were selected by 92, 92 and 91 per cent of the respondents respectively.
These values were equally 90 per cent for POPs and pesticides and 85 per cent for mercury in PR2.

SAICM/OEWG.3/INF/4
11
Figure 5 Per cent of respondents (n=65) with mechanisms to address key categories of chemicals
32. As it can also be seen in figure 5, among all the categories of key chemicals, pesticides, mercury and
POPs received the highest response rate. The high activity could be attributed to the fact that
pesticides, mercury and POPs, are addressed in the legally binding conventions. Eight out of 15
functional projects funded by QSP trust fund in the period 2014-2016 focused on indicator 1.
Furthermore, a large number of projects approved and funded in the period 2014-2016 by the Global
Environment Facility (GEF) pledged to address the sound management of these three categories of
chemicals (i.e. POPs, pesticide, and mercury) as it is discussed in the section 2.4.
33. IPEN6 reported on the International Mercury Enabling Activities Program7, launched in 2014, which
supported NGOs in 29 countries to promote treaty ratification and awareness-raising on mercury
pollution. In addition, IPEN produced Mercury Treaty Guidance documents, which have been
translated into several languages to help NGOs and government delegates apply the Minamata
Convention on Mercury to their national situations.8
6 IPEN’s Citizens’ Report 2012 – 2015 7 IMEAP 8 An NGO Introduction to Mercury Pollution and the Minamata Convention on Mercury and Guidance on the Identification
Management and Remediation of Mercury-Contaminated Sites
0% 50% 100%
ImmunotoxinsNeurotoxins
Chems in Consumer ProdChem in dispersive use
Hi-volume ChemicalEndocrine disruptors
Other PBTsCarcinogenic, mutagenic or…
MetalsPOPs
HgPesticides
% all respondents
AFR
ASP
CEE
LAC
WEOG
WORLD
PR3
0% 20% 40% 60% 80% 100%
Count of Cat-Natl Concern
High production volume
Wide dispersive use
Endocrine, immuno or neurotoxics
Consumer products
Other metals/ compounds
Other PBTs
Carcinogenic, mutagenic or…
Mercury or mercury-containing…
Pesticides
POPs
Per centage of government respondents PR2 n=83
AFR
ASP
CEE
LAC
WEOG
PR2

SAICM/OEWG.3/INF/4
12
34. The least commonly selected categories of chemicals were immunotoxins, neurotoxins, and the
chemicals in consumer products with 14, 20 and 42 per cent response rate, respectively. This in
particular highlights the room for more tangible work in regard to immunotoxins, neurotoxins and the
chemicals in products.
35. The level of activities in regard to heavy metals reached 80 per cent response rate by governments
since PR2. Six out of ten non-governmental respondents selected activities concerning the heavy
metals, out of which three were NGOs, one industry, and two were IGOs.
36. Endocrine-disrupting chemicals (EDCs) was selected by 71 per cent or 46 of the respondents in PR3;
slightly smaller than 49 respondents who selected this activity in PR2. According to IPEN’s report, the
Endocrine Society and IPEN developed the EDC Guide which was published in 20149. The guide draws
from each organization’s strengths to present a more comprehensive picture of global EDC exposures
and health risks as well as knowledge of global policies and perspectives from developing and
transition countries.
37. Overall, this indicator was among the most commonly reported activities by all the respondents with
an above-average progress by all the regions. Eight out of 15 QSP trust fund projects in the period
2014-2016 addressed this indicator.
9 Introduction to Endocrine Disrupting Chemicals (EDCs)

SAICM/OEWG.3/INF/4
13
Indicator 2 Hazardous waste management arrangements
Figure 6 Per cent of all respondents controlling different stages of the hazardous waste cycle
38. Indicator 2 addresses the progress of the countries (organizations) in regard to hazardous waste
management arrangements (Figures 6, 7). More than 90 per cent of all the respondents addressed
the top three stages of the hazardous waste management (Figure 6). The number of respondents
addressing the activity in ‘recovery and recycling of waste’ has remained similar to PR2. The
‘prevention or reduction in generation of hazardous waste’ received the largest attention with 98 per
cent response rate or 61 responses versus 64 total responses in PR2. The improvement in the level of
activities was similarly recorded for the other three stages of managing hazardous waste. One of the
respondents selected none of the stages of waste management. Another 16 per cent of governments
selected ‘other’ methods of addressing hazardous waste which is considerably smaller than reported
value in PR2 as can be seen in figure 6.
39. Given the small size of the AFR respondents, all the governments noted that they have the
arrangements for ‘the prevention or reduction in generation of waste’. All the respondents in the ASP,
CEE and LAC regions (100 per cent) also selected ‘the prevention of hazardous waste’. Only one out
of three AFR countries selected ‘recovery and recycling of hazardous waste’ and ‘disposal of
hazardous waste’.
0% 20% 40% 60% 80% 100%
Recovery and recycling ofhazardous waste
Collection and interim storage ofhazardous waste
Disposal of hazardous waste
Prevention/reduction in generationof hazardous waste
% all respondents
AFR
ASP
CEE
LAC
PR3
0% 20% 40% 60% 80% 100%
None
Other
Recovery and recycling
Collection & interim storage
Prevent/ reduce generation
Disposal of hazardous waste
Per centage of stakeholder respondents PR2
AFR
ASP
CEE
LAC
WEOG
World
PR2

SAICM/OEWG.3/INF/4
14
40. A new activity added to the questionnaire tried to measure the progress of the stakeholders in regard
to the waste management cycles in the period of 2014-2016. Between 78 to 83 per cent of the
respondents indicated that they have either introduced, revised or were developing mechanisms to
address any of the identified cycles in this reporting period. This rate pointed to the rising attention
given to the issue of the hazardous waste. Notably, 21 projects out of 31 GEF approved projects in the
period 2014-2016 addressed the hazardous waste containing chemicals, in particular POPs and the
reduction of the risk associated with them.
Figure 7 Per cent of all respondents addressing specific waste streams through legislation or permits
41. The per cent of respondents addressing specific waste streams through legislation or permits is shown
in figure 7. The response rate in PR3 was about 88 per cent on average for all of the categories of
waste streams. The majority of the respondents selected ‘plastics’ while in PR2 ‘pesticides’ received
the highest activity. Eighty-eight per cent of the respondents addressed pesticides and 91 per cent
selected the plastics in PR3. The number of respondents who addressed plastics was slightly larger
(i.e. 59 respondents) as compared to PR2 (i.e. 57 respondents). There has been increasing
international attention to address the plastic waste in recent years and this can explain the relative
growth in reported activities on plastics in waste streams in PR3 even though the total number of
respondents was significantly smaller than the previous progress reports. The response rate to
0% 20% 40% 60% 80% 100%
Others
Dioxin-related substances
Mobile phones
Pesticide contaminated wastes
Lead-acid batteries
POPs contaminated waste
Other electrical & electronic…
Biomedical & healthcare wastes
Plastics
% all respondents
AFR
ASP
CEE
LAC
WEOG
WORLD
PR3
0% 20% 40% 60% 80% 100%
Other
Mobile phones
Other electrical & electronic equipment
Plastics
Dioxin-related substances
Lead-acid batteries
POPs contaminated waste
Biomedical & healthcare wastes
Pesticide contaminated wastes
Per centage of stakeholder respondents PR2
AFR
ASP
CEE
LAC
WEOG
World
PR2

SAICM/OEWG.3/INF/4
15
address plastics reached 100 per cent of the responding countries in the AFR, ASP and CEE regions
and it was 78, and 88 per cent for the LAC, and WEOG regions.
42. The difference in proportions among the specific waste streams was considerably small and it has
subsequently decreased since PR2. This showed that the waste streams of ‘dioxins’, ‘electronic and
mobile waste’ which were not receiving adequate attention in previous reports have seen much
increase in the level of activity in PR3. In particular, two out of three AFR respondents indicated the
development of mechanisms to address mobiles, electronics, pesticides and POPs waste in this
reporting period. IPEN reported on launching, in 2016, a series of pilot projects across Africa, Asia,
Latin America and Central and Eastern Europe on the SAICM Emerging Policy Issue including the highly
hazardous pesticides, chemicals in products and hazardous substances in the life cycle of electronic
products. Outcomes of these project were realized in 2017.
43. Indicator 2 similar to indicator 1 was among the indicators with high reported activity. One project
funded by QSP trust fund focused on this indicator in this reporting period. The average score of 0.84
acquired for this indicator points at the major advancement made by majority of the respondents.
Indicator 3 Mechanisms for setting priorities for risk reduction
44. Indicator 3 addresses the mechanisms for setting priorities for risk reduction associated with the
chemicals (Figures 8- 10). The progress on accounting for chemicals through a science-based
assessment to set priorities for risk reduction is shown in figure 8A.
45. The risks associated with ‘pesticides’ were indicated as the most common risk among all the four
categories of chemicals (i.e. Pesticides, industrial chemicals, biocides and food additives) with 88 per
cent response rate or 57 respondents as compared to 77 per cent (i.e. 78 respondents) in PR2. The
response rates to the other three categories of chemicals were 82 per cent for ‘industrial chemicals’,
and 74 per cent for both ‘biocides’ and ‘food additives’. The AFR region reported the smallest progress
since PR2 with only one country out of three having science-based assessment for only ‘pesticides’
and ‘industrial chemicals’. The largest progress for science-based assessment of pesticides belonged
to the ASP, LAC and CEE respondents with 100 per cent response rate for the first two and 94 per cent
for the later in this reporting period.
46. In a separate sub-activity, the status of prioritization process by the stakeholders for a set of exposure
risks was requested (Figure 8B). The ‘Environmental risks’ have been identified by 94 per cent (i.e. 61
respondents) of the respondents as the most common exposure risk whereas this activity was
selected by 65 per cent of the respondents (i.e. 66 respondents) in PR2 (Figure 8). In addition, the
other two exposure risks, ‘consumer or public health’ and ‘occupational health’, stood after
‘Environmental risks’ with equally 91 per cent response rate.

SAICM/OEWG.3/INF/4
16
Figure 8 Per cent of respondents with science-based assessment in PR3 and PR2; (A) for different chemicals in PR3
(B) with prioritization process for the exposure risks in PR3
47. In a newly added activity, between 8 and 18 per cent of the respondents indicated that their science-
based assessment of the categories of chemicals specified above, in figure 8, was pre-market (i.e. new
chemicals only). Whereas, more than 60 per cent of respondents selected both pre- and post-market
(i.e. existing chemicals) assessment for the chemicals. This data suggested that a majority of countries
do not conduct a science base assessment of chemical before they appear in the markets and a
significant number of countries (i.e. 14-31 per cent of respondents depending on the type of chemical)
were uncertain of the existence of this mechanism which both emphasized the room for a better
coordination in this area.
0% 20% 40% 60% 80% 100%
other
None
Food additives
Biocides
Industrial chemicals
Pesticides
% stakeholder respondents
PR3 A
0% 20% 40% 60% 80% 100%
Not known/NA
other
Occupational healthand safety risks
Consumer or publichealth risks
Environmental risks
% stakeholder respondents
Exposure risks
AFR
ASP
CEE
LAC
WEOG
PR3 B
0% 20% 40% 60% 80% 100%
Other
None applicable
Food additives
Biocides
Occupational health & safety risks
Industrial chemicals
Consumer or public health risks
Environmental risks
Pesticides
Per centage of stakeholders with science based assessment PR2
AFR
ASP
CEE
LAC
WEOG
World
PR2

SAICM/OEWG.3/INF/4
17
Figure 9 Per cent of respondents within region with a scientific committee
48. The proportion of respondents with a scientific committee in place to assess risks was 78 per cent in
PR3 (i.e. 51 respondents) whereas it was 69 per cent in PR2 (i.e. 70 respondents) (Figure 9). Five
respondents in the ASP region indicated the presence of scientific committees whereas this value was
12 respondents in PR2. Six respondents from the LAC region had the scientific committees versus 10
respondents in PR2. The number of scientific committees in the WEOG region was relatively close in
PR3 with 20 respondents to PR2 with 23 respondents. Similarly, for the CEE region, 16 respondents
indicated having a scientific committee in PR3 versus 18 respondents in PR2. One out of three AFR
respondents (33 per cent) reported the presence of a scientific committee which has decreased from
6 responses received in PR2. It is notable that the response rate of the AFR region to this activity had
also decreased in PR2 as compared to PR1. It could be suggested that the continuous fall in the
number of submitted reports from the majority of the regions, in particular the AFR region, since PR1
might have contributed to the low level of activity.
49. Figure 10 shows the per cent of respondents having risk management programmes for risks associated
with the categories of chemicals. The three most commonly selected categories were ‘air pollutants’,
‘chemicals in drinking water’ and ‘pesticides’ with 86, 83, 83 per cent response rate respectively. On
average, 81 per cent of the stakeholders selected all the categories of chemicals. The largest level of
the activities in the AFR region was under ‘chemicals in recreational water’ and ‘chemicals in drinking
water’ with 100 per cent response rate. Three countries in the LAC region were developing
programmes for ‘Industrial chemicals’, ‘pesticides’, ‘biocides’ and ‘chemicals in food’. Moreover,
0%
20%
40%
60%
80%
100%
AFR ASP CEE LAC WEOG WORLD
% respondents by region
Uncertain/NA
No
Yes
PR3
0%
20%
40%
60%
80%
100%
AFR ASP CEE LAC WEOG World
Per centage of respondents by region with a scientific committee in place PR2
(blank)
Yes
In development
No
PR2

SAICM/OEWG.3/INF/4
18
another three countries in the LAC region were developing new programmes for ‘chemicals in
products’, ‘chemicals in recreational’ and ‘chemicals in groundwater’.
50. Overall, the level of activity for this indicator was above-average except for the AFR region reporting
a below-average activity. Two approved QSP trust fund projects, one in the AFR region (i.e. Ghana)
and one in the CEE region (i.e. Albania, Bosnia and Herzegovina, and the former Yugoslav Republic of
Macedonia), sought to address this indicator.
Figure 10 Per cent of respondents having risk management programmes for priority risks
0% 20% 40% 60% 80% 100%
Other
Biocides
Chemicals in food
Chemicals in groundwater
Pesticides
Chemicals in consumer…
Chemicals in recreational…
Industrial chemicals
Chemicals in drinking water
Air pollutants
% stakeholder respondents
AFR
ASP
CEE
LAC
WEOG
WORLD
PR3
0% 20% 40% 60% 80% 100%
Other situations
Chemicals in recreational water
Biocides
Chemicals in groundwater
Chemicals in consumer products
Industrial chemicals
Chemical contaminants in food
Air pollutants
Chemicals in drinking water
Pesticides
Per centage of stakeholders with risk management programmes PR2
AFR
ASP
CEE
LAC
WEOG
World
PR2

SAICM/OEWG.3/INF/4
19
Indicator 4 Use of chemicals management tools
Figure 11 Per cent of all respondents utilizing IOMC tools
51. Indicator 4 addresses the per cent of respondents implementing the IOMC tools or the self-published
tools by the countries (organizations) to address chemicals management (Figures 11, 12, 14). There
have been five new additions to the IOMC tools in PR3 including OECD Substitution and Alternatives
Toolbox, WHO Chemical Safety Cards, WHO Human Health Risk Assessment, OECD Environmental Risk
Assessment Toolkit and IOMC Toolbox (Figure 11). Moreover, UNITAR National Profile were removed
from the list of IOMC tools in PR3.
52. The IOMC tools play an important role in facilitating the sound management of chemicals. The use of
IPCS International Chemical Control Toolkit and UNITAR Guidance on Developing a Risk Management
Plan for Priority Chemicals were particularly selected by a small number of respondents; 10
respondents selected IPCS International Chemical Control Toolkit in PR3 versus 29 respondents in PR2.
The number of respondents who selected UNITAR guidance was 9 in PR3 whereas this value was 36
in PR2.
0% 20% 40% 60% 80% 100%
UNITAR Guidance
IPCS (Control Banding)
WHO Chemical Safety Cards
IOMC Toolbox
WHO Classification of Pesticides by Hazard
WHO Air Quality Guidelines
WHO Drinking Water Guidelines
FAO/WHO Code of Conduct for Pesticides
OECD Substitution and AlternativesToolbox
OECD Environmental Risk Assessment Toolkit
WHO Human Health Risk Assessment
OECD eChem Portal
OECD Testing of Chemicals
% Stakeholder respondents
PR3 AFR
ASP
CEE
LAC
WEOG
World
0% 20% 40% 60% 80% 100%
IPCS Control Banding
UNITAR Risk Manaement Plan
UNITAR National Profile
OECD echem portal
Other
WHO Air Quality Guidelines
OECD TG
International Code of Conduct on Pesticide…
WHO Classification of Pesticides
WHO Drinking Water Guidelines
FAO Pesticides Code of Conduct
Per centage of all respondents n=101
AFR
ASP
CEE
LAC
WEOG
World
PR2

SAICM/OEWG.3/INF/4
20
53. The newly added tools including IOMC Toolbox, OECD Environmental Risk Assessment Toolkit, WHO
Human Health Risk Assessment and WHO Chemical Safety Cards were selected by 26, 58, 58, and 18
per cent of the respondents respectively.
54. The top two selected tools by the respondents in PR3 were OECD guidelines for testing of chemicals,
and OECD eChem portal whereas the top two in PR2 were FAO pesticides Code of Conduct and WHO
drinking water guidelines. The highly represented regions of WEOG and CEE could be one reason for
the high selection rate of OECD tools in this progress report. The majority of WEOG, and CEE
respondents used the OECD guidelines for testing of chemicals and OECD e-Chem portal which
otherwise were selected relatively less by other regions. Excluding the responses from the EU member
States, the most popular tools among other stakeholders remained to be the same as PR2.
55. It is notable that the WEOG region showed much smaller activity in the use of the tools by WHO/FAO
Code of Conduct on Pesticides Management in PR3 as compared to PR2. For the AFR, ASP, and LAC
regions, they relied heavily on the two top tools similar to PR2, being WHO/FAO Code of Conduct on
Pesticides Management and WHO Drinking Water Guidelines. WHO Chemical Safety Cards, UNITAR
guidance on developing a risk management plan and IPCS International Chemical Control Toolkit
presented a very low rate of adoption by the least developed countries.
Figure 12 Per cent of government respondents publishing their own tools on specific chemical risk
management issues
0% 20% 40% 60% 80% 100%
Others
Management media-specific risks
Exposure assessment
Major industrial accidents
Risk characterization
Prevention & control of chemical…
% stakeholder response
AFR
ASP
CEE
LAC
WEOG
World
PR3
0% 20% 40% 60% 80% 100%
Other
Major industrial accidents
Risk characterization
Alternative substances
Obsolete chemicals/pesticides
Media-specific risks
Exposure assessment
Identification of chemicals
Hazard identification
Chemical pollution & waste
Management of pesticide risks
Per centage of all respondents N=101
AFR
ASP
CEE
LAC
WEOG
World
PR2
SAICM/OEWG.3/INF/4
21
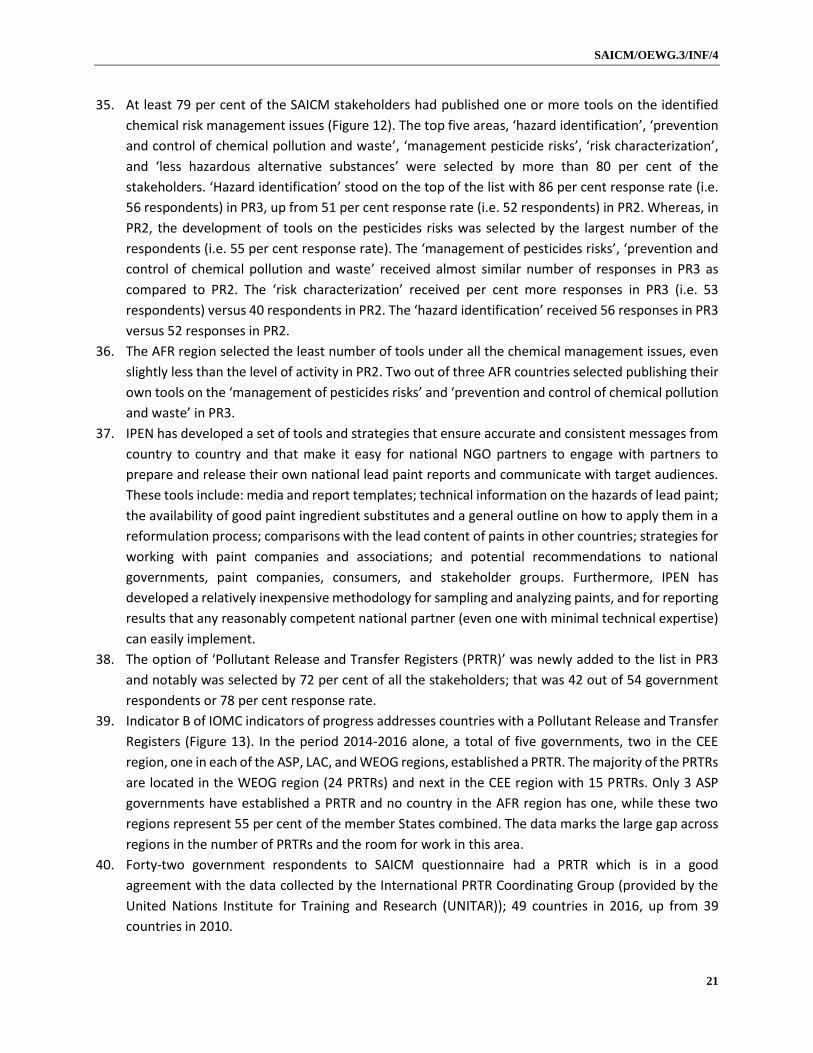
35. At least 79 per cent of the SAICM stakeholders had published one or more tools on the identified
chemical risk management issues (Figure 12). The top five areas, ‘hazard identification’, ‘prevention
and control of chemical pollution and waste’, ‘management pesticide risks’, ‘risk characterization’,
and ‘less hazardous alternative substances’ were selected by more than 80 per cent of the
stakeholders. ‘Hazard identification’ stood on the top of the list with 86 per cent response rate (i.e.
56 respondents) in PR3, up from 51 per cent response rate (i.e. 52 respondents) in PR2. Whereas, in
PR2, the development of tools on the pesticides risks was selected by the largest number of the
respondents (i.e. 55 per cent response rate). The ‘management of pesticides risks’, ‘prevention and
control of chemical pollution and waste’ received almost similar number of responses in PR3 as
compared to PR2. The ‘risk characterization’ received per cent more responses in PR3 (i.e. 53
respondents) versus 40 respondents in PR2. The ‘hazard identification’ received 56 responses in PR3
versus 52 responses in PR2.
36. The AFR region selected the least number of tools under all the chemical management issues, even
slightly less than the level of activity in PR2. Two out of three AFR countries selected publishing their
own tools on the ‘management of pesticides risks’ and ‘prevention and control of chemical pollution
and waste’ in PR3.
37. IPEN has developed a set of tools and strategies that ensure accurate and consistent messages from
country to country and that make it easy for national NGO partners to engage with partners to
prepare and release their own national lead paint reports and communicate with target audiences.
These tools include: media and report templates; technical information on the hazards of lead paint;
the availability of good paint ingredient substitutes and a general outline on how to apply them in a
reformulation process; comparisons with the lead content of paints in other countries; strategies for
working with paint companies and associations; and potential recommendations to national
governments, paint companies, consumers, and stakeholder groups. Furthermore, IPEN has
developed a relatively inexpensive methodology for sampling and analyzing paints, and for reporting
results that any reasonably competent national partner (even one with minimal technical expertise)
can easily implement.
38. The option of ‘Pollutant Release and Transfer Registers (PRTR)’ was newly added to the list in PR3
and notably was selected by 72 per cent of all the stakeholders; that was 42 out of 54 government
respondents or 78 per cent response rate.
39. Indicator B of IOMC indicators of progress addresses countries with a Pollutant Release and Transfer
Registers (Figure 13). In the period 2014-2016 alone, a total of five governments, two in the CEE
region, one in each of the ASP, LAC, and WEOG regions, established a PRTR. The majority of the PRTRs
are located in the WEOG region (24 PRTRs) and next in the CEE region with 15 PRTRs. Only 3 ASP
governments have established a PRTR and no country in the AFR region has one, while these two
regions represent 55 per cent of the member States combined. The data marks the large gap across
regions in the number of PRTRs and the room for work in this area.
40. Forty-two government respondents to SAICM questionnaire had a PRTR which is in a good
agreement with the data collected by the International PRTR Coordinating Group (provided by the
United Nations Institute for Training and Research (UNITAR)); 49 countries in 2016, up from 39
countries in 2010.

SAICM/OEWG.3/INF/4
22
41. A closer look at the regional breakdown of the responses to this activity showed that 5 governments
in the ASP region noted to have published their tool or guidance materials on Pollutant Release and
Transfers. This number did not correspond to the IOMC data which was 3 countries as of 2016 in the
ASP region. It could be explained that rather than having a comprehensive PRTR tool, these
governments have published some guidance materials on the topic. Nevertheless, a cross-
referencing is needed to confirm the differences between the two sets of data.
Figure 13 IOMC Indicator B Number of countries with a PRTR in 2010, 2016 and in the period 2014-2016 (UNITAR)
42. Figure 14 shows the government respondents selecting options in regard to pesticides under the
indicators 1 (key categories of chemicals- Pesticides), 2 (Waste streams- Pesticides), 3 (Scientific
committee- Pesticides and risk management programmes-Pesticides), 4 (FAO/WHO Code of Conduct
on Pesticide Management, WHO classification of pesticides, International Code of Conduct on
pesticides, publication of tools and guidance on pesticides risks and management of obsolete
chemical and pesticides) and 6 (GHS classification of pesticides). The activities concerning the
pesticides usually received a high level of response rate as it can be seen in figure 14; more than 77
per cent of the respondents in PR3 reported activities on the pesticides under all the indicators
except for WHO tool of classification of pesticides under indicator 4.
Figure 14 Per cent of government respondents selecting pesticide options under indicators 1, 2, 3, 4 and 6 in
PR3, PR2 and PR1.
0 5 10 15 20 25 30
AFR
ASP
CEE
LAC
WEOG
No. of countries in each region
2014-2016
2016
2010
0%10%20%30%40%50%60%70%80%90%
100%
PR3
PR2
PR1
PR3

SAICM/OEWG.3/INF/4
23
43. There has been consistent increase in activity as compared to PR1 and PR2 in case of most of the
indicators on pesticides. Except that, in this reporting period, the WHO classification of pesticides
and FAO Code of Conduct on Pesticide Management both under indicator 4 indicated a decline, with
34 and 48 per cent response rate; down from 55 and 58 per cent response rate in PR2, respectively.
Figure 15 IOMC Indicator E Number of FAO member countries with pesticide legislation based on the FAO/WHO
International Code of Conduct on Pesticide Management (FAO)
44. Indicator E of IOMC addresses the FAO member countries which have implemented pesticide
legislation based on the FAO/WHO International Code of Conduct (Figure 15). Indicator E is
interlinked with Indicator 4 of SAICM indicators of progress on the tools or guidance materials for
risk reduction of chemicals by IOMC, including the FAO/WHO International Code of Conduct on
Pesticide Management. The presented data in figure 15 shows the status of member state countries
under each FAO region10 as of 2017 collected through a global questionnaire filled by the member
States11. Eighty-nine per cent (174 countries) have implemented pesticide legislation, whereas 3 per
cent of the States have not, and another 9 per cent provided no response. A regional breakdown
showed that all the 19 FAO member countries in Near East and North Africa region have
implemented legislation.
45. Forty-eight per cent of all the respondents to SAICM questionnaire reported that they used
FAO/WHO Code of Conduct as a tool or guidance material for pesticides. The majority of FAO
member States have implemented the pesticide legislation and a closer look at the States that have
not in both questionnaires (i.e. SAICM and FAO) made the comparison more meaningful. The
majority of EU member States did not select this activity in SAICM questionnaire. Whereas, according
to the FAO data, the EU member countries had the pesticide legislation based on FAO/WHO Code of
Conduct in place. This difference in data pointed out at the slight difference in the way each indicator
enquired about FAO/WHO Code of Conduct; indicator 4 of SAICM questionnaire asked whether the
stakeholders use FAO/WHO Code of Conduct as a tool or guidance material for risk reduction, and
indicator E of IOMC collected the data on countries who have implemented the Code of Conduct as
the legislation.
10 The number of countries in FAO regional breakdown: Africa 47, Near East and North Africa 19, Asia and Pacific 44, Latin
America and Caribbean 33, Europe and Central Asia 53 countries. 11 No data before 2017 is available for the FAO/WHO International Code of Conduct on Pesticide Management (formerly the
International Code of Conduct on the Distribution and Use of Pesticides)
0
10
20
30
40
50
60
Africanregion
Near Eastand North
Africa
Asia &Pacific
LatinAmerica &Caribbean
Europe andCentral Asia
No
. of
FAO
me
mb
er
cou
ntr
ies Yes
No
No data

SAICM/OEWG.3/INF/4
24
46. With slightly above-average level of activity reported by the respondents, the indicator 4 of SAICM
indicators of progress has shown an overall positive growth of 20 per cent since PR1; with ASP and
CEE regions performing better than the average in this regard and the AFR region with a below-
average progress.
Indicator 5 Monitoring activities for selected environmental and health priorities
47. Indicator 5 of SAICM indicators of progress follows the progress of the monitoring activities for
selected environmental and health priorities (Figure 16- 18). A large number of respondents, 92 per
cent, selected the ‘environmental monitoring; in PR3 as it is shown in figure 16. All the respondents
from CEE and LAC regions also selected the ‘environmental monitoring’. ‘Monitoring of food and
drinking water’ were newly added to PR3 and yet were largely selected, with 85 per cent of response
rate. ‘Monitoring of the chemicals’ related incidents was selected by 80 per cent of the stakeholders.
Thus, it remained very close to the ‘monitoring of human poisoning’, the ‘human biomonitoring’, and
the ‘occupationally-related diseases’ with 80, 77 and 77 per cent response rates respectively.
Figure 16 Per cent of all respondents monitoring chemical substances
0% 20% 40% 60% 80% 100%
Other
Human biomonitoring
Cases of occupationally-…
Cases of human poisoning
Chemical incidents
Food and/or drinking water
Environmental monitoring
% stakeholder respondents
AFR
ASP
CEE
LAC
WEOG
World
PR3
0% 20% 40% 60% 80% 100%
Other types
Human biomonitoring
Occupationally-related disease
Human poisoning
Chemical incidents
Environmental monitoring
Per centage of stakeholder respondents monitoring substances PR2
AFR
ASP
CEE
LAC
WEOG
World
PR2

SAICM/OEWG.3/INF/4
25
48. ‘Monitoring of chemical incidents’ which is covered under legally binding Rotterdam convention
reached 80 per cent in response rate (i.e. 52 respondents), versus 64 per cent response rate or 65
respondents in PR2. The proportions of responses within the regions varied considerably. Two out
of three AFR respondents selected ‘monitoring chemical incidents’. The ASP, LAC, WEOG, and CEE
stakeholders selected this activity at a rate of 67, 78, 88 and 89 per cent in this reporting period,
versus 57, 60, 80 and 76 per cent response rate in PR2.
49. All the three respondents from the AFR region reported to perform ‘environmental monitoring’, and
‘monitoring of food and drinking water’.
50. IPEN’s report discussed the monitoring of the toxic substances in plastic children’s products
purchased in Armenia, Belarus, Czech Republic, Hungary, Serbia, China, focusing on
polybromodiphenyl ethers (PBDEs) and new, alternative brominated flame retardants (nBFRs). Their
report12 indicated high levels of toxics chemicals in several of the plastic products, noting no
information was provided by the producers regarding the substances in the product.
51. The environment sector was selected by 95 per cent of the respondents as the most common sector
involved in monitoring activities (Figure 17). The health sector stood second with 89 per cent
response rate. The labour, agriculture and industry sectors were selected by 83, 83, and 80 per cent
of all stakeholders to be the next common sectors involved in the monitoring activities.
Figure 17 Per cent of all respondents indicating the sectors involved in monitoring activities
52. In a newly added activity to PR3, significant changes or new developments in the monitoring
activities in the reporting period of 2014-2016 were questioned (Figure 18). A response rate of 18
per cent for ‘monitoring of the cases of occupationally-related disease’ and 77 per cent of all the
stakeholders for ‘monitoring of the environment’ was registered in answer to this new activity.
Majority of these respondents indicated that they have made significant changes to the
environmental monitoring programmes over this reporting period, while the rest indicated to be in
the process of making the new developments. The CEE, WEOG, and LAC regions reported the largest
12 Toxic Toy or Toxic Waste: Recycling POPs into New Products
0% 20% 40% 60% 80% 100% 120%
Other
Natural Resources
Transportation
Industry
Agriculture
Labour
Health
Environment
% stakeholder respondents
AFR
ASP
CEE
LAC
WEOG
World
PR3

SAICM/OEWG.3/INF/4
26
number of new developments and changes to their environmental monitoring programmes with 89,
83, and 78 per cent regional response rate, respectively.
53. Overall, a positive growth of 24 per cent was recorded for the indicator five since PR1. The
performance under this indicator was overall above-average across all the regions. The AFR region
reported a below-average level of activity, WEOG and CEE had the largest level of activity, and finally
ASP and LAC stood slightly above average.
Figure 18 Number of SAICM respondents having made significant changes or new developments in their
monitoring activities in this reporting period (2014-2016).
0%
20%
40%
60%
80%
100% PR3Yes
In development

SAICM/OEWG.3/INF/4
27
2.2.2 Objective B Knowledge and Information
Indicator 6 Provision of information in accordance with internationally harmonized standards
Figure 19 Per cent of respondents with labeling standards during chemical life cycle
54. Indicator 6 of SAICM reports on the number of countries (and organizations) providing information
according to internationally harmonized standards (Figure 19-22). Figure 19 demonstrates the
number of stakeholders with labeling standards during the chemical life cycle. The proportions of
the responses among the five categories identified in this activity in PR3 were very similar; falling
between 80 to 83 per cent response rate. The ‘transport’, ‘consumer use’, ‘occupational use’, and
‘production cycles’ were selected by 83 per cent of the respondents; versus 66 per cent response
rate in PR2. The ‘disposal cycle’ was selected by 80 per cent of respondents which was slightly behind
the rest of the categories. The response rates indicated that as the new countries adopted labeling
standards, they were comprehensive in covering all the stages of chemical life cycle.
55. The GHS is a key component of SAICM implementation, featuring in the basic elements of the overall
orientation and guidance: “Collection and systems for the transparent sharing of relevant data and
information among all relevant stakeholders using a life cycle approach, such as the implementation
0% 20% 40% 60% 80% 100%
Other
Disposal
Production
Occupational use
Consumer or public use
Transport
% stakeholder with labeling standards during the life cycle
AFR
ASP
CEE
LAC
WEOG
World
PR3
0% 20% 40% 60% 80% 100%
Other
None applicable
Disposal
Production
Transport
Occupational use
Consumer or public…
Per centage of stakeholders with labeling standards during chemical life cycle PR2
AFR
ASP
CEE
LAC
WEOG
World
PR2

SAICM/OEWG.3/INF/4
28
of the Globally Harmonized System of Classification and Labelling of Chemicals”. Furthermore, it
features prominently in the SAICM overarching policy strategy and the global plan of action. Indicator
H of IOMC also addresses the number of countries with full or partial implementation of GHS (Figure
23).
Figure 20 Per cent of respondents assessing labeling conformity with GHS
56. The per cent of SAICM stakeholders selecting labeling conformity with GHS for the key categories of
chemicals is shown in figure 20. Eighty-six per cent of the respondents reported conformity with GHS
for ‘industrial chemicals’, versus 59 and 38 per cent in PR2 and PR1, respectively. The proportions of
responses among various categories of chemicals were similar. The ‘pesticides’, ‘chemicals in
workplace use’ and ‘dangerous goods’ were equally selected by 82 per cent of all the respondents.
The ‘chemicals in consumer products’ received relatively lower level of activity (75 per cent response
rate) as compared to PR2 (i.e. 66 per cent response rate). The SAICM baseline report estimated the
number of countries complying with GHS to be 65 in the period 2006-2008. The baseline report noted
that however this number included different levels of conformity (partial conformity) as many of the
activities addressed implementation of GHS for a specific category such as pesticides, workplace or
occupational health and safety risks.
0% 20% 40% 60% 80% 100%
Consumer GHS
Dangerous goods
Pesticides
Workplace GHS
Industrial
% stakeholder respondents assessing label conformaty with GHS
AFR
ASP
CEE
LAC
WEOG
World
PR3
0% 20% 40% 60% 80% 100%
Other
None applicable
Consumer products
Workplace use
Dangerous Goods
Industrial chemicals
Pesticides
Per centage of stakeholders assessing labeling conformity with GHS
AFR
ASP
CEE
LAC
WEOG
World
PR2

SAICM/OEWG.3/INF/4
29
57. By looking at the regional breakdown of the responses, the regions gave different prioritization to
different categories of chemicals (Figure 21). The LAC region gave the least priority to the chemicals
in consumer products and the highest priority to dangerous good and industrial chemicals. The ASP
region put the workplace chemicals first. The largest progress belonged to the CEE region where all
the respondents indicated conformity with GHS under the specified categories of chemicals. Only 33
per cent of the AFR respondents (i.e. one out of three countries) indicated conformity with GHS under
all the categories of chemicals. All the ASP respondents indicated conformity with GHS under
workplace chemicals, whereas all the rest of chemicals were selected by 83 per cent of ASP
stakeholders.
Figure 21 Per cent of respondents within regions assessing different categories of chemicals with GHS
58. The categories of chemicals (i.e. chemicals in the workplace and consumer products) in two labeling
schemes, GHS and other harmonized labeling schemes, are compared in each region in figure 22. All
the CEE respondents indicated conformity with GHS labeling standards for both workplace and
consumer good that was a noteworthy for this region. All the ASP respondents reported to have
conformed with workplace GHS and some being slightly behind with consumer GHS (83 per cent
response rate). The LAC and AFR regions were behind the other regions concerning the
implementation of consumer GHS with 44 and 33 per cent response rate. The AFR countries reported
their activities (i.e. 67 per cent response rate or 2 respondents out of 3) toward labeling chemicals in
both the consumer products and at the workplace, but the growth seemed less in harmony with the
GHS standards.
0% 20% 40% 60% 80% 100%
AFR
ASP
CEE
LAC
WEOG
World
% stakeholders within regions assessing different categories of chemicals with GHS
Consumer GHS
Workplace GHS
Dangerous goods
Industrial
Pesticides
PR3
0% 20% 40% 60% 80% 100%
AFR
ASP
CEE
LAC
WEOG
World
Per centage of stakeholders within regions assessing different categories of chemicals with GHS
Pesticides
Industrial
Dangerous goods
Workplace GHS
Consumer GHS
None
Other
PR2

SAICM/OEWG.3/INF/4
30
Figure 22 Per cent of respondents by region implementing GHS (light shading) and all harmonized labeling schemes
59. The Indictor H of IOMC tracks the number of countries with full or partial implementation of GHS
(Figure 23). UNITAR has been integrally involved in capacity building on the GHS for several years,
notably as part of the World Summit on Sustainable Development Global Partnership for Capacity
Building to Implement the GHS. In April 2002, UNITAR and ILO, in collaboration with the OECD,
initiated the Global Partnership. Since that time, UNITAR has continued its training and capacity
building programme on the GHS, under the partnership.
60. In addition to these IOMC Participating Organizations, the UN Economic Commission for Europe
(UNECE) provides the secretariat to the ECOSOC (Economic and Social Council) Sub-Committee of
Experts on the GHS, which is a policy body acting as the custodian of the GHS. UNECE participates in
the Inter-Agency Meetings on Sound Chemicals Management and Wastes, which also includes all of
the IOMC Participating Organizations.
61. As the GHS is not part of a convention, protocol or other form of legally-binding instrument, it does
not have a mechanism whereby countries notify their ratification, or report on their compliance. It
is a tool that is available to countries, should they wish to adopt it. This makes UNECE the recipient
of information on implementation of the GHS; this information may or may not be provided by
countries. Not only is it the case that UNECE may or may not receive such information, but there are
also additional complexities as to defining “implementation”.
62. The GHS, as a tool for countries, is intentionally flexible. The “building block approach” is integrated
into the GHS, meaning that any country or competent authority can adopt the hazard classes and/
or categories that it decides to. Furthermore, the GHS may be adopted in any of the four traditional
sectors of the GHS: transport, workplace, agriculture (pesticides) and consumer products. As the
transport sector has its own, longstanding international system - UN Recommendations on the
transport of dangerous goods: model regulations – implementation in this sector may not be
representative of specific work to bring in the GHS.
0%
20%
40%
60%
80%
100%
AFR ASP CEE LAC WEOG World
OccupationalWorkplace GHS
ConsumerConsumer GHS
PR3
0%
20%
40%
60%
80%
100%
AFR ASP CEE LAC WEOG World
Occupational
Workplace GHS
Consumer
Consumer GHS
PR2

SAICM/OEWG.3/INF/4
31
63. It may also be the case that a country does not bring the GHS into legislation but works with the
private sector to bring in voluntary standards that are in line with the GHS. In addition,
implementation could include transition periods, delayed implementation dates, and phased
implementation of chemicals and mixtures. Such implementation may also relate to different
editions of the GHS text. This factor means that it is also a case of legal interpretation in deciding
what level of, and when, the GHS implementation has come into force. All of these options contribute
to a broad picture of what constitutes the challenge of determining “implementation of the GHS”.
64. The UNECE website13 provides information on the implementation in 72 countries. However, the
information is not always uniform, up-to-date, and is not necessarily an indication of specific
implementation in a country (e.g. it may reference capacity building activities). To further the
available information on the subject, the Stockholm Environment Institute (SEI) and Wageningen
University & Research undertook a research in 2017: “The Globally Harmonized System of
Classification and Labelling of Chemicals – Explaining the Legal Implementation Gap”14. The data
presented in this progress reported is fully adopted from this research paper as the most up-to-date
data on the GHS implementation globally.15
Figure 23 IOMC Indicator H Number of countries with full or partial implementation of GHS in 2010 and 2016
(UNITAR and UNECE)
65. As of 2010 which was a general baseline for IOMC indicators of progress throughout this report, 41
countries have fully or partially implemented GHS in their national legislation (Figure 23). Five
governments implemented GHS in the period 2014-2016 (i.e. 2 CEE, 1 ASP, 1 LAC, 1 WEOG countries).
The research indicated that as of 2016, 60 countries had fully or partially implemented GHS16 (31 per
13 https://www.unece.org/trans/danger/publi/ghs/implementation_e.html#c41818 14 Persson et al, 2017, Sustainability 2017, 9, 2176; doi:10.3390/su9122176 15 The paper was presented to the UN ECOSOC Sub-Committee of Experts on the GHS at its 33rd session in July 2017. 16 National GHS implementation status - as of 1 April 2017 - was defined as passing of national legislation on GHS, with the
research categorising countries as:
• Full legal implementation: legislation passed as of 1 April 2017, irrespective of on which GHS revision the legislation is based, covering the workplace, agriculture and consumer sectors;
• Partial legal implementation: legislation passed as of 1 April 2017, covering at least one of the sectors agriculture, workplace or consumers;
• Not yet implemented in legislation: no legislation aligned with the GHS has been passed as of 1 April 2017, to the researchers’ knowledge.
0 10 20 30
AFR
ASP
CEE
LAC
WEOG
No. of countries with GHS implementation
2016
Pre-2010

SAICM/OEWG.3/INF/4
32
cent of UN member States). The number of countries with GHS legislation has increased consistently
over the years with the largest growth in the period 2011-2013. As of April 2017, 50 countries (26
per cent of UN member States) had fully implemented GHS in national legislation, 15 countries (8
per cent) had partially implemented, and 128 countries (66 per cent) had not yet implemented.
Furthermore, the paper provided background information on all UN member States, with links and
information related to implementation.
66. Overall progress of the indicator 6 of SAICM was above-average with the ASP, CEE and WEOG regions
reporting above 78 per cent advancement toward achieving compliance with GHS and harmonized
labeling schemes. A large room for further work was observed in the AFR region with far below-
average activity in international harmonized standards and a large number of countries who did not
submit a report to PR3. Two QSP trust fund projects out of four were operating in the AFR region in
this reporting period, focusing on indicator 6.
Indicator 7 Communication of risks to vulnerable groups
Figure 24 Per cent of respondents communicating to vulnerable groups
67. Indicator 7 measures the progress of the stakeholders with specific strategies in place for
communicating information on the risks associated with chemicals to vulnerable groups (Figure 24,
25). More than 80 per cent of the respondents selected at least five vulnerable groups. On average
at least three vulnerable groups were selected by all the respondents, similar to PR2. The ‘workers’,
‘general public’, ‘children’, ‘consumers’ and ‘women’ were the five most frequently selected
vulnerable groups in PR3; having received between 82 and 94 per cent response rates. Whereas, the
top four vulnerable groups in PR2 received a response rate of 31 to 77 per cent. Two categories of
0% 20% 40% 60% 80% 100%
Indigenous peoples
Workers in the informal…The elderly
Highly exposed groupsWomen
ConsumersChildren
The general public
Workers
% stakeholders communicating to vulnerable groups
AFR
ASP
CEE
LAC
WEOG
World
PR3
0% 20% 40% 60% 80% 100%
None applicable
Migrant workers
Indigenous peoples
Other
The elderly
Highly exposed groups
Women
Children
General public
Per centage of stakeholders communicating to vulnerable groups PR2
AFR
ASP
CEE
LAC
WEOG
World
PR2

SAICM/OEWG.3/INF/4
33
‘workers’ and ‘workers in informal sector’ were newly introduced in PR3 and replaced the ‘migrant
workers’ in PR2. The ‘workers’ were the most frequently selected group by 94 per cent response
rate. However, the ‘workers in the informal sector’ stood close to the bottom of the list, before the
‘indigenous people’ by receiving 28 per cent of responses. The difference in activity levels between
the two categories of workers indicated the existing gap in communicating with the ‘workers in the
informal sector’. The ‘migrant workers’ in PR2 was the least informed vulnerable group in PR2 (12
per cent response rate) similar to the category of ‘workers in informal sector’ in PR3. Five QSP funded
projects in the period 2014-2016 committed to communicate the risks associated to chemicals to
vulnerable groups out of which one project was in the AFR region, one in the ASP region and three
projects were in the CEE region.
68. A modified activity in the questionnaire sought to address the sectors involved in communicating the
chemical safety to the vulnerable groups in PR3. Eighty-five and 83 per cent of all the respondents
selected the environment and health sectors. The industry, labor, transportation and natural
resources stood next; being selected by 75, 72, 57 and 57 per cent of all respondents, respectively.
Figure 25 Respondents reporting health sector involvement in communicating with vulnerable groups, by DAC
status; n=47 for PR3
69. The respondents who selected the health sector involvement in communications are demonstrated
according to their DAC-Status in figure 25. Forty-seven respondents indicated the involvement of the
health sector. The proportions of the responses according to DAC-status were similar between PR3
and PR2 in the sense that non-DAC countries dominated the submitted responses. Seventy per cent
of the non-DAC and 22 per cent of UM countries selected the health sector in PR3 as compared to
54 and 31 per cent respectively in PR2. Only 4 per cent of all the respondents were from LM and LDC
countries respectively which highlighted the remaining gaps between lower and higher income
countries similar to the previous report. The results stressed the large room for improvement and
the need for more work in this area and better coordination of the health sector activities.
70. In summary, the AFR respondents demonstrated a relatively higher level of activity to this indicator
as compared to the majority of indicators. With above-average activity worldwide, this indicator has
received substantial attention from QSP trust fund funded projects in this reporting period with a
total of five projects in the AFR (1), ASP (1) and CEE (3) regions.
LDC4%
LM4%
Non-DAC70%
UM22%
PR3LDC6%
LM9%
Non-DAC54%
UM31%
Per centage of health sector responses (n=48)
PR2

SAICM/OEWG.3/INF/4
34
Indicator 8 The number of countries (and organizations) with research programmes
Figure 26 Per cent of respondents with research programmes
71. Indicator 8 measures the number of stakeholders with research programmes (Figure 26). At least 75
per cent of the respondents selected to have research programmes under all the identified research
categories. The response rates were very close for all the identified research categories. The ‘human
effects’ were the most frequently selected with 78 per cent response rate, versus 56 per cent
response rate in PR2. The ‘safer alternatives and cleaner production technologies’ were equally
selected by 75 per cent of the respondents (i.e. 49 respondents) which showed an increase from 39
and 36 respondents in PR2, respectively. This is a significant improvement in amount and extent of
research programmes on chemicals. The ‘environmental effects’ also received 75 per cent response
rate in this period versus 56 response rate in PR2 (i.e. 57 respondents).
72. Majority of WEOG countries (more than 83 per cent) have research programmes in almost all the
identified categories. About 67 per cent of the LAC, ASP regions (i.e. 4 to 6 respondents) and 83 per
cent of CEE respondents conducted research in at least three out of four of the research categories.
There was still a large room for improvement, in particular, on research on ‘cleaner production
technologies’ in the AFR, ASP and LAC regions. A new activity in the questionnaire sought to highlight
the sectors that were majorly involved in conducting the research programmes in PR3. Seventy-five
per cent of the stakeholders selected the environment and another 72 per cent indicated the health
sectors as the two most common sectors involved in research programmes.
0% 20% 40% 60% 80% 100%
Other
Environmentaleffects/exposure
Safer alternatives
Cleaner productiontechnologies
Human health effects/exposure
% stakeholders with research programmes
AFR
ASP
CEE
LAC
WEOG
World
PR3
0% 20% 40% 60% 80% 100%
None applicable
Other
Cleaner production
Safer alternatives
Human effects/ exposure
Environmental effects/ exposure
Per centage of stakeholders with research programmes PR2
AFR
ASP
CEE
LAC
WEOG
World
PR2

SAICM/OEWG.3/INF/4
35
73. The research programmes require substantial amount of resources and funding in order to
generating scientifically reliable and reproducible data and results. The LDC group with far below-
average level of activity and the non-DAC group with slightly above-average level of activity pointed
out the large gap among the countries in different development groups in regard to the research
activities. Majority of respondents in AFR, LAC and ASP reported below-average activity in this area,
whereas CEE and WEOG reported significantly above-average progress under this indicator. Notably,
no QSP trust fund project involved research programmes in this reporting period.
Indicator 9 Websites providing information to stakeholders
Figure 27 Per cent of respondents with websites providing different types of information to stakeholders
74. Indicator 9 shows the progress on the number of respondents maintaining websites that provide
publicly available information (Figures 27, 28). The top three topics of information that were covered
in the websites were the same as PR2 with a change in their ranks. The topic of ‘chemical safety
laws’, ‘hazards and risks associated with chemicals’, and ‘chemicals in use’ were covered in the
websites by 83, 82 and 78 per cent of the stakeholders. On average, the respondents reported the
existence of websites on 6.7 topics out of 9 topics (except ‘other’); up from 4.8 in PR2.
75. The majority of the CEE respondents, more than 70 per cent, selected the websites on all the 9 topics.
According to the QSP trust fund, three projects in the CEE region in the period 2014-2016 were
operating to communicate chemicals risks through publications of new websites or other channels
of public information to stakeholders. Sixty-seven per cent of the AFR region (i.e. 2 respondents out
0% 20% 40% 60% 80% 100%
Other
Chemical alternatives/substitutes
Exposure scenarios or risks with uses
First aid and medical information for…
Pollution release info
Chemical safety info
Guidance to prevent exposure
Chemicals in use
Hazards and risks associated with…
Chemicals safety laws
% stakeholders with websites
AFR
ASP
CEE
LAC
WEOG
World
PR3
0% 20% 40% 60% 80% 100%
None applicable
Other
Chemical alterantives
First aid & medical information
Exposure scenarios
Information in local languages
Prevention of exposure
Pollution release
Chemicals in use
Chemicals safety laws
Hazards & risks
Per centage of stakeholders with websites PR2
AFR
ASP
CEE
LAC
WEOG
World
PR2

SAICM/OEWG.3/INF/4
36
of 3) reported to have websites on ‘chemical safety laws’ whereas only 33 per cent or one AFR
country reported to have websites on other top two topics. At least 50 per cent of the respondents
of the LAC and ASP regions had websites on 5 to 6 topics respectively. One QSP funded project in the
period 2014-2016 in the AFR region and one in the ASP region involved the development of websites
whereas no project in the LAC region addressed this indicator. Although the progress has been
significant, the results generally underscored the possible room for improvement in all the rest of
regions except for the WEOG and CEE. At least 83 per cent of the WEOG stakeholders reported to
have websites on all the nine topics identified in this activity.
76. On an additional note, the two government respondents of Belgium and France provided information
on their activities in regard to Nanotechnologies. Belgium emphasized their efforts through Belgian
registry for Nanomaterials, launched in 2015, to guarantee transparency and thus to strengthen the
confidence of the public and the workers in this area. France put in place an annual reporting system
for nanoparticular substances. The data are collected in an information system and accessible
online17, aims to respond to the need to improve the information of the public, consumers and
professionals.
77. In response to a newly added activity in PR3, 58 per cent of the SAICM stakeholders noted the
increase in the overall amount or the update of chemical safety information available through
websites over the 2014 to 2016 period (Figure 28A). Another new question sought to measure the
share of other channels of public information in communicating the chemical safety (Figure 28B).
The responses showed that 88 per cent of all the stakeholders used at least one of the categories of
channels of public information including the ‘social media’ (e.g. Twitter, Facebook etc.), ‘printed
media’, ‘television’, ‘radio’, or ‘community workers’. Hundred, 89, 83, 83 and 33 per cent of the CEE,
LAC, ASP, WEOG, and AFR respondents, respectively noted the use of other channels of public
information. The large level of activity highlights the growing impact of ‘social media’ as a platform
chosen by many countries and organizations to communicate information on chemical safety to the
public.
78. The indicator 9 of SAICM obtained the largest average score worldwide with 0.85 points with the CEE
region being the most active (average score 0.94) and the AFR region the least active (average score
0.42). Five projects in total in the AFR (1), ASP (1) and the CEE (3) regions were developing websites
or other channels of sharing information with stakeholders in this reporting period according to
funded projects by QSP trust fund.
17 www.r-nano.fr

SAICM/OEWG.3/INF/4
37
Figure 28 Per cent of respondents (A) increased or updated publicly available chemical safety information
through websites over the 2014 to 2016 period (B) used other channels of public information in
communicating chemical safety
2.2.3. Objective C Governance
Indicator 10 Commitments to implementation of the Strategic Approach
Figure 29 Per cent of respondents committed to SAICM
AFR, 3%
World, 6% ASP,
8%
CEE, 28%
LAC, 12%
WEOG 34%
PR3 A
% respondents with increased/updated chem safety info
AFR, 3%World,
6%ASP, 8%
CEE, 28%
LAC, 12%
WEOG 34%
PR3
% respondents with other channels of public infor
0% 20% 40% 60% 80% 100%
New SAICM focal point
Formalization of National Focal Point (NFP)
Introduction/renewal of a chemical safety…
Publication of a SAICM implementation plan
Inclusion in annual report
Committee to coordinate SAICM matters
Organizational policies support SAICM…
Resolutions of governing bodies
Ministerial statements
Implementation of chemical safety programme
Active engagement in SAICM activities
Attendance at SAICM related meetings
% stakeholders commited to SAICM
AFR
ASP
CEE
LAC
WEOG
World
PR3
0% 20% 40% 60% 80% 100%
None identified
Formalization of NFP role
SAICM Implementation Plan
Resolutions of governing bodies
Ministerial statements
Committee to coordinate SAICM matters
Other commitments
New SAICM focal point
Inclusion in annual reports
Per centage of stakeholders committed to SAICM PR2
AFR
ASP
CEE
LAC
WEOG
World
PR2

SAICM/OEWG.3/INF/4
38
79. Indicator 10 addresses the commitments to the implementation of the strategic approach (Figure
29). Several new activities were added to this indicator in PR3 including ‘attendance at SAICM related
meetings’, ‘active engagement in SAICM activities’, ‘implementation of a chemical safety
programme’, ‘organizational policies supporting SAICM’, and ‘introduction/renewal of a chemical
safety programme’, most of which were selected by more than half of the respondents. The majority
of SAICM stakeholders selected ‘attendance at SAICM related meetings’ (95 per cent) and ‘active
engagement in SAICM activities’ (82 per cent). Notably, all the respondents of AFR, LAC and ASP
regions indicated to have attended the SAICM related meetings. The WEOG respondents also
reported a high level of activity by attending the SAICM meetings and engaging in SAICM related
activities with 96 per cent response rate. Despite that, WEOG reported far less activity on almost five
out of 12 specified activities similar to PR2, including but not limited to the ‘committee to coordinate
SAICM matter’, ‘inclusion in the annual report’, ‘publication of a SAICM implementation plan’.
80. On average, the respondents selected 48 per cent of the available options which showed a growth
from PR2 (33 per cent). Only 8 per cent of the respondents selected ‘nomination of a new national
or organizational SAICM focal point’ which was greatly smaller than the rate in PR2 likely because
those governments who had selected this activity in PR2 likely did not repeat reporting in this
reporting period. Publishing a ‘SAICM Implementation Plan’ did not improve since PR2 while the
‘formalization of a SAICM national focal point’ decreased; 9 respondents in PR3 versus 21
respondents in PR2. There has been no clear improvement on the ‘establishment of a committee to
coordinate on the chemical safety, including SAICM matters’ from PR2.
81. Certain activities enjoyed a significantly large growth since PR2. The ‘ministerial or other official
public statements expressing support for SAICM’ has also depicted a progress; 46 respondents in PR3
versus 30 respondents PR2. An increase in response rate for ‘resolution of governing bodies’ as
compared to PR2 was observed; 42 respondents in this period as compared to 25 respondents in
PR2. Furthermore, the number of stakeholders who selected ‘other commitments’ significantly
dropped in PR3. Only three government respondents selected ‘other’ (6 per cent) whereas this
activity received 36 per cent response rate in PR2. The advancement under this indicator was
justified by many of the QSP trust fund projects in this reporting period (i.e. six out of 15) pledged to
commit to the implementation of Strategic Approach in particular introduction of a chemical safety
programme and publication of a SAICM implementation plan.
82. This indicator had an overall below-average level of activity worldwide, even though it has
progressed since PR1 and PR2 by 15 per cent, on average. Six projects funded by QSP were evenly
distributed among the AFR, ASP and LAC regions (i.e. two projects for each) mostly focusing on
development of publication of SAICM implementation plan and introduction or renewal of a chemical
safety programme among other relevant activities to this indicator.

SAICM/OEWG.3/INF/4
39
Indicator 11 Multi-stakeholder coordination
Figure 30 Per cent of respondents with national multi-stakeholder or multi-sectoral committee to address
chemical safety issue
83. Indicator 11 addresses the number of countries (and organizations) with multi-stakeholder or multi-
sectoral coordination mechanisms (Figure 30). For this indicator, one activity was addressed to the
governments about their governmental and multi-sectoral committee, whereas a new activity
targeted the organizations (i.e. NGOs, IGOs, etc.) about the existence of non-government or multi-
sectoral committees and the types of stakeholders involved in them.
84. Seventy-seven per cent of all the respondents selected the first activity on the presence or the
development of a government (only) committee and 91 per cent indicated the presence or the
development of a multi-sectoral committee respectively. Figure 30 demonstrates different
government ministries with a national government committee to address chemical safety issues. The
per cent of the respondents selecting the ministries or agents involved in their national committee
declined in PR3 as compared to PR2. Moreover, the responses were largely represented by CEE and
WEOG regions as is clear in the figure 30. The small response rate might be attributed to the
modifications to the phrasing of the questions in this indicator. None of the AFR countries specified
0% 20% 40% 60% 80% 100%
Prime MinisterEducation
Other levels of governmentForeign Affairs
Internal Affairs/PlanningFinance/Economy
TransportCustoms authorities
ScienceTrade
LabourAgriculture
EnvironmentHealth
Industry
% stakeholders with national multi-stakeholder or multi-sectoral committee
AFR
ASP
CEE
LAC
WEOG
World
PR3
0% 20% 40% 60% 80% 100%
Prime Minister
Other
Foreign Affairs
Education
Science
Transport
Trade
Labour
Customs authorities
Industry
Agriculture
Environment
Health
Per centage of stakeholders with national chemicals committee PR2
AFR
ASP
CEE
LAC
WEOG
World
PR2

SAICM/OEWG.3/INF/4
40
the presence of government (only) committee and the three AFR respondents selected the presence
of multi-sectoral committee. Whereas, in PR2 the AFR region reported the involvement of an average
9.2 ministries on their committee.
85. The ministries of Industry, Health, Environment, and Agriculture were the most common
participants in government committees similar to PR2. The ministries of Finance or Economy and
Internal Affairs or Planning were added to the list in PR3 and were selected by 49 and 6 per cent of
the respondents.
86. The respondents were asked in two separate questions about the type of stakeholders on their non-
government and on the multi-stakeholder committee. This modification to the activities seemed to
have negatively affected the responses. Unfortunately, the responses to the activity on the type of
stakeholders in the non-government committee were only submitted by the EU on behalf of its
member States. The rest of the respondents left this activity blank. This low rate of response could
have been due to the very slight difference between this activity and the next activity in the
questionnaire about the type of the stakeholders on the multi-stakeholder committee. As a result,
the respondents might have misunderstood and not responded to the activity.
87. The second part of this activity on the types of stakeholders on the multi-stakeholders committee
received many more responses. Seventy-seven and 75 per cent of the respondents selected the
industry and the government as the types of stakeholders. The civil society, academia and
intergovernmental organizations were selected by 75, 72 and 57 per cent of the respondents. The
interests represented on this multi-stakeholder committee concerned majorly the industry and the
environment, selected by 77 and 78 per cent of respondents, respectively. The human rights and
cultural groups did not receive much of the attention of the multi-stakeholder committee; having
received 49 and 3 per cent response rates, respectively.
88. Overall, an above-average level of activity reported for this indicator worldwide, even though the
AFR, ASP and LAC regions reported a below-average level of activity, The CEE and WEOG regions
reported an above-average and completed nearly 70 per cent of the activities in this reporting
period. Three projects in the AFR (1) and the CEE (2) regions were funded by QSP trust fund in this
reporting period to improve multi-stakeholder coordination in particular among government
ministries.

SAICM/OEWG.3/INF/4
41
Indicator 12 Implementation of key international chemicals agreements
Figure 31 Per cent of stakeholders making significant changes made to the status and/or implementing of (e.g.
through the enacting of legislation, programme implementation, or through relevant policies) international
priorities
89. Indicator 12 seeks to measure the significant changes made to the implementation of international
or regional chemical instruments over the 2014-2016 period (Figure 31). This indicator in the
previous progress reports asked for the number of stakeholders which have ratified or implemented
any of the specified chemical instruments.
90. The top two international instruments which received the highest response rate were the Minamata
Convention (i.e. 78 per cent) and the UNECE Convention on Access to Information, Public
Participation in Decision-making and Access to Justice in Environmental Matters (i.e. Aarhus
Convention) (i.e. 52 per cent). The other top-ranking international priorities with about 30 per cent
response rates were the Stockholm Convention on Persistent Organic Pollutants, the FAO/UNEP
Rotterdam Convention on the Prior Informed Consent Procedure for Certain Hazardous Chemicals
and Pesticides in International Trade, the Montreal Protocol, the Basel Convention on the Control of
Transboundary Movements of Hazardous Wastes and their Disposal, and the Organization for the
Prohibition of Chemical Weapons (OPCW) chemical weapons Convention. The Minamata convention
entered into force on 16 August 2017 and an increasing number of countries ratified the Convention
since then.
0% 20% 40% 60% 80% 100%
UNECE Aarhus ConventionUNECE Geneva Convention
OPCW Chemical weapons convention 1992
FAO/UNEP Rotterdam Convention 1998
Basel Convention 1989Montreal Protocol 1985
Stockholm Convention 2001Minamata Convention 2017
IMO Anti-fouling Systems on ShipsIMO Oil Pollution
IMO Prevention of Pollution from ShipsIMO Hazardous and Noxious Substances
ILO Convention 13 (1921)ILO Convention 136 (1971)ILO Convention 162 (1986)ILO Convention 139 (1974)ILO Convention 148 (1977)ILO Convention 174 (1993)ILO Convention 170 (1990)
OECD Legal instruments
Protocol on Pollutant-Aarhus Conv (2003)
AFR
ASP
CEE
LAC
WEOG
World
PR3

SAICM/OEWG.3/INF/4
42
91. The ASP region showed the highest level of activity in the implementation of Basel Convention,
Stockholm Convention and Montreal Protocol at 67 per cent response rate and Minamata
Convention at 83 per cent response rate.
Figure 32 IOMC Indicator G Number of parties to the Basel, Rotterdam, Stockholm in 2010 and 2016 and number
of ratifications of Minamata Convention as of 201618
92. Indicator G of IOMC reports on the number of the parties to the Basel, Rotterdam, Stockholm and
Minamata conventions (Figure 32). Thus, a closer look at the number of ratifications provided by this
indicator of IOMC helps to provide a more comprehensive picture of the global status with these four
important chemical instruments.
93. The number of ratifications of the Minamata Conventions was 35 as of 2016 (34 in the period 2014-
2016), given that it did not enter into force until 16 August 2017 (101 Parties as of 7 January 2019).
It was notable that the majority of the government respondents to SAICM reporting tool (46
governments or 85 per cent) indicated that they have made significant changes to their country’s
status and/or implementation in regard to the Minamata Convention in the period 2014-2016.
94. The number of parties has reached 183 for Basel, 160 for Rotterdam, 180 for Stockholm as of 2016.
The data shows a steady growth in the number of parties since 2010 as the baseline of IOMC
indicators by 4, 5 and 10 per cent on average for the Stockholm, Basel, and Rotterdam, respectively.
Looking at the data for the period 2014-2016, 1, 4 and 6 new parties were added in this period to
the Stockholm, Basel and Rotterdam conventions, respectively.
95. Looking at the regional data, 100 per cent of the countries in the CEE region have ratified the Basel,
Rotterdam and Stockholm conventions. Moreover, the majority of the AFR States are parties to the
BRS Conventions; 98, 89 and 98 per cent of the member countries have ratified the Basel, Rotterdam
and Stockholm Conventions, respectively. No new ratifications were recorded by the LAC and WEOG
18 The Minamata Convention entered into force on 16 August 2017, thus there were no “parties” before that. While the
indicator is number of parties, we are currently showing number of ratifications.
0
10
20
30
40
50
60
2010 2016 2010 2016 2010 2016 2010 2016
Basel Rotterdam Stockholm Minamata
AFR
ASP
CEE
LAC
WEOG

SAICM/OEWG.3/INF/4
43
States in the period 2014-2016. Most of the growth in the number of parties was thanks to the AFR,
ASP regions.
Figure 33 IOMC Indicator F Per cent of Average Core Capacity score per WHO region core capacities for chemicals
under the International Health Regulations. **The data for Global is calculated from regional averages (WHO)
96. In 2010, WHO developed and shared with States Parties a core capacity monitoring framework, with
a questionnaire on the status of implementation of the International Health Regulations for States
Parties to complete19. This framework included a checklist and 20 indicators on the status of eight
core capacities, including those related to chemical events. The self-assessment tool constituted the
basis for reporting on the implementation of the International Health Regulations by WHO between
2010-2017. 20
97. Indicator F of IOMC reports on the International Health Regulation (IHR) Average Core Capacity Score
and is used to describe the level of achievement of a core capacity. The Average Core Capacity Score
or Attribute Score is the per cent of attributes, i.e. capacities in a technical area that have been
achieved. In the case of chemical events, this includes, for example, if experts were identified for
public health assessment and response to chemical incidents; national policies or plans were in place;
designated focal points were nominated; coordination mechanisms were established; surveillance
systems were in place; priority chemical events/syndromes were identified; inventory of major
hazard sites was created; a national chemical profile was developed; manuals and Standard
Operation Procedures (SOPs) were in place; information exchange was functioning; laboratory
capacity was available; and Poison Centre(s) were in place. The minimum Score is 0 per cent when
none of the elements and functions listed in the checklist have been achieved. The maximum Score
19 This questionnaire was filled out by the states on a voluntary basis. 20 Data on the WHO International Health Regulations (IHR) was removed from the SAICM online questionnaire under indicator
12 in this reporting period, due to certain inconsistencies in reporting in the previous round, and thus the data was provided directly by WHO.
11
37 37
62
32
48
38
28
61 60
77
50
78
60
07 7
-2 0
16
5
-5
15
35
55
75
95
AFR AMR EMR EUR SEAR WPR Global**
IHR Core Capacity Score in 2010 IHR Core Capacity Score in 2016
Score Changes in 2014-2016

SAICM/OEWG.3/INF/4
44
is 100 per cent once all elements and functions are in place. The Score is 50 per cent if half of the
elements and functions are in place.
98. IHR is a legally binding treaty and as of 2016 there were 196 parties. Since 2010, the baseline data
for IOMC indicators throughout this report, there has been considerable improvement in the
developments of core capacities for the chemicals in a global scale. The Average Core Capacity Score
increased between 15 to 30 per cent across all the WHO regions (Figure 33). Almost all the regions,
except for the Africa, reached a Score above 50 per cent in 2016 with an average global Score of 60
per cent. The largest growth since 2010 was in the Western Pacific region which obtained 78 per cent
of the total Core Capacity Score; up by 16 per cent in this reporting period. In the period 2014-2016,
the South East Asia and Europe regions were found to have made zero to negative progress toward
core capacity for the chemicals.
Figure 34 IOMC Indicator D Per cent of countries in each WHO region with controls over lead in decorative paint
(WHO and UNEP)
99. Indicator D of IOMC addresses the progress of countries with controls over lead in decorative paint
(Figure 34). The ILO Convention 13 (1921) which addresses use of white lead in painting, under
indicator 12 of SAICM is linked with indicator D of IOMC. According to indicator 12, in the period
2014-2016, 9 per cent of all the SAICM stakeholders made significant changes to their country’s
(organization’s) status in regard to this convention.
100. The IOMC data on lead paint was collected through a series of questionnaires filled by the States in
2014 as the baseline, as reported to the 2014 SAICM Open-Ended Working Group (OEWG), in 2015
(as reported to ICCM4) and 2016. As of 2016, 61 countries reported having control mechanisms over
lead in decorative paint, up by 5 per cent (of 194 WHO member States) from 2014. As it is notable
in figure 34, 60 per cent of countries did not provide any information (‘no data’) in regard to controls
over lead paint. Whereas, this number decreased steadily to 33 per cent of member States in 2016.
Nevertheless, a majority of the non-responding countries in 2014 (23 per cent) indicated to be among
countries with no control over lead paint in 2016.
0%
10%
20%
30%
40%
50%
60%
70%
80%
90%
Yes No Nodata
Yes No Nodata
Pe
r ce
nta
ge o
f co
un
trie
s in
eac
h W
HO
re
gio
n
AFR
AMR
EMR
EUR
SEAR
WPR
2014 2016

SAICM/OEWG.3/INF/4
45
101. The WHO regions showed a growth in controlling the lead paint in the period 2014-2016, except for
the Eastern Mediterranean region that remained unchanged, with only 2 out of 21 countries
controlling the lead paint. The largest growth was observed in South East Asia region with 18 per
cent increase in the number of countries with controls over lead paint. Noticeably, 72 per cent of the
countries in the Europe region reported the presence of controls over lead paint. The smallest level
of activity on this issue was in the Africa region with only 4 per cent of the countries controlling lead
paint.
102. IPEN in their Citizen’s report as well as in their progress highlights submitted to this progress report,
noted several activities in regard to lead paint elimination21 which provided a more comprehensive
perspective on global progress. In the ASP region, by 2015, 80% of the paint market in the Philippines
has committed to IPEN’s “Lead SafeTM Paint” 3rd Party Certification Program. In addition, lead paint
regulations are now in place or promised by governments in all 7 Asian countries that participated in
IPEN’s Asian Lead Paint Elimination Project (Sri Lanka (enacted), Philippines (enacted), Nepal
(enacted), Indonesia, Thailand, Bangladesh and India).22
103. In the AFR region, in 2014, IPEN launched a medium-sized project from the GEF23 supporting national
lead paint elimination activities in four countries. Partners in the project are Centre de Recherche et
d’Education pour le Developpement (CREPD), Cameroon; Jeunes Volontaires pour l’Environnement
(JVE), Ivory Coast; Pesticide Action Nexus Association (PAN-Ethiopia), Ethiopia; and Agenda for
Environment and Responsible Development (AGENDA), Tanzania. In addition, selected activities
were implemented in several other countries in the AFR region under the project. IPEN also reported
on new lead paint bans, in 2016, in India and Thailand, and a regional standard for the six countries
(Burundi, Kenya, Rwanda, South Sudan, Tanzania, and Uganda) of the East Africa Community (EAC).
Ethiopia and Cameroon had introduced draft legislation for new lead paint regulations; and Kenya
and Tanzania have begun developing regulations to implement and enforce the new EAC lead paint
standard. In addition, in 2016 IPEN secured a grant from UNEP Europe Regional Office to conduct
lead paint activities and a multi-stakeholder workshop in Moldova. As a result, this project on lead
paint is being included in the government’s effort to make a comprehensive national regulation on
chemicals.
104. Activities by IPEN in both the AFR and the ASP regional projects included studies of lead levels in
paint; outreach to paint manufacturers to disseminate information about the hazards of lead in
paint, especially to children’s health, and dialogue to promote reformulation of lead-containing
paint; outreach to policy-makers to encourage enactment of national regulation restricting the use
of lead in paint; and establishing and promoting the Lead Safe Paint Certification program.
105. In addition, IPEN reported that as a direct result of their work on elimination of lead paint, their
recent studies suggest that, with a few exceptions, paint companies with the largest national market
shares have shifted to products with less than 90 parts per million (ppm) lead content; the standard
in the U.S. and other industrialized countries. Moreover, paint companies with majority market share
21 Global Lead Paint Report (2016) and Eliminating Lead in Paint in Seven Asian Countries 22 The EU funded this 2012-2015 IPEN project through the SwithAsia Program, noting all outcomes are online via the EU Switch
Asia Program. 23 Global Environment Facility (GEF) to be executing agency for the African Lead Paint Elimination Project (2014-2017) with
UNEP as implementing agency

SAICM/OEWG.3/INF/4
46
(90%) in the Philippines have applied to be part of the world’s first third-party certification program
for lead content of paint. The program, Lead Safe Paint Certification, was pioneered by IPEN and its
NGO partner EcoWaste Coalition, and assures a lead content below 90 ppm in certified paint.
106. Overall, the indicator 12 of SAICM on significant changes to the international instruments specific to
this reporting period obtained considerably small level of activity across all the regions, except for
Minamata Convention. Thus, the small overall score (i.e. 0.21) obtained for the indicator 12 is not
representative of the number of countries who have already ratified the specified international
instruments prior to this reporting period.
2.2.4. Objective D Capacity Building and Technical Cooperation
Indicator 13 Financial and in-kind resources to assist capacity-building and technical cooperation
Table 1 Number of governments (and Organizations) providing bilateral financial and in-kind assistance to other
governments to improve their capacity for the sound management of chemicals
107. Indicator 13 shows the number of countries (and organizations) providing resources (financial and
in-kind) to assist capacity building and technical cooperation with other countries (Table 1). In PR3,
35 respondents identified as donor and 5 identified as both donor and recipient out of which 34 were
the governments. Two of IGOs indicated as both donor and recipient and one IGO did not specify
their status. All the NGOs identified as recipients. Both industry respondents reported as donors. This
was larger than the number of donor countries in PR2 (i.e. 30 donors), even though, the number of
respondents to PR3 (n=65) was much smaller than PR2. In PR3, 31 government respondents, or 84
per cent of non-DAC countries24, provided financial assistance. One LM country, one private sector
24 ‘non-DAC’ refers to the countries that are not on the DAC list of aid recipients (DAC List of ODA Recipients
No. of Donors= 40 LDC LM Non-DAC UM Grand Total
36
Govt 1 31 32
Industry 1 1
IGO 3 3
37
Govt 31 31
Industry 1 1
IGO 5 5
1
Govt 1 1
Industry
IGO
5
Govt 4 4
Industry 1 1
IGO
Financtial assistance
In-kind and/or Other Financial assistance
No Financial assistance
Blanks

SAICM/OEWG.3/INF/4
47
and three IGOs indicated provision of financial assistance. In addition, 37 respondents report in-kind
assistance out of which 31 were the governments, four IGOs and one from the private sector. Two
non-DAC governments and two IGOs also indicated ‘other’ types of assistance. One donor
government and one donor from the private sector did not provide any response (i.e. Blanks) to this
activity.
108. This indicator overall obtained one of the four smallest scores among all the SAICM indicators of
progress; 0.22 on average.
Indicator 14 Identification and prioritization of capacity-building needs
Figure 35 Per cent of respondents completing or updating plans
109. Indicator 14 of SAICM addresses the number of recipient countries (and organizations) that have
identified and prioritized their capacity-building needs for the sound management of chemicals
(Figures 35, 37). ‘National implementation Plan for Stockholm Convention’ has decreased to 24
respondents who selected this activity versus 42 respondents in PR2 (Figure 35). ‘The National
Chemical Profile’ and ‘SAICM Implementation Plan’ each were selected by 82 and 75 per cent of the
recipient respondents which showed a slight decrease as compared to PR2; 23 and 21 respondents
in PR3 versus 25 and 22 respondents, respectively in PR2.
Effective for reporting on 2014, 2015, 2016 and 2017 flows); i.e. countries not receiving official development assistance (ODA)
0% 20% 40% 60% 80% 100%
Other
National Environmental Health Action Plan(NEHAP)
National SAICM Implementation Plan
National Chemicals Profile
National Implementation Plan for StockholmConvention
% recipient stakeholders completing or updating plans
AFR
ASP
CEE
LAC
WEOG
World
PR3
0% 20% 40% 60% 80% 100%
Not applicable
Not known
NEHAP
Other plans
SAICM Implementation Plan
National Chemicals Profile
No plans in 2010-2013
Stockholm Convention NIP
Per centage of stakeholders completing or updating plans PR2
AFR
ASP
CEE
LAC
WEOG
World
PR2

SAICM/OEWG.3/INF/4
48
110. IPEN reported on the completion of the implementation of the China Chemical Safety25 in
collaboration with Arnika (Czech Republic) and Green Beagle (China), in 2014, in order to strengthen
the capacity of civil society organizations and communities impacted by pollution and increase
chemical safety in China. This project has played a role in training impacted communities on how to
participate in Environmental Impact Assessment (EIA). Through multi-stakeholder trainings,
impacted communities have been informed about what the company and relevant government
departments should do to avoid unregulated emissions and releases and how to address infractions
in the original commitments made in the approved EIA forms of the projects. The project carried out
a series of 11 case studies on pollution from metals, wastes, PM2.5 and chemicals such as dioxins
and polychlorinated biphenyl (PCBs).
111. Indicator A of IOMC indicators addresses the number of countries which have prepared a National
Profile (Figure 36). The National Profile Support Programme of UNITAR provides guidance, training
and technical support to the countries in order to assess the existing infrastructure for the sound
management of chemicals.26 The International Conference on Chemicals Management (ICCM)
Resolution I/4 has recognized the development of a National Profile as a key enabling activity to
support SAICM implementation.27 As of 2016, 116 countries have prepared a National Profile which
showed a slight growth (nine per cent) since 2010 as the baseline (Figure 36). 28
Figure 36 IOMC Indicator A Number of countries in each SAICM region with National Profiles (UNITAR)
112. According to UNITAR, a majority of CEE (74 per cent), LAC (73 per cent) and AFR (72 per cent)
countries have prepared a National Profile. Whereas, less than half (43 per cent) of ASP and WEOG
countries had a National Profile. Nevertheless, the number of National Profiles increased by 9 per
cent in the AFR region since 2010, the largest growth among regions.
113. A new activity in SAICM questionnaire sought to identify the priority needs based on the 11 basic
elements from the overall orientation and guidance document29 under indicator 14 (Figure 37). Up
to 75 per cent of all the recipient respondents reported their needs, with more than 50 per cent of
the respondents across almost all the regions, except for the majority of WEOG and CEE respondents
25 https://ipen.org/projects/china-chemical-safety-project-2012-–-2014 26 https://www.unitar.org/cwm/saicm/national-profile 27 https://www.unitar.org/cwm/saicm/national-profile/policy-recommendations 28 Ten other countries also updated their National Profiles between 2011 and 2016. 29 SAICM Document- Overall Orientation and Guidance for achieving the 2020 goal of sound management of chemicals
0 30 60 90 120 150
AFR
ASP
CEE
LAC
WEOG
Total
Number of countries in each region
2016
2010

SAICM/OEWG.3/INF/4
49
who were among the donor countries and did not respond to this activity. Fifty-seven per cent of
government respondents (14 countries) indicated that they have identified a need for institutional-
strengthening in regard to the poison centres.
114. Indicator C of IOMC tracks the number of countries with poison centres. This indicator is interlinked
with indicator 14 of SAICM on the number of countries that have identified the priority needs in
regard to dealing with chemicals accidents, including institutional-strengthening for poison centres
based on the 11 basic elements (Figure 38). The data were obtained from the questionnaires that
were carried out together with ad hoc updates from the WHO regional offices. A total of 91 countries
had poison centres in 2010 versus 90 countries by the end of 2016, noting that the poisons centres
can be opened as well as be closed down. The number of poison centres in 2016 accounts for over
46 per cent of WHO member States.
Figure 37 Per cent of respondents identified the priority needs based on the 11 basic elements
115. Even though the total number of poisons centres has not increased, the regional breakdown
provided more information on the progress in each WHO region30. As can be observed in figure 38,
there has been growth in the number of poisons centres in the Eastern Mediterranean region (by 14
per cent) and a very slight increase in the Africa region (by 2 per cent). Most of the growth in these
30 The number of countries in WHO regional breakdown: Africa (AFR) 47, Americas (AMR) 35, South East Asia (SEAR) 11, European region (EUR) 53, Eastern Mediterranean (EMR) 21 countries, Western Pacific (WPR) 27. More information on the WHO regional groupings can be found on: http://www.who.int/about/regions/en/
0% 20% 40% 60% 80% 100%
Not applicable
Strengthened capacity to deal with chemicals…
Legal frameworks
Enforcement/compliance mechanisms
Multilateral environmental agreements
The transparent sharing of relevant data/info…
Industry participation & defined responsibility
Chemicals risk assessment & risk reduction
Environmentally sound and safer alternatives
Strong institutional frameworks and…
Monitoring and assessing the impacts of chem
Inclusion of the sound management of…
% respondents identified priority needs
AFR
ASP
CEE
LAC
WEOG
World
PR3

SAICM/OEWG.3/INF/4
50
two regions took place in the period 2014-2016; one new poison centre in the African region and
two new centres in the Eastern Mediterranean region were opened.
116. The other WHO regions, including Europe, the Americas and South East Asia observed a small decline
in the number of poisons centres by 4, 6, 9 per cent, respectively, since 2010. This is to indicate that
two poison centres in the Americas, two centres in Europe, and one in South East Asia region have
been closed. The number of the poison centres in the West Pacific region remained unchanged (9
centres) since 2010. Overall, except for Africa (17 per cent) and the Western Pacific region (33 per
cent), more than 50 per cent of the countries in the other regions have poison centres up and
functioning.
Figure 38 IOMC Indicator C Per cent of countries with poison centres under the WHO regions (WHO)
117. Overall, the indicator 14 of SAICM also achieved below-average level of activity and has not improved
since PR1 which stresses the need for more effort in order to advance toward the full conduct in
2020. Prioritization of capacity-building needs was the subject of concern by several QSP trust fund
funded projects in this reporting period; a total of 6 in the AFR (2), the ASP (1), the CEE (2) and the
LAC (1) regions.
Indicator 15 Development assistance programmes that include sound chemicals management
118. Indicator 15 seeks to identify the countries (and organizations) with development assistance
programmes which include the sound management of chemicals (Figures 39, 40). The activity under
this indicator were modified by splitting it to two activities in PR3. The First activity asked the donor
respondents whether sound chemical management had been included as a priority in their national
development assistance funding programmes in 2014-2016 (Figure 39). Only two non-DAC
respondents answered affirmatively to this question and the majority of the respondents including
the private sector either provided no response or indicated ‘Unknown’ or ‘Not applicable’.
0% 20% 40% 60% 80% 100%
AFR
AMR
EMR
EUR
SEAR
WPR
Per centage of countries in each WHO region with poison centres
2014-2016
2016
2010

SAICM/OEWG.3/INF/4
51
Figure 39 Per cent of donor countries with chemicals management as a priority in national development
assistance funding programmes over the 2014 to 2016 period
119. The second activity asked the recipient respondents whether they have a National Development Plan
(NDP) and addressing their priority needs for the sound management of chemicals (Figure 40). Non-
DAC countries left this activity blank and only one country responded positively which had identified
themselves as both donor and recipient country. Another two none-DAC countries indicated that
they have a National Development Plan in place, however it did not include the chemicals. Fifty per
cent of the recipient respondents included chemicals in their NDPs. Similar to PR2 and PR1, higher
proportion of lower middle-income countries (LM), and upper middle-income countries (UM)
included chemicals in their NDPs. One out of three LDC countries included chemicals in their NDPs
(33 per cent), versus 27 per cent response rate in PR2 for LDC countries (n=11). Nonetheless, the
comparison for the LDC group between the two progress reports was not applicable because
significantly smaller number of LDC countries participated in this report.
Figure 40 Number of governments with a national development plan and addressing priority needs for the
sound management of chemicals; the figure includes only recipient respondents for PR3.
120. With below-average level of activity under this indicator worldwide, there is a large room for
advancement in this area. In particular, the overall level of activity has decreased by 17 per cent
since PR1 and 16 per cent since PR2.
0%
20%
40%
60%
80%
100%
LM Non-DAC
PR3
No
Not applicable
Unknown
Yes
1 2
21
2
1
3
1
9
0%
20%
40%
60%
80%
100%
LDC LM Non-DAC UM
Yes
Unknown
Plan in place but does notcover chemicalsNo plan
52
29
7
3 10
6
11
31 3
1
2
0%
20%
40%
60%
80%
100%
LDC LM Non-DAC OL UM
n/k
Yes
No
PR2

SAICM/OEWG.3/INF/4
52
Indicator 16 Other sources of funding for capacity-building
121. Indicator 16 addresses the numbers of governments (organizations) with capacity building activities
supported by other sources of funding (Figures 41, 42). The Global Environment Facility (GEF) was
selected by the majority of the respondents; by 86 per cent of the respondents (n=24) which
decreased as compared to PR2, in terms of number of respondents; 37 respondents in PR2.
According to GEF project database, at least 66 countries had one or more projects approved by the
organization in the period 2014-2016. The United Nations and the United Nations agencies as the
funding source were selected by 64 per cent of the respondents in PR3 (i.e. 18 respondents), down
from 37 respondents in PR2 (Figure 41). Thirty-nine per cent of the respondents benefited from
Multilateral Fund for Montreal Protocol. There countries reported to have had projects funded by
the World Bank.
Figure 41 Per cent of respondents accessing non-QSP funding
122. Only three recipient countries (or DAC countries) did not identify any sources of funding shown in
figure 42 which also included the selection of options of ‘not-known’, ‘none’ or no response at all.
Majority of the ASP countries (4 out of 6) reported no access to any of the non-QSP funding sources.
Nine and 18 per cent of the countries reported accessing at least one and two sources of funding in
PR3, respectively. Whereas, in PR2 20 and 21 per cent reported single and double sources,
respectively. The LAC region selected the largest number of funding sources out of all the identified
0% 20% 40% 60% 80% 100%
Regional Development Bank
Foundation or charitable body
None
Private sector or company
Other
The World Bank
Multi-lateral Environment Convention Trust Fund
Not known
Regional Cooperation Organization
Bilateral funding agreement with another…
Multilateral Fund for the Montreal Protocol
United Nations or United Nations Agency
Global Environment Facility (GEF)
% stakeholders with non-QSP funding
AFR
ASP
CEE
LAC
WEOG
World
PR3
0% 20% 40% 60% 80% 100%
Regional Development Bank
Multi-lateral Convention
Foundation or charity
NK
Regional Cooperation Organization
The World Bank
Bilateral funding agreement
Private sector
Not applicable
Other
The Multilateral Fund
Global Environment Facility (GEF)
UN or UN agency
Per centage of stakeholders with non-QSP funding PR2
AFR
ASP
CEE
LAC
WEOG
World
PR2

SAICM/OEWG.3/INF/4
53
non-QSP sources. Nine LAC countries had GEF funding, seven countries indicated United Nations
Agencies funding, and five countries benefited from Multilateral fund for Montreal Protocol. The CEE
region reported on six GEF funded projects and five United Nations Agencies funding.
123. Overall, very small activity was recorded for the indicator 16 of SAICM (score 0.11) with very little to
no positive growth over the years once the activity levels were compared with the levels in PR2 and
PR1.
Figure 42 Number of funding sources accessed by all the respondents (except WEOG)
Indicator 17 Number of countries (and organizations) with projects supported by the Strategic
Approach’s Quick Start Programme Trust Fund (QSP trust fund)
Figure 43 Distribution of QSP funding by region for the approved projects in rounds XIII and XIV
124. Indicator 17 of SAICM addresses the number of projects that were supported by QSP in the period
2014-2016. In rounds XIII-XIV, 22 projects were approved or conditionally approved31 worth US$
31 Thirteen projects in round XIII and 4 projects in round XIV received approval or conditional approval without funding. These projects would receive priority funding as the funds become available in the QSP trust fund, providing the conditions for approval have been met as appropriate.
14%
9%
18%
18%
14%
23%
4% None
One
Two
Three
Four
Five
Six
18%
20%
21%9%
12%
18%
2%
PR2
$0
$200,000
$400,000
$600,000
$800,000
$1,000,000
$1,200,000
$1,400,000
$1,600,000
$1,800,000
AFR ASP CEE LAC
US $million
Approved projects in rounds 13 and 14

SAICM/OEWG.3/INF/4
54
4.78m (Figures 43, 44). During this reporting period (2014-2016) 15 QSP funded projects from the
rounds XII-XIV were functioning.32 The total available and approved fund for these 15 projects was
worth US$ 2.76m. The funds were distributed among the regions much more equally than in PR2
(Figure 44A).
Figure 44 Distribution of QSP funding by region (A) and SAICM objectives (B)33 for the functional projects in the
period 2014-2016 from the rounds XIII-XIV, plus 6 projects in round XII.34
125. The majority of the projects (65 per cent) focused on the SAICM Strategic objectives A, B and C, on
the risk reduction, the knowledge and information and the governance (Figure 44B). The objective E
on illegal international traffic was not addressed in any of the projects similar to PR2. Many more
projects (i.e. seven out of 15) tackled objective D on capacity-building as compared to PR2 with only
two projects covering this issue. These three objectives A, B and C were similarly the major focus of
the approved projects by QSP in the previous reporting period (2011-2013), however the proportions
of projects under each Strategic objective was different. The objective C was covered in the majority
of the projects (i.e. 45 per cent) in PR2 as compared to 28 per cent in PR3.
32 Six approved projects from the round XII were funded in the round XIII (value of US$ 1.79m) upon the availability of the sufficient funds; as a result, the agreements were put in place in 2014 to 2016. 33 Graph B shows the number of projects under each category and the per centage in brackets (Some projects cover more than
one objective). 34 Analysis of the QSP projects provided by the secretariat (see table in Annex 1, derived from regional reports)
$0
$200,000
$400,000
$600,000
$800,000
$1,000,000
AFR ASP CEE LAC
US $million
Functional projects in the period 2014-2016 (Rounds 12-14th)
A
9 (25%)
10 (28%)
10 (28%)
7 (19%) A
BCDE
B

SAICM/OEWG.3/INF/4
55
Indicator 18 Regional cooperation on sound chemicals management
Figure 45 Per cent of respondents engaged in regional cooperation
126. Indicator 18 addresses the number of countries (and organizations) engaged in regional cooperation
on issues relating to the sound management of chemicals (Figure 45). The regional cooperation has
advanced in this period and about 70 per cent of the respondents selected at least one type of
cooperation under indicator 18. The most commonly reported regional cooperation was first on the
‘knowledge and information’ and second on ‘capacity-building and technical cooperation’. The
highest level of activity was reported by the WEOG region followed by the CEE region. The LAC and
ASP reported this activity with an average response rate of 65 and 58 per cent, respectively. ‘Regional
cooperation on knowledge and information’ was selected by 88 per cent of all the respondents; 57
respondents in PR3 versus 55 respondents in PR2. ‘Capacity-building and technical cooperation’
received 85 per cent response rate; or 55 respondents in this period versus 60 respondents in PR2.
Only one in three AFR respondents reported on regional cooperation in the areas of the ‘knowledge
and information’, ‘capacity-building’ and ‘governance’.
127. The cooperation on ‘risk reduction’ did not change much since PR2; 45 respondents in PR3 versus 49
respondents in PR2. ‘Cooperation on governance’ was selected by 77 per cent of the respondents or
0% 20% 40% 60% 80% 100%
Other Cooperation
Risk reduction
Illegal international traffic
Governance
Capacity-building and technical…
Knowledge and information
% respondents engaged in regional cooperation
AFR
ASP
CEE
LAC
WEOG
World
PR3
0% 20% 40% 60% 80% 100%
NK
No relevant regional cooperation
Not applicable
Other cooperation
Illegal international traffic
Governance
Risk reduction
Knoweldge & Information
Capacity-building & technical…
Per centage of stakeholders engaged in regional cooperation PR2
AFR
ASP
CEE
LAC
WEOG
World
PR2

SAICM/OEWG.3/INF/4
56
50 respondents which was a significant increase as compared to PR2 where 37 respondents selected
this activity. ‘Cooperation on illegal national trafficking’ also significantly improved by 47
respondents having selected this activity whereas 35 respondents did so in PR2. With 67 per cent of
the ASP respondents engaging in cooperation on illegal trafficking, made them the most active after
CEE and WEOG.
128. Overall, the regional cooperation was amongst the fastest advancing indicators over the years; with
a growth of between 10 between PR1 and PR2 and a sharp increase of 34 per cent in this reporting
period as compared to PR2. Except for the AFR region, all the rest of the regions had above-average
level of activity reported for this indicator.
2.2.5. Objective E Illegal International Traffic
Indicator 19 Illegal traffic in toxic, hazardous and severely restricted chemicals
Figure 46 Per cent of respondents controlling illegal trade in chemicals
129. Indicator 19 addresses the progress of stakeholders to prevent illegal traffic in toxic, hazardous and
severely restricted chemicals individually (Figures 46, 47). On average, 79 per cent of the respondents
0% 20% 40% 60% 80% 100%
Other
Public awareness
Cooperation with neighbouring…
Monitoring of traffic
Training of border control agents
Implementation of national legislation
Communication on movements
% stakeholders controlling illegal trande
AFR
ASP
CEE
LAC
WEOG
World
PR3
0% 20% 40% 60% 80% 100%
NK
None applicable
Other
Cooperation with neighbouring…
Public awareness
Monitoring of traffic
Training of border control agents
Communication on movements
Implementation of national…
Per centage of stakeholders controlling illegal trade in chemicals PR2
AFR
ASP
CEE
LAC
WEOG
World
PR2

SAICM/OEWG.3/INF/4
57
(i.e. nearly 51 respondents) selected one of the available activities to control illegal trafficking which
used to be 48 respondents in PR2 (i.e. 47 per cent response rate). The ‘communication on the
movement of hazardous chemicals’ and the ‘implementation of national legislation preventing illegal
traffic of hazardous chemicals’ were selected by 86 per cent of the respondents, versus 54 and 61
per cent, respectively in PR2. The level of activity in ‘public information and awareness on levels and
cases of illegal trade and remedial actions undertaken’ was selected by 44 respondents or 68 per
cent response rate versus 42 respondents in PR2. This activity was the least commonly selected
mechanism to control illegal trafficking.
Figure 47 Per cent of each region controlling traffic in hazardous chemicals
0% 20% 40% 60% 80% 100%
Public awareness
Cooperation with neighbouringcountries
Monitoring of traffic
Training of border control agents
Implementation of nationallegislation
Communication on movements
% stakeholders in each region controlling illegal trade
WEOG
LAC
CEE
ASP
AFR
PR3
0% 20% 40% 60% 80% 100%
Cooperation with neighbouringcountries
Public awareness
Monitoring of traffic
Training of border control agents
Communication on movements
Implementation of nationallegislation
WEOG
LAC
CEE
ASP
AFR
PR2

SAICM/OEWG.3/INF/4
58
130. The ASP region reported the largest response rate under all the mechanisms to control illegal
trafficking, on average 83 per cent of respondents selected all the activities as can be observed in
figure 47. The high response rate of the ASP region seems to be in agreement with the high level of
activity of this region on regional cooperation in illegal trafficking under Indicator 18. The response
rate by the WEOG respondents increased slightly (i.e. 20 respondents in PR3 versus 18 respondents
in PR) on average under all the specified areas of controlling traffic which on average was smaller
than the growth reported by the rest of the regions. The ASP and CEE region demonstrated a large
activity in the ‘public awareness’ in PR3 by 83 per cent (i.e. 5 respondents) and 78 per cent response
rate (i.e. 14 respondents). This was slightly higher for the CEE region as compared to PR2 with 11
respondents having selected the ‘public awareness’. Eight of ASP respondents had selected this
activity in PR2 which was slightly larger than the number of the respondents in this reporting period.
The CEE respondents in PR3 gave the highest attention to the ‘monitoring of international traffic in
hazardous chemicals’ (i.e. 17 respondents in PR3 versus 11 respondents in PR2). All the ASP
respondents reported on the ‘monitoring of traffic’ (i.e. 6 respondents), even though 9 respondents
from this region in PR2 had selected the same activity. The LAC region has increasingly reported
higher activity for all the mechanisms, except for ‘public information and awareness’ (i.e. only one
respondents). All the LAC respondents (100 per cent) selected the ‘communication on transboundary
movement’; corresponds to 9 respondents in this period versus 7 respondents in PR2. The
‘implementation of national legislation’ and ‘training of border control agents’ were selected
commonly by 78 per cent of the LAC respondents; this corresponds to 7 respondents in this period
versus 5 and 8 respondents respectively choosing national legislation and training of agents in PR2.
Two out of three AFR respondents reported on all the activities except for monitoring of traffic.
131. With 39 per cent growth since the PR1, this indicator has benefited from a far above-average level
of activity reported by the respondents and more or less an even progress across the regions.
Accordingly, the ASP region has reportedly been the most successful in tackling the international
traffic of chemicals.

SAICM/OEWG.3/INF/4
59
Indicator 20 Illegal international traffic of hazardous waste
Figure 48 Per cent of respondents controlling illegal trade in hazardous wastes
132. Indicator 20 addresses the number of countries (organizations) with mechanisms to prevent illegal
traffic in hazardous waste (Figure 48). Progress in preventing international traffic in waste was
slightly behind the indicator 19 on controlling the traffic of hazardous chemicals. Notably, the
‘communication on transboundary movement’ was considerably selected by a smaller number of
respondents (i.e. 42 respondents) as compared to PR2 (65 respondents). Moreover, the activity on
‘training the border control agents’ decreased significantly from 53 respondents in PR2 to 27
respondents in PR3. Nonetheless, the majority of respondents reported on the ‘implementation of
national legislation’ and ‘monitoring of trafficking of hazardous waste’ by 85 per cent (i.e. 55
respondents) and 80 per cent (i.e. 50 respondents), respectively, whereas 63 and 54 of respondents
in PR2 had selected these two activities, respectively.
133. The greatest progress since PR2 was in cooperation with neighboring countries (28 per cent growth).
Much of the increase was due to the CEE and WEOG respondents with 89 and 79 per cent of these
regions, respectively, reported on this activity.
0% 20% 40% 60% 80% 100%
Other activities
Communication on movements
Training of border control agents
Public awareness
Cooperation with neighbouring…
Monitoring of traffic
Implementation of national…
% stakeholders controlling illegal trade in hazardous waste
AFR
ASP
CEE
LAC
WEOG
World
PR3
0% 20% 40% 60% 80% 100%
NK
None applicable
Other
Cooperation with neighbouring…
Public awareness
National legislation - Article 9
Training of border control agents
Monitoring of traffic
Implementation of national…
Communication on movements
Per centage of stakeholders controlling illgal trade in haz wastes PR2
AFR
ASP
CEE
LAC
WEOG
World
PR2

SAICM/OEWG.3/INF/4
60
134. Similar to indicator 19, indicator 20 also observed a constant and significant growth of 27 per cent
since PR1 with the ASP region again reportedly being the most successful among the regions
combatting the illegal traffic of hazardous waste; similar to indicator 19.
2.3. Global Overview and Comparison with Previous Progress Reports
135. The spider-grams in figure 49 demonstrate the total score of the regions by SAICM objective. The
overall level of activity reported by all respondents across all indicators was 0.59 for PR3 which was
larger than PR2 (0.47). The ‘World’35 category of stakeholders in figure 49 has obtained a larger
average score under all objectives as compared to PR2.
Figure 49 Progress against objectives by region for PR3 and PR2
136. There has been some progress under almost all objectives except for objective C. The total score for
objective C ranged between 0.31-0.47 whereas in PR2 it was 0.49-0.59. The largest decrease in score
for objective C occurred in the AFR and LAC regions. Similarly, other regions obtained lower scores
for objective C as compared to PR2 and PR1 (Figure 50). By a closer look at the indicators under
objective C, it was observed that the overall level of activity reported for indicator 11 has decreased
by 6 per cent and for indicator 12 has sharply decreased by nearly 40 per cent, as compared to PR2.
One reason is likely due to the changes made to the wording of the activities under these two
indicators in the online questionnaire in PR3. Indicator 12 in PR3 requested input on the significant
changes to the implementation of the chemical instruments. Whereas, this activity in PR2 asked for
the presence of a mechanism to implement the instruments. The majority of the respondents left
this activity blank which consequently reduced the overall score. The changes made to the activities
under indicator 11 requesting input on the type of stakeholders in the non-governmental and
35 ‘World’ category of stakeholders refers to the global IOMC institutions (OECD, WHO, UNEP, UNITAR, UNDP) which submitted
a report to PR3
0.0
0.2
0.4
0.6
0.8
1.0Obj A
Obj B
Obj CObj D
Obj E
AFR ASP CEE
LAC WEOG World
PR3
0.00
0.20
0.40
0.60
0.80
1.00ObjA
Obj B
Obj CObj D
Obj E
PR2
AFR ASP CEE
LAC WEOG World

SAICM/OEWG.3/INF/4
61
government (only) committee was left blank by multiple respondents resulting in lower level of
activity under this indicator as compared to the previous progress report. Therefore, the decrease in
score for this objective may not be comparable to the score from previous reports due to the changes
to the questions.
137. The ASP and AFR regions showed a notable increase in scores under majority of the objectives
(except for objective C) as compared to PR2. Even though the number of AFR respondents was very
limited (n=3) but the respondents reported high activities since PR2. The largest progress took place
for objective E for both AFR and ASP regions. In the AFR region, the difference in scores between PR3
and PR1 was not as large as the difference between PR3 and PR2 as can be seen in figure 50, for all
the objectives, except for objective C and D. The limited number of respondents in AFR region made
comparison among the reports complicated and not quite representative of the status of the region.
Thus, drawing a concrete conclusion was not possible.
Figure 50 Increase or decrease in scores between PR3 and PR2 (top) and between PR3 and PR1 (bottom) by SAICM
regions
138. Reviewing the data in relation to different development categories (Development Assistance
Committee (DAC) status)36 showed that there has been a considerable improvement in the score of
LDC and UM groups under majority of the objectives. Whereas LM and non-DAC groups have seen a
36 The DAC List of ODA Recipients shows all countries and territories eligible to receive official development assistance (ODA). The list effective as of 1 January 2015 for reporting on 2014-2016 flow is used in this report. The list consist of lower-middle income countries (LM), upper-middle income countries (UM), the Least Developed Countries (LDCs) and other low-income countries (OM) based on gross national income (GNI) per capita as published by the World Bank, with the exception of G8 members, EU members, and countries with a firm date for entry into the EU.
-0.20
-0.10
0.00
0.10
0.20
0.30
0.40
0.50
0.60
AFR ASP CEE LAC WEOG World
ObjA
Obj B
Obj C
Obj D
Obj E
PR3 vs PR2
-0.20
-0.10
0.00
0.10
0.20
0.30
0.40
0.50
AFR ASP CEE LAC WEOG World
ObjA
Obj B
Obj C
Obj D
Obj E
PR3 vs PR1

SAICM/OEWG.3/INF/4
62
decline under the objectives C and D since PR2 (Figure 51). Unfortunately, no country from OL group
submitted a report to PR3. Only three of the LM countries (out of 36 total) made submissions to PR3,
out of which two also submitted a report to PR2. The number of submissions was too small, eight
per cent, to be able to reliably compare it with the previous reports. The same was true about the
LDC group from which three countries submitted a report to PR3. The LM and LDC group of countries
account for more than 43 per cent of all the UN member States and a larger participation by these
countries is essential to measure the global progress.
Figure 51 Difference in scores between PR3 and PR2 (above) and between PR2 vs PR1 (below) by DAC category -
government only
139. By examining the average per cent of possible options selected by all respondents for each indicator in
figure 52, it can be seen that the largest increase, by nearly 36 per cent, in level of activity has been
for indicator 9 on the number of websites on chemicals, as compared to PR2. Indicator 18 on regional
cooperation on issues relating to the sound management of chemicals came next by a 34 per cent
increase, indicator 19 on mechanisms to prevent illegal traffic of chemicals increased by 32 per cent,
and 7 on capacity building needs by a 28 per cent growth, as compared to PR2. The largest reduction
in the level of activity was seen in the indicators 12, 13 and 15 which were likely due to rephrasing
the activities in the questionnaire as compared to PR2, thus, driving a conclusion for these three
indicators was difficult.
-0.2
0
0.2
0.4
0.6
LDC LM Non-DAC UM
ObjA
Obj B
Obj C
Obj D
Obj E
PR3 vs PR2
-0.8
-0.6
-0.4
-0.2
0.0
0.2
0.4
0.6
LDC LM Non-DAC OL UM
ObjA
Obj B
Obj C
Obj D
Obj E
PR2 vs PR1

SAICM/OEWG.3/INF/4
63
Figure 52 Average per cent of possible options selected by all respondents, by indicator (see Annex 1 for index of
full names of indicators)
140. The first nine indicators with highest response rate in PR3 are shown in Table 2. The activities under
indicators 1, 2 and 11 were similarly stood on the list of the highest most frequently responded
questions in PR2. The list of most commonly selected activities underlined the focus of the
stakeholders on objective A. The most commonly selected activities in PR2 were under objective A
and C.
0 0.2 0.4 0.6 0.8 1
12 - Conventions
15 - NDP
13 - Resources
16 - Other funds
11 - Stakeholder
14 - Needs
1- Categories
4- Tools
20 - Ill Waste
2- Haz waste
10 - Commitment
5 - Monitoring
3 - Priorities
6 - Standards
8 - Research
7 - Vulnerable
19 - Ill Chemical
18 - Reg Coop
9 - Websites
PR1
PR2
PR3

SAICM/OEWG.3/INF/4
64
Table 2 The indicators (Top nine) reported most commonly by the majority of the respondents in PR3
Indicator% respondents
selecting PR3
100.00%
100.00%
93.94%
93.94%
91.30%
90.91%
95.65%
89.13%
89.13%
1 89.13%
89.13%
86.96%
86.96%
84.78%
89.13%
86.96%
86.96%
86.96%
7
1
1
Policies
Programmes
Persistent organic pollutants
Mercury
Pesticides
11
11
10
11
2Prevention/reduction in generation of hazardous waste
Collection and interim storage
Disposal
Workers
The general public
Legislation/regulation
B1.1.1 Programme to encourage compliance with mechanisms.
C2.1. Communicate chemical safety issues to:
B1.1. Mechanisms to address key categories of chemicals:
B1.2 Prioritize groups of chemicals for risk management:
Environment
Health
Environment
Industry
Attendance at SAICM related meetings
Government
Question and Activity Description
D2.1.1A The ministries are represented on your government only committee:
D2.1.2 (b) The interests represented on your multi-stakeholder committee:
D1.1 Commitment to SAICM implementation over the 2014 to 2016 period:
D2.1.2 (a) The types of stakeholders included on your multi-stakeholder
committee:
B2.1. Address the waste management cycle:

SAICM/OEWG.3/INF/4
65
2.4. Progress on GEF Projects: Number of Countries with Projects Supported by GEF
Figure 53 Distribution of GEF funding by region (A) and number of GEF projects by SAICM objectives37 (B); for the
approved projects in the period 2014-201638
141. GEF has approved a total of 31 projects in more than 66 countries across all regions supporting the
sound management of chemicals and wastes with a total value of US$ 163m in the period 2014-
2016.39 An analysis of the GEF project database provided the data on the number and value of
projects in each region.40 Figure 53 shows the distribution of GEF funding by SAICM regions and the
number of projects by SAICM Strategic Objectives. The allocated funds and number of projects were
evenly distributed except for the CEE region with a relatively smaller number of projects; two
projects worth US$ 11.9m. Moreover, two more projects in the CEE region were jointly implemented
in collaboration with the States in the LAC and ASP regions. It is also notable that the majority of
projects (i.e. 31) addressed the objective A out of five SAICM Strategic Objectives on the risk
reduction of chemicals and wastes. Objectives B and D were addressed in nearly half of the projects
(i.e. 14 and 11, respectively).
142. A further analysis of the GEF projects enabled linking the projects to the SAICM the 20 indicators of
progress. This data is summarized in Table 3 in a form of a map of GEF activity under the SAICM
indicators of progress.
37 The sum is larger than number of approved projects since some projects address more than one SAICM objective. 38 The GEF projects with Approval Fiscal Year falls in the period 2014-2016. 39 Twenty-four of the countries out of 66 had more than one GEF project; in addition, one project in global scale and one
project for the Africa were approved in this reporting period. 40 The data extracted from the GEF project database: http://www.thegef.org/projects?search_api_views_fulltext=ChemicalPer
centage of20andPer centage of20waste
$44,271,880
$37,784,800
$18,000,000$11,900,000
$2,000,000
$48,110,370
$850,000$0
$10,000,000
$20,000,000
$30,000,000
$40,000,000
$50,000,000
$60,000,000
AFR ASP ASP,CEE
CEE CEE,LAC,ASP
LAC World
A
31
14
6
11
A B C D E
B

SAICM/OEWG.3/INF/4
66
Table 3 Number of GEF projects in the period 2014-2016 (Approval Fiscal Year) in each region addressing the SAICM indicators
Indicato
r
1-
CATEGORIES
2-
HAZWASTE
3-
PRIORITIES
4-
TOOLS
5-
MONITORING
6-
STANDARDS
7-
VULNERABLE
8-
RESEARCH
9-
WEBSITES
11-
STAKEHOLDERS
12-
CONVENTIONS
14-
NEEDS
15-
NDPs
18-REG
COOP
Total
projects
AFR 8 6 2 3 1 1 1 2 1 2 8
ASP 8 4 1 3 1 1 2 10
CEE 3 2 1 1 1 2 1 2 1 4
LAC 9 9 1 5 6 1 1 2 2 1 11
World 1 1
Total 29 21 1 2 11 1 12 2 2 2 5 6 2 3 31

SAICM/OEWG.3/INF/4
67
3. ANALYSIS OF 20 INDICATORS
143. The SAICM 20 indicators of progress were agreed in 2009 at ICCM2 as a means to monitor the
performance of countries in making progress to each of the five Overarching Policy Strategy
objectives41. Indicators of SAICM have been helpful since then to produce a baseline report (2006-
2008) and three progress reports including this report; PR1 for 2009-2010, PR2 for 2011-2013 and
PR3 for 2014-2016. Addressing all aspects of sound management of chemicals and waste, indicators
enabled the secretariat to assess the global and regional progress over time and provided the
stakeholders with a framework to set priorities, highlight areas of success, and identify gaps and
room for improvements concerning various stages of chemical management.
144. The indicators have proved to be user-friendly, simple and straightforward as equally noted in draft
report of the independent evaluation of the Strategic Approach from 2006-201542. The data collected
on these indicators were commonly sourced from the SAICM online questionnaire tool which
enabled a comparative analysis across three reporting periods. According to the draft report of
independent evaluation, 59 per cent of respondents considered that indicators of progress had been
very effective or had had some effect in assessing progress towards the sound management of
chemicals and waste.
145. The experience in using the indicators has marked the strengths of the regions under certain
indicators. It has also shown that the regions have implemented the indicators with varying pace
according to their set of priorities. Furthermore, certain indicators and their respective activities in
the questionnaire are applicable to the government stakeholders and less to the non-government
stakeholders. Whereas, some other indicators better reflect the success of non-government
stakeholders; for instance, NGOs are particularly effective at reaching more vulnerable groups under
indicator 7. In addition, according to the draft report of independent evaluation of SAICM, there were
challenges in integrating the contributions of non-government stakeholders due to stakeholders’
own surveys and reports that were not fully reflected in the on-line submissions. These challenges
raised the question as to whether the on-line survey should be restricted to government national
focal points with non-government stakeholders’ information presented as complementary
information. Stakeholders may wish to explore ways to amend the activities so that they can better
measure the activities and projects undertook by the private sector and NGOs so that the progress
report could better reflect their contributions.
146. Certain concerns remain related to the effectiveness of the indicators as was also discussed in the
previous progress report (i.e. PR2). The activity-based indicators are subjective by nature therefore
they are prone to interpretation and even misunderstanding by the respondents which may result in
under- or over-reporting of the progress under certain indicators. The online questionnaire in the
form of a questionnaire is long and time-consuming to complete, even though it is comprehensive in
collecting the stakeholder data on the indicators, which has likely contributed to the fall of
41 SAICM/ICCM.3/INF/5 paragraph 15 42 SAICM/IP.2/4

SAICM/OEWG.3/INF/4
68
submission rates over the years. Several stakeholders started but did not finish the questionnaire.
Another challenge includes, inconsistent reporting across all countries over the reporting periods.
147. Moreover, a positive correlation was observed between the area of focus of projects (i.e. Strategic
Objectives covered) financed by the GEF and QSP trust fund and the positive growth under certain
indicators. This result urges the importance of sufficient funding and resources in achieving the
milestones under each indicator.
148. The achievement of 2020 goal is assumed to be correlated with having all the stakeholders
conducting all the activities. However, the current data on the activity-based indicators which is
collected through online questionnaire tool over the past several years indicate that a bit more than
half of the activities are conducted. Thus, meeting the full conduct of indicators by 2020 based on
the aforementioned assumption by most of the countries proves to be a challenge in the remaining
time until 2020.
149. The second progress report in Strategic Approach implementation noted the experience with
indicators of progress that the activity-based indicators are not able to quantify the effect of
chemicals on the human and the environment and encourages to supplement the data with
objectively verifiable result-based indicators.
“The questionnaire’s multiple-choice responses seem to underline the need to
supplement the activity-based indicators with objectively verifiable results-based
indicators which can quantify reductions in health and environmental impacts of chemical
use, in line with the Johannesburg targets, and the steps taken towards this. The process
of collecting basic data and evidence (e.g. on poisoning or chemicals management
expenditures) is an essential step toward mainstreaming of national chemical
management. Maximising links with existing data sources could minimize duplication and
reporting burdens, and a step-wise approach to introducing such indicators could be
developed based on prioritization of activities.”43
150. In analysis of SAICM indicators and the room for development of objectively verifiable result-based
indicators, it is useful to reflect upon the lessons learned in other areas. For example, the Biodiversity
Indicators Partnership (BIP) during the development and use of indicators to measure progress in
achieving all the Aichi Biodiversity Targets of the Strategic Plan for Biodiversity 2011-2020.44 BIP
recommends setting specific, measurable, ambitious, realistic, time-bound targets which provides a
firm foundation for indicator use and development. The Biodiversity Indicator Development
Framework promotes an iterative process of defining targets and identifying indicators; with the
identification of potential indicators helping to refine the measurability of targets:
“While it is important to build on what already exists, the lack of a known existing
indicator should not limit target setting. Indicators should be used together to support
one another, and to produce integrated storylines. The collection and collation of data,
maintenance of databases and production of indicators is a resource-intensive process,
requiring continual funding. Experience has shown that global targets are often translated
43 SAICM/OEWG.2/INF/4 44 CBD/COP/14/INF/40

SAICM/OEWG.3/INF/4
69
into very different targets at the national level due to differing contexts and priorities,
requiring different indicators. Thus, the uptake of global indicators at the national scale is
limited.”
151. The indicators of progress at their current status do not fully capture the new or emerging policy
issues. According to the draft report of independent evaluation of SAICM, the stakeholders expressed
concerns that extending the application of the indicators to the emerging policy issues could cause
further challenges.
152. Since the indicators were adopted, the overall orientation and guidance has been developed and
endorsed at the fourth meeting of the International Conference in Chemical Management (ICCM4)
in 2015 which aims to provide direction and identify approaches for all Strategic Approach
stakeholders towards facilitating the achievement of the 2020 goal of sound chemicals management,
including introducing eleven basic elements required at the national and regional level to achieve
sound chemicals management to support the implementation of the Overarching Policy Strategy45.
The detailed discussion in the summary report on progress in the implementation of the Strategic
Approach for the period 2011-201346 made a comparative study between these eleven basic
elements and 20 indicators and highlighted that most of the indicators are closely related to the basic
elements identified in the overall orientation and guidance document towards the achievement of
the 2020 goal of sound chemicals management.
153. Furthermore, chemicals and waste management are embedded within many of the Sustainable
Development Goals (SDGs). A proposal on objectives and related milestones, based on the eleven
basic elements and the 2030 Agenda for Sustainable Development, was prepared for the second
meeting of the intersessional process considering the Strategic Approach and the sound
management of chemicals and waste47. The proposed objectives were grouped around four key
areas: (a) legal and institutional frameworks, implementation and enforcement; (b) stakeholder
participation and sectoral engagement; (c) knowledge and information, risk assessment/reduction
and monitoring; (d) political leadership, outreach, education and promotion. For each of the
proposed objectives, a limited number of more specific targets or milestones were developed and
the links to SDGs were explored. The proposal indicated that the objectives and related milestones
are intended to provide a practical program of work that is measurable, that makes and tracks
progress toward achieving the eventual vision for beyond 2020.
154. The SDGs, as a more recent development, are helping to understand the global situation in regard to
sound management of chemicals and waste. The SDGs also provide a broader framework for the
industries, businesses and consumers to contribute to sound management of chemicals and
reduction of waste as chemicals and waste are embedded in the SDG 12 on sustainable consumption
and production. The SDGs also allow for broader considerations of human health, environment,
agriculture, labour and gender.
155. The weaknesses of the current indicators of progress were clearly identified by one EU/JUSSCANNZ
national focal point which is highlighted in the draft report of independent evaluation of SAICM:
45 Overall orientation and guidance document for achieving the 2020 goal of sound management of chemicals 46 SAICM/ICCM.4/3 47 SAICM/IP.2/8

SAICM/OEWG.3/INF/4
70
“The challenge with the usefulness of the indicators is two-fold: 1) there has historically
been lack of reporting and therefore it is a significant challenge in doing any trend analysis
and 2) simply measuring the number of countries (for example engaged in regional
activities in chemicals or that have made a commitment to SAICM) does not demonstrate
the effectiveness of the actions undertaken – SAICM national focal point.”
156. In summary, the indicators of progress are comprehensive and thus are necessary and useful. Yet, at
their current state they are not the most effective means of assessing the progress toward the sound
management of chemicals and waste beyond 2020.
157. As concluded in the draft report of independent evaluation, SAICM stakeholders shared the view
that there was a need to continue to monitor these indicators until 2020, stating that “Nevertheless,
retaining the existing 20 indicators of progress to 2020 is appropriate given the baseline that has
been developed and useful insights are gained when comparing results over different time periods.
Some regions have produced detailed reports on progress made towards the 20 indicators.”
4. DISCUSSION AND CONCLUSIONS
158. The global reporting rate of 28 per cent shows a significant decline as compared to the previous
reports (PR2, PR1). Between 6 to 70 per cent decrease in reporting rate across regions as compared
to PR2 marks the need for more consistent participation by the stakeholders. Drawing a reliable
global picture of the progress is only possible when adequate data is available and / or collected
across all the regions and the countries consistently report on the changes and/or improvements in
every reporting cycle. Nevertheless, there is consistent progress under certain indicators
corroborating the Governments engagement in developing programmes and mechanisms for the
sound management of chemicals.
159. There is a significant variation in response rate among regions in this reporting period. Six per cent
of submitted reports were from the AFR region (i.e. three respondents) while 28 per cent of all the
member States are in this region. The WEOG and CEE regions represent 16 and 12 per cent of all the
member States, respectively, whereas, 37 and 31 per cent of the submitted reports to PR3 were from
these two regions, respectively. The absence of sufficient data for the AFR region makes it impossible
to measure the progress of the region. As a result, the overall score calculated for the objectives will
be influenced by highly represented countries in this report (i.e. WEOG, CEE) rather than providing a
solid status of the global advancement in management of chemicals and waste.
160. In comparing the data from the second and first reporting periods, the overall gap between countries
in different development categories (i.e. DAC status) seemed to be widening rather than narrowing,
with the increases in levels of activity reported by developed and upper middle-income countries
contrasting with reductions or no change in the least developed countries. Nevertheless, this trend
in data cannot be concluded consistently in this reporting period. This could be attributed to the
below average level of activity under objectives C, and D by non-DAC countries which has resulted in
lower overall scores by these countries. In addition, the number of submissions by the least
developed countries and lower middle-income was very limited and also the least developed
countries reported a high level of activity under nearly all the objectives which overall makes it

SAICM/OEWG.3/INF/4
71
difficult to compare with previous reports and draw a conclusion on the existing gaps in different
development categories.
161. This report for the first time included the data by the IOMC on their eight indicators of progress in
the implementation of Strategic Approach and the analysis of interlinkages with the 20 indicators of
SAICM. Having IOMC data included in the report showed to be of value to (a) complement or cross-
reference the data collected through the SAICM questionnaire; (b) give a better picture of the global
progress toward the sound management of chemicals under some of the SAICM key indicators of
progress. The provision of IOMC indicators in this report helps to reflect and explore the possibility
to extend the data that could be collected through IOMC. Notably, IOMC is in the process of
developing a new indicator on the number of countries that have legislation in place to manage
industrial and consumer chemicals (SAICM/OEWG.3/INF/18 - Proposal by the Organisation for
Economic Co-operation and Development (OECD) for a new Inter-Organization Programme for the
Sound Management of Chemicals (IOMC) indicator for measuring progress with the sound
management of chemicals and waste), i.e. chemicals which are not covered by specific legislations
such a pesticides or pharmaceuticals48. This indicator would be of significance, given that the SAICM
indicators do not specifically address industrial and consumer chemicals. In addition, the ILO
Conventions linked to the chemical management that are currently covered under indicator 12 of
SAICM can be potentially developed as additional IOMC indicators in future.
162. The highest level of activity recorded among IOMC indicators was under the indicator H for Basel and
Stockholm Conventions each with 180 ratifications. Furthermore, indicator E, on the pesticide
legislation based on the FAO/WHO International Code of Conduct reported a high level of activity
with 174-member States (89 per cent) having implemented the legislation as of 2017.
163. Furthermore, an analysis of the projects on chemicals and waste approved by GEF in the period 2014-
2016 was included for the first time in this reporting period. The GEF activity map provides a good
visualization of the current projects and their area of focus by linking the GEF projects to the relevant
SAICM indicators of progress.
4.1. Regional Progress
164. The greatest progress since PR1 was recorded for the objective B on knowledge and information and
on the objective E, on illegal international traffic across all the regions. The advancements under
these two objectives become clearer once compared over time. Comparing the data with those of
PR1, the AFR region had the smallest (12 per cent) and ASP had the largest growth (42 per cent) in
controlling illegal traffic. The CEE and LAC showed a consistent growth over years; 12 and 21 per cent
growth since PR2, respectively. The progress of these two regions was even larger when compared
with PR1; 26 and 31 per cent increase for CEE and LAC regions, respectively. Notably, the projects
approved by two funding mechanisms of GEF and QSP majorly involved the objectives A and B
whereas, no approved project by either of the agencies addressed the objective E on illegal
48 “Industrial” chemicals are defined by default as all chemicals that are not managed through legislations dedicated to specific
uses, such as pharmaceuticals, pesticides, biocides etc. It also covers consumer uses (such as the use of paints) that are not managed by specialized legislations. To avoid the impression that industrial chemicals are chemicals that are only used in industrial settings, they are called “industrial and consumer chemicals”.

SAICM/OEWG.3/INF/4
72
international traffic. As for the objective B, the CEE region also reported the largest growth since the
first progress report (PR1) by 43 per cent. The LAC and WEOG regions stood next equally by reporting
a 31 per cent increase in the level of activities since PR1. The AFR region demonstrated the smallest
growth of 9 per cent since PR1 under objective B.
165. Three countries from the AFR region submitted a report to PR3 and they demonstrated progress
under all objectives except for Objective C, on governance as compared to PR2. The AFR region
showed the largest advancement under objective E (36 per cent increase) followed by Objective B
(11 per cent increase), comparing the data from the PR3 with that of PR2. The AFR region has
reported below-average level of activity under majority of the indicators with a smaller growth as
compared to the other four regions over the years. However, it is very important to note that the
number of AFR respondents has sharply dropped since the two previous reports. The slower than
average progress could have been majorly affected by the small pool of data rather than a true
indication of the progress of the region.
166. The ASP region has shown the highest activity under the objective A with the score of 0.75 after the
objective E (score 0.85). This objective is an obvious strength of the ASP region obtaining one of the
largest scores among all the regions and objectives since PR1. The ASP region showed the least level
of activity under objective D, on capacity-building and technical cooperation, as compared to other
four objectives in this reporting period. Very few respondents in this region selected the National
Development plans (indicator 15) and the other sources of funding (rather than QSP) in indicator 16
which both contributed to a lower average score for this objective. This region similar to other
regions showed a decline in the level of activities under objective C as compared to the previous
progress reports. Notably, out of 10 approved projects by GEF in the ASP region, only two involved
objective D whereas they all addressed objective A.
167. The CEE region showed a positive growth of at least 26 per cent under the objectives A, B and E since
PR1. Except for the objective C with a decline in the level of activity (7 per cent decrease) and
objective D with nearly no growth since PR1. The highest score was 0.86 under objective B which was
also the one single highest score obtained under all the objectives across all the six regions. The CEE
region also reported a significant advancement under objective A with an average score of 0.82;
slightly behind the objective B. A few of GEF projects were in the CEE region (i.e. 4 out of 31) all of
which mainly concentrated on the risk reduction of the chemicals (Objective A).
168. The LAC region also prioritized the objective A (score 0.65) over other objectives. Nevertheless, with
an average score of 0.52, the rest of the objectives are not very far from the objective A. Again, the
objective C by 11 per cent decline was the only objective that did not improve since PR1 in the LAC
region. The LAC region had a positive growth of at least 10 to 31 per cent since PR1 under all
objectives except for objective C.
169. The WEOG region has reported a decline in the level of activities under the objectives C and D as
compared to PR2. The region also demonstrated very small growth as compared to the previous
reporting period (PR2) under the rest of objectives; except for objective B with 14 per cent increase
as compared to PR2. Nevertheless, there is a positive growth if the level of activities is compared
with the corresponding values in PR1 across all the objectives. In general, the WEOG region has
reported above-average level of activity under nearly all the objectives since PR2 except for objective
D on capacity-building and technical cooperation.

SAICM/OEWG.3/INF/4
73
170. The objective C did not show much of progress across all regions in this reporting period once
compared to PR2 and PR1 except for the small positive progress of 4 per cent reported by the WEOG.
Even though in PR2 the CEE, LAC and WEOG regions reported a positive progress under objective C
as compared to PR1, this positive growth was not only sustained in PR3, but also the level of activity
diminished to lower values than those of PR1. It could be due to a large number of the respondents
from PR2 who did not submit a report to PR3 or the modifications to the phrasing of the activities in
the online questionnaire in regard to the multi-stakeholder mechanisms, and significant changes to
the implementation of the key international instruments, which have partially affected the activity
levels reported by the respondents.
171. The funding mechanisms of GEF and QSP aimed to assist the Governments with the initial capacity
building and institutional strengthening toward the implementation of SAICM objectives and the
sounds management of chemicals and waste. It can be envisaged that there is a positive correlation
between the focus of the funded projects by the GEF and QSP and the major progress that is recorded
under objective A and B. A total of 15 QSP funded projects from the rounds XII-XIV were functional
in this reporting period out of which 10 projects addressed objective B, and C equally and nine
involved objective A. Out of 31 approved GEF projects in the period 2014-2016 in more than 66
countries and across four regions of AFR, ASP, CEE and LAC, without exception all the projects
pledged to address the objective A or risk reduction of chemicals. Fourteen projects dealt with
objective B and 11 projects worked on objective D.
172. Regardless of variations in the scores of objectives among the regions, once an average of the scores
of all objectives for each region is calculated, the differences are narrow with the overall score of 0.4
for the AFR, 0.52 for the LAC, 0.6 for the ASP region, 0.63 for the WEOG, and 0.65 for the CEE. With
slightly more than half of the activities being addressed and implemented globally, there is room for
much concerted effort to achieve full implementation of the Strategic Approach globally.
4.2. Overall Progress on the Indicators
173. Some modifications were applied to the activities in the questionnaire and in certain cases resulted
in a lower level of activity reported by the respondents as compared to PR2 and PR1. These
modifications included: the significant changes made to the implementation of the international
instruments in indicator 12; technical assistance by donor countries (organizations) was removed
from indicator 13; development assistance programmes in indicator 15 was split to two activities;
first, whether sound chemical management had been included in the development assistance
programmes in 2014-2016 and second, to find countries with the National Development Plan (NDP)
and addressing their priority needs for the sound management of chemicals.
174. In addition, there were multiple new activities added to the questionnaire in this reporting period
including; one activity on the mechanisms (Legislation, regulations, policies, etc.) to address key
categories of chemicals and another activity on the programmes to enforce or encourage compliance
with these mechanisms added to indicator 1 on key categories of chemicals; significant changes
made to the hazardous waste management in the period 2014-2016 was added to indicator 2; the
activity on pre- or post-market science-based assessment of the key priorities for risk reduction was
added to indicator 3; significant changes or new developments made to the monitoring activities in

SAICM/OEWG.3/INF/4
74
the period 2014-2016 was added to the indicator 5; increase or update in the amount of chemical
safety information available through websites or other channels of public information was added to
indicator 9; two-parts activity on the organizations (not the Governments) who have multi-
stakeholders or multi-sectoral committees and the types of these stakeholders (i.e. Academia, civil
society, industry, etc) were added to indicator 11; identify the priority needs based on the 11 basic
elements from the Orientation and Guidance Document was added to indicator 14 on capacity-
building needs.
175. The highest average score across all the regions and stakeholders was obtained for indicator 9 on
the websites to provide information to stakeholders (Score 0.85), indicator 2 on hazardous waste
management (Score 0.84), indicator 3 on priorities for risk reduction (Score 0.83), indicator 19 on
mechanisms to prevent illegal traffic in hazardous waste (Score 0.77) and indicator 18 on regional
cooperation on issues related to the sound management of chemicals (Score 0.77).
176. Only seven out of 20 indicators of progress (i.e. indicators 6, 9, 10, 11, 12, 14, and 17) were assessed
quantitatively in the baseline report. The progress under indicator 6 on conformity with GHS since
the baseline report in 2006-2008 came to a light when compared with the indicator H of IOMC. Sixty-
five Governments complied with GHS according to indicator H as of 2017 which was equal to the
number estimated in the SAICM baseline report in 2008. Even though multiple Governments joined
the full compliance with GHS between 2008 and 2017, there was no clear improvement above what
SAICM baseline report had already estimated in 2008. This estimation in the SAICM baseline report
included a large number of countries which were only in the process of implementing GHS in certain
areas of chemical management therefore, already taking into account those who completed this
activity after 2008.
177. Indicator 9 in the baseline report mainly addressed the number of countries with PRTRs whereas in
PR3 this indicator tracked the countries with websites that provide information on variety of
chemical safety topics. Indicator 10 on implementation of Strategic Approach was perhaps among
the indicators with largest progress since the baseline report where only 14 Governments were in
the process of development of National Strategic Approach Implementation Plan. In the period 2014-
2016, another 15 stakeholders (23 per cent of the respondents) published a SAICM implementation
plan. This number was smaller than the 24 new submissions of SAICM implementation plans in the
period 2011-2013, yet it demonstrated a continuous improvement over the years. In 2010, there
were 164 national focal points which grew to 181 focal points in 2016, 5 new focal points in the
period 2014-2016. As of 2016, 95 per cent of the respondents to the questionnaire regularly
attended the SAICM related meetings and more than 90 per cent actively engaged in SAICM
activities.
178. Drawing a conclusion on the progress of indicator 11 on multi-stakeholder coordinating mechanism
and indicator 12 on key international instruments since the baseline report was difficult, given the
modifications that were made to the activities under these two indicators. Indicator 14 of the
baseline report addressed the capacity-building needs of the countries by focusing on publicly
available plans of UNITAR National Chemicals Management Profile and of a Stockholm Convention
National Implementation Plan. According to indicator A of IOMC indicators of progress, 116 countries
had up-to-date UNITAR National Profiles as of 2016. This value was 102 National Profiles according
to SAICM baseline report which shows about nine per cent growth. Indicator 14 in PR3 also included
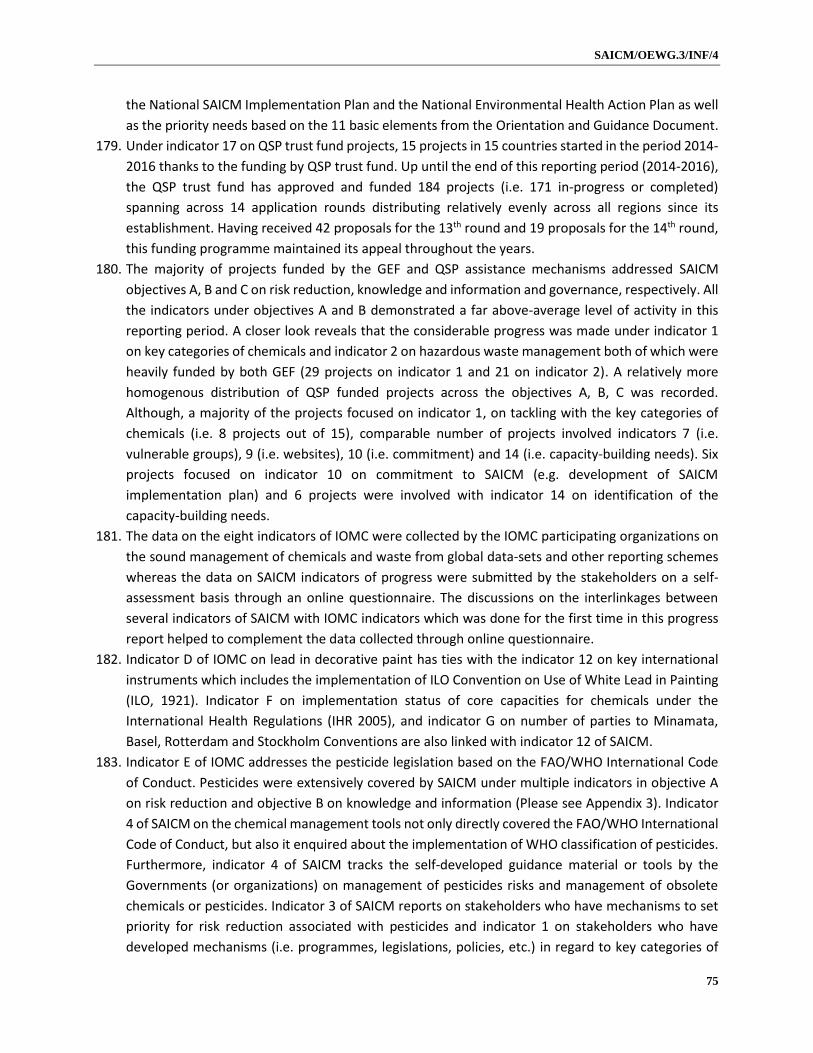
SAICM/OEWG.3/INF/4
75
the National SAICM Implementation Plan and the National Environmental Health Action Plan as well
as the priority needs based on the 11 basic elements from the Orientation and Guidance Document.
179. Under indicator 17 on QSP trust fund projects, 15 projects in 15 countries started in the period 2014-
2016 thanks to the funding by QSP trust fund. Up until the end of this reporting period (2014-2016),
the QSP trust fund has approved and funded 184 projects (i.e. 171 in-progress or completed)
spanning across 14 application rounds distributing relatively evenly across all regions since its
establishment. Having received 42 proposals for the 13th round and 19 proposals for the 14th round,
this funding programme maintained its appeal throughout the years.
180. The majority of projects funded by the GEF and QSP assistance mechanisms addressed SAICM
objectives A, B and C on risk reduction, knowledge and information and governance, respectively. All
the indicators under objectives A and B demonstrated a far above-average level of activity in this
reporting period. A closer look reveals that the considerable progress was made under indicator 1
on key categories of chemicals and indicator 2 on hazardous waste management both of which were
heavily funded by both GEF (29 projects on indicator 1 and 21 on indicator 2). A relatively more
homogenous distribution of QSP funded projects across the objectives A, B, C was recorded.
Although, a majority of the projects focused on indicator 1, on tackling with the key categories of
chemicals (i.e. 8 projects out of 15), comparable number of projects involved indicators 7 (i.e.
vulnerable groups), 9 (i.e. websites), 10 (i.e. commitment) and 14 (i.e. capacity-building needs). Six
projects focused on indicator 10 on commitment to SAICM (e.g. development of SAICM
implementation plan) and 6 projects were involved with indicator 14 on identification of the
capacity-building needs.
181. The data on the eight indicators of IOMC were collected by the IOMC participating organizations on
the sound management of chemicals and waste from global data-sets and other reporting schemes
whereas the data on SAICM indicators of progress were submitted by the stakeholders on a self-
assessment basis through an online questionnaire. The discussions on the interlinkages between
several indicators of SAICM with IOMC indicators which was done for the first time in this progress
report helped to complement the data collected through online questionnaire.
182. Indicator D of IOMC on lead in decorative paint has ties with the indicator 12 on key international
instruments which includes the implementation of ILO Convention on Use of White Lead in Painting
(ILO, 1921). Indicator F on implementation status of core capacities for chemicals under the
International Health Regulations (IHR 2005), and indicator G on number of parties to Minamata,
Basel, Rotterdam and Stockholm Conventions are also linked with indicator 12 of SAICM.
183. Indicator E of IOMC addresses the pesticide legislation based on the FAO/WHO International Code
of Conduct. Pesticides were extensively covered by SAICM under multiple indicators in objective A
on risk reduction and objective B on knowledge and information (Please see Appendix 3). Indicator
4 of SAICM on the chemical management tools not only directly covered the FAO/WHO International
Code of Conduct, but also it enquired about the implementation of WHO classification of pesticides.
Furthermore, indicator 4 of SAICM tracks the self-developed guidance material or tools by the
Governments (or organizations) on management of pesticides risks and management of obsolete
chemicals or pesticides. Indicator 3 of SAICM reports on stakeholders who have mechanisms to set
priority for risk reduction associated with pesticides and indicator 1 on stakeholders who have
developed mechanisms (i.e. programmes, legislations, policies, etc.) in regard to key categories of

SAICM/OEWG.3/INF/4
76
chemicals including pesticides. Indicator 6 of SAICM is linked with indicator H of IOMC on the number
of countries implementing the GHS. Indicator 14 of SAICM covers both IOMC indicator A on National
Profiles, and IOMC indicator C on Poison Centres. Furthermore, indicator 5 of SAICM on monitoring
activities for selected environmental and health priorities is linked with indicators B, C and D of IOMC.
Indicator B on PRTR is also covered under indicator 4 of SAICM on tools.
184. The submissions by NGOs were limited to only 4 reports and one submission by Civil Society, yet it is
of value to reflect on the specific progress reported by them under SAICM indicators of progress.
NGO respondents demonstrated an overall below-average level of activity except for Central
American Institute for Research on Toxic Substances with slightly above-average overall level of
activity. The NGOs each had their specific priorities and strengths in regard to implementation of
indicators. The Society for Ecological Restoration (SER) demonstrated the largest progress under
indicators 19 and 20 on illegal international traffic of chemicals and hazardous waste, respectively.
AWHHE reported a far above-average level of activity under indicators 9 (i.e. websites), 14 (i.e.
capacity-building needs) and 18 (i.e. regional cooperation). Central American Institute for Research
on Toxic Substances selected more than 95 per cent of the activities under indicators 2 (i.e.
hazardous waste), 6 (i.e. standards) and 9 (i.e. websites). PAN also demonstrated a far above-average
activity under indicators 7 (i.e. vulnerable groups) and 9 (i.e. websites), as well as a full conduct of all
the activities under indicator 18 (i.e. regional cooperation). IPEN reported a great progress toward
elimination of lead paint through several initiatives and projects in several countries. Moreover, IPEN
reported progress in several projects including mercury enabling activities program, highly hazardous
pesticides, endocrine-disrupting chemicals awareness initiative, IPEN-SAICM Emerging Policy Pilot
Project and chemicals in products.
185. Two stakeholders from the private sector submitted their reports through SAICM online
questionnaire. Both private sector respondents demonstrated largest level of activity under
objective B followed by objective A. Both stakeholders reported full conduct of activities under
indicator 9 on websites that provide information to stakeholders. ICCA also indicated full conduct of
activities for indicators 19 and 20 on illegal international traffic of chemicals and waste. They also
noted a significant progress under indicator 12 on significant changes to implementation of key
international instruments, indicator 3 on priorities for risk reduction of chemicals. Indicators 2 (i.e.
hazardous waste), 11 (i.e. multi-stakeholder coordinating mechanism) and 13 (i.e. resources)
obtained a below-average level of activity by ICCA. American Petroleum Institute reported above-
average level of activity under the indicator 1 (i.e. key categories of chemicals), 6 (i.e. standards) and
9 (i.e. websites), whereas, they showed below-average progress under indicators 3, 5 (i.e.
monitoring), 7 (i.e. vulnerable groups) and 13. In addition, the two respondents selected majority of
the activities under indicators 18 on chemical projects supported by other sources of funding even
though this indicator was addressed only to the recipients of funding programmes whereas both
respondents had identified as donor stakeholders; this could refer to a misunderstanding of the
activity in the questionnaire.

SAICM/OEWG.3/INF/4
77
4.3. Future Work toward the 2020 Goal
186. One of the functions of the International Conference is to evaluate the implementation of the SAICM
with a view to measuring progress against the 2020 objective and taking strategic decisions,
programming and prioritizing. By identifying achievements, understanding the gaps in
implementation and prioritizing future actions, optimum progress may be achieved.
187. Stakeholders should consider lessons learned under the current SAICM in considering reporting
needs and mechanisms in looking at SAICM and the sound management of chemicals and waste
beyond 2020. As a result, in the following sections, the strengths, weaknesses and achievements of
the SAICM progress reporting process over the reporting periods since 2009 are highlighted.
4.3.1. Strengths
188. The development of the progress reports over three periods using the data directly extracted from
the stakeholders’ responses to the questionnaire has helped to establish the strengths of the regions
under certain indicators.
189. The number of parties to the Basel, Rotterdam and Stockholm Conventions has steadily grown since
the baseline report. It has reached 183 parties for Basel, 160 for Rotterdam and 180 for Stockholm
as of 2016 which indicative of the majority of the member States. The number of parties increased
by 4, 5 and 10 per cent for the Stockholm, Basel, and Rotterdam, respectively since the baseline
report.
190. Several indicators constantly obtained an above-average level of activity since the first progress
report, including indicators 1, 2, 3 and 5:
190.1. The respondents completed more than 54 per cent of all the activities under indicator 1
on key categories of chemicals, indicator 2 on hazardous waste management in the first
progress report which increased to more than 70 per cent in this progress report.
190.2. Indicator 3 on setting priorities for risk reduction and indicator 5 on monitoring of
environmental and human health priority substances had a nearly 50 per cent average score
in the period 2009-2010 which augmented to more than 70 per cent in this reporting period.
Thus, the SAICM stakeholders consistently reported an above-average level of activity under
objective A on risk reduction.
191. Completion of more than 77 per cent of the activities under the indicators 9 on websites that provide
information to stakeholders, 2 on hazardous waste management, 3 on setting priorities for risk
reduction, 19 on illegal traffic in chemicals and 18 on regional cooperation on issues relating to the
sound management of chemicals by the stakeholders was an indication that the full conduct of these
indicators with a consistent effort is possible in run-up to 2020 goal.
4.3.2. Weaknesses
192. Limited reporting is the largest gap in the current report and needs to be addressed in future
reporting, both for potential reports for 2017-2019 and for the beyond 2020 context. The conclusions
on the progress are largely based on the responses provided by the stakeholders on their
achievements toward the objectives. Without sufficient data, those conclusions are not fully reliable

SAICM/OEWG.3/INF/4
78
and not representative of the true status of global progress toward the sound management of
chemicals.
193. The regions and the Governments have varying paces and priorities in implementing and achieving
the SAICM objectives. Yet, by looking at the overall progress under all of the indicators over the years,
it is clear that there is still a long run to achieve the 2020 goal. Thirty per cent of the indicators
acquired a score of below 0.5, and 40 per cent of the indicators have a score above 0.7. These
numbers could possibly diminish further if all the SAICM stakeholders submitted reports, on the
assumption that those who do not report their progress also more likely have made fewer
improvements to achieve the objectives.
194. Increasing the number of Governments submissions back to at least the rates in PR2 and PR1 may
be achievable with some effort and encouragement. In particular, encouraging a larger participation
by OL, LDC and LM countries can help to better understand the progress of developing countries
toward sound management of chemicals and waste. One suggestion could be allocating some time
with the stakeholders during relevant meetings emphasizing the significance of their contribution to
the progress report. A better understanding of the questionnaire questions by the stakeholders is
also needed in particular for those activities that were modified including indicator 11 on multi-
stakeholder coordinating mechanism.
195. The majority of approved projects by QSP trust fund and GEF focused on the Strategic Approach
objective A on risk reduction, B on knowledge and information and C on governance and fewer
projects involved the objective E on illegal international traffic, even though objective E has acquired
a high level of activity by the respondents to the questionnaire. In contrast, a considerable number
of QSP trust fund and GEF projects involved objective D on capacity-building and institutional-
strengthening yet very little progress was registered for this objective over the years. It might be of
value to explore reasons for the slower than average progress of the objective D as compared to the
rest of the objectives.
196. Objective D is the single objective that has shown very slow progress in particular under certain
indicators including indicator 13 on resources (financial and in-kind) to assist capacity-building and
technical cooperation, indicator 14 on identifying and prioritizing the capacity-building needs for the
sound management of chemicals, indicator 15 on development assistance programmes that include
the sound management of chemicals and indicator 16 on other sources of funding (not QSP trust
fund) for sound management of chemicals project, all of which barely exceeded 30 per cent
completion of the activities on average across all the respondents. Accordingly, indicator 16 on other
sources of funding reported a decline over the years from an average score of 0.18 in 2009-1010 to
0.1 in 2014-2016.
197. The GHS is a key component of SAICM implementation, featuring in the basic elements of the Overall
Orientation and Guidance. Nevertheless, as of 2016, 60 countries had fully or partially implemented
GHS which stands for only 31 per cent of UN member States as compared to 41 countries in 2010
(i.e. the baseline data for IOMC indicators) with full or partial implementation of GHS in their national
legislation.
198. The activity under indicator 13 on countries providing resources (financial and in-kind) targeted the
donor Governments (organizations) exclusively. The recipient countries left this activity blank and
did not acquire any score under this activity. As a result, the average score for the activity was

SAICM/OEWG.3/INF/4
79
negatively biased due to the majority of the respondents who identified as ‘recipients’. Thus, for the
future progress report a better approach would be to calculate the overall average score of this
indicator by aggregating the average score of each respondent across the ‘donors’ respondents
instead of all the respondents. The same procedure could be applied to the rest of the indicators (14,
15, 16, and 18) under objective D to which only ‘recipients’ responded and ‘donors’ left them blank.
The modified score could be more representative of the target audience to which the activity is
addressed and could improve the overall score obtained under objective D.
199. The activities in the questionnaire under indicator 13 on countries (organizations) that provide
resources (in-kind and financial) enquires solely the status of the contributions by the respective
Governments and organizations. It could be of value in future progress reports to also ask for the
quantitative data on the contributions and perhaps details on the type of projects that were
financed; for example, whether they addressed any of SAICM Strategic Priorities during that certain
reporting period. The total value of the contributions, the number of projects financed, and the
issues addressed in these projects could better measure the progress under this indicator.
200. The data for indicator H of IOMC which is on the implementation of the Global Harmonized System
of Classification and Labelling of Chemicals (GHS) was extracted from a research paper. Even though
the paper is comprehensive, this information could be updated in a future progress report and in the
longer-term, to support evaluations of SAICM and/or the sound management of chemicals and waste
beyond 2020. It would be important for countries, and IOMC and other relevant agencies to be able
to provide regularly updated statistics on the implementation of the GHS.
4.3.3. Achievements
201. The three SAICM progress reports, over three periods since 2009, accomplished to uncover and track
the progress of the regions and highlight their strengths and weaknesses. These progress reports
helped to stress the different pace of developing and developed countries in achieving the goals
toward the sound management of chemicals, identify some specific needs of the regions in
implementing the Strategic Objectives, and underline the positive impact of funding programmes in
helping the countries reaching their goals; all of which would not have been possible without such a
comprehensive analysis of the countries’ data on progress over the years.
202. The present progress report has benefited from the inclusion of the IOMC indicators which have
provided data on the sound management of chemicals from global data-sets and other reporting
schemes.
203. Some specific examples of the stakeholders’ achievements toward sound management of chemicals
include, the significant number of countries which have implemented pesticide legislation based on
the FAO/WHO International Code of Conduct on pesticides management; 174 countries as of 2017.
In addition, the increasing number of ratifications of Minamata Convention was notable; 34 in the
period 2014-2016. As of 7 January 2019, there are 101 Parties (given that it did not enter into force
until 16 August 2017).
204. In addition, indicator 7 on vulnerable groups has seen a noteworthy growth of 35 per cent since the
first progress report. The number of SAICM focal points under the indicator 10 has reached 181 as
of 2016 which has been an important achievement. Attendance at SAICM related meetings and

SAICM/OEWG.3/INF/4
80
active engagement in SAICM activities both received substantial attention over the years so much
that more than 80 per cent of the respondents reported their participation. More than 80 per cent
of the activities under indicator 9 on websites were completed by the respondents; a development
of more than 40 per cent since the first progress report. The respondents also reported a
considerable boost in the level of activities for indicator 18 on regional cooperation on issues relating
to the sound management of chemicals and indicator 19 on illegal traffic in chemicals by nearly 44
per cent on average as compared to first progress report.
205. The substantial number of projects funded by the funding programmes of QSP trust fund and GEF
whose focus was SAICM Strategic objective A on risk reduction and objective B on knowledge and
information has definitely had positive impacts on achieving the milestones under these two SAICM
objectives.
4.4. Looking beyond 2020
206. The demonstration of credible, continuous progress to sound management of chemicals will help to
secure political support and financing, and ultimately enhance impact over the long term.
207. In looking beyond 2020 for SAICM and the sound management of chemicals and waste:
a) Developing objectively verifiable results-based indicators that reflect the progress (or lack
thereof) toward minimizing the adverse health and environmental impacts of chemicals
production, use and disposal, could prove to be a more effective and consistent approach.
b) The experience of the Biodiversity Indicators Partnership in developing targets and indicators
towards achieving the Aichi Biodiversity Targets of the Strategic Plan for Biodiversity 2011-
2020 suggests setting smart and ambitious targets as a firm ground for development of
indicators, in an iterative process where indicators help to refine the measurability of targets.
In particular, this experience could be considered helpful in developing targets and indicators
which aim to measure the adverse impact of hazardous chemicals and waste on biodiversity
as well as specific indicators on emerging policy issues, in setting targets for SAICM beyond
2020.
c) A framework to track progress on multiple levels with multiple stakeholders could be
considered. The use of different data sources and methods may help to ensure a more
comprehensive review of global progress in the future.
d) In respect of measuring the level of commitment to the sound management of chemicals
and waste, the WHO core capacity monitoring framework on the status of implementation
of the International Health Regulations is an example of an effective and comprehensive
approach to evaluating the progress made by the States, including some data related to the
sound management of chemicals and waste.
e) The 2030 Agenda for Sustainable Development provides opportunities for Governments,
industry and civil society to contribute concretely on a societal level and promote more
responsible and sustainable production and consumption patterns globally. It provides a
broad framework for everyone to contribute to the sound management of chemicals and
prevention or reduction of waste production. Stakeholders should consider how the
objectives developed in the beyond 2020 context for the sound management of chemicals
SAICM/OEWG.3/INF/4
81
and waste collectively contribute to and support implementation of the 2030 Agenda for
Sustainable Development.

SAICM/OEWG.3/INF/4
82
5. ANNEXES
5.1. Annex 1- The Activity Map of the projects funded by QSP trust fund Rounds I-XIV49
Indicator 1-
CATS 2-
HAZAWASTE 3-
PRIORITY 4-
TOOLS 5-
MONITOR 6-
STANDARDS 7-
VULS 8-
RESEARCH 9-
WEB 10-
COMMITMENT 11-MS COORD
12-INTL
INSTR
14-NEEDS
15-NDP
18-REG
COOP
Total Projects
AFR-complete
7 6 10 25 15 6 30 4 3 29 28 6 1 2 0 61
AFR-in progress
0 0 1 0 0 1 0 0 0 1 0 1 1 0 0 2
ASP-complete
8 2 0 12 9 5 5 1 3 25 29 3 0 0 1 42
ASP-in progress
2 0 0 0 0 1 1 0 1 1 1 1 1 0 0 3
CEE-complete
4 3 3 6 2 1 12 0 8 6 8 5 0 0 0 14
CEE-in progress
3 1 1 0 0 0 2 0 2 2 2 1 2 0 0 4
LAC-complete
9 2 4 18 6 8 15 6 11 14 16 11 0 0 0 43
LAC-in progress
2 0 0 1 1 0 0 0 0 0 0 1 1 0 0 2
Total 35 14 19 62 33 22 65 11 28 78 84 29 6 2 1 171
49 From the rounds XIII and XIV, only the functional projects in the period 2014-2016 are shown in this activity map.

SAICM/OEWG.3/INF/4
83
5.2. Annex 2- Indicators for reporting progress in implementation of the Strategic Approach
E. Illegal
international traffic
1. Number of countries (and organizations) with mechanisms to address key categories of chemicals.
(CATEGORIES)
2. Number of countries (and organizations) with hazardous waste management arrangements.
(HAZWASTE)
3. Number of countries (and organizations) having mechanisms in place for setting priorities for risk
reduction. (PRIORITIES)
4. Number of countries (and organizations) implementing agreed chemicals management tools. (TOOLS)
5. Number of countries (and organizations) engaged in activities that result in monitoring data on
selected environmental and human health priority substances. (MONITORING)
11. Number of countries (and organizations) with multi-stakeholder coordinating mechanism.
(STAKEHOLDER)
A. Risk reduction
B. Knowledge and
information
C. Governance
D. Capacity-building
and technical
cooperation
6. Number of countries (and organizations) providing information according to internationally
harmonized standards. (STANDARDS)
7. Number of countries (and organizations) that have specific strategies in place for communicating
information on the risks associated with chemicals to vulnerable groups. (VULNERABLE)
8. Number of countries (and organizations) with research programmes. (RESEARCH)
9. Number of countries (and organizations) with websites that provide information to stakeholders.
(WEBSITES)
10. Number of countries (and organizations) that have committed themselves to implementation of the
Strategic Approach. (COMMITMENT)
18. 1Number of countries (and organizations) engaged in regional cooperation on issues relating to the
sound management of chemicals. (REG COOP))
19. Number of countries having mechanisms to prevent illegal traffic in toxic, hazardous and severely
restricted chemicals individually. (ILL CHEMICAL)
20. Number of countries having mechanisms to prevent illegal traffic in hazardous waste. (ILL WASTE)
12. Number of countries (and organizations) with significant changes to the implementation of key
international chemicals priorities. (CONVENTIONS)
13. Number of countries (and organizations) providing resources (financial and in kind) to assist capacity-
building and technical cooperation with other countries. (RESOURCES)
14. Number of countries (and organizations) that have identified and prioritized their capacity-building
needs for the sound management of chemicals. (NEEDS)
15. Number of countries where development assistance programmes that include the sound
management of chemicals. (NDP, National Development Plan)
16. Number of countries (and organizations) with sound management of chemicals projects supported
by other sources of funding (not Quick Start Programme funding). (OTHER FUNDS)
17. Number of countries (and organizations) with projects supported by the Strategic Approach’s Quick
Start Programme Trust Fund. (QSP)

SAICM/OEWG.3/INF/4
84
5.3. Annex 3- SAICM online questionnaire for the period 2014-2016
Section B: OBJECTIVE A RISK REDUCTION
INDICATOR 1
B1: Mechanisms to address key categories of chemicals Â
B1.1: Does your government or organization have any of the following mechanisms in place to address chemicals or key categories of chemicals? [Legislation/ regulations]
Policies
[Programmes]
[Agreements]
[Standards]
[Other (please describe below)]
B1.1.1 Does your government or organization have programmes in place to encourage compliance with the mechanisms identified above?Â
[Programme to encourage compliance (e.g. education and training)]
[Enforcement programme (e.g. inspections, sampling/testing)]
[Other (please describe below)]
Please briefly provide additional information, including which stages of the lifecycle your mechanism(s) address (e.g. primary or secondary manufacturing, product use, recycling, end of life, etc.)? Please note that hazardous waste management is covered in the next section.
B1.2 Which of the following categories or groups of chemicals does your country or organization prioritize for risk management?
[Persistent organic pollutants (as listed under the Stockholm Convention)]
[Other Persistent, bioaccumulative and toxic substances]
[Carcinogenic, mutagenic or reproductive toxic substances]
[Endocrine disruptors]
[Immunotoxins]
[Neurotoxins]
[Mercury or mercury-containing sources]
[Other metals or their compounds]
[Chemicals produced in high volume]
[Chemicals subject to wide dispersive uses]
[Pesticides]
[Chemical contaminants in consumer products]

SAICM/OEWG.3/INF/4
85
[Others (please describe below)]
[Not known]
[Not applicable (please explain below)]
B1.2.1Â Please briefly provide additional information (e.g. other priority chemicals or categories, or reasons why this is not relevant for your country or organization).Â
INDICATOR 2
B2: Hazardous waste management arrangements
B2.1 Please identify which part of the waste management cycle your government or organization addresses and the mechanism used:
[Prevention/reduction in generation of hazardous waste]
[Collection and interim storage of hazardous waste]
[Disposal of hazardous waste]
[Recovery and recycling of hazardous waste]
[Other (please describe below)]
Please briefly provide any additional information you would like to share:Â
B2.2 Please indicate below whether your government or organization introduced, revised or was developing mechanisms to address parts of the waste management cycle over the 2014 to 2016 period?
[Prevention/reduction in generation of hazardous waste]
[Collection and interim storage of hazardous waste]
[Disposal of hazardous waste]
[Recovery and recycling of hazardous waste]
[Other (please describe below)]
Please briefly provide any additional information you would like to share:
B2.3 Please indicate whether your country or organization addresses any of the following specific waste streams? Â
[Plastics]
[Lead-acid batteries]
[Biomedical & healthcare wastes]
[Mobile phones]
[Other electrical & electronic equipment]
[Persistent organic pollutants contaminated waste]
[Dioxin-related substances]

SAICM/OEWG.3/INF/4
86
[Pesticide contaminated wastes]
[Other (please describe below)]
Please briefly provide additional information, including the type of tool or mechanism used to address each waste stream (legislation, permit, stewardship program, education etc.).
INDICATOR 3
B3: Mechanisms for setting priorities for risk reduction.
B.3.1 Does your country or organization use science-based risk assessment to set priorities for risk reduction for any of the following types of chemicals?
[Industrial chemicals]
[Pesticides]
[Biocides]
[Food additives]
[Other (please describe below)]
B3.1AÂ Please specify whether the above is pre-market or post-market assessment? Â
same options
B3.1B Which of the following risks are considered as part of your government's or organization's prioritization process? Â
[Occupational health and safety risks]
[Environmental risks]
[Consumer or public health risks]
[Other (please describe below)]
[Not known]
[Not applicable (please explain below)]
Please briefly provide any additional details you wish to share on your answers to question B3.1.
B3.2 Does your government or organization have programmes for the management of priority risks associated with exposures to any of the following?
[Industrial chemicals]
[Pesticides]
[Biocides]
[Chemical contaminants in food]
[Chemical contaminants in consumer products]
[Chemical contaminants in drinking water]
[Chemical contaminants in recreational water]
[Chemical contaminants in groundwater]

SAICM/OEWG.3/INF/4
87
Air pollutants]
[Other (please describe below)]
Please briefly provide any additional information you wish to share.
B3.3 Is there a multi-disciplinary scientific committee, body or institute engaged in your government's or organization's scientific risk assessment, prioritization, or risk reduction activities?
Please briefly describe your committee(s), including the name and the specific topics dealt with:
INDICATOR 4
B4: Use of chemicals management tools
B4.1 Which of the following tools or guidance materials for risk reduction published by the Participating Organizations of the Inter-Organization Programme for the Sound Management of Chemicals (IOMC) are used by your government or organization?
[FAO/WHO International Code of Conduct for the Distribution and Use of Pesticides]
[IOMC Toolbox]
[IPCS International Chemical Control Toolkit (Control Banding)]
[OECD eChem Portal]
[OECD Guidelines for the Testing of Chemicals]
[OECD Environmental Risk Assessment Toolkit]
[OECD Substitution and Alternatives Assessment Toolbox]
[UNITAR Guidance on Developing a Risk Management Plan for Priority Chemicals]
[WHO Air Quality Guidelines]
[WHO Drinking Water Quality Guidelines]
[WHO Human Health Risk Assessment Toolkit]
[WHO International Chemical Safety Cards]
[WHO Recommended Classification of Pesticides by Hazard]
[Others (please describe below)]
[Not known]
[Not applicable (please explain below)]
If desired, please briefly provide additional details about your response to this question.
B4.2 Please provide the name(s) of any other (i.e. non-IOMC) tools or guidance documents your government or organization has found helpful for risk reduction activities:
B4.3 Has your government or organization published any tools or guidance materials in the following areas:

SAICM/OEWG.3/INF/4
88
[Identification of chemicals in use]
[Hazard identification]
[Exposure assessment]
[Risk characterization]
[Management of pesticide risks]
[Management of obsolete chemicals or pesticides]
[Prevention and control of chemical pollution and waste]
[Pollutant Release and Transfer Registers (PRTRs)]
[Management of media-specific risks (e.g., water quality, air quality)]
[Identification and use of less hazardous alternative substances]
Major industrial accidents]
[Others (please describe below)]
If desired, please briefly provide any additional information.
B4.4 Please describe any additional tools or guidance materials that your government or organization would find helpful for developing or implementing risk reduction activities:
INDICATOR 5
B5: Monitoring activities for selected environmental and health priorities
B5.1 Please identify whether your government or organization is engaged in any of the following kinds of monitoring or surveillance activities with respect to chemicals:
[Environmental monitoring e.g., air, water, environmental species]
[Human biomonitoring, e.g., blood, serum, urine]
[Cases of human poisoning]
[Cases of occupationally-related disease]
[Chemical incidents]
[Food and/or drinking water]
[Other types of monitoring carried out (please describe below)]
B5.2A Please identify the sectors that are involved in the monitoring or surveillance activities you identified in question B5.1.
[Agriculture]
Environment]
[Health]
[Industry]
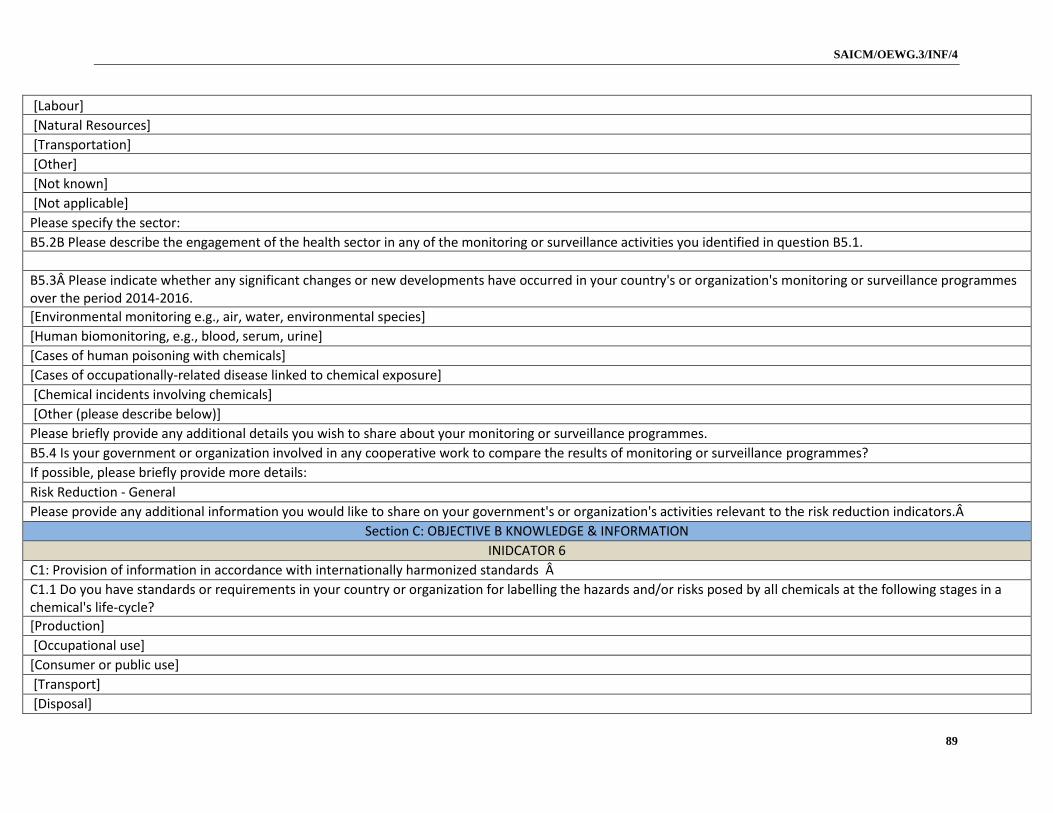
SAICM/OEWG.3/INF/4
89
[Labour]
[Natural Resources]
[Transportation]
[Other]
[Not known]
[Not applicable]
Please specify the sector:
B5.2B Please describe the engagement of the health sector in any of the monitoring or surveillance activities you identified in question B5.1.
B5.3Â Please indicate whether any significant changes or new developments have occurred in your country's or organization's monitoring or surveillance programmes over the period 2014-2016.
[Environmental monitoring e.g., air, water, environmental species]
[Human biomonitoring, e.g., blood, serum, urine]
[Cases of human poisoning with chemicals]
[Cases of occupationally-related disease linked to chemical exposure]
[Chemical incidents involving chemicals]
[Other (please describe below)]
Please briefly provide any additional details you wish to share about your monitoring or surveillance programmes.
B5.4 Is your government or organization involved in any cooperative work to compare the results of monitoring or surveillance programmes?
If possible, please briefly provide more details:
Risk Reduction - General
Please provide any additional information you would like to share on your government's or organization's activities relevant to the risk reduction indicators.Â
Section C: OBJECTIVE B KNOWLEDGE & INFORMATION
INIDCATOR 6
C1: Provision of information in accordance with internationally harmonized standards Â
C1.1 Do you have standards or requirements in your country or organization for labelling the hazards and/or risks posed by all chemicals at the following stages in a chemical's life-cycle?
[Production]
[Occupational use]
[Consumer or public use]
[Transport]
[Disposal]

SAICM/OEWG.3/INF/4
90
[Other (please describe below)]
Please briefly provide any additional information you wish to share.Â
C1.2. Do the labeling requirements of your government or organization conform with those of the Globally Harmonized System for the Classification and Labelling of Chemicals (the "GHS") for the following categories?Â
[Dangerous Goods]
[Pesticides]
[Consumer products]
[Occupational health and safety/Workplace use]
[Industrial chemicals]
[Other (please describe below)]
Please briefly provide any additional information you wish to share.
C1.3. Over the 2014 to 2016 period, were there any major changes in your standards or requirements for labelling the hazards and/or risks posed by chemicals with respect to conformity with the GHS?Â
Please briefly provide any additional information you wish to share on the changes:
INDICATOR 7
C2: Communication of risks to vulnerable groups
C2.1 Does your government or organization undertake activities or publish guidance, training or awareness materials designed to communicate chemical safety issues to any of the following?
[Women]
[Children]
[The elderly]
[Workers]
[Workers in the informal sector]
[Indigenous peoples]
[Highly exposed groups]
[Consumers (e.g. of a specific product type)]
[The general public]
[Other (please describe below)]
C2.2A Please identify the sectors involved in communicating about chemical safety issues with the groups identified in question C2.1.
[Agriculture]

SAICM/OEWG.3/INF/4
91
[Environment]
[Health]
[Industry]
[Labour]
[Natural Resources]
[Transportation]
[Other (please describe below)]
[Not known]
Not applicable]
Please specify the sector involved.
C2.2B Please describe the nature of involvement by the health sector in communicating with the groups you identified in question C2.1.
Please briefly provide any additional information you wish to share about your communications with vulnerable groups.
INDICATOR 8
C3: Research
C3.1Â Has your country or organization commissioned or funded research in any of the following areas of chemical safety?Â
[Human health effects or exposure]
[Environmental effects, releases, or exposure]
[Safer alternatives]
[Cleaner production technologies]
[Other (please describe below)]
[Not known]
[Not applicable (please explain below)]
Please briefly provide any additional information you wish to share.
C3.2A Please indicate the sectors involved in any research identified in question C3.1?Â
[Agriculture]
[Environment]
[Health]
[Industry]
[Labour]
[Natural Resources]

SAICM/OEWG.3/INF/4
92
[Transportation]
[Other]
[Not known]
[Not applicable]
Please specify the sector involved.
C3.2B Please briefly describe the nature of involvement by any health sector institutions or professional bodies in the research you identified in question C3.1.
INDICATOR 9
C4: Websites providing information to stakeholders
C4.1Â Does your government or organization maintain any websites that provide publicly available information on any of the following topics. [
Chemicals in use]
[Chemicals safety laws that apply in the country]
[Hazards and risks associated with specific chemicals]
[Exposure scenarios or risks associated with specific uses]
[Guidance on how to prevent exposure]
[First aid and medical information for selected chemical risks]
[Pollution release information]
[Chemical safety information in local languages]
[Chemical alternatives/substitutes]
[Other (please describe below)]
C4.1.1 If any of the websites identified in question C4.1 are hosted by a health sector organisation, please briefly describe below and provide web links.
C4.2 Please indicate whether the overall amount of chemical safety information you make publicly available through websites has increased, decreased or remained the same over the 2014 to 2016 period:
Please briefly provide any additional information you wish to share on the provision of information to stakeholders through websites (including web links).
C4.3 Have you used other channels of public information (e.g., social media (Twitter, Facebook etc.), printed media, television, radio, or community workers) between 2014 and 2016 to communicate on chemicals safety related topics?Â
Please briefly provide any additional information you wish to share.
Knowledge and Information - General
Please provide any additional information you would like to share on your government's or organization's activities relevant to the Knowledge and Information indicators.Â
Section D: OBJECTIVE C GOVERNANCE

SAICM/OEWG.3/INF/4
93
INDICATOR 10
D1: Commitments to implementation of the Strategic Approach
D1.1 Please identify how your government or organization has demonstrated its commitment to SAICM implementation over the 2014 to 2016 period:Â
[Ministerial or other official public statements expressing support for SAICM]
[Resolutions of governing bodies that refer to SAICM (e.g., by an Executive or management board)]
[Nomination of a new national or organizational focal SAICM focal point (where none existed)]
[Focal point role formalized in organizational plans or duty statements]
[Publication of a SAICM implementation plan or equivalent]
 [Inclusion of information on progress in SAICM implementation in annual reports]
[Establishment of a committee to coordinate on chemical safety, including SAICM matters]
[Introduction or renewal of a chemical safety programme that supports or contributes to SAICM implementation]
[Implementation of an ongoing chemical safety programme that supports or contributes to SAICM implementation]
[Attendance at SAICM related meetings]
[Active engagement in ongoing SAICM activities (e.g. emerging policy and other issues)]
[Organizational policies that include and/or support SAICM implementation (e.g. Corporate Social Responsibility Policy)]
[Other (please describe below)]
[Not known]
[Not applicable (please explain below)]
Please briefly provide any additional information you wish to share.
INDICATOR 11
D2: Multi-stakeholder coordinationÂ
D2.1 Please indicate if your government has a national multi-stakeholder or multi-sectoral committee designed to broadly address (make decisions or provide advice on) chemical safety issues, including SAICM:
[Government (only) committee]
[Multi-stakeholder committee]
[Other (please describe below)]
D2.1.1A Please identify which ministries are represented on your government only committee.
[Agriculture]
[Customs authorities]
[Education]
[Environment]

SAICM/OEWG.3/INF/4
94
[Finance/Economy]
. [Foreign Affairs]
[Health]
[Industry]
[Internal Affairs/Planning]
[Labour]
[Prime Minister]
[Science]
[Trade]
[Transport]
[Other levels of government]
[Other]
D2.1 Please indicate whether your organisation coordinates or is engaged in any multi-stakeholder or multi-sectoral committees (not including ICCM) designed to broadly address (make decisions or provide advice on) chemical safety issues, including SAICM:
[Non-government (only) committee]
[Multi-stakeholder committee]
[Other (please describe below)]
D2.1.1 Please identify the types of stakeholders on your non-governmental committee.
Academia]
D2.1.1 Please identify the types of stakeholders on your non-governmental committee. [Civil Society - health]
D2.1.1 Please identify the types of stakeholders on your non-governmental committee. [Civil Society - environment]
D2.1.1 Please identify the types of stakeholders on your non-governmental committee. [Civil Society - human rights/justice]
D2.1.1 Please identify the types of stakeholders on your non-governmental committee. [Civil Society - labour]
D2.1.1 Please identify the types of stakeholders on your non-governmental committee. [Civil Society - other]
D2.1.1 Please identify the types of stakeholders on your non-governmental committee. [Industry - chemical manufacturer]
D2.1.1 Please identify the types of stakeholders on your non-governmental committee. [Industry - product manufacturer]
D2.1.1 Please identify the types of stakeholders on your non-governmental committee. [Industry - importer/distributor]
D2.1.1 Please identify the types of stakeholders on your non-governmental committee. [Industry - retailer]
D2.1.1 Please identify the types of stakeholders on your non-governmental committee. [Industry - recycling/waste management]
D2.1.1 Please identify the types of stakeholders on your non-governmental committee. [Industry - other]

SAICM/OEWG.3/INF/4
95
D2.1.1 Please identify the types of stakeholders on your non-governmental committee. [Other (please describe below)]
D2.1.1 Please identify the types of stakeholders on your non-governmental committee. [Not applicable (please explain below)]
D2.1.1 Please identify the types of stakeholders on your non-governmental committee. [Uncertain]
D2.1.2 (a) Please identify the types of stakeholders included on your multi-stakeholder committee. [Academia]
D2.1.2 (a) Please identify the types of stakeholders included on your multi-stakeholder committee. [Civil Society]
D2.1.2 (a) Please identify the types of stakeholders included on your multi-stakeholder committee. [Government]
D2.1.2 (a) Please identify the types of stakeholders included on your multi-stakeholder committee. [Industry]
D2.1.2 (a) Please identify the types of stakeholders included on your multi-stakeholder committee. [Intergovernmental organization]
D2.1.2 (a) Please identify the types of stakeholders included on your multi-stakeholder committee. [Other]
D2.1.2 (b) Please identify the interests represented on your multi-stakeholder committee. [Agriculture]
D2.1.2 (b) Please identify the interests represented on your multi-stakeholder committee. [Cultural group]
D2.1.2 (b) Please identify the interests represented on your multi-stakeholder committee. [Environment]
D2.1.2 (b) Please identify the interests represented on your multi-stakeholder committee. [Health]
D2.1.2 (b) Please identify the interests represented on your multi-stakeholder committee. [Industry]
D2.1.2 (b) Please identify the interests represented on your multi-stakeholder committee. [Labour]
D2.1.2 (b) Please identify the interests represented on your multi-stakeholder committee. [Human rights/justice]
D2.1.2 (b) Please identify the interests represented on your multi-stakeholder committee. [Other (please describe below)]
D2.1.2 (b) Please identify the interests represented on your multi-stakeholder committee. [Not applicable (please explain below)]
D2.1.2 (b) Please identify the interests represented on your multi-stakeholder committee. [Not known]
Please briefly indicate which "Others" are represented on your committee.
D2.1.3 Please briefly describe your "Other" committee.
Please briefly provide any additional information you wish to share.
D2.2 In 2012, the International Conference on Chemicals Management adopted a strategy for strengthening the engagement of the health sector in chemicals management.  Please briefly describe in the space that follows any activities undertaken by your government or organization over the 2014-2016 period to support implementation of this strategy.Â
INDICATOR 12
D3: Implementation of key international chemicals agreements
D3.1 Were any significant changes made to your country's or organization's status and/or implementation with regard to the following international or regional chemicals instruments over the 2014 to 2016 period  (e.g. through the enacting of legislation, programme implementation, or through relevant policies)?  Acronyms FAO - Food and Agriculture Organization ILO - International Labour Organization  IMO - International Maritime Organization OECD - Organisation

SAICM/OEWG.3/INF/4
96
for Economic Co-operation and Development OPCW - Organisation for the Prohibition of Chemical Weapons UNECE - United Nations Economic Commission for Europe UNEP - United Nations Environment programme
[Aarhus Convention on Access to Information, Public Participation in Decision-making and Access to Justice in Environmental Matters (UNECE, 1998)]
[Basel Convention on the Control of Transboundary Movements of Hazardous Wastes and their Disposal (UNEP, 1989)]
[Convention on the prohibition of the development, production, stockpiling and use of chemical weapons and their destruction (OPCW, 1992)]
[Geneva Convention on Long-range Transboundary Air Pollution (UNECE, 1979)]
[Minamata Convention on Mercury (UNEP, not yet in force)]
[Montreal Protocol on Substances that Deplete the Ozone Layer (1987) under the Vienna Convention on the Protection of the Ozone Layer (UNEP, 1985)]
[ILO Convention 13: Use of White Lead in Painting (ILO, 1921)]
[ILO Convention 136: Protection Against Hazards of Poisoning Arising from Benzene (ILO, 1971)]
[ILO Convention 139: Prevention and Control of Occupational Hazards caused by Carcinogenic Substances and Agents (ILO, 1974)]
[ILO Convention 148: Protection of Workers against Occupational Hazards in the Working Environment due to Air Pollution, Noise and Vibration (ILO, 1977)]
[ILO Convention 162: Safety in the Use of Asbestos (ILO, 1986)]
[ILO Convention 170: Safety in the Use of Chemicals at Work (ILO, 1990)]
[ILO Convention 174: Prevention of Major Industrial Accidents (ILO, 1993)]
[IMO Convention for the Prevention of Pollution from Ships (IMO, 1973,1978)]
[IMO Convention on Oil Pollution Preparedness, Response and Cooperation (IMO, 1990)]
[IMO Protocol on Preparedness, Response and Cooperation to Pollution Incidents by Hazardous and Noxious Substances (IMO, 2000)]
[IMO Convention on the Control of Harmful Anti-fouling Systems on Ships (IMO, 2001)]
[OECD legal instruments pertaining to chemicals safety]
[Protocol on Pollutant Release and Transfer Registers (2003) under the Aarhus Convention]
[Rotterdam Convention on the Prior informed consent procedure for certain hazardous chemicals and pesticides in international trade (UNEP and FAO, 1998)]
[Stockholm Convention on Persistent Organic Pollutants (UNEP, 2001)]
[Other (please describe below)]
[Not known]
[Not applicable]
D3.1.1 Please briefly describe any changes identified in question D3.1 and briefly describe the outcome with regards to implementation of the instrument(s).Â
D3.2 Please briefly provide any additional information on how your government or organization is engaged in implementing or supporting key international agreements relevant for chemicals and waste.Â
Governance - General
4.4.1 Please briefly provide any additional information you would like to share on your government's or organization's activities relevant to the Governance indicators.Â

SAICM/OEWG.3/INF/4
97
Section E: OBJECTIVE D CAPACITY BUILDING AND TECHNICAL COOPERATION
Self-identification The relevance of many of the indicators for this objective depends on whether a country or organization is primarily a donor or a recipient of capacity building assistance. Â Therefore, the questions that will be asked in this part are based on your self-identification as either a donor or recipient. Â If you prefer to have the opportunity to answer all the questions, simply select "both".Â
INIDCATOR 13
E1: Financial and in-kind resources to assist capacity-building and technical cooperation (Donors only)
E1.1D Please indicate whether your government or organization provided financial or in-kind assistance over the 2014 to 2016 period to improve capacity for the sound management of chemicals in developing countries or countries in transition?  If applicable and possible, please also indicate how this compares to assistance provided in the last reporting period (2011 to 2013).Â
[Financial]
[In-kind]
[Other]
[None]
E1.1.1D If possible and applicable, please indicate which government department(s) provided the financial or in-kind assistance identified in question E1.1.
[Agriculture]
E1.1.1D If possible and applicable, please indicate which government department(s) provided the financial or in-kind assistance identified in question E1.1. [Environment]
E1.1.1D If possible and applicable, please indicate which government department(s) provided the financial or in-kind assistance identified in question E1.1. [Foreign Affairs]
E1.1.1D If possible and applicable, please indicate which government department(s) provided the financial or in-kind assistance identified in question E1.1. [Health]
E1.1.1D If possible and applicable, please indicate which government department(s) provided the financial or in-kind assistance identified in question E1.1. [Industry]
E1.1.1D If possible and applicable, please indicate which government department(s) provided the financial or in-kind assistance identified in question E1.1. [Labour]
E1.1.1D If possible and applicable, please indicate which government department(s) provided the financial or in-kind assistance identified in question E1.1. [Natural Resources]
E1.1.1D If possible and applicable, please indicate which government department(s) provided the financial or in-kind assistance identified in question E1.1. [Transportation]
E1.1.1D If possible and applicable, please indicate which government department(s) provided the financial or in-kind assistance identified in question E1.1. [Other]
E1.1.1D If possible and applicable, please indicate which government department(s) provided the financial or in-kind assistance identified in question E1.1. [Not known]
E1.1.1D If possible and applicable, please indicate which government department(s) provided the financial or in-kind assistance identified in question E1.1. [Not applicable]
Please briefly provide any additional information you wish to share about assistance provided by your country or organization.Â

SAICM/OEWG.3/INF/4
98
INDICATOR 14
E2: Identification and prioritization of capacity-building needs (Recipients only)
E2.1R Which of the following types of plans, relevant for identifying capacity building needs for chemicals management, has your government or organization completed?
[National Chemicals Profile]
[National SAICM Implementation Plan]
[National Implementation Plan for Stockholm Convention]
[National Environmental Health Action Plan]
[Other (please specify)]
E2.2R If possible, please select the priority needs you have identified from the list below (based on the 11 basic elements from the Orientation and Guidance Document):
[Legal frameworks that address the life cycle of chemicals and waste]
[Relevant enforcement and compliance mechanisms]
[Implementation of chemicals and waste-related multilateral environmental agreements, as well as health, labour and other relevant conventions and voluntary mechanisms]
[Strong institutional frameworks and coordination mechanisms among relevant stakeholders]
[Collection and systems for the transparent sharing of relevant data and information among all relevant stakeholders using a life cycle approach, such as the implementation of the Globally Harmonized System of Classification and Labelling of Chemicals]
[Industry participation and defined responsibility across the life cycle, including cost recovery policies and systems as well as the incorporation of sound chemicals management into corporate policies and practices]
[Inclusion of the sound management of chemicals and waste in national health, labour, social, environment and economic budgeting processes and development plans]
[Chemicals risk assessment and risk reduction through the use of best practices]
[Strengthened capacity to deal with chemicals accidents, including institutional-strengthening for poison centres]
[Monitoring and assessing the impacts of chemicals on health and the environment]
[Development and promotion of environmentally sound and safer alternatives]
): [Other (please describe below)]
[Not applicable (please explain below)]
Please briefly provide any additional information or comments you wish to share on the identification and prioritization of capacity-building needs.
INIDCATOR 15
E3: Development assistance programmes that include sound chemicals management

SAICM/OEWG.3/INF/4
99
E3.1DÂ Did your country include chemicals management as a priority in national development assistance funding programmes over the 2014 to 2016 period?Â
If possible, please provide the name of the programme and a web link for more information.Â
E3.1RÂ Did your country have a national development plan covering the years between 2014 and 2016 and addressing priority needs for the sound management of chemicals? *Â
Please provide the name(s) of the relevant development plan(s) in the space below and provide a web link if possible.
Please briefly provide any additional information or comments you wish to share relevant to the inclusion of chemicals management in development assistance programmes.Â
INIDCATOR 16
E4: Other sources of funding for capacity-building (Recipients only)
E4.1 Have any of the following sources provided financial support for capacity-building activities for the sound management of chemicals in your country or organization between 2014 and 2016? Note: The secretariat will use its own records to provide comparative data on funding under the SAICM Quick Start Programme (QSP) so there is no need to identify this source of funding.Â
[Global Environment Facility (GEF)]
[Multilateral Fund for the Montreal Protocol]
[United Nations or United Nations Agency (e.g., ILO, FAO, UNDP, UNEP, UNIDO, UNITAR, WHO)]
[Regional Cooperation Organization]
[Regional Development Bank]
[The World Bank]
[Multi-lateral Environment Convention Trust Fund]
[Bilateral funding agreement with another country]
[Foundation or charitable body]
[Private sector or company]
[Other type of funding source not listed above (please specify)]
[Not known]
[None]
[Not applicable]
Please briefly provide any additional details below, including the name of the organization or agency that provided the funding.
INIDCATOR 18
E5: Regional cooperation on sound chemicals managementÂ
E5.1 Please indicate whether your government or organization has been engaged in regional cooperative work in any of the following subject areas over the 2014 to 2016 period?  [
Risk reduction]

SAICM/OEWG.3/INF/4
100
[Knowledge and information]
[Governance]
[Capacity-building and technical cooperation]
[Illegal international traffic]
[Other (please specify below)]
Please briefly provide any additional information or comments you wish to share on regional cooperation on sound chemicals management.
Capacity-building and technical cooperation - General
Please briefly provide any additional information or comments you would like to share on your government's or organization's activities relevant to the capacity-building and technical cooperation indicators.
F: OBJECTIVE E ILLEGAL INTERNATIONAL TRAFFIC
INDICATOR 19
F1: Illegal traffic in toxic, hazardous and severely restricted chemicals
F1.1. Which of the following activities in support of preventing illegal international traffic of hazardous chemicals are in place in your country or organization?Â
[Implementation of national legislation preventing illegal traffic of hazardous chemicals]
[Communication of information on movements of hazardous chemicals out of the country to neighbouring countries]
[Public information and awareness on levels and cases of illegal trade and remedial actions undertaken]
[Specific training of border control agents]
[Cooperation and/legal agreements with neighbouring countries]
[Monitoring of international traffic in hazardous chemicals]
[Other measures not stated above (please specify)]
Please briefly provide any additional information you wish to share.
INDICATOR 20
F2: Illegal international traffic of hazardous wasteÂ
F2.1 Which of the following activities in support of preventing illegal international trade in hazardous waste are in place in your country or organization?
[Implementation of national legislation preventing illegal traffic of hazardous waste]
[Communication of information on movements of hazardous waste out of the country to neighbouring countries]
F2.1 Which of the following activities in support of preventing illegal international trade in hazardous waste are in place in your country or organization? [Public information and awareness on levels and cases of illegal trade remedial actions undertaken]
F2.1 Which of the following activities in support of preventing illegal international trade in hazardous waste are in place in your country or organization? [Specific training of border control agents]
F2.1 Which of the following activities in support of preventing illegal international trade in hazardous waste are in place in your country or organization? [Cooperation and/legal agreements with neighbouring countries]
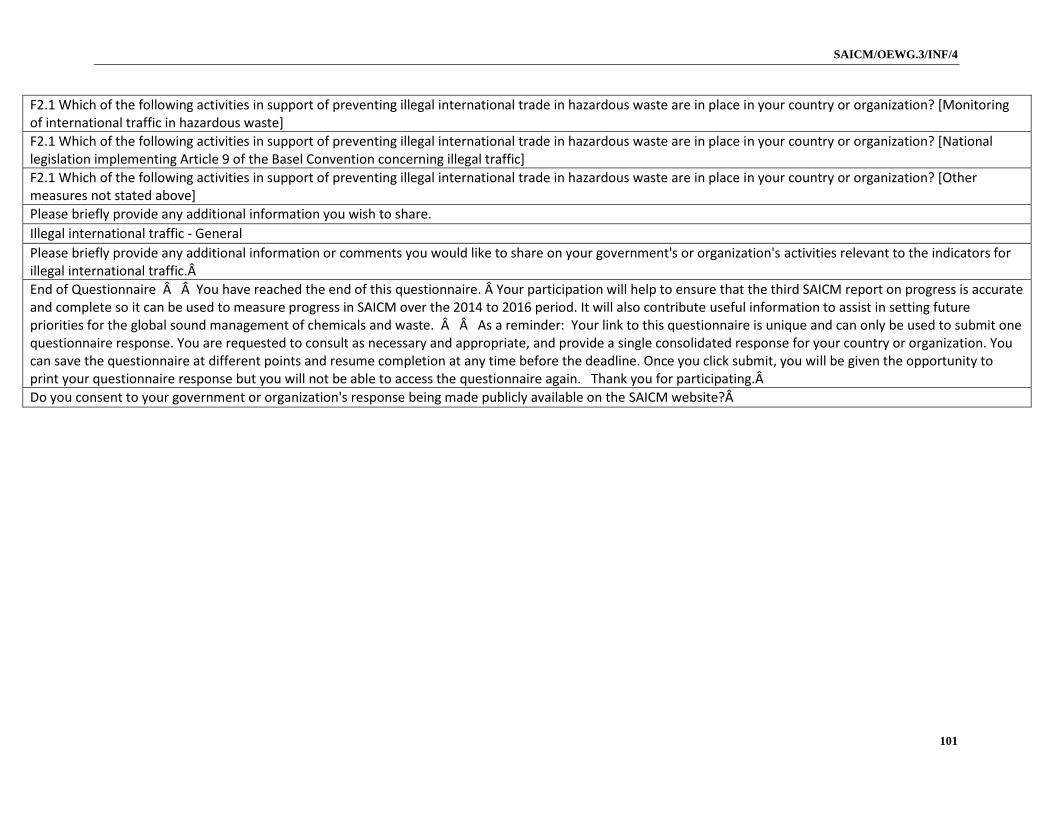
SAICM/OEWG.3/INF/4
101
F2.1 Which of the following activities in support of preventing illegal international trade in hazardous waste are in place in your country or organization? [Monitoring of international traffic in hazardous waste]
F2.1 Which of the following activities in support of preventing illegal international trade in hazardous waste are in place in your country or organization? [National legislation implementing Article 9 of the Basel Convention concerning illegal traffic]
F2.1 Which of the following activities in support of preventing illegal international trade in hazardous waste are in place in your country or organization? [Other measures not stated above]
Please briefly provide any additional information you wish to share.
Illegal international traffic - General
Please briefly provide any additional information or comments you would like to share on your government's or organization's activities relevant to the indicators for illegal international traffic.Â
End of Questionnaire   You have reached the end of this questionnaire.  Your participation will help to ensure that the third SAICM report on progress is accurate and complete so it can be used to measure progress in SAICM over the 2014 to 2016 period. It will also contribute useful information to assist in setting future priorities for the global sound management of chemicals and waste.   As a reminder: Your link to this questionnaire is unique and can only be used to submit one questionnaire response. You are requested to consult as necessary and appropriate, and provide a single consolidated response for your country or organization. You can save the questionnaire at different points and resume completion at any time before the deadline. Once you click submit, you will be given the opportunity to print your questionnaire response but you will not be able to access the questionnaire again. Thank you for participating.Â
Do you consent to your government or organization's response being made publicly available on the SAICM website?Â