Progress against cancer in the Netherlands since the late 1980s: An epidemiological evaluation
9
Progress against cancer in the Netherlands since the late 1980s: An epidemiological evaluation Henrike E. Karim-Kos 1 , Lambertus A.L.M. Kiemeney 2,3 , Marieke W.J. Louwman 4 , Jan Willem W. Coebergh 1,4 and Esther de Vries 1,4 1 Department of Public Health, Erasmus MC University Medical Center, Rotterdam, The Netherlands 2 Department of Epidemiology, Biostatistics and HTA, Radboud University Nijmegen Medical Center, Nijmegen, The Netherlands 3 Comprehensive Cancer Center the Netherlands, Nijmegen, The Netherlands 4 Department of Research, Eindhoven Cancer Registry, Comprehensive Cancer Center South, Eindhoven, The Netherlands Progress against cancer through prevention and treatment is often measured by survival statistics only instead of analyzing trends in incidence, survival and mortality simultaneously because of interactive influences. This study combines these parameters of major cancers to provide an overview of the progress achieved in the Netherlands since 1989 and to establish in which areas action is needed. The population-based Netherlands Cancer Registry and Statistics Netherlands provided incidence, 5-year relative survival and mortality of 23 major cancer types. Incidence, survival and mortality changes were calculated as the estimated annual percentage change. Optimal progress was defined as decreasing incidence and/or improving survival accompanied by declining mortality, and deterioration as increasing incidence and/or deteriorating survival accompanied by increasing mortality rates. Optimal progress was observed in 12 of 19 cancer types among males: laryngeal, lung, stomach, gallbladder, colon, rectal, bladder, prostate and thyroid cancer, leukemia, Hodgkin and non-Hodgkin lymphoma. Among females, optimal progress was observed in 12 of 21 cancers: stomach, gallbladder, colon, rectal, breast, cervical, uterus, ovarian and thyroid cancer, leukemia, Hodgkin and non-Hodgkin lymphoma. Deterioration occurred in three cancer types among males: skin melanoma, esophageal and kidney cancer, and among females six cancer types: skin melanoma, oral cavity, pharyngeal, esophageal, pancreatic and lung cancer. Our conceptual framework limits misinterpretations from separate trends and generates a more balanced discussion on progress. A question frequently asked by professionals, policymakers and the public is whether or not we are making progress in com- bating cancer. Are there improvements or is there even deterio- ration? It seems that the war on cancer is far from won, 1,2 de- spite the investments since President R. Nixon declared the ‘‘war on cancer’’ in 1971 in the United States and since the start of the ‘‘Europe against Cancer’’ program in 1986. 3 Cancer survival statistics are often used to measure pro- gress against cancer achieved by early detection/screening and therapy, whereby comparisons between countries and regions receive special attention. 4–6 However, improved survival from cancer at the population level does not always imply progress in absolute terms of less suffering and fewer deaths due to cancer. This ‘‘artificial’’ progress is often due to early detection and screening practices that result in length bias (increased survival time by more frequent diagnoses of indolent cancers) or lead-time bias (earlier diagnosis causing an increased survival time without postponing time of death) or incomplete incidence or follow-up data. 7–9 Many parameters may indicate progress, such as less false-positive and false-negative screening exams, more effec- tive therapies with fewer associated side effects, better quality of life and improved organization of palliative care. All of these are difficult to measure and monitor through the stand- ard surveillance instruments, mainly cancer registries. How- ever, several of these parameters will influence incidence, sur- vival and/or mortality of cancer that can be monitored over time. We chose to focus on these three measures of cancer burden (i.e., incidence, survival and mortality) combined to achieve a more objective assessment of progress against can- cer, while avoiding overinterpreting findings from one of these measures only. 7,9,10 Based on these three measures, two key situations of progress can be distinguished: (i) a decreas- ing incidence as a result of preceding lower risk factor preva- lence or screening of premalignant lesions (e.g., of cervical and colorectal cancer), and (ii) an improving survival as a result of changes in incidence (i.e., shifts in cancer subsite/ Key words: incidence, mortality, neoplasm, Netherlands, progress, survival, trends Additional Supporting Information may be found in the online version of this article. Grant sponsor: Dutch Cancer Society; Grant number: EMCR 2006- 3489 DOI: 10.1002/ijc.26315 History: Received 18 Apr 2011; Accepted 28 Jun 2011; Online 25 Jul 2011 Correspondence to: Henrike E. Karim-Kos, Erasmus MC, Department of Public Health, P.O. Box 2040, 3000 CA Rotterdam, The Netherlands, Tel: þ31-7043730, Fax: þ31-10-7038475, E-mail: [email protected] Epidemiology Int. J. Cancer: 130, 2981–2989 (2012) V C 2011 UICC International Journal of Cancer IJC
-
Upload
independent -
Category
Documents
-
view
1 -
download
0
Transcript of Progress against cancer in the Netherlands since the late 1980s: An epidemiological evaluation
Progress against cancer in the Netherlands since the late 1980s:An epidemiological evaluation
Henrike E. Karim-Kos1, Lambertus A.L.M. Kiemeney2,3, Marieke W.J. Louwman4, Jan Willem W. Coebergh1,4
and Esther de Vries1,4
1 Department of Public Health, Erasmus MC University Medical Center, Rotterdam, The Netherlands2 Department of Epidemiology, Biostatistics and HTA, Radboud University Nijmegen Medical Center, Nijmegen, The Netherlands3 Comprehensive Cancer Center the Netherlands, Nijmegen, The Netherlands4 Department of Research, Eindhoven Cancer Registry, Comprehensive Cancer Center South, Eindhoven, The Netherlands
Progress against cancer through prevention and treatment is often measured by survival statistics only instead of analyzing
trends in incidence, survival and mortality simultaneously because of interactive influences. This study combines these
parameters of major cancers to provide an overview of the progress achieved in the Netherlands since 1989 and to establish
in which areas action is needed. The population-based Netherlands Cancer Registry and Statistics Netherlands provided
incidence, 5-year relative survival and mortality of 23 major cancer types. Incidence, survival and mortality changes were
calculated as the estimated annual percentage change. Optimal progress was defined as decreasing incidence and/or
improving survival accompanied by declining mortality, and deterioration as increasing incidence and/or deteriorating survival
accompanied by increasing mortality rates. Optimal progress was observed in 12 of 19 cancer types among males: laryngeal,
lung, stomach, gallbladder, colon, rectal, bladder, prostate and thyroid cancer, leukemia, Hodgkin and non-Hodgkin
lymphoma. Among females, optimal progress was observed in 12 of 21 cancers: stomach, gallbladder, colon, rectal, breast,
cervical, uterus, ovarian and thyroid cancer, leukemia, Hodgkin and non-Hodgkin lymphoma. Deterioration occurred in three
cancer types among males: skin melanoma, esophageal and kidney cancer, and among females six cancer types: skin
melanoma, oral cavity, pharyngeal, esophageal, pancreatic and lung cancer. Our conceptual framework limits
misinterpretations from separate trends and generates a more balanced discussion on progress.
A question frequently asked by professionals, policymakers andthe public is whether or not we are making progress in com-bating cancer. Are there improvements or is there even deterio-ration? It seems that the war on cancer is far from won,1,2 de-spite the investments since President R. Nixon declared the‘‘war on cancer’’ in 1971 in the United States and since thestart of the ‘‘Europe against Cancer’’ program in 1986.3
Cancer survival statistics are often used to measure pro-gress against cancer achieved by early detection/screeningand therapy, whereby comparisons between countries andregions receive special attention.4–6 However, improved
survival from cancer at the population level does not alwaysimply progress in absolute terms of less suffering and fewerdeaths due to cancer. This ‘‘artificial’’ progress is often due toearly detection and screening practices that result in lengthbias (increased survival time by more frequent diagnoses ofindolent cancers) or lead-time bias (earlier diagnosis causingan increased survival time without postponing time of death)or incomplete incidence or follow-up data.7–9
Many parameters may indicate progress, such as lessfalse-positive and false-negative screening exams, more effec-tive therapies with fewer associated side effects, better qualityof life and improved organization of palliative care. All ofthese are difficult to measure and monitor through the stand-ard surveillance instruments, mainly cancer registries. How-ever, several of these parameters will influence incidence, sur-vival and/or mortality of cancer that can be monitored overtime. We chose to focus on these three measures of cancerburden (i.e., incidence, survival and mortality) combined toachieve a more objective assessment of progress against can-cer, while avoiding overinterpreting findings from one ofthese measures only.7,9,10 Based on these three measures, twokey situations of progress can be distinguished: (i) a decreas-ing incidence as a result of preceding lower risk factor preva-lence or screening of premalignant lesions (e.g., of cervicaland colorectal cancer), and (ii) an improving survival as aresult of changes in incidence (i.e., shifts in cancer subsite/
Key words: incidence, mortality, neoplasm, Netherlands, progress,
survival, trends
Additional Supporting Information may be found in the online
version of this article.
Grant sponsor: Dutch Cancer Society; Grant number: EMCR 2006-
3489
DOI: 10.1002/ijc.26315
History: Received 18 Apr 2011; Accepted 28 Jun 2011; Online 25 Jul
2011
Correspondence to: Henrike E. Karim-Kos, Erasmus MC,
Department of Public Health, P.O. Box 2040, 3000 CA Rotterdam,
The Netherlands, Tel: þ31-7043730, Fax: þ31-10-7038475, E-mail:
Epidemiology
Int. J. Cancer: 130, 2981–2989 (2012) VC 2011 UICC
International Journal of Cancer
IJC
morphology distribution caused by changes in risk factorprevalence, and more favorable stage distribution due to ear-lier diagnosis and improved detection) and changes in ther-apy regimens. Both changes in incidence and survival had toultimately affect mortality. Optimal progress should thus bereflected in a decreasing incidence and/or improving survivalaccompanied by decreasing mortality.
On the contrary, increasing incidence due to precedingincreased risk factor prevalence, and/or a worsening survivalas a result of unfavorable changes in incidence (i.e., shiftstoward certain subtypes or morphologies with a poor progno-sis) or deterioration of (access to) care leading to worseningsurvival will result in increasing mortality.11
Recently, American, European and worldwide data on inci-dence, mortality and survival were published,12–14 but none ofthese studies combined these three measures to assess progress.The present study shows the trends in incidence, survival andmortality to assess to what extent progress against cancer hasbeen made in the Netherlands since 1989 and to establishwhere action needs to be taken. This approach can be used asa framework by others using routinely collected cancer registrydata for (inter)national comparisons over time.
Material and MethodsData on the following 23 cancer types were collected: oralcavity (ICD-10 code: C01–06), pharynx (C09–14), larynx(C32), esophagus (C15), stomach (C16), colon (C18), rectum(C19–20), gallbladder (C23), pancreas (C25), lung (C33–34),skin melanoma (C43), female breast (C50), cervix (C53), cor-pus uteri (C54–55), ovary (C56), prostate (C61), testis (C62),bladder (C65, invasive only), kidney (C64–66, C68), thyroid(C73), Hodgkin lymphoma (C81), non-Hodgkin lymphoma(C82–88) and leukemia (C91–95).
Incidence data from 1989 to 2009 were obtained from thepopulation-based Netherlands Cancer Registry (NCR), whichhas complete national coverage and registers about 90,000cases annually.15 Mortality data from 1989 to 2009 werederived from Statistics Netherlands.16 Information on thevital status of diagnosed cancer patients (necessary to calcu-late survival time) was initially obtained from municipalregistries and from 1995 onward from the nationwide data-base of all municipal population registries. These registriesprovide virtually complete coverage of all deceased Dutchcitizens. Follow-up was complete until 1 January 2010.
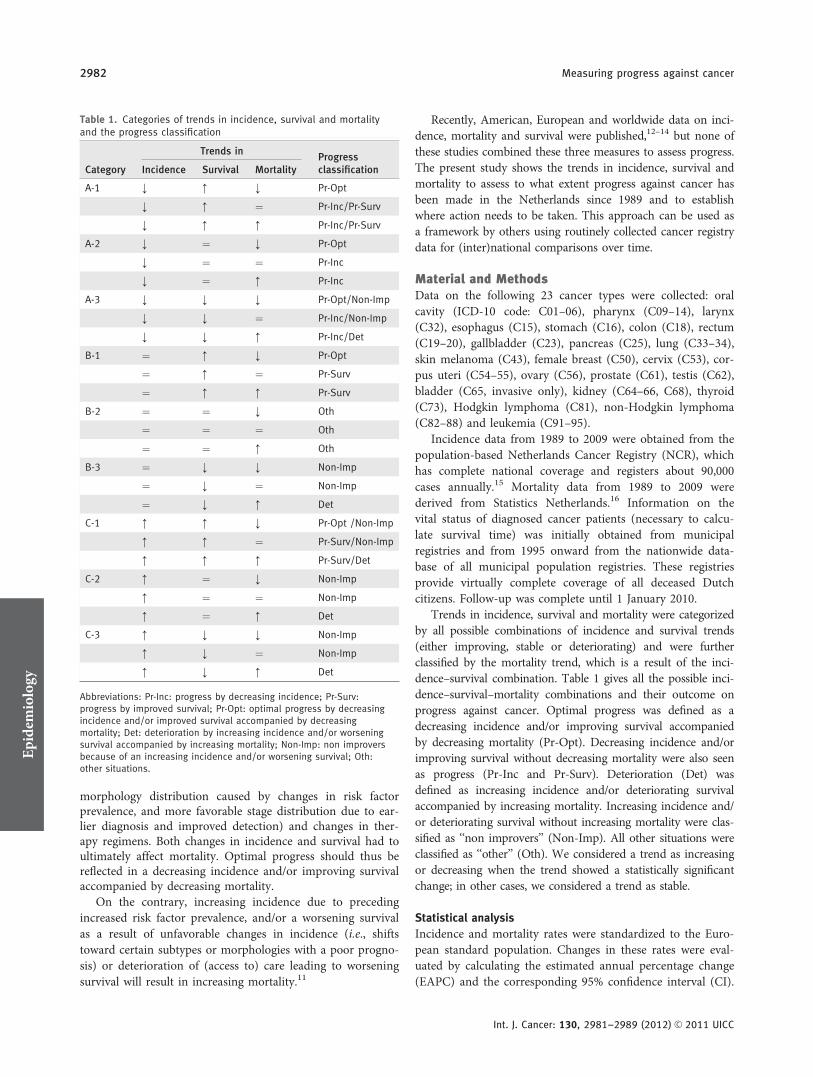
Trends in incidence, survival and mortality were categorizedby all possible combinations of incidence and survival trends(either improving, stable or deteriorating) and were furtherclassified by the mortality trend, which is a result of the inci-dence–survival combination. Table 1 gives all the possible inci-dence–survival–mortality combinations and their outcome onprogress against cancer. Optimal progress was defined as adecreasing incidence and/or improving survival accompaniedby decreasing mortality (Pr-Opt). Decreasing incidence and/orimproving survival without decreasing mortality were also seenas progress (Pr-Inc and Pr-Surv). Deterioration (Det) wasdefined as increasing incidence and/or deteriorating survivalaccompanied by increasing mortality. Increasing incidence and/or deteriorating survival without increasing mortality were clas-sified as ‘‘non improvers’’ (Non-Imp). All other situations wereclassified as ‘‘other’’ (Oth). We considered a trend as increasingor decreasing when the trend showed a statistically significantchange; in other cases, we considered a trend as stable.
Statistical analysis
Incidence and mortality rates were standardized to the Euro-pean standard population. Changes in these rates were eval-uated by calculating the estimated annual percentage change(EAPC) and the corresponding 95% confidence interval (CI).
Table 1. Categories of trends in incidence, survival and mortalityand the progress classification
Category
Trends inProgressclassificationIncidence Survival Mortality
A-1 ; : ; Pr-Opt
; : ¼ Pr-Inc/Pr-Surv
; : : Pr-Inc/Pr-Surv
A-2 ; ¼ ; Pr-Opt
; ¼ ¼ Pr-Inc
; ¼ : Pr-Inc
A-3 ; ; ; Pr-Opt/Non-Imp
; ; ¼ Pr-Inc/Non-Imp
; ; : Pr-Inc/Det
B-1 ¼ : ; Pr-Opt
¼ : ¼ Pr-Surv
¼ : : Pr-Surv
B-2 ¼ ¼ ; Oth
¼ ¼ ¼ Oth
¼ ¼ : Oth
B-3 ¼ ; ; Non-Imp
¼ ; ¼ Non-Imp
¼ ; : Det
C-1 : : ; Pr-Opt /Non-Imp
: : ¼ Pr-Surv/Non-Imp
: : : Pr-Surv/Det
C-2 : ¼ ; Non-Imp
: ¼ ¼ Non-Imp
: ¼ : Det
C-3 : ; ; Non-Imp
: ; ¼ Non-Imp
: ; : Det
Abbreviations: Pr-Inc: progress by decreasing incidence; Pr-Surv:progress by improved survival; Pr-Opt: optimal progress by decreasingincidence and/or improved survival accompanied by decreasingmortality; Det: deterioration by increasing incidence and/or worseningsurvival accompanied by increasing mortality; Non-Imp: non improversbecause of an increasing incidence and/or worsening survival; Oth:other situations.
Epidemiology
2982 Measuring progress against cancer
Int. J. Cancer: 130, 2981–2989 (2012) VC 2011 UICC
A regression line was fitted to the natural logarithm of therates, using the calendar year as regressor variable [i.e., y ¼mx þ b, where y ¼ ln(rate) and x ¼ calendar year, thenEAPC ¼ 100 � (em � 1)].
Five-year relative survival was used to estimate disease-specific survival. It reflects survival of cancer patients,adjusted for competing causes of death in the general popula-tion with the same age and gender distribution. Traditionalcohort-based relative survival analysis was used for the period1989–1991. Since follow-up was available until January 2010,period-based relative survival analysis was used for the mostrecent period 2007–2009, which gives the most up-to-dateestimates for this period.17 Survival trends were quantified asthe mean annual percentage change within 1989–2009 esti-mated by a linear regression model. A positive value of themean annual change reflects an upward trend in survival(i.e., improving) and a negative value implies a negative trend(i.e., deterioration). p-Values are two sided, and p < 0.05 wasconsidered statistically significant. All statistical analyses wereperformed using SAS (version 9.2).
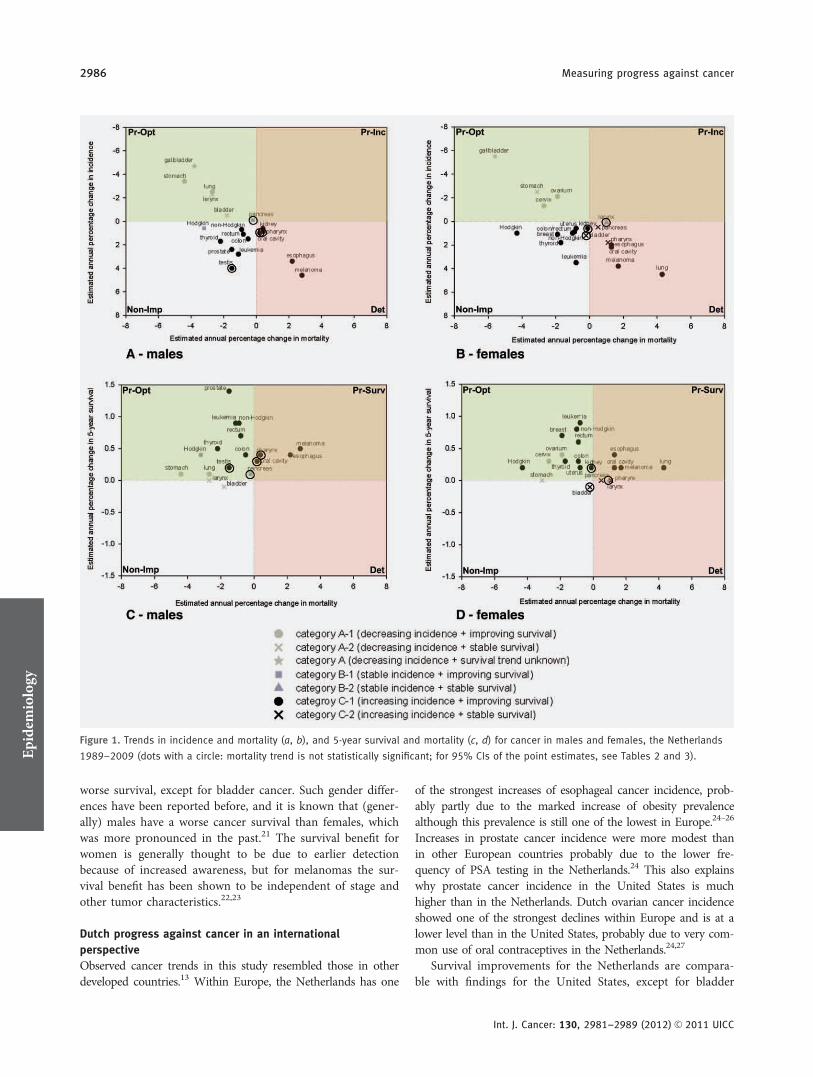
ResultsTables 2 and 3 present data on tumor-specific incidence, sur-vival and mortality for Dutch males and females separately.The tumor-specific relationship between incidence–mortalityand survival–mortality is shown in Figure 1. The most im-portant results are described below.
Progress against cancer among males
Optimal progress (Pr-Opt) was observed for 12 out of 19studied male cancers: laryngeal, stomach, colon, rectal, gall-bladder, lung, prostate, bladder and thyroid cancer, leukemia,Hodgkin and non-Hodgkin lymphoma. For oral cavity, pha-ryngeal, esophageal, pancreatic, testicular and kidney cancerand skin melanoma, progress was made through significantsurvival improvement (Pr-Surv) only. Progress made by sig-nificant decreasing incidence (Pr-Inc) only was not observedfor any studied male cancer.
Deterioration (Det) was seen for 3 out of 19 studied malecancers: esophageal and kidney cancer and skin melanoma.However, the mortality increases were smaller than the inci-dence increases probably because of the abovementioned sur-vival improvements. Oral cavity, pharyngeal, colon, rectal,prostate, testis and thyroid cancer, non-Hodgkin lymphomaand leukemia (9 out of 19 studied male cancers) were classi-fied as non improvers (Non-Imp) because of a significantlyincreasing incidence. None of the studied male cancersshowed a deteriorating survival trend.
Progress against cancer among females
Optimal progress (Pr-Opt) became manifest for 12 out of 21studied female cancers: stomach, colon, rectal, gallbladder,breast, uterus, cervical, ovarian and thyroid cancer, leukemia,Hodgkin and non-Hodgkin lymphoma. For skin melanoma,oral cavity, esophageal, lung and kidney cancer, progress was
made by significant survival improvement (Pr-Surv) only.Progress made by significant decreasing incidence (Pr-Inc)only was not observed for any studied female cancer. Stableincidence, survival and mortality trends were seen for laryn-geal cancer.
Deterioration (Det) was seen for 6 out of 21 studiedfemale cancers: skin melanoma, oral cavity, pharyngeal,esophageal, pancreatic and lung cancer. For skin melanoma,oral cavity and esophageal cancer, the mortality increaseswere smaller than the incidence increases probably becauseof the abovementioned survival improvements. Colon, rectal,breast, uterus, kidney, bladder and thyroid cancer, leukemia,Hodgkin and non-Hodgkin lymphoma (10 out of 21 studiedfemale cancers) were classified as non improvers (Non-Imp)because of a significantly increasing incidence. None of thestudied female cancers showed a deteriorating survival trend.
DiscussionA largely positive pattern of progress against cancer wasobserved for the Netherlands in the last 20 years. Out of the19 male and 21 female cancer types included in our study,optimal progress (Pr-Opt) was observed for 12 male andfemale cancers, and deterioration (Det) for three male andsix female cancers only. Marked incidence increases wereobserved for nine male and ten female cancers without beingaccompanied by increasing mortality rates. These cancers anddeteriorating cancers need our attention as well as cancerswith a poor prognosis for which 5-year survival remainedbelow 20% (e.g., cancers of the esophagus, stomach, gallblad-der, pancreas and lung).
Gender differences in progress against cancer
Out of the 17 studied cancers that occur in both sexes, allcancers showed progress (Pr-Opt or Pr-Surv) among males,while among women progress was seen for 13 of these can-cers. This gender difference in progress is due to oppositetrends in incidence of laryngeal, pancreatic and bladder can-cer and a lack of progress in terms of survival for pharyngealand pancreatic cancer among females. The opposite trends inincidence are most likely a result of opposing trends insmoking prevalence, as was already observed for lung cancer.While the smoking prevalence among adult males decreasedfrom 90% in the late 1950s to 30% in 2009, it increasedamong females until the 1970s (about 40%) and slowlydecreased to 26% in 2009.18 This gender difference in smok-ing trends combined with alcohol intake is probably also themain cause of gender differences in deterioration that wehave observed in this study: marked incidence and mortalityincreases were observed for cancers of the oral cavity, phar-ynx, pancreas and lung among females only.19,20
For pharyngeal cancer, males had a somewhat lower sur-vival than females in 1989–1991 (survival gap of 8%), indi-cating more opportunity for improvement among males.However, large survival gaps of about 10% remained for skinmelanoma, oral cavity and bladder cancer, where males had a
Epidemiology
Karim-Kos et al. 2983
Int. J. Cancer: 130, 2981–2989 (2012) VC 2011 UICC
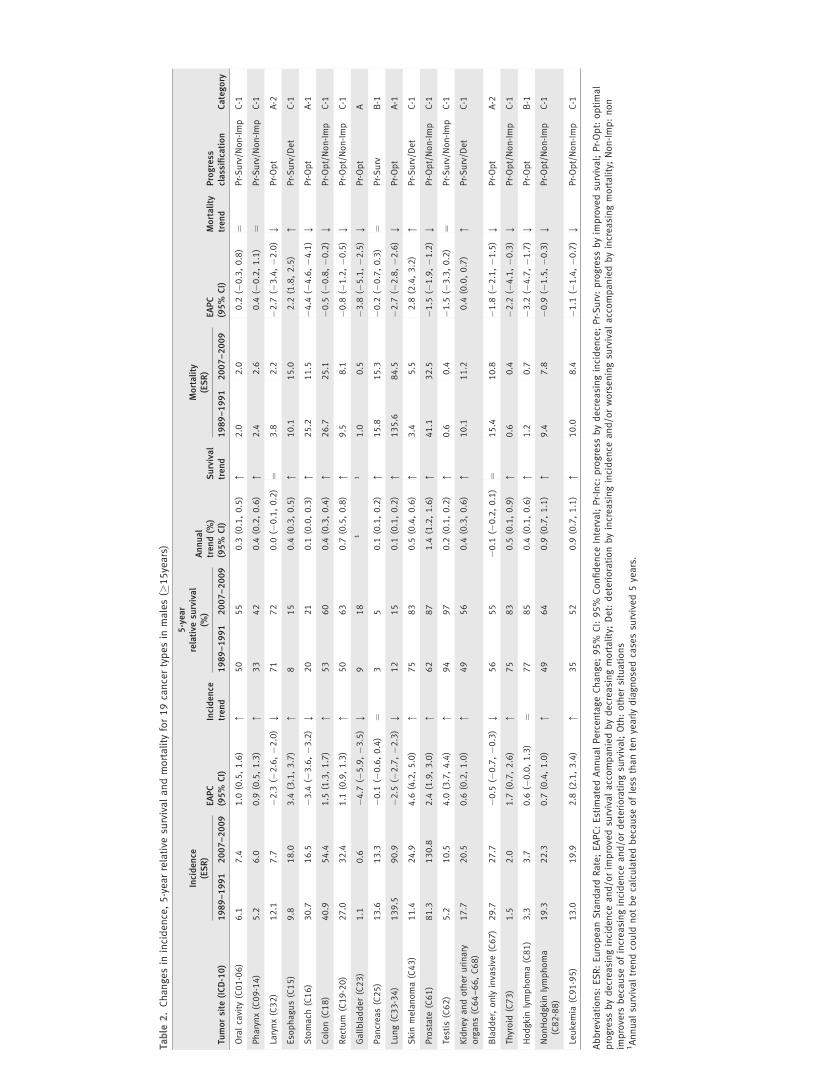
Table
2.Changesin
incidence,5-yearrelative
survivalandmortality
for19cancertypesin
males(�
15years)
Tumorsite
(ICD-10)
Incidence
(ESR)
EAPC
(95%
CI)
Incidence
trend
5-year
relative
survival
(%)
Annual
trend(%
)(95%
CI)
Survival
trend
Mortality
(ESR)
EAPC
(95%
CI)
Mortality
trend
Progress
classification
Category
1989–1991
2007–2009
1989–1991
2007–2009
1989–1991
2007–2009
Oralcavity
(C01-06)
6.1
7.4
1.0
(0.5,1.6)
:50
55
0.3
(0.1,0.5)
:2.0
2.0
0.2
(�0.3,0.8)
¼Pr-Surv/N
on-Imp
C-1
Pharynx(C09-14)
5.2
6.0
0.9
(0.5,1.3)
:33
42
0.4
(0.2,0.6)
:2.4
2.6
0.4
(�0.2,1.1)
¼Pr-Surv/N
on-Imp
C-1
Larynx(C32)
12.1
7.7
�2.3
(�2.6,�2
.0)
;71
72
0.0
(�0.1,0.2)
¼3.8
2.2
�2.7
(�3.4,�2
.0)
;Pr-Opt
A-2
Eso
phagus(C15)
9.8
18.0
3.4
(3.1,3.7)
:8
15
0.4
(0.3,0.5)
:10.1
15.0
2.2
(1.8,2.5)
:Pr-Surv/D
et
C-1
Stomach
(C16)
30.7
16.5
�3.4
(�3.6,�3
.2)
;20
21
0.1
(0.0,0.3)
:25.2
11.5
�4.4
(�4.6,�4
.1)
;Pr-Opt
A-1
Colon(C18)
40.9
54.4
1.5
(1.3,1.7)
:53
60
0.4
(0.3,0.4)
:26.7
25.1
�0.5
(�0.8,�0
.2)
;Pr-Opt/Non-Imp
C-1
Rectum
(C19-20)
27.0
32.4
1.1
(0.9,1.3)
:50
63
0.7
(0.5,0.8)
:9.5
8.1
�0.8
(�1.2,�0
.5)
;Pr-Opt/Non-Imp
C-1
Gallbladder(C23)
1.1
0.6
�4.7
(�5.9,�3
.5)
;9
18
11
1.0
0.5
�3.8
(�5.1,�2
.5)
;Pr-Opt
A
Pancreas(C25)
13.6
13.3
�0.1
(�0.6,0.4)
¼3
50.1
(0.1,0.2)
:15.8
15.3
�0.2
(�0.7,0.3)
¼Pr-Surv
B-1
Lung(C33-34)
139.5
90.9
�2.5
(�2.7,�2
.3)
;12
15
0.1
(0.1,0.2)
:135.6
84.5
�2.7
(�2.8,�2
.6)
;Pr-Opt
A-1
Skin
melanoma(C43)
11.4
24.9
4.6
(4.2,5.0)
:75
83
0.5
(0.4,0.6)
:3.4
5.5
2.8
(2.4,3.2)
:Pr-Surv/D
et
C-1
Prostate
(C61)
81.3
130.8
2.4
(1.9,3.0)
:62
87
1.4
(1.2,1.6)
:41.1
32.5
�1.5
(�1.9,�1
.2)
;Pr-Opt/Non-Imp
C-1
Testis
(C62)
5.2
10.5
4.0
(3.7,4.4)
:94
97
0.2
(0.1,0.2)
:0.6
0.4
�1.5
(�3.3,0.2)
¼Pr-Surv/N
on-Imp
C-1
Kidneyandotherurinary
organs(C64–66,C68)
17.7
20.5
0.6
(0.2,1.0)
:49
56
0.4
(0.3,0.6)
:10.1
11.2
0.4
(0.0,0.7)
:Pr-Surv/D
et
C-1
Bladder,only
invasive
(C67)
29.7
27.7
�0.5
(�0.7,�0
.3)
;56
55
�0.1
(�0.2,0.1)
¼15.4
10.8
�1.8
(�2.1,�1
.5)
;Pr-Opt
A-2
Thyroid
(C73)
1.5
2.0
1.7
(0.7,2.6)
:75
83
0.5
(0.1,0.9)
:0.6
0.4
�2.2
(�4.1,�0
.3)
;Pr-Opt/Non-Imp
C-1
Hodgkin
lymphoma(C81)
3.3
3.7
0.6
(�0.0,1.3)
¼77
85
0.4
(0.1,0.6)
:1.2
0.7
�3.2
(�4.7,�1
.7)
;Pr-Opt
B-1
NonHodgkin
lymphoma
(C82-88)
19.3
22.3
0.7
(0.4,1.0)
:49
64
0.9
(0.7,1.1)
:9.4
7.8
�0.9
(�1.5,�0
.3)
;Pr-Opt/Non-Imp
C-1
Leukemia
(C91-95)
13.0
19.9
2.8
(2.1,3.4)
:35
52
0.9
(0.7,1.1)
:10.0
8.4
�1.1
(�1.4,�0
.7)
;Pr-Opt/Non-Imp
C-1
Abbreviations:
ESR:EuropeanStandard
Rate;EAPC:Estim
atedAnnualPercentageChange;95%
CI:95%
Confidence
Interval;Pr-Inc:
progress
bydecreasingincidence;Pr-Surv:progress
byim
provedsu
rvival;Pr-Opt:optimal
progress
bydecreasingincidence
and/orim
provedsu
rvivalaccompaniedbydecreasingmortality;Det:deteriorationbyincreasingincidence
and/orworseningsu
rvivalaccompaniedbyincreasingmortality;Non-Imp:non
improvers
because
ofincreasingincidence
and/ordeterioratingsu
rvival;Oth:othersituations
1Annualsu
rvivaltrendcould
notbecalculatedbecause
ofless
thantenyearlydiagnosedcasessu
rvived5years.
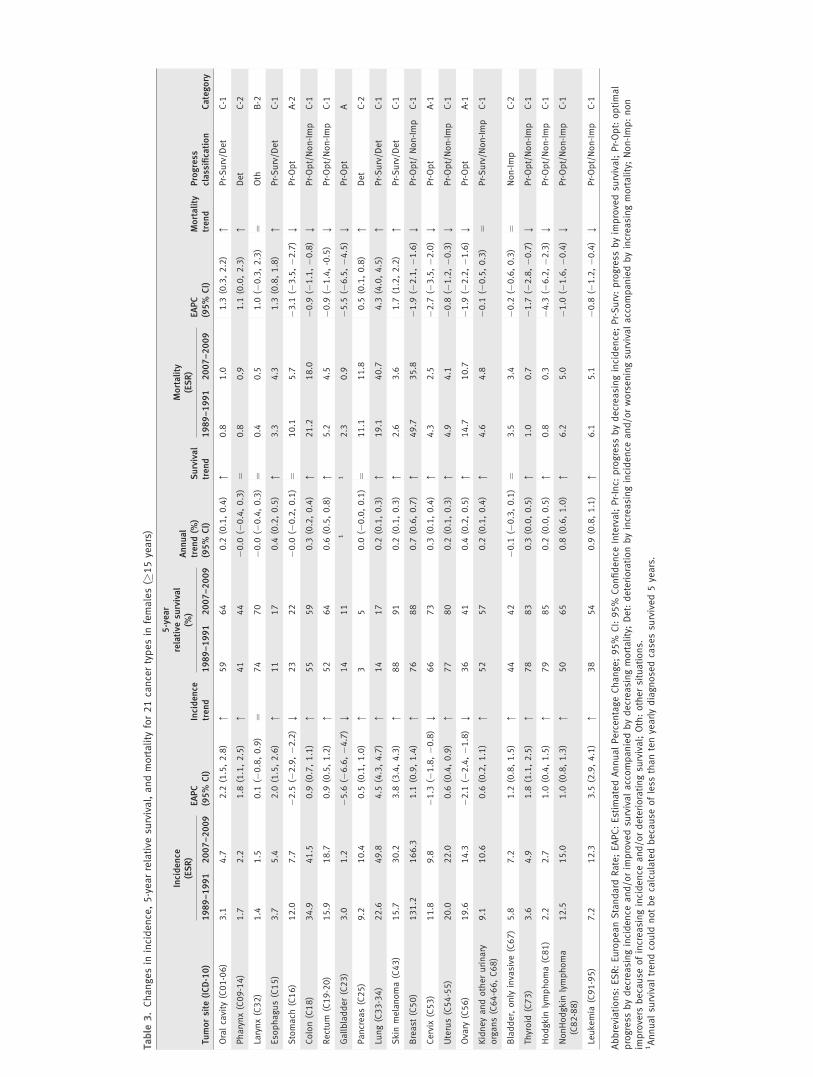
Table
3.Changesin
incidence,5-yearrelative
survival,andmortality
for21cancertypesin
females(�
15years)
Tumorsite
(ICD-10)
Incidence
(ESR)
EAPC
(95%
CI)
Incidence
trend
5-year
relative
survival
(%)
Annual
trend(%
)(95%
CI)
Survival
trend
Mortality
(ESR)
EAPC
(95%
CI)
Mortality
trend
Progress
classification
Category
1989–1991
2007–2009
1989–1991
2007–2009
1989–1991
2007–2009
Oralcavity
(C01-06)
3.1
4.7
2.2
(1.5,2.8)
:59
64
0.2
(0.1,0.4)
:0.8
1.0
1.3
(0.3,2.2)
:Pr-Surv/D
et
C-1
Pharynx(C09-14)
1.7
2.2
1.8
(1.1,2.5)
:41
44
�0.0
(�0.4,0.3)
¼0.8
0.9
1.1
(0.0,2.3)
:Det
C-2
Larynx(C32)
1.4
1.5
0.1
(�0.8,0.9)
¼74
70
�0.0
(�0.4,0.3)
¼0.4
0.5
1.0
(�0.3,2.3)
¼Oth
B-2
Eso
phagus(C15)
3.7
5.4
2.0
(1.5,2.6)
:11
17
0.4
(0.2,0.5)
:3.3
4.3
1.3
(0.8,1.8)
:Pr-Surv/D
et
C-1
Stomach
(C16)
12.0
7.7
�2.5
(�2.9,�2
.2)
;23
22
�0.0
(�0.2,0.1)
¼10.1
5.7
�3.1
(�3.5,�2
.7)
;Pr-Opt
A-2
Colon(C18)
34.9
41.5
0.9
(0.7,1.1)
:55
59
0.3
(0.2,0.4)
:21.2
18.0
�0.9
(�1.1,�0
.8)
;Pr-Opt/Non-Imp
C-1
Rectum
(C19-20)
15.9
18.7
0.9
(0.5,1.2)
:52
64
0.6
(0.5,0.8)
:5.2
4.5
�0.9
(�1.4,-0.5)
;Pr-Opt/Non-Imp
C-1
Gallbladder(C23)
3.0
1.2
�5.6
(�6.6,�4
.7)
;14
11
11
2.3
0.9
�5.5
(�6.5,�4
.5)
;Pr-Opt
A
Pancreas(C25)
9.2
10.4
0.5
(0.1,1.0)
:3
50.0
(�0.0,0.1)
¼11.1
11.8
0.5
(0.1,0.8)
:Det
C-2
Lung(C33-34)
22.6
49.8
4.5
(4.3,4.7)
:14
17
0.2
(0.1,0.3)
:19.1
40.7
4.3
(4.0,4.5)
:Pr-Surv/D
et
C-1
Skin
melanoma(C43)
15.7
30.2
3.8
(3.4,4.3)
:88
91
0.2
(0.1,0.3)
:2.6
3.6
1.7
(1.2,2.2)
:Pr-Surv/D
et
C-1
Breast
(C50)
131.2
166.3
1.1
(0.9,1.4)
:76
88
0.7
(0.6,0.7)
:49.7
35.8
�1.9
(�2.1,�1
.6)
;Pr-Opt/
Non-Imp
C-1
Cervix
(C53)
11.8
9.8
�1.3
(�1.8,�0
.8)
;66
73
0.3
(0.1,0.4)
:4.3
2.5
�2.7
(�3.5,�2
.0)
;Pr-Opt
A-1
Uterus(C54-55)
20.0
22.0
0.6
(0.4,0.9)
:77
80
0.2
(0.1,0.3)
:4.9
4.1
�0.8
(�1.2,�0
.3)
;Pr-Opt/Non-Imp
C-1
Ovary
(C56)
19.6
14.3
�2.1
(�2.4,�1
.8)
;36
41
0.4
(0.2,0.5)
:14.7
10.7
�1.9
(�2.2,�1
.6)
;Pr-Opt
A-1
Kidneyandotherurinary
organs(C64-66,C68)
9.1
10.6
0.6
(0.2,1.1)
:52
57
0.2
(0.1,0.4)
:4.6
4.8
�0.1
(�0.5,0.3)
¼Pr-Surv/N
on-Imp
C-1
Bladder,only
invasive
(C67)
5.8
7.2
1.2
(0.8,1.5)
:44
42
�0.1
(�0.3,0.1)
¼3.5
3.4
�0.2
(�0.6,0.3)
¼Non-Imp
C-2
Thyroid
(C73)
3.6
4.9
1.8
(1.1,2.5)
:78
83
0.3
(0.0,0.5)
:1.0
0.7
�1.7
(�2.8,�0
.7)
;Pr-Opt/Non-Imp
C-1
Hodgkin
lymphoma(C81)
2.2
2.7
1.0
(0.4,1.5)
:79
85
0.2
(0.0,0.5)
:0.8
0.3
�4.3
(�6.2,�2
.3)
;Pr-Opt/Non-Imp
C-1
NonHodgkin
lymphoma
(C82-88)
12.5
15.0
1.0
(0.8,1.3)
:50
65
0.8
(0.6,1.0)
:6.2
5.0
�1.0
(�1.6,�0
.4)
;Pr-Opt/Non-Imp
C-1
Leukemia
(C91-95)
7.2
12.3
3.5
(2.9,4.1)
:38
54
0.9
(0.8,1.1)
:6.1
5.1
�0.8
(�1.2,�0
.4)
;Pr-Opt/Non-Imp
C-1
Abbreviations:
ESR:EuropeanStandard
Rate;EAPC:Estim
atedAnnualPercentageChange;95%
CI:95%
Confidence
Interval;Pr-Inc:
progress
bydecreasingincidence;Pr-Surv:progress
byim
provedsu
rvival;Pr-Opt:optimal
progress
bydecreasingincidence
and/orim
provedsu
rvivalaccompaniedbydecreasingmortality;Det:deteriorationbyincreasingincidence
and/orworseningsu
rvivalaccompaniedbyincreasingmortality;Non-Imp:non
improvers
because
ofincreasingincidence
and/ordeterioratingsu
rvival;Oth:othersituations.
1Annualsu
rvivaltrendcould
notbecalculatedbecause
ofless
thantenyearlydiagnosedcasessu
rvived5years.
worse survival, except for bladder cancer. Such gender differ-ences have been reported before, and it is known that (gener-ally) males have a worse cancer survival than females, whichwas more pronounced in the past.21 The survival benefit forwomen is generally thought to be due to earlier detectionbecause of increased awareness, but for melanomas the sur-vival benefit has been shown to be independent of stage andother tumor characteristics.22,23
Dutch progress against cancer in an international
perspective
Observed cancer trends in this study resembled those in otherdeveloped countries.13 Within Europe, the Netherlands has one
of the strongest increases of esophageal cancer incidence, prob-ably partly due to the marked increase of obesity prevalencealthough this prevalence is still one of the lowest in Europe.24–26
Increases in prostate cancer incidence were more modest thanin other European countries probably due to the lower fre-quency of PSA testing in the Netherlands.24 This also explainswhy prostate cancer incidence in the United States is muchhigher than in the Netherlands. Dutch ovarian cancer incidenceshowed one of the strongest declines within Europe and is at alower level than in the United States, probably due to very com-mon use of oral contraceptives in the Netherlands.24,27
Survival improvements for the Netherlands are compara-ble with findings for the United States, except for bladder
Figure 1. Trends in incidence and mortality (a, b), and 5-year survival and mortality (c, d) for cancer in males and females, the Netherlands
1989–2009 (dots with a circle: mortality trend is not statistically significant; for 95% CIs of the point estimates, see Tables 2 and 3).Epidemiology
2986 Measuring progress against cancer
Int. J. Cancer: 130, 2981–2989 (2012) VC 2011 UICC
cancer where only US data showed improvements. Survivalfor patients with laryngeal cancer deteriorated in the UnitedStates, while it remained stable in the Netherlands.14 Overall,the 5-year survival rates were higher in the United Statesthan in the Netherlands, particularly for colorectal, thyroid,prostate and kidney cancer concurring with a comparison ofEuropean cancer survival results (EUROCARE) with USSEER data.4 The higher frequency of screening of colorectaland prostate cancer in the United States is largely responsiblefor these higher survival rates. However, there might also bea difference in completeness of follow-up in the cancer regis-tries, being high in the Netherlands and which affects sur-vival outcome negatively.11
Influence of prevention on progress
Prevention programs aimed to reduce exposure to risk factors(e.g., smoking, obesity and excessive sun exposure) and therebyto reduce cancer incidence. In this study, we observed markedincidence decreases for stomach, gallbladder, laryngeal (onlymales), lung (only males), bladder (only males), cervical andovarian cancer. The decreases of laryngeal and lung canceramong males are good examples of the effect of decreasingsmoking prevalence among males. The national screening pro-gram for cervical cancer successfully reduced cervical cancerincidence by detecting premalignancies.28
Prevention programs against smoking, obesity and excessivesun exposure remain important because of the enormous inci-dence increases of esophageal, oral cavity (only females), pha-ryngeal and lung cancer (only females) and skin melanoma.
Influence of shifts in stage distribution on progress
A shift in stage distribution can be an important cause ofimproving or deteriorating survival, although these shifts donot always become visible in overall incidence trends. They canbe caused by changes in diagnostics, early detection (e.g.,screening programs) and increased awareness among cliniciansand the population. Among cancer types with improved sur-vival, we observed a statistically significant rise in the occur-rence of early stages (T1/2 N0 M0) for esophageal, rectal, skinmelanoma, female breast, uterus, prostate, testis, kidney andthyroid cancer (Supporting Information Figure). In case of skinmelanoma, this rise is probably also due to increased awarenessin the population, although advanced-stage melanomas alsoincreased during the last decades.29,30 The national breast can-cer screening program in the Netherlands would explain theshift toward early breast cancer stages among women aged 50–75 years and probably part of the survival improvement,31,32 tosome extent also explained by increased use of adjuvant treat-ment.32,33 Increasing use of PSA tests in the Netherlands partlyexplain the shift toward early stage and even latent prostatecancers, leading to artificially high survival rates.34
Improvements in diagnostics (e.g., improved imaging tech-niques and increased number of examined lymph nodes)may also have led to a decrease in the occurrence of earlystages resulting in the so-called stage migration. This is prob-
ably valid for laryngeal, stomach, lung, pancreatic, ovarianand bladder cancer for which a decrease in the occurrence ofearly stages was observed in the present study (SupportingInformation Figure).
Influence of shifts in subsite/morphology distribution on
progress
Shifts in the prognostic profile as determined by the subsite ormorphology distribution can cause a deteriorating survival,which can be compensated by new therapies that improve sur-vival at the same time. So, a stable survival does not alwaysreflect a lack of progress. Shifts in subsite/morphology reflectchanges in risk factor prevalence and are not necessarily visiblein overall incidence trends. An example is the subsite shiftfrom noncardia to cardia stomach cancers (cardia shifted from26 to 32% for males and 13 to 18% for females in 1989–1991and 2007–2009, respectively). Relative 5-year survival forpatients with cardia tumors was only 15% compared to 24%of those with noncardia tumors despite ample attention forearlier detection due to more endoscopy and better surgery.35
Changes in therapy regimens and progress
In the Netherlands, progress was more often made in termsof survival than in terms of incidence, indicating a large rolefor changes in therapy. Changes in survival may be influ-enced by improved treatment but also by preceding changesin incidence. Unraveling and elucidating changes in incidenceand therapy are often difficult, even when incidence remainsstable, because there might be underlying proportionalchanges in age, subsite, morphology and stage distribution,whether or not following risk factor prevalence changes orearly detection. Multivariable relative survival analyses havebeen shown to be useful in unraveling the underlying mecha-nisms of improved survival, e.g., a study on colon carcinomasshowed a marked improvement in survival for patients withstage III disease to be due to more adjuvant chemotherapy.36
Remarks on measuring progress
Because of the interdependence between survival and inci-dence, it has been suggested to define progress against cancermerely as decreasing mortality.9,37,38 Using this definition,our results indicate progress in 12 of 19 male cancers and 12of 21 female cancers. However, declining cancer mortalitydoes not necessarily reflect recent progress, because mortalityrates for a given year reflect the risk of cancer death amongpatients diagnosed over the preceding years depending onthe prognosis of a certain cancer (e.g., breast cancer mortalityrate reflects deaths from the preceding 15–20 years).10
Improvements in survival can also slow down an increase ofmortality following the incidence trend. In this study, e.g.,EAPCs for mortality from skin melanoma, oral cavity andesophageal cancer were lower than those for incidence, mostlikely due to improved survival. Interestingly, certain cancers(melanoma and esophageal cancer for both sexes, oral cavityand lung cancer for females and kidney cancer for males) fall
Epidemiology
Karim-Kos et al. 2987
Int. J. Cancer: 130, 2981–2989 (2012) VC 2011 UICC
both into the Pr-Surv group and into the deterioration group,which illustrates there can be progress in survival while inci-dence and mortality continue to rise. Therefore, it is impor-tant to consider information on incidence, survival and mor-tality simultaneously. Another reason not to use cancermortality data only is that changes in mortality can also fol-low changes in coding practice of underlying cause-of-death.Therefore, we feel it is necessary to interpret mortalitychanges in combination with incidence and survival.
Welch et al.8 attempted to measure progress against can-cer in the United States by correlating both changes in inci-dence and changes in mortality with changes in 5-year sur-vival. They concluded that the effectiveness of cancer care istenuous, because of the small effect of survival changes onmortality, but much more influenced by changes in inci-dence. We did not focus on the strength of the associationbetween incidence, survival and mortality, because of the dif-ficulty of unraveling changes in incidence and therapy.
Limitations of this study
Using the progress model proposed in this study, one shouldrealize that taking the same observation periods for incidence,survival and mortality is not possible to observe the final effectof the incidence–survival combination on mortality: as it takessome time before changes in incidence and survival arereflected in the mortality statistics. An alternative could be tak-ing a gap of x years between the observation periods of inci-dence/survival and mortality. However, this gap of x yearswould be different for different cancer types, and it wouldmean not using the most recent trend information on inci-dence and survival, which would be a pity. Another importantthing to realize is that studying a certain time period does nottake into account the progress made before that period. Forexample, before 1990, much progress was made in the treat-ment of testicular cancer resulting in a decreasing and verylow mortality rates.39 In fact, mortality has become so low thatthere is hardly any room left for progress made by improvedsurvival. In these situations, progress made by improved sur-vival only is the best progress one can expect.
In this study, changes in incidence and mortality were eval-uated by EAPCs calculated over the whole study period. How-
ever, during a longer period, temporary trends in opposingdirections are not taken into account. For example, in theNetherlands, the incidence of cervical cancer decreased from9.1 per 100,000 to 6.5 in 2001, but from 2001, it started toincrease to 7.6 per 100,000 in 2009, but over the whole period,there is still an overall decreasing incidence trend.40 Whenstudying longer time periods, one might have to use joinpointanalysis to take such effects more precisely into account.
To calculate 5-year relative survival, we used two differentmethods, i.e., cohort- and period-based survival analyses.Although period-based results can differ slightly from the tra-ditional cohort-based results, it has been repeatedly shownthat they come very close to the later obtained cohort-basedresults. A difference between the two calendar periods basedon the two different methods likely points to a change inprognosis.41
ConclusionIn conclusion, our conceptual framework limits misinterpre-tations from separate trends and generates a more balanceddiscussion on progress. The observed progress against cancerin the Netherlands is the result of successful preventionresulting in, e.g., decreasing smoking prevalence (particularlyamong males, e.g., lung, laryngeal and bladder cancer),adequate screening of breast and cervical cancer (nationalcoverage), other early detection (e.g., melanoma and PSAtesting for prostate cancer), better staging by improved imag-ing techniques (e.g., lung and kidney cancer) and improvedtreatment (e.g., rectal cancer). Although there is still muchroom left for improvement, smoking prevalence and inci-dence of smoking-related cancers are still on the increase inwomen, incidence of obesity-related cancers and melanomascontinues increasing and survival of esophageal, lung, gall-bladder, pancreatic and stomach cancer remains still poor.
AcknowledgementsThe work on this research was performed within the framework of the pro-ject ‘‘Progress against cancer in the Netherlands since the 1970?’’ Theauthors thank the registration clerks of the NCR for the dedicated datacollection.
References
1. Leaf C. Why we’re losing the war oncancer (and how to win it). Fortune 2004;149:76–82; 4–6, 8 passim.
2. Ness RB. Fear of failure: why Americanscience is not winning the war on cancer.Ann Epidemiol 2010;20:89–91.
3. Boyle P, Autier P, Bartelink H, Baselga J,Boffetta P, Burn J, Burns HJ, ChristensenL, Denis L, Dicato M, Diehl V, Doll R,et al. European Code AgainstCancer and scientific justification: thirdversion (2003). Ann Oncol 2003;14:973–1005.
4. Verdecchia A, Francisci S, Brenner H,Gatta G, Micheli A, Mangone L, Kunkler I,Group E-W. Recent cancer survival inEurope: a 2000–02 period analysis ofEUROCARE-4 data. Lancet Oncol 2007;8:784–96.
5. Coleman MP, Quaresma M, Berrino F,Lutz JM, De Angelis R, Capocaccia R, BailiP, Rachet B, Gatta G, Hakulinen T,Micheli A, Sant M, et al. Cancer survivalin five continents: a worldwide population-based study (CONCORD). Lancet Oncol2008;9:730–56.
6. Berrino F, De Angelis R, Sant M, Rosso S,Lasota MB, Coebergh JW, Santaquilani M;EUROCARE Working Group. Survival foreight major cancers and all cancerscombined for European adultsdiagnosed in 1995–99: results of theEUROCARE-4 study. Lancet Oncol 2007;8:773–83.
7. Dickman PW, Adami HO. Interpretingtrends in cancer patient survival. J InternMed 2006;260:103–17.
8. Welch HG, Schwartz LM, Woloshin S. Areincreasing 5-year survival rates evidence of
Epidemiology
2988 Measuring progress against cancer
Int. J. Cancer: 130, 2981–2989 (2012) VC 2011 UICC
success against cancer? JAMA 2000;283:2975–8.
9. Autier P, Boniol M. Caution needed forcountry-specific cancer survival. Lancet2011;377:99–101.
10. Sant M, Francisci S, Capocaccia R,Verdecchia A, Allemani C, Berrino F.Should we use incidence, survival ormortality to assess breast cancertrends in European women?Nat Clin Pract Oncol 2006;3:228–9.
11. de Vries E, Karim-Kos HE, Janssen-Heijnen ML, Soerjomataram I, KiemeneyLA, Coebergh JW. Explanations forworsening cancer survival. Nat Rev 2010;7:60–3.
12. Ferlay J, Parkin DM, Steliarova-Foucher E.Estimates of cancer incidence andmortality in Europe in 2008. Eur J Cancer2010;46:765–81.
13. Ferlay J, Shin HR, Bray F, Forman D,Mathers C, Parkin DM. Estimates ofworldwide burden of cancer in 2008:GLOBOCAN 2008. Int J Cancer 2010;127:2893–917.
14. American Cancer Society. Cancer facts &figures 2010. Atlanta: American CancerSociety, 2010. 66p.
15. Schouten LJ, Hoppener P, van den BrandtPA, Knottnerus JA, Jager JJ. Completenessof cancer registration in Limburg, TheNetherlands. Int J Epidemiol 1993;22:369–76.
16. Statistics Netherlands. Available at: http://statline.cbs.nl. Accessed January 2011.
17. Brenner H, Gefeller O. An alternativeapproach to monitoring cancer patientsurvival. Cancer 1996;78:2004–10.
18. STIVORO. Available at: http://www.stivoro.nl. Accessed April 2011.
19. Marron M, Boffetta P, Zhang ZF, ZaridzeD, Wunsch-Filho V, Winn DM, Wei Q,Talamini R, Szeszenia-Dabrowska N,Sturgis EM, Smith E, Schwartz SM, et al.Cessation of alcohol drinking, tobaccosmoking and the reversal of head and neckcancer risk. Int J Epidemiol 2010;39:182–96.
20. Baron AE, Franceschi S, Barra S, TalaminiR, La Vecchia C. A comparison of thejoint effects of alcohol and smoking on therisk of cancer across sites in the upperaerodigestive tract. Cancer EpidemiolBiomarkers Prev 1993;2:519–23.
21. Micheli A, Ciampichini R, Oberaigner W,Ciccolallo L, de Vries E, Izarzugaza I,Zambon P, Gatta G, De AngelisR. The advantage of women incancer survival: an analysis of
EUROCARE-4 data. Eur J Cancer2009;45:1017–27.
22. de Vries E, Nijsten TE, Visser O,Bastiaannet E, van Hattem S, Janssen-Heijnen ML, Coebergh JW. Superiorsurvival of females among 10,538 Dutchmelanoma patients is independent ofBreslow thickness, histologic type andtumor site. Ann Oncol 2008;19:583–9.
23. Joosse A, de Vries E, Eckel R, Nijsten T,Eggermont AM, Holzel D, Coebergh JW,Engel J. Gender differences in melanomasurvival: female patients have a decreasedrisk of metastasis. J Invest Dermatol 2011;131:719–26.
24. Karim-Kos HE, de Vries E, SoerjomataramI, Lemmens V, Siesling S, Coebergh JW.Recent trends of cancer in Europe: acombined approach of incidence, survivaland mortality for 17 cancer sitessince the 1990s. Eur J Cancer 2008;44:1345–89.
25. van Blankenstein M, Looman CW,Siersema PD, Kuipers EJ, Coebergh JW.Trends in the incidence of adenocarcinomaof the oesophagus and cardia in theNetherlands 1989–2003. Br J Cancer 2007;96:1767–71.
26. Berghofer A, Pischon T, Reinhold T,Apovian CM, Sharma AM, Willich SN.Obesity prevalence from a Europeanperspective: a systematic review. BMCPublic Health 2008;8:200.
27. Collaborative Group on EpidemiologicalStudies of Ovarian C, Beral V, Doll R,Hermon C, Peto R, Reeves G. Ovariancancer and oral contraceptives:collaborative reanalysis of data from 45epidemiological studies including 23,257women with ovarian cancer and 87,303controls. Lancet 2008;371:303–14.
28. van den Akker-van Marle ME, vanBallegooijen M, Habbema JD. Low risk ofcervical cancer during a long period afternegative screening in the Netherlands. Br JCancer 2003;88:1054–7.
29. Hollestein LM, van den Akker SAW,Nijsten T, Karim-Kos HE, Coebergh JW,de Vries E. Trends of cutaneous melanomain the Netherlands: increasing incidencerates among all Breslow thicknesscategories and rising mortality rates since1989. Ann Oncol 2011 (online).
30. Welch HG, Woloshin S, Schwartz LM.Skin biopsy rates and incidence ofmelanoma: population based ecologicalstudy. BMJ 2005;331:481.
31. Fracheboud J, Otto SJ, van Dijck JA,Broeders MJ, Verbeek AL, de KoningHJ. Decreased rates of advanced breast
cancer due to mammography screeningin The Netherlands. Br J Cancer 2004;91:861–7.
32. Vervoort MM, Draisma G, Fracheboud J,van de Poll-Franse LV, de Koning HJ.Trends in the usage of adjuvant systemictherapy for breast cancer in theNetherlands and its effect on mortality. BrJ Cancer 2004;91:242–7.
33. Early Breast Cancer Trialists’ CollaborativeGroup (EBCTCG). Effects of chemotherapyand hormonal therapy for early breastcancer on recurrence and 15-year survival:an overview of the randomised trials.Lancet 2005;365:1687–717.
34. Cremers RG, Karim-Kos HE, HoutermanS, Verhoeven RH, Schroder FH, van derKwast TH, Kil PJ, Coebergh JW,Kiemeney LA. Prostate cancer: trends inincidence, survival and mortality in theNetherlands, 1989–2006. Eur J Cancer2010;46:2077–87.
35. Hartgrink HH, Bonenkamp HJ, van deVelde CJ. Influence of surgery onoutcomes in gastric cancer. Surg Oncol ClinN Am 2000;9:97–117; vii–viii.
36. van Steenbergen LN, Elferink MA, KrijnenP, Lemmens VE, Siesling S, Rutten HJ,Richel DJ, Karim-Kos HE, Coebergh JW.Improved survival of colon cancer due toimproved treatment and detection: anationwide population-based study in TheNetherlands 1989–2006. Ann Oncol 2010;21:2206–12.
37. Measurement of progress against cancer.Extramural committee to assess measuresof progress against cancer. J Natl CancerInst 1990;82:825–35.
38. Boyle P, Ferlay J. Mortality and survival inbreast and colorectal cancer. Nat Clin PractOncol 2005;2:424–5.
39. Verhoeven RH, Coebergh JW, KiemeneyLA, Koldewijn EL, Houterman S.Testicular cancer: trends in mortality arewell explained by changes in treatmentand survival in the southern Netherlandssince 1970. Eur J Cancer 2007;43:2553–8.
40. de Kok IM, van der Aa MA, vanBallegooijen M, Siesling S, Karim-Kos HE,van Kemenade FJ, Coebergh JW. Trends incervical cancer in the Netherlands until2007: has the bottom been reached? Int JCancer 2011;128:2174–81.
41. Brenner H, Steliarova-Foucher E, Arndt V.Up-to-date monitoring of childhoodcancer long-term survival in Europe:methodology and application to all formsof cancer combined. Ann Oncol 2007;18:1561–8.
Epidemiology
Karim-Kos et al. 2989
Int. J. Cancer: 130, 2981–2989 (2012) VC 2011 UICC