
Programa de Doutoramento em Bioqu´ımica
206
Universidade de ´ Evora - Instituto de Investiga¸ c˜ ao e Forma¸ c˜ ao Avan¸ cada Programa de Doutoramento em Bioqu´ ımica Tese de Doutoramento Quality Management in Laboratories - Efficiency Prediction Models Ana Teresa Moreirinha Vila Fernandes Mateus Orientador(es) | Henrique Vicente ´ Evora 2021
-
Upload
khangminh22 -
Category
Documents
-
view
0 -
download
0
Transcript of Programa de Doutoramento em Bioqu´ımica
Universidade de Evora - Instituto de Investigacao e Formacao Avancada
Programa de Doutoramento em Bioquımica
Tese de Doutoramento
Quality Management in Laboratories - Efficiency PredictionModels
Ana Teresa Moreirinha Vila Fernandes Mateus
Orientador(es) | Henrique Vicente
Evora 2021
Universidade de Evora - Instituto de Investigacao e Formacao Avancada
Programa de Doutoramento em Bioquımica
Tese de Doutoramento
Quality Management in Laboratories - Efficiency PredictionModels
Ana Teresa Moreirinha Vila Fernandes Mateus
Orientador(es) | Henrique Vicente
Evora 2021
A tese de doutoramento foi objeto de apreciacao e discussao publica pelo seguinte juri nomeadopelo Diretor do Instituto de Investigacao e Formacao Avancada:
Presidente | Ana Teresa Caldeira (Universidade de Evora)
Vogais | Henrique Vicente (Universidade de Evora) (Orientador)
Humberto Manuel Indio Tomas Chaves (Instituto Politecnico de Beja)Jorge Manuel Ferreira Barbosa Ribeiro (Instituto Politecnico de Viana do Castelo)Jose Carlos Ferreira Maia Neves (Universidade do Minho)Lia Sousa (CESPU-Cooperativa de Ensino Superior Politecnico e Univ.)
Maria Rosario Martins (Universidade de Evora)
Evora 2021

iv
Acknowledgments
I could list here an endless list of people who have helped me a lot to achieve this
goal. It would be impossible to name them all, as I would like, because I would risk
forgetting someone. However, I cannot fail to refer to some of them, thanking first and,
in particular:
– To my teacher, Professor Henrique Vicente, with whom I have had the privilege of
working for about 12 years and who has always accompanied me in a committed way,
helping me, encouraging me and instilling me with the spirit of objectivity, originality
and clarity necessary for any academic work. I thank him, not only for having
influenced my interest in the Artificial Intelligence area, but also for all the teachings,
advice and friendship, sharing many and long conversations with me: sometimes
sharing teachings, other times of outburst and motivation which allowed decisively that
this dissertation was a reality.
– To Professor José Carlos Ferreira Maia Neves, to whom I owe a very special
thanks for the teachings and involvement provided in his research team at the Algoritmi
Center of the University of Minho.
– To Professor Margarida Figueiredo, for her friendliness and availability to help
whenever necessary.
– To my colleagues, auditors of the certification body in which I collaborate and,
those belonging to the technical commission on Health Information Systems of the
Instituto Português da Qualidade for the companionship, transmission of experiences
and knowledge.
– To the employees and customers of the Laboratories who participated in the study
for their availability and friendliness.
The last words, not the least important, are for my family: to my mom, for all the
support, dedication and affection; to my daddy for all the teachings, values and honor
passed on; to my husband for the daily encouragement, affection, friendship and
understanding and, to our dear daughters, who is still of young age and with little
awareness of the World around them, they transmitted to me daily the necessary
motivation to continue and believe. I thank all of them for the confidence they have
given me, I know that I owe you the fact that I am what I am today.
v
Agradecimentos
Poderia enumerar aqui uma lista infindável de pessoas que muito me ajudaram a
atingir este objetivo. Seria impossível nomeá-las todas, como gostaria, pois correria o
risco de esquecer alguém. No entanto, não posso deixar de fazer referência a algumas
delas, agradecendo primeiramente e, em particular:
– Ao meu orientador, Professor Doutor Henrique Vicente, com o qual tenho o
privilégio de trabalhar há cerca de 12 anos e que me tem sempre acompanhado de forma
empenhada, ajudando-me, encorajando-me e incutindo-me o espírito de objetividade,
originalidade e clareza necessária a qualquer trabalho académico. A ele agradeço, não
só o facto de ter influenciado o meu interesse pela área de Inteligência Artificial mas,
também, todos os ensinamentos, aconselhamento e amizade partilhando comigo muitas
e longas conversas: umas vezes de partilha de ensinamentos, outras de desabafos e
motivação o que permitiu decisivamente que esta dissertação fosse uma realidade.
– Ao Professor Doutor José Maia Neves, a quem devo um agradecimento muito especial
pelos ensinamentos e envolvimento proporcionados na sua equipa de investigadores do
centro Algoritmi da Universidade do Minho.
– À Professora Doutora Margarida Figueiredo, pela sua simpatia e disponibilidade
em ajudar sempre que necessário.
– Aos meus colegas, auditores do organismo de certificação no qual colaboro e, aos
pertencentes à Comissão Técnica de Normalização – Sistemas de Informação para a
Saúde do Instituto Português da Qualidade, pelo companheirismo, transmissão de
experiências e conhecimentos.
– Aos colaboradores e clientes dos laboratórios que participaram no estudo pela
disponibilidade e simpatia demonstradas.
As últimas palavras, nem por isso as menos importantes, são para a minha família. À
minha mãe, por todo o apoio, dedicação e carinho. Ao meu pai por todos os
ensinamentos, valores e honra transmitidos. Ao meu marido pelo estímulo quotidiano,
carinho, amizade e compreensão e, às nossas queridas filhas, que ainda de tenra idade e
com pouca consciência do Mundo à sua volta me transmitiram diariamente a motivação
necessária para continuar e acreditar. A todos eles, agradeço a confiança que me têm
incutido, sei que é a vós que devo o facto de ser aquilo que sou hoje.
vi
Preface
Biochemistry is an essential area for contemporary societies as it deals with
extremely important issues in several areas, such as health and the environment. It plays
a decisive role in developing solutions to some of the biggest problems of our time (e.g.,
environmental pollution, food shortages, renewable energies, new diseases) and in
establishing a sustainable society. This dissertation is the result of the author's
experience as a teacher, auditor, consultant, and researcher in Quality and Environment
in accredited laboratories and certified organizations. This work clearly describes a
journey that started at the University of Évora in 1999 with a Degree in Physics and
Chemistry Teaching and, in 2007, with a Masters Degree in Environmental Chemical
Analysis. This training allowed the author to work as an analysis technician and quality
manager in Water and Industrial Effluent Laboratories. The post-graduation in Safety,
Health and Hygiene at Work and the various training courses in normative references in
the areas of Audits, Chemistry, Microbiology, Sampling, Equipment Management,
Calibrations and Laboratory Facilities allowed her to join a multinational certification
body as a technical auditor, in addition to being a member of the Technical Commission
for Health Information Systems of the Portuguese Institute of Quality.
Bearing in mind the multidisciplinarity that characterizes this dissertation, it is
intended that its content be applied, not only to laboratories with a view to creating
efficiency models, but also to other types of organizations. As a final purpose, it is
hoped that, in some way, it will raise awareness to all those who assume responsibility
and commitment to the urgency of building effective laboratory management models, in
the certainty that only in this way will significant steps be taken in improving health, the
environment and well-being of society.
vii
Prefácio
A Bioquímica é uma área essencial para as sociedades contemporâneas uma vez que
se debruça sobre questões de extrema importância, em diversas áreas, tais como a saúde
e o ambiente. Tem um papel decisivo no desenvolvimento de soluções para alguns dos
grandes problemas do nosso tempo (e.g., poluição ambiental, escassez de alimentos,
energias renováveis, novas doenças) e no estabelecimento de uma sociedade sustentável.
A presente dissertação é o resultado da experiência da autora como professora, auditora,
consultora e investigadora nos domínios da Qualidade e do Ambiente em laboratórios
acreditados e em organizações certificadas. Este trabalho descreve, de forma clara, um
percurso que se iniciou na Universidade de Évora em 1999 com a Licenciatura em
Ensino de Física e Química e, em 2007, com o Mestrado em Análises Químicas
Ambientais. Esta formação permitiu-lhe exercer funções de técnica de análises e de
gestora da qualidade em Laboratórios de Águas e de Efluentes Industriais. A pós-
graduação em Segurança, Saúde e Higiene no Trabalho e as diversas formações em
referenciais normativos nas áreas de Auditorias, Química, Microbiologia, Amostragem,
Gestão de Equipamentos, Calibrações e Instalações Laboratoriais permitiram-lhe ingressar
num organismo multinacional de certificação com a função de auditora técnica, para
além de vogal na Comissão Técnica de Sistemas de Informação para a Saúde do Instituto
Português da Qualidade.
Tendo em conta a multidisciplinaridade que carateriza a presente dissertação pretende-se
que o seu conteúdo seja aplicado, não apenas a laboratórios com vista à criação de
modelos de eficiência, mas também a outro tipo de organizações. Como último propósito,
espera-se que ela, de algum modo, sensibilize todos quantos assumem a responsabilidade
e o compromisso da urgência da construção de modelos eficazes de gestão laboratorial,
na certeza que, só desta forma, se darão passos significativos na melhoria da saúde,
ambiente e bem-estar da sociedade.
viii
Abstract
In recent years, the choice of quality tools by laboratories has increased significantly.
This fact contributed to the growth of competitiveness, requiring a new organizational
posture to adapt to the new challenges. In order to obtain competitive advantages in the
respective sectors of activity, laboratories have increasingly invested in innovation. In
this context, the main objective of this study aims to develop efficiency models for
laboratories using tools from the Scientific Area of Artificial Intelligence. Throughout
this work, different studies will be presented, carried out in water analysis laboratories,
stem cell cryopreservation laboratories and dialysis care clinics, in which innovative
solutions and better resource control were sought, without compromising quality and
promoting greater sustainability
This work can be seen as an investigation opportunity that can be applied not only in
laboratories and clinics, but also in organizations from different sectors in order to seek
to define prediction models, allowing the anticipation of future scenarios and the
evaluation of ways of acting. The results show the feasibility of applying the models
and that the normative references applied to laboratories and clinics can be a basis for
structuring the systems.
Keywords: Laboratories; Artificial Intelligence; Quality Management; Decision
Support Systems.

ix
Gestão da Qualidade em Laboratórios
Modelos de Previsão de Eficiência
Resumo
Nos últimos anos, a adoção de ferramentas da qualidade por parte dos laboratórios
tem aumentado significativamente. Este facto contribuiu para o crescimento da
competitividade, exigindo uma nova postura organizacional de forma a se adaptarem
aos novos desafios. Tendo em vista obter vantagens competitivas nos respetivos
sectores de atividade, os laboratórios têm, cada vez mais, apostado em inovação. Neste
contexto, o principal objetivo deste estudo visa o desenvolvimento de modelos de eficiência
para laboratórios através do recurso a ferramentas da Área Científica da Inteligência
Artificial. Ao longo deste trabalho irão ser apresentados diferentes estudos, realizados
em laboratórios de análises de águas, laboratórios de criopreservação de células
estaminais e clínicas de prestação de cuidados de diálise, nos quais se procuraram
soluções inovadoras e um melhor controlo de recursos, sem comprometer a qualidade e
promovendo uma maior sustentabilidade. Este trabalho pode ser encarado como uma
oportunidade de investigação que pode ser aplicado não apenas em laboratórios e
clínicas mas, também, em organizações de diversos sectores com o intuito de se
procurar definir modelos de previsão, possibilitando a antecipação de cenários futuros e
a avaliação de formas de atuação. Os resultados mostram a viabilidade da aplicação dos
modelos e que os referenciais normativos aplicados aos laboratórios e às clínicas podem
servir como base para estruturação dos sistemas.
Palavras-Chave: Laboratórios; Inteligência Artificial; Gestão da Qualidade; Sistemas
de Apoio à Decisão.
x
List of Publications
Papers in international scientific periodicals with referees
[18] Fernandes, A., Figueiredo, M., Carvalho, F., Neves, J. & Vicente, H., Threat Arti-
ficial Intelligence and Cyber Security in Health Care Institutions. Studies in
Computational Intelligence, 972, 2021. (Accepted)
DOI: 10.1007/978-3-030-72236-4 ISSN: 1860-949X e-ISSN: 1860-9503
[17] Neves, J., Maia, N., Marreiros, G., Neves, M., Fernandes, A., Ribeiro, J., Araújo,
I., Araújo, N., Ávidos, L., Ferraz, F., Capita, A., Lori, N., Alves, V. & Vicente,
H., Employees Balance and Stability as Key Points in Organizational Performance.
Logic Journal of the IGPL, 2021.
DOI: 10.1093/jigpal/jzab010 ISSN: 1367-0751 e-ISSN: 1368-9894
[16] Fernandes, A., Lima, R., Figueiredo, M., Ribeiro, J., Neves, J. & Vicente, H., As-
sessing Employee Satisfaction in the Context of Covid-19 Pandemic. Para-
digmPlus, 1 (3): 23–43, 2020.
e-ISSN: 2711-4627
[15] Fernandes, A., Chaves, H., Lima, R., Neves, J. & Vicente, H., Draw on Artificial
Neural Networks to Assess and Predict Water Quality. IOP Conference Series:
Earth and Environmental Science, 612: 012028, 7 pp., 2020.
DOI: 10.1088/1755-1315/612/1/012028 ISSN: 1755-1307 e-ISSN: 1755-1315
[14] Fernandes, A., Figueiredo, M., Dias, A., Ribeiro, J., Neves, J. & Vicente, H., A
Case-Based Approach to Assess Employees’ Satisfaction with Work Guidelines in
Times of the Pandemic. Communications in Computer and Information Science,
1277: 183–196, 2020.
DOI: 10.1007/978-3-030-61702-8_13 ISSN: 1865-0929 e-ISSN: 1865-0937
[13] Fernandes, A., Figueiredo, M., Ávidos, L., Ribeiro, J., Vicente, D., Neves, J. &
Vicente, H., Psychosocial Risk Management. Procedia Computer Science, 176:
743–752, 2020.
DOI: 10.1016/j.procs.2020.09.069 ISSN: 1877-0509 e-ISSN: 1877-0509
List of Publications
xi
[12] Fernandes, A., Figueiredo, M., Ribeiro, J., Neves, J. & Vicente, H., Psychosocial
Risks Assessment in Cryopreservation Laboratories. Safety and Health at Work,
11: 431–442, 2020.
DOI: 10.1016/j.shaw.2020.07.003 ISSN: 2093-7911 e-ISSN: 2093-7997
[11] Figueiredo, M., Fernandes, A., Ribeiro, J., Neves, J., Dias A. & Vicente, H., An
Assessment of Students’ Satisfaction in Higher Education. Advances in Intelligent
Systems and Computing, 1241: 147–161, 2020.
DOI: 10.1007/978-3-030-52538-5_16 ISSN: 2194-5357 e-ISSN: 2194-5365
[10] Maia, N., Neves, M., Barbosa, A., Carrulo, B., Araújo, N., Fernandes, A., Vicente,
D., Ribeiro, J., Vicente, H. & Neves J., Social Role in Organizational
Management – Understanding People Behavior and Motivation. Communications
in Computer and Information Science, 1178: 527–536, 2020.
DOI: 10.1007/978-981-15-3380-8_46 ISSN: 1865-0929 e-ISSN: 1865-0937
[9] Fernandes, A., Carvalho, F., Ribeiro, J., Vicente, D., Faria, J., Figueiredo, M.,
Capita, A., Neves J. & Vicente, H., Fully Informed Classification Systems –
Simpler, Maybe Better. Communications in Computer and Information Science,
1038: 3–16, 2019.
DOI: 10.1007/978-3-030-37858-5_1 ISSN: 1865-0929 e-ISSN: 1865-0937
[8] Pereira, A., Crespo, A., Fernandes, A., Aranha, I., Figueiredo, M., Ribeiro, J.,
Chaves, H., Neves, J. & Vicente, H., Wine Quality Assessment under the Eindhoven
Classification Method. Communications of the ECMS, 33(1): 158–165, 2019.
DOI: 10.7148/2019-0158 ISSN: 2522-2414 eISSN: 2522-2422
[7] Neves, J., Maia, N., Marreiros, G., Neves, M., Fernandes, A., Ribeiro, J., Araújo,
I., Araújo, N., Ávidos, L., Ferraz, F., Capita, A., Lori, N., Alves, V. & Vicente,
H., Entropy and Organizational Performance. Lecture Notes in Computer
Science, 11734: 206–217, 2019.
DOI: 10.1007/978-3-030-29859-3_18 ISSN: 0302-9743 e-ISSN: 1611-3349
[6] Fernandes, A., Vicente, H., Figueiredo, M., Ribeiro, J. & Neves, J., Quality
Management in Training Companies. Lecture Notes in Electrical Engineering,
505: 384–390, 2019.
DOI: 10.1007/978-3-319-91334-6_52 ISSN: 1876-1100 e-ISSN: 1876-1119
List of Publications
xii
[5] Fernandes, A., Vicente, H., Figueiredo, M., Maia, N., Marreiros, G., Neves, M. &
Neves, J., A Case-Base Approach to Workforces’ Satisfaction Assessment. Lecture
Notes in Business Information Processing, 268: 191–206, 2016.
DOI: 10.1007/978-3-319-49944-4_15 ISSN: 1865-1348 e-ISBN: 1865-1356
[4] Fernandes, A., Vicente, H., Figueiredo, M., Neves, M. & Neves, J., An Evaluative
Model to assess the Organizational Efficiency in Training Corporations. Lecture
Notes on Computer Science, 10018: 415–428, 2016.
DOI: 10.1007/978-3-319-48057-2_29 ISSN: 0302-9743 e-ISSN: 1611-3349
[3] Neves, J., Fernandes, A., Gomes, G., Neves, M., Abelha, A. & Vicente, H.,
International Standard ISO 9001–A Soft Computing View. Lecture Notes in
Business Information Processing, 241: 153–167, 2015.
DOI: 10.1007/978-3-319-29133-8_8 ISSN: 1865-1348 e-ISSN: 1865-1356
[2] Vicente, H., Dias, S., Fernandes, A., Abelha, A., Machado, J. & Neves, J.,
Prediction of the Quality of Public Water Supply using Artificial Neural Networks.
Journal of Water Supply: Research and Technology – AQUA, 61: 446–459, 2012.
DOI: 10.2166/aqua.2012.014 ISSN: 0003-7214 eISSN: 1365-2087
[1] Pinto, A., Fernandes, A., Vicente, H. & Neves, J., Optimizing Water Treatment
Systems Using Artificial Intelligence Based Tools. WIT Transactions on Ecology and
the Environment, 25: 185–194, 2009.
DOI: 10.2495/WRM090171 ISSN: 1746-448X e-ISSN: 1743-3541
Papers in international conference proceedings with referees
[3] Fernandes, A., Figueiredo, M., Neves, J. & Vicente, H., An Assessment of Data
Guidelines in Cryopreservation Laboratories. In Proceedings of the 2021
International Symposium on Electrical, Electronics and Information Engineering
(ISEEIE 2021), Association for Computing Machinery, New York, United States
of America, 2021. (Accepted)
ISBN: 978-1-4503-8983-9
List of Publications
xiii
[2] Neves, J., Fernandes, A., Gomes, G., Neves, M., Abelha, A. & Vicente, H.,
International Standard ISO 9001 – An Artificial Intelligence View. In S.
Hammoudi, L. Maciaszek & E. Teniente Eds., Proceedings of the 17th
International Conference on Enterprise Information Systems (ICEIS 2015), Vol. I,
pp. 421–428, Scitepress – Science and Technology Publications, Lisbon, 2015.
DOI: 10.5220/0005328904210428
[1] Fernandes, A., Vicente, H. & Neves, J., Solving Challenging Problems in the Oil
Industry Using Artificial Intelligence Based Tools. In D. B. Das, V. Nassehi & L.
Deka Eds., ISC 2009, pp. 325–331, Eurosis – ETI Publication, Ghent, Belgium,
2009.
ISBN: 978-9-07738-148-9
xiv
Table of Contents
Acknowledgments ............................................................................................................ iv
Agradecimentos ................................................................................................................. v
Preface .............................................................................................................................. vi
Prefácio ........................................................................................................................... vii
Abstract .......................................................................................................................... viii
Resumo ............................................................................................................................. ix
List of Publications ............................................................................................................ x
Papers in international scientific periodicals with referees ...................................... x
Papers in international conference proceedings with referees .............................. xii
Table of Contents ........................................................................................................... xiv
List of Figures .................................................................................................................. xx
List of Tables ................................................................................................................ xxiii
Acronyms, Initialisms and Abbreviations ..................................................................... xxv
Objectives ......................................................................................................................... 1
Methodology ..................................................................................................................... 3
Chapter I. Introduction ..................................................................................................... 5
I.1. Overview ............................................................................................................... 6
I.2. Theoretical Perspectives ........................................................................................ 7
I.3. Normative References ........................................................................................... 9
I.3.1. Laboratory Accreditation ............................................................................. 11
I.3.2. Quality Audits .............................................................................................. 12
I.4. Artificial Intelligence in Laboratories ................................................................. 13
Table of Contents
xv
I.5. Knowledge Discovery from Databases ............................................................... 15
I.5.1. Artificial Neural Networks .......................................................................... 16
I.5.2. Case Base Reasoning ................................................................................... 18
Chapter II. Quality Control ............................................................................................. 21
II.1. Overview ............................................................................................................ 22
II.2. Avoidance of Sampling Errors in Drinking Water Analysis – A Logical
Approach to Programming................................................................................. 25
II.2.1. Introduction ................................................................................................ 25
II.2.2. Related Work .............................................................................................. 28
II.2.3. Methods ...................................................................................................... 29
II.2.4. Results and Discussion ............................................................................... 30
II.2.4.1. The Adjusted version of the Eindhoven Classification Model for
Water Sampling .................................................................................. 30
II.2.4.2. The Computational System................................................................. 36
II.2.5. Conclusions ................................................................................................ 41
II.3. Draw on Artificial Neural Networks to Assess and Predict Water Quality ....... 43
II.3.1. Introduction ................................................................................................ 43
II.3.2. Materials and Methods ............................................................................... 44
II.3.2.1. Sample Collection and Preservation ................................................... 45
II.3.2.2. Analytical Procedures ......................................................................... 45
II.3.2.3. Artificial Neural Networks ................................................................. 45
II.3.3. Results and Discussion ............................................................................... 46
II.3.3.1. Database .............................................................................................. 46
II.3.3.2. Artificial Neural Networks Models .................................................... 47
II.3.3.3. Sensitivity Analysis ............................................................................ 50
II.3.4. Conclusions ................................................................................................ 50
Table of Contents
xvi
II.4. Synopsis ............................................................................................................. 51
Chapter III. Quality Management ................................................................................... 52
III.1. Overview ........................................................................................................... 53
III.2. Fully Informed Classification Systems – Simpler, Maybe Better .................... 56
III.2.1. Introduction ............................................................................................... 56
III.2.2. Computational Model................................................................................ 57
III.2.2.1. Knowledge Representation and Reasoning ....................................... 58
III.2.3. Case Study ................................................................................................. 63
III.2.4. Conclusions and Future Work ................................................................... 66
III.3. A Conceptual Model to Assess the Literacy of Water Consumers................... 68
III.3.1. Introduction ............................................................................................... 68
III.3.2. Methods ..................................................................................................... 69
III.3.2.1. Study Design ..................................................................................... 69
III.3.2.2. Electronic Search Strategy ................................................................ 69
III.3.3. Results ....................................................................................................... 69
III.3.4. Discussion ................................................................................................. 72
III.3.4.1. WCL Model in Practice ..................................................................... 75
III.3.5. Conclusions ............................................................................................... 78
III.3.6. Questionnaire on Water Quality and Health ............................................. 79
III.4. Psychosocial Risks Assessment in Cryopreservation Laboratories .................. 81
III.4.1. Introduction ............................................................................................... 81
III.4.2. State of Art ................................................................................................ 81
III.4.2.1. Psychosocial Risks ............................................................................ 81
III.4.2.2. Artificial Neural Networks ................................................................ 86
Table of Contents
xvii
III.4.3. Methods ..................................................................................................... 86
III.4.3.1. Place of Study .................................................................................... 86
III.4.3.2. Participants ........................................................................................ 86
III.4.3.3. Data Collection .................................................................................. 87
III.4.3.4. Qualitative Data Processing .............................................................. 88
III.4.3.5. Artificial Neural Networks ................................................................ 88
III.4.3.6. Ethical Aspects of the Study ............................................................. 88
III.4.4. Results and Discussion .............................................................................. 88
III.4.4.1. Sample Characterization.................................................................... 88
III.4.4.2. Answer Frequency Analysis .............................................................. 90
III.4.4.3. Psychosocial Risk Assessment .......................................................... 97
III.4.5. Study Limitations .................................................................................... 101
III.4.6. Conclusions ............................................................................................. 103
III.4.7. Psychosocial Risks Questionnaire .......................................................... 104
III.5. Synopsis .......................................................................................................... 107
Chapter IV. Total Quality Management ....................................................................... 109
IV.1. Overview ........................................................................................................ 110
IV.2. An Assessment of Data Guidelines in Cryopreservation Laboratories ................. 113
IV.2.1. Introduction ............................................................................................. 113
IV.2.2. Fundamentals .......................................................................................... 114
IV.2.2.1. Artificial Neural Networks .............................................................. 115
IV.2.3. Methods .................................................................................................. 115
IV.2.4. Results and Discussion ........................................................................... 117
IV.2.4.1. Sample Characterization ................................................................. 117
IV.2.4.2. Answer Frequency Analysis ........................................................... 117
IV.2.4.3. GDPR Implementation Assessment ................................................ 118
IV.2.5. Conclusions and Future Work ................................................................ 122
Table of Contents
xviii
IV.3. A Case-Based Approach to Assess Employees’ Satisfaction with Work
Guidelines in Times of the Pandemic............................................................. 123
IV.3.1. Introduction ............................................................................................. 123
IV.3.2. Literature Review.................................................................................... 124
IV.3.2.1. Thermodynamics and Knowledge Representation and Reasoning . 124
IV.3.2.2. Case-Based Reasoning .................................................................... 125
IV.3.3. Case Study .............................................................................................. 126
IV.3.3.1. Methods ........................................................................................... 126
IV.3.3.2. Data Processing ............................................................................... 126
IV.3.4. Results and Discussion ........................................................................... 131
IV.3.4.1. A Symbolic, Logic Method to Evaluate Employee’s Satisfaction .. 133
IV.3.4.2. A Case-Based Approach to Process Employee’s Satisfaction ........ 134
IV.3.5. Conclusions and Future Work ................................................................ 135
IV.4. Customers’ Satisfaction Assessment in Water Laboratories ......................... 137
IV.4.1. Introduction ............................................................................................. 137
IV.4.1.1. Quality Concept .............................................................................. 137
IV.4.1.2. Accreditation ................................................................................... 140
IV.4.1.3. Study Aims ...................................................................................... 141
IV.4.2. Related Work .......................................................................................... 141
IV.4.3. Materials and Methods ............................................................................ 142
IV.4.3.1. Place of Study ................................................................................. 142
IV.4.3.2. Participants ...................................................................................... 142
IV.4.3.3. Data Collection................................................................................ 143
IV.4.3.4. Qualitative Data Processing ............................................................ 143
IV.4.3.5. Artificial Neural Networks .............................................................. 144
IV.4.3.6. Ethical Aspects of the Study ........................................................... 144
Table of Contents
xix
IV.4.4. Results and Discussion ........................................................................... 144
IV.4.4.1. Sample Characterization ................................................................. 144
IV.4.4.2. Answer Frequency Analysis ........................................................... 145
IV.4.4.3. Customer Satisfaction Assessment ................................................. 148
IV.4.5. Conclusions ............................................................................................. 152
IV.4.6. Customer Satisfaction Questionnaire ...................................................... 153
IV.5. Synopsis .......................................................................................................... 155
Chapter V. Concluding Remarks and Future Perspectives .......................................... 156
References .................................................................................................................... 159
xx
List of Figures
Figure 1 – Evolution of the strategic approaches to achieve quality. ............................... 8
Figure 2 – The process of knowledge discovery in databases. ....................................... 16
Figure 3 – The classical view of case-based reasoning cycle......................................... 18
Figure 4 – The extended view of case-based reasoning cycle. ....................................... 20
Figure 5 – The main steps in sampling water for human consumption. ......................... 26
Figure 6 – The adverse event classification process....................................................... 34
Figure 7 – The Extended Causal Tree regarding the adverse event “Failure in Sampling”. . 35
Figure 8 – A global view of the Adverse Event Reporting and Learning System related
to Water Sampling. ....................................................................................... 40
Figure 9 – Geographical localization and distances between the dams where this study
was conducted. .............................................................................................. 44
Figure 10 – Structure of the ANN selected to predict COD and BOD. ......................... 48
Figure 11 – Graphical representation of ANN responses versus measured values regarding
BOD and COD. ........................................................................................... 49
Figure 12 – Graphical representation of errors versus ANN responses regarding BOD
and COD. .................................................................................................... 49
Figure 13 – Influence of each input variable on the ANN outputs. ................................. 50
Figure 14– General structure of the causal tree for the adverse event A. ....................... 57
Figure 15 – An assessment of the attained energy with respect to a single citizen answer
to Citizen’s Charter-Six-Items. ................................................................... 59
Figure 16 – A graphical view of the citizen’s charter predicate’s extent obtained according
to the answers of a single citizen to the Citizen’s Charter-Six-Items. .......... 61
Figure 17 – System’s performance evaluation. .............................................................. 63
List of Figures
xxi
Figure 18 – Flow chart of the Eindhoven classification model for the public services. ... 64
Figure 19 – The adverse event “deadline to respond to the request exceeded” in terms
of an extended causal tree. .......................................................................... 65
Figure 20 – Flow chart of papers selection process. ...................................................... 70
Figure 21 – Conceptual model for the planning and operationalizing studies on water
consumption literacy. .................................................................................. 73
Figure 22 – PDCA Model. .............................................................................................. 74
Figure 23 – Interrelationships between PDCA and WCL Models. ................................ 75
Figure 24 – Frequency of answer regarding each WCL dimension. .............................. 77
Figure 25 – Psychosocial risks factors and categories. .................................................... 82
Figure 26 – Sample characterization in terms of age groups, academic qualifications, and
departmental areas. ...................................................................................... 89
Figure 27 – Distribution of academic qualifications of the respondents by department. .... 90
Figure 28 – Respondents’ agreement/disagreement with the statements regarding each
factor. .......................................................................................................... 91
Figure 29 – Frequency of term selection versus term priority. ...................................... 93
Figure 30 – Binary associations between terms. ............................................................ 95
Figure 31 – Ternary associations between terms............................................................ 96
Figure 32 – Quaternary associations between terms. ....................................................... 97
Figure 33 – The answers of respondent #1 to the second part of the questionnaire. ...... 98
Figure 34 – A view of the qualitative data processing. .................................................. 99
Figure 35 – The ANN model for psychosocial risks assessment. ................................ 100
Figure 36 – Frequency of answer to the statements included in the second section of
the questionnaire. ...................................................................................... 118
Figure 37 – The answers of applicant 1 to the second section of the GDPR questionnaire. 119
List of Figures
xxii
Figure 38 – The quantification process of the qualitative information collected in the
second section of the GDPR questionnaire for applicant 1. ..................... 120
Figure 39 – A view of the ANN selected for GDPR implementation assessment. ....... 121
Figure 40 – Relative importance of the input variables of the ANN selected for GDPR
implementation assessment. ..................................................................... 122
Figure 41 – A fragment of employee # 1’s answers to COVID–19 training items
included in the second part of the questionnaire. ..................................... 127
Figure 42 – Estimation of energy types for the diverse items respecting to the answers
of employee # 1 to the TRI – 4. ................................................................ 129
Figure 43 – The global evaluation of the contribution of employee # 1 to the team’s
satisfaction in answering TRI – 4. ............................................................. 129
Figure 44 – Employee Satisfaction Assessment (ESA) evaluation. ............................. 131
Figure 45 – The European Foundation for Quality Management Excellence Model. . 139
Figure 46 – Sample characterization in terms of age groups, academic qualifications,
and how the customers get acquainted with the laboratory. ..................... 145
Figure 48 – Frequency of answer to the statements regarding support documentation. ... 147
Figure 49 – Frequency of answer to the statements regarding complaint handling. .... 147
Figure 50 – Frequency of answer to the statements regarding overall assessment of
service. ...................................................................................................... 148
Figure 51 – The answers of respondent #1 to the second part of the questionnaire. .... 149
Figure 52 – A view of the qualitative data processing. ................................................ 150
Figure 53 – ANN model for customers’ satisfaction assessment. ................................ 151
xxiii
List of Tables
Table 1 – Frequency of occurrence of adverse events, during 1st semester of 2019. ..... 31
Table 2 – Categories of the adjusted Eindhoven classification model for water sampling
and the corresponding codes. ......................................................................... 32
Table 3 – An excerpt from the code set of the adjusted Eindhoven classification model
for water sampling and examples of possible adverse events. ....................... 33
Table 4 – A statistical view of the database that supports this study. ............................ 46
Table 5 – Pearson correlation coefficients among variables. ......................................... 47
Table 6 – Mean Absolute Error, Mean Square Error, and Bias for the ANN topologies
tested. .............................................................................................................. 47
Table 7 – The single citizen answers to Citizen’s Charter-Six-Items. ........................... 59
Table 8 – The citizen’s charter predicate’s extent obtained according to the answers
of a single citizen to the Citizen’s Charter-Six-Items. ................................... 61
Table 9 – Correspondence between the statements included in the questionnaire and
the psychosocial risk factors. .......................................................................... 90
Table 10 – A fragment of the knowledge base for psychosocial risk assessment. ....... 100
Table 11 – Confusion Matrix regarding ANN model for psychosocial risks assessment. 100
Table 12 – Confusion matrix regarding each output classes of the ANN model for
psychosocial risks assessment. ................................................................... 102
Table 13 – Sensitivity, specificity, Positive Predictive Value and Negative Predictive
Value for each output classes of the ANN model, split by training and test. .. 102
Table 14 – A fragment of the knowledge base for the GDPR implementation
assessment. ................................................................................................. 120
Table 15 – Confusion matrix to ANN model for the GDPR implementation assessment. 121
Table 16– Answers of the employee # 1 to TRI – 4. .................................................... 128
List of Tables
xxiv
Table 17 – Assess the employee’s contribution to evaluating the team’s satisfaction
in responding to TRI – 4 for the Best and Worst Case Scenarios. .............. 130
Table 18 – The extent of the predicate tri – 4, obtained using the answers of the
employee # 1 to TRI – 4.............................................................................. 131
Table 19 – Answers from employee # 1 to RRI – 4 and CDRI – 4. ............................. 132
Table 20 – The tri – 4, rri – 4 and cdri – 4 predicates’ scopes computed in conformity
with the answers of the employee # 1. ........................................................ 132
Table 21 – A fragment of the knowledge base for costumers’ satisfaction assessment. 150
Table 22 – Confusion matrix regarding ANN model for customers’ satisfaction
assessment. ................................................................................................. 152
xxv
Acronyms, Initialisms and Abbreviations
AABB American Association of Blood Banks
A-ECM-WS Adjusted version of Eindhoven Classification Model for Water Sampling
AEMR-PS Adverse Events Manager Reports for Public Services
AERF-PS Adverse Event Reporting Forms for Public Services
AERLS-WS Adverse Event Reporting and Learning System related to Water Sampling
AN Anergy
ANNs Artificial Neural Networks
BCS Best Case Scenario
BOD Biochemical Oxygen Demand
CBR Case-Based Reasoning
CDRI – 4 Cleaning and Disinfection Related Items – Four Items
COD Chemical Oxygen Demand
COVID-19 Coronavirus Disease 2019
CTs Causal Trees
DM Data Mining
DO Dissolved Oxygen
DoC Degree-of-Confidence
ECM Eindhoven Classification Model
ECT Extended Causal Tree
EFQM The European Foundation for Quality Management
EFQM-EM The European Foundation for Quality Management Excellence Model
ERSAR Regulatory Entity for Water and Waste Services, from Portuguese
“Entidade Reguladora dos Serviços de Águas e Resíduos”
ESA Employee Satisfaction Assessment
EX Exergy
GDPR General Data Protection Regulation
Acronyms, Initialisms and Abbreviations
xxvi
HL7 PHR-S FM Functional Model of HL7 Personal Health Record System
ICT Information and Communication Technologies
IPAC Portuguese Institute of Accreditation, from Portuguese “Instituto Português
da ACreditação”
ISO International Standard Organization
ISO/IEC International Organization for Standardization/International Electrotechnical
Commission
KDD Knowledge Discovery in Databases
KMM Knowledge Manager Module
LP Logic Programming
MAE Mean Absolute Error
MRM Manager Reports Module
MSE Mean Square Error
NP EN Portuguese version of an European standard
NP EN ISO Portuguese version of an European standard developed by the International
Organization for Standardization
NP EN ISO/IEC Portuguese version of an European standard developed by the International
Organization for Standardization and the International Electrotechnical
Commission
NPV Negative Predictive Value
OQM Overall Quality Management
PDCA Plan, Do, Check and Act
PPV Positive Predictive Value
PS Public Services
QA Quality Assurance
QC Quality Control
QM Quality Management
QMS Quality Management System
QoI Quality-of-Information
R2 Determination Coefficient
Acronyms, Initialisms and Abbreviations
xxvii
RFM Reporting Forms Module
RRI – 4 Resources Related Items – Four Items
SARS-COV-2 Severe Acute Respiratory Syndrome Coronavírus 2
SARS-COV-2 Severe Acute Respiratory Syndrome Coronavírus 2
SP System Performance
TQM Total Quality Management
TRI – 4 Training Related with COVID–19 Items – Four Items
VA Vagueness
WCL Water Consumption Literacy
WCS Worst Case Scenario
WEKA Waikato Environment for Knowledge Analysis
WHO World Health Organization
1
Objectives
As Dreyfus et al. (1999) emphasise, organizations have been concerned with quality
related issues for many years. Quickly this concern has been extended to several areas,
including the laboratory area of analysis, test, and calibration. In addition to legal
requirements, which lead to high costs, competitiveness between laboratories has also
been increasingly frequent. Laboratories are increasingly asked to innovate, provide
better products and/or services, enable product and/or service customization, meet
deadlines, improve layouts, reduce accident rates, reduce waste/consumption, ensure
compliance legal provisions, ensure the protection of information, improve working
conditions, promote social responsibility policies, and above all, make a profit. In
addition, current methods of quality control and management involve many technical
and financial resources. Thus, it becomes necessary to find alternative solutions that
allow to reduce costs, without compromising the quality of the services provided.
The main goal of this study is the development of efficiency models for laboratories
using Artificial Intelligence based tools. To achieve this objective, studies with specific
goals were outlined, which are presented in four of the chapters of this thesis.
Chapter I
Bearing in mind the idea that biochemistry is transversal, that its wide range of
applications (e.g., in health and the environment) and its strong relationship with the
quality area, it is important to frame the theme through an approach to the concept of
quality, the presentation of the associated standards and the explanation of the
importance of Artificial Intelligence as a vehicle to achieve excellence in laboratories.
Chapter II
In this chapter, two studies related to Quality Control are presented. In the first one,
it is intended to build a model to prevent errors associated with the sampling process,
while in the second it is intended to develop models to predict water quality parameters.
Objectives
2
Chapter III
Quality Management is addressed through the presentation of three studies. The
first one intends to develop a model for recording and analysing adverse events that may
occur in daily work. In the second one, it is intended to develop a conceptual model that
supports studies that aim to assess the literacy levels of the population, in relation to the
theme of water and its relationship with health and sustainability. This study also
applies the model developed to the clients of a water laboratory to assess their literacy
in relation to water. Finally, the third study intends to characterize the psychosocial
risks to which employees in a cryopreservation laboratory are exposed, to assess their
awareness of these types of risks and, finally, to develop prediction models for their
management.
Chapter IV
Three studies related to Total Quality Management are presented, with the idea of
achieving the competitiveness and satisfaction of all the involved partners. The first one
intends to evaluate the implementation of the general data protection regulation in a
cryopreservation laboratory. The second one seeks to assess the satisfaction of
employees in a water analysis laboratory, regarding the new procedures implemented to
face the current pandemic scenario. Finally, in the third one, the intention is to assess
customer satisfaction in a water analysis laboratory accredited according to the ISO/IEC
17025 standard, on one hand, and to develop models for predicting customer
satisfaction, on the other hand.
3
Methodology
Throughout this work several methodologies for collecting and processing data were
adopted. They were chosen according to the type and objectives of each of the studies.
In this chapter, only general methodologies will be briefly mentioned. The detailed
description will be presented in each of the studies.
Study Locations
The different studies were carried out in different locations of different dimensions,
geographically differentiated (North zone, Central zone/metropolitan area of Lisbon and
South zone) and of different contexts, (e.g., water analysis laboratories, stem cell
cryopreservation laboratories and dialysis care clinics).
Data Collection
Data on water quality were collected in water analysis laboratories located in the
south of Portugal (municipalities of Santiago do Cacém and Sines). About the literacy
and satisfaction studies, it was decided to collect data that would allow us to obtain
answers with some statistical validity, for the questions under study. Thus, the choice of
the data-collecting instrument was the inquiry by questionnaire. This instrument has
some advantages such as faster data collection, greater simplicity in the analysis and
systematization of data, and the fact that it is cheap. The disadvantages include the
difficulty of conception and the low rates of return (Carmo & Ferreira, 1998). The
questionnaires were distributed during internal audits, in the context of the certification
and/or accreditation audit cycle. The questionnaires were delivered to the heads of the
laboratories to whom the objective of the study was explained. Those responsible
people who agreed to participate provided a collaborator for the delivery and collection
of the questionnaires. The referred employees were trained on the objectives and the
type of questionnaire to be able to clarify any doubts that someone could have during its
application. Finally, it should be noted that the participation in the study was voluntary
and that the provisions of the general data protection regulation of 25th May 2018 were
respected, the questionnaire was anonymous and confidential and the respondents were
informed of the objectives of the study.
Methodology
4
Data Processing
In the processing of the obtained data, tools from the Scientific Area of Artificial
Intelligence (e.g., Artificial Neural Networks, Case-Based Reasoning) were used, in
addition to the answer frequency analysis. The Knowledge Discovery in Databases was
the strategy followed to treat the results. For this purpose, it was chosen the Waikato
Environment for Knowledge Analysis (WEKA), a public-domain software. This tool
offers several forms of data pre-processing, several data mining algorithms, and several
methods for validating the results. It was developed in New Zealand, at the University
of Waikato, and uses the facilities provided by object-oriented programming, in Java
language. Regarding the data, they must be in a specific format (extension arff), which
is done through the converter, made available by the software, applicable to files of csv
or tsv type (Hall et al., 2009; Frank et al., 2016).
In some cases, the information collected is of a qualitative nature, so it necessary to
convert it to a numerical scale. For this purpose, it was chosen the graphic method
proposed by Fernandes et al. (2016a). In this method, for each dimension under study, a
circle of radius √1 𝜋⁄ divided into a number of parts with an equal area, corresponding
to the number of statements/questions to be considered. The answer alternatives were
indicated in the axes, and the area corresponding to the selected option was drawn. The
value corresponding to the dimension under study corresponds to the total area, i.e., the
sum of the partial areas.
The coincidence matrixes were used to validate the classification models obtained.
Based on the referred matrixes several metrics (e.g., sensitivity, specificity, accuracy,
positive predictive value, negative predictive value) were computed (Souza et al., 2002;
Florkowski, 2008; Vilhena et al., 2016). In the case of regression models, the errors or
deviations were calculated from which the mean absolute error and the mean square
error were obtained (McBride, 2005, Vicente et al., 2012b).

Chapter I. Introduction
Chapter I. Introduction
6
I.1. Overview
Despite that living beings are all macroscopically different, it has been noticed close
similarities in their biochemistry and for that reason biochemistry is a subject that aims
the global study of all beings and of life itself. Biochemistry has allowed (and it still
moves forward) the understanding of mechanisms that characterize the cellular functioning
of different tissues and organs, identifying the molecules that compose the cells (i.e., the
biomolecules), as well as the chain reactions between them (metabolic pathways). In
this way the biological phenomena can be explainable taking into account their chemical
reactivity. These scientific breakthroughs are important because they allow that some of
those phenomena can be observed in the laboratory, bringing endless advantages such
as the development and the study of some medicines before being applied directly to
living organisms. Nowadays biochemistry can be used in different areas, e.g., health
science, industry, and analytical methods, due to its transversal nature. The contemporary
society has shown more interest in this area because the environmental and health
problems are quite often explained with a strong interaction between the biochemistry
and the other knowledge areas, namely quality. Organizations have been increasingly
facing external exposures. To deal with this challenge, the organizations should improve
service quality, be more efficient, control costs, improve productivity rates, modernize,
use new technologies and teach employees new skills. Excellent organizations continually
design, manage, and improve their products, in order to satisfy their customers and
stakeholders or, in other words, to add value. In this context, Artificial Intelligence can
play a decisive role to improve products and services from different sectors of activity,
such as information technologies, telecommunications, medical systems, nanotechnology,
and biotechnology. The use of innovative biotechnologies has promoted a real revolution
in the treatment of diseases (e.g., the use of new medicines for human and animal
application), in the multiplication and reproduction of plant and animal species, in the
development and improvement of food, in the sustainable use of biodiversity and in new
waste treatments.
A laboratory equipped with a computational system that operationalizes its routines
and acts as a data and information repository can be used as a tool of great utility to
estimate costs and to manage other procedures that must be done. In Portugal, in the last
Chapter I. Introduction
7
decades, laboratories have been going through endless modifications, either to keep
pace with the technological evolution, or to establish themselves in an increasingly
competitive market. The standards created by the International Organization for
Standardization help to comply with the legislation associated with this sector of
activity and, allow to improve the quality of products and services worldwide.
I.2. Theoretical Perspectives
Quality is something connected to the human being, projecting itself in different acts,
even in the most common and automatic ones of daily life. The consumer who on
Saturdays walks around the market feeling and smelling pears and apples and
questioning the sellers, seeks quality fruit, rejecting those that do not follow the
standards defined and adopted by himself (António et al., 2016). The Portuguese Quality
Institute the entity designated for quality issues in Portugal, through the Decree-Law no.
140/2004 of 8th June, presents quality as a set of attributes and characteristics of an
entity or a product that define their ability to meet the needs and expectations of society.
Quality is also defined in ISO 9000 standards: Quality Management Systems –
Fundamentals and Vocabulary, as the degree of satisfaction of requirements, given by a
set of intrinsic properties. Several definitions of quality could be mentioned from the
most varied subjects and according to several authors. However, when analysed in
detail, it is clear that this is a large set of concepts, all with connecting points and
overlap, with their own relative importance (Hoyle, 2017; António et al., 2016). From a
historical point of view, significant changes have occurred approximately every twenty
years, in relation to the strategic approaches developed to achieve quality goals (Juran,
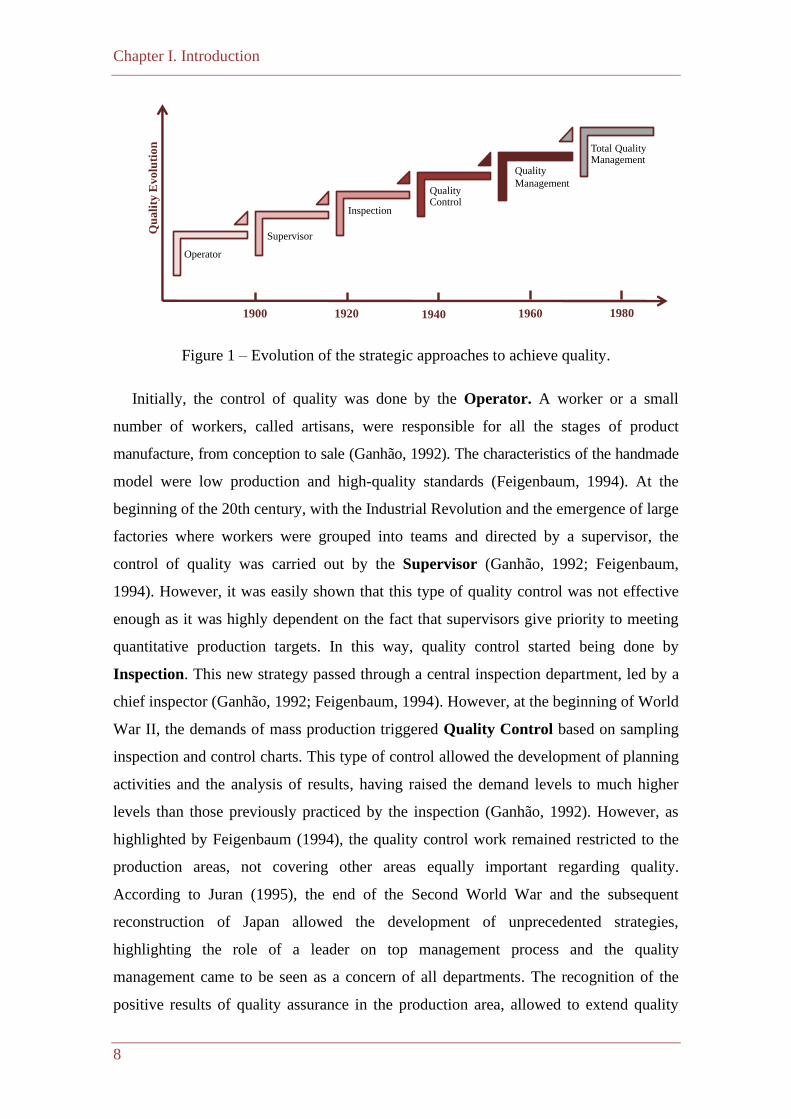
1995). This evolution, shown in Figure 1, includes six stages that will be briefly
described below.
Chapter I. Introduction
8
Figure 1 – Evolution of the strategic approaches to achieve quality.
Initially, the control of quality was done by the Operator. A worker or a small
number of workers, called artisans, were responsible for all the stages of product
manufacture, from conception to sale (Ganhão, 1992). The characteristics of the handmade
model were low production and high-quality standards (Feigenbaum, 1994). At the
beginning of the 20th century, with the Industrial Revolution and the emergence of large
factories where workers were grouped into teams and directed by a supervisor, the
control of quality was carried out by the Supervisor (Ganhão, 1992; Feigenbaum,
1994). However, it was easily shown that this type of quality control was not effective
enough as it was highly dependent on the fact that supervisors give priority to meeting
quantitative production targets. In this way, quality control started being done by
Inspection. This new strategy passed through a central inspection department, led by a
chief inspector (Ganhão, 1992; Feigenbaum, 1994). However, at the beginning of World
War II, the demands of mass production triggered Quality Control based on sampling
inspection and control charts. This type of control allowed the development of planning
activities and the analysis of results, having raised the demand levels to much higher
levels than those previously practiced by the inspection (Ganhão, 1992). However, as
highlighted by Feigenbaum (1994), the quality control work remained restricted to the
production areas, not covering other areas equally important regarding quality.
According to Juran (1995), the end of the Second World War and the subsequent
reconstruction of Japan allowed the development of unprecedented strategies,
highlighting the role of a leader on top management process and the quality
management came to be seen as a concern of all departments. The recognition of the
positive results of quality assurance in the production area, allowed to extend quality
Operator
Supervisor
Inspection
Quality Control
Total Quality Management
Qu
ali
ty E
vo
luti
on
1900 19601920 1940 1980
Quality
Management
Chapter I. Introduction
9
improvement practices to all activities/sectors of the company, which led to Quality
Management (Ross, 1999). However, it has been found that ensuring the quality of a
specific product or service is not enough. The focus should be on the quality of a
process as a whole, covering everything that happens in the company, being the customer
satisfaction the final goal (Ross, 1999). This is the concept Total Quality or Total
Quality Management, whose philosophy consists in the application of quality in all the
branches of the company. The implementation of the concept of continuous improvement,
aiming to obtain consumer satisfaction, is essential to achieve both competitiveness and
quality management (Pires, 2016). This philosophy had a great impact on engineering
practices, being at the basis of the evolution of current Quality Systems.
A System can be defined as a set of interdependent elements, which interact with
common objectives, forming a whole. Each element behaves as if it was a system itself,
contributing to an overall performance which is better than if the units operated
independently. Each system transforms inputs into outputs, in a dynamic relationship
with the environment, to achieve a common objective. A Quality Management System
can be understood as a management philosophy, which presupposes the involvement
and cooperation of all employees, aiming at providing products and services that satisfy
the needs and expectations of customers (Pinto & Soares, 2018).
In the following sections, a reflection will be made on the concept of quality in
laboratories since 1930, with the emergence of quality control, passing by quality
management until today, where it is intended to achieve the satisfaction of both
employees and customers through the total quality management.
I.3. Normative References
Analysis laboratories tend to rely almost entirely on tests to monitor and evaluate
their performance. The Internal Quality Control, based on the analysis of standard
samples whose reference values are known, and the External Quality Control, based on
blind samples whose results are reported to the organizing laboratory, are examples of
this (Kailner, 1998). However, it has become clearer that these tests are not enough to
guarantee quality in the laboratories, and it is necessary to consider other ways. In this
way, ISO 9000 standards created the basis for Quality Assurance Management with the
Certification function. The NP EN 45001:1990 standard “Criteria for the operation of
Chapter I. Introduction
10
Testing Laboratories”, in turn, was the first benchmark aimed at guaranteeing and
asserting the competence of laboratories in carrying out tests with the Accreditation
function. In general, the NP EN 45001 standard focuses on the technical competence of
testing laboratories to the detriment of quality management requirements, aimed at
customer satisfaction (Kohl, 1998).
With the publication of the ISO/IEC 17025 standard, was made an attempt to cover
topics from the Quality Management System (QMS) of a laboratory which were not
covered in the previous standard. This one includes all the management requirements of
the ISO 9001 standard relevant to the scope of the testing and calibration services
covered by the laboratory management system (Kohl, 1998). The fulfil of the QMS
requirements of ISO/IEC 17025, by a laboratory, means that it meets both the
requirements of technical competence and management, which are necessary to
guarantee consistent and technically valid results. However, it should be noted that
laboratories with the ISO/IEC 17025 accreditation cannot claim that they automatically
meet all the requirements of the ISO 9001 standard. To do that, they must apply for
certification by the ISO 9001 standard, separately.
The 2005 version of the ISO/IEC 17025 standard used a comprehensive and
transversal language, directed to any test and calibration laboratory. However, it was
clear the need for a standard exclusively directed to clinical laboratories, due to the
impact they have on the provision of services and the specificity of the samples used.
Thus, in 2007, the ISO 15189 standard appeared. It was developed based on the
ISO/IEC 17025 and ISO 9001 standards, which establish quality and competence
requirements for clinical laboratories, with a language and structure appropriate to the
sector, facilitating its understanding and implementation.
The standards NP EN ISO 15189 and NP EN ISO/IEC 17025 are structured in two
types of requirements, i.e., Management Requirements and Technical Requirements.
Notwithstanding the accreditation presupposes the fulfilment of all the requirements of
the reference standard, according to Yanikkaya-Demirel (2009), the following requirements
are considered as critical points for the implementation of the QMS in a laboratory:
• Facilities and environmental conditions;
• Laboratory equipment;
• Quality assurance of procedures and results, through measurement of uncertainties
and participation in external quality assessment programs; and
Chapter I. Introduction
11
• Presentation of results.
Concerning the facilities and environmental conditions requirement, there are some
points to be taken into account with regard to the laboratory space, viz.,
• A design that allows efficient operation as well as risk reduction;
• Good lighting, ventilation, water supply, waste disposal and environmental
conditions;
• An effective separation between areas where incompatible activities are carried
out, such as microbiology, which must be apart from the other areas;
• Control of access to areas likely to affect the quality of the results; and
• The cleaning of work areas and their maintenance, through procedures and
training of technicians and auxiliary staff (NP EN ISO 15189, 2014; NP EN
ISO/IEC 17025, 2018).
Another important requirement includes all instruments, reference materials,
consumables, reagents, and analytical systems. Laboratories must develop a programme
that shows regular calibration and preventive maintenance of equipment. Instructions
for selection, acquisition, calibration, validation and/or verification, maintenance, repair
or decommissioning of the equipment must also be established (NP EN ISO 15189,
2014; NP EN ISO/IEC 17025, 2018).
The standard references above mentioned have been revised and/or updated over the
years. In 2017 the ISO 17025 standard was revised leading to NP EN ISO/IEC
17025:2018. The latest updates of the NP EN ISO 15189 and NP EN ISO 9001
standards date from 2014 and 2015, respectively.
I.3.1. Laboratory Accreditation
The implementation of a QMS in the current scenario of the laboratories is a
prerequisite for survival since it allows them to comply with the requirements imposed
by the legislation in force, namely the accreditation. The accreditation process follows
the international standard ISO/IEC 17011, and it is governed by the principles of openness,
fairness, and non-discrimination. According to the Portuguese Institute of Accreditation
(IPAC), accreditation is the procedure through which it is formally recognized that an
entity is technically competent to perform a specific function, in accordance with
international, European or national standards (IPAC, 2020). The accreditation activity
Chapter I. Introduction
12
was performed by the Portuguese Quality Institute, whose responsibility and
competence were meanwhile attributed to the IPAC, which is now the regulator and
conformity assessment agent. Regarding the certification function, there was greater
decentralization, which can be carried out by entities accredited for the purpose.
According to the Decree-Law No. 140/2004 of 8th June, certification is the procedure
through which an accredited body gives a written guarantee that a product, process,
service, or system follows specified requirements.
The accreditation aims to guarantee the technical competence to carry out a specific
test or calibration. In addition, the incentive effect in promoting improvement within the
laboratories is also relevant. The IPAC provides the brand – accreditation and this
distinction must be used by accredited entities to benefit from national recognition and
show that they give relevance to the quality issues, helping clients to have confidence in
the results issued. Dugimont et al. (2006) list the advantages and disadvantages of
implementing a QMS aiming the accreditation. Regarding the advantages, they
highlight:
• The normalization of technical and administrative processes;
• Focus on customer satisfaction;
• The involvement of all employees and the guarantee of their technical competence;
• Greater credibility in the results;
• The comparability and reproducibility of the results issued;
• The increase of confidence between the parties involved;
• Ease of acquiring financing; and
• The continuous improvement of the service.
Regarding the disadvantages, the authors highlight the financial effort necessary to
ensure effectiveness in the implementation of the QMS, as well as the problems that
may arise from the constant updating of standards and equipment.
I.3.2. Quality Audits
In order to make an accurate assessment of the effectiveness of an organization
management system, it is necessary to carry out audits (Pinto & Soares, 2018).
According to the ISO 19011 standard, auditing is a systematic, independent, and
documented process that aims to obtain evidence to carry out an objective assessment,
Chapter I. Introduction
13
against previously established criteria (NP EN ISO 19011, 2019). The audit involves the
collection of data necessary for the correct analysis and assessment of compliance with
the requirements of the benchmark, including the requirements associated with
products, services and processes with a view to the timely detection of deficiencies,
anomalies or non-conformities. In order to avoid the subjectivity that is common in all
assessment, the following audit criteria should be taken into account:
• The criteria chosen to implement the system;
• The national legislation;
• The national and community standards;
• The regulations issued by reference bodies;
• The technical standards existing in each sector; and
• The specifications of products and services (Pinto & Soares, 2018).
The audit should be understood as a sampling process supported by objective
evidences, aiming to help the organization in the identification of non-compliant
situations and opportunities for improvement (NP EN ISO 19011, 2019). The audits are
carried out by external and independent entities that lead to the formal recognition that
the organization has a management system that complies with a certain reference
standard, resulting in the issue of a certificate.
I.4. Artificial Intelligence in Laboratories
Accreditation is extremely important for laboratory activity. The balance between the
quality requirements and the quick mutation of modern society is a challenge. In fact, it
is necessary to balance the expectations of consumers and citizens regarding new products
and services with the expectations about the requirements of safety, health, robustness,
reliability (Saltzman, 2015). The laboratories, regardless of being autonomous or integrated
into business groups, have already made their way along the line of digitization. Some
sectors were pioneers in the systematic digital approach of their activity, highlighting
those that operate in the context of clinical analyses, in testing areas associated with
technologically demanding industries and in the ones where safety is a fundamental
element. In the health sector the term eHealth came up to mention the tools and services
of Information and Communication Technologies (ICT) for health (Silva, 2013; Saltzman,
2015). Health information network, electronic health records, telemedicine services,
Chapter I. Introduction
14
health portals and many other ICT-based tools can help citizens and health professionals
in the prevention, diagnosis, and treatment of diseases, as well as monitoring health and
lifestyles (Pereira et al., 2011). The requirements in some of these areas have allowed
that, in many laboratories, there is now a perception of the way to follow in the digitization
process, recognizing that this is a particularly sensitive activity to technological evolution,
not only in the experimental context (instrumentation, knowledge and skills) but also by
the intensive integration of technologies in the development of products and services.
However, the future challenges are much more demanding. The development of smart
cities must include testing, inspection and certification entities, i.e., the development of
testing, inspection and certification sector in order to promote, in a broad sense, the
confidence to citizens (Saltzman, 2015). Smart cities require effective and efficient links
between resources, mobility, and services (i.e., technological components that guarantee
lighting, traffic, transport management, communication, water supply, energy, just to
name a few). Trust in systems and platforms requires testing, conformity assessment
and data management (Dobner & Frede, 2016). The latter is essential for the future of
laboratories. The existence of skills in new subjects, where data management or, in a
general context, data science stand out is of utmost importance. Data science is a key
element for the future. It is an interdisciplinary area that associates the analysis and
understanding of data to the decision-making process. The recent revision of the
ISO/IEC 17025:2017 standard brought an important update to the accreditation process.
The standard includes a consistent approach that promotes the digital transition, allowing
laboratories to build an activity model free of classical formal and documentary
constraints. Furthermore, it adopts a linear organizational view, aiming an integrative
perspective of resources and processes, more in line with the current organizational
structures of companies and laboratories (ISO/IEC 17025, 2017). Indeed, the current
version has a different view of laboratorial activity, perhaps due to the evolution of the
classic idea of laboratory. It not only considers the high level of technical competence
but also has started to include strategic and management elements. This review also
allowed the standardization of the concepts shared with ISO 9001 and other standards.
In order to respond to the challenges of the digital transition, the Portuguese laboratorial
organizations have been developing skills aiming to give a positive answer, being at the
forefront of the transition process, anticipating a successful adaption.
Chapter I. Introduction
15
I.5. Knowledge Discovery from Databases
Technological means have provided an exponential growth, both in number of
records and in complexity, regarding data storage. As a result of this effective increase
in information, its processing through traditional methods has become increasingly difficult
and complex. In this way, applications aimed to the task of knowledge discovery in
databases have emerged, incorporating Data Mining (DM) tools (Han et al., 2012;
Witten et al., 2017).
The concept Knowledge Discovery from Databases (KDD) appeared in 1989, as a
reference to the broader concept of searching for knowledge in data, being a process
that involves the identification and recognition of patterns or trends, in a database, in an
autonomous and possibly automatic way (Han et al., 2012; Witten et al., 2017). As it can
be seen in Figure 2, the KDD process depends on a new generation of data analysis tools
and techniques that involves several steps, namely selection, data pre-processing, data
transformation, data mining and interpretation (Han et al., 2012; Witten et al., 2017).
Although Figure 2 may suggest the existence of a linear path, this is not always the case.
At each stage, the need to return for each of the previous phases can be identified. For
example, if in the DM phase it is concluded that the data are not fully coherent or the
need to include a new data is verified, this can lead to the return to previous phases.
As previously mentioned, the DM stage is only one stage of the KDD process. It
consists in choosing and using the methods and techniques that best fit the fulfilment of
the established objectives. In general, objectives can be divided into two groups, i.e.,
prediction and description. In the case of prediction, it is intended to infer future behaviors
based on past experiences, whereas in the description it is intended to describe compactly
sets of data or variable associations (Han et al., 2012).
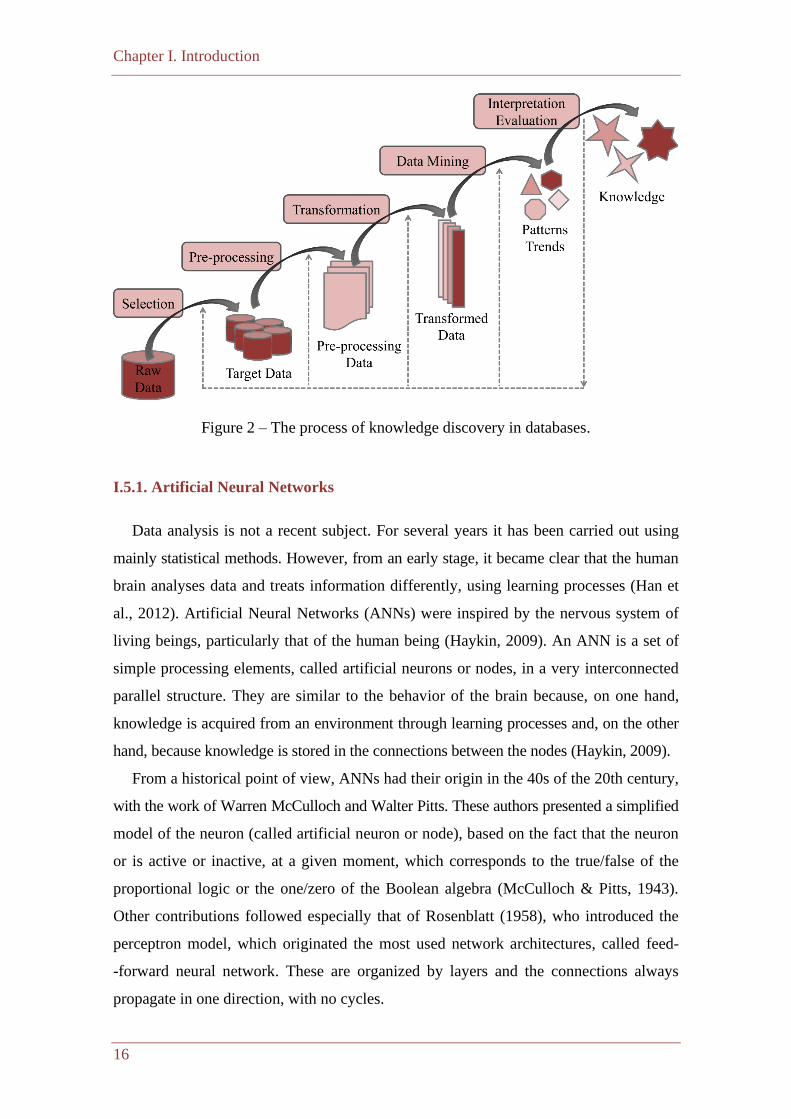
Chapter I. Introduction
16
Figure 2 – The process of knowledge discovery in databases.
I.5.1. Artificial Neural Networks
Data analysis is not a recent subject. For several years it has been carried out using
mainly statistical methods. However, from an early stage, it became clear that the human
brain analyses data and treats information differently, using learning processes (Han et
al., 2012). Artificial Neural Networks (ANNs) were inspired by the nervous system of
living beings, particularly that of the human being (Haykin, 2009). An ANN is a set of
simple processing elements, called artificial neurons or nodes, in a very interconnected
parallel structure. They are similar to the behavior of the brain because, on one hand,
knowledge is acquired from an environment through learning processes and, on the other
hand, because knowledge is stored in the connections between the nodes (Haykin, 2009).
From a historical point of view, ANNs had their origin in the 40s of the 20th century,
with the work of Warren McCulloch and Walter Pitts. These authors presented a simplified
model of the neuron (called artificial neuron or node), based on the fact that the neuron
or is active or inactive, at a given moment, which corresponds to the true/false of the
proportional logic or the one/zero of the Boolean algebra (McCulloch & Pitts, 1943).
Other contributions followed especially that of Rosenblatt (1958), who introduced the
perceptron model, which originated the most used network architectures, called feed-
-forward neural network. These are organized by layers and the connections always
propagate in one direction, with no cycles.
Chapter I. Introduction
17
The artificial neuron, commonly called node, is the basic processing unit of an ANN.
Although there are several types of nodes, in general, they all behave like comparators that
produce an output when the cumulative effect of the inputs exceeds a given limit value.
According to Haykin (2009), a node is made up of three fundamental elements:
• A set of connections (x1, x2, ..., xn), each labelled by weight (wij), i.e., a real or
binary number that has an excitatory or inhibitory effect depending on whether it
has positive or negative values. Sometimes there is an additional node, called
“bias”, whose value is +1 that aims to establish the correct operational conditions
for the network;
• An integrator, which reduces the input values to a single value (μi); and
• An activation function (f), which can condition the amplitude of the output signal
(si), introducing a nonlinear component in the computational process.
With regard to activation functions, the Heaviside step function is normally used in
McCulloch-Pitts nodes, where the output takes the value +1 only if the gain is non-
negative, obeying a philosophy of all or nothing. The logistic activation and hyperbolic
tangent functions, as well as the Gaussian and the square ones, introduce a nonlinear
component to the computational process. The logistic function, also known as the sigmoid
function, is the most used activation function in ANNs (Haykin, 2009).
Establishing the best network topology to respond to a given problem is a complex
and crucial task. However, there are no clear rules for establishing either the number of
intermediate layers or the number of nodes that constitute them. In most cases, the
establishment of the best network topology is done by trial and error, starting with an
initial structure that is selectively modified to minimize an error metric (Witten et al., 2017).
Regarding the training of neural networks, the backpropagation algorithm (Rumelhart
et al., 1986) and its variants (Riedmiller, 1994) are reference algorithms, being efficient
computational tools for the training of ANNs. They are based on gradient descent methods
and seek to minimize the error function in the weight search space, in order to find the
optimal set of weight values that, in an ideal situation, would result in the correct
outputs for any input.
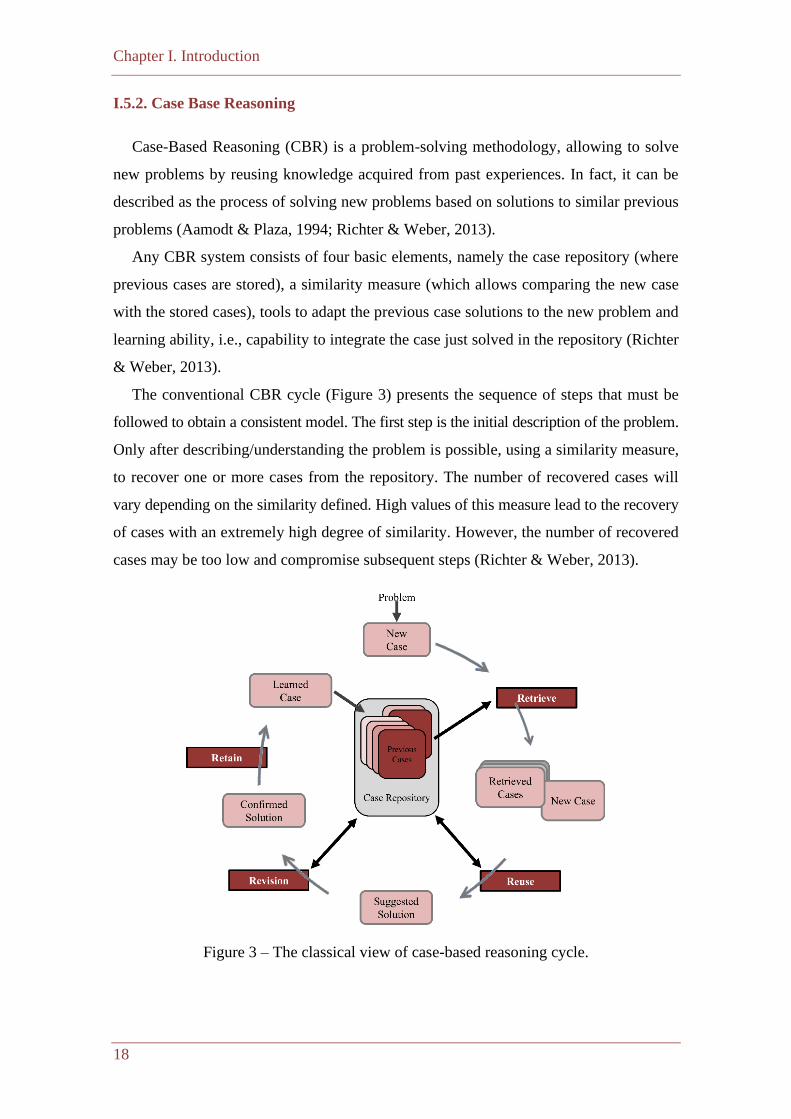
Chapter I. Introduction
18
I.5.2. Case Base Reasoning
Case-Based Reasoning (CBR) is a problem-solving methodology, allowing to solve
new problems by reusing knowledge acquired from past experiences. In fact, it can be
described as the process of solving new problems based on solutions to similar previous
problems (Aamodt & Plaza, 1994; Richter & Weber, 2013).
Any CBR system consists of four basic elements, namely the case repository (where
previous cases are stored), a similarity measure (which allows comparing the new case
with the stored cases), tools to adapt the previous case solutions to the new problem and
learning ability, i.e., capability to integrate the case just solved in the repository (Richter
& Weber, 2013).
The conventional CBR cycle (Figure 3) presents the sequence of steps that must be
followed to obtain a consistent model. The first step is the initial description of the problem.
Only after describing/understanding the problem is possible, using a similarity measure,
to recover one or more cases from the repository. The number of recovered cases will
vary depending on the similarity defined. High values of this measure lead to the recovery
of cases with an extremely high degree of similarity. However, the number of recovered
cases may be too low and compromise subsequent steps (Richter & Weber, 2013).
Figure 3 – The classical view of case-based reasoning cycle.
Chapter I. Introduction
19
In the reuse phase, a possible solution to the problem emerges based on the adaptation
of the recovered cases to the new case. However, automatic adaptation is almost
impossible, so the opinion of the user becomes essential. Thus, in the review phase, the
solution suggested by the system is tested by the user, allowing for its correction, adaptation
and/or modification, giving rise to the confirmed solution, i.e., the solution for the new
case. This phase involves an iterative process as the solution must be tested, adapted and/or
modified as many times as necessary to ensure the desired result. Finally, during the
retention stage, the new case is learned, and the knowledge base updated with the new
case (Aamodt & Plaza, 1994; Richter & Weber, 2013).
Despite the promising results, the current CBR systems are neither complete nor
sufficiently adaptable to all domains. In some cases, they do not allow the user to
choose the similarity function, which translates into a limitation. In addition, the existing
CBR systems have limitations related to their ability to deal explicitly with unknown,
incomplete, and/or contradictory information. In fact, this constraint is particularly
compromising on real problems, where information is not always complete. In an attempt
to solve the problems related to incomplete information, Fernandes et al. (2016a)
introduced a new cycle for RBC (Figure 4) that includes a standardization phase where
the Quality-of-Information and the Degree-of-Confidence of each case is taken into
account, allowing to represent, in the Cartesian plane, the cases stored in the repository
and, through unsupervised learning methods, reduce the search space and make the
recovery process more effective. This methodology allows to deal explicitly with
incomplete information, responding to one of the main limitations of the conventional
CBR cycle. In addition to the above, this approach allows the optimization of recovered
cases whenever the suggested solution is not in accordance with the intended objectives.
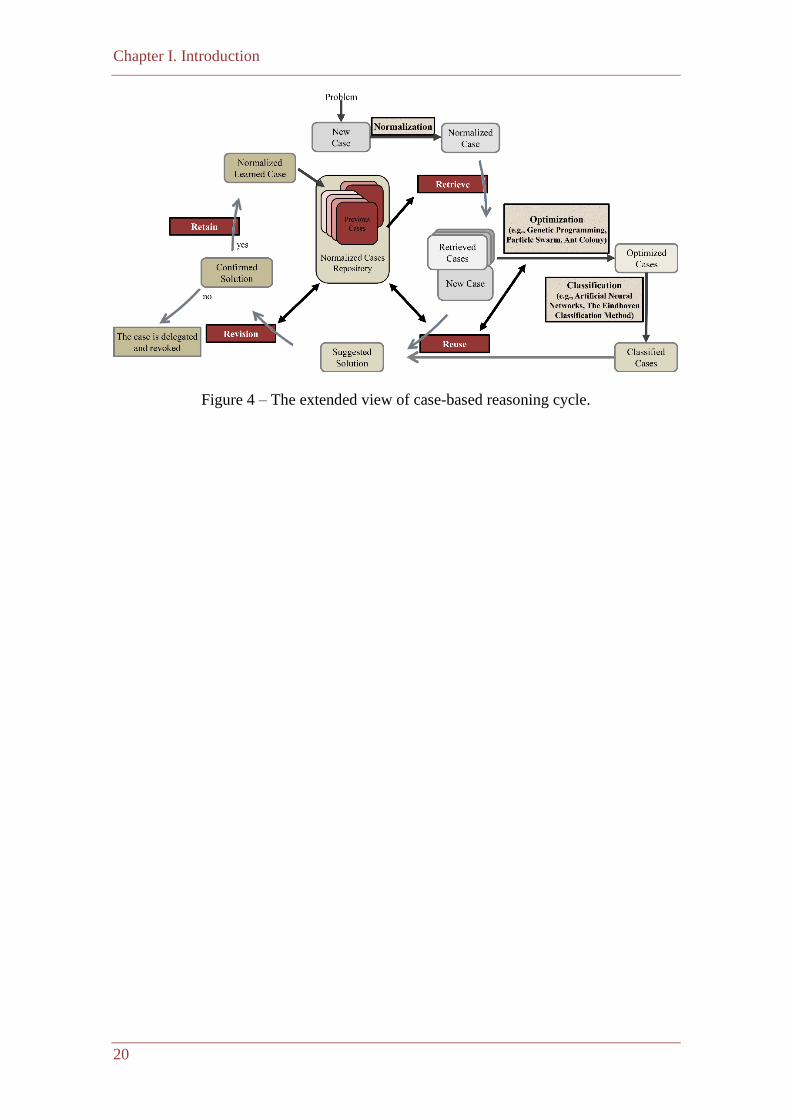
Chapter I. Introduction
20
Figure 4 – The extended view of case-based reasoning cycle.

Chapter II. Quality Control
Chapter II. Quality Control
22
II.1. Overview
Nowadays the environment is experiencing serious problems, many of which are
caused by excessive consumption and/or misuse of natural resources (e.g., water, oil,
fishing). The direct or indirect impacts on the environment, which are often local, have,
however, global repercussions. With regard to the predisposition of the Portuguese
business in relation to environmental issues, the situation is much better than a decade
ago, as evidenced by the growing number of organizations that obtain environmental
certification, the number of laboratories that obtain accreditation and the application of
computational techniques in the development of environmentally friendly solutions.
The importance of water, as a natural element indispensable to life, has been recognized
since the beginning of the existence of Man on Earth. Throughout the ages, rivers have
marked, in a decisive way, the settlement of populations and the evolution of great
civilizations, whose culture and skills appear closely linked to the use of water (Serralheiro,
2001; Lehr & Keeley, 2005a; Haidvogl, 2018). However, it was only in the middle of
the 20th century that Humanity became aware of the value of the renewable resource
water as a basic factor of economic and social development, as a result of the increasing
pressure related to the demographic growth, by the promotion of agricultural and industrial
production and by the progressive urban concentration (Lehr & Keeley, 2005a; Lehr &
Keeley, 2005b).
The problem of water, which includes the use and management of available water
resources, is not a purely quantitative problem within its biogeochemical cycle, but it is
mainly a qualitative problem (Mendes & Oliveira, 2004; Poppe et al., 2018). Water is
not found in nature in its pure state, i.e., it does not appear as a colourless, odourless,
and tasteless compound. On the contrary, it contains dissolved and/or suspended foreign
substances that can condition its possible uses (Mendes & Oliveira, 2004; Bagchi,
2013). This fact originates the need to associate the quantification of water resources
with the indication of their quality. In this context, water quality can be defined as a set
of parameters and characteristics that will determine its adaptability to certain well-
specified purposes (Mendes & Oliveira, 2004).
The need to guarantee the consumer a high-quality water presupposes its control not
only at the point of consumption, but also in the collection. Thus, regulatory authorities
Chapter II. Quality Control
23
establish quality standards for both raw water sources and distribution and consumption
points. In Portugal, the Regulatory Entity for Water and Waste Services (ERSAR) is the
competent authority for the inspection of the quality of water for human consumption
(Vieira, 2018). This entity aims to comply with the legislation associated with water, in
particular the Decree-Law No. 236/98, of 1 August. This legislation establishes quality
standards, criteria and objectives for water intended to produce water for human
consumption, transposing the Directive 75/440/EC into national law. The standards for
the control of the quality of water for human consumption in Portugal have followed the
modernization of the European regulatory framework. For example, the Directive 98/83/EC
on the quality of water intended for human consumption, was transposed to the Decree-
-Law no. 306/2007 of 27 August, and subsequently revised by the Decree-Law no.
152/2017, of 7 December. This legal framework provides the use of EN ISO/IEC 17025
(or other internationally accepted standards) for the validation of analysis methods.
Although water supply systems can be contaminated by a wide variety of substances,
only a limited number of them are a threat to human health (Serralheiro, 2001). National
legislation on water intended for human consumption establishes acceptable values for
microbiological, chemical and indicator parameters that resulted from the transposition
of European directives into national law. However, pathogenic microorganisms are a
priority in any monitoring program, as they represent a more serious risk to the safety of
water intended for human consumption, considering their epidemiological relevance
(Vieira, 2018). Chemical and radiological contamination can, in specific cases, cause
harmful effects. However, this type of contamination is related to localized natural
conditions or are the result of specific outbreaks of pollution due to anthropogenic
action (Schäfer & Bundschuh, 2018).
The verification of the conformity of the quality of water for human consumption is
carried out through the monitoring of microbiological, chemical parameters and
indicators that are grouped into two types of control (i.e., routine control and inspection
control). The first aims to provide regular information on the organoleptic and
microbiological quality of the water, as well as on the effectiveness of treatments,
particularly disinfection (Mendes & Oliveira, 2004). Inspection control aims to verify
compliance with the parametric values stipulated by law. The minimum sampling
frequency is determined by the priority given to the parameters to be monitored,
considering the type of control. Sampling is a decisive step in the control of water
quality, because the sample must represent, in a reliable way, the water situation at the
Chapter II. Quality Control
24
time of collection (Relacre, 2017). After the samples arrive at the laboratory, a set of
techniques and activities of an operational nature are triggered to meet the quality
requirements (Relacre, 2017). Experience has shown that for most of the parameters
analysed (especially the physical-chemical parameters), the concentrations present do
not often violate the limit values (Vieira, 2018). In this way, considering the costs
associated with monitoring parameters without much practical relevance, it is necessary
to find alternative solutions that allow reducing costs without compromising water
quality control. In this context, can be referred the introduction of flexible monitoring
frequencies or the application of tools based on Artificial Intelligence, which have been
applied with great success in several scientific areas (Pinto et al., 2009; Caldeira et.al,
2011; Vicente et al., 2012b; Couto et al., 2012; Martins et.al, 2015; Vicente et al., 2015;
Ahmed, 2017; Loucks & Beek, 2017; Allawi et al., 2018; Ruben et al., 2018 Chen et al.,
2019). In this way, management entities may be exempted from some of the provisions
of the water quality control programs, provided that credible risk assessments are
carried out, based on national guidelines or the World Health Organization (WHO) for
the quality of the water for human consumption.
In this chapter we will address the issue related to water quality, presenting the
following studies:
• II.2 – Avoidance of Sampling Errors in Drinking Water Analysis – A Logical
Approach to Programming1
• II.3 – Draw on Artificial Neural Networks to Assess and Predict Water
Quality2
In these studies, methodologies from the Artificial Intelligence scientific area were
used, which can be applied in laboratories or in water management entities, in order to
prevent errors associated with the sampling process (study II.2) and to predict some
parameters (study II.3) without compromising water quality and protection of human
health.
1 Submitted to Water Practice and Technology.
2 Published in IOP Conference Series: Earth and Environmental Science, 612: 012028, 2020.
Chapter II. Quality Control
25
II.2. Avoidance of Sampling Errors in Drinking Water Analysis – A
Logical Approach to Programming
II.2.1. Introduction
Securing water quality for human consumption through a public supply system is an
essential element of health policy. By the end of the 19th century, the assessment and
control of the risks to human health from the transmission of diseases caused by water
consumption was carried out empirically on the basis of the physical appearance of the
water (Bagchi, 2013). The epidemiological studies conducted by John Snow showed the
close association between the consumption of water with fecal contamination and a
cholera outbreak in London (Snow, 1855). The discovery of the existence of
microorganisms by Louis Pasteur in 1863 and the isolation of Vibrio cholera bacillus in
1883 by Robert Koch formed the crucial scientific basis for the association of water use
with public health and served as a starting point for the establishment of practices and
protocols to control water quality (Geison, 1995; Brock, 1999). Until the middle of the
20th century, the quality of water for human consumption was largely assessed based on
its organoleptic characteristics, i.e. colorless, tasteless, and odorless (Baird et al., 2017).
However, this type of assessment does not guarantee the protection of public health
from pathogenic microorganisms and hazardous chemicals. It was therefore imperative
to establish parametric standards that define the properties of water for human
consumption in terms of microbiological, physical, chemical, and radiological parameters
(ISO/IEC 17025, 2017). Current methods of controlling water quality are time
consuming, complex, expensive, and have some known limitations. Indeed, the process
of controlling water quality is complex and diverse and involves a large number of
technical and financial resources (e.g. calibrated equipment, infrastructure, skilled
technicians and reagents). With all this complexity, a large number of errors can occur
(Byleveld et al., 2008). A failure can be defined as failure of a planned action, use of an
incorrect plan and can be in connection with products, processes, and systems
(Hommerson et al., 2008). The best way to prevent similar errors from happening again
is to report them, i.e. create experiential learning systems to identify their causes.
Although this approach is widely used in the water sector, it is important to note that
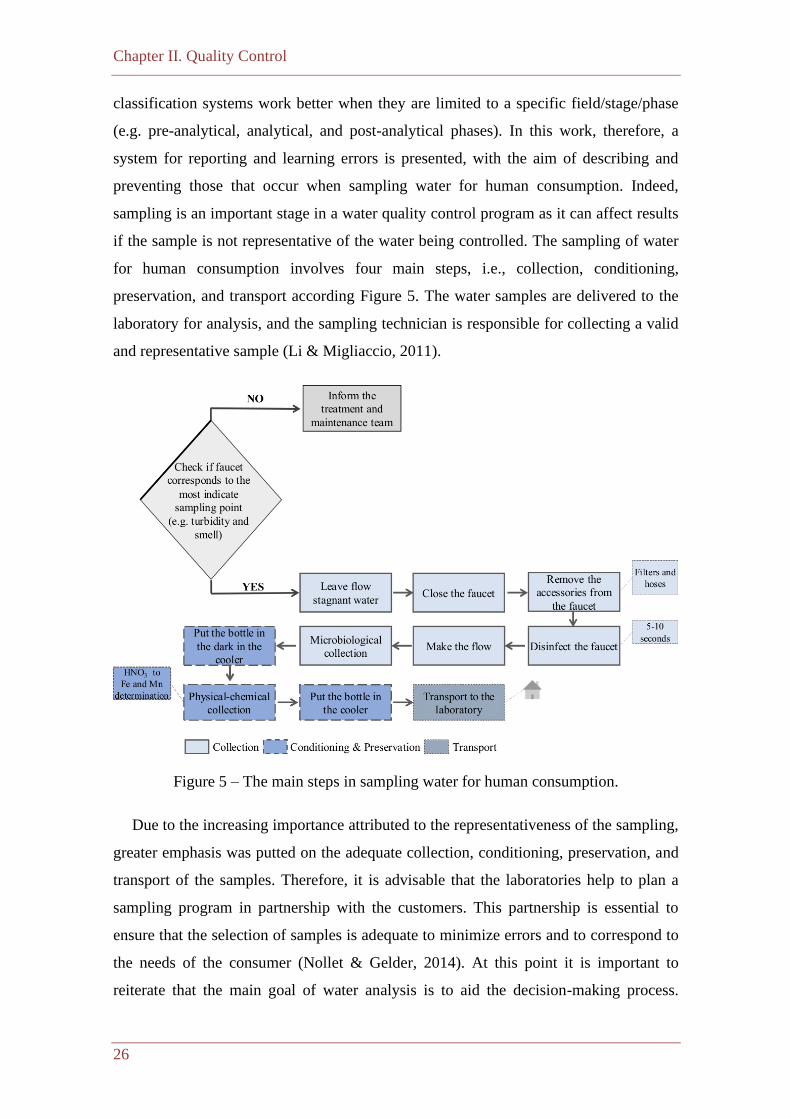
Chapter II. Quality Control
26
classification systems work better when they are limited to a specific field/stage/phase
(e.g. pre-analytical, analytical, and post-analytical phases). In this work, therefore, a
system for reporting and learning errors is presented, with the aim of describing and
preventing those that occur when sampling water for human consumption. Indeed,
sampling is an important stage in a water quality control program as it can affect results
if the sample is not representative of the water being controlled. The sampling of water
for human consumption involves four main steps, i.e., collection, conditioning,
preservation, and transport according Figure 5. The water samples are delivered to the
laboratory for analysis, and the sampling technician is responsible for collecting a valid
and representative sample (Li & Migliaccio, 2011).
Figure 5 – The main steps in sampling water for human consumption.
Due to the increasing importance attributed to the representativeness of the sampling,
greater emphasis was putted on the adequate collection, conditioning, preservation, and
transport of the samples. Therefore, it is advisable that the laboratories help to plan a
sampling program in partnership with the customers. This partnership is essential to
ensure that the selection of samples is adequate to minimize errors and to correspond to
the needs of the consumer (Nollet & Gelder, 2014). At this point it is important to
reiterate that the main goal of water analysis is to aid the decision-making process.
Chapter II. Quality Control
27
Thus, the reliability of the decisions depends on the uncertainty of the experimental
results. If the uncertainty is underestimated wrong decisions can occur with negative
consequences for health, environment, and financial issues, just to name a few. Indeed,
the errors that occur during the water analysis process are difficult to quantify.
Inadequate training, reliance on automated systems and confusing software resources
are some of the relevant issues behind the errors that may occur (Reason, 2000).
Knowledge is crucial to solve the problems of the economy and society. In everyday
situations, however, the information is often incomplete, inaccurate, uncertain,
contradicting and even unknown. On the other hand, existing models are built based on
some idealizations that remove these real-world properties. The result is a system that,
due to its inability to model the world or universe of discourse, never delivers the
expected answers (Parsons, 1996).
In the water sector, particularly regarding sampling errors, there are many situations
where the information available on errors is insufficient or ambiguous. The system
proposed in this work is based on the Eindhoven Classification Model (ECM) and
focuses on avoiding the causes of errors by applying a model specially developed for
the sampling phase. This system aims to record the nonconformities, errors, and adverse
events. In addition, there should be a learning system that enables data analysis to
ensure the continuous improvement of drinking water quality and the promotion of
public health.
The ECM was set up to address human error in the chemical process industry and has
then been applied in different areas like the steel industry, power generation, healthcare,
water distribution or public administration (Henneman et al., 2006; Raab et al., 2006;
Simmons & Graves, 2008; Rodrigues et al., 2011; Vicente et al., 2015; Fernandes et al.,
2019). The ECM contains two types of errors, namely human or active errors and the
latent ones. Regarding human error, the ECM incorporates Rasmussen’s Skill-Rule-
Knowledge framework, which includes three levels of behavior, i.e., the competence-
based, the rule-based and the knowledge-based one (Rasmussen, 1976). In the case of
latent errors, ECM differentiates between technical and organizational errors (van der
Schaaf, 1995). The former one occurs when there is an obstacle associated with physical
components (e.g. devices, physical installations), while the latter is associated with
protocols, procedures, or knowledge transfers.
Chapter II. Quality Control
28
II.2.2. Related Work
The need for accurate predictions of water quality has encouraged researchers to
develop new methods and improve the predictive capabilities of traditional ones. On the
other hand, the potential of artificial intelligence based problem-solving methods has
also been recognized significantly in the water industry. Several studies in the literature
illustrate the application of these tools to quality water control, but very few relate to the
drinking one. Indeed, water quality modeling is a powerful tool for studying, describing,
and predicting the ecological status of an aquatic ecosystem. Wang et al. (2019)
developed an artificial intelligence-based system called the Integrated Long Short-Term
Memory Network that uses cross-correlation and association rules to identify the properties
of water pollutants and track industrial point sources of pollutants.
Forio et al. (2017) analyze the effect of the major environmental variables on
predicting ecological water quality, using fuzzy models. The optimal model was
selected based on the predictive performance, ecological relevance, and interpretability.
Morales-Torres et al. (2016) presented a study about the use of sustainable drainage
systems to manage urban runoff, aiming to contribute to environmental and landscape
improvement. The authors developed a tool to analyze the impact of storm water
management in the urban environment and introduced energetic and environmental
criteria in the decision-making process. Stefanovic et al. (2015) developed a web-based
system to manage the Serbian reservoirs. The authors created a software that brings
together all the pertinent actors, processes, data sources, and applications. The software
allows to test different organizational scenarios, due to its flexibility, extensibility, and
the fact that it could be customized. Allan et al. (2013) studied the effects of regulation,
proprietorship, and business culture on the risk management within the water sector.
The authors stress that a paradigm shift is necessary. The water sector should move
from a reactive to a pro-active risk management culture based on knowledge. However,
the authors state that there is a gap in the understanding of the drivers required to carry
out such a change. Pearson et al. (2010) presented a decision support system to support
managers in the urban water sector. The proposed system aims to shift the decision-
making from the conventional standards to a sustainable, inclusive, and dynamic
paradigm, anchored by social learning and commitment. The authors stressed the basic
units of social learning, i.e., knowledge transfer for transformation, monitoring and
evaluation of the decision process and stakeholder engagement.

Chapter II. Quality Control
29
II.2.3. Methods
An adjusted version of the ECM was conceived, with the extensions and adaptations
for the water sampling scenarios, as well as the causal trees that describe the root causes
of errors. The data used in this work were obtained during 1st semester of 2019, in
internal audits carried out at water laboratories within the scope of ISO/IEC 17025:2017
quality accreditation. Checklists were used to record the non-conformities. In the
checklists, the verified observations are organized according to the general and specific
requirements of the ISO/IEC 17025 standard. The non-conformities were classified into
major non-conformity, minor non-conformity, and opportunity for improvement, and in
terms of the ECM, are referred as adverse events or errors.
The formal approach of the proposed errors reporting system in water sampling is
based on the Logic Programming (LP) paradigm for problem solving and set according
to an extension to the LP language (Neves, 1984). Undeniably, there are many
approaches to knowledge representation and reasoning using the epitome of LP, namely
in the areas of model theory and proof theory. In this paper, the proof theoretical
approach for problem solving was adopted and conveyed as an extension of the LP
language. Indeed, an extended logic program is grounded on a specified ensemble of
clauses in the form, viz.
{
¬ 𝑝 ← 𝑛𝑜𝑡 𝑝, 𝑛𝑜𝑡 𝑒𝑥𝑐𝑒𝑝𝑡𝑖𝑜𝑛𝑝
𝑝 ← 𝑝1,⋯ , 𝑝𝑛, 𝑛𝑜𝑡 𝑞1, ⋯ , 𝑛𝑜𝑡 𝑞𝑚
? (𝑝1,⋯ , 𝑝𝑛, 𝑛𝑜𝑡 𝑞1, ⋯ , 𝑛𝑜𝑡 𝑞𝑚) (𝑛,𝑚 ≥ 0)
𝑒𝑥𝑐𝑒𝑝𝑡𝑖𝑜𝑛𝑝1 , ⋯ , 𝑒𝑥𝑐𝑒𝑝𝑡𝑖𝑜𝑛𝑝𝑗 (0 ≤ 𝑗 ≤ 𝑘), 𝑏𝑒𝑖𝑛𝑔 𝑘 𝑎𝑛 𝑖𝑛𝑡𝑒𝑔𝑒𝑟 𝑛𝑢𝑚𝑏𝑒𝑟
}
Program 1 – The archetype of an extended logic program.
The first clause denotes predicate’s closure, “,” designates “logical and”, while “?” is
a domain atom denoting “falsity”, the pi, qj, and p are classical ground literals, i.e.,
either positive atoms or atoms preceded by the classical negation sign . Indeed,
stands for a strong declaration and speaks for itself, while not denotes negation-by-
Chapter II. Quality Control
30
failure, i.e., a failure in proving a certain statement since it was not declared in an
explicit way. According to this way of thinking, a set of abducibles are present in every
program (Neves, 1984). In this work are given in the form of exceptions to the extensions
of the predicates that make the program, i.e., clauses of the form, viz.
𝑒𝑥𝑐𝑒𝑝𝑡𝑖𝑜𝑛𝑝1 , ⋯ , 𝑒𝑥𝑐𝑒𝑝𝑡𝑖𝑜𝑛𝑝𝑗 (0 ≤ 𝑗 ≤ 𝑘), 𝑏𝑒𝑖𝑛𝑔 𝑘 𝑎𝑛 𝑖𝑛𝑡𝑒𝑔𝑒𝑟 𝑛𝑢𝑚𝑏𝑒𝑟
that denote data, information or knowledge that cannot be ruled out. On the other hand,
clauses of the type, viz.
? (𝑝1,⋯ , 𝑝𝑛, 𝑛𝑜𝑡 𝑞1, ⋯ , 𝑛𝑜𝑡 𝑞𝑚) (𝑛,𝑚 ≥ 0)
are invariants that make it possible to specify the context under which the universe of
discourse should be understood (Neves, 1984).
II.2.4. Results and Discussion
Table 1 lists the adverse events recorded during 1st semester of 2019, as well as the
frequency of occurrence. A perusal of Table 1 reveals that 128 adverse events occurred.
Considering the general requirements of the ISO/IEC 17025 standard, 28.9% of the
occurrences are related Resource Requirements, 53.9% are associated with Processes
Requirements, whereas 17.2% are linked to Management System Requirements. In terms
of non-conformities, 81.2% were classified as minor non-conformity (N) and 18.8%
corresponds to major non-conformity (M).
Considering the data presented in Table 1, it can be argued that the sample-related
adverse events occur much more frequently than the others, which requires special
attention.
II.2.4.1. The Adjusted version of the Eindhoven Classification Model for Water
Sampling
In order to isolate a customized version of the ECM for a particular problem, it is of
the utmost importance to identify all the causes that lead to such an undesirable event. To
adapt the ECM to the problems related to the sampling of water for human consumption,
new dimensions have been considered. These dimensions aim to adjust the original
model to sampling context and supply a general view of the events that can happen. The
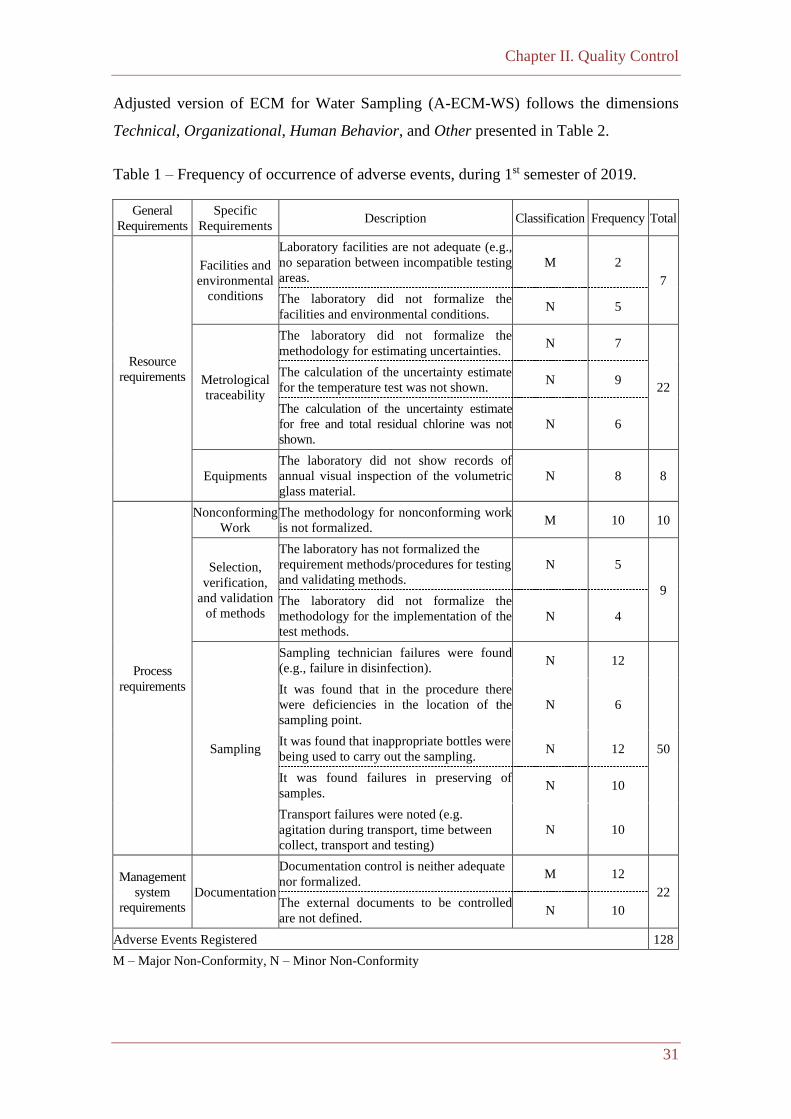
Chapter II. Quality Control
31
Adjusted version of ECM for Water Sampling (A-ECM-WS) follows the dimensions
Technical, Organizational, Human Behavior, and Other presented in Table 2.
Table 1 – Frequency of occurrence of adverse events, during 1st semester of 2019.
General
Requirements
Specific
Requirements Description Classification Frequency Total
Resource
requirements
Facilities and
environmental
conditions
Laboratory facilities are not adequate (e.g.,
no separation between incompatible testing
areas.
M 2
7
The laboratory did not formalize the
facilities and environmental conditions. N 5
Metrological
traceability
The laboratory did not formalize the
methodology for estimating uncertainties. N 7
22
The calculation of the uncertainty estimate
for the temperature test was not shown. N 9
The calculation of the uncertainty estimate
for free and total residual chlorine was not
shown.
N 6
Equipments
The laboratory did not show records of
annual visual inspection of the volumetric
glass material.
N 8 8
Process
requirements
Nonconforming
Work
The methodology for nonconforming work
is not formalized. M 10 10
Selection,
verification,
and validation
of methods
The laboratory has not formalized the
requirement methods/procedures for testing
and validating methods.
N 5
9 The laboratory did not formalize the
methodology for the implementation of the
test methods.
N 4
Sampling
Sampling technician failures were found
(e.g., failure in disinfection). N 12
50
It was found that in the procedure there
were deficiencies in the location of the
sampling point.
N 6
It was found that inappropriate bottles were
being used to carry out the sampling. N 12
It was found failures in preserving of
samples. N 10
Transport failures were noted (e.g.
agitation during transport, time between
collect, transport and testing)
N 10
Management
system
requirements
Documentation
Documentation control is neither adequate
nor formalized. M 12
22 The external documents to be controlled
are not defined. N 10
Adverse Events Registered 128
M – Major Non-Conformity, N – Minor Non-Conformity
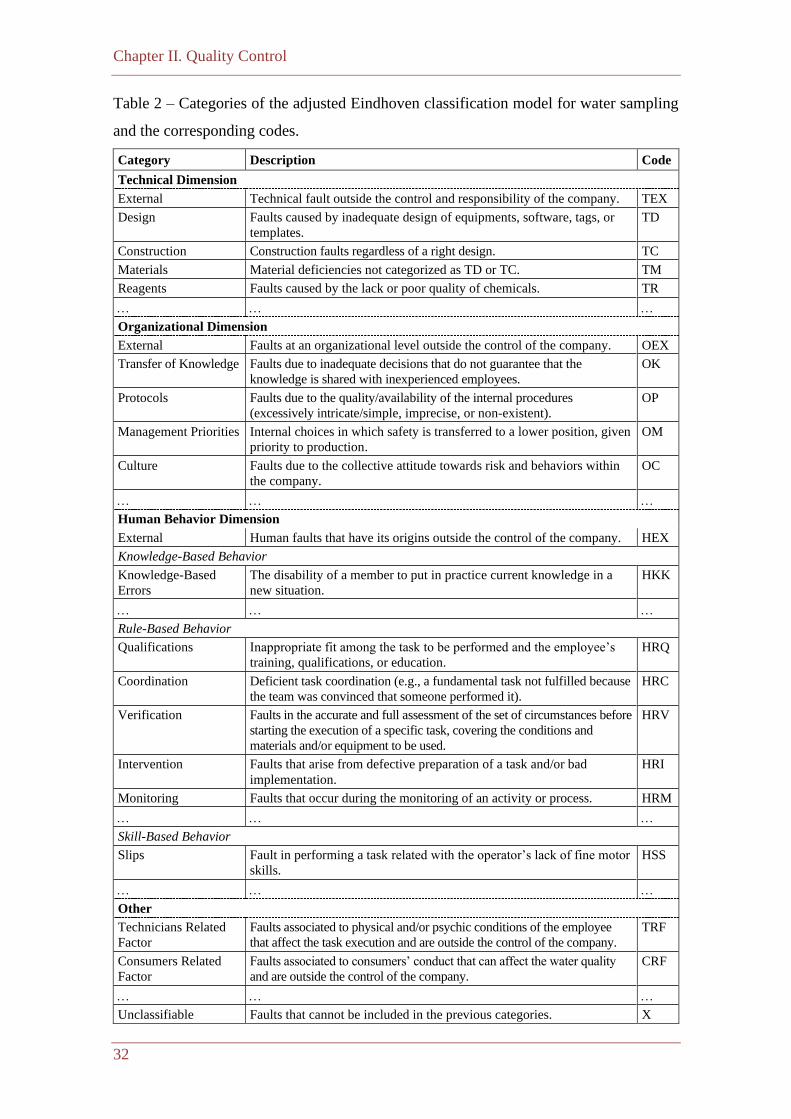
Chapter II. Quality Control
32
Table 2 – Categories of the adjusted Eindhoven classification model for water sampling
and the corresponding codes.
Category Description Code
Technical Dimension
External Technical fault outside the control and responsibility of the company. TEX
Design Faults caused by inadequate design of equipments, software, tags, or
templates.
TD
Construction Construction faults regardless of a right design. TC
Materials Material deficiencies not categorized as TD or TC. TM
Reagents Faults caused by the lack or poor quality of chemicals. TR
Organizational Dimension
External Faults at an organizational level outside the control of the company. OEX
Transfer of Knowledge Faults due to inadequate decisions that do not guarantee that the
knowledge is shared with inexperienced employees.
OK
Protocols Faults due to the quality/availability of the internal procedures
(excessively intricate/simple, imprecise, or non-existent).
OP
Management Priorities Internal choices in which safety is transferred to a lower position, given
priority to production.
OM
Culture Faults due to the collective attitude towards risk and behaviors within
the company.
OC
Human Behavior Dimension
External Human faults that have its origins outside the control of the company. HEX
Knowledge-Based Behavior
Knowledge-Based
Errors
The disability of a member to put in practice current knowledge in a
new situation.
HKK
Rule-Based Behavior
Qualifications Inappropriate fit among the task to be performed and the employee’s
training, qualifications, or education.
HRQ
Coordination Deficient task coordination (e.g., a fundamental task not fulfilled because
the team was convinced that someone performed it).
HRC
Verification Faults in the accurate and full assessment of the set of circumstances before
starting the execution of a specific task, covering the conditions and
materials and/or equipment to be used.
HRV
Intervention Faults that arise from defective preparation of a task and/or bad
implementation.
HRI
Monitoring Faults that occur during the monitoring of an activity or process. HRM
Skill-Based Behavior
Slips Fault in performing a task related with the operator’s lack of fine motor
skills.
HSS
Other
Technicians Related
Factor
Faults associated to physical and/or psychic conditions of the employee
that affect the task execution and are outside the control of the company.
TRF
Consumers Related
Factor
Faults associated to consumers’ conduct that can affect the water quality
and are outside the control of the company.
CRF
Unclassifiable Faults that cannot be included in the previous categories. X
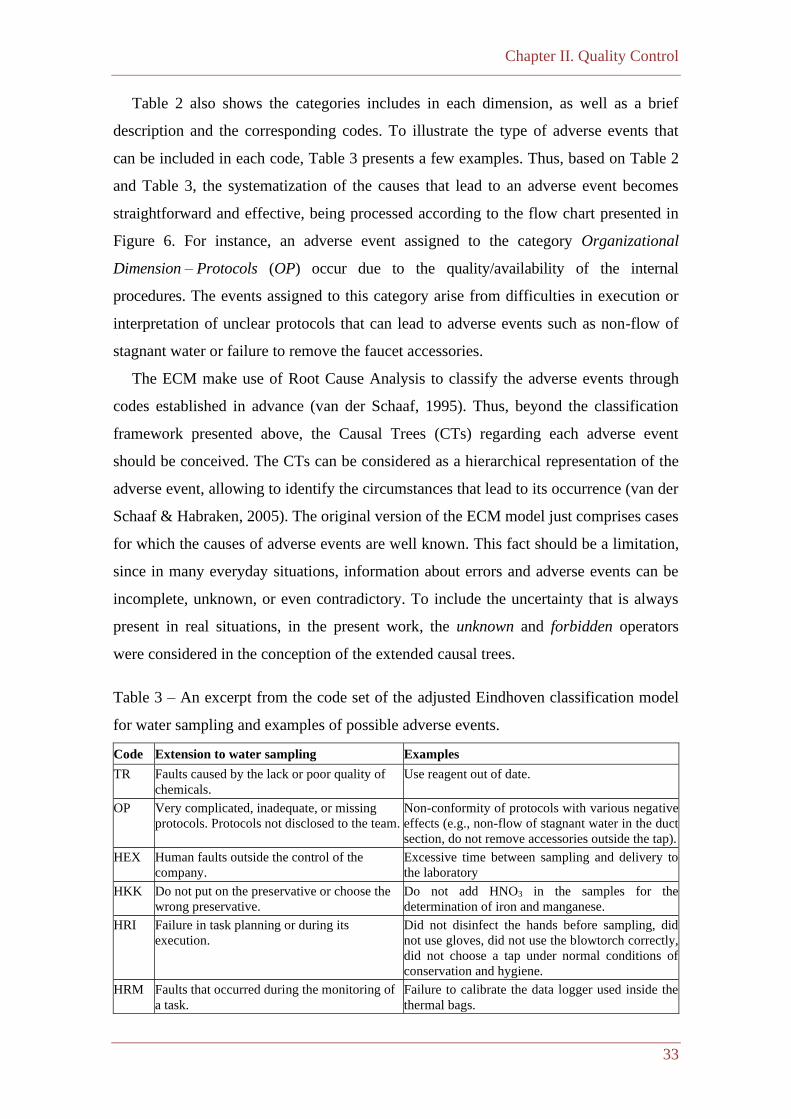
Chapter II. Quality Control
33
Table 2 also shows the categories includes in each dimension, as well as a brief
description and the corresponding codes. To illustrate the type of adverse events that
can be included in each code, Table 3 presents a few examples. Thus, based on Table 2
and Table 3, the systematization of the causes that lead to an adverse event becomes
straightforward and effective, being processed according to the flow chart presented in
Figure 6. For instance, an adverse event assigned to the category Organizational
Dimension – Protocols (OP) occur due to the quality/availability of the internal
procedures. The events assigned to this category arise from difficulties in execution or
interpretation of unclear protocols that can lead to adverse events such as non-flow of
stagnant water or failure to remove the faucet accessories.
The ECM make use of Root Cause Analysis to classify the adverse events through
codes established in advance (van der Schaaf, 1995). Thus, beyond the classification
framework presented above, the Causal Trees (CTs) regarding each adverse event
should be conceived. The CTs can be considered as a hierarchical representation of the
adverse event, allowing to identify the circumstances that lead to its occurrence (van der
Schaaf & Habraken, 2005). The original version of the ECM model just comprises cases
for which the causes of adverse events are well known. This fact should be a limitation,
since in many everyday situations, information about errors and adverse events can be
incomplete, unknown, or even contradictory. To include the uncertainty that is always
present in real situations, in the present work, the unknown and forbidden operators
were considered in the conception of the extended causal trees.
Table 3 – An excerpt from the code set of the adjusted Eindhoven classification model
for water sampling and examples of possible adverse events.
Code Extension to water sampling Examples
TR Faults caused by the lack or poor quality of
chemicals.
Use reagent out of date.
OP Very complicated, inadequate, or missing
protocols. Protocols not disclosed to the team.
Non-conformity of protocols with various negative
effects (e.g., non-flow of stagnant water in the duct
section, do not remove accessories outside the tap).
HEX Human faults outside the control of the
company.
Excessive time between sampling and delivery to
the laboratory
HKK Do not put on the preservative or choose the
wrong preservative.
Do not add HNO3 in the samples for the
determination of iron and manganese.
HRI Failure in task planning or during its
execution.
Did not disinfect the hands before sampling, did
not use gloves, did not use the blowtorch correctly,
did not choose a tap under normal conditions of
conservation and hygiene.
HRM Faults that occurred during the monitoring of
a task.
Failure to calibrate the data logger used inside the
thermal bags.
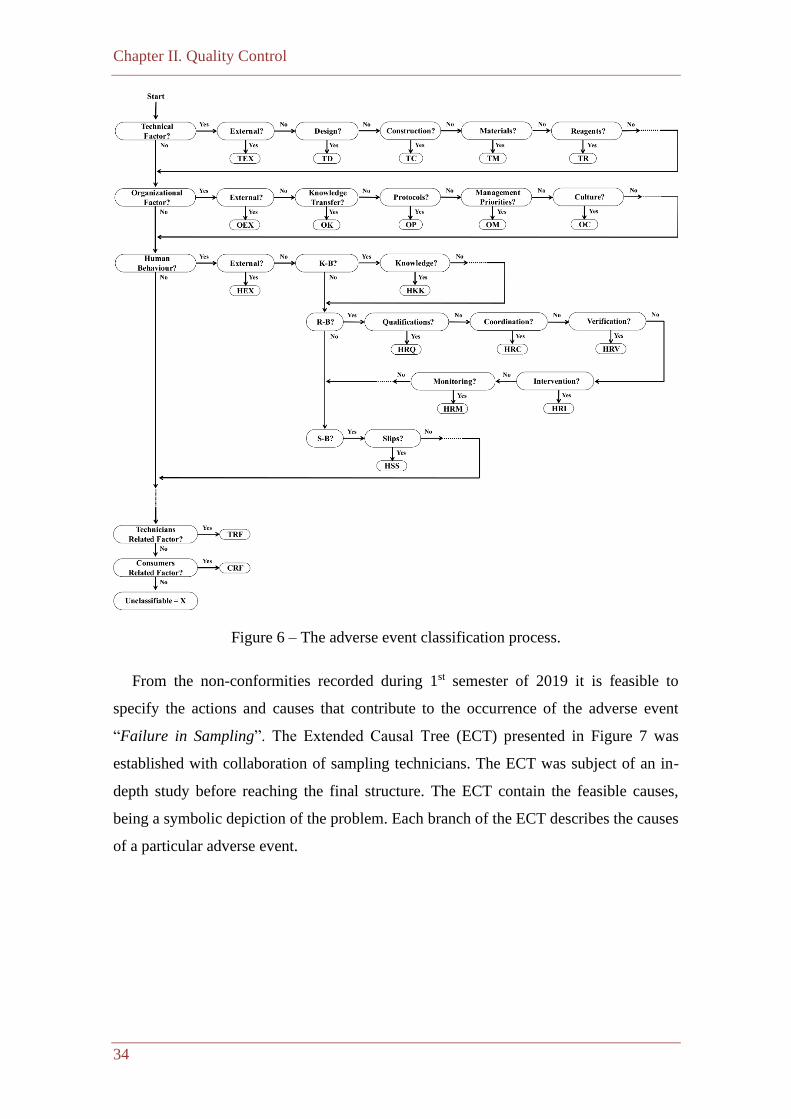
Chapter II. Quality Control
34
Figure 6 – The adverse event classification process.
From the non-conformities recorded during 1st semester of 2019 it is feasible to
specify the actions and causes that contribute to the occurrence of the adverse event
“Failure in Sampling”. The Extended Causal Tree (ECT) presented in Figure 7 was
established with collaboration of sampling technicians. The ECT was subject of an in-
depth study before reaching the final structure. The ECT contain the feasible causes,
being a symbolic depiction of the problem. Each branch of the ECT describes the causes
of a particular adverse event.
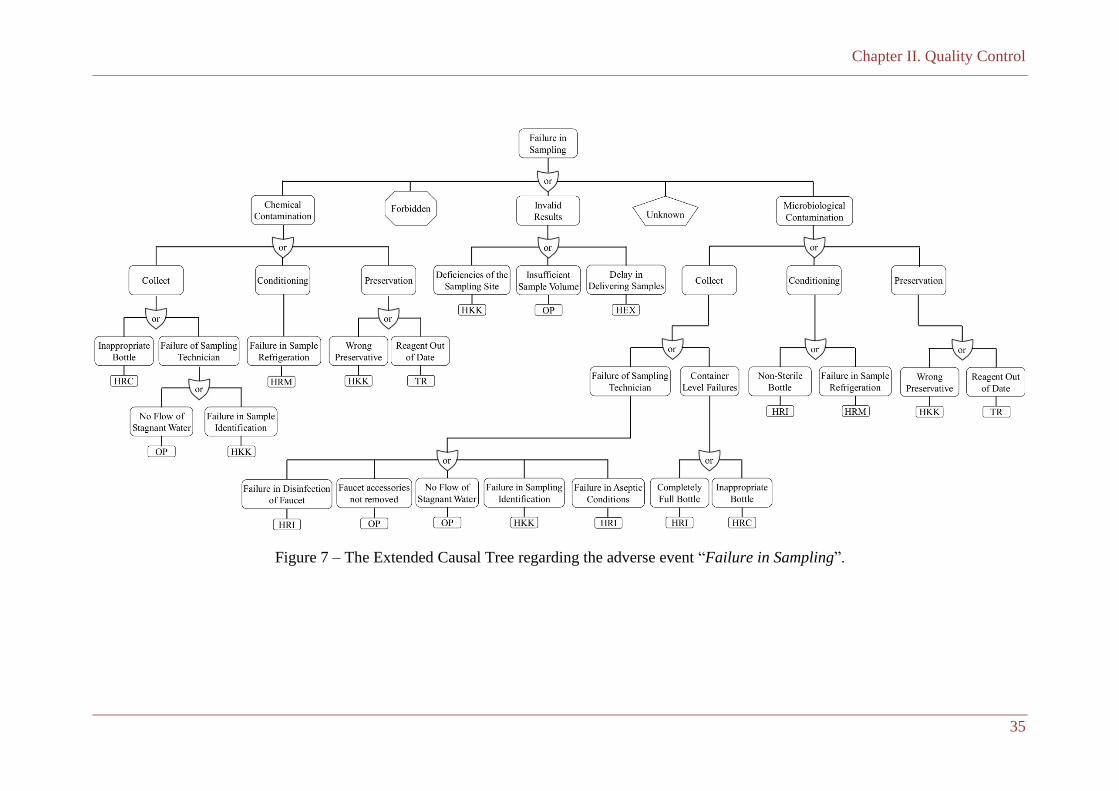
Chapter II. Quality Control
35
Figure 7 – The Extended Causal Tree regarding the adverse event “Failure in Sampling”.
Chapter II. Quality Control
36
II.2.4.2. The Computational System
To illustrate the operating mode of the A-ECM-WS, the undesired event “Error in
Sampling” and the respective causal tree (Figure 7) are considered. Taking into account that
the adverse event can emerge by several causes that should be considered simultaneously
or separately, AND/OR-nodes were incorporated in the causal tree. Furthermore, the
operators “unknown” and “forbidden” were also added to express events for which the
causes are unknown, forbidden, or not permitted. Therefore, considering the information
available in Figure 7, different scenarios can be examined, viz.
• Scenario A – The “Failure in Sampling” was due to microbiological contamination
caused by the non-removal of the faucet accessories;
• Scenario B – The “Failure in Sampling” was due to chemical contamination
caused by failure in sample preservation;
• Scenario C – A “Failure in Sampling” has occurred. The causes behind the event
were not recorded; and
• Scenario D – A “Failure in Sampling” has occurred. The causes of the adverse
event were not recorded due to internal rules of the company.
Regarding scenario A, the cause of the adverse event was recorded, corresponding to
a known value. Scenario B corresponds to a situation in which the cause that led to the
adverse event is unknown. However, it is possible to lay down a finite set of causes that
can lead to its occurrence, configuring a situation of an unknown value in a finite set of
values (two in the this example, wrong preservative or reagent out of data). In scenario
C the occurrence of the adverse event was recorded but nothing is known about their
causes, corresponding to an unknown value. Finally, scenario D involves a forbidden or
a not allowed valued, since it is not permitted to know the causes of the adverse event.
The four scenarios described above can be depicted in Program 2, following the
archetype presented in Program 1, in terms of the extent of predicate
adverse_event_cause (aec), viz.
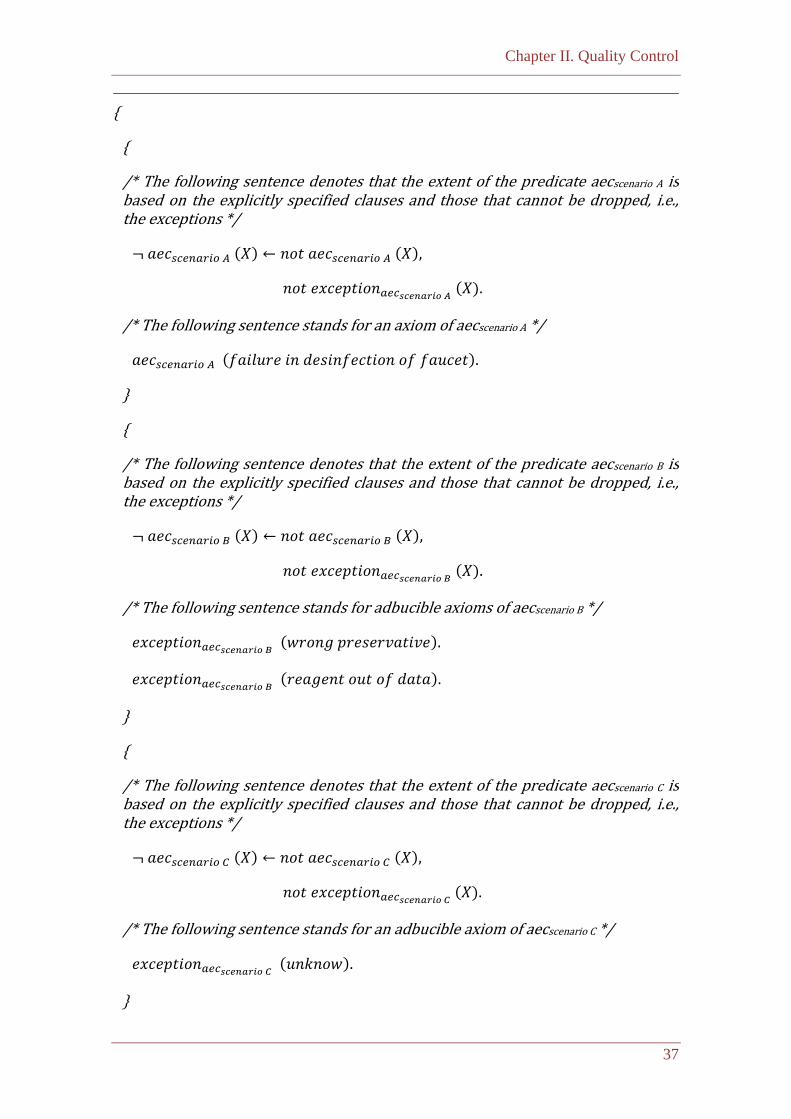
Chapter II. Quality Control
37
{
{
/* The following sentence denotes that the extent of the predicate aecscenario A is based on the explicitly specified clauses and those that cannot be dropped, i.e., the exceptions */
¬ 𝑎𝑒𝑐𝑠𝑐𝑒𝑛𝑎𝑟𝑖𝑜 𝐴 (𝑋) ← 𝑛𝑜𝑡 𝑎𝑒𝑐𝑠𝑐𝑒𝑛𝑎𝑟𝑖𝑜 𝐴 (𝑋),
𝑛𝑜𝑡 𝑒𝑥𝑐𝑒𝑝𝑡𝑖𝑜𝑛𝑎𝑒𝑐𝑠𝑐𝑒𝑛𝑎𝑟𝑖𝑜 𝐴 (𝑋).
/* The following sentence stands for an axiom of aecscenario A */
𝑎𝑒𝑐𝑠𝑐𝑒𝑛𝑎𝑟𝑖𝑜 𝐴 (𝑓𝑎𝑖𝑙𝑢𝑟𝑒 𝑖𝑛 𝑑𝑒𝑠𝑖𝑛𝑓𝑒𝑐𝑡𝑖𝑜𝑛 𝑜𝑓 𝑓𝑎𝑢𝑐𝑒𝑡).
}
{
/* The following sentence denotes that the extent of the predicate aecscenario B is based on the explicitly specified clauses and those that cannot be dropped, i.e., the exceptions */
¬ 𝑎𝑒𝑐𝑠𝑐𝑒𝑛𝑎𝑟𝑖𝑜 𝐵 (𝑋) ← 𝑛𝑜𝑡 𝑎𝑒𝑐𝑠𝑐𝑒𝑛𝑎𝑟𝑖𝑜 𝐵 (𝑋),
𝑛𝑜𝑡 𝑒𝑥𝑐𝑒𝑝𝑡𝑖𝑜𝑛𝑎𝑒𝑐𝑠𝑐𝑒𝑛𝑎𝑟𝑖𝑜 𝐵 (𝑋).
/* The following sentence stands for adbucible axioms of aecscenario B */
𝑒𝑥𝑐𝑒𝑝𝑡𝑖𝑜𝑛𝑎𝑒𝑐𝑠𝑐𝑒𝑛𝑎𝑟𝑖𝑜 𝐵 (𝑤𝑟𝑜𝑛𝑔 𝑝𝑟𝑒𝑠𝑒𝑟𝑣𝑎𝑡𝑖𝑣𝑒).
𝑒𝑥𝑐𝑒𝑝𝑡𝑖𝑜𝑛𝑎𝑒𝑐𝑠𝑐𝑒𝑛𝑎𝑟𝑖𝑜 𝐵 (𝑟𝑒𝑎𝑔𝑒𝑛𝑡 𝑜𝑢𝑡 𝑜𝑓 𝑑𝑎𝑡𝑎).
}
{
/* The following sentence denotes that the extent of the predicate aecscenario C is based on the explicitly specified clauses and those that cannot be dropped, i.e., the exceptions */
¬ 𝑎𝑒𝑐𝑠𝑐𝑒𝑛𝑎𝑟𝑖𝑜 𝐶 (𝑋) ← 𝑛𝑜𝑡 𝑎𝑒𝑐𝑠𝑐𝑒𝑛𝑎𝑟𝑖𝑜 𝐶 (𝑋),
𝑛𝑜𝑡 𝑒𝑥𝑐𝑒𝑝𝑡𝑖𝑜𝑛𝑎𝑒𝑐𝑠𝑐𝑒𝑛𝑎𝑟𝑖𝑜 𝐶 (𝑋).
/* The following sentence stands for an adbucible axiom of aecscenario C */
𝑒𝑥𝑐𝑒𝑝𝑡𝑖𝑜𝑛𝑎𝑒𝑐𝑠𝑐𝑒𝑛𝑎𝑟𝑖𝑜 𝐶 (𝑢𝑛𝑘𝑛𝑜𝑤).
}
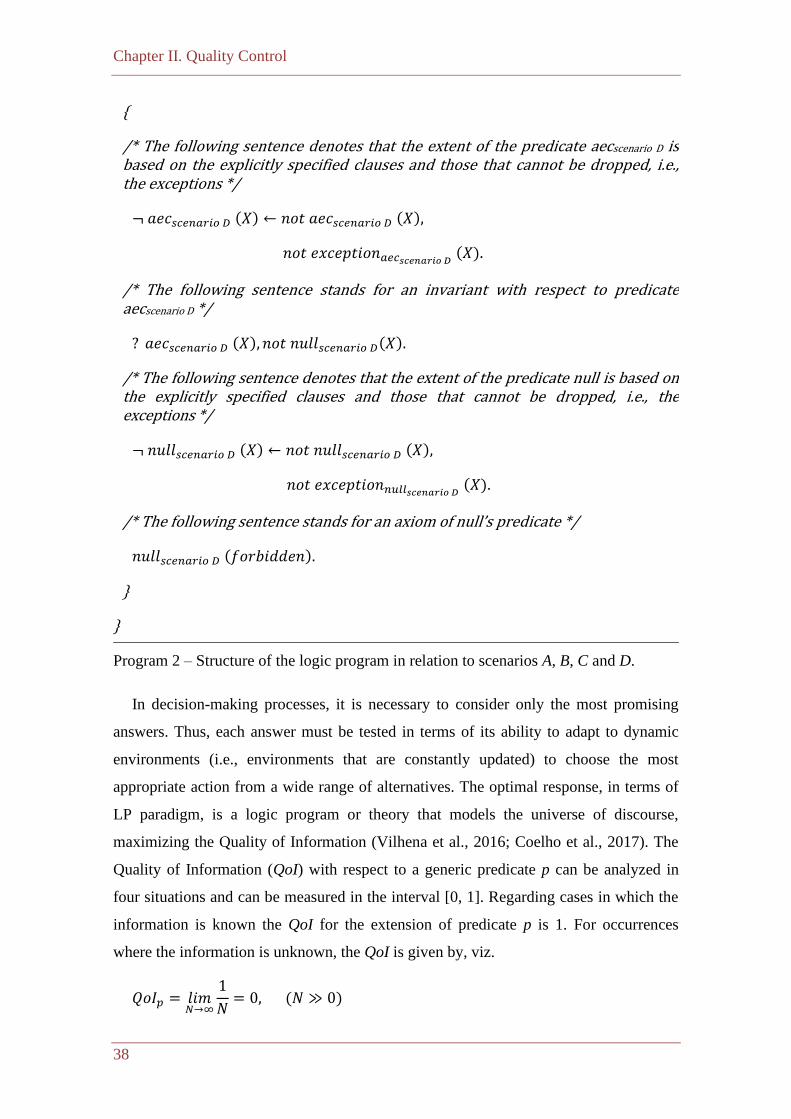
Chapter II. Quality Control
38
{
/* The following sentence denotes that the extent of the predicate aecscenario D is based on the explicitly specified clauses and those that cannot be dropped, i.e., the exceptions */
¬ 𝑎𝑒𝑐𝑠𝑐𝑒𝑛𝑎𝑟𝑖𝑜 𝐷 (𝑋) ← 𝑛𝑜𝑡 𝑎𝑒𝑐𝑠𝑐𝑒𝑛𝑎𝑟𝑖𝑜 𝐷 (𝑋),
𝑛𝑜𝑡 𝑒𝑥𝑐𝑒𝑝𝑡𝑖𝑜𝑛𝑎𝑒𝑐𝑠𝑐𝑒𝑛𝑎𝑟𝑖𝑜 𝐷 (𝑋).
/* The following sentence stands for an invariant with respect to predicate aecscenario D */
? 𝑎𝑒𝑐𝑠𝑐𝑒𝑛𝑎𝑟𝑖𝑜 𝐷 (𝑋), 𝑛𝑜𝑡 𝑛𝑢𝑙𝑙𝑠𝑐𝑒𝑛𝑎𝑟𝑖𝑜 𝐷(𝑋).
/* The following sentence denotes that the extent of the predicate null is based on the explicitly specified clauses and those that cannot be dropped, i.e., the exceptions */
¬ 𝑛𝑢𝑙𝑙𝑠𝑐𝑒𝑛𝑎𝑟𝑖𝑜 𝐷 (𝑋) ← 𝑛𝑜𝑡 𝑛𝑢𝑙𝑙𝑠𝑐𝑒𝑛𝑎𝑟𝑖𝑜 𝐷 (𝑋),
𝑛𝑜𝑡 𝑒𝑥𝑐𝑒𝑝𝑡𝑖𝑜𝑛𝑛𝑢𝑙𝑙𝑠𝑐𝑒𝑛𝑎𝑟𝑖𝑜 𝐷 (𝑋).
/* The following sentence stands for an axiom of null’s predicate */
𝑛𝑢𝑙𝑙𝑠𝑐𝑒𝑛𝑎𝑟𝑖𝑜 𝐷 (𝑓𝑜𝑟𝑏𝑖𝑑𝑑𝑒𝑛).
}
}
Program 2 – Structure of the logic program in relation to scenarios A, B, C and D.
In decision-making processes, it is necessary to consider only the most promising
answers. Thus, each answer must be tested in terms of its ability to adapt to dynamic
environments (i.e., environments that are constantly updated) to choose the most
appropriate action from a wide range of alternatives. The optimal response, in terms of
LP paradigm, is a logic program or theory that models the universe of discourse,
maximizing the Quality of Information (Vilhena et al., 2016; Coelho et al., 2017). The
Quality of Information (QoI) with respect to a generic predicate p can be analyzed in
four situations and can be measured in the interval [0, 1]. Regarding cases in which the
information is known the QoI for the extension of predicate p is 1. For occurrences
where the information is unknown, the QoI is given by, viz.
𝑄𝑜𝐼𝑝 = 𝑙𝑖𝑚𝑁→∞
1
𝑁= 0, (𝑁 ≫ 0)
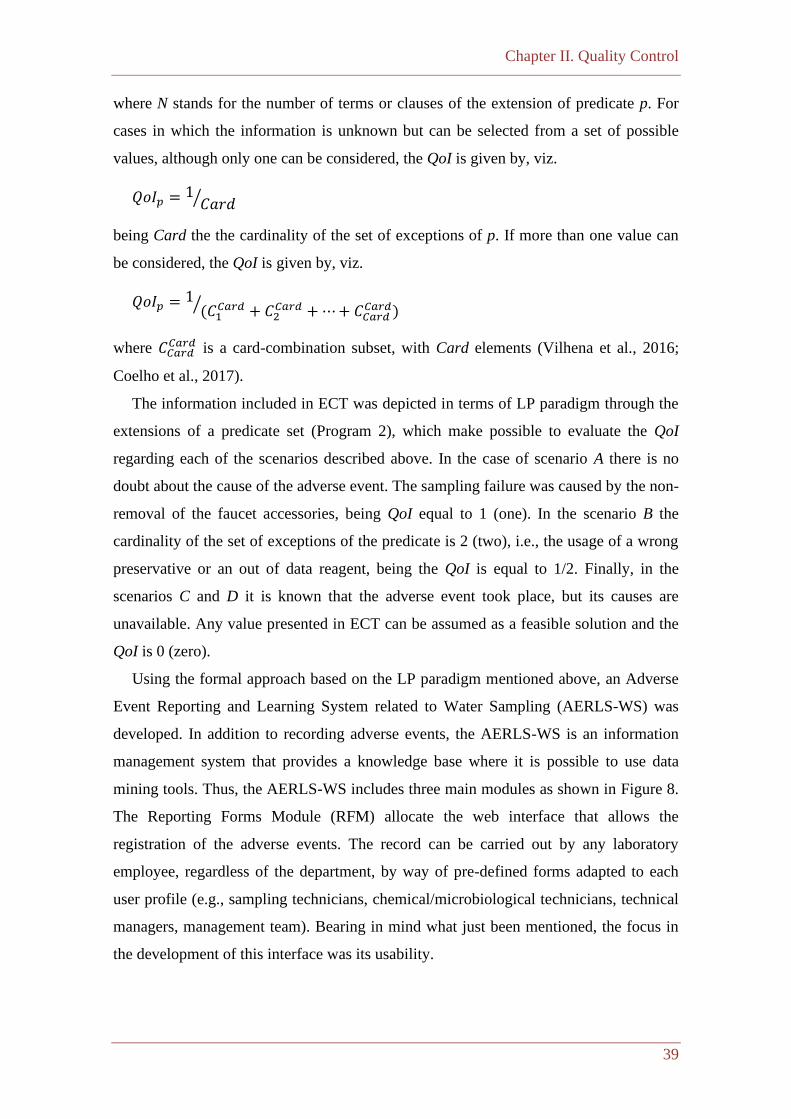
Chapter II. Quality Control
39
where N stands for the number of terms or clauses of the extension of predicate p. For
cases in which the information is unknown but can be selected from a set of possible
values, although only one can be considered, the QoI is given by, viz.
𝑄𝑜𝐼𝑝 =1𝐶𝑎𝑟𝑑⁄
being Card the the cardinality of the set of exceptions of p. If more than one value can
be considered, the QoI is given by, viz.
𝑄𝑜𝐼𝑝 =1(𝐶1𝐶𝑎𝑟𝑑 + 𝐶2
𝐶𝑎𝑟𝑑 +⋯+ 𝐶𝐶𝑎𝑟𝑑𝐶𝑎𝑟𝑑)⁄
where 𝐶𝐶𝑎𝑟𝑑𝐶𝑎𝑟𝑑 is a card-combination subset, with Card elements (Vilhena et al., 2016;
Coelho et al., 2017).
The information included in ECT was depicted in terms of LP paradigm through the
extensions of a predicate set (Program 2), which make possible to evaluate the QoI
regarding each of the scenarios described above. In the case of scenario A there is no
doubt about the cause of the adverse event. The sampling failure was caused by the non-
removal of the faucet accessories, being QoI equal to 1 (one). In the scenario B the
cardinality of the set of exceptions of the predicate is 2 (two), i.e., the usage of a wrong
preservative or an out of data reagent, being the QoI is equal to 1/2. Finally, in the
scenarios C and D it is known that the adverse event took place, but its causes are
unavailable. Any value presented in ECT can be assumed as a feasible solution and the
QoI is 0 (zero).
Using the formal approach based on the LP paradigm mentioned above, an Adverse
Event Reporting and Learning System related to Water Sampling (AERLS-WS) was
developed. In addition to recording adverse events, the AERLS-WS is an information
management system that provides a knowledge base where it is possible to use data
mining tools. Thus, the AERLS-WS includes three main modules as shown in Figure 8.
The Reporting Forms Module (RFM) allocate the web interface that allows the
registration of the adverse events. The record can be carried out by any laboratory
employee, regardless of the department, by way of pre-defined forms adapted to each
user profile (e.g., sampling technicians, chemical/microbiological technicians, technical
managers, management team). Bearing in mind what just been mentioned, the focus in
the development of this interface was its usability.

Chapter II. Quality Control
40
Figure 8 – A global view of the Adverse Event Reporting and Learning System related
to Water Sampling (AERLS-WS).
The Manager Reports Module (MRM) is equally a web interface. It intends to make
possible the analyse the adverse events previously recorded in the RFM, having
subjacent the A-ECM-WS. The A-ECM-WS allows that the system provide suggestions
for improvements to minimize/eliminate the organization failures. Thus, the system can
issue automatically individual reports for the adverse events recorded, as well as its
details in terms of branches of the ECT. The improvement suggestions contained in the
reports are due to the methodology followed that combines adjusted version of ECM for
water sampling and LP to knowledge representation and support the reasoning mechanisms.
The central point of these reports are the event causes. The system’s reports are
essential to ensure quality to laboratory results, since the time and resources required to
study the causes of the events, to make inferences, and to establish patterns and trends
are substantially reduced. In this way, this task (which is usually time consuming) can
Chapter II. Quality Control
41
be performed timely contributing to avoid/mitigate failures. In addition, once the data
are stored in the same database, they are always available for further studies. The MRM
can provide updated information about the impact, occurrence, and type of events
recorded. The user can choose how the information is displayed (e.g., bar charts, pie
charts, tables, tree diagrams). Based on the system’s reports the user can have
information about the contribution of each possible action/cause to the adverse event. It
should be noted that the actions/causes were identified by the system automatically,
considering the A-ECM-WS and the ECTs.
Lastly, the Knowledge Manager Module (KMM) is a Java application. This module
makes use of the records stored in the database to generate a knowledge base, from
which other relevant studies (e.g., through the use of data mining tools) aiming to
optimize the sampling procedures.
II.2.5. Conclusions
To achieve accurate results in water analysis is essential that the sampling stage is
carried out correctly. Thus, this work presents an adverse event reporting and learning
system, developed specifically for the sampling phase, that aims to improve the quality
of drinking water and therefore contribute to the promotion of public health. The key
contribution of this work is related with the quantification of the Quality of Information
imbedded in Causal Trees and to address the issues regarding incomplete information
using the Logic Programming paradigm. The proposed approach allows to identify in
advance the causes that lead to adverse events, enabling the establishment of action
plans to avoid or, at least, minimize them. The construction of the causal tree for a
particular event be often time-consuming and difficult, once it requires the development of
the branches regarding to each possible cause. However, after this stage being overcomed,
the process of classification and analysis of adverse events becomes very fast and easy.
The computation of the Quality of Information enables the ranking of possible causes
and, therefore, to identify the ones that should be prioritized. Consequently, in the
construction of the causal tree, it is mandatory to look for all possible causes, not only
the most probable or the usual ones.
The adverse event reporting and learning system presented allows knowledge
extraction, i.e., the identification of the main failure causes, possible trends, areas
requiring improvement plans or changes in procedures. The automatic reports generated

Chapter II. Quality Control
42
by the system are reliable. In fact, the quantification on-the-fly of the Quality of
Information of the logic terms used in the process of judgement (given in terms of a
theorem to be proved) minimizes user participation, which is only necessary to approve
the recommendations. One of the main advantages of the proposed system has to do
with its modularity. This feature allows one to update the system at any time (e.g., add
new categories, subcategories and/or causal trees) without changing its structure or way
of functioning.
Chapter II. Quality Control
43
II.3. Draw on Artificial Neural Networks to Assess and Predict Water
Quality
II.3.1. Introduction
Water management is not only a quantitative problem that is embedded in its
biogeochemical cycle, but also a qualitative one. Water is important to ensure the
sustainability of life, and given its meaning for health, it is mandatory to ensure its
quality. The quality assessment of water bodies implies the knowledge of a large set of
parameters used to indicate its suitability for different purposes (e.g., drinking water
production, irrigation). Water quality can be expressed by indicating the condition (i.e.
dissolved or particulate) and the concentration of inorganic and organic substances
present as well as some water-physical properties (Bagchi, 2013). The water quality is
assessed using analysis methods carried out in situ and in the laboratory. This process
involves several steps, such as taking, preserving, and transporting samples. In addition,
it is still necessary to consider the time that has elapsed since the time of sampling and
the completion of the laboratory analyzes as well as the financial resources expended.
To maintain water quality in real time, developing computational models grounded on
methodologies from Artificial Intelligence scientific area can be an alternative to water
quality assessment. The Chemical Oxygen Demand (COD) and the Biochemical Oxygen
Demand (BOD) enable to quantify the organic matter present in water. Some organic
substances can be directly responsible for unpleasant colors and aromas or for the
development of organisms from which they originate (Alley, 2000). Organic matter can
be of biological origin (e.g. proteins, fats, and sugars) and/or due to anthropogenic
activities. COD and BOD are criteria for controlling pollution and indicators of chemical
and/or bacteriological contamination that can pose a threat to water consumers. COD
can be defined as the amount of a particular oxidizer that reacts with the sample under
controlled conditions. The BOD in turn measures the molecular oxygen consumption in a
certain incubation period (five days) for the biochemical degradation of organic material
(Alley, 2000). This work aims the development of models grounded on artificial
intelligence techniques for problem solving, particularly ANNs (Haykin, 2009), to
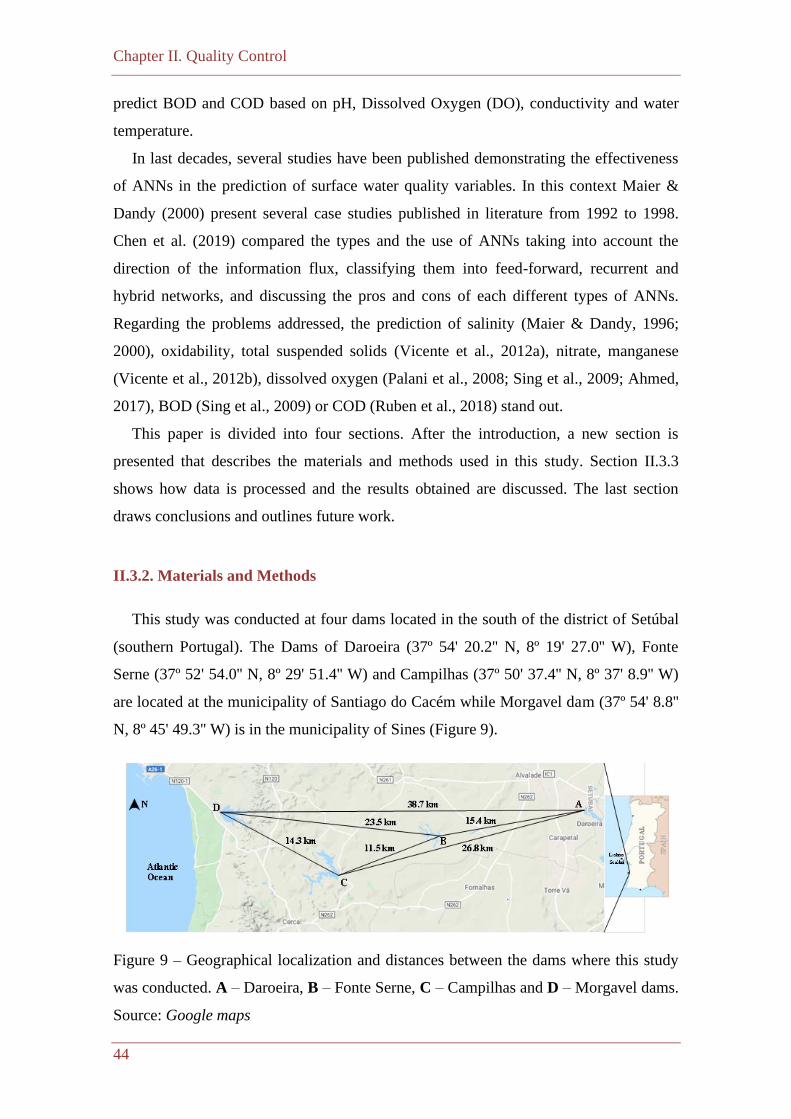
Chapter II. Quality Control
44
predict BOD and COD based on pH, Dissolved Oxygen (DO), conductivity and water
temperature.
In last decades, several studies have been published demonstrating the effectiveness
of ANNs in the prediction of surface water quality variables. In this context Maier &
Dandy (2000) present several case studies published in literature from 1992 to 1998.
Chen et al. (2019) compared the types and the use of ANNs taking into account the
direction of the information flux, classifying them into feed-forward, recurrent and
hybrid networks, and discussing the pros and cons of each different types of ANNs.
Regarding the problems addressed, the prediction of salinity (Maier & Dandy, 1996;
2000), oxidability, total suspended solids (Vicente et al., 2012a), nitrate, manganese
(Vicente et al., 2012b), dissolved oxygen (Palani et al., 2008; Sing et al., 2009; Ahmed,
2017), BOD (Sing et al., 2009) or COD (Ruben et al., 2018) stand out.
This paper is divided into four sections. After the introduction, a new section is
presented that describes the materials and methods used in this study. Section II.3.3
shows how data is processed and the results obtained are discussed. The last section
draws conclusions and outlines future work.
II.3.2. Materials and Methods
This study was conducted at four dams located in the south of the district of Setúbal
(southern Portugal). The Dams of Daroeira (37º 54' 20.2'' N, 8º 19' 27.0'' W), Fonte
Serne (37º 52' 54.0'' N, 8º 29' 51.4'' W) and Campilhas (37º 50' 37.4'' N, 8º 37' 8.9'' W)
are located at the municipality of Santiago do Cacém while Morgavel dam (37º 54' 8.8''
N, 8º 45' 49.3'' W) is in the municipality of Sines (Figure 9).
Figure 9 – Geographical localization and distances between the dams where this study
was conducted. A – Daroeira, B – Fonte Serne, C – Campilhas and D – Morgavel dams.
Source: Google maps
Chapter II. Quality Control
45
Sampling was carried out between September 2005 and December 2017. Water
Temperature, pH, DO, and Conductivity were evaluated in situ while BOD and COD
were analyzed in lab.
II.3.2.1. Sample Collection and Preservation
The analytical control of water quality begins with sampling once a month (12 times
a year) in the morning. The sampling procedures were conducted taking into account the
recommendations presented in Standard Methods for the Examination of Water and
Waste Water (SMEWW) (Baird et al., 2017). For in situ determinations 50 cm3 wide-mouth
polyethylene flasks were used, while 100 cm3 polyethylene flasks were used to collect
the samples for COD analysis. Sulphuric acid (until pH<2) were added as preserving
agent. Finally, for the BOD determination 1000 cm3 polyethylene flasks were used. The
samples were transported in thermal bags containing ice accumulators. To ensure that
the samples were not exposed to temperatures higher than those in the collection, a Data
Logger, programmed to take minute-by-minute measurements, was placed in the pouch
to record the temperature during transportation.
II.3.2.2. Analytical Procedures
The water analyzes were carried out in a water laboratory accredited according to the
ISO/IEC 17025. The pH, DO, Conductivity, Water Temperature, BOD and COD
evaluation were carried out in accordance with SMEWW 4500-H+ B, SMEWW 4500-
O B, Portuguese version of European Standard 27888: 1996, SMEWW 2550 B,
SMEWW 5210 B and SMEWW 5220 B (Baird et al., 2017).
II.3.2.3. Artificial Neural Networks
ANNs are computing tools designed to mimic the human brain and nervous system
procedures. The multilayer perceptron is one of the most widespread ANNs architectures,
in which neurons are disposed in layers, connected through forward connections (Haykin,
2009). In order to implement ANNs the software WEKA was used, maintaining unchanged
the software set of parameters (Hall, et al., 2009; Frank, et al., 2016). Aiming to guarantee
the statistical significance of the experiments, 25 replicates were realized. In each replicate
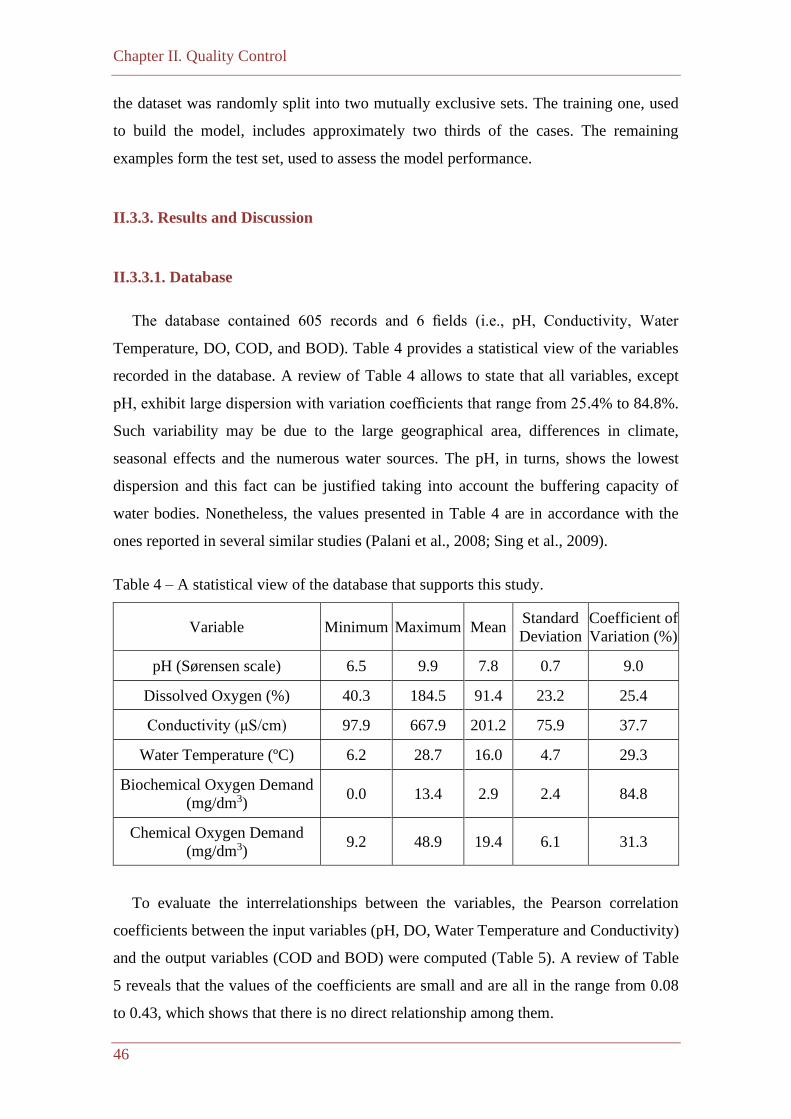
Chapter II. Quality Control
46
the dataset was randomly split into two mutually exclusive sets. The training one, used
to build the model, includes approximately two thirds of the cases. The remaining
examples form the test set, used to assess the model performance.
II.3.3. Results and Discussion
II.3.3.1. Database
The database contained 605 records and 6 fields (i.e., pH, Conductivity, Water
Temperature, DO, COD, and BOD). Table 4 provides a statistical view of the variables
recorded in the database. A review of Table 4 allows to state that all variables, except
pH, exhibit large dispersion with variation coefficients that range from 25.4% to 84.8%.
Such variability may be due to the large geographical area, differences in climate,
seasonal effects and the numerous water sources. The pH, in turns, shows the lowest
dispersion and this fact can be justified taking into account the buffering capacity of
water bodies. Nonetheless, the values presented in Table 4 are in accordance with the
ones reported in several similar studies (Palani et al., 2008; Sing et al., 2009).
Table 4 – A statistical view of the database that supports this study.
Variable Minimum Maximum Mean Standard
Deviation
Coefficient of
Variation (%)
pH (Sørensen scale) 6.5 9.9 7.8 0.7 9.0
Dissolved Oxygen (%) 40.3 184.5 91.4 23.2 25.4
Conductivity (μS/cm) 97.9 667.9 201.2 75.9 37.7
Water Temperature (ºC) 6.2 28.7 16.0 4.7 29.3
Biochemical Oxygen Demand
(mg/dm3) 0.0 13.4 2.9 2.4 84.8
Chemical Oxygen Demand
(mg/dm3) 9.2 48.9 19.4 6.1 31.3
To evaluate the interrelationships between the variables, the Pearson correlation
coefficients between the input variables (pH, DO, Water Temperature and Conductivity)
and the output variables (COD and BOD) were computed (Table 5). A review of Table
5 reveals that the values of the coefficients are small and are all in the range from 0.08
to 0.43, which shows that there is no direct relationship among them.
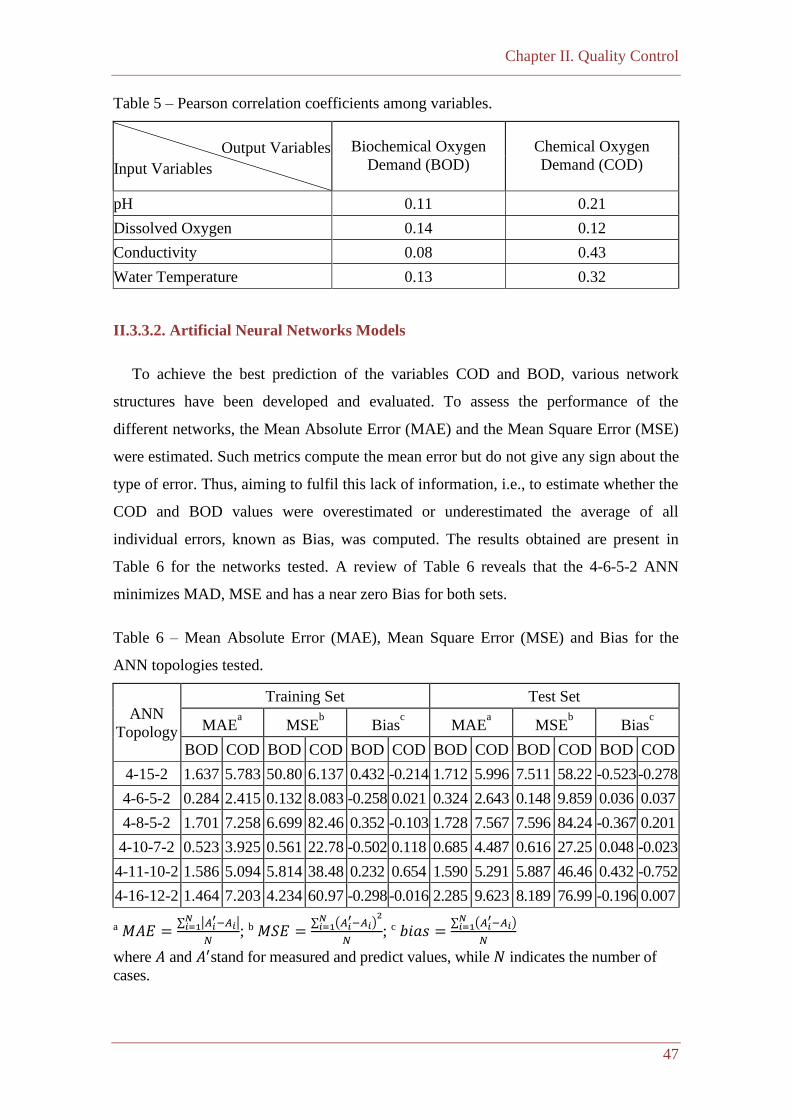
Chapter II. Quality Control
47
Table 5 – Pearson correlation coefficients among variables.
Output Variables
Input Variables
Biochemical Oxygen
Demand (BOD)
Chemical Oxygen
Demand (COD)
pH 0.11 0.21
Dissolved Oxygen 0.14 0.12
Conductivity 0.08 0.43
Water Temperature 0.13 0.32
II.3.3.2. Artificial Neural Networks Models
To achieve the best prediction of the variables COD and BOD, various network
structures have been developed and evaluated. To assess the performance of the
different networks, the Mean Absolute Error (MAE) and the Mean Square Error (MSE)
were estimated. Such metrics compute the mean error but do not give any sign about the
type of error. Thus, aiming to fulfil this lack of information, i.e., to estimate whether the
COD and BOD values were overestimated or underestimated the average of all
individual errors, known as Bias, was computed. The results obtained are present in
Table 6 for the networks tested. A review of Table 6 reveals that the 4-6-5-2 ANN
minimizes MAD, MSE and has a near zero Bias for both sets.
Table 6 – Mean Absolute Error (MAE), Mean Square Error (MSE) and Bias for the
ANN topologies tested.
ANN
Topology
Training Set Test Set
MAEa MSE
b Bias
c MAE
a MSE
b Bias
c
BOD COD BOD COD BOD COD BOD COD BOD COD BOD COD
4-15-2 1.637 5.783 50.80 6.137 0.432 -0.214 1.712 5.996 7.511 58.22 -0.523 -0.278
4-6-5-2 0.284 2.415 0.132 8.083 -0.258 0.021 0.324 2.643 0.148 9.859 0.036 0.037
4-8-5-2 1.701 7.258 6.699 82.46 0.352 -0.103 1.728 7.567 7.596 84.24 -0.367 0.201
4-10-7-2 0.523 3.925 0.561 22.78 -0.502 0.118 0.685 4.487 0.616 27.25 0.048 -0.023
4-11-10-2 1.586 5.094 5.814 38.48 0.232 0.654 1.590 5.291 5.887 46.46 0.432 -0.752
4-16-12-2 1.464 7.203 4.234 60.97 -0.298 -0.016 2.285 9.623 8.189 76.99 -0.196 0.007
a 𝑀𝐴𝐸 =∑ |𝐴𝑖
′−𝐴𝑖|𝑁𝑖=1
𝑁; b 𝑀𝑆𝐸 =
∑ (𝐴𝑖′−𝐴𝑖)
2𝑁𝑖=1
𝑁; c 𝑏𝑖𝑎𝑠 =
∑ (𝐴𝑖′−𝐴𝑖)
𝑁𝑖=1
𝑁
where 𝐴 and 𝐴′stand for measured and predict values, while 𝑁 indicates the number of
cases.
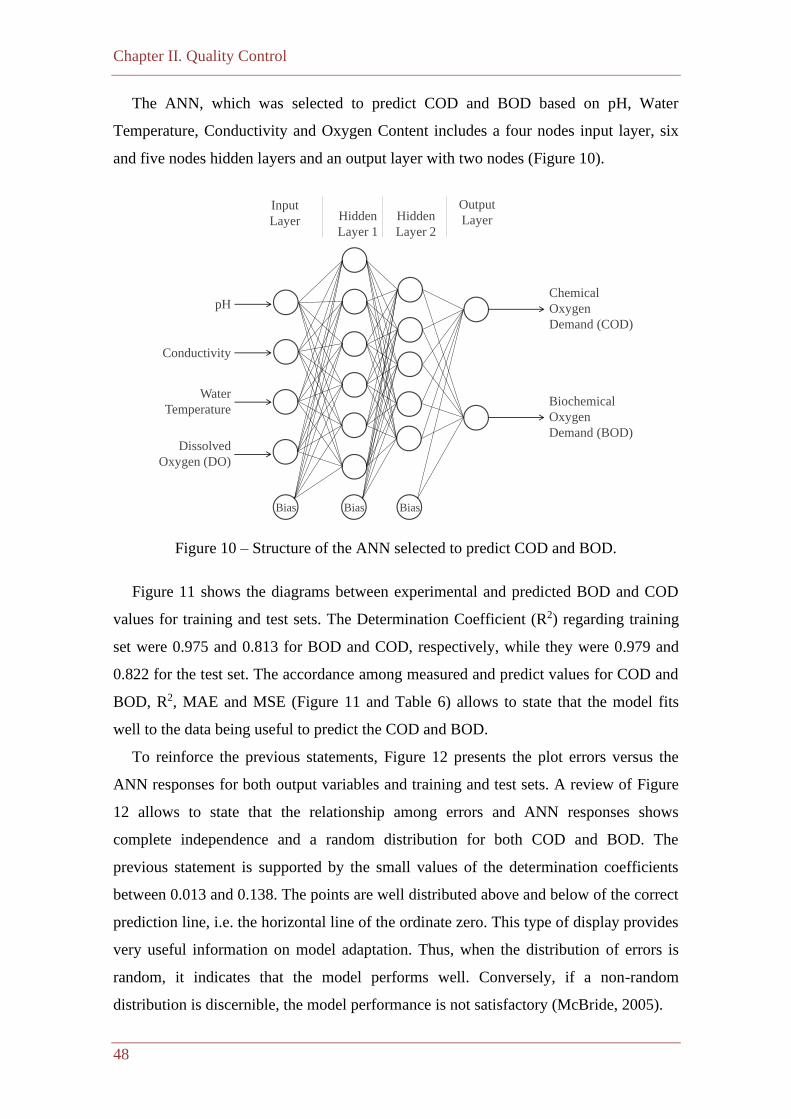
Chapter II. Quality Control
48
The ANN, which was selected to predict COD and BOD based on pH, Water
Temperature, Conductivity and Oxygen Content includes a four nodes input layer, six
and five nodes hidden layers and an output layer with two nodes (Figure 10).
Figure 10 – Structure of the ANN selected to predict COD and BOD.
Figure 11 shows the diagrams between experimental and predicted BOD and COD
values for training and test sets. The Determination Coefficient (R2) regarding training
set were 0.975 and 0.813 for BOD and COD, respectively, while they were 0.979 and
0.822 for the test set. The accordance among measured and predict values for COD and
BOD, R2, MAE and MSE (Figure 11 and Table 6) allows to state that the model fits
well to the data being useful to predict the COD and BOD.
To reinforce the previous statements, Figure 12 presents the plot errors versus the
ANN responses for both output variables and training and test sets. A review of Figure
12 allows to state that the relationship among errors and ANN responses shows
complete independence and a random distribution for both COD and BOD. The
previous statement is supported by the small values of the determination coefficients
between 0.013 and 0.138. The points are well distributed above and below of the correct
prediction line, i.e. the horizontal line of the ordinate zero. This type of display provides
very useful information on model adaptation. Thus, when the distribution of errors is
random, it indicates that the model performs well. Conversely, if a non-random
distribution is discernible, the model performance is not satisfactory (McBride, 2005).
Input
Layer Hidden
Layer 1
Hidden
Layer 2
Output
Layer
BiasBiasBias
pH
Conductivity
Water
Temperature
Chemical
Oxygen
Demand (COD)
Biochemical
Oxygen
Demand (BOD)Dissolved
Oxygen (DO)
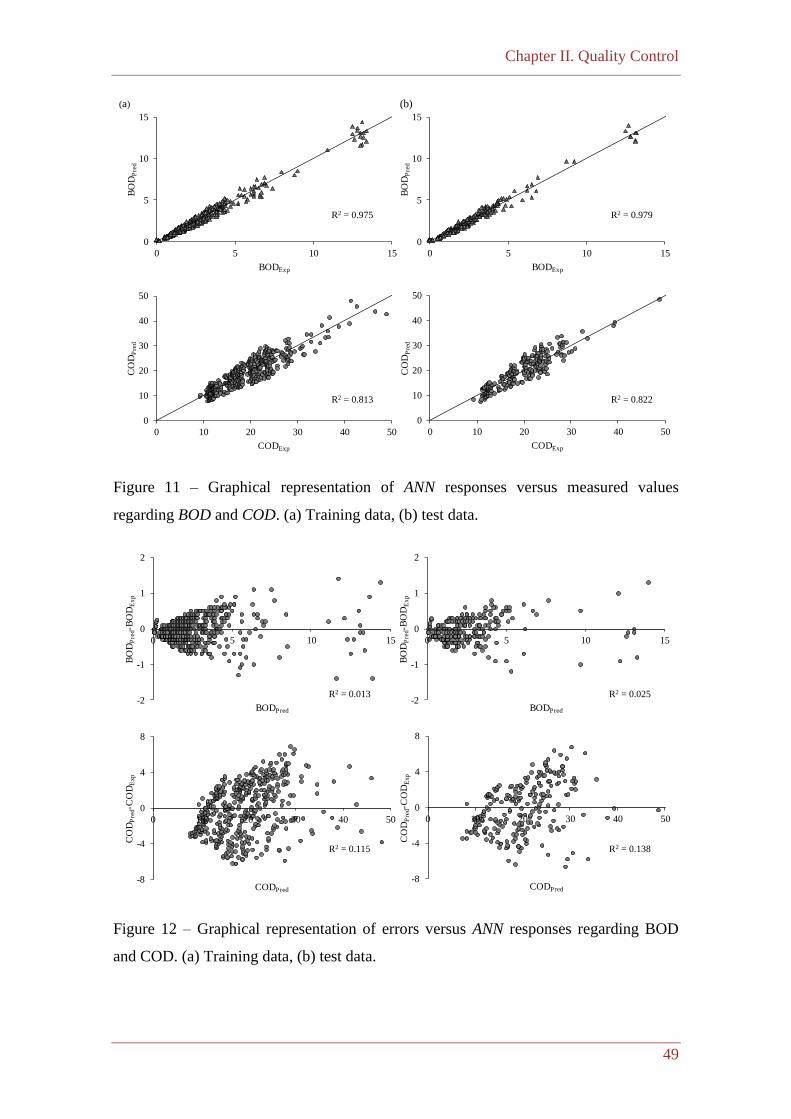
Chapter II. Quality Control
49
Figure 11 – Graphical representation of ANN responses versus measured values
regarding BOD and COD. (a) Training data, (b) test data.
Figure 12 – Graphical representation of errors versus ANN responses regarding BOD
and COD. (a) Training data, (b) test data.
R² = 0,9749
0
5
10
15
0 5 10 15
BO
DP
red
BODExp
R² = 0,979
0
5
10
15
0 5 10 15
BO
DP
red
BODExp
R² = 0,8130
10
20
30
40
50
0 10 20 30 40 50
CO
DP
red
CODExp
R² = 0,8217
0
10
20
30
40
50
0 10 20 30 40 50
CO
DP
red
CODExp
(a) (b)
R2 = 0.979R2 = 0.975
R2 = 0.822R2 = 0.813
-2
-1
0
1
2
0 5 10 15
BO
DP
red-B
OD
Ex
p
BODPred
-2
-1
0
1
2
0 5 10 15
BO
DP
red-B
OD
Ex
p
BODPred
-8
-4
0
4
8
0 10 20 30 40 50
CO
DP
red-C
OD
Exp
CODPred
-8
-4
0
4
8
0 10 20 30 40 50
CO
DP
red-C
OD
Exp
CODPred
R2 = 0.025R2 = 0.013
R2 = 0.138R2 = 0.115
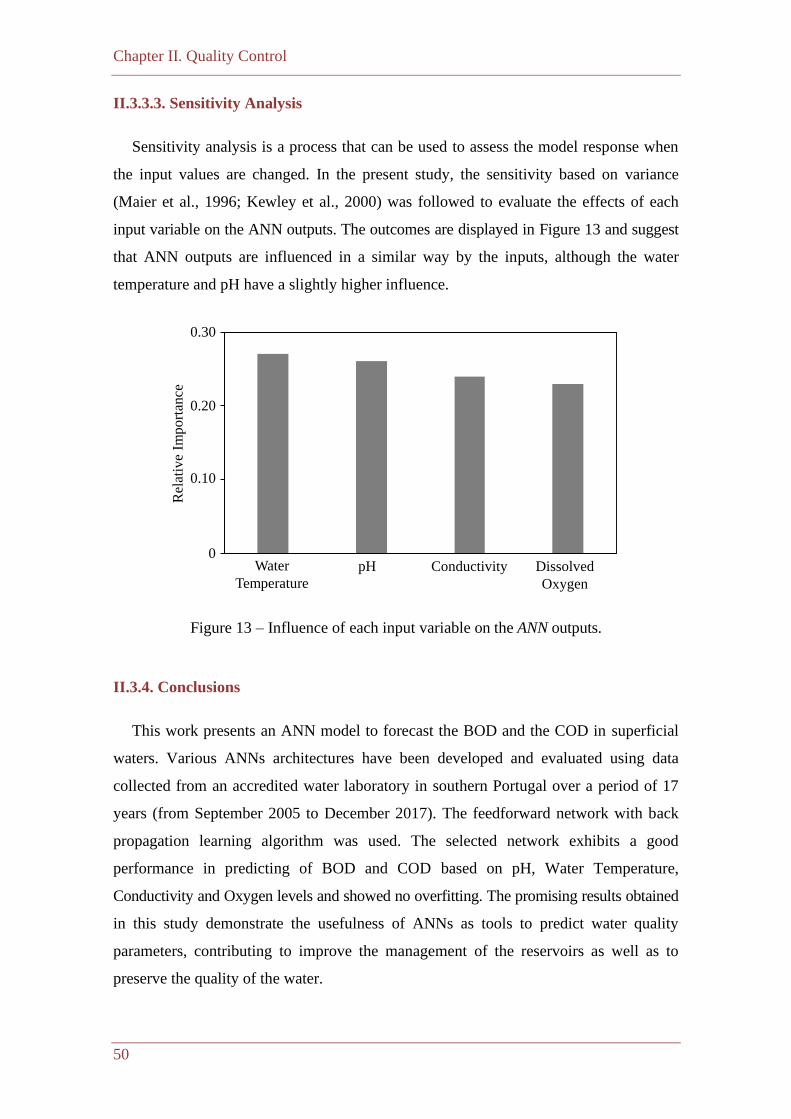
Chapter II. Quality Control
50
II.3.3.3. Sensitivity Analysis
Sensitivity analysis is a process that can be used to assess the model response when
the input values are changed. In the present study, the sensitivity based on variance
(Maier et al., 1996; Kewley et al., 2000) was followed to evaluate the effects of each
input variable on the ANN outputs. The outcomes are displayed in Figure 13 and suggest
that ANN outputs are influenced in a similar way by the inputs, although the water
temperature and pH have a slightly higher influence.
Figure 13 – Influence of each input variable on the ANN outputs.
II.3.4. Conclusions
This work presents an ANN model to forecast the BOD and the COD in superficial
waters. Various ANNs architectures have been developed and evaluated using data
collected from an accredited water laboratory in southern Portugal over a period of 17
years (from September 2005 to December 2017). The feedforward network with back
propagation learning algorithm was used. The selected network exhibits a good
performance in predicting of BOD and COD based on pH, Water Temperature,
Conductivity and Oxygen levels and showed no overfitting. The promising results obtained
in this study demonstrate the usefulness of ANNs as tools to predict water quality
parameters, contributing to improve the management of the reservoirs as well as to
preserve the quality of the water.
0
0,1
0,2
0,3
Water Temperature pH Conductivity Dissolved OxygenWater
Temperature
0.10
0.20
0
0.30
pH Conductivity Dissolved
Oxygen
Rel
ativ
e Im
po
rtan
ce
Chapter II. Quality Control
51
II.4. Synopsis
This chapter focused on the study of water quality control for human consumption.
Water laboratories play an essential role in the health system and many decisions
regarding the treatment of raw water are made considering laboratory results. In this
context, failures, errors and/or bad practices can lead to serious problems that can often
be devastating. The traditional form of quality control still remains in many laboratories,
but increasingly, the right path seems to be to understand the process as a whole, each
step and its function, in order to identify, correct and prevent adverse events. Current
methods of quality control involve a large number of technical and financial resources
(e.g., calibrated equipment, infrastructure, qualified technicians and reagents). Due to all
this complexity, a large number of errors can occur from sampling to obtaining the final
results. In this context, in the study “Avoidance of Sampling Errors in Drinking
Water Analysis – A Logical Approach to Programming” a system was proposed that
aims to avoid the main causes of errors, applying a model developed specifically for the
sampling period. This system aimed to record non-conformities, errors and adverse
events that occur during the collection of a sample of water for human consumption. An
adjusted version of the Eindhoven classification model was designed, with extensions
and adaptations for the referred scenario, as well as the causal tree associated with the
adverse event “sampling failure”. Due to the modularity of the proposed system, other
types of adverse events can be explored and added whenever justified.
In addition to the sampling stage, the analytical control of water was also addressed
through the study “Draw on Artificial Neural Networks to Assess and Predict Water
Quality”. This paper presents the training and evaluation of artificial neural networks to
predict, simultaneously, the biochemical and chemical oxygen demand based on the
values of pH, dissolved oxygen, conductivity, and water temperature. The models were
trained and tested using experimental data obtained from surface water samples used to
produce water for public use and/or irrigation. The promising results of this study
showed that this methodology can be particularly useful for improving water resource
management and maintaining water quality.

Chapter III. Quality Management

Chapter III. Quality Management
53
III.1. Overview
Quality Assurance (QA) corresponds to the set of activities planned and carried out
in a systematic way by companies, to demonstrate that the products/services meet the
quality requirements. This can be ensured either through laboratory tests or through the
evaluation of consumer satisfaction (Vieira, 2018). QA includes all activities from design,
development, production, installation, maintenance, and documentation. QA cannot
fully guarantee the production of quality products, but it makes it more likely.
Montegomery (2019) distinguishes between the concepts of Quality Control (QC) and
Quality Assurance. While the first emphasizes testing and blocking the release of defective
products, QA is concerned with improving and stabilizing production to avoid or at least
minimize issues that could lead to defective products. Quality Management (QM) and
Quality Assurance are two associated concepts, the first being a way to guarantee
quality. The second comprises the set of coordinated activities to manage and control an
organization about quality (ISO 9001, 2015). QM can have three components, namely
control, guarantee and quality improvement, focusing itself not only in the quality of the
product but also in the ways to achieve it.
There are many methods to manage and improve quality, from continuous improvement
of the product and process, to the continuous training of employees. One of the most used
strategies is the Deming cycle, also known as the PDCA cycle, which incorporates the
Plan, Do, Check and Act steps (Deming, 1982). Although it was developed in the 1930s
by the American Shewhart, its main promoter was Deming. It is a systematic and
disciplined approach to identify opportunities for improving quality and implementing
lasting solutions. In the context of a quality management system and considering its
dynamic character, the PDCA cycle can be applied both in each of the processes and in the
organization as a whole. In addition to the above, it is also considered a problem-solving
method, as each improvement goal originates from a problem that must be solved (Berlitz
& Haussen, 2011). Thus, it is strongly associated with the planning, implementation,
control, and continuous improvement of product realization, processes, and quality
management systems. In fact, the referred cycle has some characteristics such as
simplicity, operational ease, the valuation of facts, the analysis of the global problem, and
the identification of the real causes of the problem. The success achieved comes from a
Chapter III. Quality Management
54
wide applicability, as it can be used in all activities of an organization, whatever its area
of intervention. This methodology has been adapted and implemented in the health area,
and it is often used as a process of continuous improvement in the quality of both health
care and health systems, and it can also be used in other areas (Plebani, 2006).
Considering the fundamental role that water plays in disease prevention and health
promotion, issues concerning literacy in relation to the water issue relate to health
literacy. Thus, citizens must have a level of knowledge and skills to support conscious
decision-making, leading to changes in behaviour and ways of life, with a view to
improving health both from an individual and a public perspective. As a reflection of
this process, in the last decades the water sector has undergone transformations that
required laboratories to restructure the business management models (Bossuyt et al,
2007). In addition to the water industry, other sectors in the health context (such as the
blood and pathological anatomy sector) had to readjust and seek refuge in alliances,
mergers, and partnerships, aiming at reducing the cost of analysis and optimization of
efficiency indicators (Dollard et. al., 2019). In particular, the cryopreservation sector,
which aims to conserve biological cells or tissues for long periods at low temperatures
without losing cell viability, had to readjust itself and look for new methodologies. This
technique allows stem cells (isolated from blood and umbilical cord tissue, harvested on
the day of delivery), to be preserved for later clinical application. In terms of scientific
credibility, stem cell treatments are still in the maturation stage, especially in the sense
of achieving comparable results, even though there is already evidence of their
effectiveness, namely in the treatment of haemato-oncological diseases (Slack, 2018).
Over the next decade, it is expected that some stem cell therapy protocols (currently
undergoing clinical trials) will become treatments for currently unresponsive diseases.
The fact that these techniques show to be very promising leads to the existence of a
strong pressure on workers in the sector, which can lead to the appearance of
psychosocial risks that need to be studied.
This chapter aims to address quality management by presenting the following
studies:
• III.2 – Fully Informed Classification Systems – Simpler, Maybe Better3
• III.3 – A Conceptual Model to Assess the Literacy of Water Consumers4
3 Published in Communications in Computer and Information Science, 1038: 3–16, 2019.
4 Submitted to Journal of Water and Health.
Chapter III. Quality Management
55
• III.4 – Psychosocial Risks Assessment in Cryopreservation Laboratories5
These studies were designed with the aim of supporting quality management
departments in preventing adverse events that may occur in daily work (study III.2),
checking the level of knowledge of consumers regarding water quality control (study
III.3) and, finally, the assessment of the psychosocial risks to which laboratory
employees are exposed, who increasingly prioritize speed, efficiency and effectiveness
at the lowest possible cost (study III.4).
5 Published in Safety and Health at Work, 11: 431–442, 2020.
Chapter III. Quality Management
56
III.2. Fully Informed Classification Systems – Simpler, Maybe Better
III.2.1. Introduction
Citizens are better informed and increasingly demanding in terms of the quality of
the Public Services (PS) on offer. The development of quality management systems in
compliance with the ISO 9001 guidelines ensures their efficiency and helps to increase
inner and outer satisfaction (George, 2003; Chong-Fong, 2015; ISO 9001, 2015). An
adverse event in this context means failure to perform a prescribed action or the use of a
false plan to achieve an intended objective. The most efficient strategy for avoiding
adverse events is recognizing their sources, i.e., avoiding the causes can in particular
improve the quality of PS. Such causes can be related to practical problems, human
relationships, policies, action plans, products, strategies, and/or leaders. People continue
to learn from their own mistakes rather than from their successes. However, they do not
share the appearance of glitches or what they have learned with them. So, similar
mistakes can occur repeatedly, and citizens can be harmed by avoidable mistakes. Some
studies have suggested that reporting may be a possible solution to this problem. The
basic idea of reporting is based on the learning process based on experience. However,
it is important to emphasize that the registration of errors is not sufficient to ensure the
quality of the services provided. Collecting data is not enough to improve the process.
Only an efficient response to adverse events may affect the change. A technical review
of the data is essential to identify trends and patterns (van der Schaaf, 1995; World
Alliance for Patient Safety, 2005). One answer to this limitation is the combination of
an adverse event reporting system and machine learning methods to identify hazards
and risks (Vicente et al., 2015). Using models to identify causes of adverse events is
extremely important to ensuring the exchange of knowledge and experience. Thus, in
this paper it is set the formal basis of an adverse event reporting and learning system. It
will focus on preventing the causes of adverse events, therefore ensuring performance
benchmarking of the organization against a standard, whether absolute or relative to
others (Cowper & Samuels, 1979).
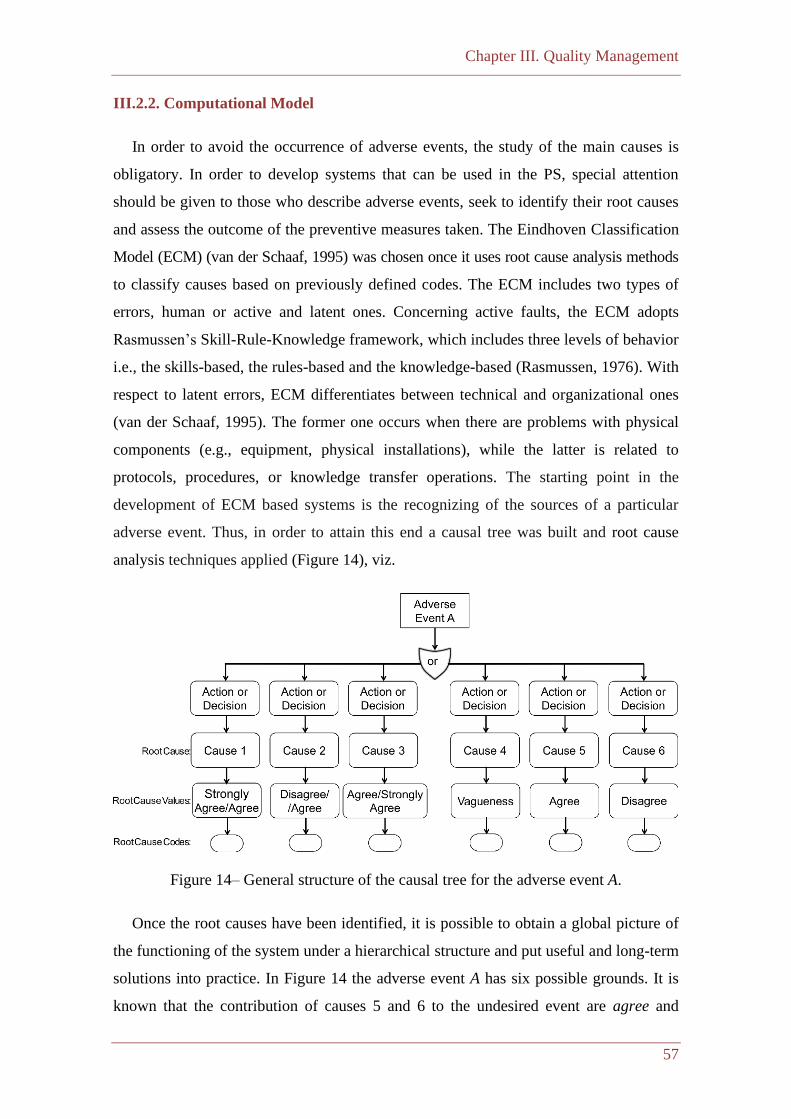
Chapter III. Quality Management
57
III.2.2. Computational Model
In order to avoid the occurrence of adverse events, the study of the main causes is
obligatory. In order to develop systems that can be used in the PS, special attention
should be given to those who describe adverse events, seek to identify their root causes
and assess the outcome of the preventive measures taken. The Eindhoven Classification
Model (ECM) (van der Schaaf, 1995) was chosen once it uses root cause analysis methods
to classify causes based on previously defined codes. The ECM includes two types of
errors, human or active and latent ones. Concerning active faults, the ECM adopts
Rasmussen’s Skill-Rule-Knowledge framework, which includes three levels of behavior
i.e., the skills-based, the rules-based and the knowledge-based (Rasmussen, 1976). With
respect to latent errors, ECM differentiates between technical and organizational ones
(van der Schaaf, 1995). The former one occurs when there are problems with physical
components (e.g., equipment, physical installations), while the latter is related to
protocols, procedures, or knowledge transfer operations. The starting point in the
development of ECM based systems is the recognizing of the sources of a particular
adverse event. Thus, in order to attain this end a causal tree was built and root cause
analysis techniques applied (Figure 14), viz.
Figure 14– General structure of the causal tree for the adverse event A.
Once the root causes have been identified, it is possible to obtain a global picture of
the functioning of the system under a hierarchical structure and put useful and long-term
solutions into practice. In Figure 14 the adverse event A has six possible grounds. It is
known that the contribution of causes 5 and 6 to the undesired event are agree and
Chapter III. Quality Management
58
disagree, respectively (known values), while the contribution of the remaining causes is
unknown, which sets two different types of unknown values. With regard to causes 1, 2
and 3, it is not possible to determine their precise values, but it is known that their
domains are given by the sets {strongly agree, agree}, {disagree, agree} and {agree,
strongly agree}, respectively, i.e., an unknown value in a finite set of values. With
regard to cause 4, it is not possible to assert its contribution to the undesirable event, all
values are plausible, i.e., an unknown value (not necessarily from a finite set of values).
III.2.2.1. Knowledge Representation and Reasoning
The Knowledge Representation and Reasoning practices in use are to be understood
as a process of energy devaluation (Wenterodt & Herwig, 2014), i.e., a data item is to be
understood as being in a given moment at a given entropic state as untainted energy
that, according to the First Law of Thermodynamics, is a quantity well-preserved that
cannot be consumed in the sense of destruction but may be consumed in the sense of
devaluation. This new understanding may be introduced by splitting a given amount of
energy into its parts, viz.
• Exergy, that stands for a measure of the energy that is transferred to the internal
energy of a working environment and consumed, i.e., it also stands for a relevant
physical factor, its entropy (In Figure 15 it is given by the dark colored areas);
• Vagueness, i.e., the corresponding energy values that may or may not have been
transferred and consumed (In Figure 15 it is given by the gray colored areas); and
• Anergy, that stands for an energetic potential that was not yet transferred, being
therefore available (In Figure 15 it is given by the white areas and stands for an
energetic potential that may be available to be transferred and consumed).
which denote all possible energy’s transfer operations as pure energy. Aiming at the
quantification of the qualitative information contained in the causal tree presented in
Figure 14, and in order to make the process comprehensible, it will be presented in a
graphical form (Figure 15). Taking as an example a group of 6 (six) items that make the
Citizen’s Charter-Six-Items (Luhtanen & Crocker, 1992), viz.
C1 – Standards;
C2 – Information and openness;
C3 – Choice and consultation;
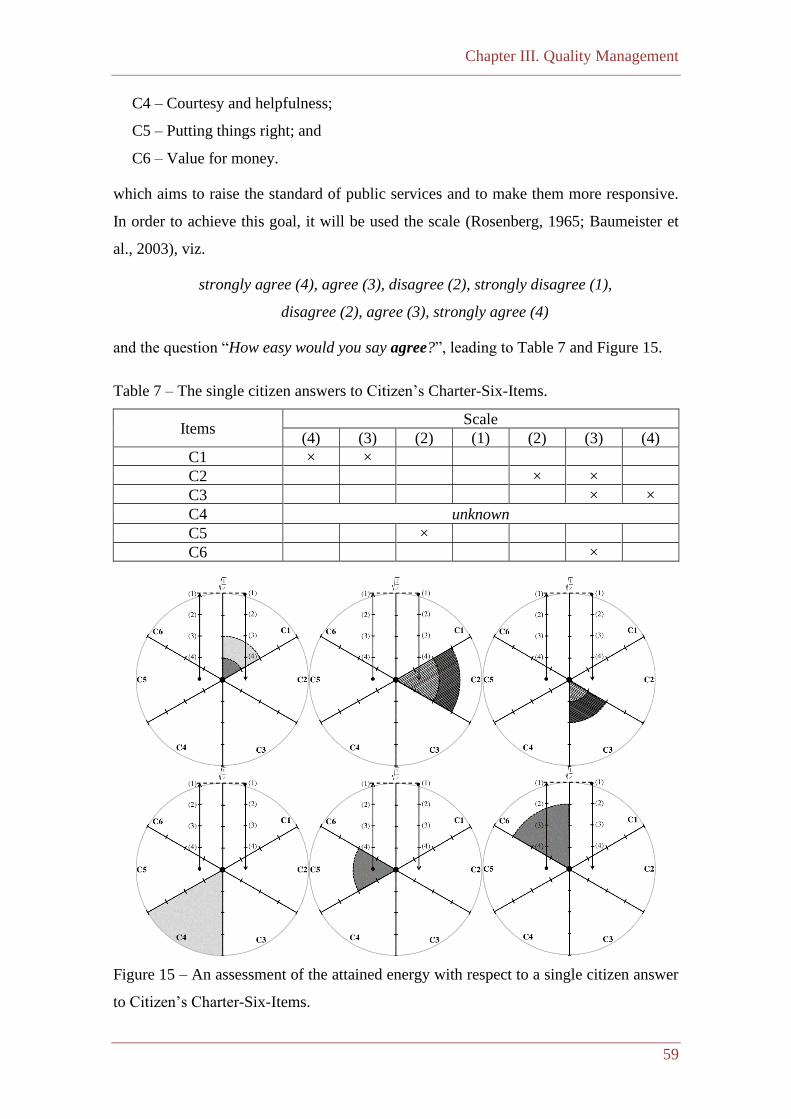
Chapter III. Quality Management
59
C4 – Courtesy and helpfulness;
C5 – Putting things right; and
C6 – Value for money.
which aims to raise the standard of public services and to make them more responsive.
In order to achieve this goal, it will be used the scale (Rosenberg, 1965; Baumeister et
al., 2003), viz.
strongly agree (4), agree (3), disagree (2), strongly disagree (1),
disagree (2), agree (3), strongly agree (4)
and the question “How easy would you say agree?”, leading to Table 7 and Figure 15.
Table 7 – The single citizen answers to Citizen’s Charter-Six-Items.
Items Scale
(4) (3) (2) (1) (2) (3) (4)
C1 × ×
C2 × ×
C3 × ×
C4 unknown
C5 ×
C6 ×
Figure 15 – An assessment of the attained energy with respect to a single citizen answer
to Citizen’s Charter-Six-Items.
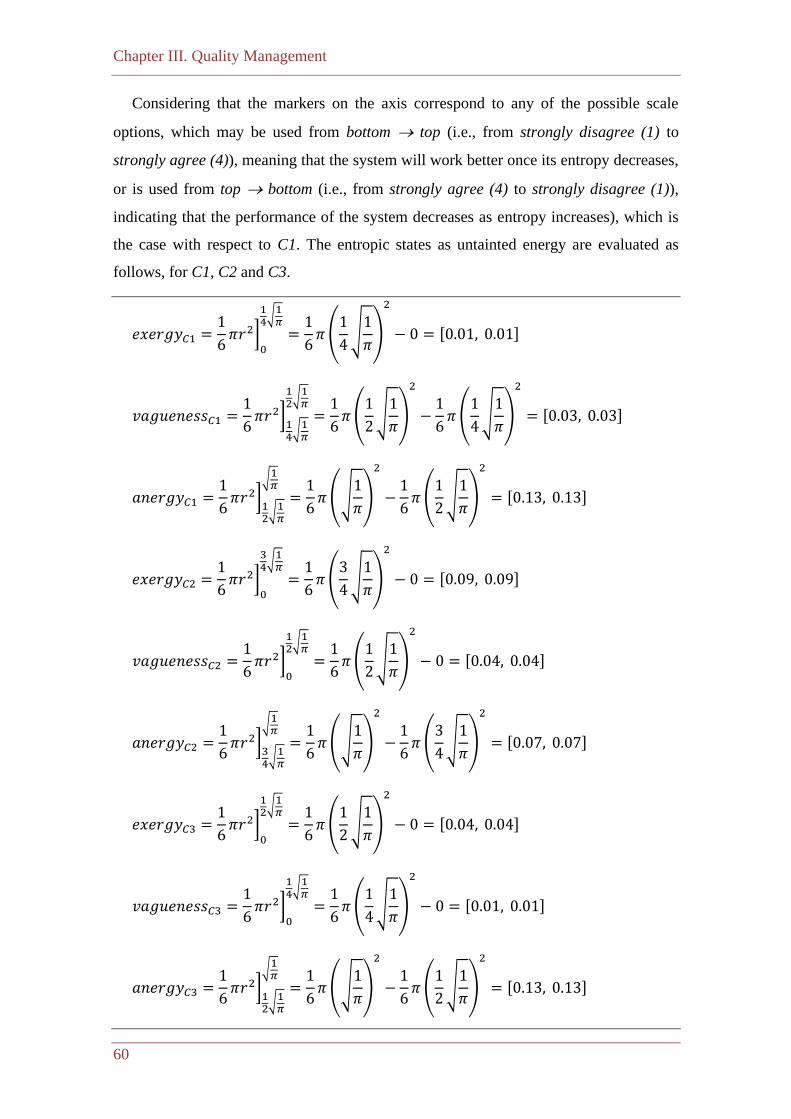
Chapter III. Quality Management
60
Considering that the markers on the axis correspond to any of the possible scale
options, which may be used from bottom → top (i.e., from strongly disagree (1) to
strongly agree (4)), meaning that the system will work better once its entropy decreases,
or is used from top → bottom (i.e., from strongly agree (4) to strongly disagree (1)),
indicating that the performance of the system decreases as entropy increases), which is
the case with respect to C1. The entropic states as untainted energy are evaluated as
follows, for C1, C2 and C3.
𝑒𝑥𝑒𝑟𝑔𝑦𝐶1 =1
6𝜋𝑟2]
0
14√1𝜋=1
6𝜋(1
4√1
𝜋)
2
− 0 = [0.01, 0.01]
𝑣𝑎𝑔𝑢𝑒𝑛𝑒𝑠𝑠𝐶1 =1
6𝜋𝑟2]
14√1𝜋
12√1𝜋=1
6𝜋(1
2√1
𝜋)
2
−1
6𝜋(1
4√1
𝜋)
2
= [0.03, 0.03]
𝑎𝑛𝑒𝑟𝑔𝑦𝐶1 =1
6𝜋𝑟2]
12√1𝜋
√1𝜋=1
6𝜋(√
1
𝜋)
2
−1
6𝜋 (1
2√1
𝜋)
2
= [0.13, 0.13]
𝑒𝑥𝑒𝑟𝑔𝑦𝐶2 =1
6𝜋𝑟2]
0
34√1𝜋=1
6𝜋(3
4√1
𝜋)
2
− 0 = [0.09, 0.09]
𝑣𝑎𝑔𝑢𝑒𝑛𝑒𝑠𝑠𝐶2 =1
6𝜋𝑟2]
0
12√1𝜋=1
6𝜋(1
2√1
𝜋)
2
− 0 = [0.04, 0.04]
𝑎𝑛𝑒𝑟𝑔𝑦𝐶2 =1
6𝜋𝑟2]
34√1𝜋
√1𝜋=1
6𝜋(√
1
𝜋)
2
−1
6𝜋 (3
4√1
𝜋)
2
= [0.07, 0.07]
𝑒𝑥𝑒𝑟𝑔𝑦𝐶3 =1
6𝜋𝑟2]
0
12√1𝜋=1
6𝜋(1
2√1
𝜋)
2
− 0 = [0.04, 0.04]
𝑣𝑎𝑔𝑢𝑒𝑛𝑒𝑠𝑠𝐶3 =1
6𝜋𝑟2]
0
14√1𝜋=1
6𝜋(1
4√1
𝜋)
2
− 0 = [0.01, 0.01]
𝑎𝑛𝑒𝑟𝑔𝑦𝐶3 =1
6𝜋𝑟2]
12√1𝜋
√1𝜋=1
6𝜋(√
1
𝜋)
2
−1
6𝜋 (1
2√1
𝜋)
2
= [0.13, 0.13]
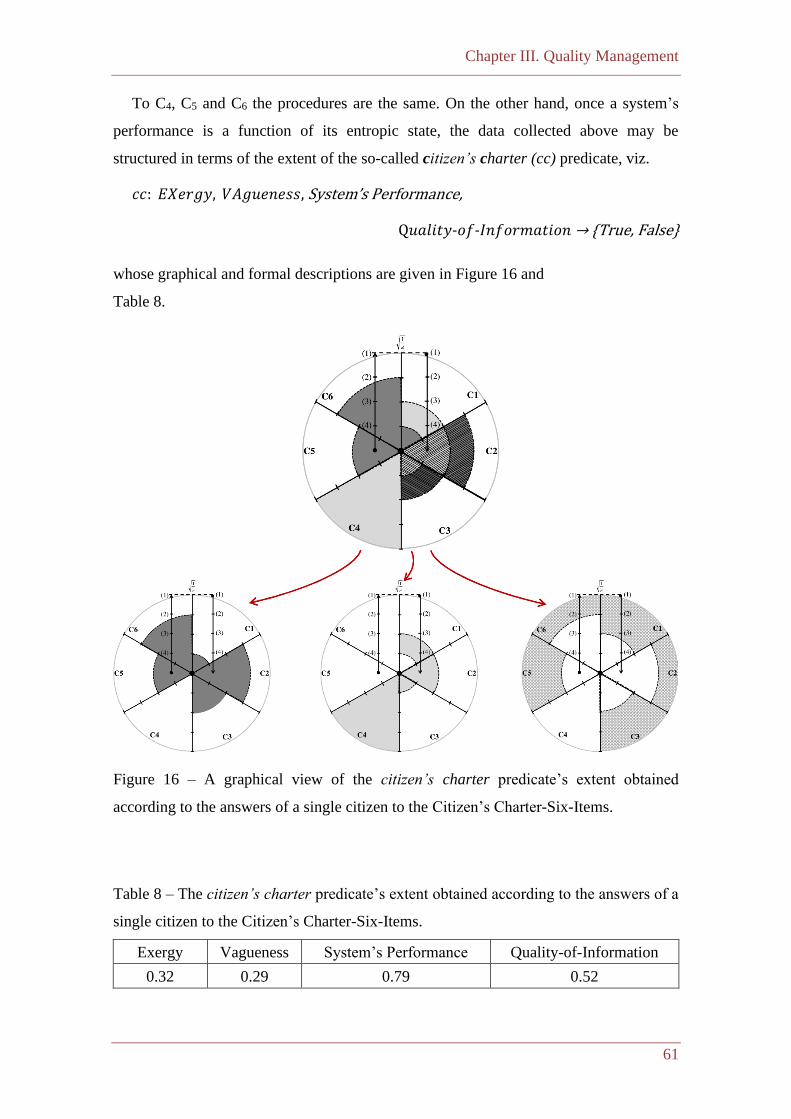
Chapter III. Quality Management
61
To C4, C5 and C6 the procedures are the same. On the other hand, once a system’s
performance is a function of its entropic state, the data collected above may be
structured in terms of the extent of the so-called citizen’s charter (cc) predicate, viz.
𝑐𝑐: 𝐸𝑋𝑒𝑟𝑔𝑦, 𝑉𝐴𝑔𝑢𝑒𝑛𝑒𝑠𝑠, System’s Performance,
Q𝑢𝑎𝑙𝑖𝑡𝑦-𝑜𝑓-𝐼𝑛𝑓𝑜𝑟𝑚𝑎𝑡𝑖𝑜𝑛 → {True, False}
whose graphical and formal descriptions are given in Figure 16 and
Table 8.
Figure 16 – A graphical view of the citizen’s charter predicate’s extent obtained
according to the answers of a single citizen to the Citizen’s Charter-Six-Items.
Table 8 – The citizen’s charter predicate’s extent obtained according to the answers of a
single citizen to the Citizen’s Charter-Six-Items.
Exergy Vagueness System’s Performance Quality-of-Information
0.32 0.29 0.79 0.52
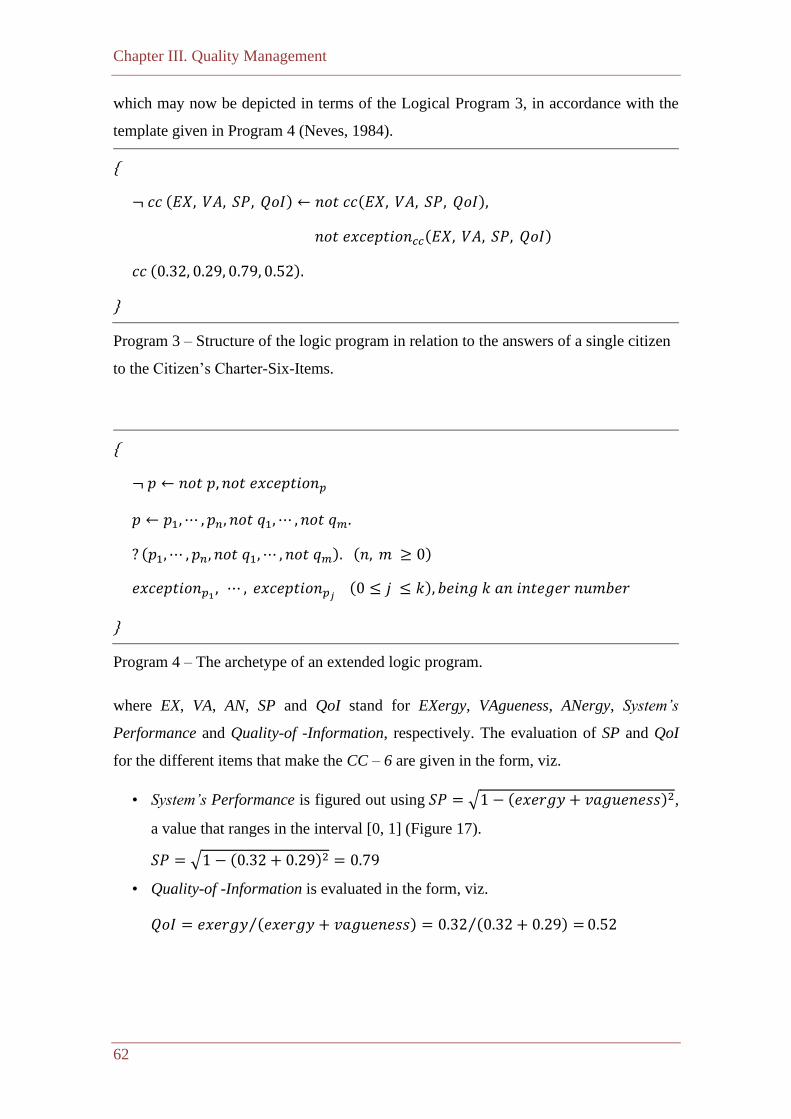
Chapter III. Quality Management
62
which may now be depicted in terms of the Logical Program 3, in accordance with the
template given in Program 4 (Neves, 1984).
{
¬ 𝑐𝑐 (𝐸𝑋, 𝑉𝐴, 𝑆𝑃, 𝑄𝑜𝐼) ← 𝑛𝑜𝑡 𝑐𝑐(𝐸𝑋, 𝑉𝐴, 𝑆𝑃, 𝑄𝑜𝐼),
𝑛𝑜𝑡 𝑒𝑥𝑐𝑒𝑝𝑡𝑖𝑜𝑛𝑐𝑐(𝐸𝑋, 𝑉𝐴, 𝑆𝑃, 𝑄𝑜𝐼)
𝑐𝑐 (0.32, 0.29, 0.79, 0.52).
}
Program 3 – Structure of the logic program in relation to the answers of a single citizen
to the Citizen’s Charter-Six-Items.
{
¬ 𝑝 ← 𝑛𝑜𝑡 𝑝, 𝑛𝑜𝑡 𝑒𝑥𝑐𝑒𝑝𝑡𝑖𝑜𝑛𝑝
𝑝 ← 𝑝1,⋯ , 𝑝𝑛, 𝑛𝑜𝑡 𝑞1, ⋯ , 𝑛𝑜𝑡 𝑞𝑚.
? (𝑝1,⋯ , 𝑝𝑛, 𝑛𝑜𝑡 𝑞1, ⋯ , 𝑛𝑜𝑡 𝑞𝑚). (𝑛, 𝑚 ≥ 0)
𝑒𝑥𝑐𝑒𝑝𝑡𝑖𝑜𝑛𝑝1 , ⋯ , 𝑒𝑥𝑐𝑒𝑝𝑡𝑖𝑜𝑛𝑝𝑗 (0 ≤ 𝑗 ≤ 𝑘), 𝑏𝑒𝑖𝑛𝑔 𝑘 𝑎𝑛 𝑖𝑛𝑡𝑒𝑔𝑒𝑟 𝑛𝑢𝑚𝑏𝑒𝑟
}
Program 4 – The archetype of an extended logic program.
where EX, VA, AN, SP and QoI stand for EXergy, VAgueness, ANergy, System’s
Performance and Quality-of -Information, respectively. The evaluation of SP and QoI
for the different items that make the CC – 6 are given in the form, viz.
• System’s Performance is figured out using 𝑆𝑃 = √1 − (𝑒𝑥𝑒𝑟𝑔𝑦 + 𝑣𝑎𝑔𝑢𝑒𝑛𝑒𝑠𝑠)2,
a value that ranges in the interval [0, 1] (Figure 17).
𝑆𝑃 = √1 − (0.32 + 0.29)2 = 0.79
• Quality-of -Information is evaluated in the form, viz.
𝑄𝑜𝐼 = 𝑒𝑥𝑒𝑟𝑔𝑦 (𝑒𝑥𝑒𝑟𝑔𝑦 + 𝑣𝑎𝑔𝑢𝑒𝑛𝑒𝑠𝑠)⁄ = 0.32 (0.32 + 0.29) =⁄ 0.52
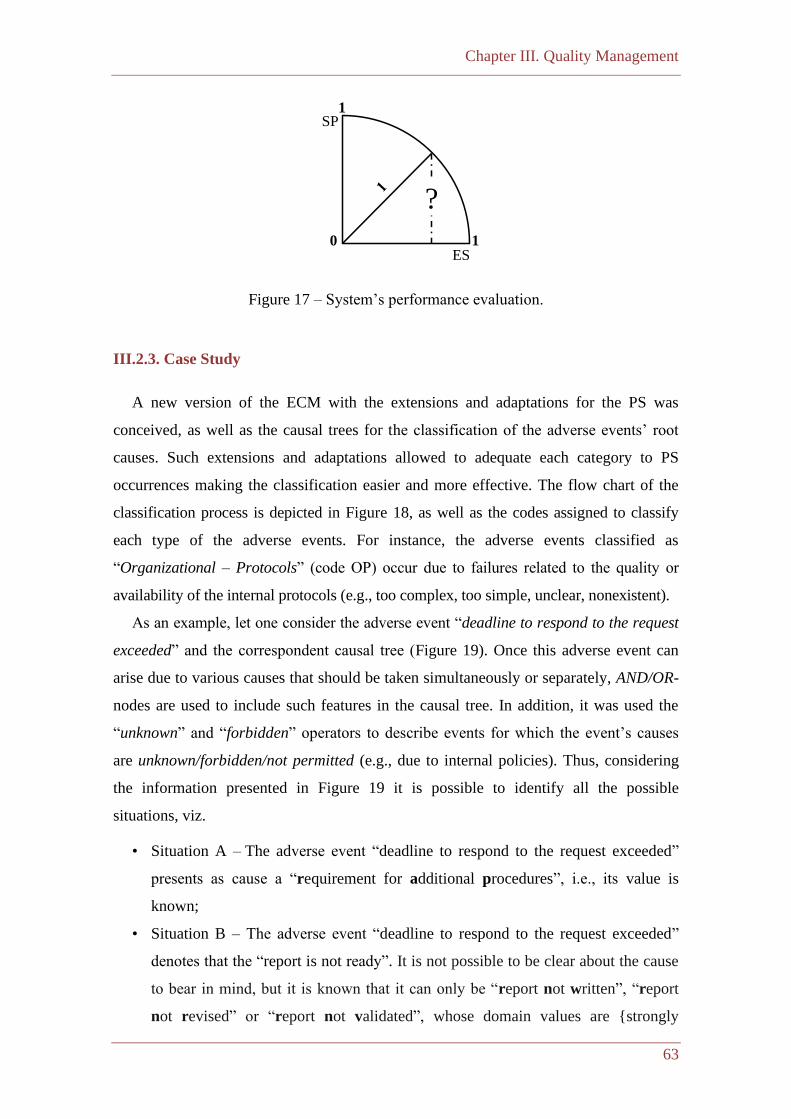
Chapter III. Quality Management
63
Figure 17 – System’s performance evaluation.
III.2.3. Case Study
A new version of the ECM with the extensions and adaptations for the PS was
conceived, as well as the causal trees for the classification of the adverse events’ root
causes. Such extensions and adaptations allowed to adequate each category to PS
occurrences making the classification easier and more effective. The flow chart of the
classification process is depicted in Figure 18, as well as the codes assigned to classify
each type of the adverse events. For instance, the adverse events classified as
“Organizational – Protocols” (code OP) occur due to failures related to the quality or
availability of the internal protocols (e.g., too complex, too simple, unclear, nonexistent).
As an example, let one consider the adverse event “deadline to respond to the request
exceeded” and the correspondent causal tree (Figure 19). Once this adverse event can
arise due to various causes that should be taken simultaneously or separately, AND/OR-
nodes are used to include such features in the causal tree. In addition, it was used the
“unknown” and “forbidden” operators to describe events for which the event’s causes
are unknown/forbidden/not permitted (e.g., due to internal policies). Thus, considering
the information presented in Figure 19 it is possible to identify all the possible
situations, viz.
• Situation A – The adverse event “deadline to respond to the request exceeded”
presents as cause a “requirement for additional procedures”, i.e., its value is
known;
• Situation B – The adverse event “deadline to respond to the request exceeded”
denotes that the “report is not ready”. It is not possible to be clear about the cause
to bear in mind, but it is known that it can only be “report not written”, “report
not revised” or “report not validated”, whose domain values are {strongly
1
1SP
ES
?
0
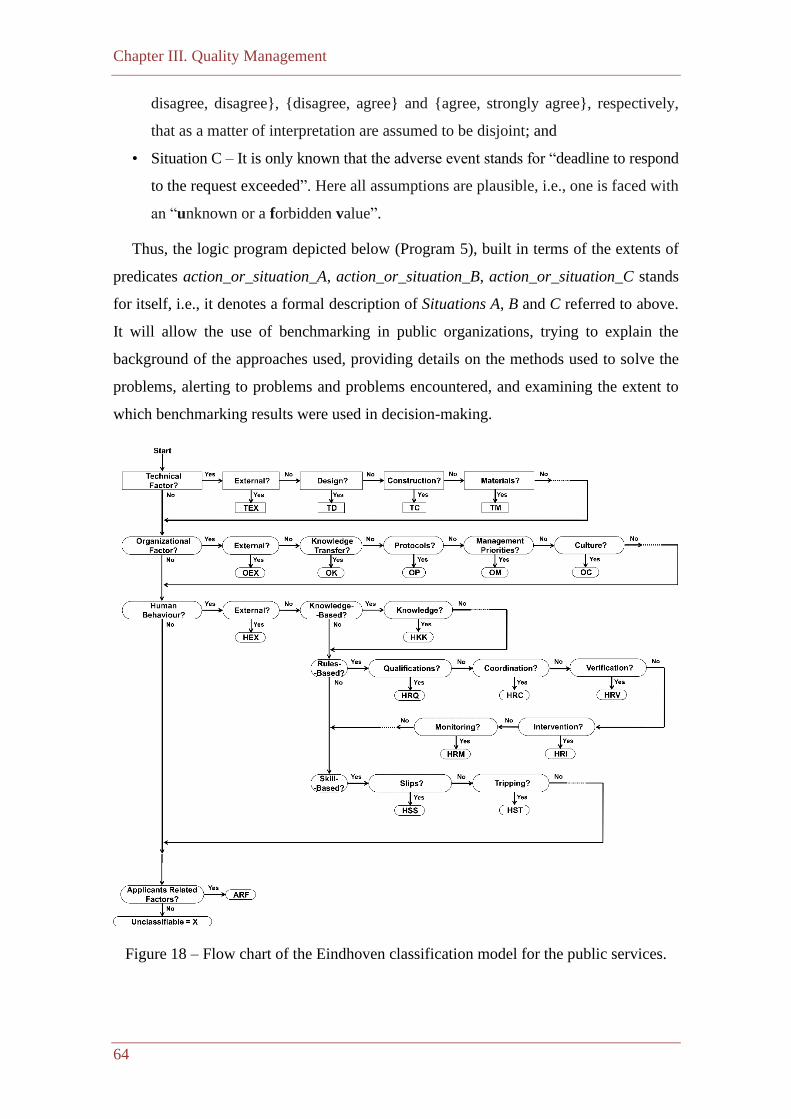
Chapter III. Quality Management
64
disagree, disagree}, {disagree, agree} and {agree, strongly agree}, respectively,
that as a matter of interpretation are assumed to be disjoint; and
• Situation C – It is only known that the adverse event stands for “deadline to respond
to the request exceeded”. Here all assumptions are plausible, i.e., one is faced with
an “unknown or a forbidden value”.
Thus, the logic program depicted below (Program 5), built in terms of the extents of
predicates action_or_situation_A, action_or_situation_B, action_or_situation_C stands
for itself, i.e., it denotes a formal description of Situations A, B and C referred to above.
It will allow the use of benchmarking in public organizations, trying to explain the
background of the approaches used, providing details on the methods used to solve the
problems, alerting to problems and problems encountered, and examining the extent to
which benchmarking results were used in decision-making.
Figure 18 – Flow chart of the Eindhoven classification model for the public services.
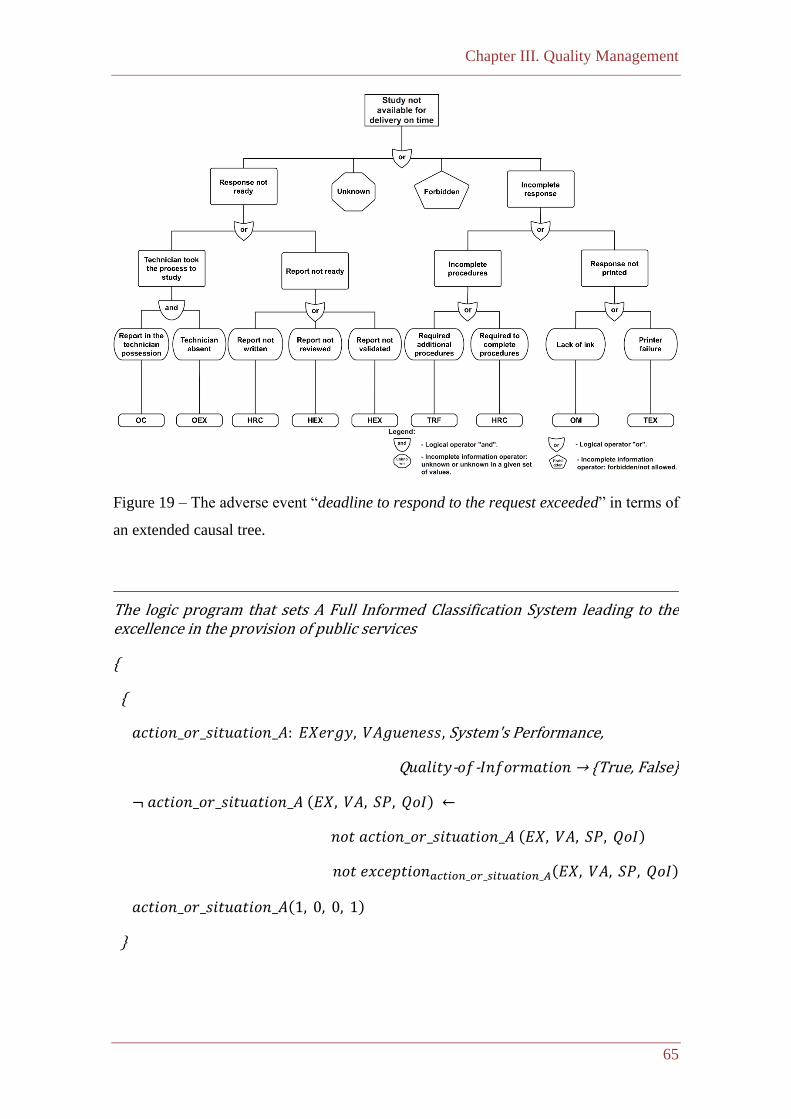
Chapter III. Quality Management
65
Figure 19 – The adverse event “deadline to respond to the request exceeded” in terms of
an extended causal tree.
The logic program that sets A Full Informed Classification System leading to the excellence in the provision of public services
{
{
𝑎𝑐𝑡𝑖𝑜𝑛_𝑜𝑟_𝑠𝑖𝑡𝑢𝑎𝑡𝑖𝑜𝑛_𝐴: 𝐸𝑋𝑒𝑟𝑔𝑦, 𝑉𝐴𝑔𝑢𝑒𝑛𝑒𝑠𝑠, System's Performance,
Q𝑢𝑎𝑙𝑖𝑡𝑦-𝑜𝑓-𝐼𝑛𝑓𝑜𝑟𝑚𝑎𝑡𝑖𝑜𝑛 → {True, False}
¬ 𝑎𝑐𝑡𝑖𝑜𝑛_𝑜𝑟_𝑠𝑖𝑡𝑢𝑎𝑡𝑖𝑜𝑛_𝐴 (𝐸𝑋, 𝑉𝐴, 𝑆𝑃, 𝑄𝑜𝐼) ←
𝑛𝑜𝑡 𝑎𝑐𝑡𝑖𝑜𝑛_𝑜𝑟_𝑠𝑖𝑡𝑢𝑎𝑡𝑖𝑜𝑛_𝐴 (𝐸𝑋, 𝑉𝐴, 𝑆𝑃, 𝑄𝑜𝐼)
𝑛𝑜𝑡 𝑒𝑥𝑐𝑒𝑝𝑡𝑖𝑜𝑛𝑎𝑐𝑡𝑖𝑜𝑛_𝑜𝑟_𝑠𝑖𝑡𝑢𝑎𝑡𝑖𝑜𝑛_𝐴(𝐸𝑋, 𝑉𝐴, 𝑆𝑃, 𝑄𝑜𝐼)
𝑎𝑐𝑡𝑖𝑜𝑛_𝑜𝑟_𝑠𝑖𝑡𝑢𝑎𝑡𝑖𝑜𝑛_𝐴(1, 0, 0, 1)
}
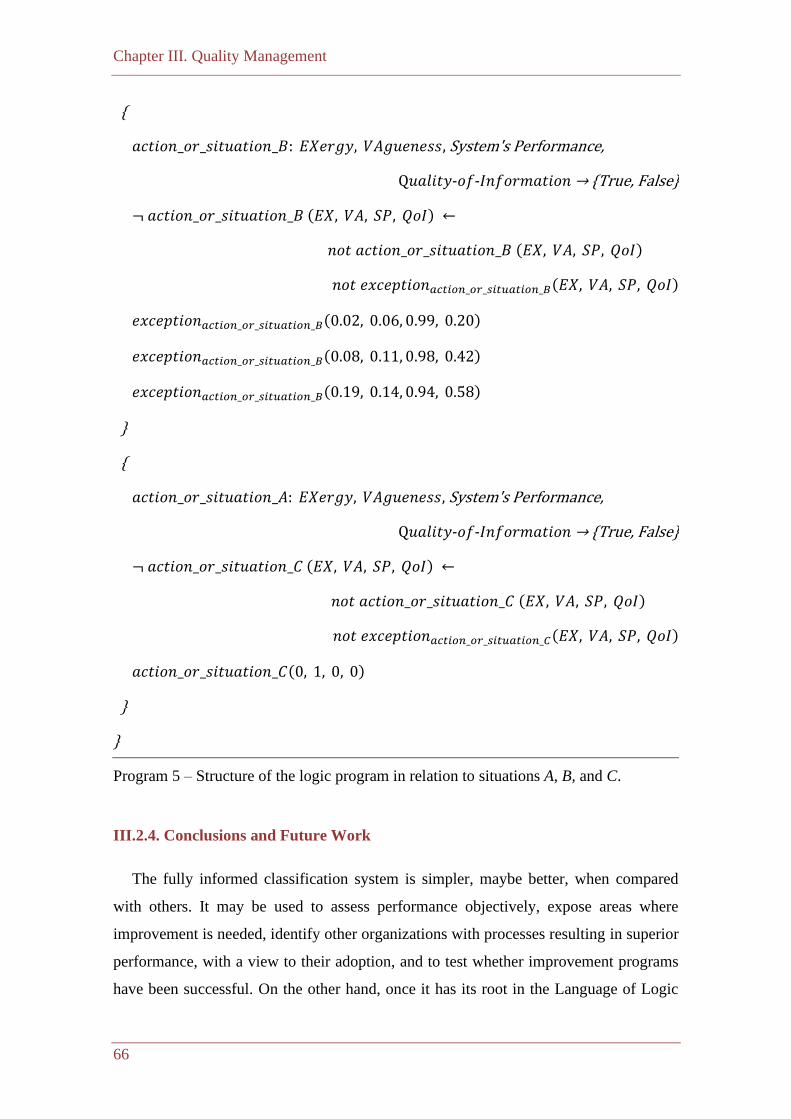
Chapter III. Quality Management
66
{
𝑎𝑐𝑡𝑖𝑜𝑛_𝑜𝑟_𝑠𝑖𝑡𝑢𝑎𝑡𝑖𝑜𝑛_𝐵: 𝐸𝑋𝑒𝑟𝑔𝑦, 𝑉𝐴𝑔𝑢𝑒𝑛𝑒𝑠𝑠, System's Performance,
Q𝑢𝑎𝑙𝑖𝑡𝑦-𝑜𝑓-𝐼𝑛𝑓𝑜𝑟𝑚𝑎𝑡𝑖𝑜𝑛 → {True, False}
¬ 𝑎𝑐𝑡𝑖𝑜𝑛_𝑜𝑟_𝑠𝑖𝑡𝑢𝑎𝑡𝑖𝑜𝑛_𝐵 (𝐸𝑋, 𝑉𝐴, 𝑆𝑃, 𝑄𝑜𝐼) ←
𝑛𝑜𝑡 𝑎𝑐𝑡𝑖𝑜𝑛_𝑜𝑟_𝑠𝑖𝑡𝑢𝑎𝑡𝑖𝑜𝑛_𝐵 (𝐸𝑋, 𝑉𝐴, 𝑆𝑃, 𝑄𝑜𝐼)
𝑛𝑜𝑡 𝑒𝑥𝑐𝑒𝑝𝑡𝑖𝑜𝑛𝑎𝑐𝑡𝑖𝑜𝑛_𝑜𝑟_𝑠𝑖𝑡𝑢𝑎𝑡𝑖𝑜𝑛_𝐵(𝐸𝑋, 𝑉𝐴, 𝑆𝑃, 𝑄𝑜𝐼)
𝑒𝑥𝑐𝑒𝑝𝑡𝑖𝑜𝑛𝑎𝑐𝑡𝑖𝑜𝑛_𝑜𝑟_𝑠𝑖𝑡𝑢𝑎𝑡𝑖𝑜𝑛_𝐵(0.02, 0.06, 0.99, 0.20)
𝑒𝑥𝑐𝑒𝑝𝑡𝑖𝑜𝑛𝑎𝑐𝑡𝑖𝑜𝑛_𝑜𝑟_𝑠𝑖𝑡𝑢𝑎𝑡𝑖𝑜𝑛_𝐵(0.08, 0.11, 0.98, 0.42)
𝑒𝑥𝑐𝑒𝑝𝑡𝑖𝑜𝑛𝑎𝑐𝑡𝑖𝑜𝑛_𝑜𝑟_𝑠𝑖𝑡𝑢𝑎𝑡𝑖𝑜𝑛_𝐵(0.19, 0.14, 0.94, 0.58)
}
{
𝑎𝑐𝑡𝑖𝑜𝑛_𝑜𝑟_𝑠𝑖𝑡𝑢𝑎𝑡𝑖𝑜𝑛_𝐴: 𝐸𝑋𝑒𝑟𝑔𝑦, 𝑉𝐴𝑔𝑢𝑒𝑛𝑒𝑠𝑠, System's Performance,
Q𝑢𝑎𝑙𝑖𝑡𝑦-𝑜𝑓-𝐼𝑛𝑓𝑜𝑟𝑚𝑎𝑡𝑖𝑜𝑛 → {True, False}
¬ 𝑎𝑐𝑡𝑖𝑜𝑛_𝑜𝑟_𝑠𝑖𝑡𝑢𝑎𝑡𝑖𝑜𝑛_𝐶 (𝐸𝑋, 𝑉𝐴, 𝑆𝑃, 𝑄𝑜𝐼) ←
𝑛𝑜𝑡 𝑎𝑐𝑡𝑖𝑜𝑛_𝑜𝑟_𝑠𝑖𝑡𝑢𝑎𝑡𝑖𝑜𝑛_𝐶 (𝐸𝑋, 𝑉𝐴, 𝑆𝑃, 𝑄𝑜𝐼)
𝑛𝑜𝑡 𝑒𝑥𝑐𝑒𝑝𝑡𝑖𝑜𝑛𝑎𝑐𝑡𝑖𝑜𝑛_𝑜𝑟_𝑠𝑖𝑡𝑢𝑎𝑡𝑖𝑜𝑛_𝐶(𝐸𝑋, 𝑉𝐴, 𝑆𝑃, 𝑄𝑜𝐼)
𝑎𝑐𝑡𝑖𝑜𝑛_𝑜𝑟_𝑠𝑖𝑡𝑢𝑎𝑡𝑖𝑜𝑛_𝐶(0, 1, 0, 0)
}
}
Program 5 – Structure of the logic program in relation to situations A, B, and C.
III.2.4. Conclusions and Future Work
The fully informed classification system is simpler, maybe better, when compared
with others. It may be used to assess performance objectively, expose areas where
improvement is needed, identify other organizations with processes resulting in superior
performance, with a view to their adoption, and to test whether improvement programs
have been successful. On the other hand, once it has its root in the Language of Logic
Chapter III. Quality Management
67
Programming where the system’s querying is set as theorems to be proved, the answers
are object of formal proof. Another advantage is in its modularity, i.e., it offers the
possibility of adding new categories and/or sub-categories at any time, without changing
the structure or its working mode.
Future work encompasses the development of the Adverse Events Manager Reports
for Public Services (AEMR-PS) module. Such component aims at the analysis of the
adverse events recorded by the Adverse Event Reporting Forms for Public Services (AERF-
PS). The AEMR-PS will provide automatic reports of the adverse events complemented
with charts and statistical information about the events recorded and will contribute to
identify trends.
Chapter III. Quality Management
68
III.3. A Conceptual Model to Assess the Literacy of Water Consumers
III.3.1. Introduction
The water that exists in nature contains microorganisms that may be pathogenic for
humans (Bagchi, 2013). Considering the key role that water plays in disease prevention
and health promotion, the issues related with water literacy can be related to health
literacy. The World Health Organization (WHO) defines health literacy as the set of
cognitive and social skills that determine individual motivation and skills, and enable
access, understanding and use of information in health promotion. In this way, citizens
should have a level of knowledge and skills to support conscious decision-making,
leading to changes in behavior and ways of living, with a view to improving health from
an individual or public perspective (WHO, 1998). For this reason, the concern with the
determination of the parameters of water quality for human consumption has been
growing in Portugal. The number of accredited laboratories is increasing, and the
existence of Quality Management Systems can contribute to raise the level of services
provided and to enhance customers’ satisfaction which, on the other hand, may be
aware of, viz.
• To know the diseases that can arise from untreated water consumption;
• To understand the importance of using public water;
• To know how and where to find information on public water quality;
• To identify situations that may affect the water quality;
• To understand the need to carry out analyzes of water withdrawals; and
• To recognize the importance of choosing a laboratory that meets legal and
technical standards.
In order to do justice to these aspects, the literature was revised. The aim of this
review is to assess the relevance of consumer literacy in relation to water quality
control. A conceptual model is presented and used to develop a questionnaire to
examine the level of knowledge of water consumers about their quality. In addition, this
study establishes the connection between the conceptual model and the Deming’s
PDCA one.

Chapter III. Quality Management
69
III.3.2. Methods
III.3.2.1. Study Design
A literature search was carried out to identify key concepts, theories, sources of
evidence and knowledge gaps. The five steps described by Arksey & O’Malley (2005),
(i.e., identifying the research question, identifying relevant studies, selecting studies,
plotting the data and finally, group, summarize and report the results) were followed.
III.3.2.2. Electronic Search Strategy
A bibliographic search was carried out for the period between January 2015 and
January 2020 using the ScienceDirect and B-On platforms using keywords like literacy,
awareness, water, water for human consumption, drinking water, the environment,
disease prevention and public health.
III.3.3. Results
The search for the term literacy gave 304.319 results (Figure 20). The studies related
to consumer literacy in the areas of finance (Cameron et al., 2014; Kramer, 2016) and
health (Amoah, 2018; Balmer et al., 2020) are more frequent than the ones concerning
environment and water. A study carried out by Amoah (2018) demonstrated that
participation in social activities (religious, voluntary and in groups) and health literacy
have positive effects on health well-being. Data were collected through the application
of 779 questionnaires to rural and urban residents in the Ashanti region of Ghana, from
June 2015 to October 2015. Balmer et al. (2020) studied the connection between the
literacy level of nursing students over the years of their training in 4 regions of the
world. The data were collected between 2014 and 2016, enrolling 845 nursing students.
In all regions, the results show significant changes in health literacy profiles according
to the training year, namely in the ability to find good health information.
The association of the terms “literacy” + “environment” and “literacy” + “water”
allowed to identify thirteen works (Figure 20). After discarding the duplications, twelve
papers were considered. Their analysis shows that five of them are related with
environment, but in a perspective different from the one intended in this study.
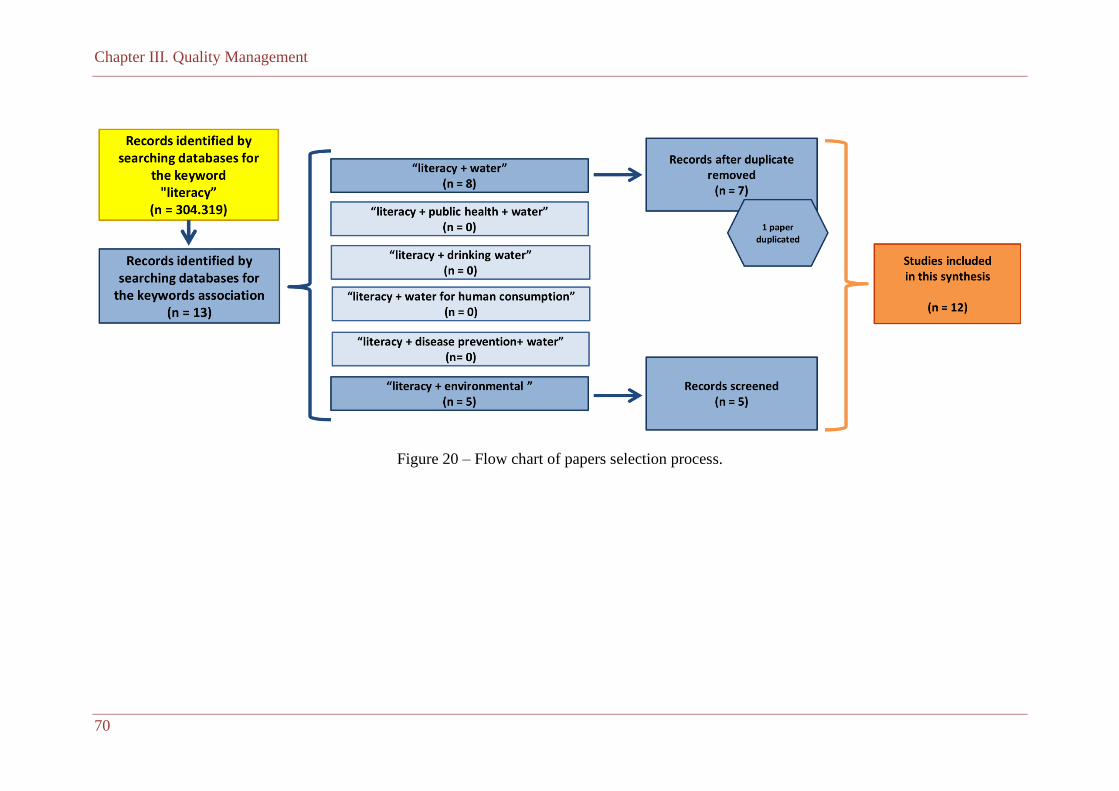
Chapter III. Quality Management
70
Figure 20 – Flow chart of papers selection process.
Chapter III. Quality Management
71
Ramdas & Mohamed (2014) define the concept of environmental literacy not only as
the knowledge about the environment and its problems, but also related to attitudes,
sensitivity, and motivation. Having this in mind, the authors addressed the problematic
of tax application to tourists to change their environmental behavior. The study shows
strong associations between tourists’ level of environmental literacy and willingness to
pay for environmental conservation (Ramdas & Mohamed, 2014). Broek (2019) studied
the household energy literacy. The author highlighted that consumers with positive
environmental attitudes and with higher education demonstrate greater levels of energy
saving literacy. Craig & Allen (2015) studied students’ environmental literacy and energy
saving behaviors. Goldman et al. (2018) investigated the environmental literacy of
students and the environmental performance of schools with certification. Sovacool &
Blyth (2015) studied the Danish consumer literacy in issues related with affordability of
electricity and gasoline, climate change and their preferences for alternative energies.
From the set of selected papers, only seven associate the terms literacy and water.
However, only one presents a study regarding water quality literacy. Irvin et al. (2019)
studied the level of knowledge of well owners about the risks associated with the use of
water from private sources. In particular, regarding environmental pollution or the
presence of contaminants. The rest of the work deals with the term’s literacy and water
from a different perspective than this study. He (2018) analyzed the Chinese literacy
regarding the use of water as a resource that must be preserved. The author evaluated
the current status of water literacy across different geographic areas of China, in order
to develop a methodology to establish reasonable water-using policies. Roldan et al.
(2019) investigate students’ climatic literacy to identify relationship between the problem
of water and the climate crisis. Simonds et al. (2019) studied the literacy of the risks
associated with the consumption of contaminated water in some rural communities in
the USA. Seelen et al. (2019) carried out a study on the level of knowledge regarding
the factors that can threaten water quality (agriculture, industry, and climate change). Su
et al. (2011) studied the level of literacy related to the impacts on public health resulting
from catastrophes associated with intense rain phenomenon. Finally, Bhardwaj et al.
(2017) investigated the percentage of people in India who practice defecation in the
open sky. The authors investigated the different factors which were responsible for the
non-usage of toilets in India and explore the drainage system and sanitation conditions
in public places. According to the authors the low education levels (particularly of women)
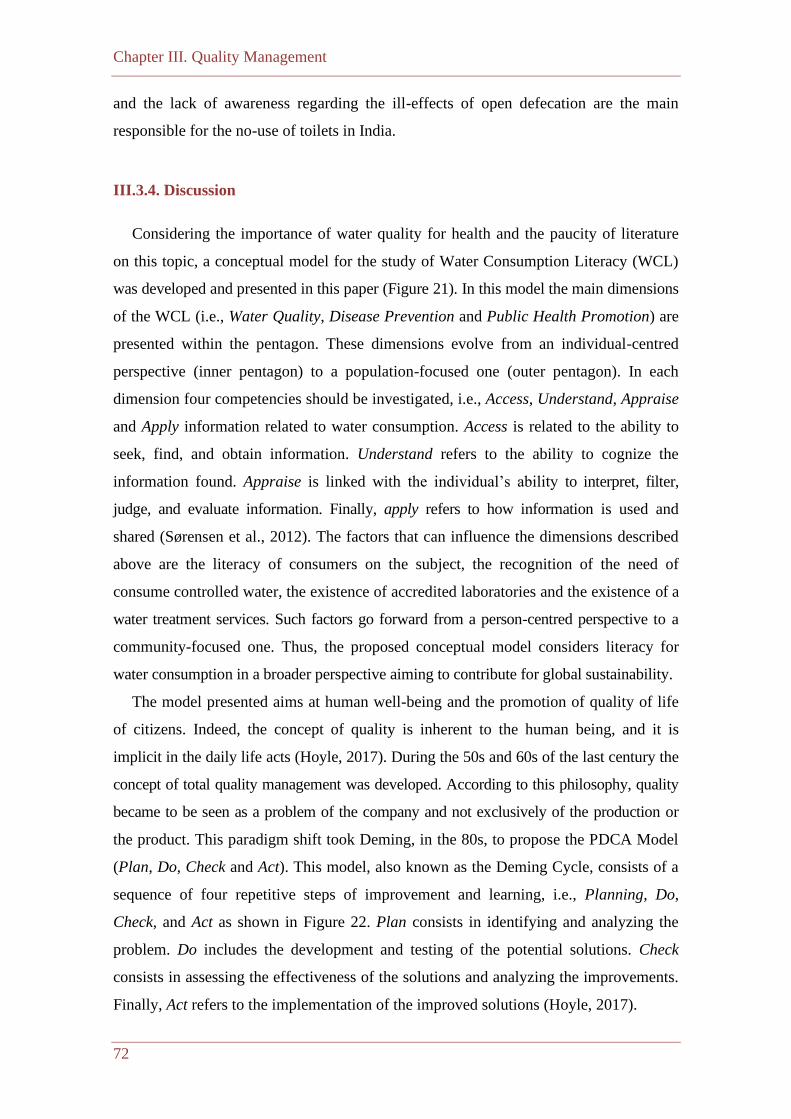
Chapter III. Quality Management
72
and the lack of awareness regarding the ill-effects of open defecation are the main
responsible for the no-use of toilets in India.
III.3.4. Discussion
Considering the importance of water quality for health and the paucity of literature
on this topic, a conceptual model for the study of Water Consumption Literacy (WCL)
was developed and presented in this paper (Figure 21). In this model the main dimensions
of the WCL (i.e., Water Quality, Disease Prevention and Public Health Promotion) are
presented within the pentagon. These dimensions evolve from an individual-centred
perspective (inner pentagon) to a population-focused one (outer pentagon). In each
dimension four competencies should be investigated, i.e., Access, Understand, Appraise
and Apply information related to water consumption. Access is related to the ability to
seek, find, and obtain information. Understand refers to the ability to cognize the
information found. Appraise is linked with the individual’s ability to interpret, filter,
judge, and evaluate information. Finally, apply refers to how information is used and
shared (Sørensen et al., 2012). The factors that can influence the dimensions described
above are the literacy of consumers on the subject, the recognition of the need of
consume controlled water, the existence of accredited laboratories and the existence of a
water treatment services. Such factors go forward from a person-centred perspective to a
community-focused one. Thus, the proposed conceptual model considers literacy for
water consumption in a broader perspective aiming to contribute for global sustainability.
The model presented aims at human well-being and the promotion of quality of life
of citizens. Indeed, the concept of quality is inherent to the human being, and it is
implicit in the daily life acts (Hoyle, 2017). During the 50s and 60s of the last century the
concept of total quality management was developed. According to this philosophy, quality
became to be seen as a problem of the company and not exclusively of the production or
the product. This paradigm shift took Deming, in the 80s, to propose the PDCA Model
(Plan, Do, Check and Act). This model, also known as the Deming Cycle, consists of a
sequence of four repetitive steps of improvement and learning, i.e., Planning, Do,
Check, and Act as shown in Figure 22. Plan consists in identifying and analyzing the
problem. Do includes the development and testing of the potential solutions. Check
consists in assessing the effectiveness of the solutions and analyzing the improvements.
Finally, Act refers to the implementation of the improved solutions (Hoyle, 2017).
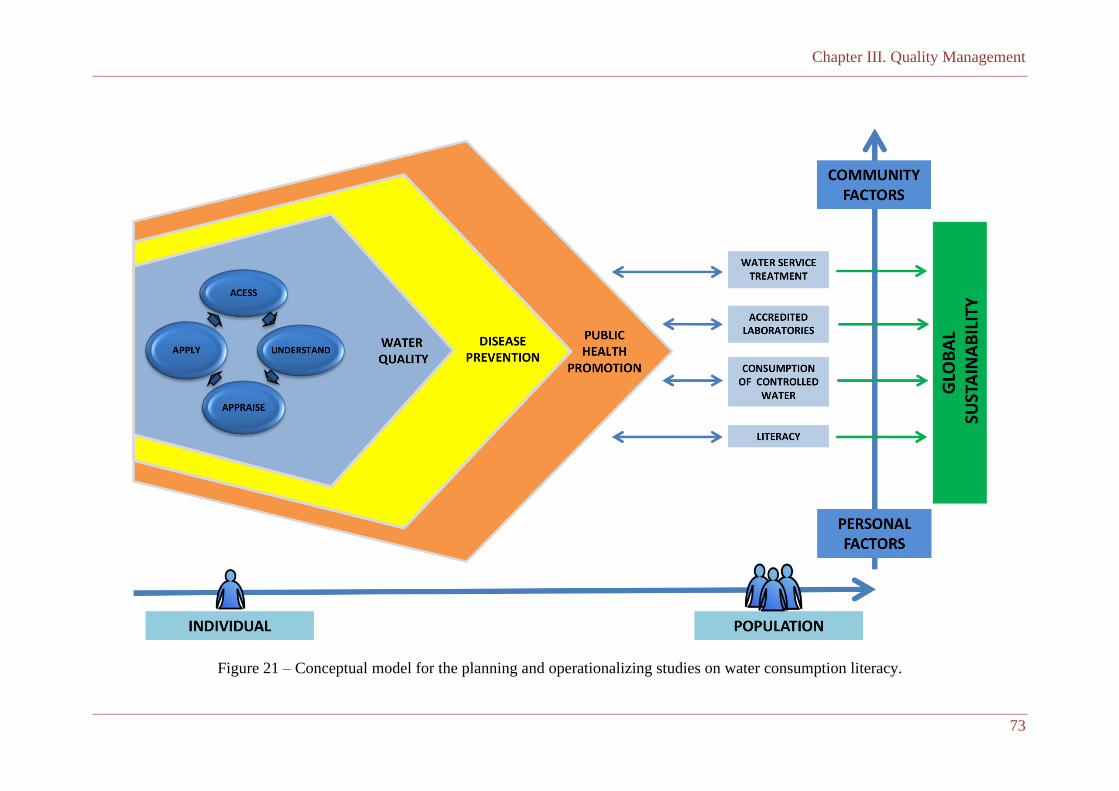
Chapter III. Quality Management
73
Figure 21 – Conceptual model for the planning and operationalizing studies on water consumption literacy.
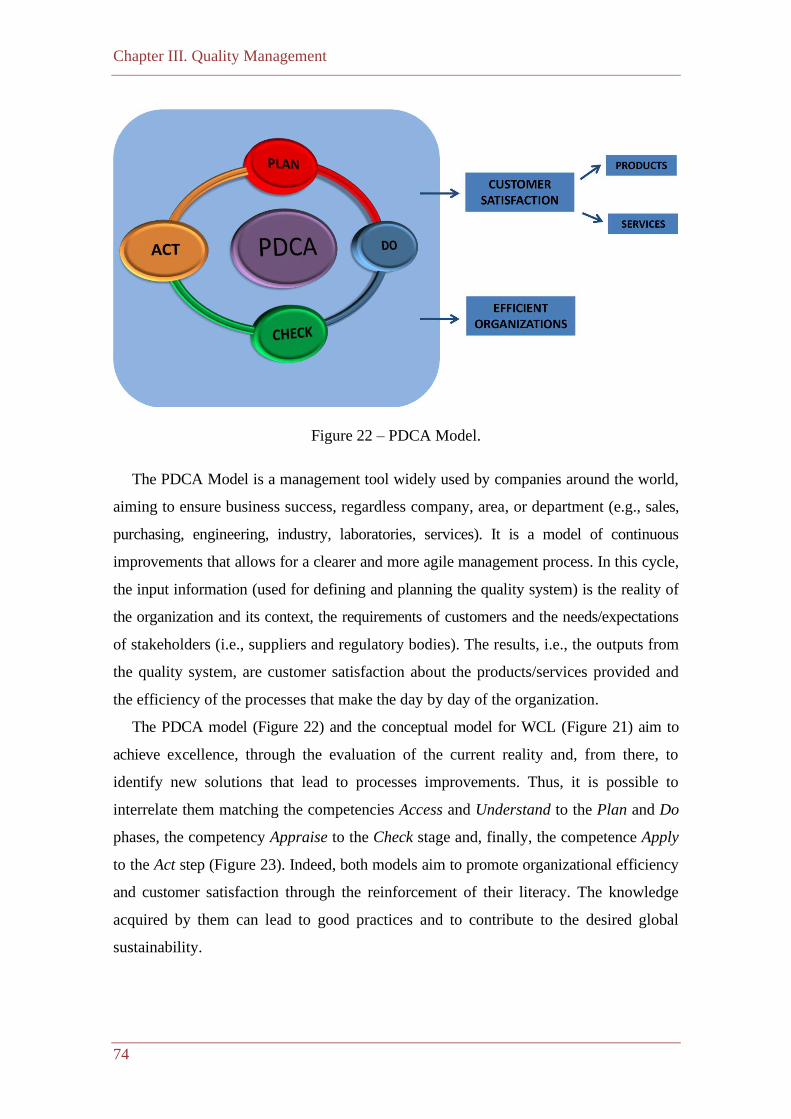
Chapter III. Quality Management
74
Figure 22 – PDCA Model.
The PDCA Model is a management tool widely used by companies around the world,
aiming to ensure business success, regardless company, area, or department (e.g., sales,
purchasing, engineering, industry, laboratories, services). It is a model of continuous
improvements that allows for a clearer and more agile management process. In this cycle,
the input information (used for defining and planning the quality system) is the reality of
the organization and its context, the requirements of customers and the needs/expectations
of stakeholders (i.e., suppliers and regulatory bodies). The results, i.e., the outputs from
the quality system, are customer satisfaction about the products/services provided and
the efficiency of the processes that make the day by day of the organization.
The PDCA model (Figure 22) and the conceptual model for WCL (Figure 21) aim to
achieve excellence, through the evaluation of the current reality and, from there, to
identify new solutions that lead to processes improvements. Thus, it is possible to
interrelate them matching the competencies Access and Understand to the Plan and Do
phases, the competency Appraise to the Check stage and, finally, the competence Apply
to the Act step (Figure 23). Indeed, both models aim to promote organizational efficiency
and customer satisfaction through the reinforcement of their literacy. The knowledge
acquired by them can lead to good practices and to contribute to the desired global
sustainability.
Chapter III. Quality Management
75
Figure 23 – Interrelationships between PDCA and WCL Models.
The articulation of the WCL and PDCA models will support future studies related
with consumers (e.g., assessing literacy levels in relation to water issues), organizations
operating in this sector (efficiency studies) as well as public policy formulation and/or
implementation. In fact, the global management of water resources should be regarded in
a holistic perspective, taking into account different viewpoints, ranging from water
quality to the multiple dimensions of water governance (e.g., integrated management
(Claassen 2013; Wang et al. 2018), evaluation/implementation of water guidelines
(Akinsete et al. 2019; Apostolaki et al. 2019; Giakoumis et al. 2019), stressing
conditions (Hartley et al. 2018; Horne et al. 2018; Tortajada et al. 2019), water reuse
(Hartley et al. 2019; Rebelo et al. 2020; Takeuchi & Tanaka 2020)), including the
connection water – health.
III.3.4.1. WCL Model in Practice
Aiming to exemplify the use of WCL model, a questionnaire to evaluate the literacy
of the consumers regarding the quality of the water consumed was conceived and
applied individually to a cohort of 147 participants, in person, by the researcher (section
III.3.6). The study was carried out in the Municipality of Santiago do Cacém. This is
one of the largest municipalities in Portugal located in the Alentejo Litoral, belonging to
the district of Setúbal. The questionnaire covers the three dimensions referred in the
WCL model and, in each of them, the four competencies were investigated, i.e., Access,
Understand, Appraise and Apply information. It was organized into two sections, where
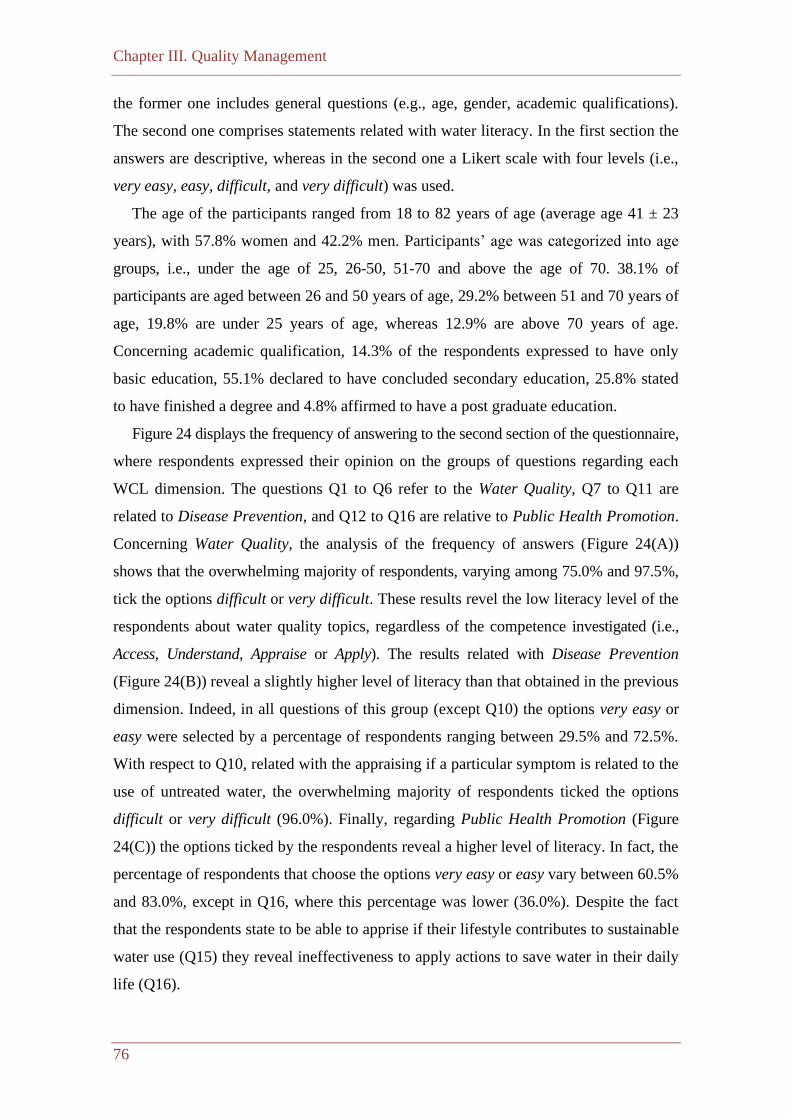
Chapter III. Quality Management
76
the former one includes general questions (e.g., age, gender, academic qualifications).
The second one comprises statements related with water literacy. In the first section the
answers are descriptive, whereas in the second one a Likert scale with four levels (i.e.,
very easy, easy, difficult, and very difficult) was used.
The age of the participants ranged from 18 to 82 years of age (average age 41 ± 23
years), with 57.8% women and 42.2% men. Participants’ age was categorized into age
groups, i.e., under the age of 25, 26-50, 51-70 and above the age of 70. 38.1% of
participants are aged between 26 and 50 years of age, 29.2% between 51 and 70 years of
age, 19.8% are under 25 years of age, whereas 12.9% are above 70 years of age.
Concerning academic qualification, 14.3% of the respondents expressed to have only
basic education, 55.1% declared to have concluded secondary education, 25.8% stated
to have finished a degree and 4.8% affirmed to have a post graduate education.
Figure 24 displays the frequency of answering to the second section of the questionnaire,
where respondents expressed their opinion on the groups of questions regarding each
WCL dimension. The questions Q1 to Q6 refer to the Water Quality, Q7 to Q11 are
related to Disease Prevention, and Q12 to Q16 are relative to Public Health Promotion.
Concerning Water Quality, the analysis of the frequency of answers (Figure 24(A))
shows that the overwhelming majority of respondents, varying among 75.0% and 97.5%,
tick the options difficult or very difficult. These results revel the low literacy level of the
respondents about water quality topics, regardless of the competence investigated (i.e.,
Access, Understand, Appraise or Apply). The results related with Disease Prevention
(Figure 24(B)) reveal a slightly higher level of literacy than that obtained in the previous
dimension. Indeed, in all questions of this group (except Q10) the options very easy or
easy were selected by a percentage of respondents ranging between 29.5% and 72.5%.
With respect to Q10, related with the appraising if a particular symptom is related to the
use of untreated water, the overwhelming majority of respondents ticked the options
difficult or very difficult (96.0%). Finally, regarding Public Health Promotion (Figure
24(C)) the options ticked by the respondents reveal a higher level of literacy. In fact, the
percentage of respondents that choose the options very easy or easy vary between 60.5%
and 83.0%, except in Q16, where this percentage was lower (36.0%). Despite the fact
that the respondents state to be able to apprise if their lifestyle contributes to sustainable
water use (Q15) they reveal ineffectiveness to apply actions to save water in their daily
life (Q16).
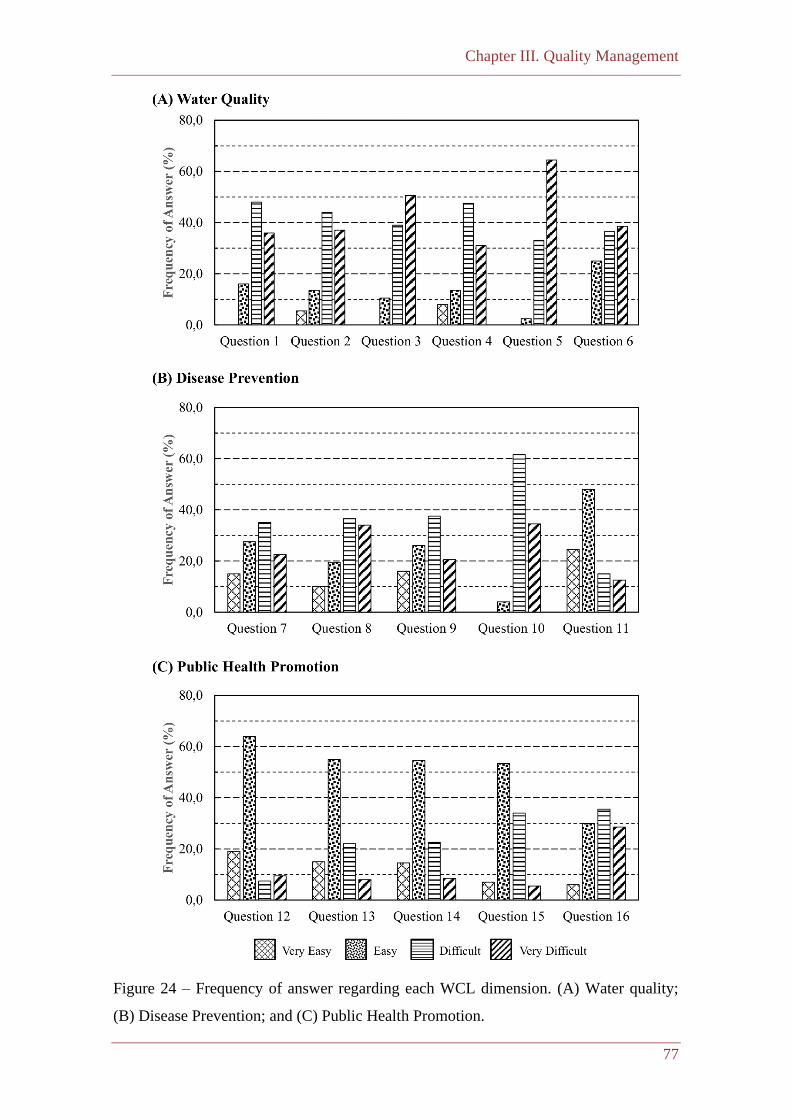
Chapter III. Quality Management
77
Figure 24 – Frequency of answer regarding each WCL dimension. (A) Water quality;
(B) Disease Prevention; and (C) Public Health Promotion.
Chapter III. Quality Management
78
A global analysis of the results presented in Figure 24 allows to state that in Water
Quality and Disease Prevention dimensions, the competence where the respondents
reveal the greatest difficulties is Appraise, which, according to what was presented
previously, matches the step Check in the PDCA model. In other words, respondents
reveal difficulties in assessing the effectiveness of the solutions/information. Regarding
the remaining dimension (i.e., Public Health Promotion) the respondents reveal the
greatest difficulties in the competence Apply, which corresponds to the step Act in the
PDCA model, i.e., the implementation of the solutions/information.
III.3.5. Conclusions
Despite the high number of papers on literacy, this work identified a paucity of
papers on literacy studies related to the quality of water for human consumption.
Considering the risks to health associated with the consumption of inappropriate water it
is mandatory to evaluate the population’s literacy levels on these issues. Thus, the
scarcity of information on the topic and the importance of water quality for health have
led to the development of the conceptual model presented in this study. Such model can
be of utmost importance to support studies aiming to assess water consumers’ literacy.
The articulation of the developed model (WCL) and the PDCA model allowed to build a
questionnaire that was applied to a cohort of 147 respondents in order to evaluate the
literacy of the consumers regarding the quality of the water issues. The questionnaire
can be extended to include other questions in future literacy studies by water
laboratories and/or by the water management entities. The main contribution of this
work is to present a methodology that can contribute to access/promote water literacy,
organizational efficiency, and consumer satisfaction, leading to good practices that
contribute to public health and global sustainability. In fact, the articulation of the WCL
model and an organizational tool like the PDCA model aims to achieve excellence
through the evaluation of the current reality to promote improvement solutions, in a
global perspective that leads to a sustainable water management.
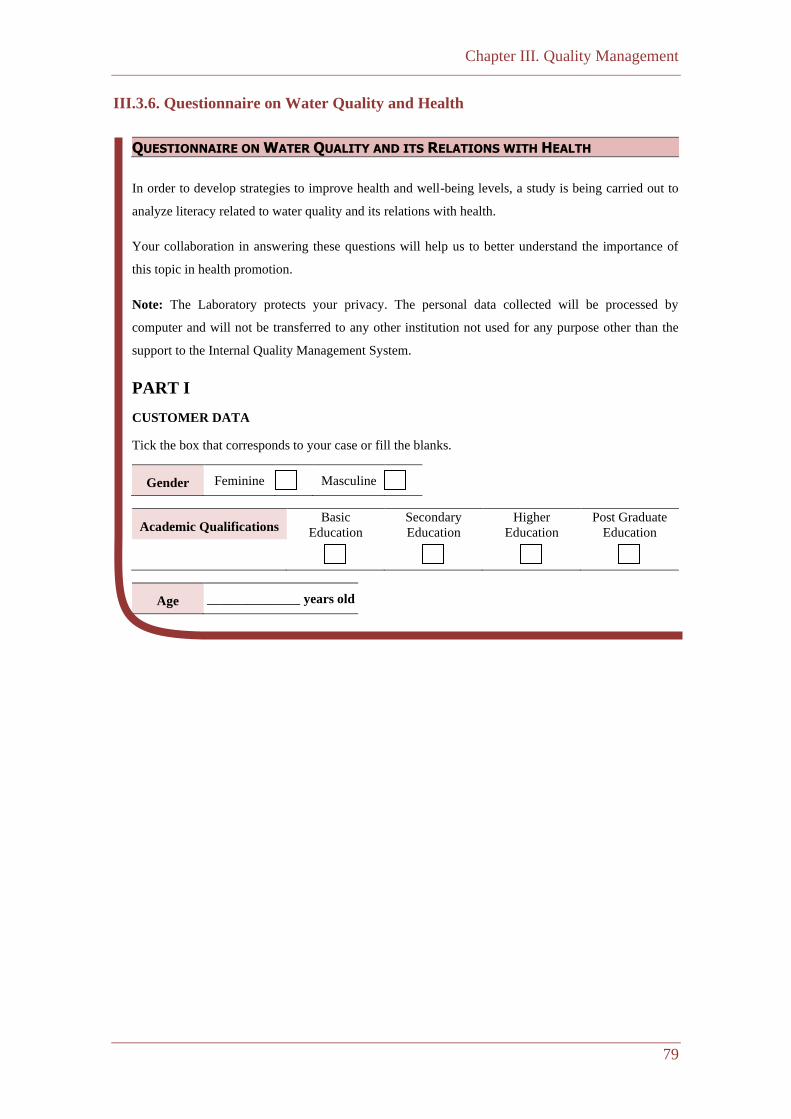
Chapter III. Quality Management
79
III.3.6. Questionnaire on Water Quality and Health
QUESTIONNAIRE ON WATER QUALITY AND ITS RELATIONS WITH HEALTH
In order to develop strategies to improve health and well-being levels, a study is being carried out to
analyze literacy related to water quality and its relations with health.
Your collaboration in answering these questions will help us to better understand the importance of
this topic in health promotion.
Note: The Laboratory protects your privacy. The personal data collected will be processed by
computer and will not be transferred to any other institution not used for any purpose other than the
support to the Internal Quality Management System.
PART I
CUSTOMER DATA
Tick the box that corresponds to your case or fill the blanks.
Gender Feminine Masculine
Academic Qualifications Basic
Education
Secondary
Education
Higher
Education
Post Graduate
Education
Age ______________ years old
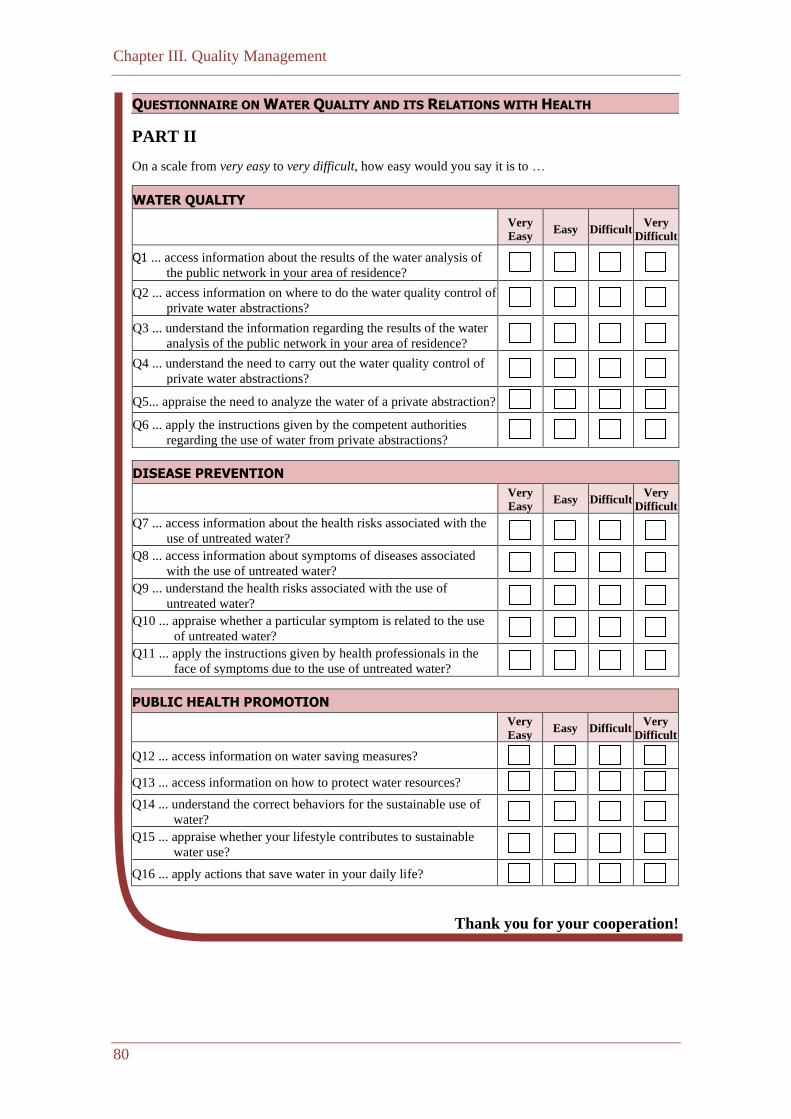
Chapter III. Quality Management
80
QUESTIONNAIRE ON WATER QUALITY AND ITS RELATIONS WITH HEALTH
PART II
On a scale from very easy to very difficult, how easy would you say it is to …
WATER QUALITY
Very
Easy Easy Difficult
Very
Difficult
Q1 ... access information about the results of the water analysis of
the public network in your area of residence?
Q2 ... access information on where to do the water quality control of
private water abstractions?
Q3 ... understand the information regarding the results of the water
analysis of the public network in your area of residence?
Q4 ... understand the need to carry out the water quality control of
private water abstractions?
Q5... appraise the need to analyze the water of a private abstraction?
Q6 ... apply the instructions given by the competent authorities
regarding the use of water from private abstractions?
DISEASE PREVENTION
Very
Easy Easy Difficult
Very
Difficult
Q7 ... access information about the health risks associated with the
use of untreated water?
Q8 ... access information about symptoms of diseases associated
with the use of untreated water?
Q9 ... understand the health risks associated with the use of
untreated water?
Q10 ... appraise whether a particular symptom is related to the use
of untreated water?
Q11 ... apply the instructions given by health professionals in the
face of symptoms due to the use of untreated water?
PUBLIC HEALTH PROMOTION
Very
Easy Easy Difficult
Very
Difficult
Q12 ... access information on water saving measures?
Q13 ... access information on how to protect water resources? Q14 ... understand the correct behaviors for the sustainable use of
water?
Q15 ... appraise whether your lifestyle contributes to sustainable
water use?
Q16 ... apply actions that save water in your daily life?
Thank you for your cooperation!
Chapter III. Quality Management
81
III.4. Psychosocial Risks Assessment in Cryopreservation Laboratories
III.4.1. Introduction
According to the Portuguese general, Labor Law the employers should identify the
riskiness to which workers are exposed and perform the risk assessment. Thus, it is of
utmost importance to understand this phenomenon in terms of occurrence, prevalence,
and prevention in various professional activities (EU-OSHA, 2012). Beyond the physical,
chemical, and biological risks, due to the significant changes that have taken place in
the working world, in recent years the psychosocial risks have emerged, with negative
consequences for society, businesses, and workers (EU-OSHA, 2007; 2012; Leka &
Jain, 2010). Psychosocial risks derive from deficiencies in work design, organization,
and management, as well as from a problematic social working context and may have
psychological, physical, and social effects such as work-related stress, burnout, or
depression (Leka & Jain, 2010).
The study of this theme began to develop in 1950, when the psychological aspects of
the work became an object of research. Attention to this phenomenon became more
pronounced in 2000, after an increase in serious accidents at work was noted. However,
psychosocial risks are still identified today as a major challenge for occupational health
and safety professionals (Leka & Jain, 2010; Lerouge, 2017).
III.4.2. State of Art
III.4.2.1. Psychosocial Risks
Psychosocial risks are a relatively recent concept and refer to conditions present in
work situations, related to work organization, hierarchy, performance of the task, and
the work environment, which may favor or impair work activity, as well as the quality
of life, well-being, and health of workers (Dollard et al., 2019). These conditions, when
favorable, foster the personal development of individuals. Conversely, when unfavorable,
undermine the health and well-being, becoming a source of occupational stress with
potential to cause psychological, physical, or social harm to individuals (Lerouge, 2017).
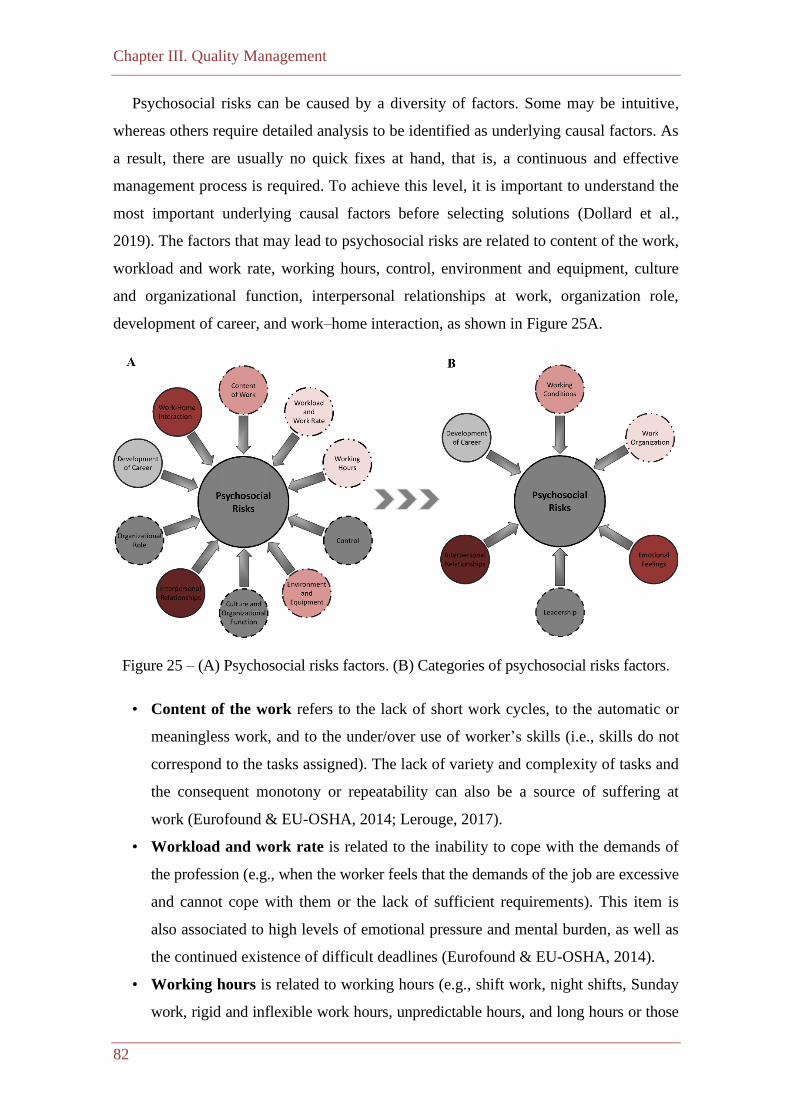
Chapter III. Quality Management
82
Psychosocial risks can be caused by a diversity of factors. Some may be intuitive,
whereas others require detailed analysis to be identified as underlying causal factors. As
a result, there are usually no quick fixes at hand, that is, a continuous and effective
management process is required. To achieve this level, it is important to understand the
most important underlying causal factors before selecting solutions (Dollard et al.,
2019). The factors that may lead to psychosocial risks are related to content of the work,
workload and work rate, working hours, control, environment and equipment, culture
and organizational function, interpersonal relationships at work, organization role,
development of career, and work–home interaction, as shown in Figure 25A.
Figure 25 – (A) Psychosocial risks factors. (B) Categories of psychosocial risks factors.
• Content of the work refers to the lack of short work cycles, to the automatic or
meaningless work, and to the under/over use of worker’s skills (i.e., skills do not
correspond to the tasks assigned). The lack of variety and complexity of tasks and
the consequent monotony or repeatability can also be a source of suffering at
work (Eurofound & EU-OSHA, 2014; Lerouge, 2017).
• Workload and work rate is related to the inability to cope with the demands of
the profession (e.g., when the worker feels that the demands of the job are excessive
and cannot cope with them or the lack of sufficient requirements). This item is
also associated to high levels of emotional pressure and mental burden, as well as
the continued existence of difficult deadlines (Eurofound & EU-OSHA, 2014).
• Working hours is related to working hours (e.g., shift work, night shifts, Sunday
work, rigid and inflexible work hours, unpredictable hours, and long hours or those
Chapter III. Quality Management
83
that do not allow socialization). These issues are seen as being inconsistent with the
preservation of the well-being and influence temporal and emotional availability
for personal and family relationships (Eurofound & EU-OSHA, 2014).
• Control refers to the person’s stress level that can be influenced by the person’s
level of control over workload and work rate, as well as other risk factors
(Eurofound & EU-OSHA, 2014). When a worker has control and influence over
how his work is planned and carries out, it helps him cope with challenges ahead.
Conversely, if the worker does not have the expected control, whether other people
determine the pace or the way of work, the worker can feel stress. Lack of flexibility,
as well as low participation in decision–making, contribute to stress and prevent a
person from developing and using new skills (Eurofound & EU-OSHA, 2014).
• Environment and equipment refer to inadequate availability, adequacy, or
maintenance of equipment as well as precariousness and job insecurity. This item
also stresses the poor environmental conditions, such as lack of space, poor
lighting, excessive noise, or high temperatures, which may hinder workers’ ability
to concentrate (Eurofound & EU-OSHA, 2014).
• Culture and organizational function relate to the levels of support and
encouragement for problem–solving and personal development (Eurofound &
EU-OSHA, 2014). Positive support and feedback (from colleagues, from leaders,
social support, or direct support for the profession) can help people overcome
difficulties and lead to job satisfaction. This item is also related to communication,
definition of organizational objectives, structural variables, hierarchical structure,
leadership style, recognition at work, employees’ freedom of expression, and
changes within organization (Lerouge, 2017).
• Interpersonal relationships at work are related to differences of opinion in a work
environment. Work relationships can cause stress when people suffer discrimination,
have poor relationships with superiors, colleagues, face interpersonal conflict, or
lack social support (Eurofound & EU-OSHA, 2014). In addition, inadequate,
incomprehensible, or unbearable supervision should be included in this item. Another
factor that cannot be overlooked and causes stress is bullying/mobbing (Dollard et
al., 2019). Bullying may involve violence (physical, verbal, or psychological),
intimidation, sexual harassment, and subtler acts such as physical or social isolation,
excessive supervision, unfounded criticism, the impoverishment of tasks, evasion
of information, or persecution at work (Lerouge, 2017).
Chapter III. Quality Management
84
• Organization role refers to stress that arises from the lack of clarity about the
roles and responsibilities that people have or when the roles and responsibilities
give rise to conflict with colleagues, superiors, or customers. This factor also covers
the stress that arises from the feeling that his role is incompatible with his skills
and abilities (Eurofound & EU-OSHA, 2014).
• Career development refers to the stress due to career stagnation, under-promotion,
over-promotion, low compensation, or low commission. Career development also
encompasses issues linked to job insecurity, career uncertainty, and low social
value to work (Lerouge, 2017).
• Work–home interaction is related with the conflict between work and family
demands which can lead to conflicts of time, commitment, and support. In addition,
it encompasses the stress that arises because of low home support and from dual
career problems (Eurofound & EU-OSHA, 2014).
Some of aforementioned factors can be grouped into generic categories, namely
Work Conditions, Work Organization, and Leadership. The former one includes the factors
Environment and Equipment and Content of Work, whereas the second comprises Workload
and Work Rate and Working Hours. Finally, the third category groups the factors Culture
and Organizational Function, Control and Organizational Role (Figure 25B).
Recent studies show that psychosocial risk analysis in organizations is increasingly
common in the industrial sector (Joensuu et al., 2010; Ferguson et al., 2012; Metzler et
al., 2019) and less frequent in the laboratory sector. Ferguson et al. (2012) studied the
psychosocial and biomechanical factors in furniture distribution workers, involving 454
participants at nine furniture distribution facilities for 6 months. The authors developed a
multivariate logistic regression model that includes baseline functional performance
probability, facility, perceived workload, intermediated reach distance number of
exertions above threshold limit values, job tenure manual material handling, and age
combined. The model sensitivity and specificity were of 68.5% and 71.9%, respectively.
Joensuu et al. (2010) examined associations between job control, social support, and
mental ill health in a multinational forest industry corporation. The 13,868 employees of
a Finnish forest company with no previous hospital admissions for mental disorders
responded to questionnaires on decision authority, skill discretion, co–worker, and
supervisor support. The results show that high skill discretion was related with reduced
risks of hospital admission for mental disorders, whereas high decision authority was
Chapter III. Quality Management
85
connected with an elevated risk. Furthermore, the authors concluded that high decision
authority was a risk factor for alcohol-related and depressive disorders, whereas good
co–worker support was linked with a reduced risk of non–depressive non–alcohol–
related mental disorders. Supervisor support, in turns, was not associated with any
mental disorders.
Metzler et al. (2019) compared different methods for evaluating psychosocial hazards in
the scope of risk assessment in a sample of 549 blast furnace workers of a German steel
manufacturing. The authors highlighted that the risk management was strongly influenced
by the choice of risk evaluation method because the measures to minimize the risks are
directed only to the ones identified and in accordance with their level of priority.
In analysis laboratories, regardless of the sector of activity, the excessive pace of
work, monotony, routine, as well as problems of interpersonal relationships, are examples
of psychological risks for the workers. Bronkhorst (2015) realized a hierarchical linear
modeling of physical safety behavior to examine the relationship between job demands,
job resources, safety climate, and safety behavior among employees working in health
care. The author used a sample of 6230 health–care employees of 52 different Dutch
organizations. Regardless of the focus (i.e., physical, or psychological safety), this study
shows that the consolidation of the safety climate increases employees’ safety behavior.
In addition, the authors point out that the organization’s safety climate is an ideal target
of intervention to avert and enhance negative physical and psychological health and
safety outcomes, mainly in times of doubt and change.
Aiming to estimate the association between psychosocial risk factors in the workplace
and musculoskeletal disorders in nurses and aides Bernal et al. (2015) examined 17
papers. Despite the low heterogeneity of cohorts, the authors identified associations
between high psychosocial demands and low job control with prevalent and incident
low back pain, prevalent shoulder pain, prevalent knee pain, and prevalent pain at any
anatomical site.
All these studies show the main role of the psychosocial risk in organizations to
minimize possible damage to the health of employees. In addition, the foregoing
demonstrates the relevance of the development of models aiming to predict the level of
psychosocial risks based on employees’ experiences. In the present work, a predictive
model based on Artificial Neural Networks (ANNs) will be presented.
Chapter III. Quality Management
86
III.4.2.2. Artificial Neural Networks
ANNs are computational tools that aim to simulate the human brain and nervous
system. The multilayer perceptron is one of the utmost common ANN architectures, in
which neurons are assembled in layers and only forward connections exist (Haykin,
2009). ANNs are increasingly applied in data mining because of their good performance
in prediction (Mitra et al., 2002). In last decades, several studies have been published
showing the usefulness of ANNs to apprehend complex relationships between variables,
in various areas of application, e.g., environment (Allawi et al., 2018; Ruben et al.,
2018), health (Vicente et al., 2016; Neves et al., 2018a), and law (Stranieri &
Zeleznikow, 2012; Neves et al., 2016; Nguyen et al., 2018) just to name a few.
III.4.3. Methods
III.4.3.1. Place of Study
This study took place in a cryopreservation laboratory and in dialysis care clinics
located in the north of Portugal. In Portugal, the quality and safety requirements for
human tissues and cells are set by the Portuguese Ministry of Health (Law No.12/2009).
However, the criteria implemented by the laboratory under study are even stricter. The
laboratory participates in external quality assays, where national and international
entities test and certify the reliability of the stored sample quality control tests.
Furthermore, the laboratory has the accreditation of the American Association of Blood
Banks (AABB), which sets the most stringent quality criteria in the industry worldwide
(AABB, 2020). The cryopreservation laboratories were chosen because the work
performed in them requires immediate results, confidentiality, and secrecy and deals
with large volumes of information. The pressure associated to these requirements can
create conditions for the appearance of psychosocial risks in the workers, and it is
important to study these risks.
III.4.3.2. Participants
This study included 200 participants aged between 17 and 80 years, with an average
of 41 ± 23 years old. The gender distribution was 44.5% and 55.5% for male and female
Chapter III. Quality Management
87
participants, respectively. The participants belong to different departmental areas in the
laboratory (i.e., quality management, human resources, finance, administrative, commercial,
and technical).
III.4.3.3. Data Collection
Aiming to perform the purposes defined before, a versatile tool to data collection was
used. After taking into consideration, the advantages and limitations intrinsic to possible
techniques, the inquiry by the questionnaire was chosen because it has a well-defined
structure and enables the conversion of the qualitative information into a quantitative
(McMillan & Schumacher, 2009; DeKetele & Roegiers, 2016; Cohen et al., 2017).
A questionnaire aiming to evaluate the perception of psychosocial risks in the
workplace was designed specifically for this study and applied to a cohort of 200
employees. The questionnaire was organized into three sections, where the former one
includes the general questions related with workers’ age, gender, academic qualifications,
and departmental areas. The second one comprises statements related with the work
conditions, organization, leadership, career development, interpersonal relationships,
and emotional feelings. Finally, the third section comprises issues related with the
workers’ opinions about the psychosocial risks. In the first part of the questionnaire the
answers are descriptive, whereas in the second one the Likert scale with four levels
(strongly disagree, disagree, agree, and strongly agree) was used. In the third section,
the respondents choose five terms (the ones that they consider more relevant) from a list
of 12 terms, ranking them in accordance with their relevance, using a numeric scale that
varies from 1 to 5 (section III.4.7).
The validation of the questionnaire follows practices of Bell (Bell, 2010). Thus, the
questionnaire was evaluated by a group of experts (i.e., a group of auditors) that
suggested some corrections. After expert analysis, the questionnaire was modified and
applied to a restrict group of employees, not included in the sample, to assess it validity
and to identify difficulties in the interpretation of the questionnaire. The updated version
was applied individually to the entire sample, in person, by the researcher. The return
rate was 90.9% (200 inquiries received in 220 delivered).
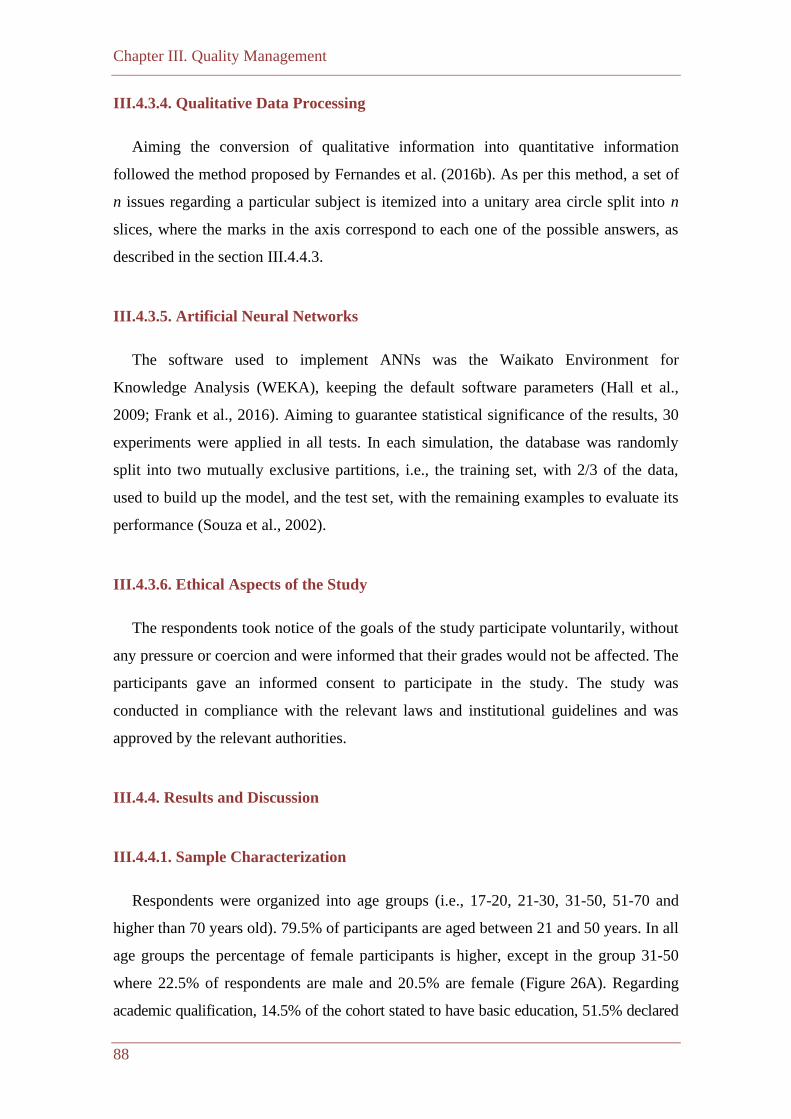
Chapter III. Quality Management
88
III.4.3.4. Qualitative Data Processing
Aiming the conversion of qualitative information into quantitative information
followed the method proposed by Fernandes et al. (2016b). As per this method, a set of
n issues regarding a particular subject is itemized into a unitary area circle split into n
slices, where the marks in the axis correspond to each one of the possible answers, as
described in the section III.4.4.3.
III.4.3.5. Artificial Neural Networks
The software used to implement ANNs was the Waikato Environment for
Knowledge Analysis (WEKA), keeping the default software parameters (Hall et al.,
2009; Frank et al., 2016). Aiming to guarantee statistical significance of the results, 30
experiments were applied in all tests. In each simulation, the database was randomly
split into two mutually exclusive partitions, i.e., the training set, with 2/3 of the data,
used to build up the model, and the test set, with the remaining examples to evaluate its
performance (Souza et al., 2002).
III.4.3.6. Ethical Aspects of the Study
The respondents took notice of the goals of the study participate voluntarily, without
any pressure or coercion and were informed that their grades would not be affected. The
participants gave an informed consent to participate in the study. The study was
conducted in compliance with the relevant laws and institutional guidelines and was
approved by the relevant authorities.
III.4.4. Results and Discussion
III.4.4.1. Sample Characterization
Respondents were organized into age groups (i.e., 17-20, 21-30, 31-50, 51-70 and
higher than 70 years old). 79.5% of participants are aged between 21 and 50 years. In all
age groups the percentage of female participants is higher, except in the group 31-50
where 22.5% of respondents are male and 20.5% are female (Figure 26A). Regarding
academic qualification, 14.5% of the cohort stated to have basic education, 51.5% declared
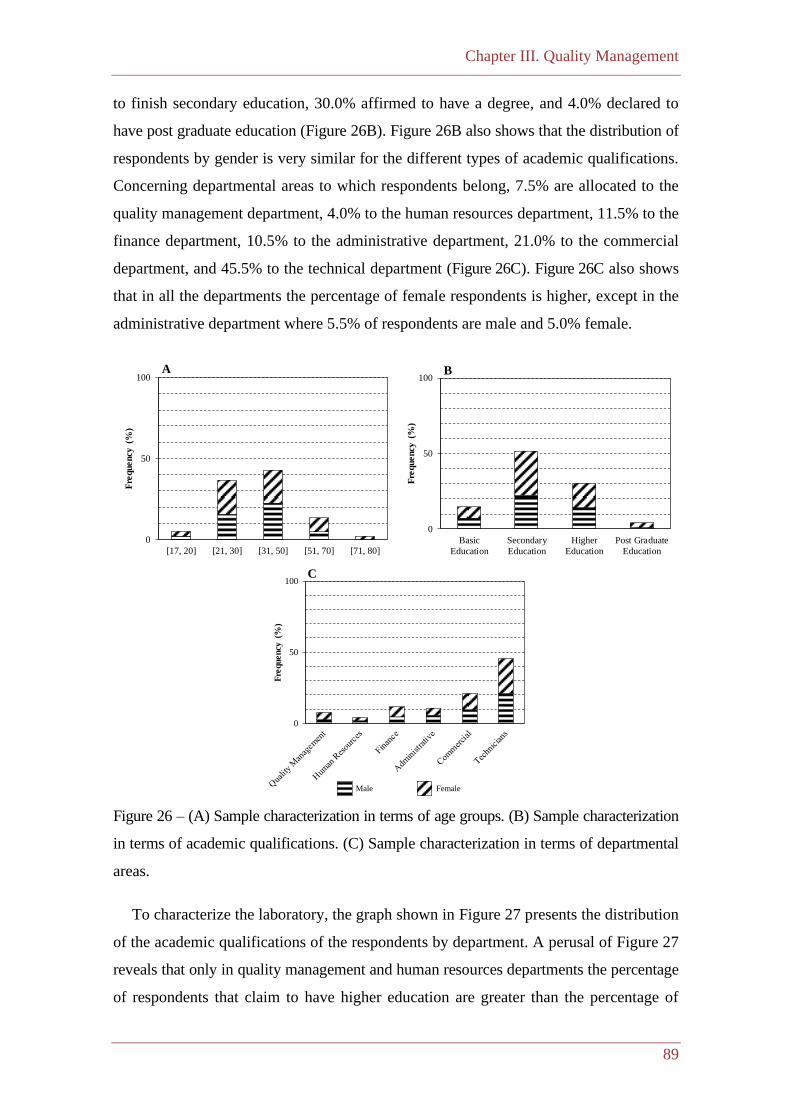
Chapter III. Quality Management
89
to finish secondary education, 30.0% affirmed to have a degree, and 4.0% declared to
have post graduate education (Figure 26B). Figure 26B also shows that the distribution of
respondents by gender is very similar for the different types of academic qualifications.
Concerning departmental areas to which respondents belong, 7.5% are allocated to the
quality management department, 4.0% to the human resources department, 11.5% to the
finance department, 10.5% to the administrative department, 21.0% to the commercial
department, and 45.5% to the technical department (Figure 26C). Figure 26C also shows
that in all the departments the percentage of female respondents is higher, except in the
administrative department where 5.5% of respondents are male and 5.0% female.
Figure 26 – (A) Sample characterization in terms of age groups. (B) Sample characterization
in terms of academic qualifications. (C) Sample characterization in terms of departmental
areas.
To characterize the laboratory, the graph shown in Figure 27 presents the distribution
of the academic qualifications of the respondents by department. A perusal of Figure 27
reveals that only in quality management and human resources departments the percentage
of respondents that claim to have higher education are greater than the percentage of
0
50
100
Basic
Education
Secondary
Education
Higher
Education
Post Graduate
Education
Fre
qu
en
cy (
%)
0
50
100
[17, 20] [21, 30] [31, 50] [51, 70] [71, 80]
Fre
qu
en
cy (
%)
0
50
100
Fre
qu
en
cy (
%)
A B
C
Male Female
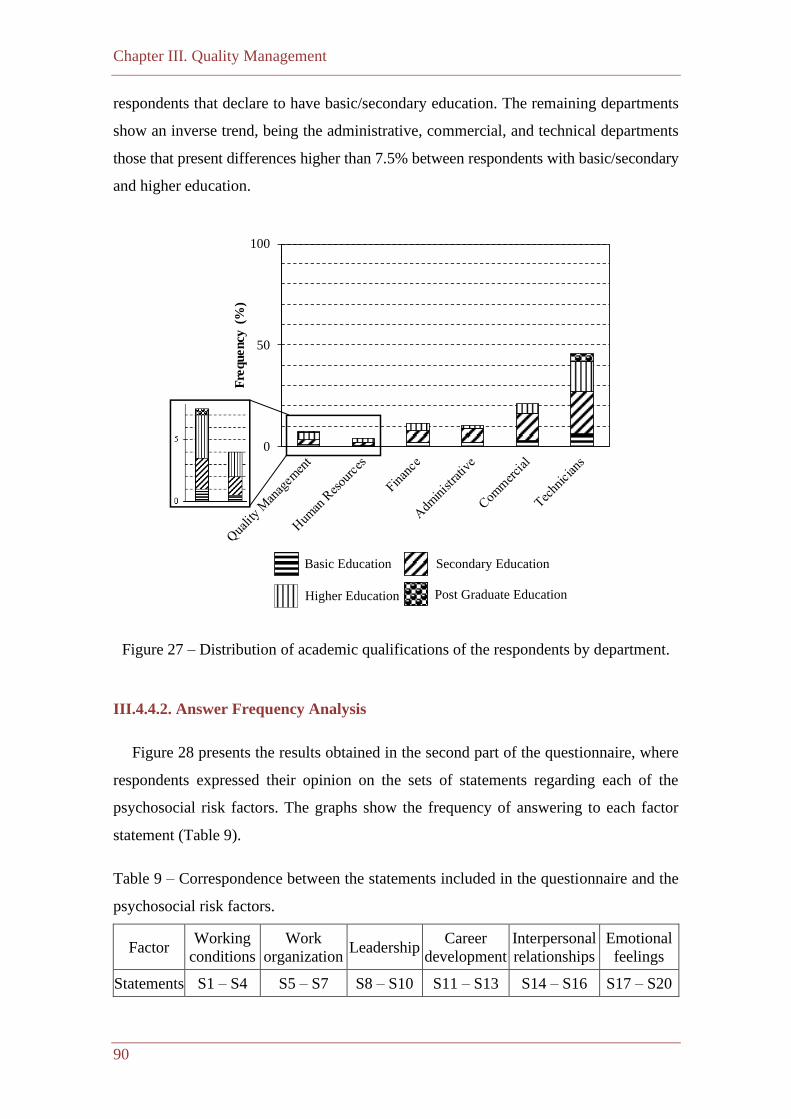
Chapter III. Quality Management
90
respondents that declare to have basic/secondary education. The remaining departments
show an inverse trend, being the administrative, commercial, and technical departments
those that present differences higher than 7.5% between respondents with basic/secondary
and higher education.
Figure 27 – Distribution of academic qualifications of the respondents by department.
III.4.4.2. Answer Frequency Analysis
Figure 28 presents the results obtained in the second part of the questionnaire, where
respondents expressed their opinion on the sets of statements regarding each of the
psychosocial risk factors. The graphs show the frequency of answering to each factor
statement (Table 9).
Table 9 – Correspondence between the statements included in the questionnaire and the
psychosocial risk factors.
Factor Working
conditions
Work
organization Leadership
Career
development
Interpersonal
relationships
Emotional
feelings
Statements S1 – S4 S5 – S7 S8 – S10 S11 – S13 S14 – S16 S17 – S20
0
50
100F
requency
(%
)
Basic Education Secondary Education
Post Graduate EducationHigher Education
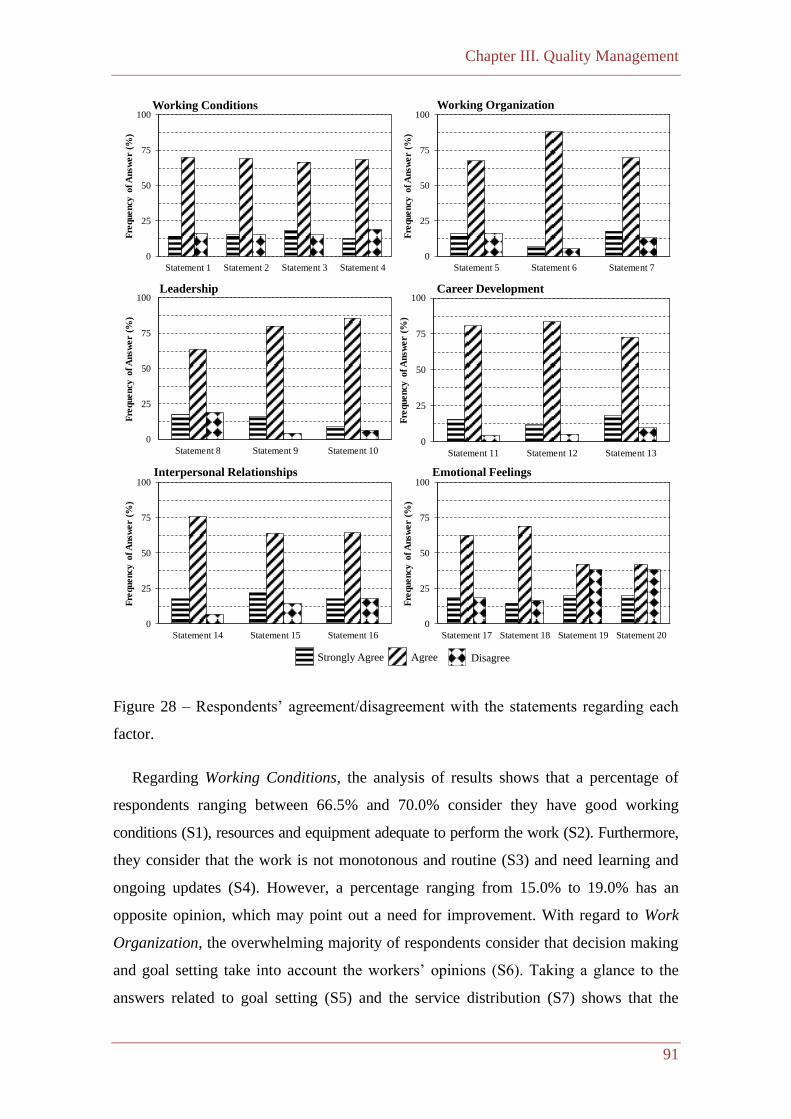
Chapter III. Quality Management
91
Figure 28 – Respondents’ agreement/disagreement with the statements regarding each
factor.
Regarding Working Conditions, the analysis of results shows that a percentage of
respondents ranging between 66.5% and 70.0% consider they have good working
conditions (S1), resources and equipment adequate to perform the work (S2). Furthermore,
they consider that the work is not monotonous and routine (S3) and need learning and
ongoing updates (S4). However, a percentage ranging from 15.0% to 19.0% has an
opposite opinion, which may point out a need for improvement. With regard to Work
Organization, the overwhelming majority of respondents consider that decision making
and goal setting take into account the workers’ opinions (S6). Taking a glance to the
answers related to goal setting (S5) and the service distribution (S7) shows that the
Strongly Agree Agree Disagree
Working Conditions Working Organization
Leadership
Interpersonal Relationships
Career Development
Emotional Feelings
0
25
50
75
100
Statement 1 Statement 2 Statement 3 Statement 4
Fre
quency
of A
nsw
er
(%)
0
25
50
75
100
Statement 8 Statement 9 Statement 10
Fre
quency
of A
nsw
er
(%)
0
25
50
75
100
Statement 11 Statement 12 Statement 13
Fre
quency
of A
nsw
er
(%)
0
25
50
75
100
Statement 14 Statement 15 Statement 16
Fre
quency
of A
nsw
er
(%)
0
25
50
75
100
Statement 17 Statement 18 Statement 19 Statement 20
Fre
quency
of A
nsw
er
(%)
0
25
50
75
100
Statement 5 Statement 6 Statement 7
Fre
quency
of A
nsw
er
(%)
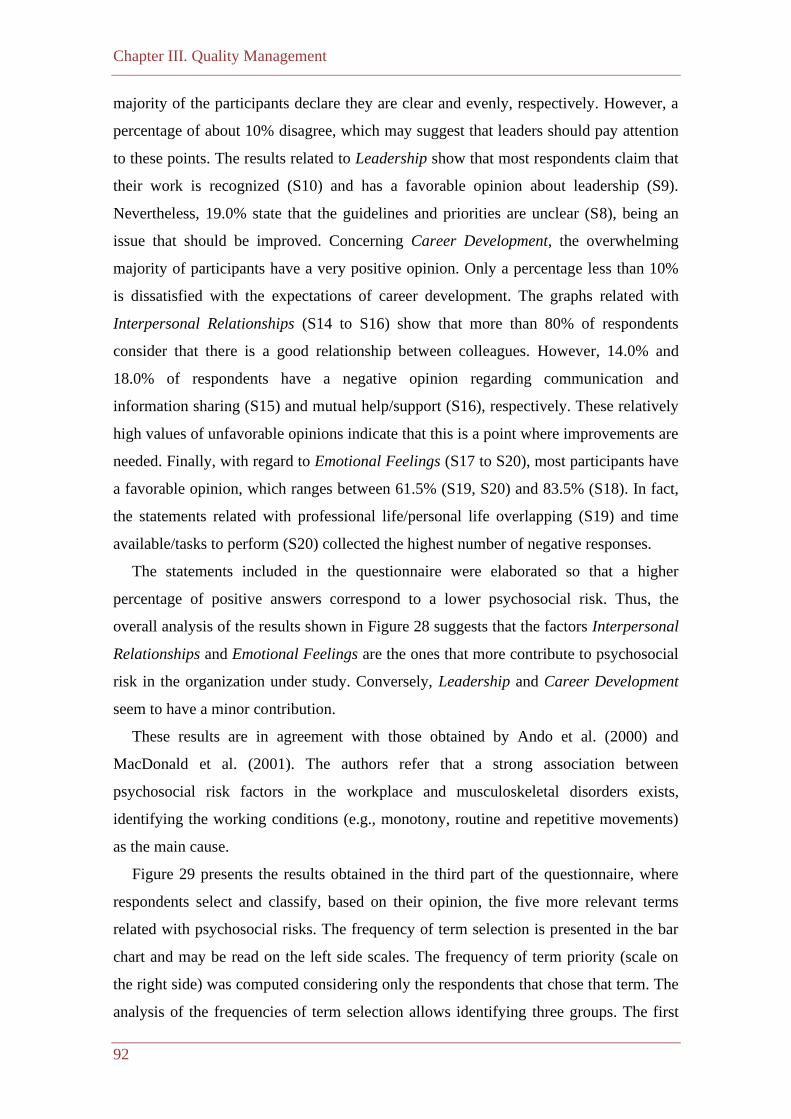
Chapter III. Quality Management
92
majority of the participants declare they are clear and evenly, respectively. However, a
percentage of about 10% disagree, which may suggest that leaders should pay attention
to these points. The results related to Leadership show that most respondents claim that
their work is recognized (S10) and has a favorable opinion about leadership (S9).
Nevertheless, 19.0% state that the guidelines and priorities are unclear (S8), being an
issue that should be improved. Concerning Career Development, the overwhelming
majority of participants have a very positive opinion. Only a percentage less than 10%
is dissatisfied with the expectations of career development. The graphs related with
Interpersonal Relationships (S14 to S16) show that more than 80% of respondents
consider that there is a good relationship between colleagues. However, 14.0% and
18.0% of respondents have a negative opinion regarding communication and
information sharing (S15) and mutual help/support (S16), respectively. These relatively
high values of unfavorable opinions indicate that this is a point where improvements are
needed. Finally, with regard to Emotional Feelings (S17 to S20), most participants have
a favorable opinion, which ranges between 61.5% (S19, S20) and 83.5% (S18). In fact,
the statements related with professional life/personal life overlapping (S19) and time
available/tasks to perform (S20) collected the highest number of negative responses.
The statements included in the questionnaire were elaborated so that a higher
percentage of positive answers correspond to a lower psychosocial risk. Thus, the
overall analysis of the results shown in Figure 28 suggests that the factors Interpersonal
Relationships and Emotional Feelings are the ones that more contribute to psychosocial
risk in the organization under study. Conversely, Leadership and Career Development
seem to have a minor contribution.
These results are in agreement with those obtained by Ando et al. (2000) and
MacDonald et al. (2001). The authors refer that a strong association between
psychosocial risk factors in the workplace and musculoskeletal disorders exists,
identifying the working conditions (e.g., monotony, routine and repetitive movements)
as the main cause.
Figure 29 presents the results obtained in the third part of the questionnaire, where
respondents select and classify, based on their opinion, the five more relevant terms
related with psychosocial risks. The frequency of term selection is presented in the bar
chart and may be read on the left side scales. The frequency of term priority (scale on
the right side) was computed considering only the respondents that chose that term. The
analysis of the frequencies of term selection allows identifying three groups. The first
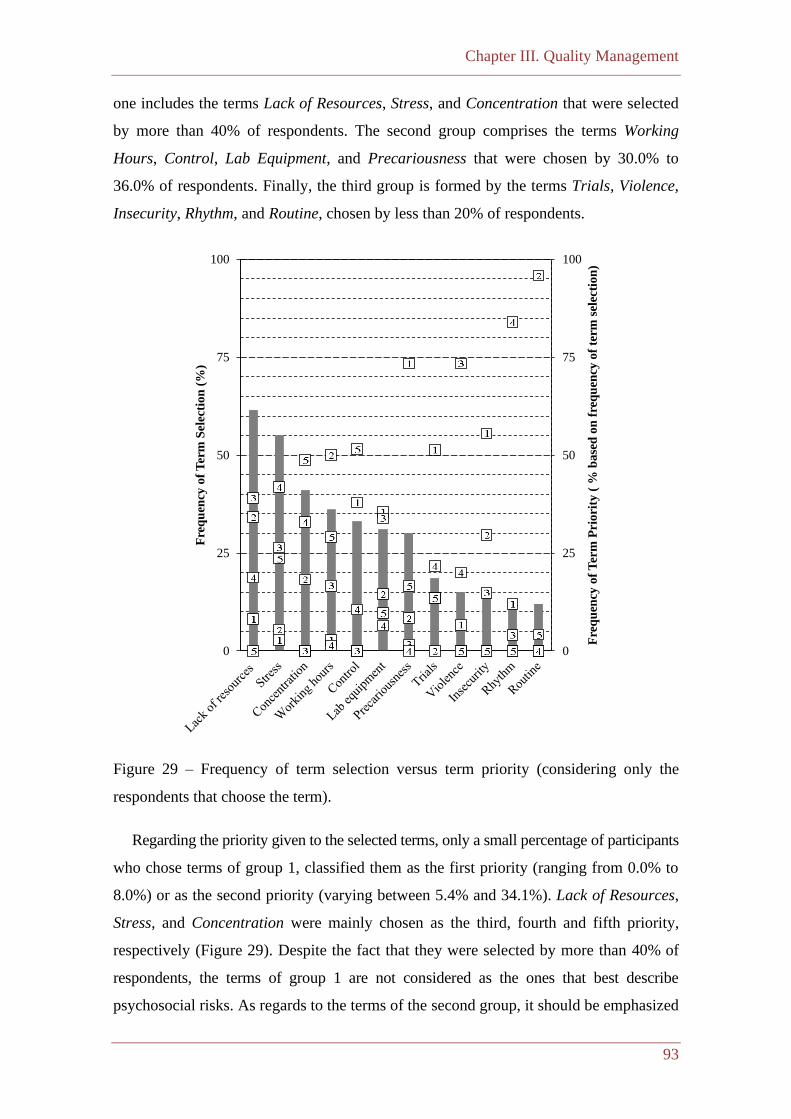
Chapter III. Quality Management
93
one includes the terms Lack of Resources, Stress, and Concentration that were selected
by more than 40% of respondents. The second group comprises the terms Working
Hours, Control, Lab Equipment, and Precariousness that were chosen by 30.0% to
36.0% of respondents. Finally, the third group is formed by the terms Trials, Violence,
Insecurity, Rhythm, and Routine, chosen by less than 20% of respondents.
Figure 29 – Frequency of term selection versus term priority (considering only the
respondents that choose the term).
Regarding the priority given to the selected terms, only a small percentage of participants
who chose terms of group 1, classified them as the first priority (ranging from 0.0% to
8.0%) or as the second priority (varying between 5.4% and 34.1%). Lack of Resources,
Stress, and Concentration were mainly chosen as the third, fourth and fifth priority,
respectively (Figure 29). Despite the fact that they were selected by more than 40% of
respondents, the terms of group 1 are not considered as the ones that best describe
psychosocial risks. As regards to the terms of the second group, it should be emphasized
0
25
50
75
100
0
25
50
75
100
Fre
qu
ency
of
Ter
m P
riori
ty (
% b
ase
d o
n f
req
uen
cy o
f te
rm s
elec
tion
)
Fre
qu
ency
of
Ter
m S
elec
tio
n (
%)
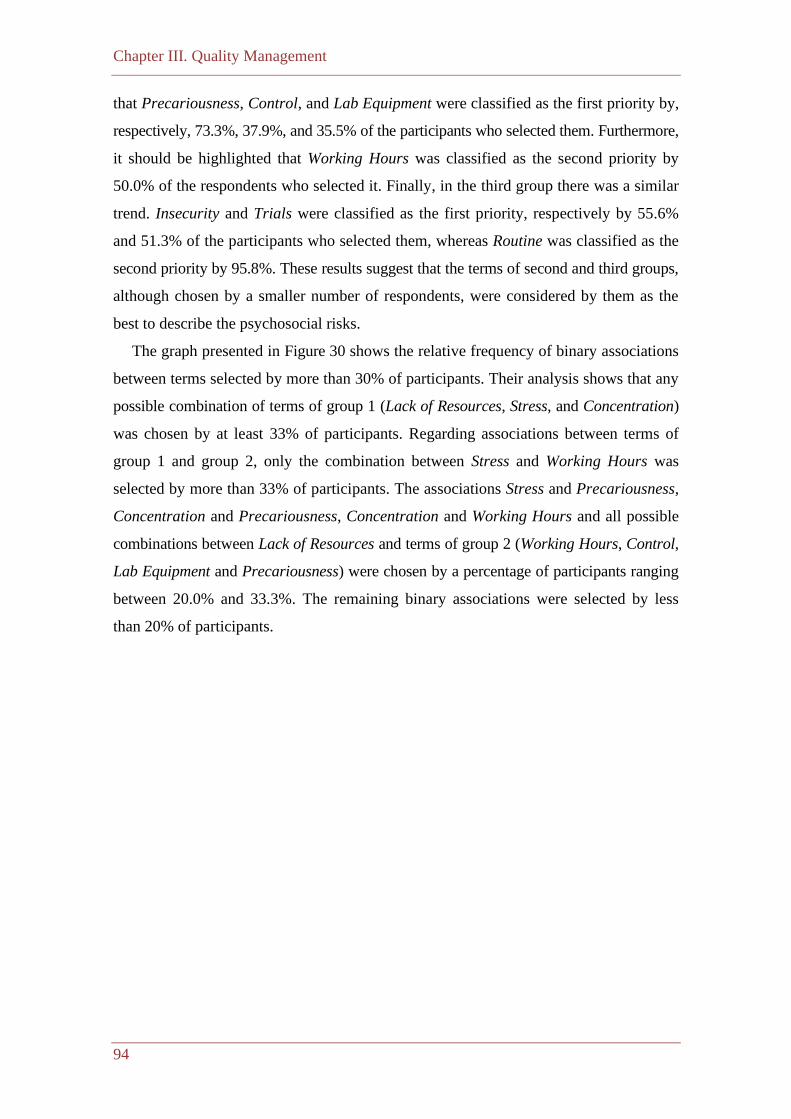
Chapter III. Quality Management
94
that Precariousness, Control, and Lab Equipment were classified as the first priority by,
respectively, 73.3%, 37.9%, and 35.5% of the participants who selected them. Furthermore,
it should be highlighted that Working Hours was classified as the second priority by
50.0% of the respondents who selected it. Finally, in the third group there was a similar
trend. Insecurity and Trials were classified as the first priority, respectively by 55.6%
and 51.3% of the participants who selected them, whereas Routine was classified as the
second priority by 95.8%. These results suggest that the terms of second and third groups,
although chosen by a smaller number of respondents, were considered by them as the
best to describe the psychosocial risks.
The graph presented in Figure 30 shows the relative frequency of binary associations
between terms selected by more than 30% of participants. Their analysis shows that any
possible combination of terms of group 1 (Lack of Resources, Stress, and Concentration)
was chosen by at least 33% of participants. Regarding associations between terms of
group 1 and group 2, only the combination between Stress and Working Hours was
selected by more than 33% of participants. The associations Stress and Precariousness,
Concentration and Precariousness, Concentration and Working Hours and all possible
combinations between Lack of Resources and terms of group 2 (Working Hours, Control,
Lab Equipment and Precariousness) were chosen by a percentage of participants ranging
between 20.0% and 33.3%. The remaining binary associations were selected by less
than 20% of participants.
Chapter III. Quality Management
95
Figure 30 – Binary associations between terms selected by more than 30% of respondents.
(Bold stands for terms of first group and no-bold denotes terms of second group).
The frequency of association between sets of three terms was also studied (Figure 31).
It was found that the terms of the group 1 were simultaneously selected by a percentage
of participants ranging between 25.0% and 33.3%, as well as all ternary associations
between Precariousness and terms of first group. Sets of three terms containing
Working Hours and terms of first group were selected by at least 15% of respondents.
To finish the analysis of Figure 31, it also noted that a percentage between 10.0% and
15.0% of respondents set associations between Rhythm, Lack of Resources and Stress;
Routine, Lack of Resources and Stress; and Trials, Lack of Resources and Concentration.
Lab Equipment
Concentration
ControlPrecariousness
Stress
Working Hours
Lack of Resources
[33,3%, 20%[,[50%, 33,3%[, [10%, 20%[
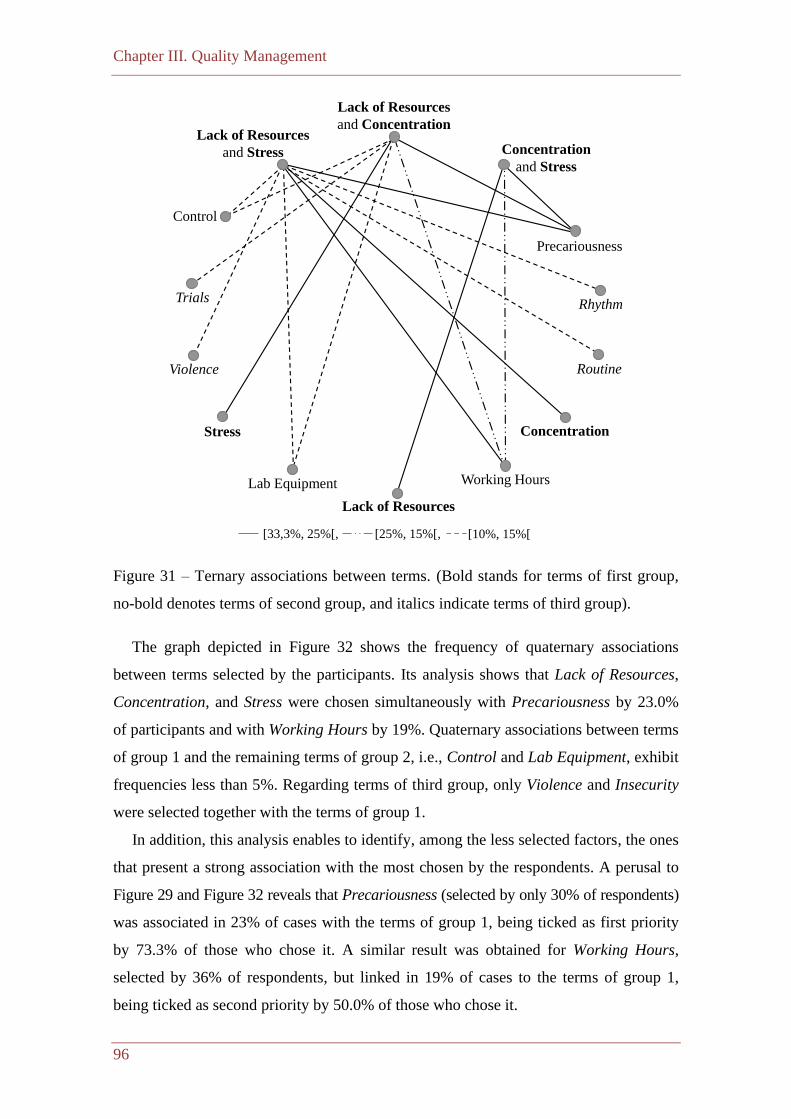
Chapter III. Quality Management
96
Figure 31 – Ternary associations between terms. (Bold stands for terms of first group,
no-bold denotes terms of second group, and italics indicate terms of third group).
The graph depicted in Figure 32 shows the frequency of quaternary associations
between terms selected by the participants. Its analysis shows that Lack of Resources,
Concentration, and Stress were chosen simultaneously with Precariousness by 23.0%
of participants and with Working Hours by 19%. Quaternary associations between terms
of group 1 and the remaining terms of group 2, i.e., Control and Lab Equipment, exhibit
frequencies less than 5%. Regarding terms of third group, only Violence and Insecurity
were selected together with the terms of group 1.
In addition, this analysis enables to identify, among the less selected factors, the ones
that present a strong association with the most chosen by the respondents. A perusal to
Figure 29 and Figure 32 reveals that Precariousness (selected by only 30% of respondents)
was associated in 23% of cases with the terms of group 1, being ticked as first priority
by 73.3% of those who chose it. A similar result was obtained for Working Hours,
selected by 36% of respondents, but linked in 19% of cases to the terms of group 1,
being ticked as second priority by 50.0% of those who chose it.
Lab Equipment
Concentration
Control
Precariousness
Stress
Working Hours
Lack of Resources
and Concentration
[25%, 15%[,[33,3%, 25%[, [10%, 15%[
Concentration
and Stress
Lack of Resources
and Stress
Lack of Resources
TrialsRhythm
Violence Routine
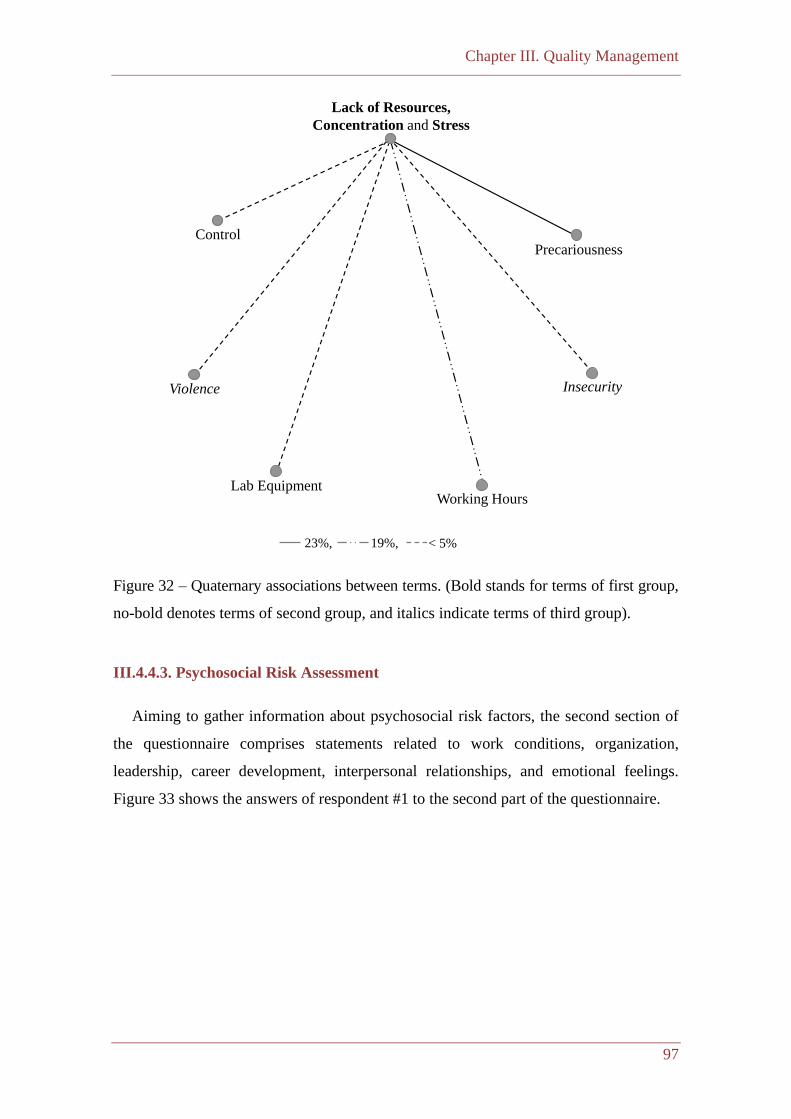
Chapter III. Quality Management
97
Figure 32 – Quaternary associations between terms. (Bold stands for terms of first group,
no-bold denotes terms of second group, and italics indicate terms of third group).
III.4.4.3. Psychosocial Risk Assessment
Aiming to gather information about psychosocial risk factors, the second section of
the questionnaire comprises statements related to work conditions, organization,
leadership, career development, interpersonal relationships, and emotional feelings.
Figure 33 shows the answers of respondent #1 to the second part of the questionnaire.
Lab Equipment
Insecurity
ControlPrecariousness
Violence
Working Hours
Lack of Resources,
Concentration and Stress
19%,23%, < 5%

Chapter III. Quality Management
98
PSYCHOSOCIAL RISKS QUESTIONNAIRE
PART II
For each statement tick the option that best reflects your opinion.
Working Conditions
Strongly
Agree Agree Disagree Strongly
Disagree
S1. There are good working conditions.
S2. There are resources and equipment needed to perform the work.
S3. The work done isn’t monotonous and routine.
S4. Work requires learning and ongoing updates.
Work Organization
Strongly
Agree Agree Disagree
Strongly Disagree
S5. There is a clear definition of objectives.
S6. There is involvement in decision making and goal setting.
S7. The service is distributed evenly.
Leadership
Strongly
Agree Agree Disagree Strongly
Disagree
S8. The leader gives clear guidelines and sets priorities for the team
S9. The leader knows when to support and advise or give autonomy.
S10. The leader recognizes your work.
Career Development
Strongly
Agree Agree Disagree Strongly
Disagree
S11. Employees aren’t professionally stagnant.
S12. Prospects for career progression are good. S13. The training and knowledge gained are valued for career
progression.
Interpersonal Relationships
Strongly
Agree Agree Disagree Strongly Disagree
S14. There is a good relationship with your colleagues. S15. There is good communication and sharing of information
between colleagues.
S16. The help and support of the colleagues are frequent.
Emotional Feelings
Strongly
Agree Agree Disagree Strongly Disagree
S17. The situations of verbal violence aren’t recurrent. S18. There is flexibility and understanding for family life. S19. Work sometimes overlaps with social and family life. S20. The time you have is enough to accomplish your tasks.
Figure 33 – The answers of respondent #1 to the second part of the questionnaire.
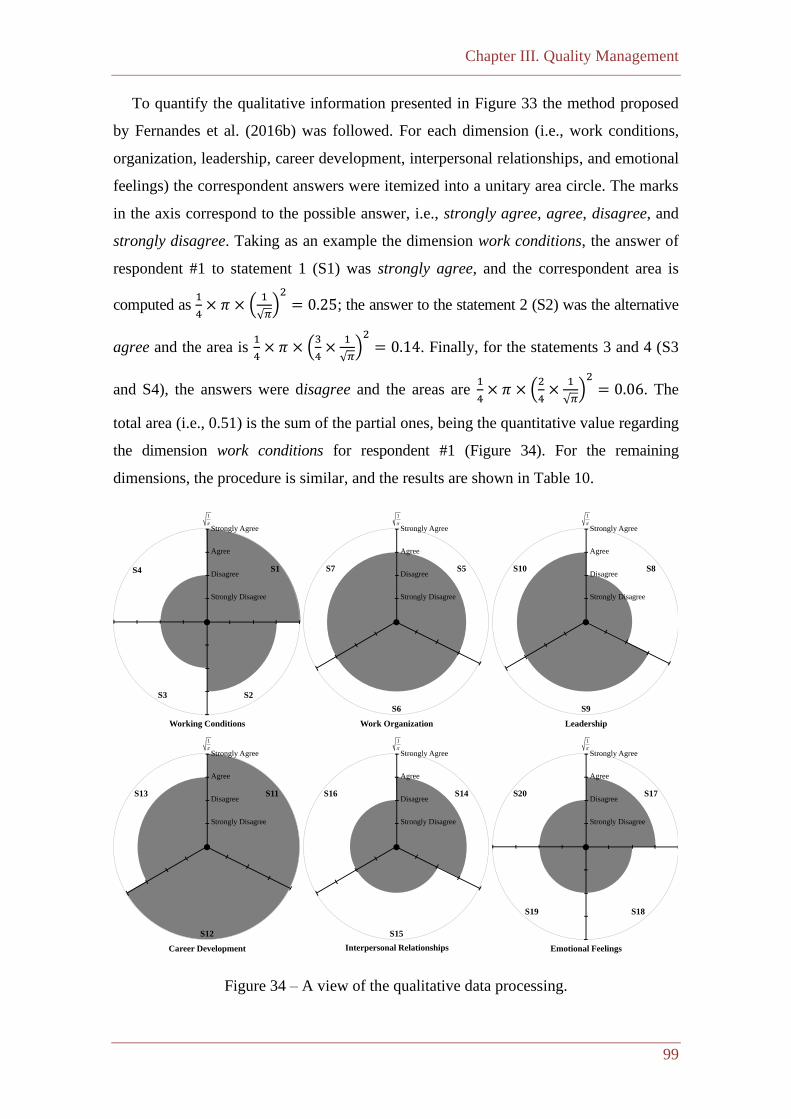
Chapter III. Quality Management
99
To quantify the qualitative information presented in Figure 33 the method proposed
by Fernandes et al. (2016b) was followed. For each dimension (i.e., work conditions,
organization, leadership, career development, interpersonal relationships, and emotional
feelings) the correspondent answers were itemized into a unitary area circle. The marks
in the axis correspond to the possible answer, i.e., strongly agree, agree, disagree, and
strongly disagree. Taking as an example the dimension work conditions, the answer of
respondent #1 to statement 1 (S1) was strongly agree, and the correspondent area is
computed as 1
4× 𝜋 × (
1
√𝜋)2
= 0.25; the answer to the statement 2 (S2) was the alternative
agree and the area is 1
4× 𝜋 × (
3
4×
1
√𝜋)2
= 0.14. Finally, for the statements 3 and 4 (S3
and S4), the answers were disagree and the areas are 1
4× 𝜋 × (
2
4×
1
√𝜋)2
= 0.06. The
total area (i.e., 0.51) is the sum of the partial ones, being the quantitative value regarding
the dimension work conditions for respondent #1 (Figure 34). For the remaining
dimensions, the procedure is similar, and the results are shown in Table 10.
Figure 34 – A view of the qualitative data processing.
S17
S19
S20
S18
1
Strongly Disagree
Disagree
Agree
Strongly Agree
Emotional Feelings
S14S16
S15
1
Strongly Disagree
Disagree
Agree
Strongly Agree
Interpersonal Relationships
S11S13
S12
1
Strongly Disagree
Disagree
Agree
Strongly Agree
Career Development
S1
S3
S4
S2
1
Strongly Disagree
Disagree
Agree
Strongly Agree
Working Conditions
S5S7
S6
1
Strongly Disagree
Disagree
Agree
Strongly Agree
Work Organization
S8S10
S9
1
Strongly Disagree
Disagree
Agree
Strongly Agree
Leadership
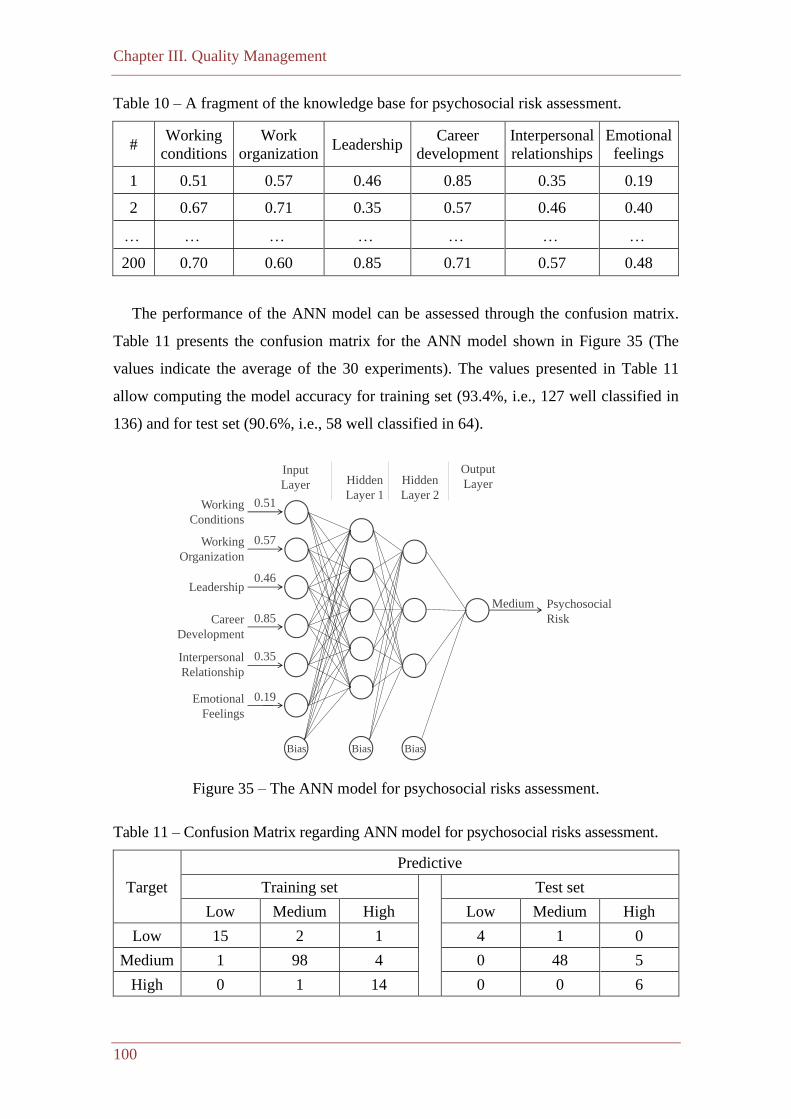
Chapter III. Quality Management
100
Table 10 – A fragment of the knowledge base for psychosocial risk assessment.
# Working
conditions
Work
organization Leadership
Career
development
Interpersonal
relationships
Emotional
feelings
1 0.51 0.57 0.46 0.85 0.35 0.19
2 0.67 0.71 0.35 0.57 0.46 0.40
200 0.70 0.60 0.85 0.71 0.57 0.48
The performance of the ANN model can be assessed through the confusion matrix.
Table 11 presents the confusion matrix for the ANN model shown in Figure 35 (The
values indicate the average of the 30 experiments). The values presented in Table 11
allow computing the model accuracy for training set (93.4%, i.e., 127 well classified in
136) and for test set (90.6%, i.e., 58 well classified in 64).
Figure 35 – The ANN model for psychosocial risks assessment.
Table 11 – Confusion Matrix regarding ANN model for psychosocial risks assessment.
Target
Predictive
Training set
Test set
Low Medium High Low Medium High
Low 15 2 1 4 1 0
Medium 1 98 4 0 48 5
High 0 1 14 0 0 6
Input
Layer Hidden
Layer 1
Hidden
Layer 2
Output
Layer
BiasBiasBias
0.57
0.51
0.46
0.35
0.85
0.19
Working
Conditions
Working
Organization
Leadership
Career
Development
Interpersonal
Relationship
Emotional
Feelings
Psychosocial
Risk
Medium
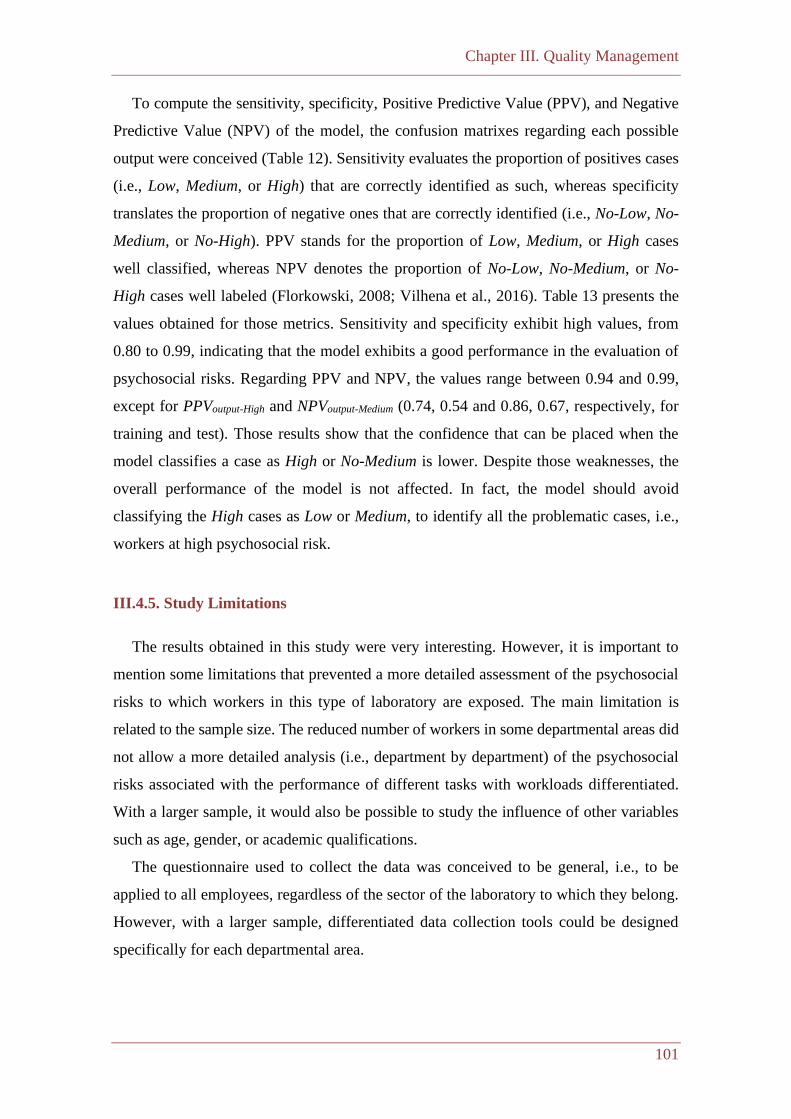
Chapter III. Quality Management
101
To compute the sensitivity, specificity, Positive Predictive Value (PPV), and Negative
Predictive Value (NPV) of the model, the confusion matrixes regarding each possible
output were conceived (Table 12). Sensitivity evaluates the proportion of positives cases
(i.e., Low, Medium, or High) that are correctly identified as such, whereas specificity
translates the proportion of negative ones that are correctly identified (i.e., No-Low, No-
Medium, or No-High). PPV stands for the proportion of Low, Medium, or High cases
well classified, whereas NPV denotes the proportion of No-Low, No-Medium, or No-
High cases well labeled (Florkowski, 2008; Vilhena et al., 2016). Table 13 presents the
values obtained for those metrics. Sensitivity and specificity exhibit high values, from
0.80 to 0.99, indicating that the model exhibits a good performance in the evaluation of
psychosocial risks. Regarding PPV and NPV, the values range between 0.94 and 0.99,
except for PPVoutput-High and NPVoutput-Medium (0.74, 0.54 and 0.86, 0.67, respectively, for
training and test). Those results show that the confidence that can be placed when the
model classifies a case as High or No-Medium is lower. Despite those weaknesses, the
overall performance of the model is not affected. In fact, the model should avoid
classifying the High cases as Low or Medium, to identify all the problematic cases, i.e.,
workers at high psychosocial risk.
III.4.5. Study Limitations
The results obtained in this study were very interesting. However, it is important to
mention some limitations that prevented a more detailed assessment of the psychosocial
risks to which workers in this type of laboratory are exposed. The main limitation is
related to the sample size. The reduced number of workers in some departmental areas did
not allow a more detailed analysis (i.e., department by department) of the psychosocial
risks associated with the performance of different tasks with workloads differentiated.
With a larger sample, it would also be possible to study the influence of other variables
such as age, gender, or academic qualifications.
The questionnaire used to collect the data was conceived to be general, i.e., to be
applied to all employees, regardless of the sector of the laboratory to which they belong.
However, with a larger sample, differentiated data collection tools could be designed
specifically for each departmental area.
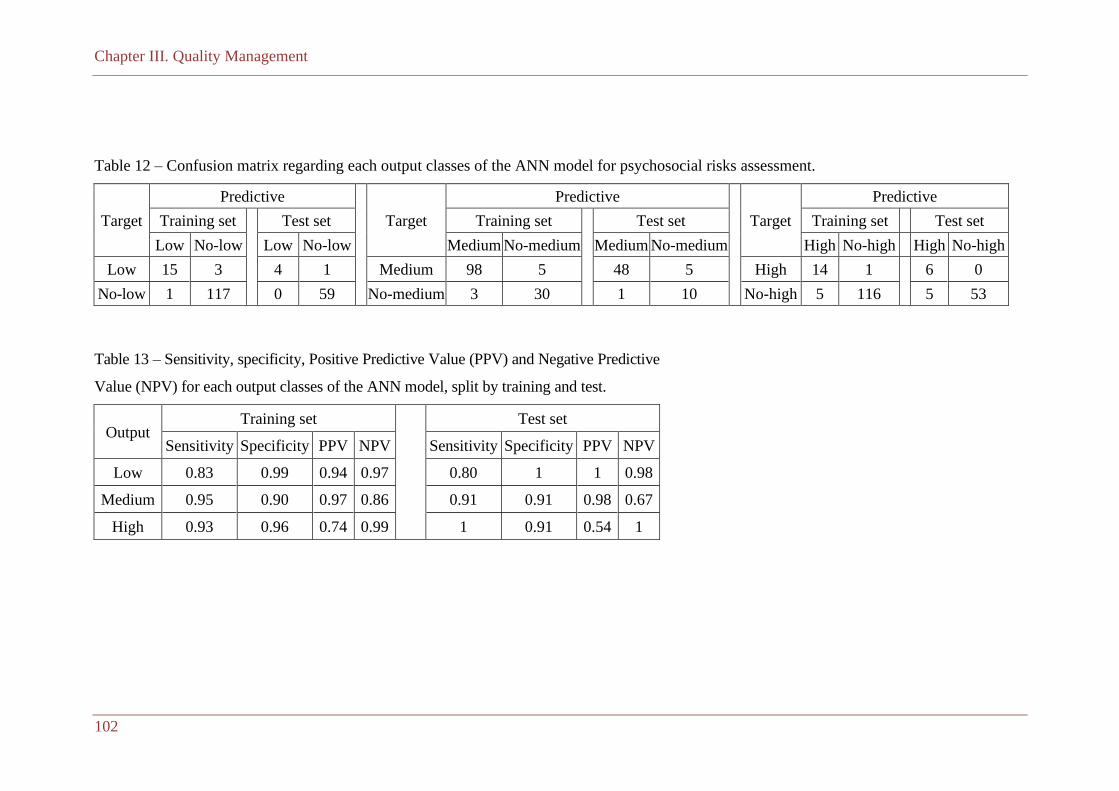
Chapter III. Quality Management
102
Table 12 – Confusion matrix regarding each output classes of the ANN model for psychosocial risks assessment.
Target
Predictive
Target
Predictive
Target
Predictive
Training set Test set Training set Test set Training set Test set
Low No-low Low No-low Medium No-medium Medium No-medium High No-high High No-high
Low 15 3 4 1 Medium 98 5 48 5 High 14 1 6 0
No-low 1 117 0 59 No-medium 3 30 1 10 No-high 5 116 5 53
Table 13 – Sensitivity, specificity, Positive Predictive Value (PPV) and Negative Predictive
Value (NPV) for each output classes of the ANN model, split by training and test.
Output Training set Test set
Sensitivity Specificity PPV NPV Sensitivity Specificity PPV NPV
Low 0.83 0.99 0.94 0.97 0.80 1 1 0.98
Medium 0.95 0.90 0.97 0.86 0.91 0.91 0.98 0.67
High 0.93 0.96 0.74 0.99 1 0.91 0.54 1
Chapter III. Quality Management
103
III.4.6. Conclusions
Nowadays, psychosocial risk assessment has been left to the discretion of each
organization. However, the standards used (i.e., OHSAS 18001 and ISO 9001) are not
clear as to how these risks should be measured. The certifications based on these standards
do not guarantee that psychosocial risks are, in fact, controlled. This study showed that
Interpersonal Relationships and Emotional Feelings are the factors that more contribute
to psychosocial risks, particularly the issues related with the overlapping of working and
personal lives, the lack of time to accomplish some tasks, the sharing of information,
and peer support. This study also revealed that the concept of psychosocial risks is generally
present among most respondents. Despite respondents having ticked the terms Lack of
Resources, Stress, and Concentration as the ones that better describe the psychosocial
risks, the terms Precariousness, Control, and Lab Equipment were the ones most often
marked as first priority. Moreover, the terms Lack of Resources, Working Hours, and
Lab Equipment were chosen simultaneously by a great number of respondents, as well
as the terms Stress, Working Hours, and Precariousness. In addition, this work presents
an intelligent decision support system that stands for a new approach to this problem
using the ANN paradigm to assess psychosocial risks. The presented approach presents a
worthy performance exhibiting sensitivities and specificities higher than 80%. This
approach focuses on the processing of information, collected through inquiry by
questionnaire, and aims to prevent recurrent events and to enhance the psychosocial
risks management. Beyond the possibility of identifying the weakness of the organization,
this system allows to concept and to design future improvement actions to promote the
employees’ quality of life. The results of this study cannot be generalized to all
organizations because the employees are exposed to different risks depending on the
sector and the type of activity in which they operate. However, these kinds of models
can be used in any organization. For this, it is necessary to carry out an assessment of
the risks to which employees are exposed and adjust the data collection tools (i.e.,
questionnaires).
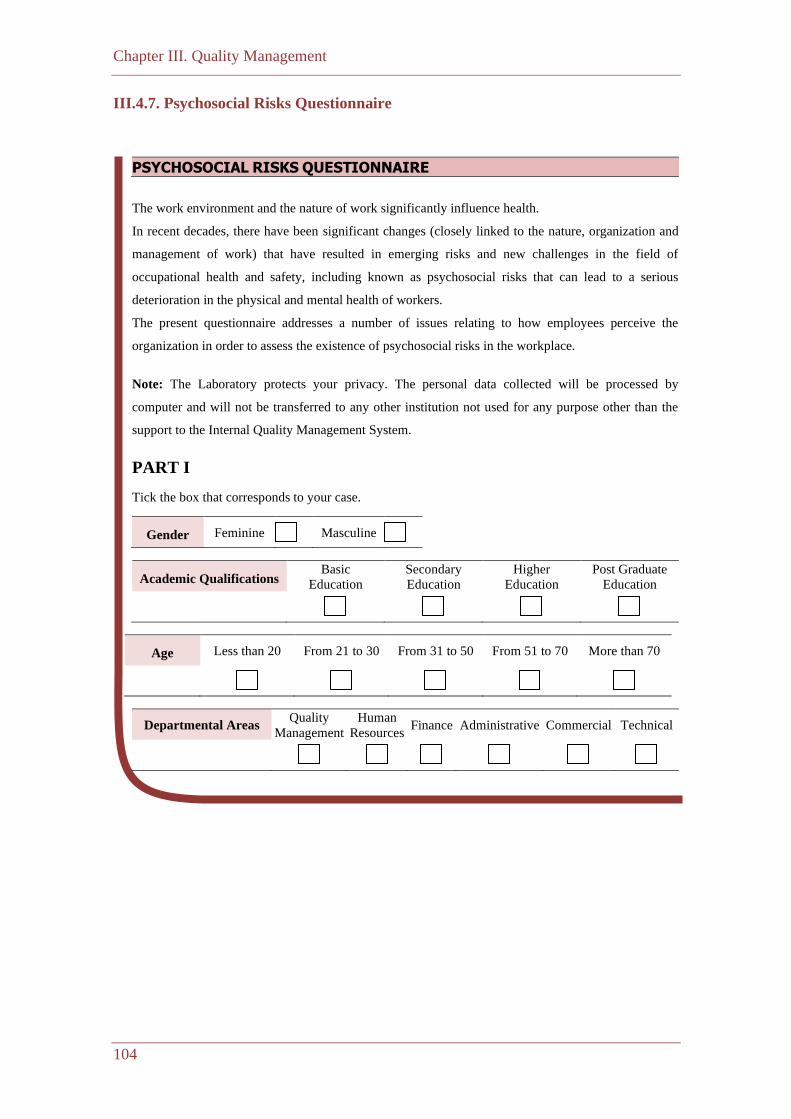
Chapter III. Quality Management
104
III.4.7. Psychosocial Risks Questionnaire
PSYCHOSOCIAL RISKS QUESTIONNAIRE
The work environment and the nature of work significantly influence health.
In recent decades, there have been significant changes (closely linked to the nature, organization and
management of work) that have resulted in emerging risks and new challenges in the field of
occupational health and safety, including known as psychosocial risks that can lead to a serious
deterioration in the physical and mental health of workers.
The present questionnaire addresses a number of issues relating to how employees perceive the
organization in order to assess the existence of psychosocial risks in the workplace.
Note: The Laboratory protects your privacy. The personal data collected will be processed by
computer and will not be transferred to any other institution not used for any purpose other than the
support to the Internal Quality Management System.
PART I
Tick the box that corresponds to your case.
Gender Feminine Masculine
Academic Qualifications Basic
Education
Secondary
Education
Higher
Education
Post Graduate
Education
Age Less than 20 From 21 to 30 From 31 to 50 From 51 to 70 More than 70
Departmental Areas Quality
Management
Human
Resources Finance Administrative Commercial Technical
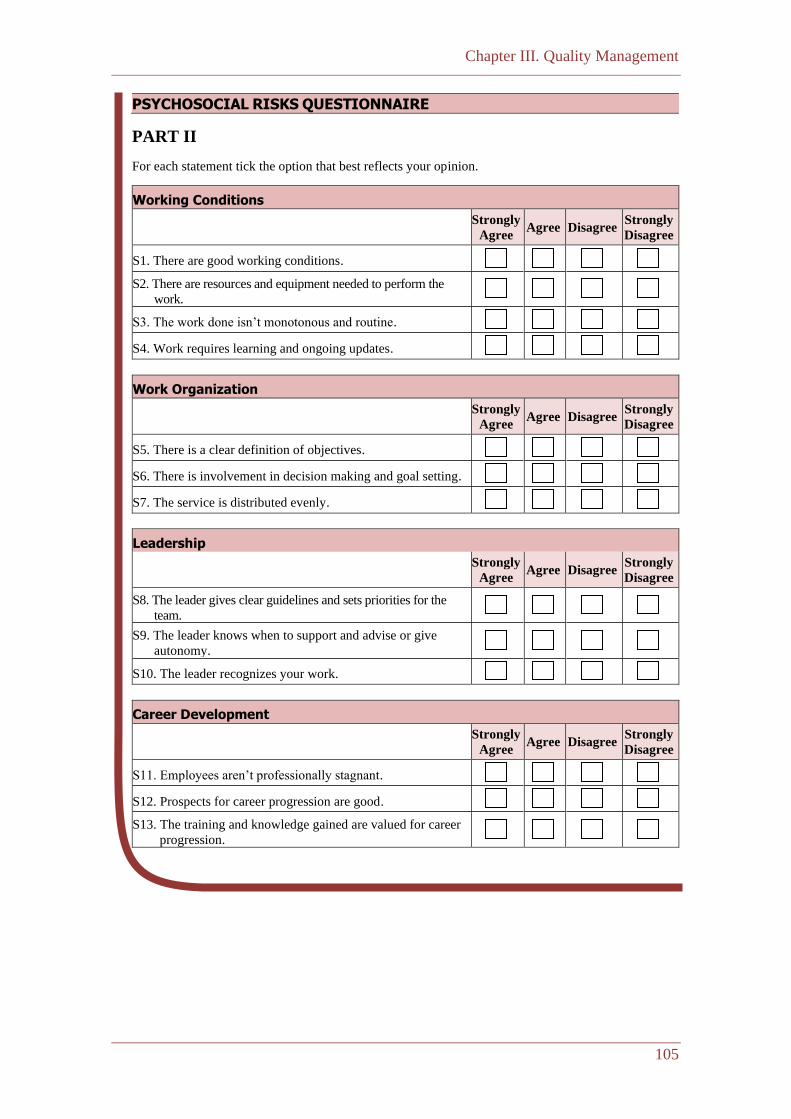
Chapter III. Quality Management
105
PSYCHOSOCIAL RISKS QUESTIONNAIRE
PART II
For each statement tick the option that best reflects your opinion.
Working Conditions
Strongly
Agree Agree Disagree
Strongly
Disagree
S1. There are good working conditions.
S2. There are resources and equipment needed to perform the
work.
S3. The work done isn’t monotonous and routine.
S4. Work requires learning and ongoing updates.
Work Organization
Strongly
Agree Agree Disagree
Strongly
Disagree
S5. There is a clear definition of objectives.
S6. There is involvement in decision making and goal setting.
S7. The service is distributed evenly.
Leadership
Strongly
Agree Agree Disagree
Strongly
Disagree
S8. The leader gives clear guidelines and sets priorities for the
team.
S9. The leader knows when to support and advise or give
autonomy.
S10. The leader recognizes your work.
Career Development
Strongly
Agree Agree Disagree
Strongly
Disagree
S11. Employees aren’t professionally stagnant.
S12. Prospects for career progression are good.
S13. The training and knowledge gained are valued for career
progression.
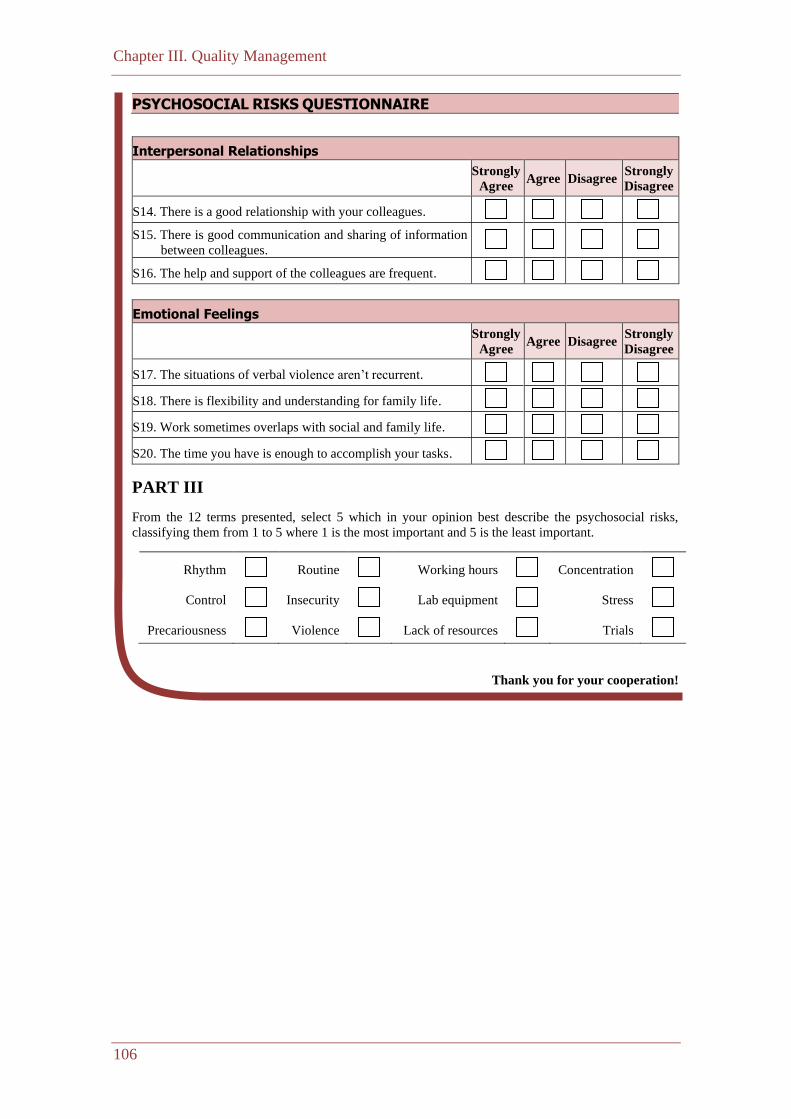
Chapter III. Quality Management
106
PSYCHOSOCIAL RISKS QUESTIONNAIRE
Interpersonal Relationships
Strongly
Agree Agree Disagree
Strongly
Disagree
S14. There is a good relationship with your colleagues.
S15. There is good communication and sharing of information
between colleagues.
S16. The help and support of the colleagues are frequent.
Emotional Feelings
Strongly
Agree Agree Disagree
Strongly
Disagree
S17. The situations of verbal violence aren’t recurrent.
S18. There is flexibility and understanding for family life.
S19. Work sometimes overlaps with social and family life.
S20. The time you have is enough to accomplish your tasks.
PART III
From the 12 terms presented, select 5 which in your opinion best describe the psychosocial risks,
classifying them from 1 to 5 where 1 is the most important and 5 is the least important.
Rhythm Routine Working hours Concentration
Control Insecurity Lab equipment Stress
Precariousness Violence Lack of resources Trials
Thank you for your cooperation!
Chapter III. Quality Management
107
III.5. Synopsis
In addition to quality control, laboratories also need adequate management. The costs
associated with poor quality are as high or higher than the costs associated with
maintaining high quality standards. Currently, all organizations in general, and laboratories
in particular, are asked to innovate, provide better products/services, enable the
customization of products/services, meet deadlines, improve layouts, reduce accident
rates, reduce waste/consumption, ensure compliance with legal provisions, ensure the
protection of information, improve working conditions, promote social responsibility
policies and, above all, make a profit. Within the scope of this chapter, the study “Fully
Informed Classification Systems Simpler, Maybe Better” was presented in which it
was shown how important the failure prediction in public service organizations is. In
spite of being a complex topic, a model was proposed to prevent unfavorable events
(adverse events) using the Eindhoven classification method. The adverse event “deadline
to respond to the request exceeded” was chosen and the respective causal tree was built,
which includes causes that can be considered simultaneously or separately. The model
presented allows describing events for which the causes are unknown/prohibited/not
allowed. It also allows the use of benchmarking in public organizations by providing
details to resolve and alert about problems found.
In addition to the importance of predicting failures in the management of an
organization, the quality of services will also be higher if customers’ demands are also
higher. The study “A Conceptual Model to Assess the Literacy of Water Consumers”
sought to develop a methodology to assess literacy on the theme of water. A conceptual
model was proposed, and its articulation with the PDCA cycle was demonstrated. In
addition, a literature review was carried out and it was found that, despite the high
number of studies on literacy, there are very few on the quality of water for human
consumption. To fill this gap, a questionnaire was created and applied to consumers of
the municipality of Santiago do Cacém. The results point out to a low literacy level of
the respondents about water quality topics, regardless of the competence investigated
(i.e., Access, Understand, Appraise or Apply). In fact, respondents revealed greatest
difficulties in assessing the effectiveness of the solutions/information, as well as in its
implementation.

Chapter III. Quality Management
108
The demand for service quality and competitiveness can lead to deteriorating working
conditions and the appearance of psychosocial risks. The study “Psychosocial Risks
Assessment in Cryopreservation Laboratories” aimed to characterize psychosocial
risks in laboratories and to develop a predictive model for their management. The
methodology used to collect the information was the inquiry by questionnaire, applied
to a sample of 200 employees. The results show that most respondents are aware of
psychosocial risks, identifying interpersonal relationships and the emotional component
as the main factors that lead to this type of risk. In addition, terms/expressions such as
lack of resources, working hours, laboratory equipment, stress and precariousness
showed a strong correlation with psychosocial risks. The model presented in this study,
based on artificial neural networks, worked well in predicting this type of risk.

Chapter IV. Total Quality Management
Chapter IV. Total Quality Management
110
IV.1. Overview
Following the evolution of the Quality Management concept, the Total Quality
Management (TQM) concept appeared. According to the Quality Management concept,
work is understood to belong to everyone and such thinking must cover all stages of the
process, giving rise to an organizational policy that provides synergies between all
sectors of the organization (Pohlmann, 2005; Alves, 2009). For its part, TQM does not
only focus on organization, but mainly on customers and employees. TQM is a philosophy
guided by the principles mentioned below (Westcott, 2013), like the quality management
principles contained in the ISO 9001 standard (Neves et al., 2015), viz.
• Customer focus – The customer is the one who ultimately determines the quality
level of a product or service. If quality is not perceived by the customer, the
product or service has no value;
• Total employee involvement – TQM encourages teamwork. A favourable
environment should be created, without intimidation and promoting decentralization,
in order to give workers greater autonomy and decision-making power;
• Process-centric – Processes must be managed and improved. For this, it is
necessary to define the activities that constitute them and to measure their
performance through indicators;
• Integrated system – The organizational system must be integrated, so that the
processes are interconnected. The work culture must be transversal to the entire
organization so that excellence is achieved;
• Strategic and systematic approach – The strategic planning of an organization
must be guided according to its vision, mission and objectives, with quality as a
central element;
• Continuous improvement – The organization must seek to continuously improve
its processes and critically analyse the problems, in order to propose solutions to
reinforce its competitiveness and promote the satisfaction of all interested parties;
• Making decisions based on facts – Decisions must be made based on analysis
and data collection. Historical data recording may be useful for future forecasts;
and
Chapter IV. Total Quality Management
111
• Effective communication – Communication between workers must be effective,
as this has a significant impact on their motivation.
TQM currently represents the main quality guideline (Han et al., 2007), where more
and more technologies are used and that contribute to the free circulation of personal
data. In the health sector, given the extremely sensitive nature of data, the protection of
personal data has gained increasing relevance after the mandatory implementation of the
General Data Protection Regulation (GDPR). Within the scope of the provision of
cryopreservation and storage of stem cells, both of blood and umbilical cord tissue, it is
necessary to collect and process personal data of patients related to physical or mental
health, information about their past health status or present, information obtained from
analysis or examination of a body part or biological samples, information about a disease,
disability, medical history or clinical treatment. Thus, it is necessary to process and
maintain this data in accordance with the GDPR, to ensure due security and confidentiality.
In the context of the current pandemic situation, organizations have had to adopt
strategies to maintain productivity, the satisfaction of employees and customers. The
exceptional situation that the world is going through, facing the pandemic crisis caused
by COVID-19, transformed the world of work, and brought big and fast changes in
organizations, business models and work management. COVID-19 is a disease caused
by the new coronavirus SARS-COV-2, which can cause severe respiratory infection
such as pneumonia. This virus can be transmitted through the respiratory droplets of the
infected person when he speaks, coughs or sneezes. On the other hand, the contact of
the hands with infectious respiratory secretions existing in the material components of
the work (e.g., tools, machines, or equipment) and subsequent transfer to the mucous
membranes (from the mouth, nose or eyes) is also a form of transmission of the COVID-19
in the workplace. Therefore, it is necessary that each organization (re)assesses the risks
and adopts the necessary measures to prevent and protect against infection by SARS-
COV-2, in order to protect work about conditions of hygiene, safety and health to all
workers, as recommended by the Constitution of the Portuguese Republic, the Labour
Code and the Basic Health Law (Decree-Law No. 10-A/2020).
In this context, the studies presented in this chapter aim to contribute to the effective
functioning of an organization, namely:
Chapter IV. Total Quality Management
112
• IV.2 – An Assessment of Data Guidelines in Cryopreservation Laboratories6;
• IV.3 – A Case-Based Approach to Assess Employees’ Satisfaction with Work
Guidelines in Times of the Pandemic7;
• IV.4 – Customers’ Satisfaction Assessment in Water Laboratories8
The study IV.2 was designed to support the cryopreservation laboratory in the
implementation of the GDPR, to guarantee the safety and confidentiality of genetic data,
analysis, and information on diseases.
According to Fernandes et al., (2016a; 2016b; 2019) evaluating satisfaction is essential
for companies that seek competitive advantage in the market. With the study IV.3 it was
intended to know the satisfaction of the collaborators regarding the implementation of
the new processes and methodologies imposed in the scope of the pandemic COVID-19.
Finally, the study IV.4 aimed to assess customer satisfaction considering the technical
and management requirements of the ISO/IEC 17025 standard in a water laboratory.
6 Published, in Proceedings of the 2021 International Symposium on Electrical,
Electronics and Information Engineering (ISEEIE 2021). ISBN: 978-1-4503-8983-9
7 Published in Communications in Computer and Information Science, 1277: 183–196, 2020.
8 Submitted to AQUA – Water Infrastructure, Ecosystems and Society.
Chapter IV. Total Quality Management
113
IV.2. An Assessment of Data Guidelines in Cryopreservation Laboratories
IV.2.1. Introduction
New technologies have changed the economy and social life and facilitated the free
flow of personal data. The collection and dissemination of such data has increased
significantly in all areas of society, not only because people are increasingly making their
personal data available, but also because the new technologies enable the use/dissemination
of personal data by private/public institutions. Loss of control over personal data can
cause physical, material, or immaterial damage to citizens. Therefore, the issues of data
protection have become increasingly important, and the General Data Protection
Regulation (GDPR) in force in the European Union since May 25, 2018 was the last
step in the direction of data protection (European Parliament, 2016). In the health sector,
given the extremely sensitive nature of the data, the application of this regulation is
compulsory in order to ensure proper security and confidentiality (Sørensen et al., 2012).
In this sector, personal data can be associated with physical or mental health; past,
present or future state of health; information from analyzes or examinations of a part of
the body or samples; genetic data; Information about an illness, disability or risk of
illness; anamnesis, treatments; or physiological/biomedical status. Indeed, the GDPR is
still a controversial issue in the health sector and has been the subject of various studies
and debates around the world (McCall, 2018; Morriss-Roberts et al., 2018). Demotes-
-Mainard et al. (2019) discuss the problem of transparency and data sharing (i.e., the
foundations of open science), the potential of big data analytics, and the reuse of hospital
data and health databases in the face of GDPR restrictions. The authors stress that European
countries should avoid poorly interoperable regulatory systems and make the necessary
adjustments to protect users’ data while streamlining clinical research. To this end, they
emphasize the need to define in the context of health what is understood as anonymous
data, pseudonym data as well as the public interest. In addition, the authors emphasize the
importance of the patient’s initial consent encompassing future research, and express
how the data will be accessed, rather than restricting its use in future research. They also
underscore the need for a technology infrastructure that enables researchers to access
repositories and stores to reuse data (Demotes-Mainard et al., 2019). Flaumenhaft &
Ben-Assuli (2018) discuss the main barriers that have led to relatively low acceptance
Chapter IV. Total Quality Management
114
of personal health records and avoided their widespread use. The authors state that
concerns about the security and privacy of this sensitive data are one of the main
obstacles. The study examines in detail the more relevant characteristics related to the
security and privacy of health data in five jurisdictions. The authors point out that the
revised legislation needs to highlight the GDPR as it is the most understanding and
strictest data protection measures (Flaumenhaft & Ben-Assuli, 2018). In some key
areas, however, there are still different interpretations and show a certain ambiguity
(e.g. the introduction of the term pseudonymization) (Mourby et al., 2018). Mense &
Blobel (2017) compare the key features of the GDPR and the functional model of the
HL7 Personal Health Record System (HL7 PHR-S FM). According to the authors, the
security and data protection standards HL7 PHR-S FM enable the efficient
implementation of the GDPR, i.e., meeting the goals of the legislature and clearly
defining the steps organizations should follow to ensure adequate data protection
(Mense & Blobel, 2017). This study was performed in cryopreservation laboratories, which
deal with the storage of stem cells from both blood and umbilical cord tissue. In this
type of activity, it is necessary to collect and process personal data from customers or
potential customers. The aim of this study is therefore to check whether the laboratory
can implement and comply with the GDPR. This paper consists of five sections. After a
brief introduction to the problem, the basics used in this work are discussed, namely the
Knowledge Discovery in Databases (KDD) process (Han et al., 2012; Witten et al.,
2017) and a computer approach based on Artificial Neural Networks (ANNs) (Haykin,
2009). Section IV.2.3 presents the methodology, whereas in section IV.2.4 the results
are presented and discussed. Finally, conclusions are drawn and future work is outlined.
IV.2.2. Fundamentals
Technological means have provided an exponential growth, both in number of
records and in complexity, regarding data storage. As a result of this effective increase in
information, its processing through traditional methods has become increasingly difficult
and complex. In this way, applications aimed to the task of KDD have emerged,
incorporating Data Mining (DM) tools (Han et al., 2012; Witten et al., 2017). The KDD
process involves several steps, namely selection, data pre-processing, data transformation,
data mining and interpretation (Han et al., 2012; Witten et al., 2017). The DM stage
Chapter IV. Total Quality Management
115
consists in choosing and using the methods and techniques that best fit the fulfilment of
the established objectives (Han et al., 2012).
IV.2.2.1. Artificial Neural Networks
Data analysis is not a recent subject. For several years it has been carried out using
mainly statistical methods. However, from an early stage, it became clear that the human
brain analyses data and treats information differently, using learning processes (Han et
al., 2012). ANNs were inspired by the nervous system of the human being and have been
progressively applied in DM (Haykin, 2009). An ANN is a set of simple processing
elements, called artificial neurons or nodes, organized in a highly interconnected parallel
structure. They are similar to the behavior of the brain because, on one hand, knowledge
is acquired from an environment through learning processes and, on the other hand,
because knowledge is stored in the connections between the nodes (Haykin, 2009).
From a historical point of view, ANNs had their origin in the 40s of the 20th century,
with the work of Warren McCulloch and Walter Pitts. These authors presented a
simplified model of the neuron (called an artificial neuron or node), based on the fact
that the neuron or is active or inactive, at a given moment, which corresponds to the
true/false of the proportional logic or the one/zero of the Boolean algebra (McCulloch &
Pitts, 1943). Other contributions followed, especially that of Rosenblatt (1958), who
introduced the perceptron model, which originated the multi-layer perceptron. These are
organized by layers and the connections always propagate in one direction, with no cycles.
During the last few years the architecture mentioned above were used to capture no-linear
relationships among variables, in different areas, such as law (Nguyen, 2018), water
quality (Ruben et al., 2018; Fernandes et al., 2020a), psychosocial risks management
(Fernandes et al., 2020b), or health (Ghosh et al., 2019; Shahid et al., 2019).
IV.2.3. Methods
This study was carried out in cryopreservation laboratories and in dialysis care
clinics located in the north of Portugal. The age of the participants ranged from 22 to 69
years (average age 41 ± 19 years), with 57% women and 43% men. A questionnaire to
assess the implementation of GDPR in cryopreservation laboratories was created and used
for a cohort of 156 employees. To avoid the potential hidden errors associated to ostensibly
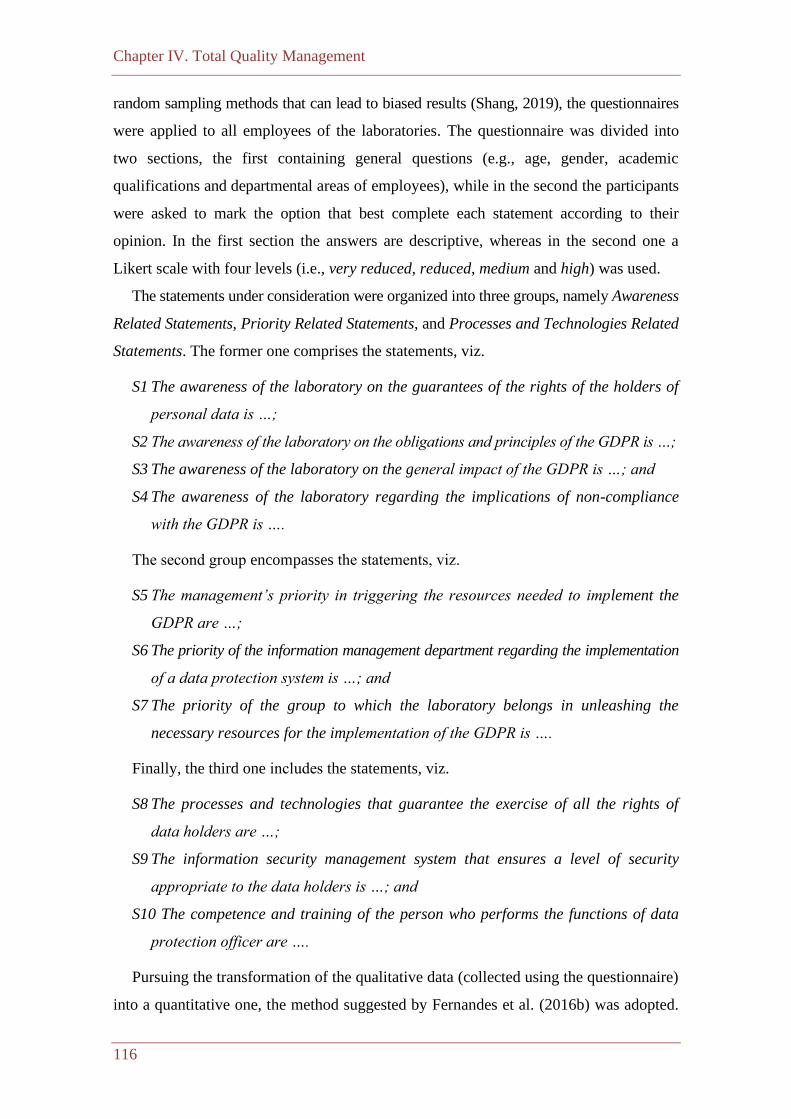
Chapter IV. Total Quality Management
116
random sampling methods that can lead to biased results (Shang, 2019), the questionnaires
were applied to all employees of the laboratories. The questionnaire was divided into
two sections, the first containing general questions (e.g., age, gender, academic
qualifications and departmental areas of employees), while in the second the participants
were asked to mark the option that best complete each statement according to their
opinion. In the first section the answers are descriptive, whereas in the second one a
Likert scale with four levels (i.e., very reduced, reduced, medium and high) was used.
The statements under consideration were organized into three groups, namely Awareness
Related Statements, Priority Related Statements, and Processes and Technologies Related
Statements. The former one comprises the statements, viz.
S1 The awareness of the laboratory on the guarantees of the rights of the holders of
personal data is …;
S2 The awareness of the laboratory on the obligations and principles of the GDPR is …;
S3 The awareness of the laboratory on the general impact of the GDPR is …; and
S4 The awareness of the laboratory regarding the implications of non-compliance
with the GDPR is ….
The second group encompasses the statements, viz.
S5 The management’s priority in triggering the resources needed to implement the
GDPR are …;
S6 The priority of the information management department regarding the implementation
of a data protection system is …; and
S7 The priority of the group to which the laboratory belongs in unleashing the
necessary resources for the implementation of the GDPR is ….
Finally, the third one includes the statements, viz.
S8 The processes and technologies that guarantee the exercise of all the rights of
data holders are …;
S9 The information security management system that ensures a level of security
appropriate to the data holders is …; and
S10 The competence and training of the person who performs the functions of data
protection officer are ….
Pursuing the transformation of the qualitative data (collected using the questionnaire)
into a quantitative one, the method suggested by Fernandes et al. (2016b) was adopted.

Chapter IV. Total Quality Management
117
Thus the set of n statements respecting to a particular theme is itemized into a unitary
area circle split into n slices, where the marks in the axis correspond to each one of the
possible options, corresponding the quantitative value to the total area, as specified
below (section IV.2.4.3).
The Waikato Environment for Knowledge Analysis (WEKA) was used to implement
ANNs, maintaining the standard software parameters (Frank et al., 2016). In each
simulation, the database was randomly divided into two mutually exclusive partitions,
i.e., the training and test sets.
IV.2.4. Results and Discussion
IV.2.4.1. Sample Characterization
Applicants’ age was categorized into age groups, i.e., less than 20 years of age, 20-
30, 31-50, 51-65 and higher than 65 years of age. 64.8% of applicants are aged between
31 and 65 years old, 33.3% are lesser than 30 years of age, while 1.9% are higher than
65 years of age. Concerning academic qualification, 25.6% of the applicants expressed
to have basic education, 23.7% declared that concluded secondary education, 40.4%
stated to have finished a degree and 10.3% affirmed to have post graduate education.
IV.2.4.2. Answer Frequency Analysis
Figure 36 displays the frequency of answering to the second part of the questionnaire,
where applicants selected the option that best complete each statement according to
their opinion. The statements S1 to S4 refer to the Awareness, S5 to S7 are related to
Priority, and S8 to S10 are relative to Processes and Technologies. The analysis of
results presented in Figure 36 shows that for all the statements, regardless the dimension
considered (i.e., Awareness, Priority and Processes and Technologies), most of the
applicants (ranging between 89.1% and 94.2%) ticked the options Medium or High
considering that the commitment of the laboratory regarding the implementation and
fulfill of the GDPR is appropriate. In fact, only a small percentage of applicants, ranged
between 5.8% and 10.9%, considers the efforts in the implementation of the mentioned
guidelines unsatisfactory.
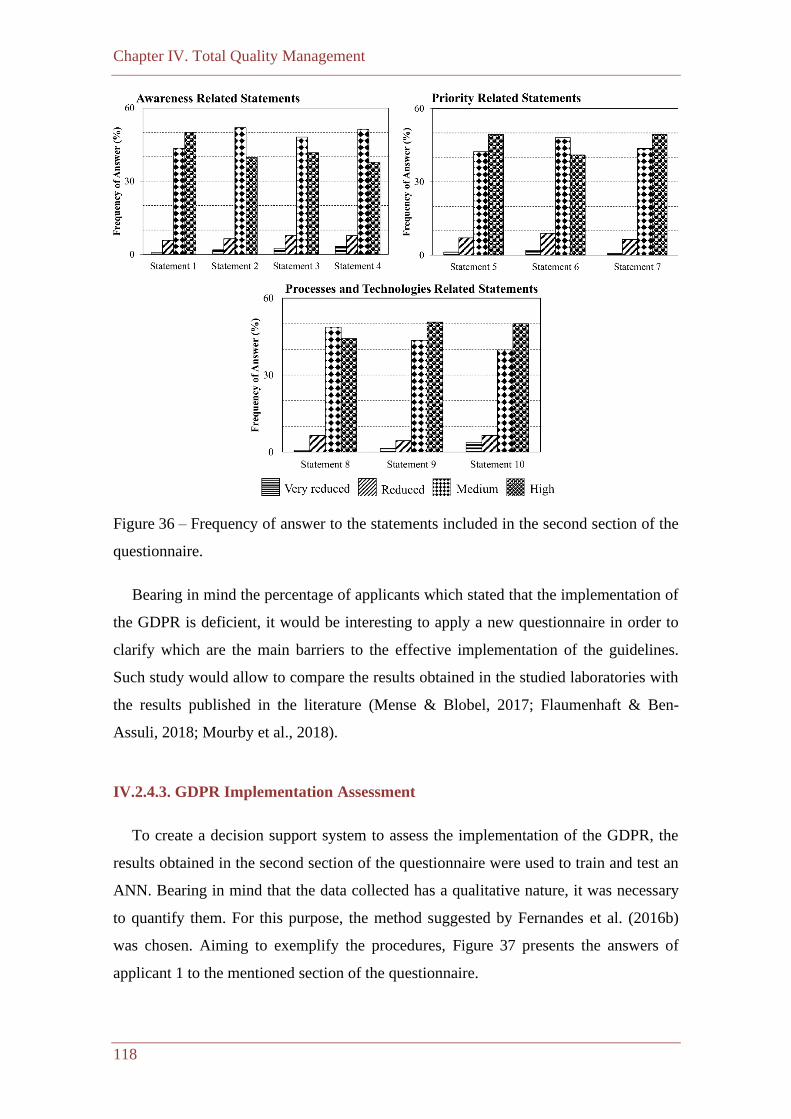
Chapter IV. Total Quality Management
118
Figure 36 – Frequency of answer to the statements included in the second section of the
questionnaire.
Bearing in mind the percentage of applicants which stated that the implementation of
the GDPR is deficient, it would be interesting to apply a new questionnaire in order to
clarify which are the main barriers to the effective implementation of the guidelines.
Such study would allow to compare the results obtained in the studied laboratories with
the results published in the literature (Mense & Blobel, 2017; Flaumenhaft & Ben-
Assuli, 2018; Mourby et al., 2018).
IV.2.4.3. GDPR Implementation Assessment
To create a decision support system to assess the implementation of the GDPR, the
results obtained in the second section of the questionnaire were used to train and test an
ANN. Bearing in mind that the data collected has a qualitative nature, it was necessary
to quantify them. For this purpose, the method suggested by Fernandes et al. (2016b)
was chosen. Aiming to exemplify the procedures, Figure 37 presents the answers of
applicant 1 to the mentioned section of the questionnaire.
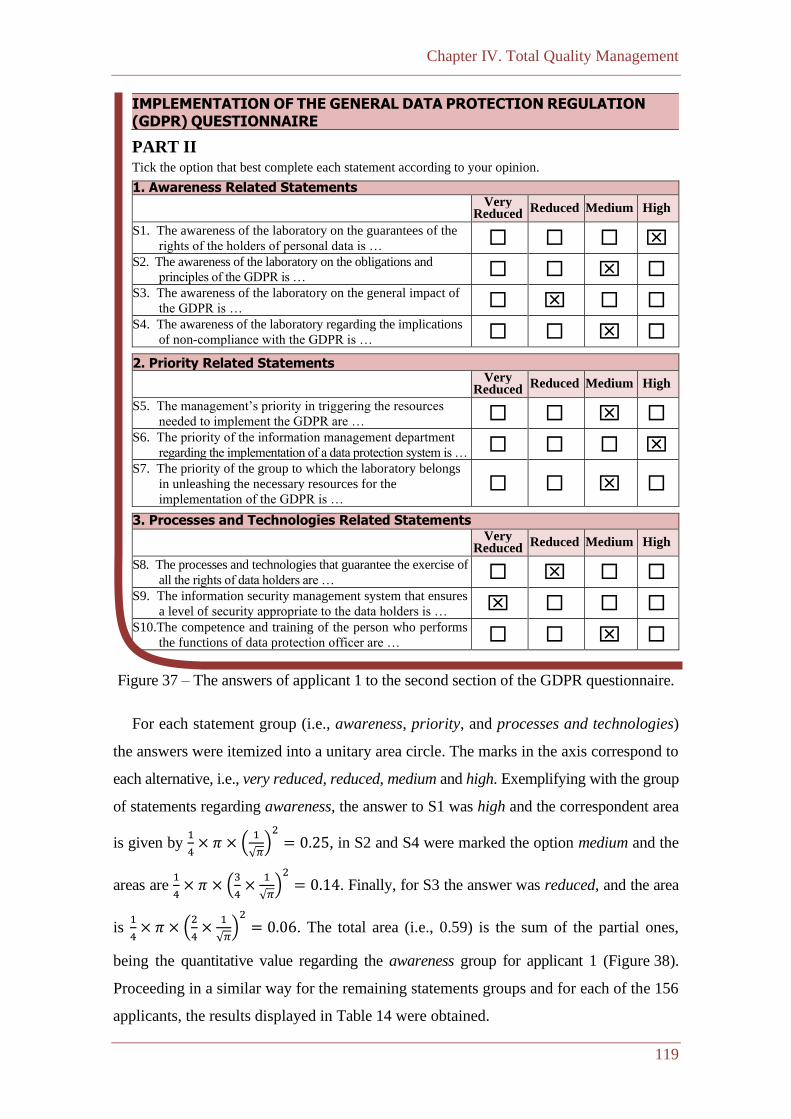
Chapter IV. Total Quality Management
119
IMPLEMENTATION OF THE GENERAL DATA PROTECTION REGULATION
(GDPR) QUESTIONNAIRE
PART II
Tick the option that best complete each statement according to your opinion.
1. Awareness Related Statements
Very
Reduced Reduced Medium High
S1. The awareness of the laboratory on the guarantees of the
rights of the holders of personal data is …
S2. The awareness of the laboratory on the obligations and
principles of the GDPR is …
S3. The awareness of the laboratory on the general impact of
the GDPR is …
S4. The awareness of the laboratory regarding the implications
of non-compliance with the GDPR is …
2. Priority Related Statements
Very
Reduced Reduced Medium High
S5. The management’s priority in triggering the resources
needed to implement the GDPR are …
S6. The priority of the information management department
regarding the implementation of a data protection system is …
S7. The priority of the group to which the laboratory belongs
in unleashing the necessary resources for the
implementation of the GDPR is …
3. Processes and Technologies Related Statements
Very
Reduced Reduced Medium High
S8. The processes and technologies that guarantee the exercise of
all the rights of data holders are …
S9. The information security management system that ensures
a level of security appropriate to the data holders is …
S10.The competence and training of the person who performs
the functions of data protection officer are …
Figure 37 – The answers of applicant 1 to the second section of the GDPR questionnaire.
For each statement group (i.e., awareness, priority, and processes and technologies)
the answers were itemized into a unitary area circle. The marks in the axis correspond to
each alternative, i.e., very reduced, reduced, medium and high. Exemplifying with the group
of statements regarding awareness, the answer to S1 was high and the correspondent area
is given by 1
4× 𝜋 × (
1
√𝜋)2
= 0.25, in S2 and S4 were marked the option medium and the
areas are 1
4× 𝜋 × (
3
4×
1
√𝜋)2
= 0.14. Finally, for S3 the answer was reduced, and the area
is 1
4× 𝜋 × (
2
4×
1
√𝜋)2
= 0.06. The total area (i.e., 0.59) is the sum of the partial ones,
being the quantitative value regarding the awareness group for applicant 1 (Figure 38).
Proceeding in a similar way for the remaining statements groups and for each of the 156
applicants, the results displayed in Table 14 were obtained.
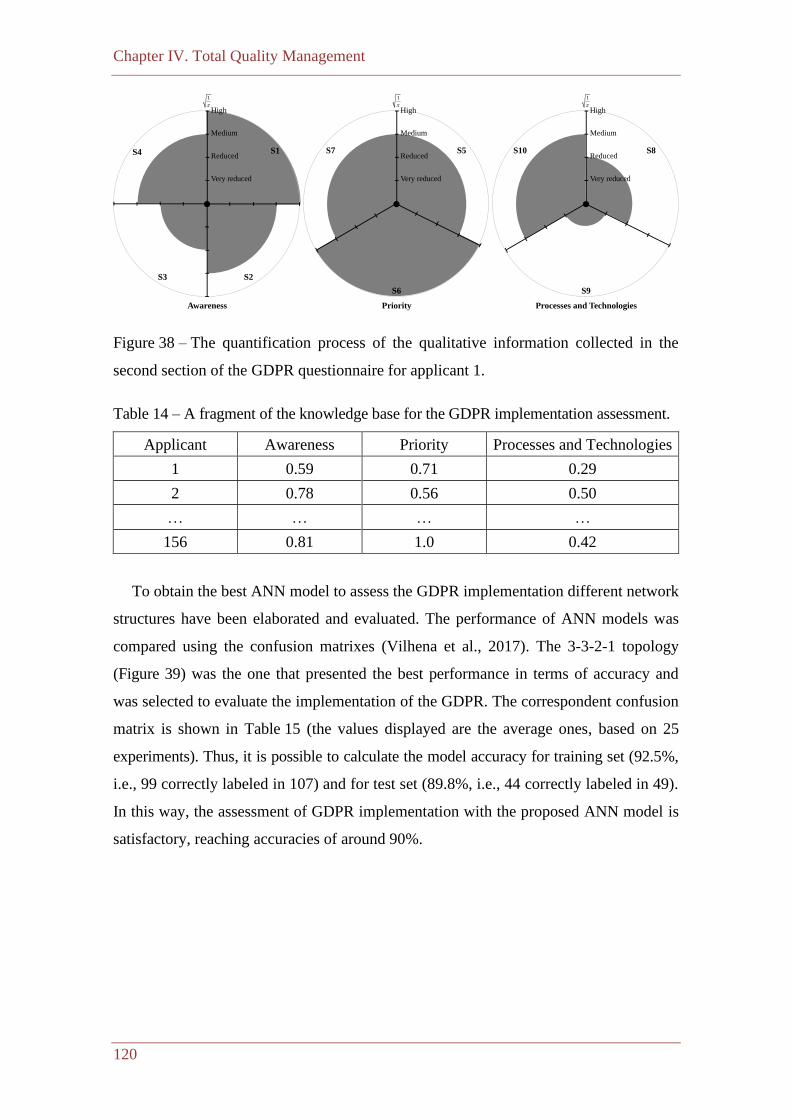
Chapter IV. Total Quality Management
120
Figure 38 – The quantification process of the qualitative information collected in the
second section of the GDPR questionnaire for applicant 1.
Table 14 – A fragment of the knowledge base for the GDPR implementation assessment.
Applicant Awareness Priority Processes and Technologies
1 0.59 0.71 0.29
2 0.78 0.56 0.50
… … … …
156 0.81 1.0 0.42
To obtain the best ANN model to assess the GDPR implementation different network
structures have been elaborated and evaluated. The performance of ANN models was
compared using the confusion matrixes (Vilhena et al., 2017). The 3-3-2-1 topology
(Figure 39) was the one that presented the best performance in terms of accuracy and
was selected to evaluate the implementation of the GDPR. The correspondent confusion
matrix is shown in Table 15 (the values displayed are the average ones, based on 25
experiments). Thus, it is possible to calculate the model accuracy for training set (92.5%,
i.e., 99 correctly labeled in 107) and for test set (89.8%, i.e., 44 correctly labeled in 49).
In this way, the assessment of GDPR implementation with the proposed ANN model is
satisfactory, reaching accuracies of around 90%.
S1
S3
S4
S2
1
Very reduced
Reduced
Medium
High
Awareness
S5S7
S6
1
Very reduced
Reduced
Medium
High
Priority
S8S10
S9
1
Very reduced
Reduced
Medium
High
Processes and Technologies
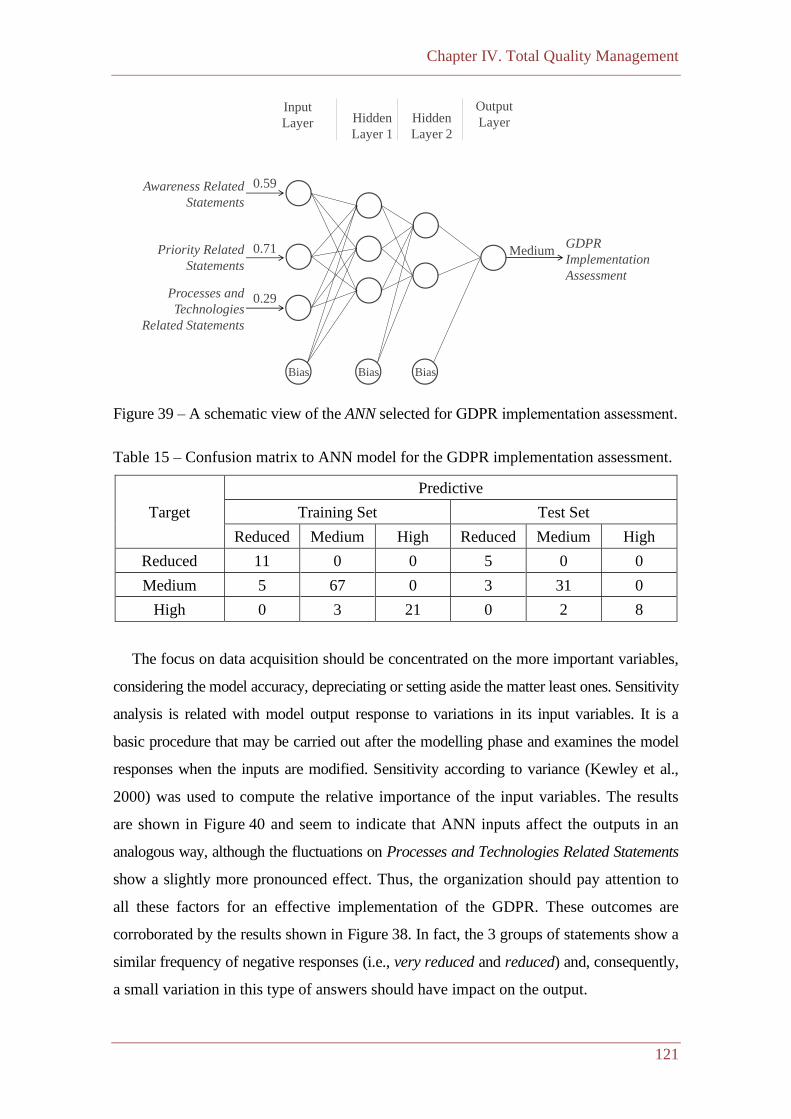
Chapter IV. Total Quality Management
121
Figure 39 – A schematic view of the ANN selected for GDPR implementation assessment.
Table 15 – Confusion matrix to ANN model for the GDPR implementation assessment.
Target
Predictive
Training Set Test Set
Reduced Medium High Reduced Medium High
Reduced 11 0 0 5 0 0
Medium 5 67 0 3 31 0
High 0 3 21 0 2 8
The focus on data acquisition should be concentrated on the more important variables,
considering the model accuracy, depreciating or setting aside the matter least ones. Sensitivity
analysis is related with model output response to variations in its input variables. It is a
basic procedure that may be carried out after the modelling phase and examines the model
responses when the inputs are modified. Sensitivity according to variance (Kewley et al.,
2000) was used to compute the relative importance of the input variables. The results
are shown in Figure 40 and seem to indicate that ANN inputs affect the outputs in an
analogous way, although the fluctuations on Processes and Technologies Related Statements
show a slightly more pronounced effect. Thus, the organization should pay attention to
all these factors for an effective implementation of the GDPR. These outcomes are
corroborated by the results shown in Figure 38. In fact, the 3 groups of statements show a
similar frequency of negative responses (i.e., very reduced and reduced) and, consequently,
a small variation in this type of answers should have impact on the output.
Input
Layer Hidden
Layer 1
Hidden
Layer 2
Output
Layer
BiasBiasBias
0.59
0.29
0.71
Awareness Related
Statements
Priority Related
Statements
Processes and
Technologies
Related Statements
GDPR
Implementation
Assessment
Medium
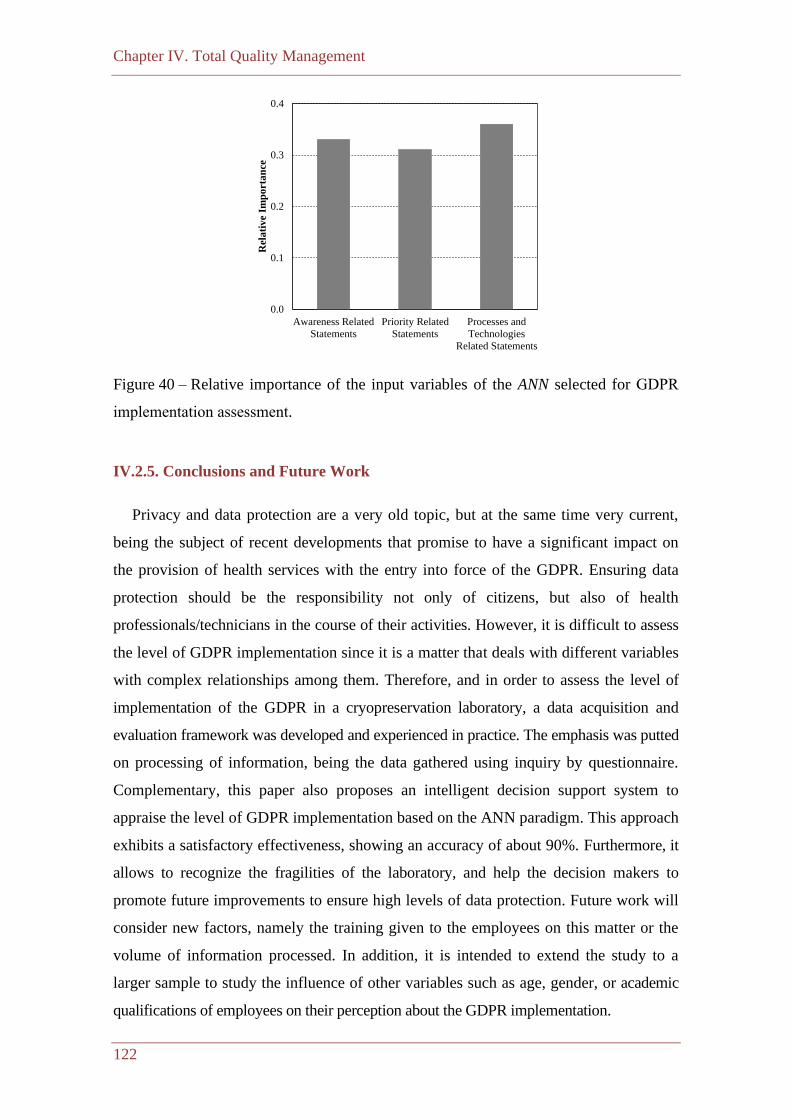
Chapter IV. Total Quality Management
122
Figure 40 – Relative importance of the input variables of the ANN selected for GDPR
implementation assessment.
IV.2.5. Conclusions and Future Work
Privacy and data protection are a very old topic, but at the same time very current,
being the subject of recent developments that promise to have a significant impact on
the provision of health services with the entry into force of the GDPR. Ensuring data
protection should be the responsibility not only of citizens, but also of health
professionals/technicians in the course of their activities. However, it is difficult to assess
the level of GDPR implementation since it is a matter that deals with different variables
with complex relationships among them. Therefore, and in order to assess the level of
implementation of the GDPR in a cryopreservation laboratory, a data acquisition and
evaluation framework was developed and experienced in practice. The emphasis was putted
on processing of information, being the data gathered using inquiry by questionnaire.
Complementary, this paper also proposes an intelligent decision support system to
appraise the level of GDPR implementation based on the ANN paradigm. This approach
exhibits a satisfactory effectiveness, showing an accuracy of about 90%. Furthermore, it
allows to recognize the fragilities of the laboratory, and help the decision makers to
promote future improvements to ensure high levels of data protection. Future work will
consider new factors, namely the training given to the employees on this matter or the
volume of information processed. In addition, it is intended to extend the study to a
larger sample to study the influence of other variables such as age, gender, or academic
qualifications of employees on their perception about the GDPR implementation.
0.0
0.1
0.2
0.3
0.4
Awareness Related
Statements
Priority Related
Statements
Processes and
Technologies
Related Statements
Rel
ati
ve
Imp
ort
an
ce
Chapter IV. Total Quality Management
123
IV.3. A Case-Based Approach to Assess Employees’ Satisfaction with
Work Guidelines in Times of the Pandemic
IV.3.1. Introduction
The health sector is central to the well-being of society, and people become gradually
more important to the proper functioning of such area. Indeed, the COVID–19 pandemics
are a major challenge for health, for organizations and for society. On the other hand,
work activities are potential sources of exposure to the virus due to the closeness of
employees and customers when acting according to their obligations (Decree-Law No.
10-A/2020). Maintaining the health of professionals who continue to work is therefore
essential to control the spread of the disease. Last but not least, and according to the
guidelines announced by the World Health Organization (WHO), all organizations had
to introduce new operating procedures such as social distance in order to avoid the
spread of the virus (WHO, 2020a). In order to maintain the productivity and satisfaction
of customers and employees, all new processes and working measures must be
understood and accepted by each one (WHO, 2020b). The entire team should be satisfied,
as employee satisfaction is highly linked to productivity, personal fulfillment, and
customer satisfaction. However, assessing employee satisfaction is a difficult task that
comprises a variety of issues that depend on both the employee and the organization
(Petrescu & Simmons, 2008; Alfes et al., 2013; Berman et al., 2020). The present work
aims to assess the satisfaction of the employees of water analysis laboratories with the
new working methods in connection with the pandemic crisis.
The paper is composed by five sections. Afterwards to a brief introduction to the
problem, the basics used in the study are discussed, specifically the notion of Entropy,
the procedures of Logic Programming for Knowledge Representation and Reasoning
(Neves, 1984; Fernandes et al., 2020c; Figueiredo et al., 2020) and a computer-based
approach to Case-Based Reasoning (Aamodt & Plaza, 1994; Richter & Weber, 2013).
Sections IV.3.3 presents the methodology and data processing, whereas in Section
IV.3.4 the results are presented and discussed taking into account the notion of Entropy
(Wenterodt & Herwig, 2014). Finally, in Section IV.3.5, the main conclusions pointed
out and future work are delineated.
Chapter IV. Total Quality Management
124
IV.3.2. Literature Review
IV.3.2.1. Thermodynamics and Knowledge Representation and Reasoning
The methodology used in this article is grounded on thermodynamics and aims to
present the practices of Knowledge Representation and Reasoning as an energy conversion
process (Wenterodt & Herwig, 2014, Neves et al, 2019; Figueiredo et al., 2020). In
order to illustrate the basics of the method, the first two laws of thermodynamics were
taken into account, attending that one is faced to a dynamic system, i.e., that moves
continuously from state to state. The First Law or the Energy Saving Law establishes
that the total energy of an isolated system is constant, although it can take different
forms. The Second Law is concerned with Entropy, i.e., the state of order of a system,
establishing that in an isolated system the entropy never decreases. These qualities meet
one’s viewpoint of Knowledge Representation and Reasoning practices. In fact, such
does are inspired by the processes of energy degradation in an isolated system, which
can be described as, viz.
• exergy, also denominated as energy ready for use or work ready for use, and
corresponds to the energy fraction that may be used in an arbitrary way by a
system, providing a measurement of its entropy, being figured by the dark zones
(Figure 42, section IV.3.3.2);
• vagueness, i.e., that corresponds to the energy values that were or were not used,
being represented by the dark regions with circles (Figure 42, section IV.3.3.2);
and
• anergy, that can be set as an available energetic potential, i.e., the energy that was
not consumed at moment, being denoted in Figure 42 (section IV.3.3.2) by the
dark surfaces with asterisks (Wenterodt & Herwig, 2014, Neves et al, 2019;
Figueiredo et al., 2020).
Several advances to Knowledge Representation and Reasoning are based on the Logic
Programming architype, namely in Model and Proof Theory. The problem-solving
method used in this work is based on Proof Theory and is applied to logic programs that
use an extension of the Logic Programming language (Neves, 1984) in the form of a
finite summative of clauses, as shown in Program 6.
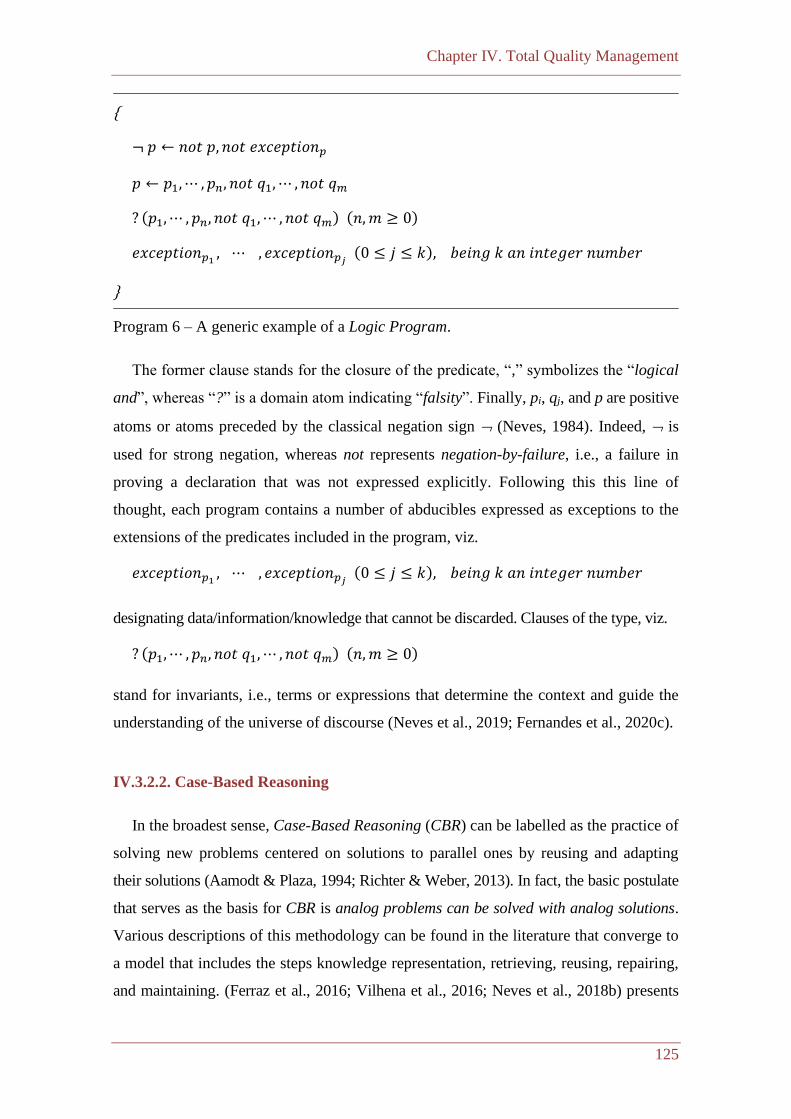
Chapter IV. Total Quality Management
125
{
¬ 𝑝 ← 𝑛𝑜𝑡 𝑝, 𝑛𝑜𝑡 𝑒𝑥𝑐𝑒𝑝𝑡𝑖𝑜𝑛𝑝
𝑝 ← 𝑝1,⋯ , 𝑝𝑛, 𝑛𝑜𝑡 𝑞1, ⋯ , 𝑛𝑜𝑡 𝑞𝑚
? (𝑝1,⋯ , 𝑝𝑛, 𝑛𝑜𝑡 𝑞1, ⋯ , 𝑛𝑜𝑡 𝑞𝑚) (𝑛,𝑚 ≥ 0)
𝑒𝑥𝑐𝑒𝑝𝑡𝑖𝑜𝑛𝑝1 , ⋯ , 𝑒𝑥𝑐𝑒𝑝𝑡𝑖𝑜𝑛𝑝𝑗 (0 ≤ 𝑗 ≤ 𝑘), 𝑏𝑒𝑖𝑛𝑔 𝑘 𝑎𝑛 𝑖𝑛𝑡𝑒𝑔𝑒𝑟 𝑛𝑢𝑚𝑏𝑒𝑟
}
Program 6 – A generic example of a Logic Program.
The former clause stands for the closure of the predicate, “,” symbolizes the “logical
and”, whereas “?” is a domain atom indicating “falsity”. Finally, pi, qj, and p are positive
atoms or atoms preceded by the classical negation sign (Neves, 1984). Indeed, is
used for strong negation, whereas not represents negation-by-failure, i.e., a failure in
proving a declaration that was not expressed explicitly. Following this this line of
thought, each program contains a number of abducibles expressed as exceptions to the
extensions of the predicates included in the program, viz.
𝑒𝑥𝑐𝑒𝑝𝑡𝑖𝑜𝑛𝑝1 , ⋯ , 𝑒𝑥𝑐𝑒𝑝𝑡𝑖𝑜𝑛𝑝𝑗 (0 ≤ 𝑗 ≤ 𝑘), 𝑏𝑒𝑖𝑛𝑔 𝑘 𝑎𝑛 𝑖𝑛𝑡𝑒𝑔𝑒𝑟 𝑛𝑢𝑚𝑏𝑒𝑟
designating data/information/knowledge that cannot be discarded. Clauses of the type, viz.
? (𝑝1,⋯ , 𝑝𝑛, 𝑛𝑜𝑡 𝑞1, ⋯ , 𝑛𝑜𝑡 𝑞𝑚) (𝑛,𝑚 ≥ 0)
stand for invariants, i.e., terms or expressions that determine the context and guide the
understanding of the universe of discourse (Neves et al., 2019; Fernandes et al., 2020c).
IV.3.2.2. Case-Based Reasoning
In the broadest sense, Case-Based Reasoning (CBR) can be labelled as the practice of
solving new problems centered on solutions to parallel ones by reusing and adapting
their solutions (Aamodt & Plaza, 1994; Richter & Weber, 2013). In fact, the basic postulate
that serves as the basis for CBR is analog problems can be solved with analog solutions.
Various descriptions of this methodology can be found in the literature that converge to
a model that includes the steps knowledge representation, retrieving, reusing, repairing,
and maintaining. (Ferraz et al., 2016; Vilhena et al., 2016; Neves et al., 2018b) presents
Chapter IV. Total Quality Management
126
an extended CBR cycle that includes a case optimization process, taking two new
metrics into account, i.e., the Quality-of-Information (QoI) and the Degree-of-Confidence
(DoC) on the solution so far obtained. The similarity measure is calculated using QoI
and DoC, which allows the search space for similar cases to be narrowed.
IV.3.3. Case Study
IV.3.3.1. Methods
The study was performed in a water laboratory in southern Portugal. The participants’
ages varied between 18 to 60 years (mean age 38 ± 20 years old), with 61% female and
39% male. A questionnaire to assess employee satisfaction with the new pandemic crisis
procedures was created and used for a cohort of 64 personnel. The questionnaire was
formed by into two segments, the initial one containing common questions (such as age,
gender, educational qualifications, seniority and department within the organization), while
the second covered points for assessing employees’ satisfaction with the current restrictions.
IV.3.3.2. Data Processing
Aiming to gather evidences related with the satisfaction of the employees concerning
the new procedures related with the pandemic crisis, the participants were requested to
mark the alternative(s) that best reflect their feelings concerning each item. In the case
of the participant mark more than one alternative, he/she is also requested to specify the
tendency of his/her answer, i.e., growing tendency (Very Dissatisfied → Very Satisfied)
or the opposite (Very Satisfied → Very Dissatisfied) as displayed in Figure 41. Taking
into account the cohort dimension, the answer alternatives were given in a four items
Likert scale, viz.
(4) Very Satisfied, (3) Satisfied, (2) Dissatisfied, (1) Very Dissatisfied
The answer alternatives are in accordance a four items Likert type scale with the
decreasing tendency, to be in terms with the First Law of Thermodynamics, i.e. from (4)
Very Satisfied, (3) Satisfied, (2) Dissatisfied, to (1) Very Dissatisfied, and from (1) Very
Dissatisfied), (2) Dissatisfied, (3) Satisfied, to (4) Very Satisfied with the increasing
tendency, to be in terms with the Second Law of Thermodynamics.
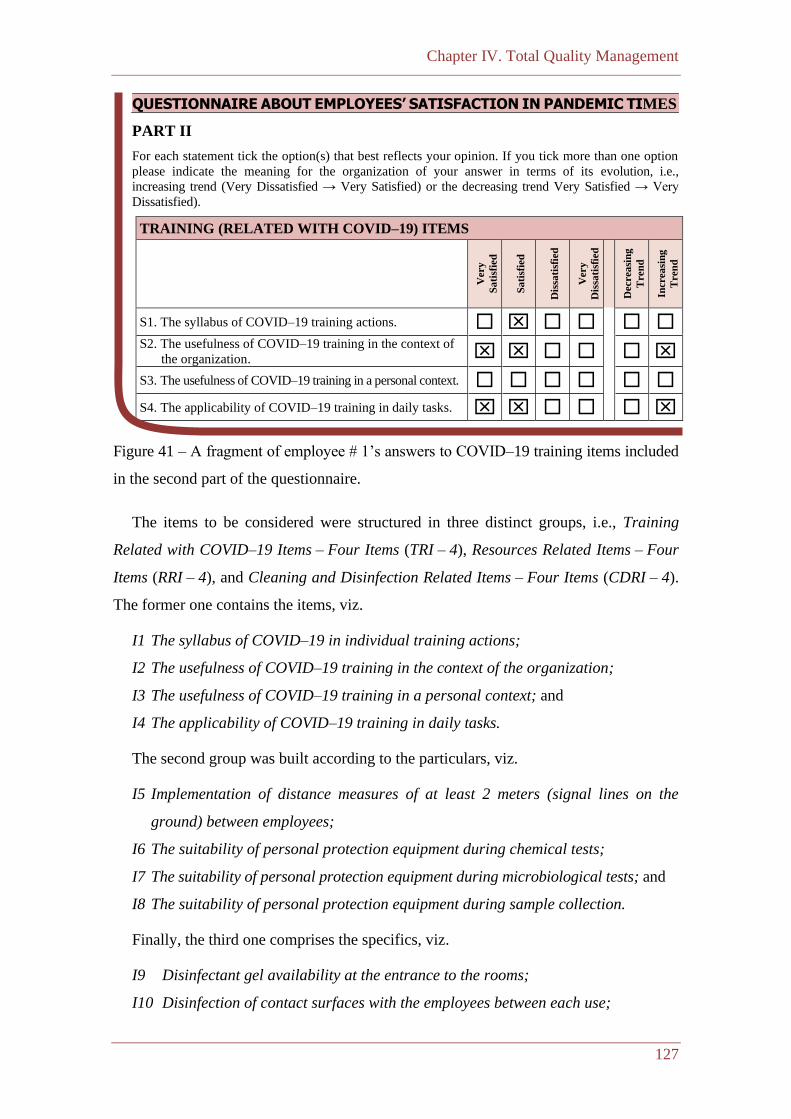
Chapter IV. Total Quality Management
127
QUESTIONNAIRE ABOUT EMPLOYEES’ SATISFACTION IN PANDEMIC TIMES
PART II
For each statement tick the option(s) that best reflects your opinion. If you tick more than one option
please indicate the meaning for the organization of your answer in terms of its evolution, i.e.,
increasing trend (Very Dissatisfied → Very Satisfied) or the decreasing trend Very Satisfied → Very
Dissatisfied).
TRAINING (RELATED WITH COVID–19) ITEMS
Very
Sa
tisf
ied
Sa
tisf
ied
Dis
sati
sfie
d
Very
Dis
sati
sfie
d
Decrea
sin
g
Tren
d
Increa
sin
g
Tren
d
S1. The syllabus of COVID–19 training actions.
S2. The usefulness of COVID–19 training in the context of
the organization.
S3. The usefulness of COVID–19 training in a personal context.
S4. The applicability of COVID–19 training in daily tasks.
Figure 41 – A fragment of employee # 1’s answers to COVID–19 training items included
in the second part of the questionnaire.
The items to be considered were structured in three distinct groups, i.e., Training
Related with COVID–19 Items – Four Items (TRI – 4), Resources Related Items – Four
Items (RRI – 4), and Cleaning and Disinfection Related Items – Four Items (CDRI – 4).
The former one contains the items, viz.
I1 The syllabus of COVID–19 in individual training actions;
I2 The usefulness of COVID–19 training in the context of the organization;
I3 The usefulness of COVID–19 training in a personal context; and
I4 The applicability of COVID–19 training in daily tasks.
The second group was built according to the particulars, viz.
I5 Implementation of distance measures of at least 2 meters (signal lines on the
ground) between employees;
I6 The suitability of personal protection equipment during chemical tests;
I7 The suitability of personal protection equipment during microbiological tests; and
I8 The suitability of personal protection equipment during sample collection.
Finally, the third one comprises the specifics, viz.
I9 Disinfectant gel availability at the entrance to the rooms;
I10 Disinfection of contact surfaces with the employees between each use;
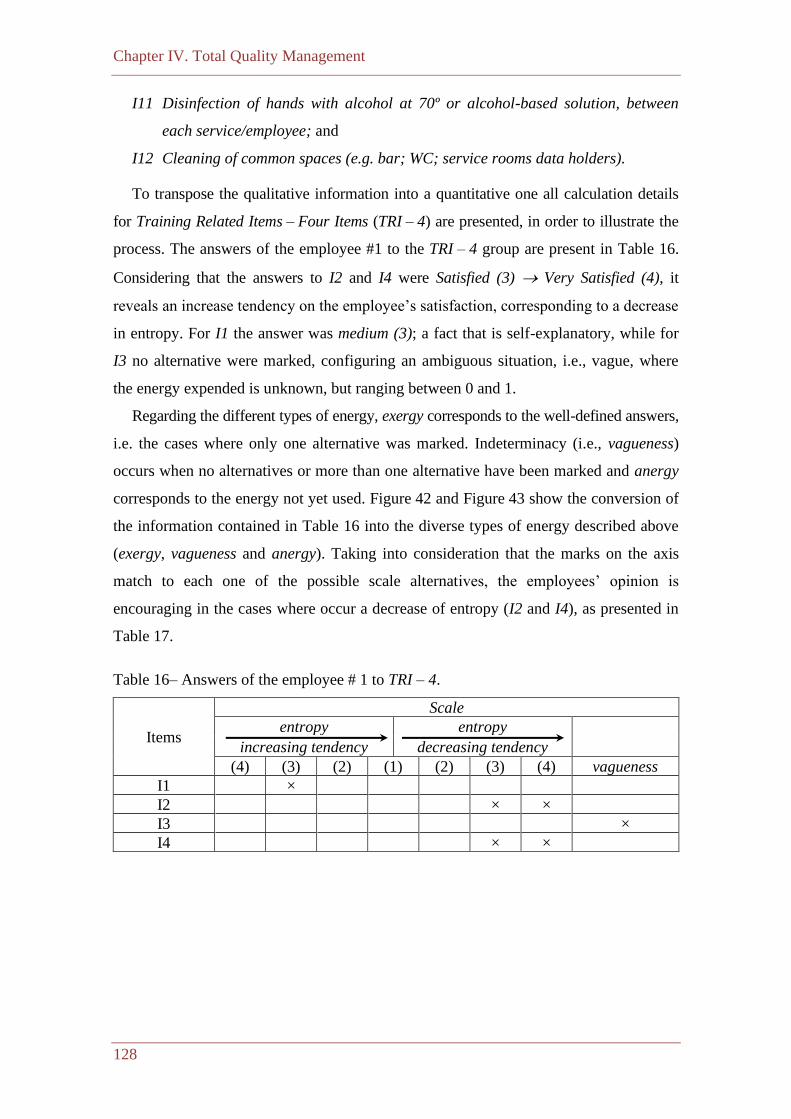
Chapter IV. Total Quality Management
128
I11 Disinfection of hands with alcohol at 70º or alcohol-based solution, between
each service/employee; and
I12 Cleaning of common spaces (e.g. bar; WC; service rooms data holders).
To transpose the qualitative information into a quantitative one all calculation details
for Training Related Items – Four Items (TRI – 4) are presented, in order to illustrate the
process. The answers of the employee #1 to the TRI – 4 group are present in Table 16.
Considering that the answers to I2 and I4 were Satisfied (3) → Very Satisfied (4), it
reveals an increase tendency on the employee’s satisfaction, corresponding to a decrease
in entropy. For I1 the answer was medium (3); a fact that is self-explanatory, while for
I3 no alternative were marked, configuring an ambiguous situation, i.e., vague, where
the energy expended is unknown, but ranging between 0 and 1.
Regarding the different types of energy, exergy corresponds to the well-defined answers,
i.e. the cases where only one alternative was marked. Indeterminacy (i.e., vagueness)
occurs when no alternatives or more than one alternative have been marked and anergy
corresponds to the energy not yet used. Figure 42 and Figure 43 show the conversion of
the information contained in Table 16 into the diverse types of energy described above
(exergy, vagueness and anergy). Taking into consideration that the marks on the axis
match to each one of the possible scale alternatives, the employees’ opinion is
encouraging in the cases where occur a decrease of entropy (I2 and I4), as presented in
Table 17.
Table 16– Answers of the employee # 1 to TRI – 4.
Items
Scale
entropy entropy
increasing tendency decreasing tendency
(4) (3) (2) (1) (2) (3) (4) vagueness
I1 ×
I2 × ×
I3 ×
I4 × ×
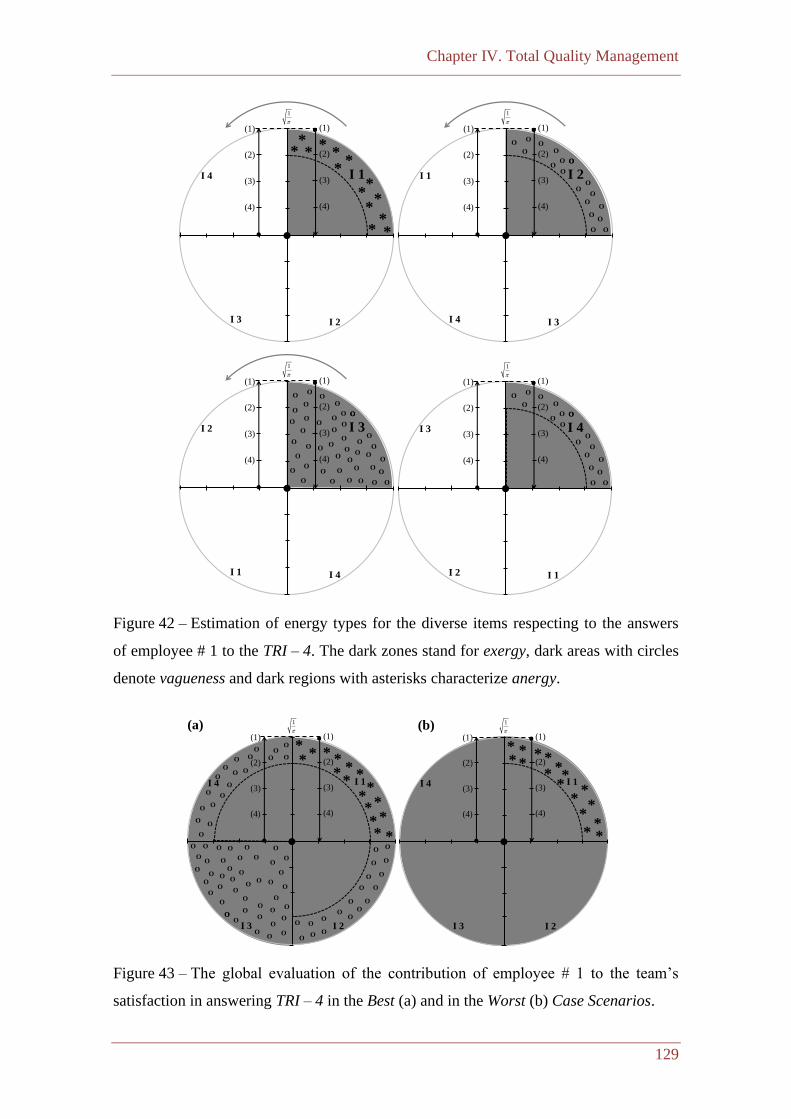
Chapter IV. Total Quality Management
129
Figure 42 – Estimation of energy types for the diverse items respecting to the answers
of employee # 1 to the TRI – 4. The dark zones stand for exergy, dark areas with circles
denote vagueness and dark regions with asterisks characterize anergy.
Figure 43 – The global evaluation of the contribution of employee # 1 to the team’s
satisfaction in answering TRI – 4 in the Best (a) and in the Worst (b) Case Scenarios.
I 2
I 4
I 1
I 3
1
(4)
(3)
(2)
(1)
(4)
(3)
(2)
(1)
O OO
O
O
O
O
O
OO
O O
O
O
O
O
O
OO
I 1
I 3
I 4
I 2
1
(4)
(3)
(2)
(1)
(4)
(3)
(2)
(1)
***
*
**
**
*
*
*
*
*
*
I 3
I 1
I 2
I 4
1
(4)
(3)
(2)
(1)
(4)
(3)
(2)
(1)
O OO
O
O
O
O
O
OO
O O
O
O
O
O
O
OO
O OO
O
OO
O
O
OO
OO
OO
OO
O
O
O
O
OO
O
O
O
I 4
I 2
I 3
I 1
1
(4)
(3)
(2)
(1)
(4)
(3)
(2)
(1)
O OO
O
O
O
O
O
OO
O O
O
O
O
O
O
OO
(a) (b)
I 1
I 3
I 4
I 2
1
(4)
(3)
(2)
(1)
(4)
(3)
(2)
(1)
*
*
*
*
***
**
**
**
**
*
*
O
O
O
O
O
O
O
OOO
O
O
O
O
O
O
O
OO
O
O
O
O
O
OO
OOO
O
OO
O
O
OO
O O
O O
OO
O
O
O
O
OO
O
O
O
O
O
OO
O
OO
O
O
O
O
OO
O
OOO
O
O
I 1
I 3
I 4
I 2
1
(4)
(3)
(2)
(1)
(4)
(3)
(2)
(1)
O
O
O
O
O
O
O
O
O
O
O
OO
O
O
O
O
O
O
*** *
**
*
**
**
*
*
*
*
*
*
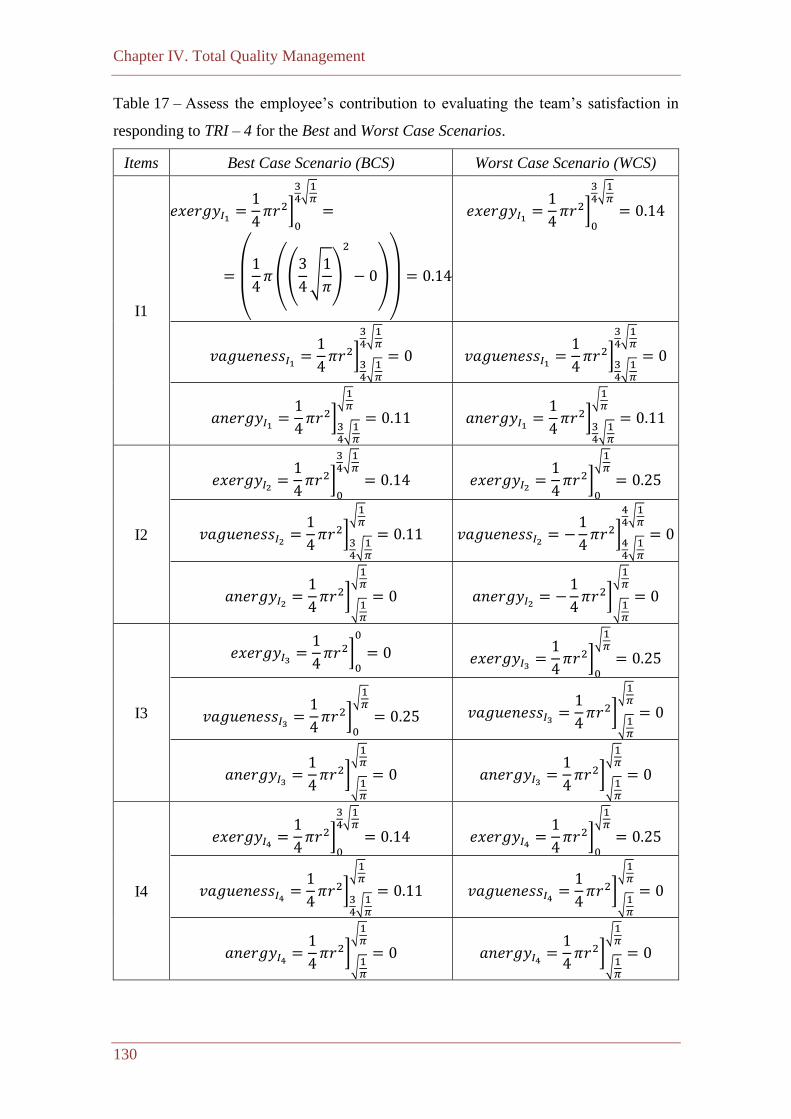
Chapter IV. Total Quality Management
130
Table 17 – Assess the employee’s contribution to evaluating the team’s satisfaction in
responding to TRI – 4 for the Best and Worst Case Scenarios.
Items Best Case Scenario (BCS) Worst Case Scenario (WCS)
I1
𝑒𝑥𝑒𝑟𝑔𝑦𝐼1 =1
4𝜋𝑟2]
0
34√1𝜋=
=
(
1
4𝜋((
3
4√1
𝜋)
2
− 0)
)
= 0.14
𝑒𝑥𝑒𝑟𝑔𝑦𝐼1 =1
4𝜋𝑟2]
0
34√1𝜋= 0.14
𝑣𝑎𝑔𝑢𝑒𝑛𝑒𝑠𝑠𝐼1 =1
4𝜋𝑟2]
34√1𝜋
34√1𝜋= 0 𝑣𝑎𝑔𝑢𝑒𝑛𝑒𝑠𝑠𝐼1 =
1
4𝜋𝑟2]
34√1𝜋
34√1𝜋= 0
𝑎𝑛𝑒𝑟𝑔𝑦𝐼1 =1
4𝜋𝑟2]
34√1𝜋
√1𝜋= 0.11 𝑎𝑛𝑒𝑟𝑔𝑦𝐼1 =
1
4𝜋𝑟2]
34√1𝜋
√1𝜋= 0.11
I2
𝑒𝑥𝑒𝑟𝑔𝑦𝐼2 =1
4𝜋𝑟2]
0
34√1𝜋= 0.14 𝑒𝑥𝑒𝑟𝑔𝑦𝐼2 =
1
4𝜋𝑟2]
0
√1𝜋= 0.25
𝑣𝑎𝑔𝑢𝑒𝑛𝑒𝑠𝑠𝐼2 =1
4𝜋𝑟2]
34√1𝜋
√1𝜋= 0.11 𝑣𝑎𝑔𝑢𝑒𝑛𝑒𝑠𝑠𝐼2 = −
1
4𝜋𝑟2]
44√1𝜋
44√1𝜋= 0
𝑎𝑛𝑒𝑟𝑔𝑦𝐼2 =1
4𝜋𝑟2]
√1𝜋
√1𝜋= 0 𝑎𝑛𝑒𝑟𝑔𝑦𝐼2 = −
1
4𝜋𝑟2]
√1𝜋
√1𝜋= 0
I3
𝑒𝑥𝑒𝑟𝑔𝑦𝐼3 =1
4𝜋𝑟2]
0
0
= 0 𝑒𝑥𝑒𝑟𝑔𝑦𝐼3 =1
4𝜋𝑟2]
0
√1𝜋= 0.25
𝑣𝑎𝑔𝑢𝑒𝑛𝑒𝑠𝑠𝐼3 =1
4𝜋𝑟2]
0
√1𝜋= 0.25 𝑣𝑎𝑔𝑢𝑒𝑛𝑒𝑠𝑠𝐼3 =
1
4𝜋𝑟2]
√1𝜋
√1𝜋= 0
𝑎𝑛𝑒𝑟𝑔𝑦𝐼3 =1
4𝜋𝑟2]
√1𝜋
√1𝜋= 0 𝑎𝑛𝑒𝑟𝑔𝑦𝐼3 =
1
4𝜋𝑟2]
√1𝜋
√1𝜋= 0
I4
𝑒𝑥𝑒𝑟𝑔𝑦𝐼4 =1
4𝜋𝑟2]
0
34√1𝜋= 0.14 𝑒𝑥𝑒𝑟𝑔𝑦𝐼4 =
1
4𝜋𝑟2]
0
√1𝜋= 0.25
𝑣𝑎𝑔𝑢𝑒𝑛𝑒𝑠𝑠𝐼4 =1
4𝜋𝑟2]
34√1𝜋
√1𝜋= 0.11 𝑣𝑎𝑔𝑢𝑒𝑛𝑒𝑠𝑠𝐼4 =
1
4𝜋𝑟2]
√1𝜋
√1𝜋= 0
𝑎𝑛𝑒𝑟𝑔𝑦𝐼4 =1
4𝜋𝑟2]
√1𝜋
√1𝜋= 0 𝑎𝑛𝑒𝑟𝑔𝑦𝐼4 =
1
4𝜋𝑟2]
√1𝜋
√1𝜋= 0
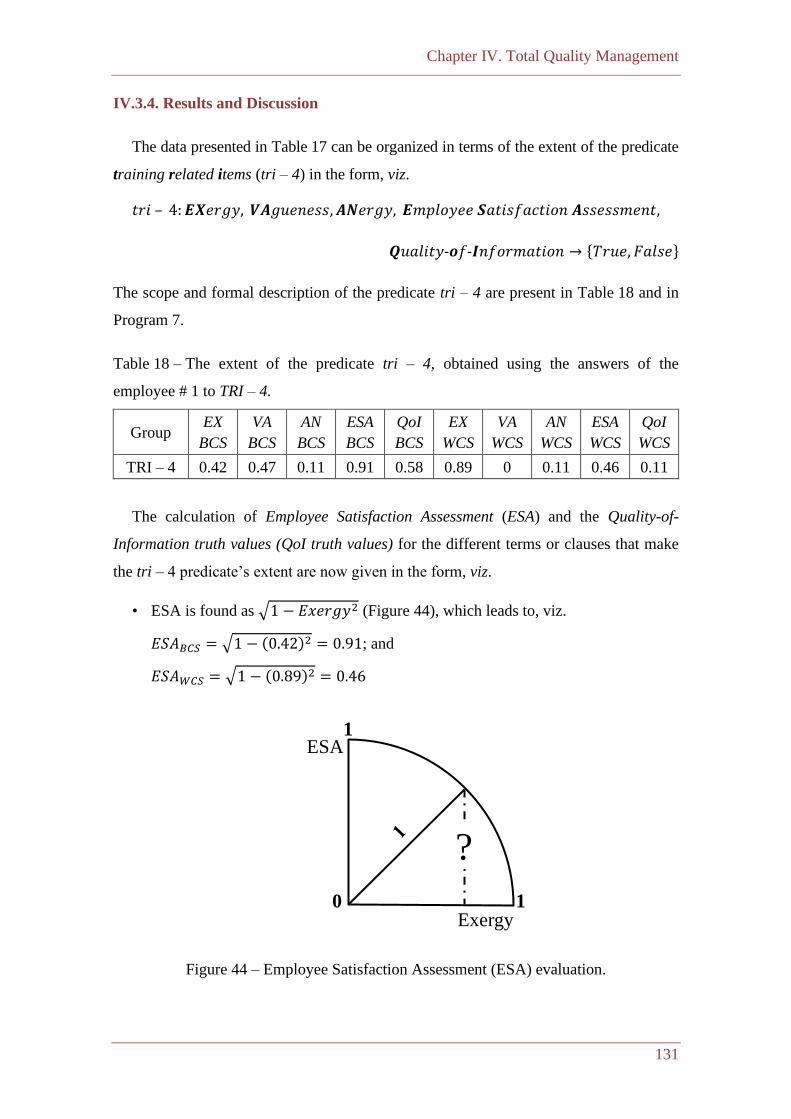
Chapter IV. Total Quality Management
131
IV.3.4. Results and Discussion
The data presented in Table 17 can be organized in terms of the extent of the predicate
training related items (tri – 4) in the form, viz.
𝑡𝑟𝑖 – 4: 𝑬𝑿𝑒𝑟𝑔𝑦, 𝑽𝑨𝑔𝑢𝑒𝑛𝑒𝑠𝑠, 𝑨𝑵𝑒𝑟𝑔𝑦, 𝑬𝑚𝑝𝑙𝑜𝑦𝑒𝑒 𝑺𝑎𝑡𝑖𝑠𝑓𝑎𝑐𝑡𝑖𝑜𝑛 𝑨𝑠𝑠𝑒𝑠𝑠𝑚𝑒𝑛𝑡,
𝑸𝑢𝑎𝑙𝑖𝑡𝑦-𝒐𝑓-𝑰𝑛𝑓𝑜𝑟𝑚𝑎𝑡𝑖𝑜𝑛 → {𝑇𝑟𝑢𝑒, 𝐹𝑎𝑙𝑠𝑒}
The scope and formal description of the predicate tri – 4 are present in Table 18 and in
Program 7.
Table 18 – The extent of the predicate tri – 4, obtained using the answers of the
employee # 1 to TRI – 4.
Group EX
BCS
VA
BCS
AN
BCS
ESA
BCS
QoI
BCS
EX
WCS
VA
WCS
AN
WCS
ESA
WCS
QoI
WCS
TRI – 4 0.42 0.47 0.11 0.91 0.58 0.89 0 0.11 0.46 0.11
The calculation of Employee Satisfaction Assessment (ESA) and the Quality-of-
Information truth values (QoI truth values) for the different terms or clauses that make
the tri – 4 predicate’s extent are now given in the form, viz.
• ESA is found as √1 − 𝐸𝑥𝑒𝑟𝑔𝑦2 (Figure 44), which leads to, viz.
𝐸𝑆𝐴𝐵𝐶𝑆 = √1 − (0.42)2 = 0.91; and
𝐸𝑆𝐴𝑊𝐶𝑆 = √1 − (0.89)2 = 0.46
Figure 44 – Employee Satisfaction Assessment (ESA) evaluation.
1
1ESA
Exergy
?
0

Chapter IV. Total Quality Management
132
• The QoI truth values are evaluated as (1 − 𝐸𝑥𝑒𝑟𝑔𝑦/𝐼𝑛𝑡𝑒𝑟𝑣𝑎𝑙 𝑙𝑒𝑛𝑔𝑡ℎ) (Neves et
al., 2019), leading to, viz.
𝑄𝑜𝐼 𝑡𝑟𝑢𝑡ℎ 𝑣𝑎𝑙𝑢𝑒𝑠𝐵𝐶𝑆 = 1 − 0.42 = 0.58
𝑄𝑜𝐼 𝑡𝑟𝑢𝑡ℎ 𝑣𝑎𝑙𝑢𝑒𝑠𝑊𝐶𝑆 = 1 − 0.89 = 0.11
{
¬ 𝑡𝑟𝑖 – 4 (𝐸𝑋, 𝑉𝐴, 𝐴𝑁, 𝐸𝑆𝐴, 𝑄𝑜𝐼 𝑡𝑟𝑢𝑡ℎ 𝑣𝑎𝑙𝑢𝑒𝑠)
← 𝑛𝑜𝑡 𝑡𝑟𝑖 – 4 (𝐸𝑋, 𝑉𝐴, 𝐴𝑁, 𝐸𝑆𝐴, 𝑄𝑜𝐼 𝑡𝑟𝑢𝑡ℎ 𝑣𝑎𝑙𝑢𝑒𝑠),
𝑛𝑜𝑡 𝑒𝑥𝑐𝑒𝑝𝑡𝑖𝑜𝑛𝑡𝑟𝑖 – 4 (𝐸𝑋, 𝑉𝐴, 𝐴𝑁, 𝐸𝑆𝐴, 𝑄𝑜𝐼 𝑡𝑟𝑢𝑡ℎ 𝑣𝑎𝑙𝑢𝑒𝑠)
𝑡𝑟𝑖 – 4 (0.42, 0.47, 0.11, 0.91, 0.58).
}
Program 7 – The extent of the tri – 4 predicate for the Best Case Scenario.
In addition to Table 16, Table 19 and Table 20 show employee # 1’s answers to the
RRI – 4 and CDRI – 4 groups.
Table 19 – Answers from employee # 1 to RRI – 4 and CDRI – 4.
Group Items
Scale
entropy increasing
tendency
entropy decreasing
tendency
(4) (3) (2) (1) (2) (3) (4) vagueness
RRI – 4
I5 ×
I6 × ×
I7 ×
I7 ×
CDRI – 4
I9 × ×
I10 ×
I11
I12 ×
Table 20 – The tri – 4, rri – 4 and cdri – 4 predicates’ scopes computed in conformity
with the answers of the employee # 1 to TRI – 4, RRI – 4 and CDRI – 4.
Groups EX
BCS
VA
BCS
AN
BCS
ESA
BCS
QoI
BCS
EX
WCS
VA
WCS
AN
WCS
ESA
WCS
QoI
WCS
TRI – 4 0.42 0.47 0.11 0.91 0.58 0.89 0 0.11 0.46 0.11
RRI – 4 0.45 0.26 0.19 0.89 0.55 0.81 0 0.19 0.59 0.19
CDRI – 4 0.40 0.30 0.30 0.92 0.60 0.70 0 0.30 0.71 0.30
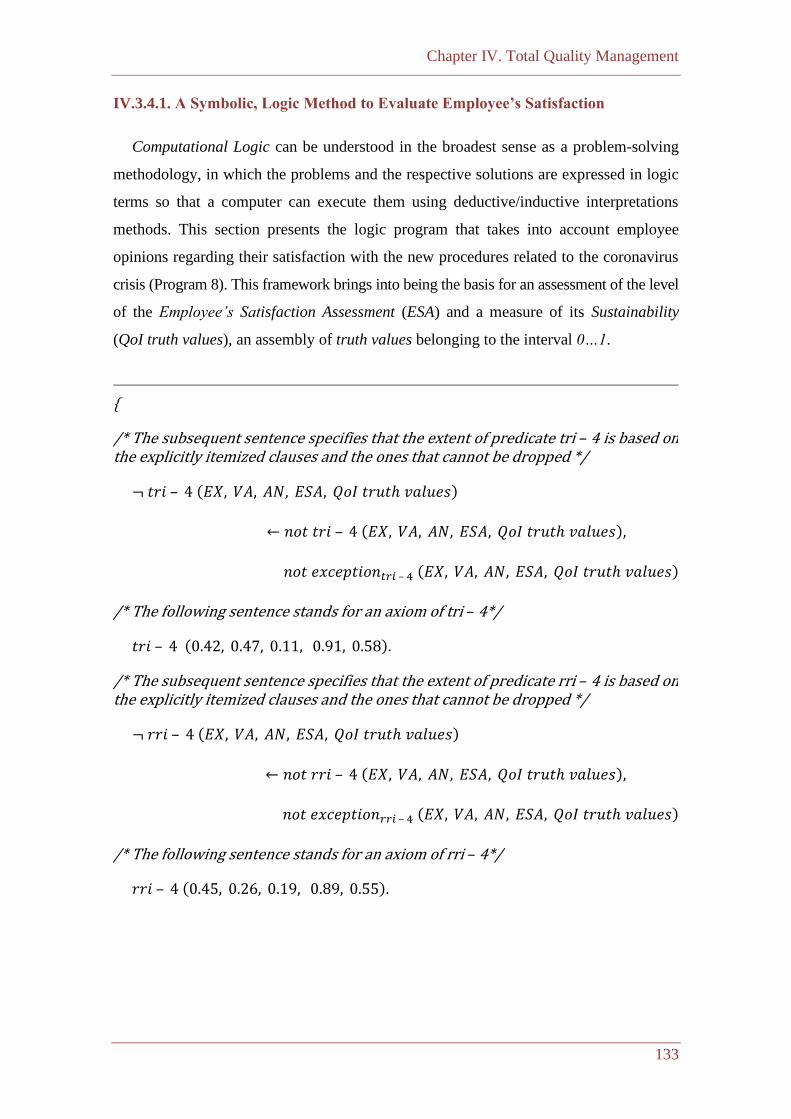
Chapter IV. Total Quality Management
133
IV.3.4.1. A Symbolic, Logic Method to Evaluate Employee’s Satisfaction
Computational Logic can be understood in the broadest sense as a problem-solving
methodology, in which the problems and the respective solutions are expressed in logic
terms so that a computer can execute them using deductive/inductive interpretations
methods. This section presents the logic program that takes into account employee
opinions regarding their satisfaction with the new procedures related to the coronavirus
crisis (Program 8). This framework brings into being the basis for an assessment of the level
of the Employee’s Satisfaction Assessment (ESA) and a measure of its Sustainability
(QoI truth values), an assembly of truth values belonging to the interval 0…1.
{
/* The subsequent sentence specifies that the extent of predicate tri – 4 is based on the explicitly itemized clauses and the ones that cannot be dropped */
¬ 𝑡𝑟𝑖 – 4 (𝐸𝑋, 𝑉𝐴, 𝐴𝑁, 𝐸𝑆𝐴, 𝑄𝑜𝐼 𝑡𝑟𝑢𝑡ℎ 𝑣𝑎𝑙𝑢𝑒𝑠)
← 𝑛𝑜𝑡 𝑡𝑟𝑖 – 4 (𝐸𝑋, 𝑉𝐴, 𝐴𝑁, 𝐸𝑆𝐴, 𝑄𝑜𝐼 𝑡𝑟𝑢𝑡ℎ 𝑣𝑎𝑙𝑢𝑒𝑠),
𝑛𝑜𝑡 𝑒𝑥𝑐𝑒𝑝𝑡𝑖𝑜𝑛𝑡𝑟𝑖 – 4 (𝐸𝑋, 𝑉𝐴, 𝐴𝑁, 𝐸𝑆𝐴, 𝑄𝑜𝐼 𝑡𝑟𝑢𝑡ℎ 𝑣𝑎𝑙𝑢𝑒𝑠)
/* The following sentence stands for an axiom of tri – 4*/
𝑡𝑟𝑖 – 4 (0.42, 0.47, 0.11, 0.91, 0.58).
/* The subsequent sentence specifies that the extent of predicate rri – 4 is based on the explicitly itemized clauses and the ones that cannot be dropped */
¬ 𝑟𝑟𝑖 – 4 (𝐸𝑋, 𝑉𝐴, 𝐴𝑁, 𝐸𝑆𝐴, 𝑄𝑜𝐼 𝑡𝑟𝑢𝑡ℎ 𝑣𝑎𝑙𝑢𝑒𝑠)
← 𝑛𝑜𝑡 𝑟𝑟𝑖 – 4 (𝐸𝑋, 𝑉𝐴, 𝐴𝑁, 𝐸𝑆𝐴, 𝑄𝑜𝐼 𝑡𝑟𝑢𝑡ℎ 𝑣𝑎𝑙𝑢𝑒𝑠),
𝑛𝑜𝑡 𝑒𝑥𝑐𝑒𝑝𝑡𝑖𝑜𝑛𝑟𝑟𝑖 – 4 (𝐸𝑋, 𝑉𝐴, 𝐴𝑁, 𝐸𝑆𝐴, 𝑄𝑜𝐼 𝑡𝑟𝑢𝑡ℎ 𝑣𝑎𝑙𝑢𝑒𝑠)
/* The following sentence stands for an axiom of rri – 4*/
𝑟𝑟𝑖 – 4 (0.45, 0.26, 0.19, 0.89, 0.55).
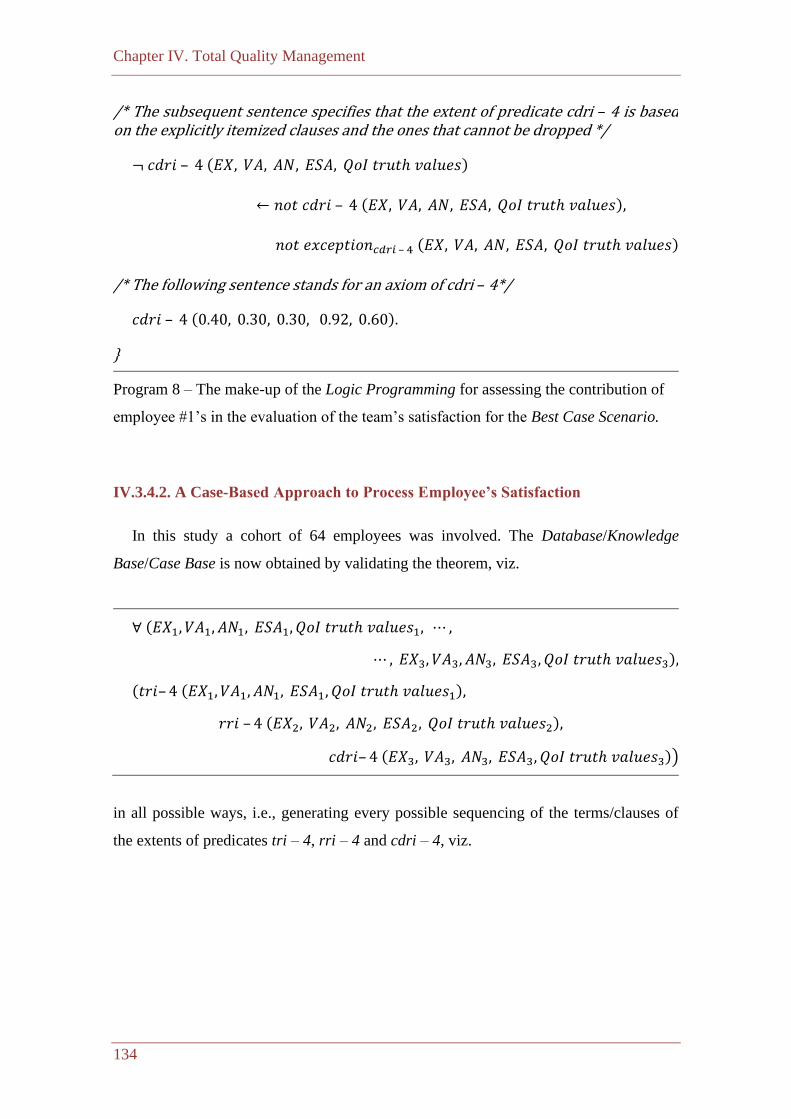
Chapter IV. Total Quality Management
134
/* The subsequent sentence specifies that the extent of predicate cdri – 4 is based on the explicitly itemized clauses and the ones that cannot be dropped */
¬ 𝑐𝑑𝑟𝑖 – 4 (𝐸𝑋, 𝑉𝐴, 𝐴𝑁, 𝐸𝑆𝐴, 𝑄𝑜𝐼 𝑡𝑟𝑢𝑡ℎ 𝑣𝑎𝑙𝑢𝑒𝑠)
← 𝑛𝑜𝑡 𝑐𝑑𝑟𝑖 – 4 (𝐸𝑋, 𝑉𝐴, 𝐴𝑁, 𝐸𝑆𝐴, 𝑄𝑜𝐼 𝑡𝑟𝑢𝑡ℎ 𝑣𝑎𝑙𝑢𝑒𝑠),
𝑛𝑜𝑡 𝑒𝑥𝑐𝑒𝑝𝑡𝑖𝑜𝑛𝑐𝑑𝑟𝑖 – 4 (𝐸𝑋, 𝑉𝐴, 𝐴𝑁, 𝐸𝑆𝐴, 𝑄𝑜𝐼 𝑡𝑟𝑢𝑡ℎ 𝑣𝑎𝑙𝑢𝑒𝑠)
/* The following sentence stands for an axiom of cdri – 4*/
𝑐𝑑𝑟𝑖 – 4 (0.40, 0.30, 0.30, 0.92, 0.60).
}
Program 8 – The make-up of the Logic Programming for assessing the contribution of
employee #1’s in the evaluation of the team’s satisfaction for the Best Case Scenario.
IV.3.4.2. A Case-Based Approach to Process Employee’s Satisfaction
In this study a cohort of 64 employees was involved. The Database/Knowledge
Base/Case Base is now obtained by validating the theorem, viz.
∀ (𝐸𝑋1, 𝑉𝐴1, 𝐴𝑁1, 𝐸𝑆𝐴1, 𝑄𝑜𝐼 𝑡𝑟𝑢𝑡ℎ 𝑣𝑎𝑙𝑢𝑒𝑠1, ⋯ ,
⋯ , 𝐸𝑋3, 𝑉𝐴3, 𝐴𝑁3, 𝐸𝑆𝐴3, 𝑄𝑜𝐼 𝑡𝑟𝑢𝑡ℎ 𝑣𝑎𝑙𝑢𝑒𝑠3),
(𝑡𝑟𝑖– 4 (𝐸𝑋1, 𝑉𝐴1, 𝐴𝑁1, 𝐸𝑆𝐴1, 𝑄𝑜𝐼 𝑡𝑟𝑢𝑡ℎ 𝑣𝑎𝑙𝑢𝑒𝑠1),
𝑟𝑟𝑖 – 4 (𝐸𝑋2, 𝑉𝐴2, 𝐴𝑁2, 𝐸𝑆𝐴2, 𝑄𝑜𝐼 𝑡𝑟𝑢𝑡ℎ 𝑣𝑎𝑙𝑢𝑒𝑠2),
𝑐𝑑𝑟𝑖– 4 (𝐸𝑋3, 𝑉𝐴3, 𝐴𝑁3, 𝐸𝑆𝐴3, 𝑄𝑜𝐼 𝑡𝑟𝑢𝑡ℎ 𝑣𝑎𝑙𝑢𝑒𝑠3))
in all possible ways, i.e., generating every possible sequencing of the terms/clauses of
the extents of predicates tri – 4, rri – 4 and cdri – 4, viz.
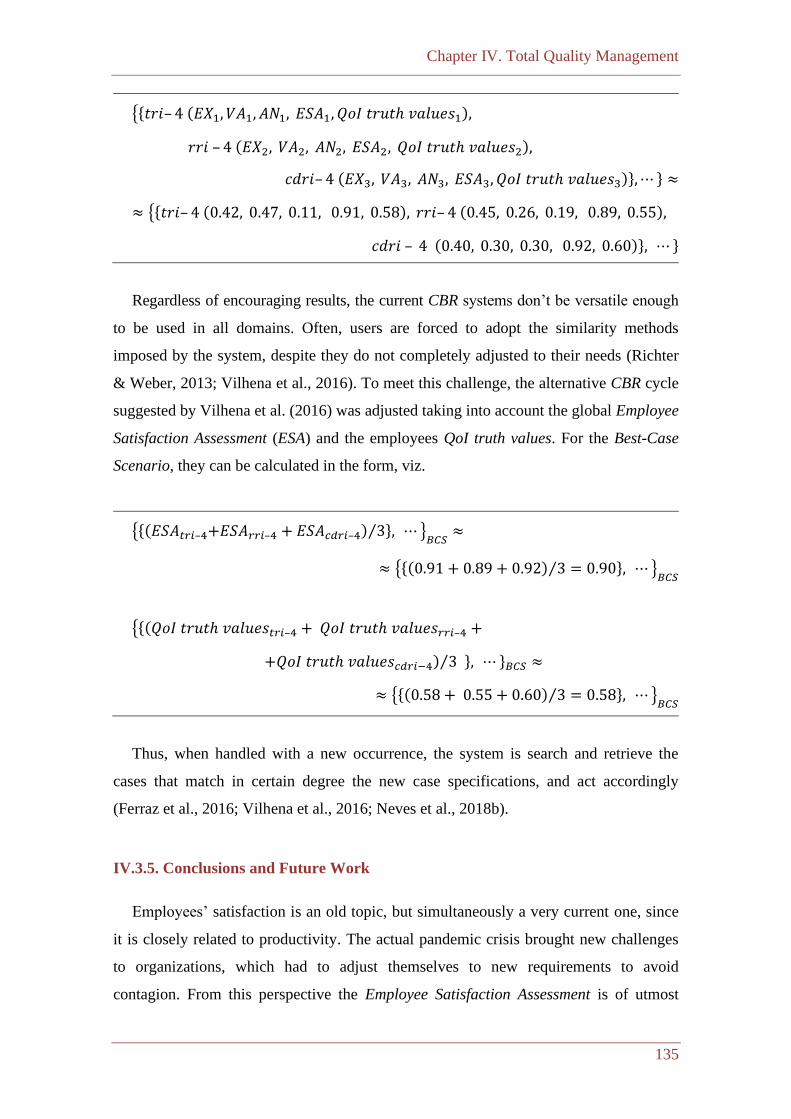
Chapter IV. Total Quality Management
135
{{𝑡𝑟𝑖– 4 (𝐸𝑋1, 𝑉𝐴1, 𝐴𝑁1, 𝐸𝑆𝐴1, 𝑄𝑜𝐼 𝑡𝑟𝑢𝑡ℎ 𝑣𝑎𝑙𝑢𝑒𝑠1),
𝑟𝑟𝑖 – 4 (𝐸𝑋2, 𝑉𝐴2, 𝐴𝑁2, 𝐸𝑆𝐴2, 𝑄𝑜𝐼 𝑡𝑟𝑢𝑡ℎ 𝑣𝑎𝑙𝑢𝑒𝑠2),
𝑐𝑑𝑟𝑖– 4 (𝐸𝑋3, 𝑉𝐴3, 𝐴𝑁3, 𝐸𝑆𝐴3, 𝑄𝑜𝐼 𝑡𝑟𝑢𝑡ℎ 𝑣𝑎𝑙𝑢𝑒𝑠3)},⋯ } ≈
≈ {{𝑡𝑟𝑖– 4 (0.42, 0.47, 0.11, 0.91, 0.58), 𝑟𝑟𝑖– 4 (0.45, 0.26, 0.19, 0.89, 0.55),
𝑐𝑑𝑟𝑖 – 4 (0.40, 0.30, 0.30, 0.92, 0.60)}, ⋯}
Regardless of encouraging results, the current CBR systems don’t be versatile enough
to be used in all domains. Often, users are forced to adopt the similarity methods
imposed by the system, despite they do not completely adjusted to their needs (Richter
& Weber, 2013; Vilhena et al., 2016). To meet this challenge, the alternative CBR cycle
suggested by Vilhena et al. (2016) was adjusted taking into account the global Employee
Satisfaction Assessment (ESA) and the employees QoI truth values. For the Best-Case
Scenario, they can be calculated in the form, viz.
{{(𝐸𝑆𝐴𝑡𝑟𝑖–4+𝐸𝑆𝐴𝑟𝑟𝑖–4 + 𝐸𝑆𝐴𝑐𝑑𝑟𝑖–4) 3⁄ }, ⋯}𝐵𝐶𝑆 ≈
≈ {{(0.91 + 0.89 + 0.92) 3⁄ = 0.90}, ⋯}𝐵𝐶𝑆
{{(𝑄𝑜𝐼 𝑡𝑟𝑢𝑡ℎ 𝑣𝑎𝑙𝑢𝑒𝑠𝑡𝑟𝑖–4 + 𝑄𝑜𝐼 𝑡𝑟𝑢𝑡ℎ 𝑣𝑎𝑙𝑢𝑒𝑠𝑟𝑟𝑖–4 +
+𝑄𝑜𝐼 𝑡𝑟𝑢𝑡ℎ 𝑣𝑎𝑙𝑢𝑒𝑠𝑐𝑑𝑟𝑖−4) 3⁄ }, ⋯}𝐵𝐶𝑆 ≈
≈ {{(0.58 + 0.55 + 0.60) 3⁄ = 0.58}, ⋯}𝐵𝐶𝑆
Thus, when handled with a new occurrence, the system is search and retrieve the
cases that match in certain degree the new case specifications, and act accordingly
(Ferraz et al., 2016; Vilhena et al., 2016; Neves et al., 2018b).
IV.3.5. Conclusions and Future Work
Employees’ satisfaction is an old topic, but simultaneously a very current one, since
it is closely related to productivity. The actual pandemic crisis brought new challenges
to organizations, which had to adjust themselves to new requirements to avoid
contagion. From this perspective the Employee Satisfaction Assessment is of utmost
Chapter IV. Total Quality Management
136
importance. Despite to be a challenging task, it is very hard to achieve since imply to
manipulate distinct variables with numerous and multifaceted interconnections among
them. In this study, the development of a Case-Based Reasoning model is presented, with
which the satisfaction of employees with the new work guidelines due to the actual
pandemic crisis is assessed. It takes the advantages of the synergies between Logic
Programming and the Laws of Thermodynamics for Knowledge Representation and
Reasoning, together with a computational approach that uses Case-Based Reasoning.
The model was tested with real data collected through questionnaires exhibiting an
overall accuracy of 85,9%. On the other hand, the weights of the case attributes can be
defined so that the bandwidth of the search space can be selected for comparable cases
at runtime. Regarding subsequent work, it will take new factors into account, namely
issues relating to occupational medicine or the organizational climate. In addition, the
study is to be extended to a larger sample in order to examine the role of additional
variables like age, gender or the academic and social training of employees on their
emotions and feelings.
Chapter IV. Total Quality Management
137
IV.4. Customers’ Satisfaction Assessment in Water Laboratories
IV.4.1. Introduction
In the last years, water quality issues as been framed in public health thematic. Thus,
it is in this context that the importance that water laboratories began to achieve in terms
of the issuance of credible and reliable results for the community should be understood.
Water quality is a set of physical, chemical, and biological characteristics defined according
to water use (e.g., human consumption, industrial and agricultural). The parameters
evaluated can reveal physical, chemical, and biological threats, when reaching values
higher than those established for a particular use. The concern with the evaluation of the
water quality parameters has been growing in Portugal and, more and more, there are
accredited laboratories. Accreditation by ISO/IEC 17025 aims to improve employee
performance in determining water quality parameters and help in complying with the
current Portuguese regulation (Decree-Law 152/2017, 2017), which establishes the drinking
water quality regime in accordance with European legislation, promotes human health
from the effect’s harmful of water contamination and ensures the availability of clean
and balanced water. According to this law the water laboratories are required to have
accreditation in accordance with ISO/IEC 17025 (ISO/IEC 17025, 2017). In other words,
all Portuguese laboratories that perform water analyses must work in accordance with
internationally approved procedures and use validated methods. In fact, quality is the
main factor that differentiates organizations, being considered a fundamental aspect that
can influence the survival of the organization in an increasingly competitive market. Quality
defines the service level of the organization and determines customer satisfaction.
IV.4.1.1. Quality Concept
The quality’s perception is inherent in humans and extends us to different politic
domains, including the most common and automatic actions in our daily life (Christian
& Drilling, 2010). Quality is the set of attributes and characteristics of a product or
service that affect the ability to meet a person’s needs. If the main characteristic of
quality is, on the one hand, the continuous improvement of company processes and, on
the other hand, the intention to satisfy the customer and everyone involved in the
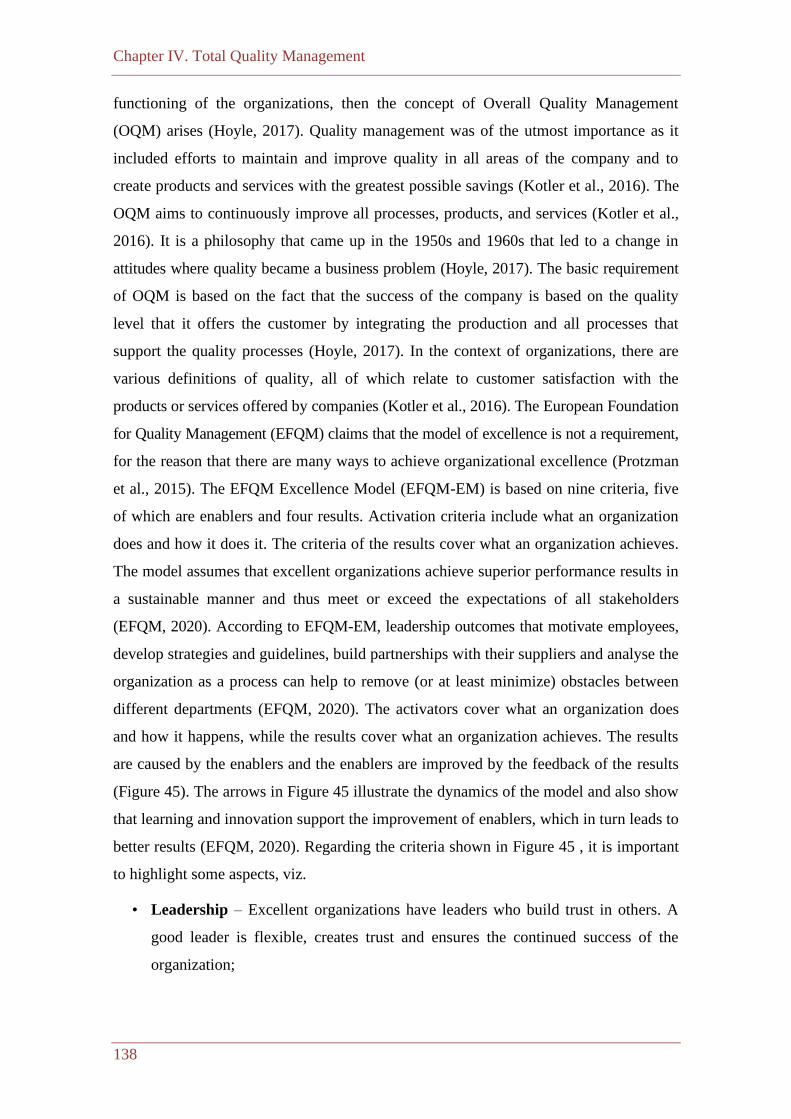
Chapter IV. Total Quality Management
138
functioning of the organizations, then the concept of Overall Quality Management
(OQM) arises (Hoyle, 2017). Quality management was of the utmost importance as it
included efforts to maintain and improve quality in all areas of the company and to
create products and services with the greatest possible savings (Kotler et al., 2016). The
OQM aims to continuously improve all processes, products, and services (Kotler et al.,
2016). It is a philosophy that came up in the 1950s and 1960s that led to a change in
attitudes where quality became a business problem (Hoyle, 2017). The basic requirement
of OQM is based on the fact that the success of the company is based on the quality
level that it offers the customer by integrating the production and all processes that
support the quality processes (Hoyle, 2017). In the context of organizations, there are
various definitions of quality, all of which relate to customer satisfaction with the
products or services offered by companies (Kotler et al., 2016). The European Foundation
for Quality Management (EFQM) claims that the model of excellence is not a requirement,
for the reason that there are many ways to achieve organizational excellence (Protzman
et al., 2015). The EFQM Excellence Model (EFQM-EM) is based on nine criteria, five
of which are enablers and four results. Activation criteria include what an organization
does and how it does it. The criteria of the results cover what an organization achieves.
The model assumes that excellent organizations achieve superior performance results in
a sustainable manner and thus meet or exceed the expectations of all stakeholders
(EFQM, 2020). According to EFQM-EM, leadership outcomes that motivate employees,
develop strategies and guidelines, build partnerships with their suppliers and analyse the
organization as a process can help to remove (or at least minimize) obstacles between
different departments (EFQM, 2020). The activators cover what an organization does
and how it happens, while the results cover what an organization achieves. The results
are caused by the enablers and the enablers are improved by the feedback of the results
(Figure 45). The arrows in Figure 45 illustrate the dynamics of the model and also show
that learning and innovation support the improvement of enablers, which in turn leads to
better results (EFQM, 2020). Regarding the criteria shown in Figure 45 , it is important
to highlight some aspects, viz.
• Leadership – Excellent organizations have leaders who build trust in others. A
good leader is flexible, creates trust and ensures the continued success of the
organization;

Chapter IV. Total Quality Management
139
Figure 45 – The European Foundation for Quality Management Excellence Model.
• Strategy – Excellent organizations implement their mission and vision by
developing a strategy that is geared towards the interest groups. The guidelines,
plans, goals, and processes are developed and implemented considering the
previously defined strategy. Companies that want excellent service appreciate people
and create a culture that enables them to achieve personal and organizational goals
that are mutually beneficial. This type of organization develops the skills of the
employees and promotes fairness and equality through communication, reward,
and recognition. It also motivates and develops a very beneficial compromise for
the organization; and
• Partnerships – Excellent organizations build good partnerships with suppliers
and have good resources to ensure that they work properly. Good management of
processes, products and services enables the generation of added value for
Processes, Products& Services
Partnerships & Resources
Strategy
People
Leadership
Business & Results
Society Results
Customer Results
People Results
Results
Learning, Creativity
andInnovation
Enablers
Chapter IV. Total Quality Management
140
customers and other stakeholders. Companies that focus on their customers can
achieve excellent results and respond to customers’ needs and expectations. In
addition, focusing on the company’s employees is critical to get good results.
Only through measures that make it possible to exceed the needs and expectations
of stakeholders can an organization be viewed as effective and achieve good
results both in society and in the economy itself.
IV.4.1.2. Accreditation
Portuguese organizations, as well as their international counterparts, seek success in
an increasingly globalized market. One of the most efficient ways to achieve that goal is
undoubtedly the accreditation. The definition of accreditation according to ISO/IEC 17000
standard is the “claim of third party concerning a body for conformity assessment,
which is a formal recognition of their competence to carry out specific activities of
conformity assessment” (ISO 17000, 2020). Accreditation is the formal recognition by an
independent official entity that an organization has technical competence to exercise, with
credibility, the activities of conformity assessment (e.g., calibration, testing, certification
and/or inspection), in accordance with certain requirements (ISO 17000, 2020). The
ISO/IEC 17025 defines a harmonized methodology, specifying the general requirements
for the competence, impartiality and consistent operation of laboratories and it is
applicable to all organizations performing laboratory activities. Indeed, accreditation to
ISO/IEC 17025 allows recognizing the competence of the laboratories and offers
competitive advantages in submitting proposals to clients that require independent and
reliable laboratories. Any calibration or test certificate issued by a laboratory that is
accredited by an accreditation body is accepted in any country (ISO 17025, 2017).
According to Squirrell (2001) this is one of the main advantages of accreditation.
Beyond confirming that the calibration/testing is based on written procedures,
accreditation also attests the technical competence to perform the respective calibration
(Jimenez et al., 2015). For laboratories interested in demonstrating their technical
competence supported by a quality system, the appropriate reference is the ISO/IEC
17025 (ISO 17025, 2017).
Chapter IV. Total Quality Management
141
IV.4.1.3. Study Aims
Assessing customer satisfaction is critical for companies looking to gain competitive
advantage in the market. Therefore, customer satisfaction is tied to the standards that
apply to different areas of activity, including chemical analysis laboratories. The present
work aims to assess the satisfaction of the customers of water analysis laboratories on
the basis of parameters that influence the management requirements and the technical
requirements of the ISO/IEC 17025 standard. To achieve this general goal, artificial
intelligence methods and techniques have been used to develop a decision support system.
for this reason, this article introduces a formal method of customer satisfaction assessment
that is based on a logical programming approach for knowledge representation and
reasoning (Neves, 1984; Neves et al., 2019; Fernandes et al., 2020c) leading to a
computational system geared towards artificial neural networks (Haykin, 2009; Vicente
et al., 2012b).
IV.4.2. Related Work
In the literature, employee satisfaction studies are more common than customer
satisfaction studies. These were carried out in areas such as health (Allen 2013; Boev et
al., 2015; Borishad et al., 2018; Liu et al., 2019), tourism (Francesco et al., 2019; Gerdt
et al., 2019) and call centers (Walsh et al., 2012; Chicu et al., 2019). To our knowledge,
no customer satisfaction studies have been published in water laboratories. Regarding
healthcare, Boev et al. (2015) examined the relationship between occupational satisfaction
in care and health-related infections in intensive care unit in adults. Wage inequality,
dissatisfaction with the salary and lack of recognition are the most important aspects.
Allen (2013) examined the effects of the introduction of a quality management system
based on ISO 15189 on the improvement of security and customer satisfaction. The
author emphasized that the implementation of such systems led to an improvement in
quality and an increase in customer security. Borishad et al. (2018) examined the
relationship between customer experience and customer satisfaction in four private
hospitals in Nigeria. The data were recorded on a questionnaire with a 5-point Likert
scale and a total of 365 participants were registered. The authors developed a model that
describes customer satisfaction as a function of the reliability of services, the correct
diagnosis of diseases, the correct treatment of diseases, the effectiveness of verbal
Chapter IV. Total Quality Management
142
communication and non-verbal communication. The model was able to explain 43.1%
of the observed variance in customer satisfaction (Borishad et al., 2018). Liu et al.
(2019) examined the relationship between workplace violence and patient safety. A
questionnaire was conducted in 23 Chinese hospitals in Guangdong Province, with 1502
nurses participating. The data were collected between December 2013 and August 2014.
According to this study, workplace violence was associated with a higher incidence of
burnout, lower job satisfaction and lower patient safety. The authors also found strong
associations between nursing staff burnout and less patient safety. Conversely, a higher
level of job satisfaction among nursing staff was directly linked to greater patient safety.
The authors also point out that burnout and job satisfaction among nurses played a
mediating role in workplace violence and patient safety (Liu et al., 2019).
IV.4.3. Materials and Methods
IV.4.3.1. Place of Study
This study was carried out in the Water Laboratory of Santiago do Cacém
Municipality, located in southern Portugal. This laboratory is accredited according to
the ISO/IEC 17025 standard. It is known for its technical know-how in sampling and
analytical tests. The water laboratory offers services for the collection, transport,
physical-chemical and microbiological analysis of samples of treated and non-treated
water (e.g. wells, boreholes, pool water and whirlpools) for private and municipalities
customers. The laboratory team consists of 1 laboratory manager, 1 quality manager, 1
administration employee, 4 sample technicians, 5 microbiology technicians, and 6
physic-chemical technicians.
IV.4.3.2. Participants
This study included 253 participants (lab customers) aged between 23 and 76 with an
average age of 43. The gender distribution was 46% for men and 54% for women.
87.6% of the participants came from rural areas, 12.4% from urban ones.

Chapter IV. Total Quality Management
143
IV.4.3.3. Data Collection
A versatile data collection tool was used to achieve the previously defined goals
(DeKetele & Roegiers, 2016; Cohen et al., 2017). Considering the advantages and
disadvantages of the possible techniques (McMillan & Schumacher, 2009), the survey
was selected using a questionnaire. The reasons for this choice are related to the fact that
this tool has a clearly defined structure and makes it possible to convert the qualitative
information provided by the respondents into quantitative one. For this study, a customer
satisfaction questionnaire was created that was used for a cohort of 253 customers. The
questionnaire was divided into three sections, the first of which contained general
questions (e.g. age, gender, location, academic qualifications, and type of acquaintance
with the laboratory). The second contains statements on the services provided, namely
customer service, the quality of the services, documentation of the support and handling
complaints. Finally, in the third section, respondents are asked to express their
worldwide satisfaction with the services provided by the laboratory. In the first part of
the questionnaire the answers are descriptive, while in the others the Likert scale was
used with four levels, i.e., very dissatisfied, slightly dissatisfied, satisfied and very
satisfied (section IV.4.6). The questionnaire is validated according to the rules of Bell
(2010). Therefore, the questionnaire was evaluated by a group of experts (i.e., a group of
accountants) who suggested some corrections. After an expert analysis, the questionnaire
was modified and applied to a limited group of customers who were not included in the
sample to assess its validity and identify difficulties in interpreting the questionnaire.
The response rate was 86.1% (253 inquiries were received in 294 endorsed).
IV.4.3.4. Qualitative Data Processing
Aiming the conversion of the qualitative information (collected through the
questionnaire) into a quantitative one, the method proposed by Fernandes et al. (2016b)
was followed. According to this method a set of n issues regarding a particular subject is
itemized into a unitary area circle split into n slices, where the marks in the axis
correspond to each one of the possible answers, as described in the section IV.4.4.3.
Chapter IV. Total Quality Management
144
IV.4.3.5. Artificial Neural Networks
The software used to implement ANNs was the Waikato Environment for Knowledge
Analysis (WEKA), while maintaining the standard software parameters (Hall et al.,
2009; Frank et al., 2016). Aiming to guarantee statistical significance of the results, 20
experiments were applied in all tests. In each simulation, the database was randomly
split into two mutually exclusive partitions, i.e., the training set (with two thirds of the
cases) and the test set (made up of the remaining examples).
IV.4.3.6. Ethical Aspects of the Study
The respondents took notice of the goals of the questionnaire and participated
voluntarily, without any pressure or coercion. The study was conducted in compliance
with the relevant laws and institutional guidelines and was approved by the quality
manager of the Water Laboratory of Santiago do Cacém Municipality. Furthermore, the
participants gave an informed consent to participate in the study.
IV.4.4. Results and Discussion
IV.4.4.1. Sample Characterization
Respondents’ age was split into age groups as shown in Figure 46A (i.e., less than 20
years old, 20-30, 31-50, 51-70 and higher than 70 years old). 71% of participants are
lesser than 50 years old while 29% are higher than 51 years old (Figure 46A). On the
way to an academic qualification, 34% of the cohort stated to have basic education, 39%
declared to finish secondary education, 20% affirmed to have a degree and 7% declared
to have post graduate education (Figure 46B). Regarding the way customers became
familiar with the laboratory, 49% declared that got acquainted through the internet (i.e.
web or social networks), 16% said they discovered the laboratory on site, 15% declared
to be regular customers and 13% affirmed that knew the lab through close people
(Figure 46C).

Chapter IV. Total Quality Management
145
Figure 46 – Sample characterization in terms of age groups (a), academic qualifications
(b) and how the customers get acquainted with the laboratory (c).
IV.4.4.2. Answer Frequency Analysis
Figure 47 shows the results of the second part of the questionnaire, in which the
respondents expressed their opinion on the statements on two factors, i.e., customer service
and quality of service provided. The graphics show the frequency of reactions to the
individual factors. Statements S1 to S5 relate to the customer service factor, while
statements S6 to S10 relate to the quality of the service provided. Regarding the customer
service factor, the analysis of the results shows that the vast majority of respondents
(between 83% and 93%) say they are satisfied or very satisfied. However, more than
20% of the respondents were very satisfied with the availability of services (S3), the
effectiveness of answering questions (S4) and the clarity of the answers to questions
(S5). Conversely, 7.5% of those surveyed stated that they were very dissatisfied with the
clarity of the answers to questions (S5). In relation to the other statements, only a small
percentage, less than 4% of the participants, stated that they were very dissatisfied.
Regarding the quality of the services provided, the analysis of the results shows that the
vast majority of respondents, who are between 83.5% and 96%, think they are satisfied
or very satisfied. The statements on the number and type of available tests (S7), samples
(S6) and appropriateness of delivery times (S9) gave more than 90% of the positive
answers (96%, 94.5% and 90%). In contrast, the statement with the highest percentage
of the most negative answer (7%) relates to the reliability of the results (S8).
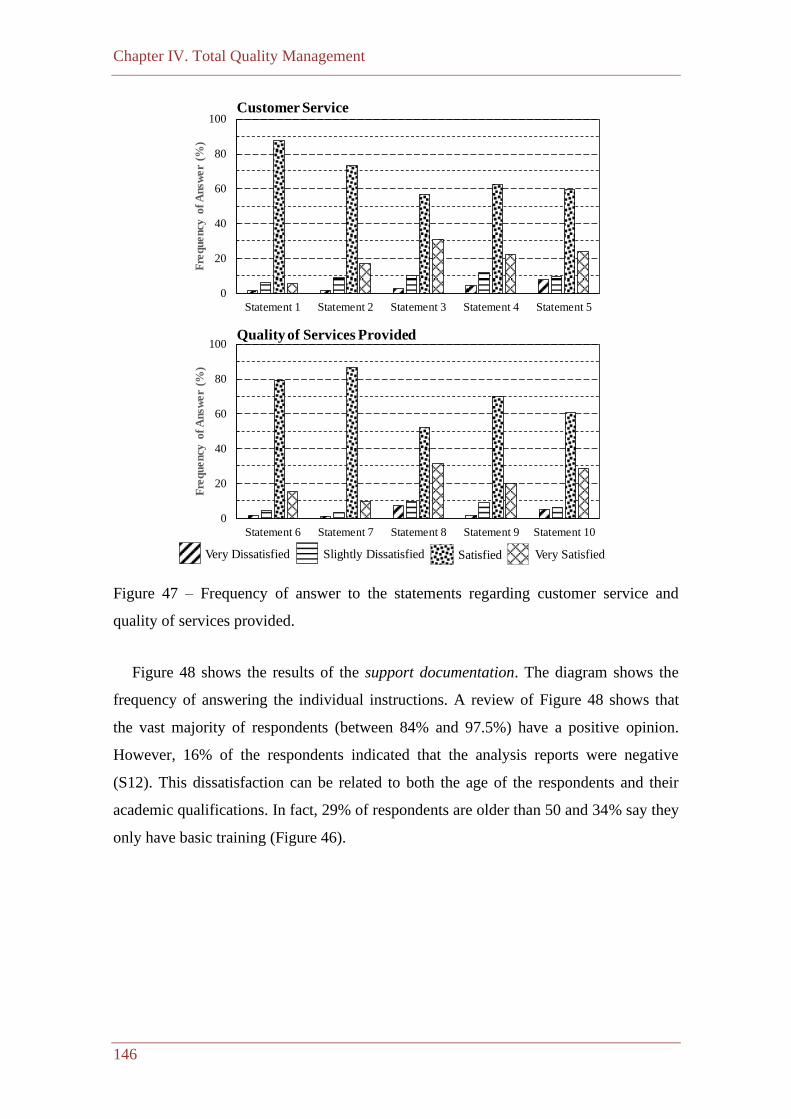
Chapter IV. Total Quality Management
146
Figure 47 – Frequency of answer to the statements regarding customer service and
quality of services provided.
Figure 48 shows the results of the support documentation. The diagram shows the
frequency of answering the individual instructions. A review of Figure 48 shows that
the vast majority of respondents (between 84% and 97.5%) have a positive opinion.
However, 16% of the respondents indicated that the analysis reports were negative
(S12). This dissatisfaction can be related to both the age of the respondents and their
academic qualifications. In fact, 29% of respondents are older than 50 and 34% say they
only have basic training (Figure 46).
Customer Service
Quality of Services Provided
0
20
40
60
80
100
Statement 1 Statement 2 Statement 3 Statement 4 Statement 5
Fre
qu
en
cy o
f A
nsw
er
(%)
0
20
40
60
80
100
Statement 6 Statement 7 Statement 8 Statement 9 Statement 10
Fre
qu
en
cy o
f A
nsw
er
(%)
Very Dissatisfied Slightly Dissatisfied Satisfied Very Satisfied
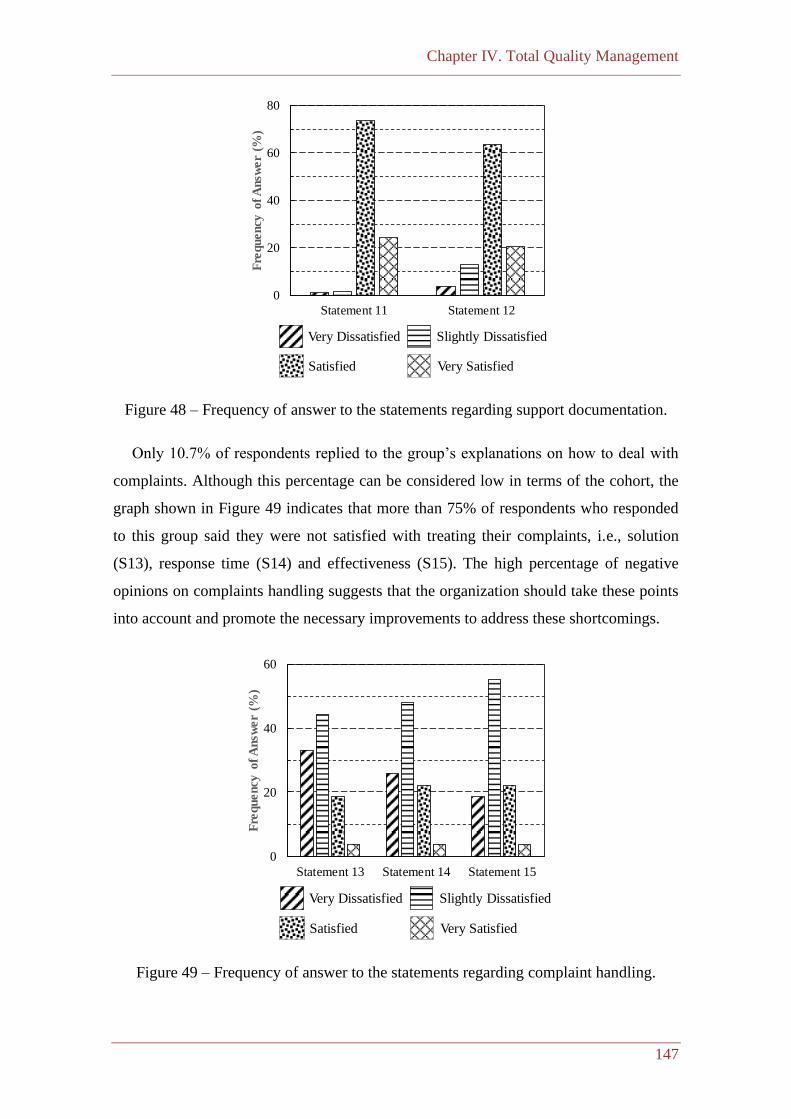
Chapter IV. Total Quality Management
147
Figure 48 – Frequency of answer to the statements regarding support documentation.
Only 10.7% of respondents replied to the group’s explanations on how to deal with
complaints. Although this percentage can be considered low in terms of the cohort, the
graph shown in Figure 49 indicates that more than 75% of respondents who responded
to this group said they were not satisfied with treating their complaints, i.e., solution
(S13), response time (S14) and effectiveness (S15). The high percentage of negative
opinions on complaints handling suggests that the organization should take these points
into account and promote the necessary improvements to address these shortcomings.
Figure 49 – Frequency of answer to the statements regarding complaint handling.
0
20
40
60
80
Statement 11 Statement 12
Fre
quency
of
Answ
er
(%)
Very Dissatisfied Slightly Dissatisfied
Satisfied Very Satisfied
0
20
40
60
Statement 13 Statement 14 Statement 15
Fre
qu
en
cy o
f A
nsw
er
(%)
Very Dissatisfied Slightly Dissatisfied
Satisfied Very Satisfied
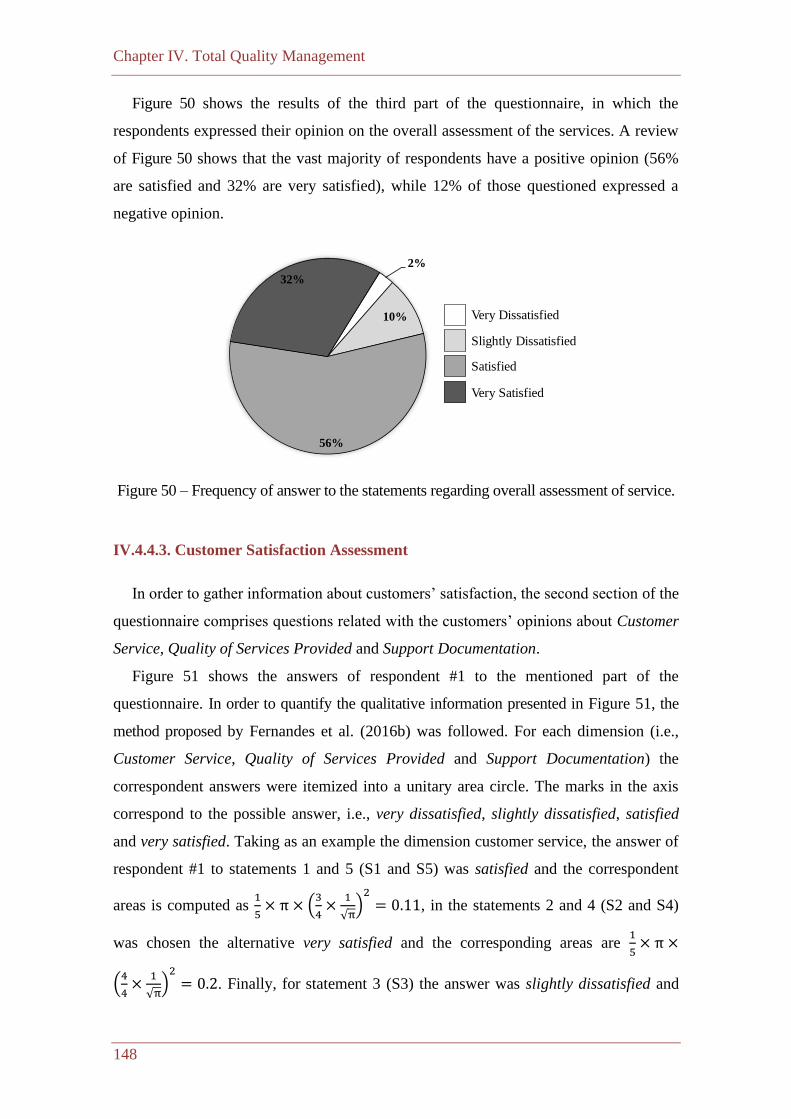
Chapter IV. Total Quality Management
148
Figure 50 shows the results of the third part of the questionnaire, in which the
respondents expressed their opinion on the overall assessment of the services. A review
of Figure 50 shows that the vast majority of respondents have a positive opinion (56%
are satisfied and 32% are very satisfied), while 12% of those questioned expressed a
negative opinion.
Figure 50 – Frequency of answer to the statements regarding overall assessment of service.
IV.4.4.3. Customer Satisfaction Assessment
In order to gather information about customers’ satisfaction, the second section of the
questionnaire comprises questions related with the customers’ opinions about Customer
Service, Quality of Services Provided and Support Documentation.
Figure 51 shows the answers of respondent #1 to the mentioned part of the
questionnaire. In order to quantify the qualitative information presented in Figure 51, the
method proposed by Fernandes et al. (2016b) was followed. For each dimension (i.e.,
Customer Service, Quality of Services Provided and Support Documentation) the
correspondent answers were itemized into a unitary area circle. The marks in the axis
correspond to the possible answer, i.e., very dissatisfied, slightly dissatisfied, satisfied
and very satisfied. Taking as an example the dimension customer service, the answer of
respondent #1 to statements 1 and 5 (S1 and S5) was satisfied and the correspondent
areas is computed as 1
5× π × (
3
4×
1
√π)2
= 0.11, in the statements 2 and 4 (S2 and S4)
was chosen the alternative very satisfied and the corresponding areas are 1
5× π ×
(4
4×
1
√π)2
= 0.2. Finally, for statement 3 (S3) the answer was slightly dissatisfied and
2%
10%
56%
32%
Very Dissatisfied
Slightly Dissatisfied
Satisfied
Very Satisfied
Very Dissatisfied
Slightly Dissatisfied
Satisfied
Very Satisfied
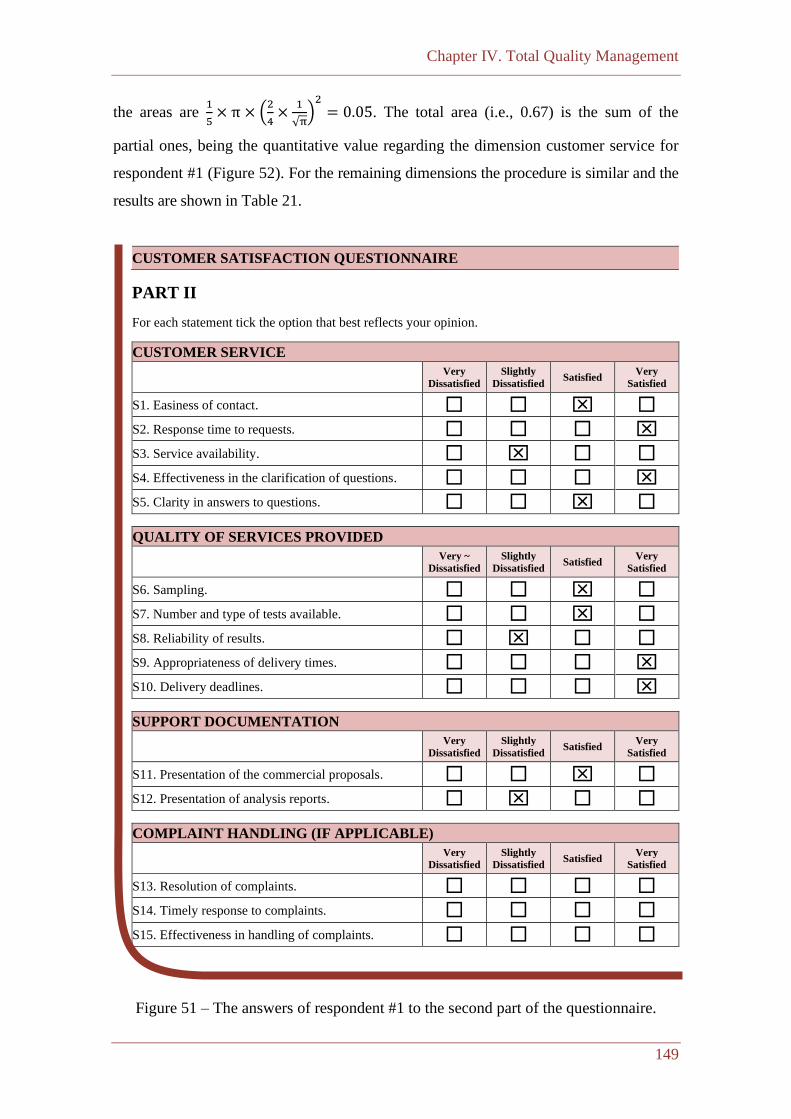
Chapter IV. Total Quality Management
149
the areas are 1
5× π × (
2
4×
1
√π)2
= 0.05. The total area (i.e., 0.67) is the sum of the
partial ones, being the quantitative value regarding the dimension customer service for
respondent #1 (Figure 52). For the remaining dimensions the procedure is similar and the
results are shown in Table 21.
CUSTOMER SATISFACTION QUESTIONNAIRE
PART II
For each statement tick the option that best reflects your opinion.
CUSTOMER SERVICE
Very
Dissatisfied
Slightly
Dissatisfied Satisfied
Very
Satisfied
S1. Easiness of contact.
S2. Response time to requests.
S3. Service availability.
S4. Effectiveness in the clarification of questions.
S5. Clarity in answers to questions.
QUALITY OF SERVICES PROVIDED
Very ~
Dissatisfied
Slightly
Dissatisfied Satisfied
Very
Satisfied
S6. Sampling.
S7. Number and type of tests available.
S8. Reliability of results.
S9. Appropriateness of delivery times.
S10. Delivery deadlines.
SUPPORT DOCUMENTATION
Very
Dissatisfied
Slightly
Dissatisfied Satisfied
Very
Satisfied
S11. Presentation of the commercial proposals.
S12. Presentation of analysis reports.
COMPLAINT HANDLING (IF APPLICABLE)
Very
Dissatisfied
Slightly
Dissatisfied Satisfied
Very
Satisfied
S13. Resolution of complaints.
S14. Timely response to complaints.
S15. Effectiveness in handling of complaints.
Figure 51 – The answers of respondent #1 to the second part of the questionnaire.
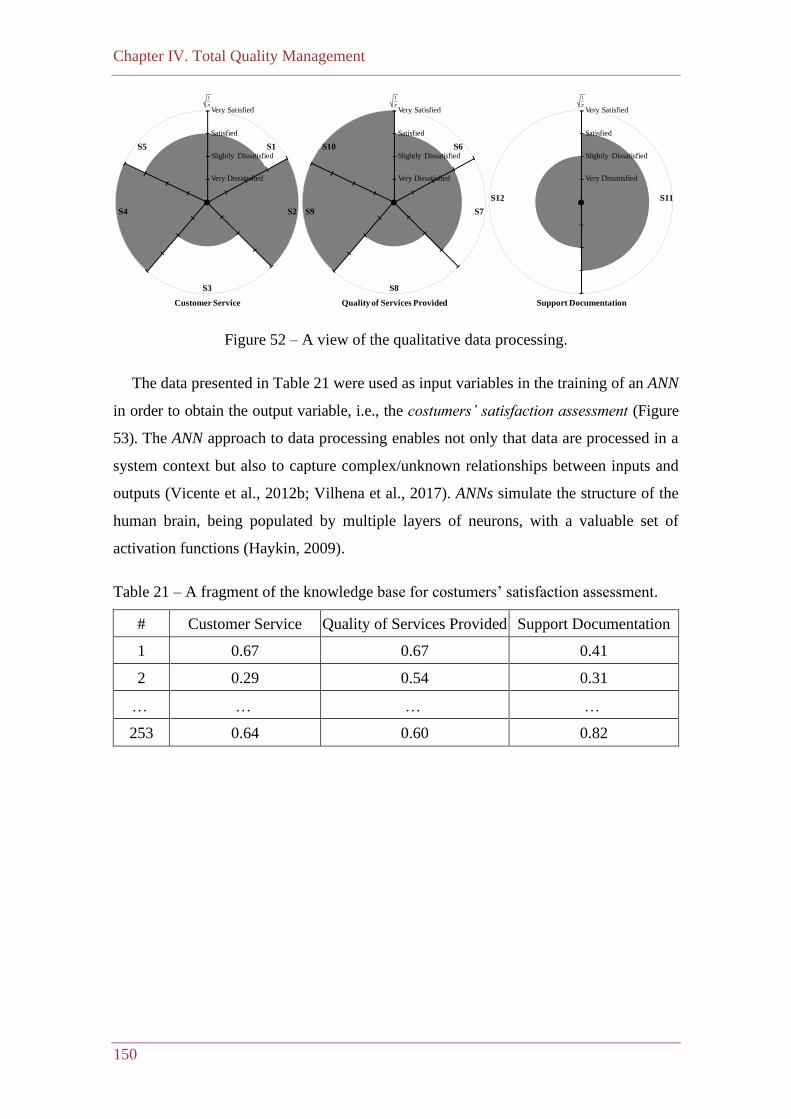
Chapter IV. Total Quality Management
150
Figure 52 – A view of the qualitative data processing.
The data presented in Table 21 were used as input variables in the training of an ANN
in order to obtain the output variable, i.e., the costumers’ satisfaction assessment (Figure
53). The ANN approach to data processing enables not only that data are processed in a
system context but also to capture complex/unknown relationships between inputs and
outputs (Vicente et al., 2012b; Vilhena et al., 2017). ANNs simulate the structure of the
human brain, being populated by multiple layers of neurons, with a valuable set of
activation functions (Haykin, 2009).
Table 21 – A fragment of the knowledge base for costumers’ satisfaction assessment.
# Customer Service Quality of Services Provided Support Documentation
1 0.67 0.67 0.41
2 0.29 0.54 0.31
253 0.64 0.60 0.82
S6S10
S8
1
Very Dissatisfied
Slightly Dissatisfied
Satisfied
Very Satisfied
Quality of Services Provided
S7S9
1
Very Dissatisfied
Slightly Dissatisfied
Satisfied
Very Satisfied
Support Documentation
S11S12
S1S5
S3
1
Very Dissatisfied
Slightly Dissatisfied
Satisfied
Very Satisfied
Customer Service
S2S4
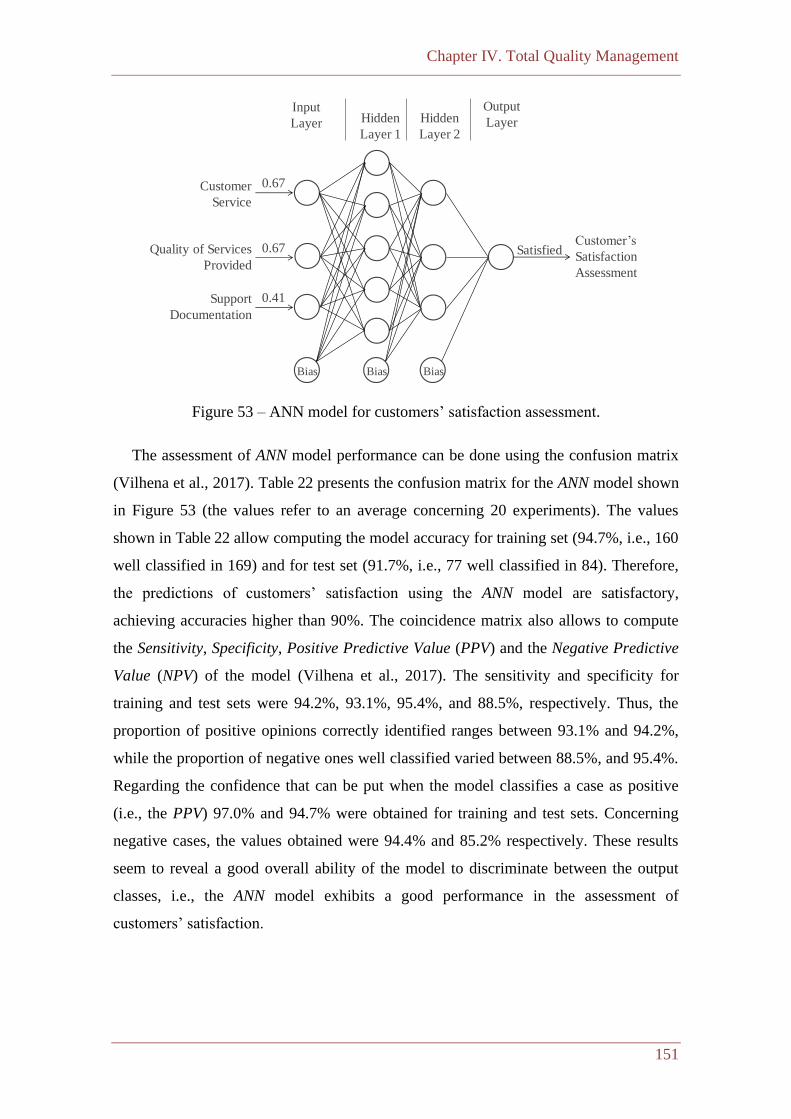
Chapter IV. Total Quality Management
151
Figure 53 – ANN model for customers’ satisfaction assessment.
The assessment of ANN model performance can be done using the confusion matrix
(Vilhena et al., 2017). Table 22 presents the confusion matrix for the ANN model shown
in Figure 53 (the values refer to an average concerning 20 experiments). The values
shown in Table 22 allow computing the model accuracy for training set (94.7%, i.e., 160
well classified in 169) and for test set (91.7%, i.e., 77 well classified in 84). Therefore,
the predictions of customers’ satisfaction using the ANN model are satisfactory,
achieving accuracies higher than 90%. The coincidence matrix also allows to compute
the Sensitivity, Specificity, Positive Predictive Value (PPV) and the Negative Predictive
Value (NPV) of the model (Vilhena et al., 2017). The sensitivity and specificity for
training and test sets were 94.2%, 93.1%, 95.4%, and 88.5%, respectively. Thus, the
proportion of positive opinions correctly identified ranges between 93.1% and 94.2%,
while the proportion of negative ones well classified varied between 88.5%, and 95.4%.
Regarding the confidence that can be put when the model classifies a case as positive
(i.e., the PPV) 97.0% and 94.7% were obtained for training and test sets. Concerning
negative cases, the values obtained were 94.4% and 85.2% respectively. These results
seem to reveal a good overall ability of the model to discriminate between the output
classes, i.e., the ANN model exhibits a good performance in the assessment of
customers’ satisfaction.
Input
Layer Hidden
Layer 1
Hidden
Layer 2
Output
Layer
BiasBiasBias
0.67
0.41
0.67
Customer
Service
Quality of Services
Provided
Support
Documentation
Customer’s
Satisfaction
Assessment
Satisfied
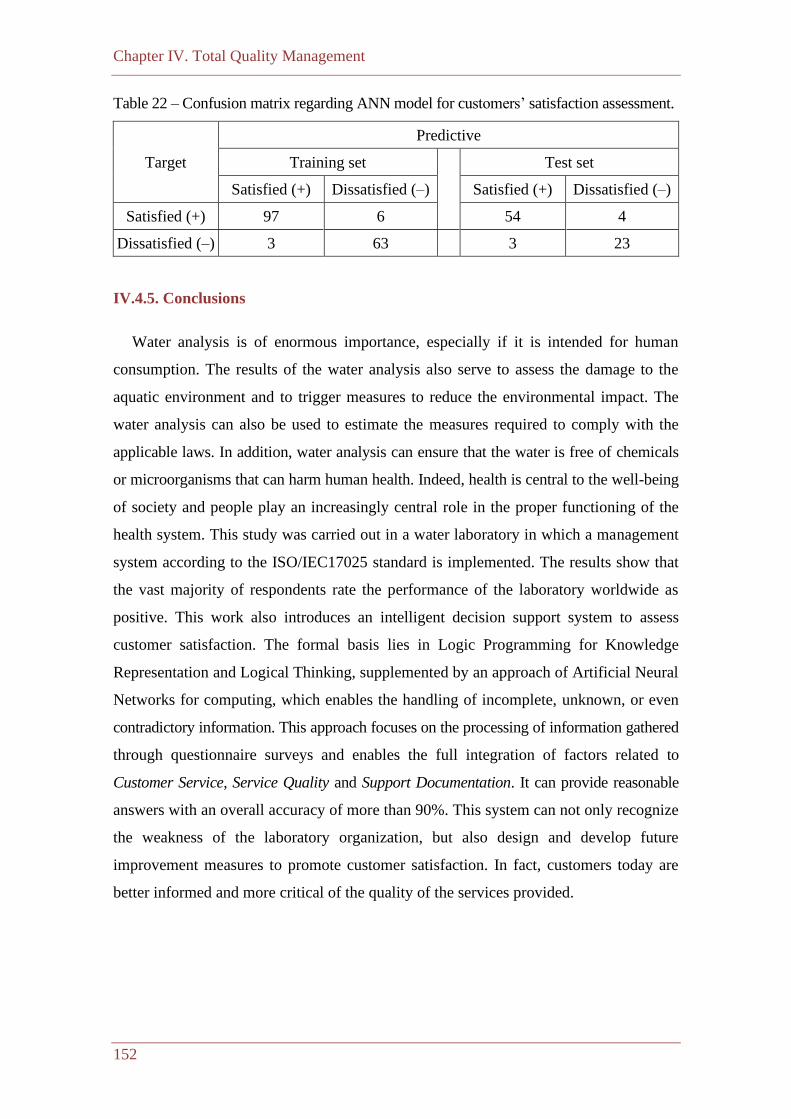
Chapter IV. Total Quality Management
152
Table 22 – Confusion matrix regarding ANN model for customers’ satisfaction assessment.
Target
Predictive
Training set Test set
Satisfied (+) Dissatisfied (–) Satisfied (+) Dissatisfied (–)
Satisfied (+) 97 6 54 4
Dissatisfied (–) 3 63 3 23
IV.4.5. Conclusions
Water analysis is of enormous importance, especially if it is intended for human
consumption. The results of the water analysis also serve to assess the damage to the
aquatic environment and to trigger measures to reduce the environmental impact. The
water analysis can also be used to estimate the measures required to comply with the
applicable laws. In addition, water analysis can ensure that the water is free of chemicals
or microorganisms that can harm human health. Indeed, health is central to the well-being
of society and people play an increasingly central role in the proper functioning of the
health system. This study was carried out in a water laboratory in which a management
system according to the ISO/IEC17025 standard is implemented. The results show that
the vast majority of respondents rate the performance of the laboratory worldwide as
positive. This work also introduces an intelligent decision support system to assess
customer satisfaction. The formal basis lies in Logic Programming for Knowledge
Representation and Logical Thinking, supplemented by an approach of Artificial Neural
Networks for computing, which enables the handling of incomplete, unknown, or even
contradictory information. This approach focuses on the processing of information gathered
through questionnaire surveys and enables the full integration of factors related to
Customer Service, Service Quality and Support Documentation. It can provide reasonable
answers with an overall accuracy of more than 90%. This system can not only recognize
the weakness of the laboratory organization, but also design and develop future
improvement measures to promote customer satisfaction. In fact, customers today are
better informed and more critical of the quality of the services provided.

Chapter IV. Total Quality Management
153
IV.4.6. Customer Satisfaction Questionnaire
CUSTOMER SATISFACTION QUESTIONNAIRE
The continuous improvement of the services provided is the main commitment of the Water Laboratory.
In this sense, knowing the degree of customer satisfaction is fundamental to create new alternatives
and leads to an increasingly effective service.
For improvement suggestions use the space for the effect at the end of the questionnaire.
Note: The Laboratory protects your privacy.
The personal data collected will be processed by computer and will not be transferred to any other
institution not used for any purpose other than the support to the Internal Quality Management System.
PART I
CUSTOMER DATA
Tick the box that corresponds to your case or fill the blanks.
Gender Feminine
Masculine
Academic Qualifications Basic
Education
Secondary
Education
Higher
Education
Post Graduate
Education
Age ______________ years old Locality ______________
How did you find the Lab? It was
Customer
Passing
by local
Friends or
Family Web
Social
Networks Publicity
PART II
For each statement tick the option that best reflects your opinion.
CUSTOMER SERVICE
Very
Dissatisfied
Slightly
Dissatisfied Satisfied
Very
Satisfied
S1. Easiness of contact.
S2. Response time to requests.
S3. Service availability.
S4. Effectiveness in the clarification of questions.
S5. Clarity in answers to questions.
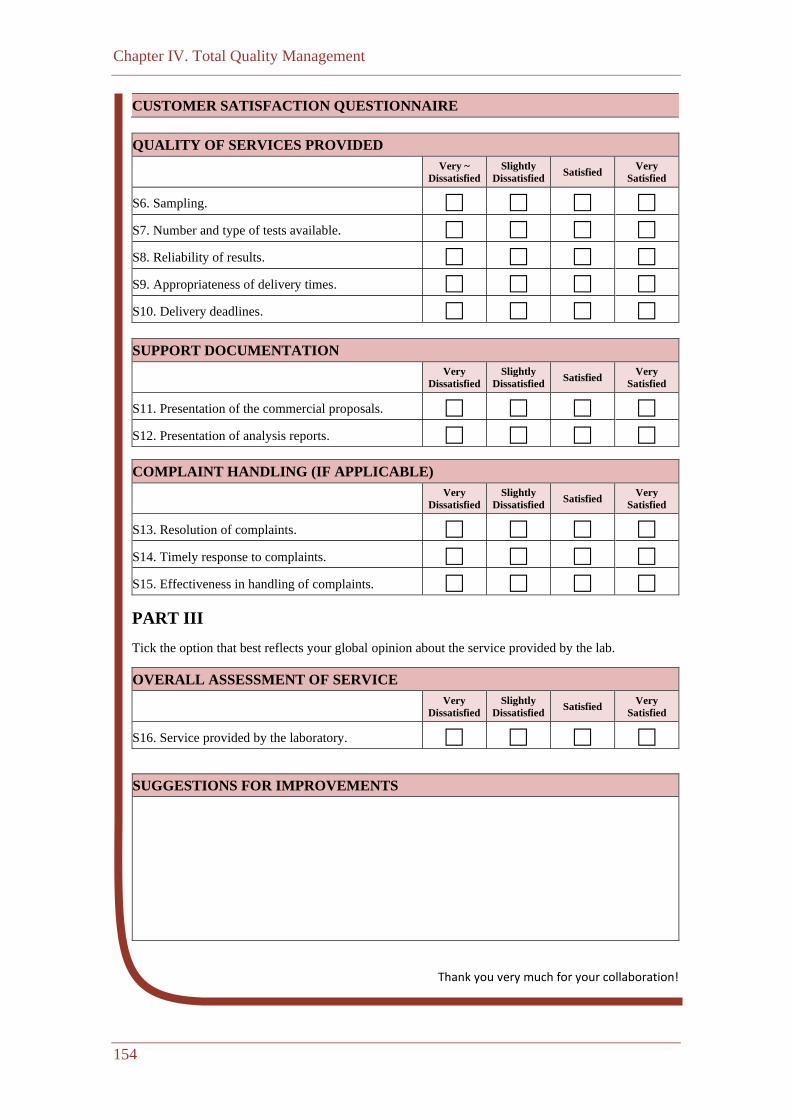
Chapter IV. Total Quality Management
154
CUSTOMER SATISFACTION QUESTIONNAIRE
QUALITY OF SERVICES PROVIDED
Very ~
Dissatisfied
Slightly
Dissatisfied Satisfied
Very
Satisfied
S6. Sampling.
S7. Number and type of tests available.
S8. Reliability of results.
S9. Appropriateness of delivery times.
S10. Delivery deadlines.
SUPPORT DOCUMENTATION
Very
Dissatisfied
Slightly
Dissatisfied Satisfied
Very
Satisfied
S11. Presentation of the commercial proposals.
S12. Presentation of analysis reports.
COMPLAINT HANDLING (IF APPLICABLE)
Very
Dissatisfied
Slightly
Dissatisfied Satisfied
Very
Satisfied
S13. Resolution of complaints.
S14. Timely response to complaints.
S15. Effectiveness in handling of complaints.
PART III
Tick the option that best reflects your global opinion about the service provided by the lab.
OVERALL ASSESSMENT OF SERVICE
Very
Dissatisfied
Slightly
Dissatisfied Satisfied
Very
Satisfied
S16. Service provided by the laboratory.
SUGGESTIONS FOR IMPROVEMENTS
Thank you very much for your collaboration!
Chapter IV. Total Quality Management
155
IV.5. Synopsis
The Total Quality methodologies had a strong impact on the operation of the
laboratories. The main methodologies adopted in Portugal include accreditation and
certification, based on international models, whose final objectives are satisfaction, on
one hand, and compliance with legal and regulatory requirements affecting the sector,
on the other hand. In this context, the paper “An Assessment of the Data Guidelines in
Cryopreservation Laboratories” assesses the implementation of GDPR in a
cryopreservation laboratory, based on the use of ANNs.
Due to the exceptional situation and the proliferation of registered cases of contagion
by the new coronavirus, SARS-COV-2, it is urgent that organizations apply extraordinary
measures in terms of training employees, acquiring resources, cleaning procedures and
disinfection. In this context, the paper “A Case-Based Approach to Assess Employees’
Satisfaction with Work Guidelines in Times of the Pandemic” combines the concept
of innovation and TQM. In this work, a model is presented, using Case-Based Reasoning,
to assess employee satisfaction with the new procedures related to the current pandemic
crisis. In this study, through the analysis of responses to a questionnaire, built for this
purpose, insights are obtained that can contribute to a better adaptation of organizations
to this situation, increasing employee satisfaction and involvement. Knowing employee
satisfaction is important but also customer satisfaction, which is an indicator of the
quality present in most organizations. In the paper “Customers’ Satisfaction Assessment
in Water Laboratories”, customer satisfaction at a water analysis laboratory, accredited
according to the ISO/IEC 17025 standard, was analysed. In general, it was found that
for all parameters analysed, whether they are related to Management Requirements or
Technical Requirements, a high level of satisfaction was obtained. These results show
that the existence of a management system according to the ISO/IEC 17025 framework
contributes to meeting customers’ requirements.

Chapter V. Concluding Remarks and Future Perspectives
Chapter V. Concluding Remarks and Future Perspectives
157
V. Concluding Remarks and Future Perspectives
Laboratories have undergone intense changes due to increasing technical and regulatory
requirements. On one hand, legal guidelines, new expectations, recommendations from
scientific societies, technological innovations and competition put pressure on laboratories
to supply a variety of new products and services to the market. On the other hand,
laboratory managers and their teams are continually challenged to demonstrate increasing
levels of technical excellence in order to guarantee the reliability of results, in line with
the necessary cost reduction, reduction of response time, minimization of consumption
of reagents and the constant need for updating. The routine of a laboratory is complex,
either because of the multiplicity of processes that must be controlled, or because of the
variety of equipment used. This framework increasingly requires better preparation of
professionals and the adoption of effective Quality Management Systems. However,
current methods of quality control and management are time consuming, complex,
expensive and involve a large number of technical and financial resources (calibrated
equipment, infrastructure, qualified technicians and reagents). All this complexity
promotes dispersion and hinders quick access to the information needed to make predictions
and make the best decisions in a timely manner.
The present work contributes to the resolution of problems in the technical area and
in quality management in laboratories, using Artificial Intelligence tools. It presents
different models that can be applied to obtain valid results and strategic business
actions. Its application in water and/or health laboratories allows to promote the quality
of services and, therefore, the reduction of waste, the minimization of consumption, the
guarantee of legal compliance, the improvement of working conditions, the prevention of
diseases, the development of new therapies and, finally, the satisfaction of clients/patients.
In fact, the introduction of these models in Biochemistry-based laboratories makes it
possible to take another step up of innovation and better laboratory performance, privileging
health and in line with customers’ expectations.
Chapter V. Concluding Remarks and Future Perspectives
158
The results obtained allow to sustain new developments and new investigations, with
a view to the application of the proposed models to other sectors. As future work, it is
proposed, viz.
• The creation of a platform that integrates all the models presented and, in this
way, provide organizations with tools to assess their efficiency as a whole; and
• The adaptation of the platform to other activities to promote quality and provide
excellent services.

References
References
160
References
AABB (2020) American Association of Blood Banks.
http://www.aabb.org/Pages/default.aspx, last accessed 2020/10/21.
Aamodt, A. & Plaza, E. (1994) Case-based reasoning: foundational issues,
methodological variations, and system approaches. AI Communications, 7, 39–59.
Ahmed, A. (2017) Prediction of dissolved oxygen in Surma River by biochemical
oxygen demand and chemical oxygen demand using the artificial neural networks
(ANNs). Journal of King Saud University Engineering Sciences, 29, 151–158.
Akinsete, E., Apostolaki, S., Chatzistamoulou, N., Koundouri, P., Tsani, S. (2019) The link
between ecosystem services and human wellbeing in the implementation of the European
water framework directive: assessing four river basins in Europe. Water, 11, 508.
Alfes, K., Shantz, A.D., Truss, C. & Soane, E.C. (2013) The Link Between Perceived
Human Resource Management Practices, Engagement and Employee Behaviour: A
Moderated Mediation Model. The International Journal of Human Resource
Management 24, 330–351.
Allan, R., Jeffrey, P., Clarke, M. & Pollard, S. (2013) The impact of regulation, ownership
and business culture on managing corporate risk within the water industry. Water
Policy, 15, 458–478.
Allawi, M., Jaafar O., Hamzah F., Abdullah S. & El-shafie A. (2018) Review on applications
of artificial intelligence methods for dam and reservoir-hydro-environment models.
Environmental Science and Pollution Research, 25, 13446–13469.
Allen, L. (2013) Role of a Quality Management System in Improving Patient Safety –
Laboratory Aspects. Clinical Biochemistry, 46, 1187–1193.
Alley, E.R. (2000) Water Quality Control Handbook. McGraw-Hill, New York, United
States of America.
Alves, M. (2009) Avaliação e Qualidade das Organizações. 2nd Edition, Edições Sílabo,
Lisbon, Portugal.
References
161
Amoah, P. (2018) Social participation, health literacy, and health and well-being: A
crosssectional study in Ghana. SSM – Population Health, 4, 263–270.
Ando, S., Ono, Y., Shimaoka, M., Hiruta, S., Hattori, Y., Hori, F. & Takeuchi, Y.
(2000) Associations of Self Estimated Workloads with Musculoskeletal Symptoms
Among Hospital Nurses. Occupational & Environmental Medicine, 57, 211–216.
António, N. Teixeira, A. & Rosa, A. (2016) Gestão da Qualidade – De Deming ao
Modelo de Excelência da EFQM. 2nd Edition, Edições Sílabo, Lisbon, Portugal.
Apostolaki, S., Koundouri, P. & Pittis, N. (2019) Using a systemic approach to address
the requirement for Integrated Water Resource Management within the Water
Framework Directive. Science of the Total Environment, 679, 70–79.
Arksey, H. & O’Malley, L. (2005) Scoping studies: towards a methodological
framework. International Journal of Social Research Methodology, 8, 19–32.
Bagchi, B. (2013) Water in Biological and Chemical Processes – From Structure and
Dynamics to Function. Cambridge University Press, Cambridge, United Kingdom.
Baird, R.B., Eaton, A.D. & Rice, E.W. Eds. (2017) Standard Methods for the Examination
of Water and Wastewater. 23rd Edition, American Public Health Association/Water
Works Association/Water Environment Federation, New York, United States of
America.
Balmer, D., King, A., Moloney, W., Moselen, E. & Dixon, R. (2020) Nursing students
and health literacy: The effect of region and programme level. Nurse Education in
Practice, 42, 102688.
Baumeister, R.F., Campbell, J.D., Krueger, J.I. & Vohs, K.D. (2003) Does High Self-
Esteem Cause Better Performance, Interpersonal Success, Happiness, or Healthier
Lifestyles?. Psychological Science in the Public Interest, 4, 1–44.
Bell, J. (2010) Doing Your Research Project: A Guide for First-Time Researchers in
Education, Health and Social Science. 5th Edition, Open University Press,
Maidenhead, United Kingdom.
Berlitz, A. & Haussen, L. (2011) Gestão Da Fase Analítica Do Laboratório: Como
Assegurar a Qualidade Na Prática. Control Lab, Rio de Janeiro, Brazil.
References
162
Berman, E.M., Bowman, J.S., West J.P. & Van Wart, M.R. (2020) Human Resource
Management in Public Service: Paradoxes, Processes, and Problems. 6th Edition,
SAGE Publications Inc., Thousand Oaks, United States of America.
Bernal, D., Campos-Serna, J., Tobias, A., Vargas-Prada, S., Benavides, F. & Serra, C.
(2015) Work-Related Psychosocial Risk Factors and Musculoskeletal Disorders in
Hospital Nurses and Nursing Aides: A Systematic Review and Meta-Analysis.
International Journal of Nursing Studies, 52, 635–648.
Bhardwaj, P., Gupta, R., Shukla, J., Mishra, D., Mudgal, M. & Amritphale, S. (2017)
The connection between female literacy and technology adoption in rural societies:
Exploring female literacy and technology adoption for promoting the usage of water-
based toilets in India. Technology in Society, 50, 44–49.
Boev, C., Xue, Y. & Ingersoll, C. (2015) Nursing Job Satisfaction, Certification and
Healthcare-Associated Infections in Critical Care. Intensive Critical Care Nurse, 31,
276–284.
Borishad, T., Kehinde, O., Iyiola, O., Olokundun, M., Ibidunn, A., Dirisu, J. &
Omotoyinbo, C. (2018) Dataset on Customer Experience and Satisfaction in
Healthcare Sector of Nigeria. Data in Brief, 20, 1850–1853.
Bossuyt, X., Verweire, K. & Blanckaert, N. (2007) Laboratory Medicine: Challenges
and Opportunities. Clinical Chemistry, 53, 1730–1733.
Brock, T. (1999) Robert Koch: A life in Medicine and Bacteriology. American Society
for Microbiology, Washington, United States of America.
Broek, K. (2019) Household energy literacy: A critical review and a conceptual
typology. Energy Research & Social Science, 57, 101256.
Bronkhorst, B. (2015) Behaving Safely Under Pressure: The Effects of Job Demands,
Resources, and Safety Climate on Employee Physical and Psychosocial Safety
Behavior. Journal of Safety Research, 55, 63–72.
Byleveld, P.M., Deere, D. & Davison, A. (2008) Water safety plans: planning for adverse
events and communicating with consumers. Journal of Water and Health, 6 (S1), 1–9.
References
163
Caldeira, A.T., Arteiro, J.M., Roseiro, J.C., Neves, J. & Vicente, H. (2011) An Artificial
Intelligence Approach to Bacillus amyloliquefaciens CCMI 1051 Cultures:
Application to the Production of Antifungal Compounds. Bioresource Technology,
102, 1496–1502.
Cameron, M., Calderwood, R., Cox, A., Lim, S. & Yamaoka, M. (2014) Factors
associated with financial literacy among high school students in New Zealand.
International Review of Economics Education, 16, 12–21.
Carmo, H. & Ferreira, M. (1998) Metodologia da Investigação: Guia para
Autoaprendizagem. Universidade Aberta, Lisbon, Portugal.
Chen, Y., Fang, X., Yang, L., Liu, Y., Gong, C. & Di, Y. (2019) Artificial Neural
Networks in the Prediction and Assessment for Water Quality: A Review Journal of
Physics: Conference Series, 1237, 042051.
Chicu, D., Pàmies, M., Ryan, G. & Cross C (2019) Exploring the Influence of the
Human Factor on Customer Satisfaction in Call Centres. BRQ Business Research
Quartely, 22, 83–95.
Chong-Fong, Y. (2015) Level of Service Quality of SME Laboratory Services on
Customer Satisfaction. MBA Thesis, University Sains Malaysia, Penang, Malaysia.
Christian, D. & Drilling, S. (2010) Implementing Quality in Laboratory Policies and
Processes: Using Templates, Project Management and Six Sigma. CRC Press, Boca
Raton, United States of America.
Claassen, M. (2013) Integrated Water Resource Management in South Africa.
International Journal of Water Governance, 1, 323–338.
Coelho, C., Vicente, H., Martins, M. R., Lima, N., Neves, M. & Neves, J. (2017) An
assessment of environmental and toxicological risk to pesticide exposure based on a
case-based approach to computing. IOP Conference Series: Earth and Environmental
Science, 52, 012091.
Cohen, L., Manion, L. & Morrison, K. (2017) Research Methods in Education. 8th
Edition, Routledge, New York, United States of America.
References
164
Couto, C., Vicente, H., Machado, J., Abelha, A. & Neves, J. (2012) Water Quality
Modeling Using Artificial Intelligence – Based Tools. International Journal of
Design & Nature and Ecodynamics, 7, 300–309.
Cowper, J. & Samuels, M. (1979) Performance Benchmarking in the Public Sector: The
United Kingdom Experience. Office of Public Services, Cabinet Office, United Kingdom.
Craig, C. & Allen, M. (2015) The impact of curriculum-based learning on environmental
literacy and energy consumption with implications for policy. Utilities Policy, 35, 41–49.
Decree-Law No. 10-A/2020 of 13 March (2020) Diário da República – 1º Suplemento –
Série I, 143, 22-(2)–22-(13).
Decree-Law No. 152/2017 of 7 December (2017) Diário da República – Série I, 235,
6555–6576.
Decree-Law No.140/2004 of 8 June (2004), Diário da República – Série I-A, 134,
3614–3619.
DeKetele, J. & Roegiers, X. (2016) Méthodologie du Recueil d’Informations:
Fondements des Méthodes d’Observation, de Questionnaire, d’Interview et d’Études
de Documents. 5th Edition, DeBoeck Universite, Paris, France.
Deming, W. (1982) Quality Productivity and Competitive Position. Massachusctts
Institute of Technology, Cambridge, United Kingdom.
Demotes-Mainard, J., Cornu, C., Guérin, A., Bertoye, P.-H., Boidin, R., Bureau, S.,
Chrétien, J.-M., Delval, C., Deplanque, D., Dubray, C., Duchossoy, L., Edel, V.,
Fouret, C., Galaup, A., Lesaulnier, F., Matei, M., Naudet, F., Plattner, V., Rubio, M.,
Ruiz, F., Sénéchal-Cohen, S., Simon, T., Vidal, A., Viola, A. & Violleau, M. (2019)
How the new European data protection regulation affects clinical research and
recommendations?. Therapies, 74, 31–42.
Dobner, P. & Frede, H.-G. (2016) Water Governance: A Systematic Approach. In: Hüttl,
R., Bens, O., Bismuth C., Hoechstetter S. (Eds.) Society–Water–Technology: A critical
appraisal of major water engineering project, pp. 79–87, Springer, Cham, Switzerland.
References
165
Dollard, M., Dormann, C. & Idris, M. (2019) Psychosocial Safety Climate: A New Work
Stress Theory. In: Dollard, M., Dormann, C. & Idris, M. (Eds.) Psychosocial Safety
Climate – A New Work Stress Theory, pp. 3–30, Springer International Publishing,
Cham, Switzerland.
Dreyfus, P., Gulbro, R.D. & Shonesy L. (1999) Quality in Manufacturing: Does Size Really
Make a Difference?. In: Proceedings of the 1999 US Association for Small Business
and Entrepreneurship National Conference, 10 pp., Houston, United States of America.
Dugimont, J., Cendra, A. & Hammad, M. (2006) Intérêt de l´accréditation en laboratoire
de biologie médicale. Biotribune Magazine, 20, 25–31.
EFQM (2020) The EFQM Model. European Foundation for Quality Management.
https://www.efqm.org/index.php/efqm-model/, last accessed 2020/10/21.
EU-OSHA (2007) Expert Forecast on Emerging Psychosocial Risks Related to
Occupational Safety and Health. Office for Official Publications of the European
Communities, Luxembourg City, Luxembourg.
EU-OSHA (2012) Management of psychosocial risks at work: An Analysis of Findings
of the European Survey of Enterprises on New and Emerging Risks. Publications
Office of the European Union. Luxembourg City, Luxembourg.
Eurofound & EU-OSHA (2014) Psychosocial Risks in Europe: Prevalence and Strategies
for Prevention – A joint report from the European Foundation for the Improvement of
Living and Working Conditions and the European Agency for Safety and Health at
Work. Publications Office of the European Union, Luxembourg City, Luxembourg.
European Parliament (2016) EU General Data Protection Regulation – Regulation (EU)
2016/679 of the European Parliament and of the Council of 27 April 2016. Official
Journal of the European Union, 59, L119/1–L119/88.
Feigenbaum, A. (1994) Controle da Qualidade Total – Volume 1: Gestão e Sistemas.
Makron Books, São Paulo, Brazil.
Ferguson, S., Allread, W., Burr, D., Heaney, C. & Marras, W. (2012) Biomechanical,
Psychosocial and Individual Risk Factors Predicting Low Back Functional Impairment
Among Furniture Distribution. Clinical Biomechanics, 27, 117–123.
References
166
Fernandes, A., Carvalho, F., Ribeiro, J., Vicente, D., Faria, J., Figueiredo, M., Capita, A.,
Neves J. & Vicente, H. (2019) Fully Informed Classification Systems – Simpler,
Maybe Better. Communications in Computer and Information Science, 1038, 3–16.
Fernandes, A., Chaves, H., Lima, R., Neves, J. & Vicente, H. (2020a) Draw on
Artificial Neural Networks to Assess and Predict Water Quality. IOP Conference
Series: Earth and Environmental Science, 7 pp. (Accepted, to be published)
Fernandes, A., Figueiredo, M., Ribeiro, J., Neves, J. & Vicente, H. (2020b)
Psychosocial Risks Assessment in Cryopreservation Laboratories. Safety and Health
at Work, 12 pp. https://doi.org/10.1016/j.shaw.2020.07.003.
Fernandes, A., Vicente, H., Figueiredo, M., Maia, N., Marreiros, G., Neves, M. &
Neves, J. (2016a) A Case-Base Approach to Workforces’ Satisfaction Assessment.
Lecture Notes in Business Information Processing, 268, 191–206.
Fernandes, A., Vicente, H., Figueiredo, M., Neves, M. & Neves, J. (2016b) An
Evaluative Model to assess the Organizational Efficiency in Training Corporations.
Lecture Notes on Computer Science, 10018, 415–428.
Fernandes, B., Vicente, H., Ribeiro, J., Capita, A., Analide, C. & Neves, J. (2020c)
Fully Informed Vulnerable Road Users – Simpler, Maybe Better. In: Proceedings of
the 21st International Conference on Information Integration and Web-based
Applications & Services (iiWAS2019), pp. 600–604. Association for Computing
Machinery, New York, United States of America.
Ferraz, F., Vicente, H., Costa, A., Neves, J. (2016) Analysis of Dyscalculia Evidences
through Artificial Intelligence Systems. Journal of Software Networking, 2016, 53–78.
Figueiredo, M., Fernandes, A., Ribeiro, J., Neves, J., Dias A., Vicente, H. (2020) An
Assessment of Students’ Satisfaction in Higher Education. Advances in Intelligent
Systems and Computing, 1241, 147–161.
Flaumenhaft, Y. & Ben-Assuli, O. (2018) Personal health records, global policy and
regulation review. Health Policy, 122, 815–826.
Florkowski, C. (2008) Sensitivity, Specificity, Receiver-Operating Characteristic (ROC)
Curves and Likelihood Ratios: Communicating the Performance of Diagnostic Tests.
The Clinical. Biochemist Reviews, 29 (Suppl 1), S83–S87.
References
167
Forio, M., Mouton, A., Lock, K., Boets, P., Tien, N., Ambarita, M., Musonge, P.,
Granda, L. & Goethals, P. (2017) Fuzzy modelling to identify key drivers of
ecological water quality to support decision and policy making. Environmental
Science and Policy, 68, 58–68.
Francesco, G. & Roberta, G. (2019) Cross-Country Analysis of Perception and
Emphasis of Hotel Attributes. Tour Management, 74, 24–42.
Frank, E., Hall, M. & Witten, I. (2016) The WEKA Workbench. Online Appendix for
“Data Mining: Practical Machine Learning Tools and Techniques” (4th Edition),
Morgan Kaufmann. https://www.cs.waikato.ac.nz/ml/weka/Witten_et_al_2016_appendix.
pdf last accessed 2020/10/21.
Ganhão, F.N. & Pereira, A. (1992) A Gestão da Qualidade – Como Implementá-la na
Empresa. Editorial Presença, Lisbon, Portugal.
Geison, G. (1995) The Private Science of Louis Pasteur. Princeton University Press,
Princeton, United States of America.
George, M. (2003) Lean Six Sigma for Service: How to Use Lean Speed and Six Sigma
Quality to Improve Services and Transactions. McGraw-Hill, New York, United
States of America.
Gerdt, S., Wagner, E. & Schewe, G. (2019) The Relationship Between Sustainability
and Customer Satisfaction in Hospitality: An Explorative Investigation Using
eWOM as a Data Source. Tour Management, 74, 155–172.
Ghosh, S., Chattopadhyay, B. P., Roy, R. M., Mukherjee, J. & Mahadevappa, M. (2019)
Estimation of echocardiogram parameters with the aid of impedance cardiography
and artificial neural networks. Artificial. Intelligence in Medicine, 96, 45–58.
Giakoumis, T. (2019) Improving the application of the Integrated River Basin
Management paradigm in the implementation of the EU Water Framework Directive.
PhD Thesis, Imperial College of London, London, United Kingdom.
Goldman, D., Ayalon, O., Baum, D. & Weiss, B. (2018) Influence of “green school
certification” on students’ environmental literacy and adoption of sustainable
practice by schools. Journal of Cleaner Production, 183, 1300–1313.
References
168
Haidvogl, G. (2018) Historic Milestones of Human River Uses and Ecological Impacts.
In: Schmutz, S. & Sendzimir, J. (Eds.) Riverine Ecosystem Management – Science
for Governing Towards a Sustainable Future. Aquatic Ecology Series, vol. 8, pp. 19–
39, Springer, Cham, Switzerland.
Hall, M., Frank, E., Holmes, G., Pfahringer, B., Reutemann, P. & Witten, I.H. (2009)
The WEKA Data Mining Software: An Update. SIGKDD Explorations, 11, 10–18.
Han, J., Kamber, M., Pei, J. (2012) Data Mining: Concepts and Techniques. 3rd Edition,
Morgan Kauffmann Publishers, San Francisco, United States of America.
Han, S., Chen, S., Ebrahimpour, M. & Roger, W. (2007) The Impact of ISO 9000 on TQM
and Business Performance. The Journal of Business and Economic Studies, 13, 1–23.
Hartley, K., Tortajada, C. & Biswas, A.K. (2018) Political dynamics and water supply
in Hong Kong. Environmental Development, 27, 107–117.
Hartley, K., Tortajada, C. & Biswas, A.K. (2019) A formal model concerning policy
strategies to build public acceptance of potable water reuse. Journal of
Environmental Management, 250, 109505.
Haykin, S. (2009) Neural Networks and Learning Machines. 3rd Edition, Prentice Hall,
New York, United States of America.
He, H. (2018) Household energy literacy: Construction of the index system of water
literacy and application in a case study of four Chinese communities. Journal of
Discrete Mathematical Sciences and Cryptography, 21, 485–491.
Henneman, E.A., Blank, F.S.J., Gattasso, S., Williamson, K. & Henneman, P.L. (2006)
Testing a classification model for emergency department errors. Journal of Advanced
Nursing, 55, 90–99.
Hommerson, A., Lucas, P. & van Bommel, P. (2008) Checking the quality of clinical
guidelines using automated reasoning tools. Theory and Practice of Logic
Programming, 8, 611–641.
Horne, J., Tortajada, C. & Harrington, L. (2018) Achieving the Sustainable Development
Goals: Improving Water Services in Cities Affected by Extreme Weather Events.
International Journal of Water Resources Development, 34, 475–489.
References
169
Hoyle, D. (2017) ISO 9001 Quality Systems Handbook – Updated for the ISO 9001:2015
Standard – Increasing the Quality of an Organization’s Outputs. 7th Edition, Routledge,
New York, United States of America.
IPAC (2020) A Acreditação. http://www.ipac.pt/ipac/funcao.asp, last accessed 2020/10/21.
Irvin, V., Rohlman, D., Vaughan, A., Amantia, R., Berlin, C. & Kile, M. (2019) Development
and Validation of an Environmental Health Literacy Assessment Screening Tool for
Domestic Well Owners: The Water Environmental Literacy Level Scale (WELLS).
International Journal of Environmental Research and Public Health, 16, 881.
ISO 9001 (2015) ISO 9001:2015 – Quality Management Systems – Requirements.
International Organization for Standardization, Geneva, Switzerland.
ISO/IEC 17000 (2020) ISO/IEC 17000:2020 – Conformity assessment – Vocabulary and
general principles. International Organization for Standardization, Geneva, Switzerland.
ISO/IEC 17025 (2017) ISO/IEC 17025:2017 – General requirements for the competence
to testing and calibration laboratories. International Organization for Standardization,
Geneva, Switzerland.
Jimenez, M., Romero, L., Dominguez, M. & Espinoso, M. (2015) 5S Methodology
Implementation in the Laboratories of an Industrial Engineering University School.
Safety Science, 78, 163–172.
Joensuu, M., Väänänen, A., Koskinen, A., Kivimäki, M., Virtanen, M. & Vahtera, J.
(2010) Psychosocial Work Environment and Hospital Admissions Due to Mental
Disorders: A 15-Year Prospective Study of Industrial Employees. Journal of
Affective Disorders, 124, 118–125.
Juran, J.M. (1995) Managerial Breakthrough: The Classic Book on Improving Management
Performance. 2nd Edition, McGraw-Hill, New York, United States of America.
Kailner, A. (1998) Quality Management in the Medical Laboratory: A Comparison of
Draft Standards. Clinica Chimica Acta, 278, 111–119.
Kewley, R., Embrechts, M. & Breneman, C. (2000) Data Strip Mining for the Virtual
Design of Pharmaceuticals with Neural Networks. IEEE Transactions on Neural
Networks, 11, 668–679.
References
170
Kohl, H. (1998) The New ISO 17025 – Basic Idea. Accreditation and Quality
Assurance, 3, 422–425.
Kotler, P., Keller, K.L., Brady, M., Goodman, M. & Hansen, T. (2016) Marketing
Management. 3rd Edition, Pearson Education, Harlow, United Kingdom.
Kramer, M. (2016) Financial literacy, confidence and financial advice seeking. Journal
of Economic Behavior & Organization, 131, 198–217.
Law No.12/2009 of 26 March (2009), Diário da República – Série I, 60, 1876–1897.
Lehr, J. & Keeley, J. Eds. (2005a) Water Encyclopedia: Oceanography; Meteorology;
Physics and Chemistry; Water Law; and Water History, Art and Culture. John Wiley
& Sons, Hoboken, United States of America.
Lehr, J. & Keeley, J. Eds. (2005b) Water Encyclopedia: Surface and Agricultural Water.
John Wiley & Sons, Hoboken, New Jersey, United States of America.
Leka, S. & Jain, A. (2010) Health Impact of Psychosocial Hazards at Work: An
Overview. World Health Organization. Geneva, Switzerland.
Lerouge, L. (2017) Psychosocial Risks in Labour and Social Security Law: A
Comparative Legal Overview from Europe, North America, Australia and Japan.
Springer International Publishing, Cham, Switzerland.
Li, Y. & Migliaccio, K. (2011) Water Quality Concepts, Sampling and Analyses. CRC
Press, Boca Raton, United States of America.
Liu, J., Zheng, J., Liu, K., Liu, X., Wu, Y., Wang, J. &You, L. (2019) Workplace
Violence Against Nurses, Job Satisfaction, Burnout, and Patient Safety in Chinese
Hospitals. Nursing Outlook, 67, 558–566.
Loucks, D. & Beek E. (2017) Water Resource Systems Planning and Management – An
Introduction to Methods, Models, and Applications. Springer Nature, Cham, Switzerland.
Luhtanen, R. & Crocker, J. (1992) A collective Self-Esteem Scale: Self-Evaluation of
One’s Social Identity. Personality and Social Psychology Bulletin, 18, 302–318.
MacDonald, L.A., Karasek, R., Punnett, L. & Scharf, T. (2001) Covariation Between
Workplace Physical and Psychosocial Stressors: Evidence and Implications for
Occupational Health Research and Prevention. Ergonomics, 51, 696–718.
References
171
Maier H.R. & Dandy G.C. (1996) The Use of Artificial Neural Networks for the
Prediction of Water Quality Parameters. Water Resources Research, 32, 1013–1022.
Maier, H.R. & Dandy, G.C. (2000) Application of Artificial Neural Networks to
Forecasting of Surface Water Quality Variables: Issues, Applications and Challenges
Artificial Neural Networks in Hydrology. Water Science and Technology Library,
36, 287–309.
Martins, M.R., Mendes, T., Grañeda, J.M., Gusmão, R., Vicente H. & Neves, J. (2015)
Artificial Neural Networks in Acute Coronary Syndrome Screening. Lecture Notes in
Computer Science, 9043, 108–119.
McBride, G.B. (2005) Using Statistical Methods for Water Quality Management Issues,
Problems and Solutions. John Wiley & Sons, Hoboken, United States of America.
McCall, B. (2018) What does the GDPR mean for the medical community?. Lancet,
391, 1249–1250.
McCulloch, W.S. & Pitts, W. (1943) A logical calculus of the ideas immanent in
nervous activity. The Bulletin of Mathematical Biophysics, 5, 115–133.
McMillan, J. & Schumacher, S. (2009) Research in Education: Evidence-Based Inquiry.
7th Edition, Prentice Hall, New York, United States of America.
Mendes, B. & Oliveira, F. (2004) Qualidade da Água para Consumo Humano. Lidel,
Lisbon, Portugal.
Mense, A. & Blobel B. (2017) HL7 Standards and Components to Support Implementation
of the European General Data Protection Regulation. European Journal for Biomedical
Informatics, 13, 27–33.
Metzler, Y., Groeling-Müller, G. & Bellingrath, S. (2019) Better Safe Than Sorry: Methods
for Risk Assessment of Psychosocial Hazards. Safety Science; 114, 122–139.
Mitra, S., Pal, S. & Mitra, P. (2002) Data Mining in Soft Computing Framework: A
Survey. IEEE Transactions on Neural Networks, 13, 3–14.
Montegomery, D. (2019) Introduction to Statistical Quality Control. 8th Edition, Wiley,
New York, United States of America.
References
172
Morales-Torres, A., Escuder-Bueno, I., Andrés-Doménech, I. & Perales-Momparler, S.
(2016) Decision support tool for energy-efficient, sustainable and integrated urban
stormwater management. Environmental Modelling and Software, 84, 518–528.
Morriss-Roberts, C., Oulton, K., Sell, D., Wray, J. & Gibson, F. (2018) How should
health service researchers respect children’s personal data under GDPR?. Lancet
Child & Adolescent Health, 2, 696–697.
Mourby, M., Mackey, E., Elliot, M., Gowans, H., Wallace, S. E., Bell, J., Smith, H.,
Aidinlis, S. & Kaye, J. (2018) Are ‘pseudonymised’ data always personal data?
Implications of the GDPR for administrative data research in the UK. Computer Law
& Security Review, 34, 222–233.
Neves, J. (1984) A Logic Interpreter to Handle Time and Negation in Logic Databases.
In: Muller, R. & Pottmyer, J. (Eds.) Proceedings of the 1984 annual conference of
the ACM on the 5th Generation Challenge, pp. 50–54. Association for Computing
Machinery, New York, United States of America.
Neves, J., Fernandes, A., Gomes, G., Neves, M., Abelha, A. &, Vicente, H. (2015)
International Standard ISO 9001 – A Soft Computing View. Lecture Notes in Business
Information Processing, 241, 153–167.
Neves, J., Maia, N., Marreiros, G., Neves, M., Fernandes, A., Ribeiro, J., Araújo, I.,
Araújo, N., Ávidos, L., Ferraz, F., Capita, A., Lori, N., Alves, V. & Vicente, H.
(2019) Entropy and Organizational Performance. Lecture Notes in Computer
Science, 11734, 206–217.
Neves, J., Vicente, H., Esteves, M., Ferraz, F., Abelha, A., Machado, J., Machado, J.,
Neves, J., Ribeiro, J. & Sampaio, L. (2018a) A Deep-Big Data Approach to Health
Care in the AI Age. Mobile Networks and Applications, 23, 1123–1128.
Neves, J., Vicente, H., Esteves, M., Ferraz, F., Abelha, A., Machado, J., Machado J., Neves, J.
(2018b) Waiting Time Screening in Healthcare. Lecture Notes of the Institute for Computer
Sciences, Social Informatics and Telecommunications Engineering, 248, 124–131.
Neves, J., Zeleznikow, J. & Vicente, H. (2016) Quality of Judgment Assessment. In:
Novais, P. & Carneiro D. (Eds.) Interdisciplinary Perspectives on Contemporary
Conflict Resolution. Advances in Linguistic and Communication Studies, pp. 96–
110, IGI Global, Hershey, United States of America.
References
173
Nguyen, T.S., Nguyen, L.M., Tojo, S., Satoh, K. & Shimazu, A. (2018) Recurrent
Neural Network-Based Models for Recognizing Requisite and Effectuation Parts in
Legal Texts. Artificial Intelligence and Law, 26, 169–199.
Nollet, L. & Gelder, L. (2014) Handbook of Water Analysis. 3rd edn, CRC Press, Boca
Raton, United States of America.
NP EN ISO 15189 (2014) NP EN ISO 15189:2014 – Laboratórios Clínicos. Requisitos
Particulares da Qualidade e Competência. Instituto Português da Qualidade, Lisbon,
Portugal.
NP EN ISO 19011 (2019) NP EN ISO 19011:2019 – Linhas de Orientação para
Auditorias a Sistemas de Gestão. Instituto Português da Qualidade, Lisbon, Portugal.
NP EN ISO/IEC 17025 (2018) NP EN ISO/IEC 17025:2018 – Requisitos Gerais de
Competência para Laboratórios de Ensaio e Calibração. Instituto Português da
Qualidade, Lisbon, Portugal.
Palani, S., Liong, S.-Y. & Tkalich, P. (2008) An ANN Application for Water Quality
Forecasting. Marine Pollution Bulletin, 56, 1586–1597.
Parsons, S. (1996) Current approaches to handling imperfect information in data and
knowledge bases. IEEE Transactions on Knowledge and Data Engineering, 8, 353–372.
Pearson, L., Coggan, A., Proctor, W. & Smith, T. (2010) A sustainable decision support
framework for urban water management. Water Resources Management, 24, 363–376.
Pereira, D., Nascimento, J., & Gomes, R. (2011) Sistemas de Informação na Saúde.
Lidel, Lisbon, Portugal.
Petrescu, A.I. & Simmons, R. (2008) Human Resource Management Practices and
Employees’ Job Satisfaction. International Journal of Manpower, 29, 651–667.
Pinto, A. & Soares, I. (2018) Sistema de Gestão da Qualidade – Guia para a sua
Implementação. 2nd Edition, Edições Sílabo, Lisbon, Portugal.
Pinto, A., Fernandes, A., Vicente, H. & Neves, J. (2009) Optimizing water treatment
systems using artificial intelligence based tools. WIT Transactions on Ecology and
the Environment, 25, 185–194.
Pires, A. (2016) Sistemas de Gestão da Qualidade – Ambiente, Segurança, Responsabilidade
Social, Indústria e Serviços. 2nd Edition, Edições Sílabo, Lisbon, Portugal.
References
174
Plebani, M. (2006) Errors in clinical laboratories or errors in laboratory medicine?.
Clinical Chemistry and Laboratory Medicine, 44, 750–759.
Pohlmann, M. (2005) The Evolution of Innovation: Cultural Backgrounds and the Use
of Innovation Models. Technology Analysis and Strategic Management, 17, 9–19.
Poppe, M., Wieghlhofer, G. & Winkler, G. (2018) Public Participation and Environmental
Education. In: Schmutz, S. & Sendzimir, J. (Eds.) Riverine Ecosystem Management
– Science for Governing Towards a Sustainable Future. Aquatic Ecology Series, vol.
8, pp. 435–458, Springer, Cham, Switzerland.
Protzman, C., Kerpchar, J. & Mayzell, G. (2015) – Leveraging Lean in Medical
Laboratories Creating a Cost Effective, Standardized, High Quality, Patient-Focused
Operation. CRC Press, Boca Raton, United States of America.
Raab, S.S., Vrbin, C.M., Grzybicki, D.M., Sudilovsky, D., Balassanian, R., Zarbo, R.J.
& Meier, F.A. (2006) Errors in thyroid gland fine-needle aspiration. American
Journal of Clinical Pathology, 125, 873–882.
Ramdas, M. & Mohamed, B. (2014) Impacts of tourism on environmental attributes,
environmental literacy and willingness to pay: A conceptual and theoretical review.
Procedia Social and Behavioral Sciences, 144, 378–391.
Rasmussen, J. (1976) Outlines of a Hybrid Model of the Process Plant Operator. In:
Sheridan, T.B. & Johannsen, G. (Eds.) Monitoring Behavior and Supervisory Control,
vol. 1, pp. 371–383, NATO Conference Series, Plenum Press, London, United Kingdom.
Reason, J. (2000) Human error: models and management. BMJ, 320 (7237), 768–770.
Rebelo, A., Quadrado, M., Franco, A., Lacasta, N., Machado, P. (2020) Water reuse in
Portugal: New legislation trends to support the definition of water quality standards
based on risk characterization. Water Cycle, 1, 41–53.
Relacre (2017) Guia Relacre 28 – Amostragem de Águas. Relacre, Lisbon, Portugal.
Richter, M.M. & Weber, R.O. (2013) Case-Based Reasoning: A Textbook. Springer,
Berlin, Germany.
Riedmiller, M. (1994) Advanced supervised learning in multilayer perceptrons – From
backpropagation to adaptive learning algorithms. Computer Standards & Interfaces
16, 265–278.
References
175
Rodrigues, S., Brandão, P., Nelas, L., Neves, J. & Alves, V. (2011) A logic programming
approach to medical errors in imaging. International Journal of Medical Informatics,
80, 669–679.
Roldán, A., Pérez, J. & Cartea, P. (2019) Water and Climate Change, Two Key
Objectives in the Agenda 2030: Assessment of Climate Literacy Levels and Social
Representations in Academics from Three Climate Contexts. Water, 12, 92.
Rosenberg, M. (1965) Society and the Adolescent Self-Image. Princeton University
Press, Princeton, United States of America.
Rosenblatt, F. (1958) The perceptron: A probabilistic model for information storage and
organization in the brain. Psychological Review, 65, 386–408.
Ross, J. (1999) Total Quality Management – Text, Cases and Readings. 3rd Edition,
CRC Press, Boca Raton, United States of America.
Ruben, G., Zhang K., Bao H., & Ma X. (2018) Application and Sensitivity Analysis of
Artificial Neural Network for Prediction of Chemical Oxygen Demand. Water
Resource Management, 32, 273–283.
Rumelhart, D., Hinton, G. & Williams, R. (1986) Learning internal representation by
error propagation. In: Rumelhart, D. & McClelland J. (Eds.) Parallel Distributed
Processing: Explorations in the Microstructures of Cognition, vol. 1, pp. 318–362,
MIT Press, Cambridge, United States of America.
Saltzman, W.M. (2015) Biomedical Engineering: Bridging Medicine and Techonology.
2nd Edition, Cambridge University Press, Cambridge, United Kingdom.
Schäfer, R.B. & Bundschuh, M. (2018) Ecotoxicology. In: Schmutz, S. & Sendzimir, J.
(Eds.) Riverine Ecosystem Management – Science for Governing Towards a Sustainable
Future. Aquatic Ecology Series, vol. 8, pp. 225–239, Springer, Cham, Switzerland.
Seelen, L., Flaim, G., Jennings, E. & Domis, L. (2019) Saving water for the future:
Public awareness of water usage and water quality. Journal of Environmental
Management, 242, 246–257.
Serralheiro, R. (2001) A Sustentabilidade do Regadio e a Conservação do Solo e da
Água em Condições Mediterrâneas. Anais da Universidade de Évora, 10–11, 209–248.
References
176
Shahid, N., Rappon, T. & Berta, W. (2019) Applications of artificial neural networks in
health care organizational decision-making: A scoping review. PLoS ONE, 14,
e0212356, 22 pp.
Shang, Y. (2019) Subgraph robustness of complex networks under attacks. IEEE
Transactions on Systems, Man, and Cybernetics: Systems, 49, 821–832.
Silva, M. (2013) Gestão da Qualidade em Cuidados de Saúde. Monitor, Lisbon, Portugal.
Simmons, D. & Graves, K. (2008) Tubing misconnections – a systems failure with
human factors: lessons for nursing practice. Urologic Nursing, 28, 460–464.
Simonds, V., Margetts, M. & Rudd, R. (2019) Expanding Environmental Health Literacy – A
Focus on Water Quality and Tribal Lands. Journal of Health Communication, 24, 236–243.
Singh, K. Basant, A., Malik, A. & Jain, G. (2009) Artificial Neural Network Modeling
of the River Water Quality – A Case Study. Ecological Modelling, 220, 888–895.
Slack J. (2018) The Science of Stem Cells. John Wiley & Sons, Hoboken, United States
of America.
Snow, J. (1855) On the mode of communication of cholera. John Churchill, London,
United Kingdom.
Sørensen, K., Van den Broucke, S., Fullam, J., Doyle, G., Pelikan, J., Slonska, Z. &
Brand, H. (2012) Health Literacy and Public Health: A Systematic Review and
Integration of Definitions and Models. BMC Public Health, 12, 80.
Souza, J., Matwin, S. & Japkowicz, N. (2002) Evaluating Data Mining Models: A
Pattern Language. In: Proceedings of 9th Conference on Pattern Language of
Programs, pp. 1–23, Illinois, United States of America.
Sovacool, B. & Blyth, P. (2015) Energy and environmental attitudes in the green state
of Denmark: Implications for energy democracy, low carbon transitions, and energy
literacy. Environmental Science & Policy, 54, 304–315.
Squirrell, A. (2001) ILAC Mutual Recognition Arrangement. Accreditation and Quality
Assurance, 6, 37–38.
Stefanovic, N., Radojevic, I., Ostojic, A., Comic, L. & Topuzovic, M. (2015) Composite
web information system for management of water resources. Water Resources
Management, 29, 2285–2301.
References
177
Stranieri, A. & Zeleznikow, J. (2012) Insights from Jurisprudence for Machine Learning
in Law. In: Kulkarni, S. (Ed.) Machine Learning Algorithms for Problem Solving in
Computational Applications: Intelligent Techniques, pp. 85–98, IGI Global, Hershey,
United States of America
Su, H., Chen, M. & Wang J. (2011) Developing a water literacy. Environmental
Sustainability, 3, 517–519.
Takeuchi, H. Tanaka, H. (2020) Water reuse and recycling in Japan – History, current
situation, and future perspectives. Water Cycle, 1, 1–12.
Tortajada, C., González-Gómez, F., Biswas, A.K. & Buurman, J. (2019) Water demand
management strategies for water-scarce cities: The case of Spain. Sustainable Cities
and Society, 45, 649–656.
van der Schaaf, T.W. & Habraken, M.M.P. (2005) PRISMA-Medical: a brief description.
Patient Safety Systems, Faculty of Technology Management, Eindhoven University
of Technology, Eindhoven, Netherlands.
van der Schaaf, T.W. (1995) Near Miss Reporting in the Chemical Process Industry: An
Overview. Microelectronics Reliability, 35, 1233–1243.
Vicente, H., Borralho, F., Couto, C., Gomes, G., Alves, V. & Neves, J. (2015) An
Adverse Event Reporting and Learning System for Water Sector Based on an
Extension of the Eindhoven Classification Model. Water Resources Management,
29, 4927–4943.
Vicente, H., Couto, C., Machado, J., Abelha, A. & Neves, J. (2012a) Prediction of
Water Quality Parameters in a Reservoir using Artificial Neural Networks.
International Journal of Design & Nature and Ecodynamics, 7, 310–319.
Vicente, H., Dias, S., Fernandes, A., Abelha, A., Machado J. & Neves J. (2012b)
Prediction of the quality of public water supply using artificial neural networks.
Journal of Water Supply: Research and Technology – AQUA, 61, 446–459.
Vicente, H., Martins, M.R., Mendes, T., Vilhena, J., Grañeda, J., Gusmão, R. & Neves,
J. (2016) A Soft Computing Approach to Acute Coronary Syndrome Risk Evaluation.
Austin Journal of Clinical Cardiology, 3, Article ID 1044, 8 pp.
Vieira, J. (2018) Água e Saúde Pública. Edições Sílabo, Lisbon, Portugal.
References
178
Vilhena, J., Vicente, H., Martins, M.R., Grañeda, J., Caldeira, F., Gusmão, R., Neves, J.
& Neves J. (2016) A Case-Based Reasoning View of Thrombophilia Risk. Journal of
Biomedical Informatics, 62, 265– 275.
Vilhena, J., Vicente, H., Martins, MR., Grañeda, J., Caldeira, F., Gusmão, R., Neves, J.
& Neves, J. (2017) An Artificial Intelligence Approach to Thrombophilia Risk.
International Journal of Reliable and Quality E-Healthcare, 6, 48–68.
Walsh, G., Gouthier, M., Gremler, D. & Brach, S. (2012) What the Eye Does Not See,
the Mind Cannot Reject: Can Call Center Location Explain Differences in Customer
Evaluations?. International Business Review, 21, 957–967.
Wang, P., Yao, J., Guoqiang, W., Fanghua, H., Sangam, S., Baolin, X., Gang, X. &
Peng, Y. (2019) Exploring the application of artificial intelligence technology for
identification of water pollution characteristics and tracing the source of water
quality pollutants. Science of the Total Environment, 693, 133440.
Wang, Y., Wan, T., Tortajada, C. (2018) Water demand framework and water
development: The case of China. Water, 10, 1860.
Wenterodt, T. & Herwig, H. (2014) The Entropic Potential Concept: A New Way to
Look at Energy Transfer Operations. Entropy, 16, 2071–2084.
Westcott, R. (2013) The certified manager of quality/organizational excellence handbook.
3rd Edition, ASQ Quality Press, Milwaukee, United States of America.
WHO (1998) The World Health Report – Life in the 21st Century – A Vision for All.
World Health Organization, Geneva, Switzerland.
WHO (2020a) Laboratory Biosafety Guidance Related to Coronavirus Disease (COVID–19)
– Interim Guidance. World Health Organization Edition, Geneva, Switzerland.
WHO (2020b) Cleaning and disinfection of environmental surfaces in the context of
COVID-19 – Interim Guidance. World Health Organization Edition, Geneva, Switzerland.
Witten, I.H., Frank, E., Hall, M. A. & Pal, C.J. (2017) Data Mining – Practical Machine
Learning Tools and Techniques. 4th Edition, Morgan Kaufmann, Cambridge, United
States of America.

References
179
World Alliance for Patient Safety, (2005) WHO draft guidelines for adverse event reporting
and learning systems: from information to action. WHO Document Production Services,
Geneva, Switzerland.
Yanikkaya-Demirel, G., (2009), ISO 15189 Accreditation: Requirements for Quality and
Competence of Medical Laboratories, Experience of a Laboratory II. Clinical
Biochemistry, 42, 279–283.