Professional SQL Server Reporting Services
620
-
Upload
khangminh22 -
Category
Documents
-
view
4 -
download
0
Transcript of Professional SQL Server Reporting Services


Professional SQL Server®
Reporting Services
Paul TurleyTodd Bryant
James CounihanGeorge McKee
Dave DuVarney
Wiley Publishing, Inc.
68787_finalFM.qxp 26/03/2004 3:49 PM Page iii

68787_finalFM.qxp 26/03/2004 3:49 PM Page ii

Professional SQL Server®
Reporting Services
68787_finalFM.qxp 26/03/2004 3:49 PM Page i

68787_finalFM.qxp 26/03/2004 3:49 PM Page ii

Professional SQL Server®
Reporting Services
Paul TurleyTodd Bryant
James CounihanGeorge McKee
Dave DuVarney
Wiley Publishing, Inc.
68787_finalFM.qxp 26/03/2004 3:49 PM Page iii

Professional SQL Server® Reporting ServicesPublished byWiley Publishing, Inc.10475 Crosspoint BoulevardIndianapolis, IN 46256www.wiley.com
Copyright © 2004 by Wiley Publishing, Inc., Indianapolis, Indiana
Published simultaneously in Canada
ISBN: 0-7645-6878-7
Manufactured in the United States of America
10 9 8 7 6 5 4 3 2 1
No part of this publication may be reproduced, stored in a retrieval system or transmitted in any form or byany means, electronic, mechanical, photocopying, recording, scanning or otherwise, except as permittedunder Sections 107 or 108 of the 1976 United States Copyright Act, without either the prior written permis-sion of the Publisher, or authorization through payment of the appropriate per-copy fee to the CopyrightClearance Center, 222 Rosewood Drive, Danvers, MA 01923, (978) 750-8400, fax (978) 646-8700. Addressrequests to the Publisher for permission to the Legal Department, Wiley Publishing, Inc., 10475 CrosspointBlvd., Indianapolis, IN 46256, (317) 572-3447, fax (317) 572-4447, Email: [email protected].
For general information on our other products and services or for technical support, contact our CustomerCare Department within the U.S. at (800) 762-2974, outside the U.S. at (317) 572-3993 or fax (317) 572-4002.
Wiley also publishes its books in a variety of electronic formats. Some content that appears in print may notbe available in electronic books.
Trademarks: Wiley, the Wiley logo, Wrox, the Wrox logo, Programmer to Programmer, and related tradedress are trademarks or registered trademarks of John Wiley & Sons, Inc. and/or its affiliates in the UnitedStates and other countries, and may not be used without written permission. Microsoft SQL Server is atrademark of Microsoft Corporation in the United States and/or other countries. All other trademarks arethe property of their respective owners. Wiley Publishing, Inc. is not associated with any product or vendormentioned in this book.
LIMIT OF LIABILITY/DISCLAIMER OF WARRANTY: THE PUBLISHER AND THE AUTHOR MAKE NOREPRESENTATIONS OR WARRANTIES WITH RESPECT TO THE ACCURACY OR COMPLETENESS OFTHE CONTENTS OF THIS WORK AND SPECIFICALLY DISCLAIM ALL WARRANTIES, INCLUDINGWITHOUT LIMITATION WARRANTIES OF FITNESS FOR A PARTICULAR PURPOSE. NO WARRANTYMAY BE CREATED OR EXTENDED BY SALES OR PROMOTIONAL MATERIALS. THE ADVICE ANDSTRATEGIES CONTAINED HEREIN MAY NOT BE SUITABLE FOR EVERY SITUATION. THIS WORK ISSOLD WITH THE UNDERSTANDING THAT THE PUBLISHER IS NOT ENGAGED IN RENDERING LEGAL,ACCOUNTING, OR OTHER PROFESSIONAL SERVICES. IF PROFESSIONAL ASSISTANCE IS REQUIRED,THE SERVICES OF A COMPETENT PROFESSIONAL PERSON SHOULD BE SOUGHT. NEITHER THEPUBLISHER NOR THE AUTHOR SHALL BE LIABLE FOR DAMAGES ARISING HEREFROM. THE FACTTHAT AN ORGANIZATION OR WEBSITE IS REFERRED TO IN THIS WORK AS A CITATION AND/OR APOTENTIAL SOURCE OF FURTHER INFORMATION DOES NOT MEAN THAT THE AUTHOR OR THEPUBLISHER ENDORSES THE INFORMATION THE ORGANIZATION OR WEBSITE MAY PROVIDE ORRECOMMENDATIONS IT MAY MAKE. FURTHER, READERS SHOULD BE AWARE THAT INTERNETWEBSITES LISTED IN THIS WORK MAY HAVE CHANGED OR DISAPPEARED BETWEEN WHEN THISWORK WAS WRITTEN AND WHEN IT IS READ.
68787_finalFM.qxp 26/03/2004 3:49 PM Page iv

About the Authors
Paul TurleyPaul is an instructor for Netdesk Corporation in Seattle. As a consultant, he has worked with MicrosoftConsulting Services on enterprise-scale development projects and has created reporting solutions usingCrystal Reports, Active Reports, and Access. Since 1988, he has managed IT projects, designed andprogrammed applications using Visual Basic 3, 4, 5, 6, ASP.NET, ADO.NET, and SQL Server. He obtainedhis MCSD certification in 1996. Other certifications include MCDBA, IT Project+ and Microsoft SolutionsFramework (MSF) Practitioner.
He designed and maintains www.Scout-Master.com, a web-based service that enables Boy Scout units tomanage their membership and advancement records online using ASP.NET, SQL Server 2000, andReporting Services. Paul has been a contributing author on books and articles including ProfessionalAccess 2000 Programming, Beginning Access 2002 VBA, and SQL Server Data Warehousing with AnalysisServices from WROX Press.
My deepest appreciation goes to my wife, Sherri, and our children: Josh, Rachael, Sara, and Krista fortheir support and understanding while barricading myself in my office for four months. Thanks to ToddShelton, Lance Baldwin, and the rest of the Netdesk team for supporting our efforts and putting up withthis madness.
For their contributions, special thanks to: Tommy Joseph, Disney Internet Group; Andrew Bryan,Dundas Software; Dennis Higgins, Strafford Technology; Mario Raia, Combined IQ.
Paul Turley contributed Chapters 1, 3, 4, 5, 10, 14, and Appendices D and E to this book.
Todd BryantTodd has been creating custom data-focused applications and reporting solutions since the earlyeighties. He began using Microsoft technologies in 1998 and the love affair began. Todd has beencontract programming, teaching, and developing custom courseware every since. He is currentlyworking as a trainer at Netdesk Corporation, where he concentrates on Enterprise Solutions, Com+Services, and Object Oriented Programming using both VB.NET and C#. His certifications include theMCSD, MCSE, MCDBA, and MCT certifications from Microsoft, the CNA certification from Novell, andboth CompTIA's A+ and CTT+.
I would like to thank my parents Janice, Gary, and Abby for believing in me. I was not always who I amtoday. Secondly, I would like to thank my daughter Ali for putting joy in my life, Christine for showingme love, and Tommy and Stephanie for teaching me the true meaning of the word compromise. Lastly, Iwould like to thank the Lord above who placed so many good people in my life and made all thispossible.
Todd Bryant contributed Chapters 11 and 12 and Appendix C to this book.
68787_finalFM.qxp 26/03/2004 3:49 PM Page v

James CounihanJames started working with databases and reporting applications when doing research for thegovernment back in 1979. Since then his program management and development experience has beenprimarily in the retail and energy industries. He's been teaching development courses at NetdeskCorporation in Seattle for the past three years, focusing on integrating LOB applications using Microsoftapplication servers and web services.
Thanks to my wife and family. It was only with their understanding and support that I was able toparticipate in this project. With my deepest love and appreciation, thank you!
James Counihan contributed Chapters 6 and 8 and Appendix B to this book.
George McKeeGeorge McKee is a Solution Developer for Avanade Inc., a Seattle-based integrator for Microsofttechnology that's a joint venture between Accenture Ltd. and Microsoft. George specializes in the in-house financial systems of Avanade. He has a degree in Chemical Engineering from Brigham YoungUniversity and has been using computers and databases to resolve technical and business problems for25 years. George has MCAD and MCSD certifications. When not sitting in front of a computer, Georgelikes to be found in backcountry skiing in the Washington Cascade Mountains. He can be reached viaemail at [email protected].
I would like to thank my wife Becky for tolerating various forms of computing at meal times and myphysical and mental absence from many family activities while writing this book. My children (GeorgeJr., Ben, Rosie, and Emily) deserve an honorable mention for patience with my generally distractedinterest in their activities during the production of this book.
George McKee contributed Chapter 13 and Appendix A to this book.
Dave DuVarneyDave DuVarney is a Senior Consultant at Aspirity, LLC where he provides consulting and trainingservices in the fields of business intelligence and software development. He brings over 5 years offinance, programming, and development methodologies experience to high technology businessintelligence solutions. Prior to joining Aspirity, Dave was a development instructor teaching a widerange of Microsoft technologies. Dave also spent his early career working for a Seattle-based CPA firm.
When Dave is not working, he enjoys running. At the time of publishing, he is training for his first fullmarathon.
I would like to thank my wife, Stephanie, for all the love and support she has provided in this process. Iwould also like to thank my parents, Marcus and Trudy, for giving me the opportunities that havehelped me succeed in life.
Dave DuVarney contributed Chapters 2 and 9 to this book.
68787_finalFM.qxp 26/03/2004 3:49 PM Page vi

AuthorsPaul TurleyTodd BryantJames CounihanGeorge McKeeDave DuVarney
Acquisitions EditorsSharon CoxKatie Mohr
Vice President and Executive GroupPublisherRichard Swadley
Vice President and Executive PublisherRobert Ipsen
Vice President and PublisherJoseph B. Wikert
Executive Editorial DirectorMary Bednarek
Editorial ManagerKathryn A. Malm
Production EditorPamela Hanley
Book ProducerPeer Technical Services Pvt. Ltd.
Credits
68787_finalFM.qxp 26/03/2004 3:49 PM Page vii

68787_finalFM.qxp 26/03/2004 3:49 PM Page viii

Foreword
Jason CarlsonMany people have asked me, "How can you be so passionate about reporting when it is so mundane?"To me the most exciting thing about reporting is that it is so very common. Like basic transportation,everybody uses it in some way or another. A report is a piece of art, meant to covey a message; butunlike traditional art, that message changes based on the data driving it. The potential to help, and beused by, millions of people and companies is one of the reasons I started writing software andeventually joined Microsoft. No other company can reach out to so many people by making greatproducts accessible.
Reporting is a very broad topic covering areas ranging from packing lists and telephone bills to ad hocanalysis and Excel spreadsheets. When designing Microsoft SQL Server Reporting Services, I startedwith a simple definition for it: an information delivery platform. While this definition is also very broad,it did allow us to focus on our design while leaving us significant room to expand in later versions. Thisbook will help you understand the power of Reporting Services and fully to utilize its capabilities.
Information is not just data; it is data that has been transformed into something meaningful. Thistransformation is important. Any tool can read and display data; what people really need for doing theirjobs is well thought out, correct, and pertinent information. There are many tools that allow anyone withaccess to data to build "views" or "reports". However, many times these users are unfamiliar with all ofthe nuances of the data storage and can produce inaccurate results or inadvertently affect theperformance of the data engine. Reporting Services acts as the official source so that there is only oneversion of the truth that everyone uses.
In future, Microsoft plans to take this even further by integrating with Information Rights Managementso that not only does the information come from a single source, but is also certified, can expire, and isaccess-controlled even after it is delivered to the end user. The data does not always exist in onedatabase or even come from a database. For those of us who have spent careers working with corporatedata, this is a painful truth. Very few reports (or sets of reports that give you sufficient insight) comefrom a single source. Building some type of data mart or data warehouse is the best solution, but notalways possible due to timing, policy, or budgetary constraints. Reports must be able to retrieve datafrom any source and combine them in a single report.
What good is information if you do not have it when you need it? Delivering information is more thanjust processing it and making it available; it is providing information when you need it, in any format,and on any device that you have. The common case today is the ubiquitous online access via HTML in abrowser. This is perfect when you have a computer and connectivity to the server. However, as we allknow, nothing is perfect. We need the reports when we are on a plane, in a car, with the customer, at thegame, on the production floor, etc. This may include your pager, telephone, fax machine, laptop, paper,and other devices. We also need different capabilities: interactivity, pixel perfect printing, integrationinto applications like MS Excel for "What if" scenarios and additional analysis, universal access via PDF,etc. A single format and a single delivery channel is not enough, but how do you know which ones you
68787_finalFM.qxp 26/03/2004 3:49 PM Page ix

x
Foreword
will need? Reporting Services insulates you from these choices. All reports may be distributed in anychannel or rendered in any format. Report design is independent of how it will be consumed. It is theresponsibility of the system to provide the report as accurately as possible, given the constraints of thespecific format or channel requested.
Building a platform is very different from building a solution. In fact the goals are in many casescompletely opposed. A platform is successful if the developers and administrators have complete accessto all aspects of the product. They need to be able to optimize, extend, restrict, embed, and replace partsof the product to meet their needs. This means that all of the APIs are available and documented, allformats are open and described, and every component is configurable or replaceable. While there arealways restrictions due to the many tradeoffs in software design, this was the goal when buildingReporting Services. Very much like Windows, SQL Server, or Visual Studio, Reporting Services isdesigned to enable developers to build on a solid foundation and mold it to meet the business needs insignificantly less time and with more functionality, but without losing the flexibility and power ofbuilding it themselves.
Looking to the future, there's an endless list of features and scenarios that Microsoft will add to make theplatform more powerful with little or no additional in-house development required. I have mentionedsome, and there are many that haven't even been considered yet.
We look forward to hearing from all of our customers about what is important to them and how we canmake designing, building, and operating their information delivery systems easier, faster, and (I hope)more fun.
Jason CarlsonSQL Server Reporting Services Product, Unit Manager, Microsoft
Jason Carlson is the Product Unit Manager for SQL Server Reporting Services. He joined Microsoft in1996 as a Program Manger for Visual Source Safe and Repository. In 1997, the Repository team joinedSQL Server and Jason became the development manager for SQL Server Meta Data Services. In 2001,he built a team and started work on V1 of Reporting Services. Before joining Microsoft, Jason ownedand operated an independent software development company. This company provided consulting andvertical software solutions for healthcare and telecommunications.
.
68787_finalFM.qxp 26/03/2004 3:49 PM Page x
Foreword
David CunninghamAgility. In business today, key decisions must be made daily or weekly rather than monthly or quarterly.Leading companies realize that to increase the speed of competitive response, their corporate agility,they need to delegate as much decision-making authority as possible to employees on the front lines.Real-time bidding systems, reverse auctions, accurate costing on spot production, build-to-ordermanufacturing, a world-wide labor force, and globalization. These are just a handful of the trends intoday's business climate that demand better decisions faster.
To be successful in this new model, employees need the best quality information they can possibly get.Information must be accurate, timely, and reliable; and it must be the information they need. Whetheryour employees are trying to maximize revenues by intelligently attacking new markets, or minimizingexpenses through astute purchasing, they absolutely must have the right information at their fingertips.
Microsoft's release of SQL Server 2000 Reporting Services marks an important milestone in the world ofbusiness intelligence: information truly accessible to the masses. By building reporting functionalitydirectly into Microsoft's Enterprise Data Platform, SQL Server 2000, software developers andinformation architects can now count on the availability of a high quality, scalable, and robustarchitecture on which to build their reporting systems.
For the past 20 years Business Intelligence (BI) has been working its way deeper and deeper into theEnterprise. Previously, the domain of a handful of highly skilled analysts high in the corporate ivorytower, BI is now in the hands of line managers, department heads, and knowledge workers at the veryedge of today's organizations.
In the past, dependable reporting systems could be horrendously expensive, with organizations forcedto deploy robust reporting services only where the greatest gains could be realized. Microsoft's long-standing objective of reducing information technology cost to spur adoption is again evident in the SQLServer 2000 Reporting Services licensing model. This technology is licensed to anyone currently licensedfor SQL Server 2000 and so essentially represents no additional cost. This is a fantastic development forsoftware developers and users alike; it will dramatically increase the adoption and distribution ofdetailed, accurate, and timely reporting and will push quality BI even further down into the Enterprise.
In this excellent book, the authors walk us through SQL Server 2000 Reporting Services from the basicsof practical reporting through deployment and management of reporting solutions written for BISolution architects, designers and developers; it is certainly a most valuable resource.
David CunninghamPresident & CEO, Dundas Software
Dundas Software has provided charting and graphing technology under license to Microsoft forinclusion in SQL Server 2000 Reporting Services and is readying additional data visualizationextensions for the next version of SQL Server, code-named 'Yukon'.
68787_finalFM.qxp 26/03/2004 3:49 PM Page xi

68787_finalFM.qxp 26/03/2004 3:49 PM Page xii

Contents
Introduction xxvii
Chapter 1: Getting Started with Reporting Services 1Who Is This Book for? 2Agility 2The Way We Were 3That Was Then, This Is Now 4Business Intelligence and Decision Support 4Automation to the Rescue – A Scenario 5Challenges of Existing Reporting Solutions 6How Does SQL Server Reporting Services Meet This Challenge? 7Business Intelligence Solutions 8Who Uses Reports and Why? 8
Executive Leadership 9Managers 9Information Workers 9Customers 10Vendors and Partners 10
Reporting with Relational Data 10Reporting for Decision Support 10Data Warehouses 10The Reporting Lifecycle 11Report Delivery Application Types 12
Web Browser 12Office Applications 12Programmability 13Subscriptions 13Report Formats 13Importing Data/Exchanging Data 13
System Requirements 13Installing Reporting Services 15
Setup Options 15Adding and Removing Options 16
Server Components 16Client Components 16
Books Online 17Reporting Services Samples 17AdventureWorks Database 17
68787_finalFM.qxp 26/03/2004 3:49 PM Page xiii

xiv
Administrative Tools 17Command Line and Unattended Installation 18Log Files 18
Email Delivery 18Designing Reports 18
Form Reports 18Tabular Reports 18Groupings and Drill-Down 19Drill-Through Reports 19Multi-Column Reports 19Matrix 19Charts 19Data Sources 19Queries 19OLAP Reporting 20
Using Visual Studio .NET 20Report Wizard 20The .NET Framework 20
Custom Reporting Extensions 21Data Processing Extensions 21Delivery Extensions 21Configuration Files 21Scripting 22
Subscriptions 22Securing Reports 22The Report Manager 23
Designing Reports 24URL Access to Reports 26Rendering Reports in Program Code 26
Report Definition Language 26Deploying Reports 27Designing and Architecting Report Solutions 27
Summary 27
Chapter 2: Reporting Services Architecture 29The Reporting Lifecycle 30
Authoring 30Management 30Delivery 31
Reporting Services Features 31Visual Studio .NET 2003 Integration 31
Query Designer 31Server Explorer 31Visual Source Safe 32Report Designer 32
Report Server Features 32Central Report Storage 32Security 32Report Delivery 33
Contents
68787_finalFM.qxp 26/03/2004 3:49 PM Page xiv

xv
Chapter Title
Scheduling 33Programming Interface Features 34
Open Architecture 34Complete Access 34
Report Server Components 34Report Processor 34
Report Request Handling 35Report Definition 35Intermediate Format 35Caching 35Session Cache 35Cached Instances 35Snapshots 36Report Processing Illustrated 36
Data Processing Extensions 37Data Processing Defined 37Supported Providers 37
SQL Server Provider 37Oracle Provider 37OLEDB Provider 37ODBC Processing Extension 38
Data Processing Extensions and Data Providers 38Supported Rendering Extensions 39Excel 39PDF 39HTML 39Web Archive (MHTML) 40CSV 40TIFF 40XML 40
Customized Extensions 41Scheduling and Delivery Processor 41Scheduling 41Delivery 42Scheduling and Delivery Processor Illustrated 43
Email 45File Share 45Custom Extensions 45
Report Server Databases 46ReportServer Database 46ReportServerTempDB Database 47Viewing Execution Information 48
The Reporting Services Web Service 48Web Services 48Open Standards 48Visual Studio .NET Integration 49Available Features 49
Report Designer 50Visual Studio .NET 50Report Definition Language (RDL) 50
Contents
68787_finalFM.qxp 26/03/2004 3:49 PM Page xv

xvi
Reporting Services Tools 50Report Manager 50Report Server Command-Line Utility (RS.EXE) 51
Reporting Services Illustrated 51Summary 52
Chapter 3: Designing Reports 55Using the Report Wizard 56
Establishing a Data Source 57Building a Query 59Define the Report Structure 62Specify the Deployment Location 63The Report Designer 65Scale Units 65
Importing Reports 68Using RDL 69Importing Access Reports 69
Plan for Extensibility 69Browser Compatibility 70Offline Viewing 70Mobile Device Support 71
Report Items and Data Regions 71Textbox Report Item 72Line Report Item 73Rectangle Report Item 74Image Report Item 74Subreport Item 76Chart Report Item 77Drill-Down and Drill-Through Reports 79Tabular Reports 80Grouping Data 80
Table Report Data Region 80List Report Data Region 80Matrix Report Data Region 81
Subtotals 82Formatting 85
Standard Formatting 85Explicit Formatting 86Conditional Formatting 88Multiple Columns 89
Pagination Control 90Page Breaks for a Rectangle 91Page Breaks for a List 91Page Breaks for a Table 92Page Breaks for a Group 92Page Breaks for a Matrix 93Page Breaks for a Chart 93
Printing Considerations 93Summary 94
Contents
68787_finalFM.qxp 26/03/2004 3:49 PM Page xvi
xvii
Chapter Title
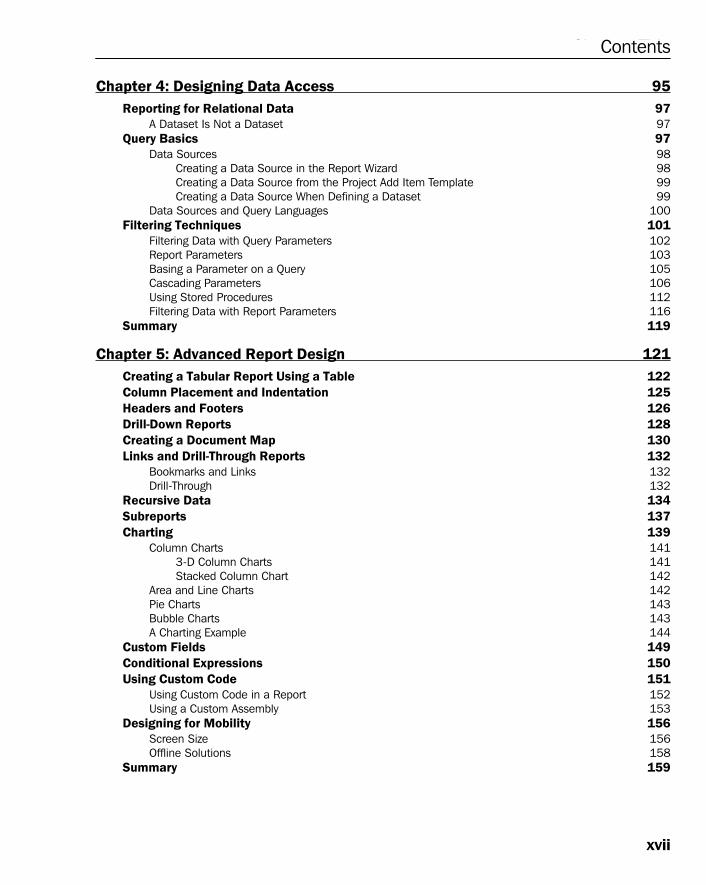
Chapter 4: Designing Data Access 95Reporting for Relational Data 97
A Dataset Is Not a Dataset 97Query Basics 97
Data Sources 98Creating a Data Source in the Report Wizard 98Creating a Data Source from the Project Add Item Template 99Creating a Data Source When Defining a Dataset 99
Data Sources and Query Languages 100Filtering Techniques 101
Filtering Data with Query Parameters 102Report Parameters 103Basing a Parameter on a Query 105Cascading Parameters 106Using Stored Procedures 112Filtering Data with Report Parameters 116
Summary 119
Chapter 5: Advanced Report Design 121Creating a Tabular Report Using a Table 122Column Placement and Indentation 125Headers and Footers 126Drill-Down Reports 128Creating a Document Map 130Links and Drill-Through Reports 132
Bookmarks and Links 132Drill-Through 132
Recursive Data 134Subreports 137Charting 139
Column Charts 1413-D Column Charts 141Stacked Column Chart 142
Area and Line Charts 142Pie Charts 143Bubble Charts 143A Charting Example 144
Custom Fields 149Conditional Expressions 150Using Custom Code 151
Using Custom Code in a Report 152Using a Custom Assembly 153
Designing for Mobility 156Screen Size 156Offline Solutions 158
Summary 159
Contents
68787_finalFM.qxp 26/03/2004 3:49 PM Page xvii

xviii
Chapter 6: Managing Reports Using the Report Manager 161Introduction to the Report Manager 161
What Is Report Management? 162Understanding the Report Manager 162The Report Manager Interface 163Navigating the Report Manager Interface 165
Navigation Tools 165Breadcrumb Trail 166Tabs and Options Toolbar 166Local Menu 166Global Toolbar and Details Button 167Searching for Folders and Reports 168The Report Manager Help 168
About System Site Settings 168Report History Default Settings 169Report Execution Timeout 169Report Logging 169About My Reports 170
Working with Folders and Reports 171Creating New Folders 171Moving Items into a Folder 172
Working with Data Sources 174Configuring Shared Data Sources 175Data Source Credentials 177
Credentials Supplied by the User 177Credentials Stored Securely 178
Configuring Users and Permissions 178About Report Manager Security 178Understanding Role-Based Security 179Using Report Manager Default Security 179Understanding Roles 180Understanding Tasks 180System Tasks and Item Tasks 181Understanding the Predefined Roles 181
System Administrator 182System User 183Content Manager 183Publisher 184My Reports 184The Browser Role 184
Creating a New Role Definition 185Understanding Role Assignments 186Creating Role Assignments 187
System Security and Network Considerations 189Revoking Access to My Reports 190Intranet and Extranet Considerations 190
Viewing, Executing, and Scheduling Reports 191Viewing Reports 191Linked Reports 191On-Demand Reports and Subscriptions 191
Contents
68787_finalFM.qxp 26/03/2004 3:49 PM Page xviii

xix
Chapter Title
The Report Execution Process 192Providing Report Parameters and Credentials 193
On-Demand Reports 194Caching the Report for Other Users 194Creating and Editing Schedules 196Snapshot Reports 198Creating a Report History 199
Report Subscriptions 200Standard Subscriptions 202Data-Driven Subscriptions 202
Summary 203
Chapter 7: Managing Reports Using Program Code 205Professional SQL Reporting Services Manager 205Building the Visual Interface 207Adding a Reference to the Web Service 210Consuming the Web Service 212Filling the Treeview 215Credentials 219Displaying the Folder Contents 221Adding/Updating Folders 223
Folder Form 225Deleting an Item from a Folder 238Importing Report Definition Files 240Managing Security 244
Tasks 244Roles 244Policies 244Building the Security Forms 244
Policy Form 244Adding, Editing, and Deleting Security Policies 250Adding, Editing, and Deleting Security Roles 261
RoleForm 261Adding, Editing, and Deleting Roles 266
Role Task Form 266Summary 275
Chapter 8: Report Scripting 277Command Line Utilities 277
rsconfig 278rskeymgmt 278rsactivate 279rs 279
Automating Server and Report Management 279Reporting Services RS Utility 280
RS Utility Command Line Syntax 280RS Utility Errors 282
Contents
68787_finalFM.qxp 26/03/2004 3:49 PM Page xix

xx
Script Development 283Script Format Requirements 283Namespaces Available 283
System 283System.IO 284System.Xml 284System.Web.Services 284Reporting Services Web Service 284
Building a Script Development Harness 285Creating the Console Project 285Adding Imports Statements 287Adding References 288Using Conditional Compilation 290
Accessing Server Items 291Creating the Proxy Instance 291Passing Variable Values to the Script 293Retrieving Items 293Building Message Content 293
Retrieving Reports 295Retrieving Report Items 295Getting Report Definitions 296
Deploying Reports 297The CreateReport Method 297Error Handling 298
Logging Events 298Opening the File 298Writing XML Nodes 299
Running the Script 301Scheduling the Script 302Summary 305
Chapter 9: URL Access and Programmatic Rendering 307URL Access 308
URL Syntax 308Accessing Reporting Services Objects 308
Folders 309Data Sources 309Resources 311Reports 312
Reporting Services URL Parameters 312Parameter Prefixes 313Parameters 314
Passing Report Information through the URL 318Report Parameters 318Rendering Snapshot History 319URL Rendering Summary 319
Programmatic Rendering 320Common Scenarios 320
Custom Security 320
Contents
68787_finalFM.qxp 26/03/2004 3:49 PM Page xx

xxi
Chapter Title
Server-Side Parameters 320Rendering through Windows 321
Building the Application Interface 321Setting Up the Reporting Service Web Service 321Retrieving Report Information 325Retrieving Report Parameters 328Rendering a Report to a File System 330Rendering a Report to the File System Summary 337
Rendering to the Web 337Using Integrated Authentication 337Modifying the web.config File 338Setting Up the Reporting Service Web Service 339Rendering to the Response Object 339Rendering to the Web Summary 345
Summary 346
Chapter 10: Report Caching and Subscriptions 347Report Delivery 347
Caching 347Cached Instances 349Snapshots 349
History 349Storing Parameters 350
Parameterized Filters 350Configuring Credentials for Data Sources 351
Storing Credentials 351Linked Reports 353
Configuring Cached Reports 353Subscriptions 357
Snapshot-Triggered Subscriptions 358Schedule-Triggered Subscriptions 359
Individual and Shared Schedules 359Configuring Email Delivery 361File Share Subscriptions 361
Pocket PC Report File Updates 363Data-Driven Subscriptions 363Managing Subscriptions 365Using the Reporting Service Web Service 366Managing Subscriptions Using Script 375Summary 376
Chapter 11: Report Definition Language 379RDL – Underlying Technology 379
What Is XML? 380XML Naming Rules 380
XML Elements 380XML Attributes 381XML Documents 382XML Namespaces 383
Contents
68787_finalFM.qxp 26/03/2004 3:49 PM Page xxi

xxii
XML Schema 384What Is RDL? 388
Document RDL 390Data RDL 392Control RDL 396
TextBox 396Line 397Rectangle 397Table 397Matrix 398List 399Image 399Subreport 400Chart 400
Creating RDL 401RDL with .NET 401RDL with CodeSmith 402
Summary 409
Chapter 12: Extending Reporting Services 411Overview 411The Missing Pieces 412
Security Extensions 412Rendering Extensions 412Extensible Report Designer Classes 413
Business Opportunities 413Common Extension Interfaces 413
What Is an Interface? 414IExtension 414IDisposable 415Interface Language Differences 415Data Processing Extensions 416
Creating a Custom Data Processing Extension 418Creating the Project 418Creating the CSVConnection Object 419
Variable Declarations 419Constructors 420Implementing IDbConnection 420Implementing IDisposable 421BeginTransaction Function 421CreateCommand Function 421Open Method 422Close Method 422ConnectionString Property 423ConnectionTimeout Property 423
Creating the CSVParameter Class 424Declarations 424
Implementing IDataParameter 424ParameterName Property 425Value Property 426
Contents
68787_finalFM.qxp 26/03/2004 3:49 PM Page xxii

xxiii
Chapter Title
Creating the CSVParameterCollection Class 426Namespaces 426Implementing IDataParameterCollection 427
Creating the CSVCommand Class 428Constructors 428Implementing IDbCommand 429Cancel Method 430ExecuteReader Function 430CommandText Property 431CommandTimeout Property 432CommandType Property 432CreateParameter Function 433Parameters Property 433
Creating the DataReader Object 434Declarations 434Implementing IDbDataReader 434GetFieldType Function 435GetName Function 436GetOrdinal Function 436GetValue Function 436Read Method 437FieldCount Property 438
Installing the CSVDataProcessing Extension 438Testing the CSVDataExtension 439
Summary 441
Chapter 13: Deployment Strategies 443Architecture Review 443
Reporting Services Components 443Report Manager 444
Report Organization 444Report Management 444Site Management 444
Clients 445Report Designer 445Report Consumer 445
Reporting Services Web Service 446Scale Up 446Scale Out 446
Report Server 446Report Server Databases 446
ReportServer 447ReportServerTempDB 447
Reporting Services Components Illustrated 447Reporting Services Deployment Scenarios 448
Small Deployment 449Medium/Large Deployment 450Enterprise Deployment 451
Contents
68787_finalFM.qxp 26/03/2004 3:49 PM Page xxiii

xxiv
System Requirements and Prerequisites 452Server Requirements 452
Licenses 454Report Server Database 454.NET Framework Requirement 454Configuring Windows Server 2003 Application Server 454
Client Requirements 456Report Designer Requirements 457Accounts and Credentials 457
Installation 457Ongoing Operations 458
Installation and Configuration 458Running Setup 458
SQL Server Instance 461Database Name 461Database Credential 461
Finishing the Setup 462Scaling Up Reporting Services 462
Report Server 462Credentials 463
Server Configuration Files 463Configuring Using the Command Line Utility 464
Administrative Issues 465Database Space Requirements 465Backup and Restore 466
Report Server Database Backup 466Encryption Key Backup 466
Security Administration 467Report Server Site 467Report Server Items 468
Server Monitoring 469Execution Log 470
Summary 471
Chapter 14: Designing Business Intelligence Reporting Solutions 473Approaching Solution Design 474
Define the Business Problem 474Performance Gaps 474Missed Opportunity Costs 474Current State/Future State 475Business Goals and Objectives 475
Direction 475Solution Design 476
Security 477Manageability 478Availability 478Scalability 479
Transactional and Decision-Support Data 480Concurrency 481Strategic Latency 481
Contents
68787_finalFM.qxp 26/03/2004 3:49 PM Page xxiv

xxv
Chapter Title
Why Be Normal? 481Understanding Business Intelligence 482BI Process Lifecycle 482
Information Gathering 483Data Scrubbing and Consolidation 483Data Staging and Transformation 484Indexing Strategies 484Decision-Support 485Query Languages 487
Multidimensional Expressions (MDX) 487OLAP and SQL Server Analysis Services 487
Architecting BI Solutions 490Farms and Gardens 490Federating and Partitioning Data 491
Reporting Solution Design 491System Environments 491
Small Environments 492Medium Environments 492Large Environments 492
Content Organization 493Security-Based Content Structure 493
Solution Profiles 494Linked Reports for Multiple Field Offices 494Scout-Master.com 496
Reporting Solution Development Environment 498Isolated Development 498
Using Source Safe 499Staging Reports 499
Summary 499
Appendix A: Troubleshooting 501Resources 501
Reporting Services Books Online 501Microsoft Knowledge Base 502Microsoft Newsgroups 502MSDN 502
Tools 502Installation Errors 503Credentials Errors 504Changing Database Connection Information 504Service Errors 504Data Access Errors 505Report Errors 505Subscription Errors 506Subscription Errors 507
Contents
xxv
68787_finalFM.qxp 26/03/2004 3:49 PM Page xxv

xxvi
Appendix B: Migrating Access Reports 509Property Settings 510Functions 513Report Elements 513
Appendix C: Reporting Services Object Model 515
Appendix D: Transact SQL Query Functions and Expressions 547Naming Conventions 547
Tables 547Columns 548Views 548Stored Procedures 548User-Defined Functions 549Multi-Part Names 549
Functions 549Numeric Manipulation 549String Manipulation 550Mathematical 552Dates 553Aggregate Functions 554Grouping Variations 554Type Conversion and Formatting 555Logic 555Query Criteria 555
Appendix E: Configuration Files 557XML Basics 557Configuration Files 558
The RSReportServer.config File 558The RSWebApplication.config File 559The ReportingServicesService.exex.config File 560The RSReportDesigner.config File 560
Contents
68787_finalFM.qxp 26/03/2004 3:49 PM Page xxvi

Introduction
SQL Server Reporting Services is a serious reporting platform that delivers real business intelligence toknowledge workers and business decision makers. It has the ability to render reports in many differentformats and also to execute those reports on demand, cache, archive, or automatically deliver them tousers. Whether you need reports to extend a custom desktop application, web site or a simple out-of-the-box reporting solution, Reporting Services can make it happen. The fact that Microsoft makes thiscapability available as an extension to their flagship database product with no additional investment isexciting news.
Whether you're a novice or an advanced-level programmer, you'll learn to create reports with the righttools for the job. We start with the architecture of Reporting Services and learn about its foundation of.NET and XML web services. You will learn how easy it is to design reports practically for any datasource. We cover the basics thoroughly and show you everything you need to get started, workingthrough the processes of report authoring, management, and delivery. You'll create dynamic, interactivereports with drill-down and drill-through features. With the use of tables, groupings, subreports,matrices, images, and charts, reports can be attractive and to-the point. You'll use the Report Manager toconfigure and execute reports. Next, we'll extend the capabilities of advanced reports using .NETprogramming code and custom expressions.
After several comprehensive exercises in report design, we will build custom viewing and managementtools for advanced reporting solutions. You'll learn to use objects in code and script to render reports,create custom data processing extensions, and manage security and subscriptions. You'll learn how todesign and extend reports with the Report Definition Language (RDL).
Finally, we'll put all the pieces together and discuss designing complete solutions and deploying reportsand Reporting Services in your business environment. Five experienced authors have worked very hardover several months to make this book a comprehensive tutorial and source of useful information. Wesincerely hope it will be a valuable addition to your reference library.
Who Is This Book for?William Shatner once said that the needs of the many outweigh the needs of the few. We've done ourbest to dispel this myth and wanted this book to meet the needs of as many people as possible. As someof us have traveled around the United States teaching and presenting Reporting Services, we've come torealize that there isn't a "typical" Reporting Services user. This book was written to address the needs ofdevelopers, serious reporting professionals who may be less experienced programmers or non-programmers, system administrators, and solution designers. To meet this objective, we begin with thebasics of report design and then progress, chapter-by-chapter, through more advanced design andprogramming techniques. We sincerely hope it will be a valuable addition to your reference library.
68787_finalFM.qxp 26/03/2004 3:49 PM Page xxvii

xxviii
What Does This Book Cover?Introduction to Reporting Services
In Chapters 1 and 2, you will learn what Reporting Services really is and what makes it a unique andpowerful reporting solution. We will introduce the stages of the reporting lifecycle and frame the stepsand tasks necessary to create a functional reporting solution.
Authoring Reports
This section spans Chapters 3, 4, and 5. These three chapters will teach you how to design reports usingthe report project template in Visual Studio .NET and the report designer tools. Using all of the availablereport items and data range items, you will create powerful reports with data groupings, conditionalformatting, drill-down and drill-through features.
In Chapter 3, you will learn the basics and shows you how to use the Report Wizard and Report Designerenvironment in Visual Studio.NET.
In Chapter 4, you will learn how to plan and create data sources, design queries, and work withparameters and filtering techniques.
Chapter 5 will introduce you to advanced programming techniques using in-line expressions, customcode, and reusable code assemblies.
Managing Reports
In Chapter 6, you will use the Report Manager to configure, secure and manage the execution of reportsorganized by business units or categories. You will also learn the basics of caching, creating snapshotsand history, and creating subscriptions.
In Chapter 7, you will learn how to manage reports using the Reporting Services Web Service throughcustom program code.
In Chapter 8 you will learn how to manage and administer all reports and your Report Server usingcommand line and batch scripting.
Report Delivery
In Chapter 9, you will learn you how to render reports using program code with the Reporting ServicesWeb Service. This powerful feature can be used to integrate reporting into custom business applications,creating a seamless user experience.
In Chapter 10, you will learn the details of subscriptions—giving users the ability to have reportsdelivered to them on a regular schedule. Using custom program code, subscriptions and snapshots maybe used to deliver important business information to users when data changes and as conditions arise.
Advanced Topics
Introduction
68787_finalFM.qxp 26/03/2004 3:49 PM Page xxviii

xxix
Chapter Title
Chapter 11 explores the details of RDL and shows you how to define reports in file-based XML. Usingcustom tools and programming, reports may be designed and created outside of the Visual Studio.NETenvironment. You will walkthrough an end-to-end solution using a third-party tool.
Chapter 12 will take you into the core of Reporting Services and show you how to replace and enhanceits fundamental capabilities. You will create a custom data processing extension and see how thearchitecture supports the ability to build your own data access, security, and rendering extensions.
Chapter 13 discusses the nuts and bolts of deployment and report server administration. You will learn toplan and design a scalable and secure Reporting Services solution.
Finally, Chapter 14 offers a birds-eye view of Business Intelligence (BI) and discusses the concepts andissues involving database design, indexing, and delivering enterprise-wide decision-support systems.
What You Need To Use This BookIn order to use SQL Server Reporting Services and to run the samples in this book, you will need:
❑ SQL Server 2000, any edition. An evaluation version of SQL Server and Reporting Services maybe downloaded from Microsoft at http://www.microsoft.com/sql.
❑ Windows 2000, Windows Server 2003, or Windows XP.
❑ Visual Studio .NET 2003, any edition.
❑ Pentium II class PC with a 500 MHz processor and 256 megabytes of RAM.
The complete source code for the samples is available for download from our web site athttp://www.wrox.com/. There are versions available in both Visual Basic .NET and C#. (See the Source Codesection later in this introduction.)
ConventionsTo help you get the most from the text and keep track of what's happening, we've used a number ofconventions throughout the book.
Tips, hints, tricks, and asides to the current discussion are offset and placed in italics like this.
As for styles in the text:
❑ We highlight important words when we introduce them
❑ We show keyboard strokes like this: Ctrl+A
Boxes like this one hold important, not-to-be forgotten information that is directlyrelevant to the surrounding text.
Introduction
68787_finalFM.qxp 26/03/2004 3:49 PM Page xxix

xxx
Introduction
❑ We show file names and code within the text like so: persistence.properties
❑ We present code in two different ways:
The Code Foreground style shows new, important, pertinent code. We indentthe 2nd line to show that you should enter both lines on one line.
The Code Background style shows code that's less important in the presentcontext or has been shown before.
Occasionally, code that needs to be placed all on one line is split over two because of the layout of thebook, as shown in the preceding highlighted code. However, make sure you type it all on one line.
Source CodeAs you work through the examples in this book, you may choose either to type in all the code manuallyor to use the source code files that accompany the book. All of the source code used in this book isavailable for download at http://www.wrox.com. Once at the site, simply locate the book's title (either byusing the Search box or by using one of the title lists) and click the Download Code link on the book'sdetail page to obtain all the source code for the book.
Because many books have similar titles, you may find it easiest to search by ISBN; for this book theISBN is 0-7645-6878-7.
Once you download the code, just decompress it with your favorite compression tool. Alternately, youcan go to the main Wrox code download page at http://www.wrox.com/dynamic/books/download.aspx to seethe code available for this book and all other Wrox books.
ErrataWe make every effort to ensure that there are no errors in the text or in the code. However, no one isperfect, and mistakes do occur. If you find an error in one of our books, like a spelling mistake or faultypiece of code, we would be very grateful for your feedback. By sending in errata you may save anotherreader hours of frustration and at the same time you will be helping us provide even higher qualityinformation.
To find the errata page for this book, go to http://www.wrox.com and locate the title using the search box orone of the title lists. Then, on the book details page, click the Book Errata link. On this page you can viewall errata that has been submitted for this book and posted by Wrox editors. A complete book listincluding links to each book's errata is also available at www.wrox.com/misc-pages/booklist.shtml.
If you don't spot your error on the Book Errata page, go to www.wrox.com/contact/techsupport.shtml andcomplete the form there to send us the error you have found. We'll check the information and, ifappropriate, post a message to the book's errata page and fix the problem in subsequent editions of thebook.
68787_finalFM.qxp 26/03/2004 3:49 PM Page xxx

xxxi
Chapter Title
p2p.wrox.comFor author and peer discussion, join the P2P forums at p2p.wrox.com. The forums are a web-basedsystem for you to post messages relating to Wrox books and related technologies and interact with otherreaders and technology users. The forums offer a subscription feature to email you topics of interest ofyour choosing when new posts are made to the forums. Wrox authors, editors, other industry experts,and your fellow readers are present on these forums.
At http://p2p.wrox.com, you will find a number of different forums that will help you not only as you readthis book, but also as you develop your own applications. To join the forums, just follow these steps:
1. Go to p2p.wrox.com and click the Register link.
2. Read the terms of use and click Agree.
3. Complete the required information to join as well as any optional information you wish toprovide and click Submit.
4. You will receive an email with information describing how to verify your account and completethe joining process.
You can read messages in the forums without joining P2P, but in order to post your own messages, youmust join.
Once you join, you can post new messages and respond to messages other users post. You can readmessages at any time on the Web. If you would like to have new messages from a particular forum e-mailed to you, click the Subscribe to this Forum icon by the forum name in the forum listing.
For more information about how to use the Wrox P2P, be sure to read the P2P FAQs for answers toquestions about how the forum software works as well as many common questions specific to P2P andWrox books. To read the FAQs, click the FAQ link on any P2P page.
AcknowledgmentsOur thanks to the members of the product team for making themselves accessible and responsive. Weappreciate you allowing us to participate—in a small way—in the process of making this a greatproduct. You've done a fantastic job! To Jason Carlson and the rest of his team, thanks taking the time tofield questions and support our efforts with this book.
Kudos to Andrew Bryan and David Cunningham at Dundas Software for your help with the chartingfeatures. The integration in the product is awesome and your assistance has been invaluable. Thanks toDennis Higgins from Strafford Technology and Mario Raia from Combined IQ for your businessperspectives. To Tommy Joseph from Disney Internet Group: thanks for starting all of this madness. Weowe you cheesecake with bacon. A big thank you goes to Eric Smith for contributing his code generationtool, CodeSmith, to the development community and the RDL templates to generate custom reports.
Special thanks goes to the Todd Shelton, Lance Baldwin, and the rest of the Netdesk team for yourpatience and support as we've tested the limits of time, energy, and human sanity.
Introduction
68787_finalFM.qxp 26/03/2004 3:49 PM Page xxxi

68787_finalFM.qxp 26/03/2004 3:49 PM Page xxxii

Getting Started withReporting Services
SQL Server Reporting Services is an amazing offering from Microsoft that will change the way youcreate and deploy reporting solutions. It's difficult to fully appreciate the revolutionary nature ofthis product until you understand its architecture. The look and feel of the Report Designerenvironment and the functionality of a particular report view window have little to do with its fullcapabilities. Like your favorite media player program, you can always bolt-on another skin orfaçade, but it's what's inside that really matters. The product group has done a stellar job byproviding a design environment and a nice web-based report management and viewingapplication. The impressive part is the underlying architecture that makes SQL Reporting Servicesa fully scalable and extensible solution that is also surprisingly easy to work with.
If you are impressed by the capabilities of the .NET Framework, web services, SQL Server, andASP.NET, you should know that by using these technologies Reporting Services takes dataaccessibility to the next level. Microsoft is making good on their promise of making informationavailable "any time, any place, and on any device." Reports may be designed using specific renderingformats and page sizes to support mobile devices. There are many other reporting tools withimpressive capabilities but none of them are quite like this one.
This chapter will introduce several topics that will be covered in greater detail later in the book.This will be a high-level view of the need for, purpose, capabilities, and mechanics of SQL ServerReporting Services.
In short, this chapter includes a discussion on the following main topics:
❑ The history of reporting
❑ Business Intelligence (BI) and decision support in current and past reporting solutions
❑ Reporting solutions and application types used to deliver reports
111
68787_ch01.qxp 26/03/2004 3:50 PM Page 1

Chapter 1
2
❑ Installing Reporting Services, setup options, resources, and tools
❑ Report Definition Language (RDL)
Who Is This Book for?Since you've picked up this book, you may be in need of a reporting solution. You may be an applicationdeveloper, solution architect, project manager, database administrator, or business owner. Maybe you'renot a technical professional and you just need reports for your business. Perhaps you are the executivesponsor of a project and you need to know what kinds of capabilities are available for IT professionals tobuild a solution for you. We assume that you have made (or are considering making) an investment inMicrosoft products to manage a business process of some kind. You may need SQL Server or VisualStudio .NET.
We have made it a point to address several aspects of reporting from the perspectives of executives andbusiness managers who need to have solutions developed for them; project managers, business analysts,and software developers who will design and create solutions; and for database and systemadministrators who will configure, deploy, and maintain databases and business reportinginfrastructure.
After spending a couple of months with the early beta release versions of Reporting Services andbuilding solutions with them, I had the opportunity to conduct some early adopter classes for BI andreport solution professionals before the product was released. For most, this was their first look at SQLReporting Services. Everyone was impressed and excited about putting it into practice. I was taken backby a handful of non-developers who complained that they wanted to use Visual Studio to create reports."Why should we have to buy this product and learn to use it?" they asked.
In Chapter 11 you will see how designing reports isn't restricted to the Visual Studio .NET designenvironment. There will likely be other design tools for building reports in the market soon. The fact isthat designing reports is easy. If you have used other report design tools, I'm sure you will agree. Onenice thing about using the Visual Studio report designer is that it feels like the other Microsoft productsyou already know how to use. If you are a Microsoft developer, you'll love it. If you're not a developer,you'll love it when you realize how easy it is to design, deploy, and manage very powerful reportingsolutions with it.
AgilityImagine that you are sitting in a presentation meeting at the corporate office of a key customer. You are asenior sales representative for a company that sells high volume data backup systems, and the solutionthey decide on will be implemented in several regional data centers around the world. Your team hasbeen preparing for this meeting for months. Your success depends on your ability to demonstrate yourcompetence to the customer and a clear understanding of their needs. Your team has done theirhomework, and you know the customer has a history of scanning printed medical records and storingthem as image files. Based on this information, you are certain that a particular product will adequatelyprovide the file backup facilities for their moderate volume of image files. You have made it a point tofamiliarize yourself with the capabilities of the system that appears to be the best fit.
68787_ch01.qxp 26/03/2004 3:50 PM Page 2

During your customer's opening presentation, they tell you that they have recently made a hugeinvestment into full motion video imaging equipment. Now they need a backup system that can handlelarge file capacities. They are prepared to make an investment that is substantially larger than what youhad anticipated for a capable backup solution. Your company began to offer a large-scale solution just acouple of weeks ago but you aren't very familiar with its capabilities. You've spent so much timepreparing to sell the smaller system that you haven't had time to learn more about this new product.Your associate is doing introductions, and it will be your turn in about 15 minutes.
Discretely, you open your Pocket PC Phone and access the World Wide Web. You login to yourcompany's secure report server, select the product catalog report; choose the product category and thendrill-down to the new product. The report has a drill-through option that lets you quickly view a detailedspecification report for the new, high-volume backup system. After noting the pertinent specifications,you save this report to a PDF file and then choose the customer sales inquiry history report. Looking upthis customer, you learn that someone named Julie made an inquiry about two months ago regardingvideo media backups from this very company.
Looking around the room, you find a name card with her name on it. You explore the details of this call,and you find that she had asked if you offer a solution comparable to a very expensive product from acompetitor. Checking the competition's web site, you discover that the competing product Julie hadmentioned uses older technology, has a smaller capacity than the new system, and it costs considerablymore. You save a report with all of the pertinent specifications to your memory card, hand the card tothe administrative assistant sitting next to you, and ask that he make printed copies of the PDF file itcontains.
Your colleague finishes her presentation and then introduces you. Taking another quick glance at thenew product specs, you begin your introduction. You explain that one of your team's greatest strengthsis your real experience and understanding of how business can change day-to-day. In order to beresponsive and competitive, it's necessary to adapt to these changes. You show the brochure for the mid-scale product and explain that this product would be an excellent solution for a company that just scansdocuments. But for digital video, a more capable solution is required. You share the productspecification and qualify the product to your customer's needs. During your presentation, theadministrative assistant returns with the printed specification report. Not missing a beat, you distributethese to everyone and conclude. Making brief eye contact with your colleague, he raises an eyebrow justbefore your customer's chief decision maker, Julie, aggressively shakes your hand, and thanks youprofusely for your time and effort.
The Way We WereIn many business applications, reports were an afterthought. This lack of planning often forceddevelopers to build ad-hoc reports with little opportunity for significant planning and design. Queriesbecame complicated and difficult to support. Reports ran slowly and were prone to errors. To avoidthese difficulties, you really need a plan. In a perfect world, you would architect the database andapplication around your reporting needs, and would completely understand your users' requirementsbefore designing the system. In the real world, you may understand some of the users' needs ahead oftime but chances are that new reports will be requested long after the other features are in place.
According to Frederick P. Brooks' The Mythical Man-Month, it's usually a good idea to learn from andthrow away your first few attempts at almost any design. I typically try to develop reports in stages
3
Getting Started with Reporting Services
68787_ch01.qxp 26/03/2004 3:50 PM Page 3

realizing that the first attempt will be a prototype. My experience has been that when you gather theinitial requirements, users will ask for a handful of different reports based on some specific criteria. Afterthe solution is deployed and people begin to use it, others will almost inevitably realize that they toowould like reports to help make their jobs as easy as their associates. As users realize what kinds ofinformation they can get, they will find new and exciting ways to sort, filter, group, pivot, and slice anddice their data – in ways they never thought possible. That is, until you show them the possibilities.
That Was Then, This Is NowStatic, printed reports may be an acceptable format for a list of products and prices or for a company, butnot for the majority of the information people use to make important decisions today. Business decisionmakers need pertinent information, and they need to view it in a manner that applies to that person'srole or responsibility. Since most users deal with information in a slightly different manner, you cancreate hundreds of reports, each designed for a specific need. Alternatively, you can create flexiblereports that serve a broader range of user needs. For example, a sales summary report could be groupedor filtered by the sales person's region, by customer type, and include information for the week, month,quarter or year, or for a specific product category. To produce individual reports for each of these needswould be time-consuming and cost prohibitive. Besides, computer users are savvier than they were afew years ago and need to have tools that help them take informed decisions, not just look at thenumbers.
I recall working at Hewlett-Packard several years ago in a manufacturing site IS group. Every Thursdaya report cart would come around. There were several regularly scheduled reports that the mainframesystem produced on a weekly and monthly basis. Users, typically department managers, wouldsubscribe to these reports that were then printed in another building and delivered by hand to eachsubscriber. Many of these reports were little more than a huge list of numbers and text printed oncontinuous, fan-fed paper – some as large as 500 pages. I watched inquisitively as managers wouldmeticulously scan through the pages, highlighting and circling figures of interest. Some would bindthem into large books and give them to their administrative assistants to go through with a ten-keycalculator and add up all of the figures they had highlighted.
At the end of the month dumpsters full of these reports were hauled off to landfills and recycling centersas their usefulness quickly came to an end. I spent nearly two years developing a reporting applicationfor this group using Microsoft Access. We originally planned for eight to ten reports in this application.But as time went on, and users began to rely on the reports to perform their jobs, they would ask for thesame reports with different sorting, grouping, and selection criteria. In the end, we deployed some 25-30reports, most of which were variations on the few original reports.
Business Intelligence and Decision SupportDennis Higgins is a BI Consultant with Strafford Technology, Inc. in Windham, NH. He says, "I think oneof the greatest challenges to providing BI Solutions is to educate the customer as to the extent of the long-rangeproblems (and the associated business costs) caused by disjointed attempts to derive information from corporatedata. Closely related to that is to correct the normal tendency to apply band aids. Foresight and planning with a BIStrategy is the most effective means of halting the creation of stove-pipe data analysis systems. Once managementperceives the benefits and buys into the process, a 'master plan' strategy can be formulated, that will guide the
4
Chapter 1
68787_ch01.qxp 26/03/2004 3:50 PM Page 4

process of developing the solution. Integration of existing systems, new tools, or BI Platform migration can thenbe tackled based on priority and available resources."
Business executives understand that it's important to have good data. They reason that good data shouldlead to good decisions, and good decisions mean good business. This makes sense, right? A verycommon scenario today is that businesses trying to get that edge will invest in expensive ERP systemsthat effectively gather and store mountains of customer, product, and sales information. Missionaccomplished? Wrong! These days, the time between data entry and consumption is very short, almostinstant. More effective data-gathering mechanisms result in data silos and data warehouses populated tothe gills with all kinds of facts.
The new generation of business workers are informed and empowered to make decisions. They needtools to get useful information and respond to changes. Having data available is useless unless it hasbusiness value and can be used to effectively take informed decisions.
A fundamental fact in business is that the people who gather and collect data are often not the peoplewho use that data or need access to the information that the data represents. Business executives,managers, and analysts make strategic decisions everyday that may affect many people, the direction oftheir organizations, and ultimately, the way people and organizations will go about conducting businessin the industry. These decisions are largely driven by the relative height of a bar displayed in a chart or afew numbers printed on a piece of paper. Having capable reporting tools doesn't necessarily solve thisproblem. Most businesses don't know how to effectively use the products they own. A reporting tool isof little value if it's complicated and difficult to use.
This presents some fundamental challenges such as collecting comprehensive, accurate and meaningfulinformation, storing it in a form so it continues to represent the facts, and presenting the information in aconcise and unbiased form. On the surface, it seems like a simple task.
Automation to the Rescue – A ScenarioI'll share an example of this kind of challenge. Several years ago, I spent a few months developing areporting system for the operations group at a paper mill in the Pacific Northwest. The old mill islocated in a small, remote town and many of the people operating the mill have been working there allof their lives. As is common in the pulp and paper industry, the mill has changed ownership a few timesand is currently operated by a very large paper and office supply company.
As time went by and technology changed, several different computer systems were incorporated intothe operation of this mill; an IBM 360 and an AS400 system were used to manage customer orders andproduction history records. The original inventory management system is still in place. It's a very old,special-purpose computer that stores most of its data in a single, flat text file. All of its components areredundant and it hardly ever needs significant maintenance. Shortly before I arrived, a Windows serverbox was installed with a SQL Server database and an application that would replicate production andinventory data from the existing database systems. Management within the parent company believedthat they didn't have a handle on the rates of material consumption and product quality. They wanted areporting system that would give them the figures they needed to make adjustments to their orderingand pulp production processes.
5
Getting Started with Reporting Services
68787_ch01.qxp 26/03/2004 3:50 PM Page 5

Over a period of time, orders would be placed for certain grades of pulp. The system would calculatequantities of ingredients to produce a batch – typically to fulfill an order for a customer. The orderwould be sent to the production floor where workers had newly installed controls used to assure theaccurate delivery of pulp ingredients. Different batches of product continued to be produced withvarying degrees of quality and their ability to track the consumption of these materials didn'tsignificantly improve. Management continued to invest in reporting solutions. They bought anddeveloped software to look for trends and perform statistical analysis but to no avail.
After several months and hundreds of thousands of dollars invested, the product quality didn't reallyimprove much. Finally, one of the IT managers put on a hard hat and walked down to the productionfloor to observe the process. What he learned was a simple lesson: when the orders arrived on theircomputer workstations, workers were printing the orders and then putting them aside. They hadoverridden the automated controls and were using the same manual techniques to make paper thatearlier generations had been using for decades. It was a matter of tradition and pride, and they weren'tabout to let some computer do their job for them.
The initial reporting solution was elegant and technically capable. The calculations were accurate andthe report presentation was appropriate. However, the solution didn't fully support the process. Thiscultural hurdle was eventually overcome (workers were instructed to use the automated systems if theywanted to keep their jobs) and the product and process improved. A report is only as good as the data itpresents, and the data is only as good as the information used for collection. The information is only asgood as the process that it represents.
Challenges of Existing Reporting SolutionsFor over ten years, Microsoft has offered only one product with substantial reporting capabilities.Designed to run as a single-user or a small workgroup, desktop application, Microsoft Access is acapable database and reporting solution. In Access 2000, Access Data Projects were added. Thisextension of the product works well against a SQL Server back-end, in a LAN environment. In VisualStudio 6, an integrated reporting tool was offered for Visual Basic 6 but its capabilities were meager atbest. Developers at that time thought this was a glimpse of things to come in subsequent versions ofVisual Studio.
Due to the lack of a unified, consistent approach for reporting, many developers have had to revert tocreating their own custom solutions. One case in point is the reports starter kit project available on theASP.NET development support site (www.asp.com). The developers did a bang-up job creating a web-based reporting solution using ASP.NET datagrids and datalist controls. They even made their ownpie charts using line drawing objects. This effectively proves that .NET is a powerful arsenal ofprogramming tools. However, it also makes the point that we have lacked a strong reporting solution toround out Microsoft's front-line development and database suite.
When Visual Studio .NET was released in 2002, I was a little disappointed because the only integratedreporting component was a limited-use version of Crystal Reports. Now, before I get myself into toomuch trouble with folks who may be loyal to this product, I'll say that Crystal Reports is a capablereporting tool. However, it's neither a part of Microsoft's strategic direction nor does it behave like, orintegrate tightly with other Microsoft products. The version of Crystal Reports that installs with Visual
6
Chapter 1
68787_ch01.qxp 26/03/2004 3:50 PM Page 6

Studio is limited to five concurrent users (and the term concurrent is subject to some seriousinterpretation). Now that Crystal Reports has changed hands once again (recently acquired by BusinessObjects), it will be interesting to see how this affects the direction of this well-known product.
Notably, the most remarkable change in the industry over the past few years has been the opportunityand need to exchange information over the Internet. Previous technologies simply don't provide themeans to access application components across the Internet. Component architectures such as COM,DCOM, and CORBA were designed to communicate across secure LAN and WAN systems, whichrequired a substantial infrastructure investment. Connecting business trading partners and evenregional sites was often cost prohibitive and logistically infeasible. Few options existed for reportingover the web. At best, a list or table filled with data could be viewed in custom-built, server-side webpage solutions using ASP or CGI. Each page had to be carefully designed and scripted at the cost ofdozens, or sometimes hundreds of programming hours.
With the recent maturity of the web, a new generation of mobile devices is evolving that can connectusers to company resources, email, documents, and databases. These laptop, hand-held, palm-top, andwrist-worn devices open new doors of opportunity and present new challenges for data presentation.Perhaps, it will soon be common for people to stagger around the streets, talking to themselves andstaring blindly into space in a zombie-like trance as they are connected to the world through web-enabled cerebral implants! We can only hope!
To gain access to useful and readable information, data must be accessible over available communicationchannels (such as corporate networks and the Internet), easy to access, secure, and available in a varietyor formats so that it may be viewed using available document readers or browsers – all compatible withdifferent devices. Did I mention the need to support different Operating Systems (OS), applications, andperhaps, without the installation of any custom software on the client device? This is the challenge.
How Does SQL Server Reporting Services MeetThis Challenge?
SQL Server Reporting Services is a server-side reporting solution that meets all of these requirementsand more. It can obtain its data from a variety of data sources that you can access using modernprogramming tools. That data may be grouped, sorted, aggregated, and presented in dynamic andmeaningful ways. The structure of the data and the presentation elements may be transmitted acrosspractically any communication medium, using an industry standard format, to just about any type ofclient or server computer or device. The resulting content may then be displayed in many standardformats using browsers and document readers. Further, the data itself may be consumed by standardand custom applications to be further parsed, imported, manipulated, and consumed. It's a trulyremarkable innovation with incredible possibilities.
Since Reporting Services is based on .NET, it offers the advantage of integrating tightly with theWindows platform and benefits from the performance, scalability, and security inherent to the .NETFramework. When used in concert with BackOffice products like Share Point Portal, it can provide acomprehensive enterprise solution with little programming effort. Reporting Services can be used withASP.NET and other .NET programming tools to produce highly customized, special-purpose solutions.
7
Getting Started with Reporting Services
68787_ch01.qxp 26/03/2004 3:50 PM Page 7

In Chapter 2, we will discuss the specific Reporting Services architecture that is used to perform all ofthis magic. In brief, functionality is exposed through an XML web service that may be accessed across aLAN or across the web. Reports may be rendered in program code or they may be accessed through asimple web address – like any other web page. Reports may be rendered in several formats. Theseinclude different flavors of HTML to provide compatibility with different browsers and devices, theAdobe Acrobat Portable Document Format (PDF) for uniform presentation and printing, as a graphic file,and in Microsoft Excel so users can slice, dice, pivot, and re-analyze the data. Content may also berendered in XML and CSV formats to import and exchange data with a variety of applications.
Business Intelligence SolutionsTraditionally, BI solutions have been very costly and only accessible to large businesses that could affordthem. Customer Relations Management (CRM) systems, Online Analytical Processing (OLAP) systems (ordata warehouses), and analysis solutions have been available for many years from specialized vendors.However, they require costly deployment, training, and maintenance. By contrast, (this is the part I likethe best) Reporting Services is available at no additional cost if you install it on a computer with alicensed instance of SQL Server. Reporting Services is an add-on to SQL Server rather than a stand-aloneproduct. In a single server installation, you don't need an additional license and you can use it royaltyfree – so long as your database, and server products are appropriately licensed. For additionalinformation regarding licensing and deployment options, please refer to Chapter 13.
Comparatively speaking, collecting data is the easy part. Most companies have been doing this fordecades, but how they utilize all of this data is often another story. There is no doubt that effectivelycollecting data may not be so easy but it's something businesses have been doing for quite some time.Most companies have untold mega-, giga-, or even peta-bytes of "important" archived data residing indocuments, spreadsheets, and various databases on backup tapes, disks and folders throughout theirenterprise – with no hope of fully utilizing and gaining significant value from it all.
According to Tommy Joseph of Disney Interactive Group, "BI is about more than just tracking product sales.It's about measuring performance, discovering patterns and trends; and measurable forecasting through statisticalanalysis."
An effective BI solution provides visibility to important facts at all levels of an organization, and givespeople access to uniform data from different sources using familiar and easy to use applications. It tiestogether applications, documents, and data sources in a manner that lets people collaborate andcommunicate effectively.
BI systems are no longer a luxury but a necessity in many business environments. Today, having accessto timely information can make the difference between having a competitive edge and being left in thedust behind competitors.
Who Uses Reports and Why?In almost any organization, there is a universal condition that people in different roles and at differentlevels have different perspectives on information. This is typically most apparent in large corporations,where executive leaders who make financial and market-direction decisions have less exposure to thedaily processes of the company than the line-level workers. Ask any executive and they will tell you that
8
Chapter 1
68787_ch01.qxp 26/03/2004 3:50 PM Page 8

the line-level worker doesn't have a broad perspective regarding the challenges and direction of theorganization at a high level. Conversely, ask most of the line-level workers in the organization and theywill tell you that the upper management and executives don't share their perspective of "real problems"and the daily pulse of the company. To a point, this is the natural condition of a healthy organization.
Bill Gates has spoken extensively about the information worker of the twentieth century. At all levelswithin an organization, people who have convenient access to accurate and appropriate information areempowered to take informed decisions that benefit the organization and the individual. This is rapidlybecoming the case throughout many industries today and continues to change the way people work andare managed. Although this paradigm shift may be occurring for many people, organizations oftenstruggle to provide the resources necessary to support workers who are eager to use information tomake a difference in their environments.
Executive LeadershipLeaders simply must make informed decisions. They must fully understand their business environmentand the competitive climate in which they operate. Access to market conditions, customer needs, andfinancial information can often make the difference between decisions that produce success orjeopardize the organization.
Decision support systems provide interfaces for executive leadership through dashboards calledExecutive Information Services (EIS). Reporting Services installs them with a simple web interface andenhances integration with executive consoles through SharePoint Portal services and third party solutionintegration.
ManagersInefficient business processes can no longer remain the status quo. Customers demand results andsimply will not tolerate services or products that don't meet their expectations. Customers have choicesand will quickly switch to a competitor if their needs are not met. Managers need the informationnecessary to drive customer satisfaction and make corrections, directing business processes and theeffective use of people and other important resources.
Information WorkersIn businesses today, workers are educated and given more freedom to solve problems and effect change.This category could be applied to workers at various levels within an organization, including themanagers and higher level workers. Often, the customer service representative or service provider willbe the only human interface a customer has with an organization. That person must be empowered tocollect and retrieve information quickly and accurately. They must also be empowered to makecorrections to - and to work with, not against - unyielding business processes. In the past, workerssimply had to accept the way information was presented to them, as well as the inefficiencies of mostautomated systems. With greater demands on businesses, workers simply must have the means toacquire accurate and concise information that meets their needs – in order to work efficiently.
9
Getting Started with Reporting Services
68787_ch01.qxp 26/03/2004 3:50 PM Page 9

CustomersMany businesses can't afford to put people in front of their customers on a routine basis. Customers whocan get the information, services and assistance they need may not demand that someone help themwhen it's not warranted. By making regular services available through customer-friendly automationand information portals, you can afford to offer assistance to customers who really need specialattention. Customers often need to look up account and transaction histories, order status, and shippinginformation. Making these services available through a web browser, email, or a mobile device canprovide a greater degree of customer satisfaction.
Vendors and PartnersLike customers, business vendors may need to interface with an organization to place orders, scheduleservice calls, and obtain status information. Making this information available in the most appropriateform will improve efficiency and ultimately business-vendor partnerships. Business vendors are oftenmore accepting of special procedures and automated systems. Vendors can be trained to use moresophisticated systems to obtain product information, service orders, invoices, and other business-relatedinformation. Systems may be designed to interface and automate the download or exchange ofinformation that enable a partnering business to work cooperatively.
Reporting with Relational DataTransactional databases are designed to capture and manage real data as it is generated; for example, asproducts are purchased and as services are rendered. Relational databases are designed according to therules of normal form and typically have many tables, each containing fragments of data rather thancomprehensive information or business facts. This helps preserve the integrity and accuracy of data atthe detail level, but it presents challenges for deriving useful information from a large volume oftransactional data. In order to obtain information with meaningful context, tables must be joined andvalues must be aggregated. Although relational database systems may support complex queries,reporting against these queries routinely could prove to be slow and inefficient.
Reporting for Decision SupportOptimized data storage systems are for analysis and don't use normalized tables, and don't containdetails at the transactional level. Tables typically have more columns and fewer rows and often containdescriptive values that would otherwise exist only in lookup tables. The purpose of a decision-supportdata store is to drive meaningful reports and analysis tools with a sampling of read-only, historical, dataand not for keeping up-to-the minute details.
Data WarehousesThe usual approach for maintaining a decision-support system is to copy only necessary data fromrelational, transaction-support databases to a separate data store at regular intervals. Depending on anorganization's reporting needs, this data dump (or import) is performed daily, weekly, or even monthly.
10
Chapter 1
68787_ch01.qxp 26/03/2004 3:50 PM Page 10

The transactional tables are joined and pre-aggregated to eliminate unnecessary detail. Surrogate keyvalues and codes have little use since the transformed data is readable in a more concise form.
Data warehouses (and smaller subsets of data analysis called data silos), can simply be implemented asrelational data stores that have been designed for analysis. There can also be special purpose datastructures that store data in hierarchal or multi-dimensional structures. These specialized data storagestructures are optimized for performing pivots and extensive calculations and aggregations against alarge volume of decision-support data.
A data warehouse is typically a large, central store of decision-support data whereas smaller, morespecialized data marts, effectively divide analysis data into business unit and divisional data warehouses.SQL Server Analysis Services (see http://www.microsoft.com/sql/evaluation/bi/bianalysis.asp) is capable ofstoring and analyzing data in both relational and multi-dimensional structures. Data warehouse systemsoften use special query expressions that have capabilities beyond that of SQL. The MultidimensionalExpressions (MDX) language supports pivoting and slicing data cubes to derive informational facts forcomparative analysis.
Eventually most businesses that generate reports from live data will experience a common anomaly. Asthe data in a transactional database is ever growing and changing, reports will reflect these subtlechanges and show up on the bottom line. Different users may produce similar reports in a short periodof relative time and will notice that totals and summary values slightly vary. With no other explanation,users question the accuracy of report data and assume that there is a problem with their data. Believe itor not, the technical term for this condition is known as "twinkling data". As this phrase suggests, thetotals and data points aren't typically way out of line. They just seem to fluctuate slightly. ReportingServices helps this situation by "freezing" report data through caching and report snapshots.
You might not perceive this to be a problem but consider what might happen if a user had made dataentry mistakes and in an effort to correct the errors, entered duplicate, corrected data and then deletedthe old records. Or, they deleted the erroneous records and then re-entered corrected information. If areport were produced at the wrong time, summary values could be skewed significantly. Statisticallyspeaking, the chances of this condition causing a crisis may not be significant, but over time, they mayincrease. Data analysis should therefore be performed on unchanging values that are updated at regular,predictable intervals. This problem is often addressed by building separate OLAP data stores used onlyfor analysis and reporting against snapshot data imported from transactional databases at regularintervals.
The Reporting LifecycleChapter 2 will discuss the reporting lifecycle in greater detail with the architecture that supports thisprocess. Briefly, creating a functional reporting solution requires an understanding of user and businessrequirements. Existing data sources must be considered and new data stores must be designed to meetreporting needs. From this perspective, the process of creating useful reports consists of three activities:
❑ Authoring: With the available tools, reports are authored using the Report Designer in VisualStudio .NET. This interface is used to create data sources, queries and datasets, and the reportdefinition.
11
Getting Started with Reporting Services
68787_ch01.qxp 26/03/2004 3:50 PM Page 11
❑ Management: Report management is performed using the Report Manager, a web browserinterface used to manage and deploy report definition files, shared data sources, andconfiguration settings; it can also be used to view and export report data.
❑ Delivery: Reports may be delivered to a user on-demand through the Report Manager or acustom application; it can also be scheduled for delivery through subscriptions. Reports can bedelivered in the form of a web page, document, file, or even via email.
Report Delivery Application TypesIn the past, reporting solutions were typically delivered through a desktop application of some kind.Data was queried in real time, and of course the application had to be connected to the data source.Users also had limited opportunity to save reports for later viewing and usually printed them on paper.
Now we have many opportunities to view and interact with reports in environments where it may notbe possible (or feasible) to connect to data stores. Reports may also be presented in different forms thatoffer multiple capabilities and compatibility with various devices and software.
Web BrowserWeb browser-based solutions have become popular for a number of reasons. User accessibility takes on awhole new definition when special software isn't required on the client computer. Of course, a webbrowser makes information available for viewing over the World Wide Web, but browser-basedsolutions are also a compelling means to deliver information in a controlled business enterpriseenvironment. Whether users access resources within their corporate intranet environment or over theweb, the browser paradigm has significantly changed the approach to application delivery.
Some of the traditional challenges with browser-solutions are the lack of consistent support for client-side script and components. These issues have largely been resolved with server-side renderingmechanisms that output product-independent HTML content. For viewing offline content, HTMLdocuments require links to external files, such as images, sounds, and video. These issues have also beenresolved by using a MIME-encoded format call MHTML or Web Archive to encapsulate binary contentwithin the page definition. Although not supported in all browsers, this format is a viable means todeliver extensible report content for live and off-line viewing. HTML 4.0 works on different types ofcomputers across the Internet, within a LAN on newer web browsers and HTML 3.2 works with olderbrowsers and on a portable or hand-held device.
Office ApplicationsMicrosoft Office brings together a tremendous assortment of capabilities to assist report users at alllevels. Microsoft Excel has been the mainstay tool for data collection and analysis. By rendering a reportinto Excel, the data may easily be reformatted, modified, or analyzed using formulas and calculations.This capability has been around for several years but it required writing custom code to use the Excelobject model from Access or Visual Basic to produce report data in Excel; in addition, this process wastedious at best. Now, pushing complex report data into a useful and well-formatted Excel document issimple.
12
Chapter 1
68787_ch01.qxp 26/03/2004 3:50 PM Page 12

Microsoft Access continues to be the office worker's database of choice. Data tracking and managementsolutions can be created with minimal cost and effort. Report Services may be used to exchange andimport data into an Access database using XML or CSV formats. Access and Excel both provide theOffice Web Components that may be used to view pivot tables and charts. These components duplicatethe functionality of the Matrix and Report Services chart items but might give users a more convenientoption for analyzing data.
ProgrammabilityThe possibilities for incorporating report features in your own applications are impressive. All of thefeatures of the Report Manager can be duplicated in many cases and can be extended through programcode. Reports may be viewed in place within an application by using an external web browser window,integrated browser control, or a custom report viewer component. Report content may be rendered to afile for persistent storage to directly into a viewer or browser.
SubscriptionsSubscriptions allow users to receive or gain access to reports on a regular schedule. Reports aredelivered by email or saved to files where they may be viewed offline at the users' convenience. Reportsubscriptions may be setup for an individual user or large groups of users using data-drivensubscriptions. To put this into perspective, effectively reports may be delivered to any individual or sizegroup of users in practically any readable format at any place and any time.
Report FormatsIn addition to the three HTML rendering formats, you can use document types to control formattingelements, printing layout and adding other capabilities. The PDF document format remains the mostpopular means for assuring that documents are formatted exactly as they were intended. Rendering areport to a Microsoft Excel workbook gives users the ability to continue to message data and performcalculations.
Importing Data/Exchanging DataNot all "reports" may be intended to be read or printed. Reporting Services provides two reportrendering formats that can be used for export/import and data exchange. Using either the CommaSeparated Values (CSV) or XML formats, Reporting Services provides a very convenient mechanism forinter system data exchange or pushing data out to a trading partner. Imagine your system automaticallysending invoices and shipping manifests to your order fulfillment vendor at end of the day via XML fileattachments to email.
System RequirementsThe hardware system requirements for Reporting Services are very similar to those for SQL Server. Thedefault installation will place the Report Manager, Reporting Services, and the Report Server databaseon the same physical server but this configuration is not a requirement. These components may beinstalled on three separate servers.
13
Getting Started with Reporting Services
68787_ch01.qxp 26/03/2004 3:50 PM Page 13

The Report Server and the Report Manager servers must be running Internet Information Services (IIS) 5.0or higher with ASP.NET, and the .Net Framework 1.1 or higher. The Report Server Database requires anyedition of SQL Server 2000 with Service Pack 3. The SQL Agent and the Distributed TransactionCoordination (DTC) services must be running.
Editions of Reporting Services correspond to editions of SQL Server and include Evaluation, Standard,Development, and Enterprise editions. Like SQL Server, Standard Edition is a good solution for a single-server environment with a moderate number of users.
The Enterprise Edition has additional capabilities to support many users in a scalable environment usingweb farms and clustering technology. Subscriptions may be managed for users and recipients whosenames and email addresses are stored in any accessible database.
The following table shows the requirements and features for each edition of Reporting Services:
SRS Edition Operating System Requirements
Windows 2003 Server
Must be configured as an Application Server SQL Server 2000 Standard or Enterprise with SP3
Enterprise
Windows 2000 Server
Windows 2000 SP4 SQL Server 2000 Standard or Enterprise with SP3
Windows 2003 Server
SQL Server 2000 Standard or Enterprise with SP3
Standard
Windows 2000 Server
Windows 2000 SP4 SQL Server 2000 Standard or Enterprise with SP3
Windows XP Professional
Windows XP SP1 SQL Server 2000 Developer, Standard or Enterprise with SP3 limited to 10 database connections
Developer
Windows 2000 Professional
Windows 2000 SP4 SQL Server 2000 Developer, Standard or Enterprise limited to10 database connections
Windows XP Professional
Windows XP SP1 SQL Server 2000 Evaluation, Developer, Standard or Enterprise with SP3 limited to 10 database connections
Evaluation
Windows 2000 Professional
Windows 2000 SP4 SQL Server 2000 Evaluation, Developer, Standard or Enterprise with SP3 limited to 10 database connections
14
Chapter 1
68787_ch01.qxp 26/03/2004 3:50 PM Page 14

Installing Reporting ServicesThis section describes the steps for installing Reporting Services for SQL Server 2000. Reporting Servicesmay be installed using one of two methods. A standard, Windows setup package provides a wizarddialog to guide the user through the entire process. It will prompt for file paths, server and otherresource names and allow for optional component selection. The other installation method is acommand-line utility and may be used, typically by system administrators, to script or automate theinstallation process. This method is not quite as user-friendly and requires more planning and a betterunderstanding of the product and its components.
Setup Options The following options are offered during setup as shown in Figure 1-1:
Figure 1-1
You can select the feature options that you want to install. Some features are related to others and appearas expandable branches of the feature tree. A plus sign next to a feature indicates that the branchincludes related features. You can also specify that all related features under a branch should be installedby choosing the option labeled Entire feature will be installed on local hard drive. Likewise, selecting Entirefeature will be unavailable will set this mode for all features under this branch. See Figure 1-2:
Figure 1-2
15
Getting Started with Reporting Services
68787_ch01.qxp 26/03/2004 3:50 PM Page 15

A few options can be installed so the content is located on a central network fileshare. Choosing thisoption for Books Online, for example, will not copy these files to the local disk but will refer to files at acentral location. In order to use this option, it is necessary for the setup disk image to be copied to afolder that will be accessible whenever this feature is used. Some features include the option to installand run from the network displaying the drop-down list shown in Figure 1-3:
Figure 1-3
Adding and Removing OptionsAfter the initial product installation, features may be added or removed by running setup again from theControl Panel | Add or Remove Programs applet. The currently installed start is displayed for each feature.Any changes made in the setup dialog will cause features to installed or removed.
Server ComponentsServer components include the Report Server and the Report Manager. It consists of a Windows servicethat runs continually on the server computer, a .NET web service hosted in IIS and a SQL Serverdatabase. The Report Server database can be installed on only one instance of SQL Server per physicaldatabase sever computer. The database need not reside on the local Report Server computer but theserver must be a member of the Windows domain or a server trusted by the domain.
Report Manager is an ASP.NET application that exposes reports, configuration, and administrativefeatures through a web browser interface.
The Report Manager requires IIS 5.0 or greater to be running on the Report Server computer. The .NETFramework version 1.1 also must be installed on the server. This is an included feature of WindowsServer 2003. On a Windows XP Professional system, SP1 is required. Windows 2000 Professional, Server,and Advanced Server require SP4. Windows XP Home Edition is not supported.
Client ComponentsThis includes the Report Designer. This option installs the Report Project and Report Wizard Projecttemplates and BI Projects project group into Visual Studio .NET 2003 or greater. The Report Designerenables developers to create report projects in Visual Studio to create reports and related data sources. Areport project generates definition files in Report RDL, an XML grammar that defines report content,layouts, and data sources. These reports may be deployed directly from Visual Studio into the ReportServer. Reports may also be deployed manually using the Report Manager.
The Report Designer and Report Server can reside on different computers to support a separatedevelopment environment. The installation requirements for the Report Designer are the same as thosefor Visual Studio .NET 2003.
Let's look at the documentation and samples for Reporting Services.
16
Chapter 1
68787_ch01.qxp 26/03/2004 3:50 PM Page 16

Books OnlineThe documentation for Reporting Services is the Reporting Services Books Online. Its format andbehavior are similar to that of SQL Server Books Online. All Reporting Services - related documentationis contained in only one source. If you plan to install the server and client tools on different computers,you should consider including the Books Online with both installations.
Reporting Services SamplesThe samples include example projects for Visual Studio .NET, SQL Server databases, import data files,report definitions, and scripts. The projects include Visual Basic and C# code samples to manage andrender reports using program code. The samples also include several reports exemplifying variousdesign techniques.
AdventureWorks DatabaseThe AdventureWorks2000 sample database was created for demonstration and instructional purposes infuture versions of SQL Server and related products. Like the Northwind and Pubs databases, it willinclude design elements and sample objects for SQL Server developers and administrators. UnlikeNorthwind and Pubs, the AdventureWorks database is not a simplified design. It has been created tomodel the design of a highly normalized, large-scale business database containing over 60 tables. Wewill use this database for many of our sample reports later in the book.
Administrative ToolsCommand-line utilities provide scripting and command level access to server management,deployment, and configuration features. These capabilities are thoroughly discussed in Chapter 8.
The following command-line utilities are installed with the Administrative Tools option:
Utilities Description
rs Used to process script files for deploying reports, managing the Report Server database, making and restoring backups, and other administrative tasks.
rsactivate Used to manage the Report Server Windows service on a local or remote Report Server computer.
rsconfig Used to set or modify configuration settings for a Report Server. This includes security authentication setting and database connections.
rskeymgmt Used to allow administrators to backup and restore private keys to enable access to this secure information.
17
Getting Started with Reporting Services
68787_ch01.qxp 26/03/2004 3:50 PM Page 17

Command Line and Unattended InstallationThe setup may be run using command line switch to automate the installation process. This capability isprovided by the standard Windows Installer 2.0. Although there is no command-line interface, the setupprocess may be scripted and settings can be specified.
Log FilesReporting Services records event information in the standard Windows Application Log and in specificlog files. Report execution logging is enabled by default and may be configured in the Report Manager.Specific settings for the Report Server are stored in the RSReportServer.config file. More granulartracing information may be captured in log files for a variety of application and server events andsystem errors. These logs may be helpful in analyzing usage and debugging specific problems. The logfiles are auto-generated using time-stamped names. The file names, categories, and locations correspondto the configuration files mentioned in the Configuration Files section of this chapter.
Email DeliveryIn order for Report Services subscriptions to utilize email delivery, an available server must beconfigured for the Simple Mail Transport Protocol (SMTP). Internally, Report Services uses CollaborativeData Objects (CDO) to send mail. These required components are part of the standard configuration ofWindows 2000 servers and Windows Server 2003 operating systems but you should verify that they areinstalled and working. The best way to do this is to create a test subscription in the Report Manager andverify that it has executed and the message is received in the recipient's inbox. Subscriptions are coveredin detail in Chapter 10.
The SMTP service is not required on the actual report server but an accessible SMTP server must beavailable to the server in order for this feature to work. If you don't have an SMTP server configured, orif you don't intend to use the email delivery option, simply leave these fields blank in the setup wizard.
Designing ReportsChapter 3 will deal with the essentials of report design and followed by Chapter 4 will take morespecific design elements to the next level. Reports fall into a few design categories which will be coverednext.
Form ReportsA report can display a single record on a page with data from a table, calculations and just static text.Form reports can be used to print or display a letter, invoice, contract or informational sheet.
Tabular ReportsThis is a fundamental style for reports that have repeated rows of data called data regions. Tabular datais repeated in free-forum bands or table rows with rows and columns. Either the list or table items maybe used to produce a tabular report in various layouts. Column headers can be displayed for eachcolumn in a table and subtotals and summary information may be displayed in table or group sectionfooters.
18
Chapter 1
68787_ch01.qxp 26/03/2004 3:50 PM Page 18

Groupings and Drill-DownRecords in a report may be sorted and grouped. Each group can be collapsed and expanded to drill-down into more detail. This capability gives users the ability to explore large sets of data withoutthe need to scroll though long, multi-page reports. The report may also be printed in its expanded form.
Drill-Through ReportsA drill-through report can be any standard form, tabular or pivot table report that contains links to aseparate report. Any textbox item may used as a link to provide drill-through capability. Key values arehidden with the link and passed as a parameter to the target report for filtering.
Multi-Column ReportsA report may contain multiple columns. List or tabular rows are repeated vertically within a column andthen snake from one column to the next, filling the page. This type of format is ideal for optimizing pagespace for labels and contact information.
MatrixA matrix is like a cross-tab or a pivot table in which the rows and columns roll-up summary values andmay be expanded or collapsed to expose more detail. It is a simple and easy-to-use control, much likethe datagrid control in ASP.NET.
ChartsCharts are used to display a graphical representation of data, typically aggregated along at least twoaxes. Common types of charts are bar and column, pie and donut, line, area and scatter charts. Morespecific types of charts like stock and bubble charts are more specialized.
Data SourcesReports can obtain data from standard data providers supported by the .NET Framework. In addition toSQL Server versions 7.0 and 2000, this list includes Oracle, Access, Excel, Informix, DB2, and any otherdatabases and data sources accessible via an OLE DB provider or ODBC driver. Non-relational sourcessuch as Active Directory Services, Exchange Server, and OLAP sources like Analysis Services can bequeried. Developers can create custom data provider extensions— when an OLEDB provider or ODBCdriver does not exist—to make practically any type of data accessible to a report.
QueriesEach report contains a query expression within its definition. A standard Transact-SQL query buildertool is incorporated into the report designer, capable of producing complex query expressions to bestored in the report. Although this is the defacto behavior of the designer, keeping queries in the reportmay not always be the best practice. Using a view or stored procedure from a SQL Server database canbe a far more efficient method to query enterprise data. Parameters passed to a stored procedure causethe precompiled query to be processed on the database server before data is transferred across networkconnections.
19
Getting Started with Reporting Services
68787_ch01.qxp 26/03/2004 3:50 PM Page 19

OLAP ReportingDecision-support databases come in many sizes and shapes. In its simplest form, a reporting data sourcecan be a relational database with a few tables that can be queried more easily with some joins to othertables. Unlike transactional databases (often called online transaction processing or OLTP systems),OLAP databases are designed for efficient read-only access and reporting.
Large-scale OLAP databases require special storage and retrieval engines. Data may be managed in acube structure, which enables values to be summarized and aggregated into slices and pivots. To querythese structures effectively, MDX is used—much like SQL is used for relational structures. Reportingservices supports the use of MDX queries although the reporting engine was not specifically builtaround this capability. When an OLAP data provider is used as a data source, the Report Designerdisplays the Generic Query Designer, which supports MDX expressions. The dataset resulting from thistype of query is flattened into rows and columns like any other dataset. For this reason, all report itemsare supported for MDX queries.
Using Visual Studio .NETVisual Studio .NET is Microsoft's integrated development environment tools for developing all types ofapplications. It replaces several different development tools in previous versions. Visual Studio nowsupports many different programming languages and file types. Whether you are an applicationdeveloper or not, Visual Studio is the only tool currently available to design and build reports for SQLServer Reporting Services. Because of the extensibility of Reporting Services and the RDL XMLgrammar, other design tools will likely become available soon.
Report WizardThe Report Wizard is a simple way to get started creating reports. It leads a designer though all of thesteps necessary to build a simple report interface. New designers will find it an easy, uncomplicated toolfor creating or choosing a data source, creating a query, selecting fields for header, grouping and displayvalues, and choosing report styles and format options. Experienced designers will likely not find thewizard helpful as they become more familiar with the design process and prefer to have more control ofthese options. After completing the wizard, the report design may be extended and tuned to providemore functionality.
The .NET FrameworkThe Microsoft .NET Framework is a completely new direction for Microsoft, and replaces the ApplicationProgramming Interfaces (API) and object technology of the past. It's far more than a marketing strategy ora product. It gives application developers the objects and building blocks to create powerful applicationsof all kinds. Design and debugging features are also available in it to help developers through thetedious application development process. Utilities and compilers enable applications to be configured,compiled, and deployed. A runtime environment manages execution, resource allocation, security, andinteroperability with other services, servers, and operating systems.
The main thing to understand about .NET is that it is a core component of Windows and it supportsapplications at many levels. The runtime and the development support tools are free. Visual Studio .NET
20
Chapter 1
68787_ch01.qxp 26/03/2004 3:50 PM Page 20
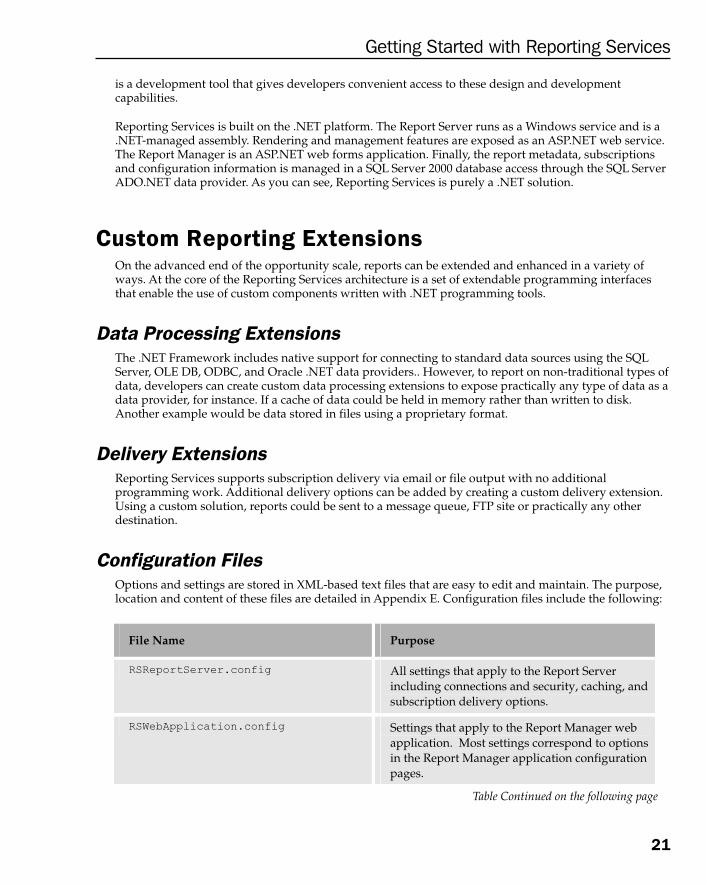
is a development tool that gives developers convenient access to these design and developmentcapabilities.
Reporting Services is built on the .NET platform. The Report Server runs as a Windows service and is a.NET-managed assembly. Rendering and management features are exposed as an ASP.NET web service.The Report Manager is an ASP.NET web forms application. Finally, the report metadata, subscriptionsand configuration information is managed in a SQL Server 2000 database access through the SQL ServerADO.NET data provider. As you can see, Reporting Services is purely a .NET solution.
Custom Reporting ExtensionsOn the advanced end of the opportunity scale, reports can be extended and enhanced in a variety ofways. At the core of the Reporting Services architecture is a set of extendable programming interfacesthat enable the use of custom components written with .NET programming tools.
Data Processing ExtensionsThe .NET Framework includes native support for connecting to standard data sources using the SQLServer, OLE DB, ODBC, and Oracle .NET data providers.. However, to report on non-traditional types ofdata, developers can create custom data processing extensions to expose practically any type of data as adata provider, for instance. If a cache of data could be held in memory rather than written to disk.Another example would be data stored in files using a proprietary format.
Delivery ExtensionsReporting Services supports subscription delivery via email or file output with no additionalprogramming work. Additional delivery options can be added by creating a custom delivery extension.Using a custom solution, reports could be sent to a message queue, FTP site or practically any otherdestination.
Configuration FilesOptions and settings are stored in XML-based text files that are easy to edit and maintain. The purpose,location and content of these files are detailed in Appendix E. Configuration files include the following:
Table Continued on the following page
File Name Purpose
RSReportServer.config All settings that apply to the Report Server including connections and security, caching, and subscription delivery options.
RSWebApplication.config Settings that apply to the Report Manager web application. Most settings correspond to options in the Report Manager application configuration pages.
21
Getting Started with Reporting Services
68787_ch01.qxp 26/03/2004 3:50 PM Page 21

ScriptingMost report management and delivery features may be automated through a simple scripting interface.A single utility executable, rs.exe, is used to obtain access to the vast capabilities of the Report Servicesweb service. You can create scripts to manage batch processing of reports or programmaticallymanipulate any exposed functionality of reporting service. Capabilities are similar to that of the webservice proxy used in .NET programming code but a scripting solution is a simpler approach thatdoesn't require complex programming or a compiled project. Scripting is an ideal approach for systemadministrators to create simple maintenance, deployment and ad-hoc delivery solutions. Chapter 8 willdetail report scripting options.
SubscriptionsSubscriptions allow users to request reports to be delivered to them automatically. Based on a schedule(single-instance or recurring) reports may be delivered using any available deliver extension (email, fileor custom) in any available rendering format. Subscriptions can be either standard, where a userrequests the scheduled delivery of a specific report, or data-driven, where a group of users can requestthe scheduled delivery of one or more reports. This is an extremely powerful tool that can be used toprovide report content in an efficient manner to users in practically any location or work schedule.Chapter 10 will lead you through this compelling feature.
Securing ReportsReporting Services uses a role-based security model that is installed and configured by default. Thismodel is highly extensible and may be changed after installation to use a custom authenticationcomponent.
In order for sensitive data to be protected from intrusion, it should be encrypted both at the ReportServer and in the web browser or client application. The preferred method to do this is to use ReportingServices' built-in support for certification-based encryption over the Secure Sockets Layer (SSL).Implementing SSL will automatically redirect web requests to an address at the same location using the
File Name Purpose
ReportingServicesService.exe.config Enables tracing and logging of certain server events that include restarts, exceptions, warnings and status messages. Some settings are used to manage the trace and log files and tracing output options.
RSReportDesigner.config Used to manage and configure custom data processing and rendering extensions. Also sets designer preview and rendering options.
22
Chapter 1
68787_ch01.qxp 26/03/2004 3:50 PM Page 22

http:// prefix. This enables bidirectional encrypted streaming of all data over port 443 (by default) ratherthan the standard HTTP port 80. Reporting Services supports levels of automatic encryption which aredetailed in the section that follows. There is currently no maintenance interface for this setting throughthe Report Manager or any other provided utility.
You will need to obtain a digital certificate from a certificate authority such as Verisign, AuthentiCode orThawte. These companies will sell or lease the certificate for a specified period of time for a few hundreddollars per year. The authority will do a background check on your business to verify you are legitimate.Configuring the certificate is actually quite easy. This is performed using the IIS management consoleand setting the properties for the ReportServer web folder.
To enable encryption in Report Services, edit the RSReportServer.Config file using Visual Studio or atext editor and set the SecureConnectionLevel element to a value from 0 to 3.
In the RSReportServer.Config file, you will find this setting near the top of the file after the encryptedlogin and connection settings:
<Add Key="SecureConnectionLevel" Value="0"/>
Modify only the number value between the double quotes and save and close the file:
The values are as follows:
The Report ManagerThe Report Manager (shown in Figure 1-4) is a web-based interface that provides both user-level accessto reports and administrative features to configure security, subscriptions, report caching, and dataaccess.
Value Description
0 (default) Disables encryption support
1 Enables minimal support but may expose credentials if a certificate isn't installed or configured properly
2 Provides an appropriate level of encryption for rendering and authentication calls
3 Encrypts all data
23
Getting Started with Reporting Services
68787_ch01.qxp 26/03/2004 3:50 PM Page 23

Figure 1-4
This web application is used to perform report and server administration as well as report delivery.Users may use it simply navigate to reports, provide parameter values and view them. The ReportManager will be discussed in detail in Chapter 6.
Designing ReportsIn this first release of Reporting Services, reports are designed and created in Visual Studio .NET using aspecial type of project especially for report design. Simple reports can be built with little effort using thereport wizard. The wizard (shown in Figure 1-5) leads the user through all of the steps necessary toproduce a variety of useful but simple report designs.
24
Chapter 1
68787_ch01.qxp 26/03/2004 3:50 PM Page 24

Figure 1-5
Chapter 3 will lead you through a series of exercises to get you started with simple report design and laythe foundation of the report design elements.
In Chapter 4, we will explore data sources and datasets that provide data for reports. We will discussdifferent query types like SQL expressions, MDX expressions, views and stored procedure. Queryparameters and report parameters enable data to be filtered at the right level and to make the best use ofdata, server and network resources.
In Chapter 5, we cover the spectrum of report design items, data ranges and formatting tools. By usinggroupings, we can design multi-level, hierarchal reports. Drill-down reports let users interactivelyexpand groupings and discover more detail without having to navigate through many pages of content.Drill-though reports let users navigate from one report to another, passing filtering parameters to obtaindetail information about items in the report. Navigational links may also be used to drill-through toexternal resources like web pages, documents and email links.
Charts are useful for aggregating values and presenting a series of data for comparison. A number ofstandard charts are available including bar, column, line, area, pie and doughnut charts. Specializedcharts types like scatter, bubble, and stock charts are used with multi-dimensional data and values indistinct ranges.
25
Getting Started with Reporting Services
68787_ch01.qxp 26/03/2004 3:50 PM Page 25

Report formatting and content may be enhanced by using program code in a few different ways.Custom functions may be written in a block of code that is embedded into the report. These functionsmay then be called in various property expressions providing conditional formatting and business rules.More complex code routines may be built into a class library and exposed to reports as customassemblies. An assembly is deployed to the Report Server and may be shared by many reports. Finally,custom extensions may be written to replace or extend inherent data source and rendering capabilities,providing custom capabilities beyond those built-into the product.
URL Access to ReportsThe Report Manager environment is the default entry point and a convenient, comprehensive interfaceto view reports. However, one easy method to view a report is to simply navigate to the report's webaddress provided by the Report Server. URL query string parameters are used to specify a variety ofoptions including rendering formats, filtering parameter values, and display options. This is a simplemethod for managing and using reports right out of the box—without additional programming orconfiguration.
Rendering Reports in Program CodePossibly the most unique characteristic of Reporting Services is the way it renders report content. Unliketraditional report solutions that use a proprietary, custom viewer to render the report content; at its core,Reporting Services is built on a programmatic interface (an XML web service) that outputs the entirecontents of reports in several different file or rendering formats. This capability gives programmers anincredible range of options for creating custom solutions. These options may include:
❑ On a simple web page, users could click a link to display a custom report in their web browserusing simple URL rendering.
❑ In a custom ASP.NET web application, users provide filtering criteria on a web page; click abutton and view the resulting report in a secondary browser window without navigating off theapplication's web site.
❑ In a desktop application, users provide filtering criteria and view the report within the desktopapplication form.
❑ Custom reports are saved to an Adobe Acrobat (PDF) file that may be viewed offline on alaptop, Pocket PC or other mobile device.
An in-depth discussion of programmatic rendering may be found in Chapter 9. Even for the noviceprogrammer, creating these kinds of solutions is relatively simple and may be accomplished with just afew lines of program code.
Report Definition LanguageRather than defining a proprietary specification for individual report definitions, our friends atMicrosoft took a very different approach. They chose to publish an extensible and well documentedstandard. The entire set of instructions that define a report are stored in a single XML document using anRDL XML grammar. If necessary, property values for elements of a report's design could be modified
26
Chapter 1
68787_ch01.qxp 26/03/2004 3:50 PM Page 26

with a text editor. If someone wanted to build their own report design tool, they would simply need tooutput the appropriate XML tags to an RDL file. This also makes it easy and convenient to send thereport definition to someone or to deploy a report to another server.
In chapter eleven, we will use a third-party tool to build reports from an RDL template. This will enableus to create new reports without using Visual Studio .NET. This exercise should open your eyes to thepossibilities to design and build reports from your own custom software, extending vertical businesssystems and making Reporting Services part of a complete business solution.
Deploying ReportsReports are defined in an RDL file but the report's definition is stored in the Report Server database onceit has been deployed to the server. Report deployment may be performed in at least three different ways.In Visual Studio .NET, the project defines a corresponding web folder on the target Report Server.Building a report project will deploy reports to a designated target Report Server. The Report Managerweb interface may be used to deploy individual reports manually by simply browsing for and selectingthe RDL file. The Reporting Services web service may be used to deploy reports programmatically usingmethods of this multi-purpose object. Chapter 13 will explore each of these options and detaildeployment techniques and related considerations.
Designing and Architecting Report SolutionsReporting Services does offer an out-of-the-box solution. Reports can be designed in Visual Studio .NET,deployed to a server and viewed using the Report Manager Web interface quite easily. However, forcustom applications or to meet specific business needs, this may not be the ideal solution. ReportingServices is an extensible service with several options for designing, managing, deploying, rendering anddelivering reports to users.
In Chapter 13, we will discuss these options and consider how understanding your businessrequirements should lead to the most ideal solution. We will look at different business cases and how areporting solution fits into the overall picture to meet business and users' needs now and in the future.
SummaryAt this point, you should understand that Reporting Services uses a new approach for report delivery.Each report has a data source that may be shared with other reports. A data source can obtain frompractically any database product or data provider.
Report definitions are stored in an XML document format called RDL. Out-of-the-box, reports may bedesigned in Visual Studio .NET but third-party and custom solutions may be used to create and designreports as well.
Reporting Services can be completely secured and highly customized. The Report Manager is providedto simplify server, user and report management. Solutions may be simple and easy to implement or theymay be completely customized and integrated into your custom-built software.
27
Getting Started with Reporting Services
68787_ch01.qxp 26/03/2004 3:50 PM Page 27

Reports may be delivered using snapshots and subscriptions that are either pulled by the user in real-time, or pushed by the server on a schedule. Using these capabilities, valuable system resources areconserved since reports are rendered less often and can be cached in the Report Server database
Setup is performed using a standard Windows Installer package. We've explored the setup options andselections. Configuration settings are stored in XML configuration files that may be modified by anadministrator using a text editor.
The next chapter will help you understand the architecture that makes Reporting Services work. Youwill learn about the nuts and bolts that give this impressive product the ability to provide scalable andextensible reporting solutions. Throughout the book, we will build on this foundation as you learn todesign, manage and deploy your own reporting solutions.
28
Chapter 1
68787_ch01.qxp 26/03/2004 3:50 PM Page 28

Reporting ServicesArchitecture
Before writing any reports, we need to take a good look at what Reporting Services does. Thischapter will introduce you to Reporting Services features and architecture.In the first part of thechapter, you will look at all the features of Reporting Services. These include the Report Designer,Report Server, and Programming Interface. The chapter will provide a surface-level overview ofwhat you will see later in the book.
Next, we'll look at how Reporting Services is put together. We will walk you through the variousprocessing components, data source extensions, and rendering extensions and take a closer look athow the Reporting Services Web Service works. This chapter also includes a series of illustrationsto help you visualize each component.Once you have completed this chapter you will have a goodunderstanding of the Reporting Services "big picture". This knowledge will carry you through thefollowing chapters and help you draw it all together.
This chapter covers:
❑ The reporting lifecycle
❑ Reporting Services features
❑ Report Server components
❑ Data Processing Extensions
❑ Delivery extensions
❑ Report Server databases
❑ The Reporting Services Web Service
❑ Report Designer
❑ Reporting Services tools
222
68787_ch02.qxp 26/03/2004 3:50 PM Page 29

Chapter 2
30
The Reporting LifecycleBefore digging into the architecture of Reporting Services, you need to understand the fundamentals of areporting lifecycle. Reporting platforms can be evaluated by their support for the followingareas—authoring, management, and delivery. We will take a look at what is included in each of thesephases and later see how Reporting Services implements them. Take a look at the reporting lifecycleblock diagram shown in Figure 2-1:
Figure 2-1
AuthoringThe authoring phase is concerned with the actual development of reports. Authoring generally includesthe following features:
❑ Connecting to a data source
❑ Writing database queries
❑ Creating report layout
❑ Creating report parameters
❑ Setting report properties such as height and width
These capabilities are important for the initial development of the report. They must be flexible enoughto handle diverse reporting needs and structured enough to be easy to use.
ManagementAfter developing the report, you move into the management phase, which is concerned with settingproperties of reports specific to the production environment. These properties include:
❑ Data source connection information
❑ Default parameter values
❑ Security permissions
❑ Report caching
❑ Report execution schedules
❑ Report delivery schedules
Management phase is generally performed by the administrators. Most of the user access to reports isdefined in this phase.
68787_ch02.qxp 26/03/2004 3:50 PM Page 30

DeliveryThe delivery phase looks at how reports get to the end users. Delivery includes:
❑ Providing an end user interface for browsing reports
❑ Publishing reports on a specific schedule
❑ Delivering reports to end users
A common concept in reporting platforms is push/pull delivery. Push delivery constitutes the reports thatare sent to the user. Pull delivery constitutes reports that can be accessed on-demand by the user . Usersare required to take the effort to get the report information. The report could be emailed to the requestorof the report, or published to a specified fileshare.
Reporting Services FeaturesHaving seen the main phases in a reporting platform, let's look at the specific features in ReportingServices that make the three phases of reporting services possible. In this section, we will look at theReport Designer, Reporting Services, and the programming interface, and then move on to the specificcomponents that make these features possible.
Visual Studio .NET 2003 IntegrationAny respectable reporting platform must provide report writers with a rich set of design tools. Microsofthas created a designer to do just that. Because of the integration with Visual Studio .NET, users can takefull advantage of the established development features. The designer also gives several design options tofulfill the users reporting requirements.
The Report Designer is fully integrated with Visual Studio .NET 2003. Through this integration, theReport Designer can take advantage of a number of established tools. Let's take a closer look at what thedesigner has to offer.
Query DesignerThe query designer allows users to visually create data source queries. It works with multiple datasources and should be familiar to people already working with Microsoft products. Users cangraphically drag and drop database objects to create SQL queries. They can also switch to a genericquery designer to create freeform queries.
Server ExplorerThe Visual Studio .NET Server Explorer allows users to view and work with multiple servers. This isextremely helpful when working with Microsoft SQL Server. Users do not have to switch from theReport Designer to other tools to view database objects. They can simply open the Server Explorer andbrowse for the specific object.
31
Reporting Services Architecture
68787_ch02.qxp 26/03/2004 3:50 PM Page 31

Visual Source SafeVisual Studio .NET also integrates with Microsoft Visual Source Safe. Report writers can easily store andmaintain the version history of their report files. This can be an invaluable tool when working on bothlarge and small scale reporting projects.
Report DesignerMicrosoft has created a couple of new Visual Studio .NET templates that allow you to create ReportingServices Report Projects. These Report Projects give you a graphical interface for creating their reportdefinition. This interface displays the data sources used by the report, the layout of the report and alsoallows you to preview a report before it is published.
The Report Designer also provides a number of controls to facilitate report writing. You can create tablereports, matrices, and freeform lists. The ability to combine these controls gives you even morepossibilities.
If you want more control over the actual report definition, you can simply switch to Code view and seethe XML generated by the designer. Working with the XML might seem a bit complicated, but when youneed to do a search and replace a given word, this can be invaluable. It also lets you see a little more ofwhat is created under the covers. Unlike other proprietary formats, XML allows you to easily read anddebug report definitions.
Report Server FeaturesThe Report Server is the main component of Reporting Services. It takes care of all report processing,data access, security, and rendering. For a while now, I have looked for what I truly felt was a service-based application—you hear a lot about it in development circles. I believe Microsoft has hit it onthe head with this one. Reporting Services is truly a serviced application. Microsoft has elegantlyencapsulated all the reporting functionality into one neat package. In this section we'll take a quick lookat what's available.
Central Report StorageReporting Services creates one central store for your reports. This eliminates the need to deal with abunch of messy fileshares. On a recent client engagement, I used it to help consolidate all of theirdifferent report areas into a hierarchical structure. This is easily accomplished with features available inReporting Services. Central storage also makes it much easier for your users to access their reports—nomore searching a bunch of directories for the item you want!
SecurityIn any reporting environment, you will have the need to secure certain items. Reporting Servicesintegrates with Windows security to create a flexible role-based security model. This model allows youto create roles with a number of different permissions. You can then assign Users and Groups to theseroles.
32
Chapter 2
68787_ch02.qxp 26/03/2004 3:50 PM Page 32

Reporting Services security is really the combination of three different items:
❑ Role definitions: A set number of tasks that can be performed. These include item-level roles,which apply to reports, folders, resources, and data sources, and system roles, those that applyto the Report Server site.
❑ Securable object: Securable objects include reports, folders, resources, data sources, and theReport Server itself.
❑ Windows users and groups: The combination of a role definition, securable object, and aWindows user/group creates a role assignment. This security model encapsulates the commonfeatures needed in a reporting system and gives you the flexibility to adopt it in yourorganization.
Report DeliveryOnce you have created your reports, you will need an easy mechanism to deliver them. ReportingServices follows the standard push/pull model for reports. Push/pull refers to the ways in which a usercan access information.
When you go to a web site and view stock quotes, you are pulling information, hence the push/pull partof the model. Users must be able to access information freely. Reporting Services allows users tonavigate through the web to see listings of available reports.
Let's say you order a book online from http://www.amazon.com/ (hopefully this book). After you enteryour credit card information, email address, and so on, and press Buy, Amazon sends a receipt to yourinbox. This is an example of a push report. Email is just one delivery method for push reports. ReportingServices supports both email and fileshare push deployment along with the ability to create your owndelivery extensions.
To take maximum advantage of a truly effective reporting system, users should have the ability to grabinformation when convenient and get information delivered on a regular basis.
SchedulingAlong with being able to deliver reports via email or a fileshare, a reporting system must have somemechanism to send these items on a regular basis. Reporting Services relies on SQL Server Agent toschedule and execute given tasks. Scheduling features in Reporting Services allows individual users andadministrators to subscribe to reports on a schedule they define.
But, delivering information is not the only area where a scheduling tool comes in handy. If we thinkabout what part of generating a report takes the longest, it is generally the actual retrieval of data.Reporting Services helps you eliminate some of this wait time by scheduling reports to execute (retrievetheir data) on a regular schedule. So, if you update your sales information every Sunday, you couldeasily schedule a report to run early Monday morning. So when users come in on Monday, they'll havequick access to their information.
33
Reporting Services Architecture
68787_ch02.qxp 26/03/2004 3:50 PM Page 33

Programming Interface FeaturesWhen selecting a reporting platform, it is crucial to be able to extend that platform and incorporate it inexisting systems. Microsoft has provided a web service interface for accomplishing these goals. Throughthe web service, you have complete access to the Reporting Services platform. Anything from renderingreports to creating subscriptions can be performed programmatically.
Open ArchitectureWhy did Microsoft use a web service interface? Web services are built on an open architecture. Thismeans you do not need to have Microsoft development technologies to take advantage of them. The keyto web services is that they are built on industry standard technologies. Through the use of XML, SOAP,and HTTP just about any platform can call and use web services.
Complete AccessNot only did Microsoft create a platform-neutral programming interface, they also let you do anythingyou need to through the interface. It is common to work with an API where the developer has limitedcontrol over what happens. With Reporting Services, the world is really open to you. If you just don'tlike the administrative tools that come with Reporting Services, you could write your own.
Most people do not go to this extreme, but it is important to have the flexibility. This means that as anapplication developer you can add any part of Reporting Services you need into your application. Acommon example would be creating your own custom interface for rendering reports. You could make itmuch easier for your users to get the report in exactly the format they want. Another example would becreating your own subscription interface. You might already know the users email information, so theyclick a few buttons and the subscriptions are done.
The possibilities for using the Reporting Services Web Service are only limited by what the product cando. This should be incredibly good news to all the code junkies out there.
Report Server ComponentsNow that we have taken a look at what Reporting Services can do, let's get down to the nuts and bolts ofhow it works. In this section we will focus on the various components of Reporting Services. We'll movethrough processing of the report and data to rendering and delivering reports.
Report ProcessorReport processing is the main driver in the Report Server. The Report Processor is responsible forhandling user requests and returning the appropriate report and data. Along with this task it alsoperforms caching of reports to improve performance. Let's take a look at the individual components thatconstitute report processing.
The main job of the Report Processor is to combine the report definition and report data to create andreturn this data.
34
Chapter 2
68787_ch02.qxp 26/03/2004 3:50 PM Page 34

Report Request HandlingWhen a report request is received, the report processor takes the following steps:
1. It determines which report is being asked for and retrieves the report definition from the ReportServer database.
2. The report processor asks for the report data. This is a call made into the data processingextensions (more on this in a moment).
3. The Report Server combines the two into an intermediate format. The intermediate format isthen sent to the rendering extensions for delivery.
Report DefinitionThe report definition is an output format and a neutral representation of the report. Reporting Serviceswas designed to support numerous output formats, so the report definition is not aware of how thereport will actually be rendered. The report definition defines the query and layout of a report. These arethings like the tables contained in the report, their position in the report, and number of columns. Thequery information is then used to retrieve data and to combine it with the layout. Once the reportdefinition and data are combined, they form an intermediate format.
Intermediate FormatThe intermediate format is an internal format of the report used by Reporting Services for rendering andcaching. It is this format that is sent to the rendering extensions. It is a combination of both the data andreport definition. The size of the intermediate format will depend mostly on the data that is returned.
CachingThe report processor also handles the caching of reports. When working with a reporting solution, themain bottleneck in report performance inevitably is the execution of queries. To solve this problem,Microsoft has developed a number of caching strategies. These strategies offer various performancegains and flexibility. The basic premise of a cached report is that we stored the report definition and datatogether. Thus when a user requests a report, the only thing that needs to be performed is the actualrendering. Rendering by comparison with other activities, is a relatively inexpensive part of the reportprocessing in terms of server resources. Let's take a look at each of the caching strategies.
Session CacheSince Reporting Services works over HTTP (we will talk more about this later), it must maintain someinformation about each user request. This is referred to as session information. If the same user asks forthe same report in a relatively short period of time, it does not make sense to query that informationagain. So, when a user makes an initial request, the report definition and data are stored in the sessioncache. Session cache is used with on-demand reports (reports not cached).
Cached InstancesCached instances also store the report definition and data, but they must expire at some given time. Thistime frame could be an hour, week, or month. The actual start time, however, is not defined. With acached instance, the first user that requests the report has to wait for the query to process. After thisinitial request, the timeout is started. Once the report expires, the next user requesting the sameinformation will have to execute the associated query.
35
Reporting Services Architecture
68787_ch02.qxp 26/03/2004 3:50 PM Page 35

This caching strategy is perfect if you have slower changing data, or even data that changes frequentlybut is not critical to update as soon as it changes. A good example of this would be stock quotes. Theyupdate constantly. It would be incredibly taxing on software systems if they had to keep up with thisrapid rate of change. So, instead of updating every millisecond, stock quotes are generally updatedevery five to ten minutes.
SnapshotsThe final type of caching strategy is the snapshot. Like the name implies, it is a snapshot of the data at agiven point in time. Unlike cached instances, snapshots have a defined start time and not definite endtime. Let's say you have a group of users that needs summary reports every Monday at 7:00 am for aweekly meeting. You are in the data warehousing group and have jobs that process data late Sundaynight in preparation for the meeting. Once the data is processed, it does not change. This data is alsovery large and takes a long time to query. In that case, it makes perfect sense to store the reports rightafter the information is available. This way when people come in Monday morning to run the reports,they are kept ready and the users will not have to wait for any query processing. Therefore, by usingsnapshots, data is made available at a specific time within minimum amount of processing time.
Working again from our example above, a week goes by and you are again ready to run your reports.Would you want to get rid of the previous week's information? Certainly not—as soon as you do,someone is bound to ask for it! So, you need a mechanism to store that information away. ReportingServices gives you the ability to store a history of report snapshots. That way, even though the newsnapshot has been created, the old one is still available.
Report Processing IllustratedFigure 2-2 shows the process of requesting a report and moving through the Report Processor:
Figure 2-2
36
Chapter 2
68787_ch02.qxp 26/03/2004 3:50 PM Page 36

Data Processing ExtensionsNow that we have seen the Report Processor, let's take a look at how the actual data is retrieved. Data isreturned to the Report Processor through the Data Processing Extensions. The Data Processing Extensionthat is used will depend on the data source defined in your report. We describe the common functions ofall these extensions and then those that are supported by Reporting Services.
Data Processing DefinedData Processing Extensions are used to return data from a given data source. The architecture inReporting Services supports the .NET managed providers and allows you to create extensions for yourown particular data source.
The common functions that all Data Processing Extensions perform are as follows:
❑ Connect to the data source
❑ Pass parameters to the query
❑ Run the query on the data source
❑ Return a list of field names from the query
❑ Move through the rowset to retrieve data
Supported ProvidersReporting Services supports the .NET managed providers for returning data. These include SQL Server,OLEDB, ODBC, and Oracle. Since they are managed providers, they take full advantage of the .NETFramework. Using these four data providers, users should be able to connect to just about any datasource. Let's take a look at some common providers.
SQL Server ProviderUsing the SQL Server provider, users can retrieve data from SQL Server tables, stored procedures, views,and User Defined Functions (SQL 2000). The SQL Server managed provider is optimized to connect toSQL Server. Extra layers such as OLEDB and ODBC have been removed for optimal performance.
Oracle ProviderAlthough Reporting Services uses SQL Server to store its metadata, you can use Oracle as a source foryour reports. Like the SQL Server managed provider, the Oracle managed provider is optimized forOracle and removes extra layers such as OLEDB and ODBC.
OLEDB ProviderThe OLEDB provider gives report writers a great deal of flexibility. Using this provider, you can query anumber of different data sources. The following is a list of just a few:
❑ Microsoft Analysis Services
❑ Microsoft Access
37
Reporting Services Architecture
68787_ch02.qxp 26/03/2004 3:50 PM Page 37

❑ Microsoft Excel
❑ Microsoft Directory Services
ODBC Processing ExtensionODBC works through the .NET OLEDB managed provider. The ODBC Processing Extension allowsusers to access any system with a compatible ODBC driver. This opens the door to reporting on anumber of legacy systems, such as dBase and FoxPro. ODBC drivers have been written for most oftoday's database systems.
Be careful when using an ODBC driver. It is possible to connect to SQL Server, Oracle, and a number ofdata sources listed earlier. If you use an ODBC driver to connect to these data source instead of thenative .NET managed provider or OLEDB provider, you could seriously hamper query performance.With your data sources, look for a .NET managed provider first, then an OLEDB provider, and if neitherof these options is available, use an ODBC driver.
Data Processing Extensions and Data ProvidersAlong with the four .NET managed providers, users can also create their own custom Data ProcessingExtensions or data providers through the Reporting Services API. This allows users to expose thefunctionality of their data source to the end user and achieve some performance gains. The .NETFramework also allows the creation of .NET data providers. Since Reporting Services supports .NETdata providers, this would be another viable option for connection to your custom data source. The roleof Data Processing Extensions in relation to the report processor and the data source is shown in Figure 2-3:
Figure 2-3
38
Chapter 2
68787_ch02.qxp 26/03/2004 3:50 PM Page 38

Supported Rendering ExtensionsReporting Services also supports a number of different rendering extensions. When creating a report inReporting Services you are creating them in a neutral output format. In the report, you define the query,the fields, and how they should be laid out. It is the job of the rendering extensions to take thisinformation combined with the data and create a useful output. Often, this is not an easy task. Let's takea look at some of the supported extensions. Microsoft has provided seven different rendering extensions.Each of these can be used to return report information.
ExcelThe Excel rendering extension takes report data and outputs it to Excel. This is a common format formany users, especially for those users who will perform further analysis on the information.
The Excel rendering is more sophisticated than competing reporting platforms. Many reportingplatforms lay out reports in a banded format. If you are familiar with Microsoft Access, you willunderstand the different bands for data detail, grouping headers and footers, page headers and footers,and report headers and footers. While this type of banded report does offer an extremely flexible reportdesign, it does not always translate well into an Excel document.
By incorporating table and matrix controls in reports, users can create report layouts almost like theywould in Excel. This type of layout lends itself nicely to rendering in Excel.
At the time of writing, Excel rendering is limited to Office XP and Office 11.
PDFMicrosoft also provides a rendering extension for PDF Format, which is probably the most populardocument format on the web. It is clean and easy to read and has printing capabilities. You would mostlikely choose this format for reports that are widely distributed but not analyzed by the end users. Thereports that are in PDF format cannot be altered. Some common examples would be invoices, inventorypick tickets, weekly sales summaries, and a company's public financial documents.
PDFs also support document map functionality. This feature in Reporting Services allows you to definebookmarks within your report. Once the report is rendered, users can click on links to easily navigate todifferent areas of the report.
End users can download Adobe Acrobat Reader for free and you do not need a license to distribute PDFdocuments generated by Reporting Services.
HTMLProbably the most common output format for reports in Reporting Services is HTML. Since both theDesigner Preview and Report Manager work in this view, reports can be rendered in HTML 4.0 orHTML 3.2. The .NET Framework looks at the user request to determine which browser is being used andthen renders the report in the appropriate HTML format.
HTML rendering is good for interactive reports. By navigating to a web site, a user can easilymanipulate report parameters to find specific information. HTML rendering also supports dynamicvisibility, which gives users the ability to drill down to detailed information and supports document
39
Reporting Services Architecture
68787_ch02.qxp 26/03/2004 3:50 PM Page 39

maps for easier navigation. Users can also render reports to HTML with Office Web Components. Thisallows for even greater manipulation of report information.
HTML rendering, however, is not good for printing. HTML pages are truly meant for displayinginformation. Most web applications will allow users to click a link and print printer friendlyinformation. In Reporting Services, users can simply export a report to PDF or Excel and print it fromthere.
Web Archive (MHTML)Web Archive or MHTML is commonly found in email messages. MHTML stands for MIME Encapsulationof Aggregate HTML Documents and these files have a .MHT extension. Generally an HTML documentreferences a number of external resources such as images and style sheets. Although HTML allows forrich formatting of documents, it is hard to transport them when they reference other independentobjects. MHTML takes care of this by encapsulating the externally referenced information such asimages into one document.
MHTML documents are useful when sending out subscriptions. If users would like to view reportsthrough email without opening an attachment, then MHTML is the appropriate format. One thing tonote though is that not all email clients support this standard, so check your User Communities setupfirst.
CSVThe Comma Separated Value (CSV) format takes the report definition and data and transforms it into a flatfile. This type of output is not appropriate for reading. It is suitable as a data exchange format. Youmight have customers with legacy systems that are very good at parsing and consuming flat files. In thiscase, you could electronically send reports in CSV format to these users. They could in turn consume thedata and report on it or manipulate it how they see fit.
TIFFThe Tag Image File Format (TIFF) is a widely used format for storing document images. Many facsimileprograms use this format to transfer data. Many organizations store documents in documentmanagement systems such as SharePoint Portal Server. Reports rendered in TIFF format would beexcellent candidates for this type of document system. You could place historical snapshots of reportsinto your document management system and then remove them from the Report Server. This wouldallow you to take advantage of common document management features such as indexing.
XMLThe Extensible Markup Language (XML) is very different from CSV rendering, but can serve many of thesame purposes. XML is a structured markup language that lets you define data. Reporting Services usesthis markup in a number of areas. When reports are rendered as XML, they include both the reportdefinition and data, much like CSV rendered reports. Similar to CSV files, XML files are designedexplicitly for the exchange of information. You could send XML rendered reports to customers or otherapplications for additional processing, or you could run the XML rendered report through an XMLTransform document to control the standard formatting of the document.
40
Chapter 2
68787_ch02.qxp 26/03/2004 3:50 PM Page 40

Customized ExtensionsAlong with the seven supported rendering extensions, the Reporting Services API also allows users tocreate their own rendering extensions. So, if you want to output a report to a Word or a GIF file, youcould create your own extension. Report rendering is illustrated in Figure 2-4:
Figure 2-4
Scheduling and Delivery ProcessorThe Scheduling and Delivery Processor has two major functions, creating report snapshots anddelivering subscriptions. These tasks hinge on the use of Microsoft's SQL Server Agent. The SQL ServerAgent is responsible for queuing scheduled events. Reporting Services monitors these events and takesappropriate action as and when required. Scheduling and delivery have been encapsulated togetherbecause they use similar functionality. In both cases, Reporting Services is watching for a given event,processing the report, and then either storing that processed report or delivering it. Let's take a closerlook at both the scheduling and delivery areas.
Scheduling Scheduling refers to the actual setting up of the report execution and delivery schedule. When we storereport schedules, this information is relayed to the SQL Server Agent to queue the request at theappropriate time. Both users and administrators can define schedules for report execution and delivery.
41
Reporting Services Architecture
68787_ch02.qxp 26/03/2004 3:50 PM Page 41

DeliveryDelivery deals with the mode of delivery of reports in Reporting Services. Users can have reportsdelivered via email, a fileshare, or a customized delivery extension, you will see more on deliveryextensions in the forthcoming sections.
There are two types of subscriptions available in Reporting Services, standard and data-drivensubscriptions.
Standard Subscriptions
Users can create their own subscriptions through Report Manager or a custom interface. Additionally,administrators can also create subscriptions for users. When setting up a standard subscription,information such as parameter values and rendering format can be set along with a schedule for reportdelivery.
With standard subscriptions, users can define their own schedule for receiving a report. This isimportant for small scale reports and gives users a great deal of freedom in how they receive certaininformation.
Data-Driven Subscriptions
Data-driven subscriptions offer a great deal of flexibility when delivering reports. You can create reportsfor any number of users, use different rendering formats for each user, and even change reportparameters for each. This allows you to create a very custom report experience for users with a minimalamount of work.
Think of a large retail organization where each store in the organization has a store manager. Each weekthe store manager receives the sales numbers from the previous week. The report is identical for eachmanager except for the reference to the actual store. So, using data-driven subscriptions, you coulddynamically set the store report parameter for each report and then email these individual reports toeach manager. In the end you have created only one report, but quickly tailored it for a number ofdifferent users.
In both standard and data-driven subscriptions, the delivery of these reports is event-driven.
Schedule-Based Events
One of the common methods of determining when reports are to be delivered is doing so through somesort of schedule. The report could be delivered every month, week, day, or at any such pre-decidedinterval of time. Reporting Services gives users a number of different options when setting schedules.These schedules can be either specific to a given subscription or shared through Reporting Services.
Let's imagine that your organization has a set of reports that have their underlying data updated everySunday evening. Executives for a Monday morning meeting can use this information. You could define ashared scheduled that contains information such as "Weekly, Monday, 6 am". This shared schedule couldthen be used for any number of reports. If later you decide that sending the report at 6 am does not meetnew requirements, you could simply edit the shared schedule and thereby change the schedule for eachreport using it.
42
Chapter 2
68787_ch02.qxp 26/03/2004 3:50 PM Page 42

Snapshot Update Events
Delivery of reports can also be triggered by the update of snapshot reports. Many reports in anorganization have set intervals after which they are updated. For example, data for a monthly salesreport is always updated on the last day of the month. Once this has happened, the data is frozen anddoes not change for an entire month. If you want to create a report from this information, does it makesense to query the database each time the report runs? No, the information at this point is static. So, wecreate a snapshot of the data at the end of each month and store the entire report. At this point whenusers display the report you no longer have the overhead of a database call.
If we were going to update our reports according to a given schedule, it would only make sense todeliver them to the appropriate users when they are ready. Reporting Services allows users to set theirsubscriptions based on updates to snapshots. Through this method, we do not have to worry aboutsetting a defined time when we think the report will be done processing; instead it will send off thedelivery when report processing is finished.
Scheduling and Delivery Processor IllustratedThe following set of illustrations (Figure 2-5) will walk you through the various tasks performed by theScheduling and Delivery Processor. Let's begin by handling the initial subscription and then move on torunning snapshots and delivering subscriptions.
Figure 2-5
Now that we have seen how report schedules are created, we can look at both snapshot processing andsubscriptions processing (Figure 2-6):
43
Reporting Services Architecture
68787_ch02.qxp 26/03/2004 3:50 PM Page 43

Figure 2-6
The final piece of scheduling and delivering is subscription processing. In Figure 2-7, you can see theindividual steps in the processing of report subscriptions:
Figure 2-7
44
Chapter 2
68787_ch02.qxp 26/03/2004 3:50 PM Page 44

Delivery Extensions
Delivery extensions are tied heavily to the Scheduling and Delivery Processor. They are used whensending subscriptions to users. Microsoft has provided two delivery extensions and given users theability to develop their own. Reporting Services comes with two delivery extensions—email andfileshare. Let's take a look at each.
EmailThe email delivery extension allows users to receive reports directly in their inbox. You can specify therendering format that you would like the report to be delivered in and whether or not to include a weblink to the report. Depending on the rendering extension used in the report, users will either see thereport directly in their mailbox or receive it as an attachment. As mentioned earlier, you could use theWeb Archive (MHTML format) to embed reports and their images in an email message.
To send email deliveries, Reporting Services must be able to communicate with a valid SMTP server.This setting is initially set when installing Reporting Services.
File ShareReports can also be delivered directly to a fileshare. For this, Reporting Services must have Writepermissions to the share. You can also specify credentials to use when sending reports to a fileshare.
Custom ExtensionsAlong with the supported extensions, Reporting Services also allows for the creation of custom deliveryextensions. Say you like monthly reports to be delivered directly to a printer after they have beenprocessed. You can create your own delivery extension and then schedule a subscription to use thisdelivery extension. In the Reporting Services sample folder, you can find an example for creating adelivery extension for a printer. Delivery extensions are illustrated in Figure 2-8:
Figure 2-8
45
Reporting Services Architecture
68787_ch02.qxp 26/03/2004 3:50 PM Page 45

Report Server DatabasesReporting Services relies on SQL Server for storing its metadata. This allows for greater scalability inlarge reporting applications. This also allows you to take advantage of features inherent to SQL Server,such as backup and transaction logging.
Reporting Services uses two SQL Server databases to store data, ReportServer andReportServerTempDB. In the next section, we will take a look at the major components of each databaseand describe how they are used. We will also take a quick look at a Data Transformation Service (DTS)package provided for monitoring information.
ReportServer DatabaseThe ReportServer database is the main store for data in Reporting Services. It houses all reportdefinitions, data sources, schedules and delivery information, security information, and snapshots andsnapshot history. There are a series of tables for each functional area. The database schema is open andgenerally easy to follow.
Updating or querying these database tables is not recommended, but an understanding of how they arearranged should give you a better understanding of how Reporting Services works.
The following table lists some of the tables in the ReportServer database and their related functions:
Table Name Function
Resources
Catalog Information such as report definitions, folder locations, and data sources.
DataSources Information about individual data sources. When reports are published, the data source information is removed to avoid inadvertent overwrites.
Security
Users User name and security ID (SID) information for authorized users.
Policies User/Group role assignment information.
PolicyUserRole User/Group role assignment information.
Roles Role descriptions and permissions.
Snapshots and Snapshot History
SnapshotData Snapshot schedule information.
ChunkData Actual report snapshots containing report definition and data.
History Snapshot history information.
46
Chapter 2
68787_ch02.qxp 26/03/2004 3:50 PM Page 46

ReportServerTempDB DatabaseAs the name implies, the ReportServerTempDB database stores temporary Reporting Servicesinformation. User session information is stored in the ReportServerTempDB. Because ReportingServices communicates using HTTP, no state is maintained between the client application and the server.Session state about the reports that the user is running must be stored between each server call. TheReportServerTempDB stores this information in a SessionData table.
ReportServerTempDB also stores report cache information. When a report is set as a cached instance,there is no definite time when that report is executed. It depends on which process requests the reportfirst. Once the report is executed, the intermediate format and data are stored in theReportServerTempDB database. If this database were to fail, the cached information would be lost. But,since it is executed when a user views the report, there is no real loss of information. Snapshots, on theother hand, are not stored here. Their execution time is usually at a set moment to ensure that the dataon the report is correct. Therefore, this information is stored in the more permanent ReportServerdatabase. Reporting Services will not be able to function without the ReportServerTempDB database.
When working with Reporting Services, it is important to pay close attention to theReportServer database. It contains all critical information related to ReportingServices and should be backed up on a regular schedule.
Table Name Function
Scheduling and Report History
Schedule Schedule execution information.
ReportSchedule Relates a given report to its execution schedule and subscription information.
Subscriptions Subscription information such as owner, parameters and delivery extension.
Notifications Subscription notification information such as date processed and last runtime and delivery extension.
ActiveSubscriptions Information on subscription success and failure.
RunningJobs Currently executing schedule processes.
Administrative
Configuration Reporting Services configuration settings.
ExecutionLog Log of report executions including report, time started, time ended, format, and parameters.
47
Reporting Services Architecture
68787_ch02.qxp 26/03/2004 3:50 PM Page 47

It is not necessary to backup the data in the ReportServerTempDB.
Viewing Execution InformationAs mentioned earlier, it is not recommended to view or modify the underlying SQL Server tables. It isalso very difficult to analyze execution information in the ReportServer database. So, Microsoft hasprovided a DTS package for moving this data out of the ReportServer database.
To use the DTS package, you must first create a database to hold execution log information. Microsoftprovides a number of scripts in Reporting Services to help with this task. Once the database has beencreated, you can use the DTS package to move information into it. Once the information has been movedto the new database, you can run queries against it or maybe even create a Reporting Service report.
The Reporting Services Web ServiceOne of the most outstanding aspects of Reporting Services is its open programming interface.Everything that we have seen so far can be performed through the Reporting Services Web Service. TheReporting Services Web Service is a set of functions you can use to render, subscribe to, and publishreports.
Reporting Services takes advantage of technologies already implemented in Internet Information Server(IIS) and the .NET Framework. Both these components provide the backbone infrastructure for webservices. IIS performs web request handling and routing along with some security. The .NET Frameworkprovides classes for consuming and publishing web service interfaces.
To understand the Reporting Services Web Service, you must first understand the underlyingtechnology.
Web ServicesWeb services have really been a hot topic over the last few years. With them comes the promise ofvarious applications exchanging information freely with one another. No more complicated interfacesfor calling code on disparate systems—just one set of standards that everyone can follow.
The standards are what make web services so inviting. In the past, different companies have come upwith their own standards for interfacing different sections of code. COM for example is a specificationthat allows code written in Visual Basic to talk to code written in C++. This is fine if you are working onMicrosoft platforms, but what if you want your Visual Basic application to use functionality in a COBOLapplication. You would have to write some cumbersome code to make this happen. Let's take a look atthe standards that make web services possible.
Open StandardsThere are a number of open standards that make web services possible. When you think of codecommunicating with other code and all the tasks that entails, you quickly find some similarities. First ofall, you need some transport mechanism for sending information.
48
Chapter 2
68787_ch02.qxp 26/03/2004 3:50 PM Page 48

One of the most widely adopted standards for sending information is Hypertext Transfer Protocol (HTTP)which is the default standard for web communication. It has the ability to send information back andforth between remote machines and has a huge implementation base. All major platforms today supportsending information via this protocol. Now that we have a transport mechanism, we need to package (oraddress) the information.
Simple Object Access Protocol (SOAP) is a messaging protocol designed specifically for the distribution ofinformation via HTTP. SOAP messages define a standard to package data and send it across the Internet.Some of this information includes header information for the message, security information, and theactual message body of itself. SOAP also uses XML as part of its protocol. So, you've got a package and away to send it—now all you need is the message.
Visual Studio .NET IntegrationVisual Studio .NET has complete support for using web services. Consuming web services is almost aseasy as working with objects in the .NET base classes. Using the Visual Studio .NET IDE, you can easilyadd web references to your projects and get full access to a web services. Using the Reporting ServicesWeb Service through Visual Studio .NET allows you to take advantage of the IDE built-in functionality.
Although Visual Studio .NET makes it easy to work with web services, it is not the only developmentoption. Because web services are built on open standards, any development tool supporting thesestandards can be used to work with them. For example, if you want to integrate Reporting Servicefunctionality into your Microsoft Office applications, you can. Through Visual Basic for applications, youcan write code that calls web services and therefore can call Reporting Services. You might want to builda list of reports into an existing Microsoft Access application. This could be easily accomplished in a fewlines of code using the Reporting Services web service.
Available FeaturesAny feature that you use in the Report Manager interface can be used or accessed through the ReportingServices Web Service. There are no special calls from the Report Manager to Reporting Services.
Here is a list of just a few things available through the Reporting Service Web Service. The rest of thebook will go into detail on these topic areas:
❑ Rendering reports through various rendering extensions
❑ Publishing reports programmatically
❑ Creating snapshot reports
❑ Adding snapshot reports to history
❑ Creating subscriptions
❑ Modifying data sources
Web service messages are sent encoded in XML. This allows services to have richlydefined interfaces and yet be able to use the structure of XML. It also allows othersystems to easily read and manipulate data.
49
Reporting Services Architecture
68787_ch02.qxp 26/03/2004 3:50 PM Page 49

The list could continue on with a number of different features. Just remember that anything you do inReport Manager can be done through the Reporting Service Web Service.
Report DesignerCreating reports in Reporting Services is very straightforward. Microsoft has provided a set of tools thatallow you to easily build and publish your reports. In this section, we will take a look at how the ReportDesigner is incorporated in Visual Studio .NET and also explain the RDL file created by the designer.
Visual Studio .NETMicrosoft has chosen Visual Studio .NET as the standard development tool for their products. Alongthese lines, they have incorporated the Reporting Services Report Designer into Visual Studio .NET.Visual Studio .NET provides a number of other features other than the Report Designer.
Once you have installed the Reporting Services, there are a couple of project templates added to VisualStudio .NET. Inside Visual Studio .NET you will see a folder called Business Intelligence Projects. Thisfolder contains both the Report Project Wizard template and Report Project template. Choosing either ofthese project templates will load the Report Designer.
Report Definition Language (RDL)Now let's take a look at what exactly the Report Designer does. The Report Designer allows you tovisually layout reports and build their underlying queries. This information is used to create an, RDLfile. An RDL file is a XML document that defines the elements of a report. It is this file that is eventuallypublished to the Report Server. Once the file is published, the report definition is stored in theReportServer database. Any subsequent publishing of the report replaces most of the definition storedin the ReportServer database. You will learn more about RDL in Chapter 11.
Reporting Services ToolsThere are a couple of tools included with Reporting Services. These tools allow you to publish reports,modify data sources, set security information, and a number of other tasks. Each of these tools relies onthe Reporting Services Web Service. Anything that you can perform with these tools can be written inyour own custom code. Let's take a look at a couple of the major tools, Report Manager and RS.EXE.
Report ManagerReport Manager is the main management tool for Reporting Services. It provides the followingfunctionality:
❑ Report management
❑ Uploading RDL files
❑ Managing folder hierarchies
50
Chapter 2
68787_ch02.qxp 26/03/2004 3:50 PM Page 50

❑ Setting data source credentials
❑ Managing default parameter values
❑ Creating linked reports
❑ Creating execution snapshots
❑ Setting caching options
❑ Security
❑ Setting server-level and item-level security
❑ Defining Reporting Services Roles
❑ Assigning Windows Users and Groups to roles
❑ Report delivery
❑ Viewing reports
❑ Exporting reports to different rendering formats
❑ Defining report subscriptions
We will take a closer look at the Report Manager in Chapter 5.
Report Server Command-Line Utility (RS.EXE)Reporting Services also comes with a command-line utility to simplify management of reports. Afterinstalling Reporting Services, you will find a file named RS.EXE. This utility contains a reference to theReporting Services Web Service and allows users to call any of the service methods. To use the ReportingServices command line utility, you must first create a Visual Basic .NET input file. This file contains onemain procedure and then instructions for working with the Report Server. The commands in the VisualBasic .NET file rely on the Reporting Services Web Service to perform their tasks. This file can then bepassed into the command-line utility for execution.
A common example of this would be deploying development reports on a set basis. You can create acommand line utility that checks for files updated in the Report Definition files. Once file changes arefound, you could then use the Reporting Services command line utility to publish these files to thereport server.
Reporting Services comes with a few samples that demonstrate how to perform various tasks usingRS.EXE.
Reporting Services IllustratedNow that we have seen all the components that make up Reporting Services, let's take a look at anoverall illustration. Figure 2-9 shows the different components of Reporting Services and how they aregrouped. Notice that the actual functionality of Reporting Services is all encapsulated in one area. Thedatabases storing data for the Reporting Service are separate. This means that we can physically separate
51
Reporting Services Architecture
68787_ch02.qxp 26/03/2004 3:50 PM Page 51

the different components of Reporting Services to take advantage of web farm configurations (multipleservers combined to distribute processing), allowing us to create highly scalable applications.
Also notice that all calls to the Reporting Service go through the Reporting Services Web Service. Thismeans that you can create your own custom front ends and have complete access to the ReportingService.
Figure 2-9
SummaryIn this chapter, we covered the basics of Reporting Services. We started with a look at the three differentreporting phases, authoring, management, and delivery. In the authoring phase, you dealt-withdeveloping the report. In the management phase, you set attributes around the reports to use in thereport generation phase. In the delivery phase, you specified the format in which users can view reports.
52
Chapter 2
68787_ch02.qxp 26/03/2004 3:50 PM Page 52

After discussing the phases, we saw the features of Reporting Services that support these phases. TheReport Designer allows users to create rich reports. Once reports are created, they can be published tothe Reports Server. Using Report Manager, we can update and maintain report information such as datasources and security information. If users need to view reports, they can go through the Report Managerinterface or a custom interface created using the Reporting Services Web Service. Users andadministrators also have the ability to create subscription information for a report.
In the final section of the chapter, we saw the specific components of Reporting Services. We started bylooking at how reports definitions and data are combined by the Report Processor. The Report Processoralso relies on data extensions to do the physical retrieval of information. After the data is received, theReport Processor calls the Rendering Extensions to get the formatted output of the report. Along withthe Report Processor, you saw the Scheduling and Delivery Processor. This component allows executionsnapshots to be created and report subscriptions to be sent out. When report subscriptions are sent out,they are sent using delivery extensions such as email and fileshare.
Now that you have seen the foundation of Reporting Services, you can move on to creating your firstreports.
53
Reporting Services Architecture
68787_ch02.qxp 26/03/2004 3:50 PM Page 53

68787_ch02.qxp 26/03/2004 3:50 PM Page 54

Designing Reports
Let's take a look at the big picture of designing reports in SQL Server Reporting Services. We willexamine most of the important features of Reporting Services just to get an idea of what you cando with the product. We'll also point you to later chapters to get more information and to learnabout the details. We will be using Visual Studio .NET to design and create reports. You may useany edition of Visual Studio .NET 2003 or later.
Before you read on you need to get your bearings and discuss this chapter's direction. In anytechnical book, it's necessary to get every reader at a basic level of understanding before movingon to advanced material. Different readers may have varying levels of expertise or experience withVisual Studio, so let's start with the basics. Don't worry whether you've never seen Visual Studiobefore, or if you are a tenured Visual Studio .NET developer, we're going to cover the rightmaterial at the right depth at the right time. If you have used Visual Studio for applicationdevelopment, please be patient as you read through the next section. If you have never written aline of code in your life or if you are new to Visual Studio .NET, you're in luck.
This chapter covers the following topics:
❑ Using the Report Wizard
❑ Importing reports
❑ Planning for extensibility
❑ Report items and data regions
❑ Formatting considerations
❑ Pagination and printing considerations
We're covering all the essentials in this section. This chapter contains a series of walkthroughexercises that are intended to lead you step-by-step through some basic report design.
333
68787_ch03.qxp 26/03/2004 3:50 PM Page 55

Chapter 3
56
Using the Report WizardTo get acquainted with the basic mechanics of reports, let's start with a quick tour of the Report Wizardused to create a simple, tabular report. The Report Wizard will take you through all of the stepsnecessary to design a basic report. From that point, you can make adjustments and add more features toyour report. To get started, open Visual Studio .NET as in Figure 3-1 and close any projects or solutionsthat you may have opened. Click the left-most button on the standard toolbar to create a new project:
Figure 3-1
The Reporting Services installation adds a project type category called Business Intelligence Projects.Choose this group, select the Report Project Wizard template and enter a name for the project. This createsa new report project and launches the wizard as in Figure 3-2:
Figure 3-2
68787_ch03.qxp 26/03/2004 3:50 PM Page 56
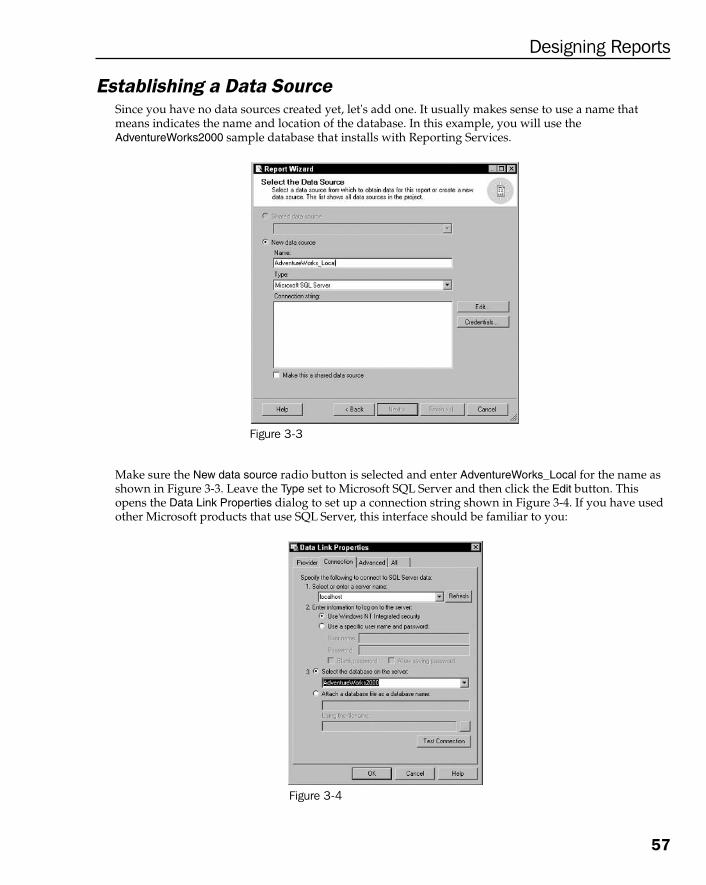
Establishing a Data SourceSince you have no data sources created yet, let's add one. It usually makes sense to use a name thatmeans indicates the name and location of the database. In this example, you will use theAdventureWorks2000 sample database that installs with Reporting Services.
Figure 3-3
Make sure the New data source radio button is selected and enter AdventureWorks_Local for the name asshown in Figure 3-3. Leave the Type set to Microsoft SQL Server and then click the Edit button. Thisopens the Data Link Properties dialog to set up a connection string shown in Figure 3-4. If you have usedother Microsoft products that use SQL Server, this interface should be familiar to you:
Figure 3-4
57
Designing Reports
68787_ch03.qxp 26/03/2004 3:50 PM Page 57

There are three steps to complete this dialog:
1. Select the database server from the drop-down list. Since you're using the database serverinstalled on the local computer, enter localhost. If this were a production application, you couldselect the name of any server on your network from the list, and then type the server name orenter an IP address to connect to a server over the Internet.
2. To use integrated Windows security, select the first radio button reading Use Windows NTIntegrated Security. The second option would be used if you were using the SQL Server securitymodel. If that were the case, your database administrator would provide this information.
3. Finally, select the AdventureWorks2000 database from the drop down list. You may use the TestConnection button to validate the settings. When you click the OK button, a connection string isgenerated and returned to the Report Wizard dialog as shown in Figure 3-5:
Figure 3-5
Selecting the check box labeled Make this a shared data source will cause this data source to be availableto other reports. This simple but important feature is quite powerful and will save you a tremendousamount of time and effort. By creating a central data source for all reports on the server, connection anddatabase information may be changed in only one place to affect all your reports. This is preferable tothe traditional approach where each report must be updated separately. This can be very inconvenientwhen the system administrator moves your database to another server or when you migrate yourreporting solution from the development environment to your production server.
So far, the Report Wizard has created a report project and has led you through creating a shared datasource. There isn't much to see yet. You need to continue to work through the pages of the wizard beforeyou see any results. In an established report project, you would create a new report using the shareddata source you created earlier.
58
Chapter 3
68787_ch03.qxp 26/03/2004 3:50 PM Page 58

Building a QueryThe next wizard page prompts for a query string as shown in Figure 3-6. If you are using a SQL Serverdatabase as the data source, this is a Transact SQL SELECT statement used to retrieve the data for thereport.
Figure 3-6
More complex reports may be based on more than one query. In fact, data can even be obtained frommultiple data sources in a single report. Let's create a very simple query that will select records fromonly the Employee table.
Click the ellipsis (…) button to open the Transact SQL Query Builder dialog:
Figure 3-7
This is dialog box is common to several Microsoft products. There are no toolbar controls available inthis dialog screen. All functionality is available from a pop up menu. If you've never created a querybefore, this might seem a little complicated, but it's not. The following steps will take you through theprocess and with a little practice you'll see that it's pretty easy. Right click the mouse while pointing tothe top area of the screen shown in Figure 3-7:
Figure 3-8
59
Designing Reports
68787_ch03.qxp 26/03/2004 3:50 PM Page 59

From the pop up menu, select Add Table to display the Add Table dialog as shown in Figure 3-9:
Figure 3-9
Select the Employee table from the list and then click the Add button. This adds the table to the top paneof the Query Builder as in Figure 3-10. Click the Close button on the Add Table dialog. You need to includefour columns in the report so let's add them to the query.
Figure 3-10
In the Employee table window, check the FirstName, LastName, Title, and EmailAddress columns. Youshould see them added to the column list and to the SQL statement, which is in the third pane of theQuery Builder window. You will also need to sort the report by the LastName and FirstName columns.This may be done by setting the Sort Type of these columns to Ascending. Note that the Sort Order values
60
Chapter 3
68787_ch03.qxp 26/03/2004 3:50 PM Page 60

are set in the order you selected the Sort Type. You could also set up sorting within the report definition;however, having the data presorted from the database as you have done here is far more efficient.
To test the query results, right click in the top pane again and select Run from the pop up menu. Thequery results are displayed in the lower pane in this window. You should see that the employees' recordsare ordered by the LastName and then FirstName columns.
The query string is returned to the Report Wizard dialog when you click the OK as in Figure 3-11 buttonin the Query Builder window. Click the Next button to continue.
Figure 3-11
The Query Builder does one very simple thing. It creates the Transact SQL expression that you see in theQuery string box in this page of the Report Wizard. If you know your way around Transact SQL, you cansimply type the expression into this box or into the SQL pane of the Query Builder Window. You can alsogo back and make changes if necessary either directly to the query string or using the Query Builderdialog. In a later example, a stored procedure will be used in place of the query string.
When you view data in this window, system memory is allocated that uses significantresources. This tool has a built-in feature that will prompt you if the query results areviewed for several minutes and the Query Builder is not closed. Often this occurs afteryou switch to another application and forget about what you were doing in the QueryBuilder. If you receive a warning message regarding the query results, your response(to leave the results open or not) will not affect the work you have done.
61
Designing Reports
68787_ch03.qxp 26/03/2004 3:50 PM Page 61

Define the Report StructureThe following pages will guide you through specifying report design elements such as the style, layout,data sorting, and grouping. In an effort to keep things simple, specify a Tabular style with all data fieldsin a single detail section as in Figure 3-12:
Figure 3-12
This report will simply be a list of records and is known as a Tabular report. Click the Next button to go tothe next page, which is used to design a Table control that will display rows and columns of data. Inthis simple report, you will not be using any groupings so all four fields will be added to the Detailssection.
Figure 3-13
Select the four fields from the Available fields list and click the Details button in the order FirstName,LastName, Title, and EmailAddress; then click the Next button as you can see in Figure 3-13.
62
Chapter 3
68787_ch03.qxp 26/03/2004 3:50 PM Page 62

The Report Wizard will create controls with coordinated fonts and colors using one of five differentthemes. These properties may be modified in the designer later. Retain the default Bold setting and clickNext as in Figure 3-14:
Figure 3-14
As you create other reports, you will have the opportunity to define your own look and feel by usingfonts, colors, borders, and graphics. The Report Wizard sets many of these properties for you using thestyle templates you see on this page. If you like, all of these properties can be changed in the ReportDesigner.
Specify the Deployment LocationThe first time the Report Wizard is used in a report, the dialogue box shown in figure 3-15 is displayed,prompting for the Report server path and Deployment folder name:
Figure 3-15
The default URL is used for the Report server. Unless you intend to use a different server, leave thisvalue as it is. Enter a folder name for the Deployment folder. This folder will be created and displayed in
63
Designing Reports
68787_ch03.qxp 26/03/2004 3:50 PM Page 63

the Report Manager will contain all of the reports defined within this project. It's important to note thatthese folders do not correspond with folders in the file system. The hierarchy of folders is actually storedin the Report Server catalog database and can be based upon functional or operational classification.This method simplifies making related reports available to various user roles. Folders may be useful forgrouping reports categorically, and searching and securing reports as a group.
When Reporting Services is installed, a web folder is created on the server and is managed by InternetInformation Services (IIS), which exposes this path as a URL or web folder. The URL you see in Figure 3-14is the default location, if you are developing on the Report Server. If you are developing on anothercomputer you should enter a URL that points to that Report Server's installation path, most likelyhttp://yourservername/ReportServer. If you're not sure, talk to your server administrator. TheDeployment folder isn't really a physical folder. It's a virtual path that is managed and exposed byReporting Services. You'll see this folder when you use the Report Manager later on.
Finally, enter a Report name, call this report Employee_List as in Figure 3-16. Click the Finish button.
Figure 3-16
This causes the report to be built and the Report Designer to be displayed in either Layout or Previewmode. The Report Designer has three tabs along the top labeled as:
❑ Data: It displays the query designer used in the Report Wizard.
❑ Layout: It is used to create or alter the report design.
❑ Preview: This is used to view the report with data.
Visual Studio .NET contains several useful designer windows that are automatically hidden by default.These windows are accessible when you hover the mouse pointer over icons positioned along the leftand right edge of the designer window. As you can see some of these icons are labeled and some are not.
64
Chapter 3
68787_ch03.qxp 26/03/2004 3:50 PM Page 64

Let's take a closer look at the Tool Box, Fields, Solution Explorer, and the Properties designer windows afterthis tour.
The Report DesignerThe next thing you should see is the actual report in Layout view. The Report Designer is now acomponent of the Visual Studio .NET Integrated Development Environment (IDE) and uses many of thewindows and tools that are built into Visual Studio. You'll be taking a look at a number of these tools asyou continue. The Report Wizard can also decipher intelligent column labels from the column names.For example, the First Name column header has a space between the words First and Name as in Figure 3-17:
Figure 3-17
Scale UnitsLet's take a short break from the wizard and discuss some important information you need tounderstand before you move on. Notice that these examples were created on a computer configuredwith US/English regional settings. As a result, all of the scaling units are set to inches. If your computeris configured for another culture or regional setting, your environment may use metric units.
It's also important to understand how a report fits onto a page. The report content fits onto a designelement called the Body. The report defines the page for printing and displaying purposes withassociated margins. The relationship between these two design elements will be shortly discussed.
American SAE, pixels, and metric scale units may be used for the report, body, margins, and control sizemeasurements. The designer will automatically use either inches (in) or centimeters (cm) depending onthe current locale setting in Windows. This example uses inches with the default US letter 8.5in x 11inpage size. If you are using metric units or a different page size, please make the appropriateadjustments. For example, if you are designing reports for A4 paper, the report width and height wouldbe set to 21cm and 29.7cm respectively.
65
Designing Reports
68787_ch03.qxp 26/03/2004 3:50 PM Page 65

Note that the Report Designer is currently only five inches wide and that the grid containing the fieldspartially fills this space. You need to make some adjustments to use the available space.
You should be able to use all of the available space to fill your target page size. Apply the followingformula to calculate the report page width:
Report Width = Body Width + Left Margin + Right Margin
You can set the report size by either resizing the report body in the designer with the mouse or by settingthe Height and Width values in the Properties window.
Click on the report background and view the Properties window (either right click and choose Propertiesor just click the Properties tab on the right side of the designer). Verify that Body is displayed in the dropdown list at the top of the properties window. Now, click the small plus sign next to Size to expand thisitem and set the properties as shown in Figure 3-18:
Figure 3-18
To set the report margins, select Report from the drop-down list and expand the Margins item. Changethe Left, Right, Top, and Bottom margins as shown in Figure 3-19:
Figure 3-19
66
Chapter 3
68787_ch03.qxp 26/03/2004 3:50 PM Page 66
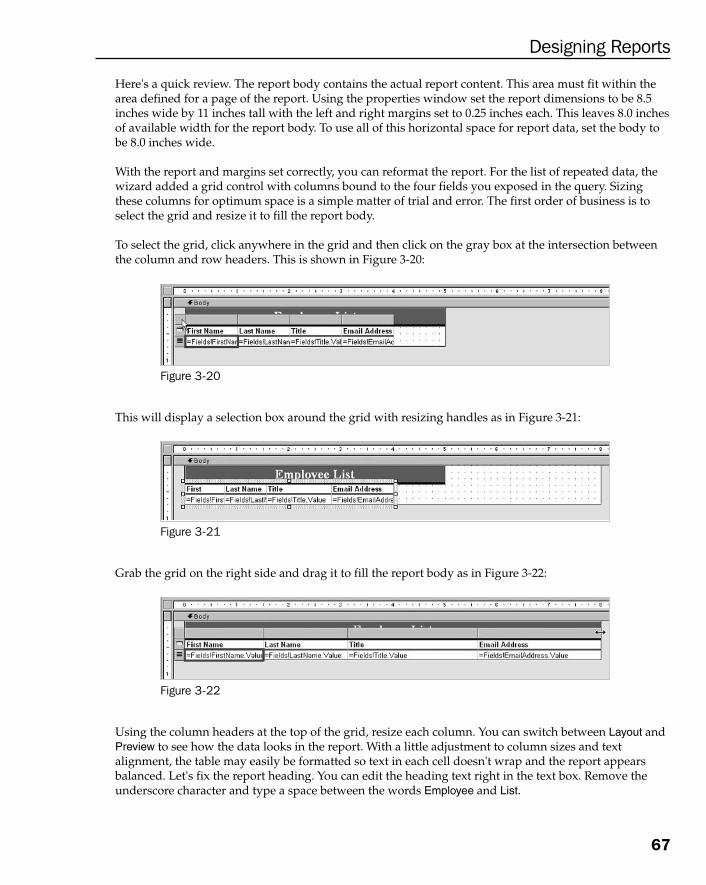
Here's a quick review. The report body contains the actual report content. This area must fit within thearea defined for a page of the report. Using the properties window set the report dimensions to be 8.5inches wide by 11 inches tall with the left and right margins set to 0.25 inches each. This leaves 8.0 inchesof available width for the report body. To use all of this horizontal space for report data, set the body tobe 8.0 inches wide.
With the report and margins set correctly, you can reformat the report. For the list of repeated data, thewizard added a grid control with columns bound to the four fields you exposed in the query. Sizingthese columns for optimum space is a simple matter of trial and error. The first order of business is toselect the grid and resize it to fill the report body.
To select the grid, click anywhere in the grid and then click on the gray box at the intersection betweenthe column and row headers. This is shown in Figure 3-20:
Figure 3-20
This will display a selection box around the grid with resizing handles as in Figure 3-21:
Figure 3-21
Grab the grid on the right side and drag it to fill the report body as in Figure 3-22:
Figure 3-22
Using the column headers at the top of the grid, resize each column. You can switch between Layout andPreview to see how the data looks in the report. With a little adjustment to column sizes and textalignment, the table may easily be formatted so text in each cell doesn't wrap and the report appearsbalanced. Let's fix the report heading. You can edit the heading text right in the text box. Remove theunderscore character and type a space between the words Employee and List.
67
Designing Reports
68787_ch03.qxp 26/03/2004 3:50 PM Page 67

Select the Preview tab to view the completed report as in Figure 3-23:
Figure 3-23
That's it! You've created your first report using the Report Wizard. You can go back and make changes tothe report design by opening it from the Visual Studio Solution Explorer. In the future, you may find itmore effective to create reports without the wizard where you have more control and don't have the toolmaking so many decisions for you. To get more practice, you may want to design additional reportsusing different data sources, queries, or other options. At the very least, you'll end up with a fewattempts that didn't go so well and some reports that worked. On one of my kids' favorite Saturday TVprograms, the teacher character would always say, "Get dirty, make messes, and don't be afraid to trythings". That concept applies here.
The remainder of this chapter will focus on individual design elements and concepts rather than theoverall process. You will apply this information in another walkthrough exercise in the chapter asdesigning more advanced reports are discussed.
Importing ReportsOne very compelling aspect of this product is that the definition of each report is managed in a standardfile format called Report Definition Language (RDL), which is just an XML document with a standarddefinition of markup tags that define all of the properties for a report. All objects placed into the ReportDesigner and the related property settings result in entries made to the RDL content for that report. Thissimple approach will make it easy for independent software vendors and custom solution developers togenerate a report definition from a variety of sources and tools.
68
Chapter 3
68787_ch03.qxp 26/03/2004 3:50 PM Page 68

Using RDLThere is little doubt that a host of applications and products will have the ability to create reportdefinitions for Reporting Services. Chapter 11 discusses advanced techniques for generating reportdefinitions outside of the integrated Report Designer.
However, a small snippet of an RDL file content describing a textbox is as follows:
<Textbox Name="textbox1"><Style><PaddingLeft>2pt</PaddingLeft><PaddingBottom>2pt</PaddingBottom><PaddingTop>2pt</PaddingTop><PaddingRight>2pt</PaddingRight>
</Style><Top>0.25in</Top><rd:DefaultName>textbox1</rd:DefaultName><Height>0.25in</Height><Width>1in</Width><CanGrow>true</CanGrow><Value /><Left>0.375in</Left>
</Textbox>
In the current version of Reporting Services, you have the ability to import reports from MicrosoftAccess. Access has an excellent report writer and has long been the only real substantial reporting tool inthe Microsoft armada of products. Since the early 1990s, Access was the product of choice for creatingreporting solutions and still is for many desktop solutions. Its greatest limitation, however, is that Accessmust be licensed and installed on the user's desktop and can effectively be used only in a single user orsmall network environment.
Importing Access ReportsIf you are already familiar with creating reports in Access, this may be a good starting point to learnreport design in Reporting Services. Most Access reports will import very nicely. There are somefunctions and expressions used in Access that are not supported and Access reports that run codebehind them will likely not work when imported. These details are explained in Appendix B but theshort version is that most basic report functionality will work. Grouping and sorting features arepreserved as are most expressions and formatting. The use of domain functions and any custom code isnot supported.
Plan for ExtensibilityIf your goal is to create a reporting solution that will work for users with different needs, there are anumber of things to be considered. The users may need to:
❑ Access reports from a web-enabled hand-held device or cell phone
❑ Download reports for off-line viewing
❑ View reports in different web browsers
69
Designing Reports
68787_ch03.qxp 26/03/2004 3:50 PM Page 69

Reporting Services can meet all of these needs if you understand the requirements and plan ahead. Let'sbriefly discuss some of these design considerations.
Browser CompatibilityA solution should be designed to meet the needs of the least capable user or platform. The optimaldesign for the web has always been a moving target. If, when designing reports, you view them only inthe latest version of Internet Explorer, you may not be aware of incompatibilities or design issues forother browsers. Creating solutions independent of the client platform for a diverse audience will alwaysbe challenging, with a certain degree of unpredictability.
Reports with interactive design elements like drill-down and auto-hide sections, for example, generateclient-side JavaScript. This script runs in the user's browser to produce effects and interactivefunctionality. Theoretically, pages containing many JavaScript functions should run in newer versions ofInternet Explorer, Netscape Navigator, and other browsers. In a report, scripted features includedocumentation maps, bookmarks, and show/hide features (used for drill-down reports). On thestandard report toolbar, scripted features provide the ability to zoom, search, refresh, export, and requesthelp.
Another variable to consider when using HTML is the font typeface and size. If you make a point to usecommon fonts, this is not typically an issue. However, the user's configuration isn't always predictable.Font files on the user's computer can be uninstalled or deleted and default font sizes can be changed inthe browser. A popular solution for unpredictable HTML results is to use a proprietary document formattypically read in a downloadable viewer. Rendering reports to an Adobe Portable Document Format (PDF)document will ensure that reports are displayed and printed consistently.
Offline ViewingReporting Services can render reports in three different forms of HTML including MHTML (or webarchive). As mentioned in earlier chapters, MHTML is a fairly recent standard that encapsulates contentthat would normally be linked to separate files, typically graphics, into a single document. Using thisformat simplifies web content rendering for portability, but it isn't supported in all browsers (includingPocket Internet Explorer). Even when using standard HTML format, most report files will be self-contained with the exception of any graphics. If all of the content is contained in one file, it will be easierto download and view offline. If your users are consistently using Internet Explorer or a browser youhave tested thoroughly, consider rendering reports in MHTML to preserve embedded graphics content.If you don't have that kind of control over the user's environment, PDF document rendering may be thebest choice.
Another possibility is to allow the user to download report content into a storage file and then renderthe content using your own client-side solution. Reports rendered as Comma Separated Values (CSV) canbe opened in Microsoft Excel where the user can format or further manipulate the data. Data saved to anXML file may be imported or read using Excel, Word, or a custom application. The Excel renderingformat currently supports Microsoft Excel versions 2002 and 2003 only.
70
Chapter 3
68787_ch03.qxp 26/03/2004 3:50 PM Page 70

Mobile Device SupportPortable electronic devices are available in different sizes and shapes. This medium could prove to be avery convenient reporting solution for users who need to get information on the go. Web-enabledcellular phones generally fit into three categories:
❑ The Pocket PC and Palm OS devices with integrated cellular phones have the advantage of arelatively larger display (240 x 320 pixels) and a more traditional-style web browser.
❑ The new generation of Smart Phones runs a slightly scaled down version of the Windows CEoperating system with a smaller display (176 x 220 pixels) and fewer features, but in a moreconvenient size.
❑ The standard web-enabled cell phone. It's hard to find a new cell phone that doesn't offer thecapability to surf the web. Most of these phones have very small displays and many will onlydisplay text.
The simple fact is that you can develop reporting solutions using Reporting Services for all of thesedevices, making it possible and convenient for users to access information wherever they are.
Of course, screen size is one of the most significant limitations so reports may simply be scaled down toa smaller page size to fit a smaller screen size. The Pocket PC and Smart Phone browsers will run client-side JavaScript to support drill-down and other such effects. To support less capable devices, youcan design simple text reports rendered in HTML.
Report Items and Data RegionsReports consist of items and regions that define the placement and format of data from a data source. Inthe Report Designer, you can place items or draw them onto the report body. If you have worked withVisual Basic or Access forms, you would be familiar with the practice of placing controls on forms. Thisis pretty much the same environment. When you add a new report to a report project in Visual Studio.NET, the designer is displayed in the Layout view. Much of the Visual Studio functionality is exposedusing various utility windows. On the left side of the designer, you will find the Toolbox that contains allof the available report items as shown in Figure 3-24. The toolbox may be set to auto hide using thepushpin icon in its toolbar.
Figure 3-24
71
Designing Reports
68787_ch03.qxp 26/03/2004 3:50 PM Page 71

Textbox Report ItemThe Textbox item can be used to display data from a data source, calculations or expressions or staticdata, much like a label control in a Windows forms project. When you drag fields from the Fields listonto the Report Designer, bound textbox items are created. Common expressions can refer to a field in thereport'
The following example in Figure 3-25 shows a textbox used as a label and another text box bound to theLastName field of the report data source:
Figure 3-25
Right click the Textbox and select Properties from the pop up menu to display the Textbox Propertiesdialog as in Figure 3-26:
Figure 3-26
Properties may also be viewed and set using the standard properties sheet located to the right of thedesigner. This window may be pinned out or will auto hide by default. As in Figure 3-27, this windowcontains quite a bit more detail than the custom properties window. However, the property informationis not as conveniently organized. Right click to get to the most common properties and use the propertysheet when you need to set other properties.
72
Chapter 3
68787_ch03.qxp 26/03/2004 3:50 PM Page 72

Figure 3-27
Line Report ItemLines may be drawn in any direction and may be set to a variety of styles and colors as displayed inFigure 3-27. The properties for a line are simple and mostly set using the properties window or designertoolbar.
Figure 3-28
Some clever techniques are used to render lines. Reporting Services will typically try to render contentusing the most effective way possible. In Figure 3-28, when outputting standard HTML, the two blacklines are rendered as table borders, the wide gray line is rendered as a DIV tag filled using a JavaScriptfunction and the diagonal broken line is rendered using Virtual Reality Modeling Language (VRML)commands.
VRML is an industry standard extension to HTML for displaying vector-based graphics in the webbrowser.
73
Designing Reports
68787_ch03.qxp 26/03/2004 3:50 PM Page 73

Rectangle Report ItemA rectangle item can have many different uses. A rectangle is simply used to visually separate a region ofthe report. It may be used to visually contain other items. If items such as text boxes, grids and so on areplaced into a rectangle, all these items can be moved together by simply moving the rectangle. Arectangle may also be used as a data container for data items and can be related to and repeated with aparent container.
Image Report ItemImages can be embedded into the report, linked to an external file, or obtained from a data source.Images can be of the BMP, GIF, JPG, JPE, PNG, or X-PNG type. Adding an image in the designer is prettystraightforward. A critical factor is that images are sized and cropped prior to being added to a report.You can resize the image in the Report Designer but this will not result in a smaller file size. Use agraphics editing tool like the Office Picture Library, Microsoft PhotoDraw, Adobe PhotoShop, orMacromedia Fireworks to resize or crop the image and them save it to a new file.
Drag and drop an image item from the Toolbox onto the report. This will launch the Image Wizard dialog(see Figure 3-29). Select the method you want to use; the image can be from a table or a file and may belinked or embedded into the report:
Figure 3-29
Keep the default selection Embedded and click Next to show the image selection page shown in Figure 3-30. Click New Image and find your image file.
Selecting the Project option will result in a linked image using a file found in the project. Selecting theDatabase option will allow you to extract an image stored in an Image or Binary type column within adatabase, exposed through your dataset.
74
Chapter 3
68787_ch03.qxp 26/03/2004 3:50 PM Page 74

Figure 3-30
When you click Next, a summary is displayed with information about the image; see Figure 3-31:
Figure 3-31
If your picture data is stored in the database and the Database option is selected, the database field pageis displayed in the wizard. This gives you the option to derive an image file type from the image as inFigure 3-32.
75
Designing Reports
68787_ch03.qxp 26/03/2004 3:50 PM Page 75

Figure 3-32
Generally, the JPEG format is most flexible. If the image uses transparency, use either the GIF or X-PNGformats. The GIF and JPEG formats are most widely used on the Internet and are supported by all webbrowsers.
Subreport ItemA subreport is a container for another report. The subreport can contain practically any other report withits own, independent data source. It can optionally have its data linked to a record in the main reportoften referred to as a master/detail report. Subreports are an important element in complex reportdesigns. Figure 3-33 shows a simple report containing a master record and related detail records in thesubreport:
Figure 3-33
The design details of the subreport are not visible in the designer. This report is designed separately andthen inserted into the main report as a subreport item.
76
Chapter 3
68787_ch03.qxp 26/03/2004 3:50 PM Page 76

Chart Report ItemThe chart functionality in Reporting Services is really a simplified version of Dundas Chart that Microsofthas licensed from Dundas Software. It's very capable and easy-to-use charting solution with a variety ofavailable chart types.
Probably the most common and most recognizable chart type is the column graph. This example as inFigure 3-34 shows store sales data grouped by year, with the total product sales grouped by productcategory:
Figure 3-34
If any of the sample sales data in the AdventureWorks2000 database is accurate, I'm glad that I don'town a bike shop. Let's use the same data to take a peek at some other report types.
Bar charts and column charts are pretty much the same. You can tilt your head to the side to get the sameview as the other. In addition to the standard, single bar view, the stacked view provides a consolidatedlook at a series of values by using fewer bars or columns. Each bar is like a mini pie chart where eachvalue in the bar's range is in proportion to the others.
Figure 3-35 shows a standard stacked column chart. A series of related values are stacked in the columnto show the aggregate sum of values and their proportional values:
Figure 3-35
77
Designing Reports
68787_ch03.qxp 26/03/2004 3:50 PM Page 77

A variation, the 100% stacked bar or chart (not shown), displays each bar with the same height or lengthas others, regardless of the total values. This type of chart is useful for comparing values within the bar'srange but not for comparing the aggregates represented by each bar.
Area and line charts are useful for analyzing trends and helping the viewer to follow data pointsthrough a series. Figure 3-36 shows a simple area chart with three points of data for each series:
Figure 3-36
To view the proportional components of an aggregate sum, this type of chart comes in two pastry types:Pie and Doughnut. Values are presented visually as a percentage of the total for all values in a series. Pieand Doughnut chart views may be either Simple or Exploded. Figure 3-37 is an example of an explodedDoughnut (sounds messy). This presentation may help to visually separate values, especially the smallerslices. This chart looks more like PacMan undergoing a root canal than retail sales figures, but thesetypes of charts can be useful for placing values into comparative perspective.
Figure 3-37
The data source for a chart can either be pre-aggregated in the underlying query using GROUPBY and SUMfunctions, or the chart will perform the aggregation for you. If you have a large volume of data,aggregating the values in the database, using a View or stored procedure, will be much more efficient.The chart item will be discussed in detail in Chapter 5.
78
Chapter 3
68787_ch03.qxp 26/03/2004 3:50 PM Page 78

Drill-Down and Drill-Through ReportsAlthough related, these are two different features. A drill-down report as in Figure 3-38 contains relatedgroups or sections of information. Each section can be expanded or collapsed to show or hide pertinentinformation. In the following report, product categories only are displayed when the report opens.Using the expand icon next to a category, the category group (in this case, Clothing) is expandedrevealing a group of related subcategories. Expanding a subcategory (such as Bib-Short) revealsindividual products within the subcategory.
Figure 3-38
A drill-through report may or may not include some drill-down functionality. Items shown in the reportmay represent sections or more detailed information that may be viewed in a separate report. These keyitems are displayed as a hyperlink and when a user clicks the link, a separate detailed report isdisplayed for the item selected as in Figure 3-39:
Figure 3-39
79
Designing Reports
68787_ch03.qxp 26/03/2004 3:50 PM Page 79

Tabular ReportsOne of the most fundamental reports is a simple list of record values arranged in rows and columns.Typical tabular reports display column headers above repeated row values. Rows may also be groupedcategorically and may be followed by totals, subtotals, or other aggregate values pertaining to agrouping or the entire report.
The two common techniques used to obtain this design are by using the grid or the list control. The gridcontrol makes it easy to format rows and columns with column headers and supports groupings,headers, footers, and multiple row sections.
Grouping DataTabular or matrix data may be sorted and grouped on one or multiple levels. The table, list, and matrixcontrols support this functionality. Groupings may be based on field values or expressions that mayinclude conditional qualifiers, functions, and combined values from multiple fields.
When values are grouped, they may need to be aggregated. This means that a row in the report layoutrepresents a rollup of multiple rows from the data source (like the sum or average of a range of values).After introducing the data region items used to perform grouped operations, let's take a closer look atthe aggregate functions that are used as rollup values within the group.
Table Report Data RegionThe following example in Figure 3-40, using a table, contains three groupings for product records on theCategory, Sub Category and Product fields:
Figure 3-40
List Report Data RegionUsing embedded list items allows greater flexibility over the formatting and placement of individualreport items. The list control may also be used as the basis for a more complex report with embeddedsub reports, lists, matrices, or grids. Figure 3-41 shows a preview of a report with groupings createdusing nested list items. The list item is useful for creating groups of repeated data that isn't constrainedto a tabular format.
80
Chapter 3
68787_ch03.qxp 26/03/2004 3:50 PM Page 80

Figure 3-41
In the design for this report, there are four list controls placed inside one another. Groupings have beencreated for each of the lists to organize them into a hierarchy. For the sake of clarity in thisdemonstration, each list control is drawn well inside its parent list and the borders are made easier to seeas in Figure 3-42. It is common for the list borders to share the same line space if you don't need to createadditional white space around data elements typically on the right side and bottom borders.
Figure 3-42
Matrix Report Data RegionThe matrix item produces a pivot table with automated drill-down functionality on both axes. Thismatrix report contains the same groupings for row data as the previous report and also contains columngroupings for Product Category and Sub Category fields. The aggregate value in the center cells is thesum of product sales for the intersection of each of the groupings. By default, values are aggregated androlled up within groupings. To view detail values, use the plus sign (+) icon to drill-down in one axis(rows or columns) and then do the same for the other axis. Figure 3-43 shows a matrix report that hasbeen expanded to show details on both the axes:
81
Designing Reports
68787_ch03.qxp 26/03/2004 3:50 PM Page 81

Figure 3-43
The matrix control takes care of the grouping functionality in this report. As in Figure 3-44, the design isfairly simple:
Figure 3-44
SubtotalsAlthough Reporting Services generically refers to these type of expressions as subtotals, they may beused to perform any aggregation of grouped data. Subtotals may be added to a table's footer row, listcontrol, or in the detail or grouping cells of a matrix. The following table is a list of aggregate functionssupported by Reporting Services:
82
Chapter 3
68787_ch03.qxp 26/03/2004 3:50 PM Page 82

Using the table from Figure 3-40, let's take a closer look at the summary rows and their aggregatedvalues. In this example, a table that has groupings on the Category and Sub Category fields is created.Note that the grouping numbers in the row markers next to each row indicate the grouping level. Thedetail row is selected and sandwiched between grouping levels 1 and 2. In the grouping footers and thereport footer, the aggregate functions Count, Sum, and Avg are used for the Color, StandardCost, andListPrice columns. In this report, an additional row is added for each of the grouping footers for thecolumns as shown in Figure 3-45:
Figure 3-45
Function Description
Avg Average for all values in a range
Count Count of all non-null values in a range
CountDistinct Count of unique values in a range
CountRows Count of all rows in a range, regardless of null values or uniqueness
First First value in a range based on the current sort order
Last Last value in a range based on the current sort order
Max Highest value in a range
Min Lowest value in range
StDev Standard deviation of non-null values
StDevP Population standard deviation of non-null values
Sum Sum of all values in a range
Var Variance of non-null values
VarP Population variance of non-null values
83
Designing Reports
68787_ch03.qxp 26/03/2004 3:50 PM Page 83

Aggregate expressions may be entered in different ways. The expression may be typed directly into thetextbox, or into the value property using the property sheet window or customer property page window.Next to each applicable property, a button can be used to open the expression builder dialog, which canbe used to assemble the expression. This will be discussed in detail in Chapter 5.
Here is a condensed view of the same report shown in the print preview. Since you are using the Countfunction on the Color field value, rows that don't have a value in this column (the value is Null) have acount of 0. First you see four sections with subtotals for the Sub Category field, and then further downthe page, you see rollups for the Category and then for the entire report as shown in Figure 3-46:
Figure 3-46
84
Chapter 3
68787_ch03.qxp 26/03/2004 3:50 PM Page 84

FormattingMany data values need to be formatted appropriately as the default formats are usually not acceptable.The following table shows common SQL Server data types and their unformatted defaults:
If these values are not what you want to see in your reports, you will need to use the Format property ofeach control to change them. The formatting capabilities of Reporting Services controls are based on theformatting mechanics in the .NET Framework and use a form of regular expressions. Regular expressionsare very powerful and can be used to format values in just about any way imaginable. Expression stringscan range from simple to extremely complex. If you need to learn more about the advanced use ofregular expressions, search the Visual Studio .NET online help or the MSDN library for RegularExpression Language Elements. For most of your needs, however, we'll show you how to use the basics.
Standard FormattingStandard, one character, strings may be used to specify formatting options for numbers and dates. Oneadvantage of using standard format strings is that culture specific formats are automatically applied.
There is plenty of information on this subject in Reporting Services Books Online. Unfortunately, there isalso a lot of extra information that just doesn't apply to most reporting needs. The objective is to keepthis simple and show only what you really need to know for majority of reports. The following table liststhe common format strings that apply to numeric data types:
Data Type Default Display Example
Float Large number of decimal positions with no rounding or truncation. Large numbers with no thousand separators or scientific notation.
123456789.1234561.23456789012346E+19
Decimal Large numbers with no thousand separators. The number of decimal positions is defined by the column's scale attribute.
123456789.1234
Int,SmallInt,BigInt
Large numbers with no thousand separators. 123456789
Money Up to four decimal positions. Large numbers with no thousand separators.
123456789.1234
Date Always displays date and time. Seconds included. 11/1/2003 3:34:26 PM
Bit Displays the words True or False. TrueFalse
85
Designing Reports
68787_ch03.qxp 26/03/2004 3:50 PM Page 85

The following table lists the common format strings that apply to date and time data types:
Explicit FormattingIn addition to the standard formatting techniques, you may also use an explicit format string to get morecontrol and deal with specific format needs. Keep in mind that the formatted output will be the same fordates and currency even if the locale setting is changed for the server.
Format Description Example
d Short date 11/1/03
D Long date Saturday, November 01, 2003
t Short time 3:34 PM
T Long time 3:23:26 PM
f Full date and time Saturday, November 01, 2003 3:34 PM
F Full date and time Saturday, November 01, 2003 3:34:26 PM
g General date and time 11/1/03 3:34 PM
G General date and time 11/1/03 3:34:26 PM
M or m Month November 01
Y or y Year November, 2003
Format Description Example
C Currency $123,456,78.9.12
D Decimalfollowed by optional precision specifier
123456789000123456789 using D12
E Scientific notation followed by optional precision specifier
1.234568e+0081.234567891234+008 using E12
F Fixed-pointfollowed by optional precision specifier
123456789.12123456789.123400000000 using F12
P Percentfollowed by optional precision specifier
12.35%
86
Chapter 3
68787_ch03.qxp 26/03/2004 3:50 PM Page 86

Again, the Reporting Services Books On-line contains detailed information about specific formats forstring elements so we won't rehash that information here. What we will do, however, is show a fewcommon examples of explicit formatting. You can find the details about this topic under the topicsCustom Numeric Format Strings and Custom DateTime Format Strings in Books Online. The following tableis a summary of some common format expression elements:
Format Element
Type Description Example
yyyy DateTime Four character year 2004
yy DateTime Two character year 03
MMMM DateTime Month, full name August
MMM DateTime Month, three characters Aug
MM DateTime Month, two numerals 09 or 11
M DateTime Month, one or two numerals 9 or 11
dddd DateTime Week day, full name Saturday
ddd DateTime Week day, three characters Sat
dd DateTime Day, two numerals 04 or 15
d DateTime Day, one or two numerals 4 or 15
hh DateTime Hour in 12-hour time, two numerals 08 or 10
h DateTime Hour in 12-hour time, one or two numerals 8 or 10
HH DateTime Hour in 24-hour time, one or two numerals 08 or 23
H DateTime Hour in 24-hour time, one or two numerals 8 or 23
mm DateTime Minute, two numerals 35
ss DateTime Seconds, two numerals 45
tt DateTime 12-hour time using AM or PM AM or PM
t DateTime 12-hour time using A or P A or P
0 Number Required numeral placeholder 09
# Number Optional numeral placeholder
% Number Percentage 95 = 95%
- , : /. Any Literals 123.45, 1-234, 12:34 PM
87
Designing Reports
68787_ch03.qxp 26/03/2004 3:50 PM Page 87

Let's use a common scenario as an example; say your company has offices around the world and followsa corporate standard to use European style dates, regardless of where users are located. Instead of lettingthe system decide how to format dates, you want them to be explicitly formatted using your corporatestandard.
By setting the Format property of the date type controls to the string MMMM d, yyyy; the resulting datewould be displayed in the format, November 1, 2003.
Conditional FormattingUnder certain conditions, you may need to alter the format of a value based on an expression related toother fields or conditions in the report. The use of different functions and expression will be discussed inChapter 4. For now, let's take a look at a couple of examples to explore the concept and some techniques.
Let's say that your company has locations in England, Germany, and the US, and, for whatever reason(remember, we're making this up), you want different rows to display information formatted for thecorresponding locales. Each row in the underlying table includes a column named MyLocale that holdsyour own two-character code for the locale. The industry has a five character standard known as theRFC1766. Your codes are loosely translatable to this standard. Based on the anticipated values in thiscolumn (UK, DE, or US), you will display currency and date information in the corresponding format.The objective will be to format the following date and currency values as follows:
A control's property may be set to an expression that will actually parse and set the property value forthe row as it is rendered. There are a few techniques to do this; one is to use the Immediate If or IIFfunction. This works if you have one condition to test and two possible outcomes. A more powerfultechnique is the Switch function. It works like the Switch statement in C# and like the Select Casestatement in VB rolled into one. This technique will be used to set the Format property of the date. Forthe textbox that will display this value, use the following expression:
=Switch(Fields!MyLocale.Value="DE", "d.MM.yy", Fields!MyLocale.Value="UK", "d/MM/yy", Fields!MyLocale.Value="US", "M/d/yy")
Value Locale Formatted Value
November 1, 2003 US 11/1/03
November 1, 2003 UK 1/11/03
November 1, 2003 DE 1.11.03
12345.1234 US $1,234.12
12345.1234 UK £1,234.12
12345.1234 DE 1.234,12
88
Chapter 3
68787_ch03.qxp 26/03/2004 3:50 PM Page 88

The currency value could be set the same way, except that the German form would be difficult tocontend with since commas are used to designate the thousand separator and a period is used fordecimals. In the German language, these characters have the opposite meaning. Fortunately each controlhas a Language property that is equipped to handle this and many other language and culture-specificidiosyncrasies. By dynamically manipulating this property in the same manner, you can reach yourobjective. Using the Switch function, you can translate your two-character codes to the industrystandard that uses five-character codes. The following expression can be used to change the Languageproperty of the currency text box:
=Switch(Fields!MyLocale.Value="DE", "de-DE", Fields!MyLocale.Value="UK", "en-GB", Fields!MyLocale.Value="US", "en-US")
Again, this is an example of one possible business problem and one possible solution. If this were a realsituation, it might make more sense to store the actual culture information string in the table and simplyset the Language property of the control to that value pulled directly from the table. By the way, all ofthe supported culture information strings can be found in the MSDN library under the search keyCultureInfo. The sample report in Figure 3-47 shows the final result using the formatting examples justdiscussed:
Figure 3-47
Multiple ColumnsA report can display list values in multiple columns. Values in a column snake from top to bottom andthen left to right. It's important to note that Reporting Services can only do so much in HTML and thatsome multi-column reports can't be rendered in some (or possibly any) versions of HTML, so your onlyoption may be to render these reports in PDF format.
Columns are defined for the Body of a report. When the Columns property for the Body is set to a valuegreater than 1, the report page width should be set according to the following equation:
Report Page Width >= (Body Width x number of columns) + (ColumnSpacing x (number ofcolumns – 1)
For example, a report, which has a body width of 2.5 inches with three columns and the column spacingset to 0.25 inches, this will yield a report width of 8 inches. If the report's left and right margins were setto 0.25 inches each, this should fit neatly into an 8.5 inch page width.
89
Designing Reports
68787_ch03.qxp 26/03/2004 3:50 PM Page 89

The following screenshot is that of a report designed with these dimensions and property settings (Figure 3-48):
Figure 3-48
This report is very simple and contains no headers or footers. You can add them to this report but theoptions are limited. You are limited to the width of the report body and the header will only show abovethe first column. In order to use a report header wider then 2.5 inches in this example, you have to createanother report and use the multi-column report as an embedded sub report. Creating sub reports will belooked at in the Chapter 4.
Pagination ControlUnlike traditional reporting tools like Microsoft Access, Reporting Services doesn’t have its own specificreport viewer. Since reports may be rendered in different formats and viewed in different browsers ordocument viewers, page handling may be different for various rendering formats. The following chartshows the behavior of pagination in the supported rendering formats:
For PDF and TIFF formats, reports will naturally paginate as the content exceeds the usable page height.In cases where you need content to paginate uniformly, you can force page breaks using a number ofdifferent data containers or data ranges. For each of the following report items, right click on the itemand select Properties from the pop up menu to view the related properties dialog.
Rendering Format Pagination Behavior
HTML Pages are separated on specific page breaks but are not based on page length. Page handing depends on the browser and is unpredictable.
PDF Pages are separated based on the page length and for specific page breaks. This format is good for large, page-oriented reports.
Excel Specific page breaks cause the workbook to be split into separate worksheets. Worksheets are not split base on page length.
TIFF Pages are separated based on the page length and for specific page breaks. This format is good for small, page-oriented reports.
MHTML Page breaks are not supported.
XML Page breaks are not supported.
CSV Page breaks are not supported.
90
Chapter 3
68787_ch03.qxp 26/03/2004 3:50 PM Page 90

Page Breaks for a RectangleYou can set a page break to occur before or after a rectangle. Using the properties dialog or propertiessheet for a rectangle, set one or both of the page break properties as seen in Figure 3-49. If all you want todo is set a page break at a specific location in a static report, you can use a rectangle with no border to dothis:
Figure 3-49
Page Breaks for a ListSince the list item is designed to repeat a group of bound report items, it is a natural place to force a pagebreak. Set these properties using the List Properties dialog as shown in Figure 3-50. In addition tobreaking before or after the entire range of listed items, you can cause a list to fit onto one page if therendered content permits this to happen. If this property is checked, the rendering engine will test thelength of the listed data and move the entire list to the next page so that it fits.
Figure 3-50
Remember that forcing page breaks may have different results depending upon therendering format used. For example, a report with forced page breaks rendered to anExcel workbook will produce separate worksheets for each page.
91
Designing Reports
68787_ch03.qxp 26/03/2004 3:50 PM Page 91

Page Breaks for a TableThe table can have page breaks defined in much the same way that they are for a list item. A page breakmay be set to occur immediately before or after the table. You can also try to fit all of the table data onone page, in which case a page break will occur before the table. The Table Properties page is shown inFigure 3-51:
Figure 3-51
Breaks may be specified within the table at data groupings. Grouping and sorting will be covered ingreater detail in the next chapter. Once a grouping has been defined for a table, the grouping and sortingproperties dialog is accessible by selecting the grouping row in the table. Either right click on the rowselector and select Edit | Group from the pop up menu or choose Grouping/Sorting from the standardProperties window.
Page Breaks for a GroupIn the Grouping and Sorting Properties dialog, shown here in Figure 3-52, page breaks may also be forcedbefore or after the grouping:
Figure 3-52
92
Chapter 3
68787_ch03.qxp 26/03/2004 3:51 PM Page 92

Page Breaks for a MatrixThe matrix page break options are the same as for the table report item. As the matrix rows areexpanded, data will automatically span pages. If the content fits on one page and the Fit this matrix onone page if possible option is checked (Figure 3-53), a page break will be placed before the content. Youcan also force a page break immediately before or after the matrix content.
Figure 3-53
Page Breaks for a ChartPage break properties for charts are available only in the standard Visual Studio properties window andnot in the custom properties dialog for the chart. You may set a page break immediately before or after achart by setting the Page Break At Start and Page Break At End properties respectively.
Printing Considerations An important issue to keep in mind is that Reporting Services doesn't display reports. It generates andrenders report content to be viewed in a web browser or an application. Report printing will bemanaged by the application that you use to view your report. This means that most reports will beprinted using either Internet Explorer or the Adobe Acrobat Reader.
The Report Manager, which is an HTML interface designed to run in Internet Explorer contains printingfeatures.
In cases where international users might need to acess and print your reports, you may need to specify apage size that will accommodate different paper sizes. For example, if you anticipate that a report will beread and printed in the United States and Great Britan, the report content should fit on both letter andA4 paper sizes.
93
Designing Reports
68787_ch03.qxp 26/03/2004 3:51 PM Page 93

SummaryThe purpose of this chapter was to introduce the Report Designer and get you started on designing areport. Several features and design considerations were mentioned but not discussed in depth. Thechapter starts by using the Report Wizard to create a simple, tabular report. This should have given youa birds view of a Report project in Visual Studio .NET and the basic features of the Report Designer.Furthermore, importing reports from Access will allow you to leverage existing report solutions. You canalso use the features of Access you already understand as a learning tool. Designing reports forextensibility with different user environments, including different browsers, computers, and mobiledevices, was also covered.
Different reporting formats can assure formatting control and compatibility. Report items can be used todisplay static values as well as data from a data source. Simple items like textboxes may be repeated andgrouped in data ranges and list-type containers. More sophisticated report items like the list, table, andmatrix may be used to create tabular and pivot reports that perform functions like aggregate, subtotal,and group, and provide drill-down and drill-through functionality.
Data formatting can be achieved using simple, standard format strings, explicit format expressions, andconditional logic using programming functions and expressions. Several report items can be used topaginate a report statically or based on the size andcontent of data regions.
By now, you should be comfortable using Visual Studio .NET to create and extend a simple reportproject. Chapter 4 will expand on what you have learned so far and take you to the next level.
94
Chapter 3
68787_ch03.qxp 26/03/2004 3:51 PM Page 94

Designing Data Access
This chapter will discuss the essential steps of report design—how to consume data. Although thisis typically simple and straightforward, there are a number of options to be considered whendesigning data sources and queries. We'll discuss the following topics:
❑ Creating standalone and shared data sources
❑ Designing queries and datasets
❑ Using parameters to filter data at the database
❑ Using parameters to filter data at the Report Server
Every report will have at least one data source (with the rare exception of a static form that doesn'tuse any data). The simplest of reports will have a single data source to provide data for a singledataset. The data source defines a connection using a simple text string. This connectioninformation may include security credentials information. The dataset defines a query expressionor data source object reference. A data source may be shared among multiple reports or may becontained within the report definition. The dataset is also contained within the report definition.Figure 4-1 depicts how data flows to the report. The data source provides the ability to connect tothe database and the dataset contains a query expression that populates the report with data:
Figure 4-1
444
68787_ch04.qxp 26/03/2004 6:01 PM Page 95

Chapter 4
96
More complex reports may require multiple datasets to provide data for different data ranges or items inthe report, or to feed values to parameter value selection. Datasets can be based on query expressionsfrom the same data source as shown in Figure 4-2:
Figure 4-2
Multiple datasets can get their data from multiple data sources. This model would enable a report tohave parameter selection values to be obtained from a local database and report data to be obtainedfrom a central data store. In some cases, data regions, subreports, and various report items might obtaindata from multiple sources through associated datasets as shown in Figure 4-3:
Figure 4-3
As you can see, almost anything is possible in terms of combining data sources and datasets.
Data sources can be practically anything you can query in program code and products that consumedata. Reporting Services consumes data using the .NET data providers, which include support for SQLServer, Oracle, and all OLE DB providers. These include almost any database product that supportsODBC access or a capable ISAM driver. Datasets in Reporting Services are always read-only so there isno need to specify cursor types or locking options.
A report can be a central point of data collection and aggregation.
68787_ch04.qxp 26/03/2004 6:01 PM Page 96

Reporting for Relational DataIn the previous chapter you briefly looked at using the Query Builder. Now you'll take a closer look athow queries are created and how data is provided for a report. At this point it's important to understandthe basic building blocks for reports. We will begin by discussing some of these fundamentals. You willgo through several short walkthrough exercises so you can see and experience how it works. It isassumed that you have used Visual Studio .NET and you have created a report using the Report Wizard.If this is not the case, please read Chapter 2 to get acquainted with these tools.
A Dataset Is Not a DatasetIf you are a .NET programmer as I am, you probably saw this term and thought, "I know what a datasetis and I use them all the time in .NET data access program code so I should have a leg up on doing dataaccess in Reporting Services". If you are not a .NET programmer you're already a step ahead of thoseprogrammers who have to relearn the application of this term.
We ran out of new words in the English language a long time ago. Everyone knows that to beenvironmentally responsible we need to recycle so this is what we're doing—recycling words andphrases. The fact is that we just simply don't have the means to assign a unique name to every object orconcept that we need to represent in written or spoken language—especially in this industry where wereinvent the technology every few years. So, we have a plethora of homonyms (two or more words thathave the same sound and often the same spelling but differ in meaning) in our glossary of technicalterms. The challenge is to understand the context of a term and to differentiate between their meanings.
This one is a classic example. In Reporting Services, you have the concept of a query in the reportdefinition that provides data values for the report output; our good friends at Microsoft decided to callthis a Dataset. If you have worked at all with programmatic data access in the .NET Framework, youshould know that a Dataset is also an object that stores a cache of data (perhaps from a query) as an XMLstructure in memory. Although these two items may both handle data and deal with queries, result sets,and binding values displayed in a report, they are two very different concepts. Now, since we have thatstraightened out, try this: If you were to create a custom data source extension in program code, youmight use an ADO.NET Dataset that would serve as the Dataset for a report!
Query BasicsReporting Services has the ability to obtain data from a variety of data sources. Most database productsare queried using a form of SQL,which means that a query created for one database product (say,Microsoft Access) may be portable to a different data source (perhaps Oracle or SQL Server). Mostdatabase products implement a form of SQL conforming to the ANSI SQL standard. SQL Server, forexample, conforms to the ANSI 92 SQL standard and other products may conform to other revisions(like ANSI 89 SQL or ANSI 99 SQL). Beyond the most fundamental SQL statements, most dialects of SQLare not completely interchangeable and will require some understanding of their individualidiosyncrasies.
The main point here is that you can use whatever query language your database product understands.Reporting Services provides a query editor designed especially for Transact SQL and a generic editorthat will accommodate other query languages and SQL dialects.
97
Designing Data Access
68787_ch04.qxp 26/03/2004 6:01 PM Page 97

Data SourcesA data source contains the connection information for a dataset. Data sources can either be created onlyfor a specific report dataset or may be shared among different reports. Since most reports will get datafrom a common data source, it often makes sense to create a shared data source. There are a number ofadvantages in using shared data sources. Even if you don't have several reports that need to share acentral data source, it takes no additional effort to create a shared data source. This may still beadvantageous in this case as the data source is managed separately from each report and can be easilyupdated if necessary. Then, as you add new reports, the shared data source will already be establishedand deployed to the Report Server.
In a Visual Studio report project there are three different ways to create a data source:
❑ Creating a data source in the Report Wizard
❑ Creating a data source from the Project Add Item template
❑ Creating a data source when defining a dataset
Let's look at each of these in detail.
Creating a Data Source in the Report WizardIf you choose Add New Report from the Solution Explorer right-click menu the Report Wizard is launched.The first page in the wizard will give you the opportunity to select an existing shared data source orcreate a new data source as shown in Figure 4-4:
Figure 4-4
98
Chapter 4
68787_ch04.qxp 26/03/2004 6:01 PM Page 98

Creating a Data Source from the Project Add Item TemplateChoose Add New Item from the Solution Explorer's right-click menu, new item options, and includeReport Wizard, Report, and Data Source. Selecting the Data Source option creates a shared data source.
The following is an example of the standard Data Link Properties dialog used to define a data source. Ifyour database server was named DWServer, this name would be selected or entered in the first box,under step 1 in this dialog as shown in Figure 4-5:
Figure 4-5
If you are working with a local development database server, installed on the same computer, you canenter local or localhost. Otherwise, enter the name of the database server.
In step 2, you choose the security authentication method to be used by the database server to checksecurity credentials. SQL Server may be configured to use Integrated Windows Security, SQL Serversecurity or both. In a development environment, integrated security is a simple choice.
Finally, you would select or type the database name.
Creating a Data Source When Defining a DatasetIf you create a new report without using the Report Wizard, data sources are selected or created from theReport Designer Data tab when creating a dataset. From the Dataset drop-down list, select New Datasetto get the dialog shown in Figure 4-6:
You may also enter an IP address to access a SQL Server across the Internet.Connecting across the Internet requires some ports to be opened through thefirewall. By default, ports 1433 and 1434 are used.
99
Designing Data Access
68787_ch04.qxp 26/03/2004 6:01 PM Page 99

Figure 4-6
Select a shared data source from the drop-down list or click the ellipsis (…) button to create a new one.This will open the Data Link Properties dialog with the same options as selecting the Data Source newitem template.
Regardless of the method used, a data source is simply a connection string saved into the reportdefinition or shared data source file.
Data Sources and Query LanguagesThe examples in this chapter will all use SQL Server 2000 databases. When creating a data source, if youchoose any data provider other than SQL Server, queries must be written in the query languageappropriate for that product. For most relational database products, this will be a dialect of SQL. Forexample, Oracle uses a version of SQL called PL/SQL and Microsoft Access understands Access SQL.Some providers require unique types of query expressions or scripting code specifically designed forthat data source environment.
When defining a dataset's query expression, the Designer will display one of the two similar querywindows. If you are using the SQL Server data provider, the Transact SQL Query Builder will bedisplayed. In the case of another data provider that uses another query language or dialect of SQL, ageneric query window is displayed.
To query cube structures in Analysis Services, a specialized expression language calledMultidimensional Expressions (MDX) is used. The current implementation of Reporting Servicessupports MDX with some limitations. Unlike the Cube Browser in Analysis Services and otherspecialized multi-dimensional data query tools, reports are based on data that is flattened to two-dimensional structures and represented as rows and columns like a SQL query.
In this sample MDX query expression for the FoodMart2000 OLAP database (included in SQL Server2000 Analysis Services), column data is generated from the Store Type dimension and rows are createdfrom the Store dimension:
"SELECT {[Store Type].[Store Type].MEMBERS}ON COLUMNS, {[Store].[Store State].MEMBERS} ON ROWS FROM
100
Chapter 4
68787_ch04.qxp 26/03/2004 6:01 PM Page 100

[Product_Sales]WHERE (Measures.[Average Sales], [Time].[Year].[2003])"
We will discuss the use of data warehouses and specialized decision-support databases in our discussionabout in Chapter 14.
Filtering TechniquesWhen retrieving report data from a data source, it's important to consider the most efficient means forfiltering report data based on the user's selection criteria. Many databases contain large amounts of data.Therefore, it is always important to retrieve just the right amount of data required for reporting. Attimes, a report will only be used to view data for a narrow range of values and at other times the usermay specify different criterion causing the report to render a varied range of related values. In the caseof a narrow range of possible values, it makes more sense to retrieve only the associated data. However,if users will specify different criteria during a session—causing the data source to be re-queried multipletimes—it could prove to be slow and also an inefficient use of resources.
In Figure 4-7, parameters presented to the data source cause data to be filtered and return only the datafor a single rendering of the report. The dataset represents the database server's result set on the clientside (the Report Server). As you see in the diagram, this is small volume of data since it has already beenfiltered at the database.
Figure 4-7
By passing selection criteria parameters at the database object level, network traffic can be greatlyreduced and the report is rendered more efficiently. However, if the user will be providing differentparameter values to render several views of the same report within a session, the database will bequeried repeatedly, perhaps resulting in longer overall wait times and much of the same data will bemoving across the network multiple times. In Figure 4-8, a larger volume of data is returned from thedatabase server since it is unfiltered. Filtering then occurs by using report parameters on the ReportServer.
101
Designing Data Access
68787_ch04.qxp 26/03/2004 6:01 PM Page 101

Figure 4-8
If all of the data necessary for each query to be executed in a user's session is obtained in one result set, itwill result in a greater volume of network traffic for a single execution. However, it may reducesubsequent report rendering times.
Selection parameters may be applied to data at the report level rather than at the data source. Since all ofthe data is cached (held in memory) reports will render much faster. This technique can reduce theoverall network traffic and rendering time.
You certainly don't want to retrieve unnecessary data from the data source, so a combination of thesetwo techniques may be the appropriate solution depending upon specific reporting needs. For example,if you are a regional sales manager and you wish to get sales summaries for each of the territories withinyour region, you may begin your session by retrieving all of the regional sales data for a range of dates.For each territory report, this data is simply filtered down to the territory level.
Filtering Data with Query ParametersLet's begin this discussion by talking about using parameters to filter data at the data source. Whetherthe data is to be filtered within the report or not, filtering at least some of the data within the database isan essential technique for most report solutions. If you have created parameterized stored procedures inSQL Server, you are already familiar with this pattern. The technique applies to stored procedures andquery expressions using very similar syntax. Let's start with a simple ad hoc query expression and thenwe'll move on to creating a stored procedure.
Query parameters begin with the @ symbol and must conform to the naming convention standards forTransact SQL identifiers. The name should not contain spaces or certain punctuation characters and can'tbegin with a numeral; for simplicity, just use letters. In stored procedures, parameters must be declaredbefore they are used. In an ad hoc query, simply make up parameter names when you need them. In theWHERE part of a SQL statement, use a parameter to represent a variable valuable as follows:
SELECT * FROM Products WHERE ProductID = @ProductID
102
Chapter 4
68787_ch04.qxp 26/03/2004 6:01 PM Page 102

In this case, the parameter has the same name as the corresponding field name but this isn't necessary. Ifyou want to use the Query Builder to create a more complex query, parameters may be specified in theCriteria column of the builder grid. This is shown in Figure 4-9:
Figure 4-9
In this example, rows will be returned for records where the ListPrice column value is less than or equalto the value specified using the @ListPriceMax parameter.
Report ParametersAll query parameters specified for a dataset will automatically generate corresponding reportparameters. Additionally, report parameters (that do not have corresponding query parameters) can beadded to support addition report functionality.
The following example demonstrates some simple report parameters used to dynamically set values onthe report. Later we'll apply this technique to some practical report features. This example is intended todemonstrate two very simple report parameters for academic purposes.
Create a new report without using the wizard. You can do this by selecting Add and then Add New Itemfrom the Solution Explorer's right-click menu; select Report from the report item templates in the AddNew Item dialog. Do not specify a dataset for the new report and then switch to the Layout view in theReport Designer.
Report parameters are added using the Report Parameters dialog. Select the Report item in the propertieswindow and click the ellipsis (…) button next to the ReportParameters item.
103
Designing Data Access
68787_ch04.qxp 26/03/2004 6:01 PM Page 103

Figure 4-10
As you see in Figure 4-10, the ReportTitle parameter is a string value with the default set to Report Title.The TextColor parameter is similar and has a default value set to Blue.
Drag two text box items from the toolbox window onto the body of the report in the Report Designer.Normally it's a good idea to give items an appropriate name (especially if they are to be referenced in anexpression) but this isn't necessary in this simple example.
Set two properties for these text boxes: the Value property for each text box and the Color property of thesecond text box. The Designer displays the value property in the text boxes but it's a good idea to changethese property values in the standard properties window or the custom text box properties dialog (rightclick the text box and choose Properties).
The first text box will get its value from the ReportTitle parameter. Set its Value property to =Parameters!ReportTitle.Value and set the Value property of the second text box to ="This Text is " &Parameters!TextColor.Value. With the second text box selected, set its Color property to =Parameters!TextColor.Value. See Figure 4-11:
Figure 4-11
104
Chapter 4
68787_ch04.qxp 26/03/2004 6:01 PM Page 104

You can also change the FontSize and FontWeight properties if you prefer to dress things up a bit more.I've also added a line to the report.
Now click the Preview tab and notice what happens. The ReportTitle and TextColor parameters aredisplayed in the header of the preview window with the default values and these values are displayedin the report.
Try changing the ReportTitle and Color using the parameter fields in the header and click the View Reportbutton to refresh the report preview. The first text box should display the text entered into the ReportTitleparameter and the second text box should not only display the specific color name but the text shouldalso be displayed in that color as in Figure 4-12:
Figure 4-12
As you can see, this is an effective way to feed values to the report to be used in expressions. We willexpand this technique to provide filtering and dynamic formatting.
Basing a Parameter on a QueryWhether report parameters are derived from query parameters or created within the report explicitly,they may be used for a variety of things in the report. Often, it will make sense to let your user selectfrom a list of items to supply a parameter value. Parameter items may be populated from a static list orfrom a data-driven query.
Parameter values can be selected from a data source through a dataset that is set up within the ReportDesigner like any dataset you would use for the report itself. A report may contain any number ofdatasets, some to supply parameter values and others to supply data for items within the report.
Using the sample Northwind database for a simple example, your report may be driven by a dataset thatselects records from the Products table where the CategoryID matches a user-specified parametervalue. The CategoryID parameter values would be based on another dataset that selects theCategoryID and CategoryName columns from the Categories table. In Report Manager, the usersimply selects a category name from a drop-down list and then the report is viewed showing onlyproducts that match the selected category.
In the upcoming walkthrough exercise, you will create different parameters that will not only drive thereport but will filter the values for multiple, related parameters.
105
Designing Data Access
68787_ch04.qxp 26/03/2004 6:01 PM Page 105

Cascading ParametersThe behavior I just described is what we call cascading parameters. This is a feature in the Report Managerthat allows one parameter value selection to cause another parameter list to be populated with relatedvalues. There will be times when you may want to filter a list of parameter values based on anotherparameter selection. In the earlier example for product categories and products let's say that theselection from the Products table is to provide another parameter value that will be used to generate areport of sales records for the selected product. In this case, you may want to select the category first.This would give you a filtered list of products that would be used to select a specific product. Theproduct selection would then be used to render the sales report.
We'll use another example from the AdventureWorks2000 database. We'll raise the bar just a little moreand create three different parameters to drive a fairly simple walkthrough example. The outcome of thisexercise will be a report showing stores in a given location. You will be prompted to select a country.When the country is selected, related states or provinces will be listed. Making a selection from this listwill make cities available. Selecting an item from this list will drive the report data—a list of stores in theselected city.
This walkthrough requires that you either complete the steps in the preceding chapter or that youalready know how to create a report project and a shared data source.
To begin with, add a new report to a Visual Studio report project. From the Solution Explorer, right clickon Reports and choose Add and then Add New Item. Select Report from the templates list and give it anyname you like. I'm calling mine Cascading_Parameters. I know it's not very imaginative but it makes thepoint.
In the Report Designer, you should be looking at the Data tab at this point. Drop down the list labeledDataset and select New Dataset. The dialog as in Figure 4-13 will appear:
Figure 4-13
Enter the name Country_List for the new dataset. Select or create a shared data source for theAdventureWorks2000 database (created one in the previous chapter) and then click the OK button tomove to the Query Builder window.
106
Chapter 4
68787_ch04.qxp 26/03/2004 6:01 PM Page 106

Rather than going through the whole Query Builder procedure, here is the SQL statement to type intothe SQL pane. Place the cursor in the third pane down in this window (between the two grids) and typethe following code:
SELECT CountryRegionCode, NameFROM CountryRegionORDER BY Name
Note that the carriage returns and most of the spacing are optional. The only critical spaces are betweenthe words ORDER and BY. Everything else should have one or more spaces. This query doesn't use anyparameters since it won't be filtered.
Drop down the dataset list, choose New Dataset and repeat the preceding steps to create a new datasetcalled StateProvince_List. The SQL expression for this dataset can also be typed into the Query Builderwindow:
SELECT StateProvinceID, StateProvinceCode, CountryRegionCodeFROM StateProvinceWHERE CountryRegionCode = @CountryCodeORDER BY StateProvinceCode
If you used the Query Builder to create this expression, there may be some additional parentheses. Theseare unnecessary and, again, the spacing and returns are not particularly important.
This expression does include a parameter, @CountryCode, which will get its value from a row selectedfrom the previous dataset. A corresponding parameter will be created for the report calledCountryCode.
Drop down the dataset list and create a third dataset called City_list. Like the last dataset, this one alsoincludes a parameter that will get its value from the selected state or province. Type the following SQLstatement for this dataset:
SELECT StateProvinceID, CityFROM AddressGROUP BY StateProvinceID, CityHAVING StateProvinceID = @StateProvinceIDORDER BY City
There is no table exclusively for cities so you can use the Address table and grouping on the Citycolumn to eliminate duplicates. This query will return a list of cities for the selected state or provinceusing the StateProvinceID parameter.
Finally you will need to create the dataset for the report itself. The SQL for this is going to be a littlemore complicated. Due to the normalized design of the AdventureWorks2000 database, it takes severaltables to take you from a city to a store with the necessary report values. Let's use the Query Builder forthis one.
If you prefer, you may skip the following Query Builder steps and type the SQL statement directly intothe SQL pane.
107
Designing Data Access
68787_ch04.qxp 26/03/2004 6:01 PM Page 107

Add one more dataset and call it Stores_By_City. Click the Add Table toolbar button (or right click the toppane and choose Add Table) and add the tables illustrated in Figure 4-14:
Figure 4-14
The joins will be added automatically by the Query Builder. An additional join will be added betweenthe StateProvince and CountryRegion tables. To remove the join, click once on the line and then press thedelete key.
In the second pane, select the table columns in the order you see here. You can either use the drop-downlists in the grid for the column and table or check them in the table diagram in the first pane. Since theStore and CountryRegion tables both contain columns called Name, you can use aliases to make thesecolumn names more descriptive. Enter the alias names as you see in the grid in Figure 4-15:
Figure 4-15
Finally, enter the query parameters @StateProvinceID and @City as you see here. This dataset shouldbe complete. To check it, compare this SQL statement with the one in the Query Builder:
SELECT Customer.CustomerID, Store.Name AS StoreName, CountryRegion.Name AS CountryName, StateProvince.StateProvinceCode, Address.City, StateProvince.StateProvinceID
FROM Customer INNER JOINCustomerAddress ON Customer.CustomerID = CustomerAddress.CustomerIDINNER JOIN Store ON Customer.CustomerID = Store.CustomerID INNER JOIN Address ON CustomerAddress.AddressID = Address.AddressID INNER JOIN CountryRegion
ON Address.CountryRegionCode = CountryRegion.CountryRegionCode INNER JOIN StateProvince
ON Address.StateProvinceID = StateProvince.StateProvinceID
108
Chapter 4
68787_ch04.qxp 26/03/2004 6:01 PM Page 108

WHERE Address.City = @City AND StateProvince.StateProvinceCode = @StateProvinceID
Let's now look into configuring parameters.
Switch to the Layout tab and select the Report item from the properties window drop-down list. Click theellipsis button next to the ReportParameters property. This opens the Report Parameters dialog as seen inFigure 4-16:
Figure 4-16
The CountryCode parameter will get its values from the Country_List dataset. Like most typical lookuptables, the key value is not intended to be a user-readable value but is used to indicate the selectedcountry for related tables through a foreign key relationship.
Select this parameter in the Parameters list box and then enter Country for the prompt. This is the captionthe user will see next to the parameter drop-down list when they view the report. Uncheck both of thecheck boxes to indicate that the user must select a value from the drop-down list.
The parameter drop-down list will display values in the Name column and return the correspondingvalue in the CountryRegionCode column. Set the Label field and Value field properties accordingly. Finally,indicate that there is no default value by selecting the last radio button and click OK when you're done.
We will repeat this process for the other two parameters. Use the following Report Parameters screendiagram to set these properties.
The StateProvinceID parameter is configured as shown in Figure 4-17:
109
Designing Data Access
68787_ch04.qxp 26/03/2004 6:01 PM Page 109

Figure 4-17
The properties for this parameter are set much like they were before. This time use the StateProvince_Listdataset as the drop-down list data source. You should remember that this dataset contains a queryparameter called CountryRegionCode. The reporting engine is smart enough to make the connectionbetween the Value field of the previous parameter's dataset and this dataset's corresponding parameter.One parameter selection will filter the list for the next parameter as long as the parameters are listed intheir order of dependency.
The final parameter, City, is configured as shown in Figure 4-18:
Figure 4-18
110
Chapter 4
68787_ch04.qxp 26/03/2004 6:01 PM Page 110

Much like the previous parameter, the City parameter gets its value list from the City_List dataset, whichcontains a query parameter related to the value field selection for the StateProvinceID parameter.
Designing the report is easy. I've made it a point to size the text box items so you can read their valueproperties in this view of the Report Designer:
Figure 4-19
The wide rectangle at the bottom of the report body is a list item. Drag this from the toolbox to the reportbody first and set its DataSetName property to Stores_By_City. The toolbox is located on the left side oftheDesigner window and has a little wrench and hammer icon.
The easiest way to create data-bound text boxes is to drag fields from the fields list (located on the leftside near the toolbox). With the fields list open, drop down the list at the top and select theStores_By_City dataset. Now drag the CustomerID and Name fields onto the list item you created earlier.
From the Toolbox, drag two text boxes above the list and change the Value properties to Customer ID andStore like you see in the Figure 4-19. The Stores By Location, Country, State/Province, and City text boxesare also unbound and serve only as static labels.
Drag and drop the CountryName, StateProvinceCode, and City fields to the right of the correspondinglabel text boxes near the top of the report body.
Note the value of these three items contains some additional information. An aggregate function (likethe First function used here) is necessary when an item isn't contained in a list, grid or other containeritem that repeats rows of data. Since this report defines more than one dataset, the dataset name isrequired in the second argument of the First function.
With these settings in place, you should be able to preview the report and see the results. Switch to thePreview tab and select a Country from the drop-down list.
As shown in Figure 4-20, select United States from the list and the State/Province parameter list isenabled:
Figure 4-20
111
Designing Data Access
68787_ch04.qxp 26/03/2004 6:01 PM Page 111

Drop this list down and you will see that it contains only states in the US. Select AZ for Arizona and theCity parameter list becomes available.
Drop down the City list, select Phoenix and then click the View Report button as shown in Figure 4-21:
Figure 4-21
As you can see, the report manager offers a great deal of built-in functionality for using parameterswithout very little effort. Even in Microsoft Access, getting this kind of behavior would have requiredwriting some code.
Using Stored ProceduresThe best way to go about querying a data source will depend highly on your requirements. Refer back toour earlier discussion about filtering techniques where processing parameters (on the database server,the client or both) affects performance, efficiency, and the flexibility of your reporting solution. Handlingparameters on the database server will almost always be more efficient, while processing parameters onthe client will give you the flexibility of handling a wider range of records and query options withoutneeding to go back to the database every time you need to render the report.
Using a parameterized stored procedure is typically going to provide the most efficient means forfiltering data since it returns only the data matching your criteria. Stored procedures are compiled tonative processor instructions on the database server. When any kind of query is processed, SQL Servercreates an execution plan, which defines the specific instructions the server uses to retrieve data. In thecase of a stored procedure, the execution plan is prepared the first time it is executed and then it iscached on the database server. In subsequent executions, results will be returned faster since some of thework has already been done. Stored procedures for SQL Server can be created in three different places:the SQL Enterprise Manager, the SQL Query Analyzer, or in Visual Studio's integrated Query Builder.
In the next exercise we will create a stored procedure that will be used to create columnar report. This isperformed using the Server Explorer to obtain a connection to the database server and then manageobjects on the server.
With Visual Studio open, you can see the Server Explorer located on the left side of the Designer bydefault. Click the plus sign handle to the left of these items to expand each branch of the tree. Open
112
Chapter 4
68787_ch04.qxp 26/03/2004 6:01 PM Page 112
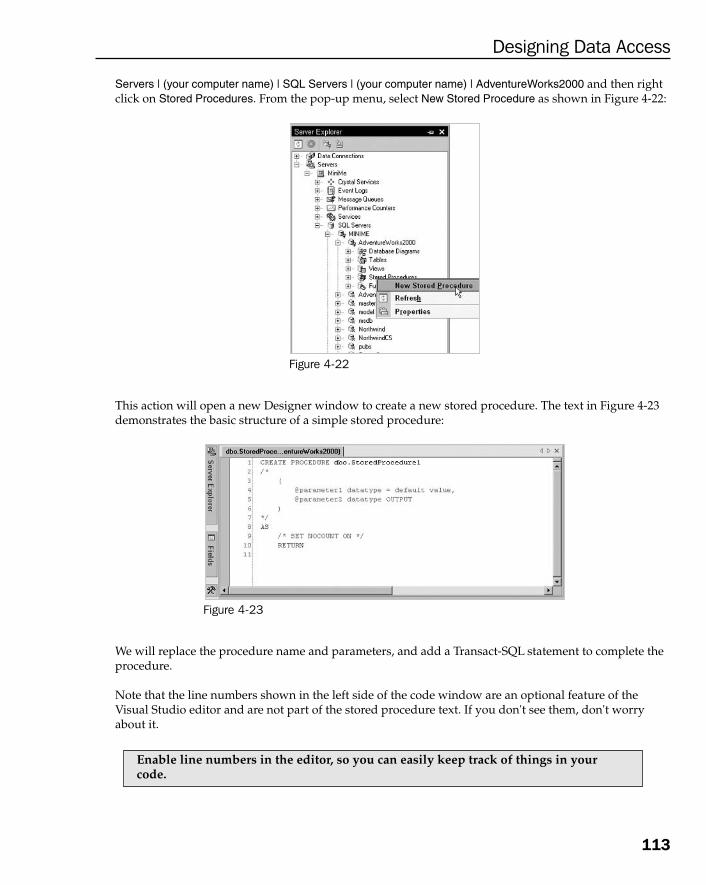
Servers | (your computer name) | SQL Servers | (your computer name) | AdventureWorks2000 and then rightclick on Stored Procedures. From the pop-up menu, select New Stored Procedure as shown in Figure 4-22:
Figure 4-22
This action will open a new Designer window to create a new stored procedure. The text in Figure 4-23demonstrates the basic structure of a simple stored procedure:
Figure 4-23
We will replace the procedure name and parameters, and add a Transact-SQL statement to complete theprocedure.
Note that the line numbers shown in the left side of the code window are an optional feature of theVisual Studio editor and are not part of the stored procedure text. If you don't see them, don't worryabout it.
Enable line numbers in the editor, so you can easily keep track of things in yourcode.
113
Designing Data Access
68787_ch04.qxp 26/03/2004 6:01 PM Page 113

Highlight the procedure name (dbo.StoredProcedure1) and replace it with spGetStoresByLocation.Highlight all of the green-colored text in the block including the /* and */ and delete it and replace itwith:
@StateProvinceCode Char(2),@City nVarChar(30)
The spacing and indentation isn't important. Highlight and delete the text /* SET NOCOUNT ON */ andthen right click in this location. From the pop-up menu, select Insert SQL. In the Query Builder, type thefollowing into the third pane down (between the grids in the second and fourth panes):
SELECT Store.Name AS StoreName, StateProvince.StateProvinceCode,StateProvince.Name AS StateProvinceName, Address.City
FROM Customer INNER JOIN Store ON Customer.CustomerID = Store.CustomerID INNER JOIN CustomerAddress ON Customer.CustomerID = CustomerAddress.CustomerID INNER JOIN Address ON CustomerAddress.AddressID = Address.AddressID INNER JOIN StateProvince ON Address.StateProvinceID = StateProvince.StateProvinceID
WHERE StateProvinceCode = @StateProvinceCode AND City = @CityORDER BY City, StoreName
Again, using spaces and indentation (as well as carriage returns) is not mandatory, but is a good practicefor increasing the clarity of code and reducing errors. If you are familiar with the Query Builder, you canbuild this query in the table diagram and column grid panes rather than typing all of this into the SQLpane. Close this window and confirm that you want to save changes and update the stored procedurewith this expression. The finished stored procedure should appear as shown in Figure 4-24:
Figure 4-24
Go ahead and close this window and save any changes if prompted. The stored procedure should showup in the Server Explorer tree under the stored procedures branch.
114
Chapter 4
68787_ch04.qxp 26/03/2004 6:01 PM Page 114

Next create a new report and use this stored procedure as the dataset. In the Solution Explorer, rightclick on Reports and select Add | Add New Item. In the Add New Item dialog, select Report and enter thereport name Stores By Location. Click Open to create the new report. On the Data tab of the ReportDesigner, drop down the Dataset list and select New Dataset. In this dialog, enter StoresByLocation for thedataset name and then select or create a data source for the AdventureWorks2000 database.
We created a shared data source for this database in the section Establishing a Data Source. You can referto that exercise to create it if the shared data source isn't available in this project.
Change the Command type from Text to Stored Procedure and then type the stored procedure name,spGetStoresByLocation, into the Query string box. Click OK when you're done. See Figure 4-25:
Figure 4-25
The Designer's appearance will change to a grid with the stored procedure name in a drop-down list attop-right.
Click the Execute button (dark red exclamation mark icon) to test the dataset and execute the storedprocedure. You will be prompted for the two parameter values, @StateProvinceCode and @City. Entertwo valid values and click OK to view the results. Figure 4-26 shows an example:
Figure 4-26
The dataset is used exactly as before. The stored procedure parameters become report parameters.
115
Designing Data Access
68787_ch04.qxp 26/03/2004 6:01 PM Page 115

Filtering Data with Report Parameters So far you've only filtered data at the database level. In cases where users may be using the same reportin one sitting to view data for different criteria, it may be more effective to retrieve a larger result setfrom the data source and then filter the report data on the Report Server.
As you've already seen, parameters defined in a query or stored procedure that serves as report datasetare pulled into the report as report parameters. You can also define your own parameters and useexpressions to filter data at the report level.
We're going to use both product categories and sub-categories for report parameters. The category willbe filtered in the dataset (at the SQL Server) and the sub-category will be filtered in the report (on theReport Server).
Add a new report to a project. Use the AdventureWorks2000 shared data source and apply the followingSQL expression in the dataset:
SELECT Product.ProductID, Product.Name AS ProductName, ProductSubCategory.Name AS SubCategoryName, ProductCategory.Name AS CategoryName, ProductSubCategory.ProductCategoryID, Product.ProductSubCategoryID
FROM Product INNER JOIN ProductSubCategory ON Product.ProductSubCategoryID = ProductSubCategory. ProductSubCategoryID INNER JOIN ProductCategory ON ProductSubCategory.ProductCategoryID = ProductCategory. ProductCategoryID
WHERE ProductSubCategory.ProductCategoryID = @CategoryIDORDER BY Product.Name
You're going to create two more datasets to populate parameter drop-down lists and set up a cascadingrelationship between the two parameters.
Using the same data source, add another dataset and name it CategoryList. Type this text into the thirdpane of the Query Builder:
SELECT ProductCategoryID, NameFROM ProductCategoryORDER BY Name
And add one more dataset named SubCategoryList using this text:
SELECT ProductSubCategoryID, Name, ProductCategoryIDFROM ProductSubCategoryWHERE ProductCategoryID = @CategoryIDORDER BY Name
With the Report Designer Layout tab selected, select the Report item from the properties window drop-down list and find the ReportParameters property. Click the ellipsis button next to this property.This will open the Report Parameters dialog. Note that the CategoryID parameter has been added to the
116
Chapter 4
68787_ch04.qxp 26/03/2004 6:01 PM Page 116

report parameters as expected. Click the Add button to add a new parameter and name it SubCategoryID.Leave all of the other settings at default values to keep things simple. Click OK to close the ReportParameters dialog.
Now switch back to the Data tab and click the ellipsis next to the dataset name. On the Dataset dialogchange to the Filter tab. There are three required elements for a filter expression—the Expression (whatyou want to filter), Operator (how you're going to compare a value), and Value (the source of the filtervalue). For the expression, drop down the list and select =Fields!SubCategoryName.Value.
Leave the equality operator set to = then drop down the Value list and select Expression. This opens theexpression builder. Use the controls to select the SubCategoryID parameter and use the Insert button tomove it into the expression box on the right side of this dialog. The resulting expression should be =Parameters!SubCategoryName.Value.
Modify the first expression using the CInt function and place parentheses around the field expression.Some value comparisons don't resolve data types correctly. If such a comparison results in a data typeconversion or casting error, it can be corrected by explicitly converting the expression to the correct datatype as you've done here with the field expression. To be on the safe side, you can use Visual Basic typeconversion functions with any expression or value. See Figure 4-27:
Figure 4-27
The Filters expression builder has an interesting feature. The And / Or column doesn't allow an explicitselection to be made. If you want to use a more complex expression (for example, if you wanted to bringback all products for a category if no sub-category was selected), you can enhance the expressionmanually as a single expression. However, you can't do it line-by-line using this tool. We'll likely seeenhancements to this dialog in future version of Reporting Services.
Now that you have the datasets and parameters set up, you can actually create a report. We'll keep itsimple. In the Layout tab, drag a text box to the report body, click on it to set focus and type the reporttitle Products by Category / Subcategory. Add a table to the report just below the text box and stretch it tofill the width of the report.
Click once in the table and then select the table by clicking the top-left corner selector to select the table.Select the DatasetName property in the properties window for the table and select the datasetProductsByCategory. From the fields list on the left of the Designer, drag the ProductName,CategoryName, and SubCategoryName fields into the detail row's first, second, and third columnsrespectively.
117
Designing Data Access
68787_ch04.qxp 26/03/2004 6:01 PM Page 117

Dress up the grid by selecting the header row (click once on the grid and use the row selector on the leftto select the header row) and use the report formatting toolbar to make the text bold. Use the propertywindow to set the Border Style | Bottom property to Solid and the Border Width | Bottom to 2pt.
Switch to the Preview tab. You should be prompted to select a category using a drop-down list. Thecategory selection will populate the CategoryID query parameter and retrieve records from the databaseinto memory. Select any category value and you should be prompted to select a subcategory. This is thereport parameter SubCategoryID. Selecting a value will cause the filter to be applied and the resultingdata will be fed to the report. Click the View Report button to render the report as shown in Figure 4-28:
Figure 4-28
The category parameter filters data at the database. This is shown in Figure 4-29:
Figure 4-29
118
Chapter 4
68787_ch04.qxp 26/03/2004 6:01 PM Page 118

The resulting data is cached in memory on the Report Server where the subcategory filter further limitsresults.
You could easily extend the design of this report using more complex items, sorting, and grouping. Thedataset query could also be replaced with a stored procedure. With these building blocks, you now havethe capability to create efficient reports that move the appropriate volume of data across networkconnections and allow users to using filtering criteria without needing to re-query the entire dataset.
SummaryDefining data sources and datasets to manage data source queries is the starting point for almost anydata-driven report. It's essential to understand basic data storage and query architecture to achieve thebest design. Data can be filtered within the database server or in the report. Making the correct choiceand finding the best combination of these options will improve performance and provide flexibility withthe least degree of overhead.
Defining shared data sources in your projects makes it much easier to maintain data connections for allof your reports as a group. Changing the database location or security credentials becomes a muchsimpler proposition. The datasets for your reports define queries for retrieving data and may be used asthe source for the report and repeatable data regions or to provide data value for report parameters.
An ad hoc query expression is stored in the report within the report definition and a stored procedure isstored in the database. Using stored procedures is an effective means for processing parameters andfiltering data before sending it to the report while using a report filter lets you reuse the data you'vealready retrieved. A combination of these parameterized filtering techniques may be an optimal solutionfor more complex reporting needs.
119
Designing Data Access
68787_ch04.qxp 26/03/2004 6:01 PM Page 119

68787_ch04.qxp 26/03/2004 6:01 PM Page 120

Advanced Report Design
Picking up where we left off in Chapter 2, we will expand on the elements of report design andlearn how to use a number of interesting and useful features. This chapter should serve as both atutorial to get you started with these advanced techniques, and a reference for creating your ownreports from your own data sources. The topics covered in this chapter are:
❑ Creating a tabular report using tables
❑ Links and drill-through reports
❑ Using charts in reports
❑ Using custom code to extend formatting and apply business logic
❑ Designing reports for mobile devices
At this point, you should be comfortable using Visual Studio .NET to create and add reports to aproject and you should be familiar with the basic mechanics of the Designer. If you are new to thisenvironment, please work through the exercises in Chapter 4 before you read on.
You will no longer be using the Report Wizard. You should be able to add a new report to aproject, create or select a shared data source, create a dataset, and add items to the Report Designerby now. This chapter will provide directions for using nearly all of the design elements mentionedhere.
In Chapter 4, we talked about using items and data regions in a report. In particular, you used thewizard to generate a tabular report with a table data region. In this chapter, you will start byrepeating this exercise, only with a greater level of detail to create a report to your ownspecifications.
555
68787_ch05.qxp 26/03/2004 6:02 PM Page 121

Chapter 5
122
Creating a Tabular Report Using a TableThe Table data region is a very useful controland can be used to create report interfaces with multiplelevels of groupings and drill-down functionality. As you briefly saw in Chapter 2, groupings give youthe ability to organize repeated data within hierarchies and related groups.
Using the Products by Subcategory/Category query you created in the previous chapter, you can create asimple report that demonstrates the use of groupings within a table. After demonstrating groupings in amulti-level grouped table, drill-down and drill-through capabilities will be added.
Groupings are added directly to the table item using the right click menu and a custom properties dialogwindow. Table groupings can have an associated header and footer row. Cells in these rows containtextboxes (by default) that can be used to display column values for the grouping level. Differentcolumns can be used to indent grouped values, or you can use the padding property of a textbox toachieve more precise control.
You'll use a modified version of the previous query without the parameter. Add a new report withoutusing the wizard. For the dataset, use the shared data source for the local AdventureWorks2000 databaseor create a data source that points to this database.
From the Products by Subcategory/Category exercise, you can copy and paste the SQL expression from theProductsByCategory dataset into the new report's dataset, and then remove the @CategoryIDparameter reference and the two key columns, ProductCategoryID and ProductSubCategoryID. Ifyou didn't do this exercise, type the following SQL expression into the third pane of the Query Builder:
SELECT Product.ProductID, ProductCategory.Name AS CategoryName,ProductSubCategory.Name AS SubCategoryName, Product.Name AS ProductName
FROM Product INNER JOIN ProductSubCategory ON Product.ProductSubCategoryID = ProductSubCategory.ProductSubCategoryIDINNER JOIN ProductCategory ON ProductSubCategory.ProductCategoryID = ProductCategory. ProductCategoryID
ORDER BY ProductCategory.Name, ProductSubCategory.Name, Product.Name
As you can see, we've simplified the expression since you're not going to use any parameters in thisexample.
Switch to the Layout tab and drag a Table data region item from the toolbox to the Report Designer.Click on the table and then click the gray handle on the top-left to select it. This should display a borderwith selection handles around the table. In the properties window, select the DatasetName property andin the drop-down list, select the dataset name.
The table currently contains a detail, header, and footer row. You will add two groups for the Categoryand Subcategory. Groups are added in top-down order so we will add the Category group first. Rightclick the detail row handle and select Insert Group from the pop-up menu as shown in Figure 5-1:
68787_ch05.qxp 26/03/2004 6:02 PM Page 122

Figure 5-1
The Grouping and Sorting Properties dialog is displayed with a default name for the new grouping. For acomplex report, you may want to devise a more intuitive naming convention than the one offered by theDesigner. Note the features in this dialog include:
❑ Name is used for identifying and referring to this group in expressions
❑ Group on may contain one or more expressions to group on
❑ Document map label is a field value or text that will be used in the document map for the report
❑ Parent group may be used to create a hierarchy of nested groupings
❑ Page break options may be used to force a page break
❑ Header and footer options enable group header and footer rows
For simplicity, just add the group field name to the end as you see in the Figure 5-2. In the Expressionbox, drop down the first list and select =Fields!CategoryName.Value:
Figure 5-2
123
Advanced Report Design
68787_ch05.qxp 26/03/2004 6:02 PM Page 123

Switch to the Sorting tab and choose the same field to ensure that records are sorted correctly prior togrouping on this field value as shown in Figure 5-3:
Figure 5-3
Click OK to close the Grouping and Sorting Properties dialog. Right click on the detail row handle againand repeat the same process for the ProductSubCategory field. This is shown in Figure 5-4 and Figure 5-5:
Figure 5-4
Figure 5-5
124
Chapter 5
68787_ch05.qxp 26/03/2004 6:02 PM Page 124

Adding the fields to the table is a snap. Just drag and drop them from the Fields window on the left.Place the CategoryName in the first cell in the group 1 row. Drag the SubCatgoryName field to the secondcolumn on the group 2 row and drag the ProductName field to the third column on the detail row asshown in Figure 5-6:
Figure 5-6
The report should be functional at this point although it needs a little cosmetic work. Select the headerrow by clicking in the table and then on the header row selector handle. This selects all of the textboxesin this row. Using the properties window set the BorderStyle | Bottom property to Solid and theBorderWidth | Bottom property to 2pt.
Column Placement and IndentationOne of the typical limitations of a grid is that if you want values to be indented or staggered, the valuesare restricted to specific column placement and widths. If you want the indentation between each levelto be less pronounced, it wouldn't allow much room for values in their respective columns.
There are two common techniques for dealing with these limitations. The first technique, you'll use inthis example, is to merge columns together which will give values more space, even with the columnspacing reduced. To apply this technique, click and drag the mouse pointer across a group of adjacentcolumns to group select them. Right click and select Merge Cells. Note that this effectively extends thefirst cell in the range and hides other cell values. You may find it necessary to abbreviate columnheadings so you can resize the columns and get the desired effect. In Figure 5-7, you can see that I'vechanged the column headings, resized the columns, and set the Category and Sub Category textboxes touse bold text:
Figure 5-7
125
Advanced Report Design
68787_ch05.qxp 26/03/2004 6:02 PM Page 125

The other technique for indenting column values in a multi-level grouping is to place different grouprow values in the same column and change the left padding property. In Figure 5-8, the table containsonly one column. The CategoryName textbox left padding is set to the default value of 2px. TheSubCategoryName textbox is set to 22px and the ProductName textbox left padding is set to 42px:
Figure 5-8
One restriction on using this technique is that the column header text can be slightly more difficult toalign. The finished report (using the multi-column technique) is shown in Figure 5-9:
Figure 5-9
Headers and FootersPage headers and footers can be configured so that they are displayed and printed on all pages, oromitted from the first and/or last pages. Using the report you created for the last section on filtering,let's move the report header text into a header and show page count information in the footer on eachpage.
126
Chapter 5
68787_ch05.qxp 26/03/2004 6:02 PM Page 126

Add a page header and footer by selecting Page Header and Page Footer from the Report menu while thereport is open in Layout view. Select Report Properties from the Report menu. This is where you canoptionally leave a page header or footer off the first or last page of the report (see Figure 5-10):
Figure 5-10
Now that the page header and footer are visible in the Designer, drag the report title textbox into theheader area. You'll also replace the header row of the table with textboxes in the page header. Add threetextboxes and label them with the same text as the three columns in the table header row. Let's also adda line and place it immediately below the row of textboxes. Resize the page header area as needed.
In the report body, click on the table and then right click the row selector to the left of the table header.Choose Delete Rows to get rid of the header row. Resize the report body as needed. Finally, in the reportfooter section, place a horizontal line and a textbox item below it.
You're going to set the value of the textbox so that it reads Page X of Y. To do this, you'll use anexpression to create a dynamic value. Expressions may be used to set most property values based on avariety of global variables, fields and calculations. To display the page number and page count, selectthe Value property for the textbox in the properties window and drop down the list. Select Expressionand use the Edit Expression window to create the expression. Begin by typing '=''Page '' & ' in theExpression box and then use the Globals item on the Fields list to select the PageNumber field. Next, insertthe field reference into the expression using the Insert button. Concatenate the text ' & '' of '' & ', and thenselect and insert the TotalPages field. The finished expression should read as follows:
=''Page '' & Globals!PageNumber & '' of '' & Globals!TotalPages
The Edit Expression window, or the Expression Builder, in turn should appear as shown in Figure 5-11:
Figure 5-11
127
Advanced Report Design
68787_ch05.qxp 26/03/2004 6:02 PM Page 127

The Expression Builder is a simple tool that builds string values. You can always type the expression intothe property window. The finished report in the Designer window can be seen in Figure 5-12:
Figure 5-12
The report should be ready to preview and is shown in Figure 5-13:
Figure 5-13
Drill-Down ReportsA drill-down report is an interactive report design that allows the user to expand and collapse sectionsof the report to discover more detail as needed. In recent years, users have become accustomed to thistype of tree-view navigation in software, so it has become a common user interface metaphor. Interactivereports give the user more options and reduce unnecessary screen space used by data that the user neednot view. They can drill down further as per their need to view more specific details.
The magic of drill-down reports is that rows and sections are simply hidden and displayed based on atoggle item. This means that a value item (like a textbox) is used to toggle the hidden property of rowsand other report items. A plus sign or icon (+) is displayed to the left of the toggle item. Each time theuser clicks the icon, the hidden property for the associated row items is toggled between true and false,
128
Chapter 5
68787_ch05.qxp 26/03/2004 6:02 PM Page 128

and the toggle icon toggles between a plus (+) and minus (-) sign. The rows must also be set up tocollapse when they are hidden.
Continuing from the previous example, the first thing you need to do is to remove the unused rowfooters in the table. Click in the table to show the row selector handles, and then right click the handlefor each of the two empty footer rows and delete them. As drill-down visibility is managed at thegrouping level, you need to define a grouping for the detail row. Select the detail row using the rowselector and find the Grouping/Sorting property in the properties window. Click the ellipsis button (…)next to this property to show the Grouping and Sorting Properties dialog. You need to specify a name. Tokeep the naming consistent with the other two groupings, enter Table1_Group3_ProductName in theName box. Select =Fields!ProductName.Value from the drop down in the first row of the Expression listbox as shown in Figure 5-14:
Figure 5-14
On the Visibility tab, change the initial visibility to Hidden and then check the box labeled Visibility can betoggled by another report item. This enables the report item drop-down list. Select the SubCategoryNameitem in the Report item drop-down list. The SubCategoryName textbox is in the second column of thesubcategory group row. It will be used to toggle the visibility of the row that is being dealt with. SeeFigure 5-15:
Figure 5-15
129
Advanced Report Design
68787_ch05.qxp 26/03/2004 6:02 PM Page 129

The same process should be repeated for the subcategory row grouping. Select the row using the rowselector and click the ellipsis button next to the Grouping/Sorting property. On the dialog, choose theVisibility tab and set the initial visibility to Hidden and use the CategoryName report item to toggle thevisibility of this grouping. Click OK to save the settings. Figure 5-16 shows the preview for this report:
Figure 5-16
Use the (+) icons to drill-down into a category or subcategory row. As you see, the report now becomesinteractive and users can customize the display of the report by viewing only the information that theyneed.
Creating a Document MapThis is a simple navigation feature that allows the user to find a group label or item value in the reportby using a tree displayed along the left side of the report. It's sort of like a table of contents for reportitems, which can be used to quickly navigate to a specific area of a large report.
The document map is limited to the HTML, Excel, and PDF rendering formats. In Excel and HTMLformats, the document map may not survive when saving report files to an older document format – such as Pocket Excel on a Pocket PC device.
You will add the CategoryName and SubCategoryName groupings to the document map. In the Groupingand Sorting Properties dialog for the Category row (group 1), drop down the Document map label list andchoose the =Fields!CategoryName.Value item. See Figure 5-17:
130
Chapter 5
68787_ch05.qxp 26/03/2004 6:02 PM Page 130

Figure 5-17
Click OK to close the dialog and then do the same for the second row group.
Be careful and specify the document map label property only for items that you want to include in thedocument map. For example, if you specify this property for a grouping (like you've done here), don'tdo the same for a textbox containing the same value. Otherwise, you will see the same value appeartwice in the document map. A report with a document map is illustrated in Figure 5-18:
Figure 5-18
The document map may be shown or hidden using the left-most icon in the Report Designer's Preview orthe Report Manager report view toolbar.
131
Advanced Report Design
68787_ch05.qxp 26/03/2004 6:02 PM Page 131

Links and Drill-Through ReportsAny textbox or image item can be used for intra-report or inter-report navigation, for navigation toexternal resources like web pages and documents, and also to send email. All of these features areenabled by using navigation properties that can be specified in the Textbox Properties or Image Propertiesdialog. In the Image Properties dialog, select the Navigation tab. In the Textbox Properties dialog, click theAdvanced button to show the Advanced Textbox Properties dialog, and then switch to the Navigation tab.
Bookmarks and LinksA bookmark is a textbox or image in a report that can be used as a navigation link. If you want to allowthe user to click an item and navigate to another item, assign a bookmark value to each of the targetitems. To enable navigation to a bookmark, set the Jump to Bookmark property to the target bookmark.
The Jump to URL property can be used to navigate to a static location (a bookmarked item, report, orURL). It can also be set to an expression that uses links stored in a database, custom code, or any othervalues. Any standard URL can be specified for linking to a web page, file, or even an email address.
Drill-ThroughThis powerful feature enables a textbox or image to be used as a link to another report by passingparameter values to the target report. The target report can consist of a specific record or multiplerecords depending on the parameters passed to the target report. The following example uses theProducts by Category report created earlier to demonstrate the use of grouped tables. The Product Nametextbox is used to link to a report that will display the details of a single product record. This reportaccepts a ProductID parameter to filter the records and narrow down to the record requested.
In the Advanced Textbox Properties dialog box, select the Jump to report radio button and select the targetreport from the drop-down list. See Figure 5-19:
Figure 5-19
132
Chapter 5
68787_ch05.qxp 26/03/2004 6:02 PM Page 132

Any parameters you need to pass to the target report can be configured using the Parameters button. Inthe Parameters dialog, parameters for the target report are selected in the Parameter Name column.Values supplied from the current report are provided in the Parameter Value column as you can see inFigure 5-20:
Figure 5-20
If you need to give a cue to the user that the item is a link, you may want to display text with anunderline. The resulting reports provide drill-through functionality. When a product name is clicked onthe main report, the viewer redirects to the detailed report for the specific product by passing theProductID parameter value. This is shown in Figure 5-21:
Figure 5-21
If you set an item as a link to a target, its appearance does not change.
133
Advanced Report Design
68787_ch05.qxp 26/03/2004 6:02 PM Page 133

Recursive DataRepresenting recursive hierarchies has always been a pain for reporting and often a challenge toeffectively model in relational database systems. Examples of this type of relationship (facilitatedthrough a self-join) may be found in the Employees table of the Northwind and AdventureWorks2000sample databases. Report tools were designed to work with data organized in traditional multi-tablerelationships. Fortunately, our friends at Microsoft built recursive support into the reporting engine todeal with this common challenge. A classic example of a recursive relationship (where child records arerelated to a parent contained in the same table) is the employee/boss relationship. For example, if I wereto diagram the organizational hierarchy of the developer instructors group at Netdesk, it would looksomething like Figure 5-22:
Figure 5-22
In our employee database, each of these records exists in the same table. My record (Paul) would indicatethat my boss is Dan. Dan reports to Lance, who in turn reports to Todd S.
In the AdventureWorks2000 database, you have a similar set of data. The Employee table contains aprimary key, EmployeeID, that uniquely identifies each employee record. The ManagerID is a foreignkey that depends on the EmployeeID attribute of the same table, and it contains the EmployeeID valuefor the employee's manager. The only record that won't have a ManagerID would be the president of thecompany or any such employee who doesn't have a boss.
Representing the hierarchy through a query would be quite difficult. However, defining the dataset forsuch a report is very simple. You simply expose the primary key, foreign key, employee name, and anyother values that you want to include on the report. You'll just include these three values for our simpleexample.
Create a new report and define a dataset using the AdventureWorks2000 shared data source. The name ofthe new dataset will be EmployeesAndManagers. Enter this SQL expression into the third pane of theQuery Builder:
SELECT EmployeeID, FirstName + ' ' + LastName AS EmployeeName, ManagerIDFROM EmployeeORDER BY FirstName + ' ' + LastName
134
Chapter 5
68787_ch05.qxp 26/03/2004 6:02 PM Page 134

Add a table to the report in the Layout tab. The single grouping will provide all of the recursivefunctionality for the table. Click on the table to show the selection handles and then click the selector tothe left of the detail row. You're not adding a new grouping, but simply using the grouping that exists onthis row. In the properties window, click the ellipsis next to the Grouping/Sorting property. In the Groupingand Sorting Properties dialog, enter the grouping name as OrgChart_Recursive. In the first row of theGroup on list box, select the expression =Fields!EmployeeID.Value. Drop down the Parent group list andselect the expression =Fields!ManagerID.Value. The reporting engine recognizes this as a recursivegrouping because these fields are in the same table. Select the Sorting tab and select the expression=Fields!EmployeeName.Value in the first row of the Sort on list box. Click OK to close the dialog. SeeFigure 5-23:
Figure 5-23
Now the fun begins; Reporting Services recognizes that recursive groupings have special characteristics.We use the Level function that returns a group level number within the recursive hierarchy. Each row isassigned a level value that represents its relative position to parent and children rows in the hierarchy.You will also use a Count function indicating that you want the count of the recursive group's children.
Drag the EmployeeName field from the Fields list window to the first column of the detail row. Entercolumn headers for the second and third columns as Level and Count respectively. In the second detailcell, set the Value property to =Level(''OrgChart_Recursive'') + 1. You're adding 1 to this value because theLevel function returns 0 for the first level, 1 for the second, and so on. The expression for the thirdcolumn will use the Recursive keyword in the Count function's third argument. This indicates that theaggregate function should be applied to child rows of this grouping. Set the value to the expression=Count(Fields!EmployeeID.Value, ''OrgChart_Recursive'', Recursive).
Finally, you want each row's padding to be progressively greater based on the grouping level. Using theLevel function you can apply some simple math to the padding property value to get the desired result.Since padding values are expressed as a string value, you will concatenate the value px to the end of acalculated numeric value.
135
Advanced Report Design
68787_ch05.qxp 26/03/2004 6:02 PM Page 135

Click on the first cell in the detail row to select the EmployeeName textbox and in the properties window,set the Padding > Left property to =Level(''OrgChart_Recursive'') * 15 & ''pt''. This will set the padding forthe first level (level 0) to 0 pixels, the second to 15 pixels, and the third to 30 pixels, and so on. I'vedressed up the header row using bold text, a border, text alignment, and added a title textbox as inprevious examples. See Figure 5-24:
Figure 5-24
Save the report and then select the Preview tab to view the results. The generated report should appearas shown in Figure 5-25:
Figure 5-25
136
Chapter 5
68787_ch05.qxp 26/03/2004 6:02 PM Page 136

SubreportsThis feature is largely borrowed from Microsoft Access. Essentially, a subreport is a standalone reportthat is embedded into another report. Using parameters, you can link the contents of a subreport to themain report.
There are some limitations to the content and formatting that can be rendered for a subreport. Forexample, a multi-column report may not be possible within a subreport (depending upon the renderingformat used). If you plan to use multiple columns in a subreport, test your report with the renderingformats you plan to use
A subreport can be linked to the main report so that it can be used like a data region, but this is notessential. A subreport could be used to show aggregated values unrelated to groupings or content in therest of the report.
Creating a subreport is like creating any other report. The fact is that you just create a report and thenadd it to another report as a subreport. If you intend to use the main report and subreport as aMaster/Detail view of related data, the subreport should expose a parameter that can be linked to a field inthe main report. You'll build a simple report that lists products and exposes a subcategory parameter.The main report will list categories and subcategories and the products list report will then be used as adata region, like a table or list like in previous examples.
The first report, which will be used as a subreport, will include a list of products. The second report willconsist of the product categories and subcategories and will contain the subreport, which renders a listof products for each subcategory.
1. Add a new report to your project called Product_List_Subreport.
2. On the Data tab, create a new dataset called Product_List using the AdventureWorks2000 datasource. Add the Products table to the dataset and select the Name, StandardPrice, andProductSubCategoryID columns to be output by the query. Sort the records by the Name columnin ascending order.
3. Create a parameter for the ProductSubCategoryID column called @SubCategoryID. The easiestway to do this is to move the cursor to the grid column labeled Criteria on the row for theProductSubCategoryID table column and type = @SubCategoryID. The SQL for the dataset shouldlook like this:
SELECT Name, StandardCost, ProductSubCategoryIDFROM ProductWHERE ProductSubCategoryID = @SubCategoryIDORDER BY Name
4. On the Layout tab, add a List item and set its DataSetName property to the Product_List dataset.
5. From the Fields window, drag the Name and StandardPrice fields into the List item and arrangethem horizontally to form a row with sufficient room for these values. Resize the list so that it isthe height of one textbox and about four inches wide. Place two textboxes to be columnheadings above the list and set their values to read Product and Price, as shown in Figure 5-26. Arrange the textboxes and the items in the list to line up, right justify the Priceheading textbox, and then resize the report body background to fit closely around the list.
137
Advanced Report Design
68787_ch05.qxp 26/03/2004 6:02 PM Page 137

Figure 5-26
6. Add a new report called Product_List_Categories and create a new dataset with the same nameusing the ProductCategory and ProductSubCategory tables. Leave the join in place, alias the namecolumns from both the tables, and sort by first the category name and then the subcategoryname. The resulting SQL expression should look like the following:
SELECT ProductCategory.Name AS ProductCategory, ProductSubCategory.Name AS SubCategory, ProductSubCategory.ProductSubCategoryID
FROM ProductCategory INNER JOIN ProductSubCategory ON ProductCategory.ProductCategoryID =ProductSubCategory.ProductCategoryID
ORDER BY ProductCategory.Name, ProductSubCategory.Name
7. On the Layout tab, add a textbox for the report heading and a list item with the DataSetNameproperty set to the new dataset. Drag and drop the ProductCategory and SubCategory fieldsfrom the fields window into the list data region, with the Product_List_Categories datasetselected. Size the list item to be about 6.5 inches wide by 1.5 inches tall (about 13 cm x 4 cm).Arrange the two new textboxes in a row in the top area of the list.
8. From the Solution Explorer, drag and drop the Product_List report into the list data region belowthe textboxes. Resize the new subreport to be about 4.5 inches wide and 0.75 inches tall (7 cm x 2cm) and place it under the second textbox. Resize the list around the contained items. The reportshould be as shown in Figure 5-27:
Figure 5-27
9. You need to use the subcategory parameter to associate the product list subreport with the outerlist data region. Right click the subreport and select Properties. In the Subreport Propertiesdialog, switch to the Parameters tab and select the SubCategoryID parameter in the first row ofthe parameters box. In the Parameter Value column, select =Fields!ProductSubCategoryID.Value inthe drop down list. See Figure 5-28:
138
Chapter 5
68787_ch05.qxp 26/03/2004 6:02 PM Page 138

Figure 5-28
This completes the report design. You should be able to preview the report and see subcategory namesfollowed by a list of related products as shown in Figure 5-29:
Figure 5-29
ChartingThe charting capabilities in Reporting Services are quite impressive and as easy to use as those in Excelor Access, and in many ways, more powerful. The charting components are based on Dundas Chartsdeveloped by Dundas Software. Dundas provides a suite of ASP.NET charting components that havebeen available for .NET developers since .NET was in early beta stages nearly four years ago. A chartitem is based on a dataset just like any data range and can use query parameters and filters in much thesame way as with a table or matrix.
Some of the more common chart types (like Column, Bar, Line, and Area) can be used for different viewsof the same data. Pie and Doughnut charts are also quite simple but work well with fewer dimensions.The other charts are more specialized.
When a report is rendered, the chart output is rendered to a bitmap and streamed to a PNG type image.This image is then linked or embedded in the report. There are nine general chart types available and aredescribed in the following table:
139
Advanced Report Design
68787_ch05.qxp 26/03/2004 6:02 PM Page 139

Chart Type Description
Column This is a classic vertical bar chart with columns representing values along the Y axis. Like-valued items along the X axis are grouped together and bars representing values for each group along the X axis have the same colors or patterns. Series values can also be grouped and sub-grouped. Columns can have point labels and the colored bars may be labeled using a legend. Columns may be arranged side-by-side (along the X axis) or in front of one another (along the Z axis). Columns may appear to be extruded from their base using a rectangular or circular shape.
Bar This has the same functionality as a Column chart turned 90 degrees with the advantage of accurately depicting value comparisons, especially for layouts where you have more available horizontal space.
Area This is like a Column chart with a trend line drawn from one point to the next in the series. It is appropriate for a series of values that tend to progress over a relatively even plane that describes a ''level'', ''up'', or ''down'' trend. It is not at all appropriate for series values that tend to jump around or fluctuate a lot. The solid shading of the charted area depicts a volume of data values.
Line Similar to the Area chart but the area of the charted region isn't filled. It is useful for comparing multiple series (along the Z axis) without obscuring trend lines behind a series.
Pie This is an excellent tool for comparing relative values. Unlike the above mentioned charts, the aggregate value isn't quantified. The value of each data point in a bar chart is expressed by the length of each bar, whereas only the relative values of each point are expressed by the size of each pie slice. Pie charts put comparative values into a proportional context and can help formulate quick decisions at a glance. Pie chart views can be exploded to visually separate each section.
Doughnut This is a Pie chart with a hole in the middle. A 3-dimensional Doughnut rendering may expose smaller slices more clearly than a Pie chart since each slice has four sides rather than three.
Scatter This chart plots several points in a range (both X and Y) to show trends and variations in value. The result is more like a cloudy band of points rather than a specific aggregated point or line.
Bubble The Bubble chart is used to chart points on three dimensions. Values are plotted using different sized points, or bubbles, on a two-dimensional grid. The size of the bubble indicates the related value along the Z axis.
Stock The Stock chart plots values vertically like a Column chart. For each item along the Y axis series, a vertical line indicates a start and end value for the range. A tick mark in the line can indicate a significant value in that range or an aggregation of the range. It is useful for showing trading stocks with opening, closing, and purchase values or represent wholesale, retail, and discount prices, and so on.
140
Chapter 5
68787_ch05.qxp 26/03/2004 6:02 PM Page 140

Column ChartsThe following chart in Figure 5-30 is an example of a simple Column chart. The X axis series values areproduct categories and the Y axis values represent annual sales revenue. In this view, the legend at thebottom indicates the X axis series values.
Figure 5-30
3-D Column ChartsFigure 5-31 is a three-dimensional view with cylindrical columns arranged in a clustered formation. Ifused correctly and in appropriate moderation, a 3-D chart adds a sense of realism (and looks cool). Thistype of view can be effective for making an impact, but a flatter view may be more appropriate tomaintain accuracy.
Figure 5-31
141
Advanced Report Design
68787_ch05.qxp 26/03/2004 6:02 PM Page 141

I'm not suggesting that this is the most appropriate view for all column charts. I've made a point to setthis chart up with a fairly extreme 3-D and perspective view, just to show you what can be done. Thistype of view tends to distort the values, and the clustering (stacking the columns along the Z axis) canhide some columns from view (in the preceding chart, I had to choose whether to hide the left-mostcolumn in the back row or the right-most column in the second row).
Stacked Column ChartColumn and Bar charts may have their bars stacked. This appends the different colored bars (for a likeseries value) into one bar with multiple colored bands. This may be an appropriate method for showingthe accumulation of all values within the series point. The individual values are displayed in a differentcolor as a percentage of the bar. In essence, each bar becomes like a linear Pie chart (see Figure 5-32):
Figure 5-32
To emphasize the proportion of like values rather than the comparative accumulation, the 100% stackedview (not pictured) will make all of the bars in the chart the same length rather than depicting the sumof all the values in the bar.
Area and Line ChartsAn Area chart plots the values of each point and then draws a line from point to point to show theprogression of values along the series. This is an effective method for analyzing trends and works wellwhen values tend to climb, decline, or remain level in the series. It typically doesn't work well to expressa series of values that are not in a relatively uniform plane. Figure 5-33 is an example of an Area chart:
Figure 5-33
142
Chapter 5
68787_ch05.qxp 26/03/2004 6:02 PM Page 142

The Line chart is a variation of an Area chart using a line or ribbon rather than a solid area. The Linechart works better than the area chart for comparing multiple categories for a series of values as onelayer may obscure another in the area view. In the preceding example, the Area chart works becausevalues are sorted in a way that larger values are in the background and other points in the foregroundare smaller, the trend increases back to front.
Pie ChartsA Pie chart is an excellent tool for comparing proportional values. Display options for a Pie chart includeexploded and 3-D views. The following 3-D Pie chart in Figure 5-34 clearly shows that Touring Bikesales are a small percentage, around 10% of total Bike Sales, and that Road Bike sales account for abouthalf of the total sales:
Figure 5-34
Bubble ChartsBubble charts are essentially a point plotted in a three dimensional grid. The value of the Z axis isexpressed by the size of the bubble. Image that the bubble exists in a 3-D plane and will appear large if itis closer to you. Actually the 'bubble' can be a circle, square, triangle, diamond, or cross shape. This alsomeans that a combination of shapes may be used to represent different data elements in the same chartspace.
In Figure 5-35, employees' vacation and sick hours are plotted above their names. The number ofvacation hours is represented by the bubble's vertical distance from the 0 baseline and the number ofsick hours is represented by the size of the bubble.
143
Advanced Report Design
68787_ch05.qxp 26/03/2004 6:02 PM Page 143

Figure 5-35
The chart shown in figure 5-36 is a Stock chart. As you see, for each product, a line is plotted to span arange of values and has a large tick mark to indicate the position of a value within the high/low range.In this example, the beginning (lowest point of the line) of the range is the standard cost of the product.The tick mark represents the last receipt cost and the high range of the line is the list price.
Figure 5-36
A Charting ExampleTo get you started on creating charts, you will create a column chart using sales information fromAdventureWorks2000. This chart will include an added feature with a category grouping that shows salesassociates grouped by their respective regions.
The dataset SQL expression and the steps to set up the chart have been provided for you. You need totake care of the standard report design details that were covered in the earlier sections of this chapter.
To demonstrate a Column or Bar chart, you only need a simple query with values to plot on two axes.You will also add a third value to categorize or group another set of values. To get started, add this SQLexpression in a new dataset using the AdventureWorks2000 database:
144
Chapter 5
68787_ch05.qxp 26/03/2004 6:02 PM Page 144

SELECT Employee.LastName AS EmployeeName, SalesPerson.SalesYTD,SalesTerritory.Name AS TerritoryName, SalesPerson.SalesLastYear
FROM Employee INNER JOIN SalesPerson ON SalesPerson.SalesPersonID = Employee.EmployeeID INNER JOIN SalesTerritory ON SalesPerson.TerritoryID = SalesTerritory.TerritoryID
WHERE SalesPerson.SalesYTD > 0 AND SalesPerson.SalesLastYear > 0 AND SalesPerson.TerritoryID < 5
ORDER BY SalesPerson.TerritoryID
Add a new Chart item to the report and resize it to fill an area about 7 inches wide and 5 inches tall (18cm x 12 cm). Right click the chart item in the Report Designer and select Column | Simple Column for theChart Type.
When you drag fields onto the report item, drop zones are displayed in the areas above to the right, andbelow the report. These areas will change depending on the report type. Switch to the Fields windowand drag these fields to the drop locations indicated in the following table:
This is also illustrated in Figure 5-37:
Figure 5-37
Field Drop Zone Label
Sales YTD Sales Last Year
Drop data fields here (above the chart)
TerritoryNameEmployeeName
Drop category fields here (below the chart)
145
Advanced Report Design
68787_ch05.qxp 26/03/2004 6:02 PM Page 145

Verify your results using this example. It's important that the fields are dropped in this order. However,you can switch them later in the properties dialog.
Right click the chart again and select Properties to display the Chart Properties dialog. On the General tab,give the chart the name SalesPerformanceChart and for the title, enter North American Sales AssociatePerformance. This is shown in Figure 5-38:
Figure 5-38
Note that the preview chart image in this dialog is the result of all the specified property settings. Youcan use this as a reference when you've completed all of the settings for this report.
Figure 5-39
146
Chapter 5
68787_ch05.qxp 26/03/2004 6:02 PM Page 146

You're going to make several changes on the Y Axis tab. The title will be displayed along the left side ofthe chart as you see in the preview image. Set the title to Total Sales ($ M). For the Scale, set Minimum to 0and Maximum to 3000000 and set the Format code to 0,, to indicate that this is to be a numerical valueusing comma separators per thousand. By providing a range of values, the tallest column will be shorterthan the top of the chart (unless it exceeds the maximum value).
Gridlines can be used to make charts easier to read but can also make them more cluttered. Theappropriate use of major and minor gridlines can emphasize comparable points. In this chart, you willshow major and minor gridlines by using the values shown in Figure 5-40:
Figure 5-40
On the Legend tab, place the legend at the bottom, in the lower-right corner of the chart with labelsarranged in a row (short and wide). This is shown in Figure 5-41. You can select Display legend inside plotarea to maximize the size of the chart; this works well on Pie and Doughnut charts that have free cornerspace. However, this could cause the legend to overlap the chart area for some types of charts.
Figure 5-41
147
Advanced Report Design
68787_ch05.qxp 26/03/2004 6:02 PM Page 147

Use the 3-D Effect settings at your discretion. You often have to play with these settings to achieve theright balance between an effective 3-D rendering and an accurate display of data (see Figure 5-42):
Figure 5-42
Realistic shading makes the 3-D chart appear to have a light source that casts shadows on the borders.The Orthographic property causes the 3-D effect to be slightly exaggerated. The Clustered property causesrows or columns at the same series point to be arranged in front of one another rather than side-by-side.Cylinder bars or columns are less traditional than block style bars.
Click OK on the Chart Properties dialog, save the report, and select the Preview tab to see the completedchart.
As you can see in Figure 5-43, having two related groups on the X axis causes set lines to show theregional groupings (in this case, the values Northwest, Northeast, Central, and Southwest) that you can seealong the bottom of the chart. Two different values are plotted at each X axis point using differentlycolored, cylindrical columns.
148
Chapter 5
68787_ch05.qxp 26/03/2004 6:02 PM Page 148

Figure 5-43
Custom FieldsCustom fields can be added to any report and can include expressions, calculations, and textmanipulation. This might be similar in functionality to alias columns in a query or view but thecalculation or expression is performed on the report server after data has been retrieved from thedatabase. Expressions can also use globals and functions that may not be available in a SQL expression.The term globals applies to a set of variables built in to Reporting Services that provide usefulinformation like page numbers. A list of available globals, fields, and parameters may be found in theExpression Builder. The global variables currently offered in Reporting Services are:
❑ Page Number
❑ Total Pages
❑ Execution Time
❑ Report Server URL
❑ Report Folder
❑ Report Name
❑ User ID
❑ Language
149
Advanced Report Design
68787_ch05.qxp 26/03/2004 6:02 PM Page 149
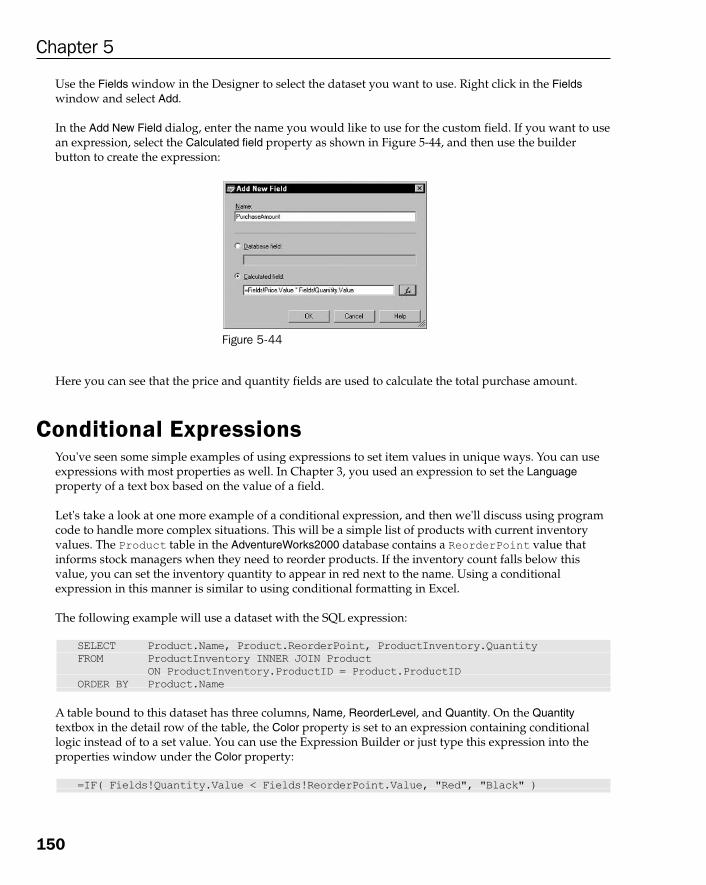
Use the Fields window in the Designer to select the dataset you want to use. Right click in the Fieldswindow and select Add.
In the Add New Field dialog, enter the name you would like to use for the custom field. If you want to usean expression, select the Calculated field property as shown in Figure 5-44, and then use the builderbutton to create the expression:
Figure 5-44
Here you can see that the price and quantity fields are used to calculate the total purchase amount.
Conditional ExpressionsYou've seen some simple examples of using expressions to set item values in unique ways. You can useexpressions with most properties as well. In Chapter 3, you used an expression to set the Languageproperty of a text box based on the value of a field.
Let's take a look at one more example of a conditional expression, and then we'll discuss using programcode to handle more complex situations. This will be a simple list of products with current inventoryvalues. The Product table in the AdventureWorks2000 database contains a ReorderPoint value thatinforms stock managers when they need to reorder products. If the inventory count falls below thisvalue, you can set the inventory quantity to appear in red next to the name. Using a conditionalexpression in this manner is similar to using conditional formatting in Excel.
The following example will use a dataset with the SQL expression:
SELECT Product.Name, Product.ReorderPoint, ProductInventory.QuantityFROM ProductInventory INNER JOIN Product
ON ProductInventory.ProductID = Product.ProductIDORDER BY Product.Name
A table bound to this dataset has three columns, Name, ReorderLevel, and Quantity. On the Quantitytextbox in the detail row of the table, the Color property is set to an expression containing conditionallogic instead of to a set value. You can use the Expression Builder or just type this expression into theproperties window under the Color property:
=IF( Fields!Quantity.Value < Fields!ReorderPoint.Value, "Red", "Black" )
150
Chapter 5
68787_ch05.qxp 26/03/2004 6:02 PM Page 150

You can do the same thing with the Font > FontWeight property, so that if the inventory quantity for aproduct is below the reorder point value, the quantity is displayed in both red and bold text.
Switch to the Preview tab to check the results; these should be as shown in Figure 5-45:
Figure 5-45
Using Custom CodeWhen you need to process more complex expressions, it may be difficult to build all of the logic into oneexpression. In such cases, you can write your own function to handle different conditions and call itfrom a property expression.
There are two different approaches for managing custom code. One is to write a block of code to definefunctions that are embedded into the report definition. This technique is simple but the code will beavailable only to that report. The second technique is to write a custom class library compiled to anexternal .NET assembly and reference this from any report on your Report Server. This approach has theadvantage of sharing a central repository of code, which makes updates to the code easier to manage.The down side of this approach is that the configuration and initial deployment is a bit tedious.
151
Advanced Report Design
68787_ch05.qxp 26/03/2004 6:02 PM Page 151

Using Custom Code in a ReportA report may contain embedded Visual Basic .NET code that defines a function that you can call fromproperty expressions. The code editor window is very simple and doesn't include any editing andformatting capabilities. For this reason, you may want to write the code in a separate Visual Studioproject to test and debug before you place it into the report. After your code is ready, open the report inthe Designer. With the Layout tab selected, drop down the Report menu and select Report Properties.
On the Report Properties window, switch to the Code tab and write or paste your code in the CustomCode box. As you can see, you can't even use the tab key to indent your code, which is why you willwant to write the code elsewhere.
Here is the code along with the expressions you will need to create a simple example report on yourown. The following Visual Basic function accepts a phone number or social security number in a varietyof formats and outputs a standard US phone number and properly formatted SSN. The Value argumentaccepts the value and the Format argument accepts the values Phone or SSN. You're only going to use itwith phone numbers so you can leave the SSN branch out if you wish:
'************************************************************* ' Returns properly formatted Phone Number or SSN' based on Format arg & length of Value arg' PT – 12/12/03'*************************************************************Public Function CustomFormat(Value as String, Format as String) as String
Select Case FormatCase "Phone"
Select Case Value.LengthCase 7
Return Value.SubString(0, 3) & "-" & Value.SubString(3, 4) Case 10
Return "(" & Value.SubString(0, 3) & ") " _& Value.SubString(3, 3) _& "-" & Value.SubString(6, 4)
Case 12Return "(" & Value.SubString(0, 3) & ") " _
& Value.SubString(4, 3) & "-" & Value.SubString(8, 4)Case Else
Return ValueEnd Select
Case "SSN"If Value.Length = 9 Then
Return Value.SubString(0, 3) & "-" _& Value.SubString(3, 2) & "-" & Value.SubString(5, 4)
ElseReturn Value
End IfCase Else
Return ValueEnd Select
End Function
152
Chapter 5
68787_ch05.qxp 26/03/2004 6:02 PM Page 152

The dataset in this report gets its data from the Vendor and related tables in AdventureWorks2000 andreturns three columns: FirstName, LastName, and Phone. The SQL expression used to retrieve thisinformation is as follows:
SELECT Vendor.Name, Contact.FirstName, Contact.LastName, Contact.PhoneFROM Vendor
INNER JOIN VendorContact ON Vendor.VendorID = VendorContact.VendorIDINNER JOIN Contact ON VendorContact.ContactID = Contact.ContactID
These three columns are used in a table bound to the dataset. The Value property of the Phone columnuses an expression that calls the custom function preceded by a reference to the Code object:
=Code.CustomFormat(Fields!Phone.Value, "Phone")
The report preview should be as shown in Figure 5-46:
Figure 5-46
Using a Custom AssemblyRather than embedding code directly into each report, using a custom assembly facilitates the use of areusable central repository of code to extend the functionality of multiple reports. As I mentioned, this isa powerful technique but setting it up is a little cumbersome in the product's current form. The customassembly feature is disabled by default and requires that you make simple but manual modifications intwo configuration files. In a default installation of Reporting Services, you will find these files in thefollowing locations:
153
Advanced Report Design
68787_ch05.qxp 26/03/2004 6:02 PM Page 153

If you double click the file icon in Windows Explorer, it should open in Visual Studio, thus allowing youto edit and save the file. In each of the files, you will find XML elements with the following content.Comments are provided with instructions to remove a commented block of tags to enable customassemblies.
<!-- Remove this comment to enable custom assemblies <CustomAssemblies><Default>
<PermissionSet class="System.Security.PermissionSet"><IPermission class="System.Security.Permissions .Security Permission"version="1" Flags="Execution"/></PermissionSet>
</Default></CustomAssemblies> -->
Remove the line beginning with <!- - and the - -> at the end of the closing tag. Close and save each ofthese configuration files.
Create a class module project. You can write this code in any .NET language since it's going to becompiled to an assembly. The methods you create can be either static or instantiated. It's a little easier touse static methods so you don't have to manage the instancing and life of each object. This simply meansis that you will declare public functions in your class using the Static keyword in C# or the Sharedkeyword in Visual Basic. Using the same code logic as in the previous example, the Visual Basic classcode would look like:
Public Class Report_Formats'************************************************************* ' Returns properly formatted Phone Number or SSN' based on Format arg & length of Value arg' PT – 12/12/03'*************************************************************Public Shared Function CustomFormat(Value as String, Format as String) as String
Select Case FormatCase "Phone"
Select Case Value.LengthCase 7
Return Value.SubString(0, 3) & "-" & Value.SubString(3, 4) Case 10
Return "(" & Value.SubString(0, 3) & ") " _& Value.SubString(3, 3) _& "-" & Value.SubString(6, 4)
Case 12
File Name Default Installation Path
RSReportDesigner.config C:\Program Files\Microsoft SQLServer\80\Tools\Report Designer
RSReportServer.config C:\Program Files\Microsoft SQLServer\MSSQL\Reporting Services\ReportServer
154
Chapter 5
68787_ch05.qxp 26/03/2004 6:02 PM Page 154

Return "(" & Value.SubString(0, 3) & ") " _& Value.SubString(4, 3) & "-" & Value.SubString(8, 4)
Case ElseReturn Value
End SelectCase "SSN"
If Value.Length = 9 ThenReturn Value.SubString(0, 3) & "-" _
& Value.SubString(3, 2) & "-" & Value.SubString(5, 4)Else
Return ValueEnd If
Case ElseReturn Value
End SelectEnd Function
End Class
Save and build the class library project in Release configuration and then copy the assembly (DLL) fileto the ReportServer\bin folder. The default path to this folder is C:\Program Files\MicrosoftSQL Server\MSSQL\Reporting Services\ReportServer\bin.
In the Report Properties dialog (this is where you entered the code in the previous topic example), selectthe References tab and add the reference by browsing to the assembly file. The reference line showsmetadata from the assembly, including the version number, as you can see in Figure 5-47:
Figure 5-47
To use a custom method in an expression, reference the namespace, class, and method using standardcode syntax. The expression for the CustomFormat method should look like:
=Reporting_Component.Report_Formats.CustomFormat(Fields!Phone.Value, "Phone")
The report should look exactly as it did in the previous example.
To deploy a report using custom assembly files to a production server, you will needto copy the assembly file to the same location on the server.
155
Advanced Report Design
68787_ch05.qxp 26/03/2004 6:02 PM Page 155
Designing for MobilityThe idea of making reports available in custom applications that run over the Internet or letting usersaccess reports from desktop computers outside of the office opens many doors of opportunity that wereearlier not possible. These capabilities are now very easy to achieve but the promise of this technologydoesn't stop there. This brings to mind the unforgettable words of Ron Popeil, ''...but wait. There'smore...'' Another very quotable figure, Bill Gates, announced in 2000 that the next generation of servicesfrom Microsoft would enable people to access information ''any time, any place, and on any device."This product fulfills that promise making reports available to the next generation of mobile computingdevices.
There are many different devices on the market that could be categorized as mobile internet devices ormobile network devices capable of viewing reports. These may include Personal Digital Assistants (PDAs),palm-sized or hand-held computers, and enhanced pagers or cellular phones. The lines separating thesedevices are becoming quite blurred as the newest generation of cell phones can be used to surf the weband some PDAs now include integrated cell phones. There are also camcorders with built-in networkingand web browsers! For our discussion, the scope of these devices will be limited to the Windows-basedunits. However, some Palm OS devices may be used to view online content via a wireless corporatenetwork or the World Wide Web and can be used to view offline documents in standard formats (such asPDFs). We acknowledge that many of the capabilities may also be supported on the Palm platform.
The challenges and opportunities for delivering mobile device-enabled reports are varied but fall intothe following areas:
❑ Screen size
❑ Device, browser, and viewer capabilities
❑ File portability
❑ File size restrictions
Current Windows-powered devices run a version of Windows CE called Pocket PC or Windows MobileSmartPhone. The Pocket PC form factor has a screen resolution of 240 by 320 pixels and features anumber of scaled-down desktop applications (like Pocket Word, Excel, Outlook, and Internet Explorer).The SmartPhone screen is considerably smaller at 176 by 220 pixels and is designed to function primarilyas a phone with some additional PDA features. An edition of the Pocket PC called the Pocket PC PhoneEdition has integrated features to support units with a built-in cell phone. All Pocket PC devices have atouch screen interface and many of the SmartPhone units are controlled only by the phone's keypad.These devices, and many non-Windows cell phone devices, may be used to view online web content.
Screen SizeThe most significant restriction for most mobile devices is the limited screen size. The Pocket PC andSmartPhone can view web content with some client-side scripting support and can also cache recentlyviewed content for offline viewing. Most web pages designed for desktop users can be viewed on thetiny screen but it requires the user to scroll extensively just to navigate a single page. Web-based reportscreated with Reporting Services are no exception. Most stock reports will likely work on a Pocket PCrunning Pocket Internet Explorer if they can be viewed in Internet Explorer on a desktop PC. The userexperience, however, is often like watching a large-screen movie through a keyhole.
156
Chapter 5
68787_ch05.qxp 26/03/2004 6:02 PM Page 156

To design reports optimized for the mobile user, reports must be simplified and designed for smallerpage size. Some dynamic reporting features (like drill-down and drill-through) may not be supported inall rendering formats. The page size of the Pocket PC screen is about 3.25 inches (8.25 cm) wide. Simplyscaling your mobile reports down to this width will resolve most screen resolution issues for mobile webusers. Keep the font sizes small and avoid clutter, large graphics, and unnecessary extra space.
Figure 5-48 illustrates a simple employee email directory that was created using a Table data region on anarrow page:
Figure 5-48
The sample report shown earlier has only two columns but it could easily have several. There is no needto restrict the functionality of your reports simply because users can't see all of the information at onetime. Just keep in mind that when the user navigates to the report, they will only see the informationbeginning in the top-left hand corner of the content. Design your reports with this in mind, placing themost important content near this entry point. Users can always scroll to find other information if thereport is intuitive and easy to navigate. This is yet another reason to use interactive reporting featureslike drill-down.
Keep the report content size to a minimum as well. Regardless of the device or computer used to viewreports, a dial-up user will always suffer a significant performance penalty from large reports. Avoidunnecessary use of graphics and filter the data whenever possible. The Pocket PC phone device pictured
157
Advanced Report Design
68787_ch05.qxp 26/03/2004 6:02 PM Page 157

in Figure 5-49 can connect to the Internet using either cell phone dial-up or a wireless networkconnection, but broadband wireless is typically only available in close proximity to a secure wirelessaccess point. At best, cellular dial-up connection speeds are 14400 to 19200 bps.
Figure 5-49
Offline SolutionsOne of the challenges that mobile users face on a number of levels is that they typically don't have theopportunity to remain continuously connected to a network or the Internet. Mobile devices are intendedto give us the ability to cut ties with the corporate network and work without wires or wirelessconnections. At times, report users might need to render reports on their desktops or have them pushedout to files or email via subscriptions. They can then view these reports offline on the mobile device.
Typically the best solution for off-line reporting is to save the report to a document. Pocket IE will store acached copy of an HTML report if it has been viewed online. In the case of a drill-down report, the entirereport content may not be stored in cache. When a cached drill-down report is viewed, exploringsections that have not been previously viewed may cause the device to try to connect and retrieve thenewly requested content. Overall, caching HTML is not a comprehensive solution.
The PDF format is by far the most reliable method for transporting a report document and keepingcontent consistently formatted. After the report has been exported to a PDF document it is a simple
158
Chapter 5
68787_ch05.qxp 26/03/2004 6:02 PM Page 158

matter to drop the file into the synchronization folder on the partnering desktop and let ActiveSyncautomatically copy it to the device the next time it is placed into its cradle. Unfortunately, AdobeAcrobat doesn't support the drill-down functionality in Reporting Services, so the report will need to bedesigned without dynamic drill-down and drill-through. The TIF image format also guarantees that thereport will look and print consistently as the file is sent from place to place, but one drawback of thisformat is that files will typically be much larger than in PDF format.
The Excel rendering format is also an excellent medium for small offline reports but Pocket Excel doesn'tsupport drill-down either. The Excel rendering format is supported only in Excel 2002 and later. Oneadvantage to using this format is that users can make modifications to their local copy of the reportcontent, and then sort and format the data. A user can also add calculations and other content to extendthe report for their own needs. See Figure 5-50:
Figure 5-50
SummaryYou have covered a lot of ground in this chapter. By using what is covered in the previous two chapters,you saw how many types of reports using data sources and filtering techniques that exposed differentdesign strategies are created.
159
Advanced Report Design
68787_ch05.qxp 26/03/2004 6:02 PM Page 159

Data regions let you repeat and group data in a section of the report. The table organizes repeated datainto specific rows and columns and provides inherent grouping capabilities with headers and footers.Using a list, you can achieve similar results with a little more formatting flexibility. With a subreport,you can essentially use a separately defined report as a data region and filter the data it contains withparameters and filters.
Drill-down and drill-through techniques optimize screen space and allow the user to interact with areport by expanding groupings of a table or list, or by using links to jump to an item, or bookmarkanother report. The document map provides a mini drill-down report in a separate frame that may beused to easily find headings and category labels and navigate to them in the report. Recursiverelationships are easy to manage and will produce multi-level groups using a single source of data.
Charts are a powerful tool used to express aggregated values in a series and in multiple dimensions.Several chart types are available for different types of data and presentation formats.
Advanced formatting and calculations can be performed by adding customized programming code toyour reports. This can be done by simply adding code in the Report Designer or by creating a compiled.NET assembly and adding a reference to the assembly in the report. Report properties can be set usingexpressions and program code to achieve conditional formatting.
Developing reports for mobile users is a relatively simple task, keeping in mind the limits andcapabilities of devices. Reports are designed to fit smaller screen sizes and may be optimized for onlineor disconnected scenarios. Mobile reporting opens vast opportunities for traveling information workersusing convenient wireless and synchronized devices.
160
Chapter 5
68787_ch05.qxp 26/03/2004 6:02 PM Page 160

Managing Reports Using the Report Manager
Now that the report authoring process is complete and reports have been deployed to the ReportServer, you need some way of managing how the reports are organized and controlling who hasaccess to them. For example, once the monthly sales report for your company has been added tothe Report Server database, you may want to schedule the report to run on the first of everymonth and ensure that only managers have access to it. Microsoft has included an applicationwith Reporting Services that provides access to all the functionality typically needed by a managerof the content in the Report Server database. This application is called Report Manager.
In this chapter, you'll learn to use the Report Manager for common Reporting Service tasks:
❑ Managing the organization of your reports and other resources
❑ Configuring report properties and adding needed resources
❑ Administrating users and implementing security policies
❑ Managing the scheduling and execution of a report
Introduction to the Report ManagerThe Report Manager application is a tool that enables you to perform tasks related to managingthe content in the Report Server database. This particular function is commonly referred to ascontent management. In Reporting Services, a Content Manager is a predefined role specifically formanaging reports and content. While the Content Manager role is important in administering aReporting Service platform, it might not be the same person who is responsible for administeringthe web server or SQL Server instances directly. The Report Manager application was built toprimarily support managing the content within the Report Server database rather than performingadministration of the server infrastructure.
666
68787_ch06.qxp 26/03/2004 6:02 PM Page 161

Chapter 6
162
What Is Report Management? An effective Reporting Service platform needs to support key content management tasks. Typically, aReport Server manager handles generating reports, organizing reports, and controlling access to them.The key Report Server management responsibilities include:
❑ Administrating the organization and identification of content
❑ Managing other resources needed by reports
❑ Configuring users and defining access permissions
❑ Managing the generation and deployment of reports
Let's see how the Report Manager addresses these content management responsibilities.
Understanding the Report ManagerThe Report Manager application resides on a web server and is accessed using a web browser. Itprovides an interface that's used to manage the contents of the Report Server database. The ReportManager is an ASP.NET Web application that acts as a graphical user interface for the Reporting ServicesWeb Service, which also happens to be an ASP.NET Web application. Figure 6-1 shows the relationshipbetween the Report Server exposed via the Reporting Services Web Service, the Report Managerapplication, and the browser running on your client machine:
Figure 6-1
You could even build your own version of the Report Manager by creating an application that worksagainst the same Reporting Services Web Service API. Choosing to do that might be a good opportunityto further understand the design and implementation of a service-based application architecture. Forexample, common tasks that were often performed in pieces using separate applications are nowachievable using a single, consolidated interface, without compromising the freedom required fordiverse and heterogeneous reporting. In the opinion of a noted professional, this capability is "really apiece of art in application architecture". However, the Report Manager is included with the ReportingServices package and is robust enough and suitable for most business needs.
Using the Report Manager, you have the ability to:
❑ Create folders and folder structures to act as containers for report collections
❑ Create and modify data sources, and add additional resources to the Report Server database
68787_ch06.qxp 26/03/2004 6:02 PM Page 162

❑ Implement an identity based security model, controlling access to Reporting Services resources
❑ Configure automated report generation and delivery
Most importantly, access to all reports and resources can be flexibly managed. For example, a user can beprovided access to reports that run on demand based on values supplied by that user, or they may berestricted to viewing static reports delivered by subscription. The task of managing content can also bebroken up among multiple roles, each responsible for managing the functions of different reports orother resources. Using the Report Manager, you can perform create, read, update, and delete operationson almost anything in the Report Server database.
The Report Manager InterfaceAlthough you've probably spent time surfing the web using your browser, you may not have used it as asophisticated application for managing content and resources in a Reporting Service database. Let's seethe interface in action.
For opening the Report Manager, you'll need to have Microsoft SQL Server Reporting Services installed,an updated Microsoft Internet Explorer browser running on your client machine, and permissions toaccess the Report Manager interface.
There are two ways of accessing the Report Manager. The first is by using the Start button on yoursystem taskbar. If Reporting Services has been installed on your local machine, click Start | Programs |Microsoft SQL Server | Reporting Services | Report Manger as in Figure 6-2:
Figure 6-2
163
Managing Reports Using Report Manager
68787_ch06.qxp 26/03/2004 6:02 PM Page 163

The menu item will open Internet Explorer and display the initial Report Manager screen, as seen inFigure 6-3:
Figure 6-3
Figure 6-3 also shows that the current user location is in the Home folder. This Home folder containsseveral folders, called sub folders or children. The SampleReports parent folder, for example, iscontained in the Home folder and could be considered a child of it. You'll take a closer look at the userinterface shortly.
The second way of getting to the Report Manager is by manually typing the Report Manager URL intothe address bar of your browser. If Reporting Services is not installed on your local machine, you mayfind this technique the easiest way to access the Report Manager. Open Internet Explorer, and type theURL of your Report Server in the address bar. By default, the address is:
http://<ServerName>/reports
Be sure to replace <ServerName> with the server hosting the Report Manager application. Duringinstallation, the name of the virtual directory containing the Report Manager can be changed from thedefault /reports to something that works better for you. If that's the case for your installation, you'llneed to specify that virtual directory name rather than /reports. You should see the same pagedisplayed in Internet Explorer as you saw when using the first technique to open the Report Manager.
Note that in the first technique used to access the interface, the Report Manager menu item has anInternet Explorer icon. It is, in fact, a shortcut to the same address you typed into the address bar usingthe second method. Some users add shortcuts to the desktop or Quick Launch toolbar for convenience.
One of the reasons the Report Manager application is so effective is because it leverages capabilities ofthe client browser used to access it. Specifically, working with the Report Manager requires MicrosoftInternet Explorer 6.0 with Service Pack 1 (SP1) or Internet Explorer 5.5 with SP2 as the browser client. Asan ASP.NET application, the Report Manager also makes use of client-side scripting to supportfunctionality, so you'll also need to have scripting enabled.
164
Chapter 6
68787_ch06.qxp 26/03/2004 6:02 PM Page 164

To check the script security settings for your browser, select Tools | Internet Options | Security tab. In theWeb Content Zone window, be sure that the Local intranet zone is selected. Below that window, there's anarea called Security level for this zone. Click the Custom Level button to open the Security Settings dialogbox, where you can view your current script settings. Scroll down to the section called Scripting to seewhether Active scripting is enabled as shown in Figure 6-4:
Figure 6-4
Although most browsers are already configured to support scripting, some organizations have scriptingdisabled as part of company policy. If so, that part of the security policy may need to be revisited forusers who are responsible for using and working with the Report Manager.
Navigating the Report Manager InterfaceThe Report Manager uses the concept and hierarchical structure of folders extensively. In fact, when youopen the Report Manager, your initial view is of the Home folder. As you move between folders, forms,and items, it's important to be aware of where you are in that hierarchical structure. To help you to movearound in the Report Manager, let's take a look at the various navigational controls available.
Navigation ToolsSeveral navigational methods have been incorporated into the Report Manager interface. Which onesyou see and which options are available vary depending on where in the folder structure you are andwhat permissions you've been granted. For example, if a user doesn't have permission to view certainreports or upload resources to folders, they won't be given access to the controls needed to perform
165
Managing Reports Using Report Manager
68787_ch06.qxp 26/03/2004 6:02 PM Page 165

those actions. Let's take a tour of the Report Manager interface by taking a look at the navigationalelements and talk about a couple of global settings.
Breadcrumb TrailFrequently referred to as breadcrumb trail, this control displays links to each level back up the file or infolder structure. It's in the top left corner of the browser window. Figure 6-5 shows an example:
Figure 6-5
In this figure, you are currently viewing the Employee_List_Operations report in the Staff_Listings folder,which is contained in the Professional_SQL_Reporting_Services folder, which in turn is one level belowthe top level Home folder. In XML terms, the Home folder could be considered the root node of thestructure and everything is descendant from it. Note the hand icon indicating a hyperlink back up to theStaff_Listings folder.
This navigation tool is not always available, for example, when viewing certain forms. The breadcrumbtrail is a quick way to navigate back to the parent folder when viewing an item's properties pages.
Tabs and Options ToolbarTabs are defined by blue and orange lines across the Report Manager interface, just below thebreadcrumb trail. Available, but not active, tabs are displayed in blue. Active tabs are orange in color andflows into the orange line above the current view. The orange line borders the top of a toolbar thatdisplays option buttons for the current view. Figure 6-6 shows an options toolbar for the Subscriptionstab and a sample option button:
Figure 6-6
In Figure 6-6, two option buttons for creating new subscriptions are displayed on the Subscriptions tab.Like tabs, the option buttons available to a user will vary depending on the permissions granted to thatuser on that item.
Local MenuUnder the Properties tab, local links may be available along the left side of the page. These links are usedto access the different property pages for an item. The links are shown in Figure 6-7:
166
Chapter 6
68787_ch06.qxp 26/03/2004 6:02 PM Page 166

Figure 6-7
You'll be taking a closer look at each of these property pages and how they're used throughout thischapter.
Global Toolbar and Details ButtonThe global toolbar is available on every page in the Report Manager. It's located in the top right corner ofthe page, displayed as a series of links with a blue background to separate them from other items on thepage. There are links to the Home folder, user-specific report subscriptions called My Subscriptions, globalSite Settings, and Report Manager Help.
The Show Details button is one of those items that get more useful as you get more comfortable workingwith the Report Manager. The button text toggles between Show Details and Hide Details, depending onyour current view as in Figure 6-8:
Figure 6-8
When viewing folder contents in Detail view, for example, you have direct access to Move and Deleteoption buttons to work with folder items as seen in Figure 6-9:
Figure 6-9
Clicking on the Properties link, seen to the left in Figure 6-9, brings you directly to the Properties tab forthat item. When the details are hidden, you must first select the item and then go to the Propertiestab—so you save a step with details displayed (great for frequent users).
167
Managing Reports Using Report Manager
68787_ch06.qxp 26/03/2004 6:02 PM Page 167

Icons beneath the Type column head indicate the type of item listed. There are icons for:
❑ Folder
❑ Report
❑ Linked report
❑ Resource
❑ Subscription
❑ Data-driven subscription
Hold the cursor over the icon to see a descriptive tool tip. Clicking the icon will perform a default actionon that item. For example, clicking the folder icon will open the folder, clicking the properties icon willaccess the properties pages, and clicking the report icon will open the report.
Searching for Folders and ReportsUse the search function available in the upper-right corner of the Report Manager interface to search foritems. Because items (folders, reports, resources, and data sources) are stored in the Report Serverdatabase, doing a search on the file system using Windows Explorer won't return the desired results. TheReport Manager search function searches the database for items matching your search keywords,whether searching by the item name or description.
Search results are only returned for items that you have permission to access, making the tool veryuseful even for end users. For example, Report Server allows storage of incremental snapshot reports forarchival purposes. A single report design can be a source of many report items. In the Report Manager,there literally may be hundreds of available reports in a typical organization. The search function returnsa filtered report set based on user permissions.
To search within a report, you can use the report toolbar displayed above the generated report in theHTML Viewer. To read more about viewing reports, see the section on Viewing, Executing, and SchedulingReports later in this chapter.
The Report Manager HelpThe Help link is always available to you from within the Report Manager. The link is in the far upper-right corner of the browser window. The Report Manager Help is a separate help application thatprovides information about every form in the Report Manager and is a valuable resource.
You'll be using those navigation tools quite a bit as you explore Report Manager. Let's start the rest ofour tour by taking a look at what's behind the Site Settings link.
About System Site SettingsThe Site Settings form is accessed using the Site Settings link in the global links area, in the top-rightcorner of the Report Manager interface. This form is used to configure default settings for the site andenable different features of the Report Manager. Usually, you won't have access to this form unlessyou're a member of the System Administrator role. Figure 6-10 shows the Site Settings form:
168
Chapter 6
68787_ch06.qxp 26/03/2004 6:02 PM Page 168

Figure 6-10
Using this form, you can change the name that's displayed in the top left corner of every page in theReport Manager. My Reports can be enabled here as you'll read about shortly. Let's briefly cover the othermain properties on this page.
Report History Default SettingsThis property defines the number of previously run reports to keep archived. Although this sets thedefault report history value for all reports, this value can be overridden by individual reports. You'llread more about configuring report histories in the Creating a Report History section later in this chapter.
Report Execution TimeoutExecution timeout is the length of time the Report Server will continue attempting to execute a report.When the timeout value elapses, execution will stop and rendering or delivery of the report will notoccur. This value can be overridden in individual reports.
Report LoggingBy default, Report Server logs information about report execution. The report log contains values suchas delivery format, the parameters used, and server processing time. The report log is not viewable in
169
Managing Reports Using Report Manager
68787_ch06.qxp 26/03/2004 6:02 PM Page 169

the Report Manager; a SQL Server DTS package is used to obtain values from the log. For moreinformation on viewing report logs, search for Report Execution Log in Reporting Services Books Online.
About My ReportsMy Reports is a folder that provides a central location for the management of user-specific content andsubscriptions. Rather than having to navigate through the public folders for regularly generated andreferenced reports, My Reports provides a self-managed area for users to place and maintain theircontent, similar to My Documents. The similarity of My Reports to My Documents in both name andfunction is not an accident. My Documents is a concept and tool almost universally accepted by users,and My Reports is a variation of that successful theme. Building on the experience and familiarity a userhas with an existing environment or feature is a good tip for feature designers and architects.
To enable My Reports, you need permission for the Manage the security settings of the Report Server task.The steps to enable this are as follows:
1. From the Home directory, click the Site Settings link in the global navigation bar in the top rightcorner of the browser window. You'll see the area displayed in Figure 6-11:
Figure 6-11
2. Check the Enable My Reports checkbox. Optionally, you can choose a role definition used togroup users who have access to their My Reports. Microsoft created the My Reports role for thispurpose, and it is the default selection. Leave that setting as My Reports, and click Apply. Thenreturn to the Home folder view. You'll see the new My Reports folder added to the Home foldercontents.
My Reports is a folder that allows users to manage their own content. Enabling My Reports lets userscreate and delete their own folders and reports and create personalized linked reports. Users don't haveaccess to the My Reports folders of other users; only Report Server administrators can do that. Using MyReports, you can upload reports and other resources as well as publish reports you've created using theReport Designer.
It's important to keep in mind that there's a My Reports folder, and a MyReports role. The My Reports roledefines permissions the user has in their My Reports folder. System administrators can change thepermission set for all roles including My Reports. Because of that, your capabilities may be different thanthose just described. It's a good practice to reserve a specific role for accessing My Reports to help ensurea consistent user experience when using it. It's easy to create a shortcut to your My Reports folder,creating a portal to the reports you frequently need to work with. Functionally, the My Reports folderprovides a secure area for users who need to manage and view reports as part of their regular workresponsibilities.
Once a user has added items to their My Reports folder, it's important to understand the different choicesavailable if tyou need to revoke access. That topic is covered in the Revoking Access to My Reports sectionlater in this chapter.
170
Chapter 6
68787_ch06.qxp 26/03/2004 6:02 PM Page 170

Working with Folders and ReportsFolders represent the structure and relationship of content in the Report Server database. Folders arecontainers for items and other folders. Each folder is considered the parent of the content it contains, anditems in that folder inherit properties of that parent. Individual folder and item properties can be set byoverriding the properties inherited from the parent folder.
Working with folders requires permission to tasks that are used to support folder management. If yourReport Manager application hasn't been modified since installation, the local system administratorautomatically has rights to perform actions such as create and delete folders. If new roles have beencreated, the role you belong to will need the same task permissions in order to manage folders.
Creating New FoldersIn Report Manager, folders are created in place, meaning it's necessary to navigate to a folder beforecreating a new folder inside it. For example, to create a new folder within My Reports, you have to be inyour My Reports folder. Once the folder is created, you can set the properties of that new folder. Home isalso a folder, so you can create folders there as well. As an example, to create a new folder within MyReports, follow these steps:
1. With Report Manager open the Home folder and click the My Reports folder to open it.
2. Be sure you're viewing the Contents tab.
3. Click the New Folder button on the option button bar. You'll be brought to the New Folder form.Verify that Create a new folder in My Reports is the action displayed at the top of the form asshown in Figure 6-12:
Figure 6-12
4. Type a name for your folder. A folder name can contain spaces, but because the name appears aspart of the URL used to access the folder, you can't use characters that are reserved for URLencoding (such as @ & $ ? , ; : + * / % = < >). For testing and exploring purposes, Samples andDemonstrations works well.
5. Type a description for your new folder. This field is optional but the item description issearchable. It's good to use a description containing keywords that helps to search for items. Thedescription used for this chapter is Sample reports and other items for demonstrating ReportManager.
6. Hide in list view refers to making the folder hidden when viewing the parent folder contents inthe default view of its Contents tab. Note that when content details are listed by clicking theShow Details button, the folder will still be visible. Leave that checkbox cleared for now.
7. Click OK. The folder will be created, and you'll see it in the Contents tab of your My Reportsfolder. Figure 6-13 shows an example:
171
Managing Reports Using Report Manager
68787_ch06.qxp 26/03/2004 6:02 PM Page 171

Figure 6-13
Notice the icon indicating a new item and how the folder description displays underneath the newfolder link. Let's see how this works.
Your new folder inherits the security of the parent My Reports folder. By changing folder permissions,you can override the parent folder settings and define your own values. The changed values will in turnbe applied to the contents of that folder. This application of parent settings continues to the deepest levelof the folder structure. The use of configuration settings that are inherited by child nodes is usedextensively in .NET.
Creating folders and modifying their security settings can degrade into an unplanned, ad hoccombination of configuration settings for different folders and users, which can be difficult to manageand maintain. Making the My Reports folder available to users allows them to manage settings in thecontext of their own My Reports folder, rather than modifying individual folder properties to grant therequired permissions.
Moving Items into a FolderItems can be added to folders and moved between folders. When you add an item, you've seen how itinherits the security properties of the new parent. When you move an item, its properties and contentsgo with it to the new location. You will need permission to manage the item type you're working with, toadd or move items to a folder. Specifically, those tasks include Manage folders, Manage reports, andManage data sources. For an example of how to add a report to a folder, follow these steps:
1. Open Report Manager to the Home folder.
2. Click the link to your My Reports folder to view its contents.
3. The Samples and Demonstrations folder you created earlier is there. Click the link to view itscontents.
4. Click the Upload File button on the options toolbar. This will open the Upload File form as shownin Figure 6-14:
Figure 6-14
172
Chapter 6
68787_ch06.qxp 26/03/2004 6:02 PM Page 172

5. Click the Browse button to open the Choose File dialog box. Navigate to the directory on yourfile system containing the SQL Server Reporting Services sample reports. By default, the samplereports are located on the installed machine at:
C:\Program Files\Microsoft SQL Server\MSSQL\Reporting Services\Samples\Reports
6. Select the Company Sales.rdl file as shown in Figure 6-15:
Figure 6-15
7. Enure that the Company Sales.rdl file is listed in the File name field of the form, and click Open.
8. Change the name to Company Sales Report. This changes the name displayed in ReportManager but does not change the underlying report. Note that you can choose to overwrite theitem if it's already in the folder. For this example, leave that checkbox cleared.
9. Click the OK button on the Report Manager Upload File form to add the report to your folder.You'll see the Company Sales Report item added to the Samples and Demonstrations folder, withthe Report and New icons alongside.
10. When you click the link to view your new report, unfortunately, you'll see the kind of messagedisplayed in Figure 6-16:
Figure 6-16
Adding a report to a folder this way is functionally the same as a report author publishing the reportusing Report Designer. When a report author designs a report, a data source is configured to retrieve thedesired dataset for the report-rendering engine to work with. Without the data source, the report is
173
Managing Reports Using Report Manager
68787_ch06.qxp 26/03/2004 6:02 PM Page 173

unable to retrieve, process, or display any data. In that case, you'll need to go in and configure someproperties for the report to function correctly.
You can set properties for reports in several categories. Some settings are specific to reports; others areinherited from the parent folder and overridden where necessary. For example in the General Propertiesof a report, you can create a new linked report based on the current report definition. Figure 6-17 showsan example of the General Properties page for a report:
Figure 6-17
In the General Properties window, you can view metadata about the report such as the Creation Date of thereport and the user who last modified it. Using the text boxes, you can change the name or descriptionof the report. Buttons along the bottom of the form let you apply changes, create a linked report, moveor delete this report. Linked reports are extensions of an existing report definition; you'll read moreabout linked reports in the Viewing, Executing, and Scheduling Reports section later in this chapter.
In the rest of the chapter, you'll read about property settings and actions that can be performed on boththe system and items contained in the Report Server. Let's start addressing that report problem by takinga look at data sources.
Working with Data SourcesA data source represents what the report definition uses to connect with the Report Server database toretrieve data from it. Data sources are generally created by the report author and added to the database
174
Chapter 6
68787_ch06.qxp 26/03/2004 6:02 PM Page 174

content along with the report definition. At times, it may be necessary to adjust data source properties.When a database gets moved to a new machine, you may need to update data sources referencing thatdatabase to point them at the new machine. Data sources are used by reports and by data-drivensubscriptions. There are two types of data sources:
❑ Report-specific (or private) data source: This is created for use by a single report definition andis embedded within the report definition. Since private data sources are part of the reportdefinition file (.rdl), modifications to the data source properties must be made using theReport Designer. When making changes in the Report Designer, the author can choose tooverwrite the existing data source property values in the Report Server database. In somecircumstances, a report may display values returned as multiple datasets. When that happens,the property settings for each data source are contained in the report definition.
❑ Shared data sources: These items are separate from report definitions and can also be managedusing Report Manager. Shared data sources are intended for use by reports and subscriptionsthat access similar datasets, giving you the ability to configure and manage a single data sourcefor use by multiple reports. Note that the changes you make to a shared data source usingReport Manager overwrite the data source properties previously held in the Report Serverdatabase.
Configuring Shared Data SourcesShared data sources are items that can be managed from within Report Manager. You can create, delete,move, and update shared data sources. In general, it's better to rely on shared data sources rather thanprivate ones that are hardcoded in the report design. Deployment is easier with shared data sources, andmultiple reports benefit from the centralized maintenance of their data sources. For example, if a datasource changes, only the required properties need to be changed. There's no need to worry aboutwhether individual, dependent reports need to be updated and re-tested. The updating andmanagement is all performed at a single data source location rather than within multiple reports.
The next sample exercise assumes you've completed the previous examples in this chapter, and that youhave permission to manage data sources. The custom data source properties specified here are for amachine running Microsoft SQL Server in the context of the system using mixed mode security.Following are the steps to configure a shared data source:
1. From your My Reports folder, click the Samples and Demonstrations folder to open it. The reportyou uploaded earlier should be there.
2. Click the Company Sales Report. You'll be brought to the View tab for the report, where you'll seethe error displayed earlier.
3. Click the Properties tab.
4. Click the Data Source link in the left navigation area. You'll see the Data Sources properties page,and the error indicating that shared data source reference is no longer valid. The Company Salesreport is configured to use a data source called AdventureWorks, and the selected radio buttonshows that this data source is A shared data source.
5. Click the radio button to select A custom data source. The shared data source information greysout while the custom data source fields become enabled.
175
Managing Reports Using Report Manager
68787_ch06.qxp 26/03/2004 6:02 PM Page 175

6. For the Connection Type drop-down combo box, select Microsoft SQL Server. SQL Server, SQLServer Analysis Services, Oracle, OLE DB, and ODBC data providers are all available by default.
7. Type an OLE DB connection string to the AdventureWorks2000 database location in theConnection String field. It's not a good practice to include credential information in theconnection string, doing so overrides the values provided in the credentials section below. Asample connection string is as follows:
data source=(local);persist security info=False;initial catalog=AdventureWorks2000
8. In the Connect Using section, select Credentials stored securely in the Report Server. Enter the userID and password you use to log into your system.
9. Click the Use as Windows credentials when connecting to the data source checkbox to select it.Figure 6-18 shows a completed data source Properties page:
Figure 6-18
10. Click the Apply button to apply your changes.
11. Click the View tab. The report will execute, and in a few moments it's displayed as HTML inyour browser. Figure 6-19 shows the rendered report:
176
Chapter 6
68787_ch06.qxp 26/03/2004 6:02 PM Page 176

Figure 6-19
A custom data source can be configured for a report, overriding the previously published values. In theprevious example, you pointed the report away from a shared data source to one that was customconfigured. Creating a shared data source uses exactly the same process, except you begin by clickingthe New Data Source button on the options toolbar when viewing the contents of a folder. Configuringthe credentials section of the form can be confusing, so let's take a closer look at that.
Data Source CredentialsSQL Server has very effective security mechanisms in place to control access to data. When a report orsubscription attempts to retrieve data from the SQL data store through a configured data source,authentication is performed to ensure that whoever is attempting to access the data has permission to doso. If your SQL Server instance is configured to use both SQL Server and Integrated Windowsauthentication, there are four ways that Reporting Services can handle authentication to SQL Server:
❑ NTLM
❑ Basic
❑ Kerberos
❑ Passport
In a way, how Reporting Services handles passing authentication credentials depends on which device isrequesting the report. When the Report Server ultimately connects to SQL Server to retrieve data,authorization is performed on the credentials it provides. Those credentials can be obtained from theuser when the report is run or can be values previously stored in the Report Server database.
Credentials Supplied by the UserBy selecting this choice, the user will be prompted for a user name and password each time they run thereport. The credentials can be used to identify the user as a Windows account holder, or passed directly
177
Managing Reports Using Report Manager
68787_ch06.qxp 26/03/2004 6:02 PM Page 177
to SQL Server for it to perform its own authentication and authorization. You'll need to instruct yourusers whether to provide Windows or SQL credentials, depending on whether your SQL Server isconfigured for Integrated Windows or SQL Server security. The Use as Windows credentials checkboxindicates whether Reporting Services should use the user-provided values as Windows accountcredentials or not.
Credentials Stored SecurelyYou can choose to have the user credentials stored in the Report Server database for use when requiredlater. The values are stored in encrypted form in the database. Storing credentials in the Report Server isrequired for reports that are run on a schedule or are made available through a subscription.
It's possible to configure the security policy for an item so only certain role members can perform certainactions. This applies to all items in the Report Server database, including data sources. Let's see how youcan control access to the report and data source contained in your folder.
Configuring Users and PermissionsReport Manager is an effective tool for managing access to Report Server content. Although configuringReporting Services security is straightforward, it's not to be taken lightly. It's important to understandthe effects of your decisions.
There are a number of topics to cover in this section, so here's a map of where we are going:
❑ After looking at an overview of the Report Manager security policy, you'll read about role-basedsecurity that is the foundation of how roles and tasks are implemented in Report Manager.
❑ You'll look at the Report Manager predefined roles. Each role is made up of a particularpermission set, which defines the role definition. You'll read about how to create your own roledefinition.
❑ You'll look at assigning users to roles and how to create your own role assignments.
About Report Manager SecuritySecurity is based on two essential elements:
❑ Identifying who or what is attempting to perform an action
❑ Determining if that user has permission to perform that action on the resource
For example, to view the Report Manager you must first log in to the system where Report Manager isrunning, and then you must have the correct permissions to view the Report Manager application. Bydefault, anyone belonging to the Everyone group can view Report Manager, so the application isavailable to a wide group of users. Regardless of this, you still have to log in and be authenticated asbelonging to that group.
Reporting Services uses a role-based security model, which can be implemented and managed throughthe Report Manager interface.
178
Chapter 6
68787_ch06.qxp 26/03/2004 6:02 PM Page 178

In Report Manager, security is addressed at two levels:
❑ System-level: This type of security addresses the tasks required to administrate the ReportServer globally
❑ Item-level: This type of security addresses the tasks that can be performed on an individualitem in the Report Server database
If you've worked with configuring users and groups in SQL Server, you're already familiar with addingusers and groups to role definitions. Let's take a closer look at how to use it in Report Manager.
Understanding Role-Based SecurityRole-based security is a security model that's based on the identity of the user who's attempting toaccess a resource. In a Windows environment, the user is identified by their Windows account. Users canbe identified using other techniques, however. For example, user-provided values can be used toperform a database lookup from a web or Windows application.
Authentication is determining who is attempting to access a resource; authorization is determiningwhether they have permission to perform the requested action on that resource.
Once the users have been identified (authenticated), it needs to be determined if they are authorized toaccess the resource. This is done by identifying which roles the users have been placed in (rolemembership). For example, administrators have more permissions than users. Ultimately, the securitysettings of the resource are checked to see if the user has permission to perform that particular action.
Identifying the user is the foundation of a role-based security model. In Reporting Services, users areidentified by their Windows account. The Reporting Services application itself does not authenticate theuser. To use role-based security in Report Manager, you create task-based roles and then add Windowsusers to your defined roles. This is considered to be the best model to use when defining the securityarchitecture for a complex application. For example, don't add overhead to your application by having ithandle user authentication. Let the user be identified outside your application, using any one of themany mechanisms available. Once authentication is handled, then authorization becomes yourapplication's responsibility. Your application is the best judge of what permissions to grant to the user,and is typically also the best place to manage those permissions.
In Report Manager, the role definition defines the permission set for each user that belongs to it. A usercan belong to multiple roles, and those role permissions can be different for different items. For example,a user who has update permissions for one resource may have read-only permissions for anotherresource.
Role-based security works well in the case of Reporting Services, because it's both flexible and scalablewhile still being relatively simple to manage.
Using Report Manager Default SecurityReporting Services installs with a default set of permissions in place. These permissions provide theinitial settings, so you can go in and start defining the implementation of your own security policy.Called Default security, it's configured so that users who belong to the local Administrator group aregiven System Administrator role permissions and Windows users belonging to the Everyone group aregiven browser role permissions.
179
Managing Reports Using Report Manager
68787_ch06.qxp 26/03/2004 6:02 PM Page 179

You'll need to edit the default security settings to support other Windows users and groups dependingon the permissions needed for users to accomplish their tasks. To better understand how security isconfigured in Reporting Services, let's take a closer look at what roles are.
Understanding RolesOnce Reporting Services is installed, you'll want to go in and change the default security configurationto support your specific access requirements. For example, you may want to create new roles, add usersto those roles, or change security settings to modify access to a particular item.
At the beginning of this chapter, you read about the role of a content manager in the context of areporting application. The content manager role is responsible for organizing the report folder structureand overseeing the generation of reports. To perform that role, a content manager has the permissions tocreate, update, and delete specific content items. The Content Manager role in Report Manager has beengiven the permissions to perform those tasks. A role might be considered a functional job description,with each role being granted the rights it needs to carry out its particular tasks. In addition to ContentManager, the Report Manager application contains a number of other predefined roles.
Understanding TasksIn Report Server, roles are defined by the permissions they have been granted. To make managingpermission sets easier, they've been grouped into subsets called tasks. Combinations of task permissionsdefine the overall permission set for a role.
A task is an action that can be performed by a user or administrator. In terms of security, tasks arecomprised of the permissions needed to perform that task. The tasks defined in Report Manager cannotbe modified and you cannot create your own.
Tasks are essentially combinations of three elements:
❑ A domain user account or group that defines the user context
❑ The role the user belongs to that defines the allowed tasks
❑ Specific item properties that define whether or not permission is granted
Permissions are defined as rights to perform specific create, read, update, or delete actions on either theglobal Report Server system or on an individual item in the Report Server database.
A Report Server item can be one of four things:
❑ Folder
❑ Report
❑ Resource
❑ Data source
Tasks are a combination of permissions granted to perform actions on each of those items. Folders act ascontainers for other items. Because of this, everything contained within a folder inherits the permissions
180
Chapter 6
68787_ch06.qxp 26/03/2004 6:02 PM Page 180

of that folder. Remember that an individual item can have its own security properties set differently,which would then override the settings of the parent folder.
System Tasks and Item TasksIn Report Manager, a distinction is made between two groups of actions that can be performed: actionsperformed on the system and actions performed on items. They are referred to as system-level and item-level tasks. System-level tasks are actions that apply to the Reporting Services system as a whole, whileitem-level tasks are actions that can be performed on items such as folders and reports that are containedin the Report Server database. The two groups essentially form separate security zones, each containingdifferent permission sets. Typically, system tasks are performed by administrators and item tasks areperformed by users. Figure 6-20 shows a sample Edit System Role page with the system-level tasks andtheir descriptions:
Figure 6-20
Understanding the Predefined RolesBy default, Report Manager contains definitions for six roles that act as the basis for implementingsecurity policies in Reporting Services. You are free to modify the default role definitions, and you'll seelater how to create your own roles. Continuing with the concept of grouping tasks into system-level anditem-level tasks, Reporting Services has system-level and item-level roles. Different forms are used toconfigure each type, which are each accessed from the Site Settings page. Figure 6-21 shows the links asthey appear at the bottom of the Site Settings page:
Figure 6-21
181
Managing Reports Using Report Manager
68787_ch06.qxp 26/03/2004 6:02 PM Page 181

In each of the following sections, the displayed task permissions were taken from the Edit Role form ofeach role. Figure 6-22 shows a complete Edit Role form, displaying the default definition of the ContentManager item-level role:
Figure 6-22
First let's look at the predefined system-level roles and then the item-level roles.
System AdministratorThe system-level System Administrator role is for Report Server users who are responsible foradministrating the application but might not be involved in the process of managing the actual contentin the Report Server database. It's a role used by Report Manager default security, and role membersinclude Windows accounts that are members of the Administrator group. Figure 6-23 shows thepermissions granted to this role:
Figure 6-23
182
Chapter 6
68787_ch06.qxp 26/03/2004 6:02 PM Page 182

Notice how the System Administrator is not granted the View report server properties or View sharedschedules task permissions. Permission to view Report Server properties is granted in the Manage ReportServer properties task, and permission to view shared schedules is granted in the Manage sharedschedules task. This is an example of how task permissions can overlap and how important it is tocarefully consider modifying existing role permissions.
System UserSystem User is a system-level role, used for providing minimum access to Report Server functionality. Itis one of the roles used in the Report Server default security configuration, where user accountsbelonging to the Windows Everyone role are added to this role. Figure 6-24 shows the permissionsgranted to the System User role:
Figure 6-24
Note that although the System User role has access to Report Server properties and shared schedules,this role has read-only permissions on both.
Report Manager installs with four predefined item-level roles. Let's look at them in detail.
Content ManagerJust as it sounds, Content Manager is the primary role meant for managers of content held in the ReportServer database; it is an item-level role. Figure 6-25 shows the permissions granted to this role:
Figure 6-25
183
Managing Reports Using Report Manager
68787_ch06.qxp 26/03/2004 6:03 PM Page 183

PublisherPublisher consists of a subset of the Content Manager permissions, allowing report authors to publishtheir reports to the Reporting Services database and manage the resources required by those reports.This is a good example of segmenting tasks and responsibilities to allow delegation. In this case, tasksrelated to publishing reports and uploading resources have been delegated without compromisingaccess to security settings or user subscriptions. Figure 6-26 shows the permissions granted to this role:
Figure 6-26
My ReportsMy Reports is the role for granting permissions to the My Reports folder, and defines the actions the useris allowed to perform on items within it. Figure 6-27 shows the permissions granted to this role:
Figure 6-27
The Browser RoleThe Browser role is the most restrictive of the predefined roles. It's applied when you want to restrict auser to a minimum level of Report Server functionality such as viewing reports. It's a good idea toinitially add new users to this role and add to their permissions as required, rather than dumping usersinto an "anything goes" role. A good security practice is called the principle of least privilege. It states thatusers should be granted the least privilege required to accomplish their tasks. Applying this principle is
184
Chapter 6
68787_ch06.qxp 26/03/2004 6:03 PM Page 184

not only helpful in mitigating security threats, but it's also helpful in preventing users from wreakingunintentional havoc on the system. Figure 6-28 shows the permissions granted to the Browser role:
Figure 6-28
Creating a New Role DefinitionGenerally, you don't need to create many new roles. Having too many roles defined can quickly becomea management headache, particularly if you start modifying role definitions that are already in use. Witha complex folder and report structure, it can be difficult to tell what effects your changes will have.
To create a new role definition, you'll need to have permission to manage system security policy. Anexample of the steps required to create a new role definition are as follows:
1. In Report Manager, click the Site Settings link. It's a global link in the upper-right corner of thepage.
2. Click the Configure item-level role definitions link. Note that you also have the ability to configuresystem-level roles.
3. Click the New Role button on the options toolbar. You'll be brought to the New Role form.
4. Give your new role the name, Demo User. It's a good practice to use a name that matches the jobfunction or title for the group you're creating. The name can include spaces and specialcharacters, though it can't be more than 256 characters long.
5. Type Role to demonstrate item-level security for the description. The description should make iteasy for administrators who create role assignments to understand what purpose the role isintended for. Ideally, the description should describe the role responsibilities. Providing acomplete description keeps an administrator from having to open a role definition just to figureout what task permissions it has.
6. Check the View folders, View reports, and View resources checkboxes. Figure 6-29 shows thecompleted New Role form:
185
Managing Reports Using Report Manager
68787_ch06.qxp 26/03/2004 6:03 PM Page 185

Figure 6-29
7. Click OK to save the new role into the Report Server database. You'll see the new role and itsdescription listed on the Item-Level Roles page.
The Demo User role is now ready for user or group accounts to be added. You can go back in andmodify the task permissions, if needed, but have your changes ironed out before adding users.Remember that many management headaches have started with modifying a role after users havealready begun using it. If desired, you can also delete the role by clicking the Delete button on the EditRole form. The Copy button will open a new Edit Role form with the same task permissions alreadyselected. This way, you can easily extend an existing role to create a new one.
Creating a new role definition is straightforward, but it's important to be careful and not go overboard.Note how changing task permissions affects users. When you remove tasks or delete a role entirely, thechange applies to every item in every folder in the Report Server database. Things can get tricky, becausea role can be associated with a single item as well as an upper-level folder and all its children. There isn'tany way to easily view how the web of user roles and permissions affect their access to different reportsand folders, so use care when modifying existing role definitions. Start with an existing definition, andextend task permissions only as required.
Users are added to roles through role assignments.
Understanding Role AssignmentsUltimately, access to the Report Server content is controlled by role assignments. Role assignments arecreated when you add a Windows domain account to a role definition. Remember that Report Serverdoesn't perform its own authentication; it relies on Windows to perform that function. Report Manageris used to map Windows users and groups to Report Manager role definitions. As you've seen, each roleis a unique collection of permissions. When a user attempts to perform an action, Report Server checks
186
Chapter 6
68787_ch06.qxp 26/03/2004 6:03 PM Page 186

the roles that the user is a member of to determine whether to allow the action. Figure 6-30 illustrateshow the Report Server permission stack maps specific domain users or groups to finally determineaccess permission on an item:
Figure 6-30
Reporting Services creates its own role assignments when it implements the default security policy uponinstallation. Default security allows members of the local Administrators group to performadministrative actions on the Report Server database, while restricting users in the Everyone group toviewing items only.
Creating Role AssignmentsCreating role assignments is how you bring life to your role definitions. Role assignments are created inplace, meaning that you must be looking at the properties for a specific item before you can make a roleassignment for it. An example of how to create a new role assignment is as follows:
1. Open Report Manager and navigate to your Samples and Demonstrations folder in My Reports.
2. Be sure you're viewing the Contents tab of the Samples and Demonstrations folder. On theOptions toolbar, click the Show Details button. You'll see the contents listed as in Figure 6-31:
Figure 6-31
3. Click the Properties icon for the Company Sales Report. The icon is in the Edit column on the leftside of the page. Click on it to go to the Properties page of the report.
187
Managing Reports Using Report Manager
68787_ch06.qxp 26/03/2004 6:03 PM Page 187

4. In the left navigation area, click the Security link to view the security properties page for thereport as in Figure 6-32:
Figure 6-32
5. On the Options toolbar, click the Edit Item Security button. You'll see a message box display asecurity message as seen in Figure 6-33:
Figure 6-33
6. Click OK on the message box. The page view changes and has new buttons on the optionstoolbar as shown in Figure 6-34:
Figure 6-34
7. Click the New Role Assignment button to view the New Role Assignment form.
8. In the Group or user name field, type the username you log in with.
9. Locate the Demo User role, and click the checkbox next to it. This will add you as a user to theDemo User role, and you now have the permissions of that role on the Company Sales Reportitem. This role permission set is in addition to the one you are currently using as you performthis exercise. Note that you can click a role to view its task permissions. Figure 6-35 shows acompleted form:
188
Chapter 6
68787_ch06.qxp 26/03/2004 6:03 PM Page 188

Figure 6-35
10. Click OK to apply the new assignment.
Note that you can easily revert back to the security settings of the parent folder by clicking the Revert toParent Security button. That will cause the security settings for the Company Sales Report to be set backto mirror those of the parent folder. Subfolders inherit the security characteristics of their parent, so thesecurity settings of the Home folder effectively establish the default settings for the rest of the tree unlessover-ridden by a child in the structure. For example, the My Reports folder has different permissionsettings than the Home folder. It's a good practice to grant limited permissions on the Home folderbecause of the inheritance of security settings down the folder hierarchy. It's also a good idea to bear inmind that when modifying the role assignments for a folder, your new settings can affect items muchfurther down in the folder hierarchy.
You can add multiple users and groups to a role assignment, though you can add a specific namedgroup or user to a role only once. When accessing an item, the task permissions in allowed roles arecombined for a user. For example, let's say that Mary belongs to the domain Department Managers andthat both Mary and Department Managers' rights have been assigned to a folder, then she'll have thecombined permissions of both Mary and Department Managers for that folder (and its contents).
Role definitions are applied across the system. Modifying them can have unforeseen consequencesunless careful consideration is given to the effects of that change. If a user needs certain permissions onan item in the Report Server database, it may be better to address the issue at the item level rather thanthe role level. Modifying the role definition affects all assignments to that role and in every location thatthe role has access.
Creating roles and role assignments aren't an everyday task, but it's important to know what happenswhen you do make or modify one. Let's look at a couple of other important security considerations.
System Security and Network ConsiderationsThe best-practices approach to implementing a Reporting Services security policy is to use a smallnumber of role definitions, assign users to the roles, and make changes to the security policy on an as-
189
Managing Reports Using Report Manager
68787_ch06.qxp 26/03/2004 6:03 PM Page 189

needed special case basis. Remember that Reporting Services security is divided into two zones, system-level and item-level. Ensure you're addressing both system-level and item-level security zones.
Like item-level role assignments, you can create your own system-level role assignments. ReportingServices security is set at the system level by configuring user permissions for actions such as creatingshared schedules and setting report security properties. To define system-level role assignments, clickConfigure site-wide security on the Site Settings form by accessing the Site Settings link. For moreinformation on the specific system tasks and permissions available, see the Understanding the PredefinedRole section in this chapter.
Revoking Access to My ReportsConsider the possible ways to prevent users from accessing their My Reports folder. First, you can clearthe Enable My Reports checkbox under Site Settings. That removes the My Reports folder from the Homefolder contents.
Its important to note that although clearing the checkbox removes the My Reports folder from display, itdoesn't actually prevent access to the My Reports folder content. If you know the structure and path to afolder, you can still navigate to the location directly.
Another way to prevent access to the contents of My Reports is to modify the role definition used foraccessing My Reports. Clearing all the task permissions will effectively lock it down and prevent a userfrom accessing its contents. Unfortunately, it also denies access to anyone else in that role (who doesn'talready have permissions granted through other role memberships).
Finally, My Reports can be secured by removing the user's Windows account from My Reports rolemembership. This is the most effective way of locking out individual users, without creating potentiallyfar-reaching side effects.
Intranet and Extranet ConsiderationsReporting Services relies on Internet Information Services (IIS) and Windows to perform userauthentication. Remember, users are granted access to Report Manager because their Windows accountor group was added to a role assignment. To provide Report Manager access, users must have a validWindows user account or be a member of a Windows group.
Report Manager itself is not meant for use in an extranet or Internet environment, although you cancreate a custom application to provide extranet access to reports and/or resources through anotherinterface. If you build an ASP.NET Web application, for example, you have many options for configuringsecurity and improving performance. Combinations of IIS and .NET authentication and authorizationmechanisms with response output and user session caching capabilities enable you to make a customapplication that's both secure and reliable. For example, you can create a subscription to deploy arendered report out to a location on the file system and use an ASP.NET configuration file for the IISvirtual directory to require authentication to access it.
You'll want authenticate users against Active Directory and encrypt the communication to ensureprivacy. Because of this, the Report Server machine should be configured as a certificate server,responding to requests over a Secure Sockets Layer (SSL) connection. Users can be authenticated againstActive Directory using ASP.NET Forms authentication, or by using IIS Basic or Integrated Windows
190
Chapter 6
68787_ch06.qxp 26/03/2004 6:03 PM Page 190

authentication mechanisms. If using Basic authentication, be sure to use an SSL connection. Certificateconfiguration may be the source of unexpected issues.
One note from the field refers to a Report Manager instance returning errors indicating problemsaccessing the machine.config file, which infact turned out to be a certificate service configurationissue.
Viewing, Executing, and Scheduling ReportsAs you've seen, the first things defining the ability of a user to view a report are the permissions of theuser and the security settings applied to that report. After that, there are a variety of ways that reportscan be run, deployed, and viewed. Let's talk about the different options available and when to use them.
Viewing ReportsAs Report Manager is a web-based management tool, the default rendering of reports is in HTMLformat so they render in your browser as part of the Report Manager interface. When you view a reportin one of the other available formats, the rendered output is displayed in a new browser window.
The .NET Common Language Runtime (CLR) handles the job of determining whether to send HTML 3.2or 4.0 to the client depending on the browser making the request. HTML 3.2 displays static HTMLreports without client-side script. Reports with advanced functionality such as search and generation ofmultiple report formats are output as HTML 4.0.
Refreshing the current report view is not done by refreshing the browser window. To view the reportusing updated data, be sure to click the refresh button on the HTML Viewer toolbar.
Linked ReportsLinked reports are based on already existing reports. Because the base report has already beenconfigured, a linked report uses those property values for much of the processing. Where linked reportsdiffer is in the security properties and report parameters used to render the data. Linked reports are away to provide filtered views of existing reports. By creating a linked report that uses predefinedparameters, for example, you can control what data renderings can be viewed by your users.
You should know that deleting a report that's being used as the base for other linked reports will breakthe link and cause those reports to fail. Unfortunately, there's no way to globally view the connectionsrelated to linked reports. You've got to view the properties of each linked report, to see what report it'sbased on.
On-Demand Reports and SubscriptionsReporting Services has two types of report execution:
❑ On-demand, which execute upon user request
❑ Subscription, which execute unattended
To begin our discussion of these report types, it's important to understand the report execution process.
191
Managing Reports Using Report Manager
68787_ch06.qxp 26/03/2004 6:03 PM Page 191

The Report Execution ProcessRunning a report means generating a rendered version of the report definition based on valuescontained in the Report Server and SQL Server databases. The authored, published report is executedusing retrieved data and staged in an intermediate format for further processing. Figure 6-36 shows themajor steps to rendering a report:
Figure 6-36
How an intermediate report is processed into a generated report depends on the type of renderingrequested. Report execution properties are accessed by navigating to the report, then selecting theProperties tab for the report selected, and finally clicking the Execution link in the left of the navigationarea. Figure 6-37 shows a sample report Execution property page:
Figure 6-37
192
Chapter 6
68787_ch06.qxp 26/03/2004 6:03 PM Page 192

Providing Report Parameters and CredentialsAs a report viewer, you may be allowed or required to provide values for the report to use when it'sgenerated. Dates and date ranges, categories and credentials are examples of commonly used parametervalues. The report author has designed the report to run using the values you provide. This is used todisplay a filtered view of the underlying data. After you've provided the required parameters, clickingthe View Report button will run and display the resulting view.
Earlier, many reporting tools required additional coding and manual passing of values in order to acceptparameters from users at runtime. Reporting Services, however, handles all the underlying tasksassociated with parameter management. For example, consider some of the different parameterpossibilities default values, derived parameters, cascading parameters, linked report parameters, datasource parameters, and so on. Reporting Services provides an elegant solution to what was once acumbersome process.
Credentials are special parameters the values of which determine whether the user has the correctpermissions to view the report. Depending on how the report was designed, two users may see entirelydifferent results when the reports run. Figure 6-38 shows a sample parameter bar for a report:
Figure 6-38
A report can contain default parameters or may run only after the user has provided values. The numberand types of parameters a report takes is part of the report definition. However, you can change whatvalues are used and whether the report viewer has the option of changing them. Figure 6-39 shows anexample report Parameters property page:
Figure 6-39
A change has been made to the report viewed in Figure 6-39. The OrderDateFrom parameter value hasbeen set to 1/1/2002, and the users ability to change that value has been revoked. The user will still beable to specify the OrderDateTo parameter value, but the user prompt will only say Order Date To forusability. Figure 6-40 shows the resulting change rendered with the report:
193
Managing Reports Using Report Manager
68787_ch06.qxp 26/03/2004 6:03 PM Page 193

Figure 6-40
Entering a new Order Date To value and clicking the View Report button will render the report based onthe new parameter value. Any parameter that has a default value can be hidden from the user. Without adefault value, the user must supply a value and click the View Report button to render the report. If thePrompt User checkbox is cleared and the parameter has a default value, the user will never see theparameter. If you do allow the user to enter parameter values, the Prompt String property can be used toprovide information to the user about the type of values required.
On-demand and subscription reports have different requirements when providing parameter andcredential values. Let's take a look at how these two report generation techniques differ.
On-Demand ReportsWhen an on-demand report is generated, the following steps occur:
1. Data is retrieved from the SQL data store.
2. The data is processed according to the report definition.
3. A temporary copy of the report in intermediate form is generated and added to memory.
4. The intermediate report is rendered based on the requested format and delivered.
The temporary, intermediate copy of the report is session-specific. The individual user is tracked duringthe Report Manager session, and if the generated report is requested again, the user will see the cachedversion. This behavior is similar to using session state in an ASP.NET application, with one importantpoint. If the underlying values of the report have changed, the user must click the refresh report icon onthe parameter toolbar. Clicking the Refresh button on the browser will not cause the report to refreshand retrieve updated values; rather it will cause the browser to merely update its view of the cachedreport.
There currently isn't any way to define or restrict the specific report rendering format when a user viewsan on-demand report, except in the behavior of your own application interface. You can control therendering of reports that are not created on demand, however, as described in the section on ReportSubscriptions later in this chapter.
Caching the Report for Other UsersOn-demand reports are executed each time the report is requested. For example, if ten users request thesame report, ten connections will be made, ten sets of data will be retrieved, and the report will begenerated and cached ten times. That's because the report is executed and cached for each unique user.Rather than separate copies of the intermediate report being generated for each user, you can specify
194
Chapter 6
68787_ch06.qxp 26/03/2004 6:03 PM Page 194

that one cached version of the report be made available to all users. This is a great way to increaseReport Server performance.
Generating a cached version of the intermediate report is set at the item level. For example, you must belooking at the properties of the Company Sales Report to enable and configure caching. Figure 6-41shows the section of the Execution properties page where cache settings are made:
Figure 6-41
The first time this report is executed, the intermediate version of the report will be cached and be madeavailable for another user to view. That user will not cause a data connection to be made, but rather willcause a rendering of the cached intermediate report to be made. This process saves server resources. TheReport Server Web Service and Report Manager web application are then able to handle more incomingHTTP requests, while making fewer SQL connections for them.
This ability enables a Report Server instance to scale enough to support even high client loads. Forexample, consider an online sports site that tracks player and team statistics. These statistics are updatedperiodically, not continually. Because of that, cached versions of the various reports can be stored. Whenthe processing of a web page requires a report, it's simply served up from the cache. The overhead ofconnecting to the data source and processing the data is avoided entirely. Few thought it was theresponsibility of the reporting engine to handle caching intelligently, but here Microsoft has done a greatjob of blending technologies and capabilities for the best possible results.
There are two ways you can specify when the cached report expires:
❑ You can set the time after which the report must expire. When the cached copy expires, thereport is executed on the next user request. The new intermediate report is then cached,expiring when the minutes specified are passed. The default value for this is 30 minutes.
❑ You can set cache expiration by scheduling a new-cached copy to be generated after a specifictime. For example, you can set the Company Sales Report to run every Sunday at midnight. Thegenerated intermediate report will be placed in the cache, available to users until the next timethe report executes. This process creates what is called a snapshot report. Snapshot reports arediscussed in the next section.
When a report takes query parameters, the cached version of the report will reflect the parameter valuessupplied when the report executed. If another user provides different parameter values, the new reportwill cause a new cache to be created. This behavior is known as vary by parameter. There can be as manydifferent cached versions of the report as there are possible parameter combinations.
Reports that use filters have a slightly different behavior. For filtered reports, only one copy of theintermediate report is cached. Filtering is applied during the rendering of the report based on theintermediate version in memory.
195
Managing Reports Using Report Manager
68787_ch06.qxp 26/03/2004 6:03 PM Page 195
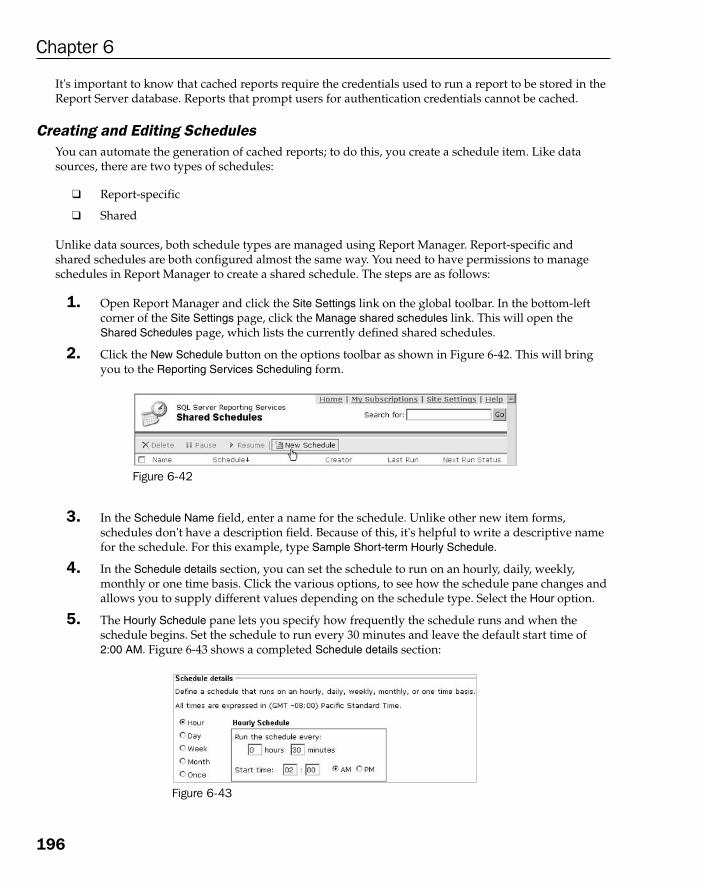
It's important to know that cached reports require the credentials used to run a report to be stored in theReport Server database. Reports that prompt users for authentication credentials cannot be cached.
Creating and Editing SchedulesYou can automate the generation of cached reports; to do this, you create a schedule item. Like datasources, there are two types of schedules:
❑ Report-specific
❑ Shared
Unlike data sources, both schedule types are managed using Report Manager. Report-specific andshared schedules are both configured almost the same way. You need to have permissions to manageschedules in Report Manager to create a shared schedule. The steps are as follows:
1. Open Report Manager and click the Site Settings link on the global toolbar. In the bottom-leftcorner of the Site Settings page, click the Manage shared schedules link. This will open theShared Schedules page, which lists the currently defined shared schedules.
2. Click the New Schedule button on the options toolbar as shown in Figure 6-42. This will bringyou to the Reporting Services Scheduling form.
Figure 6-42
3. In the Schedule Name field, enter a name for the schedule. Unlike other new item forms,schedules don't have a description field. Because of this, it's helpful to write a descriptive namefor the schedule. For this example, type Sample Short-term Hourly Schedule.
4. In the Schedule details section, you can set the schedule to run on an hourly, daily, weekly,monthly or one time basis. Click the various options, to see how the schedule pane changes andallows you to supply different values depending on the schedule type. Select the Hour option.
5. The Hourly Schedule pane lets you specify how frequently the schedule runs and when theschedule begins. Set the schedule to run every 30 minutes and leave the default start time of2:00 AM. Figure 6-43 shows a completed Schedule details section:
Figure 6-43
196
Chapter 6
68787_ch06.qxp 26/03/2004 6:03 PM Page 196

6. At the bottom of the form, set the start date of the schedule to today. This is an optionalschedule setting. Click the calendar icon to the right of the textbox to display a calendar of thecurrent month and select the date as in Figure 6-44:
Figure 6-44
7. Check the checkbox to stop the schedule on a specific date and choose tomorrow for the stopdate. Like the start date, the stop date is an optional property setting for schedules.
8. Click OK to apply the new schedule. You'll be taken back to the Shared Schedules page wherethe new schedule is listed. Note that it's easy to Pause, Resume, or Delete a schedule by selectingthe checkbox for a schedule and then choosing the action on the options toolbar.
The Sample Short-term Hourly Schedule is now available for users to choose for scheduling a report orsubscription.
Schedules are items that are stored in the Report Server database. Shared schedules differ from report-specific schedules as they are available for use by any report or subscription that needs to run on thatsame schedule. They are implemented as SQL Server Agent jobs, which has a very practical implication.For example, consider a company where different reports are generated on weekly or monthly schedulesas required.
Using a shared schedule configured for a particular time/day/date frequency, all reports cycling on asimilar schedule can be pointed to the same schedule. Then, if the schedule changes for some reasonsuch as scheduled closings or delayed shipments, all the reports can be rescheduled at one location.Even better, both generated and subscription reports can share a schedule.
Working with shared schedules requires system-level permissions, and is done from the Site Settingspage in the Report Manager. Report-specific schedules are items that can be created in-place by userswho have the permissions. Creation and editing is done from the property pages for an individualreport or subscription.
Shared schedules are created once and then referred to when setting the execution properties for a reportor subscription. Because shared schedules are managed from a central location and enable reuse, theyare usually preferred over report-specific schedules. For example, a report-specific schedule would beused when the existing shared schedules don't have the right interval settings to suit the reportexecution requirements.
197
Managing Reports Using Report Manager
68787_ch06.qxp 26/03/2004 6:03 PM Page 197

Snapshot ReportsSnapshot reports are cached reports that are executed based on a schedule rather than on a user request.To schedule a report snapshot, the steps are as follows:
1. Open Report Manager, and navigate to the Samples and Demonstrations folder. If you're notalready viewing the folder contents in the details view, click the Show Details button.
2. Click the properties icon in the Edit column for the Company Sales Report item. You'll be taken tothe General properties page.
3. Click the Execution link in the local navigation area on the left. and choose the Render this reportfrom an execution snapshot option.
4. Click the Use the following schedule checkbox. In this area, you can configure a report-specificschedule or choose an existing shared schedule.
5. Choose the Shared schedule option, and select the Sample Short-term Hourly Schedule sharedschedule item in the drop-down combo box. Notice how the schedule execution properties forthe schedule are displayed.
6. Leave the checkbox to allow creation of a snapshot when the user clicks the Apply button,manually forcing a snapshot to be generated.
7. Leave the default report execution timeout to Use default setting. The default value is set in theSite Settings form, and applies to all reports unless over-ridden by an individual report. Figure6-45 shows the completed property settings:
Figure 6-45
8. Click the Apply button to apply your updated execution settings.
198
Chapter 6
68787_ch06.qxp 26/03/2004 6:03 PM Page 198

Snapshot reports are cached intermediate reports. Cached reports execute when the user makes arequest, but snapshot reports execute automatically based on a schedule. Like cached reports, snapshotreports are rendered from the intermediate report. Unlike cached reports, snapshots aren't required toexpire after a period of time. Instead, snapshots expire and are removed when a new one is generated.Although there can only be one current snapshot, you can archive them in the report history for laterviewing. Snapshots are accessed using the View tab of the report; a report history is accessed using theHistory tab.
The Company Sales Report will now be executed hourly, creating a new intermediate report snapshoteach time. The snapshot will be served up from cache and rendered for each user request, until the newsnapshot is created. To verify that the report ran, go to the Contents tab of the Samples andDemonstrations folder. The Last Run value will be displayed there.
You can specify that snapshots be archived, rather than replaced. To do that, you create report history.
Creating a Report HistoryConfiguring report caching and snapshots is done using the Execution properties page, accessed from theProperties tab. Creating a report history is done in place, using the History tab of a report as shown in thefollowing steps:
1. Open Report Manager and navigate to the Samples and Demonstrations folder. Display thecontents in details view.
2. Click the properties icon for the Company Sales Report item to view the report Properties tab.
3. Go to the History property page.
4. By default, the Allow history to be created manually checkbox is selected. Leave the default setting.
5. Click the Use the following schedule to add snapshots to report history checkbox to select it. Thatwill enable the option buttons below it as shown in Figure 6-46:
Figure 6-46
199
Managing Reports Using Report Manager
68787_ch06.qxp 26/03/2004 6:03 PM Page 199

6. Click the option to use a Shared schedule and select the Sample Short-term Hourly Schedule in thedrop-down combo box.
7. Note that you can define your own setting for the number of copies to be kept in History. Fornow, go ahead and use the default setting.
8. Click Apply to save your changes.
9. Go to the History tab and click the New Snapshot button on the options toolbar. That will forcethe first snapshot to be generated and added to the report history.
If you don't see the snapshot available, try refreshing your browser. To view a snapshot, click the linkthat indicates the date and time of the report run. To verify that a snapshot ran, check the When Runvalue. Report executions that raise an error will not create a snapshot and so will not be archived.
Snapshots created for a report history are subject to the same credential limitations as other snapshots.The report execution runs automatically, so the credentials used to create the intermediate report mustbe stored in the Report Server database. Because snapshots are historical perspectives, users can't beprompted for credentials or have their Windows account used for authorization.
Snapshots in history are items separate from the report definition. For example, changes made to thereport definition or its data sources don't affect the previous snapshots kept in the report history.
However, changes made to the property value specifying the number of snapshots to be kept in reporthistory do affect the existing snapshots. For example, if you reduce the property value setting thenumber of copies to be kept in a report history, any report copies older than the new property value willbe deleted from the database. If current users need access to those earlier snapshots, there's a problem.Be careful when changing History property values.
Report SubscriptionsThe report rendering mechanisms you've read about so far all share one requirement for the user, toinitiate the action of viewing the rendered report. Subscriptions are a way to allow the automateddelivery of rendered reports. The following steps demonstrate creating a report subscription. Create afolder on your C drive called RSTemp (this example builds on the previous examples in this chapter):
1. Open Report Manager and navigate to the Samples and Demonstrations folder.
2. Click the Company Sales Report item and view the report Subscriptions tab.
3. Click the New Subscription button on the options toolbar. This should bring you to theSubscription: Company Sales Report page.
4. For the Delivered by: field, select Report Server File Share. Report Manager will display the pagewith the appropriate properties for your selection.
5. Leave the File Name field as the default value Company Sales Report.
6. Enter a valid UNC path to the RSTemp folder you created. For this example, type the path asfollows (replacing serverName with your server name):
\\serverName\C$\RSTemp
200
Chapter 6
68787_ch06.qxp 26/03/2004 6:03 PM Page 200

7. Select XML file with report data as the Render Format.
8. Leave the User Credentials checkbox checked, and enter your login user ID and password.
9. Leave the default Overwrite an existing file with a newer version option selected.
10. In the Subscription Processing Options section, choose to run the subscription On a sharedschedule.
11. Choose the Sample Short-term Hourly Schedule in the shared schedule combo box.
The execution properties for the schedule will be displayed below the combo box. Figure 6-47 shows acompleted subscription form:
Figure 6-47
12. Click OK to create the new subscription. You'll be taken to the Subscriptions tab for the CompanySales Report where the subscription will be listed.
When the scheduled event is raised, Reporting Services will process the schedule and deliver the reportusing the specified channel. Out of the box, SQL Server Reporting Services provides support for fileshare and email delivery. You just saw the use of file share delivery in this example. When the half hourschedule event is raised, the report in the XML version will be written to the file system. This delivery ofa single report to a single location, for example, a file path or email address, is considered a standardsubscription.
201
Managing Reports Using Report Manager
68787_ch06.qxp 26/03/2004 6:03 PM Page 201

Standard SubscriptionsTypically, subscriptions are user defined. To create a subscription, you need permission to Manageindividual subscriptions as well as permission to view the report itself. You can choose to have thedelivered report rendered in any of the available options. Email delivery provides you the option ofreceiving a link to the report rather than having the entire rendered report sent as an email.
Subscriptions are not considered as items, so you cannot use the Report Manager search function to findan existing subscription. There are two other ways to access a subscription. The first is by viewing theSubscriptions tab for a report. The second is by using the link to My Subscriptions, which is located on theglobal toolbar. My Subscriptions provides a central location to manage all your subscriptions withouthaving to navigate to each report item with access to the subscription and the report parent folder.There, you can also verify the Status and Last Run values for the subscription. To delete an existingsubscription, select it using the checkbox and click the Delete button on the options toolbar. Figure 6-48shows the subscription you created listed on the My Subscriptions page:
Figure 6-48
Like snapshot reports, the user credentials for the subscription report must be stored in the ReportServer database (or take no credentials at all). There is no way for the user to be prompted forcredentials; the report must be able to run unattended. This also applies to whatever parameters mightbe needed by the report. These parameters must be contained in the report definition or should besupplied by the user when creating the subscription.
It's possible to change the parameters used to execute the report. When that happens, the report isconsidered changed, and the subscription will not run until it is saved. Re-open your subscription andsave it, enabling the report to run again.
System Administrator role members have the ability to edit and delete individual subscriptions. Theyalso can create subscriptions that are delivered to multiple users at once. These are called data-drivensubscriptions.
Data-Driven SubscriptionsData-driven subscriptions give you the ability to broadcast a report to many users in a variety ofrendering formats. The delivery values and report parameters are dynamic and are read during thereport execution process. Consider, for example, a utility company that as part of its business process itsinvoices are generated indicating utility consumption and charges. Using Reporting Services, the invoicecould also include representations of comparative usage, and so on. Data-driven subscriptions then
202
Chapter 6
68787_ch06.qxp 26/03/2004 6:03 PM Page 202
enable the distribution through direct email to the customer in an example of one to one custom massmailing. The same process could be used to make the information available through email or securedweb page. Creating data-driven subscriptions is a seven-step process and requires the Enterprise Editionof SQL Reporting Services.
SummaryReport Manager is a robust tool, and this chapter has covered a lot of ground to address it. Fromnavigating the interface to managing content and configuring security, there's a lot to consider. UsingReport Manager as a report viewing application is intuitive and flexible. However, administeringsecurity, permissions, and report execution can be more of a challenge.
It's important to understand the implications that your choices can have. For example, remember toexercise care when extending the default security model. Reporting Services, including the ReportManager interface, demonstrate a number of sophisticated and elegant design practices.
Even if you choose to develop your own Report Server interface, much can be learned from Microsoft'sReport Manager. The next chapter, in fact, shows how to build your own Reporting Services interface.
203
Managing Reports Using Report Manager
68787_ch06.qxp 26/03/2004 6:03 PM Page 203

68787_ch06.qxp 26/03/2004 6:03 PM Page 204

Managing Reports UsingProgram Code
A friend of mine, who happens to be a very funny person, coined the following: "There is very littlethat cannot be accomplished if you have a positive mental attitude, tons of money, and supernaturalpowers". Steve's philosophy is so appropriate for much of what happens in software development.Fortunately, with Reporting Services bringing enterprise reporting to any application, it only takesthe first of Steve's ingredients but the other two are always nice to have.
We discussed the use of the Report Manager web application for managing reports in Chapter 6.In this chapter you will learn how the exposed interfaces of Reporting Services can be used todevelop custom applications to manage reports. All the tools that can be used in the ReportManager application are available for use through the Reporting Services Web Service. In fact theweb application is just a pretty wrapper around the web service. In this chapter we will not bedemonstrate all the features of the web service but will give you an understanding of what can bedone and the methods necessary to create your own user interface to the service. So get ready toget your hands dirty with some code.
Professional SQL Reporting Services ManagerIn order to program the web service, you'll be creating a Windows Forms application calledProfessional SQL Reporting Services Manager, PSRSM for short. The application will have thefamiliar look and feel of Windows Explorer, but instead of looking at the file system or resourceson the computer, you will be looking at the objects stored in the Reporting Services database. Wewill develop the application with the assumption that you have installed Reporting Services onyour local machine. The application will work properly when pointed to any machine on yournetwork that has Reporting Services installed, but the example will be easier to create if the serviceis installed on your development machine.
Start Visual Studio .NET and create a New Project. You are going to create a Windows applicationin both C# and VB.NET. Name the new project PSRS_Manager and give it an appropriate location.
777
68787_ch07.qxp 26/03/2004 6:24 PM Page 205

Chapter 7
206
The location is not important, but as you can see in Figure 7-1, the application is created inC:\Professional SQL Reporting Services:
Figure 7-1
By default Visual Studio will create a form called Form1 that will be the startup object of the application.Right click anywhere in the form Design Window and select Properties. Change the Name property toMainForm. It will also be necessary to right click on the Form1.cs file in the Solution Explorer windowand rename it to MainForm.cs.
When creating a new Windows application, Visual Studio inserts a method named Main into the codebehind Form1 that will be the starting point for the application. Since you have renamed the form, themethod will try and start the wrong object. Right click anywhere on the design window and select ViewCode. Scroll to the bottom of the code window until you find the Main method. Change the followingline of code in the method so that it looks like:
C#/// <summary>/// the main entry point for the application./// </summary>[STAThread]static void Main() {
Application.Run (new MainForm());}
If you are creating a VB.NET application as you follow along, the above step and the namespace step areboth taken care of when you set the properties of the application.
While you are looking at the code window you should change the namespace for your application.Declaring your own namespace is a useful way of collecting all of your code into a single area. Whenyou created your project, Visual Studio placed your new form into PSRS_Manager and change thenamespace code line to the following:
namespace Wrox.Professional.ReportingServices
The final bit of housekeeping that you need to take care of in order to have the application buildproperly is to set the default namespace and the startup object. Click the Project menu and choosePSRS_Manager Properties menu item. This will bring up the dialog box shown in Figure 7-2. In the
68787_ch07.qxp 26/03/2004 6:24 PM Page 206

General section of the Common Properties folder, change the Default Namespace property toWrox.Professional.ReportingServices. Below the default namespace open the combo box for the startupobject and choose Wrox.Professional.ReportingServices.MainFrom:
Figure 7-2
Click OK to save the settings and close the Property Pages dialog box.
Building the Visual InterfaceA blank form is only a canvas on which to paint or build your application. To make your application dosomething worthwhile you need to place controls from the toolbox on the form. Using the followingtable as a reference, add the necessary controls to MainForm:
ControlType
Control Name Text Anchor
TreeView treeViewFolders Top, Bottom, Left
ListView listViewReports Top, Botton, Left, Right
MainMenu mainMenu1
Label labelServerAddress Server Address: Top, Left
TextBox textBoxServerPath http://localhost/ReportServer Top, Left, Right
Button buttonGo Go Top, Right
Button buttonClose Close Bottom, Right
207
Managing Reports Using Program Code
68787_ch07.qxp 26/03/2004 6:24 PM Page 207

We are working under the assumption that Reporting Services is installed on the local developmentmachine. If you are running Reporting Services on a remote machine you may want to replace localhostin the text of the TextBox with the name of your server or a placeholder such as <ServerName> toremind you that you need to specify the server.
With all the controls you need on the form you now need to do some fine-tuning of the ListView and theMainMenu controls. Right click on the ListView control and select Properties. For the View property selectDetails from the drop-down list of choices. You need four columns in the ListView to display informationabout items in a folder. Click the Columns property in the property window and click the button withthree dots to the right of (Collection), as shown in Figure 7-3:
Figure 7-3
Figure 7-4
Using the ColumnHeader Collection Editor (shown in Figure 7-4), add four columns and set theirproperties as shown in the following table:
Name Text TextAlign Width
columnHeader1 Name Left 210
columnHeader2 Type Left 66
columnHeader3 Size Left 66
columnHeader4 Date Modified Left 135
208
Chapter 7
68787_ch07.qxp 26/03/2004 6:24 PM Page 208

The final task required to make your form work is to add menu items to the MainMenu control youassigned to the form. The menu editor in Visual Studio .NET is intuitive and easy to use; just type whereyou are prompted to add menu items as shown in Figure 7-5:
Figure 7-5
The name of a menu item can be changed from the properties window. Using the Menu Editor and theproperties window build the menu structure as outlined in the following table:
Menu Item Name Text Parent
menuItemFile File
menuItemEdit Edit
menuItemHelp Help
menuItemFileNew New menuItemFile
menuItemFileNewFolder Folder menuItemFileNew
menuItemFileNewDataSource Data Source menuItemFileNew
menuItemFileImport Import Report menuItemFile
menuItemFileExit Exit menuItemFile
menuItemEditDelete Delete menuItemEdit
menuItemSecurity Security
menuItemSecurityRoles Roles menuItemSecurity
menuItemSecuritySystemRoles System Roles menuItemSecurity
menuItemSecurityAssignments Role Assignments menuItemSecurity
menuItemSecuritySystemAssignments System Role Assignments menuItemSecurity
menuItemHelpAbout About menuItemHelp
209
Managing Reports Using Program Code
68787_ch07.qxp 26/03/2004 6:24 PM Page 209

This completes the look and basic construction of the main form of your application. Your MainFormshould look similar to Figure 7-6:
Figure 7-6
Adding a Reference to the Web ServiceAlthough the form looks correct, it is only a lifeless shell of what it needs to be. So like Gene Wilder inYoung Doctor Frankenstein it is time to "…give my creation LIFE!"
In the Solution Explorer, right click on the Web Reference folder and select Add Web Reference from themenu and click the hyperlink Web services on the local machine as in Figure 7-7:
Figure 7-7
To use Reporting Services from a remote machine, you will need to enter the URL of the service in theURL textbox. The URL should be of the form http://machineName/ReportServer/ReportService.asmx.
210
Chapter 7
68787_ch07.qxp 26/03/2004 6:24 PM Page 210

From the list of web services on the machine, select ReportService as shown in Figure 7-8:
Figure 7-8
Change the web reference name to ReportingWebService and click the Add Reference button. The WebReferences folder should now look like Figure 7-9:
Figure 7-9
The process of adding the web reference to the project has created a proxy class in the project that isnamed Reference.cs. You can view the contents of this file by opening the Solution Explorer, clickingthe Show All Files button as shown in Figure 7-10, and fully expanding the ReportingWebService. Theproxy class does not contain the actual methods of the web service; it only has a template of the methodsand the URL where the real methods can be found. When you use the web reference in design andduring compilation you will be using the proxy class to assist with proper method syntax andparameters. The proxy class will then pass the information to the service at runtime.
Figure 7-10
211
Managing Reports Using Program Code
68787_ch07.qxp 26/03/2004 6:24 PM Page 211

Consuming the Web ServiceActually using the web service is where you begin to write some code for your application. First, addsome namespaces and change the namespace for the form. Namespaces are the first lines of code in anyclass file. Namespace declarations appear above the line that declares the class.
C#using System;using System.Drawing;using System.Collections;using System.ComponentModel;using System.Windows.Forms;using System.Data;using System.Web.Services.Protocols;using Wrox.Professional.ReportingServices.ReportingWebService;
VB.NETImports System.Web.Services.ProtocolsImports Wrox.Professional.ReportingServices.ReportingWebService
Go back to the form Design View of MainForm and double click on the Go button. This will add an eventhandler for the click event of the button and take you to the code window with the new event handler inthe window.
C#private void buttonGo_Click(object sender, System.EventArgs e){
ConnectToServer();}
VB.NETPrivate Sub buttonGo_Click(ByVal sender As System.Object,
ByVal e As System.EventArgs) Handles buttonGo.ClickConnectToServer()
End Sub
The ConnectToServer method will be where you perform the connection to the web service. A call tothis method could have been placed immediately after the call to InitializeComponent in theconstructor of MainForm but there are a couple of reasons for not doing that:
❑ Reporting Services is a .NET assembly. If the web service has not been called for a while, it takestime to load the assembly and run it through the JIT compiler. This will make your applicationslow to load. If you delay the connection until the form has loaded, your application willappear to be more responsive and you can show an hourglass to let the user know thatsomething is happening while he waits for the service to respond.
❑ By waiting to connect until you explicitly call the connection method, you can put the name ofany computer running the web service into your server address textbox and connect to theservice on that computer upon clicking GO.
212
Chapter 7
68787_ch07.qxp 26/03/2004 6:24 PM Page 212

Create a private variable to hold a reference to the web service. You will use this private variable to callthe methods of the service and to pass the connected web service to dialog forms for creating or editingitems in the database.
C# /// <summary>/// Required designer variable./// </summary>private System.ComponentModel.Container components = null;// User defined private variablesprivate ReportingService rs;
VB.NETPublic Class MainForm
Inherits System.Windows.Forms.Form' User defined private variablesPrivate rs As ReportingService
Next add the ConnectToServer method to perform the actual connection. The meat of the work is doneby setting your private variable to a new ReportingService object and setting the URL of the serviceto the URL you have entered in the server address text box.
C#private void ConnectToServer(){
string serverPath = textBoxServerPath.Text + "/ReportService.asmx";try{
Cursor.Current = Cursors.WaitCursor;// Connect to Report Serverrs = new ReportingService();// A production application would perform a complete check of//the url pathrs.Url = serverPath;
}catch (Exception ex){
RSUtilities.ErrorHandler(ex);}finally{
Cursor.Current = Cursors.Default;}
}
VB.NETPrivate Sub ConnectToServer()
Dim serverPath As String = textBoxServerPath.Text + "/ReportService.asmx" Try
Cursor.Current = Cursors.WaitCursor' Connect to Report Server
213
Managing Reports Using Program Code
68787_ch07.qxp 26/03/2004 6:24 PM Page 213

rs = New ReportingService()' A production application would perform a complete check of' the url pathrs.Url = serverPath
Catch ex As ExceptionRSUtilities.ErrorHandler(ex)
FinallyCursor.Current = Cursors.Default
End TryEnd Sub
Error handling is always a vital function of an application. As you are building a demonstrationapplication and learning some new technology, a simple error handler for your application can help youdebug problems as they occur. The web service you are consuming will throw SOAP exceptions if youtry and call its methods improperly, so you should look specifically for a SoapException in your errorhandler.
Add a new class to the project and name it RSUtilities. You need to create a class with some staticmethods that you can call throughout the application to perform some common tasks associated withcreating and modifying objects in the Reporting Services database.
Add the System.IO and Wrox.Professional.ReportingServices.ReportingWebServicenamespaces to the class file. As the class will be comprised of static methods, you won’t actually need aninstance of the class to use the methods; you will only need to reference its name. If you are writing yourcode in C#, you should delete the default constructor for the class. The default constructor is the sectionwith the grey background in the following code:
public class RSUtilities{public RSUtilities(){//// TODO: Add constructor logic here//
}}
Enter the following procedure to the RSUtilities class:
C# private static void ErrorHandler(Exception ex){string exceptionText;// Find out if the exception is a SOAP exception and make // use of the SOAP exception Detail property.if (ex is SoapException){
exceptionText = ((SoapException)ex).Detail["Message"].InnerXml;}else{
exceptionText = ex.Message;
214
Chapter 7
68787_ch07.qxp 26/03/2004 6:24 PM Page 214

}MessageBox.Show("An exception has occurred: " + exceptionText,
"Application Error");}
VB.NETPrivate Shared Sub ErrorHandler(ByVal ex As Exception)
Dim exceptionText As String' Find out if the exception is a SOAP exception and make ' use of the SOAP exception Detail property.If TypeOf ex Is SoapException Then
exceptionText = (CType(ex, SoapException)).MessageElse
exceptionText = ex.MessageEnd IfMessageBox.Show("An exception has occurred: " + exceptionText,
"Application Error")End Sub
Filling the TreeviewYou can show the virtual folders in the Reporting Services database using TreeView similar to the wayfile system folders are shown in Windows Explorer. To accomplish this, open the code for MainForm andenter the following procedure.
C#private void GetServerFolders(){
this.treeViewFolders.Nodes.Clear();
CatalogItem[] items = null;try{
items = rs.ListChildren("/", true);}catch (SoapException ex){
RSUtilities.ErrorHandler(ex);}TreeNode rootNode = new TreeNode("Report Server Folders");rootNode.Tag = "/";this.treeViewFolders.Nodes.Add(rootNode);foreach (CatalogItem item in items){
if (item.Type == ReportingWebService.ItemTypeEnum.Folder){TreeNode newNode = new TreeNode(item.Name);newNode.Tag = item.Path.ToString() + "/";string parentPath =
item.Path.ToString().Replace(item.Name.ToString(), "");
215
Managing Reports Using Program Code
68787_ch07.qxp 26/03/2004 6:24 PM Page 215

AddNodeToTree(parentPath, newNode, rootNode);}
}}
VB.NETPrivate Sub GetServerFolders()
Me.treeViewFolders.Nodes.Clear()
Dim items() As CatalogItem = NothingTry
items = rs.ListChildren("/", True)Catch ex As SoapException
RSUtilities.ErrorHandler(ex)End TryDim rootNode As TreeNode = New TreeNode("Report Server Folders")rootNode.Tag = "/"Me.treeViewFolders.Nodes.Add(rootNode)Dim item As CatalogItemFor Each item In items
If item.Type = ReportingWebService.ItemTypeEnum.Folder ThenDim NewNode As TreeNode = New TreeNode(item.Name)NewNode.Tag = item.Path.ToString() + "/"Dim parentPath As String =
item.Path.ToString().Replace(item.Name.ToString(), "")AddNodeToTree(parentPath, NewNode, rootNode)
End IfNext
End Sub
Objects that can be contained in folders in a Reporting Services database are defined as objects of typeCatalogItem. A CatalogItem can be a folder, report, resource (such as a graphic image), linked report,or a data source. Every CatalogItem has a number of standard properties:
❑ CreatedBy
❑ CreationDate
❑ ModifiedBy
❑ ModifiedData
❑ Name
❑ Path
❑ Size
These properties can be returned directly from the item. For a complete list of the properties of aCatalogItem and their purposes, refer to the Reporting Services Books Online.
The GetServerFolders procedure will clear all the nodes from the TreeView and call the web methodListChildren that gets an array of all the CatalogItems that are in the Reporting Services database.Then call the ListChildren method with rs.ListChildren (/, true). The first argument is a string
216
Chapter 7
68787_ch07.qxp 26/03/2004 6:24 PM Page 216

indicating the path of the folder you want as the source for your list. You can use the root folder, whichalways has a value of /. The boolean argument indicates if you want the list to be recursive, meaningyou want to see not only the children of an item, but also any grand children, great grand children andso on. To show all the folders in the database pass true for this argument.
The array of CatalogItems is, in essence, a read-only list of the items that the current user haspermission to see in the database. New objects of type CatalogItem cannot be added directly toReporting Services. To add items to the database it is necessary to create an object of the type you wish toadd and then call the add method specific to that object type. Adding objects will be covered when wediscuss adding folders and data sources.
With an array of every item that is in the database you then need to loop through the array one item at atime to find which items are folders and then add them to the tree.
The actual addition of a node to the TreeView is done with the AddNodeToTree procedure shown below.The TreeView control in the .NET Framework has a very rigid hierarchy. The TreeView itself only holdsthe nodes that are at the root level. All the other nodes are contained by their parent node. The result ofthis structure is that you need to use a recursive routine to traverse all the nodes and find where anygiven new node should be added. You are storing the path of where a node belongs in the tree into theTag property for each node. The routine can then examine the contents of the Tag property of any nodeto see if it matches the destination path of the node to be added. When a match is found, the new node isadded to the collection of child nodes of the tree node, which is being examined.
C#private void AddNodeToTree(string parentPath, TreeNode childNode, TreeNode searchNode){
if (parentPath == searchNode.Tag.ToString()){
searchNode.Nodes.Add(childNode);}else{
TreeNodeCollection treeNodes = searchNode.Nodes;foreach(TreeNode node in treeNodes){
if (node.Tag.ToString() == parentPath.ToString()){
node.Nodes.Add(childNode);}else{
if ( node.Nodes.Count > 0){
AddNodeToTree(parentPath, childNode, node);}
}}
}return;
}
217
Managing Reports Using Program Code
68787_ch07.qxp 26/03/2004 6:24 PM Page 217

VB.NETPrivate Sub AddNodeToTree(ByVal parentPath As String, ByVal childNode As TreeNode,
ByVal searchNode As TreeNode)If parentPath = searchNode.Tag.ToString() Then
searchNode.Nodes.Add(childNode)Else
Dim treeNodes As TreeNodeCollection = searchNode.NodesDim node As TreeNodeFor Each node In treeNodes
If node.Tag.ToString() = parentPath.ToString() Thennode.Nodes.Add(childNode)
ElseIf node.Nodes.Count > 0 Then
AddNodeToTree(parentPath, childNode, node)End If
End IfNext
End IfReturn
End Sub
Make a change to the ConnectToServer procedure you created earlier so that after you connect to theserver the TreeView will automatically be filled.
C#private void ConnectToServer(){
string serverPath = textBoxServerPath.Text + "/ReportService.asmx";try{
Cursor.Current = Cursors.WaitCursor;// Connect to Report Serverrs = new ReportingService();// A production application would perform a complete check of//the url pathrs.Url = serverPath;GetServerFolders();
}catch (Exception ex){
RSUtilities.ErrorHandler(ex);}finally{
Cursor.Current = Cursors.Default;}
}
VB.NETPrivate Sub ConnectToServer()
Dim serverPath As String = textBoxServerPath.Text + /ReportService.asmx"Try
218
Chapter 7
68787_ch07.qxp 26/03/2004 6:24 PM Page 218

Cursor.Current = Cursors.WaitCursor' Connect to Report Serverrs = New ReportingService' A production application would perform a complete check of'the url pathrs.Url = serverPathGetServerFolders()
Catch ex As ExceptionRSUtilities.ErrorHandler(ex)
FinallyCursor.Current = Cursors.Default
End TryEnd Sub
After saving the project, start the project to see what happens. After the project starts, click the Go buttonto fill the TreeView. Figure 7-11 shows the result of trying to call the web service without the propercredentials:
Figure 7-11
CredentialsThis actually was not a mistake. When you created the ConnectToServer procedure you ignored animportant item and this error gives us an opportunity to discuss it. By default when Reporting Servicesis installed the virtual web folder is created with Anonymous access disabled and authentication is set toIntegrated Windows authentication. Why would this be? Remember from the previous chapter that you canset security on any object in the server. If Anonymous access was enabled you would have everyonetrying to access the service identified as IUSER_<computerName> and granting or denying an individualuser access would be problematic. Using integrated security permits the service to capture the identityof a user from the browser header information.
So to use the web service properly you need to tell the service who you are. The .NET Frameworkprovides a whole set of classes to handle identity and credential issues.
Add the following namespace to the header of the MainForm code file:
C#using System;using System.Drawing;using System.Collections;using System.ComponentModel;using System.Windows.Forms;using System.Data;
219
Managing Reports Using Program Code
68787_ch07.qxp 26/03/2004 6:24 PM Page 219

using System.Net;using System.Web.Services.Protocols;using Wrox.Professional.ReportingServices.ReportingWebService;
VB.NETImports System.NetImports System.Web.Services.ProtocolsImports Wrox.Professional.ReportingServices.ReportingWebService
Then change the ConnectToServer procedure as shown in the following code:
C#private void ConnectToServer(){
string serverPath = textBoxServerPath.Text + "/ReportService.asmx";try{
Cursor.Current = Cursors.WaitCursor;// Connect to Report Serverrs = new ReportingService();rs.Credentials = System.Net.CredentialCache.DefaultCredentials;// A production application would perform a complete check of//the url pathrs.Url = serverPath;GetServerFolders();
}catch (Exception ex){
RSUtilities.ErrorHandler(ex);}finally{
Cursor.Current = Cursors.Default;}
}
VB.NETPrivate Sub ConnectToServer()
Dim serverPath As String = textBoxServerPath.Text +"/ReportService.asmx"Try
Cursor.Current = Cursors.WaitCursor' Connect to Report Serverrs = New ReportingServicers.Credentials = System.Net.CredentialCache.DefaultCredentials' A production application would perform a complete check of'the url pathrs.Url = serverPathGetServerFolders()
Catch ex As ExceptionRSUtilities.ErrorHandler(ex)
FinallyCursor.Current = Cursors.Default
End TryEnd Sub
220
Chapter 7
68787_ch07.qxp 26/03/2004 6:24 PM Page 220

The effect of this new line of code is to take the credentials of the current user and pass them to the webservice. You could also do some error trapping around this new line of code to see if the defaultcredentials have access to the service. If the default credential fails, you could create a form to promptthe user for valid credentials. Of course it is also possible to not supply any credentials as done before,but you should provide a method to demand credentials from the user before the service can be used.For more information on .NET authentication and authorization refer to the .NET Framework and VisualStudio documentation on the System.Net namespace.
After adding your credentials to the to the ConnectToServer procedure you should be able to run theapplication and see any folders that have been added to the service.
Displaying the Folder ContentsThis would also be a good time to add some code to display the child items of a folder in the ListViewcontrol.
Add the following procedure to the code file of MainForm:
C#private void DisplayFolderContents( string path ){
if (path != "/"){
path = path.Substring(0, path.Length -1);}CatalogItem[] catalogItems = null;Cursor.Current = Cursors.WaitCursor;listViewReports.Items.Clear();catalogItems = rs.ListChildren(path, false); try{
// Main part of method if (catalogItems != null){
foreach ( CatalogItem item in catalogItems ){
// Create a ListView item containing a CatalogItemListViewItem newItem = new ListViewItem(item.Name);newItem.Tag = item.Path.ToString();newItem.SubItems.Add(item.Type.ToString());newItem.SubItems.Add(item.Size.ToString());newItem.SubItems.Add(item.ModifiedDate.ToShortDateString()
+ " " + item.ModifiedDate.ToShortTimeString());listViewReports.Items.Add(newItem);
}}
}catch (Exception ex){
RSUtilities.ErrorHandler(ex);
221
Managing Reports Using Program Code
68787_ch07.qxp 26/03/2004 6:24 PM Page 221

}finally{
Cursor.Current = Cursors.Default;}
}
VB.NETPrivate Sub DisplayFolderContents(ByVal path As String)
If path <> "/" Thenpath = path.Substring(0, path.Length - 1)
End IfDim catalogItems() As CatalogItem = NothingCursor.Current = Cursors.WaitCursorlistViewReports.Items.Clear()catalogItems = rs.ListChildren(path, False)Try
' Main part of method If Not catalogItems Is Nothing Then
Dim item As CatalogItemFor Each item In catalogItems
' Create a ListView item containing a CatalogItemDim NewItem As ListViewItem = New ListViewItem(item.Name)NewItem.Tag = item.Path.ToString()NewItem.SubItems.Add(item.Type.ToString())NewItem.SubItems.Add(item.Size.ToString())NewItem.SubItems.Add(item.ModifiedDate.ToShortDateString() + " " +
item.ModifiedDate.ToShortTimeString())listViewReports.Items.Add(NewItem)
NextEnd If
Catch ex As ExceptionRSUtilities.ErrorHandler(ex)
FinallyCursor.Current = Cursors.Default
End TryEnd Sub
The key to display the contents of a folder is the call to the web method ListChildren. Make this callwith the code rs.ListChildren(path, false). The path argument is the path of the folder that youwant to work with. For the boolean argument pass the value of false. When you filled the TreeView youwanted the method to give you a list of all child generations in the database. For the ListView you onlyneed to see the direct children of the folder you have selected. The code also examines some of theproperties of each CatalogItem (Name, Type, Size, and ModifiedDate) and uses the property valuesto fill the ListView information.
To call this procedure you need to create an event handler for the TreeView control. Open the Design Viewof MainForm and double click on the TreeView control. This will open the code for the form and give youan empty event handler for the treeViewFolders_AferSelect event.
Insert the following code into the event handler:
222
Chapter 7
68787_ch07.qxp 26/03/2004 6:24 PM Page 222

C#private void treeViewFolders_AfterSelect(object sender,
System.Windows.Forms.TreeViewEventArgs e){
TreeNode node = treeViewFolders.SelectedNode;string path = node.Tag.ToString();DisplayFolderContents(path);
}
VB.NETPrivate Sub treeViewFolders_AfterSelect(ByVal sender As System.Object,
ByVal e As System.Windows.Forms.TreeViewEventArgs) Handles treeViewFolders.AfterSelect
Dim node As TreeNode = treeViewFolders.SelectedNodeDim path As String = node.Tag.ToString()DisplayFolderContents(path)
End Sub
The first line you added grabs a reference to the currently selected node in the tree. From this node youget the Reporting Services path from where it has been stored in the tag property. Finally call theDispalyFolderContents procedure you created above to show the contents of the selected folder. Runthe application and click on the Go button to fill the TreeView. When the TreeView shows the folderstructure select any folder and the ListView will display the contents of the folder as in Figure 7-12:
Figure 7-12
Adding/Updating Folders While this looks good, it will currently only show you what already exists in the Reporting Servicesdatabase. To really make this application useful for managing Reporting Services, you need to be able toadd, edit, or delete objects in the database. With this in mind let's make changes to the application tomake it more powerful.
Add the following code to the RSUtilities class:
223
Managing Reports Using Program Code
68787_ch07.qxp 26/03/2004 6:24 PM Page 223

C#public enum EditModeEnum{
add,edit
}
public static Property CreateProperty(string Name, string Value){
Property property = new Property();property.Name = Name;property.Value = Value;return property;
}
public static Property[] CreatePropertyArray(int MemberCount){
Property[] properties = new Property[MemberCount];return properties;
}public static void SetProperty(string Name, string Value, Property[] properties){
foreach (Property property in Properties){
if (property.Name == Name){
property.Value = Value;return;
}}return;
}
VB.NETPublic Enum EditModeEnum
addedit
End Enum
Public Shared Function CreateProperty(ByVal Name As String, ByVal Value As String) As ReportingWebService.Property
Dim prop As ReportingWebService.Property = New ReportingWebService.Propertyprop.Name = Nameprop.Value = ValueReturn prop
End Function
Public Shared Function CreatePropertyArray(ByVal MemberCount As Integer) As ReportingWebService.Property()
Dim properties(MemberCount - 1) As ReportingWebService.PropertyReturn properties
End Function
Public Shared Sub SetProperty(ByVal Name As String, ByVal Value As String,
224
Chapter 7
68787_ch07.qxp 26/03/2004 6:24 PM Page 224

ByVal properties() As ReportingWebService.Property)Dim prop As ReportingWebService.PropertyFor Each prop In properties
If prop.Name = Name Thenprop.Value = Value
ReturnEnd If
NextReturn
End Sub
You can use the EditModeEnum enumeration to set the mode for forms. This way you should be able touse the same form to add a new folder or update the information in an existing folder.
Reporting Services uses a properties collection to hold and manage information about objects in thedatabase. While a CatalogItem has a description property, it cannot be set directly. To set thedescription property of an object, you must do the following:
1. Create a properties array.
2. Set the description property in the array.
3. Assign the properties array back to the item you want to work with.
You will need to do a lot of work with the properties array of an item. The three methods you will beusing to manage item properties are as follows:
❑ SetProperty
❑ CreateProperty
❑ CreatePropertyArray
Folder FormAdd a new form to the application and name it FolderForm. Add two label controls, two textboxcontrols, and two button controls to the form and arrange the controls as in Figure 7-13:
Figure 7-13
Name the textboxes textBoxName and textBoxDesctiption. Name the buttons buttonOK andbuttonCancel. Be sure to set the multiline property of textBoxDescription to true.
225
Managing Reports Using Program Code
68787_ch07.qxp 26/03/2004 6:24 PM Page 225

To pass information to the FolderForm, you are going to create some public properties of the form. Tohold the property information you need to declare some private variables.
Open the code file for the form and add the following code above the default constructor of the form:
C#// Private form variablesprivate string folderPath = "";private string folderName = "";private ReportingService rsWebService = null;private RSUtilities.EditModeEnum mode;
VB.NETImports Wrox.Professional.ReportingServices.ReportingWebService
Public Class FolderFormInherits System.Windows.Forms.Form' Private form variablesPrivate mFolderPath As String = ""Private mFolderName As String = ""Private mRsWebService As ReportingServicePrivate mMode As RSUtilities.EditModeEnum
These private variables will be used by the property routines to hold the state of each property. Now addthe following property procedures to the class below the constructor and the Dispose procedure.
C#public ReportingService RsWebService{
set{
rsWebService = value;}
}
public string FolderPath{
get{
return folderPath;}set{
string path = value.Substring(0, value.Length - 1);if (path == String.Empty){
path = "/";}folderPath = path;
}}
226
Chapter 7
68787_ch07.qxp 26/03/2004 6:24 PM Page 226
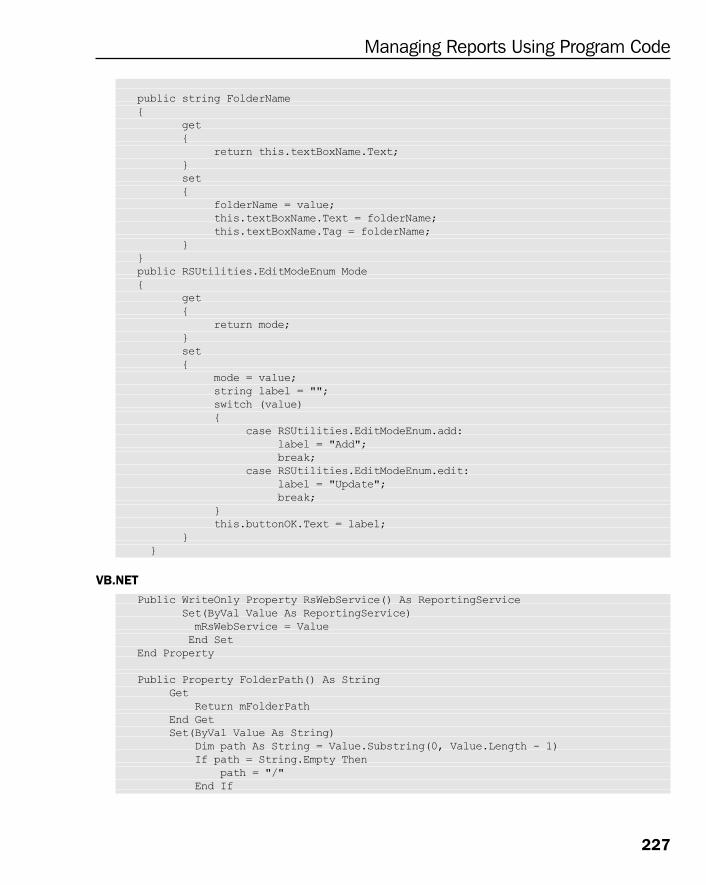
public string FolderName{
get{
return this.textBoxName.Text;}set{
folderName = value;this.textBoxName.Text = folderName;this.textBoxName.Tag = folderName;
}}public RSUtilities.EditModeEnum Mode{
get{
return mode;}set{
mode = value;string label = "";switch (value){
case RSUtilities.EditModeEnum.add:label = "Add";break;
case RSUtilities.EditModeEnum.edit:label = "Update";break;
}this.buttonOK.Text = label;
}}
VB.NETPublic WriteOnly Property RsWebService() As ReportingService
Set(ByVal Value As ReportingService)mRsWebService = ValueEnd Set
End Property
Public Property FolderPath() As StringGet
Return mFolderPathEnd GetSet(ByVal Value As String)
Dim path As String = Value.Substring(0, Value.Length - 1)If path = String.Empty Then
path = "/"End If
227
Managing Reports Using Program Code
68787_ch07.qxp 26/03/2004 6:24 PM Page 227

mFolderPath = pathEnd Set
End Property
Public Property FolderName() As StringGet
Return Me.textBoxName.TextEnd GetSet(ByVal Value As String)
mFolderName = ValueMe.textBoxName.Text = mFolderNameMe.textBoxName.Tag = mFolderName
End SetEnd PropertyPublic Property Mode() As RSUtilities.EditModeEnum
GetReturn mMode
End GetSet(ByVal Value As RSUtilities.EditModeEnum)
mMode = valueDim label As String = ""Select Case value
Case RSUtilities.EditModeEnum.addlabel = "Add"Exit Property
Case RSUtilities.EditModeEnum.editlabel = "Update"Exit Property
End SelectMe.buttonOK.Text = label
End SetEnd Property
The OK button will look at the mode of the form to determine if the information the form containsrelates to a new folder or to a folder that already exists in the Reporting Services database.
C#private void buttonOK_Click(object sender, System.EventArgs e){
if (this.textBoxName.Text == String.Empty || this.FolderPath == String.Empty)
{throw new ArgumentException("Invalid input parameter");
}else if (this.rsWebService == null){
throw new Exception("Web Service reference not set");}else{
if (this.mode == RSUtilities.EditModeEnum.add){
AddFolder();
228
Chapter 7
68787_ch07.qxp 26/03/2004 6:24 PM Page 228

}else{
UpdateFolder();}this.Close();
} }
VB.NETPrivate Sub buttonOK_Click(ByVal sender As Object, ByVal e As System.EventArgs)
Handles buttonOK.ClickIf (Me.textBoxName.Text = String.Empty Or Me.FolderPath = String.Empty) Then
Throw New ArgumentException("Invalid input parameter")ElseIf mRsWebService Is Nothing Then
Throw New Exception("Web Service reference not set")Else
If Me.Mode = RSUtilities.EditModeEnum.add ThenAddFolder()
ElseUpdateFolder()
End IfMe.Close()
End IfEnd Sub
C#private void AddFolder(){
try{
//Create Property array for descriptionProperty[] rsProperties = RSUtilities.CreatePropertyArray(1);rsProperties[0] = RSUtilities.CreateProperty("Description",
this.textBoxDescription.Text);
//Call RS CreateFolder() base methodrsWebService.CreateFolder(this.textBoxName.Text,
this.FolderPath, rsProperties);}catch (Exception){
throw new ApplicationException("Add operation failed");}return;
}
VB.NETPrivate Sub AddFolder()
Try'Create Property array for descriptionDim rsProperties() As ReportingWebService.Property =
229
Managing Reports Using Program Code
68787_ch07.qxp 26/03/2004 6:24 PM Page 229

RSUtilities.CreatePropertyArray(1)rsProperties(0) = RSUtilities.CreateProperty("Description",
Me.textBoxDescription.Text)
'Call RS CreateFolder() base methodmRsWebService.CreateFolder(Me.textBoxName.Text, Me.FolderPath,
rsProperties)Catch
Throw New ApplicationException("Add operation failed")End TryReturn
End Sub
The AddFolder method calls the web service CreateFolder method. CreateFolder takes the name ofthe folder, its path and properties as arguments. Since you need to set the description property of thefolder you have to use the property methods of RSUtilities first to create an array of properties andthen to add a Description property to the array.
C#private void UpdateFolder(){
Property[] properties = RSUtilities.CreatePropertyArray(1);properties[0] = RSUtilities.CreateProperty("Description", this.textBoxDescription.Text);try{
string oldPath = folderPath + "/" + this.textBoxName.Tag.ToString();
string newPath = folderPath + "/" + this.FolderName;
// Rename Item and Create new Properties based on old properties// Create batch headerBatchHeader batchHeader = new BatchHeader();// Set EditItem batch id and top BatchHeaderValuebatchHeader.BatchID = rsWebService.CreateBatch();rsWebService.BatchHeaderValue = batchHeader; // update the folder info inside a transactionrsWebService.MoveItem(oldPath, newPath);rsWebService.SetProperties(newPath, properties);
// Rollback transaction if either method failsrsWebService.ExecuteBatch(); rsWebService.BatchHeaderValue = null;
} catch (Exception){
throw new ApplicationException("Update operation failed");}
}
VB.NETPrivate Sub UpdateFolder()
Dim properties() As ReportingWebService.Property =
230
Chapter 7
68787_ch07.qxp 26/03/2004 6:24 PM Page 230

RSUtilities.CreatePropertyArray(1)properties(0) = RSUtilities.CreateProperty("Description",
Me.textBoxDescription.Text)Try
Dim oldPath As String = Me.FolderPath + "/" + Me.textBoxName.Tag.ToString()
Dim newPath As String = Me.FolderPath + "/" + Me.FolderName' Rename Item and Create new Properties based on old properties' Create batch headerDim batchHeader As batchHeader = New batchHeader' Set EditItem batch id and top BatchHeaderValuebatchHeader.BatchID = mRsWebService.CreateBatch()mRsWebService.BatchHeaderValue = batchHeader' update the folder info inside a transactionmRsWebService.MoveItem(oldPath, newPath)mRsWebService.SetProperties(newPath, properties)' Rollback transaction if either method failsmRsWebService.ExecuteBatch()mRsWebService.BatchHeaderValue = Nothing
CatchThrow New ApplicationException("Update operation failed")
End TryEnd Sub
The UpdateFolder method introduces the Reporting Services concept of a batch and transaction. Let'stake a step back for a moment to discuss transactions.
Imagine that you are going to lunch at your favorite restaurant and you need cash. There is an ATM onthe way to the restaurant at which you stop to get some money from your checking account. You enteryour PIN and indicate that you want to withdraw $100 from your checking account. Hitting the enterbutton begins a series of individual tasks (verifying that you have money in your account, debiting youraccount for the amount being withdrawn, crediting the ATM machine that amount and dispensing yourcash) which are treated as a single transaction. Immediately after you hit the enter button a truck comingdown the street loses control and crashes into the ATM machine. You saw the truck coming out of thecorner of your eye and were able to jump out of the way, but the ATM was not so lucky. The ATM hasbeen ripped from its base and now appears to be dead. What happened to your money? This is the timeyou are really grateful that your bank uses the concept of a transaction when handling electronic funds.If any part of the transaction fails to complete (in this case the ATM dispensing money to you) eachelement of the transaction cancelled or rolled back.
Reporting Services information is stored in a database. Good practice dictates that all updates ordeletions to data in a database should be wrapped in a transaction to make sure that no data is lost in theevent that something interrupts the process. Reporting Services uses a Batch object to contain all of thechanges to be made to the database. Remember that you are not directly manipulating the informationin the database, but asking some remote object to make these changes for you. Transmitting thetransaction information to the web service in the batch object gives the service all the information itneeds so that the change can all be wrapped in a SQL Server transaction.
The folder form is almost complete. You'll be using this form to add new folders to Reporting Services aswell as update existing folders. You already created a property of the form that you named Mode toindicate if the form is new or an existing item that you are editing. To complete the form you need to get
231
Managing Reports Using Program Code
68787_ch07.qxp 26/03/2004 6:24 PM Page 231

all the information you know about the folder and load it into the controls of the form. You are going toload the form as a modal dialog box, which will not relinquish focus until the form is closed. This allowsyou to use the activated event, which fires when the form is first visible on the screen, to see if the formis in the edit mode. If the form is in the edit mode you can get information about the folder fromReporting Services and load it into the form.
Open the Windows Form Designer generated code region of FolderForm and find the section labeled //FolderForm and add the following line of code after the last line in the section.
C#this.Activated += new EventHandler(FolderForm_Activated);
Adding an event handler in VB.NET is much easier and more intuitive than in C#. From the codewindow for FolderForm just below the title bar select FolderForm Events in the left hand combo box. Inthe right hand combo box select the event you want to trap. Figure 7-14 is an example of how the eventhandler is created for the FolderForm.Activated event:
Figure 7-14
This will declare the event handler for the form Activated event. You also need to add the event handlerusing the following code:
C#private void FolderForm_Activated(object sender, EventArgs e){
// look to see in the form has been placed in the edit modeif (this.Mode == RSUtilities.EditModeEnum.edit){
string path = this.folderPath + "/" + this.folderName;Property[] properties = rsWebService.GetProperties(path, null);foreach (Property property in properties){
if (property.Name == "Description"){
if (property.Value != null) this.textBoxDescription.Text = property.Value.ToString();
}}
}}
VB.NETPrivate Sub FolderForm_Activated(ByVal sender As Object,
ByVal e As System.EventArgs) Handles MyBase.Activated
232
Chapter 7
68787_ch07.qxp 26/03/2004 6:24 PM Page 232

' look to see in the form has been placed in the edit modeIf mMode = RSUtilities.EditModeEnum.edit Then
Dim path As String = Me.FolderPath + "/" + Me.FolderNameDim properties() As ReportingWebService.Property =
mRsWebService.GetProperties(path, Nothing)Dim prop As ReportingWebService.PropertyFor Each prop In properties
If prop.Name = "Description" ThenIf Not prop.Value Is Nothing Then
Me.textBoxDescription.Text = prop.Value.ToString()End If
End IfNext
End IfEnd Sub
The event handler is pretty straightforward. First it looks to see if the form has been placed in the editmode; if not, the entire routine is skipped. If the edit mode has been set, you then get the path of theparent folder, append the separator and the name of the folder to it, and call the GetPropertiesmethod of the web service to retrieve the properties of the folder. This form is pretty simple and you areonly setting the Description property of the folder, so you loop through all the properties until youfind this property and then place its value of the Description property into the description text box.
Now you have a fully functional folder form but no way to call it. Open the Design View of MainFormand click on the File menu to expand its members. Click on the New menu item and double click on theFolder menu item. This declares a menuItemFileNewFolder event and creates a procedure namedmenuItemFileNewFolder_Click to handle this event. Add the following code to the new eventhandler:
C#private void menuItemFileNewFolder_Click(object sender, System.EventArgs e){
FolderForm dialogForm = new FolderForm();string path = this.treeViewFolders.SelectedNode.Tag.ToString();dialogForm.FolderPath = path;dialogForm.RsWebService = rs;dialogForm.ShowDialog(this);// folder has been added show it in the treestring folderName = dialogForm.FolderName;TreeNode newFolder = new TreeNode(folderName);newFolder.Tag = path + folderName + "/";TreeNode parentFolder = this.treeViewFolders.SelectedNode;parentFolder.Nodes.Add(newFolder);
// refresh the tree to show the new folderthis.treeViewFolders.Refresh();// refresh the listviewDisplayFolderContents(path);
// dispose of the local form variabledialogForm.Dispose();
}
233
Managing Reports Using Program Code
68787_ch07.qxp 26/03/2004 6:24 PM Page 233

VB.NETPrivate Sub menuItemFileNewFolder_Click(ByVal sender As System.Object,
ByVal e As System.EventArgs) Handles menuItemFileNewFolder.ClickDim dialogForm As FolderForm = New FolderFormDim path As String = Me.treeViewFolders.SelectedNode.Tag.ToString()dialogForm.FolderPath = pathdialogForm.RsWebService = rsdialogForm.ShowDialog(Me)' folder has been added show it in the treeDim folderName As String = dialogForm.FolderNameDim NewFolder As TreeNode = New TreeNode(folderName)NewFolder.Tag = path + folderName + "/"Dim parentFolder As TreeNode = Me.treeViewFolders.SelectedNodeparentFolder.Nodes.Add(NewFolder)
' refresh the tree to show the new folderMe.treeViewFolders.Refresh()' refresh the listviewDisplayFolderContents(path)
' dispose of the local form variabledialogForm.Dispose()
End Sub
The menuItemFileNewFolder_Click event handler perfoms the following actions:
1. Declare dialogForm as a new instance of the FolderForm class
2. Get the path of the selected TreeView node from its Tag property
3. Assign the path to the FolderPath property of the dialogForm
4. Assign the local instance of the web service to the RsWebService property of dialogForm
5. Open dialogForm as a modal dialog box
After the dialog box has closed, the data from the form will be used to create a new TreeView node,which represents this new folder. Finally the TreeView and ListView will both be refreshed.
You also need a way to initiate an edit session of existing item in a folder. In Windows Explorer you expectto double click on an item to open it, so let's implement similar functionality into our application. Inorder to do this you need to open the code region labeled Windows Form Designer generated code. Afterexpanding this code region, go to the area labeled listViewReports and add an event handler for thedouble click event as shown:
C#// // listViewReports// this.listViewReports.Anchor =((System.Windows.Forms.AnchorStyles)((((System.Windows.Forms.AnchorStyles.Top System.Windows.Forms.AnchorStyles.Bottom) System.Windows.Forms.AnchorStyles.Left)
234
Chapter 7
68787_ch07.qxp 26/03/2004 6:24 PM Page 234

System.Windows.Forms.AnchorStyles.Right)));this.listViewReports.Columns.AddRange(new System.Windows.Forms.ColumnHeader[] {
this.columnHeader1,this.columnHeader2,this.columnHeader3,this.columnHeader4});
this.listViewReports.Location = new System.Drawing.Point(288, 40);this.listViewReports.Name = "listViewReports";this.listViewReports.Size = new System.Drawing.Size(480, 288);this.listViewReports.TabIndex = 1;this.listViewReports.View = System.Windows.Forms.View.Details;this.listViewReports.DoubleClick += new EventHandler(listViewReports_DoubleClick
) ;// // columnHeader1
Again adding this event handler in VB.NET is much easier and more intuitive than in C#. In theMainForm code window select listViewReports in the left combo box and double click in the right combobox.
You now need to create the event handler for the double click event. As this event handler will handlethe double click event for any items in the ListView, you need to examine what type of item you haveselected and then deal with each possible item type. Add the following code to the MainForm:
C#private void listViewReports_DoubleClick(object sender, EventArgs e){
string path = this.treeViewFolders.SelectedNode.Tag.ToString();ListViewItem item = this.listViewReports.SelectedItems[0];string itemType = item.SubItems[1].Text.ToString();switch (itemType){
case "Folder":OpenFolder(path, item.Text);break;
case "DataSource":OpenDataSource(path, item.Text);break;
case "Report":OpenReport(path, item.Text);break;
}return;
}
VB.NETPrivate Sub listViewReports_DoubleClick(ByVal sender As Object,
ByVal e As System.EventArgs) Handles listViewReports.DoubleClick
Dim path As String = Me.treeViewFolders.SelectedNode.Tag.ToString()Dim item As ListViewItem = Me.listViewReports.SelectedItems(0)Dim itemType As String = item.SubItems(1).Text.ToString()
235
Managing Reports Using Program Code
68787_ch07.qxp 26/03/2004 6:24 PM Page 235
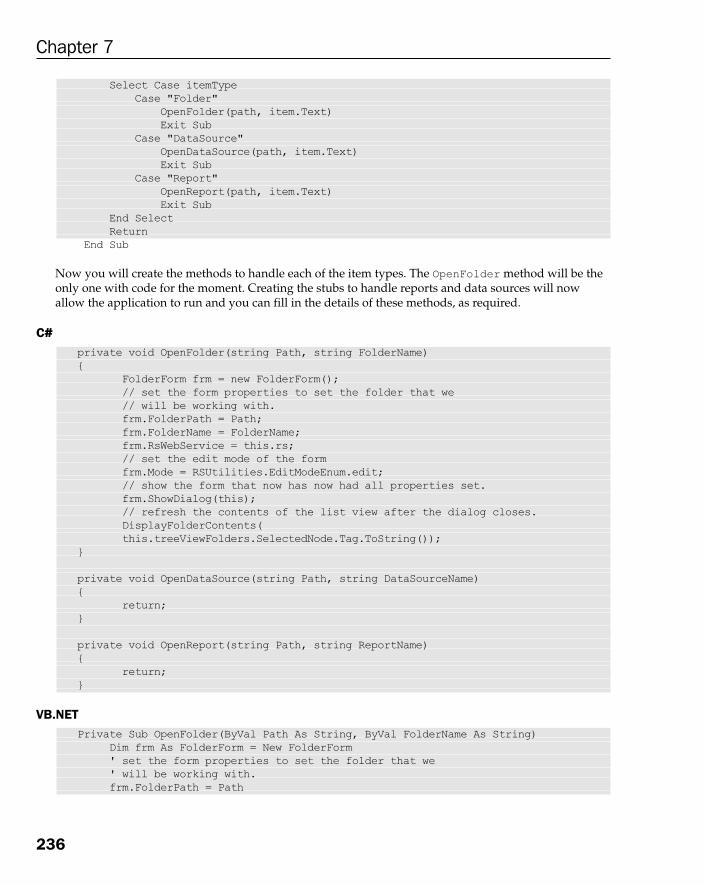
Select Case itemTypeCase "Folder"
OpenFolder(path, item.Text)Exit Sub
Case "DataSource"OpenDataSource(path, item.Text)Exit Sub
Case "Report"OpenReport(path, item.Text)Exit Sub
End SelectReturn
End Sub
Now you will create the methods to handle each of the item types. The OpenFolder method will be theonly one with code for the moment. Creating the stubs to handle reports and data sources will nowallow the application to run and you can fill in the details of these methods, as required.
C#private void OpenFolder(string Path, string FolderName){
FolderForm frm = new FolderForm();// set the form properties to set the folder that we// will be working with.frm.FolderPath = Path;frm.FolderName = FolderName;frm.RsWebService = this.rs;// set the edit mode of the formfrm.Mode = RSUtilities.EditModeEnum.edit;// show the form that now has now had all properties set.frm.ShowDialog(this);// refresh the contents of the list view after the dialog closes.DisplayFolderContents(this.treeViewFolders.SelectedNode.Tag.ToString());
}
private void OpenDataSource(string Path, string DataSourceName){
return;}
private void OpenReport(string Path, string ReportName){
return;}
VB.NETPrivate Sub OpenFolder(ByVal Path As String, ByVal FolderName As String)
Dim frm As FolderForm = New FolderForm' set the form properties to set the folder that we' will be working with.frm.FolderPath = Path
236
Chapter 7
68787_ch07.qxp 26/03/2004 6:24 PM Page 236

frm.FolderName = FolderNamefrm.RsWebService = Me.rs' set the edit mode of the formfrm.Mode = RSUtilities.EditModeEnum.edit' show the form that now has now had all properties set.frm.ShowDialog(Me)' refresh the contents of the list view after the dialog closes.DisplayFolderContents(Me.treeViewFolders.SelectedNode.Tag.ToString())
End Sub
Private Sub OpenDataSource(ByVal Path As String, ByVal DataSourceName As String)Return
End Sub
Private Sub OpenReport(ByVal Path As String, ByVal ReportName As String)Return
End Sub
You are finally ready to try out your code to add a new folder. Run the application and click the Gobutton to fill the TreeView with the folders in Reporting Services. Expand the tree and click on theProfessional SQL Reporting Services folder. From the File menu select New Folder. Enter your informationfor the folder you are creating and click the Add button as shown in Figure 7-15:
Figure 7-15
The main form should now show your new folder in the ListView and the TreeView will have a + sign infront of Professional SQL Reporting Services indicating that there is a child folder below it. You could alsolaunch the Report Manager web application and see the new folder from that tool. Be sure to doubleclick on the newly created folder to open it in the edit mode and modify either its name or description toverify that the edit procedures work, as in Figure 7-16:
Figure 7-16
237
Managing Reports Using Program Code
68787_ch07.qxp 26/03/2004 6:24 PM Page 237

Deleting an Item from a FolderBefore moving on to items other than folders you should investigate how folders as well as other itemscan be deleted from Reporting Services. Open MainForm in the Design View, expand the Edit menu, anddouble click on Delete menu item. This will create an event handler for the click event of this menu item.Into the newly created menuItemEditDelete_Click method, add the following code:
C#private void menuItemEditDelete_Click(object sender, System.EventArgs e){
DeleteServerItems();}
VB.NETPrivate Sub menuItemEditDelete_Click(ByVal sender As Object, ByVal e AsSystem.EventArgs) Handles menuItemEditDelete.Click
DeleteServerItems()End Sub
Now add the method to perform the actual deletion of the item:
C#private void DeleteServerItems(){
if (this.listViewReports.SelectedItems.Count > 0){
bool wasFolder = false;string message =
"Are you certain you want to delete the selected item(s)?";DialogResult result = MessageBox.Show(
this, message, "PSRS_Manager", MessageBoxButtons.YesNo, MessageBoxIcon.Question);
if (result == DialogResult.Yes){
Cursor.Current = Cursors.WaitCursor;string path = this.treeViewFolders.SelectedNode.Tag.ToString();try{
// Set up a reporting services batch to handle the //deletes as a transactionBatchHeader batchHeader = new BatchHeader();batchHeader.BatchID = this.rs.CreateBatch();this.rs.BatchHeaderValue = batchHeader;// Call the delete itemsforeach (ListViewItem item in
this.listViewReports.SelectedItems){
if (item.SubItems[1].Text == "Folder"){
wasFolder = true;}
238
Chapter 7
68787_ch07.qxp 26/03/2004 6:24 PM Page 238

string itemName = path + item.Text;this.rs.DeleteItem(itemName);
}// all the items have been marked for deletion. // Execute the batch.this.rs.ExecuteBatch();this.rs.BatchHeaderValue = null;
}catch (Exception exp){
RSUtilities.ErrorHandler(exp);}finally{
Cursor.Current = Cursors.Default;}if (wasFolder){
this.GetServerFolders();this.listViewReports.Items.Clear();
}else{
// refill the list view with the current list of // itemsDisplayFolderContents(
this.treeViewFolders.SelectedNode.Tag.ToString());}
}}else{
MessageBox.Show("Select an item in the list view to delete.");return;
}}
VB.NETPrivate Sub DeleteServerItems()
If Me.listViewReports.SelectedItems.Count > 0 ThenDim wasFolder As Boolean = FalseDim message As StringDim result As DialogResultmessage = "Are you certain you want to delete the selected item(s)?"result = MessageBox.Show(Me, message, "PSRS_Manager", _
MessageBoxButtons.YesNo, MessageBoxIcon.Question)If result = DialogResult.Yes Then
Cursor.Current = Cursors.WaitCursorDim path As String = Me.treeViewFolders.SelectedNode.Tag.ToString()Try
' Set up a reporting services batch to handle the ' deletes as a transactionDim batchHeader As BatchHeader = New BatchHeader
239
Managing Reports Using Program Code
68787_ch07.qxp 26/03/2004 6:24 PM Page 239

batchHeader.BatchID = Me.rs.CreateBatch()Me.rs.BatchHeaderValue = batchHeader' Call the delete itemsDim item As ListViewItemFor Each item In Me.listViewReports.SelectedItems
If item.SubItems(1).Text = "Folder" ThenwasFolder = True
End IfDim itemName As String = path + item.TextMe.rs.DeleteItem(itemName)
Next' all the items have been marked for deletion. ' Execute the batch.Me.rs.ExecuteBatch()Me.rs.BatchHeaderValue = Nothing
Catch exp As ExceptionRSUtilities.ErrorHandler(exp)
FinallyCursor.Current = Cursors.Default
End TryIf wasFolder Then
Me.GetServerFolders()Me.listViewReports.Items.Clear()
Else' refill the list view with the current list of ' itemsDisplayFolderContents( _
Me.treeViewFolders.SelectedNode.Tag.ToString())End If
End IfElse
MessageBox.Show("Select an item in the list view to delete.")Return
End IfEnd Sub
You will remember the discussion of transactions from when you were working on adding folders toReporting Services. Here we again use a Batch to make sure that all the items you have marked fordeletion are indeed removed from the database. After removing the item from the database, check to seeif the item you removed was a folder; if so refresh the TreeView as well as the ListView.
Importing Report Definition FilesFrom the chapters about designing reports you will remember that a report file is a specially formattedXML document, which contains the complete definition for a report. The report definition is stored inthe database in binary format. In order to save the data, a binary definition is read from a file stream intoan array of Bytes. You will begin this section by adding a new namespace reference to the MainFormcode file.
C#using System.IO;
240
Chapter 7
68787_ch07.qxp 26/03/2004 6:24 PM Page 240

VB.NETImports System.IO
Open MainForm Design View and add an OpenFileDialog control from the toolbox. Change the name ofthe dialog control to open ReportDialog. While still in the design mode, open the File menu and doubleclick on the Import Report menu item. Add the following code to the new event handler that you havejust created for the click event of the menu item.
C#private void menuItemFileImport_Click(object sender, System.EventArgs e){
Stream fileStream;System.Byte[] reportDefinition;string[] filePath = null;// gather the path to put the report in from the selected node// in the treeviewstring path = this.treeViewFolders.SelectedNode.Tag.ToString();// be sure to remove the trailing seperatorif (path.Length > 1){
path = path.Substring(0, path.Length -1);}openReportDialog = new OpenFileDialog();if (openReportDialog.ShowDialog() == DialogResult.OK){
// get the name of the file and its extension from the dialog boxstring delimiterString = @"\";char [] delimiter = delimiterString.ToCharArray();filePath = openReportDialog.FileName.Split(delimiter);// get the name of the report from the pathstring reportName = filePath[filePath.Length - 1];string reportExt = reportName.Substring(reportName.Length - 3, 3);reportName = reportName.Substring(0, reportName.Length - 4);// make sure that the stream is not null.// also make sure that the file extension is rdl indicating that // the file is a report definition.if ((fileStream = openReportDialog.OpenFile())!= null &&
reportExt == "rdl"){
//Now read the file stream to get the report definitiontry{
Cursor.Current = Cursors.WaitCursor;reportDefinition = new Byte[fileStream.Length];// read the report definition from the file stream.fileStream.Read(reportDefinition, 0,
(int) fileStream.Length);fileStream.Close();// the necessary information has been gathered. // Create the reportthis.rs.CreateReport(reportName, path, false,
reportDefinition, null);}
241
Managing Reports Using Program Code
68787_ch07.qxp 26/03/2004 6:24 PM Page 241

catch (Exception){
MessageBox.Show("This report is associated with a shared data source. " + "/" +"Please import the shared data source, " + "/" + "before importing this report.","Exception");
Cursor.Current = Cursors.Default;}finally{
DisplayFolderContents(this.treeViewFolders.SelectedNode.Tag.ToString());Cursor.Current = Cursors.Default;string message = "Report " + reportName +
" imported sucessfully";MessageBox.Show(message);
}}else{
MessageBox.Show("Not a report format or report file is empty");}
}
VB.NETPrivate Sub menuItemFileImport_Click(ByVal sender As Object, _
ByVal e As System.EventArgs) Handles menuItemFileImport.ClickDim fileStream As StreamDim reportDefinition() As System.ByteDim filePath() As String = Nothing' gather the path to put the report in from the selected node' in the treeviewDim path As String = Me.treeViewFolders.SelectedNode.Tag.ToString()' be sure to remove the trailing seperatorIf path.Length > 1 Then
path = path.Substring(0, path.Length - 1)End IfIf openReportDialog.ShowDialog() = DialogResult.OK Then
' get the name of the file and its extension from the dialog boxDim delimiterString As String = "\"Dim delimiter() As Char = delimiterString.ToCharArray()filePath = openReportDialog.FileName.Split(delimiter)' get the name of the report from the pathDim reportName As String = filePath(filePath.Length - 1)Dim reportExt As String = reportName.Substring(reportName.Length - 3, 3)reportName = reportName.Substring(0, reportName.Length - 4)' make sure that the stream is not null.' also make sure that the file extension is rdl indicating that ' the file is a report definition.fileStream = openReportDialog.OpenFile()If (Not (fileStream Is Nothing) And reportExt = "rdl") Then
'Now read the file stream to get the report definition
242
Chapter 7
68787_ch07.qxp 26/03/2004 6:24 PM Page 242

TryCursor.Current = Cursors.WaitCursorReDim reportDefinition(fileStream.Length)' read the report definition from the file stream.fileStream.Read(reportDefinition, 0, fileStream.Length)fileStream.Close()' the necessary information has been gathered. ' Create the reportMe.rs.CreateReport(reportName, path, False,
reportDefinition, Nothing)Catch
MessageBox.Show( _"This report is associated with a shared data source. " + "/" + "Please import the shared data source, " + "/" + _"before importing this report.", _"Exception")
Cursor.Current = Cursors.DefaultFinally
DisplayFolderContents( _Me.treeViewFolders.SelectedNode.Tag.ToString())
Cursor.Current = Cursors.DefaultDim message As String = "Report " + reportName + _
" imported sucessfully"MessageBox.Show(message)
End TryElse
MessageBox.Show("Not a report format or report file is empty")End If
End IfEnd Sub
The purpose of reading the definition into the database is to locate the file to be imported with theOpenFileDialog. Before trying to read the file make sure that a file was actually selected and that itsextension is .rdl. Once you are certain that the file does exist and is the correct type, declare the Bytearray to the length of the stream and read the stream into the array. Finally, call the web methodCreateReport and pass the following:
❑ Name of the report
❑ Path of the parent folder
❑ Boolean value that indicates if an existing report should be overwritten
❑ Definition in a Byte array
❑ Properties array for the report (since you have not set the Properties array this is set to nullor nothing)
The most common error that you might encounter in saving the report is the condition where a report isusing a shared data source that is not already in the database. If saving the report creates an exception, itis assumed that the shared data source is missing and the user must be prompted to import it.
243
Managing Reports Using Program Code
68787_ch07.qxp 26/03/2004 6:24 PM Page 243

Managing SecurityThe next topic that you will learn about for the PSRS_Manager application is security. Reporting Serviceshas a rich security model where permissions can be assigned to folders and individual objects containedin folders. The object model used for the securing Reporting Services items is different from those usedby other Windows security models, so a bit of explanation is in order.
TasksAt the lowest level of the model is the task. A task represents a particular job or action that can be donewith Reporting Services, such as viewing a folder or creating a report. The list of tasks is fixed andcannot be modified. There are two distinct types of tasks:
❑ System tasks: This task applies to the Reporting Services as a whole.
❑ User tasks: This set applies to folders and their contents on a server.
RolesA level up from the task is the role. Each role has an array of tasks, with at least one element, assigned tothem. Roles can be created and deleted. There are pre-defined system roles that have been assignedsystem tasks. Users are strongly discouraged from deleting any of the system roles and those createdduring the installation process. User roles are assigned user tasks and can be created and deleted asneeded. A role cannot be assigned both system and user tasks. The roles included in a Reporting Servicesinstallation include:
❑ Browser
❑ Content Manager
❑ Publisher
PoliciesThe highest level in the security model is the policy. In other security models this would usually bereferred to as a user and indeed a security policy is given to a user or a group. A policy has an array ofroles, with at least one element, assigned to it. A single policy cannot have both system and user securityroles. The user/group account to which a security policy is applied can be either a local computeraccount or a domain account.
Building the Security FormsTo illustrate how the security model in Reporting Services works you will be adding four forms to yourapplication. Although the model has been presented to you in a bottom up fashion, you will be buildingthe application starting at the top level so you can test it as you go along. Let's get started by looking athow to program Reporting Service policies.
Policy FormAdd a new form to your application and name it PoliciesForm and add the following controls:
244
Chapter 7
68787_ch07.qxp 26/03/2004 6:24 PM Page 244

Set the View property of the list view control to Details. Using the ColumnHeader Collection Editoradd two columns and set their properties as shown in the following table:
Arrange the controls on the form so that it looks similar to Figure 7-17:
Figure 7-17
The forms you create to manage security use public properties. These are similar to those used by theFolderForm to pass the path of the folder and a reference to the connected web service.
The code bundle for Chapter 7 will contain the complete code for these properties.
It is always a good practice to reuse code rather than duplicate code. You will use the same form tomanage policies for system and user security. To do this it will be necessary to create a property toindicate if you are intending to work on system or user security.
When you create the forms for managing roles and tasks you will be using similar properties to indicatewhether you want to work on user or system security objects.
Name Text TextAlign Width
columnHeader1 User/Group Name Left 130
columnHeader2 Roles Left 200
Control Type Control Name Text
ListView listViewPolicies
Button buttonAdd Add
Button buttonEdit Edit
Button buttonDelete Delete
Button buttonOk OK
245
Managing Reports Using Program Code
68787_ch07.qxp 26/03/2004 6:24 PM Page 245

Open the code window for PoliciesForm (as shown in the Figure 7-17) and add the following privatevariable to the class.
C#//Private form variablesprivate string itemPath = "";private string itemName = "";private ReportingService rsWebService = null;private RSUtilities.EditModeEnum mode;private bool systemPolicies = false;
VB.NET'Private form variablesPrivate mItemPath As String = ""Private mItemName As String = ""Private mRSWebService As ReportingService = NothingPrivate mMode As RSUtilities.EditModeEnumPrivate mSystemPolicies As Boolean = False
Add a public property to indicate if the form is to work on system security or object security.
C#public bool SystemPolicies{
get{return systemPolicies;
}set{systemPolicies = value;
} }
VB.NETPublic Property SystemPolicies() As Boolean
GetReturn mSystemPolicies
End GetSet(ByVal Value As Boolean)
mSystemPolicies = ValueEnd Set
End Property
Now add the following method to get an array of policy objects for either an item or the system. Theitem can be a folder or an object contained in a folder.
C#private Policy[] GetItemPolicies(){
ReportingWebService.Policy[] policies;
246
Chapter 7
68787_ch07.qxp 26/03/2004 6:24 PM Page 246

bool inheritParent;if (! systemPolicies){policies = this.rsWebService.GetPolicies(itemPath, out inheritParent);
}else{policies = rsWebService.GetSystemPolicies();
}return policies;
}
VB.NETPrivate Function GetItemPolicies() As Policy()
Dim policies() As ReportingWebService.PolicyDim inheritParent As BooleanIf Not mSystemPolicies Then
policies = mRSWebService.GetPolicies(mItemPath, inheritParent)Else
policies = mRSWebService.GetSystemPolicies()End IfReturn policies
End Function
The web service methods that return the array of policy objects are:
❑ GetPolicies: This method takes the path of the item you want to work on and a Booleanoutput parameter as arguments. The inheritParent output parameter indicates if the iteminherits its permission set from its parent.
❑ GetSystemPolicies: This method takes no arguments.
Now that you have a way to get the policies from the web service, you need to show the policies in thelist view control. Enter the following procedure in the code for PoliciesForm.
C#private void FillPolicyListView(){
this.listViewPolicies.Items.Clear();ReportingWebService.Policy[] policies = GetItemPolicies();foreach(ReportingWebService.Policy policy in policies){ListViewItem item = new ListViewItem(policy.GroupUserName.ToString());string rolesCollection = "";foreach(ReportingWebService.Role role in policy.Roles){
rolesCollection += "," + role.Name.ToString();}rolesCollection = rolesCollection.Substring(1, rolesCollection.Length - 1);item.SubItems.Add(rolesCollection);this.listViewPolicies.Items.Add(item);
}}
247
Managing Reports Using Program Code
68787_ch07.qxp 26/03/2004 6:24 PM Page 247
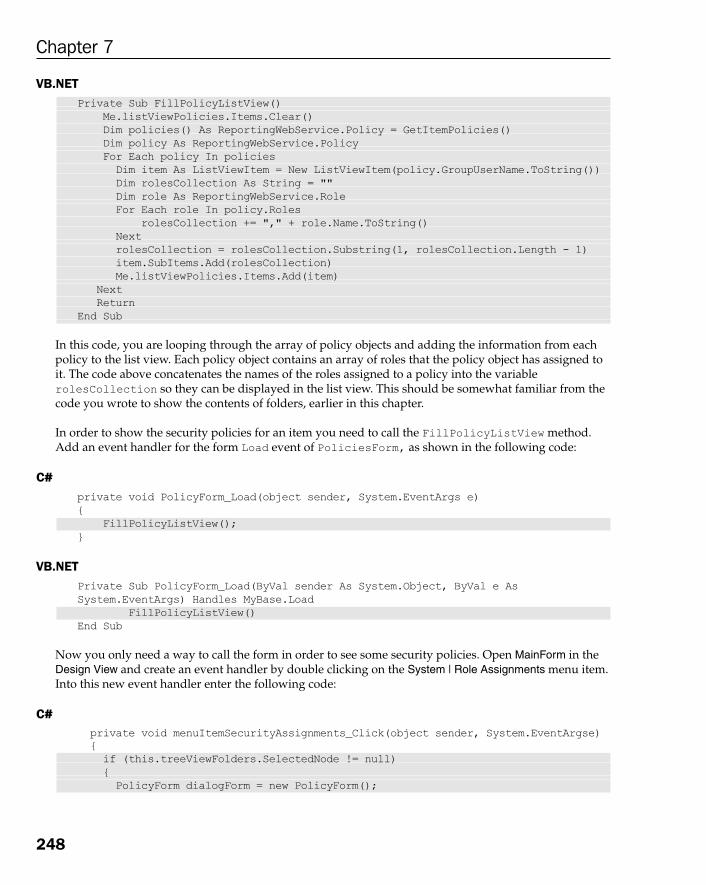
VB.NETPrivate Sub FillPolicyListView()
Me.listViewPolicies.Items.Clear()Dim policies() As ReportingWebService.Policy = GetItemPolicies()Dim policy As ReportingWebService.PolicyFor Each policy In policiesDim item As ListViewItem = New ListViewItem(policy.GroupUserName.ToString())Dim rolesCollection As String = ""Dim role As ReportingWebService.RoleFor Each role In policy.Roles
rolesCollection += "," + role.Name.ToString()NextrolesCollection = rolesCollection.Substring(1, rolesCollection.Length - 1)item.SubItems.Add(rolesCollection)Me.listViewPolicies.Items.Add(item)
NextReturn
End Sub
In this code, you are looping through the array of policy objects and adding the information from eachpolicy to the list view. Each policy object contains an array of roles that the policy object has assigned toit. The code above concatenates the names of the roles assigned to a policy into the variablerolesCollection so they can be displayed in the list view. This should be somewhat familiar from thecode you wrote to show the contents of folders, earlier in this chapter.
In order to show the security policies for an item you need to call the FillPolicyListView method.Add an event handler for the form Load event of PoliciesForm, as shown in the following code:
C#private void PolicyForm_Load(object sender, System.EventArgs e){
FillPolicyListView();}
VB.NETPrivate Sub PolicyForm_Load(ByVal sender As System.Object, ByVal e AsSystem.EventArgs) Handles MyBase.Load
FillPolicyListView()End Sub
Now you only need a way to call the form in order to see some security policies. Open MainForm in theDesign View and create an event handler by double clicking on the System | Role Assignments menu item.Into this new event handler enter the following code:
C#private void menuItemSecurityAssignments_Click(object sender, System.EventArgse){if (this.treeViewFolders.SelectedNode != null){PolicyForm dialogForm = new PolicyForm();
248
Chapter 7
68787_ch07.qxp 26/03/2004 6:24 PM Page 248

dialogForm.ItemPath = this.treeViewFolders.SelectedNode.Tag.ToString();dialogForm.ItemName = this.treeViewFolders.SelectedNode.Text.ToString();dialogForm.RsWebService = rs;dialogForm.ShowDialog(this);
}else{MessageBox.Show("Select a folder you want to view policies for");
}}
VB.NETPrivate Sub menuItemSecurityAssignments_Click(ByVal sender As System.Object, ByVale As System.EventArgs) Handles menuItemSecurityAssignments.Click
If Not (Me.treeViewFolders.SelectedNode Is Nothing) ThenDim dialogForm As PolicyForm = New PolicyFormdialogForm.ItemPath = Me.treeViewFolders.SelectedNode.Tag.ToString()dialogForm.ItemName = Me.treeViewFolders.SelectedNode.Text.ToString()dialogForm.RsWebService = rsdialogForm.ShowDialog(Me)
ElseMessageBox.Show("Select a folder you want to view policies for")
End IfEnd Sub
This code is very similar to the code you entered when working with folders. You declare a variable as anew PoliciesForm, set the form properties for the path and name of the folder, pass the reference to theweb service and show the form as a modal dialog. Now is a good time to add the code for viewing thesystem policies. Add an event handler for the Security | System Role Assignments menu selection and addthe following code to the event handler:
C#private void menuItemSecuritySystemAssignments_Click(object sender,
System.EventArgs e){
PolicyForm dialogForm = new PolicyForm();dialogForm.ItemPath = "/";dialogForm.ItemName = "Site Settings";dialogForm.RsWebService = rs;dialogForm.SystemPolicies = true;dialogForm.ShowDialog(this);
}
VB.NETPrivate Sub menuItemSecuritySystemAssignments_Click(ByVal sender As System.Object,ByVal e As System.EventArgs) Handles menuItemSecuritySystemAssignments.Click
Dim dialogForm As PolicyForm = New PolicyFormdialogForm.ItemPath = "/"dialogForm.ItemName = "Site Settings"dialogForm.RsWebService = rsdialogForm.SystemPolicies = TruedialogForm.ShowDialog(Me)
End Sub
249
Managing Reports Using Program Code
68787_ch07.qxp 26/03/2004 6:24 PM Page 249

The only interesting difference between these event handlers and the event handlers for user objects isthat here you set the path to the root path \, and the SystemPolicies property is set to true.
Save your changes and run the application. Click the Go button to load the folder tree and select theProfessional SQL Reporting Services folder from the tree. Then select the Security | Role Assignmentsmenu item. You should see the policy form as shown in Figure 7-18:
Figure 7-18
Adding, Editing, and Deleting Security PoliciesBeing able to view a list of policies is useful, but to manage Reporting Services you need to be able tomake changes to the policies. Add a new form to your application and name it UserPolicyForm. Addthe following controls to the form:
Set the DialogResult property of buttonCancel to Cancel and the DialogResult property ofbuttonOk to OK. Arrange the controls on the form as shown in Figure 7-19:
Control Type Control Name Text
Label labelItemName Item name
Label label1 User/Group Name
TextBox textBoxUserGroupName
CheckedListBox checkedListBoxRoles
Button buttonCancel Cancel
Button buttonOk OK
250
Chapter 7
68787_ch07.qxp 26/03/2004 6:24 PM Page 250

Figure 7-19
Again we will be using properties and private member variables to hold information about the objectname, object path, and a reference to the web service. Add the following private variables and propertiesto the form.
C#// Private form variablesprivate string itemPath = "";private string itemName = "";private RSUtilities.EditModeEnum mode;private ReportingService rsWebService = null;private bool systemRoles = false;private ReportingWebService.Policy userPolicy = null;private Role[] itemRoles = null;public bool SystemRoles{
get{return systemRoles;
}set{systemRoles = value;
}}
public Policy UserPolicy{
get{return userPolicy;
}set{userPolicy = value;this.textBoxUserGroupName.Text = userPolicy.GroupUserName.ToString();
}}
251
Managing Reports Using Program Code
68787_ch07.qxp 26/03/2004 6:24 PM Page 251

VB.NET 'Private form variablesPrivate mItemPath As String = ""Private mItemName As String = ""Private mRSWebService As ReportingService = NothingPrivate mMode As RSUtilities.EditModeEnumPrivate mSystemRoles As Boolean = FalsePrivate mUserPolicy As ReportingWebService.Policy = NothingPrivate itemRoles() As Role = Nothing
Public Property SystemRoles() As BooleanGet
Return mSystemRolesEnd GetSet(ByVal Value As Boolean)
mSystemRoles = ValueEnd Set
End Property
Public Property UserPolicy() As PolicyGet
Return mUserPolicyEnd GetSet(ByVal Value As Policy)
mUserPolicy = ValueMe.textBoxUserGroupName.Text = userPolicy.GroupUserName.ToString()
End SetEnd Property
The UserPolicy property is used to pass a policy object to the form so it can be edited and return thenew or modified policy to the calling form.
The work of this form will take place in the event handlers for the two buttons and the form load event.Create these event handlers and add the following code.
C#private void UserForm_Load(object sender, System.EventArgs e){
if (systemRoles){itemRoles = this.rsWebService.ListSystemRoles();
}else{itemRoles = this.rsWebService.ListRoles();
}foreach (ReportingWebService.Role role in itemRoles){
bool checkRole = false;if (this.userPolicy != null){
foreach(ReportingWebService.Role userRole in userPolicy.Roles)
252
Chapter 7
68787_ch07.qxp 26/03/2004 6:24 PM Page 252

{if (userRole.Name == role.Name){checkRole = true;break;
}}
}this.checkedListBoxRoles.Items.Add(role.Name.ToString(),checkRole);
}}
VB.NETPrivate Sub UserPolicyForm_Load(ByVal sender As System.Object, ByVal e AsSystem.EventArgs) Handles MyBase.Load
If (mSystemRoles) ThenitemRoles = Me.mRSWebService.ListSystemRoles()
ElseitemRoles = Me.mRSWebService.ListRoles()
End IfDim objRole As ReportingWebService.RoleFor Each objRole In itemRoles
Dim checkRole As Boolean = FalseIf Not (mUserPolicy Is Nothing) Then
Dim userRole As ReportingWebService.RoleFor Each userRole In UserPolicy.Roles
If (userRole.Name = objRole.Name) ThencheckRole = TrueExit For
End IfNext
End IfMe.checkedListBoxRoles.Items.Add(objRole.Name.ToString(), checkRole)
NextEnd Sub
The UserPolicyForm_Load method shown here first determines whether or not you want to work withsystem or user policies by evaluating the systemRoles variable. The existing system and user roles areloaded into the itemRoles variable with either the ListSystemRoles or ListRoles methods of theweb service. The itemRoles variable has form level scope so it can be initialized as part of the form loadevent but still is available when the roles are needed again when you process any changes at the timewhen the form is closed. The list of roles is created by looping through the array or roles found in theitemRoles variable. If the UserPolicy property has been set, you loop through the array of rolesassociated with the policy and compare the name property to the name property of the role fromitemRoles to determine if the check box of an item should be checked.
The event handler for the click event of buttonOK either assigns an array of roles to a new policy orassignes a new array of roles to the existing policy. Add the following code into the buttonOK_Clickand buttonCancel_Click event handlers:
253
Managing Reports Using Program Code
68787_ch07.qxp 26/03/2004 6:24 PM Page 253

C#private void buttonOK_Click(object sender, System.EventArgs e){
int roleCount = this.checkedListBoxRoles.CheckedItems.Count;if (this.mode == RSUtilities.EditModeEnum.add){this.userPolicy = new Policy();userPolicy.GroupUserName = this.textBoxUserGroupName.Text.ToString();
}Role[] userRoles = new Role[roleCount];for (int i = 0; i < this.checkedListBoxRoles.CheckedItems.Count; i++){foreach(Role role in itemRoles){if (role.Name == this.checkedListBoxRoles.CheckedItems[i].ToString()){userRoles[i] = role;break;
}}
}userPolicy.Roles = userRoles;this.Close();
}private void buttonCancel_Click(object sender, System.EventArgs e){
this.Close();}
VB.NETPrivate Sub buttonOK_Click(ByVal sender As Object, ByVal e As System.EventArgs)
Handles buttonOK.ClickDim roleCount As Integer = Me.checkedListBoxRoles.CheckedItems.CountIf mMode = RSUtilities.EditModeEnum.add Then
mUserPolicy = New PolicymUserPolicy.GroupUserName = Me.textBoxUserGroupName.Text.ToString()
End IfDim userRoles(roleCount - 1) As ReportingWebService.RoleDim i As IntegerFor i = 0 To Me.checkedListBoxRoles.CheckedItems.Count - 1 Step 1
Dim objRole As ReportingWebService.RoleFor Each objRole In itemRoles
If objRole.Name = Me.checkedListBoxRoles.CheckedItems(i).ToString() ThenuserRoles(i) = objRoleExit For
End IfNext
NextmUserPolicy.Roles = userRolesMe.Close()
End Sub
254
Chapter 7
68787_ch07.qxp 26/03/2004 6:24 PM Page 254

Private Sub buttonCancel_Click(ByVal sender As Object, ByVal e As System.EventArgs) Handles buttonCancel.Click
Me.Close()End Sub
The code behind the buttonOK click event checks the UserPolicy property. If a policy has not beenassigned to the property, a new policy is created. A new variable, userRoles, is then declared as a arrayof roles. The number of elements in userRoles will be the number of checked items in the checked listbox. The elements of userRoles are added from the itemRoles array by comparing the text propertyof the checked items in the checked list box to the Name property of the elements of the itemRoles array.The last step before closing the form is to assign the userRoles array to the Roles property of thepolicy held by the UserPolicy property of the form.
Although the code presented here has created a new policy or modified an existing one, this policy hasnot been applied to either the system or an item in a Reporting Services folder. The assignment of thepolicy takes place after form closes and control is returned to the calling form. To complete the policyassignment you need to create a couple of methods in the code of PolicyForm. Open the code windowof PolicyForm and enter the following code:
C#private void SetItemPolicies(Policy[] NewPolicy){
try{
// Create the batch to handle the transactionBatchHeader batchHeader = new BatchHeader();batchHeader.BatchID = rsWebService.CreateBatch();rsWebService.BatchHeaderValue = batchHeader;// set the policies for the item to the new policy// array passed to the procedurersWebService.SetPolicies(this.itemPath, NewPolicy);// execute the batchthis.rsWebService.ExecuteBatch();this.rsWebService.BatchHeaderValue = null;
}catch(Exception exp){
RSUtilities.ErrorHandler(exp);}
}
VB.NETPrivate Sub SetItemPolicies(ByVal NewPolicy() As Policy)
Try' Create the batch to handle the transactionDim batchHeader As batchHeader = New batchHeaderbatchHeader.BatchID = mRSWebService.CreateBatch()mRSWebService.BatchHeaderValue = batchHeader' set the policies for the item to the new policy' array passed to the proceduremRSWebService.SetPolicies(mItemPath, NewPolicy)' execute the batchmRSWebService.ExecuteBatch()
255
Managing Reports Using Program Code
68787_ch07.qxp 26/03/2004 6:24 PM Page 255

mRSWebService.BatchHeaderValue = NothingCatch exp As Exception
RSUtilities.ErrorHandler(exp)End TryReturn
End Sub
The SetPolicies method of the web service is used to associate a policy that you have created with anitem in the Report Server. SetPolicies method takes a path to an item and an array of policy objects asarguments in the Reporting Services database. Any time changes are made to database objects andsetting the policies for an item makes changes to the existing policies, so it is vital that these changes bewrapped in a transaction. You will remember from the code used to create new folders, that theReporting Services object for supporting transactions is a batch. The SetItemPolicies method uses thebatch header and batch objects to make sure that all the database updates are completed successfully orrolled back entirely.
Adding a New Policy
Now that you have a form to create a new policy and a method to assign a policy array to an object inthe database, you need methods to call the form, set its properties, and do something with the returneduser policy. Create an event handler for the click event of buttonAdd of PolicyForm and add thefollowing code:
C#private void buttonAdd_Click(object sender, System.EventArgs e){
UserPolicyForm dialogForm = new UserPolicyForm();dialogForm.RsWebService = rsWebService;dialogForm.ItemName = this.itemName;dialogForm.ItemPath = this.ItemPath;dialogForm.SystemRoles = this.systemPolicies;dialogForm.Mode = RSUtilities.EditModeEnum.add;dialogForm.ShowDialog(this);if (dialogForm.DialogResult == DialogResult.OK){Policy newPolicy = dialogForm.UserPolicy;if (newPolicy != null){Policy[] currentPolicies = GetItemPolicies();Policy[] newPolicies = new Policy[currentPolicies.Length + 1];for (int i = 0; i < currentPolicies.Length; i++){newPolicies[i] = currentPolicies[i];
}newPolicies[currentPolicies.Length] = newPolicy;SetItemPolicies(newPolicies);FillPolicyListView();
}}
}
256
Chapter 7
68787_ch07.qxp 26/03/2004 6:24 PM Page 256

VB.NETPrivate Sub buttonAdd_Click(ByVal sender As System.Object, ByVal e As
System.EventArgs) Handles buttonAdd.ClickDim dialogForm As UserPolicyForm = New UserPolicyFormdialogForm.RsWebService = mRSWebServicedialogForm.ItemName = mItemNamedialogForm.ItemPath = mItemPathdialogForm.SystemRoles = mSystemPoliciesdialogForm.Mode = RSUtilities.EditModeEnum.adddialogForm.ShowDialog(Me)If dialogForm.DialogResult = DialogResult.OK Then
Dim newPolicy As Policy = dialogForm.UserPolicyIf Not newPolicy Is Nothing Then
Dim currentPolicies() As Policy = GetItemPolicies()Dim NewPolicies(currentPolicies.Length) As PolicyDim i As IntegerFor i = 0 To currentPolicies.Length - 1 Step 1
NewPolicies(i) = currentPolicies(i)NextNewPolicies(currentPolicies.Length) = newPolicySetItemPolicies(NewPolicies)FillPolicyListView()
End IfEnd IfReturn
End Sub
Instantiating a new form variable, setting properties, and displaying it as a modal dialog should lookvery familiar. When you created the buttons on UserPolicyForm you had set the DialogResultproperty for each button. The event handler checks to make sure that the OK button was used to closethe form and that the dialog's UserPolicy property returns a valid policy. If these two conditions aremet then the UserPolicy from the dialog form is added to the existing policies of the database object ina new array of policies. The last step is to set the policies of the database object to the new array ofpolicies with the SetItemPolicies method.
Editing an Existing Policy
Another important task that PSRS_Manager should be able to do is to modify the roles of an existinguser. Create an event handler for the click event of buttonEdit on PolicyForm and insert the followingcode:
C#private void buttonEdit_Click(object sender, System.EventArgs e){
if (this.listViewPolicies.SelectedItems.Count == 0){MessageBox.Show("Select a user for which to edit roles.");return;
}Policy[] currentPolicies = GetItemPolicies();Policy userPolicy = null;foreach (Policy policy in currentPolicies)
257
Managing Reports Using Program Code
68787_ch07.qxp 26/03/2004 6:24 PM Page 257

{if (policy.GroupUserName == this.listViewPolicies.SelectedItems[0].Text.
ToString()){userPolicy = policy;break;
}}UserPolicyForm dialogForm = new UserPolicyForm();dialogForm.RsWebService = rsWebService;dialogForm.ItemName = this.itemName;dialogForm.ItemPath = this.itemPath;dialogForm.UserPolicy = userPolicy;dialogForm.SystemRoles = this.systemPolicies;dialogForm.Mode = RSUtilities.EditModeEnum.edit;dialogForm.ShowDialog(this);if (dialogForm.DialogResult == DialogResult.Ok){userPolicy = dialogForm.UserPolicy;Policy[] newPolicies = new Policy[currentPolicies.Length];for (int i = 0; i < currentPolicies.Length; i++){if (userPolicy.GroupUserName == currentPolicies[i].GroupUserName){newPolicies[i] = userPolicy;
}else{newPolicies[i] = currentPolicies[i];
}}SetItemPolicies(newPolicies);FillPolicyListView();
}return;
}
VB.NETPrivate Sub buttonEdit_Click(ByVal sender As System.Object, ByVal e As
System.EventArgs) Handles buttonEdit.ClickIf Me.listViewPolicies.SelectedItems.Count = 0 Then
MessageBox.Show("Select a user for which to edit roles.")Return
End IfDim currentPolicies() As ReportingWebService.Policy = GetItemPolicies()Dim userPolicy As ReportingWebService.Policy = NothingDim objPolicy As ReportingWebService.PolicyFor Each objPolicy In currentPoliciesIf objPolicy.GroupUserName = Me.listViewPolicies.SelectedItems(0).Text.
ToString() ThenuserPolicy = objPolicyExit For
End If
258
Chapter 7
68787_ch07.qxp 26/03/2004 6:24 PM Page 258

NextDim dialogForm As UserPolicyForm = New UserPolicyFormdialogForm.RsWebService = mRSWebServicedialogForm.ItemName = mItemNamedialogForm.ItemPath = mItemPathdialogForm.UserPolicy = userPolicydialogForm.SystemRoles = mSystemPoliciesdialogForm.Mode = RSUtilities.EditModeEnum.editdialogForm.ShowDialog(Me)If dialogForm.DialogResult = DialogResult.OK Then
userPolicy = dialogForm.UserPolicyDim newPolicies(currentPolicies.Length - 1) As PolicyDim i As IntegerFor i = 0 To currentPolicies.Length - 1 Step 1
If userPolicy.GroupUserName = currentPolicies(i).GroupUserName ThennewPolicies(i) = userPolicy
ElsenewPolicies(i) = currentPolicies(i)
End IfNextSetItemPolicies(newPolicies)FillPolicyListView()
End IfReturn
End Sub
The code here is very similar to the code to add a new policy. The UserPolicy of the dialog form is setto the policy selected with the list view. Rather than creating a new policy and adding it to the existingpolicy array, the modified policy replaces the original in the array before the SetItemPolicies methodis called.
Deleting a Policy
Change is a constant in any organization. It is likely that it will be necessary to revoke user privileges asthe structure of your organization changes over time. PolicyForm has a delete button and now wouldbe a good time to make it functional. Create an event handler for the click event of buttonDelete andenter the following code:
C#private void buttonDelete_Click(object sender, System.EventArgs e){
if (this.listViewPolicies.SelectedItems.Count == 0){MessageBox.Show("Select a user/group to delete.");return;
}DialogResult result = MessageBox.Show("Are you sure you want to delete this
policy?","Delete Policy",MessageBoxButtons.YesNo,MessageBoxIcon.Question);
if (result == DialogResult.Yes){string userName = this.listViewPolicies.SelectedItems[0].Text;
259
Managing Reports Using Program Code
68787_ch07.qxp 26/03/2004 6:24 PM Page 259

Policy[] currentPolicies = GetItemPolicies();Policy[] newPolicies = new Policy[currentPolicies.Length -1];int i = 0;foreach (Policy policy in currentPolicies){if (policy.GroupUserName != userName){newPolicies[i] = policy;i++;
}}SetItemPolicies(newPolicies);FillPolicyListView();
}return;
}
VB.NETPrivate Sub buttonDelete_Click(ByVal sender As System.Object, ByVal e AsSystem.EventArgs) Handles buttonDelete.Click
If Me.listViewPolicies.SelectedItems.Count = 0 ThenMessageBox.Show("Select a user/group to delete.")Return
End IfDim result As DialogResultresult = MessageBox.Show("Are you sure you want to delete this policy?", _
"Delete Policy", MessageBoxButtons.YesNo, _MessageBoxIcon.Question)
If result = DialogResult.Yes ThenDim userName As String = Me.listViewPolicies.SelectedItems(0).TextDim currentPolicies() As ReportingWebService.Policy = GetItemPolicies()Dim NewPolicies(currentPolicies.Length - 2) As ReportingWebService.PolicyDim i As Integer = 0Dim objPolicy As ReportingWebService.PolicyFor Each objPolicy In currentPolicies
If objPolicy.GroupUserName <> userName ThenNewPolicies(i) = objPolicyi = i + 1
End IfNextSetItemPolicies(NewPolicies)FillPolicyListView()
End IfReturn
End Sub
This is very similar to the way you edited the array of policies for the edit routine; instead of performinga replacement, the policy selected for deletion is eliminated from the new array of policies sent to theSetItemPolicies method.
It's about time to check if all this code actually works. Save all your changes and run the application.After clicking Go, select the Security | Role Assignments menu item and click the Add button on the policy
260
Chapter 7
68787_ch07.qxp 26/03/2004 6:24 PM Page 260

form to display the form for adding a new user policy. Enter a valid user or group name and assign theuser some roles, similar to Figure 7-20:
Figure 7-20
After clicking the Add button the policy form should show the new policy in the list view similar toFigure 7-21:
Figure 7-21
Adding, Editing, and Deleting Security RolesWith the ability to create and modify policies, it is now time to look at how roles are created andmodified. As mentioned at the beginning of this section you learned that the installation of ReportingServices creates a number of user and system roles. For most users the roles created during theinstallation provide all the options necessary to manage an installation. You may encounter a need tocreate a special purpose role so lets dive into how that is done.
RoleFormAdd a new form to your application and name it RoleForm. From the toolbox add the following controlsto RoleForm:
261
Managing Reports Using Program Code
68787_ch07.qxp 26/03/2004 6:24 PM Page 261

Set the View property of the list view control to Details. Using the ColumnHeader Collection Editoradd two columns and set their properties as shown in the following table:
Arrange the controls on the form so it looks similar to Figure 7-22:
Figure 7-22
Open the code for RoleForm and add the following private form variables to hold form property values.
C#// Private form variablesprivate Role[] roles = null;private bool systemRoles = false;private ReportingService rsWebService = null;
Name Text TextAlign Width
columnHeader1 Role Name Left 130
columnHeader2 Description Left 500
Control Type Control Name Text
Label labelRoleName Role name
ListView listViewRoles
Button buttonAdd Add
Button buttonEdit Edit
Button buttonDelete Delete
Button buttonOk OK
262
Chapter 7
68787_ch07.qxp 26/03/2004 6:24 PM Page 262

VB.NET'Private form variablesPrivate mRoles() As Role = NothingPrivate mSystemRoles As Boolean = FalsePrivate mRSWebService As ReportingService = Nothing
Now add the following property methods shown to the form.
C#public bool SystemRoles{
get{return systemRoles;
}set{systemRoles = value;
}}public ReportingService RsWebService{set{rsWebService = value;
}}
VB.NETPublic Property SystemRoles() As Boolean
GetReturn mSystemRoles
End GetSet(ByVal Value As Boolean)
mSystemRoles = ValueEnd Set
End PropertyPublic WriteOnly Property RsWebService() As ReportingService
Set(ByVal Value As ReportingService)mRSWebService = Value
End SetEnd Property
Very similar to the way you displayed the policies for a folder, you will also need a method to fill the listview with role information. Enter the following method into the code window for RoleForm:
C#private void FillRoleListView(){
this.listViewRoles.Items.Clear();if (systemRoles)
263
Managing Reports Using Program Code
68787_ch07.qxp 26/03/2004 6:24 PM Page 263

{roles = rsWebService.ListSystemRoles();this.labelRoleName.Text = "System Roles";
}else{roles = rsWebService.ListRoles();this.labelRoleName.Text = "User Item Roles";
}foreach (Role role in roles){ListViewItem item = new ListViewItem();item.Text = role.Name.ToString();item.SubItems.Add(role.Description.ToString());this.listViewRoles.Items.Add(item);
}}
VB.NETPrivate Sub FillRoleListView()
Me.listViewRoles.Items.Clear()If (systemRoles) Then
mRoles = mRSWebService.ListSystemRoles()Me.labelRoleName.Text = "System Roles"
ElsemRoles = mRSWebService.ListRoles()Me.labelRoleName.Text = "User Item Roles"
End IfDim role As ReportingWebService.RoleFor Each role In mRoles
Dim item As ListViewItem = New ListViewItemitem.Text = role.Name.ToString()item.SubItems.Add(role.Description.ToString())Me.listViewRoles.Items.Add(item)
NextReturn
End Sub
The web service methods ListRoles and ListSystemRoles each return an array of role objects. Thearray or role objects returned from the calls to the web methods is used to fill the list view withinformation. To call the FillRoleListView method, create an event handler for the form load eventand enter this code.
C#private void RoleForm_Load(object sender, System.EventArgs e){
FillRoleListView();}
VB.NETPrivate Sub RoleForm_Load(ByVal sender As System.Object, ByVal e AsSystem.EventArgs) Handles MyBase.Load
FillRoleListView()End Sub
264
Chapter 7
68787_ch07.qxp 26/03/2004 6:24 PM Page 264

Go back to MainForm and enter event handlers for the menu items menuItemSecurityRoles andmenuItemSecuritySystemRoles. Insert the following code into the new event handlers.
C#private void menuItemSecurityRoles_Click(object sender, System.EventArgs e){
RoleForm dialogForm = new RoleForm();dialogForm.RsWebService = rs;dialogForm.ShowDialog(this);
}
private void menuItemSecuritySystemRoles_Click(object sender, System.EventArgs e)
{RoleForm dialogForm = new RoleForm();dialogForm.RsWebService = rs;dialogForm.SystemRoles = true;dialogForm.ShowDialog(this);
}
VB.NETPrivate Sub menuItemSecurityRoles_Click(ByVal sender As System.Object, ByVal e AsSystem.EventArgs) Handles menuItemSecurityRoles.Click
Dim dialogForm As RoleForm = New RoleFormdialogForm.RsWebService = rsdialogForm.ShowDialog(Me)
End Sub
Private Sub menuItemSecuritySystemRoles_Click(ByVal sender As System.Object, ByVale As System.EventArgs) Handles menuItemSecuritySystemRoles.Click
Dim dialogForm As RoleForm = New RoleFormdialogForm.RsWebService = rsdialogForm.SystemRoles = TruedialogForm.ShowDialog(Me)
End Sub
Save the changes you have made and run the application. When MainForm is displayed click Go andthen select then Security | Roles menu item. You should see the RoleForm displayed looking similar toFigure 7- 23. These are roles that exist on the Reporting Services server.
Figure 7-23
265
Managing Reports Using Program Code
68787_ch07.qxp 26/03/2004 6:24 PM Page 265

Adding, Editing, and Deleting RolesNow that you can show the list of roles, let's add, edit, and delete roles.
Role Task FormAdd a new form to your application and name it RoleTaskForm. From the toolbox add the followingcontrols to RoleTaskForm:
Arrange the controls on the form as shown in Figure 7-24:
Figure 7-24
Add the following private variables to the code window of RoleTaskForm.
C#// Private form variablesprivate ReportingService rsWebService = null;private RSUtilities.EditModeEnum mode;private bool isSystemRole = false;private ReportingWebService.Role userRole = null;private Task[] itemTasks = null;
Control Type Control Name Text
Label label1 Role name
Label label2 Description
TextBox textBoxRoleName
TextBox textBoxDescription
CheckedListBox checkedListBoxTasks
Button buttonCancel Cancel
Button buttonOk OK
266
Chapter 7
68787_ch07.qxp 26/03/2004 6:24 PM Page 266

VB.NET' Private form variablesPrivate mRsWebService As ReportingService = NothingPrivate mMode As RSUtilities.EditModeEnumPrivate mIsSystemRole As Boolean = FalsePrivate mUserRole As ReportingWebService.Role = NothingPrivate mItemTasks() As Task = Nothing
In addition to the standard Mode and RsWebService properties that you have used with previousforms, add the following properties to your RoleTaskForm:
C#public bool IsSystemRole{
get{return isSystemRole;
}set{isSystemRole = value;
}}
public Role UserRole{
get{return userRole;
}set{userRole = value;this.textBoxRoleName.Text = userRole.Name.ToString();this.textBoxDescription.Text = userRole.Description.ToString();
}}
VB.NETPublic Property IsSystemRole() As Boolean
GetReturn mIsSystemRole
End GetSet(ByVal Value As Boolean)
mIsSystemRole = ValueEnd Set
End PropertyPublic Property UserRole() As ReportingWebService.Role
GetReturn mUserRole
End GetSet(ByVal Value As ReportingWebService.Role)
267
Managing Reports Using Program Code
68787_ch07.qxp 26/03/2004 6:24 PM Page 267

mUserRole = ValueMe.textBoxRoleName.Text = mUserRole.Name.ToString()Me.textBoxDescription.Text = mUserRole.Description.ToString()
End SetEnd Property
Add an event handler for the form load event and enter the following code.
C#private void RoleTaskForm_Load(object sender, System.EventArgs e){
string description = "";Task[] userRoleTasks = null;if (isSystemRole){itemTasks = this.rsWebService.ListSystemTasks();
}else{itemTasks = this.rsWebService.ListTasks();
}if (userRole != null){userRoleTasks = rsWebService.GetRoleProperties(userRole.Name.ToString(), out
description);}foreach (ReportingWebService.Task task in itemTasks){bool checkTask = false;if (this.userRole != null){foreach(ReportingWebService.Task userTask in userRoleTasks){if (userTask.TaskID == task.TaskID){checkTask = true;break;
}}
}this.checkedListBoxTasks.Items.Add(task.Name, checkTask);
}}
VB.NETPrivate Sub RoleTaskForm_Load(ByVal sender As System.Object, ByVal e As
System.EventArgs) Handles MyBase.LoadDim description As String = ""Dim userRoleTasks() As ReportingWebService.Task = NothingIf (mIsSystemRole) Then
mItemTasks = mRsWebService.ListSystemTasks()Else
mItemTasks = mRsWebService.ListTasks()
268
Chapter 7
68787_ch07.qxp 26/03/2004 6:24 PM Page 268

End IfIf Not (mUserRole Is Nothing) Then
userRoleTasks = mRsWebService.GetRoleProperties(UserRole.Name.ToString(), description)
End IfDim sysTask As ReportingWebService.TaskFor Each sysTask In mItemTasks
Dim checkTask As Boolean = FalseIf Not (mUserRole Is Nothing) Then
Dim userTask As ReportingWebService.TaskFor Each userTask In userRoleTasks
If (userTask.TaskID = sysTask.TaskID) ThencheckTask = TrueExit For
End IfNext
End IfMe.checkedListBoxTasks.Items.Add(sysTask.Name, checkTask)
NextReturn
End Sub
The RoleTaskForm_Load method uses the ListSystemTasks or the ListTasks web service method tofill a local array variable with a list of tasks. This variable has a wide scope so it can be used to evaluateselections when the OK button is clicked without going back to the web service to reload the values. Ifyou are editing an existing role, the tasks for the role are returned from the GetRoleProperites webservice method, which takes the role name and description (output parameter). Another interestingfeature of tasks has to do with the name property. If you have an array of tasks from an existing role, thename property exists but will always return an empty string and is not useful for comparing to one ofthe built in tasks. Instead you will need to compare TaskID property of the role tasks to the TaskIDproperty of the built in tasks. The RoleTaskForm_Load method uses this technique to determine if atask is already part of a role and thus its check box should be checked.
Add an event handler to the click event of buttonOK and buttonCancel and enter the following code:
C#private void buttonOK_Click(object sender, System.EventArgs e){
int taskCount = this.checkedListBoxTasks.CheckedItems.Count;Task[] roleTasks = new Task[taskCount];for (int i = 0; i < taskCount; i++){string taskName = this.checkedListBoxTasks.CheckedItems[i].ToString();foreach(Task task in itemTasks){if(taskName == task.Name){roleTasks[i] = task;break;
}}
}
269
Managing Reports Using Program Code
68787_ch07.qxp 26/03/2004 6:24 PM Page 269

try{BatchHeader batchHeader = new BatchHeader();batchHeader.BatchID = rsWebService.CreateBatch();rsWebService.BatchHeaderValue = batchHeader;if (mode == RSUtilities.EditModeEnum.edit){
rsWebService.SetRoleProperties(this.textBoxRoleName.Text.ToString(),this.textBoxDescription.Text.ToString(),roleTasks);
}else{
rsWebService.CreateRole(this.textBoxRoleName.Text.ToString(),this.textBoxDescription.Text.ToString(),roleTasks);
}this.rsWebService.ExecuteBatch();this.rsWebService.BatchHeaderValue = null;
}catch (Exception exp){RSUtilities.ErrorHandler(exp);
}this.Close();
}private void buttonCancel_Click(object sender, System.EventArgs e){
this.Close();}
VB.NETPrivate Sub buttonOK_Click(ByVal sender As System.Object, ByVal e As
System.EventArgs) Handles buttonOK.ClickDim taskCount As Integer = Me.checkedListBoxTasks.CheckedItems.CountDim roleTasks(taskCount - 1) As ReportingWebService.TaskDim i As IntegerFor i = 0 To taskCount - 1 Step 1
Dim taskName As String = Me.checkedListBoxTasks.CheckedItems(i).ToString()Dim sysTask As ReportingWebService.TaskFor Each sysTask In mItemTasks
If taskName = sysTask.Name ThenroleTasks(i) = sysTaskExit For
End IfNext
NextTry
Dim objBatchHeader As BatchHeader = New BatchHeaderobjBatchHeader.BatchID = mRsWebService.CreateBatch()mRsWebService.BatchHeaderValue = objBatchHeaderIf Mode = RSUtilities.EditModeEnum.edit Then
mRsWebService.SetRoleProperties( _Me.textBoxRoleName.Text.ToString, _
270
Chapter 7
68787_ch07.qxp 26/03/2004 6:24 PM Page 270

Me.textBoxDescription.Text.ToString,roleTasks)
ElsemRsWebService.CreateRole(Me.textBoxRoleName.Text.ToString, _
Me.textBoxDescription.Text.ToString,_ roleTasks)
End IfmRsWebService.ExecuteBatch()mRsWebService.BatchHeaderValue = Nothing
Catch exp As ExceptionRSUtilities.ErrorHandler(exp)
End TryMe.Close()
End SubPrivate Sub buttonCancel_Click(ByVal sender As System.Object, ByVal e As System.EventArgs) Handles buttonCancel.Click
Me.Close()End Sub
The web methods needed for working with role objects are:
❑ CreateRole: This method is used to create a new role. It takes a name, a description, and anarray of tasks as arguments.
❑ SetRoleProperties: This method is used for modifications of an existing role. It takes thesame arguments as the CreateRole method.
In keeping with the other times that you have made modifications to the buttonOk_Click method, alsomakes use of the batch objects to make sure the changes are wrapped in a transaction.To call theRoleTaskForm add event handlers for click events of buttonAdd and buttonEdit buttons in theRoleForm and enter the following code into the event handlers:
C#private void buttonAdd_Click(object sender, System.EventArgs e){
RoleTaskForm dialogForm = new RoleTaskForm();dialogForm.IsSystemRole = systemRoles;dialogForm.RsWebService = rsWebService;dialogForm.Mode = RSUtilities.EditModeEnum.add;dialogForm.ShowDialog(this);FillRoleListView();return;
} private void buttonEdit_Click(object sender, System.EventArgs e){
if (this.listViewRoles.SelectedItems.Count == 0){MessageBox.Show("Select a role to edit.");return;
}Role workingRole = null;string roleName = this.listViewRoles.SelectedItems[0].Text;foreach(Role role in roles)
271
Managing Reports Using Program Code
68787_ch07.qxp 26/03/2004 6:24 PM Page 271

{if(role.Name == roleName){workingRole = role;break;
}}RoleTaskForm dialogForm = new RoleTaskForm();dialogForm.IsSystemRole = systemRoles;dialogForm.UserRole = workingRole;dialogForm.RsWebService = rsWebService;dialogForm.Mode = RSUtilities.EditModeEnum.edit;dialogForm.ShowDialog(this);return;
}
VB.NETPrivate Sub buttonAdd_Click(ByVal sender As System.Object, ByVal e As
System.EventArgs) Handles buttonAdd.ClickDim dialogForm As RoleTaskForm = New RoleTaskFormdialogForm.IsSystemRole = mSystemRolesdialogForm.RsWebService = mRSWebServicedialogForm.Mode = RSUtilities.EditModeEnum.adddialogForm.ShowDialog(Me)FillRoleListView()Return
End SubPrivate Sub buttonEdit_Click(ByVal sender As System.Object, ByVal e As
System.EventArgs) Handles buttonEdit.ClickIf Me.listViewRoles.SelectedItems.Count = 0 Then
MessageBox.Show("Select a role to edit.")Return
End IfDim workingRole As ReportingWebService.Role = NothingDim roleName As String = Me.listViewRoles.SelectedItems(0).TextDim role As ReportingWebService.RoleFor Each role In mRoles
If role.Name = roleName ThenworkingRole = roleExit For
End IfNextDim dialogForm As RoleTaskForm = New RoleTaskFormdialogForm.IsSystemRole = mSystemRolesdialogForm.UserRole = workingRoledialogForm.RsWebService = mRSWebServicedialogForm.Mode = RSUtilities.EditModeEnum.editdialogForm.ShowDialog(Me)Return
End Sub
Now add an event handler for the click event of buttonDelete on RoleForm and enter the followingcode.
272
Chapter 7
68787_ch07.qxp 26/03/2004 6:24 PM Page 272

C#private void buttonDelete_Click(object sender, System.EventArgs e){
if (this.listViewRoles.SelectedItems.Count == 0){MessageBox.Show("Select a role to delete.");return;
}DialogResult result = MessageBox.Show("Are you sure you want to delete this
role?", "Delete Role",MessageBoxButtons.YesNo, MessageBoxIcon.Question);
if (result == DialogResult.Yes){string roleName = this.listViewRoles.SelectedItems[0].Text;try{// Create the batch to handle the transactionBatchHeader batchHeader = new BatchHeader();batchHeader.BatchID = rsWebService.CreateBatch();rsWebService.BatchHeaderValue = batchHeader;// delete the rolersWebService.DeleteRole(roleName);// execute the batchthis.rsWebService.ExecuteBatch();this.rsWebService.BatchHeaderValue = null;
}catch(Exception exp){RSUtilities.ErrorHandler(exp);
}FillRoleListView();
}return;
}
VB.NETPrivate Sub buttonDelete_Click(ByVal sender As System.Object, ByVal e As
System.EventArgs) Handles buttonDelete.ClickIf Me.listViewRoles.SelectedItems.Count = 0 Then
MessageBox.Show("Select a role to delete.")Return
End IfDim result As DialogResultresult = MessageBox.Show("Are you sure you want to delete this role?", _
"Delete Role", MessageBoxButtons.YesNo, _MessageBoxIcon.Question)
If result = DialogResult.Yes ThenDim roleName As String = Me.listViewRoles.SelectedItems(0).TextTry
' Create the batch to handle the transactionDim objBatchHeader As ReportingWebService.BatchHeader =
New Reporting WebService.BatchHeader
273
Managing Reports Using Program Code
68787_ch07.qxp 26/03/2004 6:24 PM Page 273

objBatchHeader.BatchID = mRSWebService.CreateBatch()mRSWebService.BatchHeaderValue = objBatchHeader' delete the rolemRSWebService.DeleteRole(roleName)' execute the batchmRSWebService.ExecuteBatch()mRSWebService.BatchHeaderValue = Nothing
Catch exp As ExceptionRSUtilities.ErrorHandler(exp)
End TryFillRoleListView()
End IfReturn
End Sub
The final web method that you will be using is DeleteRole. It will delete a role from the database; ittakes the name of the role as its only argument. Again the batch is used to wrap the changes in atransaction. Save your code changes and run the application. Click the Go button to get a reference to theweb service then choose the Security | Roles menu item to display the RoleForm. Click the Add button onthe RoleForm to add a new role. Your RoleTaskForm should look similar to Figure 7-25. Add a name anddescription for your new role, assign some tasks and click the OK button.
Figure 7-25
The RoleTaskForm shown in Figure 7-25 presents a list of tasks a role may have permissions to perform.Enter a Role Name, Description for the role, and then check the appropriate Tasks as in Figure 7-26:
Figure 7-26
274
Chapter 7
68787_ch07.qxp 26/03/2004 6:24 PM Page 274

Clicking the OK button adds the new role to the list of user item roles in the RoleForm shown in Figure 7-27:
Figure 7-27
Click the OK button to close the RoleForm dialog.
SummaryIn this chapter you learned how to consume the Reporting Services Web Service with a Windowsapplication. The code throughout the application with the exception of the interface code would workjust in the same way for a web application. You should now have a better understanding of the webservice, its objects, and methods. The content of this chapter could be expanded to fill an entire volumeby itself. In later chapters we will cover rendering reports, creating and maintaining subscriptions usingprogram code. It is hoped that the material presented here will give you confidence to explore the webservice and expand this application for your own needs.
275
Managing Reports Using Program Code
68787_ch07.qxp 26/03/2004 6:24 PM Page 275

68787_ch07.qxp 26/03/2004 6:24 PM Page 276

Report Scripting
Many repetitive tasks on Report Server administration and management can be automated usingscript files. You can copy reports from one server to another and schedule the script to run whennetwork traffic is low. By using scripts, the security configuration can be updated on a remotemachine or the settings of a single report can be copied to multiple reports on a server. Otherpractical uses of scripting include:
❑ Creating a new report subscription for a role
❑ Listing the contents of a particular folder
❑ Adding a new member to a role
❑ Updating a shared data source
❑ Listing all the reports that are visible to a role
In this chapter, you'll step through a script that replicates reports and their properties from asource machine to a target machine. The script loops through a Report Server for report items andcopies them to a target location just before logging the action in an XML log file. The file toggleseasily between the development environment and the production environment by changing asingle Boolean value.
Scripting is a powerful tool that will be increasingly used to execute common Windows andReport Server management tasks. Before getting started on the code, let's take a look at the variouscommand line utilities available in Reporting Services.
Command Line UtilitiesReporting Services provides several utility applications that can ease the process of servermanagement. The four main command line utilities are outlined in the following table:
888
68787_ch08.qxp 26/03/2004 3:54 PM Page 277

Chapter 8
278
Let’s briefly look at each of these useful tools.
rsconfigReport Server keeps credentials and connection information encrypted in the ReportServer database.The rsconfig utility is used to manage the encrypted connection settings for a Report Server installation.For example, you can use this utility to change the username and password that Report Server uses toconnect to a SQL Server database. The utility uses Windows Management Instrumentation (WMI) to writechanges to the target machine and you must have administrator privileges to perform the actions. Forreports that use data from a remote server, you can use this utility to configure the credentials usedwhen the report runs.
Arguments passed to the rsconfig utility include username, password, server name, andauthentication method.
For more information on this utility and its capabilities, refer to the rsconfig utility topic in Reporting ServicesBooks Online.
rskeymgmtAlthough encrypting data is a terrific way to secure it, the process has a weakness—the storing ofencryption key values for later use. In reality, encrypted data is only as secure as the keys that are usedto encrypt and decrypt it. Once the keys are compromised, data is no longer secure. Reporting Servicessecurely stores encryption keys in its database.
Reporting Services documentation indicates that it uses both a public key and a symmetric key toencrypt data. Symmetric encryption is used because the data to be secured is usually private and theprocess is relatively quick. Symmetric encryption involves the use of a single key value for bothencryption and decryption. For example, if you need to repair account information in a Report Serverinstance, you can use the encryption key to recover the encrypted data and restore the account. If the keyis not available, the encrypted data cannot be recovered and you'll need to manually enter the accountinformation to make the account operational again.
Reporting Services creates encryption keys during the setup process. It's important that you make a copyof the key value and store it in a secure location. The rskeymgmt utility is the tool used to retrieve theencryption key-set and write it to a file. By default the rskeymgmt executable is located in the
Utility Function
rsconfig Manages the encrypted connection settings on a server
rskeymgmt Retrieves the server encryption key-set and writes it to a file
rsactivate Creates the encryption key to activate a server
rs Automates common server management tasks
68787_ch08.qxp 26/03/2004 3:54 PM Page 278

C:\Program Files\Microsoft SQL Server\80\Tools\Binn directory. The key values written to thefile are encrypted using another key built from the password used when creating the file. The samepassword must then be used to later retrieve the decrypted keys from the storage file.
Creating a backup copy of the encryption key is straightforward. The rskeymgmt application must berun on the same machine as the Report Server installation. Use the –e (extract) argument to pull the keyvalue from Reporting Services and the –f (file) argument to specify the fully qualified file name. You'llalso need to supply a password using the –p argument. The completed command line syntax reads asfollows:
rskeymgmt -e –f a:\ReportServerDBKey.txt –p P@ssw0rd
This line extracts the key value, creates a text file on a floppy disk called ReportServerDBKey.txt, andencrypts the key value using the password indicated.
The rskeymgmt utility can be used to perform other encryption key management functions as well. Forexample, it can be used to delete encrypted content that is no longer in use.
rsactivateWhile the rsconfig utility can be used to add a Report Server instance to a web farm, the serverinstance is not considered activated until it can encrypt and decrypt data in the Report Server database.The process of activation creates the symmetric key used in the encryption process and is performedusing either the rsactivate utility or the Reporting Services WMI provider.
rsIn this chapter we refer to this utility as the RS utility. This utility provides developers andadministrators the ability to automate common, repetitive server management tasks. These scriptedoperations allow a wide range of tasks to be performed, such as finding all the reports being delivered toa particular user or updating the security settings on a server instance. The bulk of this chapter covers ascript that performs the commonly requested task of deploying reports from one server to another.
Automating Server and Report ManagementReporting Services provides a WMI interface to the configuration files for the Report Server instance andthe Report Manager application. Much like the command line utilities, these classes provide a way toprogrammatically perform application management. For example, you can change the credential valuesand authentication mechanisms that the Report Server uses to connect to the database. The same classescan be used to perform actions on remote machines. These application configuration files are XML files.
The next time the application runs, the CLR will apply the new values. The Report Server configurationfile is accessed through the MSReportServer_ConfigurationSetting class and the Report ManagerInterface web application configuration file is available through the
279
Report Scripting
68787_ch08.qxp 26/03/2004 3:54 PM Page 279

MSReportServerReportManager_ConfigurationSetting class. Both classes are accessed throughthe WMI interface.
Repetitive tasks can be automated using scripts and the RS utility. Common tasks that can be scriptedinclude duplicating environment settings from one server to another or deploying resources, reports,and other database content from one environment to another. For example, migrating content from thedevelopment environment to the testing and production environments.
The file that contains the automation code is a Unicode or UTF-8 text file with an .rss file extension.The code itself is written in Visual Basic .NET.
Reporting Services RS UtilityThe RS utility is an application that hosts scripts for execution by a scripting engine. The RS utilitycompiles the user-supplied script and creates instances of the objects required to run it. If the script doesnot compile, errors are returned to help debug the file. If the compilation is successful, execution of thescript begins. The RS utility can run scripts against a local or remote sever installation.
As a script developer, you are provided access to several namespaces in the .NET Framework classlibrary. You also have full access to the Reporting Services Web Service interface. One of the mostimportant functions of the RS utility is the creation of a proxy class for use by the hosted script. Whenthe RS utility is run, an argument is provided, which is the URL of the Reporting Service instance towork with. The RS utility then invokes the wsdl.exe utility internally, creating a proxy class that acts asthe local script interface to the Reporting Services Web Service. The variable name for the web servicereference is called rs, and is available globally to your script. All of the Reporting Service Web Servicemethods are available through the rs proxy. For this chapter, the rs proxy is referred to as the rs object.
RS Utility Command Line SyntaxLet's take a look at the RS utility command line syntax. At the command prompt, type rs /?. This willinvoke the RS utility Help displaying the utility syntax and command line arguments as in Figure 8-1:
Figure 8-1
280
Chapter 8
68787_ch08.qxp 26/03/2004 3:54 PM Page 280

Invoking the RS utility is as simple as typing rs or rs.exe at the command prompt, and supplying therequired values. The two required values are the script to run (/i argument), and the server to run thescript against (/s argument).
The syntax for using the RS utility is as follows:
rs /i <inputFile> /s <serverURL> [/u <username>] [/p <password>] [/l <timeout>] [/b] [/v <var=value>] [/t]
The arguments (parameters) can be indicated by using the / or – symbols. For example, the input filevalue can be provided using –i or /i and the filename. It's a matter of personal preference and in somecases company style guide. The arguments themselves are case insensitive except for the passwordvalue. You can have as many spaces as you want between the argument indicator and the value you'reproviding.
The script file must be a fully qualified path to the .rss file. For example, let's say that your scripts arelocated in the C:\ReportServer\Scripts directory. If you navigate to that location in the commandwindow, the path value that you'll provide to the RS utility will be as simple as the filename itself.
The serverURL value is made up of the protocol, server, and virtual directory to execute the script. Bydefault, the RS utility will attempt to connect to the resource using https. If you specify http, the RSutility will only use http. If you specify https and it's not supported on the server, the RS utility willreturn an error.
By default, the RS utility will authenticate against the target Report Server instance using the credentialsprovided by the user running the script. Both the username and password arguments are optionalarguments and can be used to provide different credentials. The script itself can provide credentialvalues through the rs object, but hardcoded credentials are a security threat. It's better to have the scriptauthenticate credentials passed by the user at runtime; the username must include the domain name anduser account.
The timeout value is an optional argument and is used to specify the number of seconds before theconnection to the server times out. The default value is eight seconds. Providing a value of zero meansthe connection never times out.
If you want your script to run as a batch, you can indicate that by using the optional /b argument.Batches are particularly useful when you need to be sure that the same action is performed on multiplemachines; for example, when running a script against multiple machines in a server farm. A batch runsas a type of mini transaction where failure of commands within the script causes the batch to roll back.This argument doesn't take any values. The RS utility default bahaviour is to run scripts withoutcreating a batch.
Your VB.NET script can also contain variables with user-provided values. These variables are notdeclared in the script and are available globally to any member within the script. The values aresupplied using /v arguments for each variable, which are provided as name=value pairs. The followingcode shows an example:
rs /i DeployReports.rss /s http://localhost/reportserver/reportservice.asmx /v targetURL= http://localhost/reportserver/reportservice.asmx
281
Report Scripting
68787_ch08.qxp 26/03/2004 3:54 PM Page 281

Quotes around the value are optional unless the value contains spaces. The /v argument is optionalunless your script uses a variable value that's not declared in the script. If the script takes an argumentthat the user doesn't supply, the script will not compile.
The /t argument is also optional; it turns on tracing to view request processing and capture informationabout returned errors.
When your script runs, the RS utility creates an instance of the scripting engine to run it. The VB.NETscripting engine uses the same code base as VB.NET, so you have access to standard VB.NETfunctionality from within your script. You'll take a closer look at the hosting environment capabilitiesand limitations throughout the rest of this chapter.
RS Utility ErrorsIt will be helpful to be aware of the errors that the RS utility can return. Knowing the exceptions can helpyou avoid raising them. Briefly, the RS utility errors include:
❑ CompilerFailed: If the RS utility is unable to compile your script it will return an error toindicate what the problem was.
❑ ConnectionFailed: The utility could not connect to the server.
❑ DuplicateCommandLineOption: Command line arguments provided more than once, exceptfor the /v argument.
❑ DuplicateVariable: Same variable provided more than once.
❑ InvalidAuthorizationMethod: The server doesn't recognize your authorization method.
❑ InvalidCommandLineOption: Check the syntax by running /?. Usually it's the result of atyping error.
❑ InvalidTimeoutValue: The value for this argument must be a positive integer.
❑ InvalidVariableName: The variable name doesn't match what the script is expecting.
❑ InvalidVariableSpecification: Variables must be provided using the name=value syntax.Use quotes if the variable value contains spaces.
❑ MissingOptionValue: You specified the argument, but forgot the value (or it's in a form thecompiler doesn't recognize).
❑ MissingRequiredOption: Input file and server URL are required.
❑ MissingSomeAuthorizationValues: Username and password are optional but paired.
❑ ScriptException: The script lets an unhandled exception fall off the Main method. You needto investigate the error and consider adding some additional exception handling.
If the Reporting Service returns an exception, it will be a SoapException containing the specific errormessage. As you'll see in the next section, there is no way to catch a SoapException in the script, soyou'll need to configure a generic catch block to catch these exceptions.
282
Chapter 8
68787_ch08.qxp 26/03/2004 3:54 PM Page 282

Now that you have an understanding of how the RS utility works, let's take a look at configuring adevelopment environment and building a script to deploy content.
Script DevelopmentBefore you begin creating an effective development harness, it's important to know the elements youhave to work with. A Reporting Service script file is simply a Unicode or UTF-8 text file which is a 16-bitcharacter-encoding standard supported by many languages. It simplifies the localization of text anddata, providing a data exchange format by defining code values for each character. The latest Microsoftoperating systems use it for character and string manipulation.
The script project that follows is done using Visual Studio .NET. Let's take a look at the requirements forthe script.
Script Format RequirementsThe file must contain a Main method .The Main method is used by the script host as the entry point intoyour code. For this environment, the Main method can take no parameters. When the Main methodcompletes, your script is done. You can make calls to methods outside of the Main method. For the scriptto compile, it needs to contain at least this code:
Public Sub Main()'code to process server content goes here
End Sub
The script file can contain user-defined variables and methods. The variables can be module-level, whichmeans they're available to all members in the file. User-defined variables (those provided by the user atruntime) are not declared in the code.
The host environment doesn't understand overloaded methods so you can't use them in your code. Thescript file does not contain Imports statements, which would otherwise indicate namespaces that are inuse.
Namespaces AvailableNot all namespaces in the .NET Framework base class library are available for use in your scripts. TheRS hosting utility provides access to the Reporting Services Web Service interface as well as to classescontained in four namespaces described in the following sections.
SystemMost of the classes in this namespace reside in the mscorlib assembly. This namespace is home to datatypes, such as integer and string, as well as to utility classes, such as the Array, Console, and Convertclasses.
283
Report Scripting
68787_ch08.qxp 26/03/2004 3:54 PM Page 283

System.IOClasses in this namespace provide access to the file system. Several encapsulate static or instancemethods for performing file and directory manipulation. Streams and different types of readers andwriters belong to this namespace. Although a few classes in this namespace are in the System assembly,most of them are located in mscorlib.
System.XmlThe System.Xml namespace is primarily located in the System.Xml assembly. This namespace providesaccess to most of the classes needed to create and read XML documents including:
❑ XmlDocument
❑ XmlElement
❑ XmlTextReader
❑ XmlTextWriter
❑ XmlValidatingReader
This namespace does not provide access to the following classes:
❑ XmlSchema
❑ XPathDocument
❑ XslTransform
System.Web.ServicesThis namespace contains relatively few classes, primarily the WebMethodAttribute andWebServiceAttribute. These attribute classes are applied to classes and methods, enabling them to beexposed as web services and web methods.
Reporting Services Web ServiceAccess to the Reporting Services Web Service interface is made through the RS utility script host. The RSutility proxy provides full access to the Web Service members.
It may be helpful to note the namespaces that are not available:
❑ Microsoft.VisualBasic
❑ System.Text
❑ System.Web.Services.Protocols
The Microsoft.VisualBasic namespace contains global functions that many VB users rely upon. TheSystem.Text is home to the StringBuilder and encoding classes, andSystem.Web.Services.Protocols is where the SoapException class lives.
284
Chapter 8
68787_ch08.qxp 26/03/2004 3:54 PM Page 284

Building a Script Development HarnessThe process of creating and maintaining a management script file can be cumbersome. Frequently,scripts are written using a text editor or other scripting tools. Depending on the developer, the file maythen be ported to Visual Studio for testing. Once the code is stable, the extra Visual Studio bits areremoved or commented out to create a proper script file once again.
Personally, I think the typical process of running a file in Visual Studio to check it and then commentingout the extra code to make it work as a dedicated script is basically a hack. There are better ways ofmaking a script file work in both the development and production environments.
The technique outlined in this chapter uses the conditional compilation capabilities of the .NETcompilers that are used when a script runs. By using conditional compilation, a script file simply togglesfrom one environment to the other. It's ideal for development because the developer has the support ofcode completion and IntelliSense. The development environment provides sophisticated debuggingcapabilities, and the file can be managed as part of a VS.NET project. The conditional compilationapproach enables scripting projects to be managed like every other project in the productiondevelopment environment while providing a completely suitable code file for the script host at runtime.
Although the script file contains VB.NET code, an .rss script file, as it is, will not compile in the VisualStudio development environment. But that's not the only confusing aspect of the script file. For example,although the file acts as a VB.NET module, it doesn't contain module statements. To help matters, thescript can contain undeclared variables and runs against an unseen web service proxy class. Having agood development harness can go a long way in creating an efficient environment for scriptdevelopment.
Creating the Console ProjectVisual Studio is a robust development tool that's familiar to most .NET developers. Its IntelliSense, codecompletion, and debugging capabilities help ease the development of .rss scripts as well. If you planon creating multiple scripts for the RS utility, it can be helpful to group them under a single solution. Forthis, start with a blank solution and add script projects as needed.
In Visual Studio, select File | New | Blank Solution from the menu bar. This will open the New Projectdialog box as shown in Figure 8-2:
285
Report Scripting
68787_ch08.qxp 26/03/2004 3:54 PM Page 285

Figure 8-2
Name the blank solution rsUtility and click OK to create the solution. You now have a container for allyour RS utility script projects. To add the first project, right click the solution in the Solution Explorer andselect Add | New Project to open another New Project dialog box. This time select Visual Basic Projects inthe Project Types pane. You'll see the various pre-built project templates in the right pane. Choose theConsole Application template and give the project an appropriate name, in this case, DeployReports asshown in Figure 8-3:
Figure 8-3
When the project is added to the solution, the Module1.vb file opens in the code window. Notice thatthe file already includes the Main method contained in a module called Module1. Rename theModule1.vb file to DeployReports.vb in the Solution Explorer.
Now that the rough framework is in place, let's further define the environment you'll be working in.
286
Chapter 8
68787_ch08.qxp 26/03/2004 3:54 PM Page 286

Adding Imports StatementsRemember, you only have access to certain namespaces from within the .rss script. The RS hostingutility provides the namespace access. The script file itself does not contain any Imports statements.The console application template includes several Imports statements already, and you'll need tomodify those to suit the project.
To do this, right click the DeployReports project in the Solution Explorer and select Properties. That willbring up the DeployReports Property Pages box. In the Common Properties folder in the left pane, click theImports group. Notice that in the Project imports box, five namespaces are already listed:
❑ Microsoft.VisualBasic
❑ System
❑ System.Collections
❑ System.Data
❑ System.Diagnostics
Select and remove all but the System and System.Diagnostics namespaces. The System.Diagnosticsnamespace is included for debugging purposes. Then, add System.IO, System.Web.Services, andSystem.Xml. Your new imports list will include:
❑ System
❑ System.Diagnostics
❑ System.IO
❑ System.Web.Services
❑ System.Xml
The completed property page will be similar to Figure 8-4:
Figure 8-4
287
Report Scripting
68787_ch08.qxp 26/03/2004 3:54 PM Page 287

Adding ReferencesNow you'll need to modify the assembly references for the project. First, remove the references that arenot needed. In the Solution Explorer, open the References folder to view the current assembly references.Remove the System.Data reference by right clicking it and selecting Remove from the context menu.Then right click the References folder and select Add Reference.
In the Add Reference dialog box, ensure that you're viewing the .NET tab. Select the System.Web.Servicesassembly by clicking the component name, and then click the Select button. That will add thecomponent to the list of Selected Components in the bottom list box. Click OK to add the reference toyour project.
For development, you'll also need to reference the Reporting Services Web Service. To do that, right clickthe References folder in the Solution Explorer and select Add Web Reference to bring up the Add WebReference dialog box. This form contains a browser pane, an address bar, and a couple of other items. Inthe address bar, type the URL of the Report Server you want to code against. The default URL ishttp<s>://<servername>/reportserver/reportservice.asmx.
If you've pointed at a valid web service, the Add Reference button will be enabled. Before you click it,however, give the web reference a name; in this case, the reference is called ReportServer. Figure 8-5shows a completed web reference dialog box:
Figure 8-5
Clicking the Add Reference button invokes the wsdl.exe utility. The wsdl.exe checks the WSDLdocument for the web service and creates a proxy class that acts as your local interface to the remote webservice. You're creating a web service proxy in the same way that the RS utility creates it for your hostedscript. Now you can code against that web service as if it were a local object, because in proxy form, it isa local object.
288
Chapter 8
68787_ch08.qxp 26/03/2004 3:54 PM Page 288

The completed solution and project hierarchy is shown in Figure 8-6. Note that the reference to theSystem.Data assembly has been deleted. The RS utility host doesn't provide access to its content, so thereference is deleted from the development environment.
Figure 8-6
Now, let's start working with the code. In the code editor, change the name of the module toDeployReports. Although it isn't required, it's a good practice to add a section of commented linescontaining information about the file. Make some space above the module declaration to add a filesummary:
#Region ' File Summary''=====================================================================' Development File: DeployReports.vb' Production File: DeployReports.rss'' Description: ' This module is an approach to building Reporting' Service scripts hosted by the RS utility.' The devEnvironment bool value allows toggling the' file between development (.vb) and production (.rss).'' The DeployReports script iterates through the Report ' Server items on a source machine, deploying the .rdl ' report definitions and properties to a target machine. ' Actions and results are logged to an XML file.'' Required Variable:' This value must be provided at runtime when hosted by ' the rs utility (using the /v parameter).'' Name: targetURL' Value: http(s) URL of the target Reporting Service machine.' Must have same folder structure as source machine. ' Must use same credentials as the source machine.''---------------------------------------------------------------------' SQL Reporting Services Beta 2' .NET Framework 1.1' Visual Studio .NET 2003' Jan 2004; James Counihan; Seattle USA'//===================================================================#End Region
289
Report Scripting
68787_ch08.qxp 26/03/2004 3:54 PM Page 289

The commented section is wrapped by a conditional compilation directive. The #Region directiveallows the wrapped section to be closed (collapsed) while working in other regions of the file. It's asample use of a conditional compilation directive. The next step is to structure the code to work in bothdevelopment and runtime environments, which is done by using other conditional compilationdirectives.
Using Conditional CompilationThe file you're creating is meant to work in both the Visual Studio development environment and thehosted RS utility production environment. To save development time, it would be nice to have a singleplace to toggle the file for use in each of the environments. Conditional compilation enables you to dothat.
Conditional compilation involves the use of compiler directives. For the DeployReports project you'll usetwo directives: a constant definition and statements to compile different blocks of code depending on theconstant value. Conditional directives are indicated using the # symbol at the start of the code statement.You may recognize the #Region and #End Region directives that wrap generated code sections in aWindows form or a web form application.
In the DeployReports.vb file, make some space above the module DeployReports statement. In thatarea at the top of the file, enter the following statements:
#Region ' Dev/Prod Toggle '
'Set value to True if hosted by Visual Studio;'Set value to False if hosted by the rs utility.#Const devEnvironment = True
#End Region
A data type declaration is not part of the statement. There's a Visual Basic .NET background compilerthat will check syntax as you code, based on the value you've toggled devEnvironmentto. As part ofyour imperative code statements you'll use #If…Then…#Else statements to block code based on theenvironment. Configuring the file for hosting by the RS utility then becomes a matter of setting thedevEnvironment value to False and giving the file an .rss extension.
In fact, the Module statement itself needs the conditional compilation block applied to it. The Modulestatement isn't used in the hosted RS utility environment so you'll need to wrap it with the conditionalcheck. If this is a development environment, compile the embedded statement into the assembly, if not,skip it.
#If devEnvironment ThenModule DeployReports#End If
The RS utility compiles the script file when it's first invoked and the compiler in that hostedenvironment understands the conditional compilation statements.
290
Chapter 8
68787_ch08.qxp 26/03/2004 3:54 PM Page 290

The next section of code is an area for global variable declaration. Three string variables are declared:m_logFile, m_logDir, and m_logPath. They contain values for the file name, directory path, andconcatenated path of where you want the log file to be saved.
#Region ' Global Vars '
'Name of the log file. This code creates xml output.Dim m_logFile As String = 'EventLog.xml''Directory to save the log to.Dim m_logDir As String = '/Report Deployment Log''Full pathDim m_logPath As String = m_logDir & '/' & m_logFile
'Not a user-defined valueDim m_errFlag As Boolean = False
#End Region
This code writes XML output to the EventLog.xml file in the Report Deployment Log directory of thecurrent drive. If the file does not exist, it will be created. The m_errFlag Boolean value is used for errorhandling to determine whether to throw the exception or handle it internally. Now you're ready to go inand start adding code to the Main method.
Accessing Server ItemsThe Main method is the host entry point to your application. In the RS utility environment the Mainmethod takes no arguments. Runtime variable values can be passed to your script but you use adifferent technique to do that. You'll read about using that technique later in this chapter. Before that,let's add some code to the file.
In the code body of the Main method, declare the traceMessage and timeStamp string variables andthe reportCount integer field. These are used to display processing information in the console windowand to write nodes to the XML log file.
#Region ' Main()'
Sub Main()
Dim traceMessage, timeStamp As StringDim reportCount As Integer
In the development environment, you'll need to connect to the ReportServer instance to beginperforming actions on it but as the RS utility hosting environment provides the connection, this step isn'tnecessary.
Creating the Proxy InstanceBecause you need to create your own web service connection in one environment and not in the other,conditional compilation is an ideal solution. Additionally, how you qualify the classes you're working
291
Report Scripting
68787_ch08.qxp 26/03/2004 3:54 PM Page 291
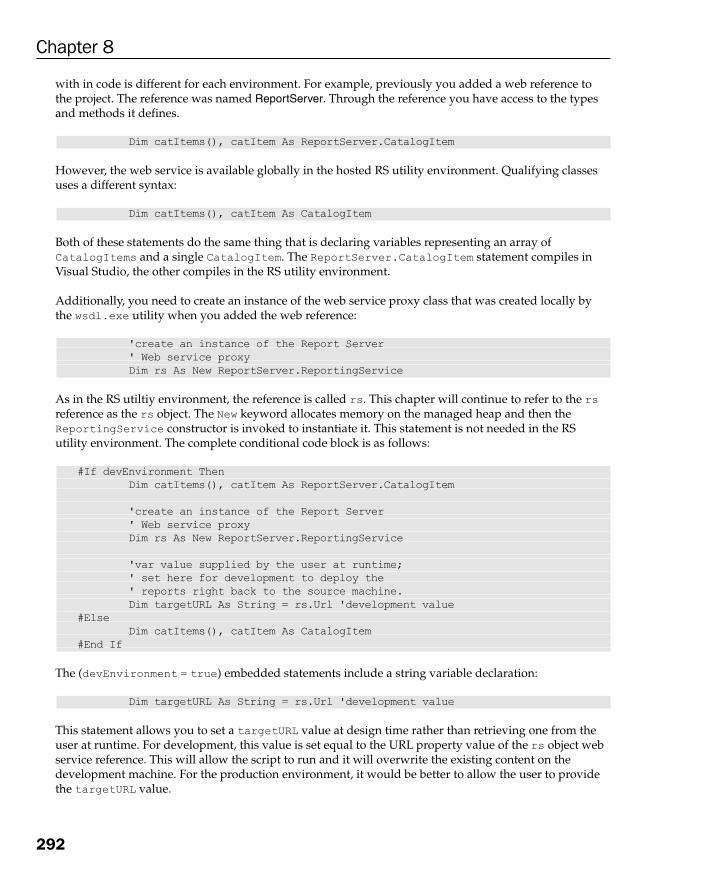
with in code is different for each environment. For example, previously you added a web reference tothe project. The reference was named ReportServer. Through the reference you have access to the typesand methods it defines.
Dim catItems(), catItem As ReportServer.CatalogItem
However, the web service is available globally in the hosted RS utility environment. Qualifying classesuses a different syntax:
Dim catItems(), catItem As CatalogItem
Both of these statements do the same thing that is declaring variables representing an array ofCatalogItems and a single CatalogItem. The ReportServer.CatalogItem statement compiles inVisual Studio, the other compiles in the RS utility environment.
Additionally, you need to create an instance of the web service proxy class that was created locally bythe wsdl.exe utility when you added the web reference:
'create an instance of the Report Server' Web service proxyDim rs As New ReportServer.ReportingService
As in the RS utiltiy environment, the reference is called rs. This chapter will continue to refer to the rsreference as the rs object. The New keyword allocates memory on the managed heap and then theReportingService constructor is invoked to instantiate it. This statement is not needed in the RSutility environment. The complete conditional code block is as follows:
#If devEnvironment ThenDim catItems(), catItem As ReportServer.CatalogItem
'create an instance of the Report Server' Web service proxyDim rs As New ReportServer.ReportingService
'var value supplied by the user at runtime;' set here for development to deploy the ' reports right back to the source machine.Dim targetURL As String = rs.Url 'development value
#ElseDim catItems(), catItem As CatalogItem
#End If
The (devEnvironment = true) embedded statements include a string variable declaration:
Dim targetURL As String = rs.Url 'development value
This statement allows you to set a targetURL value at design time rather than retrieving one from theuser at runtime. For development, this value is set equal to the URL property value of the rs object webservice reference. This will allow the script to run and it will overwrite the existing content on thedevelopment machine. For the production environment, it would be better to allow the user to providethe targetURL value.
292
Chapter 8
68787_ch08.qxp 26/03/2004 3:54 PM Page 292

Passing Variable Values to the ScriptThe targetURL value is used in the script regardless of which environment the code runs in. Whenhosted by the RS utility though, the variable is never declared in the code. The RS utility will expect thevariable value to be set when the utility is invoked. The RS utility syntax provides an optional /vargument, which is used to set values for the undeclared variables. In this case, the user will need toprovide the targetURL value in order for the script to compile. When the script is completed, thevariable value will be passed as follows:
rs /i DeployReports.rss /s http://localhost/reportserver/reportservice.asmx /v targetURL= http://localhost/reportserver/reportservice.asmx
To read more about running this file, see the Running the Script section later in this chapter.
Retrieving ItemsBefore you can perform any actions on the Report Server instance, your code must be authenticated. TheReport Server won't allow any methods to be invoked without authenticating the user tied to the requestand authorizing that the user has permission to perform the request. You could use credential valuesprovided by the user at runtime, but for ease, the code uses the identity of the user currently logged in.The following lines show the credentials property of the rs object being assigned the value of theshared DefaultCredentials property of the CredentialCache object:
'set credentials, so we'll be let throughrs.Credentials = System.Net.CredentialCache.DefaultCredentials
The authentication mechanisms you implement should be based on your security policy. Be sure tomodify this code to support your chosen security policy.
In this script, you'll be looking at each of the items in the source server to find reports to deploy. TheReporting Service ListChildren web method returns an array of catalog items that can be iteratedthrough:
'get array of server catalog itemscatItems = rs.ListChildren("/", True)
The returned results are available in the catItems array.
Building Message ContentThe next Report Server actions involve processing the returned CatalogItems. Before proceeding, thisis a good time to start logging the initial actions and displaying feedback to the user.
In the production environment, it is preferable to have the username and passwordvalues supplied by the user at runtime.
293
Report Scripting
68787_ch08.qxp 26/03/2004 3:54 PM Page 293

There are two places to output messages, the console and XML log file. The console will displaymessages regarding general actions; the log file will contain those messages in addition to actions andwarnings about each item deployed.
The RS utility-provided namespaces do not give us access to the StringBuilder class. To increase theusability in the console window, creating the message content is done in two operations. In the initialstages of the process, the current date and time are converted to a string and then formatted:
'write to log & console.'For usability in the console and xml file, 'two approaches are taken.'Note we have no access to the stringbuilder class.timeStamp = DateTime.Now.ToString("G")
The display message is then built in chunks for display in the console. The message text is built usingthe properties of the rs object reference and the catItems array. The chunks are split in the way youwant the content to be displayed in the console:
'build message elementsDim temp(6) As Stringtemp(0) = "** DeployReports script for Reporting Services ** "temp(1) = "Copying report definitions and properties from"temp(2) = "(source URL) " & rs.Url & " to"temp(3) = "(target URL) " & targetURL & "; "temp(4) = "Total server items to process: " & catItems.Length & "; "temp(5) = "Start date/time: " & timeStamp & "."
Once the message content is built, it writes values to the console:
'for readability in the console, display in chunksConsole.WriteLine()Console.WriteLine(temp(0))Console.WriteLine()Console.WriteLine(temp(1))Console.WriteLine(temp(2))Console.WriteLine(temp(3))Console.WriteLine()Console.WriteLine(temp(4))Console.WriteLine(temp(5))Console.WriteLine("Logging to: " & m_logPath)Console.WriteLine()
Then concatenate the message chunks to create the string written to the XML log. Because the chunks arearray elements, a For … Next loop works:
'concatenate the values to create the log entryDim i As IntegerFor i = 0 To temp.Length - 1
traceMessage &= temp(i)Next
294
Chapter 8
68787_ch08.qxp 26/03/2004 3:54 PM Page 294

Finally, the concatenated traceMessage value is passed to a method for logging. The traceMessagevariable will be used again later in the code, so once the message is logged, it's cleared to make it readyfor the next use:
'write to the logLogComment(traceMessage)traceMessage = ""
It would be nice to have access to the System.Text namespace where the StringBuilder class islocated. During informal testing, we've found that the StringBuilder class is about 300% faster atstring concatenation than the String class. This is a relatively short operation though, so theperformance penalty is reasonable.
With the status displayed and the first actions logged, it's time to start processing the items in thedatabase.
Retrieving ReportsThe content in a Report Server database includes folders, data sources, reports, and so on. Now that youhave a listing of each item in the Report Server database, you'll need to loop through them to identifythe reports to be deployed.
Retrieving Report ItemsThe items returned from the ListChildren method are available in the array of CatalogItems,catItems. The catItems variable is an instance of System.Array, which provides the ability to iteratethrough each of the elements contained in it. There are different ways to perform the iteration, but forthis purpose using a For … Each loop is clean and efficient:
'process catalog itemsFor Each catItem In catItems
Perform a test on each item to determine the item type. The Report Server exposes an ItemTypeEnumenumeration. It has six values that you can compare the current array element with:
❑ DataSource
❑ Folder
❑ LinkedReport
❑ Report
❑ Resource
❑ Unknown
This script tests each array element to see if it's a report. If the CatalogItem is a report, then it performsadditional processing on it. How the ItemType enumeration is qualified will be different for each of thedevelopment and production environments. That calls for a second conditional compilation code block.
295
Report Scripting
68787_ch08.qxp 26/03/2004 3:54 PM Page 295

#If devEnvironment ThenIf catItem.Type = ReportServer.ItemTypeEnum.Report Then
Dim warnings() As ReportServer.Warning#Else
If catItem.Type = ItemTypeEnum.Report ThenDim warnings() As Warning
#End If
The array of warnings holds information about the processing of the report item. You'll also needinformation about the location of the report item later, so a variable is declared and its value set usingthe Path property of the current report CatalogItem:
Dim itemPath As String = catItem.Path
Getting Report DefinitionsThe next section of the script file is where actions performed on the Report Server could raise exceptions..NET introduced the use of structured exception handling using Try … Catch blocks. The code that mayraise an exception is wrapped in a Try block, and then a Catch block is configured to catch anyexceptions that are raised in the Try block:
'process reportTry
The Catch and End Try statements can be entered now and then space can be created between them toadd more logic.
The report definition is an .rdl file in the Report Server database. The Reporting Service Web Serviceexposes a GetReportDefinition method, which can be used to get the definition. The method returnsa Byte array, so a variable is created to hold the returned result:
'get report definitionDim reportDefinition() As Byte = _
rs.GetReportDefinition(itemPath)
Later in the code, you'll need to pass a string value that the parent directory of the report. To get thatvalue, the Substring method of the itemPath string variable is invoked. The parameters passednarrow down the resulting string to the parent directory name without any "/" characters:
Dim parentDir As String = itemPath.Substring(0, (itemPath.Length - catItem.Name.Length) - 1)
Once you've got the report definition, you can change non-protected (non read-only) report propertyvalues. You can also deploy the report to another machine.
296
Chapter 8
68787_ch08.qxp 26/03/2004 3:54 PM Page 296

Deploying ReportsWhile you've got the current report definition, you can toggle the URL property of the rs object ReportServer reference to point to the target machine. That value will come from the user-provided targetURLvariable:
'deploy to target machiners.Url = targetURL
Now that the code is pointed at the targetURL, you can deploy the report.
The CreateReport MethodThe Reporting Service CreateReport method writes a report definition to a target address. This methodtakes parameters to indicate the name of the report to create, the directory to create it in, a Boolean valueindicating whether to overwrite an existing definition, a byte array which is the report definition, and anarray of property items for report properties that you might want to change.
For testing purposes, the parent directory parameter of the CreateReport method can be set to a valueother than the current location of the source report. For example, a parent directory value of / will causethe reports to be written to the root directory of the Reporting Service. You can then open ReportManager and view the newly deployed reports in the Home directory:
warnings = rs.CreateReport(catItem.Name, parentDir, True, reportDefinition, Nothing)
If there's something to know about the report creation process, the CreateReport method will return anarray of warning objects. Each array element contains information about a specific warning that wasraised while creating the report. Warnings will not prevent the report from being created. You'll have towrite warnings to the log file, along with information about the deployed report. For readability in thelog file the, deployment is logged first followed by any warnings:
'for readability: log the deployment, then any warningsLogEvent(catItem)If Not (warnings Is Nothing) Then
#If devEnvironment ThenDim warning As ReportServer.Warning#ElseDim warning As Warning#End IftraceMessage = warnings.Length.ToString & _' deployment warning(s) for the " & catItem.Name & "
report: "For Each warning In warningstraceMessage &= warning.Message & " "
Next warningLogComment(traceMessage)traceMessage = ""
End If
reportCount += 1
297
Report Scripting
68787_ch08.qxp 26/03/2004 3:54 PM Page 297

A conditional compilation block is used to separate how the Warning class is qualified as a data type forthe warning variable. The warning variable is used to represent each element in the warnings array tobuild a string containing each element value, so that the completed string can be written to the log.
That completes the Try block and the processing of this report item. A reportCount variable value isincremented, which will be used in the building of a final message for display and logging. The next stepin the process is configuring the Catch block.
Error HandlingIn this script, error handling is limited to logging errors returned while retrieving or creating the report.If a script error occurs, the exception is written to the console:
Catch ex As ExceptionIf errFlag Then
Console.WriteLine("Error processing: " & ex.ToString)Else
LogError(ex, catItem)End If'reportCount = 0
End TryEnd If
Next 'catalogItem
Exceptions caught by the RS utility host will cause execution to stop.
Logging EventsThe script logs general information on the script run, actions performed on report items, and exceptions.Each log entry is an XML node, which can either be an element or a comment. Elements are used forrecording report item actions and errors, while comments are used for general information and reportdeployment warnings.
The #Region … #End Region directive wraps this group of utility methods, which are used for writing tothe log. Each of the methods invokes a utility that checks for the existence of the log file.
Opening the FileThe GetLogFile is invoked even before the logging methods attempt to write any content to the XMLfile. This function checks for the existence of the m_logDir and m_logFile values and creates them ifthey don't exist. The System.Xml namespace contains the XmlDocument class used here:
Public Function GetLogFile() As XmlDocumentDim xmlDoc As XmlDocument
If the XML file exists, it is opened. The Load method of the XmlDocument opens the existing file so thatthe contents can be appended:
298
Chapter 8
68787_ch08.qxp 26/03/2004 3:54 PM Page 298

If File.Exists(m_logPath) ThenxmlDoc = New XmlDocumentxmlDoc.Load(m_logPath)
If a new XML file is created, the XML declarations and root element are added to the document. Thiscode block uses the shared (static in C#) CreateDirectory method of the Directory class, which isin the System.IO namespace. As the member is shared, it's invoked on the class rather than as aninstance of the class. Additionally, the LoadXml method of the XmlDocument is invoked so a string canbe passed defining the foundation of the XML content:
ElseIf Not (Directory.Exists(m_logDir)) Then Directory.CreateDirectory(m_logDir)'create the new xml docxmlDoc = New XmlDocumentxmlDoc.LoadXml('<?xml version='1.0' encoding='utf-8' ?>
<events> </events>')End If
In both cases, a reference to the XmlDocument is returned for the logging methods to work with:
Return xmlDocEnd Function
Now that the document has been returned, the logging members can write to it.
Writing XML NodesThere are three logging members in the script:
❑ LogEvent
❑ LogComment
❑ LogError
The methods are invoked depending on which node type is needed. The LogEvent code is walkedthrough here; the other methods work in almost the same way but with different data types passed asparameters. This would typically be a situation for overloaded versions of the same method but that'snot an option in the RS utility environment. Because the different parameter data types are qualifieddifferently in each environment, this is also a case for using conditional compilation. In this case, themethod signatures are blocked using the #If…Then…#Else directive:
#If devEnvironment ThenPublic Sub LogEvent(ByVal reportItem As ReportServer.CatalogItem) 'Report Server.
#ElsePublic Sub LogEvent(ByVal reportItem As CatalogItem)
#End If
299
Report Scripting
68787_ch08.qxp 26/03/2004 3:54 PM Page 299

The method body begins with declaring a string to hold a timestamp value for the log entry. Then theGetLogFile method is called to retrieve the XmlDocument to log to:
Dim timeStamp As StringTry
Dim logDoc As XmlDocument = GetLogFile()
Each event is logged as separate event elements. The elements are empty and contain their data asattribute values. In this code, the CreateElement method of the XmlDocument is invoked and passed aparameter, which is the name of the element to create:
Dim elem As XmlElement = logDoc.CreateElement("event")
The timeStamp variable is assigned a formatted value. Attributes are given values using theSetAttribute method of the XmlElement. Two parameters are passed to the method, the name of theattribute and its value:
timeStamp = DateTime.Now.ToString("T")With elem
.SetAttribute("eventType", "deployment")
.SetAttribute("reportItem", reportItem.Path)
.SetAttribute("sizeBytes", reportItem.Size)
.SetAttribute("timeStamp", timeStamp)End With
The newly created element is then added as a child element to the root node and the file changes aresaved. If an error occurs while processing the entry, you write the details to the log and continue:
logDoc.DocumentElement.AppendChild(elem)logDoc.Save(m_logPath)
Catch ex As ExceptionLogError(ex, reportItem)
End TryEnd Sub
This code will output an XML element format as:
<event eventType="deployment" reportItem="/RSExplorer/Company Sales" sizeBytes="17274" timeStamp="8:41:35 PM" />
The LogError method also logs event elements, but the eventType attribute value is error. The errorMessage property is written to the log. The method code is presented here for completeness:
#If devEnvironment ThenPublic Sub LogError(ByVal err As System.Exception, ByVal reportItem As
ReportServer.CatalogItem) 'ReportServer.#Else
Public Sub LogError(ByVal err As System.Exception, ByVal reportItem As CatalogItem)
#End IfDim timeStamp As String
300
Chapter 8
68787_ch08.qxp 26/03/2004 3:54 PM Page 300

TryDim logDoc As XmlDocument = GetLogFile()Dim elem As XmlElement = logDoc.CreateElement("event")timeStamp = DateTime.Now.ToString("T")
With elem.SetAttribute("eventType", "error")If Not (reportItem Is Nothing) Then .SetAttribute("itemToProcess", reportItem.Name).SetAttribute("errorMessage", err.Message).SetAttribute("timeStamp", timeStamp)
End WithlogDoc.DocumentElement.AppendChild(elem)logDoc.Save(m_logPath)
Catch ex As Exceptionm_errFlag = TrueThrow ex
End TryEnd Sub
The LogComment method takes a string parameter and writes it to the file as an XML comment. Becausethis method takes a String data type parameter the method signature doesn't have to be wrapped in aconditional compilation block. Again, this method code is provided for completeness. The code bundleis also downloadable from www.wrox.com.
Public Sub LogComment(ByVal comment As String)Try
Dim logDoc As XmlDocument = GetLogFile()Dim node As XmlComment = logDoc.CreateComment(comment)logDoc.DocumentElement.AppendChild(node)logDoc.Save(m_logPath)
Catch ex As ExceptionLogError(ex, Nothing)
End Try
End Sub
With the addition of the four logging members, the DeployReports script file is complete and ready torun.
Running the ScriptRunning the script in the development environment is simply a matter of pressing F5 on your keyboard.This will compile the assembly just before the CLR steps into the Main method. The script can bedebugged using techniques such as setting breakpoints and stepping through code. In the productionenvironment the script will be run at the command prompt as part of a scheduled batch file, which itselfis a script file.
301
Report Scripting
68787_ch08.qxp 26/03/2004 3:54 PM Page 301

Once the code is clean and bug-free in the development environment, it's ready to be toggled so it can behosted by the RS utility. Simply set the devEnvironment value to False and change the file extension to.rss. The script file is now ready for running in the RS utility environment.
To run the script, open the command prompt and navigate to the directory containing the script file.Navigating in the console is easily done by typing cd and a space at the command prompt. Then openWindows Explorer and navigate to the directory containing the script file. Enable the Show full path inaddress bar setting of Windows Explorer. Drag the folder icon in the Windows Explorer address bar intothe console window. The console window will be activated and the directory path added; press Enter tohave the console navigate to that directory.
Then invoke the RS utility by typing rs at the command prompt and supply values for the neededarguments. For this script, the RS utility will need to know the URL of the source Report Server instance,the name of the script file, and a value for the targetURL variable within the script.
A sample command would be as follows:
rs /i DeployReports.rss /s http://localhost/reportserver/reportservice.asmx /v targetURL= http://localhost/reportserver/reportservice.asmx
This syntax invokes the RS utility to have it run the DeployReports.rss input file against the serverURL http://localhost/reportserver/reportservice.asmx (the default Report Server locationon the local machine). The targetURL variable value has been set to the same URL as the sourcemachine. This is suitable for development and testing as this will cause the script to write the deployedreport definitions back over the reports on the source machine.
In a production environment, the targetURL value would be different from the source. Ideally, thescript would also run by itself.
Scheduling the ScriptA frequently heard request is how to automate the running of a microsoft script according to a schedule.Invoking the RS utility can be done using the Task Scheduler. In Microsoft Windows XP, go to ControlPanel and select Scheduled Tasks.
That will open a window listing of any tasks already scheduled along with the option to Add ScheduledTask. Double click that item to open the Schedule Task Wizard. Click Next to start the process ofscheduling your script run.
The first step is to choose which program to run as shown in Figure 8-7:
302
Chapter 8
68787_ch08.qxp 26/03/2004 3:54 PM Page 302

Figure 8-7
Click the Browse button to browse to the rs.exe utility. It is located in C:\Program Files\MicrosoftSQL Server\80\Tools\Binn.
Select the rs.exe program and click Open. That will bring you to the next step in the wizard where youcan give the task a descriptive name and indicate how often you want the task to run. For thisdemonstration, the One time only option is selected as shown in Figure 8-8:
Figure 8-8
Clicking the Next button will bring you to a form where you can set the time for the task to run. Theoptions for configuring the run time vary depending on the time interval you've chosen. Choose a timethat's appropriate for you and click Next.
The next form is an opportunity to provide the credentials that you want the request to be performedunder. Enter appropriate values and click Next as shown in Figure 8-9:
303
Report Scripting
68787_ch08.qxp 26/03/2004 3:54 PM Page 303

Figure 8-9
At the next form, check the box to access advanced properties, as shown in Figure 8-10:
Figure 8-10
Clicking Finish will open the property pages dialog box for the task as shown in Figure 8-11:
Figure 8-11
304
Chapter 8
68787_ch08.qxp 26/03/2004 3:54 PM Page 304
On the Task tab, the Run textbox is where you provide the command line arguments that the RS utilityneeds to run. For example, the input file, Report Server URL, and so on are added as arguments to thecommand listed in the Run textbox.
You can also access this dialog box by opening the task again after completing the Schedule Task Wizardprocess. Note that you can access the schedule and other settings for this task by using the tabs.
SummaryScripting is a tool that allows you to automate the administration and management of a Report Serverinstance, its content, and metadata. The WMI-flavored interface exposed by Reporting Services andother Microsoft application servers is powerful and flexible.
Reporting Services provides several command line utilities including the RS utility. This utility runsscripts written in Visual Basic .NET code contained in files with a particular structure. Note that the RSutility provides access to a limited number of base class library namespaces.
In this chapter, you've read about the capabilities and limitations of scripts written for hosting by the RSutility. A structure for the script file was presented, which uses the conditional compilation capabilitiesof both Visual Studio .NET and the RS utility runtime environment. The script deploys report definitionsfrom a source machine to a target machine while logging actions to an XML file. Creating scripts inVisual Studio .NET provides a rich, familiar development environment. Conditional compilation createsa file that easily toggles between development and production environments.
Scripting is but one of the features of Reporting Services. The next chapter describes how toprogrammatically render reports including accessing reports using HTTP requests and submittingparameters to reports using query strings.
305
Report Scripting
68787_ch08.qxp 26/03/2004 3:54 PM Page 305

68787_ch08.qxp 26/03/2004 3:54 PM Page 306

URL Access andProgrammatic Rendering
The main focus of Reporting Services is to be a flexible reporting tool that can be easilyincorporated in different applications. There are a number of scenarios where the Report Viewerprovided by Reporting Services will not meet report delivery needs. For example, manyorganizations maintain corporate reporting portals. In these situations, developers might need away to display numerous reports in a web environment. Reporting Services can also be embeddedinto any line of business applications. Developers might want to use Reporting Services to createinvoices or purchase orders directly from their applications. For other organizations, the defaultReport Viewer might not provide a broad security architecture.
All of these issues can be solved with the features available in Reporting Services. In this chapter,you will take a look at the two methods for rendering reports in Reporting Services. They are:
❑ Using URLs to access reports
❑ Using the Reporting Services Web Service to programmatically render reports
URL access allows you to quickly incorporate Reporting Services reports in applications such asweb portals. Programmatic rendering allows for creating custom interfaces. Developers can doanything from implementing their own security architecture around Reporting Services to creatingtheir own parameter interface.
By the end of this chapter, you will know about:
❑ The syntax and structure for accessing Reporting Services through the URL
❑ The reporting items that can be accessed through the URL
❑ The parameter options that can be passed to the URL to control report output
❑ Creating a Windows application that renders reports to the file system
❑ Creating a web application that returns rendered reports to the browser
999
68787_ch09.qxp 26/03/2004 6:25 PM Page 307

Chapter 9
308
URL AccessReporting Service's main means for accessing reports is through HTTP requests. These requests can bemade through URLs in a web browser or a custom application. By passing parameters in the URL, youcan specify the report item, set the output format, and perform a number of other tasks. In the next fewsections, you will look at the features available through URL requests, URL syntax, passing parameters,and setting the output format.
URL SyntaxThe basic URL syntax is as follows:
http://server/virtualroot?[/pathinfo]&[prefix:]param=value[&[prefix:]param=value]...n]
Here is a quick look at retrieving the list of items under the Professional SQL Reporting Services folder:
The parameters in the syntax are as follows:
❑ server: Specifies the instance of Report Server you would like to access. To access your localmachine, you can either type the machine name or use the localhost alias.
❑ virtualroot: Specifies the IIS virtual directory you specified during the setup. When installingReporting Services, you must enter two virtual directories: one for the Report Manager and onefor the Reporting Services Web Service. By default, the virtual directory you would access isreportserver.
❑ pathinfo: After specifying the server and virtual directory to the Reporting Services Web Service,you can pass a number of parameters to access report objects. The first parameter you pass ispathinfo, which specifies the path to the resource you want to access. To access the root of theReport Server, you can simply place a single forward slash ().
Once you have listed the path, you can pass various parameters. These parameters will depend on thetype of object you are referencing. Reports will have a number of parameters to specify properties suchas the rendering format. Each parameter is separated by an ampersand (&) and contains a name=valuepair for the parameter.
http://localhost/reportserver?%2fProfessional+SQL+Reporting+Services&rs:Command=ListChildren
Now that you've taken a look at the basic URL syntax, let's see how it is implemented in each of theReporting Services objects.
Accessing Reporting Services ObjectsURL requests are not limited to just reports. You can access a number of Reporting Services items. Theseinclude:
❑ Folders
❑ Data Sources
68787_ch09.qxp 26/03/2004 6:25 PM Page 308

❑ Resources
❑ Reports
In this section, you will look at accessing each of the items listed above. You will go through sampleURLs and look at items provided in the Professional SQL Reporting Services project.
FoldersAccessing folders will be your starting point for looking at URL requests. Let's take a look at the simplestURL request you can make:
http://localhost/reportserver
With this request, you can see a listing of all reports, data sources, resources, and folders in the rootdirectory of the Reporting Server as shown in Figure 9-1. To access another server, simply replacelocalhost with the name of the server.
Figure 9-1
To see how other folder URL requests work, simply click on any of the <dir> links. Clicking theProfessional SQL Reporting Services link will give you the following URL:
http://localhost/reportserver?%2fProfessional+SQL+Reporting+Services&rs:Command=ListChildren
This URL contains the following items:
❑ Path to the report: %2fProfessional+SQL+Reporting+Services
❑ Command to list the contents of the directory: rs:Command=ListChildren
You'll take a closer look at the URL parameters in the Reporting Services URL Parameters section later inthe chapter.
Data SourcesThrough URL requests, you can also view the contents of data sources. Let's again take a look at theProfessional SQL Reporting Services folder. Enter the following URL to view the contents of this folder:
309
URL Access and Programmatic Rendering
68787_ch09.qxp 26/03/2004 6:25 PM Page 309

http://localhost/reportserver?%2fProfessional+SQL+Reporting+Services&rs:Command=ListChildren
You should see the listing of items as shown in Figure 9-2:
Figure 9-2
You will notice that one of the items listed is AdventureWorks2000. This item is a data source by the <ds>tag next to the item name. If you follow the AdventureWorks2000 link, you will be able to view thecontents of that data source. Figure 9-3 shows the AdventureWorks2000 data source contents:
Figure 9-3
Let's take a look at the URL used to view the AdventureWorks2000 data source:
http://localhost/reportserver?%2fProfessional+SQL+Reporting+Services%2fAdventureWorks2000&rs:Command=GetDataSourceContents
This URL contains the following items:
❑ Path to the data source: %2fProfessional+SQL+Reporting+Services%2fAdventureWorks2000
❑ Command to view the data source content: rs:Command=GetDataSourceContents
310
Chapter 9
68787_ch09.qxp 26/03/2004 6:25 PM Page 310

Viewing the data source allows you to quickly see how your data source is configured. Notice that thisinformation is returned in XML format. This allows you to easily work with the data source information.If you have your own reporting application that shares a single connection, you could use this URL todynamically load this data source information. This information could then be used to make otherdatabase connections in your application.
ResourcesResources are items that you use in your reports like images or additional resources that have beenadded to your Report Server folder, such as Word and Excel documents. You can use URLs to accessresources stored in the Report Server. Depending on the type of resources you reference, you will eitherbe prompted to open or save a file, such as a Word or Excel document, or the resource will be rendereddirectly in the browser. In the Professional SQL Reporting Services folder, a resource for the AdventureWorks logo is added. This image can be directly rendered in your browser. Let's take a look at thefollowing URL:
http://localhost/reportserver?%2fProfessional+SQL+Reporting+Services%2fAdventure+Works+Logo&rs:Command=GetResourceContents
See Figure 9-4 for the output:
Figure 9-4
The URL contains the following contents:
❑ Path to the resource: %2fProfessional+SQL+Reporting+Services%2fAdventure+Works+Logo
❑ Command to retrieve the resource content: rs:Command=GetResourceContent
You can use this information in other applications. If you want to reference the Adventure Works logofrom a web page, you could simply set the src attribute of an image tag (<img>) to reference the earlierURL .
Resources can also be incredibly handy for storing documents. In your reporting solution, you mightwant to store readme files to accompany your reports. You can store these documents as resources on theReport Server and then apply different properties to them, such as security. Your application could thenpoint to the resource URL to allow downloading of the document.
311
URL Access and Programmatic Rendering
68787_ch09.qxp 26/03/2004 6:25 PM Page 311

ReportsThe most important objects you can access through the URL are your reports. This section provides aquick look at the syntax for accessing reports. Later we'll discuss the various parameters you can pass tochange things such as report parameters, output formats, and other items.
The basic syntax for accessing a report is very similar to accessing all of your other resources. You shouldfirst specify a path to the report and then provide the commands for its output. Let's look at the basicURL for accessing your Customer Product Sales Pivot report:
http://localhost/reportserver?%2fProfessional+SQL+Reporting+Services%2fCustomer_Product_Sales_Pivot1&rs:Command=Render
View the Customer Product Sales Pivot report as in Figure 9-5:
Figure 9-5
The URL contains the following contents:
❑ Path to the resource:%2fProfessional+SQL+Reporting+Services%2fCustomer_Product_Sales_Pivot1
❑ Command to retrieve the resource content: rs:Command=Render
Using URLs is the easiest and most convenient way to embed Reporting Services reports in yourapplications. You can simply create your own links that point to the various report URLs. You areprobably asking yourself, ''That's nice! I can access a report, but how do I pass parameters and changethe output format?'' In the next section, you'll take a look at all the possible parameters you can passthrough the URL including setting report parameters and output format.
Reporting Services URL ParametersNow that you have seen the basics of obtaining items from your Report Server using URLs, let's take alook at passing some parameters. The next few sections will move through how parameters are passed
312
Chapter 9
68787_ch09.qxp 26/03/2004 6:25 PM Page 312

to Reporting Services and the available values for these parameters. The majority of the parameterfunctionality will be focused on report rendering, but some items will also apply to your data source,resources, and folder.
Parameter PrefixesThe first thing you need to take a look at is the different parameter prefixes in Reporting Services. Thereare four main parameter prefixes in Reporting Services: rs, rc, dsp, and dsu. The following sections willtake a look at these prefixes in detail.
rs Prefix
In the earlier examples, you saw the parameter rs:Command. This parameter contains the prefix rs. The rsprefix is used to send commands to the Report Server. The following URL shows an example of the rsprefix being used to call the Command parameter and pass the ListChildren argument to it:
http://localhost/reportserver?%2fProfessional+SQL+Reporting+Services&rs:Command=ListChildren
rc Prefix
The second main parameter prefix in Reporting Services is the rc prefix. This prefix is used to interactwith the given report output format. For example, if you are outputting your report as HTML, you cancontrol the HTML viewer. You can use this prefix to pass parameters that do things such as hide toolbarsor control the initial state of toggle items. The following URL calls the Product Sales Pivot report andturns off the parameter inputs:
http://localhost/reportserver?%2fProfessional+SQL+Reporting+Services%2fCustomer_Product_Sales_Pivot1&rs:Command=Render&rc:Parameters=False
Figure 9-6 shows how rc:Parameters is used to hide parameters in the HTML viewer:
Figure 9-6
Notice that the parameter dialog is not visible in the HTML viewer.
313
URL Access and Programmatic Rendering
68787_ch09.qxp 26/03/2004 6:25 PM Page 313

dsu and dsp Prefixes
Parameter prefixes can also be used to send database credentials. Use the dsu prefix to pass the datasource username and dsp to pass the data source password. In any Reporting Services report, you couldincorporate multiple data sources. So, you need a way to specify which data source the credentialsshould be passed to. That's where the prefixes come in. The full syntax to use these prefixes is as follows:
[dsu | dsp]:datasourcename=value
If you want to pass the user name guest with a password guestPass to your AdventureWorks2000 datasource, you will use the following URL parameters:
&dsu:AdventureWorks2000=guest&dsp:AdventureWorks2000=guestPass
Now that you have seen the different parameter prefixes in Reporting Services, we'll move on to theavailable parameters that can be used with the rs and rc prefixes.
ParametersFirst, let's take a look at the parameters that can be used with the rs prefix. The following table lists thethree available values and their uses:
Now that you have seen the different rs parameters, let's take a look at some of their available values.
Parameter Use
Command The Command parameter is used to send instructions to the Report Server about the item being retrieved. Available values return the report item and set session timeout information.
Format The Format parameter is used when rendering reports. Any rendering formats available on the report server can be passed using this parameter.
Snapshot The Snapshot parameter is used to retrieve historical report snapshots. Once a report has been stored in snapshot history, it is assigned a time/date stamp to uniquely identify that report. Passing this time/date stamp will return the appropriate report.
You should be aware that these credentials will be passed as clear text over theInternet and will be visible to the end user. You can encrypt the URL using the SecureSockets Layer (SSL) on your web server. This will prevent the information from beingsent as clear text over the Internet, but will not prevent the end user from viewing thecredentials that you use. Make sure you consider these factors in your reportingsolution architecture.
314
Chapter 9
68787_ch09.qxp 26/03/2004 6:25 PM Page 314

Command Parameter
The Command parameter is your main parameter for setting the output of a given report item. It can alsobe used for resetting a user's session information, which guarantees that a report is not rendered fromthe session cache. Here is a listing of the possible values that can be passed to the Command parameter:
Format Parameter
The Format parameter is the main parameter for controlling the report output. The available values forthis parameter are determined by the different rendering extensions available on your Report Server.The following table shows the output formats available with the default installation of ReportingServices:
Table continued on following page
Value Output
Web Formats
HTML3.2 HTML version 3.2 output. This format is used for older browser versions.
HTML4.0 HTML version 4.0 output. This format supports newer browser versions such as Internet Explorer 4.0 and above.
Value Use
GetDataSourceContents The GetDataSourceContents command can be used to return data source information in an XML format. You can use this parameter on shared data source items.
GetResourceContents The GetResourceContents command will return the binary of your Reporting Services resources. You can use this to retrieve report resources, such as images, via the URL.
ListChildren The ListChildren command is used in combination with a Reporting Services folder. This value allows us to view a list of all items in a given folder.
Render The Render command is probably the most commonly used command value. It allows you to render your report via the URL.
ResetSessionTimeout The ResetSessionTimeout command can be used to refresh a user's session cache. Because Reporting Services works via HTTP, it is crucial for the server to maintain state information about the user. However, if you want to ensure that a report is executed each time the user views a report, this state information needs to be refreshed. Use this parameter to reset the user's sessions and remove any session cache information.
315
URL Access and Programmatic Rendering
68787_ch09.qxp 26/03/2004 6:25 PM Page 315

When you set the rendering formats via the URL, the report will either be rendered directly in thebrowser or you will be prompted to save the output file. Let's take a look at rendering the CustomerProduct Sales Pivot report in PDF format. Enter the following URL using the rs:Format=PDF parameter:
http://localhost/reportserver?%2fProfessional+SQL+Reporting+Services%2fCustomer_Product_Sales_Pivot1&rs:Command=Render&rs:Format=PDF
Value Output
Web Formats (continued)
MHTML MHTML standard output. This output format is used for sending HTML documents in email. Using this format will embed all resources, such as images, into the MHTML document instead of referencing external URLs.
Print Formats
IMAGE The IMAGE format allows you to render your reports to a number of different Graphics Device Interfaces (GDI) such as BMP, PNG, GIF, or TIFF.
PDF The Portable Document Format (PDF) can also be used for viewing and printing documents.
Data Formats
EXCEL Excel XP and Excel 2003 output. Users can use this format to further manipulate report information.
CSV Comma Separated Value (CSV) format. CSV output is handy for consuming report data through applications that work with CSV files.
XML Extensible Markup Language (XML) format. XML can be used by numerous applications to consume report data.
Control Format
NULL The NULL provider allows you to execute reports without rendering. This can be very useful when working with reports that have cached instances. You can use the NULL format to execute the report for the first time and thereby storing the cached instance.
316
Chapter 9
68787_ch09.qxp 26/03/2004 6:25 PM Page 316

Figure 9-7 shows the output:
Figure 9-7
Notice that the browser will now prompt you to save the rendered report. This can be easilyincorporated into your own custom applications or portals. You can simply give your users a linkcontaining the rs:Format parameter and automatically output the correct format.
Setting Device Information
Now that you have seen the various output formats available in Reporting Services, you need to take alook at the different device information settings for the various formats. The Format parameter allowsyou to specify the type of format you want, but each format has specific settings that can be useful toyou. For example, if you specify the IMAGE format, you get an output in TIFF. What if you wanted aBitmap or JPEG image? Well, to output in a different image format, all you need to do is to just specifydevice information when passing the URL. Let's take a look at outputting your Customer Product SalesPivot report in JPEG format using the following URL (Figure 9-8 shows the output):
http://localhost/reportserver?%2fProfessional+SQL+Reporting+Services%2fCustomer_Product_Sales_Pivot1&rs:Command=Render&rs:Format=IMAGE&rc:OutputFormat=JPEG
Figure 9-8
317
URL Access and Programmatic Rendering
68787_ch09.qxp 26/03/2004 6:25 PM Page 317

Notice that the file type sent back to you is a JPEG image. There are numerous device informationsettings you can use for each of the rendering extensions. Each device information setting is prefixedusing the rc prefix. The following syntax can be used for passing device information:
http://server/virtualroot?/pathinfo&rs:Format=format&rc:param=value[&rc:param=value...n]
Now that you have seen the different output formats and commands you can pass to Reporting Services,let's take a look at passing information to your individual reports.
Passing Report Information through the URLThe previous sections illustrated how a URL can be used to control report rendering In the next section,you will look at how a URL can be used to control report execution. This section starts with anexplanation of passing report parameters. These are the parameters that you define while authoringyour report. Finally, you'll see how historical snapshots can be rendered using the URL.
Report ParametersMany of your reports have parameters to control all kinds of behavior. You can use parameters to alteryour query, filter datasets and tables, and even change the appearance of your reports. ReportingServices allows you to pass this information directly via a URL request. In the earlier section, you saw alot about the parameter prefixes and the available values that can be sent to the Reporting Services. Withreport parameters, you simply need to remove the prefix and directly call the parameter name.
Your Customer Product Sales Pivot report accepts two parameters: OrderDateFrom and OrderDateTo. Youmight want to allow your users to update these parameters through a custom interface you define.When you call the report, you will need to provide these parameters in the URL as shown here:
http://localhost/reportserver?%2fProfessional+SQL+Reporting+Services%2fCustomer_Product_Sales_Pivot1&rs:Command=Render&OrderDateFrom=12/1/2003&OrderDateTo=12/31/2003
Let's take a look at calling the report with an OrderDateFrom value of 12/1/2003 and OrderDateTo value of12/31/2003 (see Figure 9-9):
Figure 9-9
318
Chapter 9
68787_ch09.qxp 26/03/2004 6:25 PM Page 318

Notice that by passing the parameters in your URL, the HTML viewer updates to reflect the values. Theparameter name that you use in the URL is defined in the report definition. Since your ReportParameters are called OrderDateFrom and OrderDateTo, these names are used in your URL.
Now that you have seen how to pass report parameters to the URL, let's look at passing snapshot IDs torender historical execution snapshots.
Rendering Snapshot HistoryOne of the major features of Reporting Services is the ability to create execution snapshots of reports. Sayyou have a report where the data updates on a monthly basis. Once the data is updated, it does notchange for another month. A perfect example of this would be monthly financial statements. If your dataonly changes once a month, there is no reason to query your database every time you need a report. So,you can use execution snapshots to store this information after the query has been executed. Goingalong the same lines as a monthly report, what should happen when your data updates from sayJanuary to February? You don't want to lose the January snapshot once the February information isavailable. That is where historical snapshots come into play. When you create the February snapshot,you go and add January to the snapshot history and so on for each subsequent month.
Now that you have execution snapshots stored in history you need some way to access them. ReportingServices gives you a very easy way to do this. As you have already seen, each report has a report paththat can be used to render the report. To render a historical snapshot, you simply need to add aparameter for the historical snapshot ID.
The syntax to pass your snapshot ID is as follows:
http://server/virtualroot?[/pathinfo]&rs:Snapshot=snapshotid
The snapshot ID for your historical snapshot will be the time and date stamp of when the report wasadded to the history. The time is adjusted to GMT based on the time zone where the historical snapshotwas added.
URL Rendering SummaryThrough URL rendering, you have seen the various commands that can be passed to Reporting Servicesthat can be used to control the report item display, the format to use, and snapshot information using thers prefix. Once you have created your commands for the Report Server, you can pass parameters specificto the output format. Using the rc prefix and the device information parameters, you can specify thingssuch as encoding and what items to display in the HTML viewer. After you have specified the reportitem, you need to know how to output it. You can pass parameters to your report by simply passing theparameter name and value combination.
In the next section, let's take a look at the second part of rendering Reporting Service reports. You canuse URLs for simple web applications and web portals, but sometimes you need finer control overreport access and rendering. To achieve this, we'll use the Reporting Service Web Service toprogrammatically render your reports.
319
URL Access and Programmatic Rendering
68787_ch09.qxp 26/03/2004 6:25 PM Page 319

Programmatic RenderingReporting Services gives you two main methods for rendering your reports. Rendering using a URL isvery handy and easy to implement in many situations, but it does have its limitations. When renderingfrom the URL, you have to make sure that you use the security infrastructure provided with ReportingServices. For some applications, such as public web sites, you might want to implement your ownsecurity. In that case, rendering from the URL will not provide the functionality you need. In this section,you will take a look at rendering reports using the Reporting Services Web Service.
You'll connect to the Reporting Services Web Service, return a list of available reports, retrieve theirparameters, and finally render the report. Let's take a look at two implementations of programmaticrendering. The first implementation is using a Windows form to render reports to a file. This will helpyou to understand the basic principles without a lot of interface work. The second implementation willtake you through rendering through an ASP.NET page. You'll see some of the items that need to beconsidered when working through a web application.
Common ScenariosBefore you look at the actual programming code for rendering reports, it is important to understand acouple of scenarios where it is reasonable to do so. There are two scenarios that are commonlyexperienced while working with clients. They do not represent the only scenarios where you wouldwrite your own rendering code, but do illustrate how and when custom code can be used. Let's look ateach of these scenarios.
Custom SecurityProbably the biggest question I get when working with clients is, "How do I use Reporting Services if Idon't want to implement their security infrastructure?'' Reporting Services requires you to connect toreports using a Windows identity. In many organizations, this is just not possible. They have mixedenvironments or non-trusted domains that do not allow for identification to the Report Server. Someclients also have largescale authentication and authorization infrastructures already implemented.
You can still use Reporting Services in these situations. Using your own security infrastructure involvescreating both authentication and authorization code in your environment. After you have determinedthat a user can access a report, a Windows identity that you define can be used to connect to reports. Tohide this security implementation, the Reporting Services Web Service can be employed. You can renderreports directly to a browser or file without passing the original user identity to the Report Server.
Server-Side ParametersWhile URL rendering is by far the easiest way to incorporate Reporting Services in your applications, itdoes have some limitations. When you send information via a URL, it is very easy for a user to changethat URL or see what it is that you pass.
By using the Reporting Services Web Service you can easily hide the details of how you retrieve reportinformation. Parameters are passed through your code instead of the URL. This gives you completecontrol over how that information is retrieved without exposing it to the users. Let's take a look at yourfirst rendering application.
320
Chapter 9
68787_ch09.qxp 26/03/2004 6:25 PM Page 320

Rendering through Windows In this section, we'll take a look at the mechanics of rendering using the Reporting Service Web Service.We are going to build a simple Windows application that returns a list of reports from the Report Server.Once we have the list of reports, we'll use the web service to return a list of report parameters. Afterentering any report parameters, we'll render the report to a file. These steps will illustrate the maincomponents of rendering through program code.
Building the Application InterfaceTo start, you need to build your application interface. Let's start by building a simple Windows form;Figure 9-10 shows the design view of your form:
Figure 9-10
This form will allow you to query a given Report Server to return a list of reports. Once it has returnedthe reports, you can use it to access a list of parameters for the reports. Finally, you'll need to render thereport to a given folder location.
Setting Up the Reporting Service Web ServiceBefore you can get into rendering reports, you need to first set up a reference to the Reporting ServiceWeb Service. Once you have created your web reference, you can start to develop the application. Thenext few figures show you how to create a reference to the web service. Start by adding a web referenceto your project.
Open the Solution Explorer and right click on the Reference folder. Click the Add Web Reference menuitem to open the Add Web Reference dialog as in Figure 9-11:
Figure 9-11
321
URL Access and Programmatic Rendering
68787_ch09.qxp 26/03/2004 6:25 PM Page 321

In the Add Web Reference dialog, enter the location of web service in the URL dialog. This URL willdepend on the Report Server name and the installed location of the Report Server virtual directory. Bydefault, the Report Server virtual directory is located under the root as /reportserver. For the defaultvirtual directory on a local machine, enter the following URL:http://localhost/reportserver/reportservice.asmx?wsdl.
Once you have entered the URL, hit Enter to view a description of the web service. Enter a name for thenew web reference and hit Add Reference. The dialog should look like Figure 9-12 when filled in:
Figure 9-12
Now that you have referenced the web service, you are ready to start writing your code. The first thingyou can do is add a using (C#) or Imports VB.(VB.NET) statements to your code. The first part of theusing statement will be the application name followed by the web reference name. I have called my C#project Rendering and my VB.NET project RenderingVB.
C#using System;using System.Drawing;using System.Collections;using System.ComponentModel;using System.Windows.Forms;using Rendering.RSService;
VB.NETImports SystemImports System.DrawingImports System.CollectionsImports System.ComponentModelImports System.Windows.FormsImports RenderingVB.RSService
322
Chapter 9
68787_ch09.qxp 26/03/2004 6:25 PM Page 322

After you have added the using or Imports statement, you need to create an instance of theReportingService object. This is the main object that will be used to retrieve a list of reports and theirassociated parameters, and then render the report. At the top of the Windows form class code, create thedeclarations shown in the following sections.
C#private ReportingService _rs = new ReportingService();
VB.NETPrivate _rs As New ReportingService
Next, you need to set the security credentials that will be used by Reporting Services. In your code, passthe credentials of the currently logged on user. If you already have your own custom authentication andauthorization method in place, you could pass a system identification you define instead of the currentuser.
Open the Form Load event in the windows form, this is a suitable place for setting the credentials. Insidethis event, set the ReportingService object's Credentials property toSystem.Net.CredentialCache.DefaultCredentials. This will give the web service the credentialsof the currently logged-on user.
C#_rs.Credentials = System.Net.CredentialCache.DefaultCredentials;
VB.NET_rs.Credentials = System.Net.CredentialCache.DefaultCredentials
The final piece you need to add to the Form Load event is the code to populate your drop-down list. Thiscode will add all the format names to the list along with appropriate extensions for each. Let's begin bycreating a small class that helps you populate the drop-down.
C#/* Helper class for format extensions. */private class Format{
private string _name;private string _extension;
public Format(string name, string extension){
_name = name;_extension = extension;
}
public string Name{
get{return _name;}}
323
URL Access and Programmatic Rendering
68787_ch09.qxp 26/03/2004 6:25 PM Page 323
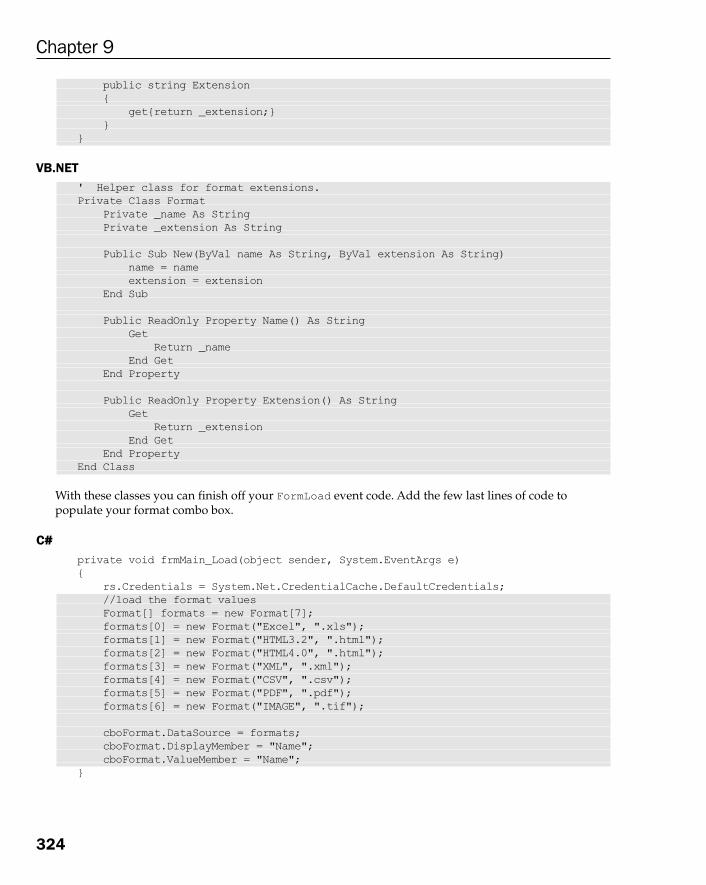
public string Extension{
get{return _extension;}}
}
VB.NET' Helper class for format extensions. Private Class Format
Private _name As StringPrivate _extension As String
Public Sub New(ByVal name As String, ByVal extension As String)name = nameextension = extension
End Sub
Public ReadOnly Property Name() As StringGet
Return _nameEnd Get
End Property
Public ReadOnly Property Extension() As StringGet
Return _extensionEnd Get
End PropertyEnd Class
With these classes you can finish off your FormLoad event code. Add the few last lines of code topopulate your format combo box.
C#private void frmMain_Load(object sender, System.EventArgs e){
rs.Credentials = System.Net.CredentialCache.DefaultCredentials;//load the format valuesFormat[] formats = new Format[7];formats[0] = new Format("Excel", ".xls");formats[1] = new Format("HTML3.2", ".html");formats[2] = new Format("HTML4.0", ".html");formats[3] = new Format("XML", ".xml");formats[4] = new Format("CSV", ".csv");formats[5] = new Format("PDF", ".pdf");formats[6] = new Format("IMAGE", ".tif");
cboFormat.DataSource = formats;cboFormat.DisplayMember = "Name";cboFormat.ValueMember = "Name";
}
324
Chapter 9
68787_ch09.qxp 26/03/2004 6:25 PM Page 324

VB.NETPrivate Sub frmMain_Load(ByVal sender As Object, _
ByVal e As System.EventArgs) Handles MyBase.Load
rs.Credentials = System.Net.CredentialCache.DefaultCredentials'load the format valuesDim formats(6) As Formatformats(0) = New Format("Excel", ".xls")formats(1) = New Format("HTML3.2", ".html")formats(2) = New Format("HTML4.0", ".html")formats(3) = New Format("XML", ".xml")formats(4) = New Format("CSV", ".csv")formats(5) = New Format("PDF", ".pdf")formats(6) = New Format("IMAGE", ".tif")
cboFormat.DataSource = formatscboFormat.DisplayMember = "Name"cboFormat.ValueMember = "Name"
End Sub
You have now created an instance of the ReportingService object, passed the logged-on user'scredentials to it, and populated the format drop-down list. In the next section, we'll take a look atconnecting to the Report Server and retrieving a list of available reports.
Retrieving Report InformationNow that you have set up the Reporting Service Web Service, you need to retrieve your list of reports. Todo this, specify the Report Server you want to query and then call the ListChildren method of theReportingService object. ListChildren returns a list of all items including data sources, resources,and reports. Once you have retrieved the list, you will need to pull out only report items. Finally, youwill add the report items to the drop-down.
Let's start by setting the URL to your Report Server. Open the click event of the Get Items button to startyour code.
C#_rs.Url = txtServer.Text + "/ReportService.asmx";
VB.NET_rs.Url = txtServer.Text & "/ReportService.asmx"
The preceding code uses the server location specified in the Server Address textbox concatenated withthe reference to the Reporting Service Web Service.
Once the URL for the web service is set, you can get the list of reports. Create an array of CatalogItemobjects and then call the ListChildren method. This method takes two parameters, the folder path onthe Report Server and a Boolean value indicating whether or not to recur the directory.
325
URL Access and Programmatic Rendering
68787_ch09.qxp 26/03/2004 6:25 PM Page 325

C#CatalogItem[] items;items = _rs.ListChildren("/", true);
VB.NETDim items() As CatalogItemitems = _rs.ListChildren("/", True)
The last step is to loop through the returned list of items and add them to a drop-down list. Similar tohow the formats were loaded, create a class to help data-bind the report items. Let's take a look at thecode for this class.
C#private class ReportItem{
private string _name;private string _path;
public ReportItem(string name, string path){
name = name;path = path;
}
public string Name{
get{return _name;}}
public string Path{
get{return _path;}}
}
VB.NETPrivate Class ReportItem
Private _name As StringPrivate _path As String
Public Sub New(ByVal name As String, ByVal path As String)_name = name_path = path
End Sub
Public ReadOnly Property Name() As StringGet
Return _nameEnd Get
End Property
326
Chapter 9
68787_ch09.qxp 26/03/2004 6:25 PM Page 326

Public ReadOnly Property Path() As StringGet
Return _pathEnd Get
End PropertyEnd Class
Using the ReportItem class just created, you can now add the report catalog items to the combo box.The following code is for the GetItems button click event including populating the report drop-down.
C#
private void btnGetItems_Click(object sender, System.EventArgs e)
{
//set the path to the report server
_rs.Url = txtServer.Text + "/ReportService.asmx";
//return a list of items from the report server
CatalogItem[] items;
items = _rs.ListChildren("/", true);
//populate your report combo boxcboReports.Items.Clear();foreach(CatalogItem item in items){
if(item.Type == ItemTypeEnum.Report){
cboReports.Items.Add(new ReportItem(item.Name, item.Path));}
}
cboReports.DisplayMember = "Name";cboReports.ValueMember = "Path";
}
VB.NET
Private Sub btnGetItems_Click(ByVal sender As Object, _
ByVal e As System.EventArgs) Handles btnGetItems.Click
'set the path to the report server
_rs.Url = txtServer.Text & "/ReportService.asmx"
'return a list of items from the report server
Dim items() As CatalogItem
items = _rs.ListChildren("/", True)'populate your report combo boxcboReports.Items.Clear()Dim item As CatalogItemFor Each item In items
If item.Type = ItemTypeEnum.Report ThencboReports.Items.Add(New ReportItem(item.Name, item.Path))
End IfNext item
327
URL Access and Programmatic Rendering
68787_ch09.qxp 26/03/2004 6:25 PM Page 327

cboReports.DisplayMember = "Name"cboReports.ValueMember = "Path"
End Sub
You will now be able to open your form and return a list of report items. In the next section you will lookat retrieving the parameters for a report.
Retrieving Report ParametersThe next area of programmatic rendering consists of retrieving a list of parameters for your report. Thisbit of code can be used in a number of scenarios. The parameter interface that is provided by ReportingServices works well for simple parameters. However, it does not handle many thing, like multi-selectparameters or more advanced interfaces such as calendar controls. Being able to return a list ofparameters allows you to create your own dynamic interface.
In the following example, we will create a simple list of parameters. For each parameter, we willdynamically add a label control and textbox to your form. This example will also include theGetParameters click event to run your code. First thing you need to do is identify the report that isselected in your report drop-down list.
C#
ReportItem reportItem = (ReportItem)cboReports.SelectedItem;
VB.NET
Dim reportItem As ReportItem = CType(cboReports.SelectedItem, ReportItem)
This creates a new ReportItem variable using the selected item of your combo box. The ReportItemclass created in the previous section contains a Name and Path property. You can use this Path propertyto retrieve your list of parameters.
To return your list of parameters, call the GetReportParameters method or the ReportingServiceobject. This method has two functions. It returns a list of parameters and can validate parameters againstthe available values defined when creating the report. Let's take a look at the arguments of theGetReportParameters method:
❑ Report: This is the path to the report you want to retrieve.
❑ HistoryID: The ID used to identify any historical snapshots of your report.
❑ ForRendering: This Boolean argument can be used to retrieve the parameters that were setwhen the report was executed. For example, you might create a snapshot of your report orreceive it in an email subscription. In both cases, the report is executed before the user views it.By setting the ForRendering property to true, you can retrieve these values and use them inyour own custom interface.
❑ ParameterValues: The ParameterValues argument can be used to validate the valuesassigned to a parameter. This can be useful in guaranteeing that the parameter values you passto your report match the parameter values accepted by the report.
❑ Credentials: The database credentials to use when validating your query based parameters.
328
Chapter 9
68787_ch09.qxp 26/03/2004 6:25 PM Page 328

Since you are not working with historical reports or validating values, a number of the properties willnot be set. The following code can be used for calling the GetReportParameters method.
C#ReportParameter[] parameters;parameters = _rs.GetReportParameters(reportItem.Path, null, false, null, null);
VB.NETDim parameters() As ReportParameter
parameters = _rs.GetReportParameters(reportItem.Path, Nothing, False,Nothing, Nothing)
The last piece of work to do is to create a user interface for your parameters. The ReportParameterobjects returned by Reporting Services contain information useful for creating a custom interface. Someof the key properties include the parameter data type, prompt, and valid values. All of these can be usedto define your own interface. Finish your code by simply adding a label and textbox to your form foreach ReportParameter. Following is the completed GetParameter click event code.
C#
private void btnParameters_Click(object sender, System.EventArgs e)
{
//return the list of parameters for the report item
ReportItem reportItem = (ReportItem)cboReports.SelectedItem;
ReportParameter[] parameters;
parameters = _rs.GetReportParameters(reportItem.Path, null, false, null,
null);//add the parameters to the parameter list UIint left = 10;int top = 20;foreach(ReportParameter parameter in parameters){
Label label = new Label();TextBox textBox = new TextBox();
label.Text = parameter.Prompt;label.Left = left;label.Top = top;
textBox.Name = parameter.Name;textBox.Text = parameter.DefaultValues[0];textBox.Left = left + 150;textBox.Top = top;top +=25;
grpParamInfo.Controls.Add(label);grpParamInfo.Controls.Add(textBox);
}}
329
URL Access and Programmatic Rendering
68787_ch09.qxp 26/03/2004 6:25 PM Page 329

VB.NET
Private Sub btnParameters_Click(ByVal sender As Object, ByVal e As _
System.EventArgs) Handles btnParameters.Click
'return the list of parameters for the report item
Dim reportItem As ReportItem = CType(cboReports.SelectedItem, ReportItem)
Dim parameters() As ReportParameter
parameters = _rs.GetReportParameters(reportItem.Path, Nothing,
False, _Nothing, Nothing)'add the parameters to the parameter list UIDim left As Integer = 10Dim top As Integer = 20Dim parameter As ReportParameterFor Each parameter In parameters
Dim label As New LabelDim textBox As New TextBoxlabel.Text = parameter.Promptlabel.Left = leftlabel.Top = top
textBox.Name = parameter.NametextBox.Text = parameter.DefaultValues(0)textBox.Left = left + 150textBox.Top = toptop += 25
grpParamInfo.Controls.Add(label)grpParamInfo.Controls.Add(textBox)
Next parameterEnd Sub
Now that you have retrieved your list of reports and built a parameter list, let's take a look at outputtingthe report to a file.
Rendering a Report to a File SystemIn this section, you'll take a look at rendering your report to a file. Using the ReportingService object'sRender method, you can retrieve a byte array that contains the final report. This byte array can be usedin a number of different ways. In this example, you will write the byte array to a file using the filesystem object. Later you will take a look at another example that writes the byte array to the HTTPResponse object.
Before you get into the rendering code, let's look at the different parameters of the Render method:
330
Chapter 9
68787_ch09.qxp 26/03/2004 6:25 PM Page 330

Parameter Data Type Description
Report String Path to the report in Reporting Services.
Format String Output format of the report: HTML3.2, HTML4.0, MHTML, IMAGE, PDF, EXCEL, CSV, XML, NULL.
HistoryID(optional)
String History ID used to render historical snapshots.
DeviceInfo String Information used by a specified rendering format. For example, specifying the image type (.gif,.jpeg) with the IMAGE format.
Parameters ParameterValue Array Input parameter value array used to render the report.
Credentials DataSourceCredentialsArray
Array of data source credentials used to connect to the data sources for a report. These credentials contain the username, login password, and data source name.
ShowHideToggle String Changes initial toggle state of the report.
Encoding (out) String Output returned from Reporting Services containing the encoding of the report. The encoding parameter is used to correctly decode the returned byte array.
MimeType (out) String Output returned from Reporting Services containing the MIME type of the underlying report. Useful when rendering a report to the web. The MIME type can be passed to the Response object to ensure that the browser correctly handles the document returned.
ParametersUsed(out)
ParameterValue Array Output of parameter values used to execute the report. Can include query parameters used for the creation of an execution snapshot. Important when developing the application user interface.
Warnings (out) Warning Array Output of any warnings from Reporting Services.
StreamIds (out) String Array Output of stream IDs that can be used with the Render Stream method.
331
URL Access and Programmatic Rendering
68787_ch09.qxp 26/03/2004 6:25 PM Page 331

The parameters of the Render method are similar to the values that can be passed using URL rendering.In your Windows application, you will be mostly interested in the Report, Format, and Encodingparameters. These parameters allow you to correctly return your report and stream it to the file system.
Now that you have seen the basics around the Render method, let's take a look at the code you need towrite for your Render button click event. The first thing you need to do in your code is retrieve theselected report and output format. Use the Format and ReportItem classes created earlier to retrievethe selected items in your drop-downs.
C#Format format = (Format)cboFormat.SelectedItem;ReportItem reportItem = (ReportItem)cboReports.SelectedItem;
VB.NETDim format As Format = CType(cboFormat.SelectedItem, Format)Dim reportItem As ReportItem = CType(cboReports.SelectedItem, ReportItem)
You need to retrieve the input parameters specified by the user. Then, you need to create a new functionthat loops through the textboxes you've created earlier to retrieve their values and return an array ofParameterValue objects.
C#private ParameterValue[] GetParameters(){
ArrayList controls = new ArrayList();
//get the values from the parameter controlsint len = grpParamInfo.Controls.Count;for(int i=0;i<len;i++){
if(grpParamInfo.Controls[i] is TextBox){
controls.Add(grpParamInfo.Controls[i]);}
}
//add the control information to parameter info objectslen = controls.Count;ParameterValue[] returnValues = new ParameterValue[len];for(int i=0;i<len;i++){
returnValues[i] = new ParameterValue();returnValues[i].Name = ((TextBox)controls[i]).Name;returnValues[i].Value = ((TextBox)controls[i]).Text;
}
return returnValues;}
332
Chapter 9
68787_ch09.qxp 26/03/2004 6:25 PM Page 332

VB.NETPrivate Function GetParameters() As ParameterValue()
Dim controls As New ArrayList
'get the values from the parameter controlsDim len As Integer = grpParamInfo.Controls.CountDim i As IntegerFor i = 0 To len - 1
If TypeOf grpParamInfo.Controls(i) Is TextBox Thencontrols.Add(grpParamInfo.Controls(i))
End IfNext i
'add the control information to parameter info objectslen = controls.Count - 1Dim returnValues(len) As ParameterValue
For i = 0 To lenreturnValues(i) = New ParameterValuereturnValues(i).Name = CType(controls(i), TextBox).NamereturnValues(i).Value = CType(controls(i), TextBox).Text
Next i
Return returnValuesEnd Function
You can now use the GetParameter function to build an array of input parameters. You can add thefollowing code to your Render click event to retrieve the input parameters.
C#ParameterValue[] parameters = GetParameters();
VB.NETDim parameters As ParameterValue() = GetParameters()
Now that you have your list of input parameters, you are almost ready to call the Render method. Forthis, you need to declare variables that will be used for the MIME type, encoding, output parameters,warnings, and stream IDs. These are all output parameters of the Render method. This step is necessarywhen working in C#, but can be avoided in VB.NET by passing Nothing into the unused parameters.The final variable you will need for the Render method is an array of bytes. This byte array can then bewritten to the file system.
C#string encoding;string mimeType;ParameterValue[] parametersUsed;Warning[] warnings;string[] streamIds;
//render the reportbyte[] data;
333
URL Access and Programmatic Rendering
68787_ch09.qxp 26/03/2004 6:25 PM Page 333

data = _rs.Render(reportItem.Path, format.Name, null, null, parameters, null, null, out encoding, out mimeType, out parametersUsed, out warnings, out streamIds);
VB.NETDim encoding As StringDim mimeType As StringDim parametersUsed() As ParameterValueDim warnings() As WarningDim streamIds() As String
'render the reportDim data() As Bytedata = _rs.Render(reportItem.Path, format.Name, Nothing, Nothing, _
parameters, Nothing, Nothing, encoding, mimeType, _parametersUsed, warnings, streamIds)
Finally, you need to take the byte array returned from the Render method and write it to the file system.Use the output path specified in the output textbox along with the report name and format file extensionto open a file stream. Following is the entire Render button click event along with the final piece of codefor writing the file to the file system.
C#private void btnRender_Click(object sender, System.EventArgs e){
//get the format and report item from the comboboxesFormat format = (Format)cboFormat.SelectedItem;ReportItem reportItem = (ReportItem)cboReports.SelectedItem;
//set up variables needed to call render methodParameterValue[] parameters = GetParameters();
string encoding;string mimeType;ParameterValue[] parametersUsed;Warning[] warnings;string[] streamIds;
//render the reportbyte[] data;data = _rs.Render(reportItem.Path, format.Name,
null, null, parameters, null, null, out encoding, out mimeType, out parametersUsed, out warnings, out streamIds);
//create a file stream to write the outputstring fileName = txtOutputLocation.Text + "\\" +reportItem.Name + format.Extension;
System.IO.FileStream fs = new System.IO.FileStream(fileName, System.IO.FileMode.OpenOrCreate);
System.IO.BinaryWriter writer = new System.IO.BinaryWriter(fs);writer.Write(data, 0, data.Length);
334
Chapter 9
68787_ch09.qxp 26/03/2004 6:25 PM Page 334

writer.Close();fs.Close();MessageBox.Show("File written to: " + fileName);
}
VB.NETPrivate Sub btnRender_Click(ByVal sender As Object, ByVal e As System.EventArgs) _
Handles btnRender.Click
'get the format and report item from the comboboxesDim format As Format = CType(cboFormat.SelectedItem, Format)Dim reportItem As ReportItem = CType(cboReports.SelectedItem, ReportItem)'set up variables needed to call render methodDim parameters As ParameterValue() = GetParameters()Dim encoding As StringDim mimeType As StringDim parametersUsed() As ParameterValueDim warnings() As WarningDim streamIds() As String
'render the reportDim data() As Bytedata = _rs.Render(reportItem.Path, format.Name, Nothing, Nothing, _
parameters, Nothing, Nothing, encoding, mimeType, _parametersUsed, warnings, streamIds)
'create a file stream to write the outputDim fileName As String = txtOutputLocation.Text & "\" & reportItem.Name & _
format.Extension
Dim fs As New System.IO.FileStream(fileName, System.IO.FileMode.OpenOrCreate)
Dim writer As New System.IO.BinaryWriter(fs)writer.Write(data, 0, data.Length)writer.Close()fs.Close()MessageBox.Show(("File written to: " + fileName))
End Sub
Now that you have completed the code for rendering the application, let's try it out. You need to buildand run the project. When the form opens, enter your server information in the Server Address textboxand click the Get Items button that you can see in Figure 9-13:
Figure 9-13
335
URL Access and Programmatic Rendering
68787_ch09.qxp 26/03/2004 6:25 PM Page 335

You can select the Customer_Product_Sales_Pivot1 report from the report list (Figure 9-14) and click theGet Parameters button. This will give you two parameters, Order Date To and Order Date From.
Figure 9-14
Finally, enter the Output Folder (C:) and the rendering Format as PDF. Once these items have beenspecified you can click the Render button to render your report. When the rendering is complete, youwill receive a message box letting you know that the file has been written to the specified location asshown in Figure 9-15:
Figure 9-15
You can now search for and open the file Customer_Product_Sales_Pivot1.pdf in Adobe Acrobat.
336
Chapter 9
68787_ch09.qxp 26/03/2004 6:25 PM Page 336

Rendering a Report to the File System SummaryIn this section, you learnt the basic steps of rendering a report to the file system:
❑ Using the ReportingService object's ListChildren method to return a list of reports.
❑ Using the ReportingService object's GetReportParameters method to return a list of reportparameters.
❑ Using the Render method of the ReportingService object to output your report in a givenformat.
These basic steps can be used in numerous applications to render a report. Using these methods, userscan create their own custom list of reports, customer report parameter pages, and output the reportusing the returned byte array. In the next section, you will use some of these same steps to render areport to the web via the Response object.
Rendering to the WebIn the preceding section, you saw the mechanics of rendering to a file system. However, most of today'sapplications are written for the web. Along with URL requests, you can also use the Reporting ServicesWeb Service to render reports programmatically to the web.
While doing this, most of your steps will be identical to rendering to the file system; you simply changethe interface. Using the ListChildren method, developers can easily bind reports to an ASP.NET datagrid or create a tree view of available reports. Likewise, developers could also use the GetParametersmethod to create their own parameter interface.
Since you have seen both the ListChilden and GetParameters methods, in this section, you will workmore with the specifics around developing ASP.NET applications. You'll look at changes that can bemade to the web.config file to pass credential information to Reporting Services. Then you will look atthe mechanics of rendering to the ASP.NET Response object.
Using Integrated AuthenticationThere are two main components to every security model, authentication and authorization. In ReportingServices, you can use Windows Integrated Security within an ASP.NET application to authenticate users.
After creating a new ASP.NET web application, you need to open IIS and change some settings of thevirtual directory.
In the sample created for this chapter, the virtual directory created in IIS is called WebRenderingCS andWebRenderingVB for the C# and Visual Basic .NET projects respectively. To set the virtual directories touse integrated authentication, you need to check their settings in IIS. In Figure 9-16, the appropriate IISsettings are shown.
Before you start your example, you need to ensure that your application is configuredto use Integrated Security.
337
URL Access and Programmatic Rendering
68787_ch09.qxp 26/03/2004 6:25 PM Page 337
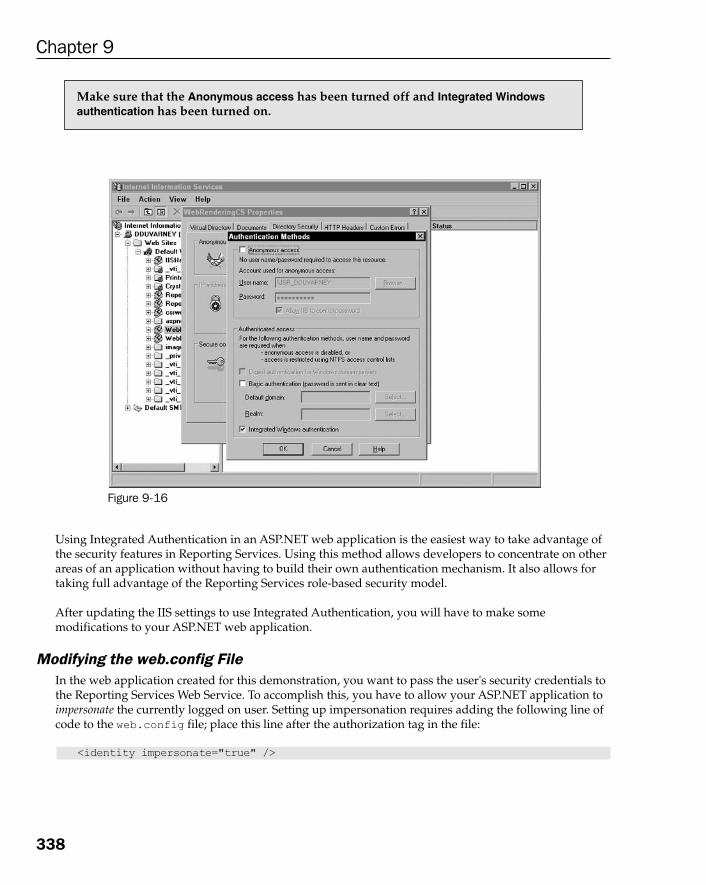
Figure 9-16
Using Integrated Authentication in an ASP.NET web application is the easiest way to take advantage ofthe security features in Reporting Services. Using this method allows developers to concentrate on otherareas of an application without having to build their own authentication mechanism. It also allows fortaking full advantage of the Reporting Services role-based security model.
After updating the IIS settings to use Integrated Authentication, you will have to make somemodifications to your ASP.NET web application.
Modifying the web.config FileIn the web application created for this demonstration, you want to pass the user's security credentials tothe Reporting Services Web Service. To accomplish this, you have to allow your ASP.NET application toimpersonate the currently logged on user. Setting up impersonation requires adding the following line ofcode to the web.config file; place this line after the authorization tag in the file:
<identity impersonate="true" />
Make sure that the Anonymous access has been turned off and Integrated Windowsauthentication has been turned on.
338
Chapter 9
68787_ch09.qxp 26/03/2004 6:25 PM Page 338

Setting Up the Reporting Service Web ServiceJust like in any Windows application, you need to set a reference to the Reporting Services Web Service.The details for creating the reference are identical to those found in the Rendering Through Windowssection, so we will not go into the details here.
For this example, we have added a web reference to http://localhost/reportserver/reportservice.asmx?wsdland named it RSService.
Rendering to the Response ObjectNow that you have set up Integrated Authentication and modified the web.config file, you're ready towrite some code. In this application, you will have one page that takes in a report path and format fromthe URL. You'll use this information to call the Render method of the Reporting Services object andwrite that information back to the response stream.
This sample will use one ASP.NET page called Render.aspx. Place your code sample in the Page_Loadevent of the page. This would be a logical approach when developing an application around ReportingServices. It allows you to have one point of entry to the Report Server. The page could then be referencedfrom other areas of an application.
Let's add some code to the pages Page_Load event to retrieve the report path and format from the HTTPRequest.
C#string path = Request.Params["Path"];string format = Request.Params["Format"];
VB.NETDim path As String = Request.Params("Path")Dim format As String = Request.Params("Format")
Now that you have the report path and format, you can start setting up the ReportingService object.Like you did with the Windows application, you will create an instance of the ReportingServiceobject and then set the credentials to the credentials of the currently logged-on user.
C#//create the ReportingService objectReportingService rs = new ReportingService();
//set the credentials to be passed to Reporting Servicesrs.Credentials = System.Net.CredentialCache.DefaultCredentials;
VB.NET'create the ReportingService objectDim rs As New ReportingService
'set the credentials to be passed to Reporting Servicesrs.Credentials = System.Net.CredentialCache.DefaultCredentials
339
URL Access and Programmatic Rendering
68787_ch09.qxp 26/03/2004 6:25 PM Page 339

Once the Reporting Service object has been created and your credentials set, you can go ahead andrender the report. You will create variables to pass any report parameters (none in this example) andcapture the reports encoding, MIME type, parameters used, warnings, and stream IDs. The key outputparameter, which you'll render your report through, is the MIME type. This parameter will tell the HTTPResponse what type of document is being passed back. The following code renders your report to theweb application. You should notice that it is identical to the code used in the Windows application.
C#ParameterValue[] parameters = new ParameterValue[0];string encoding;string mimeType;ParameterValue[] parametersUsed;Warning[] warnings;string[] streamIds;
//render the reportbyte[] data;data = rs.Render(path, format, null, null, parameters, null, null,
out encoding, out mimeType, out parametersUsed, out warnings, out streamIds);
VB.NETDim parameters As ParameterValue()Dim encoding As StringDim mimeType As StringDim parametersUsed As ParameterValue()Dim warnings As Warning()Dim streamIds As String()
'render the reportDim data As Byte()data = rs.Render(path, format, Nothing, Nothing, parameters, _
Nothing, Nothing, encoding, mimeType, parametersUsed, _ warnings, streamIds)
The Render method of the ReportingService object passes back a byte array that can be used in anumber of ways. For the web, you will write this information directly back to the HTTP Response
object. Before you write back the data though, you need to set some information about the report,namely, the report MIME type and a file name. You will start by assembling a file name for the report. Todo this, you use the name of the report followed by an extension that you determine using the valuereturned in the MIME type parameter. Following is a sample function for determining a file extensionbased on the MIME type. There are a number of MIME types that can be passed back from ReportingServices that are not shown here, so you might want to add more code to this function for yourapplication needs.
C#string GetExtension(string mimeType){
string retVal="";
switch(mimeType)
340
Chapter 9
68787_ch09.qxp 26/03/2004 6:25 PM Page 340

{case "text/html": //HTML3.2, HTML4.0
retVal = "html";break;
case "multipart/related": //MHTMLretVal = "html";break;
case "text/xml": //XMLretVal = "xml";break;
case "text/plain": //CSVretVal = "csv";break;
case "image/tiff": //IMAGEretVal = "tif";break;
case "application/pdf": //PDFretVal = "pdf";break;
case "application/vnd.ms-excel": //EXCELretVal = "xls";break;
}
VB.NETPublic Function GetExtension(ByVal mimeType As String) As String
Dim retVal As String
Select Case mimeTypeCase "text/html" 'HTML3.2, HTML4.0
retVal = "html"Case "multipart/related" 'MHTML
retVal = "html"Case "text/xml" 'XML
retVal = "xml"Case "text/plain" 'CSV
retVal = "csv"Case "image/tiff" 'IMAGE
retVal = "tif"Case "application/pdf" 'PDF
retVal = "pdf"Case "application/vnd.ms-excel" 'EXCEL
retVal = "xls"End Select
Return retValEnd Function
Now that you have a function to return the appropriate file extension, you can construct a complete filename. Following is the code to use the report path information long with the MIME type to create thefile name.
341
URL Access and Programmatic Rendering
68787_ch09.qxp 26/03/2004 6:25 PM Page 341

C#string extension = GetExtension(mimeType);string reportName = path.Substring(path.LastIndexOf("/") + 1);string fileName = reportName + "." + extension;
VB.NETDim extension As String = GetExtension(mimeType)Dim reportName As String = path.Substring(path.LastIndexOf("/") + 1)Dim fileName As String = reportName & "." & extension
Finally, you need to put it all together by writing the data and file information back to the Responseobject. For this, you:
❑ Start by clearing out any information that is already in the response buffer.
❑ Set the content type of the response equal to the MIME type of your rendered report.
❑ If your report is in a format other than HTML, make sure to attach your file name informationto the response.
❑ Finally, use the BinaryWrite method to write the rendered report byte array directly to theResponse object.
Following is the completed code for the Page_Load event.
C#private void Page_Load(object sender, System.EventArgs e){
//get the path and output format from the query stringstring path = Request.Params["Path"];string format = Request.Params["Format"];
//create the ReportingService objectReportingService rs = new ReportingService();
//set the credentials to be passed to Reporting Servicesrs.Credentials = System.Net.CredentialCache.DefaultCredentials;
ParameterValue[] parameters = new ParameterValue[0];string encoding;string mimeType;ParameterValue[] parametersUsed;Warning[] warnings;string[] streamIds;
//render the reportbyte[] data;data = rs.Render(path, format, null, null, parameters, null, null,
out encoding, out mimeType, out parametersUsed, out warnings, out streamIds);
//determine if format is rendered to the web or a file.string extension = GetExtension(mimeType);
342
Chapter 9
68787_ch09.qxp 26/03/2004 6:25 PM Page 342

string reportName = path.Substring(path.LastIndexOf("/") + 1);string fileName = reportName + "." + extension;
//write the report back to the Response objectResponse.Clear();Response.ContentType = mimeType;//add the file name to the response if it is not a web browser format.if(mimeType!="text/html")
Response.AddHeader("Content-Disposition", "attachment; filename=" + fileName);
Response.BinaryWrite(data);}
VB.NETPrivate Sub Page_Load(ByVal sender As System.Object, ByVal e As System.EventArgs)_
Handles MyBase.Load
'get the path and output format from the query stringDim path As String = Request.Params("Path")Dim format As String = Request.Params("Format")
'create the ReportingService objectDim rs As New ReportingService
'set the credentials to be passed to Reporting Servicesrs.Credentials = System.Net.CredentialCache.DefaultCredentials
Dim parameters As ParameterValue()Dim encoding As StringDim mimeType As StringDim parametersUsed As ParameterValue()Dim warnings As Warning()Dim streamIds As String()
'render the reportDim data As Byte()data = rs.Render(path, format, Nothing, Nothing, parameters, _
Nothing, Nothing, encoding, mimeType, parametersUsed, _warnings, streamIds)
'determine if format is rendered to the web or a file.Dim extension As String = GetExtension(mimeType)Dim reportName As String = path.Substring(path.LastIndexOf("/") + 1)Dim fileName As String = reportName & "." & extension
'write the report back to the Response objectResponse.Clear()Response.ContentType = mimeType'add the file name to the response if it is not a web browser format.If mimeType <> "text/html" Then
Response.AddHeader("Content-Disposition", "attachment; filename=" & fileName)
End If
343
URL Access and Programmatic Rendering
68787_ch09.qxp 26/03/2004 6:25 PM Page 343

Response.BinaryWrite(data)End Sub
This example quickly demonstrates some of the key pieces of code that can be used to to render reportsto the web. You first need to set the security context for the application by configuring WindowsIntegrated authentication and allowing impersonation from your application. Next, you retrieve a reportfrom Reporting Services by specifying the report path and format. Finally, you use the rendered reportdata along with its associated MIME type to render the report using the HTTP Response object.
Now that the code for your web application is complete, let's take a look at using your Render.aspxpage. You can use a simple query string to render your report. A sample query string that renders theEmployee List report from the Professional Reporting Services sample reports in HTML 4.0 format is asfollows:
http://localhost/WebRenderingCS/Render.aspx?Path=%2fProfessional+SQL+Reporting+Services%2fEmployee_List&Format=HTML4.0
This URL does the following:
❑ It calls the Render.aspx page from your C# project.
❑ It passes in the required parameters, the path (Professional SQL Reporting Services/EmployeeList) and the Format (HTML 4.0).
If you place this URL in the Internet Explorer, you'll get the following HTML output as shown in Figure 9-17:
Figure 9-17
344
Chapter 9
68787_ch09.qxp 26/03/2004 6:25 PM Page 344
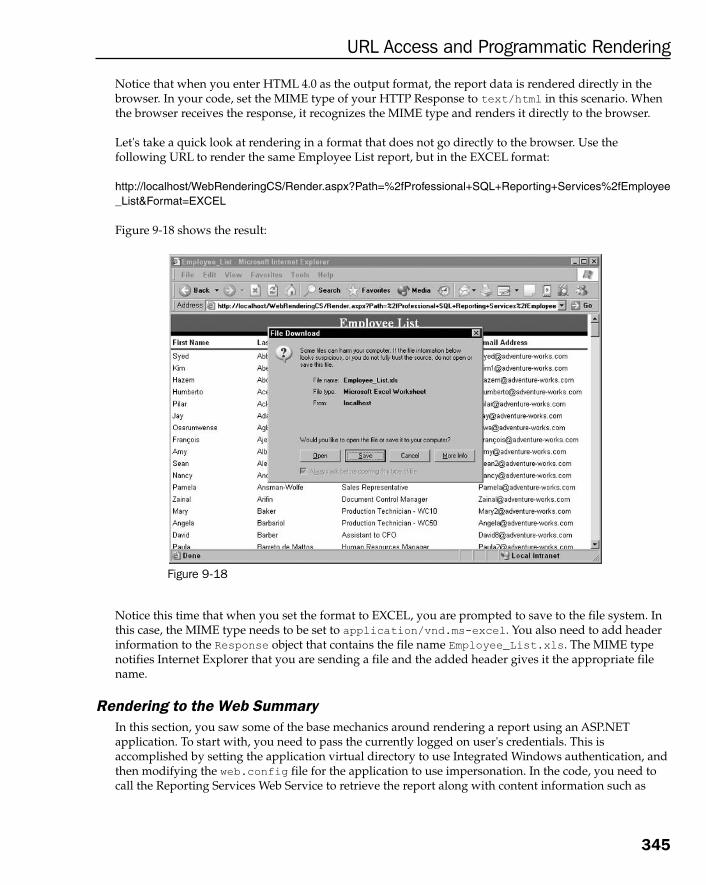
Notice that when you enter HTML 4.0 as the output format, the report data is rendered directly in thebrowser. In your code, set the MIME type of your HTTP Response to text/html in this scenario. Whenthe browser receives the response, it recognizes the MIME type and renders it directly to the browser.
Let's take a quick look at rendering in a format that does not go directly to the browser. Use thefollowing URL to render the same Employee List report, but in the EXCEL format:
http://localhost/WebRenderingCS/Render.aspx?Path=%2fProfessional+SQL+Reporting+Services%2fEmployee_List&Format=EXCEL
Figure 9-18 shows the result:
Figure 9-18
Notice this time that when you set the format to EXCEL, you are prompted to save to the file system. Inthis case, the MIME type needs to be set to application/vnd.ms-excel. You also need to add headerinformation to the Response object that contains the file name Employee_List.xls. The MIME typenotifies Internet Explorer that you are sending a file and the added header gives it the appropriate filename.
Rendering to the Web SummaryIn this section, you saw some of the base mechanics around rendering a report using an ASP.NETapplication. To start with, you need to pass the currently logged on user's credentials. This isaccomplished by setting the application virtual directory to use Integrated Windows authentication, andthen modifying the web.config file for the application to use impersonation. In the code, you need tocall the Reporting Services Web Service to retrieve the report along with content information such as
345
URL Access and Programmatic Rendering
68787_ch09.qxp 26/03/2004 6:25 PM Page 345

MIME type. Once you have the binary report data, you can write that information directly back to theResponse object.
Rendering reports directly through an ASP.NET application can be very helpful. It allows developers tocreate their own interface for items such as parameters. A key point to remember is that Report Manageruses the same Reporting Services Web Service that we used here. So, anything that you can do from theReport Manager, can also be done through your own code. This adds an incredible amount of flexibilityfor developers of custom applications.
SummaryIn this chapter, we saw the two main ways to render reports from Reporting Services. The first part ofthe chapter focused on rendering reports via URL requests. The second part looked at rendering reportsprogrammatically through the Reporting Services Web Service.
URL rendering gives you a quick way to add Reporting Services reports to your own applications. Youcan add Reporting Services reports to custom portals or create your own custom report links in otherapplications.
Programmatic rendering of reports gives developers the greatest amount of flexibility. Since theReporting Services API is implemented as a web service, you can call it from a number of different typesof applications including .NET Windows applications, ASP.NET web applications, and .NET consoleapplications. You can even use this web service from Visual Basic 6.0 or VBA applications usingMicrosoft's SOAP library. This flexibility allows for the creation of a number of applications includingthose that use custom security or pass parameter information stored in other application databases.
With URL rendering and the Reporting Services Web Service, developers can quickly and easilyincorporate Reporting Services into their own custom-built applications.
346
Chapter 9
68787_ch09.qxp 26/03/2004 6:25 PM Page 346

Report Caching andSubscriptions
This chapter will deal with some of the most compelling and exciting capabilities of ReportingServices. If used appropriately, report caching, snapshots, and history provide an efficient, scalablesolution for delivering reports to thousands of users without unnecessarily taxing serverresources. Subscriptions give users reports delivered in any format when they need them. You willuse the Report Manager interface to create and manage subscriptions and then take a look at using.NET code and script to create custom solutions for programmers and administrators.
Report DeliveryReports may be delivered to users in different ways. Using the Report Manager interface, you'veprimarily seen reports delivered on-demand. This means that when a user requests a report, a queryis executed, parameters are used to filter data, and the report is rendered in real-time. Althoughon-demand delivery has the advantage of presenting the most timely report data, it may notalways be the most optimal method and best use of system resources if a report is to be viewedmultiple times. Two other delivery methods, caching and subscriptions, give users additionaloptions to make reports available immediately when needed.
Caching can be used to conserve system resources by rendering reports less often while servingmore users. There are three different ways to cache reports that affect the ability to revisit a reportsnapshot stored in history or to apply client-side filtering without retrieving additional data froma data source.
CachingIt's important that you differentiate between the general concept of caching and a specific type ofreport caching that is referred to as the cached instance of a report. In general terms, report caching
101100
68787_ch10.qxp 26/03/2004 6:05 PM Page 347

Chapter 10
348
means that a copy of an executed report (and possibly a copy of its data) is held on the Report Server inmemory and/or in the Report Server database. Before you try to differentiate between cached instances,snapshots, and snapshot history, we need to discuss some of the details about what goes on when reportsare rendered on the server. In their infinite wisdom, our good friends at Microsoft devised an intelligentmethod for managing report delivery. The result is a mechanism that balances efficiency and flexibility.It is a three-phased approach that encompasses the server-side report definition, an intermediaterendering of a report independent from any specific rendering format and a cache of its data, and thenthe final rendering in a specified format.
Figure 10-1
After a report is deployed to the Report Server, its definition is stored in the Report Server Database.Before the final rendered report is outputted, an image of the report and its data is produced on theserver in an intermediate report format. The intermediate report format describes the placement of data,items, regions, and pages before it is rendered to a specific output format.
The intermediate rendering format is the foundation of report caching. For reports that are rendered ondemand in real time, the intermediate format is held in memory on the Report Server. When a report iscached, the intermediate format image is written to disk in the ReportServerTempDB database (one ofthe two databases that comprise the Report Server). This enables the report data and definition to beretrieved once and outputted in different rendering formats or multiple times in the same renderingformat. This way, the retrieval of report data which is typically the most time consuming process, isperformed once and reused multiple times, thus dramatically improving performance. This also makesit possible for a single cached instance to produce different outputs based on report parameters thatfilter data on the cached data store. The final rendering is performed against the intermediate formatusing a designated rendering extension.
In order to set up any implementation of caching, security credentials must be provided for the datasource of a report. If you are using shared data sources, this only needs to be set up once on the shareddata source.
68787_ch10.qxp 26/03/2004 6:05 PM Page 348

Cached InstancesIf a report is configured to cache report instances when a user first requests the report with a uniquecombination of parameter values (assuming the report takes parameters), the intermediate form of thereport and its data are stored in the Report Server database. Each unique combination of parametersmay produce a separate cached instance. A significant difference between a cached instance and asnapshot is that a cached instance is rendered the first time a user requests the report with uniqueparameters. Cached reports are configured to expire after a specific period or on a schedule, after whichthe report cache is flushed and the report is cached again on the next request. The cache will also beflushed automatically when a report definition is modified and redeployed, caching options arechanged, or the report is deleted.
If the report is rendered from a cached instance, this means that data presented in the report couldpotentially be out of date without the user's knowledge. For this reason it may be a good idea to updatecached instances frequently, especially for a transactional database where data changes often. In the caseof a data warehouse, it might make sense to synchronize cached report updates with batch data updatesto the warehouse database.
SnapshotsA snapshot is a static, cached copy of a rendered report. Snapshots are created before users requestreports and are usually created and refreshed on a prescribed schedule. Because snapshots are renderedbeforehand, users cannot interactively supply parameter values. Reports that require parameters mustbe configured with these values ahead of time.
Often, a particular report needs to be generated at a predetermined interval, for example, a monthlysales report. So if the report were created at the end of January, users would want to see the Januaryreport throughout February. They do not expect the February data to be seen in the January report.These types of reports are best created upfront, without waiting for the first user to request it, becausethe report is expected to be available at the end of January. Therefore, you can now instruct ReportingServices to create the report pro-actively and keep it ready for users.
HistoryReport snapshots may be placed into history. This means that when another snapshot is created for areport, it doesn't overwrite the previous snapshot. Any of these individual snapshots for the same reportmay be retrieved from history until the history is cleared or reaches its maximum size. Reports maymanually or automatically be placed into history based on a schedule when a snapshot is created.
The following table compares the features of various types of cached reports:
Keep in mind when using cached instances that users viewing a report will have noindication that the report is rendered from a cached instance and will not see newdata entered since the report was cached.
349
Report Caching and Subscriptions
68787_ch10.qxp 26/03/2004 6:05 PM Page 349

Storing ParametersSince report snapshots and subscriptions are executed without the user's interaction, all parametervalues must be supplied in the report configuration so they may be presented to the rendering engine atthe time of unattended report execution. Although defaults can be set for parameters, reports configuredto execute as a cached instance can be interactive and, therefore, do not require parameter values to bestored. You can look at some examples of the configuration pages in Report Manager in the followingsection.
Parameterized FiltersIn Chapter 3, we discussed a number of query and filter techniques. In brief, these included usingparameterized queries in the database (by using either ad hoc SQL statements or stored procedures),filtering data in the report, or a combination of the two.
You will recall that report parameters that are derived from query parameters cause data to be filtered atthe data source. Additional report parameters may be added to filter data on the report server usingfilter expressions. Unlike query parameters that will cause multiple report instances to be cached (eachinstance for a different combination of parameters), filter parameters in a cached instance simply filterthe data stored with the cached report. Filter expressions are applied to the cached data and will notcause additional instances to be cached.
Cached Instance Snapshot History
Creation Created with the first user request using a unique combination of parameters.
Created on a schedule before the first user requests a report.
Like a standard snapshot; history entries can be created on a schedule or snapshots may be added to history manually by users.
Lifespan Cache automatically expires after a designated time has elapsed or based on a designated schedule.
A Report snapshot is overwritten when the next scheduled snapshot is created.
History entries don't typically expire but may be overwritten when a designated number of history entries has been reached.
TypicalScenarios
To optimize performance and conserve resources when users use different parameter values.
For static reports that do not require user interaction, a snapshot can be created with pre-selected parameter values. It's not optimal if reports have several parameter options.
Preserves snapshots for archival and future reference. Appropriate for keeping a static view of data that changes.
350
Chapter 10
68787_ch10.qxp 26/03/2004 6:05 PM Page 350

Configuring Credentials for Data Sources If you have created reports where data sources use Windows Integrated security or don't storecredentials in the connection string, you will need to make a configuration change before you can enablecaching or add subscriptions for these reports. Some types of cached reports are executed before a useractually views the report. For this reason, the security credentials needed to retrieve data from the datasource must be stored to execute the report ahead of time.
Storing CredentialsData sources used by cached reports (either cached instances or report snapshots) must use storedcredentials. This information is stored in encrypted form with the shared data source or the reportdefinition in the Report Server database. If this is not set up prior to attempting to create a cached reportor subscription, a warning will be displayed similar to the Figure 10-2:
Figure 10-2
This is easily remedied. Shared data sources make it much easier to configure caching for multiplereports. In Report Manager, open the folder containing the reports and data sources. Data sources appeardifferent from reports and are shown with a small globe icon. Click a data source link to open theProperties page. You can view properties for the AdventureWorks2000 data source as shown in Figure 10-3:
351
Report Caching and Subscriptions
68787_ch10.qxp 26/03/2004 6:05 PM Page 351

Figure 10-3
If you are not using a shared data source, you can get the same settings in the Data Sources tab on theProperties page of a specific report.
In the data source Properties page, select Connect Using: Credentials stored securely in the report server.Enter a username and password to authenticate to the data source as shown in Figure 10-4. Thisinformation is stored as an encrypted string in the Report Server database. With this setting in place, youwill be able to configure caching and create subscriptions.
Figure 10-4
352
Chapter 10
68787_ch10.qxp 26/03/2004 6:05 PM Page 352

Depending on how the database or database server is configured, different options on this page may beappropriate. If you are using SQL Server and authenticating with Windows Integrated Security, checkthe box labeled Use as Windows credentials when connecting to the data source. These settings should besufficient to enable caching and subscriptions. Click Apply to save your settings.
Linked ReportsIn Chapter 1, you were presented a once common scenario where slight variations in reportingrequirements would lead to the creation of several different reports. Rather than creating individualreports that may be filtered on different criteria or use different security settings, you can use one reportand store a different set of settings to match each requirement. A linked report is a configuration profilefor a report that can store a separate set of configuration settings. Any number of linked reports can becreated for a base report.
For example, let's say that you have a sales summary report that presents data filtered on a countryparameter and an optional parameter to filter on more specific regions within the country. You want tocache several versions of the region-specific reports (one for each region using supplied parametervalues) such that the data is current or within a range of three hours. The Sales Manager only runs thereport for the entire country once a week and wants to always see the latest, up-to-the-minute sales data.In this case, you can create a linked report for each of the regions with default values provided for thecountry and regional parameters.
In the sales summary report example, the Sales Manager's report is rendered live using interactiveparameter selections. Another copy of the report is saved without query-based parameters and isconfigured as a cached instance. This report would serve as the base for linked reports that have thecountry and regional parameter values provided.
Configuring Cached ReportsCaching options are configured for each report using settings on the Execution tab on the Properties page.To begin, select the report in Report Manager. In this example, I've created a version of the Product Salesby Location report without query-based parameters so you can specify default values and name thismodified report Product Sales By Location (cache). The new report has been deployed. Open it in ReportManager and as you can see in Figure 10-5, the Order Date parameters are requested without drop-downlists:
Default parameter values can only be specified for non-query-based parameters. Incases where you would like to have an interactive version of the report with query-based parameters and another version for caching, you should either usesubscriptions or save a separate copy of the report without query-based parameters.
353
Report Caching and Subscriptions
68787_ch10.qxp 26/03/2004 6:05 PM Page 353

Figure 10-5
Now select the Properties tab to create a linked report. On the Properties page, click the Create LinkedReport button to add the linked report as illustrated in Figure 10-6:
Figure 10-6
In the linked report page that you see in Figure 10-7, enter a name for the linked report and optionally, adescription. In this example, we create a linked report for our general purpose Product Sales report thatwill be used to view sales summary data for the state of Arizona. I'm naming the linked report ProductSales-Arizona.
354
Chapter 10
68787_ch10.qxp 26/03/2004 6:05 PM Page 354

Figure 10-7
The linked report can now be treated just like any other report with its own set of configuration settings.Click the Parameters link on the left side of the Properties page.
Based on the specifications for this report, specify the default parameter values for the cached report asyou can see in Figure 10-8. The order date range was already given default values in the ReportDesigner. Set the CountryRegionCode to US and the StateProvinceName to Arizona. It is necessary to selectthe Has Default checkbox to enter a default value. If you want the user to be able to change a parametervalue from the default, leave the corresponding Prompt User checkbox checked. The Prompt String settingsimply modifies the label text for the parameter on the Report Manager page. Apply these settings whencompleted.
Figure 10-8
355
Report Caching and Subscriptions
68787_ch10.qxp 26/03/2004 6:05 PM Page 355
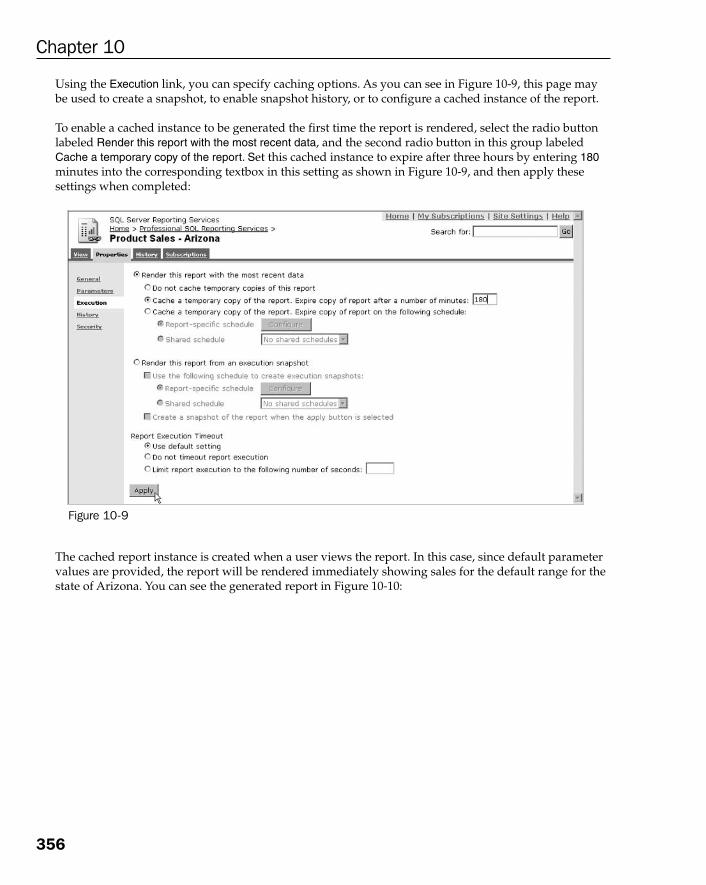
Using the Execution link, you can specify caching options. As you can see in Figure 10-9, this page maybe used to create a snapshot, to enable snapshot history, or to configure a cached instance of the report.
To enable a cached instance to be generated the first time the report is rendered, select the radio buttonlabeled Render this report with the most recent data, and the second radio button in this group labeledCache a temporary copy of the report. Set this cached instance to expire after three hours by entering 180minutes into the corresponding textbox in this setting as shown in Figure 10-9, and then apply thesesettings when completed:
Figure 10-9
The cached report instance is created when a user views the report. In this case, since default parametervalues are provided, the report will be rendered immediately showing sales for the default range for thestate of Arizona. You can see the generated report in Figure 10-10:
356
Chapter 10
68787_ch10.qxp 26/03/2004 6:05 PM Page 356

Figure 10-10
After the first request, subsequent visits to this report within three hours should show the same contentvery quickly as the report is rendered from the cached instance rather than the typical database queryexecution and report rendering process.
Creating a snapshot is very similar to creating a cached instance. On the Execution tab, select options forcreating a snapshot rather than a cached instance. The snapshot is generated immediately or on aspecified schedule (without user interaction) rather than on the first user's request.
SubscriptionsWhat a useful and convenient feature this is! As a manager, you may need to do a bi-weekly statusreport for your people. When you travel, you might like to have a current, up-to-date employeedirectory on your PDA at all times. As new products are added to your line of products and pricinginformation changes, you'd like the updated product catalog in front of your people so they're neverworking with outdated information. Using subscriptions makes all of this possible, simply and easily.
When I began to use SQL Server Reporting Services in the first beta version, I was thoroughly impressedwith the many new features. The ability to output reports using different rendering formats wascompelling. The simple Report Manager interface was nice and the ability to program reports tointegrate them into my applications was cool. I thought the product team at Microsoft had done a terrificjob. But this feature is icing on the cake! When I started playing with subscriptions, I thought, "Wow, thisis just too good to be true!"
357
Report Caching and Subscriptions
68787_ch10.qxp 26/03/2004 6:05 PM Page 357
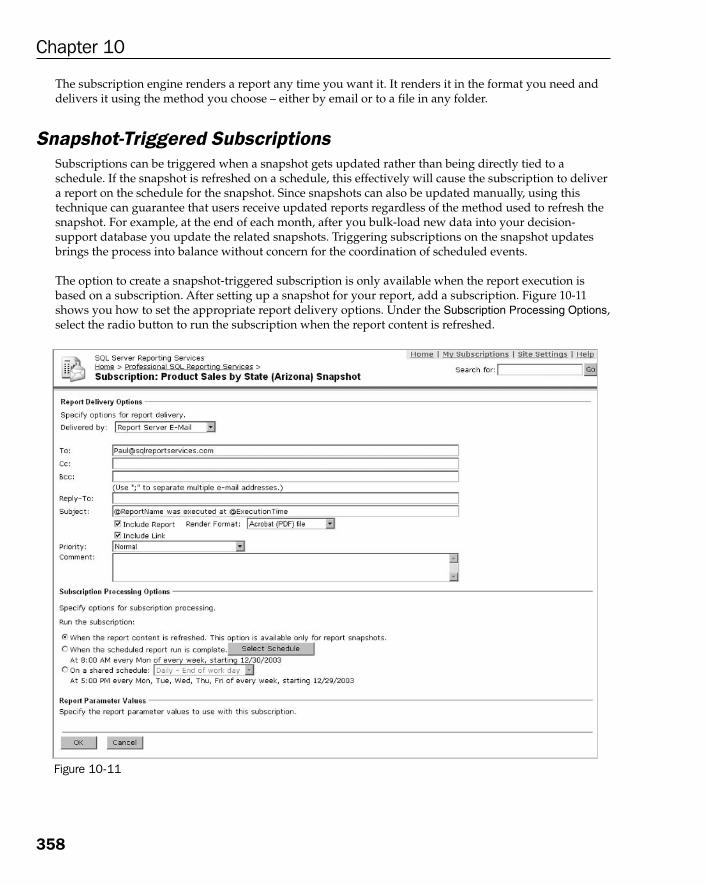
The subscription engine renders a report any time you want it. It renders it in the format you need anddelivers it using the method you choose – either by email or to a file in any folder.
Snapshot-Triggered SubscriptionsSubscriptions can be triggered when a snapshot gets updated rather than being directly tied to aschedule. If the snapshot is refreshed on a schedule, this effectively will cause the subscription to delivera report on the schedule for the snapshot. Since snapshots can also be updated manually, using thistechnique can guarantee that users receive updated reports regardless of the method used to refresh thesnapshot. For example, at the end of each month, after you bulk-load new data into your decision-support database you update the related snapshots. Triggering subscriptions on the snapshot updatesbrings the process into balance without concern for the coordination of scheduled events.
The option to create a snapshot-triggered subscription is only available when the report execution isbased on a subscription. After setting up a snapshot for your report, add a subscription. Figure 10-11shows you how to set the appropriate report delivery options. Under the Subscription Processing Options,select the radio button to run the subscription when the report content is refreshed.
Figure 10-11
358
Chapter 10
68787_ch10.qxp 26/03/2004 6:05 PM Page 358

Schedule-Triggered SubscriptionsThe most common type of subscriptions will likely be based on a shared or an individual schedule. Thescheduling mechanism is based on the SQL Server Agent that fires and executes events at specific times.
Individual and Shared SchedulesThere are advantages of using both the types of scheduling options. Creating a shared schedule makes iteasier to schedule multiple events to run at the same time and individual schedules don't have to be setup for each event. This may be an appropriate solution when you need to run several reports during off-peak hours when the server isn't busy with live user requests. Although this may be more convenient, asignificant penalty is realized when the server tries to run demanding jobs at the same time. For reportsthat are long, perform complex calculations, or consume a lot of data, you may want to stagger theschedules to prevent this condition.
To create a shared schedule, click the Site Settings link in the Report Manager. On the Site Settings page,click Manage Shared Schedules (see Figure 10-12):
Figure 10-12
On the next page (shown in Figure 10-13), click New Schedule and fill out the details in the Schedulingpage. These options are similar to setting a recurring appointment in Microsoft Outlook.
359
Report Caching and Subscriptions
68787_ch10.qxp 26/03/2004 6:05 PM Page 359

Figure 10-13
As you can see in Figure 10-13, by default, the start date is set to the current date and no end date isspecified. If you would like the schedule to expire then you must set the end date. The start and enddates can only be set by using the calendar controls. Click on the corresponding calendar icon to displaythe calendar control (Figure 10-14) and then navigate to the date using the calendar's back (<) andforward (>) buttons and then select the dates. To enable the end date, the Stop this schedule on checkboxmust be checked. Clicking the end date calendar icon will check this box for you. Click OK to accept thenew schedule. The shared schedule will now be available for selection in all pages that prompt for aschedule.
360
Chapter 10
68787_ch10.qxp 26/03/2004 6:05 PM Page 360

Figure 10-14
Configuring Email DeliveryWhen Reporting Services is first installed, the setup wizard prompts for the mail server name andaddress information. Launching the setup wizard again will not prompt for this information again. Tomodify or set the email server information, you must edit the RSReportServer.config file. Emailoptions are set under the RSEMailDPConfiguration element in the Delivery section of this file. Formore information about modifying configuration settings, please refer to Chapter 1.
File Share SubscriptionsSpecifying a file share subscription is very simple. On the Subscriptions link for a report, click AddSubscription. On the Report Delivery Options page, under Delivered By, select Report Server File Share fromthe drop-down list. See Figure 10-15:
361
Report Caching and Subscriptions
68787_ch10.qxp 26/03/2004 6:05 PM Page 361

Figure 10-15
You will typically want to specify credentials for a user and then assign this user write permissions onthe shared folder. The example in Figure 10-15 shows a user created specifically for our file subscriptionscalled Subscription Writer. This user has been granted write permissions on the folder.
Enter a valid UNC file path into the Path text box. A local file system path is not acceptable input. If youare entering a local path, follow these steps:
1. Using Windows Explorer, create a file share for the local path. This is easily done by rightclicking on the folder and selecting Sharing. Create the share using the Sharing tab.
2. Using the Permissions options on the Sharing tab, grant a user read and write access to thisshared folder.
3. Click OK on the Sharing Permissions dialog to accept the file share settings.
362
Chapter 10
68787_ch10.qxp 26/03/2004 6:05 PM Page 362

4. In Windows Explorer, navigate to My Network Places (or Network Neighborhood in Windows NT).Continue to drill-down to the network share on the server. Typically, this will be under EntireNetwork\ Microsoft Windows Network\ (your domain or workgroup name)\ (server name)\ (file sharename).
5. Copy the path from the address box in Windows Explorer and paste it into the Path textbox.
The Universal Naming Convention (UNC) path should be in the form \\server name\share name.Although it usually is not recommended, you can use an administrative user's credentials to write thesubscription output file. In this case, you could use an administrative share (such as c$) rather thancreate a new share. In any case, the system administrator should be involved in this decision.
Pocket PC Report File UpdatesIf you would like to have a subscription that updates file-based reports for a Pocket PC device, you canoutput report files across the network to the synchronization folder for a device. When a mobile devicepartnership is created using Microsoft ActiveSync on a user's personal computer, a folder is designatedfor automatic file synchronization. Any files that are modified or written to this folder will beautomatically synchronized with the Pocket PC device. This folder is found under the user's MyDocuments folder and is typically named (mobile device name) My Documents. For example, if yourdevice name were Freds Pocket PC, the synchronization folder would be named Freds Pocket PC MyDocuments. Any subfolders are also synchronized so you could create a subfolder called Reports andwrite report files to this location.
When creating file shares for machines across the network, the My Documents folder location can beremapped by the user and is profile-specific. The default location for My Documents is C:\Documents andSettings\(user profile name)\My Documents. Make sure that the user writing to the remote computer fromthe Report Server has been granted write access to the output folder.
Data-Driven SubscriptionsA data-driven subscription is a subscription where the report recipient information is provided by aquery. In addition to the list of recipients, several subscription-specific properties can be based on valuesreturned by a query as well. This makes some very interesting and creative solutions possible.
Reporting Services doesn't provide a database by default so you do have to do a little work to prepare adata-driven subscription, but it's actually quite simple. The data can be stored in practically any form aslong as the necessary values are available in columns returned by the query. At the very least, the onlyrequirement is a list of names or email addresses. Every property may use either a static value (assignedwhen the subscription is created) or values from each row in the query. The query could returninformation that can be used to customize a report; this implies that for every subscription recipient, areport may be rendered in a different format, sent to a different file share, or sent using a differentsubject line, priority flag, and so on.
Unlike the Report Designer, tools to assist with building expressions are not offered. If you are notversed in the practice of creating a connection string or Transact SQL expressions, it is recommendedthat you use the Report Designer to create these expressions as discussed in Chapters 2 and 3. Theconnection string and query expressions may be copied from the respective designer tool and pastedinto these textboxes. File paths must also be typed into these pages as no browsing feature is offered.
363
Report Caching and Subscriptions
68787_ch10.qxp 26/03/2004 6:05 PM Page 363

The following properties are available for email subscriptions:
The following properties are available for file-share subscriptions:
Property Description
File name (required) File name without the path. Omit the extension if the File Extensionproperty is set to True.
File Extension (required) True/False – Generate file extension based on the Render Format.
Path UNC path not including the file name or trailing slash.
Render Format (required) Report rendering format for output file. Single file rendering format is advised for subscriptions, such as MHTML rather than HTML.
Use Credentials (required) True/False – Use specified credentials or system process.
User Name Required if Use Credentials is True.
Password Required if Use Credentials is True.
Write Mode Auto increment to add an auto-incrementing number to file name. Overwrite to replace existing file.
Property Description
To (required) Email address or alias of recipient
CC Carbon copy email address or alias
BCC Blind carbon copy email address or alias
Reply-To Address or alias for recipient to reply
Include Report True/False– Include report as embedded content (defaults to True)
Render Format(required)
Report rendering format (defaults to web archive). A single file rendering format is recommended for subscriptions, such as MHTML rather than HTML
Priority Email message priority (defaults to Normal)
Subject Email subject line
Comment Text added to the message subject
Include Link True/False – Include report as linked file (defaults to True)
364
Chapter 10
68787_ch10.qxp 26/03/2004 6:05 PM Page 364

Managing SubscriptionsIt is likely that the most significant subscription management task will be to verify if subscriptions arerunning as scheduled. The outcome of subscription events is recorded in the server's Application Logand more specific details are written to individual log files with the date/timestamp in each file name.Over time, hundreds of these files may be produced and should be backed-up and/or deleted.
Events in the Application Log are recorded with the Source property value of Report Server and SQLServer Reporting Service. There is no method to directly read or consolidate the individual log files.However, Reporting Services ships with SQL script files, which will enable you to import this data intotables for analysis using SQL Server DTS. These files are contained on the product CD in the Extrasfolder.
For more information about importing and using log file information, search the Reporting ServicesBooks Online for the topic Querying and Reporting on Report Execution Log Data. Like other advancedfeatures, this can be a powerful tool for administrators but it's a little cumbersome to set up.
Now the good news. Simplified subscription log information is easy to obtain in the Report Manager. Toget information for a specific report, select the Subscription tab. The status for the last execution isdisplayed for each subscription and snapshot. A summary view of all reports accessible to the currentuser is also available on the My Subscriptions tab (see Figure 10-16). These execution summaries can beused to diagnose subscription errors including service and permission related problems.
Figure 10-16
365
Report Caching and Subscriptions
68787_ch10.qxp 26/03/2004 6:05 PM Page 365

Using the Reporting Service Web ServiceThe ReportingService Web Service object exposes methods for managing subscriptions. The followingtable lists these methods and associated arguments. Remember that webmethods (programmatic methodsfor a webservice class) don't support overloaded calls or optional arguments. For arguments that don'trequire a value, you can pass a Null (C#) or Nothing (VB).
Let's look at a few examples of some subscription management routines. To obtain a list of subscriptionswith associated properties for a report, you can use the ListSubscriptions method and use it bypassing in a report name. This returns a collection of Subscription objects.
Let's take a look at a sample application to view and create subscriptions. I'm not going to take youthrough this example step-by-step, but I will give you enough information to reproduce thesubscription-related code. As you can see in Figure 10-17, I've added two ComboBoxes, two Buttons,and a ListView control to a form in a Windows application project. The Panel and the other controls atthe bottom will be used later to create new subscriptions. The Panel is invisible and the NewSubscription button is disabled. The click event of the Get Subscription button enables the other buttonbecause you create the ReportService object in this event.
Method Arguments
CreateDataDrivenSubscription Report, ExtensionSettings,DataRetrievalPlan, Description,EventType, MatchData, Parameters()
CreateSubscription Report, ExtensionSettings, Description,EventType, MatchData, Parameters()
DeleteSubscription SubscriptionID
GetSubscriptionProperties SubscriptionID, ExtensionSettings,Description, Active, Status, EventType,MatchData, Parameters()
ListSchedules -
ListSubscriptions Report, Owner
ListSubscriptionsUsingDataSource DataSource
SetDataDrivenSubscriptionProperties DataDrivenSubscriptionID,ExtentionSettings, DataRetrievalPlan,Description, EventType, MatchData,Parameters()
SetSubscriptionProperties SubscripionID, ExtensionSettings,Description, EventType, MatchData,Parameters()
366
Chapter 10
68787_ch10.qxp 26/03/2004 6:05 PM Page 366
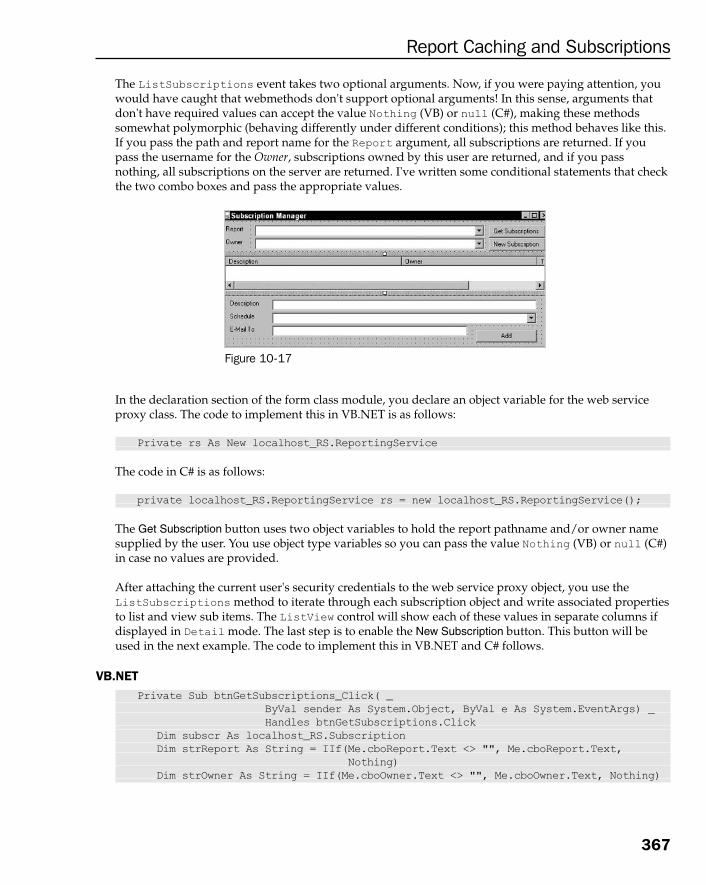
The ListSubscriptions event takes two optional arguments. Now, if you were paying attention, youwould have caught that webmethods don't support optional arguments! In this sense, arguments thatdon't have required values can accept the value Nothing (VB) or null (C#), making these methodssomewhat polymorphic (behaving differently under different conditions); this method behaves like this.If you pass the path and report name for the Report argument, all subscriptions are returned. If youpass the username for the Owner, subscriptions owned by this user are returned, and if you passnothing, all subscriptions on the server are returned. I've written some conditional statements that checkthe two combo boxes and pass the appropriate values.
Figure 10-17
In the declaration section of the form class module, you declare an object variable for the web serviceproxy class. The code to implement this in VB.NET is as follows:
Private rs As New localhost_RS.ReportingService
The code in C# is as follows:
private localhost_RS.ReportingService rs = new localhost_RS.ReportingService();
The Get Subscription button uses two object variables to hold the report pathname and/or owner namesupplied by the user. You use object type variables so you can pass the value Nothing (VB) or null (C#)in case no values are provided.
After attaching the current user's security credentials to the web service proxy object, you use theListSubscriptions method to iterate through each subscription object and write associated propertiesto list and view sub items. The ListView control will show each of these values in separate columns ifdisplayed in Detail mode. The last step is to enable the New Subscription button. This button will beused in the next example. The code to implement this in VB.NET and C# follows.
VB.NETPrivate Sub btnGetSubscriptions_Click( _
ByVal sender As System.Object, ByVal e As System.EventArgs) _Handles btnGetSubscriptions.Click
Dim subscr As localhost_RS.SubscriptionDim strReport As String = IIf(Me.cboReport.Text <> "", Me.cboReport.Text,
Nothing)Dim strOwner As String = IIf(Me.cboOwner.Text <> "", Me.cboOwner.Text, Nothing)
367
Report Caching and Subscriptions
68787_ch10.qxp 26/03/2004 6:05 PM Page 367

rs.Credentials = System.Net.CredentialCache.DefaultCredentials'-- Loop through subscriptions collection, add to listviewFor Each subscr In rs.ListSubscriptions(strReport, strOwner)
Dim ListItem As New ListViewItemWith ListItem
.Text = subscr.Description
.SubItems.Add(subscr.Owner)
.SubItems.Add(subscr.EventType)
.SubItems.Add(subscr.LastExecuted)
.SubItems.Add(subscr.Status)End WithMe.lstvwSubscriptions.Items.Add(ListItem)
Next'-- Enable new subscription buttonMe.btnNewSubscription.Enabled = True
End Sub
C#private void btnGetSubscriptions_Click(object sender, System.EventArgs e){
string strReport = null;string strOwner = null;if(this.cboReport.Text!= ""){
strReport = this.cboReport.Text;}if(this.cboOwner.Text!= ""){
strOwner = this.cboOwner.Text;}rs.Credentials = System.Net.CredentialCache.DefaultCredentials;
foreach (localhost_RS.Subscription subscr in rs.ListSubscriptions(strReport, strOwner))
{ListViewItem ListItem = new ListViewItem();ListItem.Text = subscr.Description;ListItem.SubItems.Add(subscr.Owner.ToString());ListItem.SubItems.Add(subscr.EventType.ToString());ListItem.SubItems.Add(subscr.LastExecuted.ToShortDateString());ListItem.SubItems.Add(subscr.Status.ToString());this.lstvwSubscriptions.Items.Add(ListItem);
}this.btnNewSubscription.Enabled = true;
}
Figure 10-18 shows what the form looks like when the application is run and my computer\user nameis passed:
368
Chapter 10
68787_ch10.qxp 26/03/2004 6:05 PM Page 368

Figure 10-18
You can add a new subscription using the CreateSubscription method. Arguments passed to thismethod are as follows:
1. ExtensionSettings: This argument is required and can be a little tricky. TheExtensionSettings object contains two properties. The Extension property is a stringindicating the type of delivery extension. The ParameterValues property is an object of typeParameterValueOrFieldReference that contains an array of ParameterValue objects. Eachelement is a name/value pair. Depending on the subscription type, a different list of parametername/value pairs is passed using this array. These parameters correspond to the itemspresented on the Report Delivery Options section of the Snapshot page in Report Manager.
2. EventType: This argument takes a string to set either TimedSubscription orSnapshotUpdate.
3. MatchData: This argument accepts multiple types and values depending on the EventTypeargument; these include the ScheduleID for a shared schedule or a string containing the XMLelement content for the schedule. Shared schedule information may be obtained using theListSchedules method to enumerate the server's schedules.
4. Parameters: This argument is an array of ParameterValue objects. It is used to supply reportparameters as name/value pairs.
Now, let's put it all together in a sample application. Using the same form as the previous example, I'veplaced two textboxes, two combo boxes, and a button on the Panel control at the bottom of the form asseen in Figure 10-19:
Figure 10-19
369
Report Caching and Subscriptions
68787_ch10.qxp 26/03/2004 6:05 PM Page 369

At the top of this form, the New Subscription button was enabled at the end of the Get Subscriptionsbutton click event code. In the click event of this button, you set the Visible property of the panel to Trueand get a list of shared subscriptions that have been created on the Report Server, adding the Descriptionfor each schedule to the Schedule combo box. For the following code, you'll look at VB.NET and C#language examples side-by-side.
VB.NETPrivate Sub btnNewSubscription_Click( ByVal sender As System.Object, _
ByVal e As System.EventArgs) _Handles btnNewSubscription.Click
Me.Panel1.Visible = True
Dim sched As localhost_RS.ScheduleFor Each sched In rs.ListSchedules
Me.cboSchedules.Items.Add(sched.Description)Next
End Sub
C#private void btnNewSubscription_Click(object sender, System.EventArgs e){
this.Panel1.Visible = true;foreach (localhost_RS.Schedule sched in rs.ListSchedules()){
this.cboSchedules.Items.Add(sched.Description);}
}
After a schedule is selected from the schedule combo box, the SelectedIndex value will correspond tothe index of the corresponding schedule. Let's use this to obtain the ScheduleID value and pass it to theCreateSubscription method.
After entering a description, recipient email address, and selecting a rendering format, the user clicks theAdd Subscription button. In this click event, you set up the values and objects passed as arguments to theCreateSubscription method. Let's see how to do this in the following sections.
The selected item in the Schedule combo box corresponds to a member of the Schedules collectionreturned by the ListSchedules method. There is only one method to obtain these items, so you use aloop to resolve the selection and exit when the counter variable matches the SelectedIndex property ofthe combo box.
VB.NET'-- Get selected scheduleDim sched As localhost_RS.ScheduleDim iSchedCounter As Int16For Each sched In rs.ListSchedules
iSchedCounter += 1If iSchedCounter = Me.cboSchedules.SelectedIndex() Then Exit For
Next
370
Chapter 10
68787_ch10.qxp 26/03/2004 6:05 PM Page 370

C#//-- Get selected schedulelocalhost_RS.Schedule scheduleItem = null;Int16 iSchedCounter = 0;foreach (localhost_RS.Schedule sched in rs.ListSchedules()){
iSchedCounter += 1;if (iSchedCounter == this.cboSchedules.SelectedIndex){
scheduleItem = sched;break;
}}
You can now obtain the ScheduleID property of the Schedule object using the sched variable.
Next, you create an ExtensionSettings object and set its Extension property to indicate that thissubscription will use the email delivery extension as follows.
VB.NETDim extset As New localhost_RS.ExtensionSettingsextset.Extension = "Report Server Email"
C#localhost_RS.ExtensionSettings extset = new localhost_RS.ExtensionSettings();extset.Extension = "Report Server Email";
Now for the extension-specific properties of the ExtensionSettings object. The ParameterValuesproperty is set to an object of type ParameterValueOrFieldReference and is a five-element array.You also create five corresponding ParameterValue objects. For each of these objects, you set the Nameand Value properties and then add them to the array.
VB.NET'-- Create Parameter Values arrayDim ParamVals(5) As localhost_RS.ParameterValueOrFieldReferenceextset.ParameterValues = ParamVals
'-- Populate the Extension ParametersDim pvTo As New localhost_RS.ParameterValuepvTo.Name = "TO"pvTo.Value = Me.txtEMailTo.Textextset.ParameterValues(0) = pvToDim pvIncludeRpt As New localhost_RS.ParameterValuepvIncludeRpt.Name = "IncludeReport"pvIncludeRpt.Value = "True"extset.ParameterValues(1) = pvIncludeRpt
Dim pvRenderFormat As New localhost_RS.ParameterValuepvRenderFormat.Name = "RenderFormat"pvRenderFormat.Value = Me.cboRenderFormat.Textextset.ParameterValues(2) = pvRenderFormat
371
Report Caching and Subscriptions
68787_ch10.qxp 26/03/2004 6:05 PM Page 371

Dim pvPriority As New localhost_RS.ParameterValuepvPriority.Name = "Priority"pvPriority.Value = "NORMAL"extset.ParameterValues(3) = pvPriority
Dim pvSubject As New localhost_RS.ParameterValuepvSubject.Name = "Subject"pvSubject.Value = "@ReportName was executed at @ExtensionTime"extset.ParameterValues(4) = pvSubject
C#//-- Create Parameter Values arraylocalhost_RS.ParameterValueOrFieldReference[] ParamVals = new
Subscriptions_CS.localhost_RS.ParameterValueOrFieldReference[5];extset.ParameterValues = ParamVals;
//-- Populate the Extension Parameterslocalhost_RS.ParameterValue pvTo = new localhost_RS.ParameterValue();pvTo.Name = "TO";pvTo.Value = this.txtEMailTo.Text;extset.ParameterValues[0] = pvTo;
localhost_RS.ParameterValue pvIncludeRpt = new localhost_RS.ParameterValue();pvIncludeRpt.Name = "IncludeReport";pvIncludeRpt.Value = "true";extset.ParameterValues[1] = pvIncludeRpt;
localhost_RS.ParameterValue pvRenderFormat = new localhost_RS.ParameterValue();
pvRenderFormat.Name = "RenderFormat";pvRenderFormat.Value = this.cboRenderFormat.Text;extset.ParameterValues[2] = pvRenderFormat;
localhost_RS.ParameterValue pvPriority = new localhost_RS.ParameterValue();pvPriority.Name = "Priority";pvPriority.Value = "NORMAL";extset.ParameterValues[3] = pvPriority;
localhost_RS.ParameterValue pvSubject = new localhost_RS.ParameterValue();pvSubject.Name = "Subject";pvSubject.Value = "@ReportName was executed at @ExtensionTime";extset.ParameterValues[4] = pvSubject;
The report you are using doesn't require any parameters, so you have everything necessary to actuallycreate the subscription. Call this method by passing Nothing in place of a Parameters array.
VB.NET'-- Create the Subscription (no report parameters in last arg)rs.CreateSubscription(Me.cboReport.Text, _
extset, _Me.txtDescription.Text, _"TimedSubscription", _
372
Chapter 10
68787_ch10.qxp 26/03/2004 6:05 PM Page 372

sched.ScheduleID, _Nothing)
C#//-- Create the Subscription (no report parameters in last arg)rs.CreateSubscription(this.cboReport.Text,
extset, this.txtDescription.Text, "TimedSubscription", scheduleItem.ScheduleID, null);
Now let's look at the entire routine put together. Here's all of the Add Subscription button click event codein both VB.NET and C#.
VB.NETPrivate Sub btnAddSubscription_Click(ByVal sender As System.Object, _
ByVal e As System.EventArgs) Handles btnAddSubscription.Click
'-- Get selected scheduleDim sched As localhost_RS.ScheduleDim iSchedCounter As Int16For Each sched In rs.ListSchedules
iSchedCounter += 1If iSchedCounter = Me.cboSchedules.SelectedIndex() _
Then Exit ForNext
Dim extset As New localhost_RS.ExtensionSettingsextset.Extension = "Report Server Email"
'-- Create Parameter Values arrayDim ParamVals(5) As localhost_RS.ParameterValueOrFieldReferenceextset.ParameterValues = ParamVals
'-- Populate the Extension ParametersDim pvTo As New localhost_RS.ParameterValuepvTo.Name = "TO"pvTo.Value = Me.txtEMailTo.Textextset.ParameterValues(0) = pvToDim pvIncludeRpt As New localhost_RS.ParameterValuepvIncludeRpt.Name = "IncludeReport"pvIncludeRpt.Value = "True"extset.ParameterValues(1) = pvIncludeRpt
Dim pvRenderFormat As New localhost_RS.ParameterValuepvRenderFormat.Name = "RenderFormat"pvRenderFormat.Value = Me.cboRenderFormat.Textextset.ParameterValues(2) = pvRenderFormatDim pvPriority As New localhost_RS.ParameterValuepvPriority.Name = "Priority"pvPriority.Value = "NORMAL"extset.ParameterValues(3) = pvPriority
373
Report Caching and Subscriptions
68787_ch10.qxp 26/03/2004 6:05 PM Page 373

Dim pvSubject As New localhost_RS.ParameterValuepvSubject.Name = "Subject"pvSubject.Value = "@ReportName was executed at @ExtensionTime"extset.ParameterValues(4) = pvSubject
'-- Create the Subscription (no report parameters in last arg)rs.CreateSubscription(Me.cboReport.Text, _
extset, _Me.txtDescription.Text, _"TimedSubscription", _sched.ScheduleID, _Nothing)
End Sub
C#private void btnAddSubscription_Click(object sender, System.EventArgs e){
//-- Get selected schedulelocalhost_RS.Schedule scheduleItem = null;Int16 iSchedCounter = 0;foreach (localhost_RS.Schedule sched in rs.ListSchedules()){
iSchedCounter += 1;if (iSchedCounter == this.cboSchedules.SelectedIndex){ scheduleItem = sched;break;}
}localhost_RS.ExtensionSettings extset = new localhost_RS.ExtensionSettings();extset.Extension = "Report Server Email";
//-- Create Parameter Values arraylocalhost_RS.ParameterValueOrFieldReference[] ParamVals = newSubscriptions_CS.localhost_RS.ParameterValueOrFieldReference[5];extset.ParameterValues = ParamVals;
//-- Populate the Extension Parameterslocalhost_RS.ParameterValue pvTo = new localhost_RS.ParameterValue();pvTo.Name = "TO";pvTo.Value = this.txtEMailTo.Text;extset.ParameterValues[0] = pvTo;
localhost_RS.ParameterValue pvIncludeRpt = new localhost_RS.ParameterValue();pvIncludeRpt.Name = "IncludeReport";pvIncludeRpt.Value = "true";extset.ParameterValues[1] = pvIncludeRpt;localhost_RS.ParameterValue pvRenderFormat = new
localhost_RS.ParameterValue();pvRenderFormat.Name = "RenderFormat";pvRenderFormat.Value = this.cboRenderFormat.Text;extset.ParameterValues[2] = pvRenderFormat;
localhost_RS.ParameterValue pvPriority = new localhost_RS.ParameterValue();
374
Chapter 10
68787_ch10.qxp 26/03/2004 6:05 PM Page 374

pvPriority.Name = "Priority";pvPriority.Value = "NORMAL";extset.ParameterValues[3] = pvPriority;
localhost_RS.ParameterValue pvSubject = new localhost_RS.ParameterValue();pvSubject.Name = "Subject";pvSubject.Value = "@ReportName was executed at @ExtensionTime";extset.ParameterValues[4] = pvSubject;
//-- Create the Subscription (no report parameters in last arg)rs.CreateSubscription(this.cboReport.Text,
extset, this.txtDescription.Text, "TimedSubscription", scheduleItem.ScheduleID, null);
}
Managing Subscriptions Using ScriptUsing script, you can perform almost any task in a .NET application but scripts are run at the commandline in text mode. As we discussed in Chapter 8, a Reporting Services script file is written using VisualBasic .NET code and has nearly all the capabilities of a console application.
We will use the GetSubscriptions button code from the Subscription Manager application above.However, there are some modifications for this to work in console mode rather than as a Windowsform. The VB Script code is saved in a file called List_Subscriptions.rss.
Sub Main()Dim subscr as SubscriptionConsole.WriteLine()Console.Write("Report: ")Dim strReport as String = Console.ReadLine()Console.Write("Owner: ")Dim strOwner as String = Console.ReadLine()rs.Credentials = System.Net.CredentialCache.DefaultCredentialsIf sReport = "" Then strReport = NothingIf sOwner = "" Then strOwner = Nothing
Console.WriteLine()Console.WriteLine("*********************************************************")Console.WriteLine("Subscriptions for:")Console.WriteLine("Report: " & sReport)Console.WriteLine("Owner: " & sOwner)Console.WriteLine("---------------------------------------------------------")For Each subscr In rs.ListSubscriptions(strReport, strOwner)
Console.WriteLine(subscr.Description)NextConsole.WriteLine("---------------------------------------------------------")
End Sub
Let's examine the code, grasp the logic, and then run the script.
375
Report Caching and Subscriptions
68787_ch10.qxp 26/03/2004 6:05 PM Page 375

In a Reporting Services script, the Reporting Service Web Service is invoked automatically and allrelated classes are accessible without additional references. As you can see in this code, you declare aSubscription object using the variable subscr.
Using the Console object, you use the ReadLine method to obtain a value from the user and the Writeand WriteLine methods to send text to the console (command line).
You can use two string variables, sReport and sOwner to capture input from the user and then convertthese values to object types using the variables oReport and oOwner. This is necessary so you can passthe Nothing value to the ListSubscriptions method in case the user doesn't provide a value. Next,you iterate through the Subscriptions collection and write out the list to the console.
Open a command window, change to the folder containing the report, and issue a command to executethe script, which looks like Figure 10-20:
Figure 10-20
The result is a list of all subscriptions on the server for which I am the owner. By using scripts, youshould be able to apply almost any VB.NET code that is simplified to work in the console environment.
SummaryReporting Services has several options for report delivery including on-demand reporting where thedata is queried and reports are generated upon request. Although this provides the most timely reportdata, it may not be the most practical solution.
Caching report content gives us a range of scalable and extensible options. A cached instance can holdboth the report content and a portion of data in the report server database so the data can be filtered andreports can be rendered to different formats after the cached report is created without taxing the datasource.
376
Chapter 10
68787_ch10.qxp 26/03/2004 6:05 PM Page 376

Snapshots are static, cached reports that can be generated before users need them and can be deliveredin a variety of ways that may include subscriptions and history.
Subscriptions deliver reports on a shared or individual schedule and can be sent via email or a sharedfolder. Delivery extensions can also be written to provide additional delivery mechanisms. We'veexplored some custom subscription management solutions. Using the Reporting Services Web Service orscripting host provider, custom applications can be written to create and manage your ownsubscriptions and report delivery solutions.
377
Report Caching and Subscriptions
68787_ch10.qxp 26/03/2004 6:05 PM Page 377

68787_ch10.qxp 26/03/2004 6:05 PM Page 378

Report Definition Language
In the previous chapters, we have demonstrated how reports can be created for SQL ServerReporting Services using Visual Studio and the Report Designer tool. The goal of this chapter is togive you a better understanding of how reports are built, what is happening in the background,and how your reporting requirements are communicated to SQL Server Reporting Services usingReport Definition Language (RDL). We will discuss the technology that makes it all possible andRDL itself. We will finish the chapter by demonstrating the creation of simple RDL tags using the.NET Framework XML classes and by creating a full blown report using a freeware tool calledCodeSmith.
In short, this chapter covers:
❑ The underlying technology behind RDL and related definitions, such as XML namingrules, elements, attributes, documents, namespaces, and schema.
❑ What is RDL?
❑ Creating RDL
RDL – Underlying TechnologyMicrosoft's RDL is a XML grammar that allows us to define reports. It is based on open standardsand designed to communicate your reporting needs to SQL Server Reporting Services, but can beconsumed by any tool that understands its structure. The Visual Studio Report Designer providesa graphical user interface that allows you to design reports in a What You See Is What You Get(WYSIWYG) type of environment. Behind the scenes, the Visual Designer is actually creating aRDL document based on the following technologies that you can use to communicate yourreporting requirements to Reporting Services:
❑ XML
❑ XML Schema
111111
68787_ch11.qxp 26/03/2004 3:56 PM Page 379

Chapter 11
380
❑ RDL
❑ XML Web Services
What Is XML?XML is an acronym that stands for Extensible Markup Language, a specification developed by the WorldWide Web Consortium (W3C). XML is a pared-down version of Standard Generalized MarkUp Language(SGML), designed especially for web documents. It allows designers to create their own customizedtags, enabling the definition, transmission, validation, and interpretation of data between applications asalso between organizations.
XML has strong syntactical rules that facilitate its use in machine-to-machine as well as humancommunication. These rules only define what constitutes an XML document, but do not define or limitits use in any way. This means that you are in full control of the tags you use and the representation ofdifferent data in your documents. In order to further discuss RDL, the structure and makeup of XMLmust be more fully explored. The scenario for this discussion is an XML document that needs to becreated to represent the inventory for a hypothetical car dealership called Ali's Auto.
XML Naming RulesThe rules of XML naming are common among all of the pieces used to build an XML document andshould be first discussed because of this. There are no rules that govern what you name the pieces ofyour document, but there are rules on how you name them:
❑ Names must start with letters or an underscore.
❑ Names cannot start with numbers.
❑ Names cannot contain spaces.
❑ Items cannot begin with "xml" as it is a reserved word.
There are many schools of thought on XML naming conventions, but the XML 1.0 specification onlyaddresses what characters may be used and where.
XML ElementsThe basic building block of an XML document is the element. Examine the text below:
<Car>Pontiac Grand Prix</Car>
The text between the < and > characters is known as a XML tag. The <Car> tag above is known as thestart tag. The </Car> tag is its duplicate with the exception of the / character, which marks it as the endtag. In XML, this matching is required. The text Pontiac Grand Prix is known as the element content.These tags and everything within them together constitute a XML element. In cases where a tag has nocontent, it is legal to add a / to the starting tag to indicate an empty tag:
<Car/>
68787_ch11.qxp 26/03/2004 3:56 PM Page 380

When creating XML elements, there are rules that must be followed:
❑ Elements must follow XML naming rules
❑ Every start tag must have a matching end tag
❑ Tags cannot overlap
XML is extensible in that it allows you to fully control all the tags that you use to describe your data. Thefollowing XML fragment demonstrates changing the Car tag to provide information that is moredetailed:
<Car><Make>Pontiac</Make><Model>Grand Prix</Model>
</Car>
The <Make> and <Model> tags have been added to give you additional granularity when accessing yourCar data. Notice that they are nested within the <Car> tag. This indicates that they belong to or provideadditional information about the <Car> tag. Nesting is normally used to indicate relationships betweenthe data being represented in an XML Document.
XML AttributesAnother much used part of an XML document is the attribute. An attribute is typically used to providedetailed information about an XML element although this is not a formal requirement. Attributes areattached to the start tag of an XML element.
<Car Vin="BR549">
<Make>Pontiac</Make>
<Model>Grand Prix</Model>
</Car>
The above Car element has now been modified to provide more information about the car. In thisinstance, a vehicle identification number attribute was added to the start tag of the Car element. Becauseof the flexible nature of XML, a more attribute-centric version of the Car element could be createdwithout violating any XML rules:
<Car Vin="BR549" Make="Pontiac" Model="Grand Prix" />
Although the text of the last two code blocks is very different, they are functionally equivalent. Just likeelements, attributes also have rules that they must abide by:
❑ Attributes must be unique within their element.
❑ Attributes must have content.
❑ Attribute content must be enclosed with quotes.
The type of quotes that you use to enclose the contents of your attributes is not important, but you mustbe consistent in their usage.
381
Report Definition Language
68787_ch11.qxp 26/03/2004 3:56 PM Page 381

You might have to decide between using attributes and elements in your report design. Both can servethe same purpose, but there are some tradeoffs you need to take into account. If you are in a situationwhere you have limited bandwidth, you could use attribute-centric XML, otherwise use element-centricXML. However, mixing the two is a bad design strategy.
XML DocumentsXML documents are a mixture of elements and attributes organized to represent some data. In thissection, let's discuss how to declare your documents as an XML document, and how detailedinformation and instructions can be sent to applications that will parse or use your XML data. Theconcept of a 'well-formed' XML document will also be introduced.
An XML document is identified by the inclusion of an XML declaration similar to:
<?xml version="1.0" ?>
This XML declaration should be the first thing encountered in the document. It is used to identify thedocument as an XML document, as well as to provide additional version or encoding information.Currently, the version information is not really used as there is only one XML specification, but thisinformation is in place in case additional versions of the XML specification should ever occur. It wouldindicate to the application that was reading or "parsing" the XML, which specification and rules toenforce. Let's modify the above XML fragment example to provide it with an XML declaration.
<?xml version="1.0" encoding="utf-8" ?><Car Vin="BR549">
<Make>Pontiac</Make><Model>Grand Prix</Model>
</Car>
While the XML above allows you to represent a car, there is still a problem. The ability to represent morethan one car must be added. In order to do this, you need to create a common outer element that will bethe container for all the other elements in our document. This outermost element is known as the root ordocument element. To prepare for the eventuality that other types of vehicles besides cars might need tobe represented, the outer element could be named Vehicles:
<?xml version="1.0" encoding="utf-8" ?><Vehicles>
<Car Vin="BR549"><Make>Pontiac</Make><Model>Grand Prix</Model>
</Car></Vehicles>
The document designed to represent vehicles for Ali's Auto is almost complete. It now complies with allthe rules required for it to be considered "well formed" XML.
❑ The document has an XML declaration.
❑ It is composed of one or more elements.
382
Chapter 11
68787_ch11.qxp 26/03/2004 3:56 PM Page 382

❑ All document entities conform to the XML naming rules.
❑ All document entities meet rules for their type (elements, attributes, namespaces, and so on).
❑ The XML tags are properly nested (no overlapping tags).
A well formed XML document simply follows all the rules governing the creation of XML. These rulesprovide and enforce a common standard for machine and program readability, which is one of theprimary purposes of XML. It is important to note that nowhere do these rules address what should becontained in a document. This issue will be addressed in the XML Schema section that follows.
XML NamespacesWhen using XML, you might need to combine XML documents. It is likely that names used by youmight have been used by others. This would be troublesome if not for the concept of namespaces. XMLnamespaces allow developers to uniquely identify their element names and relationships. This allowsthe developer to avoid name collisions with elements that have the same names but are defined indifferent vocabularies. Typically developers use Uniform Resource Identifiers (URIs) as namespaces andspecifically Uniform Resource Locators (URLs), because the naming standards for Internet domainsguarantee that each domain name is unique. See the following example:
<?xml version="1.0" encoding="utf-8" ?>
<Vehicles xmlns="http://sqlreportservices.com/AliAuto">
<Car Vin="BR549">
<Make>Pontiac</Make>
<Model>Grand Prix</Model>
</Car>
</Vehicles>
This allows the multiple tags with the same name to maintain their individuality. A combined documentmight look similar to the document that follows:
<?xml version="1.0" encoding="utf-8" ?><Vehicles xmlns="http://sqlreportservices.com/AliAuto"
xmlns:JJ="http://sqlreportservices.com/JanicesJalopies"xmlns:LL="http://sqlreportservices.com/LeweysLemons">
<Car Vin="BR549">
<Make>Pontiac</Make>
<Model>Grand Prix</Model>
</Car><JJ:Car><JJ:Vin>BR549</JJ:Vin><JJ:Make>Pontiac</JJ:Make><JJ:Model>Grand Prix</JJ:Model>
</JJ:Car><LL:Car Vin="BR549" Make="Pontiac" Model="Grand Prix" />
</Vehicles>
Notice that the namespace declared for Ali's Auto has no prefix. It is the default namespace of thedocument, and all entities will be processed in that context unless a prefix is specified. This leads us intothe next topic of discussion, XML Schema.
383
Report Definition Language
68787_ch11.qxp 26/03/2004 3:56 PM Page 383

XML SchemaAli's Auto has now identified the information that is important for their use, and come up with an XMLstructure to represent that information. Next, they need to ensure that all of their XML documents matchthis structure. The most recent and powerful way to perform this function is by using an XML Schema.
An XML Schema is a formal specification that defines how information is to be represented in an XMLdocument. It defines the structure of the document and the elements that are allowed. It defines therelationships between elements, their order, and can also define their data types. An XML Schemadocument is another example of the power and flexibility of XML, which is used to create the schemaitself.
Let's start out by creating our solution. The steps are as follows:
1. Create the solution by choosing File | New | Blank Solution. Change the name of the solution toRDLSolution.
2. Add the language-specific project by choosing File | Add Project | New Project. Use the emptyproject template.
3. Change the name of the project to XMLProject.
4. Add an XML document to the project by selecting File | Add New Item | File.
5. Select an XML file and change the name of the file to AliAuto.xml.
6. Edit the XML so that it matches the text in Figure 11-1:
Figure 11-1
Now that we have created our document using the facilities provided by Visual Studio, it is time tomake use of another tool that is available. We want to make a Schema to enforce the structure of ourXML document. Choose XML | Create Schema from the Visual Studio Menu as shown in Figure 11-2.Ensure that the cursor is inside the document to make this choice visible.
Figure 11-2
This can have several effects on both the document and the project. If no namespace is identified in yourdocument, then Visual Studio creates a default namespace. Visual Studio will modify the Vehicleelement by adding an xmlns attribute with a value of http://tempuri.org/AliAuto.xsd. The value
384
Chapter 11
68787_ch11.qxp 26/03/2004 3:56 PM Page 384

that Visual Studio inserts into the tag is not actually unique; it is a place holder for your customnamespace. Split "tempuri" and you literally have "temp" and "uri". The idea is to create a uniquenamespace that identifies the elements from this particular XML document.
<Vehicle xmlns="http://tempuri.org/AliAuto.xsd">
Since we have already defined a namespace for the document, a new XML Schema document has beenadded to our project but no namespace was specified. XML Schema documents have an .xsd fileextension; in the example described earlier, this file is called AliAuto.xsd. You can see that it has beenadded to the XMLProject project in Figure 11-3:
Figure 11-3
An XML Schema document is used to verify that a particular document meets the structure, naming,and type information required for a specific document. Open AliAuto.xsd and you should be able to seesomething similar to Figure 11-4:
Figure 11-4
This image is the DataSet view provided by Visual Studio for working with Schema documents. Itdisplays the Car element as well as the other attributes and elements that should be nested within thattag. The data types of the individual elements are also displayed and can be modified. Notice the toolbaron the left. It contains the design objects for creating and working with all types of XML Schemadefinitions. The DataSet view is a visual schema design surface that abstracts what is going on behindthe scenes. To see the actual XML that gets generated is used to enforce the structure of XML documentsfor Ali's Auto, click on the XML tab at the bottom:
385
Report Definition Language
68787_ch11.qxp 26/03/2004 3:56 PM Page 385

<?xml version="1.0" ?><xs:schema id="Vehicle" targetNamespace=":http://sqlreportservices.com/AliAuto" xmlns="http://sqlreportservices.com/AliAuto" xmlns:xs="http://www.w3.org/2001/XMLSchema" attributeFormDefault="qualified" elementFormDefault="qualified"><xs:element name="Vehicle" >
<xs:complexType><xs:choice maxOccurs="unbounded"><xs:element name="Car"><xs:complexType><xs:sequence><xs:element name="Make" type="xs:string" minOccurs="0" /><xs:element name="Model" type="xs:string" minOccurs="0"/>
</xs:sequence><xs:attribute name="Vin" form="unqualified" type="xs:string" /></xs:complexType>
</xs:element></xs:choice></xs:complexType>
</xs:element></xs:schema>
This XML should be similar to what is generated by Visual Studio for your XML document. This versionhas been edited to remove the Microsoft-specific namespaces so that it is more readable. The deletion ofthese unused tags has no effect on the ability of this document to enforce the XML rules defined by Ali'sAuto.
After examining the document, you should notice that almost all of the tags are prefixed by xs. Thisindicates that these tags are defined by the XML Schema definition maintained by the W3C:
<xs:schema id="Vehicle" targetNamespace="http://tempuri.org/AliAuto.xsd"
xmlns="http://sqlreportservices.com/AliAuto"
xmlns:xs="http://www.w3.org/2001/XMLSchema"
attributeFormDefault="qualified" elementFormDefault="qualified">
For the most part, Schema documents are almost self explanatory. The <Vehicle> tag is a complex tag,which means that it is composed of other tags. It is unlimited in the number of times that it can occur ina document, which is indicated by the maxOccurs="unbounded" attribute tag:
<xs:element name="Vehicl"
<xs:complexType>
<xs:choice maxOccurs="unbounded">
After the schema has been created for Ali's Auto, you may validate the document by selecting XML|Validate XML Data from the Visual Studio Menu. The results of the document are displayed in the statuswindow if there are no errors. See Figure 11-5:
386
Chapter 11
68787_ch11.qxp 26/03/2004 3:56 PM Page 386

Figure 11-5
To demonstrate both the effectiveness of an XML Schema and show what happens when the data isinvalid, the document needs to be modified. The schema document for Ali's Auto specifies the order ofthe Make and Model elements. This is indicated by the elements being placed in the confines of the XMLSchema sequence element:
<xs:sequence><xs:element name="Make" type="xs:string" minOccurs="0" /><xs:element name="Model" type="xs:string" minOccurs="0"/>
</xs:sequence>
Changing the order of the elements should cause the document to fail validation. Edit the XMLdocument to reverse the element order in the first <Car> tag as shown in Figure 11-6:
Figure 11-6
Because the schema document specifies the order that these tags should be in, the document now failsvalidation. When errors occur, the error message is placed in the Task Pane of Visual Studio. Validatingwith the reversed element order causes the message in Figure 11-7 to appear:
Figure 11-7
The ability to define the elements and structural relationships that are valid in a particular context vastlyincreases the flexibility and functionality of XML in data processing. The combination of a standardXML document format and a schema to validate that format combine to create what is commonlyknown as an XML Vocabulary. XML Vocabularies allow you to define a standard mechanism formachine-to-machine communication using XML and to validate that communication at both ends of thetransaction. There are several well known vocabularies in place today:
387
Report Definition Language
68787_ch11.qxp 26/03/2004 3:56 PM Page 387

❑ Channel definition format: Used to ''push'' web pages
❑ XHTML: Attempt at structuring HTML
❑ XSL: XML stylesheets (XML transformation and formatting)
New XML vocabularies are being created at a frantic pace. They can be extremely useful for facilitatingcommunications between businesses and software. Many vertical industry vocabularies have and arebeing developed.
What Is RDL?RDL promotes interoperability of reporting tools by defining a common schema facilitating the exchangeof report definitions between most reporting tools. However, you need to be clear about the fact thatRDL is a schema definition and not a programming language, interface, or a protocol, nor does it specifyguidelines for report processing or the passing of report definitions between applications.
As mentioned earlier, RDL is the XML vocabulary that defines the communication of reportingdefinitions to SQL Server Reporting Services. The purpose of the previous section on the XMLtechnology was to provide the insight you need to closely examine RDL.
Let's start by adding a new project to the existing RDLSolution. Select File | Add Project | New Projectfrom the Visual Studio menu. Next, select the Business Intelligence Project section and the Report Projecttemplate. Change the name of the project to Master Detail as shown in Figure 11-8:
Figure 11-8
Figure 11-9 shows that a new reporting project has been added to the solution. The method used tocreate this project is kind of convoluted because Microsoft, in trying to be helpful, has made it almostdifficult to create a blank report. The standard report creation mechanism is wizard-based, which ishelpful in a production environment, but does not facilitate the examination of RDL modifications. Thisis needed to enable you to examine the underlying RDL as controls are added or data connectionsettings are changed:
388
Chapter 11
68787_ch11.qxp 26/03/2004 3:56 PM Page 388

Figure 11-9
The next step is to add a report to the Master Detail Project. Highlight the Reports folder and right click tobring up the context menu. Specifically avoid the Add New Report menu choice because it will start thereport wizard. Choose Add | Add New Item as shown in Figure 11-10:
Figure 11-10
This will bring up the Add New Item dialog box, where the Report object should be chosen as in Figure 11-11. A blank report will then be created and added to the project:
Figure 11-11
After the blank report has been added, you will see a design surface like Figure 11-12. During thiswalkthrough, the visual controls provided in the Report Designer toolbox will be added to the designsurface and the corresponding RDL examined.
389
Report Definition Language
68787_ch11.qxp 26/03/2004 3:56 PM Page 389

Figure 11-12
Document RDLIn order to view the RDL that gets generated during the process of dragging and dropping the visualcontrols, the file that contains the RDL must be selected. This is done in the Solution Explorer window. Inthis window, right-click on the file to invoke the context menu as you can see in Figure 11-13. Select theView Code option (this can also be done from the Visual Studio menu).
Figure 11-13
After the View Code option is chosen, there should be two views of the report open in Visual Studio. Thefirst view is the Visual Design view into which we will place our visual controls. The second is the XMLview of the report, which we will examine after placing controls on the design surface. The RDL for anempty report is as follows:
<?xml version="1.0" encoding="utf-8"?><Reportxmlns="http://schemas.microsoft.com/sqlserver/reporting/2003/10/reportdefinition"xmlns:rd="http://schemas.microsoft.com/SQLServer/reporting/reportdesigner"><RightMargin>1in</RightMargin>
<Body><Style /><Height>2in</Height>
</Body>
<TopMargin>1in</TopMargin><Width>5in</Width><LeftMargin>1in</LeftMargin><rd:SnapToGrid>true</rd:SnapToGrid><rd:DrawGrid>true</rd:DrawGrid><rd:ReportID>6d3a29b0-6216-4880-857f-1fd355497048</rd:ReportID>
390
Chapter 11
68787_ch11.qxp 26/03/2004 3:56 PM Page 390

<BottomMargin>1in</BottomMargin></Report>
Notice that there are two namespaces at the top of the document. The first namespace is used to definethe elements that belong to the report definition. This is also the default namespace of the document,which means that any tags that do not contain a prefix are defined within the context of this namespace:
xmlns="http://schemas.microsoft.com/sqlserver/reporting/2003/10/reportdefinition"
The second namespace that you see is specific to the designer:
xmlns:rd="http://schemas.microsoft.com/SQLServer/reporting/reportdesigner">
The designer-specific tags are used to control the behavior of the Visual Studio Report Designer. All ofthe tags that belong to the designer namespace will be prefixed with rd to resolve any name clashes,should they occur.
<rd:SnapToGrid>true</rd:SnapToGrid><rd:DrawGrid>true</rd:DrawGrid><rd:ReportID>6d3a29b0-6216-4880-857f-1fd355497048</rd:ReportID>
These tags are represented in the Properties window for the document in the Design Section, and anychanges made to these properties will be reflected in the RDL itself. Change the SnapToGrid property toFalse. See Figure 11-14:
Figure 11-14
The following snippet of RDL illustrates how changing properties in the design window changes theRDL text in the document itself. It reflects the change in the value of the SnapToGrid property. This is truenot only for the document properties, but also for the data that you choose to use and every visualcontrol that you use in your report design:
<rd:SnapToGrid>false</rd:SnapToGrid><rd:DrawGrid>true</rd:DrawGrid><rd:ReportID>6d3a29b0-6216-4880-857f-1fd355497048</rd:ReportID>
391
Report Definition Language
68787_ch11.qxp 26/03/2004 3:56 PM Page 391

Data RDLIn previous chapters, the AdventureWorks database has been used for all of the examples. To maintainconsistency, this section will also use this database. In order to create a simple report, you first need tocreate the data definition that will be used to populate your report. Choose the Data tab of the reportdesigner and select New Dataset… from the drop-down list box as seen in Figure 11-15:
Figure 11-15
This will cause the Data Link Properties dialog to appear. Edit your connection settings to resemble thoseshown in Figure 11-16:
Figure 11-16
After the connection to the database has been successfully made, the Query Designer window appears.This window is very similar to that seen in Access or Visual Studio, so a detailed explanation is notincluded here. Before you add any actual data to the report, examine the changes made to the RDL bythe addition of a valid database connection.
After examining the RDL, you will notice that two new sections have been added to the document bythe designer. The following RDL section is the <DataSources> section. This tag contains nested tagsthat identify the data provider used as well as the connection string properties needed to connect to thedata store.
The content inside the <rd:DataSourceID> is a Globally Unique Identifier (GUID) that enables thedesigner to track individual data sources. Reporting projects might contain several different data
392
Chapter 11
68787_ch11.qxp 26/03/2004 3:56 PM Page 392

sources, and it also supports the concept of a shared data source in which many different reports use thesame data connection. In fact, the data source is conceptually equivalent to the Connection object intraditional ADO. If Integrated Security is used, a tag in the RDL indicates this:
<DataSources><DataSource Name="AdventureWorks2000"><rd:DataSourceID>6740a68a-aaa7-42fb-8025-57eed884a359</rd:DataSourceID><ConnectionProperties><DataProvider>SQL</DataProvider><ConnectString>data source=(local);
initial catalog=AdventureWorks2000</ConnectString><IntegratedSecurity>true</IntegratedSecurity>
</ConnectionProperties></DataSource>
</DataSources>
The second section added to the report is the <DataSets> section. It contains tags to name the dataset,relate the dataset to a specific query, and a <DataSourceName> tag that is used to link a particulardataset to a data source:
<DataSets><DataSet Name="AdventureWorks2000"><Query><DataSourceName>AdventureWorks2000</DataSourceName><CommandText />
</Query></DataSet>
</DataSets>
At this point, the <CommandText> tag in this code is empty, but that will soon change when you adddatabase content to your report. Click on the Add Table button on the Query Designer toolbar as shown inFigure 11-17:
Figure 11-17
This will cause a table selection dialog box to be shown. For the purpose of this example, we will keepthe data access portion very simple by adding just the Contact table. After adding the table, check theFirstName, MiddleName, and LastName boxes. As we add or delete tables and fields using Query Designer,the SQL statement is created in the SQL window at the bottom. The result is shown in Figure 11-18:
393
Report Definition Language
68787_ch11.qxp 26/03/2004 3:56 PM Page 393

Figure 11-18
You can now examine the results of the addition of data to your report by switching over to the XMLView of the report. The <DataSources> tag remains unmodified, but there have been significantchanges to the <DataSets> tag:
<DataSets><DataSet Name="AdventureWorks2000"><Fields><Field Name="FirstName"><DataField>FirstName</DataField><rd:TypeName>System.String</rd:TypeName>
</Field><Field Name="MiddleName"><DataField>MiddleName</DataField><rd:TypeName>System.String</rd:TypeName>
</Field><Field Name="LastName"><DataField>LastName</DataField><rd:TypeName>System.String</rd:TypeName>
</Field></Fields><Query><DataSourceName>AdventureWorks2000</DataSourceName><CommandText>SELECT FirstName, MiddleName, LastName FROM Contact </CommandText>
</Query></DataSet>
</DataSets>
The first and most obvious change to the <DataSets> tag is the addition of a <Fields> tag with nested<Field> elements within. The <Fields> tag represents the collection that is returned by querying thedata store:
<Field Name="FirstName"><DataField>FirstName</DataField><rd:TypeName>System.String</rd:TypeName>
</Field>
394
Chapter 11
68787_ch11.qxp 26/03/2004 3:56 PM Page 394
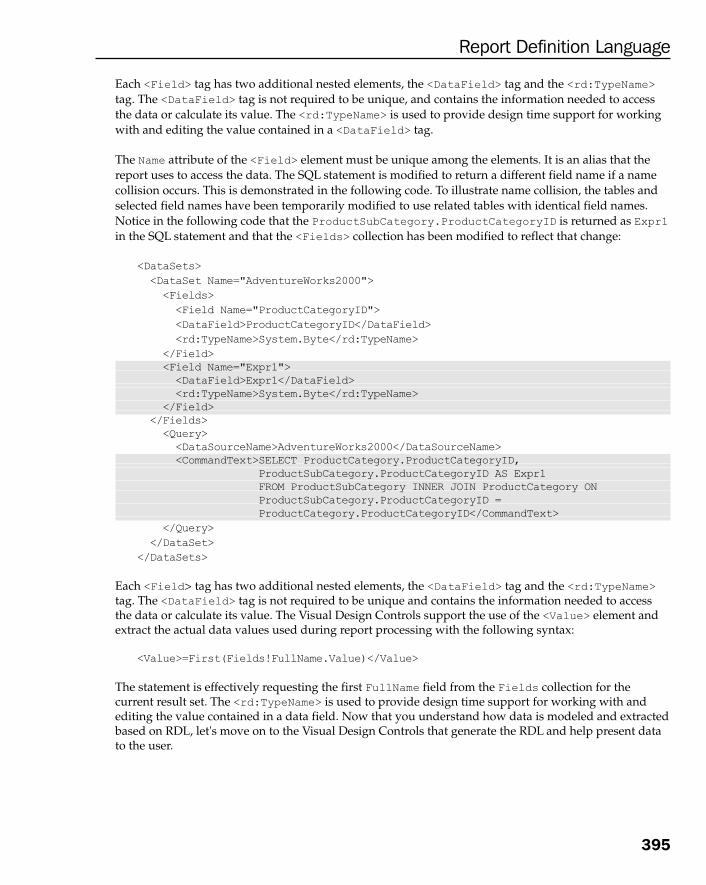
Each <Field> tag has two additional nested elements, the <DataField> tag and the <rd:TypeName>tag. The <DataField> tag is not required to be unique, and contains the information needed to accessthe data or calculate its value. The <rd:TypeName> is used to provide design time support for workingwith and editing the value contained in a <DataField> tag.
The Name attribute of the <Field> element must be unique among the elements. It is an alias that thereport uses to access the data. The SQL statement is modified to return a different field name if a namecollision occurs. This is demonstrated in the following code. To illustrate name collision, the tables andselected field names have been temporarily modified to use related tables with identical field names.Notice in the following code that the ProductSubCategory.ProductCategoryID is returned as Expr1in the SQL statement and that the <Fields> collection has been modified to reflect that change:
<DataSets>
<DataSet Name="AdventureWorks2000">
<Fields>
<Field Name="ProductCategoryID">
<DataField>ProductCategoryID</DataField>
<rd:TypeName>System.Byte</rd:TypeName>
</Field><Field Name="Expr1"><DataField>Expr1</DataField><rd:TypeName>System.Byte</rd:TypeName>
</Field></Fields><Query><DataSourceName>AdventureWorks2000</DataSourceName><CommandText>SELECT ProductCategory.ProductCategoryID,
ProductSubCategory.ProductCategoryID AS Expr1FROM ProductSubCategory INNER JOIN ProductCategory ON ProductSubCategory.ProductCategoryID = ProductCategory.ProductCategoryID</CommandText>
</Query>
</DataSet>
</DataSets>
Each <Field> tag has two additional nested elements, the <DataField> tag and the <rd:TypeName>tag. The <DataField> tag is not required to be unique and contains the information needed to accessthe data or calculate its value. The Visual Design Controls support the use of the <Value> element andextract the actual data values used during report processing with the following syntax:
<Value>=First(Fields!FullName.Value)</Value>
The statement is effectively requesting the first FullName field from the Fields collection for thecurrent result set. The <rd:TypeName> is used to provide design time support for working with andediting the value contained in a data field. Now that you understand how data is modeled and extractedbased on RDL, let's move on to the Visual Design Controls that generate the RDL and help present datato the user.
395
Report Definition Language
68787_ch11.qxp 26/03/2004 3:56 PM Page 395

Control RDLThere are nine visual design controls that ship with Reporting Services. Figure 11-19 shows a Textboxcontrol added to report. They each generate RDL based on their purpose. After creating an empty report,you can view the tags that each control generates by simply dragging and dropping them onto thedesign surface. The corresponding RDL can be viewed through the View Code option.
Figure 11-19
In the following sections, we will study the RDL generated by these nine controls.
TextBoxThe RDL generated by the Textbox control is displayed in the following code snippet. The Textbox is asimple placeholder for information that needs to be displayed. The <Value> tag contains the formula orexpression that will be used to provide the needed data. The Textbox can be used as a standalonecontrol or contained within sophisticated controls that use it to output their results.
<Textbox Name="textbox1"><Style><PaddingLeft>2pt</PaddingLeft><PaddingBottom>2pt</PaddingBottom><PaddingTop>2pt</PaddingTop><PaddingRight>2pt</PaddingRight>
</Style><Top>0.25in</Top><rd:DefaultName>textbox1</rd:DefaultName><Height>0.25in</Height><Width>1in</Width><CanGrow>true</CanGrow><Value /><Left>0.375in</Left>
</Textbox>
The complex controls cause many pages of RDL to be added to the report, and inthose cases, only the skeleton of the RDL has been included here instead of usingactual default values.
396
Chapter 11
68787_ch11.qxp 26/03/2004 3:56 PM Page 396

LineThe Line control is used only for visual effect. The style, size, and position of the line can be modified inthe Visual Designer. It is primarily used to provide context separation within reports:
<Line Name="line1"><Top>0.53125in</Top><Width>1in</Width><Height>1in</Height><Style><BorderStyle><Default>Solid</Default>
</BorderStyle></Style><Left>1.23958in</Left>
</Line>
RectangleA Rectangle is a container control. It is used to group other controls on a report so that they can bepresented or moved as one unit. It is the conceptual equivalent of a panel control in Windowsapplication development. The RDL below is generated by a Rectangle control that contains a Line:
<Rectangle Name="rectangle1"><Top>1.39583in</Top><ReportItems><Line Name="line2"><Top>0.11458in</Top><Height>1in</Height><Width>1in</Width><Style><BorderStyle><Default>Solid</Default>
</BorderStyle></Style><Left>0.3125in</Left>
</Line></ReportItems><Height>1.47917in</Height><Width>2in</Width><Left>1.34375in</Left>
</Rectangle>
TableThe Table control is used to group or relate repetitive data items. Dropping a Table control onto ablank report causes four pages of RDL to be generated, which is too much to display here. The RDLdisplayed below is a skeleton based on Reporting Services Books Online. A summary of the Tablecontrol is that it creates a collection of rows and columns that can be sorted and grouped like the DataGrid control used by developers. The combination of a row and column corresponds to a cell, which usesa nested TextBox control to display the data.
<Table Name="table1"><Style />
397
Report Definition Language
68787_ch11.qxp 26/03/2004 3:56 PM Page 397

<Top /> <Left /><ZIndex /><Visibility /><ToolTip /><Label /><Bookmark /><Custom /><KeepTogether /><NoRows /><DataSetName /><PageBreakAtStart /><PageBreakAtEnd /><Filters /><TableColumns /><Header /><TableGroups /><Details /><Footer />
</Table>
MatrixThe Matrix control is a two-axis grid with drill-down capability on both axes. It is very similar to theTable control except for its dual axis capabilities. It is the Reporting Services equivalent of the PivotTable. The Matrix is composed of rows and columns that use the Textbox to render all of the results.The following code snippet is a skeleton of the RDL generated by the Matrix control:
<Matrix Name="matrix1"><Style /><Top /><Left /><ZIndex /><Visibility /><ToolTip /><Label /><Bookmark /><Custom /><KeepTogether /><NoRows /><DataSetName /><PageBreakAtStart/><PageBreakAtEnd /><Filters /><Corner /><ColumnGroupings /><RowGroupings /><MatrixRows /><MatrixColumns /><LayoutDirection /><GroupsBeforeRowHeaders />
</Matrix>
398
Chapter 11
68787_ch11.qxp 26/03/2004 3:56 PM Page 398

ListA List is a data region that is repeated with each group or row in a result set. It is used for repeatingrecords and allows simple grouping with nested tags being repeated for each record. The followingexample list will group on each repetition of CustomerID from the NorthWind database:
<List Name="list1"><Style /><Height>1in</Height><Top>0.875in</Top><ZIndex>1</ZIndex><Grouping Name="CustomerGroup"><GroupExpressions><GroupExpression>=Fields!CustomerID.Value</GroupExpression>
</GroupExpressions></Grouping><DataSetName>Northwind</DataSetName><Width>2in</Width><Left>0.375in</Left>
</List>
ImageThe Image control is used to display images on a report. The images that you add to a report have threestorage options. The image may be embedded in the report, stored in the database, or added to theproject. The following example is that of an embedded image. Adding the Image control causes two tagsto be added. The first tag, <Image>, contains all of the display information:
<Image Name="ovals"><Top>0.94792in</Top><Height>0.16667in</Height><Width>0.41667in</Width><Source>Embedded</Source><Style /><Value>ovals</Value><Left>0.875in</Left><Sizing>AutoSize</Sizing>
</Image>
The second tag, <EmbeddedImages>, is a collection that contains the data for each image that isembedded into the report. Inside the <EmbeddedImage> tag is located the MIME type of the image andthe encoded values that make up the image:
<EmbeddedImages><EmbeddedImage Name="ovals"><MIMEType>image/gif</MIMEType><ImageData>R0lGODlhKAAQAOYAADMAAOe7b16p1eXw921DO72ppuvIjJHG55t+eFMhGebe3oW93r/c7vLduYizwXlRSUAIAODX1u/Vp9LFwo5sZ8Oxrvz7+Gmv17GZlsu8uea/eWYzM920cPbnz/ju3NDm8uPXzaJyRabQ50MNAG+03l8xJ+nEhL+dfKaMh/j29qHEz/HYrToBAE4bENbp8/Ht7NTKqsO7lu3n55HE4fjiu67T6eu+hRZI4OHhJztC6NA2MCTX7dhBahTCMoReuCIc8uVz4O9fLxeEemwoaHAEixA7FD6zEaOhwymFJiypaJGAEo3Pqqjw2C6IKkIFKNJjUQKEFXz5bDk5wBKgFEMZINAbwoLäJhM4oQUw4YQLFQH/oApcdAPAKxYtEGQRFMWcVw0Sfghy0euXgAUfEsmgsKHEDSIRHzhp4WGAx4pcgz7MyJHDBxRJk1L0UMQkEuBJiBMjDgQAOw==</ImageData>
399
Report Definition Language
68787_ch11.qxp 26/03/2004 3:56 PM Page 399

</EmbeddedImage></EmbeddedImages>
MIME stands for Multipart Internet Mail Extension. MIME types were originally designed so thatmail messages could contain nontext data like images and documents. They are used to identify thespecific encoding mechanism used to store or serialize data. When an embedded image is used, a binaryrepresentation of the image is stored, and when rendered the appropriate MIME type is sent as part ofthe stream payload to indicate how the binary data should be processed.
SubreportThe Subreport control emits RDL text that allows a report to be embedded within the body of the mainreport. The Subreport can be parameterized and repeat with other data region controls.
<Subreport Name="subreport1"><Style /><Top>1.44792in</Top><ReportName /><Width>3in</Width><Left>2.29167in</Left>
</Subreport>
ChartThe Chart control emits the RDL that allows Reporting Services to create a graphical representation ofdata. The Chart control is able to represent two-dimensional data using nine chart types: Column, Bar,Line, Pie, Scatter, Bubble, Area, Doughnut, and Stock.
<Chart Name="chart1"><Style /><Top /><Left /><Height /><Width /><ZIndex /><Visibility /><ToolTip /><Label /><Bookmark /><Custom /><KeepTogether /><NoRows /><DataSetName /><PageBreakAtStart/><PageBreakAtEnd /><Filters /><Grouping /><Sorting /><ReportItems /><Parameters /><DataFields /><ChartDefinition />
</Chart>
400
Chapter 11
68787_ch11.qxp 26/03/2004 3:56 PM Page 400

Creating RDLCreating an RDL document is not a trivial task. It requires a detailed understanding of XML andReporting Services processing. In addition, you should expect a plethora of third party tools to emergethat generate Reporting Services-compatible RDL. Although most developers use tools provided byMicrosoft or third parties to create report definitions, it is important to understand how you could, ifneeded, create or modify an RDL document.
In this section, we will cover two methods to create RDL. We will use the XML classes within the .NETframework to emit a simple RDL tag followed by a more practical example, where you begin with areport template and modify the RDL based upon a different data source. The second example will use athird party tool called CodeSmith.
RDL with .NETBecause a full blown discussion of XML programming in .NET is beyond the scope of this book, thissection will only demonstrate the creation of a simple RDL tag using the .NET Framework classes. Thefollowing code snippets assume that you are familiar with Visual Studio and C#.
For a more detailed discussion of this topic, see XML Programming Bible by Wiley Press (ISBN 0-7645-3829-2).
The following code snippet is a simple console application. It has one static method that creates the XMLfor a Textbox:
static void Main(string[] args){
CreateXML.GenerateRDL();}public static void GenerateRDL(){
MemoryStream stream = new MemoryStream();XmlTextWriter writer = new XmlTextWriter(stream,Encoding.UTF8);writer.Formatting = Formatting.Indented;
writer.WriteStartElement("Textbox"); //begin textboxwriter.WriteAttributeString("Name","textbox1");
writer.WriteStartElement("Style"); // begin stylewriter.WriteElementString("PaddingLeft","2pt");writer.WriteElementString("PaddingBottom","2pt");writer.WriteElementString("PaddingTop","2pt");writer.WriteElementString("Paddingright","2pt");writer.WriteEndElement();// end style
writer.WriteElementString("Top","0.25in");writer.WriteElementString("rd:DefaultName","textbox1");writer.WriteElementString("Height","0.25in");writer.WriteElementString("Width","1in");writer.WriteElementString("CanGrow","true");writer.WriteElementString("Value","");
401
Report Definition Language
68787_ch11.qxp 26/03/2004 3:56 PM Page 401

writer.WriteElementString("Left","0.375");writer.WriteEndElement(); // end textbox
writer.Flush();stream.Position=0;
StreamReader sr = new StreamReader(stream);
Console.WriteLine(sr.ReadToEnd());sr.Close();
}
A more object-oriented approach could also be taken. One idea might be to create your own objectmodel for all of the RDL objects. You could create a Textbox object with properties that map to the RDLtags and override the ToString method with code while replacing the values with those from the object.The result of running this code is shown in Figure 11-20:
Figure 11-20
RDL with CodeSmithDevelopers spend a significant amount of their time doing redundant work. The process is not onlyboring, but also error prone. The idea behind automating the creation of repetitive code is to decreaseerrors and increase maintainability. RDL is non-proprietary in nature, and hence, a third party tool canalso be used to create a report. The following criteria were used when selecting a tool for thisdemonstration:
❑ Free
❑ Powerful
❑ Flexible
❑ Preferably created using .NET
❑ Not created specifically to illustrate this concept
CodeSmith, created by Eric J. Smith, is a free template-based code generator that meets all of thesecriteria. It consists of four related tools, three of which are available at no cost:
402
Chapter 11
68787_ch11.qxp 26/03/2004 3:56 PM Page 402

❑ CodeSmith Console: It is a command line application that can be used to batch buildsophisticated projects using CodeSmith templates and XML property sets.
❑ CodeSmith Explorer: It is a graphical user interface to the generation engine. It allowsdevelopers to browse templates, add and modify template properties, and view the results.
❑ CodeSmith Visual Studio Addin: It is an add-in to Visual Studio that allows the generation ofcode from XML property sets from within Visual Studio. This paradigm is very similar to ASPcode-behind pages.
❑ CodeSmith Studio: It is a template development environment with syntax highlighting thatwill soon be available for a minimal charge. CodeSmith's syntax is almost identical to ASP.NET,and anyone who is familiar with that syntax should easily be able to produce code with it. Iteven uses the compilers that ship with the .NET Framework to compile the template code,resulting in the ability to write templates in any of the pure .NET-compatible languages: VisualBasic .NET, C#, or J# CodeSmith enjoys strong support, both from the creator and a growingcommunity of active developers.
The scenario for the following example is that we have created a standard report format that needs to bereplicated with different data sources. The original report used for this example was created using VisualStudio and is based upon a two-table join of related database tables. Retracing the steps to create acommon look and feel changing the data source and the control value tags is both time consuming anderror prone. Our design goal is that we should be able to pick two related tables from any data source,choose the fields that we want displayed, and generate the appropriate report based on the new datasources. Let's start by looking at the original report design (see Figure 11-21).
Figure 11-21
This report was designed using the NorthWind database that ships with SQL Server. It is a Master Detailrelationship report based on an inner join of the Customer and Order tables. The top two boxes in thereport are Textbox controls that contain the name of the database and the name of the report. The thirdbox from top is a List control. It has been set up to group on the primary key value from the Mastertable. This will cause all controls and fields to be repeated for each row in the Customer table. The lastbox on the report is a Table control. The Table control has been set up to group on the OrderID Field.In the final report, a table will be output that contains the order information from that particularcustomer. The report resembles Figure 11-22 when processed:
403
Report Definition Language
68787_ch11.qxp 26/03/2004 3:56 PM Page 403

Figure 11-22
Now that the design of the report is done and it renders correctly, we need to make our efforts morerepeatable. A template needs to be created that will allow us to choose any Master and Detail table,specify the fields that need to be displayed, and automatically have a new report generated. For thepurpose of this demonstration, we will be using the CodeSmith Explorer to set the report properties andgenerate reports. There are five values that vary between the reports that will be generated, and we needto create properties that will allow the user to edit and change those values. The values are:
❑ Master Table
❑ Master Table Display Columns
❑ Detail Table
❑ Detail Table Display Columns
❑ Report Name
Let's examine the key portions of the template and examine the generation of a Master Detail Report.The template that we will use is called MasterDetail.cst. You need to install CodeSmith and thenclick on the template provided with the book code samples to execute it. The following window shownin Figure 11-23 will appear:
Figure 11-23
404
Chapter 11
68787_ch11.qxp 26/03/2004 3:56 PM Page 404

You can download the template used for the following example fromhttp://www.ericjsmith.net/codesmith/.
Notice that the window looks exactly like the property window used to set design time values in VisualStudio and that there are five editable properties that map to the varying report values described earlier.These properties are defined within the template and are used to dynamically generate our reports.Theproperty at the bottom of the form is the ReportName property and is used to set the name of the report.The report name is stored in a variable called ReportName of type string. The default value isMaster/Detail Report and it is created using the following code:
<%@ Property Name="ReportName" Type="System.String" Default="Master/Detail Report"Category="Summary" Description="The name of the report." %>
The default value inserted by this property directive for ReportName is acceptable, so you don't need tomodify it. Select the MasterTable property; this will cause the Table Picker window to appear (see Figure 11-24):
Figure 11-24
CodeSmith would display any known data sources in the Data Source listbox above, but because this isthe first time that any data source is being accessed, a data source must be specified. This is done byclicking on the ellipses displayed in the upper right hand corner (see Figure 11-24) which causes the DataSource Manager window to appear, which you can see in Figure 11-25:
Figure 11-25
Click the Add button; this will cause the Data Source window to be displayed. Edit the Connectionproperties for the data source connection as shown in Figure 11-26 to connect to your database:
Figure 11-26
405
Report Definition Language
68787_ch11.qxp 26/03/2004 3:56 PM Page 405

The connection information is verified upon pressing the OK button. If your connection settings arecorrect, the Data Source Manager window will now have an entry (see Figure 11-27):
Figure 11-27
Now, if you close the Data Source Manager window, it will cause the Table Picker window to be displayedand it should be populated with the available tables as seen in Figure 11-28:
Figure 11-28
Choose the Customers table by clicking the Select button. This causes the Table Picker window to close,and the report property window to come to the forefront as shown in Figure 11-29:
Figure 11-29
You can see from Figure 11-29 that the MasterTable property has been set to dbo.Customers and the fieldsfrom that table have been copied into the MasterDisplayColumns property field. Next, you need to set thetable value for the Detail section of the report. Because you have a valid data source, the table list fromFigure 11-28 is displayed. Select the Orders table and the chart properties window will be displayed withthe information shown in Figure 11-30:
406
Chapter 11
68787_ch11.qxp 26/03/2004 3:56 PM Page 406

Figure 11-30
All that remains for generating a new report is to choose the fields that we want to display. Theseproperties have already been set from the code for our Master and Detail tables, but the default behavioris all fields and we may want to change this.
Edit the Columns property for both the Master and Detail tables by clicking on those property fields. Acustom type editor has been associated with each property, which will cause the String Collection Editorwindow to be displayed as in Figure 11-31:
Figure 11-31
Finally, you need to delete unwanted fields from the report. You can generate the report by pressing theGenerate button displayed at the bottom of Figure 11-30. This causes our template to use the propertiesthat we have set to generate the RDL, the results of which are shown in Figure 11-32:
407
Report Definition Language
68787_ch11.qxp 26/03/2004 3:56 PM Page 407

Figure 11-32
The report created by this template matches the report shown in Figure 11-25. The main benefit itprovides is that the users of this template may create and use this reports with a common look and feelbased on different tables and fields with no additional effort. Our efforts to create a flexible, repeatablesolution have been successful.
Although a full-blown example of template creation is beyond the scope of this book, it is important todisplay an example of how the RDL from the original report and the templated code work together. Thefollowing code snippet illustrates the mixed ASP.NET-like code that generates the table cell headers forthe Detail records. Only the template code has been highlighted here:
<TableCells><% for (int i = 0; i < DetailDisplayColumns.Count; i++) {%>
<TableCell><ReportItems><Textbox Name="<%= DetailDisplayColumns[i] %> Header"><Style><PaddingLeft>2pt</PaddingLeft><TextAlign>Left</TextAlign><PaddingBottom>2pt</PaddingBottom><PaddingTop>2pt</PaddingTop><PaddingRight>2pt</PaddingRight><FontWeight>700</FontWeight></Style><ZIndex>7</ZIndex><rd:DefaultName><%= DetailDisplayColumns[i]%> Header</rd:DefaultName><CanGrow>true</CanGrow><CanShrink>true</CanShrink><Value><%= DetailDisplayColumns[i] %></Value></Textbox></ReportItems></TableCell>
<% } %>
Notice that the code almost resembles the use of traditional ASP. CodeSmith uses a mixed text and tagsolution that generates dynamic output based on changing properties. Automatic or template-based
408
Chapter 11
68787_ch11.qxp 26/03/2004 3:56 PM Page 408

code generation cannot eliminate all of your coding but can be intelligently applied to improve qualityand reduce the effort involved in code maintenance.
There is, however, a small disadvantage associated with using a third party tool like CodeSmith. In caseof errors, you might need to examine three levels of code to determine the source: Reporting Services,Visual Studio, and CodeSmith.
SummaryMicrosoft's use of XML-based RDL is huge step forward toward common report definition formats. Itopens up a brand new revenue stream for tool vendors, and allows existing reporting solutions to exporttheir proprietary reports into an open extensible format for use by Reporting Services or any other futuretools that are able to emit or consume RDL. Our simple examples using both the .NET Frameworkclasses and CodeSmith illustrate this point. The ability to buy or build these tools give us that have beensorely lacking in the reporting arena for years.
409
Report Definition Language
68787_ch11.qxp 26/03/2004 3:56 PM Page 409

68787_ch11.qxp 26/03/2004 3:56 PM Page 410

Extending ReportingServices
Earlier chapters focused on building and managing reports and interfacing with ReportingServices through the exposed Reporting Service Web Service. All of these topics are crucial tousing and understanding Report Services, but we also want to address those situations where thebuilt-in functionality provided by Reporting Services does not fully meet your needs.
In this chapter, you will learn about the extensibility of Reporting Services and the areas thatcurrently support customization. These include:
❑ Extensibility options
❑ Reasons for extending SQL Server Reporting Services
❑ How to create custom extensions
❑ How to install custom extensions
OverviewAs you learned in Chapter 2, Reporting Services is a robust and scalable product for enterprisereport processing. In addition, Microsoft has built Reporting Services using a modular extensiblearchitecture that gives users the ability to customize, extend, and expand the product to supporttheir enterprise Business Intelligence (BI) reporting needs. Reporting Services currently supportsextending its behavior in the following areas:
❑ Data processing extensions: Custom data providers can allow you to access any type ofdata store using a consistent programming model. Currently supported providers includeODBC, OLEDB, Oracle, and SQL.
121122
ch68787_12.qxp 26/03/2004 3:56 PM Page 411
Chapter 12
412
❑ Delivery extensions: Delivery extensions allow you to deliver reports to users or groups ofusers according to a schedule. Email and network file shares are the delivery mechanismscurrently built into the product.
❑ Delivery management extensions: Management extensions are user interface components thatallow a user to control the delivery of reports through Report Manager.
❑ Custom report objects: Custom report objects are .NET assemblies that allow you to addcustom functionality to report processing.
The Missing PiecesReporting Services supplies a good deal of extensibility out of the box. This is especially impressivewhen you consider its status as a first release product. There are, however, key pieces of the product thatyou would expect to be extensible where customization is blatantly absent.
Security Extensions Reporting Services currently supports only Integrated Windows Security and SQL Server security. Thisis a glaring omission by the designers of the product. Most companies have heterogeneous networkswith multiple operating systems (OS) and products. In a perfect world, all of our networks, applications,and resources would support some form of single sign-on, or at least would allow us to build thisourselves. By limiting Reporting Services to a Windows-only environment, Microsoft has severelyrestricted its customer base.
Postings at the beta news groups indicate that they are aware of this issue and is actively workingtowards resolution. There is an unimplemented placeholder interface calledIAuthorizationExtension in the Reporting Services Interface assembly. There are no guarantees,however, that this functionality would make it into the Release to Market 1.0 version.
Rendering Extensions Rendering extensions control the type of document that gets created when a report is processed.Theoretically, you could have Report Services create any type of document given the ability to extendthe product in this area. Microsoft has indicated support for custom rendering in future versions but notin the 1.0 release. Currently, Microsoft provides the following rendering extensions out of the box:
❑ HTML: The HTML extension will generate HTML 3.2 for use with older browsers and HTML4.0 for browsers that support the dynamic HTML standard.
❑ MHTML: MHTML is another HTML standard created to allow disconnected viewing of HTMLdocuments. All the images in the page are encoded into the document, which increases its size,but allows it to be viewed both online and offline.
❑ Excel: The Excel extension creates Microsoft Excel-specific MHTML.
❑ CSV: The Comma Separated Values extension emit data fields separated by commas. The firstrow of the CSV result contains the field names for the data.
ch68787_12.qxp 26/03/2004 3:56 PM Page 412

❑ Image: The image extension allows you to export reports as images in the EMF, GIF, JPEG,PNG, TIFF, and WMF formats.
❑ PDF: This extension allows the generation of reports in the PDF format.
Extensible Report Designer Classes Microsoft's tool for creating Reports is the Report Designer. Report Designer is integrated into VisualStudio .NET and uses a development paradigm that is very similar to building Windows forms. Youdrag and drop controls onto the design template and set properties to change the behavior of the control.Unlike Windows forms, the Report Designer classes are sealed, preventing programmers from extendingthem and adding functionality.
Microsoft team members have indicated that decisions about the object model for Reporting Controls isstill ongoing and are not commiting to either timelines or functionality. There is, however, a placeholderin the RDL object model called CustomReportItem that suggests that the capability to create customReport controls at some time in the future would be available. Since the Designer ultimately createsXML, it is possible to overcome this limitation by creating your own object model to create RDL. In fact,many third parties such as Proclarity and Sorfware Artisans are already extending their tools to emitReporting Services compatible RDL.
Business OpportunitiesMicrosoft has a long history of creating and fostering an ecosystem around their products. SQL Serveralready has many third party products that can be used to enhance its capabilities, ease development,and make managing the product easier. Searching the Internet revealed literally hundreds of productsbuilt to enhance your SQL Server experience. Reporting Services will be no exception. This chapterintroduces you to most of the areas within Reporting Services that allow customization and offeropportunities to create add-on products that provide value to customers. Some areas of opportunityinclude creating:
❑ Delivery extensions that work with third party products like IBM MQSeries.
❑ Rendering extensions to support other presentation formats such as Macromedia Flash orMicrosoft PowerPoint.
❑ Custom security extensions to allow the use of Reporting Services in heterogeneousenvironments.
❑ Entire Business Intelligence (BI) reporting solutions for various business products.
Common Extension InterfacesReporting Services uses common interfaces to allow expanding the product in a standard way. Most ofthese interfaces are used to allow Reporting Services to interact with a variety of different objectswithout any knowledge of their architecture or implementation. This is a commonly used way of
413
Extending Reporting Services
ch68787_12.qxp 26/03/2004 3:56 PM Page 413

allowing product extension and standardizing object creation and interaction used in Object OrientedProgramming (OOP).
What Is an Interface?Most C/C++ developers are intimately familiar with interfaces. The entire COM programming model isbased upon them. Visual Basic developers have used interfaces for years, but the VB programmingenvironment hid this from programmers. In fact, Reporting Services itself is exposed to developersthrough a web service interface. In order to provide complete coverage of Extending Reporting Services,a definition and explanation of interfaces is required. So what is an interface?
This sounds great, but what does it mean? In Reporting Services, the primary class of all extensioncomponents must implement the IExtension interface. This is illustrated in the code snippets providedin the following section.
IExtensionAll developers who want to extend Reporting Services must build a method called SetConfigurationinto the initial class used in their components. This method matches the method signature in thefollowing code sample. They must also create a property called LocalizedName that returns the nameof the component based on the language being used for coding (Russian, German, Italian, and so on).Once the programmers have met these requirements, they are said to have implemented the interface.
C#
The code in C# that extends the IExtension interface is as follows:
public interface IExtension{
void SetConfiguration(string configuration);string LocalizedName{ get; }
}
VB.NET
A Visual Basic example that implements the IExtension interface is shown here:
Imports Microsoft.ReportingServices.InterfacesPublic Class MyExtension Implements IExtension
Public ReadOnly Property LocalizedName() As String _Implements IExtension.LocalizedNameGet'write code to return the localized name of the component
End GetEnd Property
An interface is a presepecified definition that forms a contract between softwarecomponents and defines how they communicate.
414
Chapter 12
ch68787_12.qxp 26/03/2004 3:56 PM Page 414

Public Sub SetConfiguration(ByVal configuration As String) _Implements IExtension.SetConfiguration'write code to configure your component to allow configuration
End Sub
End Class
IDisposableThe IDisposable interface is very common, although it is not a Reporting Services—specific interface.It is commonly used throughout the .NET Framework. The purpose of the IDisposable interface is toprovide a common way of releasing references to non-memory resources such as a database connection.Let's see the definition of IDisposable.
C#public interface IDisposable{
void Dispose();}
VB.NETPublic Interface IDisposable
Sub Dispose()End Interface
Many of the input/output related objects in the .NET Framework implement the IDisposable interfacedue to their interaction with non-memory resources. The extensions we will create for ReportingServices are no exception. A full discussion of resource management, however, is beyond the scope ofthis book. Our code will not actually do anything in IDisposable, but will have an empty or NOOPoperation to meet the interface requirements of the specific object.
Interface Language DifferencesThere are differences in the way that VB.NET and C# require interface methods to be declared. C#supports implicit interface definitions. If the method names and signatures match those of an interfaceimplemented by the class, then the class methods are automatically mapped to their associated interfacemethods. VB.NET requires explicit interface implementation. In order to be mapped correctly, VB.NETrequires that you specify that the method is implementing a certain interface. This is done with theImplements keyword as follows:
Public Sub Dispose() Implements IDataReader.Dispose'Data Providers often work with non-memory resources. If this'is the case implement the IDisposable Interface.
End Sub
415
Extending Reporting Services
ch68787_12.qxp 26/03/2004 3:56 PM Page 415

Data Processing ExtensionsReporting Services allows you to access data from traditional data sources such as relational databasesusing the existing .NET data providers. The following providers are supplied as part of the .NETFramework supplied by Microsoft:
❑ ODBC
❑ OLEDB
❑ Oracle
❑ SQLClient
Data processing extensions are components that allow you to access data for use within ReportingServices. If that implies a .NET data provider to you, then congratulations are in order. These two typesof data access objects are very similar and are based on a common set of interface definitions. If you havealready built a custom .NET data provider, you may use that provider with Reporting Services with nomodification. However, you also can extend your existing provider to provide additional functionality.
In this chapter, we will discuss the similarities and differences between a standard .NET data providerand a Reporting Services Data Processing Extension. Let's start with some architectural informationabout data providers in general, and then dive into the details of creating a custom data processingextension. The .NET Framework has a data access object model that is very similar to that used intraditional COM-based ADO. The ADO.NET object model is shown in Figure 12-1:
Figure 12-1
The RS data provider is essentially the same as the ADO data provider, except for the fact that it requireswrappers around .NET providers to support the RS required interfaces. The programming paradigm isvery similar as well.
The basic steps for working with a data source are as follows:
❑ Make a connection to a data source.
❑ Issue a command to manipulate data.
❑ Retrieve the results of your query.
416
Chapter 12
ch68787_12.qxp 26/03/2004 3:56 PM Page 416

These actions map directly to the objects above, although a DataAdapter implementation is not neededbecause Reporting Services only reads the data.
The following table summarizes the objects that are normally created in a data processing extension, andprovides a description of the object responsibilities:
Each of these objects contains implementation-specific code needed to create a connection, issuecommands, or read and update data. Microsoft has enforced a consistent data access mechanism bybasing these objects on a set of standard interfaces. Figure 12-2 shows the interfaces that may beimplemented when creating a data processing extension, although not all of them are required:
Figure 12-2
The following table indicates the interfaces that must be implemented to build a custom data processingextension:
Table continued on following page
Interface Description
IDbConnection Unique session with a data source
IDbTransaction Local transaction (non-distributed)
IDbCommand Represents query command methods to be executed against a data source
Object Description
Connection Establishes a connection to a specific data source.
Command Executes a command against a data source. Exposes a Parameters collection and can execute within the scope of a transaction.
DataReader Provides access to data using a forward-only, read-only stream.
DataAdapter Responsible for retrieving data and for resolving updates with the data source. This object is not required for a Reporting Services Data Processing Extension because of the read-only nature of Reporting Services.
417
Extending Reporting Services
ch68787_12.qxp 26/03/2004 3:56 PM Page 417

Creating a Custom Data Processing ExtensionCreating a full blown data provider is no trivial task. The goal of this walkthrough is familiarize youwith the .NET data access mechanism, as well as help you create and install a custom Reporting ServicesData Extension. Our implementation is simplified in that it does not support transactions. It should alsobe noted that an ODBC driver already exists that could be used for this task.
Let's look at the scenario for this walkthrough. You regularly receive student data from a third partyover which you have no control. The information is sent in a CSV file with a specific layout. There is animmediate need to create a formatted hard copy of this data for use as a roster. After some research, yourealize the Reporting Services will meet your needs. You decided to make your efforts reusable bycreating a custom data extension.
Creating the ProjectLet's start by creating our projectby choosing File | New | Project. Change the name of the Project toCSVDataExtension. Use the Class Library template. The name of the assembly needs to change to reflectour custom namespace. Choose Project | Properties and change the assembly name toWrox.Professional.ReportingServices.CSVDataExtension.
Most of the classes created for this project have common requirements. Most of them have empty defaultconstructors, and all of them require the use of some common namespaces. The code below is a skeletonof how each class should look after you create it. Replace the ClassName with the name of the class youare working on. This will allow you to concentrate only on the differences between the objects that willbe created in your data extension project.
C#using System;using Microsoft.ReportingServices.DataProcessing;
namespace Wrox.Professional.ReportingServices.CSVDataExtension{
public class CSVClassName{}
}
Interface Description
IDataParameter Methods to support passing parameters to a Command object
IDataParameterCollection Collection of parameters
IDataReader Methods used to read a forward-only, read-only data stream
IExtension Reporting Services-specific interface that supports localizationand is implemented by all SRS extensions
418
Chapter 12
ch68787_12.qxp 26/03/2004 3:56 PM Page 418

VB.NETImports System;Imports Microsoft.ReportingServices.DataProcessing;
Namespace Wrox.Professional.ReportingServices.CSVDataExtensionPublic Class CSVClassName
End ClassEnd Namespace
Creating the CSVConnection ObjectThe Connection object is responsible for connecting to the data source and providing a mechanism foraccessing both the data processing extension—specific transaction and command objects. Theseresponsibilities are enforced through the IDbConnection interface.
To add the CSVConection class to the project, choose Project | Add Class from the menu. Change thename of the class to CSVConnection. After the class definition, the IDisposable.Dispose method mustbe added to this class. This was discussed earlier in the section on interfaces.
Namespaces are used to bring assemblies that you have referenced into scope. You will be using thefollowing namespaces in the CSVConnection class. Add the Interfaces namespace definition to thetop of your file.
C#using System;using Microsoft.ReportingServices.DataProcessing;using Microsoft.ReportingServices.Interfaces;
VB.NETImports SystemImports Microsoft.ReportingServices.DataProcessingImports Microsoft.ReportingServices.Interfaces
Variable DeclarationsThe following variables are used later in the code. The m_connString variable holds the connectionstring that will be used to connect to the data source. The m_state variable holds the value of the stateof the current connection. The System.Data.ConnectionState is an enumeration that represents allthe possible states of a connection.
C#private string m_connString;private System.Data.ConnectionState m_state = System.Data.ConnectionState.Closed;
VB.NETPrivate m_connString As StringPrivate m_state As System.Data.ConnectionState = System.Data.ConnectionState.Closed
419
Extending Reporting Services
ch68787_12.qxp 26/03/2004 3:56 PM Page 419

ConstructorsThe CSVConnection object has an empty default constructor, as well as an overloaded constructor thatallows the developer to create the object and initialize the connection string in one line of code.
C#public CSVConnection(string connString){
//contructor with connection stringm_connString = connString;
}
VB.NETPublic Sub New(ByVal connString As String)
'contructor with connection stringm_connString = connString
End Sub
Implementing IDbConnectionThe IDbConnection interface is the standard mechanism that data providers use to control the use ofthe Connection object. These properties and methods help you make changes to the connectionsettings, open and close the connection, and associate the connection with a valid transaction. YourConnection object does not support transactions due to its read-only nature and because you areworking against a file system, which is not a resource manager.
C#public interface IDbConnection : IDisposable, IExtension{
IDbTransaction BeginTransaction();IDbCommand CreateCommand();void Open();void Close();string ConnectionString { get; set; }int ConnectionTimeout { get; }
}
VB.NETPublic Interface IDbConnection
Inherits IDisposable, IExtension Function BeginTransaction() As IDbTransactionFunction CreateCommand() As IDbCommandSub Open()Sub Close()Property ConnectionString() As StringProperty ConnectionTimeout() As Integer
End Interface
420
Chapter 12
ch68787_12.qxp 26/03/2004 3:56 PM Page 420
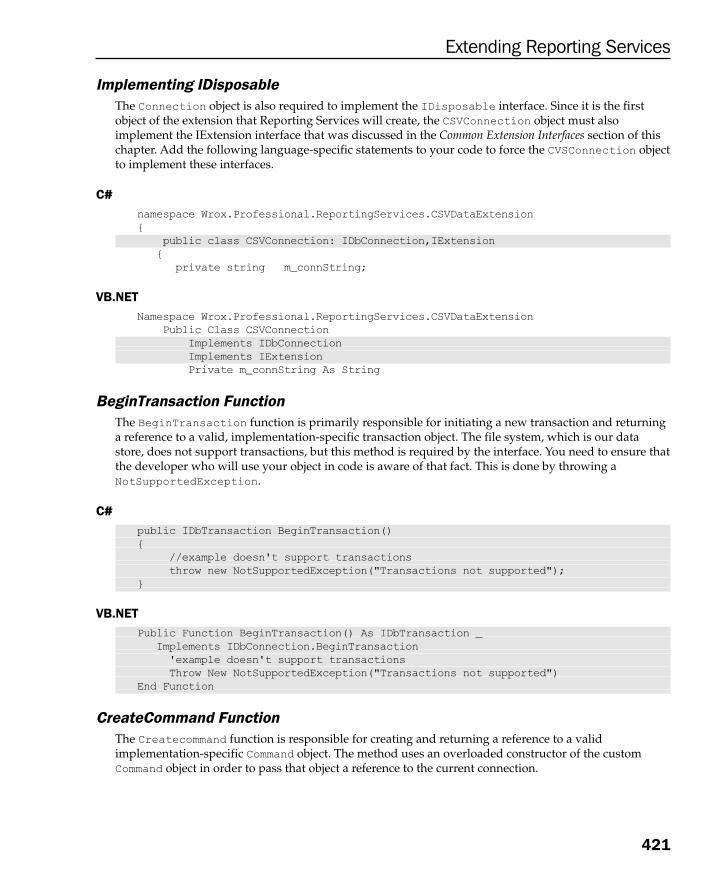
Implementing IDisposableThe Connection object is also required to implement the IDisposable interface. Since it is the firstobject of the extension that Reporting Services will create, the CSVConnection object must alsoimplement the IExtension interface that was discussed in the Common Extension Interfaces section of thischapter. Add the following language-specific statements to your code to force the CVSConnection objectto implement these interfaces.
C#namespace Wrox.Professional.ReportingServices.CSVDataExtension{
public class CSVConnection: IDbConnection,IExtension{
private string m_connString;
VB.NETNamespace Wrox.Professional.ReportingServices.CSVDataExtension
Public Class CSVConnectionImplements IDbConnectionImplements IExtensionPrivate m_connString As String
BeginTransaction FunctionThe BeginTransaction function is primarily responsible for initiating a new transaction and returninga reference to a valid, implementation-specific transaction object. The file system, which is our datastore, does not support transactions, but this method is required by the interface. You need to ensure thatthe developer who will use your object in code is aware of that fact. This is done by throwing aNotSupportedException.
C#public IDbTransaction BeginTransaction(){
//example doesn't support transactionsthrow new NotSupportedException("Transactions not supported");
}
VB.NETPublic Function BeginTransaction() As IDbTransaction _
Implements IDbConnection.BeginTransaction'example doesn't support transactionsThrow New NotSupportedException("Transactions not supported")
End Function
CreateCommand FunctionThe Createcommand function is responsible for creating and returning a reference to a validimplementation-specific Command object. The method uses an overloaded constructor of the customCommand object in order to pass that object a reference to the current connection.
421
Extending Reporting Services
ch68787_12.qxp 26/03/2004 3:56 PM Page 421

C#public IDbCommand CreateCommand(){
// Return a new instance of the implementation-specific command objectreturn new CSVCommand(this);
}
VB.NETPublic Function CreateCommand() As IDbCommand _
Implements IDbConnection.CreateCommand'Return a new instance of the implementation'specific command objectReturn New CSVCommand(Me)
End Function
Open MethodIn a full data provider implementation, the Open method is used to make a data source—specificconnection. Your implementation does not actually support connections, but you can trick ReportingServices into thinking that it does. You can do this by implementing the Open method and changing thevalue of the ConnectionState property to indicate that the connection is valid and open. The currentvalue of the connection state is stored inside a private variable called m_state, which you can change toindicate an open connection.
C#public void Open(){
// set the connection state to open and returnm_state = System.Data.ConnectionState.Open;return;
}
VB.NETPublic Sub Open() Implements IDbConnection.Open
' set the connection state to open and returnm_state = System.Data.ConnectionState.OpenReturn
End Sub
Close MethodThe Close method is used to close your data source—specific connection. You trick Reporting Servicesby creating the Close method and changing the value of the ConnectionState property to indicatethat the connection is closed. Your Close method is exactly the same as your Open method with theexception that it sets the value of m_state to closed to indicate that the connection was closedcorrectly.
C#public void Close(){
//set the connection state to close and return
422
Chapter 12
ch68787_12.qxp 26/03/2004 3:56 PM Page 422

m_state = System.Data.ConnectionState.Closed;return;
}
VB.NETPublic Sub Close() Implements IDbConnection.Close
' set the connection state to close and returnm_state = System.Data.ConnectionState.ClosedReturn
End Sub
ConnectionString PropertyThe ConnectionString property allows you to set the connection string through code. This property usesa private variable to store the current connection string, which is used to provide the information neededto connect to the data source. Most developers are familiar with this property because of its frequent usein both traditional ADO and ADO.NET. The ConnectionString property is used to indicate the file thatyou are going to parse. The user of your data processing extension should input the path to the file theywish to parse into the connection string. We are storing the connection string in the m_connStringprivate member variable .
C#public string ConnectionString{
Get {return m_connString;}Set {m_connString = value;}
}
VB.NETPublic Property ConnectionString() As String _
Implements IDbConnection.ConnectionStringGet
Return m_connStringEnd GetSet(ByVal Value As String)
m_connString = ValueEnd Set
End Property
ConnectionTimeout PropertyThe ConnectionTimeout property allows you to set the timeout property of the connection. This isused to control how long the interval for connecting to the source should be before an error is thrown.Your class does not actually use this value, but it is implemented for consistency and due to interfacerequirements. Returning a value of 0 indicates that there is an infinite timeout period.
C#public int ConnectionTimeout{
get{
// Returns the connection time-out value.
423
Extending Reporting Services
ch68787_12.qxp 26/03/2004 3:56 PM Page 423

// Zero indicates an indefinite time-out period.return 0;
}}
VB.NETPublic ReadOnly Property ConnectionTimeout() As Integer _
Implements IDbConnection.ConnectionTimeoutGet ' Returns the connection time-out value.
' Zero indicates an indefinite time-out period.Return 0
End GetEnd Property
Creating the CSVParameter ClassThe CSVParameter class is not needed until the Command class is created, but because of thatdependency you do need to create it. The Parameter object is used to send parameters to the Commandobject that can be used in executing commands against the data source. Despite the fact that this class isnot used to perform any work, the interface requirements of the Command class force you to create it.This class also has interface requirements; it is required to support the IDataParameter interface definedin the Reporting Services Data Processing Extension assembly.
To add the CSVParameter class to the project, choose Project | Add Class from the menu and change thename to CSVParameter.
DeclarationsThe following declarations are used internally to hold both the value and the name of the parameter. Thename is stored in a string variable called m_paramName. Because the value variable might contain anytype of value, the m_value is declared as an Object type.
C#String m_paramName;Object m_value;
VB.NETDim m_paramName As StringDim m_value As Object
Implementing IDataParameterThe IDataParameter interface enforces that your custom parameter class allow a programmer to getand set the name and value of the current parameter.
C#public interface IDataParameter{
string ParameterName { get; set; }
424
Chapter 12
ch68787_12.qxp 26/03/2004 3:56 PM Page 424

object Value { get; set; }}
VB.NETPublic Interface IDataParameter
Property ParameterName() As StringProperty Value() As Object
End Interface
Modify the class code to force the CSVParameter class to implement IDataParameter.
C#namespace Wrox.Professional.ReportingServices.CSVDataExtension{
public class CSVDataParameter : IDataParameter{
string m_paramName;
VB.NETNamespace Wrox.Professional.ReportingServices.CSVDataExtension
Public Class CSVDataParameterImplements IDataParameterDim m_paramName As String
ParameterName PropertyThe ParameterName property is used to store the name of the parameter in a string variable calledm_paramName. This field is typically used to map to parameters in stored procedures but is unused inyour implementation.
C#public String ParameterName {
get { return m_paramName; }set { m_paramName = value; }
}
VB.NETPublic Property ParameterName() As String _
Implements IDataParameter.ParameterNameGet
Return m_paramNameEnd GetSet(ByVal Value As String)
m_paramName = valueEnd Set
End Property
425
Extending Reporting Services
ch68787_12.qxp 26/03/2004 3:56 PM Page 425

Value PropertyThe Value property is similar to the name created earlier in that it is not actually used. The value isstored in an object variable called m_value.
C#public object Value {
get{
return m_value;}set{
m_value = value;}
}
VB.NETPublic Property Value() As Object _
Implements IDataParameter.ValueGet
Return m_valueEnd GetSet(ByVal Value As Object)
m_value = ValueEnd Set
End Property
Creating the CSVParameterCollection ClassThe CSVParameterCollection class is simply a collection of Parameter objects. Although you couldhave created a custom collection class that implements all of the required methods, an easier route exists.The IDataParameterCollection interface is basically a subset of the IList interface used to defineother objects in the .NET Framework. By using an object already available, you reduce the requiredcoding effort considerably.
To add the CSVParameterCollection class to the project, choose Project | Add Class from the menu.Change the name of the class to CSVParameterCollection.
There is no need to create custom constructors or member variables for use in your collection class. Thisis because you can use the internal variables and constructors that exist inside the ArrayList base classthat this class inherits from. The properties that you create will be mapped directly to properties andmethods that exist in the ArrayList class.
NamespacesThe CSVParameterCollection class uses the standard namespaces discussed earlier. There is anadditional namespace that is needed because of the use of ArrayList. You must add theSystem.Collections namespace.
426
Chapter 12
ch68787_12.qxp 26/03/2004 3:56 PM Page 426

C#using System;using Microsoft.ReportingServices.DataProcessing;using System.Collections;
VB.NETImports SystemImports Microsoft.ReportingServices.DataProcessingImports System.Collections
Implementing IDataParameterCollectionThe IDataParameterCollection interface defines a custom Add method as well as provides methodsto access the members of this collection through the IEnumerable interface. The ArrayList base classimplements this interface. Your class will use the parent class properties and methods to service itsneeds.
C#public interface IDataParameterCollection : IEnumerable{
int Add(IDataParameter parameter);}
VB.NETPublic Interface IDataParameterCollection
Inherits IEnumerableFunction Add(ByVal parameter As IDataParameter) As Integer
End Interface
You can modify the code to enforce the implementation of IDataParameterCollection as well as tobe able to gain the functionality inherited from the ArrayList class.
C#namespace Wrox.Professional.ReportingServices.CSVDataExtension{
public class CSVDataParameterCollection : ArrayList, IDataParameterCollection{
VB.NETNamespace Wrox.Professional.ReportingServices.CSVDataExtension
Public Class CSVDataParameterCollectionInherits ArrayListImplements IDataParameterCollection
Since most of the functionality of the CSVDataParameterCollection class exists in its parent class, allthat needs to be done is to create the custom Add method required by the IDataParameter interface.This method is used by the custom collection to add parameters to an instance of the Collection object.
427
Extending Reporting Services
ch68787_12.qxp 26/03/2004 3:56 PM Page 427

C#public int Add(IDataParameter value){
if (((CSVDataParameter)value).ParameterName != null){
return base.Add(value);}else
throw new ArgumentException("parameter must be named");}
VB.NETPublic Overloads Function Add(ByVal value As IDataParameter) As Integer _
Implements IDataParameterCollection.AddIf Not (CType(value, CSVDataParameter)).ParameterName Is Nothing Then
Return MyBase.Add(value)Else
Throw New ArgumentException("parameter must be named")End If
End Function
Creating the CSVCommand ClassThe Command object is responsible for sending commands to the data source. This is enforced by makingthe object implement the IDbCommand interface, which supplies a standard mechanism for passing incommands to be executed against the data source as well as parameters that might be needed in theprocess of executing these commands. It also defines a property that allows the developer to associatethe command with a transaction object. Your implementation is simplified in that it does not supporttransactions.
To add the CSVCommand class to the project, choose Project | Add Class from the menu. Change the nameof the class to CSVCommand. Then go on declaring some variables.
C#CSVConnection m_connection;String m_cmdText;
VB.NETDim m_connection As CSVConnectionDim m_cmdText As String
ConstructorsYou would want the users of your processing extension to be forced to create the Command object eitherthrough the CreateCommand method of the IDbConnection interface or by passing in a validCSVConnection object as a parameter. The purpose of this is to ensure that you have access to theconnection string that is needed to locate the CSV file you intend to parse. This can be accomplished bydeclaring the default constructor of your command object to be private. This prevents the developerfrom creating the CSVCommand object without the correct initialization.
428
Chapter 12
ch68787_12.qxp 26/03/2004 3:56 PM Page 428

C#private CSVCommand(){
//force creation of the object through the IDBCommand //interface or with a valid connection
}
public CSVCommand(CSVConnection connection){
//overloaded constructor to accept current Connection objectm_connection = connection;this.m_cmdText = this.m_connection.ConnectionString;
}
VB.NETPrivate Sub New()
End Sub
Public Sub New(ByVal connection As CSVConnection)'overloaded constructor to accept current connection objectm_connection = connectionMe.CommandText = Me.m_connection.ConnectionString
End Sub
Implementing IDbCommandThe required interface for all Command objects is called IDbCommand. It consists of methods that allow thedeveloper to pass commands and parameters to the Command object. The most interesting method of thisobject is the ExecuteReader method, which contains the object-specific code to read data from our CSVdata source.
C#public interface IDbCommand : IDisposable{
void Cancel();IDataReader ExecuteReader(CommandBehavior behavior);string CommandText { get; set; }int CommandTimeout { get; set; }CommandType CommandType { get; set; }IDataParameter CreateParameter();IDataParameterCollection Parameters { get; }IDbTransaction Transaction { get; set; }
}
VB.NETPublic Interface IDbCommand
Inherits IDisposableSub Cancel()Function ExecuteReader(ByVal behavior As CommandBehavior) As IDataReaderProperty CommandText() As String
429
Extending Reporting Services
ch68787_12.qxp 26/03/2004 3:56 PM Page 429

Property CommandTimeout() As IntegerProperty CommandType() As CommandTypeFunction CreateParameter() As IDataParameterProperty Parameters() As IDataParameterCollectionProperty Transaction() As IDbTransaction
End Interface
You need to add the following Implements statements to your code using language-specific syntax toforce the CVSCommand object to implement these interfaces.
C#namespace Wrox.Professional.ReportingServices.CSVDataExtension{
public class CSVCommand: IDbCommand{
CSVConnection m_connection;
VB.NETNamespace Wrox.Professional.ReportingServices.CSVDataExtension
Public Class CSVCommandImplements IDbCommandDim m_connection As CSVConnection
Cancel MethodThe Cancel method is typically used to cancel a method that has been queued. Most implementations ofdata providers are multi-threaded and support the issue of multiple commands against the data store.You have only created this method to support the IDbCommand interface requirements and shouldinform the developer of your lack of support by throwing a NotSupportedException.
C#public void Cancel(){
// not supportedthrow new NotSupportedException();
}
VB.NETPublic Sub Cancel()_
Implements IDbCommand.Cancel' Not supportedThrow New NotSupportedException
End Sub
ExecuteReader FunctionThe ExecuteReader method returns an extension-specific reader object to the caller so they may loopthrough and read the data. The CSVCommand object creates an instance of your custom reader object. Aninternal method is then executed passing in the m_cmdText variable that you filled from theCSVConnection.ConnectionString property. Your CSVReader implementation knows how to use
430
Chapter 12
ch68787_12.qxp 26/03/2004 3:56 PM Page 430

this information to gain a reference to the supplied CSV file. A reference to your custom data reader isthen returned.
C#public IDataReader ExecuteReader(){
//Verify a valid connnectionif (m_connection == null || m_connection.State !=
System.Data.ConnectionState.Open) throw new InvalidOperationException("Connection must be valid and
open.");// Execute the command and return a datareader
CSVDataReader reader = new CSVDataReader();reader.GetFile();// The getfile methods opens a stream to the file// specified in the command text
return reader;}
VB.NETPublic Function ExecuteReader() As IDataReader
'Verify a valid connnectionIf m_connection Is Nothing Or m_connection.State <>
System.Data.ConnectionState.Open ThenThrow New InvalidOperationException("Connection must be valid and
open.")End If'Execute the command and return a datareaderDim reader As CSVDataReader = New CSVDataReader()reader.GetFile(m_cmdText)'The getfile methods open a stream to the file'Specified in the command textReturn reader
End Function
CommandText PropertyReporting Services does not manually create a separate Command object. It uses the CreateCommandmethod of the IDBConnection interface to return an implementation-specific command object. Thisobject maps the ConnectionString property of the CSVConnection object to the CommandText of thecommand object to provide the path to the file that you are going to parse using your custom dataextension. Due to this, you do need not allow the programmer to change the CommandText propertyfrom code. You need to create this property as a read-only property, but are forced to make it read/writebased on interface requirements. Therefore, you need to create both the set and get methods, eventhough the set method is effectively empty, (it contains a NOOP operation).
C#public string CommandText{
//string used to specify the filepath
431
Extending Reporting Services
ch68787_12.qxp 26/03/2004 3:56 PM Page 431

get { return m_cmdText;}set {//NOOP}
}
VB.NETPublic Property CommandText() As String _
Implements IDbCommand.CommandTextGet
Return m_cmdTextEnd GetSet(ByVal Value As String)
'NOOPEnd Set
End Property
CommandTimeout PropertyThe CommandTimeout property is used to specify how long the Command object should wait for theresults of an executed command before throwing an exception. You do not actually use this value, but itmust be implemented due to interface requirements. You don't allow the developer to actually set thisvalue through code, but return the default value of 30 seconds.
C#public int CommandTimeout{
// Implemented the Property for consistency but it is not used.get {return 30;}set {//NOOP}
}
VB.NETPublic Property CommandTimeout() As Integer _
Implements IDbCommand.CommandTimeoutGet
Return 30End GetSet(ByVal Value As Integer)'NOOP
End SetEnd Property
CommandType Property Most data processing extensions allow the developer to pass in a command as text, or they can pass in afully initialized Command object for the Execute reader method to examine and use. The CSVCommandclass only accepts text, and any other type of will cause your component to throw a NotSupportedException.
C#public CommandType CommandType{
// supports only a text commandType
432
Chapter 12
ch68787_12.qxp 26/03/2004 3:56 PM Page 432

get {return CommandType.Text;}set {if (value != CommandType.Text) throw new NotSupportedException();}
}
VB.NETPublic Property CommandType() As CommandType _
Implements IDbCommand.CommandTypeGet
Return CommandType.TextEnd GetSet(ByVal Value As CommandType)
If Value <> CommandType.Text ThenThrow New NotSupportedException
End IfEnd Set
End Property
CreateParameter FunctionThe CreateParameter function returns an extension-specific parameter to the Command object. Themethod must be supported due to the interface requirements, even though it is not actually used. TheCSVParameter object is a simple class that implements another interface called IdataParameter,which allows it to be returned as an object of the interface type.
C#public IDataParameter CreateParameter(){
//return CSVDataParameterreturn new CSVDataParameter();
}
VB.NETPublic Function CreateParameter() As IDataParameter _
Implements IDbCommand.CreateParameterReturn New CSVDataParameter
End Function
Parameters PropertyThe Parameters property returns a collection that implements the IDataParameterCollectioninterface. Your custom collection class is the CSVParameterCollection and satisfies theserequirements. The Parameters property allows the developer to index into the Parameters collectionto set or get the parameter values.
C#IDataParameterCollection IDbCommand.Parameters{
//Indicate that our provider does not support parametersget {throw new NotSupportedException("Parameters not supported");}
}
433
Extending Reporting Services
ch68787_12.qxp 26/03/2004 3:56 PM Page 433

VB.NETPublic ReadOnly Property IDbCommandParameters() As IDataParameterCollection _
Implements IDbCommand.ParametersGet 'indicate that parameters are not supported
Throw New NotImplementedException("Parameters are not supported")End Get
End Property
Creating the DataReader ObjectThe data reader is the workhorse of your extension. Everything you have done to this point is to get toyour custom CVSDataReader object. The behavior of the data reader is enforced by the IDbDataReaderinterface, which supplies methods to indicate the number, names, and types of the fields that will beread. It also allows the object to actually access the data.
To add the CSVDataReader class to the project, choose Project | Add Class from the menu. Change thename of the class to CSVDataReader. After adding the class, add the custom namespace and edit theclass definition.
DeclarationsThe variables of the CSVDataReader hold of all the information that you will use to build the propertiessupported by the CSVDataReader class. The m_currentRow variable is used to store the value of thecurrent row as the data is being read from your CSV data file. The string array m_names contains thenames of the fields that will be read, while the m_types array provides access to the type of data thatwill be read. As the data is read, it will be loaded into an array of the object type called m_cols. Datafrom the file will be read by an internal StreamReader class called sr.
C#internal int m_currentRow;internal String[] m_names = {"Name","EmailAddress"};internal Type[] m_types = {typeof(String),typeof(String)};internal bject[] m_cols = new object[2];internal int m_fieldCount = 2;private StreamReader sr;
VB.NETFriend m_currentRow As IntegerFriend m_names() As String = {"Name", "EmailAddress"}Friend m_types() As Type = {Type.GetType("string"),Type.GetType("string")}Friend m_cols() As Object = New Object(2) {}Friend m_fieldCount As Integer = 2Private sr As StreamReader
Implementing IDbDataReaderThe IDbDataReader interface enforces consistency in working with data. It provides properties andmethods that allow you to examine the data and its types as well as the Read method that will actuallydo the dirty work.
434
Chapter 12
ch68787_12.qxp 26/03/2004 3:56 PM Page 434

C#public interface IDataReader : IDisposable{
Type GetFieldType(int fieldIndex);string GetName(int fieldIndex);int GetOrdinal(string fieldName);object GetValue(int fieldIndex);bool Read();int FieldCount {get;}
}
VB.NETPublic Interface IDataReader
Inherits IDisposableFunction GetFieldType(ByVal fieldIndex As Integer) As TypeFunction GetName(ByVal fieldIndex As Integer) As StringFunction GetOrdinal(ByVal fieldName As String) As IntegerFunction GetValue(ByVal fieldIndex As Integer) As ObjectFunction Read() As BooleanProperty FieldCount() As Integer
End Interface
You need to modify your class definition to force the custom CSVDataReader class to support theinterface requirements.
C#namespace Wrox.Professional.ReportingServices.CSVDataExtension{
public class CSVDataReader : IDataReader{
internal int m_currentRow;
VB.NETNamespace Wrox.Professional.ReportingServices.CSVDataExtension
Public Class CSVDataReaderImplements IDataReader
GetFieldType FunctionThis property returns the type of data at a particular position within the stream that is being read. Thisdata is used to allow the developer to store the data being read in the correct datatype upon retrievalfrom the data reader.
C#public Type GetFieldType(int i){
// Return the actual Type class for the data type.return m_types[i];
}
435
Extending Reporting Services
ch68787_12.qxp 26/03/2004 3:56 PM Page 435

VB.NETPublic Function GetFieldType(ByVal i As Integer) As Type _
Implements IDataReader.GetFieldType'Return the actual Type class for the data type.Return m_types(i)
End Function
GetName FunctionThe GetName method allows the developer to retrieve a data field from the DataReader object bypassing in the name of the field to be read.
C#public string GetName(int i){
Return m_names[i];}
VB.NETPublic Function GetName(ByVal i As Integer) As String _
Implements IDataReader.GetName' returns name of current columnReturn m_names(i)
End Function
GetOrdinal FunctionThe GetName method allows the developer to index data based on its position within the DataReaderstream.
C#public int GetOrdinal(string name){
// Look for the ordinal of the column with the same name and return it.// Returns -1 if not foundreturn Array.IndexOf(m_names, name);
}
VB.NETPublic Function GetOrdinal(ByVal name As String) As Integer _
Implements IDataReader.GetOrdinal' Look for the ordinal of the column with the same name and return it.' Returns -1 if not foundReturn Array.IndexOf(m_names, name)
End Function
GetValue FunctionThe GetValue function retrieves the actual value from the data stream. All of these methods aretypically used together. The developer pulls the type information from the stream, creates variables ofthe correct type to hold this data, and gets the values of the data using the GetValue function.
436
Chapter 12
ch68787_12.qxp 26/03/2004 3:56 PM Page 436

C#public Object GetValue(int i){
//returns column valuereturn m_cols[i];
}
VB.NETPublic Function GetValue(ByVal i As Integer) As Object _
Implements IDataReader.GetValue'returns column valueReturn m_cols(i)
End Function
Read MethodThe Read method is the workhorse of the CSVDataReader class. The function loops through the CSVdata line by line. As each line is read, it is split into individual data fields and placed into the m_colsobject collection based on the delimiter field delimStr. If a line is successfully read, this is indicated tothe user of your extension by incrementing the row count variable m_currentRow and by returning aBoolean value. As long as true is returned, data is successfully read. False is returned when theinternal StreamReader hits the end of the file.
C#public bool Read(){
//Implement the Methods to open the CSV Filestring line;string delimStr = ",";char [] delimiter = delimStr.ToCharArray();
while ((line = sr.ReadLine()) != null) {
m_currentRow++;m_cols = line.Split(delimiter);return true;
}return false;
}
VB.NETPublic Function Read() As Boolean _
Implements IDataReader.Read'Implement the Methods to open the CSV FileDim line As StringDim delimStr As String = ","Dim delimiter() As Char = delimStr.ToCharArray()Do
line = sr.ReadLineIf Not (line) Is Nothing Then
m_currentRow = m_currentRow + 1
437
Extending Reporting Services
ch68787_12.qxp 26/03/2004 3:56 PM Page 437

m_cols = line.Split(delimiter)Return True
ElseReturn False
End IfLoop
End Function
FieldCount PropertyThe FieldCount property returns the number of fields or columns available in each row of data that theRead method returns.
C#public int FieldCount{
// Return the count of the number of columns,get { return m_fieldCount; }
}
VB.NETPublic ReadOnly Property FieldCount() As Integer _
Implements IDataReader.FieldCountGet
Return m_fieldCountEnd Get
End Property
Installing the CSVDataProcessing ExtensionAfter creating your custom data processing extension, you must install it to enable access to it. Theinstallation process is actually pretty simple. Since your extension will be used by both the developerand Reporting Services, it requires installation in more than one location.
Reporting Services has a standard location where extensions should be installed. This location is asubdirectory below the installation directory of SQL Server itself. I will refer to the SQL Serverinstallation path as InstallPath. On my machine, this directory is C:\Program Files\MicrosoftSQL Server\MSSQL\.
The directory that you will install the extension into is the bin directory of the Report Server:InstallPath\ Reporting Services\ReportServer\bin. Copy your custom data processingextension assembly into this directory. The extension is now in the correct location, but we need toinform Reporting Services of its presence. This is done by editing the configuration file that ReportingServices uses for its settings. This file is called RSReportServer.config and is located in theInstallPath\ Reporting Services\ directory. Open this file and look for the <Data> section. Withinthis section, you should see entries similar to the following:
<Data><Permissions>
<PermissionSet class="System.Security.NamedPermissionSet" version="1"
438
Chapter 12
ch68787_12.qxp 26/03/2004 3:56 PM Page 438
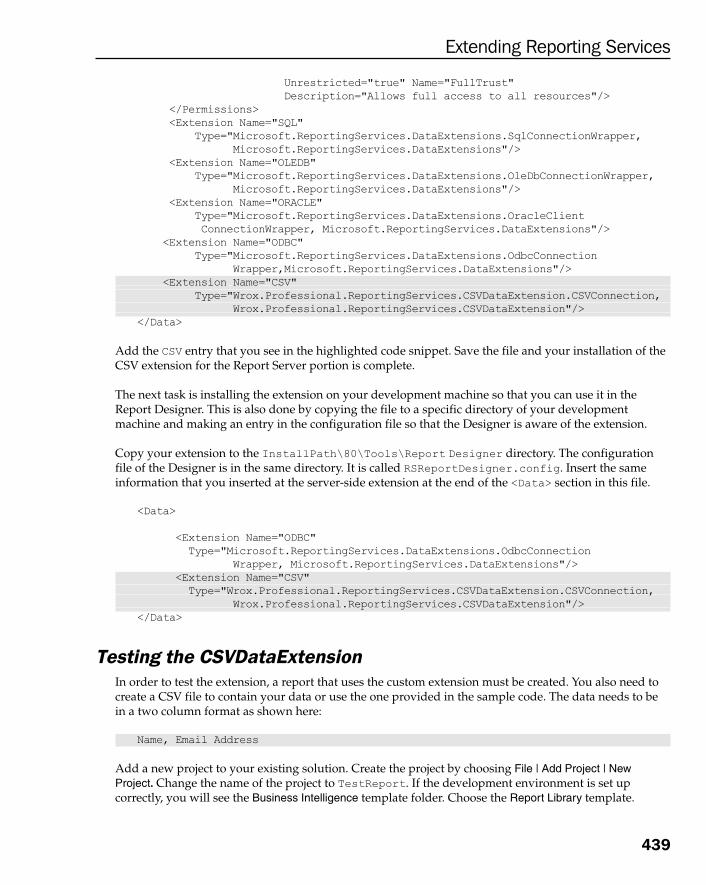
Unrestricted="true" Name="FullTrust" Description="Allows full access to all resources"/>
</Permissions><Extension Name="SQL"
Type="Microsoft.ReportingServices.DataExtensions.SqlConnectionWrapper,Microsoft.ReportingServices.DataExtensions"/>
<Extension Name="OLEDB" Type="Microsoft.ReportingServices.DataExtensions.OleDbConnectionWrapper,
Microsoft.ReportingServices.DataExtensions"/><Extension Name="ORACLE"
Type="Microsoft.ReportingServices.DataExtensions.OracleClientConnectionWrapper, Microsoft.ReportingServices.DataExtensions"/>
<Extension Name="ODBC"Type="Microsoft.ReportingServices.DataExtensions.OdbcConnection
Wrapper,Microsoft.ReportingServices.DataExtensions"/><Extension Name="CSV"
Type="Wrox.Professional.ReportingServices.CSVDataExtension.CSVConnection,Wrox.Professional.ReportingServices.CSVDataExtension"/>
</Data>
Add the CSV entry that you see in the highlighted code snippet. Save the file and your installation of theCSV extension for the Report Server portion is complete.
The next task is installing the extension on your development machine so that you can use it in theReport Designer. This is also done by copying the file to a specific directory of your developmentmachine and making an entry in the configuration file so that the Designer is aware of the extension.
Copy your extension to the InstallPath\80\Tools\Report Designer directory. The configurationfile of the Designer is in the same directory. It is called RSReportDesigner.config. Insert the sameinformation that you inserted at the server-side extension at the end of the <Data> section in this file.
<Data>
<Extension Name="ODBC" Type="Microsoft.ReportingServices.DataExtensions.OdbcConnection
Wrapper, Microsoft.ReportingServices.DataExtensions"/><Extension Name="CSV" Type="Wrox.Professional.ReportingServices.CSVDataExtension.CSVConnection,
Wrox.Professional.ReportingServices.CSVDataExtension"/></Data>
Testing the CSVDataExtensionIn order to test the extension, a report that uses the custom extension must be created. You also need tocreate a CSV file to contain your data or use the one provided in the sample code. The data needs to bein a two column format as shown here:
Name, Email Address
Add a new project to your existing solution. Create the project by choosing File | Add Project | NewProject. Change the name of the project to TestReport. If the development environment is set upcorrectly, you will see the Business Intelligence template folder. Choose the Report Library template.
439
Extending Reporting Services
ch68787_12.qxp 26/03/2004 3:56 PM Page 439

After the project has been created, you need to add a report. Add the report by selecting File | Add NewItem | Report. Change the name of the report to Roster. There is no dataset associated with the report.Create a new dataset by clicking on the drop-down list and select New Dataset as shown in Figure 12-3:
Figure 12-3
After the new dataset is created, the Data Source window will pop up. Edit the Name property displayedin the text box to something like CSVDataSource and select the CSV type. If the CSV type is notavailable, then review your installation of the extension. The result should look like the image shown inFigure 12-4:
Figure 12-4
Next, we must set up the security. Select the Credentials tab and ensure that Windows Integrated Security isselected as shown in Figure 12-5:
Figure 12-5
Select OK and now you can design the visual aspects of the report. Select the Toolbox tab of the tool boxwindow. Drag and drop a List Control onto the design surface. Next, select the Fields tab of the tool boxwindow. That should display the available field names for the report. There should be two fields: Nameand Email Address. Drag and drop the field names into the list box. The layout of the report should besimilar to that shown in Figure 12-6:
Figure 12-6
440
Chapter 12
ch68787_12.qxp 26/03/2004 3:56 PM Page 440

Now, select the Preview tab to view the results of your work. This should appear as shown in Figure 12-7.This view will depend on the data in the file that you use:
Figure 12-7
SummaryIn this section, we have learned about the extensibility options available in SQL Reporting Services andsome of the business opportunites created. Microsoft has created a flexible and powerful reportingsolution that allows us to modify its behavior by implementing the interfaces required by the particularextension type. This functionality is sure to create a third party market for tools as well as allow theenterprise developer to create custom solutions for the unque needs of their business.
We also discussed the data access methods used by the .NET Framework and specifically how to create acustom data processing extension to work with non-relational data. Our example is very simple anddoes not stand alone as an application, although it could be easily extended to provide additionalfunctionality, such as support for variable numbers of fields and field names. The primary purpose ofthe example in this chapter was to familiarize the reader with the requirements for creating andinstalling an extension. This type of extension was chosen because it is used on the server for reportprocessing and on the developer machine for report creation.
441
Extending Reporting Services
ch68787_12.qxp 26/03/2004 3:56 PM Page 441

ch68787_12.qxp 26/03/2004 3:56 PM Page 442

Deployment Strategies
It might seem that placing all the chapters about how to use Reporting Services before informationon how to design a solution and deploy it is a bit like putting the cart before the horse. We believethat this work should first provide you with details and training on what Reporting Services cando and how it can be accomplished. This should have revealed some horizons to you about whatyou might be able to accomplish with this tool. Now with all the knowledge and skills you haveacquired, we would like to provide some direction for your solution and how to deploy it.
We will be reviewing some information that has already been presented so that we can build onthat. By the time we finish you should have sufficient information to deploy a solution in a varietyof scenarios.
Architecture ReviewIn the following section, we will review the different architectural components of ReportingServices. Understanding the different components will help you understand how thosecomponents can be deployed. Let's start by reviewing each of the major functional areas ofReporting Services: the Report Server and Report Server database. The section will finish with alook at three different deployment scenarios: small, medium/large, and enterprise. You should beable to identify the appropriate deployment scenario for your organization.
Reporting Services ComponentsBefore we cover deployment, you need to take a look at each of the components of ReportingServices. Each component needs to be considered when deploying Reporting Services. Thecomponents to consider can be grouped into three categories:
❑ Interfaces to Reporting Services
❑ Report Server
131133
ch68787_13.qxp 26/03/2004 3:56 PM Page 443

Chapter 13
444
❑ Report Server database
The interfaces you will look at include Report Manager and client applications. Both will use theReporting Services Web Service to communicate with Reporting Services. With these items you will needto think about IIS deployment along with application authentication.
Deployment of the Report Server will affect processing of reports, scheduled execution, and connectionby clients. Here you will look at the major functions of Report Server and how they can be scaled outand up to handle larger volumes of data.
Finally, you'll look at the Report Server database. All metadata for Reporting Services is stored in twoSQL databases. Our major considerations here are how the Report Server connects to these twodatabases and how these databases can be scaled.
Report ManagerReport Manager is the primary tool for managing and configuring reports. You could break ReportManager into three main areas:
❑ Report organization
❑ Report management
❑ Site management
Report OrganizationIt is the ability to logically group reports into a hierarchical structure. Through the use of folders,Reporting Services users can organize reports based on their business requirements. Report folders giveyou the ability to set properties such as description and security. Careful consideration should be givento the logical organization of reports before starting with Reporting Services. Proper organization willensure that users can easily navigate folders to find reports as well as assist in setting up secure access todata.
Report ManagementAs the name implies, report management allows you to manage individual reports. You can setdescriptions of reports, manage parameter default values and prompts, manage report data sources, setexecutions properties, view report history, and set security on individual items. All of these areas arecrucial to successfully managing Reporting Services.
Site ManagementThe final area of report management is site management. From Report Manager, you can set various siteproperties as well as define site-level and item-level security roles. Site management really has to domainly with managing the Report Server itself. You can set information such as report executiontimeouts, shared schedules, and whether or not to enable logging. Some of these items can also be setthrough Reporting Services configuration files that will be covered in the Server Configuration Filessection later in this chapter.
Security is a major issue for any system. Reporting Services implements a role-based security model. Thismodel can be applied to both individual items such as reports and folders as well as the Report Manager
ch68787_13.qxp 26/03/2004 3:56 PM Page 444

site. Through Report Manager, system administrators can define site-level and item-level roles andmanage existing roles.
In order to prevent system lockouts, Reporting Services does not allow the BUILTIN\Administratorgroup to be removed from the system administrator role assignment. This means that any member ofBUILTIN\Administrators group will have the ability to change their security settings on individualreports. This should be taken into consideration when deciding which server to deploy ReportingServices to.
Report Manager is an ASP.NET application built on top of the Reporting Services Web Service. Why isthis important? Well, anything that Microsoft has done in the Report Manager, you can do in your owncode. If you don't like the management interface or simply want to build enhancements, you can do thatby calling the web service.
ClientsThe final components you'll look at in the architecture are Reporting Services clients. They are dividedinto two categories:
❑ Report Designer
❑ Report Consumer
Each component will need to interact with Reporting Services and be considered in your finaldeployment.
Report DesignerA Report Designer is any application that needs to publish report definitions to Reporting Services. Youwill need to use Microsoft's Designer in Visual Studio .NET for this discussion, although the sameprinciples would apply to any third party design tool.
Through the Reporting Services Web Service, designers can publish Report Definition Language (RDL)files. This process reads the report definition and stores it in the Report Server database. Whendeploying Reporting Services, you must ensure that report design tools are able to connect to theReporting Services Web Service.
Report ConsumerReport Consumers can come in just about any form. They could be ASP.NET web applications, WindowsForms applications, or just about anything that can consume web services. For this reason, it is muchmore difficult to generalize how every consumer will connect to Reporting Services.
The key point to remember is that the application must communicate with Reporting Services throughthe Reporting Services Web Service. For this reason, you will need a valid HTTP connection to theReport Server. You will also need to pass the user's credentials to the Report Server. Depending on yourapplication's design, this could come in numerous forms.
445
Deployment Strategies
ch68787_13.qxp 26/03/2004 3:56 PM Page 445

Consider a Report Consumer deployed over the Internet versus an Intranet. If you deploy yourconsumer over the Internet, you will have to find some way to pass authentication to Reporting Services.This could come through basic authentication over SSL, ASP.NET Forms authentication, or your owncustom security model. You will need to consider any consumer deployment of this type whenconfiguring Reporting Services.
Reporting Services Web ServiceThe Reporting Services Web Service is the main entry point into Reporting Services. Microsoft has takenall of the API calls for Reporting Services and created a platform independent interface using webservices. The Reporting Services Web Service relies on the .NET Framework and IIS for implementation.When you install Reporting Services, you will be required to have both of these components.
Because the interface to Reporting Services is hosted in IIS, you can take advantage of a number of itsfeatures. To scale applications, you have one of the two options:
❑ Scale up
❑ Scale out
Scale UpScaling up requires adding additional powerful hardware to an existing server to increase output. Thiscan be very handy for small deployments and is often a less expensive approach. Purchasing hardwarecan be cheaper than most software licenses.
Scale OutScaling out, on the other hand, means adding additional servers and then allowing them to worktogether to increase output. This option is the most robust but often requires additional softwarelicenses. Deployment of Reporting Services in a web farm configuration will be outlined later in thechapter.
The Reporting Services Web Service handles all communication with the Reporting Server. It allows forcross-platform independence and gives us a deployment option that both scales up and scales out.
Report ServerThe Report Server is the key component of Reporting Services. The Report Server component isresponsible for handling report processing, which includes data processing and rendering along withhandling security authorization, scheduled report execution, and delivery.
Report Server DatabasesTo perform all of its operations, Reporting Services must have a store for the services metadata. Thisincludes things such as user role assignments, report definitions and the Report Server's folderhierarchy.
446
Chapter 13
ch68787_13.qxp 26/03/2004 3:56 PM Page 446

Microsoft has decided to store this metadata in Microsoft SQL Server. SQL Server is a robust and well-established relational database management system (RDBMS). Storing data in SQL Server allowsReporting Services to take advantage of features such as transaction logging, data page caching, andsophisticated backup utilities.
Let's take a look at the two databases used by Reporting Services:
❑ ReportServer
❑ ReportServerTempDB
The use of these two databases is crucial to Reporting Services operation. It allows you to physicallyseparate the Report Server and its underlying metadata store.
ReportServerThe ReportServer database is the main metadata store for Reporting Services. This database containsall report definitions, data source definitions, schedules, security assignments, snapshots, and snapshothistory. In order for Reporting Services to function properly, it must be able to establish a connection tothis database.
The ReportServer can reside on either the same machine or a different machine than the installation ofReporting Services. This allows administrators to scale SQL Server resources separately from ReportServer resources. Later in the chapter, you will see how separating the Report Server from theunderlying metadata store can be used in larger deployments.
ReportServerTempDBThe ReportServerTempDB database is responsible for storing short-lived metadata such as the user'ssession cache and cached instances. This database is also crucial to the operation of Reporting Servicesand is installed on the same SQL Server as the ReportServer database.
Because the information in this database is temporary, it is not necessary to perform regular backups.Backup strategies will be discussed later in the chapter.
Reporting Services Components IllustratedFigure 13-1 is a diagram of the Reporting Services components. When looking at the diagram, youshould be aware of the different physical components involved. The two major components include theReport Server and ReportServer database. Later in the chapter, you will see how these components canbe separated to meet large scale reporting needs.
447
Deployment Strategies
ch68787_13.qxp 26/03/2004 3:56 PM Page 447

Figure 13-1
Reporting Services Deployment ScenariosNow that you have reviewed the components of Reporting Services, let's take a look at differentdeployment scenarios. The deployment scenarios are broken down into different size categories. Youwill first look at small deployments. These deployments would consist of single-server setups forsmaller user groups. Then you will look at medium to large deployments. In this scenario, you'll look atseparating the report processing and Report Server metadata. Finally, you will go over enterprise sizedeployments. Here you will see how Reporting Services can be scaled out using multiple web servers tohandle report processing.
In this section, we will illustrate how Reporting Services can be scaled out by adding more servers. Incertain scenarios, you might want to consider scaling up Reporting Services. By scaling up you are
448
Chapter 13
ch68787_13.qxp 26/03/2004 3:56 PM Page 448

adding additional resources to the current server instead of adding additional servers. This option doesnot afford as much scalability as additional machines but can save considerable amount of money onlicensing and maintenance.
Small DeploymentFor a small deployment of Reporting Services, it is acceptable to place both the Report Server andReportServer, database on one machine. This allows you to take advantage of an existing SQL Serverlicense. If a machine already has SQL Server 2000 installed, you can install Reporting Services on thatsame machine with no additional licensing costs. A single server deployment is most commonly used indepartmental type reporting scenarios. This setup can easily support a user base of up to 50 users.
While installing Reporting Services, you need to specify the local SQL Server as the location for theReportServer and ReportServerTempDB. This server must be running IIS, SQL Server 2003 (SP3a)and the .NET Framework. The installation will also install the Report Manager application along withthe Reporting Services Web Service. You will also need to specify an SMTP server when sending emailsubscriptions.
Let's take a look at the deployment of Reporting Services on a single server. Figure 13-2 shows thevarious components of Reporting Services (clients, Report Manager, Reporting Service, and ReportingService database):
Figure 13-2
449
Deployment Strategies
ch68787_13.qxp 26/03/2004 3:56 PM Page 449

Medium/Large DeploymentThe next type of deployment scenario you might consider is a medium to large-scale deployment. Thisdeployment would be suitable for supporting the reporting needs of a small organization, or takingadvantage of existing SQL Server resources.
In this scenario, Reporting Services is installed on one server containing IIS and the .NET Framework.During the installation, you can point to a remote server to house the ReportServer andReportServerTempDB database. The installation server will contain the Report Manager, ReportServices Web Service, and Report Server.
The advantage to this architecture is the separation of report processing and metadata processing.Multiple machines allows for allocating different resources for the two separate tasks. There are,however, a couple of disadvantages to this setup. First, there will be increased network traffic betweenthe two servers. Installing additional or gigabit network adapters can overcome some of this. The seconddisadvantage is licensing; when you install Reporting Services on a separate machine, you will berequired to have SQL licenses for both. Be sure to check the Microsoft web site for specific licensingdetails.
Figure 13-3 illustrates deploying Reporting Services on multiple servers:
Figure 13-3
450
Chapter 13
ch68787_13.qxp 26/03/2004 3:56 PM Page 450

Enterprise DeploymentOne key feature of Reporting Services is its ability to scale out for an enterprise environment. Its web-based interface along with its integration with SQL Server allow for large-scale deployments.
In an enterprise deployment, you will start out by installing Reporting Services on one server containingIIS and the .NET Framework. During installation, the Report Server database should be installed on aremote SQL Server. For each additional machine, you need to install Reporting Services again and pointits database to the shared SQL Server. Once all of the machines have been configured, you can useproduction scaling and clustering tools such as Microsoft Application Center, to maintain the web farmenvironment. You can also take advantage of Network Load Balancing to improve the performance ofSQL Server.
This scenario takes advantage of available Microsoft technologies as well as multiple machines. Theupside is that processing power can now be distributed among numerous machines. However, the setupand maintenance of a web farm environment will take considerably more resources. You will also haveto pay additional licensing fees for each installation of SQL Server and Reporting Services.
Figure 13-4 illustrates a web farm deployment with three web servers and two SQL Servers:
Figure 13-4
451
Deployment Strategies
ch68787_13.qxp 26/03/2004 3:57 PM Page 451

System Requirements and PrerequisitesBefore deploying Reporting Services, there are some configuration aspects that need to be consideredand some key decisions made.
A Report Server installation consists of the following:
❑ A web server that hosts the server-side components, usually Microsoft IIS
❑ An instance of SQL Server to host the database on which Report Services is built
❑ User accounts with the necessary security permissions to create the database on the SQL Serverinstance that will be hosting the Reporting Services database
❑ An SMTP server that will deliver reports via email
The prerequisites for each of these components are given in the following table. These elements arerequired for the setup to run successfully.
Server RequirementsOperating system requirements for the server components are shown in the following table:
Operating System Operating System-Specific Requirements
Windows 2000 Server with Service Pack 4 (SP4) or later
Windows 2000 Advanced Server with SP4 or later
Windows 2000 Datacenter Server with SP4 or later
Internet Information Services 5.0
SQL Server 2000a with Service Pack 3a
SQL Server Agent
Windows XP Professional with Service Pack 1 or later
Internet Information Services 5.0
SQL Server 2000a with Service Pack 3a
SQL Server Agent
Component System Requirements
Report Server IIS 5.0 or higher web server; ASP.NET
Report Manager IIS 5.0 or higher web server; ASP.NET
Report Server database Instance SQL Server 2000 SP3
Report Designer Workstation with any edition of Visual Studio .NET 2003
452
Chapter 13
ch68787_13.qxp 26/03/2004 3:57 PM Page 452

Prior to running setup, both Report Server and Report Manager require IIS to be installed and running.When running the Reporting Services installation, a number of components will need to be updated forthe installation to run correctly. The following components may be updated:
❑ Windows Installer 2.0
❑ Windows .NET Framework version 1.1
❑ Microsoft SQL Server 2000 Reporting Services setup support files
By the yard stick of the hardware currently available in the market place today, the hardwarerequirements for a Report Server installation are very ordinary. Minimum hardware requirements areshown in the following table:
It cannot be emphasized enough that these represent minimum requirements. These requirements areadequate for a development environment or even a small installation with a limited number of users.However as the number of users of the system increases, a minimalist system can become bogged down.
In my experience, all of the Windows server operating systems outlined in the earlier table performbetter with more memory. "More is always better" may indeed be true when discussing server RAM. Assome vendors sell systems based on 2 GHz processors for less than $300 (without monitor), it wouldmake sense for a production system to use a processor substantially more powerful than a 500 MHz.
Component Hardware Requirement
Processor 500 MHz Pentium II – class processor required,600-MHz Pentium III (or higher) – class processor recommended
Memory 256 MB minimum for server components, 512 MB recommended
Hard Disk 100 MB on the installation drive
Once installed, these components cannot be rolled back or uninstalled.
Operating System Operating System-Specific Requirements
Windows Server 2003, Standard Edition
Windows Server 2003, Enterprise Edition
Windows Server 2003, Datacenter Edition
Computer configured as an application server
ASP.NET
SQL Server 2000a with Service Pack 3a
SQL Server Agent
453
Deployment Strategies
ch68787_13.qxp 26/03/2004 3:57 PM Page 453

LicensesReporting Services is licensed as a component of SQL Server 2000. A valid SQL Server license is requiredfor each machine on which Reporting Services or any of its components are installed. If your installationuses a web farm to deliver reports, each server in the farm will need a license, even though SQL Serveritself may not be installed on these machines.
Report Server DatabaseAll folders, report definitions, data sources, subscriptions, metadata, and so on are stored in a SQLServer relational database. The setup process installs and configures the database on a machine alreadyrunning an instance of SQL Server 2000. The instance of SQL Server can be on the local machine or aremote instance. Installing multiple instances of Reporting Services on a single server is not supported.
.NET Framework RequirementBoth Report Server and Report Manager require Microsoft .NET Framework version 1.1. If the .NETFramework version 1.1 is not installed, the setup process for Reporting Services will install it. The setupprocess will also register ASP.NET in IIS if it has not already been registered.
Configuring Windows Server 2003 Application ServerAs a security measure, Windows Server 2003 is installed with nearly all services turned off. To configurea Windows Server 2003 machine in preparation for installing Reporting Services, the server must beconfigured as an IIS application server and have ASP.NET enabled. This is done using the Configure YourServer Wizard or from the Add / Remove Programs tool in the control panel as in Figure 13-5.
To configure the application server using the wizard, start the wizard. If you are shown an informationscreen, click Next. Select Application server as shown in Figure 13-5 and click Next:
To install Reporting Services on Windows Server 2003 you must manually enableASP.NET.
The Reporting Services database can only be installed on Developer, Standard, andEnterprise editions of SQL Server 2000. It cannot be installed on the Personal edition(also known as MSDE).
454
Chapter 13
ch68787_13.qxp 26/03/2004 3:57 PM Page 454

Figure 13-5
On page 2 of the wizard, be sure to check the checkbox marked Enable ASP.NET as shown in Figure 13-6:
Figure 13-6
If you use the Add / Remove Programs tool in the Control Panel to configure your server, after starting thetool, click on the large button on the left labeled Add/Remove Windows Components as shown in Figure 13-7:
Figure 13-7
455
Deployment Strategies
ch68787_13.qxp 26/03/2004 3:57 PM Page 455

The Windows Components Wizard will then be displayed. Check the Application Server checkbox and thenclick the Details button as in Figure 13-8:
Figure 13-8
Be sure to check the ASP.NET checkbox as in Figure 13-9. Click the OK button to close the ApplicationServer details dialog box. Finally click the Next button on the Windows Components Wizard to perform thesetup.
Figure 13-9
After IIS and ASP.NET have been configured, your server is ready to install Reporting Services. Theserver that is to host the SQL Server database must, of course, have SQL Server installed before theReporting Services database can be installed.
Client RequirementsConsumers of Reporting Services reports generally view the output and manage the server through aweb browser. There are no operating system requirements for users to view published reports. The onlyrequirement is that the client workstation must have a browser that supports HTML 3.2.
Internet Explorer 6.0 with Service Pack 1 is required for client workstations that will access and managea report server using Report Manager. Additionally, scripting must be enabled when using Report
456
Chapter 13
ch68787_13.qxp 26/03/2004 3:57 PM Page 456

Manager. To enable scripting, you need to click on Tools in the Internet Explorer window and selectInternet Options. Then click on the Security tab and then on the Custom Level button. Scroll down toScripting settings and enable the Active scripting option.
Report Designer RequirementsThe Report Designer will run on any version of the following operating systems as long as all thecurrent service packs have been applied:
❑ Windows 2000
❑ Windows XP
❑ Windows Server 2003
The tool requires Microsoft Visual Studio .NET 2003. Any edition of Visual Studio .NET 2003 can be usedfor designing reports. However, Visual Studio .NET 2002 cannot be used for designing reports. Fordeveloping applications that consume the Reporting Services Web Service, either Visual Studio .NET2002 or Visual Studio .NET 2003 can be used.
If reports are to be rendered into formats other than HTML, such as PDF or XLS, appropriate softwaretools (Adobe Acrobat Reader or Excel) will be required for viewing the output.
Accounts and CredentialsWhile running the Reporting Services setup, a number of pages will prompt you for credentials. Beforeyou run setup, this is a good time to understand what credentials are required and why.
Reporting Services components need credentials for:
❑ The ReportServer service needs a credential to operate as a Windows Service.
❑ The Report Server machine must connect to the Report Server SQL Server database at runtime,as this is where all information about any item is stored.
❑ A computer being added to a web farm must have credentials to connect to a report server thatalready exists in a web farm.
InstallationThe user running setup on a server must be a member of the Administrators group on the targetinstallation system. One of the first screens encountered during the install asks you to select accountunder which the Windows service will run.
While running setup, a credential must be provided to the SQL Server that has permissions to:
❑ Create the Report Server database
❑ Create logins
❑ Create roles
❑ Assign permissions to users
457
Deployment Strategies
ch68787_13.qxp 26/03/2004 3:57 PM Page 457

This set of installation credentials can use either SQL Server Authentication or Windows Authentication.If it is undesirable for the user running setup to use their own credentials, then the command line setuputility should be used where alternative credentials can be entered.
As all these credentials can be a bit confusing, so let's spend some time on the details of these accounts inthe installation walkthrough.
Ongoing OperationsFor operating Reporting Services after installation has completed successfully, the Report Server willneed to be in the database owner role for the ReportServer database and have local systemadministrator privileges to start the Report Server Windows service. This account can be a local systemaccount or a Windows domain account. While using a local account, remember that the account must bea member of the local system administrators group.
Installation and ConfigurationBy far the easiest method of installing Reporting Services is to use the GUI setup program. The setupprogram includes a wizard for specifying installation options. Setup prompts for login credentials,virtual directory names, and other information depending on the components selected for installation.
All components are installed locally with the exception of the ReportServer database. The databasecan be installed either on a local or remote SQL Server instance. The installation can install allcomponents or specific components selected at the start of the process. By far the simplest installation isto install all the components on a single system.
It is also possible to install Reporting Services from a command prompt. For devout adherents to thecommand line interface, refer to the setup help file. The help file also provides a great deal of detail onusing the wizard and the choices that need to be made during the installation.
Running SetupBefore running setup, an important item should be checked. The Distributed Transaction Coordinator(DTC) service is required for setup to complete successfully. Before running setup, use the Services toolin the Control Panel to make sure that the service is installed and that its Startup type is set to Automaticor Manual. Setup will fail if the DTC service is disabled.
Let's go through the setup wizard in detail. Start the installation process by double clicking onsetup.exe or by inserting the product CD into your CD drive and selecting the option to installReporting Services. After you agree to the license for the product some support files will be installed onyour machine to allow setup to run. If you cancel or abort the setup process the support files will not beuninstalled. Once the support files have been installed successfully click the Next button.
The next step is to evaluate your system and make sure that the prerequisites are installed. These arethings like .NET Framework 1.1 and ASP.NET; the process will also look for the existence of VisualStudio .NET 2003 to determine if the design tools can be installed on your machine. Once your machinehas passed the prerequisites check, click the Next button.
458
Chapter 13
ch68787_13.qxp 26/03/2004 3:57 PM Page 458

You now finally come to the start screen for the install wizard. Click the Next button. Fill out theregistration information so you can get to where you actually have to make some decisions as in Figure 13-10:
Figure 13-10
This is the screen where you indicate which parts of Reporting Services you want to have installed onthe target machine. If the prerequisite check found that Visual Studio .NET 2003 is installed on yourmachine, then the option to install the Report Designer will be shown. Otherwise this screen will givethe option to install the server components, administrative tools, and documentation. For yourwalkthrough, it does not matter if you choose to install the Report Designer. You will be focusing on theserver component installation.
The samples and the AdventureWorks database are good tools to explore the capabilities of ReportingServices. However, some database administrators view sample or demonstration databases on aproduction server as a potential security problem. Installation of these samples will likely depend onyour security policies and the intended use of this Reporting Services installation.
Figure 13-11
459
Deployment Strategies
ch68787_13.qxp 26/03/2004 3:57 PM Page 459

This page of the wizard, as shown in Figure 13-11, determines under which account the Windowsservice will run. The choices are for a built-in system account or a Windows domain account. Undermost circumstances, you will want to run the service using a built-in account. For Windows 2000 and XP,this will be the local system account. For Windows Server, you have the choice of using the local systemaccount or the NT AUTHORITY\NETWORK SERVICE account. If you choose to use a domain user accountto run the service, make sure that the account has permissions to logon as a service. It is recommendedthat you use the local system account for Windows 2000 and XP and that the NETWORK SERVICEaccount be used for Windows Server 2003. The Auto-start the service check box should be checked.
The names of the virtual directories are not important, but they can be specified to be somethingdifferent from the default values. The two checkboxes on the form are of some interest.
If you are setting up a server the primary function of which will be to deliver Reporting Services reports,you may want to make the default web page for the server be the local Report Manager virtual directory.To do this, check the box labeled Redirect the default Web site. This will cause the Report Managerapplication to come up by using only the machine name in the URL of a browser.
If you are setting up Reporting Services to be exposed to the Internet you may want to use Secure SocketsLayer (SSL) connections to the web service and Report Manager. This will ensure that any informationsent over the Internet to the server will be encrypted for security as in Figure 13-12:
Figure 13-12
You then come to the database settings as shown in Figure 13-13. The settings on this page determinewhether the configuration will be on a single server or multiple servers as part of the configuration.
460
Chapter 13
ch68787_13.qxp 26/03/2004 3:57 PM Page 460

Figure 13-13
SQL Server InstanceIf SQL Server has already been installed on the machine the default value here will be the name of thedefault SQL Server instance on your machine. If SQL Server has not been installed on the machine, youwill need to give the name of a SQL Server instance on another machine. Choosing an instance on adifferent machine is necessary if you want keep the web service and the database separate or if you wantto install the service on a web farm.
Database NameThe default name of the database is ReportServer, however, any valid SQL Server database name canbe used. The name chosen for the database must be unique on the server where the database is to beinstalled.
Database CredentialFor this credential, you can specify a Windows domain account, a SQL Server login, or a service account.Any of the three account types can be used, but some thought and care should go into the selection ofthe account. The credential specified must have permission to create the database if it does not exist. Ifyou are using an existing database on a different server, this account must have database ownerpermission to the ReportServer and ReportServerTempDB databases. If your SQL Server 2000database server is a Windows Server 2003 machine, Reporting Services must use SQL Serverauthentication to connect to the ReportServer database. If Windows authentication is used for aWindows Server 2003 database server, schedules and subscriptions will fail with an internal error(rsInternalError).
461
Deployment Strategies
ch68787_13.qxp 26/03/2004 3:57 PM Page 461

Finishing the SetupThe next step is to specify the email server name and the From address to be used for reports that aresent to users via email. These are less critical to the operation of Reporting Services except when it comesto the push delivery of reports. Be sure to use a valid server and address.The last step before the processactually starts is to specify the license model and number of licenses. This is identical to SQL Serverlicensing and in fact is just a duplicate of your SQL Server license. You should use the same licensemodel as your database server.
With any luck, the process will run to completion and announce that it was successful.
Scaling Up Reporting ServicesTo configure a multi-server Reporting Services environment or an enterprise-size web farm of ReportServers, the same setup procedure is used. The only difference comes at the database configuration page.If you enter the name of a SQL Server instance that is not on the local machine, the wizard pageimmediately after the database setup will be shown as in Figure 13-14:
Figure 13-14
This page is used for all of the scaled up installations that separate the web server from the databaseserver.
Report ServerThe name of a computer in a Windows domain must be specified here. If this is the first server that willbe running the web service only, you should enter the name of the machine on which you are runningthe setup program. If you have already installed a report server and want to add another server to the
462
Chapter 13
ch68787_13.qxp 26/03/2004 3:57 PM Page 462

farm, then you should specify the name of a server that already is a member of the farm. All thecomputers that make up a web farm must be in the same domain or in a trusted domain.
CredentialsThe credential must be a Windows domain account with permission to administer the Report Server onthe web farm. This account should be a member of local administrators group on the machines in thefarm. This is simplified greatly if the account is a member of the domain administrators group.
Carefully choose the account you want to use here. This credential is not saved; it is only used for theinstallation process. If you select an account with insufficient permissions, the process will fail.
Server Configuration FilesReporting Services installs the following files that contain configuration settings for the Report ServerWeb Service, Report Manager Web application, Reporting Services service, and Report Designer at thelocations described in the following table:
The .config files are XML files that can be edited with any XML editor. They are contained in thephysical directories where the web application and the web service are installed. The most interesting ofthe files is RSReportServer.config.
RSReportServer.config contains information such as data connection strings, which are encryptedfor security reasons, values for SQL Server Agent jobs, and extensions that contains properties to controlthe Report Server.
Configuration File Default Install Location
RSReportServer.config Program Files\Microsoft SQLServer\MSSQL\ReportingServices\ReportServer
RSWebApplication.config Program Files\Microsoft SQLServer\MSSQL\ReportingServices\ReportManager
ReportingServicesService.exe.config Program Files\Microsoft SQLServer\MSSQL\ReportingServices\ReportServer\bin
RSReportDesigner.config Program Files\Microsoft SQLServer\80\Tools\Report Designer
463
Deployment Strategies
ch68787_13.qxp 26/03/2004 3:57 PM Page 463

These extensions can be modified and customized by programming the web service. The detailed formatof the RSReportServer.config file is detailed in Books Online.
The other configuration files take care of the other areas of Reporting Services.RSWebApplication.config contains settings for the Report Manager interface.ReportingServicesService.exe.config has information pertaining to the Reporting ServicesWindows services. Most importantly, this file contains information for configuring the level of tracingperformed by the service. The final configuration file, RSReportDesigner.config, contains settingsthat are used by Visual Studio .NET. These settings are similar to those found inRSReportServer.config. In the next section, you'll look at working with theRSReportServer.config file.
Configuring Using the Command Line UtilitySince RSReportServer.config is an XML file, it can be edited by any text editor. However, the dataconnection information is encrypted for security reasons. In order to modify encrypted information, acommand line tool, rsconfig, which comes with Reporting Services must be used. If the databaseconnection information for the web service must be modified, Reporting Services could be uninstalledand re-installed. However using rs.config to change the connection information is a much faster andless complicated solution.
The syntax for rs.config is as follows:
rsconfig -s YourSQLServer -m YourComputerName -d ReportServerDatabaseName -a SQL -u YourUserName -p YourPassword
The parameters for rs.config are as follows:
❑ -m computername: The name of the computer on which the report server is installed. This isoptional unless you are managing a remote computer.
❑ -s servername: The name of the SQL Server instance on which the Report Server database isinstalled. Optional if the instance is on a local computer. The default value is the default SQLServer instance installed on the computer that is specified by the computername argument.
❑ -d databasename: The name of the Report Server database.
Extension Properties
Data processing extension Child elements in the Data element
Rendering extension Child elements in the Render element
Delivery extension Child elements in the Delivery element
Delivery UI extension Child elements in the Delivery UI element
Event processing extension Child elements in the EventProcessing element
464
Chapter 13
ch68787_13.qxp 26/03/2004 3:57 PM Page 464

❑ -a authorization method: Allowable values are windows or sql. Use windows to specify thatthe Report Server should use Windows credentials when connecting to the Report Serverdatabase. Use sql to specify that the report server should use SQL Server credentials whenconnecting to the Report Server database.
❑ -u [domain\]username: Specifies a user name. The value is case sensitive if you are usingWindows Authentication.
❑ -p password: Specifies the password to use with the username argument. You can set thisargument to a blank value if the account does not require a password.
A more detailed explanation of the parameters for rsconfig.exe is found in Books Online.
Administrative IssuesIn this section, you will take a look at common administrative issues in Reporting Services. Let's start byidentifying disk space requirements for the Report Server database. Then we can move on to backup andrestore of the Report Server database along with the Report Server encryption key. You'll look at securityadministration and demonstrate some of the common security tasks. Finally, you'll look at performancemonitoring and administration of Reporting Services log files.
Database Space RequirementsThere is no set formula for calculating how much disk space Reporting Services will consume. However,you will learn those factors that will significantly increase disk space along with the database tables thatshould be monitored closely.
To understand how Reporting Services consumes disk space, you have to look back at some conceptsdemonstrated earlier in the book. The major area you need to consider is report caching. When ReportingServices caches reports, it caches both the report definition and data. This is why it is difficult todefinitively state how much disk space Reporting Services will consume. It is partly based on thenumber of reports that are cached and the size of data returned in those reports. Following is a list offactors that will contribute to increased disk space:
❑ Total number of reports
❑ Total number of active sessions
❑ Number of report cached instances
❑ Length of time reports are cached
❑ Total number of report snapshots
❑ Total number of report snapshots in history
❑ Amount of report data returned in individual reports
All of these factors will have a considerable impact on the size of the Report Server database. To monitorthis size, there are a couple of key tables to monitor. First, you should watch the size of the Catalogtable in the ReportServer database. This table contains all report definitions. The more the reportdefinitions, the larger the size of this table.
465
Deployment Strategies
ch68787_13.qxp 26/03/2004 3:57 PM Page 465

The second and most important table to monitor is the ChunkData table. You will find this table in boththe ReportServer and ReportServerTempDB databases. In the ReportServer database, theChunkData table contains all report snapshots. So, the number of report snapshots along with the size ofdata in the snapshots will affect this table. The ChunkData table in the ReportServerTempDB containsall temporary cache information. This includes individual session cache data and report cachedinstances. The size of this table will increase with more active connections and long expire times oncached instances. You can monitor the size of these tables through the task pad in SQL Server EnterpriseManager.
Backup and RestoreThe key effectively manage to any system is to take proper backup of application data. There are twoitems that need to be backed up to ensure proper disaster recovery of Reporting Services. First you willlook at the backup of the ReportServer database. Then we will discuss how Reporting Services usesencryption keys and why these keys need to be backed up.
Report Server Database BackupWe have discussed in this chapter that the metadata store for Reporting Services lies in Microsoft SQLServer. The backup utilities in SQL Server can be used to backup both the ReportServer andReportServerTempDB database. However, it is not necessary to backup both databases.
Again, you need to recognize what data is stored in each of the two Report Server databases. TheReportServer database contains crucial information that must be backed up. It contains all of thereport definitions, security role assignments, and report snapshots. ReportServerTempDB is less crucialto backup. It contains temporary information such as session caches and cached instances. If thedatabase were to fail, the information in ReportServerTempDB would be restored as soon as operationsbegan again. However, if you had set up a specific schedule that populated cached instances, such asscheduling delivery to the null provider, you would want to back this database up.
Encryption Key BackupThere are a number of items stored securely in each Report Server instance. This includes connectioninformation, credentials, and server accounts. This information is encrypted using an encryption keythat is created when Reporting Services is installed. There are a number of scenarios where you mightneed to reinstall Reporting Services. If you reinstall Reporting Services, you will need to also restore thisencryption key. If it is not restored, data stored in the ReportServer database will not be propertyretrieved.
After Reporting Services is installed, you should backup the encryption key. Microsoft has supplied autility called rskeymgmt that will copy the encryption key to the file system. This utility will also allowyou to remove any encrypted information in case your encryption key cannot be restored.
To backup the encryption key, you will have to use the following command line switches:
❑ -e: Does not take a value and tells the utility to extract the encryption key
❑ -f: Specifies where on the file system to store the encryption key
❑ –p: Specifies a password to be associated with the key file
This password will be needed later when restoring the encryption key file. Let's take a quick look atbacking up the Report Server key. See Figure 13-15:
466
Chapter 13
ch68787_13.qxp 26/03/2004 3:57 PM Page 466

Figure 13-15
You can see that the encryption key has been backed up to the file system. This file can then be moved toanother media for safe storage.
To restore the encryption key, you will use the rs.keymgmt utility. With the restore, you will use the –fand –p switch as shown earlier, but instead of specifying the extract key, here you will specify the –a(apply) key. Figure 13-16 shows a screenshot of restoring the encryption key:
Figure 13-16
Use the following command line to reactivate a local copy of report server:
rsactivate –c "C:\Program Files\Microsoft SQL Server\MSSQL\Reporting Services\ReportServer\RSReportServer.config" –r
Security AdministrationReporting Services uses a role-based security model. This model combines Windows NT users andgroups and Reporting Services roles to set security on a securable object. In this section, you will look atthe different types of securable objects, the predefined roles for each, and creating role assignments.
In Reporting Services, there are two different types of securable objects:
❑ Report Server site
❑ Report Server items
Report Server SiteWhen defining roles for the Report Server site, you are defining how users can work with andadminister Reporting Services. Report Server items are the folders, data sources, connections, and
If you use the rs.keymgmt utility to restore your encryption key, you will have toreactivate the instance of Report Server.
467
Deployment Strategies
ch68787_13.qxp 26/03/2004 3:57 PM Page 467

reports contained within a Report Server instance. Let's take a look at the roles that can be defined foreach.
For each securable object type, there is a certain set of tasks that can be defined. Role definitions are usedto represent a set of tasks that can be performed. Once a role definition has been created, it is associatedwith a securable object and a Windows NT user or group to create a role assignment. Let's walk throughcreating a role assignment for the Home folder.
Report Server ItemsFirst, navigate to the properties of your Home folder using Report Manager. Enter the following URL intoyour browser:
http://localhost/Reports/Pages/Folder.aspx?SelectedTabId=PropertiesTab
You can view the properties as shown in Figure 13-17:
Figure 13-17
You can see on the Home folder that there is one role assignment defined for the BUILTIN\Administratorsgroup. The role assigned is Content Manager. So, this is an associate between the Home folder (securableobject), BUILTIN\Administrators group (user/group), and Content Manager (role definition). Now let's adda new role assignment for the guest account. You need the guest account to have browse permissions onthe Home folder. Click the New Role Assignment button to create the association.
Here enter the group you would like to give permissions to, Guests, and the role to associate them with,Browser. Clicking OK will create the role assignment as shown in Figure 13-18:
468
Chapter 13
ch68787_13.qxp 26/03/2004 3:57 PM Page 468

Figure 13-18
You can see that you have defined two role assignments for the Home folder as in Figure 13-19:
Figure 13-19
The key to remember here is the relationship between a securable object, role definition, and Windowsuser/group. The combination of these three items creates a role assignment and sets permissions inReporting Services.
Server MonitoringMicrosoft Reporting Services also comes equipped with a couple of server monitoring options. The firstoption is log files. Log files capture information such as events sent to the application log, exceptionsfrom Reporting Services, and SOAP messages sent to and from the server. The second server monitoring
469
Deployment Strategies
ch68787_13.qxp 26/03/2004 3:57 PM Page 469

option is Windows Performance Counters. Reporting Services provides over 30 performance countersincluding the number of active sessions, number of report executions, and cache hit ratios. These optionsallow you to troubleshoot problems as well as monitor current resource utilization. Let's look in detail ateach monitoring option.
There are three main log files used by Reporting Services. The log files can be found under the SQLServer install directory at <Instance (Default MSSQL)>\Reporting Services\Log Files. In thisfolder, you will find trace log files that are created daily. The description of each of the three log files is asfollows:
There are numerous counters that can be viewed using Windows Performance Monitor. A few of themain counters include Active Sessions, Report Requests, Total Reports Executed, and Total Requests.There are also a number of counters that can be used to monitor report cache information. Using thesecounters can help pinpoint bottlenecks in Reporting Services.
You can manage the amount of information that is stored in the trace logs through theReportingServicesService.exe.config configuration file. However, the logs files are not deleted.You should make sure that you monitor the log files directory and remove files as appropriate.
Execution LogYou can also monitor Reporting Services through the Reporting Services Execution log. When reportsare executed, log entries are stored in the ReportServer database's ExecutionLog table. This tableincludes information about which report is executed, the duration of execution and other metrics thatcan be used to monitor performance. By default, Reporting Services maintains these entries for 60 days.You can change this value through the Report Manager. To do this, go to the following link:
http://localhost/Reports/Pages/Settings.aspx
This opens Reporting Services Site Settings as shown in Figure 13-20:
Log File Description
ReportServerService_<timestamp>.log This log contains information about the Reporting Service service.
ReportServerWebApp_<timestamp>.log This log contains information for the Report Manager Web application.
ReportServer_<timestamp>.log This log contains information for the Report Server processing engine.
470
Chapter 13
ch68787_13.qxp 26/03/2004 3:57 PM Page 470

Figure 13-20
Notice that at the bottom of the screen you can specify when to remove log entries along with turning onand off execution logging.
SummaryIn this chapter you have reviewed architecture, discussed installation planning, performed aninstallation, and discussed administering a Reporting Services solution. This chapter should serve as afoundation upon which you can build your level of skill with the product. A more detailed explanationof the features is available through BOL that is included with Reporting Services. It is a good tool forfurther investigation of the product.
This foundation will be sufficient to get you started in a productive installation.
471
Deployment Strategies
ch68787_13.qxp 26/03/2004 3:57 PM Page 471

ch68787_13.qxp 26/03/2004 3:57 PM Page 472

DesigningBusiness Intelligence
Reporting Solutions
It's time to change our vantage point once again. Now that you understand the many capabilitiesof SQL Server Reporting Services, let us discuss how to apply these features to solve realproblems. We will take a look at some of the high-level business drivers, challenges, and theclimate of Business Intelligence (BI).
The objective of this chapter is not to give you all the details necessary to create an entire solutionbut to discuss the considerations and high-level objectives for a complete BI or reporting solution.We will show you some example solutions and discuss their components. It is said that you cangive a man a fish and feed him for a day but you can teach a man to fish and feed him for alifetime! In this chapter, we will talk about why… and how to fish.
Business decision-makers face many of the same questions now as in decades past. How toincrease revenue, identify and increase the profitability of key customers, and recognize markettrends are familiar questions to leaders and managers at all levels within a business organization.One of the largest differences between today's decision-makers and those of twenty years ago isthat today's manager must be faster and more informed.
Even the process of identifying a company's most valuable customers can involve analyzing datafrom multiple data sources and customer touch-points. For example, the information of a singlecustomer can be located in sales and marketing data stores, a web application database, and insatellite offices closer to the customer's geographical location. Capturing the data to get anaggregate view, enabling you to identify your most profitable customers is one example of howbusinesses can increase performance through BI. The goal is being an agile company that's able tocompete more effectively in the marketplace, ultimately increasing profitability and reducing costswhile responding to changing market conditions with both speed and precision.
141144
68787_ch14.qxp 26/03/2004 3:57 PM Page 473

Chapter 14
474
In this chapter, you'll read about recommended approaches to BI solution design, as well as see how twocompanies implement Reporting Services solutions in their own environments. The chapter concludeswith tips for enterprise development and an overall summary of how to approach your next ReportingServices solution.
Approaching Solution DesignReporting solutions often exhibit the kind of behavior seen in company web applications; they tend tostart small, and increase in size and complexity quickly. Allowing for this growth while maintainingusability and manageability can be a significant challenge.
Define the Business ProblemUsing the term solution suggests that something needs to be fixed. The natural conclusion of this line ofreasoning is that a problem exists! The fact is that not all business solutions are necessarily a fix forsomething broken, however, a solution must have a clear purpose. The problem might simply be that werecognize an opportunity that we would like to pursue. If our information tells us that customers willneed a product or service, the problem might be that we aren't currently selling that product or theservice. Whatever the case, the business need, opportunity or problem must drive the solution.
Business solutions are remedies for business problems. It's often easy to lose sight of this fundamentaltruth as programmers and other technical professionals immerse themselves in designing applications.Every element of the system must be designed for this purpose. From the login dialog to the browse listsand reports—every feature exists for the sole purpose of meeting a stated business need and solving abusiness problem. Business intelligence tools support the goal that business decision makers areinformed and empowered through visibility to important information.
Performance GapsA performance gap is a problem that stems for the inability to perform optimally. This might be ameasure of response time, profitability, quality, or the low-level of customer satisfaction. Performancegaps must be in the form of measurable and quantifiable values.
Missed Opportunity CostsLost or missed opportunity costs can be difficult to quantify because the desired goal has not yet beenattained. It's imperative to fully understand and define the conditions and implications of seizing anopportunity. The perceived goal must be clearly defined in terms or values that are both measurable andspecific enough to define. Setting goals such as improving performance and increasing production are tooambiguous to either recognize or measure an acceptable degree of success.
Consider the classic case of the small, home-based, thriving business that grows and expands to thesmall office. Suddenly the one-guy-company entrepreneur must contend with factors like rent, payrolland labor laws (did I mention corporate taxes?). This scenario has stifled the energy of countless smallbusiness owners. Moving from the small, one-person business to the moderate-sized office businessmight open doors of opportunity, but this comes at an increased cost and management overhead.Having visibility to lost opportunities, as well as our capacity to accommodate such opportunities, canhelp business grow at the right time and in the right way.
68787_ch14.qxp 26/03/2004 3:57 PM Page 474

Another significant factor to consider in business is the cost of not seizing an opportunity. Often thecurrent state of business simply cannot be maintained. Take, for example, the thousands of businessesover the past decade that were doing just fine selling their products exclusively through retail stores.Some competitors recognized the opportunity to go on-line and sell offer products on the World WideWeb. Since that time, markets have undergone drastic changes and latecomers have been forced to dothe same out of sheer survival.
Current State/Future StateBefore we can understand where we are going, we have to understand where we are. In order toaccurately describe the intended state of a solution, it's important to fully understand the currentconditions and environment. Many times, replacing a system or implementing a new tool can introducenew elements into an environment that can cause additional problems or affect other elements. Thebetter we can understand the current state, the better we may be able to define the desired future state ofthe solution.
Business Goals and ObjectivesPossibly one of the greatest challenges in developing a new solution is to fully understand its purpose.It's easy to lose sight of the bigger picture. Users, customers, IT professionals, and business executiveshave different goals and relatively different perspectives and requirements. No one perspective isnecessarily more important than the other (unless one is paying our salary, their needs are far moreimportant than those any others!).
What should ideally drive a business solution is, well, the business. The needs of the business keep italive. A healthy business is founded on goals and objectives that serve its customers, employees, andshareholders. So, naturally, the ultimate purpose for a business solution is to meet the needs of thebusiness and everyone who makes the business work. This may sound a bit idealistic but it's afundamental principle that is all too often realized too late after expensive IT projects fail.
DirectionI just can't talk about IT project goals without telling one of my favorite stories.
Long ago, in the medieval times, a small kingdom had suffered many attacks from surrounding enemies.The king sent out his knights, charged to strengthen his armies. A certain valiant knight rode into asmall, fortressed village in the kingdom. He looked up at the wooden fortress wall outside of the villageand noticed dozens of arrows that had been shot into the wall from the same direction. Each arrow wasshot directly into the bull's-eye of one of several different targets painted on the wall.
Figure 14-1
475
Designing Business Intelligence Reporting Solutions
68787_ch14.qxp 26/03/2004 3:57 PM Page 475

The knight asked a man passing by where the arrows had originated. The man told him that they wereshot into the wall from the vicinity of a small cottage, on the edge of the woods, across a large field fromthe village wall. The knight was impressed and wanted to meet the person responsible for such animpressive feat. He rode his steed across the field to the cottage and dismounted.
The knight knocked on the cottage door. A young boy of about fourteen years old opened the front doorand was startled to see, standing in his doorway, this towering knight in his armor, shield and sword.The knight sternly spoke to the boy and asked to speak with the person responsible for the arrows in thefortress wall. The boy sheepishly replied that he had done it and wanted to know if there would be apunishment. The knight chuckled and told the boy he was impressed with his skill and wanted to see ademonstration.
The boy quickly disappeared and zealously returned with his hand-carved bow and quiver full of arrows.He nervously fumbled through the arrows and pulled the straightest arrow he could find from the quiver.The boy excitedly explained that archery was his passion and that he lived for the bow. He spent longhours practicing daily. Together they stood on the front porch as the boy drew back the arrow and let itsail across the field in the direction of the fortress wall.
The knight and the boy walked together across the field to find the arrow and when they reached the wall,the knight searched through all of the arrows, looking for the one that had most recently been thrust intothe wood. The knight didn't notice that the boy scrambled away and then quickly returned while he wassearching for the arrow. It didn't take the knight long to find the new arrow because it was nowhere neara target. As the knight turned to the boy with a puzzled look (although the boy had run away andreturned), he was standing in the same place. The young man looked at the knight with a big grin on hisface—and a bucket of paint in his hands—that he used to paint a target around the arrow…
This is the standard operating procedure for many IT project teams. We reason that as long as we have ageneral direction it ought to be good enough. However, the larger the project and the greater the impactit will have on a business, the more important it is to define its scope and specific purpose. It is no longerfeasible to sketch out a rough project plan and then fill-in the gaps and details as the project progresses—bolting on features and appendages here and there. This is what Doctor Frankenstein didwith his creation, and unless we would like to have similar results, we shouldn't do that same.
Solution DesignNearly all business systems share some common attributes. We will briefly discuss these commonelements of design and then apply these principles to business intelligence and reporting solutions.
Successful solution design includes effectively addressing many areas within an organization. sales,marketing, operations, manufacturing, and accounting department personnel and applications can allprovide data to and consume the data from Reporting Services. Start bringing in BizTalk Server,SharePoint Portal Server, Commerce Server and Content Management Server into the solution mix andyou've got a rapidly escalating quantity of data and an equally escalating need to effectively manage it.It's important that your reporting solution help users access the reports they need, rather than making itdifficult for them. Good reporting solutions address four key questions:
❑ Is it secure?
❑ Is it manageable?
476
Chapter 14
68787_ch14.qxp 26/03/2004 3:57 PM Page 476

❑ Is it available when needed?
❑ Is it scalable?
Reports must be available to users across an organization. Like any critical Web application, a ReportingServices solution must satisfactorily address those questions to remain a viable solution as it matures.Balance is important; an impregnable application that nobody wants to use fails to fulfill its purpose.
SecurityOften addressed after the fact, security is a topic that should be addressed early—even as early as theenvisioning phase of the solution development process. It's important to implement multiple barriers orlayers of defense in your architecture. By having multiple layers of security in place that are configuredto work together, you create a defense-in-depth strategy that doesn't rely on any single point in theinfrastructure to secure it. When designing such a strategy, it's important to address three key aspects ofthe solution:
❑ The network topology and host infrastructure: This includes the use of firewalls at theperimeter and mechanisms like digital certificates to secure communication.
❑ The reporting solution architecture and design: This aspect of the solution includesappropriate error handling (fail securely—and test it to be sure), input validation (never trustuser input), and content structure (based on permissions).
❑ The component-level interactions that are made: Here, interactions between the logical tiers ofthe application architecture are examined to ensure that functions such as data access andASP.NET control processing are performed securely.
During the design phase, document all of the access requirements for your solution, including theReport Server content structure. Define the Access Control Lists (ACLs) used to support the securitypolicy. The idea is to be explicit about who has access permission and who doesn't at each point in thesystem, and configure each element in the structure to support the chosen policies.
In a simple extranet scenario, Figure 14-2 shows the use of a SSL connection between the client and theISA perimeter firewall, securing communication in transit. IIS is configured to use digital certificates,and handles the task of authenticating users. Web applications are held in a DMZ, which is furtherremoved from the internal domain by another ISA firewall. IPSEC can be used internally, encryptingcommunication in transit on the network if required. This is an example of breaking the network intomanageable sections, and using devices such as routers and firewalls to protect each section.
Figure 14-2
477
Designing Business Intelligence Reporting Solutions
68787_ch14.qxp 26/03/2004 3:57 PM Page 477

A well-known security doctrine says, "Run with just enough privileges to get the job done, and nomore." Allowing users or applications more privileges than required for the task exposes unnecessaryvulnerabilities and increases the security threat. Reporting Services functionality is exposed as a WebService, which is fundamentally an ASP.NET application running on IIS. Report Manager is an ASP.NETapplication that provides a GUI interface to the Web service. Each application server in the overallsolution architecture has its own security mechanisms that can be configured to suit requirements. Forexample, IIS can be configured to authenticate users, or the CLR can handle the task using its ownauthentication mechanism. To make the most of the capabilities of each element in the solution, you'llwant to develop an overall security policy and then configure each element to support the policy. Usethe security mechanisms in each application server, so they don't have to rely entirely on the networkmechanisms for protection.
ManageabilityManageability refers to the ongoing operations required to keep the infrastructure, technologies, andprocesses of the solution healthy. Ideally, operations are performed using a pro-active approach ratherthan being forced to continually respond to whatever the current, urgent need is. The tasks typicallyassociated with system management include:
❑ Content management: The Report Server content must grow in a controlled fashion asrequirements change and the solution matures.
❑ System monitoring: Use performance monitors and logs to spot bottlenecks and flag elementsof the system that might not be running at full health.
❑ Remote server management: Report Server solutions are frequently deployed to multipleservers at multiple end points. Using code to automate the deployment and managementprocess eases the maintenance workload.
Typically, there's a close relationship between manageability and the other goals you're trying to achieve.Effective management tools and techniques are important to your ability to address the other areas ofthe solution. For example, regular system monitoring can have a direct impact on applicationavailability. Frequently, decisions made in one area directly affect those made in other areas. Forexample, the content structure you choose can affect both security and manageability.
AvailabilityAvailability is the ability of the application to recover from component or infrastructure failures.Typically the domain of IT operations, availability includes controlling how changes are made to thesystem, isolating trouble spots, and implementing fallback policies in the event of a failure. Success inthis area requires planning for failure.
As with security, it's important to not rely on any one element in the system. For example, having asingle IIS instance to handle incoming HTTP requests means a critical single point failure in the system.Increasing the number of servers creates redundancy in the system so that requests can be serviced evenin the event of a failure.
The front end of the system can be made redundant by using cloned, load-balanced servers in a Webfarm. Each server has instances of IIS, the Report Service, and Report Manager if that functionality isalso required. Availability can be increased yet again by having multiple server farms at alternate endpoints. For example, the service can be deployed to server farms in multiple cities. Applications that
478
Chapter 14
68787_ch14.qxp 26/03/2004 3:57 PM Page 478

consume the web service content can be written to self-heal themselves if waiting for a response from aservice end point times out. Having Microsoft Windows Server 2003 available on your network providesyou the ability to do that, because of the Universal Description Discovery and Integration (UDDI)service it provides.
UDDI is a standards-based store of Web service listings. The listing data is communicated to the storeusing XML and HTTP, using the same mechanisms as regular web services. Each listing containsinformation about the company exposing the service, a description of the service, and details about theserver end-points and protocols. In the event of a web service end point failure, the consumingapplication can abort the original request and send a request to the UDDI server for a listing of available,identical services. Once the collection of listings is received, the application sends a request to a selectedservice and the application process continues. Figure 14-3 is a diagram of the resulting interactions:
Figure 14-3
The Reporting Services application scales well to different environments. The topology you select willdepend on the load you expect, or more specifically, the number of HTTP requests the server will beexpected to service. Use performance counters to monitor the CPU usage and number of cache hits asrequests are sent to the server. Aim for a high load of 80-85% of CPU capacity, to allow for spikes inusage.
Back-end data stores can also use clustering for fail over protection. Like the front end, back end nodescan be distributed across geographical locations to help ensure availability. In both cases, be sure youhave a program in place to manage and stay up-to-date on application updates and patches.
ScalabilityScalability is the ability of the application to handle an increasing user load. Reporting Service is a webapplication, giving you the ability to use multiple mechanisms to support increasing user loads. Bothfront-end web servers and back-end application servers can scale. There are two main ways to scale:scaling up and scaling out.
479
Designing Business Intelligence Reporting Solutions
68787_ch14.qxp 26/03/2004 3:57 PM Page 479

Scaling up involves increasing the capacity of a component in the system. For example, you might scaleup the processor in a machine or increase the RAM.
Scaling out increases the number of components so they can handle increased load together. Forexample, adding more machines to handle HTTP requests would result in creation of a web server farm.There are significant performance capabilities when using multiple machines to share the workload.Sharing the workload includes having separate machines for the Reporting Services application, the SQLServer data store, and other application servers used in the system.
Each component in the solution may have its own techniques and tools for scaling. For example,ASP.NET provides many scaling capabilities. Caching is an excellent way to increase the ability of yourservers to handle an increasing load. For example, you can cache the output for processing an HTTPrequest so the next request for that resource is pulled straight from cache. The request is never processedin the traditional sense. You can set the cache expiration value so that the cache gets refreshedperiodically.
Moving management applications off to separate machines, and implementing functionality likeComponent Services are both techniques that can enable a solution to handle increased load. Webservers benefit greatest from increases in processor power, while storage components benefit fromincreases in disk space and I/O speed.
Transactional and Decision-Support DataThere are generally two categories of data storage systems used to manage business information. Whenmost people hear the term database system, they probably think of a Relational Database ManagementSystems (RDBMS). This is by far the most common and most often used type of database for collecting,managing, and providing reporting for transactional data. The other category, OLAP (On-LineAnalytical Processing), is more specialized and is used only for advanced reporting and decision-support. We'll discuss some of the differences and design strategies for these two types of data storage.
On-line Transactional database systems (OLTP) are typically based on relational data stores that arequeried using structured query language (SQL). OLAP systems, typically based on multidimensional,hierarchal structures, are queried using specialized languages such as multidimensional expressions(MDX).
Back in the 1960s and early 1970s, computer systems made it feasible for large businesses to track largevolumes of information. They designed systems to keep track of customers, accounts, products,inventory, invoices, vendors, shipments, manufacturing processes, measurements, quality control andthe like. A data revolution was underway. However, as the companies who provided these systems triedto maintain them and interoperate with others, they quickly learned that there was more to informationmanagement than just writing values out to a file.
In the 1970s, a mathematician named Edgar Codd, working for IBM, wrote a series of articles aboutdesign principles for relational data stores. The point of his work was not so much as to how to buildproducts to manage data but how to design database systems for effective storage and retrieval—whether implemented as tables in a client-server database product or as flat or delimited text files. Theeventual outcome was a generation of products designed for managing moderate to huge volumes ofdata and making that data accessible to hundreds or thousands of users via current computer andnetworking technologies. Dr. Codd's work (along with the efforts of Ray Boyce and Chris Date) has
480
Chapter 14
68787_ch14.qxp 26/03/2004 3:57 PM Page 480

driven the capabilities and features of modern relational database products, mainly patterned after thework of Oracle and IBM. Boyce and Codd established the rules of Normal Form (BCNF), a short list ofrules for designing relationships and structures within databases.
ConcurrencyOne of the main goals for relational systems is typically to allow multiple users the ability to enter data,make modifications, and access information all at the same time. A basic assumption in these systems isthat users will need access to data immediately after it is entered into the data store. Unfortunately thisability can often expose data in a partial or inconsistent state. In some environments, it may only beappropriate to make records available for reporting after an item (such as an invoice or order) has been"closed" or completed.
For this and other reasons, decision-support systems are typically based on read-only databases. Usingeither relational storage or special-purpose OLAP data sources, transactional data is loaded into thesedata stores at regular, scheduled intervals using ETL (Extract/Transform/Load) tools.
Strategic LatencyMaking this data visible for immediate reporting can adversely affect the accuracy of report data. In asystem where data will only be retrieved, these capabilities don't add value and require design elementsthat may not support the purpose of the solution. Reporting and decision-support systems are usuallynot updated in real-time. Depending on how important the most recent data is in managementdecisions, regular load intervals may be scheduled daily, weekly, or monthly. This gives time in theprocess for scrubbing data so it is presented in a reliable state and assuring that values are consistentthroughout the data store.
If users understand that weekly sales summaries are made available by Monday morning, reports can beproduced at the appropriate times with no question about the accuracy of the information they contain.Using caching, snapshots and subscriptions; reports can be produced for thousands of users from amoderate server. By coordinating the scheduled weekly data load, report cache refresh and subscriptiondelivery; everyone has accurate information in a well-coordinated fashion.
Why Be Normal?The rules of normal form were specifically written to support concurrent, consistent, transactional data.Most large-scale, transactional databases consist of scores of tables; some have hundreds. Most tablesmay be used to store look-up values and to bridge multi-entity relationships so values aren't storedredundantly throughout the database. All of this data organization can have an adverse effect for dataretrieval. The values describing our reporting facts are spread across many tables. This requires complexqueries to traverse joins between all of the tables.
The rules that govern transactional systems are often not applied (at least not strictly) to decisionsupport systems. For example, a product sales fact table in our decision-support database might containthe product name and category name text values repeated many times across different records to avoidjoining it to a product table via a foreign key surrogate value. In a transactional system, this would be ano-no! In the data warehouse, this isn't an issue due to the fact that the data can't be changed and,therefore repeated values should be consistent.
481
Designing Business Intelligence Reporting Solutions
68787_ch14.qxp 26/03/2004 3:57 PM Page 481

Understanding Business IntelligenceAs you have seen, we have many choices for data storage, query techniques, languages, and tools. Oneof the greatest challenges for any business is to select a set of tools and products and integrate them intolong-term solutions. The essence of BI is to make appropriate selections to assemble an enterprisearchitecture to provide these capabilities. A functional BI solution empowers business leaders to makeinformed decisions that will carry a business to its goals. Whether this is increased sales, competitiveviability, improved processes or all of these, BI is the finger on the pulse of a business.
In terms of technology, a BI solution is the total integration of information gathering and data collection,the effective storage of data, the extractions and collaboration of various business unit data silos, andfinally the aggregation of all this information into a consumable form. It should be simple anduncomplicated yet encompass all important business processes and activities.
Possibly one of the greatest lessons I've learned from Microsoft's approach to building software is theconcept of zero-defect. Contrary to the name, this doesn't mean that a product must be perfect or evenbetter than anything else. The concept of zero-defect is that we define the quality of a product or servicein measurable terms before we build it, and then, throughout the construction of that product, wecontinually monitor its quality against the specification. With rigid quality assurance practices in place,we assure that our solution is good enough to meet the standard set at the beginning of the process.Likewise, a business intelligence solution should be used to set thresholds and acceptance criteria—andthen to measure business performance against predefined marks.
Reporting information must be standardized, qualified, and comparative—it has consistent interval,form, and is exposable to extractions and operations (aggregation, analysis, and data mining etc.)Creating reports to guide business decisions is the primary driver for gathering and maintaininginformation in our organization with the accuracy of these reports often determining the success orfailure of a business process, campaign, or the business itself.
BI Process LifecycleWith BI, we do our best to simplify processes but business is not always simple. If your business waseasy, more people would be doing it. As a business consultant, I've entered many business environmentscharged with simplifying processes and building reporting solutions to help ease complexity. Asoutsiders, we tend to cut through the details and quickly define core processes. On many occasions, Iremember thinking, "what's wrong with these people. Don't they realize that their business is simple? Whydon't they just go from step A to Z rather than executing all of the convoluted steps in between?" Months later,having worked along side people and just beginning to realize the complexity of an environment, did Istart to appreciate how delicate and complicated some business processes can be.
BI needs to deal with the complexities of, while providing a means to simplify the flow of criticalinformation through a business as much as possible. Like your business, the flow of information isn'talways linear. Our BI solution recognizes dependencies as well as the parallel nature of businessprocesses. The intelligence part comes from the dynamic, iterative nature of these processes.
Each process is aware of state (current information particular to its position in time and relative to thewhole business process.) The process is informed, dynamic, and intelligent. All processes roll up into
482
Chapter 14
68787_ch14.qxp 26/03/2004 3:57 PM Page 482

and depend on the business case. The business case, in turn, qualifies state and process through qualityassurance and control. State and processes have tolerance, extractions rules, storage and maintenancerules, and operational requirements. BI is an iterative process with ongoing qualifying of informationthrough structure, context, and operations. BI's lifecycle completes as the Business Case changes,proactively and intelligently.
Information GatheringBusiness related information may be gathered at many points. Collecting or transacting informationapplies to any point or process that acquires data that will reside within the BI solution. Whether it is aninternal or external source, the data comes into or back into the information pool accessible to BIprocesses. Many companies have invested heavily in ERP (Enterprise Resource Planning) systems thatgather a tremendous volume of data but without effective aggregation and analysis tools, all of thisinformation becomes overwhelming.
Processes for gathering data fall into interactive or automated types. Data-quality is enforced byapplications that host these processes. Both types can depend upon diverse storage systems asintermediate and/or final caching structures for a process. Often, it makes sense for data to exist induplicate—at least for a time—until archived records are removed from transactional systems andsummarized records are stored for reporting. Data marts and data warehouse solutions isolate reportingfrom transactional data management, both to preserve integrity and conserve system resources.
Data Scrubbing and ConsolidationData is collected as records that define informational context through association with other records.Often, isolated values must be extrapolated into multiple tables with lookup keys and category codes tosupport the context of these values. This is often one of the most cumbersome tasks; extracting from anon-normalized, flat-structured or ad-hoc collection if informational facts, meaningful values that fitneatly into our data store.
I recall a data warehouse consulting project in the mid nineties at the same paper mill I mentioned inChapter 1. The inventory management system was a special-purpose mainframe system that had been inoperation for decades. Most of its data was stored in a just a few flat text files. Critical values had beenhand-keyed into the green screen applications with no validation for product descriptions, productionlines and machines, inventory locations, product categories, status codes, etc. After we built anormalized staging database, we automated the extraction and wrote scripts to scrub the data as it wasloaded. When a new lookup value (such as a location or product category was encountered), we addedthis to our lookup tables to maintain referential integrity.
The result: hundreds of slight mis-spellings and abbreviations that represented duplicate values alreadypresent in the lookup tables. Without validating data as it was input into the inventory system, wecontinued to collect garbage in the data warehouse. Working with the mill workers who entered most ofthe data, we could manually fix over 99% of the data but a certain percentage of the records simply hadto be tossed out.
483
Designing Business Intelligence Reporting Solutions
68787_ch14.qxp 26/03/2004 3:57 PM Page 483

Data Staging and TransformationThe process of decision-support data consolidation is often called ETL (Extract, Transform and Load). Anumber of tools are offered to move and manipulate data as it is staged for loading into a datawarehouse. The SQL Server arsenal includes a very powerful tool for this purpose. Data TransformationServices (DTS) can be used to "pump" large quantities of data from data sources to data destinationswith nearly limitless capabilities. Transformations may be performed using complex scripting and querylogic. A transformation package consists of steps that can execute queries, scripts, applications, import,export, send email, and log events. Each transform moves data from one connection to another.
The selection is typically based on a SQL expression and each column may be validated, parsed,combined or otherwise manipulated with a program script (using either VBScript of Jscript.)Dependencies may be established between each step to create branching logic. Execution steps may beperformed based on a previous step's successful completion or failure.
The DTS designer offers simple drag-and-drop symbols and wizard dialogs to make this complexprocess easy to perform. The DTS package depicted in Figure 14-4 illustrates the transformation andloading of data from four regional data marts, importing a text file from the corporate mainframe,running an external utility and three script files to scrub and validate data rows. The graphic nature ofDTS makes this package relatively simple to design and easy to follow its data-flow and logic.
Figure 14-4
Indexing StrategiesAdding indexes to a table can accelerate data retrieval, support joins and enforce record uniqueness. In atransactional system, indexing can impede performance, as indexes must be updated as and whenrecords are inserted, deleted or modified. This is a classic trade-off between performance andfunctionality. A typical OLTP database will have an index to enforce the primary key constraint on each
484
Chapter 14
68787_ch14.qxp 26/03/2004 3:57 PM Page 484

table. Additional indexes will support foreign-key relationships and columns most often used to forsorting and selection should be indexed. Additionally, if data is most often retrieved or joined on oneparticular column, building the tables using a clustered index will speed data retrieval withoutsignificant impact on typical query performance. When designing the usual multi-purpose database, it isnecessary to strike an appropriate balance between optimal transaction processing and queryperformance.
Since decision-support databases exist for the sole purpose of data retrieval, tables should typically beheavily indexed. There is much to be considered and there are a number of variables. If some tables willalways have records sorted in a particular order, a clustered index will support this goal but can workagainst additional queries on the same table. Typically, use multiple, non-clustered indexes on tables andcomposite, multi-column indexes to support commonly used queries that sort by multiple columns.
Decision-SupportTo remedy the issues of traditional relational database design, we simply break the rules! This is notdone in the transactional database but in a separate database designed exclusively for decision-support.New data is loaded at regular intervals into the decision-support database. Often called a datawarehouse, this becomes a central repository for historical and relatively current data. A data warehousecan be fed from many sources. In large organizations, data is often collected through departmentalsystems that store data in separate stores. These databases are often referred to as data silos. Each maybe structured and designed to support its own process and user needs. Over time, data silos may existon different platforms and locations; it'll be virtually impossible to connect and share them in real time.
In this environment, the data warehouse becomes the central point for reliable and consistent reportinginformation (see Figure 14-5). After data from various locations and sources has been scrubbed andtransformed, the information it represents should be accurate and results should be predictable.
Figure 14-5
Sometimes this data consolidation must be performed in stages. Take, for example, a large business withseveral regional locations. Each location has several departments, each with their own disparate datacollection and storage systems. In this case, we recognize individual data silos at the department level.Each night, data is collected into a site-specific data warehouse, called a data mart. At the end of theweek, the data marts are consolidated into a central data warehouse where the data is furtheraggregated and made available at the corporate level.
485
Designing Business Intelligence Reporting Solutions
68787_ch14.qxp 26/03/2004 3:57 PM Page 485

Depending upon the disparity of these data structures, consolidation may require a staging database.This provides an intermediate platform for collecting and transforming the data structure before it loadsinto the data warehouse or any other final destination. In Figure 14-6, data marts feed a central datawarehouse but not all data analysis may be performed in a central location. Figure 14-7 shows datamarts that may also be fed from the central data warehouse as well as local silos. Reports may begenerated from the data marts as well as the central data warehouse.
Figure 14-6
Figure 14-7
486
Chapter 14
68787_ch14.qxp 26/03/2004 3:57 PM Page 486

Query LanguagesReporting Services supports practically any query language as long as there is a capable driver or dataprovider for the product that can return a standard result set. The query language is passed directly tothe data source and it's the job of the driver and data source to parse and execute the query. This meansthat if you are using an Oracle database, you would write your queries in PL/SQL. If you are usingInformix, MySQL, Sybase, Access, or any other database product, you simply write your queries in thenative dialect of SQL or any appropriate query language.
Multidimensional Expressions (MDX)Microsoft Analysis Services and other OLAP data sources use MDX, a query expression languagespecifically designed to query cube structures. Rather than addressing data using rows and columns,cube structures are addressable using tuples and slices. By slicing cube data along different dimensions,we resolve dimensional intersections that represent aggregated data points. MDX expressions convertthe multidimensional structure of a cube into flat row and column structures, which is why we can usethese expressions in Reporting Services.
OLAP and SQL Server Analysis ServicesDecision support data stores are specifically designed for reporting. At some point, relational storageand structured query language may no longer meet data warehouse requirements. When tables reachmillions of rows, a traditional database may not deliver acceptable performance or function at all! Inorder to achieve acceptable performance, a data warehouse is typically designed with pre-aggregatedvalues so all of the functions and calculations don't have to be applied each time a query is processed.
OLAP databases are specifically engineered to support special data structures and associated querylanguages for this purpose. Microsoft SQL Server Analysis Services defines cube structures asmultidimensional hierarchies supporting the concepts of facts and dimensions. Data can be stored in arelational database, in a multidimensional storage structure, or parts of the data can be stored in both.
OLAP queries are designed to be interactive. This is where SQL and MDX differ significantly. In a SQLquery, a single result set is returned to the client. MDX queries are tightly coupled to the OLAP databaseand provide continual drill-down and discovery into the cube structures using interactive tools. In SQLServer 2000, Reporting Services doesn't support this capability. It only allows MDX queries to return aflat result set—much like a SQL query. However, despite this limitation, reports using MDX expressionsagainst OLAP sources can still be far more efficient than using SQL to query the source databases.
SQL Server's relational store can effectively store hundreds of millions of data rows but lacks the tools todeliver multidimensional cube data and drill-downs. Microsoft's data warehouse solution includes boththe relational storage engine and a multidimensional engine optimized to consolidate large volumes ofdata and to build pre-aggregated results for multiple dimensions of values. Analysis Services simplifiesthe complexities of transactional systems and provides a simple interface to create intricate cubes,dimensions and calculated measures.
As the volume of data increases, different storage options may be appropriate. Cube data can bemaintained in the relational store using a method called Relational On-line Analytical Processing (ROLAP),in a multidimensional structure (MOLAP), or a combination of the two. Let's take a look at a simpleOLAP report using MDX expressions. Figure 14-8 shows an OLAP cube in the SQL Server AnalysisServices Cube Editor. This cube is based on the AdventureWorksDW sample data warehouse database.
487
Designing Business Intelligence Reporting Solutions
68787_ch14.qxp 26/03/2004 3:57 PM Page 487

Figure 14-8
To create the report, we define two datasets using a shared data source. In Figure 14-9, the data sourceuses the OLE DB Provider for OLAP Services:
Figure 14-9
488
Chapter 14
68787_ch14.qxp 26/03/2004 3:57 PM Page 488

Two datasets are used to represent the cube data. The first dataset is used to populate a parameter listfrom our Time dimension. The following MDX query retrieves date values at several levels based on thedimension definition in the cube including the year, quarter and month.
With MEMBER Measures.DateKey as '[Time].CurrentMember.UniqueName'MEMBER Measures.DateName as 'Space([Time].CurrentMember.Level.Ordinal*2) +
[Time].CurrentMember.Name'Select
{Measures.DateKey, Measures.DateName} on Columns,[Time].Members on Rows
FROM [Reseller Sales]
We'll define a parameter called TimePeriod in the report and set the source of this parameter to thisdataset in the designer. When the report is opened in Report Manager, the parameter list looks like this(see Figure 14-10):
Figure 14-10
The report itself will be based on a dataset called DataDetail. This MDX expression is entered into thegeneric query builder as a literal string preceded by an equal sign. Note that in order to insert line breaksfor improved readability, we must parse the string with double quotes and then concatenate it withampersands. The filtering criteria of this expression refers to the TimePeriod parameter in the WHEREclause.
="SELECT NON EMPTY HIERARCHIZE({[Product].[Category].Members, "& " [Product].[Sub Category].Members, " & "[Product].[Product Name].Members}) ON ROWS, " & "{[Sales Amount]} ON COLUMNS "& "FROM [Reseller Sales] " & "WHERE " & Parameters!TimePeriod.Value
The report uses a simple matrix data range to display values along two axes. The report will haveproduct category, subcategory, and product name groupings on the rows. A more sophisticated reportmight also have column groupings and could support drill-down capabilities like the matrix report welooked at in Chapter 3.
The end result (shown in Figure 14-11) is a report displaying product sales with automatic rollupsummaries on the category and subcategory rows:
489
Designing Business Intelligence Reporting Solutions
68787_ch14.qxp 26/03/2004 3:57 PM Page 489

Figure 14-11
Figure 14-11 shows this report executed for the month of August selected from the TimePeriodparameter list. A textbox near the top of the report shows the parameter value. In this example, theparameter value is [Time].[All Time].[2001].[Quarter 3].[August].
Architecting BI SolutionsIn order to serve a large user base and, perhaps, use in various locations; multiple database servers areoften necessary. There are a number of options which we'll consider in the following sections.
Farms and GardensNo, this is not a magazine title. Database servers, component application servers and web servers canincorporate clustering technology to form scalable hosting platforms for large enterprise solutions. Webpage processing and report rendering can be very resource-intensive and a single server—regardless ofits processor speed or memory—may not have the capacity to manage all requests at a given time.
490
Chapter 14
68787_ch14.qxp 26/03/2004 3:57 PM Page 490

A web farm is a virtual server comprised of multiple physical servers that run in tandem sharing a singleIP address. As web requests are presented to the virtual server, the clustering service finds the mostavailable server in the cluster to handle the request. This technology allows banks of relativelyinexpensive PCs to provide the computing horsepower of midrange and small mainframe systems.Smaller-scale operations can start at the fraction of the cost and add hardware, scaling-out as needed.Clustering capabilities were first introduced in a stand-alone product (code-name WolfPack Server forWindows NT 4.0) and then incorporated into Windows 2000 Advanced Server. Clustering is now astandard feature of Windows Server 2003 Enterprise and Datacenter Editions.
A web garden is simply a web server residing on a scaled-up machine, consisting of multiple processors.Individual processors may be assigned to specific services and processes or they can collectively serviceprocesses in tandem.
Federating and Partitioning DataClustering and replication technology have made it possible and relatively easy to use multiple serversto host enterprise-scale databases. One advantage of the Windows distributed network platform is thatwe don't have to put all data on a single storage device or host it on the same server. Often times,bottlenecks can be resolved by simply spreading data access across the network, either putting datacloser to users or sharing the workload. SQL Server can remotely access other database servers so thatdata can be made available at different locations.
Partitioning data is a matter of placing the data for a single database on different storage media. Harddrives and other storage hardware are usually the slowest part of the system. When data stored on threedifferent hard disks is accessed, queries may be able to run three times faster (assuming there are noother bottlenecks).
The strategy of federating data is that multiple database servers will host supporting data. Throughlinked servers that bridge the collective data, queries on one server can access the data on other servers.This shares the resources of all servers. To support large volumes of data, very fast or dedicated networkconnections may be required between the database servers.
Reporting Solution DesignAn effective reporting solution addresses both the external network environment and the internalstructure of content in the Report Server.
System EnvironmentsOne size does not fit all—large organizations with sophisticated needs require more capable systemconfigurations than small operations. In Chapter 13, we had discussed specifics of server deploymentand configuration details. Now, we will take a brief look at some of the considerations that influence thedesign and planning for appropriately sized business intelligence solutions.
491
Designing Business Intelligence Reporting Solutions
68787_ch14.qxp 26/03/2004 3:57 PM Page 491

Small EnvironmentsSmall businesses can realize the benefits of Reporting Services with a single server. Figure 14-12 showsan example of a small-business architecture:
Figure 14-12
Many smaller businesses have IIS applications and SQL Server running on the same box. If the serverhas sufficient resources, simply adding Report Server to the installed programs will work. Additionaldata sources on other machines can be accessed as required.
Medium EnvironmentsMedium-sized businesses are likely to place enough load on the reporting structure to warrantspreading that load across multiple machines, as shown in Figure 14-13:
Figure 14-13
This architecture will allow the web server to handle more requests than in the smaller environmentreducing the need to scale out with more machines. Note that you can also scale up at this point byincreasing the capacity of the components in the server.
Large EnvironmentsWhen the number of requests hitting the server becomes too many for a single machine, scaling out withmore machines is an effective way to handle increased load (Figure 14-14):
492
Chapter 14
68787_ch14.qxp 26/03/2004 3:57 PM Page 492

Figure 14-14
The Report Manager application isn't deployed to the front-end server farm. It's a level back on adedicated staging server, keeping the load-balanced servers focused on handling report requests. ReportManager can run on a background machine. Updated Report Server content is then deployed to thecloned farm machines using scheduled scripts.
Content OrganizationSimilar to the organic nature of intranet sites, Report Server content tends to grow with little centralmanagement or control. Departments and teams create their own folders, and sometimes groups arecreated to restrict access to the folder contents. Frequently, the folder structure mirrors the organizationalstructure of the company. Although these approaches are often easier, they won't necessarily provide theanticipated return.
Unplanned growth in the content structure can often result in a difficult-to-manage combination of non-conventional folder names and mixed report content blended with checkerboard permissions. Afrequent cause of ad hoc designs is a reluctance of administrators to enforce the concept of running withleast privileges. Too many users with too many permissions leaves too many people deciding how bestto organize and secure the content. The server content and server environment can become difficult touse and maintain. The larger your environment, the more crucial it is to use discipline. Remember howintertwined security, manageability, availability, and scalability are. Here is where the pain of poorchoices can come back to haunt you.
Another more disciplined, systematic approach to develop a content structure is based on security.
Security-Based Content StructureThis is a design of solution based on how security is implemented using groups and users. Thisapproach allows you to take full advantage of the hierarchical structure of Reporting Services contentand leverage the inheritance of security policies by folder child items.
One of the most effective techniques to use when developing the Report Server content structure usessecurity as its foundation. This approach works with the hierarchical structure of how the Report Serverorganizes content. Each content folder in Report Server inherits the permissions of its parent folder,along with the other report and resource items located there. Structure your content based on how youwant to control access, keeping more secure content in folders nested below a more permissive parent.
Consider, for example, a small manufacturing company with five hundred employees. The companyoperates in a single location and is divided into organizational departments. Each department has report
493
Designing Business Intelligence Reporting Solutions
68787_ch14.qxp 26/03/2004 3:57 PM Page 493

needs based on work groups and users. The reports are needed primarily by department managers,although some manufacturing team leads use reports to monitor production. In this case, the contentstructure consisted of separate folders at the root for each department. Users within each departmentwere added to a group which had permission to that folder. Within each department folder, access tomore sensitive resources was further restricted by creating nested sub-folder. The restricted content wasmoved to the nested folder, and permissions set accordingly. Figure 14-15 shows you an example of howthe content was structured:
Figure 14-15
Using this structure, generally available reports are at the Root or Home level. Operations-only reportsare in the Managers folder, with access permitted only to Operations department members. This isduplicated for each department, with each nested content node typically restricting access further.
Solution ProfilesThe following are two solutions that demonstrate implementations of Reporting Services in a realbusiness solution environment.
Linked Reports for Multiple Field OfficesA computer retailer based in New York has 150 outlets on the east coast of the United States. The storesare grouped into ten regions. It's a moderate operation with each retail shop doing between $1-2 millionin sales per year. The parts for each computer are sourced and assembled at the home office, anddelivered to each storefront by truck. Retail performance goals are set by the main office. Each retailshop has daily, weekly, and monthly sales goals for each item and system the company sells. The retailstores use a mix of static and dynamic reports to track sales data for each period. Dynamic reports are
494
Chapter 14
68787_ch14.qxp 26/03/2004 3:57 PM Page 494

viewed via browser and secure Internet connection, while static reports are emailed to store managerseach morning. The set of reports used by the retail stores is consistent among all stores.
The main office uses reports to provide aggregate and detail views of retail sales. Additionally, separatedepartments have their own reporting requirements. For example, the warehouse is continuallymonitoring inventory levels and attempting to forecast demand. There, the staff is trying to keep enoughstock on hand for short-term production needs, without overbuying and ending up with an overstock ofoutdated components.
Because each of the retail stores uses essentially the same report set, a strategy using linked reports isemployed. In the Report Server root, a folder was made for each region and the main office, along with aRetail Master folder (Figure 14-16):
Figure 14-16
Each region folder has a child folder for every retail store in that region. The Retail Master folder containsthe actual reports that the retail stores use. The Master folder is locked down, preventing access toanyone other than developers and report managers. The region-level and store-level folders have usergroups configured so only the users in that region or store have permission to access it. The retail storesuse linked reports to view the data, which allows additional control. For example, linked reports provide
495
Designing Business Intelligence Reporting Solutions
68787_ch14.qxp 26/03/2004 3:57 PM Page 495

a filtering capability. Each office gets the same set of reports, but users only have access to reports thatare rendered using the data for that office. Folder permissions for the main office work the same way,with permissions granted by office user group. The structure of the content and report linking wasdesigned in the planning phase of the development process. Naming conventions were also establishedfor folders, reports, data sources, and schedules.
For this particular solution, one of the key features of Reporting Services is the ability to connect tomany different data stores. Because this company had invested in applications for different departments,data is spread among SQL Server, OLE DB, ODBC, and IBM DB2 data stores. Implementing a ReportingServices solution enables managers and key decision-makers to aggregate data from disparate storesinto a single, comprehensive report.
Scout-Master.comScout-Master.com allows Boy Scout leaders to manage their unit records online. See Figure 14-17.
Figure 14-17
The challenge facing these organizations is that every boy, parent, and leader has to keep track of dozensof individual awards, requirements, and their goals, progress and status. Using a secure web-baseddatabase solution has made this daunting task more manageable. Over the years, desktop software has
496
Chapter 14
68787_ch14.qxp 26/03/2004 3:57 PM Page 496

been developed for scout records management but this doesn't provide visibility to anyone but the unitleader who has the program running on their home PC. The web-based solution connects everyone andautomatically sends email reminders for calendar events, goals, and award deadlines. Over the past twoyears, hundreds of scout troops had signed-up to use the site to keep track of their membership,contacts, calendar activities, meeting plans, and award progress.
The project started small when the Microsoft .NET Framework was in beta stage and eventually wentcommercial. About a year ago, the first design was unplugged and the entire site was re-architectedusing Visual Studio.NET. The web solution is a three-tier design built on SQL Server 2000, .NET businessclasses, ASP.NET Web user controls, web forms and mobile web forms. A few months ago, the site wasmoved from a commercial Internet service provider host to a dedicated server running Windows Server2003 Web Server Edition.
Master.com are two-fold. Based on a user's position in the unit, they should have access to differentreports. Some reports will only provide detail information for a boy and will be available to the scout,his parents, and award counselors. Other reports will be available only to certain unit members withprivileges based on their leadership position. Reports can be viewed in real time or may be saved on theserver for download or off-line viewing. Figure 14-18 shows a merit badge requirements report renderedto a secondary browser window from a page within the ASP.NET web forms application:
Figure 14-18
497
Designing Business Intelligence Reporting Solutions
68787_ch14.qxp 26/03/2004 3:57 PM Page 497

Many scout leaders have hand-held PDA devices and would like to save membership rosters andsummary reports to files so they may be viewed when they aren't connected to the Internet(unfortunately most scout summer camps don't have wireless Internet access.)
SQL Reporting Services has been easy to implement within the application. All reports are renderedfrom code behind web user controls and the process is completely invisible from users. They simply seea list of available reports. Custom web forms prompt users for report parameters and criteria and thereports are simply delivered in the web browser as part of their application experience. Users are alsogiven the option to download report files in a variety of formats (including PDF and Excel) in a layoutsuitable for their PDAs.
Some users have expressed concerns about keeping their unit records only on a commercial site ratherthan having the data in their possession. Reporting Services provided an easy solution and is used to letprivileged users retrieve data backups. A set of reports was designed to return the bulk of unitmembership data, rendering these records in XML and CSV file formats. This gives subscribers theability to off-load their data for safe-keeping and to import records into their own spreadsheets or ad-hoc databases. If nothing else, it gives users a safety blanket, knowing that their current data is in theirpossession.
In all, the reporting solution has been rock solid since it was originally written using the beta 1 versionof Reporting Services. It was easy to program and offers all of the features needed to meet the systemrequirements.
Reporting Solution Development EnvironmentQuestions frequently come up about effective environments for team ASP.NET application development.For example, it's surprising how many developers write code logged in an account that's a member ofthe local Administrators group. It's also rare to see development computers configured with servicesrunning as something other than the Administrator. The idea of managing the environment so as to helpusers to run with least privileges applies to development as much as it does to users of the Report Servercontent. Creating applications that don't need elevated privileges to run help create a safer environmentfor everyone. There are a few more good practices that are worth mentioning, starting with the idea ofisolated development.
Isolated DevelopmentThere are several approaches that you can take when working on complex web applications in a teamenvironment. They differ mostly in where the code files are worked on and stored. Provisions includemaking code files available to each member of the development team. Generally, the differentdevelopment environment models are referred to as isolated, semi-isolated, and non-isolated.
An isolated development environment is one where development work is done in isolation on your localmachine. The master source code files can be located on a file share or managed using a tool like VisualSource Safe. In a semi-isolated environment, developers work on their files located on a common webserver. Debugging also takes place on that server. When debugging a web application, IIS is blocked—which effectively prevents other developers from running their own code. A non-isolated environmenttakes that one step further, by having all developers working with one set of files in a single virtual
498
Chapter 14
68787_ch14.qxp 26/03/2004 3:57 PM Page 498

folder on the server using Front Page extensions or by some technique that's similar to this. Don't dothat! It's too easy to mess stuff up.
In the development of an island that is your workstation, each developer works with separate localcopies of the application. Creation and debugging are done safely away from other developers and thenon-dev environments. With more than three or four developers, you'll also benefit from some type ofsource control. Migrate your work to a server for building, testing, or staging and eventual deploymentto the production boxes.
Using Source SafeMicrosoft's Visual Source Safe (VSS) is a proven and effective tool for source control. It integrates withVisual Studio .NET, enabling you to run. VSS also integrates with Visual Studio and Reporting Servicessolutions. For example, you can check out a report definition .rdl file for development or testing. Be sureto use the VSS hooks and menus in Visual Studio, rather than using the VSS Explorer interface. The VSSmenus in VS.NET provide easy access to code check-in & out, and utilities like WinDiff for comparingtwo files for differences. Implementing source code control can really help make the developmentprocess more efficient and easier to manage. Adding a build process will do the same.
Staging Reports In an enterprise environment, reports should be staged to a server. There, they can be managed usingReport Manager and deployed to target machines using scripts. If the staging server is also used fortesting, its hardware and software configuration should mirror the production machines as closely aspossible.
One Reporting Service environment had report development work being done by individuals indifferent departments of the company. The reports all ran on the same Report Server instance whichserviced the moderate reporting load. In that case, developers deployed their work to their My Reportsfolder. Administrators have access permission to each users My Reports folder. It was a simple processfor the admin to move the reports from each My Reports folder to the staging machine. Once there, theprocess of testing and managing continues.
SummaryBusiness intelligence solutions, like any business solutions, must be carefully planned and scoped toavoid common pitfalls. Business solutions are created to solve business problems and to enable businessleaders to take advantage of the opportunities in a timely manner. Every feature should be traceableback to a stated business requirement. Design considerations like scalability, available up-time, andperformance should be clearly defined before the system is designed and constructed.
Most small to mid-scale reporting solutions will likely be based on databases designed for transactionaldata processing. Systems in this category often require design compromises data entry and queryperformance.
Data warehouses are used to collect read-only data using storage optimized for data retrieval. SQLServer Analysis Services stores data in hierarchal cube structures that are queried usingMultidimensional Expressions (MDX,) a query language optimized for complex pivots and data mining.Reporting Services supports MDX queries through the OLE DB OLAP data provider.
499
Designing Business Intelligence Reporting Solutions
68787_ch14.qxp 26/03/2004 3:57 PM Page 499

68787_ch14.qxp 26/03/2004 3:57 PM Page 500

Troubleshooting
In any development project or system implementation, even code that cannot possibly break mayneed to be fixed. Reporting Services is a tool written and used by people. As long as we continueto have software written and used by people, we can expect that from time to time problems willoccur. Hopefully this appendix will be a useful tool in helping you navigate the bumps in theReporting Services deployment process.
ResourcesEven though this is a new product, there are a number of resources available to help you work outdifficult problems with Reporting Services. Microsoft server products have generally been put intoproduction environments before they are available for retail sale. Reporting Services is nodifferent. A good place to start with is the Reporting Services web site:
http://www.microsoft.com/sql/reporting/default.asp
This site is a vital resource for articles, support, and downloads.
Reporting Services Books OnlineAll the documentation for Reporting Services is contained in the Books Online (BOL) help file.While accurate, the information in BOL is sometimes too brief to be of much help. BOL doesprovide authoritative information and should be one of the first resources used when in need ofhelp.
http://msdn.microsoft.com/library/default.asp?url=/library/en-us/RSPORTAL/HTM/rs_gts_portal_3vqd .asp
AAA
68787_AppendixA.qxp 26/03/2004 3:57 PM Page 501

Appendix A
502
Microsoft Knowledge BaseRelevant knowledge base (KB) articles are linked to the details of error messages from BOL. The KB canalso be searched from http://support.microsoft.com. The KB contains the most recent information aboutissues and problems associated with Microsoft products.
Microsoft NewsgroupsMicrosoft provides many public newsgroups on a variety of topics for SQL Server. At the time ofwriting, Reporting Services was still in beta testing stage and did not have a public newsgroup.However, without the aid of the beta newsgroup for this product it would have been extremely difficultto complete this book. Using a newsgroup gives you the advantage of hundreds of heads workingtogether on a difficult problem.
http://www.microsoft.com/sql/community/newsgroups/dgbrowser/en-us/default.mspx?dg=microsoft.public.sqlserver.reportingsvcs
MSDNMSDN provides a duplication of the development tools documentation. You can find links on MSDN toother resources, such as articles from MSDN magazine and other publications as well at:
http://msdn.microsoft.com/
ToolsThe Reporting Services Windows service and Web Service both keep log files of their processes anderrors. The log files are found in:
C:\Program Files\Microsoft SQL Server\MSSQL\Reporting Services\LogFiles
The web service logs, by default, begin with ReportServer. The Windows service logs begin withReportServerService. The log files are text files that can be viewed with Notepad or any other texteditor. In the event of problems, this should be a source to see what is happening as the service runs.
The tracing level is controlled by the configuration file:
C:\Program Files\Microsoft SQL Server\MSSQL\Reporting Services\ReportServer\bin \ReportingServicesService.exe.config
The tracing level can be adjusted by editing the value of DefaultTraceSwitch. Acceptable values forthis switch are described in the following table:
68787_AppendixA.qxp 26/03/2004 3:57 PM Page 502

The setup process sets the logging level to 3 by default. The tracing can be made more thorough orturned off completely.
Installation ErrorsFor the writing of this book, particularly in trying to set up a web farm, a persistent error was theproblem in getting the Reporting Services Web Service to start:
Activation error 1603Failure activating the web service
There are several reasons why the web service might bot start:
❑ ASP.NET on Windows Server 2003 does not run as a Network Service
❑ Report Server Windows service was not running during setup
❑ ASP.NET 1.1.4322 is not registered with Internet Information Services (IIS).
❑ The default web site is mapped to an IP address instead of being mapped to 'All Unassigned'
❑ Problem with the service public key
❑ Microsoft IIS configuration for the default web site includes settings that the setup program didnot expect
To resolve issues with the service failing to start, be sure to check the log files and look for specific errorsregarding the starting of the service. Try running the key management utility (rskeymgmt.exe) anddeleting any security keys, after which you will need to run rsConfig.exe and rsActivate.exe.
The last item in the list, like many Windows application errors from the past, may not be viewed asespecially helpful. This is rather a catch-all reason. If you have checked each of the other items in the list,it might be time to uninstall IIS and reinstall it with the default parameters.
Value Description
0 Disables tracing
1 Exceptions and restarts
2 Exceptions, restarts, warnings
3 Exceptions, restarts, warnings, status messages (default)
4 Verbose mode
503
Troubleshooting
68787_AppendixA.qxp 26/03/2004 3:57 PM Page 503

Credentials ErrorsCredentials always represent a potential source of problems. Make sure that the Windows service runsunder the proper account. For Windows Server 2003 it should run as a Network Service.
Make sure that the credential that connects to the ReportServer database has dbo permission on:
❑ ReportServer
❑ ReportServerTempDB
And public permission on:
❑ master
❑ tempdb
For reports that are to be distributed via subscription, make sure that the report uses a credential storedsecurely on the server.
Changing Database Connection InformationThe data source for Reporting Services may have to be moved to a different server or the credentialsmight need to be changed. Any time the database connection information for the web service must bemodified, the rsconfig should be used.
The syntax for rsconfig is as follows:
rsconfig -sYourSQLServer -mYourComputerName -dReportServerDatabaseName-aSQL -uYourUserName -pYourPassword
The complete syntax is found in BOL.
The following is a brief summary of some of the possible errors when using Reporting Services.
Service ErrorsThe errors listed below have to do with the Windows service and the web service. The log files can bevery helpful in figuring out the details of the problem.
Error Reasons
rsReportServerNotActivated The installation has not been activated. The rsActivate utility will need to be run to start it.
rsReportServerDisabled The service is unable to encrypt or decrypt data managed by the SQL Server.
rsReportServerDatabaseLogonFailed The logon used by the web service to connect to the SQL database has failed.
504
Appendix A
68787_AppendixA.qxp 26/03/2004 3:57 PM Page 504

Data Access Errors
Errors in this section deal with the data used in reports and access to it.
Report Errors
The following errors deal with the rendering and delivery of reports.
Error Reasons
rsDataSourceDisabled A report cannot be processed because its data source has been disabled.
rsDataSourceNotFound The report data source cannot be found bythe service.
rsInvalidDataSourceCredentialSetting Action cannot be completed because the needed credentials are not stored on the server.
rsInvalidDataSourceReference Action cannot be completed because the data source connection information has been deleted.
Error Reasons
rsServerBusy The server is too busy to process your request; retry later.
rsServerConfigurationError Problems in the Report Server configuration files. Check the details in the error logs.
rsInvalidReportServerDatabase The database used by the Report Server is either in a format that is invalid, or it is corrupt and cannot be read.
rsInternalError An internal error has occurred. Check the error log for details and how to address it.
rsAccessDenied The user trying to perform an operation does not have sufficient permission to perform the operation.
rsSecureConnectionRequired https (SSL) connection is required to perform the operation you are trying to perform.
505
Troubleshooting
68787_AppendixA.qxp 26/03/2004 3:57 PM Page 505

Subscription Errors
Errors in this section deal with subscriptions.
Error Reasons
rsCannotActivateSubscription The subscription cannot be activated. The delivery extension no longer exists.
rsCannotSubscribeToEvent The referenced event cannot be subscribed to.
Error Reasons
rsDeliveryExtensionNotFound The delivery extension is not registered with Report Server.
rsInvalidReportLink The report link for a linked report is no longer valid.
rsInvalidSearchOperator The value entered for a search operator is not valid.
rsParameterTypeMismatch The value entered for a parameter does not match the data type expected for the parameter.
rsReadOnlyReportParameter The parameter is read-only and may not be modified.
rsReportHistoryNotFound Snapshots for this report have not been saved, or the snapshot being searched for was not saved.
rsReportMayNotBeScheduled A schedule for this report is not found. If it wasscheduled, check to make sure that the databasecredentials are saved in the database.
rsReportNotReady The report is still being rendered and not yet ready for viewing.
rsReportParameterTypeMismatch The value provided for a report parameter does not match the expected parameter type.
rsReportParameterValueNotSet There is no default for the report parameter and the user has not supplied a value.
rsReportTimeoutExpired The length of time allowed for the operation has been exceeded. The operation has been cancelled.
rsUnknownReportParameter You have tried to set the value of an unknown report parameter.
506
Appendix A
68787_AppendixA.qxp 26/03/2004 3:57 PM Page 506

Error Reasons
rsDeliveryExtensionNotFound The delivery extension, that which been attempted to be used, is not defined on this report server.
rsJobWasCanceled The job has been cancelled by an administrator.
rsScheduleAlreadyExists You have attempted to create or rename a schedule that already exists.
rsScheduleNotFound The referenced schedule cannot be found in the report server database.
rsSchedulerNotResponding The scheduling engine has hung and is not responding.
rsSubscriptionNotFound The referenced subscription cannot be found in the report server database.
rsTaskNotFound The references task does not exist or cannot be found.
507
Troubleshooting
68787_AppendixA.qxp 26/03/2004 3:57 PM Page 507

68787_AppendixA.qxp 26/03/2004 3:57 PM Page 508

Migrating Access Reports
The following Access report controls, property settings, and other report elements will beconverted to report items in SQL Server Reporting Services if supported.
Controls
Table continued on following page
Control Converted to Item
Label Textbox
Textbox Textbox
Option Group (unsupported)
Toggle Button (unsupported)
Option Button (unsupported)
Check Box (unsupported)
Combo Box (unsupported)
List Box (unsupported)
Command Button (unsupported)
Image Image
Unbound Object Frame (unsupported)
Bound Object Frame (unsupported)
BBB
68787_AppendixB.qxp 26/03/2004 3:58 PM Page 509

Appendix B
510
Property SettingsProperty Supported
BackColor Yes
BackStyle Yes
BorderColor Yes
BorderStyle Yes
BorderWidth Yes
BottomMargin Yes
CanGrow (section) No
CanGrow (textbox) Yes
CanShrink (section) No
CanShrink (textbox) Yes
Caption Yes
DecimalPlaces No
FastLaserPrinting No
Filter No
FilterOn No
FontBold Yes
Control Converted to Item
Page Break (unsupported)
Tab Control (unsupported)
Sub form Subreport
Sub report Subreport
Line Line
Rectangle Rectangle
ActiveX Controls (unsupported)
68787_AppendixB.qxp 26/03/2004 3:58 PM Page 510

Table continued on following page
Property Supported
FontItalic Yes
FontName Yes
FontSize Yes
FontUnderline Yes
FontWeight Yes
ForceNewPage Yes
ForeColor Yes
Format No
FormatConditions No
GrpKeepTogether No
Height Yes
HideDuplicates Yes
Hyperlink Yes
IsHyperlink Yes
IsVisible Yes
KeepTogether (group) Yes
KeepTogether (section) No
Left Yes
LeftMargin Yes
LineSlant Yes
LineSpacing Yes
LinkChildFields Yes
LinkMasterFields Yes
NewRowOrCol Yes
NumeralShapes No
511
Migrating Access Reports
68787_AppendixB.qxp 26/03/2004 3:58 PM Page 511

Property Supported
Orientation No
PageFooter Yes
PageHeader Yes
Pages Yes
PaintPalette No
PaletteSource No
Picture Yes
PictureAlignment No
PicturePages No
PictureSizeMode No
PictureTiling (image) No
PictureTiling (report) Yes
ReadingOrder Yes
RepeatSection Yes
RightMargin Yes
RunningSum Yes
ScrollBars No
SizeMode Yes
SpecialEffect No
TextAlign Yes
Top Yes
TopMargin Yes
Vertical No
Width Yes
512
Appendix B
68787_AppendixB.qxp 26/03/2004 3:58 PM Page 512

FunctionsNearly all common expression functions (VBA and Access SQL) are supported by Reporting Services orhave Visual Basic .NET equivalents. The following domain aggregate functions are not supported anddo not have equivalent functionality. Equivalent aggregate functions exist in Transact SQL, but theseneed to be applied within a query rather than on item properties.
Report Elements
Table continued on following page
Element Supported Comment
VBA Code Modules Yes
Events No
Parameterized queries Yes
Expression functions Yes Reporting Services supports most VBA or Access SQL functions that are allowed in Access property expressions. All supported functions are converted to the Visual
Function Supported
DAvg No
DCount No
DFirst No
DLast No
DLookup No
DMax No
DMin No
DStDev No
DStDevP No
DSum No
DVar No
DVarP No
513
Migrating Access Reports
68787_AppendixB.qxp 26/03/2004 3:58 PM Page 513

Appendix B
514
During report conversion, the Access database or project is opened during the report conversion process.Although the conversion engine handles most unsupported conversion issues gracefully, errors cancause the process to stall under some conditions. In this case, the Access database may be left with openlocks on it and you won't be able to open the database. In this case, delete the corresponding ldb fileafter closing Visual Studio. In extreme cases, you may need to reboot the computer first.
Element Supported Comment
Expression functions (continued)
Basic .NET equivalents. The most significant functions, commonly used in Access expressions and not supported by ReportingServices are the domain aggregate functions.
Access data source – Access tables
Yes Connection string refers to the original Accessdatabase.
Access data source – linked tables
No Connection string refers to the original Access database not the source of the linked tables.
Remote data source in Access Data Project (ADP)
Partial ODBC and OLEDB sources are supported but certain characters are not allowed in names ( ';', '<', or '>').
Group section Yes Appropriate sorting and grouping properties are applied to detail sections. Nested groupings are created for additional group sections.
Field names and variable Yes Names are converted according to Reporting Services rules. Field names that are the same as control/item names are modified and names containing spaces are modified. Any variable names that don't correspond to fields are converted to report parameters.
Image formats Yes All image formats are converted to BMP and stored as embedded images.
68787_AppendixB.qxp 26/03/2004 3:58 PM Page 514

Reporting Services ObjectModel
Reporting Services exposes its Application Program Interface (API) through the Reporting ServicesWeb Service that interacts with the actual Reporting Server. This appendix is meant to be a quickreference to the programmatic functionality that Reporting Services exposes through this webservice.
Relevant code for both C# and VB.NET has been provided in this chapter. Book formattingconstraints may cause the code lines to wrap. However, note that the VB.NET code lines shouldreside on one line in the code editor, note that no underscore has been inserted in such cases.
CancelBatchThis method cancels a batch of commands that are created by using CreateBatch and associatedwith a particular BatchID. The BatchID can be changed to a value equal to the BatchIDgenerated when the batch was created through the BatchHeaderValue property of the webservice. When CancelBatch is called, any calls associated with that BatchID value cannot beexecuted.
C#
public void CancelBatch();
VB.NET
Public Sub CancelBatch()
CCC
68787_AppendixC.qxp 26/03/2004 3:58 PM Page 515

Appendix C
516
CancelJobA job is a task that a report server is actively processing. CancelJob cancels execution of a job bypassing in the JobID associated with that job.
C#public bool CancelJob(string JobID);
VB.NETPublic Function CancelJob(ByVal JobID As String) As Boolean
CreateBatchThe CreateBatch method creates a batch that allows the execution of multiple methods within thescope of a single transaction. Upon execution, this method returns a BatchID. This batch identifier isused to group commands and can be accessed through the BatchHeaderValue property of the webservice.
C#public string CreateBatch();
VB.NETPublic Function CreateBatch() As String
CreateDataDrivenSubscriptionThis method creates a data-driven subscription for a specified report. It requires passing in the extensionsettings for the preferred delivery mechanism as well as the DataRetrievalPlan and event type thatwill cause the report to be delivered. The return value is a unique identifier for the new subscription.
C#public string CreateDataDrivenSubscription(string Report, ExtensionSettings ExtensionSettings, DataRetrievalPlan DataRetrievalPlan, string Description,string EventType, string MatchData, ParameterValueOrFieldReference[] Parameters);
VB.NETPublic Function CreateDataDrivenSubscription(ByVal Report As String, ByVal ExtensionSettings As ExtensionSettings, ByVal DataRetrievalPlan As DataRetrievalPlan, ByVal Description As String, ByVal EventType As String, ByVal MatchData As String, ByVal Parameters As ParameterValueOrFieldReference()) As String
CreateDataSourceThis method creates a new data source in the Reporting Server database. It is sensitive because itcontains username and password information, and depending on the settings of the server, may requirethat it be executed only over SSL.
68787_AppendixC.qxp 26/03/2004 3:58 PM Page 516

C#public void CreateDataSource(string DataSource, string Parent, bool Overwrite, DataSourceDefinition Definition, Property[] Properties);
VB.NETPublic Sub CreateDataSource(ByVal DataSource As String, ByVal Parent As String, ByVal Overwrite As Boolean, ByVal Definition As DataSourceDefinition, ByVal Properties As Property())
CreateFolderThe CreateFolder method creates a logical folder on the Reporting Server in which items such asreports or data sources may be placed. If you are creating a nested folder hierarchy, then you must passin the full path of the parent folder. In addition, you must pass a collection of custom properties for thefolder. These properties can be used to search by or provide detailed information about the folder.
C#public void CreateFolder(string Folder, string Parent, Property[] Properties);
VB.NETPublic Sub CreateFolder(ByVal Folder As String, ByVal Parent As String, ByVal Properties As Property())
CreateLinkedReportA linked report is defined as a report that does not contain a full report definition in the ReportingServer, and is primarily created for the purpose of being included in other reports. This method creates areport and requires that you pass in the name of the linked report, the path of the report, the path to thereport definition upon which you are basing the report, and the report properties.
C#public void CreateLinkedReport(string Report, string Parent, string Link,Property[] Properties);
VB.NETPublic Sub CreateLinkedReport(ByVal Report As String, ByVal Parent As String,ByVal Link As String, ByVal Properties As Property())
CreateReportThe CreateReport method adds a new report to the Reporting Server database. It requires that youpass in the path where you want the report to be created, a Boolean value indicating whether you wantan existing report with the same name to be overridden, the report itself, and any custom properties thatyou would like applied to the report.
517
Reporting Services Object Model
68787_AppendixC.qxp 26/03/2004 3:58 PM Page 517

C#public Warnings[] CreateReport(string Report, string Parent, bool Overwrite,byte[] Definition, Property[] Properties, [out] ref Warning[] Warnings);
VB.NETPublic Function CreateReport(ByVal Report As String, ByVal Parent As String, ByVal Overwrite As Boolean, ByVal Definition As Byte(), ByVal Properties As Property()) As Warning()
CreateReportHistorySnapshotA snapshot of a report is a view of that report frozen at a certain point in time. This method generates areport history snapshot of a specified report. All the subreport items and parameters are also stored ashistory. A string is returned which is a unique snapshot identifier.
C#public string CreateReportHistorySnapshot(string Report,[out] ref Warning[] Warnings);
VB.NETPublic Function CreateReportHistorySnapshot(ByVal Report As String, ByRef WarningsAs Warning()) As String
CreateResourceThis method adds a new resource to the Reporting Server database. It requires that you pass in theresource, the parent directory, a Boolean value indicating whether to overwrite an existing resource withthe same name, the MIME type of the resource, and any properties that you want to specify.
C#public void CreateResource(string Resource, string Parent, bool Overwrite, byte[] Contents, string MimeType, Property[] Properties);
VB.NETPublic Sub CreateResource(ByVal Resource As String, ByVal Parent As String, ByVal Overwrite As Boolean, ByVal Contents As Byte(), ByVal MimeType As String, ByVal Properties As Property())
518
Appendix C
68787_AppendixC.qxp 26/03/2004 3:58 PM Page 518

CreateRoleThis method creates a new security role in the Reporting Server database. The required fields are a stringrole name, a description of the role, and a collection of tasks that you want the role to performrepresented by task IDs.
C#
public void CreateRole(string Name, string Description, Task[] Tasks);
VB.NETPublic Sub CreateRole(ByVal Name As String, ByVal Description As String, ByVal Tasks As Task())
CreateScheduleThe CreateSchedule method allows the developer to create a shared schedule that can be used by asubscription to deliver reports. The name of the schedule and a ScheduleDefinition object thatdescribes the schedule are the required parameters. The return value is a unique schedule ID thatidentifies the newly created schedule.
C#
public string CreateSchedule(string Name, ScheduleDefinition ScheduleDefinition);
VB.NETPublic Function CreateSchedule(ByVal Name As String, ByVal ScheduleDefinition As ScheduleDefinition) as String
CreateSubscriptionCreates a subscription for a specified report in the Reporting Server database. The required parametersare the name of the report, the delivery extension to use, a user friendly description, the event that willcause the subscription to be run, and match data that is needed by the EventType object. This methodreturns a unique subscription ID for the newly created subscription.
C#public string CreateSubscription(string Report, ExtensionSettings ExtensionSettings, string Description, string EventType, string MatchData, ParameterValue[] Parameters);
519
Reporting Services Object Model
68787_AppendixC.qxp 26/03/2004 3:58 PM Page 519

VB.NETPublic Function CreateSubscription(ByVal Report As String, ByVal ExtensionSettingsAs ExtensionSettings, ByVal Description As String, ByVal EventType As String, ByVal MatchData As String, ByVal Parameters As ParameterValue()) As String
DeleteItemThe DeleteItem method deletes a specified item from the Reporting Server database as well as anyobjects that are related to that item, such as properties, subscriptions, or snapshots. It takes the full pathto the item to be deleted as a string parameter.
C#
public void DeleteItem(string Item);
VB.NET
Public Sub DeleteItem(ByVal Item As String)
DeleteReportHistorySnapshotThis method deletes an individual report history snapshot for a specified report. It requires that youpass in the path to the report and an identifier for the specific history to be removed.
C#
public void DeleteReportHistorySnapshot(string Report, string HistoryID);
VB.NETPublic Sub DeleteReportHistorySnapshot(ByVal Report As String, ByVal HistoryID As String)
DeleteRoleIt deletes a specified role from the Reporting Server database. In addition, all the policies associated withthis role are also deleted. It requires you to pass in the name of the role to be deleted.
C#
public void DeleteRole(string Name);
VB.NET
Public Sub DeleteRole(ByVal Name As String)
520
Appendix C
68787_AppendixC.qxp 26/03/2004 3:58 PM Page 520

DeleteScheduleThe DeleteSchedule method deletes a specific schedule from the Reporting Server database. Anyreports that were scheduled to run based on this schedule will no longer be processed. It requirespassing in a string value representing the ID of the schedule.
C#
public void DeleteSchedule(string ScheduleID);
VB.NET
Public Sub DeleteSchedule(ByVal ScheduleID As String)
DeleteSubscriptionThis method allows the user to delete a subscription to a specified report. Executing the method requiresthe subscription ID of the subscription to be deleted.
C#
public void DeleteSubscription(string SubscriptionID);
VB.NET
Public Sub DeleteSubscription(ByVal SubscriptionID As String)
DisableDataSourceThis method allows the developer to disable a specific data source. Reports and subscriptions that usethe specified data source will not run. It requires passing in the name of the data source that is to bedisabled.
C#
public void DisableDataSource(string DataSource);
VB.NET
Public Sub DisableDataSource(ByVal DataSource As String)
EnableDataSourceThis method enables a data source that was previously disabled.
521
Reporting Services Object Model
68787_AppendixC.qxp 26/03/2004 3:58 PM Page 521

C#
public void EnableDataSource(string DataSource);
VB.NET
Public Sub EnableDataSource(ByVal DataSource As String)
ExecuteBatchA batch identifier is returned when the CreateBatch Method is used. To execute a batch, the developersets the BatchHeaderValue property of the web service proxy class to the appropriate batch ID. Allmethods that are associated with this batch ID will execute within the scope of a single databasetransaction.
C#
public void ExecuteBatch();
VB.NET
Public Sub ExecuteBatch()
FindItemsFindItems returns items that match the specified search criteria. The required parameters are the folderto search, logical operators AND and OR, and a collection of search conditions. The return value is theCatalogItem collection.
C#public CatalogItem[] FindItems(string Folder, BooleanOperatorEnum BooleanOperator, SearchCondition[] Conditions)
VB.NETPublic Function FindItems(ByVal Folder As String, ByVal BooleanOperator As BooleanOperatorEnum, ByVal Conditions As SearchCondition())As CatalogItem())
FireEventFireEvent causes an event to be fired. Required parameters are the event to be fired and the datarequired by the event.
C#
public void FireEvent(string EventType, string EventData);
522
Appendix C
68787_AppendixC.qxp 26/03/2004 3:58 PM Page 522

VB.NET
Public Sub FireEvent(ByVal EventType As String, ByVal EventData As String)
FlushCacheFlushCache invalidates the cache for an individual report. The name of the report is the only parameterpassed to this method.
C#public void FlushCache(string Report);
VB.NETPublic Sub FlushCache(ByVal Report As String)
GetCacheOptionsThis method returns the cache configuration for a report and the ExpirationDefinition settings thatdescribe when the cached copy of the report expires. The return value is a Boolean value indicatingwhether the report is in the cache or not.
C#public bool GetCacheOptions(string Report, [out] ref ExpirationDefinition
Expiration );
VB.NETPublic Function GetCacheOptions(ByVal Report As String, [out] ByRef Expiration As ExpirationDefinition) As Boolean
GetDataDrivenSubscriptionPropertiesThis method returns the properties of a data-driven subscription. The required parameter is the ID of thesubscription. The other parameters are declared but not initialized. They will be returned with validvalues representing the settings of the subscription. They are the extension settings, the data retrievalplan, a description of the subscription, the current status of the subscription, the type of event thatcauses the subscription to fire, and the match data for the event.
C#public string GetDataDrivenSubscriptionProperties(string DataDrivenSubscriptionID, [out] ref ExtensionSettings ExtensionSettings, [out] ref DataRetrievalPlan DataRetrievalPlan, [out] ref string Description, [out] ref ActiveState Active, [out] ref string Status, [out] ref string EventType, [out] refstring MatchData, [out] ref ParameterValueOrFieldReference[] Parameters);
523
Reporting Services Object Model
68787_AppendixC.qxp 26/03/2004 3:58 PM Page 523

VB.NETPublic Function GetDataDrivenSubscriptionProperties(ByVal DataDrivenSubscriptionIDAs String,[out] ByRef ExtensionSettings As ExtensionSettings, [out] ByRef DataRetrievalPlan As DataRetrievalPlan, [out] ByRef Description As String, [out] ByRef Active As ActiveState, [out] ByRef Status As String, [out] ByRef EventTypeAs String, [out] ByRef MatchData As String, [out] ByRef Parameters As ParameterValueOr FieldReference())
GetDataSourceContentsGetDataSourceContents returns a DataSourceDefinition object representing the contents of a datasource. The required parameter is the name of the data source.
C#
public DataSourceDefinition GetDataSourceContents(string DataSource);
VB.NETPublic Function GetDataSourceContents(ByVal DataSource As String) As DataSource Definition
GetExecutionOptionsThis method returns the execution options and associated settings for an individual report. The requiredparameters are the name of the report and an uninitialized ScheduleDefinition object. This object willbe returned with its properties set to the values for the report. The return value is an enum datatype thatindicates whether the report is based on live data or a snapshot.
C#public ExecutionSettingEnum GetExecutionOptions(string Report, [out] ref ExecutionSettingEnum ExecutionSetting, [out] ref ScheduleDefinitionOrReference Schedule);
VB.NETPublic Function GetExecutionOptions(ByVal Report As String,[out] ByRef Schedule As ScheduleDefinitionOrReference) As ExecutionSettingEnum
GetExtensionSettingsThis method requires that you to pass in the name of an extension. The return value is an array ofknown parameters for the specific extension.
524
Appendix C
68787_AppendixC.qxp 26/03/2004 3:58 PM Page 524

C#
public ExtensionParameter[] GetExtensionSettings(string Extension);
VB.NETPublic Function GetExtensionSettings(ByVal Extension As String)As ExtensionParameter())
GetItemTypeIt retrieves the type of an item, if it exists in the Reporting Server database. The required parameter is thename of the object. The return value is an enumeration representing the type of object.
C#
public ItemTypeEnum GetItemType(string Item);
VB.NET
Public Function GetItemType(ByVal Item As String)
GetPermissionsGetPermissions returns a string array containing a list of user permissions that are associated with aparticular item in the Reporting Server database. The required input parameter is a string representingthe name of the item.
C#
public void GetPermissions(string Item, [out] ref string[] Permissions);
VB.NETPublic Sub GetPermissions(ByVal Item As String, [out] ByRef Permissions As _String())
GetPoliciesGetPolicies returns an array of Policy objects that are associated with a particular item as well as aBoolean value indicating whether the item inherits those policies from its parent.
C#public Policy[] Policies, GetPolicies(string Item, [out] ref bool InheritParent);
525
Reporting Services Object Model
68787_AppendixC.qxp 26/03/2004 3:58 PM Page 525

VB.NETPublic Function GetPolicies(ByVal Item As String, [out] ByRef Policies As Policy(), [out] ByRef InheritParent As Boolean)
GetPropertiesGetProperties returns property values for a particular report object. You need to pass in an array ofProperty objects with names initialized and the method returns those objects with their values set.
C#public Property[] GetProperties(string Item, Property[] Properties);
VB.NETPublic Function GetProperties(ByVal Item As String, ByVal Properties As Property()) As Property()
GetRenderResourceGetRenderResource returns the resource for a specified rendering extension format. It requires thatyou pass in the format to use for processing device-specific information and the MIME type of theresource. It returns the resource as a base-64 encoded byte array.
C#public void GetRenderResource(string Format, string DeviceInfo, [out] ref byte[] Result, [out] ref string MimeType);
VB.NETPublic Sub GetRenderResource(ByVal Format As String, ByVal DeviceInfo As String, [out] ByRef Result As Byte(), [out] ByRef MimeType As String)
GetReportDataSourcePromptsThis method returns an array of DataSourcePrompt objects. These are used to present prompts to theuser for required connection values such as username and password. The only parameter is a stringrepresenting the full path to the data resource.
C#
public DataSourcePrompt[] GetReportDataSourcePrompts(string Report)
VB.NETPublic Function GetReportDataSourcePrompts(ByVal Report As String) As DataSourcePrompt()
526
Appendix C
68787_AppendixC.qxp 26/03/2004 3:58 PM Page 526

GetReportDataSourcesWhile using this method, a developer passes in the full path to a report and this method returns an arrayof DataSource objects that are associated with that report.
C#
public DataSource[] GetReportDataSources(string Report);
VB.NET
Public Function GetReportDataSources(ByVal Report As String) As DataSource()
GetReportDefinitionThis method retrieves the report definition for a report in base-64 encoded byte format. It can then beconverted into Report Definition Language (RDL) for use in tools such as Visual Studio.
C#public byte[] GetReportDefinition(string Report);
VB.NETPublic Function GetReportDefinition(ByVal Report As String)As Byte()
GetReportHistoryLimitThis method returns an integer that indicates the number of snapshot history reports to maintain. Therequired parameters are the name of the report, a Boolean value that will be altered in the method toreflect whether the report has its own limit or uses the system limit, and an integer that will be returnedwith the value of the current system limit.
C#public int GetReportHistoryLimit(string Report, [out] ref bool IsSystem, [out] ref int SystemLimit);
VB.NETPublic Function GetReportHistoryLimit(ByVal Report As String, , ByRef IsSystem As Boolean, ByRef SystemLimit As Integer)
GetReportHistoryOptionsThis method returns the report history snapshot options and properties that are generated for a reportby passing in the report name. The method returns a Boolean variable that indicates whether the reportallows the creation of manual snapshots. The property information is retrieved by output parameters,
527
Reporting Services Object Model
68787_AppendixC.qxp 26/03/2004 3:58 PM Page 527

which indicate whether snapshots have been kept and a schedule definition is associated with thereport.
C#public bool GetReportHistoryOptions(string Report,[out] ref bool KeepExecutionSnapshots, [out] ref ScheduleDefinitionOrReference Schedule);
VB.NETPublic Function GetReportHistoryOptions(ByVal Report As String,[out] ByRef KeepExecutionSnapshots As Boolean, [out] ByRef Schedule As ScheduleDefinitionOrReference) as Bool
GetReportLinkThe GetReportLink method returns the full path of the report, the report definition of which is used forthe specified linked report. The only parameter is the name of the report referred for the reportdefinition.
C#
public string GetReportLink(string Report, [out] ref string Link);
VB.NET
Public Sub GetReportLink(ByVal Report As String) As String
GetReportParametersThis method returns report parameters for a specified report. The first parameter is the name of thereport. The next two parameters are used together. If a HistoryId is provided and the ForRenderingparameter is set to true, the returned properties belong to a snapshot of the provided report. TheParameterValues argument can be used to verify valid parameters against a report. The Credentialsparameter returns the credentials to use to validate and check the parameters.
C#public ReportParameter[] GetReportParameters(string Report, string HistoryID, bool ForRendering, ParameterValue[] Values, DataSourceCredentials[] Credentials) Parameters);
VB.NETPublic Function GetReportParameters(ByVal Report As String, ByVal HistoryID As String, ByVal ForRendering As Boolean, ByVal Values As ParameterValue(), ByVal Credentials As DataSourceCredentials()) As ReportParameter())
528
Appendix C
68787_AppendixC.qxp 26/03/2004 3:58 PM Page 528

GetResourceContentsThis method requires the developer to pass in the resource that needs retrieval. The method returns aMIME type and the value of the resource as a base-64 encoded byte array.
C#
Public byte[] GetResourceContents(string Resource, [out] ref string MimeType);
VB.NETPublic Function GetResourceContents(ByVal Resource As String, ByRef MimeType As String) As Byte()
GetRolePropertiesThis method returns a collection of tasks associated with a given role. The description string argumentwill contain the description for the role.
C#
public Task[] GetRoleProperties(string Name,[out] ref string Description);
VB.NETPublic Function GetRoleProperties(ByVal Name As String, ByRef Description As String) as Task()
GetSchedulePropertiesThis method returns a Schedule object containing the schedule definition for a single shared scheduleby passing in a specific schedule ID.
C#
public Schedule GetScheduleProperties(string ScheduleID);
VB.NET
Public Function GetScheduleProperties(ByVal ScheduleID As String) As Schedule
529
Reporting Services Object Model
68787_AppendixC.qxp 26/03/2004 3:58 PM Page 529

GetServerDateTimeThis method is described in the documentation but does not exist in the Beta version. It supposedlyreturns the current date and time of the computer that is running the report server scheduler. It exists inthe internal Reporting Server classes but is not exposed through the WSDL-generated proxy class.
C#
public DateTime GetServerDateTime();
VB.NET
Public Function GetServerDateTime()
GetSubscriptionPropertiesThe GetSubscriptionProperties method returns a subscription and the associated information for aspecified report in the Reporting Server database. The required parameters are the name of the report, adelivery extension object, a string to hold a user-friendly description, an Event object, and match datathat is needed by the EventType object. It also returns a string representing the owner of thesubscription. All of the parameters except the subscription have no initial value, but return the settingsfor the subscription after the method executes.
C#public string GetSubscriptionProperties(string SubscriptionID,[out] ref ExtensionSettings ExtensionSettings, [out] ref string Description, [out] ref ActiveState Active, [out] ref string Status, [out] ref string EventType, [out] ref string MatchData, [out] ref ParameterValue[] Parameters);
VB.NETPublic Sub GetSubscriptionProperties(ByVal SubscriptionID As String,[out] ByRef ExtensionSettings As ExtensionSettings, [out] ByRef Description As String, [out] ByRef Active As ActiveState, [out] ByRef Status As String, [out] ByRef EventTypeAs String, [out] ByRef MatchData As String, [out] ByRef Parameters As ParameterValue())
GetSystemPermissionsThis retrieves a string array representing the system permissions of the current user. An example of avalid permission is the Create Roles permission.
C#public string[] GetSystemPermissions();
VB.NETPublic Function GetSystemPermissions( ) as String()
530
Appendix C
68787_AppendixC.qxp 26/03/2004 3:58 PM Page 530

GetSystemPoliciesThis method returns an array of Policy objects representing groups and associated roles.
C#public Policy[] GetSystemPolicies();
VB.NETPublic Function GetSystemPolicies() As Policy()
GetSystemPropertiesThis method requires passing in an array of Property objects with names initialized to the propertiesthat you are interested in. The method returns this array of properties with their values from the systemindicating the system status.
C#public Property[] GetSystemProperties(Property[] Properties, [out] ref Property[] Values);
VB.NET
Public Function GetSystemProperties(ByVal Properties As Property()) As Property()
InheritParentSecurityThis method deletes all the policies associated with an item, thereby causing it to inherit policies from itsparent.
C#
public void InheritParentSecurity(string Item);
VB.NET
Public Sub InheritParentSecurity(ByVal Item As String)
ListChildrenThis method returns a CatalogItem array when passed a string value representing a specified folder. ABoolean value that indicates whether the search should be recursive and traverse the entire directorystructure of the path below the specified folder is also required.
531
Reporting Services Object Model
68787_AppendixC.qxp 26/03/2004 3:58 PM Page 531

C#
public CatalogItem[] ListChildren(string Item, bool Recursive);
VB.NETPublic Function ListChildren(ByVal Item As String, ByVal Recursive As Boolean) As CatalogItem()
ListEventsThis method returns an array of events that are defined on the report server.
C#Public Event[] ListEvents()
VB.NETPublic Function CancelBatch() As Event
ListExtensionsIt returns a list of Extension objects that are configured for a given extension type such as delivery,rendering, or data. The parameter is an enumeration representing all of the extension types.
C#public Extension[] ListExtensions(ExtensionTypeEnum ExtensionType );
VB.NETPublic Sub ListExtensions(ByVal ExtensionType As ExtensionTypeEnum)As Extension()
ListJobsThis method returns an array of Jobs that represent information about currently running jobs on thereport server.
C#public Jobs[] ListJobs();
VB.NETPublic Function ListJobs()As Job()
ListLinkedReportsThe ListLinkedReports method returns an array of catalog items that are linked to the specifiedreport.
532
Appendix C
68787_AppendixC.qxp 26/03/2004 3:58 PM Page 532

C#public CatalogItem[] ListLinkedReports(string Report);
VB.NET
Public Function ListLinkedReports(ByVal Report As String) As CatalogItem()
ListReportHistoryThis method returns an array of report history snapshots and their properties for a specified report.
C#
public ReportHistorySnapshot[] ListReportHistory(string Report)
VB.NET
Public Function ListReportHistory(ByVal Report As String)As ReportHistorySnapshot()
ListReportsUsingDataSourceThis method returns an array of reports that are associated with a shared data source.
C#
public CatalogItem[] ListReportsUsingDataSource(string DataSource);
VB.NETPublic Function ListReportsUsingDataSource(ByVal DataSource As String)As CatalogItem()
ListRolesIt returns an array of Roles defined on the report server from which their names and descriptions canbe extracted.
C#
public Roles[] ListRoles();
VB.NET
Public Function ListRoles() As Role()
LIstScheduledReportsThis method returns an array of reports that are associated with a shared schedule.
533
Reporting Services Object Model
68787_AppendixC.qxp 26/03/2004 3:58 PM Page 533

C#
public CatalogItem[] ListScheduledReports(string ScheduleID);
VB.NET
Public Function ListScheduledReports(ByVal ScheduleID As String) As CatalogItem()
ListSchedulesThis method returns an array containing all the shared schedules on the report server.
C#
public Schedule[] ListSchedules();
VB.NET
Public Function ListSchedules()As Schedule()
ListSecureMethodsIt returns a string array of methods that require a secure connection when invoked.
C#
public string[] ListSecureMethods();
VB.NET
Public Function ListSecureMethods() As String()
ListSubscriptionsThe ListSubscriptions method returns an array of Subscription objects that have been created fora given report for a specific user. This array includes both standard and data-driven subscriptions.
C#
public Subscription[] ListSubscriptions(string Report, string Owner);
VB.NETPublic Function ListSubscriptions(ByVal Report As String, ByVal Owner As String) As Subscription()
ListSubscriptionsUsingDataSourceThis method returns a list of subscriptions associated with a given data source.
534
Appendix C
68787_AppendixC.qxp 26/03/2004 3:58 PM Page 534

C#
public Subscription[] ListSubscriptionsUsingDataSource(string DataSource);
VB.NETPublic Function ListSubscriptionsUsingDataSource(ByVal DataSource As String) As Subscription()
ListSystemRolesIt returns an array of Role objects from which the names and descriptions of system roles can beextracted.
C#
public Role[] ListSystemRoles();
VB.NET
Public Sub ListSystemRoles() As Role()
ListSystemTasksThe ListSystemTasks method returns an array of Task objects from which system task informationcan be extracted. System level tasks are specific to the Reporting Server, such as managing sharedschedules or server roles.
C#public Task[] ListSystemTasks();
VB.NETPublic Function ListSystemTasks() As Task()
ListTasksThis method returns an array of Task objects from which item task information may be extracted. Anexample of an item-level task is viewing a folder or a report.
C#public Task[] ListTasks();
VB.NETPublic Function ListTasks() As Task()
535
Reporting Services Object Model
68787_AppendixC.qxp 26/03/2004 3:58 PM Page 535

MoveItemThe MoveItem method moves or renames an item in the Reporting Server database; required parametersare the original location and the destination path.
C#public void MoveItem(string Item, string Target);
VB.NETPublic Sub MoveItem(ByVal Item As String, ByVal Target As String)
PauseScheduleThis method pauses the execution of a given shared schedule. The required parameter is the associatedschedule ID.
C#public void PauseSchedule(string ScheduleID);
VB.NETPublic Sub PauseSchedule(ByVal ScheduleID As String)
PrepareQueryThis method returns a dataset containing the fields retrieved by the delivery query for a data-drivensubscription. The parameters are the data source to be used, the data definition object, and a Booleanvalue to indicate whether the data definition has changed.
C#public DataSetDefinition PrepareQuery(DataSource datasource, DataSetDefinition dataset,Boolean changed);
VB.NETPublic Sub PrepareQuery(ByVal DataSource As DataSource, ByVal DataSet As DataSetDefinition, ByRef Changed As Boolean)
RenderThe Render method processes a specified report and renders it in a specified format. The requiredparameters are the report name, the report format (HTML, PDF, and so on), a history ID if a snapshot isto be used, an XML string providing device-specific information, the report parameters, the credentialsused to access the data, a toggle to show or hide the ID, the encoding mechanism (UTF-8, UTF-16, and soon), an array of parameters to be filled with the used parameters if the report is a snapshot, a Warningcollection to be filled with any warnings that occur, and a collection of streams representing any externalresources. The return value is an array of bytes representing the rendered stream.
536
Appendix C
68787_AppendixC.qxp 26/03/2004 3:58 PM Page 536

C#public byte Render(string Report, string Format, string HistoryID, string DeviceInfo, ParameterValue[] Parameters, DataSourceCredentials[] Credentials, string ShowHideToggle,[out] ref string Encoding, [out] ref string MimeType, [out] ref ParameterValue[] ParametersUsed, [out] ref Warning[] Warnings, [out] ref string[] StreamIds);
VB.NETPublic Function Render(ByVal Report As String, ByVal Format As String, ByVal HistoryID As String, ByVal DeviceInfo As String, ByVal Parameters As ParameterValue(), ByVal Credentials As DataSourceCredentials(), ByVal ShowHideToggle As String,[out] ByRef Encoding As String, [out] ByRef MimeType As String, [out] ByRef ParametersUsed As ParameterValue(), [out] ByRef Warnings As Warning(), [out] ByRef StreamIds As String())
RenderStreamThe RenderStream method returns a byte array of the requested stream associated with a renderedreport. This method is called to render a specific external resource, such as an image, within a report.
C#public byte RenderStream(string Report, string Format, string StreamID, string HistoryID, string DeviceInfo, ParameterValue[] Parameters,[out] ref string Encoding, [out] ref string MimeType);
VB.NETPublic Sub RenderStream(ByVal Report As String, ByVal Format As String, ByVal StreamID As String, ByVal HistoryID As String, ByVal DeviceInfo As String, ByVal Parameters As ParameterValue(),ByRef Encoding As String, ByRef MimeType As String)
ResumeScheduleThis method is used to resume from a shared schedule that has been paused.
C#public void ResumeSchedule(string ScheduleID);
VB.NETPublic Sub ResumeSchedule(ByVal ScheduleID As String)
SetCacheOptionsThis method configures caching options for a specified report. Parameters of the report, a Boolean valuethat indicates whether to create a cache of the report, and an expiration definition or date that controlshow long the report is in the cache are passed to this function.
537
Reporting Services Object Model
68787_AppendixC.qxp 26/03/2004 3:58 PM Page 537

C#public void SetCacheOptions(string Report, bool CacheReport, ExpirationDefinition Expiration);
VB.NETPublic Sub SetCacheOptions(ByVal Report As String, ByVal CacheReport As Boolean, ByVal Expiration As ExpirationDefinition)
SetDataDrivenSubscriptionPropertiesThis method sets the properties of a data-driven subscription.
C#public void SetDataDrivenSubscriptionProperties(string DataDrivenSubscriptionID, ExtensionSettings ExtensionSettings, DataRetrievalPlan DataRetrievalPlan, string Description, string EventType, string MatchData, ParameterValueOrFieldReference[] Parameters);
VB.NETPublic Sub SetDataDrivenSubscriptionProperties(ByVal DataDrivenSubscriptionID As String, ByVal ExtensionSettings As ExtensionSettings, ByVal DataRetrievalPlan As DataRetrievalPlan, ByVal Description As String, ByVal EventType As String, ByVal MatchData As String, ByVal Parameters As ParameterValueOrFieldReference())
SetDataSourceContentsIt replaces the contents of an existing data source. The parameters are the name of the source and a datadefinition object defining all the source properties.
C#public void SetDataSourceContents(string DataSource, DataSourceDefinition Definition);
VB.NETPublic Sub SetDataSourceContents(ByVal DataSource As String, ByVal Definition As DataSourceDefinition)
SetExecutionOptionsThis method sets the execution options and the associated execution properties for an individual report.The first parameter is the name of the report, followed by an enumeration indicating whether the reportshould be excuted in real-time or scheduled. The third parameter, Schedule, is only used if theexecution is scheduled.
C#public void SetExecutionOptions(string Report, ExecutionSettingEnum ExecutionSetting, ScheduleDefinitionOrReference Schedule);
538
Appendix C
68787_AppendixC.qxp 26/03/2004 3:58 PM Page 538

VB.NETPublic Sub SetExecutionOptions(ByVal Report As String, ByVal ExecutionSetting As ExecutionSettingEnum, ByVal Schedule As ScheduleDefinitionOrReference)
SetPoliciesThis method sets the policies that are associated with a specified item. The required parameters are theitem and an array of Policy objects to place on the specified item.
C#
public void SetPolicies(string Item, Policy[] Policies);
VB.NET
Public Sub SetPolicies(ByVal Item As String, ByVal Policies As Policy())
SetPropertiesIt sets the properties that are associated with a specified item. The required parameters are the item forwhich you will set properties and an array of Property objects to place on the specified item.
C#
public void SetProperties(string Item, Property[] Properties);
VB.NET
Public Sub SetProperties(ByVal Item As String, ByVal Properties As Property())
SetReportDataSourcesIt sets the data sources that are associated with a specified item. The required parameters are the item inquestion and an array of data source objects to place on the specified item.
C#
public void SetReportDataSources(string Report, DataSource[] DataSources);
VB.NETPublic Sub SetReportDataSources(ByVal Report As String, ByVal DataSources As DataSource())
539
Reporting Services Object Model
68787_AppendixC.qxp 26/03/2004 3:58 PM Page 539

SetReportDefinitionThe SetReportDefinition method is used to change a report definition for a specified report. Therequired parameters are the name of the report, followed by an array of bytes that are the reportdefinition. The return value is an array of warnings informing the developer of problems that occur.
C#
public Warning[] SetReportDefinition(string Report, byte[] Definition);
VB.NETPublic Function SetReportDefinition(ByVal Report As String, ByVal Definition As Byte()) As Warning()
SetReportHistoryLimitThis allows the developer to specify the number of snapshots of a report that the report server retains.The required parameters are the name of the report, a Boolean value indicating whether the defaultsystem limit should be used or a specific limit.
C#public void SetReportHistoryLimit(string Report, bool UseSystem, int HistoryLimit);
VB.NETPublic Sub SetReportHistoryLimit(ByVal Report As String, ByVal UseSystem As Boolean, ByVal HistoryLimit As Integer)
SetReportHistoryOptionsThis method allows the developer to sets report history options that control snapshot creation andlifetime. The required parameters are the name of the report, a Boolean value that controls whethermanual snapshots can be created, and a Boolean value indicating whether snapshot histories should bemaintained. You also need to pass in the schedule the snapshot should be created against.
C#public void SetReportHistoryOptions(string Report, bool EnableManualSnapshotCreation, bool KeepExecutionSnapshots, ScheduleDefinitionOrReference Schedule);
VB.NETPublic Sub SetReportHistoryOptions(ByVal Report As String, ByVal EnableManualSnapshotCreation As Boolean, ByVal KeepExecutionSnapshots As Boolean, ByVal Schedule As ScheduleDefinitionOrReference)
540
Appendix C
68787_AppendixC.qxp 26/03/2004 3:58 PM Page 540

SetReportLinkA linked report does not contain a full report definition. This method allows you to specify the reportthat contains the full definition for the report. A linked report may be linked to more than one reportdefinition.
C#
public void SetReportLink(string Report, string Link);
VB.NET
Public Sub SetReportLink(ByVal Report As String, ByVal Link As String)
SetReportParametersThis method allows the developer to specify parameters to a report that it needs in order to beprocessed. The parameters are the name of the report and a collection of parameters, the names of whichmuch match those defined in the report.
C#
public void SetReportParameters(string Report, ReportParameter[] Parameters);
VB.NETPublic Sub SetReportParameters(ByVal Report As String, ByVal Parameters As ReportParameter())
SetResourceContentsResources such as images are stored as byte arrays. The SetResourceContents method allows thedeveloper to replace the contents of an existing resource by passing in a byte array representing the newvalue. The required parameters are the resource to be accessed, the byte array that contains the value,and the MIME type of the resource.
C#public void SetResourceContents(string Resource, byte[] Contents, string MimeType);
VB.NETPublic Sub SetResourceContents(ByVal Resource As String, ByVal Contents As Byte(), ByVal MimeType As String)
541
Reporting Services Object Model
68787_AppendixC.qxp 26/03/2004 3:58 PM Page 541

SetRolePropertiesThis method allows the developer to associate a group of tasks with a specified role. The requiredparameters are the role name and the array of tasks to associate with the role.
C#
public void SetRoleProperties(string Name, string Description, Task[] Tasks);
VB.NETPublic Sub SetRoleProperties(ByVal Name As String, ByVal Description As String, ByVal Tasks As Task())
SetSchedulePropertiesThis method allows the developer to sets the properties of a shared schedule. The required parametersare the name of the report, the schedule ID, and a schedule definition object that contains the scheduleproperties for the report.
C#public void SetScheduleProperties(string Name, string ScheduleID, ScheduleDefinition ScheduleDefinition);
VB.NETPublic Sub SetScheduleProperties(ByVal Name As String, ByVal ScheduleID As String, ByVal ScheduleDefinition As ScheduleDefinition)
SetSubscriptionPropertiesThis method allows the developer to set the properties of a shared subscription. The requiredparameters are the name of the report, the subscription ID, delivery-specific setting information, adescription of the subscription, the event that causes the subscription to run, match data used by thespecific type of event used, and the parameters for the report.
C#public void SetSubscriptionProperties(string SubscriptionID, ExtensionSettings ExtensionSettings, string Description, string EventType, string MatchData, ParameterValue[] Parameters);
VB.NETPublic Sub SetSubscriptionProperties(ByVal SubscriptionID As String, ByVal ExtensionSettings As ExtensionSettings, ByVal Description As String, ByVal EventType As String, ByVal MatchData As String, ByVal Parameters As ParameterValue())
542
Appendix C
68787_AppendixC.qxp 26/03/2004 3:58 PM Page 542

SetSystemPoliciesThis allows the developer to set system policies by passing in an array of Policy objects.
C#public void SetSystemPolicies(Policy[] Policies);
VB.NETPublic Sub SetSystemPolicies(ByVal Policies As Policy())
SetSystemPropertiesThis method allows the developer to set system properties by passing in an array of Property objects.
C#public void SetSystemProperties(Property[] Properties);
VB.NET
Public Sub SetSystemProperties(ByVal Properties As Property())
UpdateReportExecutionSnapshotThis method creates a report history snapshot for a specific report.
C#
public void UpdateReportExecutionSnapshot(string Report);
VB.NET
Public Sub UpdateReportExecutionSnapshot(ByVal Report As String)
ValidateExtensionSettingsThis method allows the developer to validate the Reporting Services extension settings. The requiredparameters are the name of the extension and an array of parameter values to verify. The method returnsan array of extension parameter objects with initialized values if they are valid and error messages ifthey are not.
C#public ExtensionParameter[] ValidateExtensionSettings(string Extension, ParameterValueOrFieldReference[] ParameterValues);
543
Reporting Services Object Model
68787_AppendixC.qxp 26/03/2004 3:58 PM Page 543

VB.NETPublic Function ValidateExtensionSettings (ByVal Extension As String, ByVal ParameterValues As ParameterValueOrFieldReference()) ParameterErrors As ExtensionParameter())
The Reporting Services Web Service proxy class contains several properties that are used to control howReporting Services handles various requests. These properties and a description of their impact onReporting Services are discussed in the following sections.
BatchHeaderValueThis value is used to group multi-method operations against the Reporting Services Web Service.
C#public BatchHeader BatchHeaderValue { get; set; }
VB.NETPublic Property BatchHeaderValue() As BatchHeader
ItemNamespaceHeaderValueThis value is used to retrieve properties for a specific item by setting either the ID or the name of theproperty in the ItemNamespaceHeader.
C#public ItemNamespaceHeader ItenNamespaceHeaderValue { get; set; }
VB.NETPublic Property BatchHeaderValue() As BatchHeader
ServerInfoHeaderValueThis property contains server-related information such as the edition of Reporting Services and theversion information.
C#public ServerInfoHeader ServerInfoHeaderValue { get; set; }
VB.NETPublic Property ServerInfoHeaderValue() As ServerInfoHeader
SessionInfoHeaderValueThis property contains information about the current session such as the session ID and the sessionexpiration time.
544
Appendix C
68787_AppendixC.qxp 26/03/2004 3:58 PM Page 544

C#public SessionInfoHeader SessionInfoHeaderValue { get; set; }
VB.NETPublic Property SessionInfoHeaderValue() As SessionInfoHeader
545
Reporting Services Object Model
68787_AppendixC.qxp 26/03/2004 3:58 PM Page 545

68787_AppendixC.qxp 26/03/2004 3:58 PM Page 546

Transact SQL QueryFunctions and Expressions
Every organization should establish a standard for programming and database object namingconventions. This appendix includes some suggested naming standards and a simplified referenceof common Transact SQL functions and statements for use in query expressions.
Naming ConventionsAlthough a universal, industry-wide naming convention doesn't exist, most experienced databaseprofessionals agree on some basic conventions. Agreeing on a universal standard is not nearly asimportant as an organization having a set of standards upon which they can agree upon, support,and maintain. The following is a list of some of the common objects with some suggested namingconventions.
TablesTable names are not typically prefixed. Some database designers use the tbl prefix but this is lesscommon in client/server databases than in desktop databases like Access. Table names in SQLServer can be in mixed case. Because older database systems have not had a history of supportingmixed-case names, many tenured database professionals still do not use them. A long-standingtradition has been to separate logical words in table names using underscores. You must not try touse any other punctuation character. Although SQL Server supports spaces in names, manyprofessionals don't believe this is a good practice. If spaces are used in object names, the namemust be enclosed in square brackets. For example:
[Customer Orders].[Customer First Name]
In any case, keep names simple yet descriptive.
DDD
68787_AppendixD.qxp 26/03/2004 3:58 PM Page 547

Appendix D
548
Bear in mind that as a database grows in size and supporting tables are added, it is common for tables tobe added with names that will be very similar to others. For this reason, it is recommended that you bemore descriptive as you name tables. Many database professionals also have strong feelings aboutpluralization of table names. Some argue that a table name describes a single instance of a data entity,therefore the name should be singular. In either case just be consistent. Names may end with numbersonly with a good reason but should begin with a letter. Some examples are:
Customer_Order
CustomerOrder
ProductSupplier
ColumnsColumn naming rules (and variations) are similar to tables. Again, it's more important to be consistentwithin your organization than to conform to a universal naming rule. You should be more concernedabout describing the purpose of a column in its name than keeping it short. Column names shouldn'tcontain spaces and may contain underscores. No other punctuation should be used.
ViewsPrefix views with v, vw, or vw_. Because views can represent complex queries it is important to describeits purpose in the name. You could begin the name with the main table or entity name. For example:
vw_CustomerOrderDetailByProductCategory
Stored ProceduresDo not prefix stored procedures with sp_. This is reserved for system-stored procedures. There are twoschools of thought for stored procedure naming. The traditional convention is to use a prefix thatdescribes the type of operation a procedure will perform for a table or entity. For example:
Get_CustomerIns_CustomerUpd_CustomerDel_Customer
The other idea is that if the procedure name begins with the name of the table, all of the related storedprocedures will be listed along with the table. For example:
CustomerCustomer_DelCustomer_GetCustomer_InsCustomer_Upd
68787_AppendixD.qxp 26/03/2004 3:58 PM Page 548

User-Defined FunctionsBecause user-defined functions have been offered only since the release of SQL Server 2000, there hasbeen little time for naming standards to evolve. A simple rule is to prefix all function names with fn_.For example:
fn_FirstName( )fn_CustomersWithOrders( )
When calling a stored procedure, you must use a two-part or multi-part name that identifies the owner.For example, DBO.fn_CustomersWithOrders( ).
Multi-Part NamesAll database objects can be identified using up to four name elements. When programming acrossservers or multiple databases, it may be necessary to use more than just the object name to identify anobject. The complete object name has four parts separated by periods:
SERVER.DATABASE.OWNER.OBJECT
For example:
Production5.CompanySalesDB.DBO.CustomerOrder
Depending on the scope of the reference or code, only part of the name may be necessary:
CompanySalesDB.DBO.CustomerOrderDBO.CustomerOrderCustomerOrder
FunctionsThe following Transact SQL functions are grouped by category:
Numeric Manipulation
Table continued on following page
Function Name Description
CEILING (numeric_value) Converts numeric expressions to actual numeric values. For example, a numeric expression with currency symbol and thousand separator.
CEILING ($1,234.0)
Returns 1234.
COS (numeric value) Cosine of an angle.
COT (numeric value) Cotangent of an angle.
549
Transact SQL Query Functions and Expressions
68787_AppendixD.qxp 26/03/2004 3:58 PM Page 549

String Manipulation
Function Name Description
CHAR (Integer) Returns a character from the ASCII character code
CHAR (65)
Returns A
CHARINDEX (target value string,whole_string string)
CHARINDEX (target value string,whole_string string ,start_position Integer)
Returns an integer indicating the starting position of the first occurrence of the target value that is found within the whole_string value. Often used to locate delimiting characters within a column or static value.
DATALENGTH (string value) Returns the number of characters in a variable-length string.
LEFT (string_value,end_character_int)
Returns a string value that is the left-most characters ending with the end_character.
LEN (string value) Returns an integer indicating the length of a string.
LOWER (string value) Converts all characters of a string to lower case.
Function Name Description
DEGREES (numeric) Converts radians to degrees.
EXP (float) Returns the exponent for a float value.
FLOOR (numeric) Used to round a numeric value to the largest integer not greater than the value.
ISNUMERIC (value) Indicates whether a value can be converted to a number. Returns 1 or 0.
LOG (Float) Returns the logarithm of a value.
LOG10 (Float) Returns the 10-based logarithm of a value.
PI () Returns the constant value of Pi.
POWER (value, exponent value) Calculates the exponent (value raised to the exponent_value).
TAN (numeric value) Returns the tangent of a value.
550
Appendix D
68787_AppendixD.qxp 26/03/2004 3:58 PM Page 550

Table continued on following page
Function Name Description
LTRIM (string value) Trims spaces from the left side (leading) for a string.
NCHAR (character code) Returns a Unicode character for an integer character code. Similar to CHAR but handles Unicode character set.
PATINDEX (pattern_string,value)
Returns the index (integer of the staring position) of a search pattern string found within another string. The pattern_string is any string with wild card characters that could be passed to the LIKE operator.
QUOTENAME (string_value)
QUOTENAME (string_value,quote_string)
Accepts a string with embedded quotes (', ", [ or ])and returns a string with double instances of quote characters to indicate that they are literal.
REPLACE (target_string,replace_characters,new_characters)
In the first string, replaces occurrences of the second string with the third string.
REPLICATE (string_value,repeat_int_value)
Returns a string that consists of the string_valuerepeated a specified number of times.
REVERSE (string_value) Returns a string with characters of the input string in reverse order.
RIGHT (string_value,length_int)
Returns the right-most part of a string. Like the LEFTfunction but reads from the right-most part of the string.
RTRIM (string_value) Removes spaces from the right of a string (trailing).
SOUNDEX (string_value) Returns a four character string to represent a comparative phonetic equivalent. Typically used for sound-alike comparisons.
SPACE (repeat_int_value) Returns a string of spaces (one space repeated a specified number of times).
STR (value) Converts a value to a string.
STUFF (string_value,start_int, length_int,replace_with_string)
Replaces characters in the string_value with characters in the replace_with_string, starting at start_int for a length or length_int.
STUFF ('abcdefghij', 2, 4, 'wxyz')
Returns abwxyzghij
551
Transact SQL Query Functions and Expressions
68787_AppendixD.qxp 26/03/2004 3:58 PM Page 551

Mathematical
Function Name Description
ABS (numeric_value) Absolute value for a number.
ACOS (numeric_value) Angle from a cosine.
ASIN (numeric_value) Angle from a sine.
ATAN (numeric_value) Angle from a tangent.
ATN2 (low_range, high_range) Angle from a range of two tangents.
RADIANS (numeric_value) Converts degrees to radians.
RAND (numeric_seed) Returns a fractional random number between 0 and 1
ROUND (numeric_value, length)
ROUND (numeric_value, length,operation)
Rounds a number to a given length. Optionally truncates if operation argument is greater than 0.
SIGN (numeric_value) Returns + or – for a positive or negative numeric value.
SIN (radians_numeric) Returns the sine of an angle.
SQUARE (numeric_value) Returns the square of a value.
SQRT (numeric_value) Returns the square root of a value.
Function Name Description
SUBSTRING (string_value,start_int, length_int)
Returns part of a string from the start_int for a length of length_int. To return all characters to the right of the starting position, use a length value that is equal to or greater than any possible value.
SUBSTRING ('abcdefghi', 3, 4)
Returns cdef
SUBSTRING ('abcdefghi', 3, 1000)
Returns cdefghi
UNICODE (single_character) Returns the Unicode character code for a string character.
UPPER (string_value) Converts a string to upper case characters.
552
Appendix D
68787_AppendixD.qxp 26/03/2004 3:58 PM Page 552

Dates
Function Name Description
DATEADD (datepart,number,date_value)
Returns a datetime value after adding or subtracting a specified period to the input date_value. The datepart is a named constant (Year, Month, Day). Number is an integer (positive or negative) for the number of datepart units to add to the date_value.
DATEADD (Month,3,'12/25/2003')
Returns 3/25/2004
DATEDIFF (datepart,start_date,end_date)
Returns an integer for the number of datepart units that separate the start_date from the end_date values.
DATEDIFF (Day,'12/25/2003','3/25/2004')
Returns 91
DATENAME (datepart,date_value)
Returns the specified datepart value for a date as a string.
DATENAME (Month,'1/7/2004')
Returns January
DATEPART (datepart,date_value)
Returns the specified datepart value for a date as an integer.
DATENAME (Month,'1/7/2004')
Returns January
DAY (date_value) Returns an integer for the Day datepart of the date_value.
GETDATE () Returns the current date and time.
GETUTCDATE () Returns the current date and time of Universal or Greenwich Mean Time.
ISDATE (value) Indicates whether a value can be converted to a date. Returns 1 or 0
MONTH (date_value) Returns the month number for a date.
YEAR (date_value) Returns a four position–integer representing the year part for a date.
553
Transact SQL Query Functions and Expressions
68787_AppendixD.qxp 26/03/2004 3:58 PM Page 553

Aggregate Functions
Grouping Variations
Function Returns
GROUP BY column_name
GROUP BY column_name,column_name, …
Rolls up a result set by a column value or unique combination of column values. All columns returned in the query must have aggregate functions or be in the GROUP BY list.
GROUPING (column_name) An aggregate function that returns a bit value indicating whether the row is the result of a ROLLUP or CUBE group summary.
SELECT ProdID, OrderID, GROUPING (OrderID), SUM (Amt)FROM ProdSalesGROUP BY ProdID, OrderID
HAVING criteria Used to qualify an expression evaluated after GROUP BY and aggregate functions have been applied to a result set.
SELECT ProdID, OrderID, SUM (Amt)FROM ProdSalesGROUP BY ProdID, OrderIDHAVING SUM (Amt) > 500
Note that the SUM function is not actually performed again. This is treated only as an expression to qualify rows returned.
Function Returns
AVG (value) Average for a group or range.
COUNT (column_name)
COUNT (*)
Aggregate count of rows not including nulls. Using * counts all rows regardless of nulls.
COUNT_BIG (column_name)
COUNT_BIG (*)
Aggregate count of rows not including nulls. Using * counts all rows regardless of nulls.
MAX (value) Aggregate function returns the highest value in the group or range.
MIN (value) Smallest value in the group or range.
STDEV (value) Standard deviation of a group or range.
STDEVP (value) Standard deviation for a population of a group or range.
SUM (value) Sum of a group or range.
VAR (value) Variance of a group or range.
VARP (value) Variance of a population for a group or range.
554
Appendix D
68787_AppendixD.qxp 26/03/2004 3:58 PM Page 554

Type Conversion and Formatting
Logic
Query Criteria
Function Returns
CONTAINS (column_name, 'searchcriteria')
CONTAINS (*, 'search criteria')
Valid only with full-text indexing enabled. Provides more extensive search and criteria–matching capabilities than the standard WHERE and LIKEoperators. Using * applies criteria to all full text– indexed columns in the table. Several optional rules and conditions can be applied to use complex matching expressions. For example WHERE CONTAINS (*,'apples')
Function Returns
COALESCE (expr, expr, expr, …) Returns the first non-null value from a list of any number of expressions.
COALESCE (null, 'abc', 'def')
Returns abc
ISNULL (value) Indicates whether a value is null. Returns 1 or 0.
NULLIF (value1, value2) Returns null if two values are equal, otherwise returns the first value.
Function Returns
CAST (value AS type) Converts a value (of any acceptable type) to an explicit data type.
CAST (1234 AS VarChar(10))
This can also be achieved using the CONVERT function.
CONVERT (type, value)CONVERT (type, value,style)
Converts a value to an explicit data type. Optionally applies a style (format) to values such as numbers and dates. Style is an integer value—(found in MSDN Library & SQL Books On Line).
CONVERT (VarChar(10), 1234)
CONVERT (VarChar(10), @DateValue,101)
Returns 1/7/2004
555
Transact SQL Query Functions and Expressions
68787_AppendixD.qxp 26/03/2004 3:58 PM Page 555

Function Returns
FREETEXT (column_name, 'searchcriteria')
FREETEXT (*, 'search criteria')
Valid only with full-text indexing enabled. Provides more extensive search and criteria matching capabilities than the standard WHERE and LIKE operators. Performs approximate text matching and can return a comparative rating for the match.
Expressions may contain operators such as AND, OR and NEAR.
Using * applies criteria to all full-text indexed columns in the table.
IN (value, value, value, …) Used to match one set of criteria against a list of values.Effectively replaces multiple OR statements.
SELECT * FROM Customers WHERE State IN ('WA','OR', 'CA')
556
Appendix D
68787_AppendixD.qxp 26/03/2004 3:58 PM Page 556

Configuration Files
Following the pattern set in .NET, configuration information is stored in XML files in SQL ServerReporting Services. Configuration information is easy to modify and the file structures are easilyreadable.
XML BasicsIf you need to modify any settings in these files, it's important to understand the essentials of XMLdocument structure and form. XML data is organized into elements and attributes. Like in HTML,an element is called a tag. Tags consist of opening tags and closing tags and can also containnested element tags. The following code snippet is a simplified example of an XML elementstructure:
<FirstElement>First Element Value<SecondElement>Second Element Value</SecondElement>
</FirstElement>
Note that in XML, carriage returns, spaces, and tabs are ignored. These are added only to increasehuman readability other than in element names and values.
In the first example, element values are sandwiched between opening and closing element tags.Values can also be defined using attributes contained in the opening element tag. The following isan example of values stored in an element's attributes:
<FirstElement Attribute1="Attribute 1 Value" Attrubute2="Attribute 2 Value"> <SecondElement Attribute1="Attribute 1 Value"></SecondElement>
</FirstElement>
EEE
68787_AppendixE.qxp 26/03/2004 3:58 PM Page 557

Appendix E
558
Attribute values are enclosed in double-quotes and element values are not. Element values can still beused in combination with attributes. They are removed from the example for simplicity. Since the secondelement is opened and closed with no element value or nested elements, an optional convention may beused to open and close the element in a single tag using the format used for the <SecondElement>element:
<FirstElement Attribute1="Attribute 1 Value" Attribute="Attribute 2 Value"> <SecondElement Attribute1="Attribute 1 Value" />
</FirstElement>
Configuration FilesFour files are used to manage various configuration settings for the server and design environment.We've simplified the XML file layout for each of these configuration files below:
The RSReportServer.config FileAll settings that apply to the report server, including connections, security, caching, and subscription delivery options.
Default install path:C:\Program Files\Microsoft SQL Server\MSSQL\Reporting Services\ReportServer
Settings:ConfigurationDsnConnectionTypeLogonUserLogonDomainLogonCredInstanceIdInstallationIDSecureConnectionLevelInstanceNameProcessRecycleOptionsCleanupCycleMinutesSqlCommandTimeoutSecondsMaxActiveReqForOneUserDatabaseQueryTimeoutRunningRequestsScavengerCycleRunningRequestsDbCycleRunningRequestsAgeMaxScheduleWaitDisplayErrorLinkReportCodePermissions/PermissionsReportExpressions/PermissionsCustomAssemblies/Permissions
ServiceIsSchedulingServiceIsNotificationService
68787_AppendixE.qxp 26/03/2004 3:58 PM Page 558

IsEventServicePollingIntervalMemoryLimitRecycleTimeMaxAppDomainUnloadTimeMaxQueueThreadsUrlRootUnattendedExecutionAccount/UserName/Password/Domain
ExtensionsDelivery/Configuration
RSEmailDPConfigurationSMTPServerSMTPServerPortSMTPAccountNameSMTPConnectionTimeoutSMTPServerPickupDirectorySMTPUseSSLSendUsingSMTPAuthenticate/FromEmbeddedRenderFormats/RenderingExtensionPrivilegedUserRenderFormatsExcludedRenderFormats/RenderingExtensionSendEmailToUserAliasDefaultHostNamePermittedHosts
Render PermissionsExtension(s) (XML,NULL,CSV,IMAGE,PDF,HTML4.0,HTML3.2,MHTML,EXCEL,HTMLOWC)ConfigurationOWCConfigurationOWCDownloadLocation (Languages)
DataPermissionExtension(s) (SQL,OLEDB,ORACLE,ODBC)SecurityEventProcessingExtension(s)/Type(s)(ReportHistorySnapshotCreated,
TimedSubscription,SnapshotUpdated)
The RSWebApplication.config FileSettings that apply the Report Manager web application. Most settings correspond to options in the Report Manager application configuration pages.
Default install path:C:\Program Files\Microsoft SQL Server\MSSQL\Reporting Services\ReportManager
Settings:ConfigurationUIReportServerUrl
ExtensionsDeliveryUI
559
Configuration Files
68787_AppendixE.qxp 26/03/2004 3:58 PM Page 559

ExtensionDefaultDeliveryExtensionConfigurationRSEmailDPConfiguration
DefaultRenderingExtensionExtensionConfigurationFileShare
DefaultRenderingExtension MaxActiveReqForOneUserDisplayErrorLink
The ReportingServicesService.exex.config FileEnables tracing and logging of certain server events that include restarts, exceptions, warnings and status messages. Some settings are used to manage the trace and log files and tracing output options.
Default install path:C:\Program Files\Microsoft SQL Server\MSSQL\Reporting Services\ReportServer\bin
Settings:ConfigurationconfigSections
namesystem.diagnosticsswitchesDefaultTraceSwitch
RStraceFileNamePrefixTraceListenersTraceFileModeComponents
The RSReportDesigner.config FileUsed to manage and configure custom data processing and rendering extensions. Also sets designer preview and rendering options.
Default install path:C:\Program Files\Microsoft SQL Server\80\Tools\Report Designer
Settings:ConfigurationSecureConnectionLevelInstanceNameKeepSnapshotsInMemorySessionCookiesSessionTimeoutMinutesReportCodePermissionsReportExpressionsCustomAssembliesDefault
560
Appendix E
68787_AppendixE.qxp 26/03/2004 3:58 PM Page 560

PermissionSetIPermission/class
ExtensionsRender
PermissionsPermissionSet/class/version/Unrestricted/Name/DescriptionExtension(s) (XML,CSV,IMAGE,PDF,HTML4.0,HTML3.2,MHTML,EXCEL,HTMLOWC)
DataPermissions
PermissionSet/class/version/Unrestricted/Name/DescriptionExtension(s) (SQL,OLEDB,ORACLE,ODBC)
DesignerExtension(s) (SQL,OLEDB,ORACLE,ODBC)
561
Configuration Files
68787_AppendixE.qxp 26/03/2004 3:58 PM Page 561

68787_AppendixE.qxp 26/03/2004 3:58 PM Page 562

Index
68787_Final_Index_14April.qxp 14/04/2004 11:32 AM Page 563

68787_Final_Index_14April.qxp 14/04/2004 11:32 AM Page 564

3-D Column charts, 141
A-a authorization method parameter, rs.config,
465access control, data source
data source, 177Access database, importing reports from, 69Access SQL, 100accessibility of reports, 478accessing the Report Manager, 163
Internet Explorer, through, 164Reporting Services, through, 163
Active Directory authentication, 190ActiveSubscriptions function, Scheduling and
Report History table, 47Add New Item dialog, Solution Explorer, 103Add Web Reference dialog
programmatic access to report objects, 322adding fields, drag-and-drop method, 125
adding/removing options, Reporting Services installation
client components, 16server components, 16
AddNodeToTree procedure, 217Administrative table, ReportServer database, 47administrative tools, installation options, 17, 465
backup and restore, 466ADO.NET object model, 416Advanced Textbox Properties dialog, 132AdventureWorks2000 sample database, 17, 57
Employees table, 134Product table, 150
aggregate functions, data grouping, 82, 111ANSI SQL standard, 97Area charts, 142assigning a new security policy, PSRS_Manager
Application, 255authentication settings, Reporting Services, 17authentication, access to data source, 177authoring interface, Visual Studio .NET, 11authoring reports, 30auto hide design element, 70automated data gathering, 483automated management of reports, 277automated server management, 279
Index
A Guide to the IndexThe index is arranged hierarchically, in alphabetical order, with symbols preceding the letter A.Most second-level entries and many third-level entries also occur as first-level entries. This is toensure that users find the information they require however they choose to search for it.
68787_Final_Index_14April.qxp 14/04/2004 11:32 AM Page 565

Bbackup of Report Server database, 466Bar charts, 77batch running of user-supplied script, 281BCC property, email subscription delivery, 364BeginTransaction function, data processing
extensions, 421bi-directional encrypted streaming, 23bookmarks, 132Books Online, online documentation, 17, 87, 501browser compatibility, a design consideration, 70Browser role permissions, 179, 184browser-based report delivery applications, 12Bubble charts, 143building a query with SQL statements, 107
SQL statements, with, 107, 114Project Wizard, with, 59– 60
built-in security versus SSL, 22Business Intelligence (BI) solutions, 8, 473Business Intelligence Projects, Report Wizard, 56
Ccached instances, 35, 47, 349cached reports
cached instance, 349configuring, 353default expiry time, 195expiration time, setting of, 195, 349performance enhancement or Report Server, 195report history, creating, 199snapshot reports compared, 199snapshots, 349types, comparison table of, 349
cachingcached instances, 35security considerations, 348session cache, 35snapshot, 36
Cancel method, IDbCommand interface, 430cascading parameters, 106
example using Solution Explorer, 106Catalog function, Resources table, 46
566
backup of Report Server database
CatalogItem objects, 216CC property, email subscription delivery, 364central report storage, Report Server, 32certificate authority, 23certificate server, Report Server configured as, 190Chart control, control RDL, 400chart creation, an example
3-D effects, 148AdventureWorks2000 database, 144Chart Properties dialog, 146gridlines, using, 147preview chart image property, use of, 146scale settings, 147size settings, 147SQL expressions, 144
Chart Report item, Toolbox tool, 77charts, report type, 19, 139–143ChunkData function, Snapshots and Snapshot His-
tory table, 46client components, capabilities, 16client-side processing of parameters, 112Close method, creating data processing extensions,
423clustering, database, 491CodeSmith tool, 402Collaborative Data Objects (CDO), email delivery, 18color definition, Report Wizard, 63Column charts, 77, 141column placement and indentation, 125, 126ColumnHeader Collection Editor, PSRS_Mangager
Application, 208Command object, data processing extensions, 417command-line options, installation options, 17command-line utilities
rs, 278rsactivate, 278rsconfig, 278rskeymgmt, 278
CommandText property, Command object, 431CommandTimeout property, Command object, 432CommandType property, Command object, 432Comment property, email subscription delivery, 364CompilerFailed error message, rs utility, 282complex queries using query builder, 103complex reports, 96
68787_Final_Index_14April.qxp 14/04/2004 11:32 AM Page 566

conditional compilation, 285, 290conditional expressions, 150
example, 150ConectionFailed error message, rs utility, 282Configuration function, Administrative table, 47configuration settings, Reporting Services, 17,
458ReportingServicesService.exe.config file, 464RSReportDesigner.config file, 464RSReportServer.config file, 464RSWebApplication.config file, 464
configuring cached reports, 353configuring data sources, 175configuring the report parameters, 109Connection object, data processing extensions,
417ConnectionString property, data processing
extensions, 423ConnectionTimeout property, data processing
extensions, 423ConnectToServer method, RSRS_Manager
Application, 213consumer, 456
system requirements, 456content manager, 161Content Manager, predefined roles, 183content organization, 493control formats, Format parameter, 316control RDL, 396–400
Chart control, generated by, 400Image control, generated by, 399Line control, generated by, 397List control, generated by, 399Matrix control, generated by, 398Rectangle control, generated by, 397Subreport control, generated by, 400Table control, generated by, 397TextBox control, generated by, 396
CreateCommand function, data processing extensions, 421
CreateDataDrivenSubscriptions method, ReportingService object, 366
CreatedBy property, CatalogItem objects, 216CreateElement method, XmlDocument class, 300
567
creating data processing extensions
Inde
x
CreateProperty method, managing item properties, 225
CreatePropertyArray method, managing item properties, 225
CreateReport method, deploying reports, 297CreateSubscription method, ReportingService
object, 366EvenType argument, 369ExtensionSettings argument, 369MatchData argument, 369Parameters argument, 369
creating data processing extensionsBeginTransaction function, 421Close method, 423code snippets
BeginTransaction function, 421Cancel method, IDbCommand interface, 430Close method, 423CommandText property, Command object, 431CommandTimeout property, Command object,
432CommandType property, Command object, 432ConnectionString property, 423ConnectionTimeout property, 423constructor, for creating objects, 420constructors declaration, 428create a project, 418CreateCommand function, 421CreateParameter function, IDataParamer
interface, 433CSVCommand class, creating, 428CSVConnection class, adding, 419CSVParameterCollection class, 426ExecuteReader method, 429FieldCount property, Read method, 438GetFieldType function, 435GetName function, 436GetOrdinal function, 436GetValue function, 436IDataParameter interface, implementing, 424IDataParameterCollection interface,
implementing, 427IDbCommand interface, implementing, 429IDbConnetion, implementing, 420IDbDatareader interface, implementing, 434IDisposable interface, implementing, 421
68787_Final_Index_14April.qxp 14/04/2004 11:32 AM Page 567

creating data processing extensions (continued)Open method, 422parameter declarations, 424ParameterName property, 425Parameters property, IDataParamerCollection
interface, 433Read method, CSVDataReader class, 437Value property, 426variables, declaring, 419
CommandText property, Command object, 431CommandTimeout property, Command object,
432CommandType property, Command object, 432ConnectionString property, 423CSVConnection object, 420CSVDataProcessing extension, installing, 438CSVDataReader object, creating, 434CSVParameter class, creating, 424GetFieldType function, 435GetName function, 436GetOrdinal function, 436GetValue function, 436IDataParameter interface, implementing, 424IDataParameterCollection interface,
implementing, 427IDbConnection interface, implementing, 420IDbDatareader interface, implementing, 434IDisposable interface, implementing, 421Open method, 422ParameterName property, 425project, creating, 418Read method, CSVDataReader class, 437variable declarations, 419
creating folders, 171creating RDL document, 401
.NET, with, 401creating schedules, on-demand reports, 196creating Subreports, 137CreationDate property, CatalogItem objects, 216credentials, 193, 463
configuring, 351errors, related to, 504see also securitystoring, 351
Credentials parameter, Render method, 331
568
creating data processing extensions (continued)
Crystal Reports, 6CSVCommand class, data processing extensions,
428CSVDataProcessing extension, installing, 438CSVDataReader object, creating, 434CSVParameterCollection class, data processing
extensions, 426Cube browser, SQL Server Analysis services, 100cube structures, SQL Server Analysis services, 100custom assembly, custom code, 151
disabled by default, 153RSReportDesigner.config, 154RSReportServer.config, 154
custom code, 151custom extensions, rendering, 41custom fields, 149custom rendering extensions, lack of, Reporting
Services, 412custom report parameters, 116custom reporting extensions,
configuration files, 21data processing, 21delivery, 21scripting, 22
custom reports design, RDL, 27CustomReportItem placeholder, RDL, 413
Ddata farms, 491data formats, Format parameter
CSV, 316EXCEL, 316XML, 316
data gardens, 491data gathering, automated, 483data grouping
List controls, 80matrix reports, 19, 81
Data Link Properties dialog, Report Wizard, 57data management schematic, 485data processing extensions
ADO.NET object model, 416Command object, 417
68787_Final_Index_14April.qxp 14/04/2004 11:32 AM Page 568

common functions, 37Connection object, 417ConnectionString property, 423ConnectionTimeout property, 423CreateCommand function, 421creating, 418data providers, .NET-managed, 37DataAdapter object, 417DataReader object, 417objects, normally created, 417rendering extensions, 39–41, 348Scheduling and Delivery Processor, 41
data RDL, 392data sorting definition, Report Wizard, 62data source, 95, 174
access control, 177central source, 98configuring shared data source, 175Connection object, ADO, equivalent to, 393connection string, defined as, 100creating, 98embedded within report definition, 175errors, related to, 505moving database to different machine, 175private data source, 175Project Add Template, creating with, 99providers, 96query languages, 100Report Wizard, creating with, 98security, 177shared data source, 175URL access to, 309
data source object reference, 95data source sharing between reports, 58, 95Data Transformation Service (DTS), 46data warehouse
freezing data, 11integrity of data, 11query expressions, 11
DataAdapter object, data processing extensions,417
database owner role, 458data-driven subscriptions, 13, 42, 202, 363<DataField> tag, data RDL, 395
569
design categories for reports
Inde
x
DataReader object, data processing extensions,417
<DataSets> section, data RDL, 393DataSet versus data set, 97<DataSource> section, data RDL, 392<DataSourceName> tag, data RDL, 393-d
databasename parameter, rs.config, 464DataSources function, Resources table, 46debugging installation, 18debugging the user-supplied script, 301decision-support databases, 20Default security, Report Manager, 179default settings, report history, 169defining the report structure, Report Wizard, 62DeleteSubscription method, ReportingService
object, 366deleting existing security policy, PSRS_Manager
application, 259delivering reports, 31Delivery extensions, 45
custom extensions, 45email report delivery, 45file share report delivery, 45
delivery extensions, Reporting Services, 412delivery management extensions, Reporting
Services, 412deploying reports, 27
errors, related to, 505deployment, 443
enterprise level, 451medium scale, 450small scale, 449system requirements, 452
Deployment folder, 63design categories for reports
charts, 19data sources, 19drill-through reports, 19form reports, 18groupings and drilldowns, 19matrix, 19multiple column reports, 19queries, 19tabular reports, 18
68787_Final_Index_14April.qxp 14/04/2004 11:32 AM Page 569

design considerations for reportsbrowser compatibility, 70extensibility, 69mobility, 156multiple columns, 89report items and data regions, 71
designing a reporting solution, 476availability, 478manageability, 478scalability, 479security, 477
Developer edition, SQL Server Reporting Services,14
DeviceInfo parameter, Render method, 331Distributed Transaction Coordination (DTC)
services, 14document maps, 130
limitations of Excel and HTML formats, 130selecting levels, 131
document RDL, 390Donut charts, 78drill-down design element, 70drill-down reports, 79, 81, 128
hiding rows and columns, 128interactive design, 128managed at the grouping level, 129page view of an interactive report, 130
drill-through reports, 19, 79, 132example page view, 133inter-report linkage, 132parameters, passing to target reports, 132
dsp prefix, parameters passing, 314dsu prefix, parameters passing, 314DuplicateCommandLineOption error message,
rs utility, 282DuplicateVariable error message, rs utility, 282
EEdit Expression window, expression builder, 127EditModeEnum constant, 225email delivery, configuring, 361
properties, 364email, subscription delivery, 361
570
design considerations for reports
embedded functions, custom code, 151Employee table, example table
creating with Report Wizard, 59Encoding(out) parameter, Render method, 331encryption at client-side, security, 22encryption at Report Server, security, 22encryption key, 278encryption key backup, Report Server database, 466Enterprise edition, SQL Server Reporting Services,
14error messages, rs utility
CompilerFailed, 282ConnectionFailed, 282data access errors, 505DuplicateCommandLineOption, 282DuplicateVariable, 282IndividualAuthorizationMethod, 282InvalidCommandLineOption, 282InvalidTimeoutValue, 282InvalidVariableName, 282InvalidVariableSpecification, 282MissingOptionValue, 282MissingRequiredOption, 282MissingSomeAuthorizationValues, 282report errors, 506ScriptException, 282service errors, 504subscription errors, 506
Evaluation edition, SQL Server Reporting Services,14
ExecuteReader method, IDbCommand interface,429–430
executing reportslinked reports, 191main steps, 192on-demand execution, 191report parameters, 193
execution information, 48execution log files, server monitoring, 470Execution Time, global variable, 149execution timeout settings, site settings, 169ExecutionLog function, Administrative table, 47Executive Information Services (EIS), 9expanding and collapsing report sections, 128expiration, cached reports, 349
68787_Final_Index_14April.qxp 14/04/2004 11:32 AM Page 570

explicit definitions, interfaces, VB.NET, 415expression builder tool, 128expressions used for data filtering, 116, 350extending Reporting Services, 411
code snippetsIDisposable interface, 415IExtension interface, 414
interfaces, common, 413missing facilities, 412opportunities for customization, 413
extensibility of reportsbrowser compatibility, 70font type and size, HTML-rendered reports, 70mobile device support, 71offline viewing, 70PDF rendering, 70
extension interfaces, common, 413, 464
Ffederating data, 491File Extensions property, file share subscriptions,
364File Name property, file share subscriptions, 364file share push deployment, report delivery, 33file share subscriptions, 361
pocket PCs, delivery to, 363properties, 364
FillPolicyListView method, PSRS_Manager Application, 248
filtering techniques, data retrieval, 101at the database level, 102at the report server level, 116expressions, 350parameterized filters, 350performance enhancement, 102
folder structure, Report Serveradding items to folders, 172creating folders, 171inheritance of properties, 171moving items between folders, 172parent role, 171permissions, 171security considerations, 172setting properties, 174
571
Inde
x
folders, URL access to, 309fonts definition, Report Wizard, 63FoodMart2000 OLAP database, 100form reports, 18Format parameter, programmatic rendering
control formats, 316data formats, 316print formats, 316Render method, parameter of, 331setting device information, 317web formats, 315
formatting of reports, 85column placement and indentation, 125, 126conditional formatting, 88explicit formatting, 86headers and footers, 126merging columns, 125multiple columns, 89page breaks, 91–93pagination, 90paper sizes, 93
forms compared to report body, 71freezing of data, 11
Ggeneric editor, Reporting Services, 97GetDataSourceContents value, Command
parameter, 315GetFieldType function, data processing
extensions, 435GetName function, data processing extensions,
436GetOrdinal function, data processing extensions,
436GetReportDefinition method, Reporting Services
Web Service, 296GetReportParameters method
Credential attribute, 328ForRendering attribute, 328HistoryID attribute, 328ParameterValues attribute, 328Report attribute, 328
GetResourceContents value, Command parameter, 315
GetResourceContents value, Command parameter
68787_Final_Index_14April.qxp 14/04/2004 11:32 AM Page 571

GetSubscriptionProperties method, ReportingService object, 366
GetValue function, data processing extensions,436
global variables, 149Globally Unique Identifier (GUID), 392grid controls, tabular reports, for, 80Grouping and Sorting Properties dialog, 123grouping definition, Report Wizard, 62grouping of data by data region, 80grouping of reports, 19
Hheaders and footers, 126hiding rows and columns, 128History function, Snapshots and SnapshotHistory
table, 46HistoryID parameter, Render method, 331HTML rendering format, report delivery, 13HyperText Transfer Protocol (HTTP), 49
IIDataParameter interface, data processing
extensions, 418IDataParameter interface, implementing, 424IDataParameterCollection interface, data
processing extensions, 418IDataParameterCollection interface,
implementing, 427standard formatting, 85
IDataReader interface, data processing extensions, 418
IDbCommand interface, data processing extensions, 417
IDbCommand interface, implementing, 429IDbConnection interface, data processing
extensions, 417IDbDatareader interface, implementing, 434IDbTransaction interface, data processing
extensions, 417IDisposable interface, Reporting Services, 415IExtension interface, 414
572
GetSubscriptionProperties method, ReportingService object
IExtension interface, data processing extensions,418
#If...Then...#Else directive, 299Image control, control RDL, 399Image Wizard, Toolbox tool, 74implicit definitions, interfaces, support in C#, 415importing items, PSRS_Manager Application, 241importing reports, 68
MS Access, from, 69RDL, 68
Include Link property, email subscription delivery,364
Include Report property, email subscription delivery,364
indexing of data, 484information worker, 9installation, Reporting Services, 15, 457
adding/removing options, 16configuration files, 463database credential, 461Distributed Transaction Coordinator, 458errors, 503log files, 18Report Server installation, 462set-up options, 15SQL Server instance, 461SSL, internet exposure, 460unattended installation, 18Visual Studio .NET, use of, 458
Integrated Windows Security, 99, 177intelligent data storage, 5Intellisense tool, .NET compilers, 285interactive data gathering, 483interactive reports, 128intermediate report format, report delivery, 35, 348Internet Information Server (IIS), 48, 64InvalidAuthorizationMethod error message, rs
utility, 282InvalidCommandLineOption error message, rs utility,
282InvalidTimeoutValue error message, rs utility, 282InvalidVariableName error message, rs utility, 282InvalidVariableSpecification error message, rs
utility, 282
68787_Final_Index_14April.qxp 14/04/2004 11:32 AM Page 572

isolated development, 498item-level tasks, 181
LLanguage support, data sources, 100Language, global variable, 149Line charts, 143Line control, control RDL, 397Line Report item, Toolbox tool, 73linked reports, 191, 353links, 132List control, data grouping, 80, 399ListChildren method, 216ListChildren value, Command parameter, 315ListRoles method, web service method, 264ListSchedules method, ReportingService object,
366ListSubscriptions method, ReportingService
object, 366ListSubscriptions.res, Subscription Manager
application, 375ListSubscriptionsUsingDataSource method,
ReportingService object, 366ListSystemRoles method, web service method,
264ListSystemTasks method, web service method,
269ListTasks method, web service method, 269LoadXml method, XmlDocument class, 299LocalizeName property, IExtension interface, 414log files, 502LogComment method, XmlDocument class, 301LogError method, XmlDocument class, 300
M-m computername parameter, rs.config, 464Main method, user-supplied script, rs utility, 283Managing encrypted connections, 278managing reports, 30, 444
reporting solutions, design aspects of, 478site management, 444
managing subscriptionsReportingService object, 366webmethods methods, 366
573
My Reports, predefined roles
Inde
x
Matrix control, control RDL, 398matrix reports, data grouping, 19, 81matrix, report type, 19Menu Editor, PSRS_Manger Application, 209Merge Cells option, Grouping and Sorting
Properties dialog
merging columns, 125metadata, 174method signature, 414MHTML, browser-based delivery, 12MimeType(out) parameter, Render method, 331missing facilities in extensibility, Reporting
Services, 412MissingOptionValue error message, rs utility, 282MissingRequiredOption error message, rs utility,
282MissingSomeAuthorizationValues error message,
rs utility, 282
mobile devices, report capabilities, 156ModifiedBy property, CatalogItem objects, 216ModifiedData property, CatalogItem objects, 216modular architecture, Reporting Services, 411monitoring of servers
log files, 470MS Access, use for report delivery, 13MS Excel for report delivery, 12MSReportServer_ConfigurationSetting class, 279MSReportServerReportManager_
ConfigurationSetting class, 280multi-column reports, 19Multidimensional expressions (MDX), 100, 487Multipart Internet Mail Extension (MIME), 400multiple columns report layout, 89multiple database servers, 490multiple datasets, 96multiple servers, working with, 31multi-server Reporting Services, 462multi-table relationships, 134My Reports folder
locking, 170managing users' own content, 170My Reports role compared, 184revoking access to, 190
My Reports, predefined roles, 184
68787_Final_Index_14April.qxp 14/04/2004 11:32 AM Page 573

NName property, CatalogItem objects, 216namespaces
XML, 383naming rules, XML, 380need for reporting services, 8
business-to-business, 10customers, 10executive leadership, 9information workers, 9managers, 9
nesting of tags, XML documents, 381.NET data providers versus data processing
extensions, 416.NET Framework classes, for RDL documents
creating RDL document, 401.NET Framework, support for reporting services,
21IDisposable interface, 415
.NET tool kit, 6network considerations, security
intranet and extranet, 190item-level security, 190My Reports, revoking access to, 190system-level security, 190
network traffic, reduction in, 101New data source radio button, Report Wizard, 57New Subscription button, implementing, 367Notifications function, Scheduling and Report
History table, 47NotSupportedException exception, 430NT AUTHORITY\NETWORK SERVICE ACCOUNT,
460
Oobject creation, standardizing by interfaces
extension interfaces, common, 414ODBC processing extension, 38offline viewing of reports, 70OLAP reports, 20, 487OLEDB Provider, data provider, 37
574
Name property, CatalogItem objects
on-demand reports, 194caching, 195filtered reports, 195schedules, 196snapshot reports, 198vary-by-parameter behavior, 195
Open method, data processing extensions, 422Open standards, 48opportunities for customization, Reporting Services,
413optimizing reporting time, filtering techniques, 102Oracle Provider, data provider, 37organization of reports, 444overriding report execution timeout settings, 169
P-p password parameter, rs.config, 465P/L SQL, 100page breaks, formatting of reports, 91–93Page Number, global variable, 149pagination of reports, 90paper size consideration, 93parameterized filters, 350parameterized stored procedures, 102ParameterName property, data processing
extensions, 425Parameters dialog, Advanced Textbox Properties
dialog, 133Parameters parameter, Render method, 331Parameters property, IDataParamerCollection
interface, 433parameters, passing to target reports, drill-through,
132parameters, URL access to objects
dsp prefix, 314dsu prefix, 314prefixes, 313rc prefix, 313rs prefix, 313
ParametersUsed(out) parameter, Render method,331
Parent Security option, 189parsing of XML documents, 382Password property, file share subscriptions, 364
68787_Final_Index_14April.qxp 14/04/2004 11:32 AM Page 574
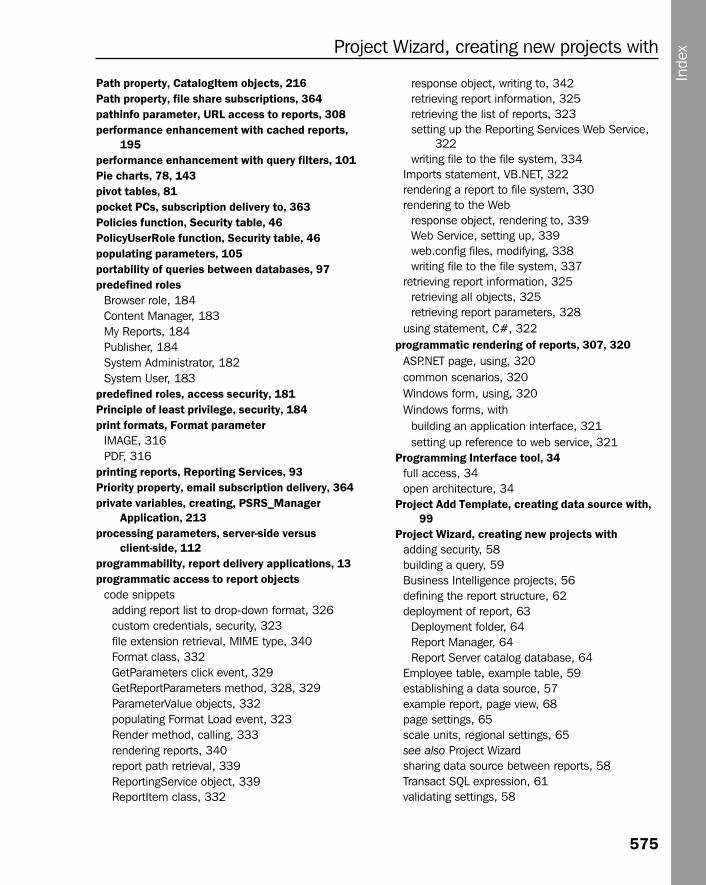
Path property, CatalogItem objects, 216Path property, file share subscriptions, 364pathinfo parameter, URL access to reports, 308performance enhancement with cached reports,
195performance enhancement with query filters, 101Pie charts, 78, 143pivot tables, 81pocket PCs, subscription delivery to, 363Policies function, Security table, 46PolicyUserRole function, Security table, 46populating parameters, 105portability of queries between databases, 97predefined roles
Browser role, 184Content Manager, 183My Reports, 184Publisher, 184System Administrator, 182System User, 183
predefined roles, access security, 181Principle of least privilege, security, 184print formats, Format parameter
IMAGE, 316PDF, 316
printing reports, Reporting Services, 93Priority property, email subscription delivery, 364private variables, creating, PSRS_Manager
Application, 213processing parameters, server-side versus
client-side, 112programmability, report delivery applications, 13programmatic access to report objects
code snippetsadding report list to drop-down format, 326custom credentials, security, 323file extension retrieval, MIME type, 340Format class, 332GetParameters click event, 329GetReportParameters method, 328, 329ParameterValue objects, 332populating Format Load event, 323Render method, calling, 333rendering reports, 340report path retrieval, 339ReportingService object, 339ReportItem class, 332
575
Project Wizard, creating new projects with
Inde
x
response object, writing to, 342retrieving report information, 325retrieving the list of reports, 323setting up the Reporting Services Web Service,
322writing file to the file system, 334
Imports statement, VB.NET, 322rendering a report to file system, 330rendering to the Web
response object, rendering to, 339Web Service, setting up, 339web.config files, modifying, 338writing file to the file system, 337
retrieving report information, 325retrieving all objects, 325retrieving report parameters, 328
using statement, C#, 322programmatic rendering of reports, 307, 320
ASP.NET page, using, 320common scenarios, 320Windows form, using, 320Windows forms, with
building an application interface, 321setting up reference to web service, 321
Programming Interface tool, 34full access, 34open architecture, 34
Project Add Template, creating data source with,99
Project Wizard, creating new projects withadding security, 58building a query, 59Business Intelligence projects, 56defining the report structure, 62deployment of report, 63
Deployment folder, 64Report Manager, 64Report Server catalog database, 64
Employee table, example table, 59establishing a data source, 57example report, page view, 68page settings, 65scale units, regional settings, 65see also Project Wizardsharing data source between reports, 58Transact SQL expression, 61validating settings, 58
68787_Final_Index_14April.qxp 14/04/2004 11:32 AM Page 575

PSRS_Manager Application, 205adding namespaces, 212adding/updating folders, 223batch and transactions concept, 231building the visual interface, 207
Button control, 207Label control, 207ListView control, 207MainMenu control, 207TextBox control, 207TreeView control, 207
code snippets, 212adding folders, 226adding namespaces, 212AddNodeToTree procedure, 217assigning a new policy, 255calling a folder, 233ConnectToServer, establishing connection, 213deleting existing security policy, 259deleting items from folders, 238deleting items from Reporting Services, 238displaying the child items, 221, 222double click event, event handler, 235editing existing items in folders, 234event handler, adding, 212existing security policy, editing, 257folder status check, event handler, 228importing items, 241list new roles, 263policy forms, 244private variables, creating, 213property procedures, adding, 226role assignments, security, 249roles, adding new, 262RSUtilities class, 214security credentials, adding, 219system and individual roles, click event
handlers, 265TreeView control, 215UserForm_Load method, 252
ColumnHeader Collection Editor, 208ConnectToServer method, 212default namespace, setting, 206deleting existing security policy, 259deleting items from Reporting Services, 238deploying on remote server, 208displaying the child items, 221
576
PSRS_Manager Application
existing security policy, editing, 257FolderForm.Activated event, 232ListRoles method, web services method, 264ListSystemRoles method, web services method,
264ListSystemTasks method, web service method, 269ListTasks method, web service method, 269Menu Editor, 209menuItemFileNewFolder event, 233new security policy, adding, 256OpenFolder method, 236policies, adding, deleting, and editing, 250proxy class, 211Report definition Files, importing, 240roles, adding, deleting, and editing, 266RSUtilities class, 214security, 244
creating a new policy, 255ListView control, showing policies in, 247policies, adding, deleting, and editing, 250policies, roles, and tasks definitions, 244private and public variables, 246role assignments, 249roles, adding, deleting, and editing, 261system/user policies, 253
security credentials, adding, 219SetItemPolicies method, 259SetPolicies method, 256Solution Explorer, 210startup object, setting, 206UpdateFolder method, 230Web Service, adding a reference to, 210
Publisher, predefined roles, 184
Qqueries
creating, 97hierarchical representation of data, difficulties with,
134portability between databases, 97
Query Builder, Project Wizard, 60Query Designer tool, VS.NET, 31query editor, Reporting Services, 97query expression, 95query expressions, data warehouses, 11
68787_Final_Index_14April.qxp 14/04/2004 11:32 AM Page 576

query languages, 487query parameters, filtering data with, 102
Rrc prefix, parameters passing, 313Read method, CSVDataReader class, 437real-world scenario, need for reporting services, 2Rectangle control, control RDL, 397Rectangle Report item, Toolbox tool, 74recursive data, 134
Employee Organization chart example, page view,136
queries, difficulty in using, 134query builder, used for, 134
#Region...#End Region directive, 298regular expressions, 85relational data, reporting with, 10, 97relational databases, 480Relational Online Analytical processing (ROLAP),
487Render Format property, email subscription deliv-
ery, 364Render Format property, file share subscriptions,
364Render method, programmatic rendering, 330
syntax for calling, 333Render value, Command parameter, 315rendering extensions, data processing
extensions, 39, 348CSV, 40custom extensions, 41Excel, 39HTML, 39MHTML, 40PDF, 39TIFF, 40XML, 40
rendering reportsprogrammatic rendering, 307
Reply-To property, email subscription delivery,364
report body, 66columns definition, 89placing items on, 71
577
Report Designer
Inde
x
report connection strings, backup and restoration, 17
Report Definition Language (RDL), 16, 26.NET Framework classes, 401CodeSmith, document creation, 402control RDL, 396creating RDL document, 401custom reports design, 27CustomReportItem placeholder, 413data RDL, 392deploying reports, 27document RDL, 390example of RDL file content, 69importing reports, 69interoperability of reporting tools, 388non-proprietary nature, 402open standards as base, 379report design without VS.NET, 27Report Designer objects, 68third-party design tool, 27XML, 379XML document, 50XML vocabulary, 388
report delivery, 12basic architecture, 348caching, 347programmability, 13Report Server, feature of, 33scheduling feature of Report Server, 33subscription, by, 13
report delivery application types, 12MS Office applications, 12programmability, 13web browser, 12
Report Designer classes, lack of customization, support for, 413
Report Designer, 32, 445designer environmet, 1Fields option, 65page settings, 65– 66page view of the tool, 65RDL file, 50Server Explorer feature, 65Solution Explorer feature, 65system requirements, 457
68787_Final_Index_14April.qxp 14/04/2004 11:32 AM Page 577

Report Designer (continued)Tool Box feature, 65Visual Studio .NET, incorporated into, 50VS.NET IDE, component of, 65
report execution logs, 18Report Folder, global variable, 149report formats
CSV, 13HTML rendering format, 13multiple formats, support for, 35XML, 13
report functionalityaggregation of data, 82formatting, 85grouping, 80subtotals, 82
report history, creating, 199report information, passing of, URL access to
objects, 318name-value combination, passing values by, 319report parameters, 318
no reed for prefixes, 318snapshot history, rendering of, 319
report logging, 169report management, automating
rs utility, 280user-supplied scripts, 280
Report Manager, 23, 161, 444accessing the interface
Internet Explorer, through, 164Reporting Services, through, 163
basic archiecture, 162configuring shared data source, 175creating a schedule for report execution, 196custom version, 162data source security, 177graphical user interface, 162interface features, 163
breadcrumb trail tool, 166Detail view, 167global toolbar, 167Help link, 168navigating, 165search function, folders and reports, 168
tabs and options toolbar, 166
578
Report Designer (continued)
item-level tasks, 181managing subscriptions, 365network considerations, security, 190on-demand reports, 194predefined roles, 181report history, creating, 199security, 178
Everyone group, 178item-level, 179role-based, 179system-level, 179
system-level tasks, 181users and permissions, 178viewing reports, 191
Report Manager web applications settings, 21Report Name, global variable, 149Report parameter, Render method, 331report parameters, 103
automatically generated, 103cascading parameters, 106datasets, relationship with, 105example, creating parameters, 105query parameters, 103, 105selecting from data source, 105setting values dynamically, 103
Report Parameters dialog, Solution Explorer, 103report parameters, filtering techniques, 101Report Processor features
caching, 35report definition, 35request handling, 35
Report Project Wizard template, Report Wizard, 56report scripting, 277Report Server, 446
central report storage, 32certificate server, configured as, 190delivery scheduling feature, 33folder structure, 171installation, 452performance enhancement, caching on-demand
reports, 195report delivery feature, 33Report Processor, 34Report Server items, 180security, 32, 467
68787_Final_Index_14April.qxp 14/04/2004 11:32 AM Page 578

security administration, 468settings, 21system requirements, 452
Report Server database, 161, 348, 446backup, 466custom extensions, 46encryption key backup, 466ReportServer database, 46ReportServerTempDB database, 46–47viewing execution information, 48
Report Server settings, 21Report Server URL, global variable, 149report snapshots, creating, 41report subscriptions, 200
automatic scheduling and rendering of reports,200
standard subscriptions, 202report types, 8Report Viewer, 307Report Wizard
AdventureWorks2000 sample database, 57creating a new project, 56defining the report structure, 62establishing a data source, 57, 98
Data Link Properties dialog, 57New Data source radio button, 57
Report Wizard Project template, client componentinstallation, 16
Report Wizard, Visual Studio .NET, 20, 24reporting lifecycle, 30reporting services (general)
basic architecture, 8challenges, existing solutions, 6data import, regular, 10hurdles in development, 6mobile devices, accessibility over, 7need, 4, 8report lifecycle, 11security, 22web, impact of, 7
Reporting Services (the MS tool).NET-based, 7.NET Framework requirement, 454architecture, 443capabilities, 2, 7clients, 445
579
Reporting Services Web Service
Inde
x
command-line utilities, 277components, schematic diagram for, 448custom rendering extensions, lack of customiza-
tion support for, 412customization, 411data processing extensions, 411delivery extensions, 412delivery management extensions, 412designing reports, 18editions, 14email delivery, 18encryption, built-in support, 22extensibility, 411
missing facilities, 412extension interfaces, common, 413features, 29formatting mechanics, 85generic editor, 97IDisposable interface, 415installation, 15, 457interfaces, 444license requirement, 454modular architecture, 411monitoring of servers, 469online documentation, 17opportunities for customization, 413printing considerations, 93query editor, 97rendering extensions, available, 412rendering reports, 307Report Designer classes, lack of customization
support, 413Report Manager tool, 50Report Server command-line utility, 51Report Viewer, 307scaling up, 462security extensions, lack of, 412SetConfiguration method, 414system requirements, 13troubleshooting, 501
Reporting Services Web Service, 48, 280, 446available features, 49errors, related to, 504IIS, 48open programming interface, 48programmatic rendering of reports, used for, 307,
321
68787_Final_Index_14April.qxp 14/04/2004 11:32 AM Page 579

reporting solutionsavailability of data, 478content organization, 493data consolidation, 483decision-support strategies, 485design considerations, 476development environment, 498examples, 494indexing strategies, 484information gathering, 483requirements, defining, 474
existing and future states of business, 475goals and direction, 475lost opportunities, 474performance gaps, 474
security considerations, 477system environments, 491transactional data, 480UDDI, use of, 479
reporting solutions security, schematic of, 477ReportingService object, 366ReportingServices constructor, 292ReportingServicesService.exe.config,
configuration files, 22ReportParameters item, Report Wizard, 103ReportSchedule function, Scheduling and Report
History table, 47ReportServer database, 447
Administrative table, 47Resources table, 46Scheduling and Report History table, 47Security table, 46Snapshots and Snapshots History table, 46
ReportServer_<timestamp>.log, 470ReportServerServices_<timestamp>.log, 470ReportServerTempDB database, 46, 47, 348, 447ReportServerWebApp_<timestamp>.log, 470report-specific schedules, on-demand reports, 196ResetSessionTimeout value, Command
parameter, 315Resources table, ReportServer database, 46resources, URL access to, 311role definition
creating, 185role assignments, creating, 187
580
reporting solutions
role assignments, understanding, 186word of caution, 186
role definitions, security of Report Server, 33role-based security model, 22, 179row selector handles, 129rs command, command-line installation options, 17rs prefix, parameters passing, 313
Command parameter, 314Format parameter, 314Snapshot parameter, 314
rs proxy, 280rs utility, 464
arguments not case sensitive, 281error messages, 282operating mechanism, 280report management, automating, 280syntax, 281user authentication, 281
rs, command-line utility, 278RS.EXE, command-line utility, 51rsAccessDenied error message, 505rsActivate command, command-line installation
options, 17rsactivate, command-line utility, 278rsCannotActivateSubscription error message, 506rsCannotSubscribeToEvent error message, 506rsConfig command, command-line installation
options, 17rsconfig, command-line utility, 278rsDataSourceDisabled error message, 505rsDataSourceNotFound error message, 505rsDeliveryExtensionNotFound error message, 506,
507rsInternalError error message, 505rsInvalidDataSourceCredentialSetting error
message, 505rsInvalidDataSourceReference error message, 505rsInvalidReportLink error message, 506rsInvalidReportServerDatabase error message, 505rsInvalidSearchOperator error message, 506rsJobWasCanceled error message, 507rsKeyMgmt command, command-line installation
options, 17rskeymgmt, command-line utility, 278
error detection, 503rsParameterTypeMismatch error message, 506rsReadOnlyReportParameter error message, 506
68787_Final_Index_14April.qxp 14/04/2004 11:32 AM Page 580

RSReportDesigner.config, configuration files, 22rsReportHistoryNotFound error message, 506rsReportMayNotBeScheduled error message, 506rsReportNotReady error message, 506rsReportParameterValueNotSet error message,
506RSReportServer.config file, 18, 23RSReportServer.config, configuration files, 21rsReportServerDatabaseLogonFailed error
message, 504rsReportServerDisabled error message, 504rsReportServerNotActivated error message, 504rsReportTimeoutExpired error message, 506rsReportTypeMismatch error message, 506rsScheduleAlreadyExists error message, 507rsScheduleNotFound error message, 507rsScheduleNotResponsing error message, 507rsSecureConnectionRequired error message, 505rsServerBusy error message, 505rsServerConfigurationError error message, 505rsSubscriptionNotFound error message, 507rsTaskNotFound error message, 507rsUnknownReportParameter error message, 506RSUtitlities class, PSRS_Manager Application,
214RSWebApplication.config, configuration files, 21running a report, 192RunningJobs function, Scheduling and Report
History table, 47
S-s servername parameter, rs.config, 464scale units, regional settings for reports, 65Scatter chart, 140Schedule function, Scheduling and Report History
table, 47Schedule Task Wizard, 302schedule-triggered subscriptions, 359Scheduling and Delivery processor
data-driven subscriptions, 42delivery, 42schedule-based events, 42scheduling, 41
581
securable object, security of Report Server
Inde
x
snapshot update events, 43standard subscriptions, 42
Scheduling and Delivery Processor, 41Scheduling and Report History table,
ReportServer database, 47scheduling reports
schedule-triggered subscriptions, 359snapshot-triggered subscriptions, 358
scheduling the user-supplied script, 302schemas, XML, 384script development, 285
accessing server items through VS.NET, 291debugging, 301deploying reports, 297
CreateReport method, 297error logging, 298warning messages, 297
logging events, 298#Region...#End Region directive, 298GetLogFile function, 298
Main method, accessing server items, 291building message content, 294creating the proxy instance, 291passing variables, 293retrieving items, 293
managing subscriptions, 375retrieving reports, 295
items, retrieving, 295report definitions retrieval, 296
running the script, 301#If...Then...#Else directive, 299opening files, 298writing XML notes, 299
scheduling the script, 302VB.NET, used for, 285VS.NET development environment, 285
adding Imports statements, 287adding references, Solution Explorer, 288conditional compilation, using, 290creating console project, 285
ScriptException error message, rs utility, 282search function, folders and reports, 168securable object, security of Report Server, 33
68787_Final_Index_14April.qxp 14/04/2004 11:32 AM Page 581

security.NET authentication, Internet security, 190batch and transactions concept, 231content management role definitions, 180credentials, 193credentials, changing programmatically, 279, 323data source used for security, 95data source, of, 99default security in Report Manager, 179hardcoding credentials versus runtime
authentication, 281IIS authentication, Internet security, 190item administration, Report Server, 468item-level, 190managing encrypted connections, 278network considerations, 190new projects, adding to, 58Parent Security option, 189predefined roles, 181principle of least privilege, 184programmatic rendering for custom security, 320PSRS_Manager Application, 219Report Manager, access to, 165Report Server, 32, 46, 467reporting solutions, of, 477role creations, caution, 185site administration, Report Server, 467symmetric encryption, 278system-level, 190
security extensions, lack of, Reporting Services,412
security policies, adding, deleting, and editing,PSRS_Manager Application, 250
security roles, adding, deleting, and editing,PSRS_Manager Application, 261
Security table, ReportServer database, 46Server Explorer tool, VS.NET, 31
creating stored procedures, 112server management, Reporting Services, 17server parameter, URL access to reports, 308server-side processing of parameters, 112session cache, 35SetConfiguration method, Reporting Services,
414
582
security
SetDataDrivenSubscriptionProperties method, ReportingService object, 366
SetPolicies method, security policies, 256SetProperty method, 225SetSubscriptionProperties method,
ReportingService object, 366setting up the Reporting Services Web Service, 322shared data sources, 98
configuring, 175shared data source, in example, 106shared schedules, on-demand reports, 196shared versus report-specific schedules, 197shared versus separate data source, 58ShowHideToggle parameter, Render method, 331Simple Mail Transfer Protocol (SMTP), email deliv-
ery, 18Simple Object Access Protocol (SOAP), 49Site settings, Report Manager interface, 168
default settings, report history, 169execution timeout settings, 169My Reports folder, 170report logs, 169
Size property, CatalogItem objects, 216snapshot reports, 198SnapshotData function, Snapshots and Snapshot
History table, 46snapshots, 36, 47
history, 349not interactive, 349rendered reports, static copy of, 349
Snapshots and Snapshots History table, ReportServer database, 46
snapshot-triggered subscriptions, 358Solution Explorer
Add Reference dialog, 288Add Web Reference dialog, 288new projects creation, 103Imports statements, adding, 287
References, adding, 288programmatic access to report objects, 321PSRS_Manager Application, used for, 210script development, 286see also Project Wizard
SQL Agent, system requirements for SQL Server Reporting Services, 14
68787_Final_Index_14April.qxp 14/04/2004 11:32 AM Page 582

SQL Server 2000, system requirements for SQLServer Reporting Services, 14
SQL Server Agent, 41SQL Server Analysis Services, 11, 487SQL Server data types, 85SQL Server Provider, data provider, 37SQL Server security, data source creation, 99SQL Server tables, caution against modifying, 48stacked Column charts, 142Standard edition, SQL Server Reporting Services,
14Standard Generalized MarkUp Language (SGML),
380standard samples, Reporting Services, 17standard subscriptions, 202Stock chart, 140stored procedures for processing parameters, 112storing credentials, 351
encrypted form, 351shared data sources, 351
StreamIds(out) parameter, Render method, 331StringBuilder class, 294Structured Query language (SQL), 97style definition, Report Wizard, 62Subject property, email subscription delivery, 364Subreport control, control RDL, 400Subreport Report item, Toolbox tool, 76Subreports, 137
linking to main reports, 137subscription delivery, 12, 22, 41
file share subscriptions, 361managing subscriptions, 365schedule-triggered, 359snapshot-triggered, 358
Subscription Manager application, managing subscriptions, 375
Subscriptions function, Scheduling and ReportHistory table, 47
subscriptions, report delivery, 13, 357errors, related to, 506snapshot-triggered, 358
symmetric encryption, 278System Administrator role permissions, 179System Administrator, predefined roles, 182System namespace, user-supplied script, 283system requirements, Reporting Services
.NET Framework requirement, 452consumer of report, requirements for, 456Report Designer, 457Report Server, 452
system requirements, SQL Server Reporting Services, 13
System User, predefined roles, 183System.Collections namespace,
CSVParameterCollection class, 426System.IO namespace, user-supplied script, 284System.Web.Services namespace, user-supplied
script, 284System.XML namespace, user-supplied script,
284system-level tasks, 181
TTable control, control RDL, 397table data region, 121tabular reports, 18, 80
grouping by data regions, 80temporary copies of reports, 194TextBox control, control RDL, 396Textbox Report item, Toolbox tool, 72To property, email subscription delivery, 364Toolbox design tool
Chart Report item, 77Image Report item, 74Line Report item, 73page view, 71Subreport Report item, 76Textbox Report item, 72
Total Pages, global variable, 149tracing settings, 22Transact SQL expression, Query Builder, 61, 100Transact SQL identifiers, queries, 102transactional databases, 10, 480TreeView control, PSRS_Manager Application,
215AddNodeToTree procedure, 217GetServerFolders procedure, clearing nodes, 216ListChildren method, 216
TreeView control, PSRS_Manger ApplicationCatalogItem object, 216
TreeView control, PSRS_Manger Application
583
Inde
x
68787_Final_Index_14April.qxp 14/04/2004 11:32 AM Page 583
troubleshootingresources available, 501
twinkling data, 11
U-u [domain\] username parameter, rs.config, 465UDDI, 479unattended installation, Reporting Services, 18URL access to reports, 307
access to Reporting Services items, 308parameters, passing, 313syntax, 308
pathinfo parameter, 308server parameter, 308virtualroot parameter, 308
Use Credentials property, file share subscriptions,364
User ID, global variable, 149User Name property, file share subscriptions, 364user session information storage, Report-
ServerTempDB database, 47Users function, Security table, 46user-supplied script, automated report
management, 280available namespaces, .NET Framework class
library, 283batch, running as, 281hardcoding credentials versus runtime authentica-
tion, 281script development, 283, 285
Vvalidating data, 483viewing reports, 191virtualroot parameter, URL access to reports, 308Visual Basic, use for report delivery, 12visual design controls, control RDL
control RDL, 396Visual Source Safe (VSS) development
environment, 499Visual Source Safe tool, VS.NET, 32Visual Studio .NET, 20, 49
design/build environment for reports, as, 20, 31Query Designer tool, 31Report Designer tool, 32Server Explorer tool, 31Visual Source Safe tool, 32
installation of Reporting Services, use in, 458Report Wizard, 20, 56user-supplied script development, rs utility, 283XML documents, creating with, 384
VRML, Line Report item, 73
WWarnings(out) parameter, Render method, 331web formats, Format parameter
HTML 3.2, 315HTML 4.0, 315MHTML, 316
web-based management, Report Manager, 23programmatic interface, 26URL access to reports, 26
webmethods methods, 366code snippets
Add Subscription event, full listing, 373click event, New Subscription button, 370creating subscription, 372ExtensionSettings object, 371New Subscription button, implementing, 367Schedule combobox, 370web services proxy class, 367
managing subscriptions, programmatic methods for,366
well formed XML documents, 382Windows forms, used for programmatic rendering
see Reporting Services Web Service, 321Windows Integrated Security, 353Windows Management Instrumentation (WMI), 278
server management interface, 279Windows Server 2003 Application Server, 454Windows Server 2003, Datacenter edition, 491Windows users and groups, security of Report Server,
33Write Mode property, file share subscriptions, 364
troubleshooting
584
68787_Final_Index_14April.qxp 14/04/2004 11:32 AM Page 584

XXML, 380
RDL, role in, 379XML attributes, 381XML documents
attributes, 381constitution, 382elements, 380flexibility of schemas, 384naming rules, 380nesting of tags, 381syntactical features, 380Visual Studio .NET, creating with, 384well formed documents, 382
XML element, 380XML namespaces, 383XML schemas, 384XML View, Visual Studio .NET, 390XML vocabulary, 387XmlDocument class, 298xs prefix, XML tags, 386
xs prefix, XML tags
Inde
x
585
68787_Final_Index_14April.qxp 14/04/2004 11:32 AM Page 585