
Product Placement In Movies As A Tool Of Transnational Advertising: Comparative Analysis Between...
160
KNOWLEDGE GLOBALIZATION CONFERENCE Boston, Massachusetts NOVEMBER 1, 2013 Published Annually Vol. 7, No. 2 ISBN 978-0-979-7593-3-8 CONFERENCE PROCEEDINGS Papers and Abstracts Published by Sawyer Business School, Suffolk University, Boston, Massachusetts, USA Knowledge Globalization Institute LLC, Massachusetts, USA
Transcript of Product Placement In Movies As A Tool Of Transnational Advertising: Comparative Analysis Between...

KNOWLEDGE GLOBALIZATION CONFERENCE
Boston, Massachusetts
NOVEMBER 1, 2013
Published Annually Vol. 7, No. 2
ISBN 978-0-979-7593-3-8
CONFERENCE PROCEEDINGS
Papers and Abstracts
Published by
Sawyer Business School, Suffolk University, Boston, Massachusetts, USA
Knowledge Globalization Institute LLC, Massachusetts, USA

2

3
Knowledge Globalization Conference 2013, Boston, Massachusetts
Preface
The 9th Knowledge Globalization Conference was held in Boston, Massachusetts, on November 1,
2013. The Conference was hosted by Sawyer School of Business, Suffolk University, Boston. The
conference was attended by scholars, members of the business community, and students from
many countries.
A total of 39 papers were accepted for presentation in nine tracks covering innovation issues in the
areas of environment, culture, globalization, technology, education, agriculture, leadership and
management processes. Among these 38 papers were presented at the conference. The presenters
included experienced researchers, young scholars and PhD students from 14 countries. The mix of
people and representation of countries make our efforts worthwhile.
The quality of the papers and the level of participation were of high standards. Partha S. Ghosh, a
visionary leader and a creative problem solver, renowned strategist and an innovator of Business
and Economic models spoke on Global Conscience and paradigm shifts in his keynote speech.
The conference also offered two plenary sessions presented by academic and business people.
This Proceedings Edition includes many of the conference papers. As such, it offers a wide
window into the current global scholarship and the continuing dialogue concerning strategic
thinking in the areas of social, cultural, economic and business trends and thus offers an
opportunity for cross-cultural exchanges and increased global understanding. We thank the
conference presenters and participants for their insightful contributions. It brought scholars from
developed countries and developing countries under one roof. For example, scholars from Croatia,
China, Thailand, Canada, Vietnam, USA, and Malaysia debated and discussed their papers face to
face without any barriers of politics or geography. The diversity in the papers presented represents
the true global and multidisciplinary nature of the conference. Papers highlighted important
strategic issues in areas, such as, higher education, MOOC, big data, educational technology,
ethical issues, IFRS, Balkans integration, agriculture and tourism.
We thank Dean William O’Neill for his continued support to the knowledge globalization efforts.
We also thank the students, faculty and staff of Suffolk University and who contributed in many
ways from the topics development to the presentation process of the conference.
On behalf of the editorial Board
Mawdudur Rahman
President, Knowledge Globalization Institute

4
Editorial Board
Dr. Mawdudur Rahman Editor-in-Chief, JKG
Dr. Nargis Mahmud Managing Editor, JKG
Man Liang Editorial Assistant
Jointly published by Sawyer Business School, Suffolk University and Knowledge
Globalization Institute, Boston, Massachusetts, USA
Disclaimer: Copyrights belong to the authors of the articles. Suffolk University or
Knowledge Globalization Institute assume on responsibility for any infringement of
copyrights by the authors of the articles or for the accuracy of data or information.

5
Table of Contents
Section 1 - Papers
Author Title Page
Abdelfatteh
Harrabi
Globalization and ESP education in the Tunisian Higher
Education context 11-16
Lidija Cehulic
Vukadinovic Strategic Problems and Integration of the Western Balkans 17-30
Nattachet -
Pooncharoen
Knowledge Creation Practices of SMEs in Agricultural
Industry of Phetchabun, Thailand 31-50
Shouhong Wang Strategic Renewal of Curricula Classics: A Case Study 51-64
Riza Ulker, Malik
Ozturk
The Current Status and future of K-12 Online Education: US
Case 65-79
Atchara - Sriphan
Knowledge Transfer Activities for the Development of
Organic Rice Production of Community Producers Based on
Sustainable Development Concept in Thailand
80-97
Shaikh A. Hamid,
Abraham Habib
Behavior of Monthly Total Returns of U.S. Treasury Bills:
1926 To 2011 98-121
Kareem Raouf El
Damanhoury
Product Placement in Movies as a of Transnational
Advertising: Comparative Analysis between French and
American Movies
122-129

6
Section 2- Abstracts
Author Title Page
Haco Hoang Empowering Migratory Populations Through Local
Ethnic Media 133
Jonathan Haughton,
Shahidur Khandker
The Surprising Effects of the Great Recession: Losers
and Winners in Thailand in 2008-2009 134
Colin W O'Reilly Firm Investment Decisions in the Post-Conflict Context 134
Tom Vine Can information ever be truly universal? Re-evaluating
the dynamic between knowledge and globalization 135
Chloe Zhang
Take My Mother-in-law…Please!” A Study of the
Impact of Women’s Power on the Co-residence Decision
in China
136
Jeff Furman, Pierre
Azoulay, Joshua
Krieger, Fiona
Murray
Retractions in Biomedical Research
136
Ben Daniel, Russell
Butson
Big Data in Higher Education the University of Otago
Experince 137
Sushil Bhatia Big Data and New Product Innovation 138
Emine Ferda Bedel A Study of Emotional-Social Intelligence in Early
Childhood Preservice Teachers 139
Gul Celkan
How to Come Up with an Educational Strategy in a
“Technology Implemented Versus Traditional Class”
Setting
140-141
Sukanya Ray,
Karine Toussaint,
Quan Diep, Arumi
Horikoshi, K Ide,
Natalie Garcia
Understanding of Cultural Beliefs on Death and
Bereavement Processes among Caucasian American and
Japanese Students 141

7
Sirous Tabrizi Overcoming Ideology for Critical Democracy in Education 142
Mawdudur Rahman MOOC and the Future Higher Education Strategy 142
Geeta Sudhir Nair Managing Higher Education to Meet the Challenges of
India Tomorrow 143
Kamolnat
Muangyim, Jampee
Wongnak
The Development of Teaching-Learning Process yo Create
Humanized Pharmacy Service 144-145
Gul Celkan Should Educational Strategies be at the Mercy of the
Economy 146
Zakaryae Arsalane Globalization and Educational Curricula 147
Weichu Xu, Mary
Rogers
Improve Students’ Team Performance in Business Education:
An Empirical Study from University Campus 148
Sandra R Sutherland Lessons in Globalizing the Classroom Experience: A Decade
of Effort at Framingham State University 149-150
Sharifah Rohayah
Sheikh Dawood
Sustaining Regional Competitiveness: The Role of Bio-tech
Cluster in Promoting Knowledge Intensive Services (KIS) in
the NCER Region of Malaysia
150-151
Banu Bedel Means to Reach the Sustainable Tourism Objective in
Turkey’s Tourism Strategy 2023 152
Miriam F Weismann How Beneficial Are Charitable Benefit Corporations in the
Marketplace? 153
Wendi Sun Economic Development and Child Health in Vietnam 154-156
Joe Ilsever,
Raymond Leung
Review of Evidence between Corporate Governance and
Mandatory IFRS Adoption from the Perspective of Agency
Theory and Information Symmetry
157

8
Sathasivam
Mathiyalakan,
Georde Heilman,
Sharon White,
Lynette Wood,
Leslie Weisenfeld
Facebook Use by Accounting & MIS Students
158-160

9
Knowledge Globalization Conference 2013, Boston, Massachusetts
Section 1 - Papers


11
Knowledge Globalization Conference 2013, Boston, Massachusetts
Globalization and ESP Education in a Tunisian Higher
Education Context
Dr. Abdelfatteh Harrabi
The Higher Institute of Applied Studies to Humanities, Mahdia Tunisia
Abstract
In context of the globalization of Tunisia context, the huge potential of ICT
(Information and Communication Technology) in foreign language teaching and
learning has become very remarkable. This study aims to highlight the need for
ICT in the educational situation of English for Specific Purposes within the
Higher Institute of Commerce of Sousse, the preparatory institute for engineering
studies of Monastir and the faculty of medicine of Monastir, Tunisia. In order to
explore the attitudes of students in these institutions, a questionnaire was adopted.
Results show a significant percentage of students who favor the use of
information and communication technology in the classroom situation. In fact,
most of them feel more motivated for learning English in this context. Ultimately,
this study aims to improve the teaching/learning situation of English for Specific
Purposes in Tunisian higher education.
Keywords: Globalization, Information communication technology, English for
specific purposes, learners’ attitudes.
1. Introduction
Globalization is described as a complex process of creating worldwide networks
of capital, technology, and information made possible through enhanced
competition, stronger interconnection and greater interdependence. Competition
has brought enormous changes in the structure of production and distribution in
the global economy. Through the expansion of worldwide networks and
interconnections, globalization has accelerated the interdependence among
nations, groups and individuals (Castells1997 in Brunner 2001).

12
As a worldwide phenomenon, globalization has affected all aspects of human life.
In politics, it continues to threaten the legitimacy and influence of the nation-state
as it yields to international agreements, international institutions and new forms of
sovereignty geared towards global governance. In economics, it has deepened and
expanded global trade causing structural changes in production and distribution
based on comparative competitiveness of economies. It has also exposed the
global village to systematic risks associated with the integration of the world
economy including, among others, environmental destruction and the spread of
crisis (Brunner 2001). From a sociological perspective, through various forms of
networks, globalization has established a veritable global civil society by
galvanizing and linking various national non-governmental organizations on
common issues of public action aimed specifically to counter the effects of
globalization on various aspects of society (Brunner 2001). In the cultural sphere,
the establishment of global communication industries has threatened, and to some
extent weakened, national values and traditions through the emergence of
multiethnic and multicultural societies towards a global culture (Brunner 2001).
2. Explosion in Information and Communications Technology
Knowledge is not only expanding exponentially, it is now easily accessible across
the globe due to the rapid developments in information and communications
technology (ICT). This has hastened and strengthened the linkages of universities,
research institutions, scientists and other individuals in the knowledge industry.
The current global economic restructuring is made possible by the continuing
rapid spread and deep integration of advanced information and communications
infrastructure based on convergence of technology and telecommunications,
broadcasting, computers, and content providers. The foundations of what is
referred to as an information society are being laid out by the tremendous impact
of these communications networks on current socio-economic relations,
institutions and structures (Brunner 2001). This emerging society is characterized
by a networked structure (the Internet and the world wide web), prominence of
knowledge-based industries, and organizational innovations in economic, legal
and social institutions towards the establishment of a learning society. Thus,
integration with or exclusion from the emerging information society will become
the definitive factor explaining the development process of economies in the
future(Castells 1999 in Brunner 2001). In addition, the advances in

13
telecommunications and information technology have facilitated the delivery of
educational services across national boundaries. Global education has become a
reality that is transforming educational institutions in their training of human
resources. In a more open trading environment, the human resource needs of
economic sectors have become more similar giving rise to the harmonization of
training requirements. The convergence of educational standards internationally
will feed further to a greater expansion of global education.
3. The Globalization of Tunisia and the Development of the ICT
Sector
One of the globalizing aspects of Tunisia is the development of the ICT sector
which has been a major priority for Tunisia during the recent past, and the
government has put down a number of ambitious performance objectives. In
particular, the authorities have aimed to more than double the contribution of the
ICT sector to GDP from 3.5 per cent in 2001 to 8 percent in 2006. Moreover, the
presidential program for the period 2004 to 2009 reinforces the emphasis on ICT
development by calling for the establishment of an appropriate base for a
knowledge society.
Nevertheless, this development in the ICT sector did not have a direct impact on
education in general and higher education in particular. One might say that needs
in Tunisian general education can be defined by the sociocultural purpose of
particular educational institution, area, region contexts, and the aim being the
construction of critical citizenship in a globalized” world (Canagarajah 2005)
Hence exploration of the attitudes of learners concerning ICT use in the
educational context seems of paramount importance.
4. Methodology
4.1. Study Design
We have used a cross sectional study to describe the students’ perceptions of
including Information and communication technology in the teaching/learning of
English for Specific Purposes in the Tunisian higher education.
4.2. Population
The studied population was composed of the students of the Higher Institute of
Commerce of Sousse, of the preparatory institute for engineering studies of

14
Monastir and of the faculty of medicine of Monastir. A class of students was
picked out randomly (all the classes of the institutions were numbered, a simple
random picking out was done and a class was selected and included in the study).
4.3. Data collection
The data were collected using a self-administered and anonymous questionnaire
for students. The questionnaire adopted in the present study depends on the
particular nature of the set of themes. I was initially based on the personal criteria
of age, sex as well as the socio-demographic characteristics to draw a distinction
between learners. The specialty before undertaking the higher education is also
used as a parameter in the questionnaire in order to determine the importance of
English language. We have also collected information about the number of hours
of English language learning, the time table and their influence on the learning of
English, and the students’ point of view towards the teaching aids. Data about the
use of information and communication technology in English classes were also
collected; whether the ESP students needed technologies such as computers
connected to internet, video projectors, and interactive whiteboards in learning
English.
5. Results
5.1. General Characteristics
The studied population included 28 third year students at the Higher Institute of
Commerce of Sousse, 33 second year students at the preparatory institute for
engineering studies of Monastir and 35 third year students of the faculty of
medicine of Monastir. These students were aged between 20 and 25 years. The
average age of this population was 21 years. The percentage of males slightly
exceeded that of females in the studied population. In fact, 44.6% of this
population was males whereas 55.4% was females. These students obtained their
bachelor's degree in different sections. The students who had the bachelor's
degree in the specialty of mathematics represented 52.2% of the population, while
the students who had a bachelor's degree in the specialty of science represented
31,5% of it. The students who had a bachelor's degree in the specialty of
economics and management represented only 16.1% of the whole population.

15
5.2. Institutional context
The students of Commerce had a three hour English course a week. The students
of medicine and the preparatory studies of engineering had a two hour English
course a week. The majority of these English studies were done during the
afternoons. These students had English averages going from 6 to 18 out of 20.
5.3. Students’ perceptions of Information and communication technology
The figures showed that 85,8% of the students of the Higher Institute of
Commerce of Sousse, 90,6% of the students of the faculty of medicine of
Monastir and 87,5% of students of the preparatory institute for engineering
studies of Monastir stated the need to use information and communication
technology during the English courses. Indeed 92,8% of the students of the
Higher Institute of Commerce of Sousse, 97,5% of the students of the faculty of
medicine of Monastir and 96,9% of students of the preparatory institute for
engineering studies of Monastir said they needed information and communication
technology during the English courses.
6. Conclusion
In the context of Tunisian globalization, the present paper is related to the
exploration of the need for integrating information and communication
technology in the teaching/learning of English for Specific Purposes in the
Tunisian higher education through the Higher Institute of Commerce of Sousse,
the preparatory institute for engineering studies of Monastir and of the faculty of
medicine of Monastir. Thus, through the questionnaire, we highlighted the
remarks related to the subject. After the diagnosis of the situation of
teaching/learning of English for Specific Purposes, it was proved that the teaching
material such as audiovisuals, new technologies and multimedia were lacking in
spite of the development of the ICT sector in Tunisia during these years.
It is the public educational institutions’ responsibility to offer literacy in various
media in English (Benesch 2006), which is crucial in the world today so as to
enable learners to appropriate English for their clearly defined needs now and for
purposes later in life. It would be thus interesting to think of improving the
situation in this field in Tunisia. This improvement could be carried out by
introducing information and communication technology in the teaching/learning
of English for Specific Purposes.

16
References
Benesch, S. (2006). Critical media awareness: Teaching resistance to
interpellation. In J. Edge (Ed.), (Re)locating TESOL in an age of empire (pp.
49–64). New York: Palgrave Macmillan.
Brunner, J.J. (2001). Viewpoints/ Controversies, Globalization, Education and
the Technological evolution. Prospects 31(2).
Canagarajah, A. S. (2005). Reconstructing local knowledge. Reconfiguring
language studies. In A. S. Canagarajah (Ed.), Reclaiming the local in
language policy and practice. Mahwah, NJ: Lawrence Erlbaum.

17
Strategic Problems and Integration of the Western Balkans
Lidija Čehulić Vukadinović
University of Zagreb, Croatia
Abstract
In the days of turbulent changes and challenges in the international relations
strategic thinking is a must. This applies for every region in the world and
especially needed in the areas where there have been recent wars and areas that
are still open for chances of instability. In contemporary European context
Southeast Europe or Western Balkans are still seen as a part of unfinished issues.
After the wars that ravished the former Yugoslavia, eruption of instability has
been a permanent feature which has prevented development in that part of the
world. This paper focuses on the existing situation in the area of Western Balkans
emphasizing on the role of euro-Atlantic integration process (NATO, European
Union). Two countries; Slovenia and Croatia are now fully integrated into NATO
and European Union and are parts of a wide European integration process. On the
other hand the majority of Western Balkans countries (Albania, Bosnia and
Herzegovina; Kosovo, Macedonia , Montenegro ,Serbia) have some kind of
institutional ties with, both NATO and European Union, but still they are far
from full-fledged membership in these organizations. The question remains how
in the future the relations between space exclusivity and Europeanization are
going to work. There are also many unresolved questions regarding security,
political, economic, ethnic, energy supply....) in the area of Western Balkans
countries. As the role of international actors such as: NATO and European union
were important in stabilizing the situation, immediately after the wars in that area,
one should say that NATO and European Union could contribute to bring these
countries to free and democratic Europe. Integration of Western Balkans
countries into NATO and EU is a two-way process. On one side it depends on the
country aspiring for membership, and on the other side it depends when the
organizations i.e. NATO and EU – are willing and ready to open the doors to new

18
members. So if we want to have a free and democratic Europe for the rest of the
Western Balkans countries it is important to continue with the reforms of their
societies and NATO and European Union should not stop with their enlargement
policy.
Key words: Western Balkans, NATO, European Union, euro Atlantic
integration, democracy, stability, prosperity, strategic thinking
Western Balkans has been introduced into the political discourse during the
European Union summit in Zagreb in 2000 for the territories of the former
Socialist Federal Republic of Yugoslavia, minus Slovenia, plus Albania, i.e.
Croatia, Bosnia and Herzegovina, the then FR Yugoslavia1, Macedonia, and
Albania. The newly adopted term is primarily a political synonym used for
identifying this group of countries that were at that time on a similar level of
internal development, judged by the state of their overall post-socialist transition
processes, level of their integration into Euro-Atlantic and European structures (or
lack of it), and by direct or indirect consequences of military and ethnic conflicts
in this region.
In early 90s of the 20th Century, immediately after disappearance of bi-polar
relations and in the midst of a search for a new structure of European and World
order, post-socialist countries of the Western Balkans have expressed their desire
to pursue political, economic and security integration within the so called
“Western way of life”. In institutional sense this also meant integration with
NATO and EU. The disintegration of Yugoslavia has slowed down the much
needed transition of countries emerging after the dissolution of the former
federation and at the same time it has determined their paths to integration into
both NATO and EU. The only exception was Slovenia which became a NATO
and EU member in 2004. Slovenia was the most advanced federal state within the
former SFR Yugoslavia, it was spared large scale war destruction, and being a
small but well organized country it managed to implement the needed reforms
quickly and successfully. The rest of the former SFR Yugoslavia was not as
successful. In territories of Croatia and Bosnia and Herzegovina the wars were
raging till 1995, and in 1999 Serbia was bombed by NATO. Presence of
1 Today these are: Srbija, Montenegro, and Kosovo.

19
international forces was preventing ethnic conflicts in Macedonia. Albania,
which was a part of socialist world, but at the same time, was pursuing a policy of
neutrality and isolationism in relation to security and economy integrations of the
socialist world (Warsaw Pact and COMECON), also managed to protect its
territorial integrity after the fall of the bi-polar world, albeit with much assistance
from the international community (especially the USA and NATO). Therefore it
is understandable why did the European Union, within a range of its regional
approaches to post-socialist countries2, group these countries under the term
Western Balkans and adopt a specific program for assisting them on their paths
towards integration with EU. Namely, on the same EU Zagreb summit in 2000
where the term Western Balkans was launched, the Stabilization and Accession
Agreement was adopted as an important mechanism for accession of these
countries closer to the EU..3
It must be noted that NATO, although not taking over the term Western Balkans
in it official documents, also insisted on political stabilization of these countries –
through its Partnership for Peace program – and only then on reforms of their
defense systems. In analyzing the requested reforms one can see that the so called
“first set” of these pre-conditions set forth by both NATO and EU are almost
identical. It refers to political conditions – regional cooperation, full cooperation
with the ICTY, return of refugees, strengthening the rule of law, fight against
corruption, nd democratization of all aspects of society. In other words, by
applying the “stick and carrot” policy, NATO and EU were trying to guide these
countries to full membership in both organizations. Today, in spite of the term
Western Balkan still present and used each of these countries has different level
of institutional links with NATO and EU, respectively.
2 For more on EU regional approaches to South Easter Europe see in: R. Vukadinović, L. Čehulić
Vukadinović, Politika europskih integracija, Zagreb, 2011, pp. 330-35. 3 For other European post-socialist countries that were aspiring to EU membership EU had a
different mechanism – Accession Agreement. Naturally, due to specific problems caused by the
war and other soft challenges to security that countries of the Western Balkans needed to address,
the EU primarily insisted on stabilization, and only after that on accession.

20
Integration of the Western Balkans
Analyzing the enlargement process of NATO and EC/EU it can be noticed that all
“new democracies”, including the post-socialist ones, have first become members
of NATO and only then of EC/EU. It was evident that Euro-Atlantic allies have
maintained this principle for the countries of the Western Balkans as well. In
reviewing their institutional bilateral connections it can be concluded that NATO
made the first steps towards a particular country, and EU followed thereafter.
Croatia
Military aggression in which one third of Croatia’s territory was occupied, fight
for physical liberation of the country, and Croatia’s involvement in the armed
conflicts in Bosnia and Herzegovina all have stopped Croatian progress towards
integration into NATO. Almost to the very end of the 20th century Croatia was,
along with FR Yugoslavia and Bosnia and Herzegovina, one of the most isolated
SEE countries by international community. In spite of the fact that NATO forces,
as well as the EU member states and the USA, were assisting Croatian fight in
various ways, due to the war that was forced upon Croatia, it was left out of any
NATO institutional ties and programs designed for post-socialist countries.4
Croatia’s progress towards NATO began after democratic presidential and
parliamentary elections in 2000, when Croatia, almost overnight, became a
member of Partnership for Peace. Soon after this, Croatia started to participate in
NATO’s Membership Action Plan. Along with Albania and Former Yugoslav
Republic of Macedonia Washington included Croatia into program for adjusting
to the standards of the Alliance – the so called Adriatic Charter. This all led to
Croatia being recognized as a country deserving invitation to full NATO
4 During her visit to Croatia in late May 1997, the US Secretary of State Madelaine Albright
insisted on the following: Croatian support to and consistent implementation of the Dayton
Agreement; return of refugees and displaced persons to Croatia; cooperation with the International
Criminal Tribunal in the Hague. A year later in his article Croatia's Roadmap to Partnership for
Peace the US Ambassador to Croatia William T. Montgomery has higlighted the principal
guideliness for Croatian participation in Partnership for Peace. American ambassador recommends
Croatia to invest efforts in: reconciliation process; creating conditions for free return, life and
work of all refugees from Croatia; consistent implementation of the Dayton Accords;
democratization of the society with special accent on freedom of media, change of electoral
legislation, and free and fair elections. See in: Lidija Čehulić: „Clintonova administracija i ulazak
Hrvatske u Partnerstvo za mir“, Politička misao, vol. 37, no.3, 2000, p. 277.

21
membership during the NATO summit in Bucharest in 2008. Croatia became a
NATO member in 2009 on NATO summit in Strasbourg and Cologne.5 Since
then Croatia actively participates in numerous political, humanitarian, civilian and
military missions conducted under the auspices of the UN or NATO.6 At the same
time Croatia has established institutional ties with the EU. However public
support for Croatian membership to NATO has never exceeded 55 percent.7
With the exception of a short period of time when it was included into the EU
PHARE program, until January 2001 Croatia was actually only entitled to annual
trade preferences in trade with EU.8 The negotiations between the EU and
Republic of Croatia on Stabilization and Accession Agreement (SAA) have
officially begun at the end of the 2000 EU summit in Zagreb. By signing the SAA
and the Temporary Agreement, which was to be implemented until the
effectiveness of the SAA, Croatia has for the first time established formal
relations with the EU. This was the most important formal step within the process
of Croatian accession to EU before the official request for full membership status
(in 2003) and acquiring the candidate status (in 2004). Of all the post-socialist
countries, Croatia’s negotiations were the longest and the most substantive ones.
This was a result of internal political situation, certain “enlargement fatigue” that
was felt within some EU member states, as well as a result of positions of some
neighboring countries towards Croatia’s membership in EU (Slovenia). Finally on
July 1st, 2013 Croatia became the twenty-eighth member of the EU.
Bosnia and Herzegovina
The country that suffered the longest and bloodiest war after the break-up of
former Yugoslavia can be grateful to NATO and US administration under
President Clinton for stopping the armed conflict. But the very same international
5 The Head of Defense Policy Office within Croatian Ministry of Defense at the time, Mr. Pjer
Šimunović, stated after the final operational meeting at which Croatian officers presented to their
NATO colleagues the Report on achieved progress in adopting NATO standards by Croatian
armed forces that „Croatia is entering NATO as one of the countries with highest readiness for
membership ever“. Vjesnik, 18 and 19 October 2008. 6 See in: Marta Nakić-Vojnović: „Contribution of Croatia to International Peacekeeping
Missions“, in L. Čehulić (ed Yearbook Šipan 2006, Zagreb, 2007, pp. 82-91. 7 For more on public opinion in regards to NATO membership see in: Zlatko Gareljić: „Croatia
and NATO“, in L. Čehulić (ed.): Yearbook Šipan 2006, Zagreb, 2007, pp. 115-24. 8 Between 1992 and 2001 the Council of Ministers was determining the content of trade
preferences for Croatia at the beginning of each calendar year.

22
community has also forced a protectorate status upon Bosnia and Herzegovina
and a political system that very few of the citizens of this country supports – the
Dayton Agreement. Regardless of all advantages or disadvantages of its
functioning in accordance with the Dayton model, integration of this country into
European and Euro-Atlantic space is more of a symbolic character than
expression of will of its citizen or realistic possibilities.
Bosnia and Herzegovina was accepted to Partnership for Peace program in 2006.
It was also conditionally offered participation in the Action Plan for NATO
membership in 2010. However, the underlying issue of military property remains
unsolved. Soldiers from Bosnia and Herzegovina participate in peace missions
and other joint activities of the Alliance. On the other hand EU has, through
Stabilization and Accession Agreement (2008), initiated reforms in Bosnia and
Herzegovina but due to poor functioning of the Bosnia and Herzegovina as a
unique state, little has been achieved on accession to EU.
Emergence of a “state within the state” – the Republic of Srpska – in combination
with deeply rooted national divisions prevents this country from further accession
to Euro-Atlantic integrations. Formal progress achieved on the path towards
NATO membership is not equally well accepted in two entities, while recent
Progress Report issued by the EU reveals that there is not much progress in
functioning of the state. Lack of readiness by the local players to invest joint
efforts on solving the existing daily hardships and lack of unanimous joint
interest for membership in NATO and EU represent sufficient reasons for
international community to be dissatisfied with the present situation. Global crisis
and numerous problems throughout the world and in Europe are additionally
decreasing the level of interest of both Europe and international community for
Bosnia and Herzegovina. In turn, this has resulted in a situation where almost any
development within the country has been left to political inertia.
Serbia
Similar to the situation in Bosnia and Herzegovina, Serbia is both institutionally
and psychologically still far away from NATO and European Union. Differing
from Bosnia and Herzegovina where NATO was crucial in stopping the bloody
war, Serbia is still views NATO as an enemy that has attacked Serbian
sovereignty in 1999 (action in Kosovo followed by NATO air strikes on

23
strategically significant targets in Belgrade and Novi Sad). By applying the “stick
and carrot” policy NATO and EU are trying to get closer to Belgrade and are
awarding every, even the slightest democratic progress in the country. Serbia was
admitted to Partnership for Peace (Riga, 2006), but it was clear that without the
democratization of the whole Serbian society and formation of a stable pro-
Western government, there will be no further integration of Serbia into NATO. In
the post-Cold War times Serbia was defeated in all wars it led (Croatia, Bosnia
and Herzegovina, Kosovo), and its territory has shrunk with the secession of
Montenegro and Kosovo. But still, Serbia has not experienced internal social
catharsis and is constantly facing dangerous remains from the recent past in
various segments of its social development. Within such context all positive
reforms and transformations of the military forces have been offset by internal
political instability and weaknesses of the society. Thesis offered by some
segments of Serbian political elites that Serbia may enter the EU without NATO
membership, and comparisons with neutral status of Austria or Switzerland are
not very realistic.
However, in spite of this stalling in institutional relations with NATO, the
European Union is continuing with the “stick and carrot” strategy. Serbia has the
Stabilization and Accession Agreement, and as a reward for Serbian willingness
to talk with Prishtina after the incidents on Serbian-Kosovo border, it even
received a candidate status.
The so called Independence Declaration of 2009 was intended to point to Serbian
desire to separate the Euro-Atlantic process and to stay outside of NATO - i.e. to
remain neutral – while still aspiring for EU membership. Although the
Declaration was primarily a declaratory response to court judgment on Kosovo, it
was obvious that Tadić’s administration did not wish to alienate itself from
Europe.
However following the presidential elections and the rise of the new coalition
with president Nikolić to power, statements that Serbia will “never abandon its
Southern province” and that “choice between Kosovo and Europe” is not an
option are gaining on strength and frequency in Serbia. Due to its unwillingness to
make a positive step towards opening negotiations with Kosovo, Serbia will
probably not receive a date for opening negotiations with the EU during this year.
At the same time readiness to implement the agreements reached with Kosovo

24
during the previous administration will not be enough since Serbia was already
rewarded for that by receiving the EU candidate status.
Montenegro
Besides Kosovo, Montenegro was the last country of the former SFR Yugoslavia
to gain its independence in 2006, and has immediately made a solid start in
implementing reforms needed for accession to NATO and EU. During the so
called Community of Serbia and Montenegro defense and security issues were
under the realm of the joint state, with its independence Montenegro had to start
from the scratch in these areas. Ranging from legal regulation to establishment of
operational security forces, everything that was done in this small country on
these issues was done in accordance with NATO standards and principles.9
NATO recognized this and admitted Montenegro into Partnership for Peace
immediately after the independence (2006). This was a clear advantage for
Montenegrin armed forces, as well as for the whole society. Later Montenegro fell
as collateral victim of NATO politics when due to conflicts in Georgia it was not
admitted to Membership Action Plan. Montenegro had to wait until 2009 to enter
this program. Again, as a collateral victim of NATO’s internal crisis it was not
admitted to NATO membership during the Chicago summit and now must wait
for the fourth wave of NATO enlargement. If it continues with the successful
reforms and activities within the existing NATO programs there is no reason for
Montenegro not to become the next NATO member from the Western Balkans
region as soon as the Alliance decides on the new enlargement.
Montenegro’s path towards the EU was similarly successful. After signing the
Stabilization and Accession Agreement (2007) Montenegro has bravely requested
EU membership. The fact that it was given the candidate status, as well as the
date for beginning the negotiations, additionally encourages political elites, as
well as citizens of the country, to persist on Euro-Atlantic and European path.10
9 For more on development of security and defense systems in Montenegro, see Mehmedin
Tahirović, „Montenegro and Partnership for Peace“, Međunarodne studije, vol. 8, no. 2, 2008, p.
53-70. 10
On reforms undertaken in Montenegro on this path, see in: Gordana Đurović (ed.) „Crna Gora u
XXI stoljeću – u eri kompetitivnosti: integracija u evropske i evroatlantske strukture“, Montenegro
Academy of Sciences and Arts, vol. 73, no. 4, Podgorica 2010.

25
Institutional accession of Montenegro to NATO and EU gives favorable winds to
political elites who were, because of that, able to solve some dilemmas of their
own, as well as dilemmas expressed by the public opinion in Montenegro.
Namely, every time a slow-down in this path towards the West is being sensed
Montenegro calls upon its traditional connections with Russia. Some radical
advocates of this Russian-Montenegro ties attempt even to substitute European
path with closer relations with Russia. Montenegro may be taken as an example
by all remaining Western Balkans countries, as well as any other country aspiring
to NATO and EU membership, as a positive example of modern, globally
interlinked international community. Since NATO and EU have well established
relations with Russia, membership in these organizations does not have to mean
automatic break-up of connections and relations with Russia.
Kosovo
Kosovo, as an independent state, is the project of the United States of America.11
Although United States is the most powerful member of the Alliance, to
Kosovo’s regret this fact did not help in all members recognizing Kosovo’s
independence. In the post-Cold War times Kosovo lies within NATO’s sphere of
interest not only because of the first out-of-area action conducted there in 1999,
but also due to extended presence of large contingent of NATO forces in that
country.12
However, in Brussels potential membership of Kosovo is not being
officially mentioned for the time being, for it is waiting for all members of the
Alliance to recognize the newly independent state. The same may be said for the
relation between the EU and Kosovo. As long as all member states do not
recognize Kosovo as a sovereign state EU may not even consider strengthening
institutional relations with that country. Still, there are ways in which NATO and
EU members are cooperating with Kosovo, not to mention the fact that EU,
NATO and UN forces are physically present in Kosovo. Based on this it might be
said that Kosovo is in a rather specific situation, because it is simultaneously a
subject, and an object of contemporary international relations.
11
See in Radovan Vukadinović: „Američka politika i stvaranje kosovske države“, Međunarodne
studije, vol. 8, No. 1, 2008, pp.. 5-19. 12
Besford Rreecaj: „Konačno rješenje statusa Kosova: procesi i perspektive“, Međunarodne
studije, vol. 8, no. 1, 2008, pp. 20-42.

26
Albania
The post-Cold War Albanian desire to join NATO was a proof of newly elected
government that it will put an end to long lasting Albanian policy of isolationism
and its specific type of neutralism. Situation in the region (not only the armed
conflicts in the territories of the former Yugoslavia, but also continuing crisis over
ethnic, religious and territorial issues in the neighborhood) has contributed to the
fact that public opinion in Albania was constantly expressing the highest level of
support to integration of their country to the Alliance. Even in times of
stabilization in the South Eastern Europe and objective hardships that Albanian
population was suffering during the transition and painful internal reforms, this
support did not fall below eighty percent.
Albania was among the first countries that joined NATO cooperation programs,
such as North Atlantic Cooperation Council, Partnership for Peace, Membership
Action Plan, within which it was developing various political, military and civil
activities with the member states. Signing of the Adriatic Charter was in a way
American recognition and reward for Albanian loyalty and cooperation with
NATO, while call to join the Alliance together with Croatia, extended on NATO
summit in Bucharest in 2008, was the icing on a cake of all Albanian efforts. For
Albanian government this was certainly a reward, but also an obligation to start
addressing Albanian internal problems (mostly connected to soft security
challenges such as drug trafficking, crime, corruption) with more firmness and
commitment. European Union insists on the very same criteria. Albania has
signed the Stabilization and Association Agreement (in 2006) but mostly due to
insufficient reforms towards democracy and rule of law it did not achieve a
stronger institutional integration with European Union.
Macedonia
Macedonia was not exposed to brutal armed conflicts after the breakup of former
Yugoslavia. However, in its post-socialist development it was not exempt from
internal ethnic conflicts (including the use of armed forces) caused by
dissatisfaction of Albanian population with its status in the new state. Religious
and territorial problems gradually followed ethnic ones. The Ohrid Agreement has

27
legally regulated status of unsatisfied national minorities but its implementation
was facing numerous problems.. Military presence of international community is
a reality for some time now. Internal instabilities can easily spread over
Macedonian borders in combination with Greek–Macedonian dispute over the
name of the new state (among other) resulted in a strong orientation of Skopje
towards the West, inclusive of NATO and its strongest member, the USA. Similar
to Albania, Macedonia was also intensifying its cooperation and partnerships
through all existing NATO programs available to post-socialist countries.
Together with Albania and Croatia, it has been contributing to international peace
through activities within the Adriatic Charter. Level of public support to NATO
membership in those times was never below sixty percent, while in times of
intensified internal crisis it was rising up to eighty percent. Membership in the
Alliance was primarily seen as a guarantee for lasting internal peace, stability and
prosperity of the country. Thus the fact that Macedonia was not invited to join
NATO with other two members of Adriatic Charter in 2008 resulted with deep
disappointment in Skopje. Even more so due to the fact that the first hints of such
negative outcome started only at the eve of the Bucharest summit and during the
summit itself. Greece as full member of the Alliance has used the fact that
Alliance decides with unanimous vote and by voting against has effectively
blocked Macedonian membership. NATO leadership has expressed regret over
such development and reinstated that NATO doors remain open for all potential
members that fulfill the criteria. However, there will be no additional screening
for Macedonia. Namely, Macedonia has met all the criteria and it will be admitted
to membership as soon as it solves its bilateral disputes over the name with
Greece. But the situation has significantly changed since these optimistic and
comforting statements at the Bucharest summit.
In spite of Macedonian active cooperation with NATO within the Partnership for
Peace and Membership Action Plan, disappointment after the Bucharest summit
has resulted in slow down of implementation of necessary reforms in Macedonia.
At the same time its accession to European Union is also in a stalemate.. After
signing the Stabilization and Accession Agreement (2001) and acquiring the
status of candidate country (2005) Skopje was warned that Macedonia is tired of
waiting for the date to begin negotiations. In the meantime the Ohrid Agreement
has not

28
yielded expected results as ethnic differences are growing stronger, . In the long
run this status quo that NATO and EU has maintained towards this country can’t
be good, neither for Macedonia, nor for Western Balkans. It will be very difficult
for Macedonia to resist internal pressures without external assistance.
Conclusion
Western Balkans is no longer a “black pit” of the Old Continent. This is a region
where “unstable stability” still prevails, but challenges to security are no longer
primarily military ones. They have been replaced by a wide array of the so called
soft-security challenges (ethnic, religious, national, border issues, energy supply,
drugs, prostitution and human trafficking, other types of crimes, ecological
issues, economic stagnation, terrorism ,etc.)..In early 1990s when post-bipolar
structures of the international community started to emerge Western Balkans
primarily turned to the West. Today, after twenty years of transition, conditions
for easier penetration of other players into this area have been created. Russia and
Turkey are increasingly important partners on which countries of the Western
Balkans may count, along with the West.
The open door policy or enlargement remains as official policy of both NATO
and EU, but there will be no new admissions to NATO and EU membership for
quite some time. In comparing enlargement policy of the two organizations with
their other internal policies it can be said that enlargement was the most
successful NATO’s policy since the dissolution of the bi-polarism, while EU in
total had to face more challenges than benefits from this process. So the accession
of Croatia to European Union was the last round of enlargement to the Western
Balkans this decade.
Western Balkans is the only part of Europe where NATO and EU still have their
forces present as guarantors of peace and stability (Bosnia and Herzegovina,
Kosovo). This also represents a sort of security that both organizations will
remain present in the region. But it must be said that from the point of Euro-
Atlantism, and especially if viewed globally, Western Balkans is no longer a
region holding top positions of the world politics due to its problems and
unsolved issues. Stabilization and integration of this region will continue
gradually, with insistence on stronger engagement of local players.

29
Bibliography:
A. Brnčić, P. Leppee, I. Mošnja, Hrvatska na putu u Europsku uniju: od
kandidature do članstva, drugo izdanje, Zagreb, 2004, p. 44.
Zbigniew Brzezinski, Strategic Vision. America and the Crisis of Global Power,
New York, 2012.
Lidija Čehulić: “Clintonova administracija i ulazak Hrvatske u Partnerstvo za
mir“, Politička misao, vol. 37., no.3., 2000., p. 177.
Gordana Đurović (ed.): Crna Gora u XXI. Stoljeću - u eri kompetitivnosti:
integracija u evropske i evroatlantske strukture, Crnogorska akademija nauka i
umjetnosti, vol 73., no. 4., Podgorica 2010.
Gordana Đurović, Evropska unija i Crna Gora-Politika proširenja, Podgorica,
2012.
Zlatko Gareljić: “Croatia and NATO”, u L. Čehulić (ed.) : Yearbook Šipan
2006., Zagreb, 2007., pp. 115-124.
Charles A. Kupchan: No One's World. The West, the Rising Rest and the Coming
Global Turn, Oxford, 2011.
Walter Laqueur: After the Fall. The End of the European Dream and the Decline
of a Continent, London, 2011.
G.Lenci, L.Martin (eds.), The European Security Space, Paris, 1998.
Marta Nakić-Vojnović: “Contribution of Croatia to International Peacekeeping
Missions”, in Besford Rreecaj: ”Konačno rješenje statusa Kosova: procesi i
perspektive”, Međunarodne studije, vol. 8., no.1., 2008. pp.20-42.
Mladen Puškarić, Europska integracija, Zagreb,2012.
Jacques Rupnik (ed.), The Western Balkans and the EU: “The Hour of Europe”,
Chaillot paper, June 2011., Paris
Mehmedin Tahirović: “Crna Gora i Partnerstvo za mir”, Međunarodne studije,
vol.8. no.2., 2008., pp.53-70.
Tomasz Žornaczuk, The Impact of Enlargement to Croatia on the Functioning of
the European Union, Bulletin, No. 19(472) 25 February 2013, PISM

30
Tomasz Žornaczuk, The Prospect of EU Enlargement to the Western Balkans in
2013, Bulletin, No. 24 (477) 8 March 2013, PISM

31
Knowledge Creation Practices of SMEs in
Agricultural Industry of Phetchabun, Thailand
Nattachet Pooncharoen
Naresuan University, Thailand
Abstract
The objectives of this study are 1) to study the knowledge creation processes of
the SMEs (Small and Medium Enterprises) in agricultural industry of Phetchabun
province, Thailand, 2) to analyze the relationship of knowledge creation practices
of SMEs in agricultural industry of Phetchabun with their income, and 3) to
propose the recommendations on the strategic knowledge creation practices for
SMEs of agricultural industry in this area. SMEs play significant role in Thailand
economy both in term of employment and production. To move toward an
economic integration called ASEAN Economic Community (AEC) vision, Thai
government authorities realized the weakness, especially in marketing knowledge,
of these enterprises, and offered helps such as market mapping and databases with
related services. However, firms in this industry, as indicated by this research, still
need specific and appropriate system and techniques for knowledge management
processes, especially on the knowledge creation. Using quantitative and
qualitative research methods based mainly on Nonaka & Takeuchi’s SECI model
(Socialization-Externalization-Combination- Internalization), this research results
indicated that 1) the knowledge creating procedures of the SMEs in this industry
are basically product oriented (concentrating on product quality), 2) main
knowledge creation practices are combination, and both socialization and
internalization practices were mostly done at individual level through formal and
informal social and political networks, and 3) the economic value such as income
earned by an organization could be used to identify key knowledge creation
practices of SMEs in this industry.

32
Keywords: Knowledge Creation Practices, SMEs, Agricultural Industry,
ASEAN Economic Community (AEC), Phetchabun
Introduction
SMEs (Small and Medium Enterprises) in Thailand (firms with fixed assets more
50 million and 20 or more employees) share significant portion of employment
and production in Thailand. In 2006, SMEs business account for 99.5 percent of
all business in Thailand. Its major products consist of service, trade and
maintenance, and industrial products, with the share of 30, 41.1 and 28.2 percent
respectively. They employed 76.7% of all workers in Thailand, mostly in
production sector (45.3%). Share of their export is about 30 percent, and almost
all (around 99.6 percent) of Thai entrepreneurs are working in SMEs.
Problems of SMEs in Thailand generally are not in production but in the lack of
marketing knowledge. The responsible government authorities have emphasized
in their promotion plan that SMEs in Thailand should increase their marketing
channels, develop products that respond to market needs and as the same time link
domestic markets to international markets (Office of SMEs Promotion, 2012: 20-
29). Even with the help by the government covering wide range of knowledge to
SMEs, knowledge still has to be adjusted to fit different type of business
operations. Moreover, after the crisis in Thailand in 1997, the U.S. Crisis in 2008
and the recent crisis in Europe, SMEs in Thailand faced several fluctuation of
market and reduction trend of demand. To maintain and expand existing markets,
they need not only high capacity in the use of labor, capital and technology but
also right knowledge at individual and organizational level of production,
management and marketing. The knowledge of marketing especially is needed
because in competitive environment main objective of business is obviously
required to make their customer satisfy, and maintain present and upcoming
orders. Under present circumstances it is very difficult to do so.
Generally, most of business organizations are aware of how important knowledge
is in their daily business life. It could help them learn from the past, understand
customer’s needs, reduce cost, improve working efficiency and make leader
become a thought leader (Handzic, 2006). But the holistic and untouchable nature
of knowledge management makes it difficult to apply in real life and to attain

33
concrete and successful results (Mittelmann, 2013: 1). Normally, important
conditions of successful knowledge management are: to make the existing
knowledge be ready to use; the right knowledge should be known; all knowledge
should be transformed into organizational knowledge, and the knowledge creation
methods to obtain new knowledge should also be known. In other words, firms
have to know how to utilize knowledge at operation level by not emphasizing on
the use of knowledge management tools but its using skills (Probst, 2000: 8). To
achieve complex objective and at the same time to make knowledge management
practical for everyday use, an organization must have knowledge management
processes (including knowledge creation) that suits to limitations, culture and
other conditions of the organization.
Knowledge inside an organization can be created by an individual or a group. At
individual level, high innovation is really needed in uncertain environment.
However, in normal situation what an organization need is knowledge that is
capable of solving the problems at hand. Successful knowledge management
programs should be able to manage problems that could affect management
power and organizational culture. All this require solid measurement of
knowledge management practices.
This research pays attention to knowledge creation practices and the possible link
to economic value such as income of the firms. Knowledge creation of SMEs in
the northern area of Thailand is the interest of this study. Specifically, the
objectives of this research are: 1) to study the knowledge creation process of the
SMEs (Small and Medium Enterprises) in agricultural industry in Phetchabun
province of Thailand, 2) to analyze the relationship of SMEs’ knowledge creation
practices in this industry with their income, and 3) to propose the
recommendations on their strategic knowledge creation practices. In the article,
we first present knowledge management and knowledge creation model and then
explain how knowledge creation practices could possibly link to economic value.
Next, research methodology including the population, sample and research
framework will be concisely explained. Finally, results, conclusion and further
research recommendations are at the end of the article.

34
Operating Definitions
Economic value is the value a firm or organization earned from selling its
product in the market,
Agricultural industry is industry that produces agricultural related products,
Knowledge creation is formation of new ideas through interactions between
explicit and tacit knowledge in individual human minds.
Tacit knowledge is unwritten, unspoken, and hidden vast storehouse of
knowledge held by practically every normal human being, based on his or her
emotions, experiences, insights, intuition, observations and internalized
information. Tacit knowledge is integral to the entirety of a person's
consciousness, is acquired largely through association with other people, and
requires joint or shared activities to be imparted from on to another
(http://www.businessdictionary.com, accessed on August 3, 2013)
Explicit knowledge is articulated knowledge, expressed and recorded as words,
numbers, codes, mathematical and scientific formulae, and musical notations.
Explicit knowledge is easy to communicate, store, and distribute and is the
knowledge found in books, on the web, and other visual and oral means.
(http://www.businessdictionary.com, accessed on August 3, 2013)

35
Knowledge Management Model
Knowledge management processes
Knowledge management consists of many processes as shown in
figure 1 below.
Figure 1 Knowledge management processes and economic values
Knowledge management processes at the beginning involve the acquisition of
knowledge both from inside and outside organization. After bringing it inside the
organization, the processes will be carried to the point that the right knowledge
can be utilized.
Figure 1 above presents all knowledge management processes; start from the
acquisition of knowledge from both domestic and international sources.
Identifying process is first implemented to get related knowledge, and keep it in
storage so that knowledge could be shared and distributed inside; some
knowledge will be utilized afterward. Knowledge creating process could occur
before, after and during the operation. This research emphasizes only knowledge
creating part of the knowledge management process and how it could possibly
link to the economic gain of the firm in a specific industry and area.

36
Knowledge Management Model of the SME
In general, the knowledge processes of the firm in SME consist of the same
processes as in the larger firm. The different lines are flat and flexible in
organization structure. This means that their working processes are also different;
for example, it possess low degree of standardization and formalization, people
dominated, simple and flexible decision making process and also product-
oriented. As a result, knowledge management processes of these enterprises are
also unique. Knowledge sharing, basic activity of knowledge creation, in this
industry has characteristics including, having mainly tacit knowledge (deep and
broad common knowledge) instead of explicit, working in informal mode, having
limited impact of information technology and most activities directly involving
owner and manager.(Thai Hai Hang Nguyen, 2011).
Knowledge Creation Model
Knowledge management is experience originated from the process of learning
from the work place of individual or organization during a period of time in order
to achieve organization objectives. Knowledge creating process is a crucial part of
knowledge management process. And main intention of this research is to study
this type of process of SMEs in the northern area of Thailand, a place that have
distinctive social, economic and political characteristics. Since knowledge
management is naturally complex, to seek out one of it process need an
appropriate framework. SECI model (Nonaka & Takeuchi, 1995) seems to be
useful to look at interaction of persons and things inside an organization that
simultaneously represent both communication and knowledge activities. SECI
stands for Socialization, Externalization, Combination and Internalization. These
are activities among two main categories of knowledge, tacit knowledge and
explicit knowledge.
Knowledge is a thought framework collected from experience, ability, skill, rule
as well as information needed for decision making. Most of knowledge originate
from meeting of individuals such as training and informal conversation. In
knowledge management, all interactions include experience and new information
coming from both other individuals and organizations (Mittelmann, 2013: 3). The

37
methods of creation and the use of knowledge depend on individual or group of
individuals and the context behind.
As defined in the model, Tacit knowledge is the knowledge inside each
individual, coming from experience, learning or talents which is very difficult to
be communicated through the use of numbers, formula and text but it can be
developed and shared with other through a form of human interaction. Explicit
knowledge, instead, expresses causation of things that can be gathered and
transformed into various forms such as books, manuals, documents and other type
of accessible reports.
All dynamic relationships among two type of knowledge above are hard to
understand how it works. But SECI model, to some extent, help us explore useful
knowledge creation activities that should be done specifically for an organization.
The relationships among these two broad type of knowledge, if it is done rightly,
could be in harmony and is continuously adjusted by itself. In other words,
knowledge creation mechanism will go on within the working culture of
organization and be flexible enough to adjust if it is necessary.

38
Figure 2 SECI Model (Socialization, Externalization, Combination,
Internalization)
Source: Nonaka & Takeuchi (1995); Nonaka, I., Ryoko Toyama and Toru Hirata
(2008).
The model in figure 1 above can be explained as follows:
Socialization (tacit-tacit relationship) is the association of individuals in an
environment. It is the exchange of tacit knowledge like direct experience which is
very difficult to be transferred by other forms and methods. The result of this
activity is a new form of tacit knowledge (Lopez-Nicolas and others 2010,
523)(see the upper left of figure 1)

39
Externalization (tacit-explicit relationship) are activities to make tacit knowledge
become clearer or to turn it into explicit knowledge. The purpose is to transmit it
to other people in the organization under an environment. An example result is
working operation manual (see the upper right of figure 1).
Combination (explicit-explicit relationship) is the combination of explicit
knowledge put together to make a knowledge base system. It is the same as
acquiring all information and use it to create new knowledge (see lower right of
figure 1)
Internalization (explicit-tacit relationship) is learning and development of tacit
knowledge of each individual within a group and an environment, and turn
explicit knowledge into tacit knowledge by making it concrete and become part of
value and belief of organization.
All relationship are in the same box which means they are together as one. The
dynamic relationship is shown by spiral line in the middle of the box. It is
possible that sequence of knowledge creation could switch back and forth
depending on situations and context.
Knowledge Creation and Economic Value of SMEs in Phetchabun
In knowledge creation processes, new knowledge will be acquired, transferred
and shared. Useful knowledge will consequently be produced and embedded in
the output of the firm. Effective knowledge creating processes could be measured
by the amount of knowledge gained from those processes by using various
methods such as Intellectual Capital Index, Balance Scorecard and Success
Factors. But cost of collecting and measuring is high because it must represent
abstract variables like qualitative perspective, strategy and operation, and concrete
variables like training evaluation and capability balance sheet. Therefore, the use
of statistical link among knowledge creation processes and the outcome of the
firm could be useful and practical.

40
Methodology
Population and sample
This research use both quantitative and qualitative research by using
questionnaires and in-depth interviews of 11 SMEs entrepreneur in Phetchabun, a
province in the north of Thailand. Firms in the sample are small and medium size
firms of agricultural industry.
Data collection procedures and analysis
We first interviewed experts and entrepreneurs to set up scope and structure of
questions in the questionnaire to obtain quantitative data from the areas, and
interviews 11 firms from all districts of Phetchabun. Data from the questionnaire
were used to analyze the relationship of income and knowledge creation practices.
Data from the interviewing part consists of text and image files about the
production processes and firms’ knowledge creation practices. All data were
together used to summarize information and knowledge from the field. An
analysis for each group was done to generalize what we found.
Research Framework
Framework of the questions was drawn from the model portrayed previously,
especially in figure 3 above. There are 4 core factors of productions which are
capital, labor, knowledge and other factors (i.e. Management, technology and
regulations). Knowledge factors are their experience in setting up business,
conducting day-to-day operation and facing coming problems. The figure also
shows that to get an effective knowledge factor, knowledge creation process
should be implemented and knowledge strategies should also be set up. The
research will explore specifically marketing knowledge creating processes of
SMEs of Phetchabun area and try to understand its link to income so that right
strategies can be found and later implemented.

41
Figure 3 Research Framework
Results and Analysis
Basic results
From our observation, SMEs in Phetchabun can be separated into 5 groups using
knowledge management processes:
(1) High technology group. Firms in this group normally use their main
production engine imported from other countries. However, some adjusted
those machines by their engineers and mechanists. Types of industries in this
group are medical instruments and supplies, and biotech products.

42
(2) Labor intensive group. This group usually uses old but unique machines that
must be operated by semiskilled workers. Firms included in our interviews
produce sugar and other agricultural products.
(3) Innovative group. Firms in this group develop their products and service using
unique in-house technology.
(4) Market leader group. Firms in this category utilize traditional technology and
skills learned from experience to dominate a segment of the market. Products
of firms in this industry include various products made from silk.
(5) Local wisdom group. The size of firms in this category is small. They
normally develop their products from family wisdom and idea created from
long experience in the same business. The products in this group include
products made from tamarind.
Information we gain from the interview concerning knowledge and its sources can
be concluded in the table below.

43
Table 1: Core Knowledge and Sources of Knowledge
Group Knowledge
creators
Sources of knowledge Core tacit knowledge
High
technology
Owner or CEO,
Engineer
Experience, Network, Close friends,
Academic background, Knowledge
from machine producers, Suppliers,
Advisors
Production processes from
foreign countries, Human
resource management,
Machine maintenance
Labour
intensive
Owner Long working experience, Customers,
Seminar, International study visit,
Consultant companies
Products using labor intensive
techniques
Innovative Owner Experience, Problem solving, Seminar,
Academic training, Study tour,
Internet, Advisors, Staffs, Networks,
R&D
Electric and mechanic
products
Market
leader
Owner Working experience, Production
processes, Customer behavior,
Academic training, Government
support training, Study visit, Internet,
Local wisdom
How to produce agricultural
and other products
Local
wisdom
Owner,
Government
advisors
Local wisdom, Experience, Road show,
Customer contact, Self-study and
learning
Secret production techniques
Table 1 shows that regularly source of knowledge of SMEs comes from the
owner’s experience: customers, training and internet. However, in the case of
larger firms professionals may be hired experts to take some responsibilities, and
in the case of smaller firms, help on knowledge could come from government
advisors. Tacit knowledge in SMEs case indicates clearly that it’s on products and
related production processes.
On explicit knowledge, the results can be concluded in table 2 below.

44
Table 2: Explicit Knowledge, Knowledge Structure and Utilization
Group Explicit knowledge Knowledge utilization and structure
High technology Accounting system, Organizational MIS,
Quality assurance system, ISO manual,
Machine structure, Working procedure
Quality assurance system, Machine
structure, Machine related information,
Daily check
Labour intensive Production data, Accounting and personal
data, Problems and working records and
procedures
Reducing waste, honesty, Keep long
time customers, Treating employees as
family members
Innovative Standard (by law), ISO 9000, Efficiency
index, On-line database, Web, Accounting
Honesty, Patience, Diligence, Network,
ISO, Insufficient number of labor
Market leader Accounting records, Statistical records,
Document system, Production methods
Research, Quality product, Honesty,
Special production techniques, Morality,
Flexibility
Local wisdom Accounting records, Office documents,
Organizational history
Strategic plan, Serving customer needs
Knowledge structure or knowledge composition shows how knowledge inside a
firm was organized and exchanged to create new knowledge. From this table,
there are some signs that indicate that smaller firm, such as firms in “local
wisdom” group, information and knowledge of customers has increasing role in
their decision process.
Characteristics of Knowledge Management of SMEs in Phetchabun
From the analysis of knowledge management behavior of selected enterprises in
Phetchabun, Thailand, we reach the conclusion that:
Most of the medium size companies that survived the recent economic crisis in
Thailand know their production process very well (at least better than their
competitors). They are also eager to learn and almost all of them pay attention to
details on products and customer needs.
Sources of knowledge are from many places. The most important, sources
include customer tests and product itself such as ways to improve the quality of
product. Collecting explicit knowledge in the form of accounting record of the
firms is normal in large, medium and small firm. However, it has not been used
directly, especially in the case of small firm.

45
Competition encourages firms to appreciate the important of knowledge. The role
of explicit knowledge is lesser in an environment where working procedures are
flexible due to firm size. Firms with larger size tend to have high level staffs to
handle guideline, suggestion and order from top executive. At this level,
knowledge transfer will normally been achieved by knowledge exchange, a two-
way communication method.
For larger firm, the implementation of quality control (product, health and
environment) has been required by law. So they are familiar with tedious works of
collecting working procedures information. Some have been able to take
advantage of this situation to build knowledge and share among their workers. For
example, firms may record problems and solutions, and ask staffs to share with
their coworkers periodically.
In a smaller company, firm behavior reflects habit of the owners. They play the
most important role in the organization. For example, owner or top leaders like to
continuously improve product and staffs have to respond accordingly. For small
size enterprise, explicit knowledge, especially core knowledge, is hardly
collected. Main reasons come from the fact that by its nature, knowledge is very
difficult to be made explicit; it’s usually in experiences and skills learned by
owners themselves.
Core knowledge of the SMEs in Phetchabun
Core knowledge of all firms in our sample is mostly about their products, how it
comes into present form, its origin and details of its production processes. It’s
obvious for them that to be ahead of their competitors they have to know how to
create new product, know to manage people (effective human resource
management) and know useful networks. Moreover, they also were interested in
details critical knowledge like knowledge on related products and consumer
demand in order to gather that knowledge and make it ready to use on time. All
successful firms usually learn from their mistakes and are willing to fight
oncoming obstructions. Experience, a form of knowledge, is praised by all
respondents to be a very important factor. Not just knowledge on product that is
valued, knowledge on ways to conduct businesses including people control,
patience and perseverance received from parents and ancestors

46
Knowledge Creation of SMEs in Phetchabun
Normally in the case of highly competitive environment, firms try to get
knowledge from every source possible. From this research, many evidences
indicate that firms paid a lot of attention to knowledge from customers to get
product details that customers really want.
Socialization:
For high technology group, knowledge sharing was achieved between owners or
major shareholders with top level managers, and between top level manager and
high level managers. Knowledge transferred, instead, was done from high level
managers to staffs of the firm. Because firms at this size have many employees,
owners need their representatives to look after their properties. Top managers are
usually hired to manage overall picture of the firm. These managers are
responsible to set up high level managers that see day-to-day operations. Since
problems, big or small, occur every day, regular meeting is really needed.
Knowledge exchanges on operations are at this level of management while owner
contact frequently with top manager with different type of knowledge. Staffs daily
received information and orders regarding how to operate, directly from manager
such as plant manager.
For labor intensive group, there are many knowledge creators. It is more
complicated because firms have to deal with more workers. They need more
managers. The different also is the emergence of “second generation owners,”
who receive knowledge directly transferred from the owner. Another creator is
“trainers from outside.” This expresses the need for outsiders to improve workers’
efficiency. Human resource staff of the firm may not have enough resources
(time, specific knowledge) to handle this task.
For innovative group, firms in this group of industry are smaller but they proudly
set up their royal customers. Some are able to compete with foreign multinational
companies. Knowledge exchange within this group is more complicated on the
relationship with inventors or people who are responsible for research and
development of the firm. Relationship between owner and inventors sometime is
direct but sometime working through manager.
For market leader group, knowledge sharing of this group is getting more
centralized. Technology used in this group is lower than previous 3 groups. The

47
knowledge that is on the owner who gains long time experience that is sometime
very difficult to be transferred. Therefore, trusted workers come to take some
responsibilities from second generation owners. Since competition is high and
production process could be copied, firms at this level tend to have advantage
over competitors by creating networks and have a good relationship with
suppliers. Training from outside is also important like other group.
Finally, for local wisdom group, it is smallest group compared with other 4
groups above. So the relationship is simple. Knowledge sharing mostly happens
within family members (first with their spouse). There are knowledge transfer to
second generation owners and staffs (with more limited content). With limited
resources by its nature, networks are crucial for them both in monitoring
customers’ needs and seeking for new marketing channels.
Externalization:
As shown in table 2, explicit knowledge of each industry was listed. Some were
done by quality assurance system and other international standards such as ISO
9000 and other Thai government environmental standard. Automatically,
procedures were recorded and some were really used in firm operations. Other
types of explicit knowledge involve information needed for basic business
operation such as accounting and finance. The rest of explicit knowledge of
working records, problem records and working procedures. Techniques were used
to access this category of knowledge, depending on type of production of that
particular SMEs.
Combination:
Mostly, it’s in the form of accounting database, statistical records and document
system. Technologies were used to make it connected among different database
and to make it online. This type of knowledge creation is the basis for a small
company to jump to the next level of accomplishment; even it’s not difficult to do
so.
Internalization:
Since knowledge management techniques of SMEs in this area of Thailand is
still in its early stage of trial and error, knowledge created inside and outside was
not fully internalized as it should be. This may not be a special case. The
processes of turning knowledge into knowledge of the firm are complicated and

48
take a lot of time. However, the future is promising because SMEs firm especially
the success one is very much interested to take advantage of knowledge
management techniques and tools to utilize the knowledge they possesses.
Marketing Knowledge Creation of SMEs of Agricultural Industry in
Phetchabun
There are different levels of SMEs. Most market leaders usually pass basic
requirement of quality product such as GAP (Good Agricultural Practices) and the
government food safety standard. Many indicators show that the dynamic of tacit-
explicit relationship of Nonaka model can be used to express how SMEs in
agricultural industry in this area create new knowledge including marketing
knowledge. However, many SMEs of this industry missed breakthrough
opportunity to expand its business size, not because of the lag of knowledge of
production technique but the lag of the right marketing channel and demand.
Knowledge Creation Procedures and Economic Values
From the sample, statistical relation between knowledge creation practices and
income are significant but rather weak. To confirm this, Information we tracked
from the SMEs firms qualitatively show that knowledge directly determine the
level of income especially in the case of competitive business environment. Even
by looking at a broader view of knowledge management, it is not easy to identify
that linkage because it is usually embedded in labor and other production factors.
That could be the reason that those linkages are not strong. Moreover, time of
knowledge usage is normally not in the record; it is hard to point out when the
result of knowledge application will emerge. This is why “externalization”
Discussion and Conclusion
From our analysis on the knowledge management practices of the SMEs operated
in Phetchabun, we found that certainly size and type of product will confine parts
of their operation-related knowledge. To effectively use knowledge, successful
firms treat knowledge as a tool and use it achieve their main objective which is
being success in business and to solve daily problems.
On knowledge creation, within Thai cultural context, to effectively transfer
knowledge (one of the main element of knowledge creation) within organization
especially when there are many workers, knowledge creators should do it

49
informally using coaching style of communication. Beside trials and errors
experiment of business operation (such as production development), this type of
activities should be one of many methods to make important knowledge known
throughout organization. To gain more knowledge from outside, they should form
both social and political networks formally and informally to the point that new
ideas are emerged.
On knowledge management in general, firm should possess important core
knowledge such as how to produce the quality of product and how to fulfill
customer needs; as business expand, firm should seek for more outside sources of
knowledge such as government and other types of modern business networks
(using, for instance, internet technologies), and as the same time be alert to seek
for more knowledge continuously. For a firm to be success, as we learn from the
research: first, probably the most important, firm should have long experience of
selling products and managing staffs and be patient and diligent as they face harsh
obstacles.
Research Limitation and Direction for Further Research
This works should be explored further to set up knowledge creation model for
specific industry. Sample should be extended to other areas as well. On qualitative
side, details should be obtained more on other process of knowledge management
to understand the whole knowledge management process. All results should be
reviewed by informants again to confirm what we found here. To measure the
links of knowledge management procedures and at the same time generalize
results of the research further, quantitative methods should be added, for example,
getting samples from other industries and other areas.
References
Handzic (2006). “Knowledge Management in SMEs: Practical Guidelines.”
CACCI Journal (1).
Office of SMEs Promotion (2012). Third Small and Medium Enterprises Plan
2012-2016, Bangkok.
Mittelmann, A. (N/A). "Practical Aspects of Knowledge Management." Retrieved
January 25, 2013, 2013, from http://www.voestalpine.com/stahl/.
Lopez-Nicolas, Carolina and Angel L. Meron o-Cerdan.(2011) “Strategic

50
Knowledge Management, Innovation and Performance.” International
Journal of Information Management 31.
Nonaka, I. and Hirotaka Takeuchi.(1995). The Knowledge-Creating Company:
How Japanese Companies Create the Dynamics of Innovation. Oxford,
Oxford University Press.
Nonaka, I., Ryoko Toyama and Toru Hirata.(2008). Managing Flow: A Process
Theory of the Knowledge-Based Firm. New York, Palgrave Macmillan.
Nguyen, Thai Hai Hang (2011). Knowledge Management in Small and Medium
Sized Enterprises in Developing Countries. Doctoral Thesis, Faculty of
Management and Economics, Tomas Bata University in Zlin.
Office of Small and Medium Enterprises Promotion (2007), Report on Small and
Medium Enterprises of The Year 2006 and 2007 Trend, Bangkok: Office
of Small and Medium Enterprises.
Probst, G. F. B. (2000) "Practical Knowledge Management: A Model That
Works." Retrieved January 27, 2013, 2013.

51
Strategic Renewal of Curricula Classics: A Case Study
Shouhong Wang
University of Massachusetts Dartmouth, USA
Abstract
The design of a university major more or less depends on the needs of the society.
When the enrollments of a discipline across all programs have exceptional
declining trends, strategic renewal of curricula of the discipline is imperative. To
meet the challenge of stable low enrollments in the Management Information
System (MIS) programs, the renewal of the MIS curriculum is taking place. This
paper presents a case study of strategic renewal of MIS classic courses for all
business majors.
1. Introduction
There has been a great deal of concern about the low enrollments in Management
Information Systems (MIS) majors during the recent years (Harris et al. 2012).
At the 2010 PACIS conference, the President of Association of Information
Systems (AIS) made a profound presentation of “The Future of Academic MIS”
(George 2010). The speech summarized previous predictions for the future, the
history of lessons, and the reality of academic MIS, as well as the diversified
viewpoints of the past 15 presidents of AIS. While there are many factors that
influence the enrollments, and there is no magic to instantly reverse the low
enrollments in MIS programs, it is clear to the MIS faculty members that strategic
renewal of the MIS curricula and pedagogies is imperative.
There is no doubt that the body of knowledge of IS and IT is important to
business education (AACSB 2010). Thus, advanced MIS courses that are
subsequent to the core introductory MIS course can be useful for all non-MIS
majors who are interested in the advanced MIS topics. Offering advanced MIS
courses to all business majors might relieve the enrollment pressure for the MIS
programs, and, at the same time, make the MIS discipline more relevant to
business education by providing opportunities for all business majors to learn
innovative IS/IT topics (Plice and Reinig 2007). This raises the question: What is

52
a strategic issue for the MIS faulty to survive? This paper is to present a case of
strategic redesign of two classic MIS major courses: the information systems
analysis and design (ISAD) course and the database design and implementation
(DB) course, for all business majors. The rest of the paper is organized as
follows. Section 2 provides a background of the issue. Section 3 presents the
major consideration of redesign of MIS courses for all business majors. Section 4
discusses our experiences of implementing the redesign of the two courses for all
business majors. Finally, Section 5 summarizes the study.
2. Background of Issue
MIS has become a discipline in business education in the 1970s. It has
experienced turmoil periods since. In the past several years, many MIS programs
have difficulties to sustain. The teaching methodologies in MIS are continually
renovated in response to the changes of information technology (Avison et al.
2006; Guidry et al. 2011). Decades ago, MIS was more likely to focus on the
implementation of information systems for business. Gradually, systems users
and consultants found that commercialized business application software
packages, ERP, SaaS (Software as a service) were readily available on the
software market. As a result of the proliferation of commercialized business
applications software, the nature of systems analysis, design, and implementation
has been changed. In fact, the theme of information systems development for
ordinary business enterprises has been shifted from system construction to system
acquisition (Wang 2005). Nowadays, information technology has become a kind
of commodity. Ordinary business organizations acquire commercial software
products to develop information systems, while only IT frontier organizations
(such as Google and facebook) might have to use the construction approach to the
systems development. Research (Chao and Shih 2005) supported by a survey has
shown that there has been the availability of a variety of job opportunities for
organizational and end-user computing professionals and these jobs require
primarily system acquisition skills instead of system construction skills
(Brookshire et al. 2007; Harris et al. 2012).
The following major common characteristics of MIS would make the MIS
courses less relevant to business education, as discussed below.

53
(1) Information system construction focusing
During the past years, MIS have been over-emphasizing software system
construction. On the other hand, the business users are not particularly concerned
with the construction aspects, but would like to have explicit specifications about
the business process that can be carried out by the commercial software products.
This is similar to consumers of cars not wanting to review the manufacturing
blueprints when making the purchase decision (Wang 2002).
(2) Secondary material for business education
Many MIS courses teach secondary material. For example, many database
textbooks (e.g., Gillenson 2011) generally include a chapter of object-oriented
database, regardless of the fact that few business database systems are using
object-oriented database. Many database textbooks (e.g., Elmasri and Navathe
2011) even include technical details of DBMS functionalities such as concurrency
control which are not essential for database design and implementation.
(3) Weak managerial context
Paradoxically, regardless of the closeness of MIS and management
science/operation management, decision methodologies are commonly weak or
even missing in the existing MIS textbooks. For example, unlike systems
construction, systems acquisition analysis must involve an intensive decision
process to choose one software product among the alternatives for the new
system.
(4) Insufficient practical components
Group project concepts and skills are a major component of MIS courses for
business (Keys 2002). Project skills refer to the learned capability of students to
work as a team and to complete the required information systems development
deliverables on time. While project skills are a crucial learning outcome in
business, the traditional MIS textbooks do not provide comprehensive guidelines
for practical information systems projects.

54
3. Strategic Course Redesign
A strategic course redesign includes the design of new teaching material, the
design of new teaching approach, and the design of assessment measures, as
discussed below.
3.1. Development of new teaching material
To provide better teaching material for all business majors in studying the MIS
courses, a new set of teaching material (Wang and Wang 2011; 2012) has been
developed. The new teaching material covers all important topics of MIS to
deliver the comprehensive concept of information system development, but
emphasizes the unique features that implement the redesign of the courses in a
broad business context, as discussed in Section 4 of the cases.
3.2. New approach to teaching the redesigned courses
Based on our experiences of teaching the redesign courses, we consider that the
project approach is effective. When students learn MIS through lectures, they
often remember little more than lists of keywords or isolated exercise questions.
On the other hand, using the course project approach, students reach out, find
business organizations, identify system development opportunities for the
organizations, determine system requirements for them, and initiate system
acquisition plans. It is clear to us that students cannot effectively learn systems
acquisition without doing projects aided by project management tools.
3.3. Assessment of strategic course redesign
There have been few guidelines for assessment of strategic course redesign
although general guidelines for assessing courses at the pedagogy level are
available (Stevens et al. 2011; Grant 2012). At the strategic level, enrollments
and students evaluations are important success indicators. At the pedagogy level,
tests for readings (e.g., multiple choices questions or problem solving question)
are often used for evaluating students’ performance, course projects for real-world
problems of MIS are the major instrument for evaluating students’ learning
outcomes in the redesigned course, as discussed in Section 4 of the cases.

55
4. The Case Study
This section describes the two cases of redesign of classic MIS courses. For each
case, we present the main topics of the redesigned course in comparison to the
original one, the learning contents and their leaning outcomes for all business
majors, and the positive consequence of the redesign.
4.1. Case A: redesign of the Information Systems Analysis and Design course
The redesign of the ISAD course emphasizes topics directly related to information
systems acquisition, including business process modeling, structured systems
analysis, packaged systems, multiple criteria decision analysis, and projects. All
these topics are included in the 2010 Curriculum Guidelines (Topi et al. 2010),
the MIS discipline curricula guidelines. Table 1 lists the main topics of the
original course in comparison to the redesign
. Table 1: Redesign of the ISAD Course
Main Topics Original Course Redesigned Course
Systems development life cycle (SDLC) Primary theme is
system construction
Primary theme is system
acquisition
Systems analysis
Process modeling UML / Use case for
software engineering
Data flow diagram for
process modeling
Data modeling Details of ER diagram Refers to database course
Systems design
Application
software
alternatives design
Absent Detailed procedure of
commercial software
alternative development
Decision making
involved in systems
design
Absent Detailed decision making
models for system
acquisition
System
infrastructure
design
Lack of clear section Detailed items of system
infrastructure design
System architecture
design
General description of
networking
Detailed examples of
system architecture
User interface
design
Details of user
interface design
Criteria for design and
assessment of user

56
process interfaces
Program design Details of program
design methods and
process
Refers to programming
course
Database design Details of database
design techniques
Refers to database course
Post-design Absent Detailed instructions for
gap analysis and
backward-design
Systems
implementation
Implementation
process
Details of
implementation
process for system
construction
Succinct
Systems testing Comprehensive
systems testing
spectrum
Focuses on testing the
acquired software system
Information
systems
development
project
Project
management
General principles,
with few guidelines
Detailed guideline for
system acquisition project
and a thorough case study
of practical projects
Table 2 lists the important learning contents that are relevant to all business
majors.

57
Table 2: Important Learning Contents of the ISAD Course for All Business
Majors
Important Learning Contents Learning Objectives for All Business
Majors
1. Business process modeling using data flow
diagrams
• Be able to model business process
• Understand business process improvement
• Develop systems thinking ability
2. Decision making process and tools
(Weighted Average Decision Matrix and
AHP) for system acquisition
• Understand decision making process
• Be able to apply decision making methods
• Develop rational thinking ability
3. Gap analysis and backward-design • Be able to evaluate commercial software
systems for business
• Be able to analyze trade-offs
• Develop design thinking ability
4. Complete ISAD cases of real-world
system acquisition development
• Understand the process of system acquisition
• Be able to plan a system acquisition project
• Develop design thinking ability for system
acquisition
The effectiveness of teaching and learning is the key criterion for assessment of
course redesigns. It is difficult to find a practically applicable objective measure
of the effectiveness of practical ISAD skills which involves complex intellectual
activities; however, there are two subjective measures that have commonly been
used for the evaluation of the teaching approach: students’ course evaluation and
analysis of students’ artifacts. The overall students’ evaluations were
consistently positive (i.e., above 4 on a 5-point scale) in this redesigned ISAD
course over the past five years. It is our understanding that students’ teaching
evaluation can be a measure for the overall satisfaction of students, but is not the
best criterion for assessing the redesign of the ISAD course. The course redesign
was evaluated on the basis of a comparison of the quality of students’ project
reports that were produced by two sets of students; that is, one set took the
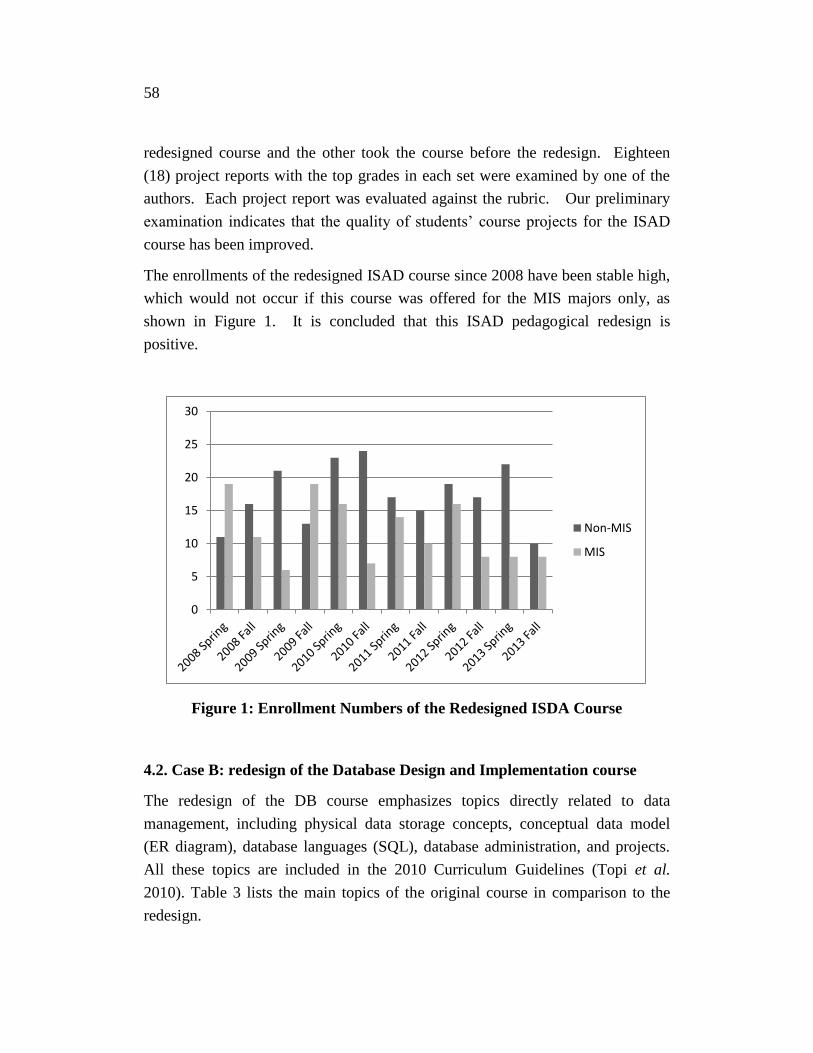
58
redesigned course and the other took the course before the redesign. Eighteen
(18) project reports with the top grades in each set were examined by one of the
authors. Each project report was evaluated against the rubric. Our preliminary
examination indicates that the quality of students’ course projects for the ISAD
course has been improved.
The enrollments of the redesigned ISAD course since 2008 have been stable high,
which would not occur if this course was offered for the MIS majors only, as
shown in Figure 1. It is concluded that this ISAD pedagogical redesign is
positive.
Figure 1: Enrollment Numbers of the Redesigned ISDA Course
4.2. Case B: redesign of the Database Design and Implementation course
The redesign of the DB course emphasizes topics directly related to data
management, including physical data storage concepts, conceptual data model
(ER diagram), database languages (SQL), database administration, and projects.
All these topics are included in the 2010 Curriculum Guidelines (Topi et al.
2010). Table 3 lists the main topics of the original course in comparison to the
redesign.
0
5
10
15
20
25
30
Non-MIS
MIS

59
The two subjective measures have been used for the evaluation of the teaching
approach: students’ course evaluation and analysis of students’ artifacts. The
overall students’ evaluations were consistently positive (i.e., above 4 on a 5-point
scale) in this redesigned DB course over the past four years. It is our
understanding that students’ teaching evaluation can be a measure for the overall
satisfaction of students, but is not the best criterion for assessing the redesign of
the DB course. The course redesign was evaluated on the basis of a comparison
of the quality of students’ project reports that were produced by two sets of
students; that is, one set took the redesigned course and the other took the course
before the redesign. Fifteen (15) project reports with the top grades in each set
were examined by one of the authors. Each project report was evaluated against
the rubric. Our preliminary examination indicates that the quality of students’
course projects for the DB course has been improved.
Table 3: Redesign of the DB Course
Main Topics
Original Course Redesigned Course
Data quality Lack of clear boundary
between data and
information
• Highlight data
redundancy
• Differentiate
information from data
Physical storage File systems Emphasizes on B-tree
Data models Hierarchical / Network /
Relational / Object-oriented
models
Focuses on relational
model only
Conceptual data
model (ERD)
Free format of ERD Enforce physical ERD
Logical database
design
Lack of specific steps for
normalization process
Detailed steps for
normalization process
Physical database Focuses on physical storage Major physical database

60
design methods design techniques
Distributed database General concept and
discussion
Data deployment matrix
Database language
(SQL)
Focuses on syntax of SQL Focuses on semantics of
queries using SQL
Database
development project
Lack of project guidelines Detailed guideline for
DB project and a
thorough step-by-step
hands-on tutorial
Table 4 lists the important learning contents that are relevant to all business
majors.
Table 4: Important Learning Contents of the DB Course for All Business
Majors
Important Learning Contents Learning Objectives for All Business
Majors
1. Data and information • Understand data redundancy
• Be able to differentiate information from data
2. Physical relational data model (physical
ER diagram)
• Understand relational data model
• Be able to apple physical ERD for database design
3. Physical database design technique and
data deployment for distributed database
• Understand physical database techniques
• Be able to do make decision on data deployment
for distributed database
4. Complete project of real-world database
development
• Understand the process of database development
• Be able to plan a database project
• Develop design thinking ability for database
design and implementation
• Be able to apply SQL for business applications

61
The enrollments of the redesigned DB course since 2009 have been stable high,
which would not occur if this course was offered for the MIS majors only, as
shown in Figure 2. It is concluded that this DB pedagogical redesign is positive.
Figure 2: Enrollment Numbers of the Redesigned DB Course
4.3. Lesson We Learned from the Cases
It has been our experience that, while the flexible nature of teaching
accommodates differing pedagogical approaches and allows instructors to set
teaching-learning strategies on their own, the course project method is an
effective tool for the ISAD course and the DB course. The following primary
lessons have been learned from our practices during the past three years.
(1) Since the redesigned ISAD course and the DB course were offered, the
numbers of enrollment of non-MIS majors in the two courses have been high.
(2) IT has become a kind of commodity for ordinary business organizations. We
need to redesign our MIS courses to serve a wide population of business students.
We are convinced that the shifting of theme from system construction to system
acquisition is the right direction for the redesign of the ISAD course and the DB
0
2
4
6
8
10
12
14
16
18
20
2009Fall
2010Spring
2010Fall
2011Spring
2011Fall
2012Spring
2012Fall
2013Spring
2013Fall
Non-MIS
MIS

62
course. The new design made multiple teaching modules (e.g., lecture, reading,
and course project) cohesive in terms of practical problem solving skills.
(3) Generally, teaching practical MIS skills for all business majors is a
challenging task. It involves several stages of course projects, including project
proposal, midterm progress inspection, and final deliverables. The students’
evaluation has consistently indicated that students have benefited from course
projects in problem solving skills for business. The most demanding activities on
the instructor’s side include the one-to-one supervision of individual student’s
projects and the intensive evaluation work load. When a class size was large
(e.g., more than 35), time constraints could diminish project-specific cares. Other
drawbacks of the approach to teaching and learning project skills have been
observed as well. First, the ISAD course projects are normally group activities. It
is hard to evaluate project skills at the individual level. Second, it is always a
demanding task to provide a balance between practical project skills and broad
course contents for the limited class time.
5. Conclusion
One of the most important aspects of effective business education is to help
business students develop practical problem solving skills. In the history of MIS,
ISAD methods have been dominated by computer software construction-centered
approaches. The proliferation of commercial off-the-shelf software products,
ERP systems, and SaaS has introduced new tasks of acquirement analysis for the
ISAD field. Our redesigned ISAD course shifts the emphasis and enhances the
business students’ practical skills for systems acquisition. To offer the ISAD
course for all business majors, we must make a strategic redesign. In the DB
field, the practical project skills have been missing in the traditional courses. To
offer the DB course for all business majors, we must teach more DB applications
in addition to DB development. This paper has explained the redesign of the
ISAD course and the DB course for all business majors, and has presented our
case of the effective strategic redesign. Our experience has indicated that the
redesigns of the two MIS courses are useful for teaching practical systems
development skills for all business majors, and strategically make the MIS
discipline more relevant to business education in general. We conclude that the
strategic renewal of the classic MIS courses meets the challenges for the future of
academic MIS.

63
References
AACSB, Business Schools on an Innovation Mission: Report of the AACSB
International Task Force on Business Schools and Innovation, AACSB
International, 2010.
Avison, D., Cole, M., and Fitzgerald, G., Reflections on teaching information
systems analysis and design: From then to now! Journal of Information
Systems Education, 17(3), 2006, 253-256.
Brookshire, R. G., Yin, L. R., Hunt, C. S., and Crews, T. B. An end-user
information systems curriculum for the 21st century, The Journal of Computer
Information Systems, 47(3), 2007, 81-88.
Chao, C. and Shih, S. C., Organizational and end-user information systems job
market: An analysis of job types and skill requirements, Information
Technology, Learning, and Performance Journal, 23(2), 2005, 1-15.
Elmasri, R. and Navathe, S. B., Fundamentals of Database Systems, 6th
Ed.,
Boston, MA: Pearson Education, Inc., 2011.
George, J. F., The Future of Academic MIS, 2010 PACIS Conference, July 10,
2010, (www.pacis2010.org/keynoteI.pdf).
Gillenson, M. L., Fundamentals of Database Management Systems, NY: Wiley,
2011.
Grant, D., Shortening requirements engineering: Dual imperative action research
study, The Journal of Computer Information Systems, 53(2), 2012, 1-8.
Harris, A. H., Greer, T. H., Morris, S. A., and Clark, W. J. Information systems
job market late 1970's-early 2010's, The Journal of Computer Information
Systems, 53(1), 2012, 72-79.
Keys, A. C., Using group projects in MIS: Strategies for instruction and
management, The Journal of Computer Information Systems, 43(2),
2002/2003, 42-50.
Plice, R. K. and Reinig, B. A., Aligning the information systems curriculum with
the needs of industry and graduates, The Journal of Computer Information
Systems, 48(1), 2007, 22-30.

64
Stevens, D., Totaro, M., and Zhu, Z., Assessing IT critical skills and revising the
MIS curriculum, The Journal of Computer Information Systems, 51(3), 2011,
85-95.
Topi, H., Valacich, J. S., Wright, R. T., Kaiser, K., Nunamaker, J. F. Jr., Sipior,
J. C., and Vreede, G., J. d., IS 2010: Curriculum guidelines for undergraduate
degree programs in information systems, Communications of the Association
for Information Systems, 26, 2010, Article 18.
Wang, S., Teaching the object-oriented approach for business information
systems analysis and design, Journal of Informatics Education Research, 4(1),
2002, 17-26.
Wang, S., Business software specifications for consumers: towards a standard
format, Journal of Organizational and End User Computing, 17(1), 2005, 23-
37.
Wang, S. and Wang, H., Database Design and Implementation, Universal
Publishers, Boca Raton, FL, 2011 (www.uPublish.com).
Wang, S. and Wang, H., Information Systems Analysis and Design, Universal
Publishers, Boca Raton, FL, 2012 (www.uPublish.com).

65
The Current Status and Future of K-12 Online Education: US Case
Riza Ulker
Malik Ozturk
Zirve University, Turkey
Abstract
Cyber Schools, digital schools, online schools, virtual schools, internet schools,
and e-learning, no matter what it is called online education is a new phenomenon
in education that is not fully understood. A new trend that is hard to comprehend
by just reading or hearing about it. The investigator of this study did not solely
rely on the literature and decided to visit a cyber-charter school district and visit
the homes of cyber charter school students to gather observational data for this
study. The investigator was aware of a new learner type that is called
“Screenagers” in the literature. A case study approach was used to develop
insights into the phenomenon, in this case, the present and future of cyber
education. Qualitative inquiry methods were used in this study. These methods
allowed the researcher to capture an understanding of the perspectives of the
CEO’s, cyber charter parents and education academics regarding cyber education.
Consisted with its theoretical framework, Constructivism, this study has followed
a qualitative approach to explore the nature of construct. The goal of this
qualitative case study was to explore what the charter school directors, cyber
charter school parents and education academics believed the current situation of
cyber schools in a US State to be and what their visions of cyber schools were for
the future. Through this search, the researcher examined the effects of the
progresses that are currently taking place in the cyber schools and across this US
state. Three different methods of data collection were used; site visit and
interviewing charter CEOs, home visits to cyber charter students’ homes and
interviewing parents, and information sessions and interviewing education
academics. A leadership group consisting charter school CEOs, including the
researcher visited the cyber charter school district led by one of the CEOs to learn
how cyber curriculum can be integrated into their existing academic programs.
The leader of the group was the president of the state’s coalition of public charter
66
schools and CEO of one of the charter schools in the state. The investigator also
visited homes of fourteen cyber charter school students as a second step of data
collection. Cyber charter parents were interviewed on the subject; the investigator
visited the homes of 14 cyber charter school students in the state and took
observation notes as they were either receiving a box full of instructional
materials from the cyber charter School or working on the computer connected to
their online classrooms. Later, information gathered from the site visit and home
visits were presented to thirty- six education academics in six different
information sessions. After the information sessions, education academics were
interviewed on the subject. Three different questions asked during interviews;
How cyber curriculum can be integrated into existing academic programs of brick
and mortar charter schools? What is your role as a cyber charter school parent?
What do you believe the present state of cyber schools in your state is? Cyber
charter school CEOs reported on a conceptual change in schooling, from two
extreme end of schooling; traditional brick and mortar schools and futuristic cyber
schools to combination of both; Brick and Click Schools. Parents reported that
while some of public school parents are accused of using schools as baby-sitting
services, cyber charter schools required full time supervision at homes. Education
academics reported heavy criticism on social development of cyber school
students.
Key Words: Online education, brick and mortar schools brick and click schools,
cyber schools, screenagers.
1. Introduction
"Online learning is a disruption that cannot be stopped," Joseph J. O'Brien,
(Director of the Chester County Intermediate Unit)
Cyber Schools, digital schools, online schools, virtual schools, internet schools,
and e-learning, no matter what it is called online education is a new phenomenon
in education that is not fully understood. A new trend that is hard to comprehend
by just reading or hearing about it. The investigator of this study did not solely
rely on the literature and decided to visit a cyber-charter school district and visit
the homes of cyber charter school students to gather observational data for this

67
study. The investigator was aware of a new learner type that is called
“Screenagers” in the literature. For example, two teenagers are sitting on a curb
texting each other. A screenager is a teenager who spends a lot of time on an
electronic screen. Screenager activities are sending e-mails, text messages, and
instant messages, downloading movies and music, Web surfing and gaming.
Cyber charter school students are not only teenagers; this cyber charter school
district had students from kindergarten to 12th grade (Rushkoff, 1997).
Today’s generation of pupils is frequently referred to as Generation Y or
the Millennial Generation. Generation Y, as one high school student defines, has
“technology in their blood”. These pupils do not know existence without
computers and the Internet. US Department of Education to one study, 94% of
these pupils use the Internet for school related study. Pupil access to the Internet
at school has grown radically over the years (Rosendale, 2009). Could cyber
schools be a solution to the country of India’s biggest educational problem?
Human Resource Development (HRD) Minister Kapil Sibal has reported in 2010
that there is a shortage of 1.2 million teachers in India and K-12 education in
India currently is not mandatory. Could online education, a global phenomenon,
be solution to India’s problem? More specifically, could laid-off New Jersey
teachers teach Indian children in the comfort of their houses? When Katrina Hit
Louisiana and destroyed the State’s whole Educational System literally and
physically wiped out all the brick and mortar schools, could cyber schools have
been a quicker solution than rebuilding the brick and mortar schools back? 50
percent of all high school courses will be given online by 2019. This does not
mean that brick and mortar school buildings will disappear but some courses
will be in class, some will be online (Christensen, Johnson & Horn, 2008).
The US Department of National Education Technology Plan encourages
states, districts, and schools to deliver all students with access to online
learning opportunities and to establish criteria for getting credit via online
learning that parallels the criteria for getting course credits in local schools;
however, current traditional educational systems are not fully equipped to deal
with the challenges of implementation. Elementary and secondary school
administrators have concerns about virtual education that are similar to those
associated with traditional education, which is summarized into three major
categories: policy, quality, and funding. Within the category of quality, a major

68
concern is training for teachers of virtual courses. Unlike traditional education,
administrators seeking resources to aid in virtual program formulation will find a
scarcity of research in the K-12 levels. We see changes taking place in the
educational arena; a new enthusiasm in the infinite possibilities of the digital age
for changing how we learn, how we teach, and how the countless fragments of our
educational system fit together – an uproar for change that is bringing
transformations and incomparable changes in our nation’s history (United States
Department of Education) (Morse, 2010).
The educational world has been transformed through technology. From the early
beginnings of the one-room schoolhouse to the modern day classroom, the
physical environment for learning is an ever- evolving concept. Distance
learning is hardly a new innovation in education. The earliest form of an
extended classroom or distance education was paper-based correspondence.
The research revealed that instruction associated with distance learning could
accelerate learning as good or better than conventional classroom instruction,
and the lack of direct contact was not disadvantageous to the learning
process (Means et al., 2009). In recent years, computers have been added to the
education mix as supplemental enrichment. The availability of the Internet,
advanced software applications, and accessibility to widespread use of the
personal computers have all contributed to adapting, expanding, and elevating
the level of distance learning. Curriculum and instruction can now be delivered
in a timelier and a personal way. Again, more recent research has supported the
success of distance learning for the adult learner. The Carnegie Foundation
reviewed multiple comparative studies and found no significant differences in
student learning outcomes for mastery of coursework from online instruction
to that of traditional educational settings. These studies primarily focused on
adult level distance learning models (Terry, 2009; Grigorovici & Russill, 2002).
The latest trend in the e-learning environment is now taking place at the K-12
level. By 2001, over 25% of states in the United States had operational or planned
state-sanctioned K-12 virtual schools in place. This figure represents only a
fraction of all K-12 virtual offerings. State-sanctioned virtual schools are
operated and financially supported by state-level governments. State virtual
schools currently represent the leading option in distance education. College and
university based virtual schools offer independent learning high school courses

69
and video-based continuing education programs to K-12 online courses.
Consortium cyber schools are national, multi-state, state-level, or regional in
nature; these virtual offerings act as agents for outside provider chances or share
courses among partners. Local education agency-based virtual schools are created
by local public schools and school districts. These schools serve to support and
supplement alternative educational needs to the local population of students.
Many schools utilize a hybrid model of both distance and face-to-face instruction.
Virtual charter schools operate under state charters and are exempted from some
state rules and regulations depending on charter specifics and charter school law.
Private virtual schools make up a smaller portion of overall national offerings and
primarily serve a large population of home-school students. Lastly, many for-
profit companies have contributed an important job to the establishment of cyber
school offerings, including creating courses, delivery platforms, curriculum, web
development, and software applications (Terry, 2009). Virtual education provides
differentiated learning environments, exposure to advanced level technologies,
flexible scheduling, and one-to-one teacher-student interaction. Additionally,
virtual schools are being explored as a possible solution to the ever-growing
achievement gap in American education. The new frontier in e-learning models
now includes middle and even elementary level learners. These learning models
incorporate the addition of a learning coach, usually a parent, to provide
additional supervision and support for younger students." Virtual education shares
the common goal of increasing student achievement through best practice.
Although the why is mutual, the how varies across models. (Terry, 2009; Kafai &
Sutton, 1999) According to a study (Cattagni and Farris, 2001), almost
100% of U.S. public schools have Internet connections and the student to
computer (internet connected) percentage has increased to a portion of 3.8 to 1.
Screenagers spend more time using the Internet than watching television
and this new generation of pupils wants a new style of education. An education
delivered in a channel to which they are habituated: the Internet (Rosendale,
2009).
The proliferation of the Internet has challenged the boundaries of
education’s conventional methods of teaching and learning. Online education
represents a vital response to the shortcomings of K-12 education and the need for
reform. As a result, online learning continues to grow rapidly across the United
States as an increasing number of students, educators, and policymakers realize

70
the vast benefits of learning unconstrained by time and place. Many online
programs were created in response to the need to transcend limitations of time and
place and increase availability of courses to students in rural and urban schools.
Virtual schools are increasing options for students, allowing for focus on student
needs and supporting school reform and redesign efforts in K-12 education, online
learning is an emerging but rapidly growing phenomenon. Emergence of online
learning represents a convergence of several factors: the development of the
Internet and the World Wide Web, the utilization of computers in instruction, the
use of media to unite teacher and student at a distance, and the integration of
technology into all aspects of education (El-Tigi, Lewis & Mac Entee, 1997).
However, questions still remain about the educational needs best addressed
through online learning as well as its impact on school improvement and learner
outcomes. Online education represents a crucially important response to the
shortcomings of K-12 education and the need to reform. With the United States
economy transitioning away from manufacturing and toward a greater
percentage of knowledge-based jobs, 90% of the fastest growing jobs in the
economy require a college degree and only 70% of all public high school students
graduate, and only 32% of all students leave high school qualified to attend
four-year colleges (Watson, 2007). In addition to helping address these
shortcomings, online education can also facilitate mastery of essential 21st
century skills by stressing self-directed learning, time management, and
personal responsibility, along with technology literacy in a context of problem-
solving and global awareness.
In 2004, many political and educational leaders realize that global trends are
changing the nature of education. With the call for school reform being
heard, several groups in America have recently identified school reform as a
major and current priority. The US Department of Education has identified high
school reform models that support student achievement, and has
acknowledged small school size, scheduling choice, charter schools, career
academies, early college initiatives, and student engagement as research-based
models that contribute to improved student achievement. The National
Governor’s Association (NGA) formed a task force to study redesigning high
schools in order to make them more relevant and rigorous to the lives of
America’s students. The task force initiative responded to employers’ needs for
more highly skilled and better-educated workers, suggesting that reforms include

71
choices in high school programs and opportunities to earn college credit or
professional credentials. The National Association of Secondary School
Principals called for redesigning high schools that are more rigorous and
personalized for American students. Each of the reform models offered and
recommended by these groups is an example of a proven strength of online
learning that is central to success in the new global economy. By providing
scheduling flexibility, personalization, freedom from a large physical school,
engaging tools of distance learning, opportunities to accelerate learning, and
access to rigorous academic programs, virtual schools are not just important
examples of school reform models, but online education may also represent the
best hope for bringing high school reform quickly to large numbers of students
(Barkley, 2010).
1.1. History of the visited Cyber Charter School
The town where the cyber charter school is located was an economic and cultural
powerhouse through most of the 20th century, due to its vibrant steel industry.
Like many similar communities, this town suffered a devastating decline
beginning in the late 1970s and ceasing with the closure of Steel Mills in 1982.
The Town's influence as a hub of industrial and cultural progress seemed to
disappear overnight and the community faced an economic and educational
turmoil. The community's population declined quickly as people moved out
of the area to search for new jobs; The town's tax base fell dramatically which,
combined with decreasing enrollment, forced city officials to close down its
public high school in 1986 (Moe & Chubb, 2010). In the following years, there
was great anxiousness among high school students and their families because
there was not even one community in that County that would agree to educate the
students from this town on a long-term basis. In 1990, the community of another
town in the neighboring state, which is approximately 10 miles from the town,
agreed to educate the high school students from the town for the next 20 years.
This was a great easement to the students, families and community leaders in
the town. However, it raised concerns in the capitol city and throughout the state
because tax dollars were now being sent to the neighboring state to educate their
students.

72
In 1997, a new charter school law in the state provided a new opportunity for the
community of the town. The next year, the town received a $25,000 state grant
to put together a plan to address the educational turmoil in its community.
Under the leadership of its CEO, this Cyber Charter School was created and
started enrolling students in the fall of 2000. Utilizing a truly cutting-edge
approach, Cyber School formulated an advanced union of modern technology and
proven academic methodologies to deliver high-quality educational choices to
students and families.
Initially designed to provide educational services to approximately 50 students
from the town, Cyber Charter Schools had over 500 students enroll in the first
year and it has seen fast growth ever since.
2. Goal
The purpose of this qualitative case study was to explore what the charter school
directors, cyber charter school parents and education academics believed the
current situation of cyber schools in a US State to be and what their visions of
cyber schools for the future were. Through this search, the researcher examined
the effect of the progresses that are currently taking place in the cyber schools and
across this US state. Three different methods of data collection were used; site
visit and interviewing charter CEOs, home visits to cyber charter students’ homes
and interviewing parents, and information sessions and interviewing education
academics.
Three different questions asked during interviews.
How cyber curriculum can be integrated into existing academic programs of
brick and mortar charter schools?
What is your role as a cyber-charter school parent?
What do you believe the present state of cyber schools in your state is?
3. Methods
A case study approach was used to develop insights into the phenomenon, in this
case, the present and future of cyber education. Qualitative inquiry methods were

73
used in this study. These methods allowed the researcher to capture an
understanding of the perspectives of the CEO’s, cyber charter parents and
education academics regarding cyber education.
Consisted with its theoretical framework, Constructivism, this study has followed
a qualitative approach to explore the nature of construct. A case study is a
bounded system that is used to understand the selected case in depth (Baytak,
2011). CEOs of nine brick-and-mortar charter schools visited the home of a
US state’s cyber charter school district in a first step toward adding their own
online courses through a proposed state Charter School Digital Network. The
researcher was one of these visiting nine Brick and Mortar charter School CEOs.
These nine CEOs spent a whole day visiting the facilities, talking to the
administrators and staff, listening to presentations. At the end of the day, ten
charter school CEOs, including the CEO of host cyber charter school district were
interviewed on the subject; A leadership group consisting charter school
CEOs, including the researcher visited the cyber charter school district led by
one of the CEOs to learn how cyber curriculum can be integrated into their
existing academic programs. The leader of the group was the president of the
state’s coalition of public charter schools and CEO of one of the charter schools
in the state.
The investigator also visited homes of fourteen cyber charter school students as a
second step of data collection. Cyber charter parents were interviewed on the
subject; The investigator visited the homes of 14 cyber charter school students in
the state and took observation notes as they were either receiving a box full of
instructional materials from the cyber charter School or working on the computer
connected to their online classrooms. Later, information gathered from the site
visit and home visits were presented to thirty- six education academics in six
different information sessions. After the information sessions, education
academics were interviewed on the subject. After the data collection at the school
site and students’ homes, the researcher prepared a presentation on the cyber
charter school and had 6 information sessions with 6 education academics in
each session. A total of 36 education academics participated in these
information sessions. Interviews were done after each information session.

74
4. Data Collection
Observations notes during facility visits and home visits, interviews of Charter
CEOs, cyber charter school parents, and education academics were used as the
descriptive data collection tool regarding the current and future state of cyber
education in this US state. The researcher was the primary instrument for
data collection and analysis. During the interviews, the subjects expressed their
thoughts and opinions and his or her own perspectives on how they believe the
current state of their school to be and what they believe cyber schools will be in
the future, and Interview notes were taken. The critical factor was not the
quantity of informants, but the quality of the responses. The selection of the
informants of the study was based on the fact that they were all current brick and
mortar charter CEO’s, cyber charter school parents, and Education academics in
this particular US state. Using the analysis process recommended by Lincoln and
Guba (1985) the identified emerging themes were reported by 1) consensus
themes, which are when the majority of the participants stated the theme, and 2)
supporting themes, which are when two or three of the participants stated the
theme.
5. Results
Based on the guidelines of case study research methodology, the findings of the
current study can be categorized with the following themes;
Findings from the Site Visit and Interviewing Charter CEOs
The physical site included office buildings, a warehouse where the cyber charter
school shipped everything from crayons to laptops to cyber charter school
students’ homes (There was a post office and a repair shop inside the ware
house), a performing art school where cyber charter schools students
occasionally met for social activities.
After touring of the physical site, The CEOs engaged in a round table
discussion followed by the interview.The investigator asked one open-ended
question; How cyber curriculum can be integrated into existing academic
programs of brick and mortar charter schools?One of those attending, CEO, said,
“I am very excited about the possibility of expanding our school without having
to expand the facility. “He also said adding online curriculum will free his
school from the limitations of its locality, bringing great teachers and a wider

75
variety of course offerings to students. He hopes to add several cyber classes this
fall through the program. The idea of visited cyber charter school’s sharing online
curriculum and its CEO, at the charter school coalition’s annual leadership
conference, proposed expertise with their brick-and-mortar counterparts. The host
CEO took the group on a tour of the Cyber facilities. “There is a great opportunity
now,” he told them. “If we take advantage of it we can be leaders for a long time.
If we don’t, we’ll be spectators. “He said public school districts finally have
begun adding cyber curriculum, and State’s 124 bricks-and-mortar charter
schools need to do the same if they wish to remain competitive. A presentation of
a “plug-and-play” virtual school model showed the educators how they can add
the Interactive courses they want from a menu of 250 state-approved courses. The
website would function as part of the host school, and is designed to be flexible,
inexpensive and easily customized. “I think this collaboration is extremely
important. Brick-and-click is the wave of the future,” said another CEO.
Findings from Home visits to cyber charter students’ homes and Interviewing
Parents
Following instructional materials were in the boxes that cyber charter School
Students received; one laptop, one printer, one iPad for 11th and 12th grades, one
certain brand Touch Pad, Text Books by a well-known company. All
instructional materials had the cyber charter school’s logo. The investigator
asked one open-ended question: What is your role as a cyber-charter school
parent? The investigator observed that all cyber charter school students needed an
adult supervisor when they are home. Parents of cyber charter school students
reported during the home visits that cyber school employees makes
occasional phone calls to the homes to make sure that their students are being
supervised. Some parents reported that cyber charter employees interviewed the
parents as a pre-condition for enrollment and made sure that their students will be
supervised home after they are admitted to the cyber charter school. 12 of 14
parents reported that while some of public school parents are accused of
using schools as baby-sitting services, cyber charter schools required full time
supervision at homes. 8 of 14 Parents of elementary cyber school students
reported that they feel like their children having problems finding playmates at

76
an age where play is everything. Remaining 6 of 14 parents of middle school and
high school students reported similar concerns about social activities of their
teenagers.
Findings from Information Sessions and Interviewing Education Academics
The researcher has shared all the information that he has gathered during the site
visit and home visits. The investigator asked one open-ended question: What do
you believe the present state of cyber schools in your state is? 32 of 36
Education Academics pointed out that cyber charter school students’ social
development will suffer, activities that the cyber charter school is organizing
such as field trips, student clubs, dorms, tutoring centers and occasional
gatherings for performing art activities, study groups etc. will not be enough for
cyber charter students’ social development.
6. Discussion and Conclusion
The CEOs use internal and external sources for professional development on a
wide variety of topics, which differed from school to school. The CEOs foresee
changes in traditional brick and mortar schools so that they can compete with
cyber charter schools. Some of these changes could be an increase in the amount
of technology used in brick and mortar schools or others such as the offering of
online courses. Lastly, Cyber CEOs might transfer their schools into brick and
click schools to avoid criticism by cyber charter parents on social development of
cyber school students. Same criticism was made by 32 education academics as
part of this study. Cyber elementary charter school students miss out on play due
to the fact that they do not have as many friends as brick and mortar elementary
students do. Cyber middle and high school students miss out on social activities
due to the fact that they do not have as many friends as brick and mortar middle
school and high school students do.
Future research needed to study the impact of online education on social
development of kindergarten and elementary cyber students, middle school
students and high school students separately.

77
All these might lead the way to a conceptual change in schooling, from two
extreme end of schooling; traditional brick and mortar schools and futuristic
cyber schools to combination of both; Brick and Click Schools (Smart & Cappel,
2006).
REFERENCES
Barkley, B. W., (2010). The Effect of Blended Online Versus Face-to-face
Learning Environments on Student Outcomes for Eight Grade Algebra I
Students. Dissertation Submitted to the Faculty of Trevecca Nazarene University
School of Education in Partial Fulfillment of the Requirements for the Degree
of Doctor of Education in Leadership and Professional Practice.
Baytak, A. (2011). The nature of using Virtual Worlds by a Child as a Learning
Platform. A Case Study. Turkish Online Journal of Distance Education-TOJDE
ISSN 1302-6488, Volume: 12 Number: 3/2
Cattagni, A., & Farris, E. (2001). Internet Access in U.S. Public Schools and
Classrooms: 1994 – 2000. Education at a Distance, 15(6). Received on December
15, 2011, from http://www.usdla.org/html/journal/JUN01_Issue/article04.html.
Christensen, C., Johnson, C. W., Horn, M. B. (2008). Disrupting Class: How
Disruptive Innovation Will
Change the Way the World Learns.
Dilmaç, B., (2009). Psychological Needs as a Predictor of Cyber bullying: a
Preliminary Report on College
Students. Educational Sciences: Theory & Practice, 9(3). 1307-1325
Dilmaç, B., & Aydoğan, D., (2010). Parental Attitudes as a Predictor of Cyber
Bullying among Primary
School Children. Journal of Psychological and Brain Sciences, 2:4 2010
El-Tigi, M. A., Lewis, B. A. & Mac Entee, V. M. (1997). Perception of
Elementary Students of Visuals on the Web, (ED 408 949)
Esack, S., (2010). Bethlehem Area May offer Online Classes. IU 20 Aould Help
District Recoup Money

78
Now Sent to Cyber Charter Schools. The Morning Call.
Fischer, D. A., (2009). Classrooms without Borders: The Characteristics of
International Secondary Schools that Offer Online Courses. A Dissertation
Submitted to the Faculty of the Graduate School, University of Minnesota.
Grigorovici, D, Nam, S. & Russill, C. (2002). The Effects of Online Syllabus
Interactivity on Students’
Perception of the Course and Instructor. Internet and Higher Education, 6 (2003)
41–52.
Kafai, Y. B. & Sutton, S. (1999). Students’ Computer and Internet use at Home:
Current Trends and Issues. Journal of Educational Computing Research, Vol.
21(3) 345-362.
Lincoln, Y. S., & Guba, E. G. (1985). Naturalistic inquiry. Beverly Hills, CA,
Sage Publications, Inc. Lischin, J., (2010). Examining Charter Schools.
Association for Supervision and Curriculum Development. Association for
Supervision and Curriculum Development,Volume 16. Issue 1.
Means, B., Toyama,Y., Murphy. R., Bakia, M., and Jones, K. (2009).
Evaluation of Evidence-based Practices in Online Learning: A Meta-analysis
and Review of Online-learning Studies. Washington, D.C.: U.S. Department of
Education.
Moe, T., M., & Chubb, J. C., (2010). Liberating Learning; Technology,
Politics, and the Future of
American Education. Center of the American Experiment.
Moore, P. L. (2002). Access and Success in Web Courses at an Urban
Multicultural Community College: The Student’s Perspective. Unpublished
Research Report, Northern Arizona University, (ED 465 402). Morse, B. C.,
(2010). Virtual Education in Rhode Island’s K-12 Public Schools: Current
Status and Perceptions of Administrators. A Dissertation Submitted in Partial
Fulfillment of the Requirements for the Degree of Doctor of Education, Johnson
& Wales University Providence, Rhode Island.
Rosendale, E. G., (2009). Supervision of Cyber Teachers: Examining U.S. Based
Cyber School Policy and Practice. Submitted to the Graduate Faculty of

79
School of Education in Partial Fulfillment of the Requirements for the
Degree of Doctor of Education, University of Pittsburgh.
Rushkoff, D., (1997). Playing the Future: What We Can Learn from Digital Kids.
Sherbondy, K. H., (2008). A Descriptive Study of Cyber Charter Schools in
Pennsylvania. Submitted to the Graduate Faculty of School of Education in
Partial Fulfillment of the Requirements for the Degree of Doctor of Education,
University of Pittsburgh.
Smart, K.L., Cappel, J.J. (2006). Students' Perceptions of Online Learning: A
Comparative Study. JITE
201-219
Terry, K. A., (2009). Exploring a Professional Learning Community Model and
Student Achievement in a
Virtual Middle School. Doctoral Study Submitted in Partial Fulfillment of the
Requirements of the Degree of Doctor of Education Teacher Leadership, Walden
University.
Watson, F. J. (2007, April). A National Primer on K-12 Online Learning.
Retrieved November 20, 2011, from North American Council for Online
Learning:
http://www.kaplanonlineschools.com/pdf/NACOL%20A%20National%20Primer
%20on%20K-12%20Online%20Learning.pd

80
Knowledge Transfer Activities for the Development of Organic Rice
Production of Community Producers Based on Sustainable
Development Concept in Thailand
Atchara Sriphan
Naresuan University, Thailand
Abstracts
Main objective of this research is to set up knowledge transfer activity for the
development of organic rice production of community producers based on
sustainable development concept in Thailand. The research attempts to 1) study
the development of organic rice production process, and 2) develop knowledge
transfer activity strategy for the development of organic rice production of
community producers based on sustainable development concept in Thailand.
Mixed method research were used and the findings are as follows: 1) Even with
the Thai Government supports as stated in the Strategic Plan for Development of
Thailand Organic Agriculture 2013-2019, at present there are few organic rice
community producers of organic rice in Thailand, and their development
processes now are at the beginning stage which are not systematic, minimal
concern about sustainable development, especially environmental dimension and
lacks of knowledge and technology to support organic rice production process, 2)
the strength of organic rice production in Thailand is that there are many rice
planting areas and farmers; the weakness is the lack of knowledge about organic
rice production; the opportunity is the supporting policies related to organic rice
production from Thai Government, and the threat is the high competition in
global rice market between rice exporters from many countries, especially within
ASEAN, 3) various present knowledge transfer activities were currently
conducted by few community producers in the research areas such as activities in
Farmer School, in learning center and from different types of training, and 4)
suitable knowledge transfer activity strategy for the development of organic rice
production of community producers based on sustainable development concept in
Thailand as indicated by this research is the use of participatory knowledge
transfer activity strategy, SCAPEN Strategy. This strategy was separated 6 steps,

81
Sustainable development concept, Communication, Awareness, Participation,
Education, and Networking.
Introduction
Sustainable development proposes a new paradigm of decision making for all
sectors of society. It entails a new perspective on present issues and challenges,
and requires a better appreciation of the complex interconnections between the
economic, social and environmental aspects of current challenges. In order to
attain sustainable development, 1) environmental policies need to be socially and
economically feasible; 2) social policies need to be environmentally and
economically feasible; 3) economic policies need to be socially and
environmental feasible (Bell, Halucha, and Hopkins, 2000). Therefore, not only
sustainable development is the concept for Thailand, it is also the world
development concept.
To adopt this perspective is like looking at current problems through a new lens.
The sustainable development lens focuses attention not only on the integrated of
three aspects above but also on the horizons of the future as a way of seeing more
desirable approaches to the problems of the present (Bell, Halucha, and Hopkins,
2000).
Over the past quarter-century Thailand has enjoyed remarkable economic growth,
making the country an economic leader and prominent development partner in the
region. This growth has not come without a cost. Rapid development,
urbanization, and the spread of industrial activity have had a serious impact on the
country’s people and ecosystems. Much of the country’s forest cover has been
lost, while roughly half of Thailand’s rivers and lakes are classified as having
poor water quality. There is overused of land and water and a lack of planning in
certain sectors. Climate change also threatens to have a major impact on Thailand,
especially its low-lying central region, which is also the most fertile area of the
country, and coastal areas which are prone to flooding due to rising sea levels.
Consequently, energy conservation, conservation technologies and alternative
energy are now some of the highest-profile issues and areas of green activity in
Thailand. With a new constitution that mandates improved environmental

82
governance, Thailand is attempting to reverse these trends while decentralizing
the process of environmental decision making (UNDP Thailand, 2012).
Government agencies and other organizations provide helps for this problems. For
example, UNDP provided the sustainable development programs such as
environmental programs that based on a partnership approach that brings in a
number of stakeholders, including communities, NGOs, and local and national
authorities. Their Global Environment Facility (GEF) has allocated US$23.9
million to Thailand through 2010 in two critical focal areas: biodiversity and
climate change. UNDP also manages the GEF Small Grants Program, through
which over 200 small projects have been implemented in Thailand since 1998
(UNDP Thailand, 2012).
The effects of all the projects above on the production of goods and services are
still not impressive. The rice production in Thailand is generally the same as in
the past . Most of Thai community producers don’t have innovative idea for the
production of green products that reflects interconnections of economic, social
and environmental aspects. This is an indication of the lack of knowledge, the
most important factor of production process sustainability.
Thailand has a strong tradition of rice production. It has the fifth-largest amount
of land under rice cultivation in the world and is the world's second largest
exporter of rice (Maierbrugger, 2013). Thailand has plans to further increase its
land available for rice production, with a goal of adding 500,000 hectares to its
already 9.2 million hectares of rice-growing areas (The Nation, 2009). In 2008,
The Thai Ministry of Agriculture expects rice production to yield around 30
million tons of rice (Nirmal, 2008).The most produced strain of rice in Thailand is
jasmine rice, which is a higher quality type of rice. However, jasmine has a
significantly lower yield rate than other types of rice, but it also normally fetches
more than double the price of other strains in a global market (The Nation, 2009).
The government wanted to promote urban growth, and one of the ways it
accomplished this was by taxing the rice industry and using spending money in
big cities. In fact, during 1953, tax on rice accounted for 32 percent of
government revenue. The government set a monopoly price on exports, which
increased tax revenue and keep domestic prices low for Thailand. The overall
effect was a type of income transfer from farmers to the government and to urban
consumers (who purchased rice). These policies on rice were called the "rice

83
premium," which was used until 1985 when the government finally gave in to
political pressure. The shift away from protecting the peasant rice farmers by the
government moved the rice industry away from the egalitarian values that were
enjoyed by farmers to more of a modern-day, commercial, profit-maximizing
industry (Pasuk Phongpaichit, and Baker, 1995).
The Thai government had strong incentives to increase rice production and they
were successful in most of their plans. The government invested in irrigation,
infrastructure, and other pro-rice projects. The World Bank also provided finance
for dams, canals, locks, ditches, and other infrastructure in the Greater
Chaophraya Project. These policies helped lead rice land to increase from 35
million to 59 million rai from 1950s to 1980s. During 1961 to 2007, The rice
production has about tripled in terms of total paddy rice produced. While
Thailand's rice production has not increased every year, which is not to be
expected, one can see a trend line for steady significant increases since the 1960s.
A large portion of this rapid expansion was due to increased production of rice in
northeast Thailand (Perehudoff, 2007). While in the past, central Thailand was
the main producer of rice, northeast Thailand quickly caught up to a comparable
amount of production. This was in part due to the new road systems between
northeast Thailand and the shipping focused cities on the coastline. The villages
that had a significant portion of rice production were also changing as farmers
went from more subsistence practices to mostly wage labor (exchange labor also
virtually disappeared). Cows were being replaced for tractors to work on the farm
and irrigation technology was updated in most villages. The green revolution was
just starting to spread among the world’s agricultural industries. Rice farmers and
merchants took advantage of new rice varieties, strains, fertilizers, and other
technological advances. The International Rice Research Institute (IRRI) was also
disseminating knowledge, technology, new rice strains, and other information to
rice producers in Thailand. From the 1950s to 1970’s rice production per unit of
land increased by almost 50 percent (Pasuk Phongpaichit, and Baker, 1995).
By the end of 2012, Thailand had around 17 million tonnes of milled rice in
stockpiles. It planned to export a large part of it through government-to-
government contracts in 2013. Unfortunately, beaten by India and Vietnam,
Thailand lost the spot of Top Rice exporting country in 2012.

84
While all of these advances helped improve overall production of rice in
Thailand, many low-income farmers in Thailand were left worse off. Many
peasants were unable to hold onto to their land that they used to harvest rice on
and had to become tenants to survive. The government would always expect tax
revenue, even during a bad year, and this pushed many low-income farmers even
closer to the margin. New technologies also pushed up the entrance cost of rice
farming and made it harder for farmers to own their land and produce rice.
Farmers that already had somewhat large scale operations or could afford all the
new chemicals, rice strains, and tractors benefited greatly while the normal
peasant was turned from a land owning rice producer to a manual laborer on
others land (Pasuk Phongpaichit, and Baker, 1995).
Rice has many important roles in Thai society from food to work. Rice uses over
half of the farmable land area and labor force in Thailand . It is one of the main
foods and sources of nutrition for most Thai citizens. Rice is also of the main
components of Thai exports (Evenson, Herdt, and Hossain, 1996). The Thai rice
industry also faces a few big threats. According to Setboonsarng the top three
threats are, “(i) increase in competition in the international market; (ii) growing
competition with other economic activities that increases the cost of production,
especially the labour cost; and (iii) degradation of ecological conditions. Rice
research has to address these challeneges.”As the world becomes “flatter,” and the
rice production around the world become more competitive, it becomes harder for
Thailand to keep its competitive advantage and the margins Thai rice producers
have been used to. For the second threat, the modernization of Thailand has led to
an increase in wealth and the cost of labor, making it more expensive for rice
farmers that use cheap manual labor. Third, the massive amount of land used for
rice can have long term adverse effects on the yields of the land.
However the market for organic rice is still in its infancy, but is growing year on
year as more and more consumers realize there is now a choice. Thailand is
currently facing increasing competition on several fronts, both conventional and
novel- conventional, from countries such as Vietnam, whose exports are rapidly
catching up with Thailand, and novel, from countries such as China, which has
deployed biotechnology to complement its conventional breeding programs, to
produce hybrid rice yielding double that of current varieties. Thailand faces an
even greater threat to its niche market, homemade fragrant rice, and in 2004

85
prevented an attempt by American scientists to develop its own varieties of
Jasmine rice. Such an undertaking would have led to a permanent collapse in
incomes for poor rice farmers in northeastern Thailand, probably with grievous
social consequences. Thailand is still vulnerable to this threat today (The National
Innovation Agency, 2006)
Innovation is not only required in the development of new products. It can also be
applied to the marketing of new rice products and to the development of an
identifiable Thai brand. A national brand could be considered which would
certainly complement the “Kitchen of the World’ initiative. However, ensuring
recognition of a Thai brand will require major investment in brand-building in key
high-value markets such as the EU, USA and Japan (The National Innovation
Agency, 2006).
Clearly then, there is a growing realization in the rice sector that innovation must
be put to work to enhance the competitiveness of the sector in the global
marketplace. Already, some ambitious companies are adopting new technologies
and methods to truly compete, but they are relatively few in number. It must be
realized that innovation is not a reactive process; it must be an integral part of a
company’s structure for it to survive. There must also be a sound understanding of
intellectual property and its management and an efficient regulatory system to
ensure that the maximum value of innovative thinking is captured (The National
Innovation Agency, 2006).
Compared with other rice producing countries, Thailand’s rice economy has
benefited relatively little from Green Revolution technologies, and there has been
limited investment in downstream value added products. Thailand’s rice sector
could benefit enormously from a coherent rice innovation policy, which would
focus on increasing productivity and water use efficiency, technology transfer for
downstream processing, and promotion of high value specialties for international
markets (The National Innovation Agency, 2006).
In conclusion, Thailand has many community producers who produce rice but
they are not organic rice. Moreover they are not knowledge based production, and
need sustainable production development supported by knowledge transfer
activities from both local and global sources. Even if Thai community producers
have regularly conduct knowledge transfer activities among producers, workers,
public sector personnel, business sector personnel and other important

86
stakeholders, they are not able to develop their rice products under sustainable
development concept.
There are many indications that make us believe that it’s because they don’t have
the right strategy, especially knowledge transfer strategy. This research try to fill
this gap by first analyzing their overall knowledge transfer activities of their
production, and then searching for knowledge transfer activities that could lead to
a sustainable production process. Therefore main objective of this research is to
set up knowledge transfer activities of community producers for the development
of organic rice based on sustainable development concept in Thailand. Later, the
results of this research could be implemented for Thai community producers in
the area.
Research Objectives
This research is an effort to set up knowledge transfer activity for the
development of organic rice production of community producers based on
sustainable development concept in Thailand. The research attempts to 1) study
the development of organic rice production process, and 2) develop knowledge
transfer activity strategy for the development of organic rice production of
community producers based on sustainable development concept in Thailand.
In pursuit of the above objective, this paper will include the following topics:
conceptual framework, methodology, results, discussion and conclusion, research
limitations and direction for further research at the end.
Conceptual framework
To reach the objectives of the research, conceptual framework shown in figure 2
below demonstrates relationship between sustainable development concept
(Agenda 21,the Rio Declaration on Environment and Development ,1992;
WBCSD Vision 2050 ,2012; ICUN, 2006), green production concept (Thailand
Business Council for Sustainable Development (TBCSD), 1993); Turan, 2007;
Michelini and Razzoli , 2004) , knowledge based production (Powell and
Snellman, 2004), the production of organic rice, organic rice for global market,
and the knowledge transfer activity strategy considered to be appropriate for the
organic rice in Thailand.

87
Figure1: Shows the Research Conceptual Framework
Methodology
This research is mixed method research. There were used both quantitative and
qualitative research methodology. Under present complicated economic system,
knowledge transfer activity involving culture, environment and economic issue,
combination of local and global knowledge in Thailand and unique characteristics
of organic rice as a innovative product, this methodology was chosen to be our
main research procedures which can be divided into 7 steps: (IIED and ODA,
1994) (1) Select a location and gain approval from local administrative officials
and community leaders 100 producers from 2005 community rice producers
around of Thailand (Bureau of Rice Production Extention (BRPE), 2013). (2)
Collect both secondary and field data (spatial, time related, social, environmental,
economic and governance) by community survey, participatory and non
participatory observation, individual and group interviews of community
producers, group discussion, public opinions, and share information with selected
communities. (3) Synthesize and analyze that both of quantitative and qualitative
Sustainable
Development
Concept
1) Agenda 21, the
Rio Declaration
on Environment and
Development (1992)
2) WBCSD Vision
2050 (2012)
3) ICUN (2006)
Green Production
Concept
1) TBCSD (1993)
2) Turan (2007)
3) Michelini and
Razzoli (2004)
Knowledge
based
Production
Powell and
Snellman (2004)
3
Knowledge
Transfer
Activity
Strategy
Improvement
of Production
of Organic
Rice in
Thailand
Thai Organic Rice for Global Market
6

88
data (4) Identify problems and opportunities to resolve them with volunteered
community rice producers (5) Rank opportunities and prepare maps, action plans,
reports and costing (including basic work plan for all members of the
community). (6) Adopt and implement the knowledge transfer activity strategy.
(7) Follow-up, evaluate and disseminate knowledge transfer activity strategy,
maintain momentum through addressing new issues.
Figure2: Seven Steps of the Research
Results
The research findings focus on two points as follows:
(1) the organic rice production slowly increased from 2007 to 2013 although
Thai Government proposed a policy about organic agriculture (, Strategic Plan for
Development of Thailand Organic Agriculture 2013-2019) .Now there are few
community producers of organic rice in Thailand, and their development
processes at present are at the beginning stage which are not systematic, minimal
concern about sustainable development, especially environmental dimension and
Step1: Select a location from 2005 community rice producers
Step2: Collect both secondary and field data
Step3: Synthesize and analyze that both of quantitative and qualitative data
Step4: Identify problems and opportunities to resolve them
Step5: Rank opportunities and prepare maps, action plans, reports and costing
Step6: Adopt and implement the knowledge transfer activity strategy
Step7: Follow-up, evaluate and disseminate knowledge transfer activity strategy

89
lacks of knowledge and technology to support organic rice production process.
Most of agriculture products in Thailand like rice are still traditional in term of
production methods.
They are under organic standard. Moreover three dimensions of sustainable
development concept including economic dimension, social dimension and
environmental dimension hasn’t been actively applied. In fact, 95.01 percent of
farmers in Thailand are still traditional both in term of production methods, only
4.99 percent are organic rice production in term of production methods. The
highest percentage of farmers in organic rice production community is in the
north-eastern part of Thailand. The result is shown in table 1.
Table 1: Organic Rice Producers in Thailand
Community Rice Producers Percentage (%)
N=2005
Non organic rice producers 95.01
Organic rice producers 4.99
Summary 100
The development process of organic rice production at present are at the
beginning stage which are not systematic because the community producers still
produce organic rice following the traditional production method and within the
bound of their families or communities. They are minimal concern about
sustainable development, especially environmental dimension and lack of
knowledge and technology to support organic rice production process. So their
products are not popular in the wide area of Thailand. The result from secondary
and field data by community survey, participatory and non participatory
observation, individual and group interviews of community producers, group
discussion, public opinions, and share information with selected communities are
shown in table 2.

90
Table2: Present rice production methods
Production Processes Rice production methods
Production Way Most of producers are non organic rice production
Material Use
(fertilizer, insecticide)
Most of producers use not pure organic
materials.
Production Knowledge&
Technology
Traditional/Modern knowledge & technology
but
lack of knowledge & technology to support
organic
rice production process.
Product Evaluation
Most of producers evaluate product quality
such as
moistness, rice kernel, taste etc, but lack
organic quality evaluation.
Marketing
Use traditional marketing that it is minimal
concern
about sustainable development concept, value
added in agricultural products.
Lack of study on consumer behavior in global
market. Lack of study and understanding of
marketing trend such as green marketing,
cooperate social responsibility (CSR) etc.
The data in table 1 and table 2 show that the development of organic rice
production should be changed to knowledge-based production. Knowledge-based
production is the production that emphasizes knowledge as the most important
material in production process. However knowledge-based production will be
possible if community producers have the better way of turning knowledge to
practical knowledge that really improve production process.

91
Knowledge management is the process that set up to identify, seek, create, share,
learn, and use knowledge to gain a certain type of benefit. That is to say
knowledge management is important for new business organization especially
community business that lack the original knowledge and technology for
developing their products. Most of successful cases of knowledge management
process for business development have good knowledge transfer model which is
considered to be the key success factor of knowledge management process.
However no knowledge transfer process that suitable for any organization
management. So business organizations should develop knowledge transfer
activities that suitable their organizations.
(2) From this research SWOT analysis found that the strength of organic rice
production in Thailand is that there are many rice planting areas and farmers; the
weakness is the lack of knowledge about organic rice production; the opportunity
is the supporting policies related to organic rice production from Thai
Government, and the threat is the high competition in global rice market between
rice exporters from many countries, especially within ASEAN
(3) Organic rice producers in Thailand have various present knowledge transfer
activities were currently conducted by few community producers in the research
areas such as activities in Farmer School, in learning center and from different
types of training.
(4) Suitable knowledge transfer activities for development of organic rice based
on sustainable development concept in Thailand as indicated by this research is
the use of SCAPEN Model. This model was separated 6 steps, Sustainable
development concept, Communication, Awareness, Participation, Education, and
Networking.
The research findings focus on three points as follows: (a) organic rice production
in Thailand are still traditional both in term of production way, material use,
production knowledge& technology, product evaluation, and marketing. Three
dimensions of sustainable development concept including economic dimension,
social dimension and environmental dimension hasn’t been actively applied.
Appropriate knowledge transfer activities for the production of organic rice in
Thailand is participatory knowledge transfer activities among community
producers, workers, public sector personnel, business sector personnel and other

92
important stakeholders. The model that we found suitable for this industry is
SCAPEN Model. The model is divided into six elements which are: (1)
Sustainable development concept is the information to develop production to
sustainable production. (2) Communication is the knowledge communication
activities among stakeholders. (3)Awareness is the stakeholders awareness to
develop production to sustainable production.(4) Participation is the stakeholders
participation in knowledge transfer activities.(5) Education is the practical
knowledge transferring method among stakeholders whole education system by
formal education for example teaching in school, college, university, informal
education for example attending training courses in community knowledge
centers, non-formal education for example searching knowledge from anywhere,
anytime, any person, or receiving knowledge from mass media etc. , and (5)
Networking is the building of network include knowledge network, political
network, societal network, economic network, and environmental network.
To implement this model, one should follow these 6 steps:
step 1 to distribute sustainable development concept to community producers by
various way through community leaders, economic measure, social etc.,
step 2 to communicate sustainable development concept to community producers
through opinion leaders, local expert,
step 3 to make awareness in sustainable development concept among community
producers through participatory activities such as public forum, public hearing,
traditional show etc.,
step 4 to encourage participation among community producers though public
planning, public interesting, economic measure etc.,
step 5 to educate community producers through non- formal education activities,
and
step 6 to build networking through community social event, create mutual
economic interest.
However, the most important step that is considered to be a key success factor is
step 2. One of the major reasons is from what this research was discovered to be
the biggest obstacle of knowledge transfer activities in this industry is the
difficulties of communicating sustainable concepts to community producers.

93
Based on one of sustainable development concept, knowledge transfer activities
have to be used strategically. Therefore, to develop organic rice in Thailand,
knowledge transfer of practical knowledge should be one of the key production
activities (Figure 2).
Figure 2: Shows six steps to SCAPEN Model
Discussions and Conclusions
Discussions
This study confirms the use of SCAPEN model in the development of organic rice
based on sustainable development concept in Thailand. This model realizes that
perceived usefulness, and subjective norm which were perceptive factors adapted
from the model should have significant influences on knowledge transfer
activities adoption among community producers. To cover all the factors behind
the adoption of knowledge transfer activities and sustainability development, it
also include the role of knowledge factors, environments and industrial factors,
individual characteristics, learning style, organizational characteristics cultural
factors, and technological factors.
Step 1 Sustainable Development Concept
Step 2 Communication
Step 3 Awareness
Step 4 Participation
Step 5 Education
Step 6 Networking

94
In addition, we suggest that the knowledge transfer activities would improve the
development of other sustainability rice production in Thailand. Our
comprehensive model above can be taken as a research model for proposition
development and further empirical investigation.
Conclusions
Main objective of this research is to set up up knowledge transfer activities of
community producers for the development of organic rice based on sustainable
development concept in Thailand. Specifically, the research attempts to 1) study
the development of organic rice process, and 2) develop knowledge transfer
activities of community producers for the development of organic rice based on
sustainable development concept. Both quantitative and quality methods were
used in this research. We found that 1) Although Thai Government proposed a
policy about organic agriculture, Strategic Plan for Development of Thailand
Organic Agriculture 2013-2019, but at present there are few community
producers of organic rice in Thailand, and their development processes now are at
the beginning stage which are not systematic, minimal concern about sustainable
development, especially environmental dimension and lacks of knowledge and
technology to support organic rice production process, 2) the strength of organic
rice production in Thailand is that there are many rice planting areas and farmers;
the weakness is the lack of knowledge about organic rice production; the
opportunity is the supporting policies related to organic rice production from Thai
Government, and the threat is the high competition in global rice market between
rice exporters from many countries, especially within ASEAN, 3) various present
knowledge transfer activities were currently conducted by few community
producers in the research areas such as activities in Farmer School, in learning
center and from different types of training, and 4) suitable knowledge transfer
activity strategy for the development of organic rice production of community
producers based on sustainable development concept in Thailand as indicated by
this research is the use of participatory knowledge transfer activity strategy,
SCAPEN Strategy. This strategy was separated 6 steps, Sustainable development
concept, Communication, Awareness, Participation, Education, and Networking.

95
The model for the strategy we found suitable for this industry is SCAPEN Model.
Implication of this model can be divided into six steps: step 1 to distribute
sustainable development concept to community producers by various way through
community leaders, economic measure, social etc., step 2 to communicate
sustainable development concept to community producers through opinion
leaders, local expert, step 3 to make awareness in sustainable development
concept among community producers through participatory activities such as
public forum, public hearing, traditional show etc., step 4 to encourage
participation among community producers though public planning, public
interesting, economic measure etc., step 5 to educate community producers
through non- formal education activities, and step 6 to build networking through
community social event, create mutual economic interest.
This model could be used for transferring knowledge for the development of
sustainability organic rice production in Thailand. In the future, the author will
apply this model for other sectors, and improve the model to make even more
general.
Research Limitations and Direction for Further Research
This research has two main limitations: (1) limit of amount of community
producers who produce organic rice in year 2012-1013.
Further research is required to develop appropriate research hypotheses to carry
on with the research. Future studies can explore deeper the exact knowledge
transfer strategy in the other industry and the influence of knowledge
management practice on organizational performance and productivity. We believe
that this rather complex model can be taken as a research model to investigate
knowledge management in detail both in other industry and in its effect on
organizational performance and productivity.
However to apply the model to other industry, other area and other cultural
context need extensive field survey of stakeholders on both quantitative and
qualitative side. In order to improve performance of an organization , we may not
need all factors in SCAPEN model depending on contextual factors of each
situation. The model appears in this paper is simply treated as a general case.

96
References
Bell, David Halucha, Paul and Hopkins, Mark. (2000). Sustainable Development
Concept Paper. Retrieved from
website:http://sustreport.org/background/sd_paper.html.
Evenson, Robert E., Robert W. Herdt, and Mahabub Hossain. (1996). Rice
Research in Asia: Progress and Priorities. Wallingford, UK: CAB International in
association with the International Rice Research Institute.
IIED and ODA. (1994). Whose Eden? An overview of community approaches
to wildlife management. United Kingdom: International Institute for
Environment and Development. IUCN. (2006).
The Future of Sustainability Rethinking Environment and Development in
the Twenty-first Century. Retrieved from
http://cmsdata.iucn.org/downloads/iucn_future_of_sustanability.pdf.
Michelini, RC, and Razzoli, RP. (2004). Product-service eco-design; knowledge-
based infrastructures., Journal of Cleaner Production. 12: 415-428.
The National Innovation Agency. (2006). Potential World Markets for
Innovative Rice Businesses. The National Innovation Agency.
Pasuk Phongpaichit, and Christopher John Baker. (1995). Thailand, Economy and
Politics. Kuala Lumpur: Oxford University Press.
Perehudoff, Carol.(2007). "Thailand's miracle grain for all seasons; Humble rice
has the power to feed, cleanse, fight ravages of time." The Toronto Star [Toronto]
30 June 2007.
Power, W.W. and Snellman, K. (2004). The Knowledge Economy. California:
Stanford University.
Rice strain is cause of comparatively low productivity." The Nation (Thailand) 16
Apr. 2008. 2 Feb. 2009.
Sriphan, Atchara. (2012). Knowledge Transfer Strategies for Development of
Cultural Goods and Services based on Sustainable Development Concept in
Thailand. OIDA International Journal of Sustainable Development. 5(7): 47-
56.

97
Thailand wants rice top spot back". Investvine.com. 2013-02-01. Retrieved 2013-
02-14.
Turan, A. (2007). Eco-labelling applications in the textile & apparel sector in
Turkey. Fibres & Textiles in Eastern Europe. April/June15 (2): 14-19.
UNDP Thailand. (2012). UNDP’s work in Thailand can be divided into five
broad thematic areas. Retrieved from
http://www.undp.or.th/focusareas/focusareas.html.

98
Behavior of Monthly Total Returns of U.S. Treasury Bills:
1926 To 2011
Shaikh A. Hamid
Southern New Hampshire University, USA
Abraham Habib
University of Massachusetts Boston,USA
Abstract
This paper explores the behavior of total monthly returns of Treasury bills over
the period January 1926 to December 2011. We examine three types of month
effects: if the mean of T-bills total monthly returns of the entire data set, and of a
given month were significantly different from zero; if the mean of T-bills total
monthly returns of a given month was different from the mean of the other eleven
months stacked; and if the variance of the T-bills total monthly returns for a given
month was different from the variance of the other eleven months stacked. The
mean of T-bills total monthly returns (0.294%) for the entire data set as well as
the mean of all the months were significantly greater than zero. No month effect
was detected either in terms of mean or in terms of variance. When the data are
sliced into three sub-periods, we find results similar to what we find for the entire
data set. The non-existence of significant differences in the means or the
volatilities of the returns of a month compared to the other eleven months stacked
together shows that T-bills market is largely efficient. This is contrary to what we
found with similar studies on monthly returns of long-term Treasury and
corporate bonds. The mean of T-bills total monthly returns during the Republican
presidencies (0.372%) was higher than during the Democratic presidencies
(0.215%). Compared to the other eleven months stacked, the variance of the
returns of December during Republican presidencies was lower and it was higher
during Democratic presidencies.

99
Introduction
The U.S. Treasury bills market is one of the most active markets in the world.
U.S. Treasury securities are the debt financing instruments of the United States
federal government. T-bills have maturities of 1-month, 3-month, 6-month, and 1-
year. They are issued at a discount to face value and reach full value (par value) at
maturity. The difference between the discount price and par value is the interest or
return earned. They carry a par value of $1,000 and up to $5 million. T-bills are
backed by the credit of the U.S. government, and are thus considered close to
risk-free investment. From 1928 to 2011, U.S. three-month T-bills provided
investors with a 3.61% compound annual return. With 3.11% compound annual
inflation, the real return over this period has been 0.50%. During this period, the
annual returns have ranged between 0% and 15%, with the returns ranging from
0% to 5% in 59 of the 84-year period. Historically, T-bills have realized the
highest returns during the inflationary 1970's and early 1980's. T-bills have
realized the lowest returns during the years of the Great Depression (the 1930's),
during the 1940's, when interest rates were price controlled ("pegged") by the
Federal Reserve, and recently during the "Great Recession" period and thereafter
(2008 - 2011).
With such an active trading in T-bills and with sophisticated investors that include
many foreign governments, the T-bills market is expected to exhibit a high degree
of efficiency. For example, we will not expect to find monthly seasonality in the
returns from T-bills. This paper explores some aspects of the behavior of the
monthly returns from T-bills in general and the presence of monthly seasonality in
particular. Insight into the behavior of U.S. T-bills returns has implications for
investors and policy makers. The next section deals with previous research on the
U.S. T-bills returns behavior, followed by research methodology of this study,
analysis of results, and summary and conclusion.
Literature Survey
Contrasted to the extensive research on equity returns, few investigations examine
seasonality in the fixed income markets and even fewer in the T-bills market.
Gibbons and Hess (1981) found some day-of-the-week effects in the trading of
thirty-day T-bills between 1963 and 1968. Ferri, Goldstein, and Oberhelman

100
(1984) also look at the day-of-the-week effect in T-bills return. The result of this
study show for the data tested that the day-of-the-week effect in the returns of the
bill market are occasional but irregular features of the market. Eiseman and
Timme (1984) explore intraweek seasonality in the federal funds market using
data from January 1966 to June 1982, and found seasonality to vary over time in
intensity and relative size. Park and Reinganum (1986) find unusual price
behavior of T-bills that mature at the turn of calendar months. Flannery and
Protopapadakis (1988) find intraweek seasonality continue to be significant but
not uniform. Chen and Chan (1997) found using monthly returns from 1926 to
1990 T-bills return showed strong October effect during economic expansion and
strong November effect during contraction.
Research Methodology
The goal of this research is to find if there was a month effect in U.S. T-bills total
monthly returns for the period of the study (1926-2011) and if so, was it more
pronounced during Democratic presidencies or Republican presidencies. Many
studies have used the dummy variable methodology to detect market seasonality.
Chien, Lee and Wang (2002) provide statistical analysis and empirical evidence
that the methodology may lead to misleading results. We avoid this problem by
following the methodology used in Hamid and Dhakar (2003) through which they
analyze seasonality in the monthly changes of the Dow Jones Industrial Average.
We study the month effect in three different ways. Unless otherwise stated,
significance in all cases is tested at the 5% level.
1. If the mean of T-bills monthly total returns was different from zero. The
mean of monthly total returns for a given month i is subjected to the
following hypothesis test: Ho: i = 0 vs. Ha: i 0. We use the standard t-
test for testing this hypothesis.
2. If the mean of T-bills total monthly returns of a given month was different
from the mean of the other eleven months stacked. We conduct the
following hypothesis test for a given month i: Ho: i = j vs. Ha: i j,
where j represents the remaining 11 months other than i. Since the
variances for many (i, j) periods and the sample sizes were unequal, we
use the more conservative t-test assuming unequal variances.

101
3. If the variance of the T-bills total monthly returns for a given month was
different from the variance for the other months. We conduct the
following hypothesis test for a given month i: Ho: i2
= j2
vs. Ha: i2 j
2,
where j represents the remaining 11 months other than i. We use the
standard F-test for testing this hypothesis.
In addition to the t-test and F-test, we use three nonparametric tests which do not
depend on the assumption of normal distribution of the data series. Kruskal-
Wallis nonparametric test is a test of differences in population medians. Mood’s
Median test is like Kruskal-Wallis test but is more robust against outliers. Mann-
Whitney test is a 2-sample rank test (also called the two-sample Wilcoxon rank
sum test) of the equality of two population medians.
To gain deeper insight into the month effect, we divide the entire period
(January 1926 to December 2011) into three sub-periods:
1926 to 1945 (which includes the Great Depression years, and the Second
World War);
1946 to 1972 (which includes the Breton Woods fixed exchange rate era,
and the break down of that era in 1972);
1973 to 2011 (which includes the volatile world we live in since the first
oil crisis of 1973).
We analyze the behavior of T-bills total monthly returns for (a) the entire data, (b)
the three sub-periods, (c) the Republican presidencies, and (d) the Democratic
presidencies.
Data and Descriptive Statistics
The data consists of U.S. T-bills total monthly returns January 1926 to December
2011. The data is obtained from Stocks, Bonds, Bills, and Inflation Yearbook
2012. The data contains 518 months which saw Republican presidents, and 514
months which saw Democratic presidents. That gives us 1,032 months of
observations.

102
The descriptive statistics for the monthly T-bills total monthly returns are shown
in Table 1. The mean monthly return for the entire period was 0.29% and the
median is 0.26%. The distribution of monthly means is positively skewed. The
maximum monthly return was 1.35% in June 1981 and the minimum was -0.06%
in November 1938.
Table 1: Descriptive Statistics for T-bills Total Monthly Returns:
January 1926 to December 2011
Figure 1 shows the frequency distribution of T-bills monthly returns for the entire
data set. The returns are far from being normally or log-normally distributed. The
Kurtosis (1.28) is much less than it would be under normal distribution (3).
T-BILLS TOTAL MONTHLY RETURNS
Mean 0.29%
Median 0.26%
Mode 0.30%
Std Deviation 0.25%
Kurtosis 1.28
Skewness 1.04
Minimum -0.06%
Maximum 1.35%
Count 1032

103
Figure 1: Frequency of T-bills Monthly Returns: January 1926 to December
2011
The distribution is presented next in more compact form. Only 12 (less than 1%)
of the monthly returns were negative (between -0.06% and -0.01%). Nearly half
of the returns (46%) were between 0% and 0.24%. A little over one-third of the
returns (35%) were between 0.25% and 0.49%. That means a little over four-fifths
of the returns (82%) were less than 0.49%. So less than one-fifth of the returns
were 0.50% or higher (highest return was 1.35%). From December 2008 to
December 2011, 36 of the returns were 0% (15) or 0.01% (21). The very high
Jarque-Berra statistic of 313.25 also shows non-normality of the data series.
Table 2: Frequency Distribution of T-bills Monthly Returns: 1926 to 2011
Range of Returns Frequency Frequency( as % of Total)
-0.06% to -0.01% 12 1.16
0.00% to 0.24% 474 45.93
0.25% to 0.49% 360 34.88
0.50% to 0.74% 130 12.6
0.75% to 0.99% 38 3.68
1.00% to 1.35% 18 1.74
Total 1032 100%
Fre
qu
en
cy
Histogram

104
Figure 2 shows the trend of monthly returns for the entire data set. The peak
period was from January 1978 to December 1982 – the mostly Carter years during
which the first and second oil shocks and the aftermath of the inflationary
pressures of the Vietnam War led to double digit inflation rates and corresponding
high T-bills monthly returns. During these five years the average return was
0.86% (0.29% for the entire data period) or 10.32% annualized.
Figure 2: T-bills Monthly Returns: January 1926 to December 2011
Results and Analysis
Entire Period (1926 – 20011)
Firstly, we explore month effect for the entire U.S. T-bills total monthly returns
data set. We test for the three types of month effects. Table 3 summarizes the
statistical outputs and results of the tests.
1 2 3 4 5 6 7
8 9 10 11 12 13 14
15 16 17 18 19 20 21
22 23 24 25 26 27 28
29 30 31 32 33 34 35

105
Table 3: Month Effect in T-bills Total Returns: January 1926 to December
2011
Note 1. “Positive” implies that the mean percentage change was significantly greater than zero.
“Negative” implies that the mean percentage change was significantly less than zero.
Note 2. “Higher” implies that the mean percentage change was significantly greater than the rest
of the months. “Lower” implies that the mean percentage change was significant smaller than the
rest of the months.
Note 3: All returns in all tables are in percentage.
The mean of monthly returns for the entire data set of 0.294% was significantly
greater than zero (p value=0.00). The means of monthly returns of all the
individual months were significantly greater than zero. October experienced the
highest mean return (0.307%) followed by September and March (both 0.298%).
February had the lowest mean (0.274%). As implied by the blank spaces in the
second last row of Table 2, the returns of none of the months was significantly
different from the returns of the other eleven months stacked. As implied by the
blank spaces in the last row of Table 2, the standard deviations of none of the
All Jan Feb Mar Apr May Jun Jul Aug Sep Oct Nov Dec
Count 1032 86 86 86 86 86 86 86 86 86 86 86 86
Mean 0.294 0.292 0.274 0.298 0.300 0.296 0.291 0.296 0.293 0.298 0.307 0.283 0.297
Median 0.260 0.260 0.255 0.280 0.250 0.260 0.265 0.275 0.255 0.265 0.280 0.265 0.255
Minimum
-
0.060
-
0.010
-
0.030
-
0.010
-
0.010
-
0.020 0.000
-
0.010
-
0.010 0.000 0.000
-
0.060 0.000
Maximum 1.350 1.040 1.070 1.210 1.260 1.150 1.350 1.240 1.280 1.240 1.210 1.070 1.310
Range 1.410 1.050 1.100 1.220 1.270 1.170 1.350 1.250 1.290 1.240 1.210 1.130 1.310
Std Dev 0.253 0.234 0.234 0.259 0.270 0.258 0.251 0.256 0.253 0.253 0.264 0.248 0.262
Sample Var 0.001 0.001 0.001 0.001 0.001 0.001 0.001 0.001 0.001 0.001 0.001 0.001 0.001
p-value (m=0) 0.000 0.000 0.000 0.000 0.000 0.000 0.000 0.000 0.000 0.000 0.000 0.000 0.000
p-value (t test) 0.952 0.428 0.867 0.813 0.918 0.945 0.904 0.991 0.854 0.609 0.699 0.913
p-value (F test) 0.169 0.170 0.391 0.199 0.417 0.484 0.439 0.503 0.513 0.298 0.410 0.321
Mean % Change Pos Pos Pos Pos Pos Pos Pos Pos Pos Pos Pos Pos Pos

106
months was significantly different from the standard deviation of the returns of
the other eleven months stacked. The non-existence of significant differences in
the means or the volatilities of the returns of a month compared to the other
eleven months stacked shows that T-bills prices were largely efficient. This is
contrary to what we found with similar studies on monthly returns of long-term
Treasury and corporate bonds.
Figure 3 graphs the mean of monthly returns for the entire data set. On average,
there was a slight fall from January to February, a rise in March and then a rather
flat trend until August and then rising in September and October. We then see a
fall in November and then rise in December. If intently viewed, the figure shows a
rather symmetrical distribution in the means of monthly returns with July as the
mid-point.
Nonparametric Kruskal-Wallis test result (not reported for brevity) shows no
significant difference in the medians of the returns of the twelve months (H
statistic = 0.85; p value=1.00). Mood’s Median test also shows no difference in
the medians of the monthly returns (Chi-Square statistic = 0.88; p value=1.00).
Figure 3: T-bills Total Monthly Returns: January 1926 – December 2011
Jan Feb Mar Apr May Jun Jul Aug Sep Oct Nov Dec
Mean 0.29 0.27 0.30 0.30 0.30 0.29 0.30 0.29 0.30 0.31 0.28 0.30
T-Bills Monthly Returns: 1926-2011
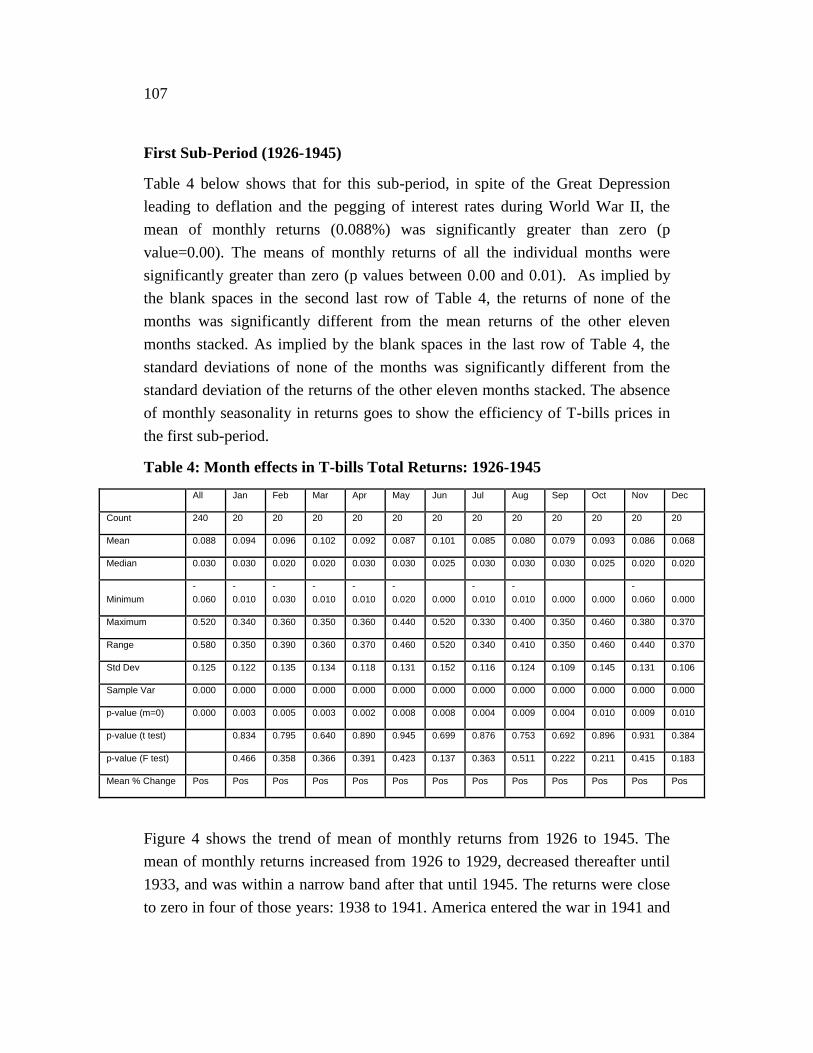
107
First Sub-Period (1926-1945)
Table 4 below shows that for this sub-period, in spite of the Great Depression
leading to deflation and the pegging of interest rates during World War II, the
mean of monthly returns (0.088%) was significantly greater than zero (p
value=0.00). The means of monthly returns of all the individual months were
significantly greater than zero (p values between 0.00 and 0.01). As implied by
the blank spaces in the second last row of Table 4, the returns of none of the
months was significantly different from the mean returns of the other eleven
months stacked. As implied by the blank spaces in the last row of Table 4, the
standard deviations of none of the months was significantly different from the
standard deviation of the returns of the other eleven months stacked. The absence
of monthly seasonality in returns goes to show the efficiency of T-bills prices in
the first sub-period.
Table 4: Month effects in T-bills Total Returns: 1926-1945
All Jan Feb Mar Apr May Jun Jul Aug Sep Oct Nov Dec
Count 240 20 20 20 20 20 20 20 20 20 20 20 20
Mean 0.088 0.094 0.096 0.102 0.092 0.087 0.101 0.085 0.080 0.079 0.093 0.086 0.068
Median 0.030 0.030 0.020 0.020 0.030 0.030 0.025 0.030 0.030 0.030 0.025 0.020 0.020
Minimum
-
0.060
-
0.010
-
0.030
-
0.010
-
0.010
-
0.020 0.000
-
0.010
-
0.010 0.000 0.000
-
0.060 0.000
Maximum 0.520 0.340 0.360 0.350 0.360 0.440 0.520 0.330 0.400 0.350 0.460 0.380 0.370
Range 0.580 0.350 0.390 0.360 0.370 0.460 0.520 0.340 0.410 0.350 0.460 0.440 0.370
Std Dev 0.125 0.122 0.135 0.134 0.118 0.131 0.152 0.116 0.124 0.109 0.145 0.131 0.106
Sample Var 0.000 0.000 0.000 0.000 0.000 0.000 0.000 0.000 0.000 0.000 0.000 0.000 0.000
p-value (m=0) 0.000 0.003 0.005 0.003 0.002 0.008 0.008 0.004 0.009 0.004 0.010 0.009 0.010
p-value (t test) 0.834 0.795 0.640 0.890 0.945 0.699 0.876 0.753 0.692 0.896 0.931 0.384
p-value (F test) 0.466 0.358 0.366 0.391 0.423 0.137 0.363 0.511 0.222 0.211 0.415 0.183
Mean % Change Pos Pos Pos Pos Pos Pos Pos Pos Pos Pos Pos Pos Pos
Figure 4 shows the trend of mean of monthly returns from 1926 to 1945. The
mean of monthly returns increased from 1926 to 1929, decreased thereafter until
1933, and was within a narrow band after that until 1945. The returns were close
to zero in four of those years: 1938 to 1941. America entered the war in 1941 and

108
high financing needs could have caused returns to be higher but yields were kept
low to finance war needs.
Figure 4: Average of Monthly Returns: January 1926 to December
1945
Figure 5 shows that the monthly means of the twelve months from 1926 to 1945
shows some cyclicity with peaks in March, June, and October. There is also an
overall falling trend with the low in December.
Figure 5: T-bills Total Monthly Returns: January 1926 to December 1945
Second Sub-Period (1946-1972)
Jan Feb Mar Apr May Jun Jul Aug Sep Oct Nov Dec
Mean 0.094 0.096 0.102 0.092 0.087 0.101 0.085 0.080 0.079 0.093 0.086 0.068
T-Bills Monthly Returns, 1926-1945

109
This was an era of fixed-exchange rates and relative domestic progress and
prosperity. This was an era in which America helped Europe to rise up from the
ashes of the Second World War under the Marshall Plan and also helped Japan to
get back on its feet. (The Marshall Plan itself was worth over $120 billion in
today’s dollars.) Table 5 shows that compared to the previous sub-period, the
mean of T-bills monthly total returns more than doubled (0.228% vs. 0.088%) and
this was significantly greater than zero (p = 0.00). The means of all the individual
months were positive and significantly greater than zero. As implied by the blank
spaces in the second last row of Table 5, the returns of none of the months was
significantly different from the returns of the other eleven months stacked. As
implied by the blank spaces in the last row of Table 5, the standard deviations of
none of the months was significantly different from the standard deviation of the
returns of the other eleven months stacked.
Table 5: Month effects in T-bills Total Returns: 1946-1972
Figure 6 below shows means of monthly total returns for the second sub-period.
Contrasted to the trend for the first sub-period, we see an overall rising trend from
All Jan Feb Mar Apr May Jun Jul Aug Sep Oct Nov Dec
Count 324 27 27 27 27 27 27 27 27 27 27 27 27
Mean 0.228 0.242 0.213 0.223 0.213 0.224 0.223 0.227 0.221 0.236 0.249 0.221 0.242
Median 0.205 0.240 0.190 0.200 0.190 0.230 0.200 0.220 0.170 0.190 0.250 0.200 0.230
Minimum 0.030 0.030 0.030 0.030 0.030 0.030 0.030 0.030 0.030 0.030 0.030 0.030 0.030
Maximum 0.640 0.600 0.620 0.570 0.530 0.530 0.580 0.530 0.530 0.620 0.600 0.520 0.640
Range 0.610 0.570 0.590 0.540 0.500 0.500 0.550 0.500 0.500 0.590 0.570 0.490 0.610
Std Dev 0.142 0.147 0.142 0.141 0.134 0.136 0.145 0.147 0.146 0.149 0.147 0.144 0.144
Sample Var 0.000 0.000 0.000 0.000 0.000 0.000 0.000 0.000 0.000 0.000 0.000 0.000 0.000
p-value (m=0) 0.000 0.000 0.000 0.000 0.000 0.000 0.000 0.000 0.000 0.000 0.000 0.000 0.000
p-value (t test) 0.610 0.573 0.850 0.562 0.892 0.865 0.964 0.813 0.771 0.451 0.810 0.603
p-value (F test) 0.418 0.525 0.506 0.372 0.408 0.459 0.424 0.440 0.395 0.423 0.485 0.479
Mean % Change Pos Pos Pos Pos Pos Pos Pos Pos Pos Pos Pos Pos Pos

110
February to December. The cyclicity is less pronounced for this sub-period. The
mean returns were between 0.21% and 0.25% with no significant difference in the
returns.
Figure 6: T-bills Total Monthly Returns: January 1946 – December 1972
Third Sub-Period (1973-2011)
From a mean monthly change of 0.088% in the first sub-period and 0.228% in the
second sub-period, the mean return increased to 0.444% in the third sub-period as
can be seen in Table 6. It was significantly greater than zero. All months
experienced mean returns significantly greater than zero. As implied by the blank
spaces in the second last row of Table 6, the returns of none of the months was
significantly different from the returns of the other eleven months stacked. As
implied by the blank spaces in the last row of Table 6, the standard deviations of
none of the months was significantly different from the standard deviation of the
returns of the other eleven months stacked.
So we find no month effect in terms of either the mean return of a month being
significantly different from the mean of the other eleven months, or the volatility
of a month being significantly different from the volatility of the other eleven
months – either in the entire data period or in the data of any of the three sub-
periods.
Jan Feb Mar Apr May Jun Jul Aug Sep Oct Nov Dec
Mean 0.242 0.213 0.223 0.213 0.224 0.223 0.227 0.221 0.236 0.249 0.221 0.242
T-Bills Monthly Returns, 1946-72

111
Table 6: Month effects in T-bills Total Returns: 1973-2011
All Jan Feb Mar Apr May Jun Jul Aug Sep Oct Nov Dec
Count 468 39 39 39 39 39 39 39 39 39 39 39 36
Mean 0.444 0.429 0.408 0.451 0.467 0.452 0.435 0.453 0.451 0.453 0.457 0.426 0.489
Median 0.430 0.430 0.390 0.430 0.440 0.430 0.410 0.450 0.440 0.440 0.420 0.400 0.480
Minimum 0.000 0.000 0.000 0.010 0.000 0.000 0.000 0.000 0.010 0.000 0.000 0.000 0.000
Maximum 1.350 1.040 1.070 1.210 1.260 1.150 1.350 1.240 1.280 1.240 1.210 1.070 1.310
Range 1.350 1.040 1.070 1.200 1.260 1.150 1.350 1.240 1.270 1.240 1.210 1.070 1.310
Std Dev 0.267 0.242 0.249 0.281 0.295 0.275 0.267 0.271 0.261 0.264 0.284 0.265 0.261
Sample Variance 0.001 0.001 0.001 0.001 0.001 0.001 0.001 0.001 0.001 0.001 0.001 0.001 0.001
p-value (m=0) 0.000 0.000 0.000 0.000 0.000 0.000 0.000 0.000 0.000 0.000 0.000 0.000 0.000
p-value (t test) 0.677 0.389 0.834 0.573 0.805 0.879 0.794 0.822 0.789 0.726 0.710 0.295
p-value (F test) 0.213 0.271 0.371 0.226 0.453 0.504 0.501 0.423 0.457 0.339 0.471 0.447
Mean % Change Pos Pos Pos Pos Pos Pos Pos Pos Pos Pos Pos Pos Pos
Figure 7 below shows that the trend of the means of the monthly returns of this
sub-period is pretty similar to the trend we saw for the previous sub-period; we
see an overall rising trend. The returns have ranged from a low of 0.41% in
February to a high of 0.49% in December. The returns are depressed little bit
because of the low yields since 2007 – close to 0%.
Figure 7: T-bills Total Monthly Returns: January 1973 – December 2011
Jan Feb Mar Apr May Jun Jul Aug Sep Oct Nov Dec
Mean 0.43 0.41 0.45 0.47 0.45 0.44 0.45 0.45 0.45 0.46 0.43 0.49
T-Bills Monthly Returns, 1973-2011

112
Comparison of Three Sub Periods
Figure 8 shows the means of the various months for the three sub-periods. As we
saw for the entire data set, we see a similar pattern for each of the three sub-
periods.
Figure 8: Comparison of Three Sub-periods Contrasted With Entire Data
Set
An interesting trend is the increase in the mean of monthly returns for each of the
three successive sub-periods (0.09%, 0.23%, 0.44%) and corresponding increase
in the medians (0.03%, 0.21%, 0.43%) and an increase in the standard deviations
of the monthly changes (0.13%, 0.14%, 0.27%).
The means of the three sub-periods are significantly different: the means of the
second and third sub-periods are significantly higher than the mean of the first
sub-period, and the mean of the second sub-period is significantly higher than the
mean of the first sub-period – all for p values of 0.00.
1926-1945
1946-1972
1973-2011
ALL

113
Nonparametric Kruskal-Wallis test result (not reported for brevity) shows
significant difference in the medians of the returns of the three sub-periods (H
statistic = 386.53; p value=0.00). Mood’s Median test also shows significant
difference in the medians of the monthly returns (Chi-Square statistic= 263.59; p
value=0.00).
While the means and medians increased, the standard deviations also increased
significantly based on F-test. The standard deviation of the second sub-period is
significantly higher than that of the first sub-period for a p-value of 0.04. The
standard deviation of the third sub-period is significantly higher than that of the
first for a p-value of 0.00. The standard deviation of the third sub-period is
significantly higher than that of the second sub-period for a p-value of 0.00. The
stable period during Breton Woods fixed exchange rate system did not lower the
standard deviation of the second sub-period possibly as a result of the effects of
the Korean War and the Vietnam War. The even higher standard deviation during
the third sub-period (0.27%) is attributable to the volatile world after the break-up
of the Breton Woods system and the effects of globalization and technological
innovations causing wide-spread dissemination of news and the need for market
participants to react faster to such news.
Month Effect: Republican and Democratic Presidential Periods
Given the important impact presidencies have on the economy, we explored the
three types of month-effects in T-bills total monthly returns during the Republican
and Democratic presidencies.

114
Republican Presidencies
Table 7 shows the statistical output for T-bills total monthly returns during
Republican presidencies over the entire period. The mean of T-bills total monthly
returns (0.372%) over the 518 Republican months was significantly greater than
zero. The median of T-bills total monthly returns during Republican periods was
0.335%. The means of T-bills total monthly returns for all the individual months
were significantly greater than zero. We do not see a month effect in terms of
mean: the mean return of none of the months was significantly different from the
mean returns of the other eleven months stacked. The mean of monthly returns for
the twelve months were within 0.34% and 0.39%. However, we see a month
effect in terms of variance: the standard deviation of the returns of December was
significantly lower than that of the other eleven months stacked. We would not
expect to see such an anomaly in a highly efficient market; the volatility of no
month should be significantly different from that of the other eleven months.
Table 7: Month effects in T-bills Total Return: Republican presidencies
All Jan Feb Mar Apr May Jun Jul Aug Sep Oct Nov Dec
Count 518 44 44 43 43 43 43 43 43 43 43 43 43
Mean 0.372 0.341 0.351 0.381 0.385 0.382 0.383 0.389 0.379 0.382 0.389 0.350 0.354
Median 0.335 0.310 0.330 0.350 0.340 0.320 0.350 0.320 0.320 0.320 0.370 0.350 0.340
Minimum -0.030 0.000 -0.030 0.080 0.080 0.010 0.020 0.030 0.030 0.030 0.020 0.020 0.000
Maximum 1.350 0.800 1.070 1.210 1.130 1.150 1.350 1.240 1.280 1.240 1.210 1.070 0.870
Range 1.380 0.800 1.100 1.130 1.050 1.140 1.330 1.210 1.250 1.210 1.190 1.050 0.870
Std Dev 0.246 0.204 0.232 0.241 0.261 0.264 0.262 0.272 0.265 0.255 0.258 0.226 0.225
Sample Var 0.001 0.000 0.001 0.001 0.001 0.001 0.001 0.001 0.001 0.001 0.001 0.001 0.001
p-value (m=0) 0.000 0.000 0.000 0.000 0.000 0.000 0.000 0.000 0.000 0.000 0.000 0.000 0.000
p-value (t test) 0.304 0.532 0.798 0.737 0.804 0.784 0.668 0.852 0.793 0.648 0.510 0.318
p-value (F test) 0.052 0.313 0.449 0.307 0.278 0.294 0.192 0.260 0.391 0.349 0.237 0.000
Mean % Change Pos Pos Pos Pos Pos Pos Pos Pos Pos Pos Pos Pos Pos

115
Figure 9 shows that the mean returns of March through October ranged within a
narrow range of 0.38% to 0.39%. The returns of the first two and last two months
ranged within a narrow band of 0.341% and 0.354%. The figure resembles a
plateau between March and October.
Figure 9: T-bills Total Monthly Returns: 1926-2011: Republican Presidencies
Democratic Presidencies
Table 8 shows the statistical output for T-bills total monthly returns during
Democratic presidencies over 1926-2011. The mean of T-bills total monthly
returns (0.215%) over the 514 Democratic months is significantly greater than
zero. The overall median of T-bills total monthly returns during Democratic
presidencies was 0.120% compared to 0.335% during Republican presidencies.
The returns of all the months were significantly greater than zero. Ten of the 12
months during democratic presidencies experienced returns significantly greater
than zero. We do not see a month effect in terms of mean: as in the case of
Republican presidencies. The mean return of none of the months was significantly
different from the mean returns of the other eleven months stacked. The mean of
monthly returns for the twelve months were within 0.19% and 0.24%. As in the
case of the Republican presidencies, we see a month effect in terms of variance,
but of the opposite type: the standard deviation of the returns of December was
significantly higher than that of the other eleven months. We would not expect to
Jan Feb Mar Apr May Jun Jul Aug Sep Oct Nov Dec
Mean 0.341 0.351 0.381 0.385 0.382 0.383 0.389 0.379 0.382 0.389 0.350 0.354
T-Bills Monthly Returns: Republican presidencies

116
see such an anomaly in a highly efficient market; no month should exhibit
volatility significantly different from that of the other eleven months.
Table 8: Month effects in T-bills Total Returns: Democratic presidencies
All Jan Feb Mar Apr May Jun Jul Aug Sep Oct Nov Dec
Count 514 42 42 43 43 43 43 43 43 43 43 43 43
Mean 0.215 0.241 0.194 0.215 0.216 0.210 0.200 0.203 0.206 0.213 0.224 0.216 0.239
Median 0.120 0.155 0.110 0.110 0.120 0.120 0.120 0.130 0.130 0.120 0.140 0.110 0.120
Minimum -0.06 -0.01 -0.01 -0.01 -0.01 -0.02 0.000 -0.01 -0.01 0.000 0.000 -0.06 0.000
Maximum 1.310 1.040 0.890 1.210 1.260 0.820 0.810 0.770 0.770 0.830 0.950 0.990 1.310
Range 1.370 1.050 0.900 1.220 1.270 0.840 0.810 0.780 0.780 0.830 0.950 1.050 1.310
Std Dev 0.234 0.255 0.211 0.251 0.254 0.223 0.204 0.204 0.210 0.224 0.245 0.253 0.286
Sample Var 0.001 0.001 0.000 0.001 0.001 0.000 0.000 0.000 0.000 0.000 0.001 0.001 0.001
p-value (m=0) 0.000 0.000 0.000 0.000 0.000 0.000 0.000 0.000 0.000 0.000 0.000 0.000 0.000
p-value (t test) 0.482 0.540 0.965 0.954 0.905 0.647 0.731 0.806 0.999 0.765 0.949 0.540
p-value (F test) 0.239 0.186 0.272 0.242 0.340 0.120 0.116 0.178 0.354 0.353 0.258 0.038
Mean % Change Pos Pos Pos Pos Pos Pos Pos Pos Pos Pos Pos Pos Pos
Figure 10 shows a slightly upward rising trend in the means of monthly returns
for the twelve months.
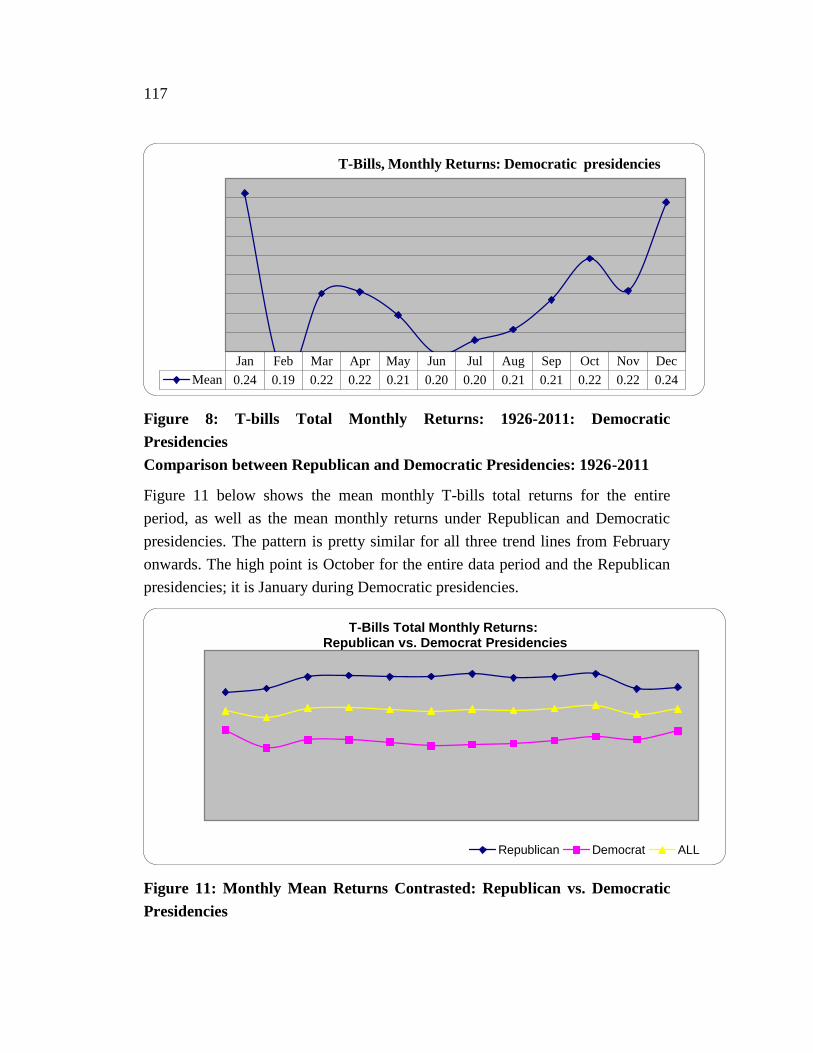
117
Figure 8: T-bills Total Monthly Returns: 1926-2011: Democratic
Presidencies
Comparison between Republican and Democratic Presidencies: 1926-2011
Figure 11 below shows the mean monthly T-bills total returns for the entire
period, as well as the mean monthly returns under Republican and Democratic
presidencies. The pattern is pretty similar for all three trend lines from February
onwards. The high point is October for the entire data period and the Republican
presidencies; it is January during Democratic presidencies.
Figure 11: Monthly Mean Returns Contrasted: Republican vs. Democratic
Presidencies
Jan Feb Mar Apr May Jun Jul Aug Sep Oct Nov Dec
Mean 0.24 0.19 0.22 0.22 0.21 0.20 0.20 0.21 0.21 0.22 0.22 0.24
T-Bills, Monthly Returns: Democratic presidencies
T-Bills Total Monthly Returns: Republican vs. Democrat Presidencies
Republican Democrat ALL

118
Two-sample t-test assuming equal variances shows a significant difference (p
value=0.00) between the mean monthly returns during Republican presidencies
(0.372%) and Democratic presidencies (0.215%). However, F-test (p value=0.27)
shows no significant difference in the standard deviations of monthly returns
during Republican presidencies (0.246%) and during Democratic presidencies
(0.234%).
Nonparametric Kruskal-Wallis test result (not reported for brevity) shows
significant difference in the medians of the returns during Republican and
Democratic presidencies (H statistic = 133.45; p value=0.00. Two-sample rank
test (called the Mann-Whitney test) of the equality of two population medians also
shows significant difference in the medians of the returns under the two types of
presidencies (W statistic = 322853.0; p value=0.00).
It would be interesting to see if borrowing during the Republican presidencies was
significantly higher than during Democratic presidencies to warrant the higher
average returns achieved by investors during Republican presidencies. However,
we have to note that such results are not just the action of the presidents in power
but also caused by actions of the Congress and the Federal Reserve System. It will
be very hard, if not impossible, to isolate the relative impact of the actions of the
three parties.
If war periods cause higher prices, Democrats have had more than their share of
war presidents: Woodrow Wilson was the war president during First World War,
Franklin Delano Roosevelt during Second World War, Harry Truman during
Korean War, and Kennedy and Johnson presided over the major part of the
Vietnam War. The Depression Years, which depressed prices greatly, were
presided over by Republican President Herbert Hoover. These factors could well
have accounted for the lower monthly returns during Democratic presidencies.
Mean Returns during Expansions and Recessions
The mean monthly returns for the 832 months that saw economic expansion was
0.2920%. The mean monthly returns for the 216 months that saw economic
recession was 0.2912%. There is no significant difference between the two means
(p value=0.97). The standard deviations of the monthly returns in the two periods
are respectively 0.2386% and 0.2965% -- and the difference is significant based
on F-test for a p-value of 0.00. Recessions bring greater uncertainty and hence we

119
would expect to see greater variance of returns in such periods. But we do not see
a significant difference in the means of the two economic conditions.
Mean Returns during Crises
The mean of T-bills monthly total returns during the various crisis years were as
follows:
Great Depression (October 1929 to November 1933): 0.1182%
World War II (January 1, 1939 to August 15, 1945): 0.0151%
World War II (December 7 to August 15, 1945)13
: 0.0264%
Korean War (June 27, 1950 to July 27, 1953): 0.1324%
Vietnam War (August 1964 to January 1973)14
: 0.3961%
Vietnam War (August 1964 to April 30, 1975)15
: 0.4362%
Part of the Vietnam War period was Republican President Nixon’s presidency
(January 1969 to August 1974) and then it was Republican President Ford
(August 1974 to January 1977). The Vietnam War cost $118 billion, and started
the inflationary cycle that tarnished the Carter presidency (February 1977 to
January 1981). The mean of monthly returns during this period was 0.694% -- or
8.32% annualized – much higher than for the entire data period (3.53%). The
foregoing mean returns are all lower than the mean return for the entire data
period (0.294%) except for the mean return during Vietnam War.
Summary and Conclusion
This paper explores the behavior of the U.S. T-bills total monthly returns over the
period January 1926 to December 2011. We looked at seasonality via the month
effect in T-bills total monthly returns. We looked at three types of month effects:
if the means of monthly T-bills total monthly returns of the entire data set and of
13
This period takes into account the formal declaration of war against Japan after the bombing of
Pearl Harbor by the Japanese on December 7, 1941. 14
The start of the Vietnam War is assumed as August 1964 when President Johnson got
Congressional authorization for use of force for going into combat operations. Prior to that, the
U.S. had mainly training and support role with the South Vietnamese Armed Forces. The war
formally ended on April 30, 1975, but in this scenario, the end of U.S. active involvement is taken
as the Paris accord of January 1973. 15
This scenario takes into account the final fall of the South Vietnamese regime.

120
each of the twelve months were significantly different from zero; if the mean of
total monthly returns for each month was different from the means of the other
months stacked; if the variance of the total monthly returns for each month was
different from the variance of the other eleven months stacked.
The means of T-bills total monthly returns for the entire data set as well as for
each month were significantly greater than zero (p = 0.00). We find that there is
some semblance of symmetrical distribution in the monthly returns with July as
the mid-point. The means of monthly returns as well as the standard deviations of
the returns of none of the months were significantly different from that of the
other eleven months.
We sliced the data into three sub-periods to gain greater insight on monthly
seasonality. We find significant increase in the means and medians of monthly
returns for each of the three successive sub-periods and also an increase in the
standard deviations of the monthly returns for the successive sub-periods – which
was not significant. The mean of monthly returns for each sub-period and for each
month in each sub-period were significantly greater than zero. As in the case of
the entire data period, the means of monthly returns as well as the standard
deviations of the returns of none of the months in any of the sub-periods were
significantly different from that of the other eleven months. The absence of
seasonality in monthly returns for the entire data period as well as for the three
sub-periods is a testament to the efficiency of the T-bill market to a high degree.
The mean of T-bills total monthly returns for the 518 months of Republican
presidencies (0.372%) was significantly higher than the mean of the 514 months
of Democratic presidencies (0.214%) and so were the medians. There was no
significant difference in the variances of returns of the two presidencies.
However, the variance of the returns of December during Republican presidencies
was significantly lower compared to the other eleven months; the variance of
December was higher compared to the other eleven months during Democratic
presidencies.

121
REFERENCES
Chen, Carl R. and Anthony Chan (1997). From T-Bills to Stocks: Seasonal
Anomalies Revisited, Journal of Business, Finance and Accounting, 24(5),
June, pp. 573-592.
Chien, Chin-Chen, Cheng-few Lee and Andrew M. L. Wang (2002). A note on
stock market seasonality: The impact of stock price volatility on the
application of dummy variable regression model, The Quarterly Review of
Economics and Finance, 42, pp. 155-62.
Eiseman, P.C. and S.G. Timme (1984). Intraweek Seasonality in the Federal
Funds Market, Journal of Financial Research, Volume 7, No. 1 (Spring), pp.
47-56.
Ferri, Michael G., and Steven J. Goldstein and Dennis H. Oberhelman, (1984). A
Second Look at Day-Of-The-Week Effects in Treasury Bill Returns,
Quarterly Journal of Business & Economics, Volume 23, Issue 4, pp. 46-56.
Flannery, Mark J. and Aris A. Protopapadakis (1988). From T-Bills to Common
Stocks: Investigating the Generality of of Intra-Week Return Seasonality,
Journal of Finance, Vol. XLIII, No. 2, (June), pp. 431-450.
Gibbons, M.R. and Hess, P. (1981). Day of the Week Effects and Asset Returns,
Journal of Business, October, Volume 54, pp. 579-596.
Park, Sang Yong and Marc Reinganum (1986). The Puzzling Behavior of
Treasury Bills That Mature At The Turn of Calendar Months, Journal of
Financial Economics, Vol. 16(2), pp. 267-283.

122
Product Placement In Movies As A Tool Of Transnational Advertising:
Comparative Analysis Between French And American Movies
Kareem El Damanhoury
Ohio University,USA
1. Introduction
Globalization has been escalating over time to become an inevitable reality
throughout the world nowadays; and according to Barber (2012), the world is
becoming one big transnational market in which multinational corporations are
expanding (p. 29). However, that expansion requires careful attention to different
cultural contexts "globalization", thus movies present an adequate vehicle for
transnational advertising. Multinational corporations have seized the opportunity
to place their products within movies. Expenses on product placements in US
media, according to Lehu (2007), have risen from "US$190 million in 1974, to
US$512 million in 1985, and US$1.30 billion in 1994 to reach US$3.458 billion
in 2004" (p. 34) which highlights the increasing global consumer capitalism.
Product Placement in movies, the appearance of a product or brand within a
movie scene, generates high global reach and breaks through traditional set
campaign-periods. It also guarantees exposure due to its implicit nature that
makes it unavoidable unlike traditional TV advertising. Moreover, a successful
product placement does not necessarily imply a homogenous trend across
cultures; for example, Kureshi & Sood (2011) reveal that in 2007-2009,
Romance/Drama movies involved the highest number of product placements in
Bollywood while Comedies involved the highest number in Hollywood (p. 250).
Therefore, product placement specialists seem aware of cultural barriers hindering
placement effectiveness, so they use it differently to fit cultural contexts.
This research paper aims at comparing trends of product placement as a means of
transnational advertising within French and American movies through analyzing a
sample of movies produced in France and the United States. Content analysis is
used to explore variables such as product category, average placement per minute,

123
and type of placement. Research findings indicate that clothing brands were the
most frequently placed products in the French movie compared to beverage
products in the American one. This implies that patterns of product placement
differ according to variables within different cultural contexts, thus global
strategies are employed to fit each context.
2. Literature Review
Globalization and Cinema
In a globalized interconnected world, global consumerism prevails as a result of
multinational corporations expanding in transnational markets. However,
according to Lechner (2012), this expansion faces cultural barriers in local
markets as globalization does not necessarily result in a homogenous effect across
cultures (p. 107). Therefore, globalization becomes an effective strategy for
global expansion. Thompson (2004) describes globalization as the process in
which "local cultures and the forces of globalization are thoroughly
interpenetrated and co-shaping" (p. 632). Multinational corporations have been
aware of such notion in their global expansions. For example, Watson (2000)
states that Macdonald's has the same taste everywhere, yet it localizes itself within
cultural contexts by developing "spicy wings (red-pepper-laced chicken) in
Beijing, kosher Big Macs (minus the cheese) in Jerusalem, vegetable McNuggets
in New Delhi, or a McHuevo (a burger with fried egg) in Montevideo" (p. 122).
In addition, Thompson (2004) asserts that "global brands do exert a systematic
influence on the cultural hetero-hybridization engendered by globalization" (p.
638).
The media has been widely used as an effective vehicle that generates global
reach as well as culture promotion. For example, Korean pop culture wouldn't
have risen in Asia if not for its media uprising in the 1990s in terms of movies,
music, and TV programs/series. A movie, according to Walter Benjamin (1935),
is considered a strong force that causes a "liquidation of the traditional value of
the cultural heritage" (p. 4), thus it reflects culture. According to Doobo Shim
(2012), not only have Korean movies become a notion across Asian cinemas, but
also big Hollywood corporations such as "Fox and Columbia have started to take
Korean movies on for their global distribution runs" (p. 359). Moreover, Kureshi
and Sood (2011) state that Hollywood movies have a "worldwide audience of 2.6
billion" (p. 245); and so they provide an unprecedented economic opportunity for

124
multinational corporations seeking expansion. As a result, multinational
corporations started using product placement in movies since the end of the 18th
century.
2.1. Product Placement and its Techniques
According to Hackley, Tiwsakul, and Preuss (2008), product placement is a tool
of advertising "in which the message, the sender and the precise intention behind
a brand seen in a television (TV) show, movie or computer game are often
implicit" (p. 109). Wilson handball in "Cast Away", Mini Cooper in "Italian Job",
Facebook in "Social Network" are just few examples of product placement in
movies. It has been used since the end of the 18th
century as a form of embedding
consumer capitalism within entertainment. Jay Newell's research, as cited by
Lehu (2007), concludes that the first incident of product placement was in 1896 in
a French movie (p. 19). However, product placement had gained much more
importance by the end of the 19th
century after the emergence of technological
advancements such as DVRs and TiVo besides the internet that have enabled the
viewers to avoid cluttered TV advertising.
Product placement in movies has offered corporations a global reach as well as an
implicit presence within movie scenes that makes it unavoidable. Unlike TV
advertising, product placement breaks through traditional set campaign-periods,
and thus remains in movies forever. Product placement, as a tool of transnational
advertising, has been expanding throughout the world; for example, product
placement expenses in Indian movies in 2007, according to Burman as cited by
Kureshi, and Sood (2011), "were valued to be around Rs 2 billion" (p. 245).
Furthermore, Wiles and Danielova (2009), using an event study analysis,
concluded that product placements in the sampled movies were accompanied by
an "average 89%" increase in firms' stock prices during the movie launching (p.
57).
Product placement could be executed in different ways: verbal, visual, or
audiovisual. According to Kureshi and Sood (2011), a verbal placement is "when
any of the actors in the film, main or otherwise, mentioned the brand name"
whereas a visual placement is when the product or brand appears in the scene
whether in the background or as the main item in the camera shot (p. 250). The
audiovisual placement combines both aspects within a movie scene, and so the
product appears and its name is also mentioned. However, these executions could

125
be of different levels: blatant or subtle. According to Gupta and Lord (1998), a
blatant placement is "made highly visible by virtue of size and/or position on the
screen or its centrality to the action in the scene" whereas a subtle placement
could be "small in size, a background prop outside of the main field of visual
focus, lost in an array of multiple products or objects, low time of exposure" (p.
49). The use of different types and levels of placement signifies the cultural
influence that would make a type of placement more effective in one cultural
context without the other.
3. Method
3.1. Data Collection
Investigating the different trends of product placements in French and American
movies in 2011-2012, I have administered a preliminary content analysis form to
measure certain variables within the sampled movies. According to Wimmer R.
and Dominick J. (2011), Kerlinger defines content analysis as "a method of
studying and analyzing communication in a systematic, objective, and
quantitative manner for the purpose of measuring variables" (p. 156). The
variables in this study are: frequency of placements (total and average numbers of
placements per minute), number of placements of each product, type of placement
(verbal, visual, or audiovisual), level of placement (subtle or blatant), nature of
the product (consumer product, B2B, or service), nature of the company (local or
international), and accreditation of products in final credits. As a quantitative data
collection tool, Wimmer and Dominick (2011) state that content analysis is often
used as a description of communication messages (p. 157-158), which are simply
the product placements within the sampled movies in this paper.
This paper employs a non probability purposive sample which is "used frequently
in mass media studies…with the knowledge that it is not representative of the
general population" (Wimmer & Dominick, 2011, 94). The sample consists of 2
comedies produced in 2011-2012 that were chosen on basis of similarity in
respect of duration, worldwide screening, and total gross. The Intouchables,
directed by Olivier Nakache and Eric Toledano, is a French-speaking movie
produced in France in 2011; on the other hand, Seth MacFarlane's Ted is an
English-speaking movie produced in the United States in 2012. According to US
Box Office website, The Intouchables has generated a "worldwide gross of

126
$426,606,534" out of which "$13,185,153 domestic gross" whereas Ted has
generated a "worldwide gross of $549,218,568" out of which "$218,665,740
domestic gross" (US Box Office website).
3.2. Findings
There were 24 incidents of product placement within The Intouchables, with an
average of one placement every 4:42min. The products most frequently placed
were consumer products ranging from cars, food, beverages, clothing, cigarettes
and technology to jewelry. Highest number of placements (25%) was for clothing
brands: Umbro, Adidas, Nike, Kangol, Scholt NYC, and IKKS. The most
frequently placed brand throughout the movie was Maserati Quattroporte car.
The only service placed was that of a French transportation company Express.
Moreover, 20 out of the 24 placed products were of multinational companies
(approximately 83%). Only 3 placements, Coca Cola, Nutella, and M&Ms, were
executed audio-visually (12.5%) while all others were visual placements. As for
the level of placements, approximately 75% were subtle. Although there were no
brand accreditations in the end credits, some of the placed brands, Maserati,
Mercedes Benz, Renault, Blackberry, and Mars Chocolate, were mentioned in the
acknowledgments.
On the other hand, there were 36 incidents of product placement within Ted with
an average of one placement every 2:56min. The products most frequently placed
were consumer products. Highest number of placements (approximately 22%)
was for beverage brands: Budweiser, Crystal Champagne, Bud Light, DonQ,
Pepsi, Jameson, Michelob Ultra Orange Grape Fruit, and Coca Cola. The most
frequently placed brand throughout the movie was Budweiser. Out of the 36
placed products, 28 were of multinational companies (approximately 78%). The
local brands placed within the movie were local restaurants as well as a grocery
store, a PR firm, and a car rental. In addition, out of the 27 placements, 75% were
visually executed whereas the remaining placements involved four verbal and five
audiovisual. As for the level of placements, nearly 63% were blatant. In addition,
no brand accreditation existed in the end credits.

127
4. Discussion
The main aim of this research was to compare different trends of product
placement within French and American movies. Findings have clearly indicated
that product placement, as a means of transnational advertising, is used differently
across the small sample of French and American movies. This implies the use of
globalization as a strategy to localize product placements according to the cultural
context. However, research findings cannot be generalized to all French and
American movies due to sample limitations.
Research findings indicate the difference in placement types and levels between
The Intouchables and Ted. Approximately 63% of products in Ted were blatantly
placed whereas approximately 75% of products in The Intouchables were subtly
placed. This might imply that American viewers seem to tolerate blatant
placements in movies way more than French viewers; thus, blatant placements are
dominant in the American movie and subtle ones are dominant in the French
movie. Furthermore, findings indicate that one placement would appear every
2:56 min in Ted and every 4:42 min in The Intouchables which might indicate a
higher level of tolerance among American viewers towards frequent product
placements in movies.
Although, consumer products were the highly placed ones in both movies, the
most frequently placed category differed between the two movies. Beverage
products constituted approximately 22% of the placements in Ted whereas
clothing brands were the most frequently placed ones in The Intouchables (25%).
Budweiser was the dominant brand in Ted while Maserati was the most dominant
in The Intouchables. Therefore, the dominance of alcoholic beverages in Ted
seems to convey a part of the American culture. On the other hand, it seems that
luxurious cars are significant in France. As for the types of placement, visual
placements were dominant in both movies, but there were incidents of audiovisual
placements too. However, verbal placements were only existent in Ted, and all
four brands, PS3, Hasbro, Snickers, and Ikea, were mentioned in a humorous
context. This might imply that American viewers seem to be used to product
placement that they do not always have to see the product or brand.
In conclusion, there are different trends of product placement within the sample of
American and French movies. These differences add to the notion that product
placement specialists do employ global strategies tailored to the cultural context

128
to ensure its effectiveness. However, further studies are needed that would
examine the trends of product placement on a wider sample and among other
cultures as well.
Bibliography
Barber, B. (2002, January 21). Beyond Jihad Vs. McWorld. The Nation.
Retrieved from http://archives.evergreen.edu/webpages/curricular/2001-
2002/stress/Jihad%20vs%20McWorld%20-%20Barber.pdf
Barber, B. (2012). Jihad Vs. McWorld. In F. J. Lechner and J. Boli (Eds.), The
Globalization Reader fourth edition (pp. 28-36). Malden, MA: Blackwell.
Gupta, P., & Lord, K. (1998). Product Placement in Movies: The Effect of
Prominence and Mode on Audience Recall. Journal of Current Issues and
Research in Advertising, 20 (1), 47-59. doi: 10.1080/10641734.1998.10505076
Hackley, C., Tiwsakul, A. and Preuss, L. (2008) An Ethical Evaluation of Product
Placement-A Deceptive Practice? Journal of Business Ethics: A European
Review, 17 (2), 109-120. doi: 10.1111/j.1467-8608.2008.00525.x
Kureshi, S., & Sood, V. (2011). In Film Placement Trends: A Comparative Study
of Bollywood and Hollywood. Journal of Indian Business Research, 3 (4), 244-
262. doi: 10.1108/17554191111180591
La Ferle, C., & Edwards, S. (2006). Product Placement: How Brands Appear on
Television. Journal of Advertising, 35 (4), 65-86. doi: 10.2753/JOA0091-
3367350405
Lechner, F. (2012). The Globalization Reader fourth edition. Malden, MA:
Blackwell.
Lehu, J. (2007). Branded Entertainment: Product Placement & Branded
Entertainment Strategy in the Entertainment Business. London and Philadelphia:
Kogan Page. Retrieved from
http://ehis.ebscohost.com/eds/ebookviewer/ebook/nlebk_191414_AN?sid=e0026
32d-378f-4a42-a35b-e7a88958517a@sessionmgr4&vid=1&format=EB
Lipman, J. (1989, April 7). Outcry over Product Placement Worries Movie Ad
Executives. Wall Street Journal.

129
Shim, D. (2012) Hybridity and the Rise of Korean Pop Culture in Asia. In F. J.
Lechner and J. Boli (Eds.), The Globalization Reader fourth edition (pp. 358-
363). Malden, MA: Blackwell.
Thompson, C. (2004). The Starbucks Brandscape and Consumers’
(Anticorporate) Experiences of Globalization. Journal of Consumer Research,
31(3), 631-642. doi: 10.1086/425098
Tomlinson, J. (2012) Cultural Imperialism. In F. J. Lechner and J. Boli (Eds.),
The Globalization Reader fourth edition (pp. 343-351). Malden, MA: Blackwell.
US Box Office website - Intouchables page: Retrieved from
http://www.boxoffice.com/statistics/movies/intouchables-2012?q=intouchables
US Box Office website - Ted page: Retrieved from
http://www.boxoffice.com/statistics/movies/ted-2012?q=ted
Walter Benjamin. (1935) The Work of Art in the Age of Mechanical Reproduction,
10. Retrieved from
http://design.wishiewashie.com/HT5/WalterBenjaminTheWorkofArt.pdf
Watson, J. (2000). China's Big Mac Attack. Journal of Foreign Affairs, 79(3),
120-134. Retrieved from
http://www.jstor.org/discover/10.2307/20049734?uid=3739192&uid=2134&uid=
373125501&uid=2&uid=70&uid=3&uid=373125491&uid=60&sid=2110248889
9131
Wiles, M., & Danielova, A. (2009). The Worth of Product Placement in
Successful Films: An Event Study Analysis. Journal of Marketing, 73 (4), 44-63.
doi: http://dx.doi.org/10.1509/jmkg.73.4.44
Wimmer, R., & Dominick, J. (2011). Mass Media Research: An Introduction,
Ninth Edition. Boston, MA: Wadsworth Cengage Learning.


131
Section 2 - Abstracts


133
Empowering Migratory Populations through Local Ethnic Media
Haco Hoang
California Lutheran University, USA
Abstract
Globalization has contributed to two phenomena: 1) a revolution in
communication due to advances in technology, and 2) the demand for cheap
laborers who migrate across borders due to the needs of economic sectors in other
countries. The civil and political rights of migratory workers are often non-
existent because they face numerous barriers to social and political activism
including limited literacy, socioeconomic constraints, and fears about immigration
status. Migratory farm worker populations, for example, often lack social and
political empowerment even though they frequently live and work in communities
plagued by environmental problems. How can the forces of global
communication be harnessed to empower this global yet marginalized
workforce? The purpose of this paper is to assess the civic capacity of farm
workers in Oxnard, California by assessing: 1) the civic needs of the population,
2) the programming content of two Spanish radio stations; and 3) the concrete
ways that the population can be empowered to promote environmental
health. Oxnard is a city with a large agricultural sector and significant farm
worker population, many who emigrate from Mexico into California for seasonal
work. The civic needs of Oxnard farm workers were identified through
qualitative surveys to gauge public perceptions regarding environmental risks and
civic engagement opportunities. Content analyses of two popular Spanish radio
stations in Oxnard were conducted to determine if local ethnic media outlets could
be utilized to enhance the civic capacity of farm worker communities. The study
found that Spanish radio is a medium that may mitigate, if not eliminate, some
key barriers to public engagement on environmental issues for Oxnard farm
workers: low levels of education and literacy, lack of financial resources,
transportation, work flexibility, fear of employer reprisals, and concerns about
immigration status. Radio is an accessible and low-cost, low-risk way for farm
workers to learn about environmental health issues and to express concerns about
exposure and risk.

134
The Surprising Effects of the Great Recession: Losers and Winners
in Thailand in 2008-2009
Jonathan Haughton
Shahidur Khandker
Suffolk University<USA
Abstract
In 2009, buffeted by the great recession, Thai GDP fell by 2.3%. Monthly survey
data show, after controlling for household variables, real consumption per capita
rose in 2009 relative to 2008 for most groups, including the poor, and urban and
rural households. Losers included some residents of Bangkok, especially those
aged 20-29. But school enrollment rates did not fall, and durables purchases rose;
households reduced their savings, and also benefitted from lower food prices. A
simulation exercise based on the drop in GDP would have missed these
effects. Hence the importance of country-specific policy analysis, rooted in
timely local evidence.
Firm Investment Decisions in the Post-Conflict Context
Colin W O'Reilly
Suffolk University
Abstract
Economic and political transition can occur through peaceful or violent means.
Violent transition disrupts the incentive for firms to make productive investments.
This paper studies the determinants of profit reinvestment for firms in post-
conflict transition economies. Results indicate that while access to finance is an
important determinant of reinvestment during transition, it is not as important in
the post-conflict context. However, property rights protections, in particular
institutions of contract enforcement, are a more important determinant of profit
reinvestment for firms operating in the post-conflict environment than for firms in
general. This indicates that obstacles to investment are context specific.

135
Can Information Ever Be Truly Universal?
Re-evaluating the Dynamic between Knowledge and Globalization
Tom Vine
School of Business, Leadership and Enterprise
University Campus Suffolk, UK
Abstract
The proposed presentation revisits the epistemological dynamic between
knowledge and globalization. In the launch edition of the Journal of Knowledge
Globalization, Rahman & Mahmod (2008: 2) suggest that ‘knowledge
globalization is an eclectic process of knowledge sharing’. This paper endeavours
to deconstruct this process and in so doing reasons that knowledge sharing is
revealed to be subject to at least two tensions. First, the predisposition for
humans to seek out novelty is behavior which is - if taken to its logical conclusion
- at odds with the process of knowledge sharing. This is a persuasive argument,
particularly if we accept the postmodernist position that knowledge is both
socially constructed and inextricably bound up with identity. Second, this paper
explores the tension between knowledge sharing on a global stage and the
asymmetries of information/expertise on which the foundations of exchange
apparently rest. Finally, potential means of resolving these tensions are explored
in a bid to further refine organizational and strategic thinking.
Reference:
Rahman R & Mahmud N (2008) ‘Towards Developing a Theory of Knowledge
Globalization’, Journal of Knowledge Globalization, 1(1): 2-8

136
Take My Mother-in-law…Please!” A Study of the Impact of
Women’s Power on the Co-residence Decision in China
Chloe Zhang
Suffolk University, USA
Abstract
This paper investigates the effect of the wife’s bargaining power on the decision
about intergenerational co-residence (i.e. whether she lives with the husband’s
mother or not). By applying a household bargaining model and using the China
Health and Nutrition Survey (CHNS) data from 2000, this paper finds evidence in
favor of women’s empowerment: the increase in women’s bargaining power, in
particular their human capital relative to their husbands, significantly reduces the
probability of living with their mothers-in-law, whereas, income power has mixed
results. Women’s stronger bargaining power contributes to the Chinese family
transition and social revolution.
Retractions in Biomedical Research
Jeff Furman
Boston University, USA
Pierre Azoulay
Joshua Krieger
Fiona Murray
MIT, USA
Abstract
To what extent does “false science" impact the rate and direction of scientific
change? We examine the impact of more than 1,100 scientific retractions on the
citation trajectories of articles that are close neighbors of retracted articles in

137
intellectual space but were published prior to the retraction event. Our results
indicate that following retraction and relative to carefully selected controls,
related articles experience a lasting five to ten percent decline in the rate at which
they are cited. We probe the mechanisms that might underlie these negatives pill
overs over intellectual space. One view holds that adjacent fields atrophy post-
retraction because the shoulders they offer to follow-on researchers have been
proven to be shaky or absent. An alternative view holds that scientists avoid the
“infected" fields lest their own status suffers through mere association. Two
pieces of evidence are consistent with the latter view. First, for-profit citers are
much less responsive to the retraction event than are academic citers. Second, the
penalty suffered by related articles is much more severe when the associated
retracted article includes fraud or misconduct, relative to cases where the
retraction occurred because of honest mistakes.
Big Data in Higher Education the University of Otago Experience
Ben Daniel
Russell Butson
University of Otago, New Zealand
Abstract
Big Data—a collection of large and complex data sets, often challenging to
process using traditional database management tools, brings new opportunities for
institutions of higher education, as institutions continue to face unprecedented
challenges in their environment. This paper outlines a number of factors currently
triggering changes in the environments of higher education, and challenges
associated with these changes. The paper further illustrates how Big Data can be
leveraged to address some of these challenges. Experiences from University of
Otago Technology Enhanced Analytics (UO-TEA) system are presented,
challenges associated with project implementations are discussed.

138
Big Data and New Product Innovation
Sushil Bhatia
Suffolk University
Abstract
Innovation and new product development is a risky and tough business as most of
the new products fail. There are many reasons for that. To name a few -
undercapitalization, poor market research, not getting customers involved at the
right time and not reaching the market on time. The lack of access to information
or the lack of right information is some of the reasons. Due to this it is difficult to
conduct business analytics to create the right course of action.
BIG DATA can change all that by providing information and improving these
areas.
1. Market: Reducing Time to market by 25-30 %. Access to the right
information, feedback from the customers at the right time can reduce time to
market by 25-30% as it has been shown in healthcare industry.
2. Manufacturing: improved decision-making by helping to focus on the product
features that matter resulting in reduced manufacturing costs and increased
quality
3. Reduce R&D cost: Big data can also help with open innovation as it can sort
through hundreds of ideas very quickly thus reducing the cost of research and
development.
4. Improved customer service: Installation of sensors in complex equipment can
help detect where the defects are during operation resulting in quick repairs, better
customer service and lower repair costs.
This paper presentation will expand on the use of Big Data in new product
development, innovation and how companies are using this to achieve their goals.

139
A Study of Emotional-Social Intelligence in Early Childhood Pre-
service Teachers
Emine Ferda Bedel
Canakkale Onsekiz Mart University, Turkey
Abstract
Emotional intelligence is defined as the individuals' ability to perceive, assess,
express, and regulate or manage emotions in themselves and others. Since the
conceptualization of Emotional intelligence in the 1990s, it has received a
considerable research attention. Emotional Intelligence measures have been
translated to different languages and various studies have linked it to
psychological or physical well-being, leadership, job satisfaction and
performance. Research suggests that emotional intelligence is a better predictor
for success than Intelligence Quotient, therefore, it should be considered as an
important dimension of strategic personal and occupational growth. In the field of
education, there is a growing interest in emotional intelligence and it is generally
examined in relation to academic performance. In addition, some other studies
exists documenting the link between emotional intelligence and teaching efficacy
which emphasizes the importance of exploring emotional intelligence in teacher
candidates. This study aims to measure emotional intelligence of early childhood
pre-service teachers and to investigate statistical differences regarding gender and
class level. To collect data, the Bar-On Emotional Quotient Inventory (EQ-i) has
been used. The EQ-i consists of five interrelated dimensions: Intrapersonal,
Interpersonal, Stress Management, Adaptability and General Mood Scale. To
analyze data, descriptive statistics and variance analysis were used. Results will
be reported during presentation.

140
How to Come Up With an Educational Strategy in a “Technology
Implemented Versus Traditional Class” Setting
Gul Celkan
Middle Georgia State College, USA
Abstract
Times are changing fast, and it gets hard at times to catch up with all the advances
in technology especially in educational institutions as so many factors need to be
considered and reconsidered before coming up with the best practices in using
technology across the campus for teaching purposes.
In a college setting, using technology seems the best solution to solve a lot of
issues concerning students. This is easier said than done for the mere reason that
not all courses blend well with hybrid or on-line learning. This implies the
decision- making bodies at colleges have to bear in mind the characteristics of the
course first before coming up with binding ideas.
A country’s economy has impact on education as well. While good economy
helps prosper colleges, bad economy implies budgetary cuts, poor financing and
finding other means to make up for these losses. They may have to find ways of
solving these issues but one thing should not be put into oblivion. These should
not be made at the expense of the students.
The current strategy followed by most if not all tertiary institutions suffering from
some kind of economic recession due to low student enrollment, less state
subsidiary, or higher costs of education, is to seek refuge in hybrid learning
programs. Online classes had been popular for some time now, but now colleges
are making all kinds maneuvers to implement hybrid learning to replace face-to-
face learning.
It is with no doubt the primary obligation of the College President and his “crew”
to find the best solutions for the college not only to recruit more students and hire
qualified academic personnel but also to offer education using the best means
possible. In our time, people always consider technology as a primary tool to be
used in all classes. This sounds like a well and carefully crafted idea. However,
when you start considering it for each and every course offered on campus, you

141
come up with the short comings; These shortcomings are such that they cannot be
overcome overnight. They imply a complete change in teaching methods.
Having had experience with a hybrid learning class, I will emphasize the positive
and negative impacts such classes may have on students as well as even some
instructors if teaching policies are not carefully wrought.
To keep abreast with the century using technology in education becomes a must,
however, the strategies to be followed during the process should be well consulted
with all the stakeholders.
Understanding of Cultural Beliefs on Death and Bereavement
Processes among Caucasian American and Japanese Students
Sukanya Ray
Karine Toussaint
Quan Diep
Arumi Horikoshi
K Ide
Natalie Garcia
Suffolk University, USA
Abstract
This study was a preliminary exploration of attitudes towards death and
bereavement among Japanese and Caucasian American college-age
women. Participants completed several questionnaires that assessed their levels
of death anxiety, death depression, personal attitudes towards death and
bereavement, and perceptions of their culture’s, family’s, and/or religion’s
attitudes towards death and bereavement. Trends suggested lower levels of death
anxiety and death depression in Japanese students, more personal acceptance of
death and bereavement in Caucasian American students, and greater cultural
acceptance of death as perceived by Japanese students. This study offers
suggestions for in depth multi-dimensional approaches to the study of death and
bereavement across cultures.

142
Overcoming Ideology for Critical Democracy in Education
Sirous Tabrizi
Western University, Canada
Abstract
In a global society, where an emphasis on equality and social justice is important,
equality of opportunity is of high importance especially for minorities. Within
government policy groups, there are a number of highly influential ideologies.
Two currently popular ones include neo-liberalism and neo-conservatism. While
both neo-liberalism and neo-conservatism seek to create opportunities for all
citizens, through different means, their impact on education may hamper this.
Furthermore, either ideology may hamper the development of critical democracy
in a society. This paper will examine how neo-liberalism and neo-conservatism
influence attempts to implement critical democracy in education, and why an
emphasis on critical democracy regardless of the underlying ideology is better for
education.
MOOC and the Future Higher Education Strategy
Mawdudur Rahman
Suffolk University
Abstract
MOOC (Massive Open Online course) is around for more than year. It stated
with one course at the University of Manitoba in 2008. MOOC got a lot attention
with professors from Harvard, MIT, and Stanford University joining the
bandwagon in 2012. Within this time it has opened up new avenues /dimensions
to the domain of higher education. On the one hand it has opened unlimited
opportunities for learners, wider reach for the instructors. Hundreds and thousands
of students from all over the globe are taking courses from professor of Harvard,
MIT, Stanford sponsored platforms - Udacity, Coursera, and edX. On the other
side there are counter arguments about the academic value and quality and over

143
all sustainability of such courses. Can such courses meet to academic
requirements to earn credits for an academic degree? Is this movement a fad or is
a direction to a future education system? This paper will examine the reality of
MOOC and the strategic directions for future higher education system. I
concluded that structural changes in higher education must come and academic
institutions must embrace the new directions and embrace the new player. The
older players will change or lose the ground.
Managing Higher Education to Meet the Challenges of India
Tomorrow
Geeta Sudhir Nair
H.R.College of Commerce & Economics, India
Abstract
The present paper portrays the important role higher education plays in our
economy and society of today and tomorrow. A brief review of the strengths and
weaknesses is chalked out for a reality check. Later, ways and means of managing
higher education, focusing on domestic reforms and internationalization are
suggested to address the challenge of an increasing youth base of our burgeoning
population to meaningfully engage the youth, as well as harness human resources
for a qualitatively better growth.
Key words: higher education, reforms, internationalization, youth.

144
The Development of Teaching-Learning Process to Create
Humanized Pharmacy Service
Kamolnat Muangyim
Jampee Wongnak
Ministry of Public Health, Thiland
Abstract
Nowadays, people are paying more and more attention to the humanized health
care (HHC) concept, since health service providers (care givers) have been
working more and more like service machine. The care givers always consider
health problem separately from the patients’ environment. Diseases have been
always diagnosed, rather than the whole person’s illness and difficulties
contributing to the diseases. As a consequence, the care givers would always
focus on eliminating the diseases, and ignore to address the person’s illness and
difficulties. Therefore there has been a lot of front page news highlighting
conflicts between care givers and patients. There are many researches and
developments on humanized medical care, and humanized nursing care, but
humanized pharmacy service (HPS) is very hard to find, especially for teaching-
learning process constructing HPS providers.
This research aimed to 1) identify the characteristic of HPS, and 2) establish
teaching-learning protocol contributing to HPS. The intervention was the adoption
of knowledge management (KM) and appreciative inquiry (AI). HHC
communities of practice (HHC COPs) were invited to share their tacit knowledge
and real experiences, under the friendly atmosphere following the concept of AI.
An AI expert was invited to be the modulator for this focus group discussion.
Questionnaires containing two questions: 1) what is your definition for HPS; and
2) how can you perform HPS, were distributed amongst the students prior to the
intervention, immediately after the intervention, and three months after the
intervention when the student came back from their hospital fieldwork. For more
understanding, focus group discussions between students and teachers were
employed after each questionnaire data collection. The collected data were

145
analyzed by content analysis. The data quality was assured by triangulation
technique, since the teaching team consisting of three pharmacists analyzed the
data independently.
The HPS, extracted from this study, was the service characterized by the
happiness of service providers and clients. By this it meant the service providers
should have affection in their works, so they were willing to serve their clients
with their best. In addition, these service providers had to realize that a client was
a whole person who needed help. Then, they could recognize clients’ illness and
difficulties by adopting systematic thinking. This resulted in compassion and
benignity. These attributes would motivate service providers to help clients
unconditionally, in order to alleviate clients’ difficulties. Thus we could say that
these service providers had service mind. When the clients were helped, they
would be happy. The clients’ happiness then could act as immediate reward
empowering the service providers to continue their good deeds.
Teaching-learning model developed in this research was effective to prepare the
student for HPS. The teacher should be able to create network with communities
of HHC practice, in order to give the students opportunity of knowledge and
experience sharing with these experts. This method is also the KM. HHC insight
from direct experience from the experts would be shared and exchanged with
teachers and students. As a result, the teachers and students could understand and
depict what HPS was. Moreover, the shared experiences from various situations
could be easily applied when the students had to encounter similar situations.
Most of all, knowing that there were some care givers dedicated themselves to
help people was a very good motivating factor inducing the students to do the
same thing.

146
Should Educational Strategies be at the mercy of the Economy?
Gul Celkan
Middle Georgia State College, USA
Abstract
Times are changing fast, and it gets hard at times to catch up with all the advances
in technology especially in educational institutions as so many factors need to be
considered and reconsidered before coming up with the best practices in using
technology across the campus for teaching purposes.
In a college setting, using technology seems the best solution to solve a lot of
issues concerning students. This is easier said than done for the mere reason that
not all courses blend well with hybrid or on-line learning. This implies the
decision- making bodies at colleges have to bear in mind the characteristics of the
course first before coming up with binding ideas.
A country’s economy has impact on education as well. While good economy
helps prosper colleges, bad economy implies budgetary cuts, poor financing and
finding other means to make up for these losses. They may have to find ways of
solving these issues but one thing should not be put into oblivion. These should
not be made at the expense of the students.
The current strategy followed by most if not all tertiary institutions suffering from
some kind of economic recession due to low student enrollment, less state
subsidiary, or higher costs of education, is to seek refuge in hybrid learning
programs. Online classes had been popular for some time now, but now colleges
are making all kinds maneuvers to implement hybrid learning to replace face-to-
face learning.
It is with no doubt the primary obligation of the College President and his “crew”
to find the best solutions for the college not only to recruit more students and hire
qualified academic personnel but also to offer education using the best means
possible. In our time, people always consider technology as a primary tool to be

147
used in all classes. This sounds like a well and carefully crafted idea. However,
when you start considering it for each and every course offered on campus, you
come up with the shortcomings. These shortcomings are such that they cannot be
overcome overnight. They imply a complete change in teaching methods.
Having had experience with a hybrid learning class, I will emphasize the positive
and negative impacts such classes may have on students as well as even some
instructors if teaching policies are not carefully wrought.
To keep abreast with the century using technology in education becomes a must,
however, the strategies to be followed during the process should be well consulted
with all the stakeholders.
Globalization and Education Curricula
Zakaryae Arsalane
School of Arts and Humanities
University of Moulay Ismail, Morocco
Abstract
This study aims to give perception to educational curricula in the light of
globalization through answering the following questions:
A) What are the effects of globalization on education?
B) What is the role of educational curricula on facing the challenges of
globalization?
To answer these questions the study builds upon existing research which includes
books, journals, previous globalization conference findings, and texts related to
this field.

148
The researcher comes up with a comprehensive view concerning globalization
concepts, its related fields, characteristics, tools, institutions, components and
results.
To explain the effects of globalization on education as a subsystem from the
whole community system; a light had been thrown on globalization’s aims from
the perspective of international and national educational systems. Perceptions
have been set up to encounter the challenges which education faces, as follows:
- Building strong human beings and orienting their capacities.
- Becoming independent.
- Integration and unionization in an institutionalized community.
- Active dialogue with others.
From the survey of literature, which concerns globalization curriculum and the
changes, the study set up perceptions to the role of educational curricula to
encounter the global challenges. In light of the results recommendations have
been suggested.
Improve Students’ Team Performance in Business Education:
An Empirical Study from University Campus
Weichu Xu,
Mary Rogers
Framingham State University, , USA
Abstract
Team skill is becoming an important asset that employees can bring into
organization. For business schools, they try to prepare business students to acquire
teamwork skill in their business education to prepare for students’ future career.
How to work with other team members and make team work effectively is an
important issue in business education.

149
In this paper we focus on how to use 12 steps method to help business students to
learn how to improve their teamwork skill and how to improve their team
performance. We examine the relationship between 12 different steps and team
performance. This paper first discusses existing methods and research on which
factors will have impact on the team performance. Then we focus on 12 steps
method and how to use it to improve team performance. Based on previous
discussions and research, we propose and examine several hypotheses on the
relationship among 12 steps and its impact on team performance with a dataset
collecting from university student teams. The last part of paper explores the future
research agenda to have a further study in this field.
Keywords: Team performance, student, university
Lessons in Globalizing the Classroom Experience: A Decade of
Effort at Framingham State University
Sandra R Sutherland
Framingham State University, MA, USA
Abstract
Although universities have always been a place where ideas are freely exchanged
in the pursuit of higher understanding, universities have differed and evolved in
how to best organize to accomplish this goal. Universities routinely search for the
best professors in their discipline, recruit the best students in the market and
thereby deliver the best educational experience.
Today’s situation is no different. However, universities today are faced with
greater competition, a shift in the role of professor from expert to facilitator, a
more diverse student population and a clear sense that we live in a global
community competing for the same resources. It is therefore important for faculty
and students to be aware of their global environment with its different beliefs,

150
ideas, resources and constraints. To facilitate this global understanding, faculty
is encouraged to go abroad. This enables them (1) to better understand their
discipline in a foreign environment and thus pass on that knowledge and (2) to
instinctively and more persuasively inspire students to go abroad. Students also
need institutional support to get formal academic exposure to other countries
through faculty led tours and a variety of study abroad programs. The purpose of
this paper is to share lessons from what Framingham State University has done to
offer an academically enriched global experience to their students and how this
effort eventually fit into the strategic plan of the university.
Sustaining Regional Competitiveness: The Role of Bio-tech Clusters
in Promoting Knowledge Intensive Services (KIS) in the NCER
Region of Malaysia
Sharifah Rohayah
Universiti Sains Malaysia, Malaysia
Abstract
Knowledge intensive services (KIS) are important trajectory of the modern
economies, which are critical to the economic growth, innovation and knowledge
diffusion. In particular the links between high tech industries and KIS have
become growth factor in many regions. The innovation process, the mechanisms
of knowledge exchange and the respective linkages between sectors are important
elements in the current process of firm development, and for countries like
Malaysia, knowledge has become a key source of competitiveness where
knowledge intensive sectors in production and services have a lead in
transforming the economy and region. The paper focuses on the analysis of Bio-
tech cluster in promoting KIS especially Research and Development (R & D)
related services for regional development. The aim is to assess the establishment
and concentration of bio-tech firms in the Northern Corridor Economic Region

151
(NCER) in Malaysia and the extent to which they promote linkages and
networking within and beyond the region. The regional governance structure is
explored in order to reveal the role of institutional framework in enhancing the
bio-tech industries and geographical clustering in this region. In direct connection
with the universities, the existence of bio-tech parks and hi-tech parks as well as
the bio-tech centre in the northern states, the bio-tech industry has gained
essential ingredient to sustain and develop. The findings revealed important
occurrence of clustering and mechanism of knowledge exchange through
collaborative networking and linkages between the manufacturing and services
sector as well as with the universities. Globalization and knowledge based
economic development have indeed transformed and expanded the production
activities. Location still remains a major influence on firms’ strategies and in
promoting clustering initiatives and collaborative networks amongst firms and
industries for sustaining growth. This phenomenon increasingly transforms the
geographic distribution and structure in the metropolitan and the peripheral areas.
Keywords: regional competitiveness, KIS, R &D services, NCER region,
Malaysia

152
Means to Reach the Sustainable Tourism Objective in Turkey’s
Tourism Strategy 2023
Banu Bedel
Ministry of Culture and Tourism. Turkey
Abstract
Tourism is one of the main sources of revenue in Turkey, which also has deep
social, economic and environmental impacts. In order to enhance the positive
contributions of this sector while minimizing its detrimental effects, sustainable
tourism has been adapted as one of the objectives of Turkey’s Tourism Strategy
2023 issued by The Turkish Ministry of Culture and Tourism. A national award
scheme concerning the Environmental Friendliness of Accommodation
Establishments has been prepared and been in place since 2008. There is also
ongoing international work within ISO TC 228, Technical Committee on Tourism
and Related Services on the preparation of an international standard in this field.
Another collaborative endeavour involves accessibility of tourism facilities. There
is also the UNESCO World Heritage Committee proposal to adopt sustainable
tourism approach to preserving heritage and promoting economic prosperity in
heritage areas. This study aims to assess the existing work and develop guidelines
for sustainable tourism in heritage areas using sustainable tourism criteria of UN
World Tourism Organization. These guidelines may be useful to reach the
national objective stated in the strategic plan, as well as contribute to global
sustainability.

153
How Beneficial Are Charitable Benefit Corporations in the
Marketplace?
Miriam F Weismann
Suffolk University, USA
Abstract
It has been said that “B Corp certification is to sustainable business what Fair
Trade certification is to coffee or USDA Organic certification is to milk.” B Corps
are certified to meet rigorous standards of social and environmental performance,
accountability, and transparency. Until recently, fiduciary duty rules
restrained a traditional corporate entity from engaging in little more than meeting
its legal and fiduciary duty to maximize shareholder wealth. Stakeholder-oriented
companies risked shareholder litigation for the unauthorized dissipation of
corporate assets aimed at securing social or charitable goals. As the Chicago
School of Economics made clear, the funds of the corporation belong to the
shareholders and “doing good” was not the legal prerogative of the company, it
was the choice of the shareholders. A growing number of states have changed the
rules by enacting legislation which changes the rules of fiduciary duty and allows
corporations to use corporate funds to support sustainable and charitable business
practices. Sounds good in theory but has the creation of this new form of business
organization achieved any real benefits in the marketplace?

154
Economic Development and Child Health in Vietnam
Wendi Sun
Suffolk University, USA
I. Methodology & Data
In this section I will discuss the methodology I proposed to use and the data used
in my paper.
I.A. Methodology
The starting point for thinking about the determinants of a child’s health status is
a health production function. We can estimate a health production function for the
regions of Vietnam based on Grossman (1972) theoretical model.
The utility function is,
,t t tMax U U H Z
where tH is health stock in period t ; t is the flow of services per unit of health
stock; t t th H is the total quantity of health services available for consumption in
period t ; tZ represents all other commodities besides health.
The health production is,
, ;t t t t tI I M TH E
where tI is gross investment in health; tM is medical services; tTH is the time spent
on producing health; tE is education level.
The household production is,

155
, ;t t t t tZ Z X T E
where tZ is the investment in all other commodities besides health; tX represents
goods inputs; tT is time spent producing other commodities; tE is education level.
Based on the above theoretical model, we can estimate the determinants of a
child’s health:
, ,H f HI E
In general, a child’s health status (H) is determined by three kinds of variables,
health inputs (HI), the local health environment (E) and the child’s genetic health
endowment ( ).
Substitute health inputs from the above equation, we can estimate a reduced-form
equation:
, , , , , ,iH Y MS FS E
whereY is household per capita income; is the characteristic of household; MS is
mother’s education level; FS is father’s education level; is household’s taste and
preference; E is characteristic of the local environment; is child’s genetic health
endowment.
Estimate the pooled form model:
1 2
0
1 1
k k
i j ij j j i
j j
H a a X b X e
where iH is health measure; ijX are the 1k variables on individual i on household j ;
jX are the 2k household variables; ie is the disturbance term.
Divided variables used into four groups: child characteristic; parent characteristic;
household characteristic; and environment characteristic. Child characteristic
includes variables such as age, gender, breastfeeding status, birth order, etc.

156
Parent characteristic includes variables such as education, employment, marital,
age at child birth, etc. Household characteristic includes variables such as
household size, economic status, numbers of children, etc. Environment
characteristic includes variables such as water from well/river, toilet, regional
effects, etc.
I.B. Data
This paper uses several household surveys completed in Vietnam: the 1993
Vietnam Living Standards Survey (VLSS), the VLSS 1998, the 2002 Vietnam
Household Living Standard Survey (VHLSS), VHLSS 2004, VHLSS 2006, and
the 2009 Vietnam Urban Poverty Survey (UPS). The VLSS 1993 used a
multistage cluster sampling procedure to pick 4,800 households; the VLSS 1998
covered 5999 households; the VHLSS 2006 covered approximate 3500
households; and the UPS 2009 covered approximate 3000 households. All VLSS
(VHLSS) data are nationally representative, and the UPS data are regionally
representative. The household questionnaires for the Vietnam Living Standard
Survey could run to more than 100 pages. The questionnaires were based on the
format used by the World Bank in other Living Standards Measurement Surveys,
and were adapted to Vietnamese conditions and needs. The surveys were
undertaken the State Planning Committee and the General Statistical Office, with
technical assistant from the World Bank and significant financial support from the
United Nations Development Program (UNDP) and the Swedish International
Development Agency (SIDA). In these surveys, the household questionnaire
covered many different topics, including income and expenditures, credit and
savings, employment, health, education, housing, fertility, and small household
businesses. These surveys are well suited for examining the determinants of child
health in Vietnam. All household members, children and adults, were filed for
details. The great amount of household information, including detailed income
and expenditure data, can reduce problems of omitted variable bias.

157
Review of Evidence between Corporate Governance and Mandatory
IFRS Adoption from the Perspective of Agency Theory and
Information Symmetry
Joe Ilsever
Raymond Leung
University of Fraser Valley, Canada
Abstract
Prior studies illustrate the issues of agency theory stemmed from the separation
between ownership and management. As such, information asymmetry between
the agent and principal is the major reason why agent can take advantages from
adverse selection and moral hazard, which is the obvious problem in recent
accounting scandals. Boards of directors therefore have fiduciary duties to
exercise effective corporate governance mechanism to control information
asymmetry. We have reviewed the extant literature on whether corporate
governance is positively related to more and better disclosure as an attempt to
reduce information asymmetry. Also, when IFRS requires more disclosure and
IFRS adoption becomes mandatory for many jurisdictions, we examined recent
studies on whether firms adopting IFRS with corporate governance regimes can
reduce information asymmetry by making themselves more transparent. In
general, empirical findings are mixed due to the complex and inter-related nature
of corporate governance systems including single-country or cross-country
studies, self-constructed or comprehensive corporate governance metrics and
whether self-selection and endogeneity can be controlled in modeling.

158
FACEBOOK USE BY ACCOUNTING & MIS STUDENTS
Sathasivam Mathiyalakan
Georde Heilman
Sharon White
Lynette Wood
Leslie Weisenfeld
Winston Salem State University, USA
Abstract
Social networking continues to increase in popularity, with about two-thirds of all
internet users belonging to at least one social networking site (Duggan and
Brenner, 2013). Since its founding in 2004, Facebook has grown to become one
of world's leading social networking site. It now reports over a billion monthly
active users (Facebook, 2013). Social media in general and Facebook in particular
have provided a rich setting for studies in a variety of use and user topics such as
gender (Junco, Merson and Salter, 2010), ethnicity (Gabre and Kumar, 2012;
Grasmuck, Martin and Zhao, 2009), privacy (Lewis, Kaufman and Christakis,
2008; Pinchot and Paullet, 2012; Whitcomb and Fiedler, 2010), identity
construction (Boyd and Heer, 2006), and the effect of social media on student
engagement and academic performance (Junco, 2012).
Facebook is pervasive in students’ lives and can impact their academic careers in
a variety of ways. Case and King (2012) examined the social networking behavior
of students enrolled at a private northeastern U.S. university who used Facebook
and Twitter. They found that approximately 65% of the respondents indicated
social networking is either somewhat or very important to them. There appeared
to be a gender difference, with a higher percentage of females indicating that
social networking is important to them. The percentage of students indicating that
social sites are important to them fell as students rose in academic class. The
findings also indicated that although Twitter is not used as much as Facebook, it
is becoming more popular.
Other research indicates that using Facebook for educational advantage may not
be a priority for many students. For example, Akyildiz and Argan (2011)

159
examined Facebook usage among college students in Turkey and found that more
than 90% of the students have a Facebook account, log in to Facebook several
times a day, have 101-300 friends, and spent 15-30 minutes daily on Facebook-
related activities. Their predominant uses of Facebook tend to be having fun,
contacting friends, and following the news as opposed to conducting educational
and school related work. Studies of students in other countries have supported an
average use time of at least 30 minutes per session while finding little support for
Facebook's educational value (Hew 2011, Pempek et al. 2009). However, while
enhancing the educational experience may not be a predominant theme among
Facebook users, there is some research that indicates it can be useful. Jackson
(2012-2013) found that new students who joined a university-sponsored Facebook
group that provided pre-enrollment contact and integration information had higher
retention rates than the new students who didn't join. Additionally, Duncan and
Barczyk (2013) found that students tended to have favorable impressions of
Facebook for classroom use and, surprisingly, older students thought it provided a
greater social learning experience than their younger counterparts.In Facebook, a
user can develop a profile by providing personal information, interests,
photos/videos and “likes,” and choose settings that control who may view this
information. The user can then identify other Facebook users as “Friends,” collect
“Friends” through a process called Friending, and interact with them through
Facebook functions like posting, chatting, email, and feedback. In addition, users
may also join groups or form associations for information sharing, allowing for
the quick dissemination of information and coordination of plans and activities
(Ellison et al. 2007, Huang 2011). Recent research findings indicate that a
majority of students spend at least 30 minutes per session on Facebook (Akyildiz
& Argan, 2011; Pempek, et al., 2009). Some researchers suggest that Facebook
users tend to spend their time socializing with others based on pre-existing
relationships (Pempek et al., 2009).
By default, Facebook Likes are publicly available information. Using a logistic
linear regression model with dimensionality reduction preprocessing, Kosinski,
Stillwell and Graepel (2013) found that Facebook Likes can be used to accurately
predict a number of highly sensitive personal attributes such as gender, age,
ethnicity, religious and political views, sexual orientation, intelligence, happiness,

160
use of additive substances, and parental separation. The authors note that such a
predictive ability can be used both positively, as in the provision of improved
products and services, as well as for negatively, because it can be so easily and
perhaps incorrectly applied to large numbers of people without their individual
knowledge or consent.
Whitcomb and Fiedler (2010) examined the relationship between induced
negative emotions and perceived privacy risk in Facebook. YouTube videos
showing incidents of college students exposing themselves to privacy risks
through personal information disclosure were used to induce emotions. Using a
sample of thirty-four (34) students, they found that the respondents exposed
themselves to significant privacy risks through their Facebook activities.
Interestingly, they found that female subjects’ perception of risk was greater than
that of the male subjects.
Very little research has been done to evaluate the use of Facebook within HBCUs
(Historically Black College or Universities - see Gabre and Kumar (2012) as an
example). In this study, using students from an HBCU, we look at differences in
Facebook use and attitudes between HBCU accounting & MIS students. Study
limitations as well as future directions are also discussed.