Processes affecting δ 34S and δ 18O values of dissolved sulfate in alluvium along the Canadian...
14
This article appeared in a journal published by Elsevier. The attached copy is furnished to the author for internal non-commercial research and education use, including for instruction at the authors institution and sharing with colleagues. Other uses, including reproduction and distribution, or selling or licensing copies, or posting to personal, institutional or third party websites are prohibited. In most cases authors are permitted to post their version of the article (e.g. in Word or Tex form) to their personal website or institutional repository. Authors requiring further information regarding Elsevier’s archiving and manuscript policies are encouraged to visit: http://www.elsevier.com/copyright
-
Upload
independent -
Category
Documents
-
view
4 -
download
0
Transcript of Processes affecting δ 34S and δ 18O values of dissolved sulfate in alluvium along the Canadian...
This article appeared in a journal published by Elsevier. The attachedcopy is furnished to the author for internal non-commercial researchand education use, including for instruction at the authors institution
and sharing with colleagues.
Other uses, including reproduction and distribution, or selling orlicensing copies, or posting to personal, institutional or third party
websites are prohibited.
In most cases authors are permitted to post their version of thearticle (e.g. in Word or Tex form) to their personal website orinstitutional repository. Authors requiring further information
regarding Elsevier’s archiving and manuscript policies areencouraged to visit:
http://www.elsevier.com/copyright

Author's personal copy
Processes affecting δ34S and δ18O values of dissolved sulfate in alluvium along theCanadian River, central Oklahoma, USA
Michele L.W. Tuttle a,⁎, George N. Breit a, Isabelle M. Cozzarelli b
a U.S. Geological Survey, 964D Denver Federal Center, Denver, CO 80215, USAb U.S. Geological Survey, 12201 Sunrise Valley Drive, Reston, VA 20192, USA
a b s t r a c ta r t i c l e i n f o
Article history:Received 15 October 2008Received in revised form 4 May 2009Accepted 10 May 2009
Editor: D. Rickard
Keywords:Alluvial aquiferδ34S sulfateδ18O sulfateBacterial sulfate reductionSulfate isotope fractionationOxygen isotope exchange
The δ34S and δ18O values for dissolved sulfate in groundwater are commonly used in aquifer studies toidentify sulfate reservoirs and describe biogeochemical processes. The utility of these data, however, often iscompromised by mixing of sulfate sources within reservoirs and isotope fractionation during sulfur redoxcycling. Our study shows that, after all potential sulfate sources are identified and isotopically characterized,the δ34SSO4 and δ18OSO4 values differentiate processes such as sulfate-source mixing, sulfide oxidation, baritedissolution, and organosulfur decomposition. During bacterial reduction of sulfate, the values reflect kineticsulfur isotope fractionation and exchange of oxygen isotopes between sulfate and water. Detailed analysis ofthe chemistry (Cl and SO4 concentrations) and isotopic composition (δ2HH2O and δ18OH2O) of groundwater inan alluvial aquifer in Central Oklahoma, USA allowed the identification of five distinct end members thatsupply water to the aquifer (regional groundwater flowing into the study area, river water, leachate from aclosed landfill that operated within the site, rain, and surface runoff). The δ34SSO4 and δ18OSO4 values in eachend member differentiated three sources of sulfate: sulfate dissolved from Early to Late Permian rocks withinthe drainage basin (δ34SSO4=8–12‰ and δ18OSO4=10‰), iron sulfides oxidized by molecular oxygen duringlow water-table levels (δ34SSO4=−16‰ and δ18OSO4=10‰), and organosulfur compounds (predominatelyester sulfates) from decomposition of vegetation on the surface and from landfill trash buried in the alluvium(δ34SSO4=8‰ and δ18OSO4=6‰). During bacterial reduction of these sulfate sources, similar isotopefractionation processes are recorded in the parallel trends of increasing δ34SSO4 and δ18OSO4 values. Whenextensive reduction occurs, the kinetic sulfur isotope fractionation (estimated by εH2S–SO4=−23‰) resultsin the steady increase of δ34SSO4 values to greater than 70‰. Equilibrium isotope fractionation duringexchange of sulfate oxygen and water oxygen, a process not commonly observed in field-based studies, isdocumented in δ18OSO4 values asymptotically approaching 21‰, the value predicted for conditions at thestudy site (εSO4–H2O=27‰). These results show that recognition of all potential sulfate sources is a criticalfirst step to resolving complexities in δ34SSO4 and δ18OSO4 data. The approach taken in this study can be usedin other aquifer systems where the identification of multiple sulfate sources and sulfur redox cycling isimportant to understanding natural processes and anthropogenic influences.
Published by Elsevier B.V.
1. Introduction
Sulfur is a minor nutrient, an important electron acceptor andelectron donor for metabolic processes, a commonly used tracer ofsolute source(s), and a key reactant in the bacterial remediation oforganic contaminants. The abundance, oxidation state, and isotopiccomposition of sulfur in near-surface environments are modified inresponse to geochemical and biological processes. For these reasons,studies often use aqueous and solid-phase sulfur compounds tounderstand these processes and their reaction pathways (Krouse,1980; Van Stempvoort and Krouse, 1994; Bottrell et al., 1995; Krouse
and Mayer, 2000; Gooddy et al., 2002; Spence et al., 2005). This paperextends the findings of the few studies that have examined sulfur andoxygen isotope systematics in dissolved sulfate within alluvium (e.g.Basharmal, 1985; Strebel et al., 1990; Bottrell et al., 1995; Massmannet al., 2003), and develops a comprehensive approach to investigatebiogeochemical processes that affect the δ34SSO4 and δ18OSO4 values.
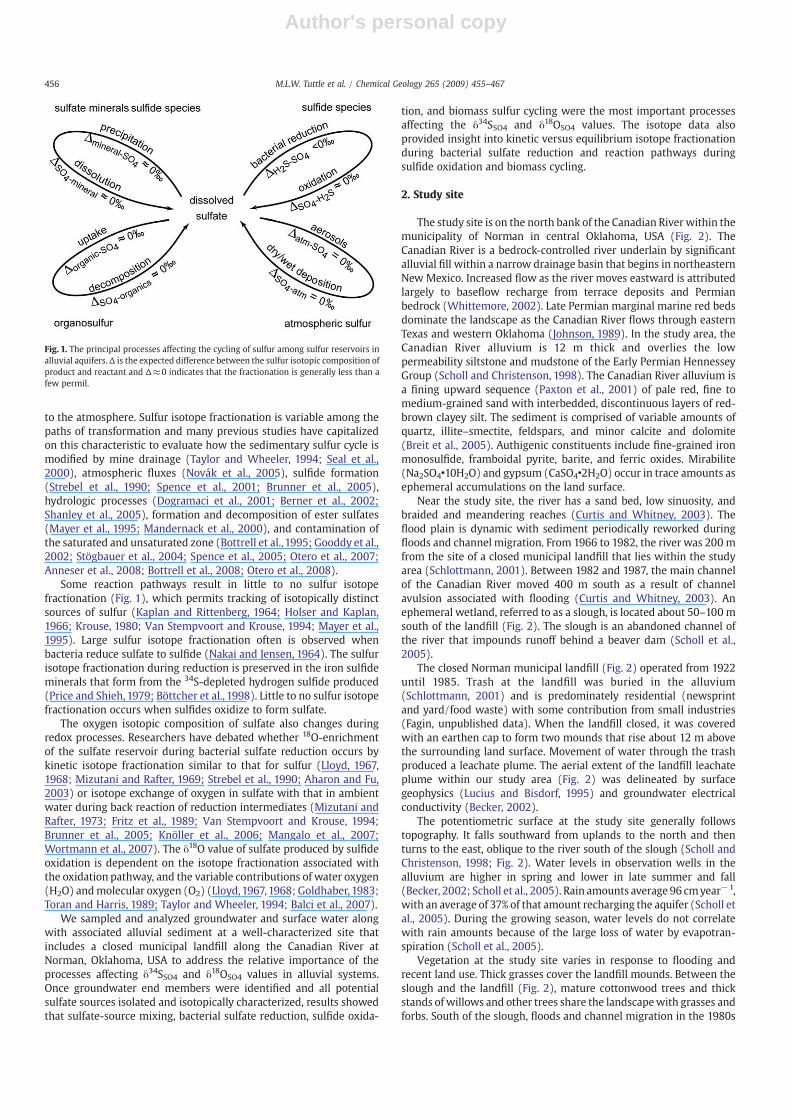
Sulfur fluxes and reservoirs in alluvial systems parallel those of thebroader global sedimentary sulfur cycle as described in Brimblecombe(2003). Sulfur accumulates by formation of sulfate and sulfideminerals and with burial of biomass, and is released by oxidationand (or) dissolution of sulfur-bearing minerals and decomposition ofbiomass (Fig. 1) (Freney and Williams, 1983; Edwards, 1998; Janzenand Ellert, 1998; among others). Export and import of sulfur throughthese reservoirs is by groundwater and surface-water flow, sedimentand biomass transfer, atmospheric deposition, and gaseous diffusion
Chemical Geology 265 (2009) 455–467
⁎ Corresponding author. U.S. Geological Survey, MS 964D, Box 25046, Denver FederalCenter, Denver, Colorado 80225, USA. Tel.: +1 303 236 1944; fax: +1 303 236 1983.
E-mail address: [email protected] (M.L.W. Tuttle).
0009-2541/$ – see front matter. Published by Elsevier B.V.doi:10.1016/j.chemgeo.2009.05.009
Contents lists available at ScienceDirect
Chemical Geology
j ourna l homepage: www.e lsev ie r.com/ locate /chemgeo
Author's personal copy
to the atmosphere. Sulfur isotope fractionation is variable among thepaths of transformation and many previous studies have capitalizedon this characteristic to evaluate how the sedimentary sulfur cycle ismodified by mine drainage (Taylor and Wheeler, 1994; Seal et al.,2000), atmospheric fluxes (Novák et al., 2005), sulfide formation(Strebel et al., 1990; Spence et al., 2001; Brunner et al., 2005),hydrologic processes (Dogramaci et al., 2001; Berner et al., 2002;Shanley et al., 2005), formation and decomposition of ester sulfates(Mayer et al., 1995; Mandernack et al., 2000), and contamination ofthe saturated and unsaturated zone (Bottrell et al., 1995; Gooddy et al.,2002; Stögbauer et al., 2004; Spence et al., 2005; Otero et al., 2007;Anneser et al., 2008; Bottrell et al., 2008; Otero et al., 2008).
Some reaction pathways result in little to no sulfur isotopefractionation (Fig. 1), which permits tracking of isotopically distinctsources of sulfur (Kaplan and Rittenberg, 1964; Holser and Kaplan,1966; Krouse, 1980; Van Stempvoort and Krouse, 1994; Mayer et al.,1995). Large sulfur isotope fractionation often is observed whenbacteria reduce sulfate to sulfide (Nakai and Jensen, 1964). The sulfurisotope fractionation during reduction is preserved in the iron sulfideminerals that form from the 34S-depleted hydrogen sulfide produced(Price and Shieh, 1979; Böttcher et al., 1998). Little to no sulfur isotopefractionation occurs when sulfides oxidize to form sulfate.
The oxygen isotopic composition of sulfate also changes duringredox processes. Researchers have debated whether 18O-enrichmentof the sulfate reservoir during bacterial sulfate reduction occurs bykinetic isotope fractionation similar to that for sulfur (Lloyd, 1967,1968; Mizutani and Rafter, 1969; Strebel et al., 1990; Aharon and Fu,2003) or isotope exchange of oxygen in sulfate with that in ambientwater during back reaction of reduction intermediates (Mizutani andRafter, 1973; Fritz et al., 1989; Van Stempvoort and Krouse, 1994;Brunner et al., 2005; Knöller et al., 2006; Mangalo et al., 2007;Wortmann et al., 2007). The δ18O value of sulfate produced by sulfideoxidation is dependent on the isotope fractionation associated withthe oxidation pathway, and the variable contributions of water oxygen(H2O) andmolecular oxygen (O2) (Lloyd,1967,1968; Goldhaber,1983;Toran and Harris, 1989; Taylor and Wheeler, 1994; Balci et al., 2007).
We sampled and analyzed groundwater and surface water alongwith associated alluvial sediment at a well-characterized site thatincludes a closed municipal landfill along the Canadian River atNorman, Oklahoma, USA to address the relative importance of theprocesses affecting δ34SSO4 and δ18OSO4 values in alluvial systems.Once groundwater end members were identified and all potentialsulfate sources isolated and isotopically characterized, results showedthat sulfate-source mixing, bacterial sulfate reduction, sulfide oxida-
tion, and biomass sulfur cycling were the most important processesaffecting the δ34SSO4 and δ18OSO4 values. The isotope data alsoprovided insight into kinetic versus equilibrium isotope fractionationduring bacterial sulfate reduction and reaction pathways duringsulfide oxidation and biomass cycling.
2. Study site
The study site is on the north bank of the Canadian River within themunicipality of Norman in central Oklahoma, USA (Fig. 2). TheCanadian River is a bedrock-controlled river underlain by significantalluvial fill within a narrow drainage basin that begins in northeasternNew Mexico. Increased flow as the river moves eastward is attributedlargely to baseflow recharge from terrace deposits and Permianbedrock (Whittemore, 2002). Late Permian marginal marine red bedsdominate the landscape as the Canadian River flows through easternTexas and western Oklahoma (Johnson, 1989). In the study area, theCanadian River alluvium is 12 m thick and overlies the lowpermeability siltstone and mudstone of the Early Permian HennesseyGroup (Scholl and Christenson, 1998). The Canadian River alluvium isa fining upward sequence (Paxton et al., 2001) of pale red, fine tomedium-grained sand with interbedded, discontinuous layers of red-brown clayey silt. The sediment is comprised of variable amounts ofquartz, illite–smectite, feldspars, and minor calcite and dolomite(Breit et al., 2005). Authigenic constituents include fine-grained ironmonosulfide, framboidal pyrite, barite, and ferric oxides. Mirabilite(Na2SO4•10H2O) and gypsum (CaSO4•2H2O) occur in trace amounts asephemeral accumulations on the land surface.
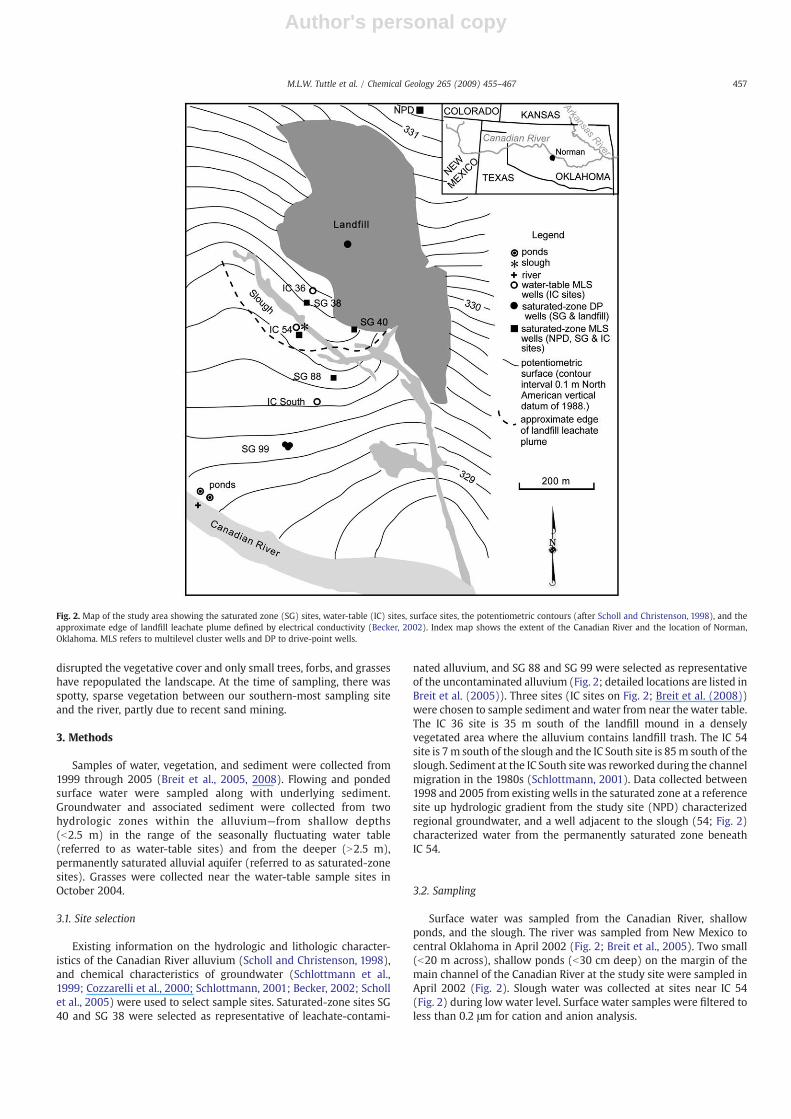
Near the study site, the river has a sand bed, low sinuosity, andbraided and meandering reaches (Curtis and Whitney, 2003). Theflood plain is dynamic with sediment periodically reworked duringfloods and channel migration. From 1966 to 1982, the river was 200 mfrom the site of a closed municipal landfill that lies within the studyarea (Schlottmann, 2001). Between 1982 and 1987, the main channelof the Canadian River moved 400 m south as a result of channelavulsion associated with flooding (Curtis and Whitney, 2003). Anephemeral wetland, referred to as a slough, is located about 50–100 msouth of the landfill (Fig. 2). The slough is an abandoned channel ofthe river that impounds runoff behind a beaver dam (Scholl et al.,2005).
The closed Norman municipal landfill (Fig. 2) operated from 1922until 1985. Trash at the landfill was buried in the alluvium(Schlottmann, 2001) and is predominately residential (newsprintand yard/food waste) with some contribution from small industries(Fagin, unpublished data). When the landfill closed, it was coveredwith an earthen cap to form two mounds that rise about 12 m abovethe surrounding land surface. Movement of water through the trashproduced a leachate plume. The aerial extent of the landfill leachateplume within our study area (Fig. 2) was delineated by surfacegeophysics (Lucius and Bisdorf, 1995) and groundwater electricalconductivity (Becker, 2002).
The potentiometric surface at the study site generally followstopography. It falls southward from uplands to the north and thenturns to the east, oblique to the river south of the slough (Scholl andChristenson, 1998; Fig. 2). Water levels in observation wells in thealluvium are higher in spring and lower in late summer and fall(Becker, 2002; Scholl et al., 2005). Rain amounts average 96 cmyear−1,with an average of 37% of that amount recharging the aquifer (Scholl etal., 2005). During the growing season, water levels do not correlatewith rain amounts because of the large loss of water by evapotran-spiration (Scholl et al., 2005).
Vegetation at the study site varies in response to flooding andrecent land use. Thick grasses cover the landfill mounds. Between theslough and the landfill (Fig. 2), mature cottonwood trees and thickstands of willows and other trees share the landscapewith grasses andforbs. South of the slough, floods and channel migration in the 1980s
Fig. 1. The principal processes affecting the cycling of sulfur among sulfur reservoirs inalluvial aquifers.Δ is the expected difference between the sulfur isotopic composition ofproduct and reactant and Δ≈0 indicates that the fractionation is generally less than afew permil.
456 M.L.W. Tuttle et al. / Chemical Geology 265 (2009) 455–467
Author's personal copy
disrupted the vegetative cover and only small trees, forbs, and grasseshave repopulated the landscape. At the time of sampling, there wasspotty, sparse vegetation between our southern-most sampling siteand the river, partly due to recent sand mining.
3. Methods
Samples of water, vegetation, and sediment were collected from1999 through 2005 (Breit et al., 2005, 2008). Flowing and pondedsurface water were sampled along with underlying sediment.Groundwater and associated sediment were collected from twohydrologic zones within the alluvium—from shallow depths(b2.5 m) in the range of the seasonally fluctuating water table(referred to as water-table sites) and from the deeper (N2.5 m),permanently saturated alluvial aquifer (referred to as saturated-zonesites). Grasses were collected near the water-table sample sites inOctober 2004.
3.1. Site selection
Existing information on the hydrologic and lithologic character-istics of the Canadian River alluvium (Scholl and Christenson, 1998),and chemical characteristics of groundwater (Schlottmann et al.,1999; Cozzarelli et al., 2000; Schlottmann, 2001; Becker, 2002; Schollet al., 2005) were used to select sample sites. Saturated-zone sites SG40 and SG 38 were selected as representative of leachate-contami-
nated alluvium, and SG 88 and SG 99 were selected as representativeof the uncontaminated alluvium (Fig. 2; detailed locations are listed inBreit et al. (2005)). Three sites (IC sites on Fig. 2; Breit et al. (2008))were chosen to sample sediment and water from near the water table.The IC 36 site is 35 m south of the landfill mound in a denselyvegetated area where the alluvium contains landfill trash. The IC 54site is 7m south of the slough and the IC South site is 85m south of theslough. Sediment at the IC South sitewas reworked during the channelmigration in the 1980s (Schlottmann, 2001). Data collected between1998 and 2005 from existing wells in the saturated zone at a referencesite up hydrologic gradient from the study site (NPD) characterizedregional groundwater, and a well adjacent to the slough (54; Fig. 2)characterized water from the permanently saturated zone beneathIC 54.
3.2. Sampling
Surface water was sampled from the Canadian River, shallowponds, and the slough. The river was sampled from New Mexico tocentral Oklahoma in April 2002 (Fig. 2; Breit et al., 2005). Two small(b20 m across), shallow ponds (b30 cm deep) on the margin of themain channel of the Canadian River at the study site were sampled inApril 2002 (Fig. 2). Slough water was collected at sites near IC 54(Fig. 2) during low water level. Surface water samples were filtered toless than 0.2 μm for cation and anion analysis.
Fig. 2. Map of the study area showing the saturated zone (SG) sites, water-table (IC) sites, surface sites, the potentiometric contours (after Scholl and Christenson, 1998), and theapproximate edge of landfill leachate plume defined by electrical conductivity (Becker, 2002). Index map shows the extent of the Canadian River and the location of Norman,Oklahoma. MLS refers to multilevel cluster wells and DP to drive-point wells.
457M.L.W. Tuttle et al. / Chemical Geology 265 (2009) 455–467
Author's personal copy
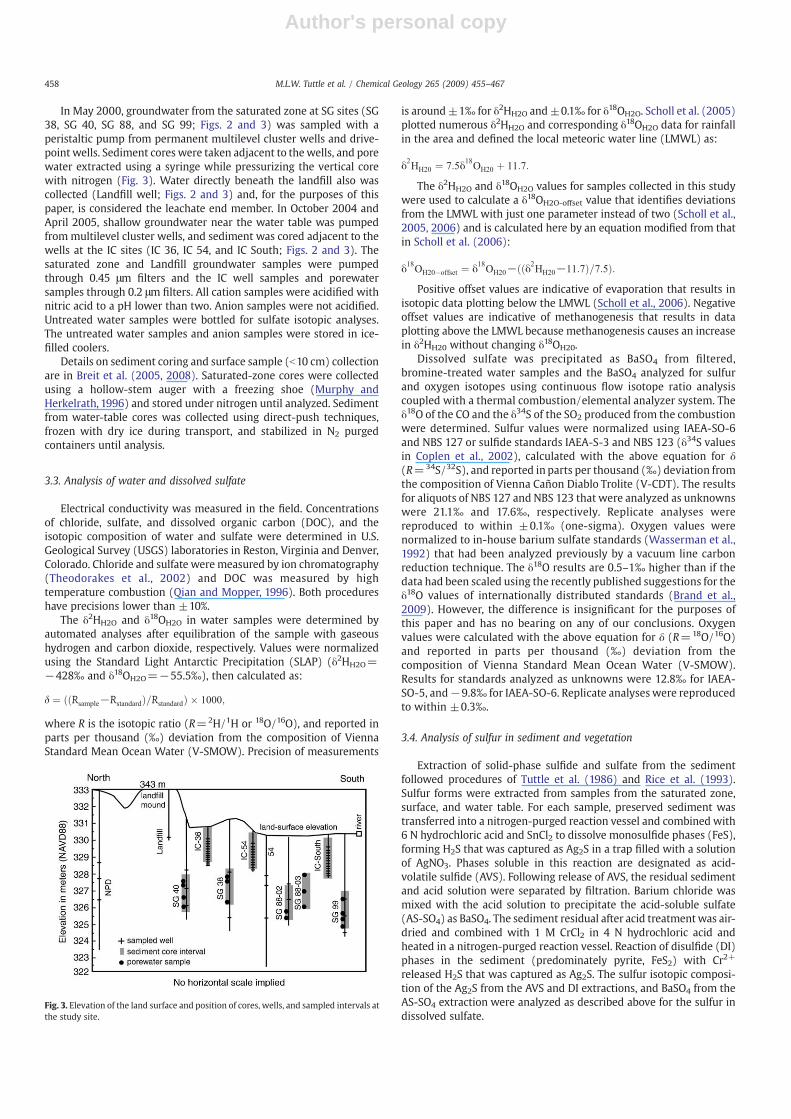
In May 2000, groundwater from the saturated zone at SG sites (SG38, SG 40, SG 88, and SG 99; Figs. 2 and 3) was sampled with aperistaltic pump from permanent multilevel cluster wells and drive-point wells. Sediment cores were taken adjacent to thewells, and porewater extracted using a syringe while pressurizing the vertical corewith nitrogen (Fig. 3). Water directly beneath the landfill also wascollected (Landfill well; Figs. 2 and 3) and, for the purposes of thispaper, is considered the leachate end member. In October 2004 andApril 2005, shallow groundwater near the water table was pumpedfrommultilevel cluster wells, and sediment was cored adjacent to thewells at the IC sites (IC 36, IC 54, and IC South; Figs. 2 and 3). Thesaturated zone and Landfill groundwater samples were pumpedthrough 0.45 μm filters and the IC well samples and porewatersamples through 0.2 μm filters. All cation samples were acidified withnitric acid to a pH lower than two. Anion samples were not acidified.Untreated water samples were bottled for sulfate isotopic analyses.The untreated water samples and anion samples were stored in ice-filled coolers.
Details on sediment coring and surface sample (b10 cm) collectionare in Breit et al. (2005, 2008). Saturated-zone cores were collectedusing a hollow-stem auger with a freezing shoe (Murphy andHerkelrath, 1996) and stored under nitrogen until analyzed. Sedimentfrom water-table cores was collected using direct-push techniques,frozen with dry ice during transport, and stabilized in N2 purgedcontainers until analysis.
3.3. Analysis of water and dissolved sulfate
Electrical conductivity was measured in the field. Concentrationsof chloride, sulfate, and dissolved organic carbon (DOC), and theisotopic composition of water and sulfate were determined in U.S.Geological Survey (USGS) laboratories in Reston, Virginia and Denver,Colorado. Chloride and sulfate were measured by ion chromatography(Theodorakes et al., 2002) and DOC was measured by hightemperature combustion (Qian and Mopper, 1996). Both procedureshave precisions lower than ±10%.
The δ2HH2O and δ18OH2O in water samples were determined byautomated analyses after equilibration of the sample with gaseoushydrogen and carbon dioxide, respectively. Values were normalizedusing the Standard Light Antarctic Precipitation (SLAP) (δ2HH2O=−428‰ and δ18OH2O=−55.5‰), then calculated as:
δ ¼ ððRsample−RstandardÞ=RstandardÞ � 1000;
where R is the isotopic ratio (R=2H/1H or 18O/16O), and reported inparts per thousand (‰) deviation from the composition of ViennaStandard Mean Ocean Water (V-SMOW). Precision of measurements
is around±1‰ for δ2HH2O and±0.1‰ for δ18OH2O. Scholl et al. (2005)plotted numerous δ2HH2O and corresponding δ18OH2O data for rainfallin the area and defined the local meteoric water line (LMWL) as:
δ2HH20 ¼ 7:5δ18OH20 þ 11:7:
The δ2HH2O and δ18OH2O values for samples collected in this studywere used to calculate a δ18OH2O-offset value that identifies deviationsfrom the LMWL with just one parameter instead of two (Scholl et al.,2005, 2006) and is calculated here by an equation modified from thatin Scholl et al. (2006):
δ18OH20�offset ¼ δ18OH20−ððδ2HH20−11:7Þ=7:5Þ:Positive offset values are indicative of evaporation that results in
isotopic data plotting below the LMWL (Scholl et al., 2006). Negativeoffset values are indicative of methanogenesis that results in dataplotting above the LMWL because methanogenesis causes an increasein δ2HH20 without changing δ18OH20.
Dissolved sulfate was precipitated as BaSO4 from filtered,bromine-treated water samples and the BaSO4 analyzed for sulfurand oxygen isotopes using continuous flow isotope ratio analysiscoupled with a thermal combustion/elemental analyzer system. Theδ18O of the CO and the δ34S of the SO2 produced from the combustionwere determined. Sulfur values were normalized using IAEA-SO-6and NBS 127 or sulfide standards IAEA-S-3 and NBS 123 (δ34S valuesin Coplen et al., 2002), calculated with the above equation for δ(R=34S/32S), and reported in parts per thousand (‰) deviation fromthe composition of Vienna Cañon Diablo Trolite (V-CDT). The resultsfor aliquots of NBS 127 and NBS 123 that were analyzed as unknownswere 21.1‰ and 17.6‰, respectively. Replicate analyses werereproduced to within ±0.1‰ (one-sigma). Oxygen values werenormalized to in-house barium sulfate standards (Wasserman et al.,1992) that had been analyzed previously by a vacuum line carbonreduction technique. The δ18O results are 0.5–1‰ higher than if thedata had been scaled using the recently published suggestions for theδ18O values of internationally distributed standards (Brand et al.,2009). However, the difference is insignificant for the purposes ofthis paper and has no bearing on any of our conclusions. Oxygenvalues were calculated with the above equation for δ (R=18O/16O)and reported in parts per thousand (‰) deviation from thecomposition of Vienna Standard Mean Ocean Water (V-SMOW).Results for standards analyzed as unknowns were 12.8‰ for IAEA-SO-5, and−9.8‰ for IAEA-SO-6. Replicate analyses were reproducedto within ±0.3‰.
3.4. Analysis of sulfur in sediment and vegetation
Extraction of solid-phase sulfide and sulfate from the sedimentfollowed procedures of Tuttle et al. (1986) and Rice et al. (1993).Sulfur forms were extracted from samples from the saturated zone,surface, and water table. For each sample, preserved sediment wastransferred into a nitrogen-purged reaction vessel and combined with6 N hydrochloric acid and SnCl2 to dissolve monosulfide phases (FeS),forming H2S that was captured as Ag2S in a trap filled with a solutionof AgNO3. Phases soluble in this reaction are designated as acid-volatile sulfide (AVS). Following release of AVS, the residual sedimentand acid solution were separated by filtration. Barium chloride wasmixed with the acid solution to precipitate the acid-soluble sulfate(AS-SO4) as BaSO4. The sediment residual after acid treatmentwas air-dried and combined with 1 M CrCl2 in 4 N hydrochloric acid andheated in a nitrogen-purged reaction vessel. Reaction of disulfide (DI)phases in the sediment (predominately pyrite, FeS2) with Cr2+
released H2S that was captured as Ag2S. The sulfur isotopic composi-tion of the Ag2S from the AVS and DI extractions, and BaSO4 from theAS-SO4 extraction were analyzed as described above for the sulfur indissolved sulfate.
Fig. 3. Elevation of the land surface and position of cores, wells, and sampled intervals atthe study site.
458 M.L.W. Tuttle et al. / Chemical Geology 265 (2009) 455–467

Author's personal copy
The δ34S of sulfur in vegetation was determined on the abundantgrasses growing at the study site. Grass samples were rinsedthoroughly with deionized water, dried, ground, and ashed withEschka mixture (ASTM, 1984). The ash was dissolved in water and thesulfate precipitated as BaSO4 that was isotopically analyzed using thesame procedures described above for sulfur in dissolved sulfate.
3.5. Statistical analysis
The statistical package S+ (v. 6.2, 2003, Insightful Corporation) ranthree non-parametric tests used for comparison of populations withinthe sediment-bound sulfur species. The Wilcoxon rank sum testcompared populations for significant differences. Wilcoxon signedrank test is a pair-wise comparison used to compare AVS and DIabundances within sample sets. The Kruskal–Wallis rank sum test isfor multiple comparisons and was used to compare results among thewater-table wells. Differences at a probability level of 0.05 wereconsidered significant for all three comparisons.
4. Results
4.1. Water composition
Complete listings of compositional data for surface water andgroundwater in the permanently saturated-zone (SG sites) arepresented in Breit et al. (2005). Data from near the water table (ICsites) are found in Breit et al. (2008). We focused on electricalconductivity, chloride, sulfate, DOC, δ34SSO4, δ18OSO4, and δ18OH2O-offset
as the key compositional variables needed for this study. Summariesof these data are presented in Tables 1 and 2.
Compositional data for surface water are in Table 1. As expected, rainhas much lower concentrations of chloride (0.004 mM) and sulfate(0.012 mM) than all surface water collected. The δ18OH2O-offset for raincollected within the study site varies within the narrow range of−0.7 to
0.8‰. Canadian River water has high sulfate concentrations (median=3.4 mM), intermediate chloride concentrations (median=2.5 mM), andlowDOC concentrations (median=0.2mM) relative to concentrations inother surface water. The δ34S of sulfate dissolved in the Canadian River is4‰ higher than that measured in the local bedrock aquifers (average of8‰; Ferree et al. (1992); Schlottmann and Funkhouser (1991)). Thisdifference reflects higher isotopic values for sulfate in Late Permian rocks(upstream) compared to those for Early Permian sulfate in rock units inthe vicinity of the study site. The δ18OSO4 of river water is 12‰, and theδ18OH2O-offsetvalue is positive (1‰), which is consistent with slightevaporation of rain. In the shallow ponds, chloride concentrations (0.2–0.48mM)and sulfate concentrations (0.31–0.40mM) are nearly an order-of-magnitude lower than those in river water. In pond water, the δ34SSO4values (11 and18‰) and δ18OSO4 values (15 and16‰) are up to 6‰higherthan those in riverwater.Water in the slough has awide range of chlorideconcentrations (0.5–67 mM) and sulfate concentrations (0.3–15 mM),relatively high δ34SSO4 values (27‰), and a similar δ18OSO4 value (12‰) tothat in river water. Scholl et al. (2005) attributed the high δ18OH2O-offset ofsloughwater (up to 9.4‰) to evaporation,which is likely the cause for thecorresponding high chloride and sulfate concentrations.
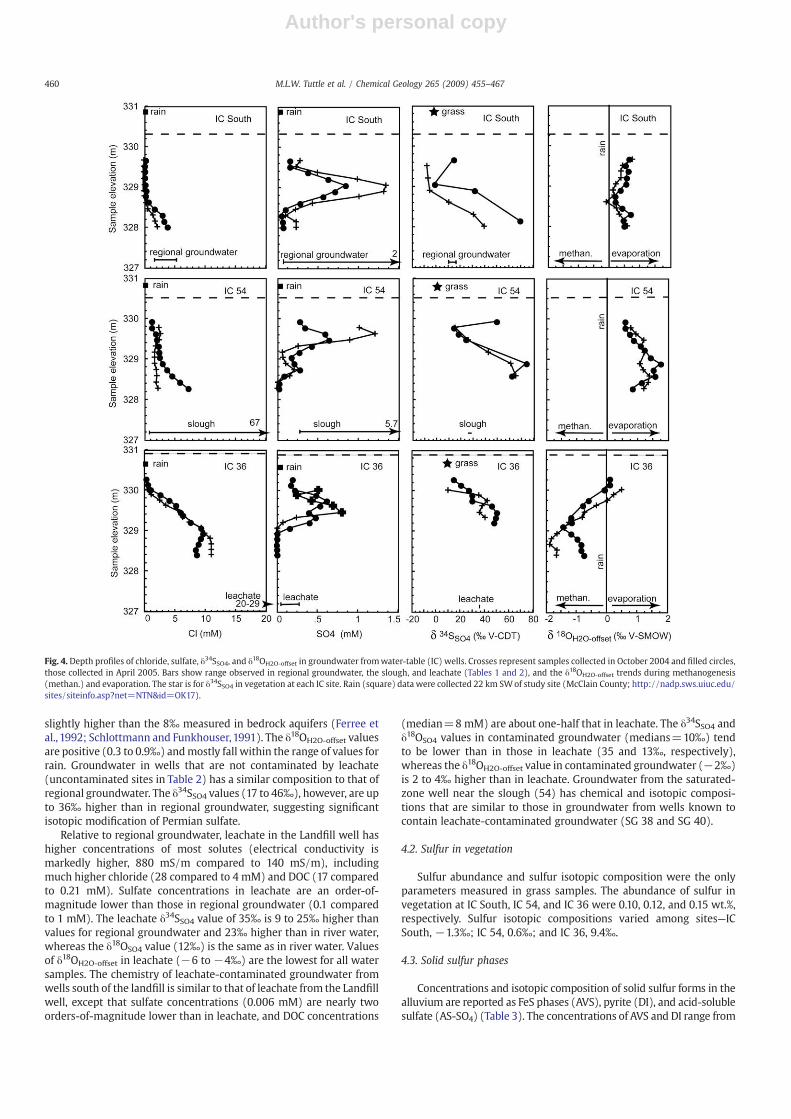
Chemical and isotopic compositions of water in each of the threewater-table (IC) wells vary greatly with depth (Fig. 4). All three water-table wells have distinct maxima in sulfate concentration (0.6–1.4 mM) between 0.4 and 0.8 m below the water table. These maximaare higher by as much as 0.5mM in the October sampling compared tomaxima in the April sampling. Chloride concentrations increase withdepth but the amount of increase varies markedly with location. InApril, chloride concentrations reached 4 mM at IC South, 7 mM at IC54, and 9 mM at IC 36. The δ34SSO4 also increases with depth (maximain April are 70‰ at IC South, 63‰ at IC 54, and 50‰ at IC 36). IC Southsamples have slightly positive δ18OH2O-offset values (approximatelyzero to 0.8‰) that aremostly within the range for rain at the study site(−0.8 to 0.7‰). The IC 54 samples have consistently positive offsets(0.5 to 1.8‰). In contrast, offsets in samples from IC 36 are typicallynegative and range from −2.0 to 0.5‰.
The regional groundwater composition (NPD) is very similar tothat of river water with the exception that it only contains about 30%of the sulfate (Tables 1 and 2). The δ34SSO4 values (10 to 16‰) are
Table 1Compositional median and range for rain and surface water at the study site.
Rain Canadian River(this study)
Canadian River(NWIS)c
Shallowponds
Slough
E.C. 1.1 – 126 – 194mS m−1 0.65–1.9a 167 66–210 34–65 43–870
n=272 n=1 n=620 n=2 n=17Cl 0.004 – 2.5 – 5.2mM 0.002–0.01a 3.5–5.8 0.6–9.3 0.21–0.48 0.5–67
n=272 n=3 n=620 n=2 n=17SO4 0.012 – 3.4 – 1.8mM 0.007–0.022a 4.8–5.1 1.3–5.7 0.31–0.40 0.3–15
n=272 n=3 n=620 n=2 n=17DOC nd – nd nd 39mM 0.2 13–1700
n=1 n=17δ34SSO4 nd – nd – –
‰V-CDT 12.2–12.4 10.8–17.9 27.3–27.7n=3 n=2 n=2
δ18OSO4 nd – nd – –
‰V-SMOW 12.2–12.6 15.2–16.1 11.9n=3 n=2 n=1
δ18OH2O-offset −0.1 – nd nd 1.4‰V-SMOW −0.8–0.7b 1.2 0–9.4
n=92 n=1 n=17
Bold typeface=median; E.C.=electrical conductivity; DOC=dissolved organiccarbon; range=values between 10th and 90th percentiles; nd, not determined; –,sample number too small for median.
a NADP sample site in McClain County, OK, 1983–2007. Data from (http://nadp.sws.uiuc.edu/sites/siteinfo.asp?net=NTN&id=OK17).
b Data are from study site (Scholl et al., 2005).c National Water Information System (NWIS) data collected at Bridgeport and Noble
OK, 1967–1992. Data at (http://nwis.waterdata.usgs.gov/usa/nwis/qwdata).
Table 2Compositional median and range for groundwater collected from the saturated zone inCanadian River alluvium.
NPD regionalgroundwater
SGuncontaminated
Landfill wellleachate
SGcontaminated
54 nearslough
E.C. 140 nd 880 527 420mS m−1 110–160 700–920 430–600 240–500
n=15 n=5 n=21 n=19Cl 3.9 2.8 28 22 19mM 1.8–5.3 0.3–3.1 20–29 14–36 7.1–24
n=15 n=14 n=5 n=21 n=19SO4 1.0 0.84 0.13 0.006 0.05mM 0.7–2.0 0.01–1.1 0.02–0.26 b0.002–0.35 b0.01–1.9
n=15 n=14 n=5 n=21 n=19DOC 0.21 0.8 17 8.4 4.5mM 0.14–0.28 0.3–1.1 10–21 5.8–17 1.8–6.5
n=15 n=14 n=5 n=21 n=19δ34SSO4 – 30.5 – 10.3 nd‰ V-CDT 9.8–15.7 16.6–46.0 35.1 8.7–48.7
n=2 n=5 n=1 n=5δ18OSO4 nd 16.9 – 10.0 nd‰ VSMOW 16.2–20.0 12.9 6.5–17.0
n=5 n=1 n=5δ18OH2O-offset 0.5 nd −5.9 −2.2 −1.4‰ VSMOW 0.3–0.9 −6.0 to −4.0 −3.1 to −1.2 −2.0–0.9
n=15 n=5 n=21 n=19
Bold typeface=median; E.C.=electrical conductivity; DOC=dissolved organiccarbon; nd, not determined; –, sample number too small for median. Data for SGsites include porewater data as well as data from adjacent wells collected between 1997and 2006. Data for 54 and NPD are on samples collected between 1997 and 2006 and arelimited to the depths sampled at the SG sites.
459M.L.W. Tuttle et al. / Chemical Geology 265 (2009) 455–467
Author's personal copy
slightly higher than the 8‰ measured in bedrock aquifers (Ferree etal., 1992; Schlottmann and Funkhouser,1991). The δ18OH2O-offset valuesare positive (0.3 to 0.9‰) andmostly fall within the range of values forrain. Groundwater in wells that are not contaminated by leachate(uncontaminated sites in Table 2) has a similar composition to that ofregional groundwater. The δ34SSO4 values (17 to 46‰), however, are upto 36‰ higher than in regional groundwater, suggesting significantisotopic modification of Permian sulfate.
Relative to regional groundwater, leachate in the Landfill well hashigher concentrations of most solutes (electrical conductivity ismarkedly higher, 880 mS/m compared to 140 mS/m), includingmuch higher chloride (28 compared to 4 mM) and DOC (17 comparedto 0.21 mM). Sulfate concentrations in leachate are an order-of-magnitude lower than those in regional groundwater (0.1 comparedto 1 mM). The leachate δ34SSO4 value of 35‰ is 9 to 25‰ higher thanvalues for regional groundwater and 23‰ higher than in river water,whereas the δ18OSO4 value (12‰) is the same as in river water. Valuesof δ18OH2O-offset in leachate (−6 to −4‰) are the lowest for all watersamples. The chemistry of leachate-contaminated groundwater fromwells south of the landfill is similar to that of leachate from the Landfillwell, except that sulfate concentrations (0.006 mM) are nearly twoorders-of-magnitude lower than in leachate, and DOC concentrations
(median=8 mM) are about one-half that in leachate. The δ34SSO4 andδ18OSO4 values in contaminated groundwater (medians=10‰) tendto be lower than in those in leachate (35 and 13‰, respectively),whereas the δ18OH2O-offset value in contaminated groundwater (−2‰)is 2 to 4‰ higher than in leachate. Groundwater from the saturated-zone well near the slough (54) has chemical and isotopic composi-tions that are similar to those in groundwater from wells known tocontain leachate-contaminated groundwater (SG 38 and SG 40).
4.2. Sulfur in vegetation
Sulfur abundance and sulfur isotopic composition were the onlyparameters measured in grass samples. The abundance of sulfur invegetation at IC South, IC 54, and IC 36 were 0.10, 0.12, and 0.15 wt.%,respectively. Sulfur isotopic compositions varied among sites—ICSouth, −1.3‰; IC 54, 0.6‰; and IC 36, 9.4‰.
4.3. Solid sulfur phases
Concentrations and isotopic composition of solid sulfur forms in thealluvium are reported as FeS phases (AVS), pyrite (DI), and acid-solublesulfate (AS-SO4) (Table 3). The concentrations of AVS and DI range from
Fig. 4. Depth profiles of chloride, sulfate, δ34SSO4, and δ18OH2O-offset in groundwater fromwater-table (IC) wells. Crosses represent samples collected in October 2004 and filled circles,those collected in April 2005. Bars show range observed in regional groundwater, the slough, and leachate (Tables 1 and 2), and the δ18OH2O-offset trends during methanogenesis(methan.) and evaporation. The star is for δ34SSO4 in vegetation at each IC site. Rain (square) data were collected 22 km SWof study site (McClain County; http://nadp.sws.uiuc.edu/sites/siteinfo.asp?net=NTN&id=OK17).
460 M.L.W. Tuttle et al. / Chemical Geology 265 (2009) 455–467

Author's personal copy
b0.1 to 185 μmol g−1. In the saturated zone, the highest medianconcentrations of AVS and DI are in the uncontaminated samples (8.4and 7.8 μmol g−1, respectively), with lower median concentrations inleachate-contaminated samples (6.2 and 3.7 μmol g−1, respectively).AS-SO4 is present partly as fine-grained barite (Ulrich et al., 2003; Breitet al., 2005) and concentrations range from b0.3 to 12 µmol g−1 in thesaturated zone. Among thewater-table samples, theAS-SO4 abundancesare similar (0.7–0.8 μmol g−1),whileAVS andDI abundances arehighestin samples from IC 36 (1.7 and 1.1 μmol g−1, respectively). Surfacesamples, which were selected largely because of the visible black graincoatings, contain similar concentrations of AVS, DI, and AS-SO4 (1.6–1.8 μmol g−1) that are intermediate to contents measured in saturated-zone and water-table samples.
Collectively the sulfur isotopic compositions of AVS, DI, and AS-SO4
vary over a range of nearly 45‰ (Table 3). Median δ34S values aresignificantly different among species with the lowest for DI (−19‰)and the highest for AS-SO4 (16‰). In water-table and saturated-zonealluvium, the δ34S values for AVS are 3–8‰ higher than those for DI.Among saturated-zone samples, leachate-contaminated areas containδ34S values of AVS and DI (0.6 and−4.4‰, respectively) that are 13‰higher than those from uncontaminated areas. No significant differ-ence in δ34S values of sulfide phases in uncontaminated areas at thewater table and in the saturated zonewas detected. The δ34S values forAS-SO4 extracted from the saturated zone are 5 to 10‰ lower than theδ34S of AS-SO4 at the water table in IC South, which, in turn, areapproximately 8‰ lower than AS-SO4 in alluvium from IC 36 and IC 54.
5. Discussion
Sulfur within the Canadian River alluvium originates largely asdissolved sulfate that is released duringweathering of bedded gypsumin Permian rocks within the drainage basin. As groundwater passesthrough the alluvium, the abundance and isotopic composition ofdissolved sulfate are modified by bacterial sulfate reduction, sulfide-mineral formation and oxidation, sulfate-mineral formation anddissolution, and sulfate uptake into biomass that subsequentlydecomposes (Fig. 1). The significance of these processes and theirdistribution within the alluvium is determined using a frameworkdefined by five groundwater end members and three isotopicallydistinct sulfate sources.
5.1. Groundwater end members within Canadian River alluvium
Groundwater in the Canadian River alluvium at the study site isderived from five end members: regional groundwater, river water,
landfill leachate, direct recharge of rain, and evaporated surface water(runoff). Regional groundwater enters the study area from the northand eventually discharges into the river (Scholl and Christenson,1998). The complex pattern of channels that define the Canadian River(Curtis and Whitney, 2003) facilitates substantial interaction of riverwater and alluvial groundwater in the hyporheic zone, which hasvariable extent controlled by the relative water levels in the river andalluvium. The influence of river water is expected to increase afterflooding events. Passage of regional groundwater through landfillwaste produces chemically and isotopically distinct leachate. Raininfiltrates directly into the porous sands exposed on the groundsurface of much of the alluvium. Water in the slough is maintained bysurface runoff and discharge of shallow groundwater, and undergoesmodification by evaporation.
The δ18OH2O-offset and chloride concentrations group these ground-water end members as a result of processes that variably alter theircomposition (Fig. 5). Rain has a narrow range of δ18OH2O-offset (−0.8 to0.7‰) and low chloride concentrations acquired in the atmosphere(0.002–0.01 mM). Regional groundwater, as defined by water from theNPD well (Table 2), has slightly positive δ18OH2O-offset values (0.3 to0.9‰) and significantly higher chloride contents (1.8–5.3 mM) thanrain. The slightly positive δ18OH2O-offset and increased chloride concen-trations indicate that the regional groundwater originates as rainfall thatis modified by evaporation prior to or during infiltration, rock–water
Table 3Median and range of concentration and δ34S value of solid-phase sulfur species in Canadian River alluvium.
SG uncontaminated SG contaminated IC 36 IC 54 IC South Surface
AVS 8.4 6.2 1.7 0.84 0.56 1.6μmol g−1 0.13–120 0.2–41 0.6–2.8 0.41–3.8 0.16–2.4 0.37–70
n=13 n=15 n=8 n=10 n=13 n=9DI 7.8 3.7 1.1 0.34 0.45 1.8μmol g−1 0.31–185 0.31–69 0.5–5.5 0.19–15 0.19–2.0 0.31–2.8
n=13 n=15 n=8 n=10 n=14 n=8AS-SO4 2.5 1.9 0.70 0.70 0.8 1.8μmol g−1 b0.3–12 b0.3–10 0.16–1.0 0.3–2.4 0.5–1.4 0.3–6.9
n=13 n=15 n=18 n=17 n=20 n=6δ34SAVS −12.6 0.6 −11.2 −12.0 −16.4 −3.7‰ V-CDT −22.1–5.4 −22.6–12.7 −18.5–3.9 −15.0–4.3 −21.5 to −7.1 −15.9–7.4
n=13 n=13 n=8 n=7 n=12 n=9δ34SDI −17.0 −4.4 −19.2 −15.9 −19.3 −11.4‰ V-CDT −24.1–3.1 −24.7–12.4 −25.1 to −13.3 −18.8–3.6 −23.5 to −12.0 −16.5–4.4
n=12 n=14 n=8 n=5 n=14 n=8δ34SAS-SO4 −3.3 −1.9 14.7 15.8 7.3 11.7‰ V-CDT −19.0–1.0 −14.1–13.8 11.0–15.1 10.8–20.1 5.5–12.4 11.7–12.7
n=8 n=8 n=7 n=7 n=14 n=3
Bold typeface=median, AVS=acid-volatile sulfide, DI=disulfide, AS-SO4, acid-soluble sulfate. Statistics for AVS and DI in the IC samples are limited to samples collected below thewater table.
Fig. 5. δ18OH2O-offset relative to chloride in groundwater samples and the five end-member groundwaters at the study site.
461M.L.W. Tuttle et al. / Chemical Geology 265 (2009) 455–467

Author's personal copy
interactions, and possible anthropogenic contributions. The sloughwater is variably evaporated as indicated by the large range in positiveδ18OH2O-offset values (zero to 9.4‰) and in chloride concentrations (0.5–67 mM). Leachate recovered from the Landfill well shows a negativeδ18OH2O-offset (−6 to−4‰) due to methanogenesis, and relatively highchloride concentrations (20–29 mM) resulting from leaching of landfillwastes. Resolution of river water, regional groundwater, and sloughwater on Fig. 5 is difficult because the chloride concentrations overlapand, like water in the slough, river water is susceptible to evaporation.
Our groundwater samples are classified relative to end-membercompositions (Fig. 5). Rainwater, regional groundwater, evaporatedsurface water, landfill leachate, and possibly river water are evidentin samples recovered from the water-table wells. All water samplescollected at IC South have δ18OH2O-offset values between zero and 1,and variable chloride concentrations that are consistent withmixing of infiltrated rain with regional groundwater and (or)river water. Chloride concentrations in the shallowest samples(b0.9 mM) are higher than those measured for rainwater(0.004 mM; Table 1). Chloride is likely added to rain as it infiltratesthe unsaturated zone where the ion may be stored in soil moistureor salts [similar to sulfate] as described in Section 5.2. Theincreased chloride concentrations with depth (Fig. 4) can beexplained by a downward decreasing component of rain mixingwith ambient groundwater.
Groundwater at IC 54 has δ18OH2O-offset values and chlorideconcentrations consistent with a mixture of evaporated sloughwater and regional groundwater (Fig. 5). The absence of a distinctmixing trend is attributed to the complex hydrology at this well. Schollet al. (2005) describes slough water as a mixture of surface runoff anddischarge of shallow groundwater, with a variable contribution ofleachate. At the time of our sampling, there was no evidence ofleachate contamination near the water table at IC 54, but it wasdetected in the deeper 54 well a few meters to the south (Fig. 5;Table 2).
As with water in the upper-most portion of IC South, rainwaterrecharge is apparent in the upper-most portion of IC 36. Dissolvedspecies in these upper-most wells likely are derived from leaching ofions in the unsaturated zone. Deeper wells at IC 36 (below 329.8 melevation) produced water with δ18OH2O-offset values and chlorideconcentrations that are consistent with a mixture of leachate andregional groundwater (Figs. 4 and 5). Leachate contamination in thiswell is consistent with the observation that the well penetratedlandfill trash (Breit et al., 2008).
Samples recovered fromwells at the contaminated saturated-zonesites (SG 38 and SG 40) fall along the regional groundwater-leachatemixing line (Fig. 5). Unfortunately the isotopic compositions of watersamples collected at SG 88 and SG 99 sites were not determined,however, the chemistry of these water samples is very similar to thatof regional groundwater (Table 2; Fig. 5).
5.2. Dissolved sulfate concentration and δ34S
Fig. 6 shows δ34SSO4 values relative to dissolved sulfate concentra-tion (upper X-axis) and the natural logarithm of the measured sulfateconcentration divided by two probable end-member sulfate concen-trations (lower axes that are discussed in this section below). Threedistinct populations are apparent. Most samples (Population 1) havesulfate concentrations between 0.05 and 3 mM, and δ34SSO4 valuesequal to or higher than those measured in Permian rocks within thedrainage basin (8 to 12‰). Population 1 includes all water samplesexcept the four uppermost IC South samples (Population 2) and fourfrom SG 38 and SG 40 (Population 3). Within Population 1, ageneralized trend of increasing δ34SSO4 with decreasing sulfateconcentration is attributed to bacterial sulfate reduction. Population2 (Fig. 6) has intermediate sulfate concentrations (0.2–2 mM) andnegative δ34SSO4 values derived from oxidation of sulfide that is
depleted in 34S. Population 3 has very low sulfate concentrations(b0.02 mM) and δ34SSO4 values consistent with sulfate derived fromPermian bedrock. The sources of sulfate in Populations 2 and 3, andthe processes that modify them, are discussed in greater detail withthe oxygen isotopic composition of the sulfate in Section 5.3.
Bacterial sulfate reduction responsible for the trends in Population1 is dependant on the availability of sulfate, organic matter, and agenerally reducing environment (Ulrich et al., 2003; Harris et al.,2006). The range of initial sulfate concentrations (0.2–3 mM) isdeduced from the intersection of the bounding lines of Population 1(Fig. 6) with the isotopic composition of Permian sulfate. These initialsulfate concentrations are consistent with variable mixing of regionalgroundwater and river water with rainwater recharge (Table 1) andare adequate to support bacterial sulfate reduction within thealluvium (Ulrich et al., 2003). Sources of organic carbon within theCanadian River alluvium include organic matter deposited with thesediment (average of 0.5 wt.%; Breit et al. (2005)), ambient DOC(Table 2), and the high content of DOC in the leachate (Table 2). At thestudy site, reducing conditions are established a few centimetersbelow the water table based on the concentrations of dissolved ironand increase in the content of extractable ferrous iron in the sediment(Breit et al., 2008).
The magnitude of the isotope fractionation of sulfur (fractionationfactor) during bacterial sulfate reduction can be estimated from Fig. 6by applying established principles (Canfield, 2001; Spence et al.,2001). The observed increase in δ34SSO4 with decreasing sulfateconcentration is interpreted to result from kinetic isotope fractiona-tion during bacterial sulfate reduction. The H2S produced is depletedin 34S relative to the residual sulfate reservoir (ΔH2S–SO4). The ΔH2S–SO4
is related to the isotope fractionation factor (α), which is calculatedfrom the Rayleigh equation as follows:
Ro=Rt þ Fð1−1=αÞ;
where Ro and Rt are the 34S/32S of the initial sulfate and residualsulfate reservoirs, respectively, and F is the fraction of sulfate
Fig. 6. δ34SSO4 relative to sulfatemeasured at time of sampling ([sulfate]t) in upper x-axisand, in the lower axes, the natural logarithm of the unreduced fraction of the sulfatereservoir ([sulfate]t/([sulfate]o) considering two end-member initial reservoir concen-trations ([sulfate]o of 0.2 and 3.0mM (see Section 5.2 for explanation)). Populations 1–3are designated. Diagonal bounding lines of Population 1 indicate εH2S–SO4 of −23‰.
462 M.L.W. Tuttle et al. / Chemical Geology 265 (2009) 455–467

Author's personal copy
remaining in the unreduced reservoir ([SO4(t)]/[SO4(o)]). The value forα is estimated as:
α≈ðεH2S–SO4=103Þ þ 1;
where εH2S–SO4 is the isotope enrichment factor calculated as:
εH2S–SO4 ¼ ðδ34SSO4ðtÞ−δ34SSO4ðoÞÞ=ðlnð½SO4ðtÞ�=½SO4ðoÞ�Þ;
and represents the slope of the linear trend in Fig. 6 (lower axes).The εH2S–SO4 for Population 1 is −23‰. This value is similar to the
difference between Permian sulfate (average 10‰) and themedian forall sulfideminerals analyzed in the alluvium (−16‰; Breit et al., 2005,2008). Studies in other alluvial aquifers have reported consistentlyless negative εH2S–SO4 values (−9.7‰, Strebel et al., 1990; −9.8‰,Bottrell et al., 1995; −9.8‰, Spence et al., 2001; and −14 to −16‰,Spence et al., 2005). The more negative εH2S–SO4 value measured inthis study may reflect the higher concentrations of dissolved sulfate,different electron donors, or different sulfate-reducing organisms(Brüchert, 2004; Mangalo et al., 2007).
5.3. Covariance of δ34S and δ18O of dissolved sulfate
The sulfur and oxygen isotopic composition of dissolved sulfate alsodefines three distinct groups of samples that are somewhat differentfrom those defined in Fig. 6. The δ34SSO4 and δ18OSO4 data from thewater-table zone, the river, slough, and the Landfill well are presentedon Fig. 7, where they define three parallel lines of isotope evolutionresulting fromprogressive bacterial sulfate reduction. Data for samplesfrom the river, IC 54, and deeper levels in the IC South well define themiddle line on Fig. 7. The left-most line represents samples from theupper levels of IC South, and the right-most line intersects samplesfrom IC 36, the Landfill well, and the slough. Each of the lines has anorigin represented by the lowest δ34SSO4 and δ18OSO4 values on Fig. 7.These values approximate the isotopic composition of sulfate weath-ering from Early and Lake Permian rocks in the drainage basin(δ34SSO4=10‰ and δ18OSO4=10‰), sulfate derived from oxidation ofauthigenic iron sulfide phases in the alluvium (δ34SSO4=−16‰ andδ18OSO4=10‰), and sulfate released during decomposition of organicmatter (δ34SSO4=8‰ and δ18OSO4=6‰).
Sulfate in the study area originates principally from dissolution ofbedded gypsum in Permian redbeds and enters the alluviumwith riverwater and regional groundwater. The isotopic composition for riverine
sulfate is 12‰ for both δ34SSO4 and δ18OSO4. These values are consistentwith values for gypsum in Late Permianmarine rocks (average δ34SSO4of 12‰ and δ18OSO4 of 10‰; Claypool et al. (1980); Strauss (1997)).Although much of the riverine sulfate dissolved upstream is trans-ported past the study site in the stream channel, some river waterenters the alluvium within the hyporheic zone and over a wider areaduring flood events. Dissolved sulfate in regional groundwater has amedian concentration near 1 mM (NPD well; Table 2). This sulfate isattributed largely toweathering of Early Permian fluvial bedrock in theimmediate vicinity of the study site that contains gypsumwith δ34SSO4values near 8‰ (Schlottmann and Funkhouser, 1991; Ferree et al.,1992; Breit, 1998). The δ18OSO4 for Early Permian sulfate was notdetermined, but is assumed to be similar to that for Late Permiansulfate. The origin for the middle line in Fig. 7 represents the averageisotopic composition for Early and Late Permian sulfate.
Oxidation of iron sulfide in the alluvium (Table 3) is expected toproduce sulfate with negative δ34SSO4 values as observed in the upperwells at IC South (Population 2 in Fig. 6 and left line in Fig. 7). Suchoxidation occurs when the water-table elevation drops exposingformerly saturated sediment to air (Mandernack et al., 2000 andreferences therein). The low δ34SAS-SO4 values measured in manysaturated-zone samples suggest this mechanism has been activethroughout deposition of the alluvium and that sulfate from sulfideoxidation in the past is preserved in authigenic barite within thealluvium (Breit et al., 2005).
The δ18O of sulfate formed by sulfide oxidation records the δ18O ofreactant water and molecular oxygen depending on the specificoxidation reaction (Lloyd, 1967, 1968; Van Stempvoort and Krouse,1994; Spence et al., 2001). A theoretical lower limit for δ18OSO4 valuesassumes that all oxygen in sulfate formed from sulfide comes fromwater molecules. The εSO4–H2O is 0‰ for circumneutral water (Lloyd,1967; Taylor and Wheeler, 1994). Therefore, the expected δ18OSO4
would be −6‰ the δ18OH2O value of ambient groundwater at thestudy site (Schlottmann, 2001; Scholl et al., 2005). Alternatively,molecular oxygen could be the source, particularly in the unsaturatedzone. Sulfate formed by oxidation with O2 would potentially contain12% of the oxygen from water molecules and the balance frommolecular oxygen (δ18OO2=23‰) according to the following reaction(Goldhaber, 1983; Taylor and Wheeler, 1994):
FeS2 þ 7=2O2 þ H2O⇒Fe2þ þ 2SO
2−4 þ 2H
þ:
Using this reaction and isotope enrichment factors for circumneu-tral water (εSO4–O2 of −9‰ and εSO4–H2O of 0‰; Lloyd (1967); TaylorandWheeler (1994)), the calculated δ18OSO4 would be 11‰. This valueis close to the 10‰ suggested as the initial starting composition byextrapolation of the left-most linear trend in Fig. 7 to the medianδ34SFeSx value of −16‰. The similarity of the extrapolated andcalculated δ18OSO4 values suggests that the complexities inherent inthe O2 oxidation pathway (Goldhaber, 1983) are accounted for in thegeneral oxidation reaction above. Ulrich et al. (2003) demonstratedthat O2 is an important oxidant in Canadian River alluvium usingresults from laboratory studies. These findings, however, contrast withrecent work by Bottrell et al. (2008) that found similar negativeδ34SSO4 values, but also negative δ18OSO4 values in sulfate produced bysulfide oxidation in alluvial ‘drift’ deposits. These results implyanaerobic oxidation of sulfide, indicating that sulfide oxidationmechanisms can be highly variable in relatively similar settings.
The isotopic compositions of sulfate that define the right line onFig. 7 are interpreted to indicate the contribution of sulfate fromdecomposition of organic matter. The initial isotopic values for thisline are defined by values in groundwater from the uppermost port ofIC 36, which has the δ34SSO4 value of Permian sulfate (10‰), but aδ18OSO4 value (6‰), which is lower by nearly 4‰ relative to Permiansulfate. The decrease in δ18OSO4 is thought to represent an incorpora-tion of water oxygen during release of sulfur during organic-matter
Fig. 7. δ18OSO4 relative to δ34SSO4 for groundwater from ICwells, four of the groundwaterend members (no δ34SSO4 available for rain), and projected isotopic composition ofsulfate prior to bacterial sulfate reduction (“initial” composition, see Section 5.3 forexplanation). Water from NPD represents regional groundwater and, from the Landfillwell, leachate. See Section 5.1 for explanation of recharge and leachate.
463M.L.W. Tuttle et al. / Chemical Geology 265 (2009) 455–467
Author's personal copy
decomposition. Probable sources of organic matter include decayingvegetationwithin and on the alluvium, and trash buried in the landfill.The ground surface around IC 36 is covered with vegetation includingthick grasses on the landfill mounds and large deciduous trees nearby.Grass at IC 36 has a δ34S of 9.4‰ and leaf fall is expected to be similar.Such organic matter decomposes in the soil on top of the alluvium aswell as when buried during flood events. The concentration ofdissolved sulfate at IC 36 depicted in Fig. 4 could be derived fromdecomposition of as little as 0.26 g of plant matter cm−2, an amountconsistent with seasonal observations at the site. In addition to thecycling of organic matter on the land surface, a significant portion ofthe trash in the landfill includes yard waste from the city of Norman(Fagin, unpublished data). This waste largely originated from plantsgrown on the Early Permian rocks that dominate the surficial geologyin the city. The DOC released to groundwater during leachateformation contains about 2 wt.% sulfur (Leenheer, personal commu-nication). The δ34S expected for this organosulfur is in the 8 to 12‰range for Permian sulfate.
Organosulfur compounds such as ester sulfates and amino acidsare recognized as important components of terrestrial sulfatereservoirs (Fitzgerald,1976; King and Klug,1980; Freney andWilliams,1983; Gélineau et al., 1989; Mayer et al., 1995; Vairavamurthy et al.,1995; Mandernack et al., 2000; Gooddy et al., 2002; Stögbauer et al.,2004; Einsiedl and Mayer, 2005; Schiff et al., 2005; Schroth et al.,2007; Szynkiewicz et al., 2008). Ester sulfates are generally consideredthe most labile form of organic sulfur and can function as a sulfate‘buffer’ in the alluvium (Edwards, 1998). Sulfate derived fromhydrolysis of ester sulfates is expected to retain three oxygen atomsfrom the original sulfate incorporated into the organic matter (likelylocal Permian sulfate with δ18OSO4 value near 10‰) and acquires oneoxygen atom fromwater during hydrolysis (King and Klug, 1980). Theδ18OSO4 produced in this manner would be 6‰ (Fig. 7), which isconsistent with the projected initial value of the right line on Fig. 7.Sulfate derived from decomposition of carbon-bonded sulfur such asin amino acids would contain more oxygen from water resulting in alower δ18OSO4 value. Nonetheless, some contribution from carbon-bonded sulfur cannot be ruled out.
Not all of the samples expected to contain sulfate derived fromorganic-matter decomposition conform to the right-most evolutionline on Fig. 7. Many of the samples from IC 36 plot between themiddleand right lines (Fig. 7). The distribution of these samples reflectsmixing of sulfate in regional groundwater and sulfate in leachate.Mixing is also supported with other compositional attributes of theseintermediate samples (Fig. 5).
Although kinetic sulfur isotope fractionation during bacterialsulfate reduction is well documented, processes responsible forisotope fractionation of sulfate-bound oxygen are still debated.According to results from some studies (Lloyd, 1967; Mizutani andRafter, 1969), the linearity of Canadian River alluvium data and theslope of lines near 0.25 (Fig. 7) result from kinetic isotopefractionation of oxygen that parallels the kinetic isotope fractionationof sulfur. Other studies support the kinetic isotope fractionation ofoxygen during reduction, and attribute variations in the slope toenvironmental factors (Strebel et al., 1990; Mandernack et al., 2000;Aharon and Fu, 2003). An alternative interpretation proposes that theincrease of δ18OSO4 is due to exchange of oxygen isotopes bound tosulfate with ambient water oxygen. This exchange is facilitated byback reaction (oxidation) of reduced sulfur intermediates formedduring bacterial sulfate reduction (Mizutani and Rafter, 1973; Fritzet al., 1989; Van Stempvoort and Krouse, 1994; Brunner et al., 2005;Knöller et al., 2006; Mangalo et al., 2007; Wortmann et al., 2007).Proponents of the oxygen isotope exchange hypothesis propose thatthe initial slope of the isotopic trend is a product of variable mixingratios of sulfate sources, sulfate reduction rates, δ18O of the ambientwater, and equilibrium isotope fractionation factors, and as reductionnears completion, δ18OSO4 asymptotically will approach the value
predicted for equilibrium isotope fractionation between sulfateoxygen and water oxygen.
The distinct isotope trends for each sulfate source identified inFig. 7 enable testing of the kinetic and equilibrium isotope fractiona-tion models for evolution of sulfate oxygen with progressive bacterialsulfate reduction. The intermediate reduction line in Fig. 7 asympto-tically approaches a constant δ18OSO4 value of 21‰ when δ34SSO4values are greater than 50‰. This δ18OSO4 value is that predicted forequilibrium isotope fractionation as sulfate oxygen exchanges withwater oxygen (δ18OH2O=–6‰), using an estimated fractionationfactor for 17 °C of 27‰ (Fritz et al., 1989). Reduction of sulfate formedby oxidation of sulfide or decomposition of organic matter (Fig. 7) donot demonstrate a similar level of equilibrium, because thesereservoirs are small and mix with the larger Permian sulfate reservoirbefore extensive bacterial sulfate reduction occurs. The parallel natureof isotopic evolution of the sulfate sources during the initial stages ofreduction (Fig. 7), however, supports similar isotope fractionation inall reservoirs.
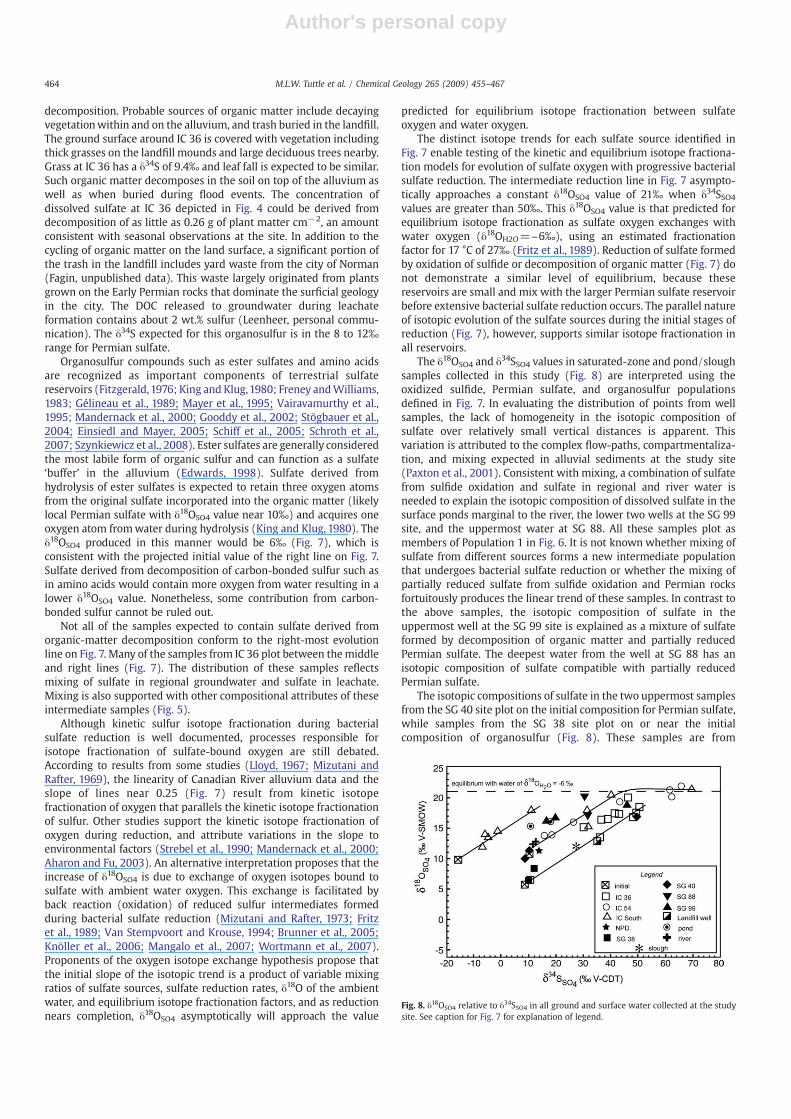
The δ18OSO4 and δ34SSO4 values in saturated-zone and pond/sloughsamples collected in this study (Fig. 8) are interpreted using theoxidized sulfide, Permian sulfate, and organosulfur populationsdefined in Fig. 7. In evaluating the distribution of points from wellsamples, the lack of homogeneity in the isotopic composition ofsulfate over relatively small vertical distances is apparent. Thisvariation is attributed to the complex flow-paths, compartmentaliza-tion, and mixing expected in alluvial sediments at the study site(Paxton et al., 2001). Consistent with mixing, a combination of sulfatefrom sulfide oxidation and sulfate in regional and river water isneeded to explain the isotopic composition of dissolved sulfate in thesurface ponds marginal to the river, the lower two wells at the SG 99site, and the uppermost water at SG 88. All these samples plot asmembers of Population 1 in Fig. 6. It is not known whether mixing ofsulfate from different sources forms a new intermediate populationthat undergoes bacterial sulfate reduction or whether the mixing ofpartially reduced sulfate from sulfide oxidation and Permian rocksfortuitously produces the linear trend of these samples. In contrast tothe above samples, the isotopic composition of sulfate in theuppermost well at the SG 99 site is explained as a mixture of sulfateformed by decomposition of organic matter and partially reducedPermian sulfate. The deepest water from the well at SG 88 has anisotopic composition of sulfate compatible with partially reducedPermian sulfate.
The isotopic compositions of sulfate in the two uppermost samplesfrom the SG 40 site plot on the initial composition for Permian sulfate,while samples from the SG 38 site plot on or near the initialcomposition of organosulfur (Fig. 8). These samples are from
Fig. 8. δ18OSO4 relative to δ34SSO4 in all ground and surface water collected at the studysite. See caption for Fig. 7 for explanation of legend.
464 M.L.W. Tuttle et al. / Chemical Geology 265 (2009) 455–467
Author's personal copy
contaminated alluvium and contain very low sulfate concentrations(Population 3, Fig. 6) attributed to complete reduction of sulfate inregional groundwater during mixing with leachate. The low concen-trations of sulfate measured in the samples must have been addedsubsequent to this extensive sulfate reduction based on the similarityof δ34SSO4 values to initial values for Permian sulfate and organosulfur.The origin of the Permian sulfate in the two SG 40 samples is likelydetrital barite in the alluvium that would have a Permian isotopiccomposition. Dissolution of detrital barite was shown to occur in thealluvium containing low sulfate concentrations (Ulrich et al., 2003).Because the amount of sulfate in Population 3 samples is below thatneeded to maintain bacterial sulfate reduction (Ulrich et al., 2003;Harris et al., 2006), the isotopic signature of the initial sulfate source isunmodified. In contrast, organically derived sulfate in the lower-mostSG 40 sample contained sufficient sulfate to support bacterialreduction (Fig. 8).
Sulfate extracted from water in the slough is isotopically verysimilar to sulfate from the Landfill well (Fig. 8). The indication ofdominance by organic sulfur is consistent with the abundance oforganic matter produced in this highly productive wetland environ-ment. Although water recovered from IC 54 is expected to reflectrecharge from the slough, none of the sulfate samples from this wellindicate an organosulfur component (Fig. 8). This may reflect acontrast in conditions at the times the slough (2002) and IC 54 (2004–2005) were sampled, or the dilution of organic-derived sulfate byPermian sulfate in regional groundwater or river water.
6. Conclusion
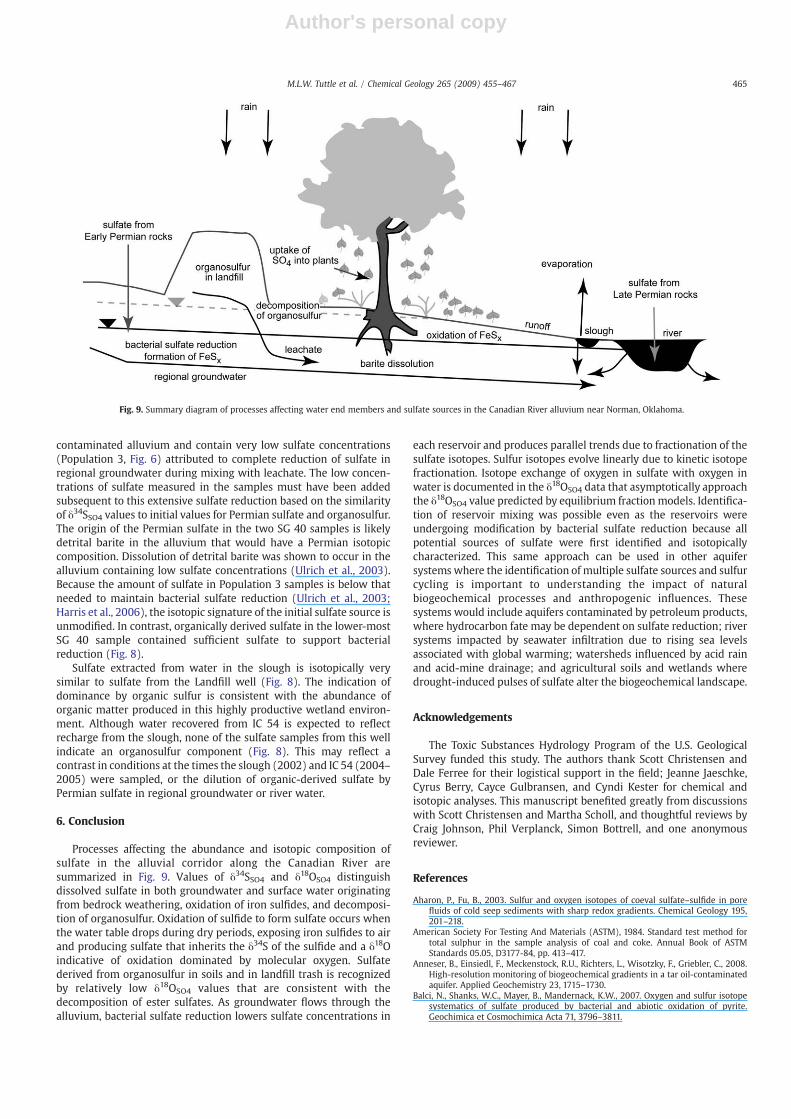
Processes affecting the abundance and isotopic composition ofsulfate in the alluvial corridor along the Canadian River aresummarized in Fig. 9. Values of δ34SSO4 and δ18OSO4 distinguishdissolved sulfate in both groundwater and surface water originatingfrom bedrock weathering, oxidation of iron sulfides, and decomposi-tion of organosulfur. Oxidation of sulfide to form sulfate occurs whenthe water table drops during dry periods, exposing iron sulfides to airand producing sulfate that inherits the δ34S of the sulfide and a δ18Oindicative of oxidation dominated by molecular oxygen. Sulfatederived from organosulfur in soils and in landfill trash is recognizedby relatively low δ18OSO4 values that are consistent with thedecomposition of ester sulfates. As groundwater flows through thealluvium, bacterial sulfate reduction lowers sulfate concentrations in
each reservoir and produces parallel trends due to fractionation of thesulfate isotopes. Sulfur isotopes evolve linearly due to kinetic isotopefractionation. Isotope exchange of oxygen in sulfate with oxygen inwater is documented in the δ18OSO4 data that asymptotically approachthe δ18OSO4 value predicted by equilibrium fraction models. Identifica-tion of reservoir mixing was possible even as the reservoirs wereundergoing modification by bacterial sulfate reduction because allpotential sources of sulfate were first identified and isotopicallycharacterized. This same approach can be used in other aquifersystems where the identification of multiple sulfate sources and sulfurcycling is important to understanding the impact of naturalbiogeochemical processes and anthropogenic influences. Thesesystems would include aquifers contaminated by petroleum products,where hydrocarbon fate may be dependent on sulfate reduction; riversystems impacted by seawater infiltration due to rising sea levelsassociated with global warming; watersheds influenced by acid rainand acid-mine drainage; and agricultural soils and wetlands wheredrought-induced pulses of sulfate alter the biogeochemical landscape.
Acknowledgements
The Toxic Substances Hydrology Program of the U.S. GeologicalSurvey funded this study. The authors thank Scott Christensen andDale Ferree for their logistical support in the field; Jeanne Jaeschke,Cyrus Berry, Cayce Gulbransen, and Cyndi Kester for chemical andisotopic analyses. This manuscript benefited greatly from discussionswith Scott Christensen and Martha Scholl, and thoughtful reviews byCraig Johnson, Phil Verplanck, Simon Bottrell, and one anonymousreviewer.
References
Aharon, P., Fu, B., 2003. Sulfur and oxygen isotopes of coeval sulfate–sulfide in porefluids of cold seep sediments with sharp redox gradients. Chemical Geology 195,201–218.
American Society For Testing And Materials (ASTM), 1984. Standard test method fortotal sulphur in the sample analysis of coal and coke. Annual Book of ASTMStandards 05.05, D3177-84, pp. 413–417.
Anneser, B., Einsiedl, F., Meckenstock, R.U., Richters, L., Wisotzky, F., Griebler, C., 2008.High-resolution monitoring of biogeochemical gradients in a tar oil-contaminatedaquifer. Applied Geochemistry 23, 1715–1730.
Balci, N., Shanks, W.C., Mayer, B., Mandernack, K.W., 2007. Oxygen and sulfur isotopesystematics of sulfate produced by bacterial and abiotic oxidation of pyrite.Geochimica et Cosmochimica Acta 71, 3796–3811.
Fig. 9. Summary diagram of processes affecting water end members and sulfate sources in the Canadian River alluvium near Norman, Oklahoma.
465M.L.W. Tuttle et al. / Chemical Geology 265 (2009) 455–467

Author's personal copy
Basharmal, M., 1985. Isotopic composition of aqueous sulphur at landfill sites. M.Sc.Thesis, University of Waterloo, Waterloo Ontario.
Becker, C.J., 2002. Hydrology and leachate plume delineation at a closed municipallandfill, Norman, Oklahoma. U.S. Geological Survey Water Resources InvestigationsReport 01-4168.
Berner, Z.A., Stüben, D., Leosson, M.A., Klinge, H., 2002. S- and O-isotopic character ofdissolved sulphate in the cover rock aquifers of a Zechstein salt dome. AppliedGeochemistry 17, 1515–1528.
Böttcher, M.E., Smock, A.M., Cypionka, H., 1998. Sulfur isotope fractionation duringexperimental precipitation of iron(II) and manganese(II) sulfide at roomtemperature. Chemical Geology 146, 127–134.
Bottrell, S.H., Hayes, P.J., Bannon, M., Williams, G.M., 1995. Bacterial sulfate reductionand pyrite formation in a polluted sand aquifer. Geomicrobiology Journal 13,75–90.
Bottrell, S., Tellam, J., Bartlett, R., Hughes, A., 2008. Isotopic composition of sulfate as atracer of natural and anthropogenic influences on groundwater geochemistry in anurban sandstone aquifer, Birmingham, UK. Applied Geochemistry 23, 2382–2394.
Brand, W.A., Coplen, T.B., Aerts-Bijma, A.T., Böhlke, J.K., Gehre, M., Geilmann, H.,Gröning, M., Jansen, H.G., Meijer, H.A.J., Mroczkowski, S.J., Qi, H., Soergel, K., Stuart-Williams, H., Weise, S.M., Werner, R.A., 2009. Comprehensive inter-laboratorycalibration of reference materials for δ18O versus VSMOW using various on-linehigh-temperature conversion techniques. Rapid Communications in Mass Spectro-metry 23, 999–1019.
Breit, G.N., 1998. The diagenetic history of Permian rocks in the Central OklahomaAquifer. In: Christenson, J.S., Scott, Havens (Eds.), Ground-water Quality Assess-ment of the Central Oklahoma Aquifer, Oklahoma: Results of Investigations. U.S.Geological Survey, pp. 45–61. Water Supply Paper 2357-A.
Breit, G.N., Tuttle, M.L.W., Cozzarelli, I.M., Christenson, S.C., Jaeschke, J.B., Fey, D.L., Berry,C.J., 2005. Results of the chemical and isotopic analyses of sediment and water fromalluvium of the Canadian River near a closedmunicipal landfill, Norman, Oklahoma.U.S. Geological Survey Open-File Report 2005-1091.
Breit, G.N., Tuttle, M.L.W., Cozzarelli, I.M., Berry, C.J., Christenson, S.C., Jaeschke, J.B.,2008. Results of the chemical and isotopic analyses of sediment and ground waterfrom alluvium of the Canadian River near a closed municipal landfill, Norman,Oklahoma, part 2. U.S. Geological Survey Open-File Report 2008-1134.
Brimblecombe, P., 2003. The global sulfur cycle. In: Holland, H.D., Turekian, K.K. (Eds.),Treatise on Geochemistry, vol. 8. Elsevier, New York, pp. 645–686.
Brüchert, V., 2004. Physiological and ecological aspects of sulfur isotope fractionationduring bacterial sulfate reduction. In: Amend, J.P., Edwards, K.J., Lyons, T.W. (Eds.),Sulfur Biogeochemisry—Past and Present. InThe Geological Society of America,Boulder, pp. 1–16.
Brunner, B., Bernasconi, S.M., Kleikemper, J., Schroth, M.H., 2005. A model for oxygenand sulfur isotope fractionation in sulfate during bacterial sulfate reductionprocesses. Geochimica et Cosmochimica Acta 69, 4773–4785.
Canfield, D.E., 2001. Biogeochemistry of sulfur isotopes. In: Valley, J.W., Cole, D.R. (Eds.),Stable Isotope Geochemistry. In: Reviews in Mineralogy & Geochemistry, vol. 43.Mineralogical Society of America, Washington, D.C., pp. 607–636.
Claypool, G.E., Holser, W.T., Kaplan, I.R., Sakai, H., Zak, I., 1980. The age curves of sulfurand oxygen isotopes in marine sulfate and their mutual interpretation. ChemicalGeology 28, 199–260.
Coplen, T.B., Hopple, J.A., Böhlke, J.K., Peiser, H.S., Rieder, S.E., Krouse, H.R., Rosman, K.J.R.,Ding, T., Vocke, R.D., Révész, K.M., Lamberty, A., Taylor, P., De Bièvre, P.D., 2002.Compilation of minimum and maximum isotope ratios of selected elements innaturally occurring terrestrial materials and reagents. U.S. Geological SurveyWater-Resources Investigations Report 01-4222.
Cozzarelli, I.M., Suflita, J.M., Ulrich, G.A., Harris, S.H., Scholl, M.A., Schlottmann, J.L.,Christenson, Scott, 2000. Geochemical and microbiological methods for evaluatinganaerobic processes in an aquifer contaminated by landfill leachate. EnvironmentalScience and Technology 34, 4025–4033.
Curtis, J.A., Whitney, J.W., 2003. Geomorphic and hydrologic assessment of erosionhazards at the Norman Municipal Landfill, Canadian River floodplain, CentralOklahoma. Environmental and Engineering Geoscience 9, 241–252.
Dogramaci, S.S., Herczeg, A.L., Schiff, S.L., Bone, Y., 2001. Controls on δ34S and δ18O ofdissolved sulfate in aquifers of the Murray Basin, Australia and their use asindicators of flow processes. Applied Geochemistry 16, 475–488.
Edwards, P.J., 1998. Sulfur cycling, retention and mobility in soil: a review. United StatesDepartment of Agriculture General Technical Report NE-250.
Einsiedl, F., Mayer, B., 2005. Sources and processes affecting sulfate in a karsticgroundwater system of the Franconian Alb, Southern Germany. EnvironmentalScience and Technology 39, 7118–7125.
Ferree, D.M., Christenson, S.C., Rea, A.H., Mesander, B.A., 1992. Ground-water qualityassessment of the Central Oklahoma aquifer, Oklahoma; hydrologic, water-quality and quality-assurance data 1987–90. U.S. Geological Survey Open-FileReport, pp. 92–461.
Fitzgerald, J.W., 1976. Sulfate ester formation and hydrolysis: a potentially important yetoften ignored aspect of the sulfur cycle of aerobic soils. Bacteriological Reviews 40,698–721.
Freney, J.R., Williams, C.H., 1983. The sulphur cycle in soil. In: Ivanov, M.V., Freney, J.R.(Eds.), The Global Biogeochemical Sulphur Cycle. InJohn-Wiley, New York, pp.129–201.
Fritz, P., Basharmal, G.M., Drimmie, R.J., Ibsen, J., Qureshi, R.M., 1989. Oxygen isotopeexchange between sulphate and water during bacterial reduction of sulphate.Chemical Geology 79, 99–105.
Gélineau, M., Carignan, R., Tessier, A., 1989. Study of the transit of sulfate in a CanadianShield lake watershed with stable oxygen isotope ratios. Applied Geochemistry 4,195–201.
Goldhaber, M.B., 1983. Experimental study of metastable sulfur oxyanion formationduring pyrite oxidation at pH 6–9 and 30 °C. American Journal of Science 283,193–217.
Gooddy, D.C., Clay, J.W., Bottrell, S.H., 2002. Redox-driven changes in porewaterchemistry in the unsaturated zone of the chalk aquifer beneath unlined cattle slurrylagoons. Applied Geochemistry 17, 903–921.
Harris Jr., S.H., Istok, J.D., Suflita, J.M., 2006. Changes in organic matter biodegradabilityinfluencing sulfate reduction in an aquifer contaminated by landfill leachate.Microbial Ecology 51, 535–542.
Holser, W.T., Kaplan, I.R., 1966. Isotope geochemistry of sedimentary sulfates. ChemicalGeology 1, 93–135.
Janzen, H.H., Ellert, B.H., 1998. Sulfur dynamics in cultivated, temperate agroecosystems.In: Maynard, D.G. (Ed.), Sulfur in the Environment. InMarcel Dekker Inc., New York,pp. 11–44.
Johnson, K.S., 1989. Geologic evolution of the Anadarko basin. In: Johnson, K.S. (Ed.),Anadarko Basin Symposium, 1998: Oklahoma Geological Survey Circular, vol. 90,pp. 3–12.
Kaplan, I.R., Rittenberg, S.C., 1964. Microbiological fractionation of sulfur isotopes.Journal of General Microbiology 34, 195–212.
King, G.M., Klug, M.J., 1980. Sulfhydrolase activity in sediments of Wintergreen Lake,Kalamazoo County, Michigan. Applied and Environmental Microbiology 39,950–956.
Knöller, K., Vogt, C., Richnow, H., Weise, S., 2006. Sulfur and oxygen isotopefractionation during benzene, toluene, ethyl benzene, and xylene degradation bysulfate-reducing bacteria. Environmental Science & Technology 40, 3879–3885.
Krouse, H.R., 1980. Sulphur isotopes in our environment. In: Fritz, P., Fontes, J.Ch. (Eds.),Handbook of Environmental Isotope Geochemistry. InElsevier Scientific PublishingCompany, Amsterdam, pp. 435–545.
Krouse, H.R., Mayer, B., 2000. Sulphur and oxygen isotopes in sulfate. In: Cook, P.G.,Herczeg, A.L. (Eds.), Environmental Tracers in Subsurface Hydrology. InKluwerAcademic Publishers, Boston, pp. 195–231.
Lloyd, R.M., 1967. Oxygen-18 composition of oceanic sulphate. Science 156, 1228–1231.Lloyd, R.M., 1968. Oxygen isotope behavior in the sulfate–water system. Journal of
Geophysical Research 73, 6099–6110.Lucius, J.E., Bisdorf, R.J., 1995. Results of geophysical investigations near the
Norman, Oklahoma, Municipal Landfill, 1995. U.S. Geological Survey Open-FileReport, pp. 95–825.
Mandernack, K.W., Lynch, L., Krouse, H.R., Morgan, M.D., 2000. Sulfur cycling inwetlandpeat of the New Jersey Pinelands and its effect on stream water chemistry.Geochimica et Cosmochimica Acta 64, 3949–3964.
Mangalo, M., Meckenstock, R.U., Stichler, W., Einsiedl, F., 2007. Stable isotopefractionation during bacterial sulfate reduction is controlled by reoxidation ofintermediates. Geochimica et Cosmochimica Acta 71, 4161–4171.
Massmann, G., Tichomirowa, M., Merz, C., Pekdeger, A., 2003. Sulfide oxidation andsulfate reduction in a shallow groundwater system (Oderbruch Aquifer, Germany).Journal of Hydrology 278, 231–243.
Mayer, B., Feger, K.H., Giesemann, A., Jäger, J., 1995. Interpretation of sulfur cycling intwo catchments in Black Forest (German) using stable sulfur and oxygen isotopedata. Biogeochemistry 30, 31–58.
Mizutani, Y., Rafter, R.A., 1969. Oxygen isotopic composition of sulphates: part 4.Bacterial fractionation of oxygen isotopes in the reduction of sulphate and in theoxidation of sulphur. New Zealand Journal of Science 12, 60–67.
Mizutani, Y., Rafter, R.A., 1973. Isotopic behavior of sulphate oxygen in the bacterialreduction of sulphate. Geochemical Journal 6, 183–191.
Murphy, F., Herkelrath, W.N., 1996. A sample-freezing drive shoe for a wire line pistoncore sampler. Ground Water Monitoring and Remediation 16, 86–90.
Nakai, N., Jensen, M.L., 1964. The kinetic isotope effect in bacterial reduction andoxidation of sulfur. Geochimica et Cosmochimica Acta 28, 1893–1912.
Novák, M., Vile, M.A., Bottrell, S.H., Stepanová, M., Jacková, I., Buzek, F., Prechová, E.,Newton, R., 2005. Isotope systematics of sulfate–oxygen and sulfate–sulfur in sixEuropean peatlands. Biogeochemistry 76, 187–213.
Otero, N., Canals, À., Soler, A., 2007. Using dual-isotope data to trace the origin andprocesses of dissolved sulphate: a case study in Calders stream (Llobregat basin,Spain). Aquatic Geochemistry 13, 109–126.
Otero, N., Soler, A., Canals, À., 2008. Controls of δ34S and δ18O in dissolved sulphate:learning from a detailed survey in the Llobregat River (Spain). AppliedGeochemistry 23, 116–1185.
Paxton, S.T., Marston, R.A., Collins, K.L., Pickup, B.E., Dehay, B., Christenson, S., 2001.Potential for subsurface contaminant transport in floodplains adjacent to municipallandfills. Geological Society of America Annual Meeting, Boston, Abstracts, p. A424.
Price, F.T., Shieh, Y.N., 1979. Fractionation of sulfur isotopes during laboratory synthesisof pyrite at low temperatures. Chemical Geology 27, 245–253.
Qian, J., Mopper, K., 1996. Automated high performance, high temperature combustiontotal organic carbon analyzer. Analytical Chemistry 68, 3090–3097.
Rice, C.A., Tuttle, M.L., Reynolds, R., 1993. The analysis of forms of sulfur in ancientsediments and sedimentary rock: comments and cautions. Chemical Geology 107,83–95.
Schiff, S.L., Spoelstra, J., Semkin, R.G., Jeffries, D.S., 2005. Drought induced pulses of SO42−
from a Canadian shield wetland: use of δ34S and δ18O in SO42− to determine sources
of sulfur. Applied Geochemistry 20, 691–700.Schlottmann, J.L., 2001. Water chemistry near the closed Norman Landfill, Cleveland
County, Oklahoma. U.S. Geological Survey Water-Resources Investigations Report00-4238.
Schlottmann, J.L., Funkhouser, R.A., 1991. Chemical analysis of water samples andgeophysical logs of cored test-holes drilled in the Central Oklahoma Aquifer,Oklahoma. U.S. Geological Survey Open-File Report 91-464.
466 M.L.W. Tuttle et al. / Chemical Geology 265 (2009) 455–467

Author's personal copy
Schlottmann, J.L., Scholl, M.A., Cozzarelli, I.M., 1999. Identifying ground-water andevaporated surface–water interactions near a landfill using deuterium, 18oxygen,and chloride, Norman, Oklahoma. In: Morganwalp, D.W., Buxton, H.T. (Eds.), U.S.Geological Survey Toxic Substances Hydrology Program—Proceedings of theTechnical Meeting, Charleston, South Carolina, March l8–12, 1999. InU.S. GeologicalSurvey, pp. 509–520. Water-Resources Investigations Report 99-4018C.
Scholl, M.A., Christenson, S.C., 1998. Spatial variation in hydraulic conductivitydetermined by slug tests in the Canadian River alluvium near the Norman Landfill,Norman, Oklahoma. U.S. Geological Survey Water-Resources Investigations Report97-4292.
Scholl, M.A., Christenson, S.C., Cozzarelli, I.M., Ferree, Dale, Jaeschke, J., 2005. Rechargeprocesses in an alluvial aquifer riparian zone, Norman landfill, Norman, Oklahoma,1998–2000. U.S. Geological Survey Scientific Investigations Report 2004–5238.
Scholl, M.A., Cozzarelli, I.M., Christenson, S.C., 2006. Recharge processes drive sulfatereduction in an alluvial aquifer contaminated with landfill leachate. Journal ofContaminant Hydrology 86, 239–261.
Schroth, A.W., Bostick, B.C., Graham, M., Kaste, J.M., Mitchell, M.J., Friedland, A.J., 2007.Sulfur species behavior in soil organic matter during decomposition. Journal ofGeophysical Research 112, G04011. doi:10.1029/2007JG000538.
Seal, R.R., Alpers, C.N., Rye, R.O., 2000. Stable isotope systematics of sulfate mineral.In: Alpers, C.N., Jambor, J.L., Nordstrom, D.K. (Eds.), Sulfate Minerals: Crystal-lography, Geochemistry, and Environmental Significance. In: Reviews in Miner-alogy & Geochemistry, vol. 40. Mineralogical Society of America, Washington, D.C.,pp. 551–602.
Shanley, J.B., Mayer, B., Mitchell, M.J., Michel, R.L., Bailey, S.W., Kendall, C., 2005. Tracingsources of streamwater sulfate during snowmelt using S and O isotope ratios ofsulfate and 35S activity. Biogeochemistry 76, 161–185.
Spence, M.J., Bottrell, S.H., Thornton, S.F., Lerner, D.N., 2001. Isotopic modeling of thesignificance of bacterial sulphate reduction for phenol attenuation in a contami-nated aquifer. Journal of Contaminant Hydrology 53, 285–304.
Spence, M.M., Bottrell, S.H., Thornton, S.F., Richnow, H.H., Spence, K.H., 2005.Hydrochemical and isotopic effects associated with petroleum fuel biodegradationpathways in a chalk aquifer. Contaminant Hydrology 79, 67–88.
Stögbauer, A., Berner, Z., Stüben, D., 2004. Redox control on the isotopic composition ofdissolved sulfate in percolating sewage—an experimental study. Acta HydrochimicaHydrobiologica 32, 304–315.
Strauss, H., 1997. The isotopic composition of sedimentary sulfur through time.Palaeogeography, Palaeoclimatology, Palaeoecology 132, 97–118.
Strebel, O., Böttcher, J., Fritz, P., 1990. Use of isotope fractionation of sulfate–sulfur andsulfate–oxygen to assess bacterial desulfurication in a sandy aquifer. Journal ofHydrology 121, 155–172.
Szynkiewicz, A., Modelska, M., Jedroysek, M.O., Mastalerz, M., 2008. The effect of acidrain and altitude on concentration, δ34S, and δ18O of sulfate in the water fromSudety Mountains, Poland. Chemical Geology 249, 36–51.
Taylor, B.E., Wheeler, M.C., 1994. Sulfur- and oxygen-isotope geochemistry of acid minedrainage in the western United States: field and experimental studies revisited. In:Alpers, C.N., Blowes, D.W. (Eds.), Environmental Geochemistry of Sulfide Oxidation.In: ACS Symposium Series, vol. 500. American Chemical Society, Washington D.C.,pp. 481–514.
Theodorakes, P.M., d'Angelo, W.M., Ficklin, W.H., 2002. Fluoride, chloride, nitrate andsulfate in aqueous solution utilizing autosuppression chemically suppressed ionchromatography. In: TaggartJr. Jr., J.E. (Ed.), Analytical Methods for ChemicalAnalyses of Geologic and Other Materials. InU.S. Geological Survey. U.S. GeologicalSurvey Open-file Report 02-223, Chapter V.
Toran, L., Harris, R.F., 1989. Interpretation of sulfur and oxygen isotopes in biological andabiological sulfide oxidation. Geochimica et Cosmochimica Acta 53, 2341–2348.
Tuttle, M.L., Goldhaber, M.B., Williamson, D.L., 1986. An analytical scheme fordetermining forms of sulfur in oil shales and associated rocks. Talanta 33, 953–961.
Ulrich, G.A., Breit, G.N., Cozzarelli, I.M., Suflita, J.M., 2003. Sources of sulfate supportinganaerobic metabolism in a contaminated aquifer. Environmental Science andTechnology 37, 1093–1099.
Vairavamurthy, M.A., Orr, W.L., Manowitz, B., 1995. Geochemical transformations ofsedimentary sulfur; an introduction. In: Vairavamurty, M.A., Schoonen (Eds.),Geochemical Transformations of Sedimentary Sulfur. InAmerican Chemical Society,Washington, DC, pp. 1–14.
VanStempvoort, D.R., Krouse,H.R.,1994. Controls ofδ18O in sulfate: reviewofexperimentaldata and application to specific environments. In: Alpers, C.N., Blowes, D.W. (Eds.),EnvironmentalGeochemistryof SulfideOxidation. In: ACSSymposiumSeries, vol. 500.American Chemical Society, Washington D.C., pp. 446–480.
Wasserman, M.D., Rye, R.O., Bethke, P.M., Arribas Jr., A., 1992. Methods for Separationand Total Stable Isotope Analysis of Alunite. U.S. Geological Survey. Open-FileReport 92-9.
Whittemore, D.O., 2002. Recharge changes along rivers crossing the High Plains aquifer.Geological Society of America Abstracts with Programs 34 (6), 98.
Wortmann, U.G., Chernyavsky, B., Bernasconi, S.M., Brunner, B., Böttcher, M.E., Swart,P.K., 2007. Oxygen isotope biogeochemistry of pore water sulfate in the deepbiosphere: dominance of isotope exchange reactions with ambient water duringmicrobial sulfate reduction (ODP Site 1130). Geochimica et Cosmochimica Acta 71,4221–4232.
467M.L.W. Tuttle et al. / Chemical Geology 265 (2009) 455–467