process techniques study of integrated circuits interim ...
209
* C5-1471.12/501 PROCESS TECHNIQUES STUDY OF INTEGRATED CIRCUITS INTERIM SCIENTIFIC REPORT NO. 1 James E. Meinhard May 1968 Distribution of this report is provided in the interest of information exchange and should not be construed as endorsement by NASA of the material presented. Responsibility for the contents resides with the organi- zation that prepared it. Prepared under Contract No. NAS 12-4 by NORTH AMERICAN ROCKWELL CORPORATION Anaheim, California Electronics Research Center NATIONAL AERONAUTICS AND SPACE ADMINISTRATION
-
Upload
khangminh22 -
Category
Documents
-
view
0 -
download
0
Transcript of process techniques study of integrated circuits interim ...

*
C5-1471.12/501
PROCESS TECHNIQUES STUDY OF INTEGRATED CIRCUITS
INTERIM SCIENTIFIC REPORT NO. 1
James E. Meinhard
May 1968
Distribution of this report is provided in the interest of information exchange and should not be construed as endorsement by NASA of the material presented. Responsibility for the contents resides with the organi- zation that prepared it.
Prepared under Contract No. NAS 12-4 by NORTH AMERICAN ROCKWELL CORPORATION
Anaheim, California
Electronics Research Center
NATIONAL AERONAUTICS AND SPACE ADMINISTRATION

Seymour Schwartz Technical Monitor
NAS 12-4
Electronics Research Center 575 Technology Square
Cambridge, Mas sachuset ts 0 2 139
Requests for copies of this report should be referred to:
NASA Scientific and Technical Information Facility P. 0. Box 33, College Park, Maryland 20740

C5-1471.12/501
PROCESS TECHNIQUES STUDY OF INTEGRATED CIRCUITS
INTERIM SClE TIFIC REPORT
BY
James E. Meinhard
May 1968
Prepared under Contract No. NAS 12-4 by NORTH AMERICAN ROCKWELL CORPORATION
Anaheim, California
Electronics Research Center
NATIONAL AERONAUTICS AND SPACE ADMINISTRATION


CONTENTS
Summary . . . . . . . . . . . . . . . . . Introduction . . . . . . . . . . . . . . . .
Objectives . . . . . . . . . . . . . . . Redefinitions of Objectives . . . . . . . . . . .
Current Problems in Planar Technology . . . . . . . . . Activities Completed . . . . . . . . . . . . . .
Failure Mechanisms Related to Oxide Passivation . . . Failure Mechanisms Associated with Packaging . . . . Failure Mechanisms in Heteroepitaxial Systems . . . Scribe and Break Damage . . . . . . . . . . . Nonuniform Diffusion Doping . . . . . . . . . . Failure Analysis Service . . . . . . . . . . . Instrumental Capability Profile . . . . . . . . .
Continuing Activities . . . . . . . . . . . . . . Failure Mechanisms Related to Oxide Passivation (Statement
of WorkItem 15) . . . . . . . . . . . . . Failure Mechanisms Associated with Packaging (Statement
of Work Item 16) . . . . . =
Instrumental Capability Profile (Statement of Work Item 17)
. . .
. . .
. . . . . .
. . .
. . .
. . . . . . . . . . . . . . . . . . . . .
. . .
. . .
. . . . . .
' 1
* 3
. 3
. 4
. 5
- 7
0 7 - 8 0 9 . 9 - 9 . 1 0
. 1 1
9 1 1
28 29
Conclusions . . . . . . . . . . . . . . . . . . . . 37
References . . . . . . . . . . . . . . . . . . . . . 45
Appendix A . Hydrogen Isotope Investigation of Passivation Silicon Oxides 47
AppendixB . InversionHardening : TechBrief 67-10176 . * . 55
Appendix C . EPR Investigation of Thermally GrownSiOa . . . . . . . 57
Appendix D . Electron Spin Resonance Spectra of Impurities and Oxidation States in Thermally Grown Silicon Dioxide . . . . 91
Appendix E . Factors Influencing Dielectric Defects in Silicon Oxide Layers . 93
Appendix F . Investigation of Methods for the Detection of Structural Defects in Silicon Oxide Layers . . . . . . . . . . . . . 113
Appendix G . Electrograph Method for Locating Pinholes in Thin Silicon Dioxide Films . . . . . . . . . . . . . . . . 135
iii

CONTENTS (Con t)
Appendix H. Evidence of Mechanical Stress a s a Cause of Dielectric Defects in Silicon Dioxide Layers . . . . . .
Appendix I. Thermodynamic Analysis of Ambient Gas Effects . . Appendix J. F ina lRepor tonCaseNo. CQF-101 . . . . . . Appendix K. Instrumental Capability Profile . . . . . . . Appendix L. Measurement of Compressive Stress in Oxide Layers
Appendix M. Effect of Hydrogen on Integrated Circu i t Performaiice
New Technology Appendix . . . . . . . . . . .
Page -
. . . 143
. . . 147
. . . 161
. . . 175
* . 189
. * . 191
. . * 199
iv

Figure
1 . 2 . 3 . 4 . 5 . 6 . 7 . 8 . 9 .
A-1 . A-2 . c.1 . c.2 . c-3 . c.4 . c.5 . C.6 . c.7 . C.8 . c.9 .
c.10 . c- 11 . c.12 . C.13 . C.14 . C.15 . 6.16.
C.17 . C.18 .
ILLUSTRATIONS
Electron Photomicrograph of Replica of an Oxide of Defect (Black Region). Approximate Length: Twelve Microns . . . . . . . . High Temperature HC1 Etching Test ..................... Electrophoretically Decorated Wafer of Very High Oxide Defect Density (see Appendix F) ........................ Defects a s a Function of Oxidation Time for Various Stress Conditions ................................. Defects a s a Function of Oxide Thickness for Various Stress Conditions .................................. Oxide Defects a s a Function of Growth for Oxidatively Precleaned Wafers ................................. Oxide Thickness Dependence on Time for Treated and Untreated Wafers ................................. Comparison of Oxidative Precleaning With Nonoxidative Precleaning Plus Initial Slow Growth . . . . . . . . . . . . . . . . . . . . Decay of Oxide Defects - The Firs t 1000 A Under Various Treatments ..................................... Interaction of Water With Silicon (Schematic) . . . . . . . . . . . . . . . Silicon Wafer Oxidation Equipment (Schematic) . . . . . . . . . . . . . . Schematic Model of Some Defects in a Two-Dimensional Model of the Silicon Dioxide Network ......................... E PR Sample Preparations ........................... Block Diagram of the Varian V-4502 EPR Spectrometer Systems . . Discovery of Second Signal o r Silicon Dioxide Grown Wet by Convection Method . . . . . . . . . . . . . . . . . . . . . . . . . . . . Sample A Showing Second Signal at 20 C . . . . . . . . . . . . . . . . . . Sample MA. W at -160 C . . . . . . . . . . . . . . . . . . . . . . . . . . . . . Sample MA. EW at -150 C Showing How Second Signal Is Brought Out by Increased Gain . . . . . . . . . . . . . . . . . . . . . . . . . Second Signal a t -160 C ............................. Sample A Going From -164 C to -70 C . . . . . . . . . . . . . . . . . . . Sample A Going From -50 C to +40 C .................... Line Shape Calculations ............................. Resonance Spectra of Silicon Dioxide Sample (M' + NaC1) W at Temperatures Between -180 C and +lo0 C . . . . . . . . . . . . . . . Sample (T + NaOH) W at -180 C ........................
Page
13 14
15
16
17
2 1
22
25
26 54 54
58 61 63
64 66 68
69 70 7 1 7 1 73
76 79
Sample (M'W + HF) at T . -180 C ........................ 79 Small Second Signal a t -180 C Detected From Oxide Grown Dry on Silicon That Had Been Contaminated With NaCl . . . . . . . . 80 Second Signal of Oxide Treated by H F Shown a t -180 C Under Room Ambient and Then Under Small Vacuum . . . . . . . . . . . . . . . 8 1 Spectra of Single Crys ta l Silicon With the Aluminum on Oxide Partially Dissolved by HC1 . . . . . . . . . . . . . . . . . . . . . . . 84 Possible Impurity Structure and Oxidation States in S . 0 2 . . . . . . . 86
1
V

I LLUSTRATIONS (Cont)
Figure .-
Page
Defect Density Variation in Virgin Thermal Oxide . . . . . . . . . . . . 95 Comparison of Defect Densities in Grown. Etched Back. andRegrownOxides . . . . . . . . . . . . . . . . . . . . . . . . . . . 97 Defect Density vs Thickness Variation With Oxidation Temperature . . . . . . . . . . . . . . . . . . . . . . . . . . . . . . 99 Comparison of Thermal Expansion Characteristics 105 Impurity Profiles in Oxidized Silicon Wafe r s . . . . . . . . . . . . . . . 107 Postulated Boron Distributions in Thermally Grown Oxides . . . . . 107 Electrophoretic Decoration Test Assembly . . . . . . . . . . . . . . . . . 115 Oxide Defect Decoration After Fluid
Photograph of Decoration and Cu Radiation From Electron Beam Microprobe of the Decoration . . . . . . . . . . . . . . . 116 Sequential Electrophoretic Decoration of the Same Wafer . . . . . . . 118 Trapped Gas Pattern Under Gelatin Film . . . . . . . . . . . . . . . . . . 119 Electrochemical Autograph Assembly . . . . . . . . . . . . . . . . . . . . 119 Oxide Openings Displayed by Electrochemical Autograph Technique . . . . . . . . . . . . . . . . . . . . . . . . . . . . . . . 121 Metallization Pattern for Dielectric Breakdown Test 124 Top: Wafer Photographed by Electric Field Excitation; Bottom: Same Wafer Treated by Electrophoretic Decoration Method . . . . . . . . . . . . . . . . . . . . . . 126 Oxide Defect Before (Top) and After Electrophoretic Decoration Test (Bottom) . . . . . . . . . . . . . . . . . . . . . . . . . . . . 127 Electrograph Assembly Diagram . . . . . . . . . . . . . . . . . . . . . . . 138 Electrograph of Silicon Wafe r Containing Etched Microcircuitry Patterns . . . . . . . . . . . . . . . . . . . . . . . . . . . . . 138 One of Individual Integrated Circuits of the Electrograph of Figure 2 Showing Pinhole Location . . . . . . . . . . . 139 Replica Electron Micrograph of Oxide Anomaly Located
Etching of Silicon Dioxide With 0 . 5 Percent Hydrofluoric Acid . . . . . . . . . . . . . . . . . . . . . . . . . . . . . . . . . 141 Oxide Defect Decorations on Silicon Wafer Specimen No . 4 of Table H-1 . . . . . . . . . . . . . . . . . . . . . . . . . . . . . . . . 144 Etch Pit in Silicon (center) and Surrounding Structure . . . . . . . . . 144 Lot N o . 435. Part No . 03698 . . . . . . . . . . . . . . . . . . . . . . . . . . 163 Part No . 03698. Lot No . 435 . . . . . . . . . . . . . . . . . . . . . . . . . . 163 Par t No . 00156. Lot No . 439 . . . . . . . . . . . . . . . . . . . . . . . . . . 164 Par t No . 03748. Lot No . 435 . . . . . . . . . . . . . . . . . . . . . . . . . . 166 Part No . 00653. Lot N o . 438 . . . . . . . . . . . . . . . . . . . . . . . . . . 166
Evaporation . lOOX . . . . . . . . . . . . . . . . . . . . . . . . . . . . . . . . 115
by Means of the Electrograph Method . . . . . . . . . . . . . . . . . . . . 139
E.1 . E.2 . E.3 . E.4 . E.5 . E.6 . F.1 . F.2 . F.3 . F.4 . F.5 . F.6 . F.7 . F.8 . F.9 .
F- 10 . G.1 . G.2 . G-3 . .
G.4 . 6.5 . H.1 . H.2 . J- 1 . 5.2 . 5.3 . 5.4 . 5.5 .
vi

ILLUSTRATIONS (Cunt)
Figure
J.6 . 5.7 .
. 5.8 . J.9 .
J.10 . J.11 . 5.12 . 5.13 . M.1 . M.2 . M.3 . M.4 . M.5 . M.6 . M.7 .
-ge
Part No . 03740. Lot No . 437 . . . . . . . . . . . . . . . . . . . . . . . . 167 Part No . 03741. Lot No . 435 . . . . . . . . . . . . . . . . . . . . . . . . 167 Part No . 00630. Lot No . 438 . . . . . . . . . . . . . . . . . . . . . . . . 168 Part No . 00653. Lot No . 438 . . . . . . . . . . . . . . . . . . . . . . . . 168 Part No . 01065. LotNo . 439 . . . . . . . . . . . . . . . . . . . . . . . . 169 Pa r tNo . 01065. LotNo . 439 . . . . . . . . . . . . . . . . . . . . . . . . 169 Part No . 01221. Lot No . 432 . . . . . . . . . . . . . . . . . . . . . . . . 170 Lead Bond Tensile Tester . . . . . . . . . . . . . . . . . . . . . . . . . . 170
192 Behavior of Two Surviving Units in 15-Percent Hydrogen Ambient . . . . . . . . . . . . . . . . . . . . . . . . . . . . . . . 193 High Temperature Failure of Emitter-to-Pad Metallizationa . a 194 IC's Mounted on Platen . . . . . . . . . . . . . . . . . . . . . . . . . . . . 195
196
Integrated Circuitry Mounted on Paper Platen . . . . . . . . . . . . .
Insertion of Test Specimens Into Environmental Chamber . . . . . Environmental 'rest Assembly . . . . . . . . . . . . . . . . . . . . . . . 196
Temperatures . . . . . . . . . . . . . . . . . . . . . . . . . . . . . . . . . . 197 Effects of Vacuum and Forming Gas on Beta at Elevated
vii

Table
TABLES
Page . I .
I1 . 111 .
IV . A.1 . A.2 . A.3 . A.4 . A.5 . A.6 .
B.1 . c.1 . c.2 . c.3 . c.4 . E.1 . E.2 . E.3 . E.4 . E .5 . F.1 . .F. 2 .
H.1 . 1.1 . 1.2 . 1.3 .
J.l . J -2 5.3 . 5.4 . 5.5 . J.6 . 5.7 . 5.8 . L.1 .
Oxide Defect Decay Factors . . . . . . . . . . . . . . . . . . . . . . . . 18 Full Stress Defect Densities in Oxidatively Precleaned Wafers . . 19 Defect Densities as a Function of Pretreatments and GrowthRate . . . . . . . . . . . . . . . . . . . . . . . . . . . . . . . . . 23 Comparison of Various Leak Test Techniques . . . . . . . . . . . . . . 32 Tritium Activity in Oxide Derived From 100 mc/Gram Water . . . 48 Tritium Activity in Oxide Derived From 1 Curie/Gram Water . . . 49 Tritium Exchange With Humid Environment . . . . . . . . . . . . . . 50 Stability of Tritium Labeled Passivation Oxide . . . . . . . . . . . . . 50 Beta Activity Versus Counting Orientation . . . . . . . . . . . . . . . . 51 Inversion Recovery Kinetics of Hydrated and Deuterated Transis tors . . . . . . . . . . . . . . . . . . . . . . . . . . . . . . . . . . 52 Inversion Hardening of 2N2412 Small Signal P N P Transistors . . . 55 Silicon Material Parameters of Samples Used for Oxide Growth . . 59 Special Sample Treatments . . . . . . . . . . . . . . . . . . . . . . . . . 60 EPR Sample Data and Results . . . . . . . . . . . . . . . . . . . . . . . . 75 Signal Summary for Si-Si02 System . . . . . . . . . . . . . . . . . . . 87 Effect of Moisture on Defect Density . . . . . . . . . . . . . . . . . . . 96 Silicon Surface Preparation . . . . . . . . . . . . . . . . . . . . . . . . . 98 Substrate Impurities and Oxidation Conditions . . . . . . . . . . . . . . 100 Effect of Substrate Dopant and Oxidation Conditions on Dielectric Defect Densities in Si0 Layers . . . . . . . . . . . . . . . 101 Comparison of Defect Density (cm2-2 Among Processors . . . . . 102 Dielectric Breakdown v s Decorated Defect Density . . . . . . . . . . 124 Occurrence of Dielectric Defects and Mechanical Stress in Oxide as a Function of Processing . . . . . . . . . . . . . . . . . 129 Oxide Dielectric Defects Located by Electrophoretic Decoration . . 145 Thermodynamic Values for Ambient Gases (2) (3) . . . . . . . . . . . 148 Thermodynamic Values for Ambient Solids (2) (3) (4) . . . . . . . . . 149 Chemical Reactions for Process Introduced Ambient Gases at Gas-Solid Interfaces in Packaged Integrated Circuits . . . . . . 151 Voids Observed by X-Radiography in Sample CQF-101 . . . . . . . 162 Gross Leak Failures . . . . . . . . . . . . . . . . . . . . . . 164 Electrical Failures . . . . . . . . . . . . . . . . . . . . . . . . . . . . . . 165 Dynamic Electrical Failures . . . . . . . . . . . . . . . . . . . . . . . . . 165 Post Data Yield Strength Data . . . . . . . . . . . . . . . . . . . . . . . 171 Pad Bond Yield Strength Data . . . . . . . . . . . . . . . . . . . . . . . . . 172 Moisture Content of Selected Devices . . . . . . . . . . . . . . . . . . . 172 Gas Contents of Selected Devices . . . . . . . . . . . . . . . . . . . . . . 173 Correlation of Defect Densities With Oxidation and Stress . . . . . . 190
viii

Process Techniques Study of Integrated Circuits
By James E. Meinhard
Autonetics Division of North American Rockwell Corporation
Anaheim, California
SUMMARY
The purpose of this program is to investigate and resolve some of the dominant problems of modern planar technology, particularly those tending to impede its evolu- tion into a large scale integration and ultimate reliability. A further purpose is to provide instrumental support services to NASA-ERC in failure analysis and instrumental capabilities. Categories of investigation are as follows:
Investigational Activities:
1. 2.
Failure Mechanisms Related to Oxide Passivation. Failure Mechanisms Associated with Packaging.
Services:
1. 2. Instrumental Capability Profile.
Failure Analysis Service and Consultation.
Past program activities on oxide passivation have provided insights into the origin of atomic species contributing to inversion and the origin of dielectric defects. Current activities are concentrated primarily on the latter problem where it has been shown that most of the dielectric defects in oxide layers are developed during the cooling of wafers after oxidation and follow an exponential decay with increasing oxide thickness. Current experimepts show that diffusion bar r ie rs introduced prior to oxidation, o r other means for slowing initial growth, tend to reduce virtual defect densities.
Previous packaging investigations have been confined to gas ambient studies in which the effects of hydrogen and of water were evaluated on the performance of various transistor samples. The program has been extended to other failure problems of importance to packaging as well as to environmental studies on integrated circuits. The present report summarizes the results obtained on exposing groups of integrated circuits to various ambient conditions. Effects of hydrogen are found to be non-specific and are deleted from further investigations on bipolar planar devices.
been completed.
program, a current version of which appears in the present report. associated with the leak testing of integrated circuit packages are discussed.
Rockwell Corporation Autonetics Division Document Number C5-1471.12/501.
Failure analysis on Case Number CQF-101; comprising 89 npn transistors has
An initial instrumental capability profile was provided at an early stage of this Problems
Reproduction of this report has been referenced informally by North American
1

2

INTRODUCTION
Objectives
The primary objective of the investigations under Contract NAS 12-4 has been, from its inception, the development of advanced process techniques for the fabrication of high reliability silicon integrated circuits. This objective initially was formulated under two task items. The first item called attention to an instrumental investigation of planar processing techniques, with special emphasis on device surfaces, for the purpose of discovering and correcting failure modes in the following seven categories:
1. Effects- of gas ambients during fabrication
2. Effects of t races of materials deposited during fabrication
3. Application of photoresist and photoetch techniques
4. Processing of the oxide
5. Scribing
6 . Contact attachment
7 . Effects of contact between the processing tools and the wafer during fabricat ion.
The second item formulated specific studies relating to interactions between the silicon and the highly insulating material in contact with it, and to the effects of such interactions on integrated circuit performance, including long t e rm drift, which i s of major concern in extended space missions.
The broad area of activity covered by this statement of work was made so deliberately, to provide flexibility in the attack on emerging problems in a rapidly advancing field, such as those relating to large scale integration, and to provide latitude in the assessment of the relative importance of such problems so that the work could be directed at all times to meaningful ends. A further advantage of this philosophy lay in the opportunity it afforded in the full utilization of the considerable instrumental capabilities and interdisciplinary skills of Autonetics without risking compartmentalization in specific areas. This type of approach is indeed necessary in dealing with a technology as complex and sensitive to minor perturbations as silicon planar processing. The broad approach also brings to bear Autonetics exten- sive operations and industrial knowledge viewpoint on reliability problems, a factor which is crucial to its satisfactory performance on major contracts with the Government. As a result, the massive records and compilations of data developed on previous component reliability programs have been accessible to serve as guidelines for investigations under the present program.
3

Redefinitions of Objectives
A s work progressed, however, objectives w e r e crystallized in certain areas and phased out in others, either because a satisfactory conclusion had been reached o r because a solution to the problem had been reached within the industry itself. In general, these new Statement of Work items were drawn to more specific areas which could, however, still be categorized within the broader range first formulated, the intent being to reflect more precisely the content of current program activities and to provide a formal mechanism for support of new and important problem investigations. A case in point i s the shift of major attention from the problem of sodium and hydrogen ions in silicon dioxide, which was being successfully attacked by Carlson at Texas Instruments, and others, to the equally ubiquitous but much less well understood problem of oxide dielectric defects, progress in the understanding of this important problem, particulariy in view of its antecedent significance to the success of large scale integration.
It i s indeed gratifying to be able to report sound
In time, however, the rate of accumulation of new task items began to exceed their rate of completion. The apparent resulting extension of available personnel over many areas was, to a certain extent, exaggerated because of the presence of a certain degree of overlap among some items. While this attested to the consistency of the overall program it also created a somewhat over-ambitious picture of the activities undertaken which could lead to a potential dilution of accomplishment. Con- sequently the objectives of the program were redrawn into four categories of investigation as follows:
Investigational Activities:
1. 2.
Failure Mechanisms related to Oxide Passivation Failure Mechanisms associated with Packaging
Services:
1. 2. Instrumental Capability Profile.
Failure Analysis Service and Consultation
These categories reflect the overall purpose of the program, which is to investigate some of the dominant problems confronting planar technology and to seek solutions to these problems, as well as to provide NASA-ERC with instrumental support and consulting services. At the same time the reporting format was changed to reflect more clearly the resulting program consolidation.
In accordance with the principles stated above, previous accomplishments on contract NAS 12-4 are reviewed in this report in the context of the overall program objectives adopted in the original Statement of Work, and in subsequently adopted task items, as well as in relation to the current technological problems listed in the section below. The relevancy of each activity is thereby established, Documents evidencing these accomplishments a re included in the Appendixes.
4

CURRENT PROBLEMS IN PLANAR TECHNOLOGY
The need for high reliability in the complex electronic systems required for space missions has motivated a significant investigation into the physical nature of failure in electronic devices. The necessity of such a study is a consequence of the rapid commercial exploitation of solid-state technology founded on the available understanding of the essential physics, chemistry, metallurgy, and crystallography. Consequently, the technology has evolved largely on a liberal application of empirical techniques in the development of manufacturing processes, leaving many gaps in the knowledge of atomic and molecular mechanisms capable of causing parameter drift or abrupt failures in devices. Such deficiencies necessarily have led to the frequent introduction of incompletely defined process changes for the improvement of reliability, performance specifications, and yields without recognition of many con- sequences of these perturbations on succeeding process steps and ultimate device performance. ~
Frequently the current literature offers over-optimistic solutions to current problems. A critical analysis of such reports often reveals claims that are either unsupportable or out of the context of present technology and lacking in the documen- tation necessary to produce hardware for systems use. Considering the number and variety of process treatments required for the manufacture of a single device it is not surprising, therefore, that the foregoing situation of conflicting data and over- optimistic evolutionary claims is currently a problem area.
In the list of problems that follows no attempt is made to give an exhaustive survey or to accommodate current process innovations of promise, such as beam lead technique o r stacked layer technique. Autonetics' current interaction with electronic component suppliers and its commit- ment to developing sources of highly reliable devices.
The list is derived essentially from
1. Cracked die
2. Unsatisfactory gross leak test of packages (see below)
3. Oxide dielectric defects
(Note: Items 1, 2, and 3 reflect a significant proportion of the failure modes currently prevailing in components utilized by Autonetics).
4.
5 .
6.
7 .
Sonobonding, aluminum/aluminum.
Packaging: leads are too long, often broken.
HFE degradation under reverse bias. Degradation increases with temperature and is aggravated in shallow diffused devices.
Inferior heat sink: produces local overheating which may contribute to hFE degradation, mass transport of metallization (see item 10) and, by heat- induced mechanical stress, cracked die.
5

8. Packaging: lack of hermeticity allows ingress of contamination, such as sodium, Entrance of moisture may produce lead corrosion (see below).
9. Corrosion of leads in an environment of 85 percent relative humidity at 85 F. Contamination and electrochemical effects are implicated.
M a s s transport in conductors due to high current density. This is a self diffusion phenomenon, severe in aluminum but minimal in molybdenum/ gold conductors. Advanced technology may have to abandon aluminum in some types of planar devices. In other types improvements in heat sink combined with more massive metallization may suffice.
10.
,
The above list is considered to represent existing dominant problems of integrated circuit technology. concepts are introduced and various problems are overcome. requirements demanded of its major manufactured products Autonetics of necessity must maintain a continuing awareness of these problems, and seek solutions therefor, as they arise. Consistency i s thus clearly evident between the concerns of Autonetics regarding the procurement and analysis of high reliability components and program objectives under Contract NAS 12-4. Accomplishments under this contract are discussed in the following section.
The list undoubtedly will change as new processing Because of the reliability
6

ACTIVITIES COMPLETED
Failure Mechanisms Related t o Oxide Passivation
Tasks completed in this area or discontinued for priority reasons, include the Statement of Work Items 1,2,3,6,7,8,9,10,11,12. Tasks remaining are re-defined in continuing Item 15. Accomplishments and continuing efforts are discussed under the two general categories of inversion and dielectric defects.
Inversion model investigation. - The objectives of this investigation were to employ isotopic t racers to determine the contribution of mobile positive ions to inversion and to use EPR spectrometry to discover whether oxygen vacancies are present and potentially able to. participate in inversion. A t the time the original proposal was prepared no definitive experimental evidence existed capable of distinguishing between the positive ion model and the oxygen vacancy model. It was believed that more exact knowledge of the mobile species causing inversion would provide a basis for a solution to the inversion problem. Subsequently a number of investigators demon- strated electromigration of sodium ions through oxide layers, and precautions taken to exclude sodium from processing environments were found to yield devices more resistant to inversion. The general improvements due to sodium control made logical a decreasing emphasis in this area on Contract NAS 12-4. results have been accomplished on this program and were presented at an Electro- chemical Society Meeting (Appendix A) in 1966.
The following
Entrapment of hydrogen in thermal oxide grown in a moist ambient was demonstrated by using tritium tracer of 1000 millicuries/gram specific activity in the process gas and counting the weak beta activities in the resulting oxide samples. The oxides were found to contain approximately 1017 atoms of hydrogen/cm3 oxide. The oxide beta activities were stable over a long period ot time, showing little or no tendency to exchange with atmospheric water. A later experiment by Burgess and Fowkes using a much lower specific activity gave a value of 1020 H atoms/cm3, a result that was found to be experimentally unrepeatable on Contract NAS 12-4. The essential objective of the investigation was achieved, however, and later sub- stantiated by the work of others. Hofstein (Ref. 1) has since demonstrated the con- tribution of hydrogen ions to drift instability in MOS devices.
Sodium ion occurrence in the oxide was investigated by neutron activation anal s i s of specimens from the tritium tracer runs. 101zatoms/cm3 were found. This result was in substantial agreement with those of Carlson, and others, and the investigation was closed.
Sodium levels in the range of
Deuterated planar transistors were selected for inversion study with the initial intention of detecting electrochemically liberated deuteruim in the package ambient by mass spectrometry. A positive result would implicate hydrogen ion transport in inver- sion. Following the availability of the tritium tracer results, however, calculations showed that the available deuterium, even if completely freed, would be beyond the limit of mass spectrometric detection. The deuterated transistors then were
7

investigated through their activation energies of recovery from inversion. A difference between them and comparable hydrated transistors again would indicate hydrogen ion participation. An apparent difference between the two sets of trans- istors indeed was observed initially but was not substantiated in later experiments because repeated inversions and deinversions produced changes in the activation energies. Although the original objective was thereby thwarted the changes observed were in the direction of increasing inversion resistance and led to a proposed process innovation of "inversion hardening" by thermal and bias cycling (Appendix B), later published as Tech Brief 67-10176. the achievement of this result.
The activity in this area was terminated with
The electron paramagnetic resonance experiments were performed on thermally grown silicon dioxide to investigate the oxygen vacancy model. Resonance data were taken on many samples grown wet or dry under varying conditions of temperature, ambient, and chemical contamination. Three resonance signals were detected from these oxides. One was from hydrogen entrapment and another from a possible electrode reaction between aluminum and the oxide that has been postulated to generate oxygen vacancies by Burkhardt at IBM. The third signal was shown to be related to both sodium and fluorine retention in the oxide. A detailed report of this, work i s given in Appendix C.
A further accomplishment in this area of effort was the preparation and delivery of a paper on the subject a t the American Physical Society Summer Meeting, Seattle, Washington, 31 August to 2 September, 1967. An abstract of this paper is given in Appendix D.
Oxide dielectric defect investigation. - Most aspects of this investigation con- stitute a continuing effort and will be dealt with in detail in the "Continuing Activities" section of the report. Accomplishments include a paper delivered in 1966 (Appendix E) which evolved from ear l ier investigations (Appendix F) (Appendix G). A short technical note relating defect incidence with thermally induced mechanical stress (Appendix H) also has been prepared.
Failure Mechanisms Associated with Packaging
Tasks completed in this area, o r discontinued because of a lack of conclusive results, are identified as Statement of Work Items l-a, 4, and 13. The bulk of the work in this area has been directed toward an evaluation of the effects of hydrogen ambients on the performance of integrated circuits, partly because of various, and sometimes conflicting, reports of such effects and partly because analytical results at Autonetics frequently have disclosed the presence of hydrogen in integrated circuit packages. However, a significant degradative effect due to hydrogen was not found, and efforts to induce such an effect w e r e abandoned. A further result of this program was a thermodynamic analysis of ambient gas effects (Appendix I) on materials normally present in packaged devices which corroborated the above results with respect to hydrogen interaction with silicon, silicon dioxide, aluminum, and aluminum oxide. the packaging art and are the subject of investigation under continuing Statement of Work Item 16. A more detailed report of this activity therefore is deferred to the section on "Continuing Activities".
Nevertheless, materials compatibility problems continue to plague
8

Failure Mechanisms in Heteroepitaxial Systems
Action in this area, which was specified under Statement of Work Item 5 and designated as a low priority effort, was not taken. This decision followed an analysis of the potential impact of silicon on sapphire, and other hetero systems, on the immediate future of integrated circuit technology. It was concluded that the somewhat primitive state-of-the art, compared with conventional planar technology, would render highly uncertain the selection of meaningful device reliability problems for study ,
Scribe and Break Damage
Activities in this area were specified under Statement of Work Items l-e, 4, and 13 and were terminated after brief investigation. gation was to determine by defect etching or X-ray topographic techniques to what extent normal scribing operations introduced crystal damage capable of propagating into adjacent device areas. It was suspected that damage from this source could give rise to cracked dice during breaking operations or subsequent steps, such as packaging and lidding. If a correlation of this sor t could be found, at least one origin of the cracked die problem could be recognized and corrected.
The objective of this investi-
Scribe damage was investigated by etch-pit count technique but no evidence of defect propagation into surrounding lightly doped areas was found. The investigation was repeated at a later data but the highest observed total etch width was less than 0.004 in. in confirmation of earlier results. Although these results scarcely can be regarded as conclusive it was tentatively decided that scribe damage would constitute, at most, only a sporadic source of cracked dice.
Nonuniform Diffusion Doping
Effort in this area was covered by Statement of Work Items l-ab and 13 and, although not dealt with in a conclusive fashion, was terminated after obtaining essentially negative results from a brief analysis of one potential source of difficulty. The objective of this investigation was to determine whether incomplete mixing of input gas compositions employed in diffusion steps led to persistent concentration gradients a t wafer surfaces and nonhomogeneous doping. If such an effect were found to be present it would indicate a requirement for a process modification, such as a baffle system, to assure complete mixing, or a means to assure uniform wafer exposure as, for example, by mechanical wafer rotation. Calculations showed, however, that complete mixing occurs in the first 4 in. of furnace tube. Because the unoccupied input tube section employed by most processors is three to four times this distance it was concluded that incomplete vapor phase mixing was not a sub- stantial source of doping irregularities and the invesitgation was abandoned, It is recognized, however, that nonuniform doping is a continuing problem and may become a deterrent to the development of large scale integration after other more pressing problems are resolved.
9

Failure Analysis Service
This service was defined in Statement of Work Item 14 and was terminated with the completion of the analysis of 89 npn transistors comprising Case Number CQF-101 (Appendix J). The objective of this service was to examine, on request, state-of-the- art components for inhomogeneities arising from process techniques. These analyses were to be performed in detail on components important to the Failure Mechanisms Branch, Qualifications and Standards Laboratory, NASA-ERC. This effort con- stituted a support function which was expected to reveal hitherto unsuspected inade- quacies associated with fabrication steps as well as to characterize salient reliability problems peculiar to components from specific sources. Component anomalies were examined by established failure mechanism techniques from which performance predictions could be derived appropriate to the long te rm reliability and environmental requirements applicable to NASA missions.
In s t rume nt a 1 C apa bi 1 ity Profile
This activity was sponsored originally under Statement of Work Items 1,4 , and 13 which have been terminated in favor of a more specific redefinition of the effort under continuing Item 17. The objective of this effort is to apprise NASA-ERC of optimum instrumentation and test sequences from which maximum insight into failure mechanisms may be gained. Original tabulations were presented in the second Monthly Report and Quarterly Report Number One, giving instrumental capability ranges, applications to failure mode and failure mechanism investigation, and references to pertinent process steps. been presented in succeeding reports. Continuing efforts in this area a re intended to ensure the awareness of NASA-ERC of current instrumental innovations for extracting maximum failure information. This is being accomplished through periodic updating of previous compilations, the most recent of which was compiled during the current year (Appendix K).
,
Supplementary instrumental data have
A further objective of this effort i s to supply NASA-ERC with critical reviews and analyses of current test techniques, A prominent problem area presently exists in the leak testing of hermetically sealed packages which is summarized under the Continuing Activities section.
10

CONTl NU1 NG ACTlV lTl ES
Failure Mechanisms Related to Oxide Passivation (Statement of Work Item 15)
The occurrence of dielectric defects, or "pinholes", constitutes a significant failure mode in modern oxide-passivated devices and is probably the largest remaining barr ier to large scale integration. Although numerous remedial innova- tions in materials and process techniques have been attempted, no reliable solution to this problem has yet been found. of thermally grown oxide for most masking and passivating purposes, and because this application of silicon dioxide has been successfully optimized in most other respects, it seems important to take full advantage of these characteristics by determining the process requirements needed to remove this remaining major problem in its use. The objectives of this effort, therefore, are to discover why structural defects are produced in thermally grown oxides and to learn how they may be preve nte d .
Because of the general convenience and superiority
Previous activity on this program has sought to relate the origin of dielectric defects to various process factors and structural considerations. These results may be summarized as follows:
1. Factors tending to increase dielectric defects
a. Extended processing (generally) b. c. d. Superficial H F etching e. Abrupt oxide steps f. Thermal cycling g. Mechanical wiping h.
Higher compressive stress in the oxide Embedded lapping grains in the substrate
Removal of back oxide layers
2. Factors tending to decrease dielectric defects
a. b. c. d. e.
Growth of oxide to higher thicknesses Chemical etch of initial wafer Pyrolytic oxide, uniformly applied and properly densified Additives tending to reduce bond strain in silica glass Addition of steam to oxidation process gas, or termination of any dry oxidation step with a wet oxidation
3. Factors having little or no effect on defect incidence:
a. b. c. Oxide growth rate
Wafer cooling rates after oxidation Mineral content of water used as steam source
11

d. Substrate doping (generally) e. f.
Crystal defects (dislocations and stacking faults) Certain non-reactive particulate contaminants (such as alumina) which do not stick to the oxide during growth
Electron photomicrographs (Figure 1) show pile-ups of oxide layers at defect sites, thereby indicating compressive stress in the oxide as the major cause of defects. This idea was confirmed by comparing oxide defect densities existing at the oxidation temperature with those existing after cooling. Briefly, the technique con- sists of terminating an oxidation with a short HC1 etch which attacks any exposed silicon (Figure 2), producing an etch pit at each defect site. After cooling the addi- tional defects @re located by electrophoretic decoration (Figure 3). In an oxide layer grown to 8000A the ratio of defect densities before and after cooling was found to be 1:195 (Appendix H). Most of the above findings have been reported previously (Appendixes E and F) and all are consistent with the compressive stress model advanced as the originating agency of oxide defects.
The approaches to continued investigation on this program consist of examining in detail the inhomogeneities in oxide distribution evidently present at the initial stages of oxidation using the techniques described above, that a significant number of defects may exist at the processing temperature after only a brief oxidation period, thus predisposing oxides to a distribution of thin spots at later stages of oxidation. the compressive s t ress produced on cooling and that the remainder constitute the latent defect si tes opened up by light etching in hydrofluoric acid, postulated that if initial oxidation irregularities could be removed through appropriate process control the finished oxide layers would be free of thin spots and capable of withstanding the existing stresses without rupture.
I
Experiments have shown
It is postulated that a portion of these thin spots yield to
It i s further
More quantitative investigations were conducted to compare defect densities at no stress (i. e., before cooling), at full stress (i. e., after cooling) and at partial stress relief (i. e., after removal of the back oxide layer), These data were obtained for a series of oxidation times to yield growth dependent plots as typified in Figures 4 and 5. Conventional oxide growth technique was used (N2: 245 cc/min; 02: 245 cc/ min passed through water at slightly less than 100 C; temperature: 1180 C) followed by HC1-He etching before removal from the growth zone. evaluated by standard etch pit and decoration counts. The observed dependence on t1/2 is characteristic of a diffusion controlled process and has been confirmed by other investigators (Refs 3-9) for the oxidative growth of silica. The exponential decrease in the number of defects with oxide growth also is apparent from Figures 4 and 5. Decay of this number, N, may be expressed either in te rms of growth time, t, or layer thickness, z, according to
Defect densities were
where N and N, are the corresponding preexponential factors (ordinate intercepts)
and 5 are listed in Table I.
. and X an k 4) are the respective decay factors. Decay factors appropriate to Figures 4
12

Figure 1.- Electron Photomicrograph of Replica of an Oxide Defect (Black Region). Approximate Length: Twelve Microns.
13

a. Silicon Etching of Oxide Defect Site
b. Etch Pat tern of Unoxidized "Control" Wafer
Figure 2.- High Temperature HC1 Etching Tes t
14

Figure 3 .- Electrophoretically Decorated Wafer of Very High Oxide gefect Density (see Appendix F).
15

3 3 x 10
10
1
10- 0 1 2 3 4 5 6 7 8 9
?'2 (MINUTES)
Figure 4.- Defects as a Function of Oxidation Time for Various Stress Conditions
16

a a
c 4 x 10%
l o 2
10
1
10-1 1 I I I I
THICKNESS (i x lom3)
Various Stress Conditions
2 3 4 5 6 0 1
Figure 5. -Defects as a Function of Oxide Thickness for
1 7

TABLE I OXIDE DEFECT DECAY FACTORS
+(per 1000 f i )
2 .22
1.08
0 . 8 3
C o nd it ion
No stress
Full stress
Partial stress
A/+
0 .62
0.55
0 . 5 4
ktminutes -1/2)
1.37
0.60
0.45
Internal consistency between the time and thickness data i s given by the ratios, h/+? and is better than 94 percent.
Obviously the smaller the decay factor the greater the defect density and the more serious the pinhole problem. to room temperature the decay factor is reduced by more than 50 percent and the defect density increased by roughly an order of magnitude. cooling the compressive stress is developed in the oxide layers which, for the set of wafers under discussion, was found by Prof icorder analysis to be uniformly 4.1 x l o 4 psi over the range of thicknesses grown (Appendix L). It is this magnitude of stress that differentiates the "full stress" condition (middle curve) from the "no stress" condition (lower curve) existing at the oxidation temperature (Figures 4 and 5). And it is the difference in slopes of these two curves that links the occur- rence of dielectric defects with compressive stress.
Merely by cooling from the oxidation temperature
Simultaneouslv with
In the upper curve, stress in the oxide layer has been partially relieved by etching off the opposite oxide layer. silicon substrate, yielding an observable warp curvature in the wafer. A s a result the remaining oxide layer assumes a conformal convex curvature which, it is postulated, opens up oxide fracture sites previously held together in the more planar "full stress" state. Thus, the "partial stress relief" condition is believed to introduce still more defects, as evidenced by the slope of the upper curve in Figures 4 and 5 , because of the unbalanced nature of the relief. It would appear from these results that an inte- grated circuit technology that allowed the back oxide to remain on the chip would be somewhat less prone to pinhole problems.
The relief mechanism i s through strain of the
A more serious problem, however, remains. This i s the existence of a virtual defect density (Nt, of Equation 1) of the order of 103/cm2. Admitting that this extrap- olated value is fictitious, one still must assume a very large defect density at some small t > 0 which increases exponentially with thinner oxides. This p oblem i s
generally required. It seems more important, therefore, to understand the physical basis for the virtual defect density, so that it can be manipulated downwards, rather than attempting to increase defect decay factors.
especially critical to MOS-FET technology where gate oxides of 1000 a , or less, are
18

From a comparison of Figures 4 and 5 it is seen that the preexponential defect density is approximately 50 percent higher €or the thickness dependent curves than f o r the t1/2 dependent curves. This difference is significant within the experimental limits of e r r o r and indicates the presence of a kinetic anomaly during the initial phases of oxidation. Such a n anomaly might be associated with the initial nonhomoge- neous oxide distribution indicated by these plots. If so, process steps or modifica- tions tending to moderate, or reverse, this condition might also reduce the virtual defect density with a consequent improvement in oxide quality.
Accordingly, wafers were pretreated in a manner designed to produce diffusion attenuation layers on the surfaces. These layers consist primarily of silicon dioxide in the 200 or less thickness range produced by a wet chemical method consisting of treating the wafers with H F (to remove old oxide), KOH solution (to remove residual flouride), and hot concentrated nitric acid (to remove residual KOH and initiate uniform oxidation). Each step is followed by thorough rinsing with distilled water. The exact nature of the layers so produced still is unknown. Boundaries in such layers produced by controlled (masked) HF etching are readily revealed by moisture condensation from a humid environment. Attempts to measure the thickness of the layers by Proficorder and Tally-Surf tracing, and by interferometry, however, failed. Although the layers are suspected of being a porous and partly hydrated silicon dioxide, the possibility of a small component of nitride cannot be ruled out.
High temperature oxide defect densities on wafers so treated (termed hereinafter "oxidative precleaning") w e r e found to be practically nonexistent, even for oxidation time as short a s 2.5 minutes. Room temperature decorated defects, however, were significant and are listed in Table 11.
TABLE I1 FULL STRESS DEFECT DENSITIES IN OXIDATIVELY PRECLEANED WAFERS
Run
K
L
M
N
0
P
Oxidation Time
(Minutes)
2.5
5
10
15
20
30
Oxide Thickness
(Angstroms)
1300
2000
2700
3000
4100
5000
Defects pe r Wafer (Average)
213 f 18
172 f 29
88 f 11
75f 6
5 0 5 3
40f 3
19

9
A plot of the defect densities against both thickness and (time)":! (Figure 6 ) shows that the time dependent plot now has a higher virtual defect density than the thickness dependent plot - a reversal f rom the corresponding relation shown in Fig- ures 4 and 5, The fact that the oxidative precleaning indeed moderates the initial high temperature attack is more clearly shown by plotting thickness vs (time)l/Z for both the oxidatively precleaned and normally cleaned ("untreated") wafers (Figure 7). The concavity of the f'treated" curve at the origin is in the expected sense for an initial attenuation of oxidation.
'
A comparison of Figure 6 with Figures 4 and 5 also indicates that the oxidative precleaning produced a significant reduction in virtual defect densities, Whether this reduction was due to the initial oxide layer or to the additional cleansing action was, of course, not determined by this set of experiments. Therefore, an extended non- oxidative precleaning technique was worked out in the hope of separating the two effects. Additionally, other process variables are available for manipulation in securing initial slow growth without recourse to oxidative precleaning, such as initial reduction in temperature, o r in the oxygen content of the process gas. Initial pilot tests showed the latter method to yield more reproducible results in the present e quipme nt .
A systematic investigation of the above process parameters therefore was undertaken with special emphasis on defect incidence in the region of thin oxide layers. In this series only the oxidative and the extended non-oxidative pretreatments were used. Slow growth was achieved by limiting the oxygen to 4 percent of the process gas composition and by reducing the temperature of the water reservoir. The oxidation temperature, however, remained a t 1180 C. All data was taken as a function of oxide thickness grown, as measured (in most cases) by Proficorder tracing. All defect readings are recorded on a explained below. In addition the ratio of etch pits (high temperature defects) to decorations (room temperature defects) were computed for each series, where applicable, as a further test of internal consistency. Current data thus obtained are compiled in Table 111.
basis as a result of changes in counting technique
Comparison of Sets A and B in Table I11 plotted against oxide thickness (Figure 8) indicates that there may be little or no difference in how the initial oxidation rate i s moderated. The effect of both on the virtual defect density appears to be significant. Compared with ear l ier results, which yield a virtual defect density of-4 x 10³ per wafer ("Full Stress" curve, Figure 5), o r >10 the present treatments yield an order of magnitude improvement (-1.1 x l o 2 emw2). Although the defect decay rate is somewhat smaller than that applicable to Figure 5, this potential modification in process technique ma have important implications for thin oxide applications, such
410 defects of 70 cm-2.
3
as MOS gates. A t 1000 31 oxide thickness, for example, Figure 5 yields a density of (taking the wafer area as 3.2 em2) while Figure 8 yields a density
Sets C, D and E of T ble I11 were undertaken primarily to explore defect decay behavior in the first 1000 f of oxide growth and are plotted in Figure 9. It i s evident, first of all, that a substantial spread in data exists in this region. This spread is due in part to a less homogeneous defect distribution in thin oxides and in part to counting e r r o r resulting from the substantially higher defect densities encountered. In spite of these difficulties it i s seen that measures taken to moderate the initial
20

500
100
1 0 I I I I I I I I I I 0 1 2 3 4 5 6 7 8 9 10 11
t1’2 (MINUTES)
I I I I I I
THICKNESS (ANGSTROMS x
0 1 2 3 4 5
Figure 6.- Oxide Defects as a Function of Growth for Oxidatively Precleaned Wa€ers
21

0. 5
0
t1’2 (MINUTES)
Figure 7. - Oxide Thickness Dependence on Time for Treated and Untreated Wafers
22

a, k
cdu 3 k g
c, a, tn
m wco 0 rl m r l o *a m o m c dbIn m a I n mco o r l r l n M M * oo r l 00 O O O C
O B 0 0 d d do'd d d d o'd d d d c
000000 0 0 0 0 0 0 0 0 000 0000000 000000 00000 0 0 0 bkr l P - m I n m m o I n M O P - o + o w m m w w m I n w * I n w * c v w * m w w d c v c v M * I n r l ? l t X M *
In m m M
M 4
In In M c13
I
2 4 M
0 In
4 F9 U n H
!3

24
a '
s
m w m m r l m r l m 0000
0000 . . . .

150
100
h
(-? 5 50 v
u w fr w n
20
10
0 OXIDATIVE PRECLEANING, NORMAL GROWTH SET A, TABLE111
A NONOXIEATIVE PRECLEANING, SLOW GROWTH TO 400 A FOLLOWED BY NORMAL GROWTH SET B, TABLE I11
0
THICKNESS (X x
1 2 3 4 5 6
Figure 8. - Comparison of Oxidative Precleaning With Nonoxidative Preeleaning Plus Initial Slow Growth
25

26
A SET E (NONOX)
I 1 I I I I I 1 2 3 4 5 6 7 8 9 10 11 12
THICKNESS (l x
0 Figure 9. - Decay of Oxide Defects in the First 1000 A Under
Various Treatments

oxidation rate result in xtremely steep (25 to 50 percent per 100 1) defect decay curves in the first 700 f of growth. Beyond 1000 the curves appear to level out in a manner consistent with that of Figure 8. It also would appear that initial slow growth is only about half as effective following oxidative precleaning (Sets E) than it is in its absence. Finally, lowering the water content of the process gas (Sets C and D vs non- oxidative Set E) further increases the abruptness of defect disappearance.
Although a mechanistic explanation of these effects is somewhat doubtful at the present time, an empirical prediction of optimum process conditions may be possible. All indications appear to point to the desirability of a very slow initial oxidation stage. This might be achieved by introducing a small increment of oxygen, preferably dry, at the beginning, followed by a prolonged baking in pure nitrogen before proceeding with normal (moist) oxidation. Alternatively, provision could be made for very slow introduction of the wafers into the hot zone of the furnace using a standard gas composi- tion throughout. The general concept here would be to allow sufficient time for the development of an equilibrium distribution of the first few hundred Angstroms of oxide. Continuing investigations will be aimed at testing this hypothesis.
The etch-pit to decoration ratios given in Table I11 show considerable consistency within sets but not between sets. This is most clearly indicated by Set D which was intended to duplicate Set C. The E/D ratio of Set C is 0.38 i- 0.05, and of Set D, 0.11 i- 0.04. It might be concluded that the higher the E/D ratio the lower the vulnerability of existing thin spots to the compressive stress developed in the oxide on cooling to room temperature. and thus a steeper drop in defect densities, at the beginning stages of oxidation. This appears to be borne out in a comparison of combined curves C and D (Figure 9) and curves E, with their respective E/D ratios (Table 111). However further investigation is required to establish unequivocally the physical significance of these ratios.
This would imply an ear l ier filling in of defects,
The spread in room temperature defect decoration counts (Table III) attests to the counting e r r o r caused by copious electrolytic hydrogen evolution in the presence of the high defect densities characteristic of the thin oxides grown in the present series, It was decided, therefore, to abandon bubble source counting in favor of counting the metal salt deposits which collect around each defect si te as a result of anode dissolution. These salts were rendered more visible by addition of acolorimetric agent, such as dimethylglyoxime or rubeanic acid, to the alcoholic phase. Counting then could be done in the absence of electrolytic effects after only a short period of applied voltage. A 1:l correspondence between decorated sites and bubble sites has not been achieved yet, but rubeanic acid was found to be superior to dimethylglyoxime for use with a nickel anode. Further tests are underway to establish the correct con- ditions and appropriate reagents for this improved defect counting technique.
Continued activities in this area will proceed along the lines established above with special emphasis on thin oxide layers and initial oxidation kinetics manipulated in a manner to achieve equilibrium distribution of initial oxide layers.
27

Failure Mechanisms Associated With Packaging (Statement of Work Item 16)
Gas ambient effects on integrated circuits. - The objectives of continuing investigations in this area are directed toward potentially corrosive contaminants, such as chlorinated solvents, and potentially conductive condensates, such as those from aromatic solvents, which may interact catalytically on the oxide surfaces to produce current leakage paths. The effort is based on results from ambient analyses by gas chromatography and mass spectrometry which have revealed a variety of organic contaminants, such as those given in Appendix I. Investigation of the effects of hydrogen or integrated circuits has been discontinued, as indicated previously, a detailed summary of which is given in.Appendix M.
Materials compatibility. - The objective of investigations in this area are directed toward an analysis and correction of failure modes associated with the physical contact of incompatible materials, such as inferior heat sinks, cracked dice, and nonhermeticity ,
The problem of inferior heat sinks will require the development of improved materials or process techniques for die-to-header bonding that will assure uniformly rapid heat dissipation from devices under operating load. problem are poor thermal conductivity, thickness variations, and voids due to mal- distribution of ceramic adhesive layers. Thermal excursions resulting from poor heat dissipation may, in turn, contribute to other significant problems such as cracked die, degradation of h under bias, and mass transport of metallization. A useful approach is to locate voids in adhesive bonding by X-ray, analyze the chemical and thermal properties of the adhesive employed and map thermal emission from devices under various electrical loads by means of infrared microscopy. Parallel investigation of alternate adhesive compositions and process techniques of applying adhesives and mounting dice also should be made.
Factors contributing to this
FF
The problem of cracked dice is complicated by artifacts which may not be caused basically by the potential incompatibility of the associated materials. occasional "examples" of the cracked die problem are suspected to have resulted from inept delidding procedures. Other such examples may have occurred through package deformation on mechanical removal of the device from its bonding to a printed circuit board or through other maltreatments. Both of these problems are aggravated by the unusually thin-gauge metal used in the packages of certain manufacturers. In light of these uncertainties it is necessary to reassess the cracked die problem using methods that do not introduce mechanical s t r e s s in the die. real possibilities that stresses sufficient to cause cracking may be introduced by lead bonding and lidding operations and by the mechanical, thermal, distributional, and curing properties of the ceramic adhesive used in bonding die to header. Aside from dimensional changes during curing, improper distribution of adhesive is often found which causes an inferior heat sink and allows excessive thermal excursions to occur in the die during operation. adhesive which, if rigid, introduces severe mechanical stresses in the die. of problem is less likely where dice are scrubbed to the package, but thermal expan- sion mismatch between the die and the casing still i s a potential source of fracture. In addition to assessing the over-all cracked die problem i t is proposed that progrxm effort in this area be focused on the mechanical stresses inherent in the various methods of die-to-header bonding.
In the past,
Beyond this problem lie the very
Thermal expansion of the die is not matched by the This type
28

Lack of hermeticity also may arise from the incompatibility of rigidly bonded mater iah and requires examination of available evidence of dimensional, lid component assembly and thermal variations characteristic of current practice. It also is impor- tant to seek evidence of oxides, or other contaminants, which may cause incomplete wetting of interfaces during sealing. Breaches in hermeticity may arise from acci- dental package damage or misalignment of components prior to sealing, or from inadequate temperature and environmental control during sealing. In ceramic packages, improper distribution or inherent porosity of adhesives also may lead to hermetic flaws. Accidental flexure of leads or other mechanical stresses often aggravate inherent incompatibilities and produce cracks in-glass-to-metal seals causing a further source of leaks. Alternatively, hermeticity may be lost at glass-to-metal interfaces through the accidental presence of contaminants, such as oxides, or through accidental exposure to etchants.
In view of the large variety of leak sources it is necessary to limit the objectives to those of dominant frequency. Although it is possible to infer the cause of many leaks by metallurgical sectioning, electron microprobe analysis and other instrumental investigations of nonhermetic packages, a more direct approach i s to examine critically the packaging techniques of specific manufacturers which generally provides prompt clues to hermeticity problems. Having thus narrowed the possibilities, it is then possible to confirm the source (or sources) of nonhermeticity by instrumental analysis. A s in the case of gas ambients, however, general conclusions in this area will not be applicable without qualifications concerning spec if ic manufacturers .
Investigations in the area of materials compatibility will be governed by the selection of problems of crucial importance as revealed by Autonetics' continuing analysis of integrated circuit packages from various manufacturing sources.
Instrumental Capability Profile (Statement of Work Item 17)
The major objective of this effort has been defined in a previous section of this report and a current compilation of instrumental capabilities is given in Appendix K. A further objective of this program i s to provide NASA-ERC with critical reviews of current test techniques. hermetically-sealed integrated circuit packages are brought under scrutiny. Methods presently in use, including their advantages and shortcomings, are considered as well as new approaches under development designed to improve on those now employed. Because of the previous absence of a single test applicable to the entire leak-rate range, applicable techniques conventionally are categorized as "fine leak" and tlgross leak'' tests. For convenience these categories are followed below although they may become obsolete in view of a new technology now being evolved.
In the present section leak test techniques applicable to
Fine leak testing. - All of the test methods reviewed and outlined herein, with two notable exceptions, employ the technique of inoculating the package with a tracer gas, usually helium, after it has been sealed, then conducting a leak test of the device with a helium leak detector. The pressure and duration of the t racer gas inoculation varies among users but is of problematical effect on the leak test accuracy. average pressurization period is four hours at G O psig. The practical upper limit for helium leak testing appears to be 1 x lower limit appears to be 1 x 10⁻⁵ to 1 x 10⁻⁶ Std cc/sec He.
The
to 1 x 10⁻⁹ Std cc/sec He. The practical
29

The technique of inoculating a package after sealing with a t racer gas in actuality produces a questionable leak rate number which is the product of the leak rate of an unknown gas fraction pressured into the package, and of that fraction of gas in turn being evacuated from the package and tested during the leak test-cycle. Furthermore the helium leak test machine is calibrated for 100 percent helium. The fraction of helium (tracer gas) within the package i s obviously unknown. The only way to assure the validity of a tracer gas leak test i s to seal the devices to be tested in a gas ambient with a known fraction of the tracer gas to be used.
A. new leak test method developed at the North American Rockwell Corporation Science Center requires no special pre-pressurization to inoculate a package with a t racer gas. The packages may be sealed with dry nitrogen or dry air . This leak test method is based on the principle that helium atoms excited to the metastable state will transfer energy to the nitrogen o r oxygen atoms presumably leaking from the package under test. The excitations of these N2 or 0 2 molecules can thus be detected either by a change in conductivity o r by detection of photoemission. utilizing this principle have demonstrated that leaks as fine as 1 x 10⁻⁸ Std cc/sec He and as gross as holes 0.090 in. diameter can be detected. principle, "fine" leaks and llgross'l leaks are detected with one test.
Leak tests conducted
Thus utilizing this new
The leak test method reputedly used by Raytheon is one which inoculates a package under pressure with Freon or similar liquid. of 50 pgram will fail a device. Based on DuPont Corporation, corrosion rate studies of Freon type compounds on aluminum, it has been determined that at room temperature Freon will corrode through the average integrated circuit interconnection in 10 months. This method appears to be a reliability hazard.
It i s reported that a weight gain
It is theorized that all leakage at rates less than lo-' Std cc/sec He is by diffusion and that leakage due to viscous flow is negligible. The fraction of ambient exchange is therefore independent of total and partial pressures, although the absolute amount of exchange of a particular gas is directly proportional to the difference between the partial pressure within and without the package. circuit flat pack with a n internal volume of 0.005 cc and a leak rate of 5 x 10⁻⁷ atm cc He/sec thus exchanges 10 percent in 0.77 hours, 50 percent in 5.2 hours, and 90 percent in 1 7 . 2 hours. The time for exchange is inversely pro ortional to the leak rate and, for example, is 50 times as great for a leak rate of 10-8 atm cc He/sec. The time for an equivalent proportion of exchange in a larger package is greater and is directly proportional to the volume of the package.
A 14-lead integrated
Gross leak testing. - Most gross leak detection methods reviewed and outlined herein, and used on opaque packages, employ the simple technique of detecting gas bubbles escaping from a leaking package while immersed in a hot liquid. stipulates that the device to be tested be placed in liquid and then a vacuum should be applied while the observer watches for bubbles indicating a leak. This i s merely a slight ramification of the basic principle employed.
One method
There is little agreement on how sensitive the bubble test is. It has been variously rated from >lO-3 to > 10-5 Std cc/sec He.
30

There is agreement however on the fact that this test is very much affected by operator efficiency and operator fatigue. It is recommended that a n operator should not work at this test for more than two hours continuously.
More specifically, the formation of bubbles depends on the thermal expansion of the contained gas. Their appearance, however, is easily overlooked by operators in the early stages of familiarization; even among experienced personnel results are likely to vary between individuals and with the same individual at various stages of fatigue. In part this is due to the transient nature of the phenomenon, the fact that not all surfaces of the device can be observed at the same time, the fact that light reflec- tions from the package sometimes may be confused with bubbles and the fact that rechecks of test results are not reliable. A more basic problem is the fact that the internal gas pressure must compete with and exceed the liquid capillary filling pres- sure due to surface tension. Thus, below a certain pore size no gas exit is possible and the pore fills with the glycol. Multiple pores below the minimum detectable size could result in an extremely leaky package which would pass undetected. Furthermore, operator A using a bath at 150 C would pass a particular device that operator B using a bath at 160 C would reject because at the higher temperature the internal gas pres- sure is higher and the liquid surface tension lower, thus favoring gas exit in the minimum pore size region. It should be remembered, further, that this minimum pore size region is considerably above the upper limit of the conventional helium leak test.
Tests conducted by NAR have proved that the bubble test is not reliable and not repeatable if ethylene glycol is used as the test liquid. Even at relatively high tem- peratures (125 C) glycol has a high viscosity and high surface tension which causes erroneous leak indications. problems.
It is conjectured that mineral oil produces similar
FC-43 has been shown to be an ideal substitute for glycol and mineral oil as a bubble test medium.
Summary. - Presently used leak test techniques are summarized below and are compared in Table IV.
MIL-STD-833 (Proposed) Method 1014
A. He Fine Leak
1. Pressurize device to be tested in 100 percent He one hour minimum at 5 atmospheres minimum.
Transfer time between (1) and ( 3 ) is 30 minutes maximum. 2.
3 . Test device in a mass spectrometer calibrated for Helium.
4. Devices shall have a maximum leak rate of 1 x Sensitivity Range lom5 to estimated.
Std cc/sec He
31

P
-
P
32

B. Radioisotope Fine Leak
1.
2.
3. 4. 5.
6 .
Devices are to be placed in chamber and chamber evacuated €0
0.5 mm Hg - time unspecified. Chamber then filled with Kr-85/N2 mixture to pressure at 5 atm absolute for 12 minutes minimum. I(r-85/N2 evacuated from chamber to 0 . 5 mm Ha. Chamber refilled with air to atmos pressure. Devices are then leak tested via scintillation counter within four hours of steps 1, 2, 3, 4. Maximum leak rate allowable 1. x Sensitivity Range 10-5 to 10-10 estimated.
atmos cc/sec of Kr-85
C. Freon Gross Leak Test
I. Leaks > loe3 std cc/sec
1.
2.
3.
Immerse device two in. below surface of FC-43 fIuid maintained at 125 C f 5 C. View device immediately through a magnifier against a black background. A single bubble or stream of bubbles from package constitutes a failure. N o evidence of bubbles constitutes a good device.
NOTE: Sensitivity Range to loe3 estimated.
11, Leaks > std cc/sec
1. 2. 3. 4. 5.
Evacuate devices in vacuum chamber 1 hour (vacuum 1 Torr). Backfill chamber with FC-113 without pr ior loss of vacuum. Apply pressure of 90 psi for 3 hours minimum. Remove devices and dry 3 f 1 minutes in air . Repeat steps 1 and 2 and 3 of Item C-I.
NOTE: Sensitivity Range loS2 to estimate.
D. Penetrant Dye Gross Leak Test
1. 2 .
3, 4.
5.
6 .
This test to be used on transparent glass encased devices only. Devices shall be placed in chamber and completely covered with dye solution. Chamber shall be pressurized to 100 psig for 2 hours minimum. Remove pressure and wash devices with acetone, then with Alcohol, and then air-jet dry. Examine devices with magnification 7 - 20X using UV light as illumination. Any evidence of dye penetration is cause for rejection.
NOTE: Sensitivity range to estimate.
33

Raytheon Corp. leak test. - Information at this time i s sketchy and not considered completely re liable.
1.
2.
Devices are baked in a vacuum oven at 170 C for 4 hours then weighed.
Devices are then immersed in a fluorochemical liquid (presumably freon) for an unstated time at a n unstated pressure.
Devices are removed from liquid externally dried and weighed again.
A weight gain of 50 pgram per device constitutes a failure.
NOTE: Sensitivity - Unknown.
3 .
4 .
North American Rockwell Corporation - Rocketdyne Division proposed leak test (SFG). -
1. Place devices one hour in Vac chamber.
2. Backfill vacuum chamber with SFg gas without first losing vacuum.
3. Pressurize chamber to 60 psig for one hour.
4. Open pressure chamber.
5. Place test device in test chamber and Helium flush for 5 sec.
6. Evacuate test chamber containing device to be leak tested through a gas chromatograph.
,
7 . Any SF6 gas escaping from "leaking" test device is detected and analyzed quantitatively by the gas chromatograph.
NOTE: Sensitivity Range = 0.013 in. diameter holes in package to 10-7 std cc/sec.
North American Rockwell Corporation Science Center Division proposed leak t&. -
1. Place device to be tested in test chamber.
2. Flush lines and test chamber with He at 5 psig.
3. Determine background noise.
4. Read/record leak rate.
5. Remove device.
NOTE: Sensitivity Range = 0.090 in. hole to los8 std cc/sec He leak.
34

6. Watch for bubbles. Any sign of escaping bubbles o r growing bubbles shall constitute a leaky device.
NOTE: FC-43 may be substituted for glycol per Spec AAO607-010. temperature is 125 f 5 C.
Bath
35

MIL STD 883 (Proposed)
Method A
1. 2.
3 . 4.
Maintain bath of clear mineral oil at 125 f 5 C. Immerse device to be tested 1 in. below surface 1 minute minimum duration. Any indication of escaping bubbles shall be cause for rejection. Clean devices after test with suitable solvents.
NOTE: Sensitivity Range > 1 x estimated.
Method B
1.
2.
3 .
4.
Place devices in clear mineral oil bath 1 in. below surface in a vacuum chamber with a suitable viewing window. Draw a vacuum not greater than 1.5 in. H8 over bath and hold for at least one minute. Any indication of escaping bubbles from devices shall be cause for rejection. Clean devices with suitable solvents after test.
NOTE: Sensitivity Range >1 x std cc estimate.
Method C
1. Quite similar to MIL-STD-883 Method 1014 A.
Autonetics Procurement Spec No. AC 477-0005
1. Fine leak - in accordance with MIL-STD-202 Method 112, condition C, Procedure I11 A.
2. Gross leak - in accordance with MIL-STD-202, Method 112, Condition A, except use ethylene glycol or H 2 0 instead of mineral oil.
3. The allowable leak shall not exceed 5 x cc/sec.
Autonetics Process Spec AAO607-010 and AA0115-079
1. Pressure bomb in He at 65 f 3 psig for 4 f 1/2 hours.
2.
3. Leak limit is 5 x std cc He/sec
Leak test devices within 20 minutes of removal.
4. Units passing He test are then bubble tested.
5. Immerse device 1 in. below surface of ethylene glycol maintained at 150 C f 10 C, Hold 10 sec.
36

CONCLUSIONS
The objectives achieved under Contract NAS 12-4 have been significant in a diversity of investigational areas. In many instances potential innovations and improvements in process techniques have been clearly indicated. In others certain conclusions, though currently useful, should be regarded as temporary because of the viable nature of planar technology as a whole. In still other areas, potential conclu- sions are emerging as a result of progress in the solution of specific problems or as a result of reports of such progress in evoking additional investigations elsewhere. The complexity of integrated circuit processing, which is a direct result of the multi- plicity of scientific and engineering disciplines on which the technology has been erected, generally has proved an effective stimulant to these advances. These accomplishments , and their process implications , are enumerated below:
1.
2.
3.
4.
5.
6.
Accomplished Proof of strong entrapment of hydrogen from steam, by radiotracer technique , in thermally grown silicon dioxide layers. Process implications: The trapped hydrogen may contribute to the inversion of planar pnp transistors and to the instability of MOS-FET gate threshold voltages by proton migration. Proton migration recently has been confirmed (Ref 1).
Accomplished Demonstration of sodium contamination, by neutron activation analysis , in silicon dioxide layers grown by conventionally "clean" methods. Process implications: Steps should be taken to exclude sodium in planar processing as an additional contributor to inversion. This effect has been abundantly confirmed elsewhere.
Accomplished: Demonstration of a slight initial difference in inversion recovery kinetics between a group of deuterated transistors and a compar- able group of hydrated transistors. Process implications: Proton migration may be a source of inversion in planar transistors using oxides grown under moist conditions.
Accomplished: Development of progressive resistance to inversion by repeated inversion and deinversion of planar transistors. Process implications: Tends to confirm an electrochemical ion transport model for inversion , thereby achieving improved long-term reliability (Appendix B) . Accomplished: Proof of a strong EPR signal from the interaction of vacuum-deposited aluminum on silicon dioxide layers, indicating reduction by the aluminum and the formation of oxygen vacancies. Process implica- tions: The formation of oxygen vacancies by this mechanism can be avoided by using less active metals (e. g. , gold) for intraconnections, thereby reducing the possibility of inversion and contributing to long-term reliability.
Accomplished: Demonstration of an absence of an EPR signa1 corresponding to oxygen vacancies at the Si-Si02 interface. Process implications: Inversion from this specific source is highly improbable.
37

7. Accomplished: Demonstration of the same characteristic EPR signal from either sodium or fluoride contamination of silicon dioxide. Process implications: Traces of fluoride, as well as sodium, produce similar defect structures in the oxide that may act as trapping states and contribute to inversion. Steps should be introduced after etching treatments to remove residual fluoride.
Accomplished: Proof that the effect of hydrogen on transistor betas, by environmental testing, is nonspecific and tends to be curative rather than degradative. Process implications: The presence of hydrogen in package atmospheres is not inimical to the long-term reliability of planar bipolar transis tors.
8.
9. Accomplished: Demonstration that propagation of significant crystal damage, by etch-pit count technique, into adjacent sensitive device areas a s a result of conventional scribing procedure is improbable. Process implications: Scribing done with appropriate equipment, combined with precise registry and proper maintenance, does not appear to constitute a reliability hazard. Continued alertness in this area, however, is recommended as the investigation was not exhaustive and did not cover such contingencies as diamond wear , registry deviations, etc.
10. Accomplished: By calculation, in diffusion steps complete mixing of input gases occurs in the first 4 inches of furnace tube. Process implications: Iptroduction of baffles, o r other mechanical means to create turbulence, will not avail in improving the uniformity of diffusion doping as convention- ally practiced; This exercise, however, ignores potential streaming effects across the wafers themselves, particularly in situations where the diffusant is a n extremely dilute component of the gas phase.
11. Accomplished: Demonstration that dielectric defects in oxide layers generally are cumulative with processing. Process implications: Innovations should be sought that minimize the thermomechanical flexing caused by high-temperature treatments.
12. Accomplished: Demonstration that the higher the compressive s t r e s s in an oxide layer, the higher the defect abundance. Process implications: Compressive s t r e s s can be moderated by additives that reduce the glass set temperature and the thermal expansion mismatch with silicon. This approach, however, is beset with certain difficulties, such as the avoidance of unwanted impurity (trapping) states and the exact control of composition. Rather than attempt to manipulate the compressive stress in this fashion, it is recommended that defect occurrence be brought under control by identifying and eliminating the physical irregularities which activate local ruptures in the oxide.
13. Accomplished: Demonstration that a higher defect incidence in oxide grown on mechanically polished than on chemically polished substrates. Process implications: One of the physical irregularities contributing to oxide defects may be embedded lapping grains o r crystal damage sites caused by lapping. Wafer pretreatments therefore should be terminated by some form of chemical polish.
38

14. Accomplished Demonstration that superficial etching by H F increases significantly the oxide defect population to thickness ratio. implications: Control of M O s gate oxide thicknesses, which are typically of the order of 10008, should be accomplished by growth techniques rather than HF thinning techniques. This would require additional precautions to prevent o r remove outer-skin sodium contamination normally eliminated in H F thinning.
Process
15. Accomplished: Observation that a significant localization of defects at abrupt steps in oxide thickness. Process implications: Fortunately a large proportion of such steps are located at windows where metallization contact with the substrate is desired. However, cognizance'of this potential failure mode should be a factor in integrated circuit design. Metallizations, where possible , should be routed to avoid sharp changes in oxide thickness, and oxide overlap at contact windows should be sufficient to provide impervious protection to surrounding junctions and substrate.
16. Accomplished Proof tha t repeated heating and cooling of oxidized silicon wafers in an inert ambient produces a substantial increase in defect density. Process implications: This observation provides some insight as to why continued processing contributes to defect incidence (item 11) as well as arguing against manufacturing decisions to reprocess in an effort salvage, for example, the results of an inadequate diffusion.
17. Accomplished Demonstration that gentle mechanical wiping of oxide layers increases the incidence of dielectric defects. Process implications: As in Item 16 this provides further insight into the structural character of oxide defects, inplying that a spalling effect is involved that loosens material sufficiently at certain sites to render it susceptible to subsequent removal by mechanical means. It also indicates that the handling of wafers during manufacture must be minimized as much as possible and done with great care. This would apply to almost any tool used in handling, since the referenced wiping experiments w e r e done with cotton swabs.
18. Accomplished: Proof that removal of one oxide layer (by etching) produces a significant increase in the defect density of the oxide layer remaining on the opposite face of the wafer. Process implications: The wafer is mechanically flexed by this treatment, as amply demonstrated by experi- ment, imparting a convex curvature to the opposite layer, which contributes to the postulated spalling effect adduced in Item 17, above. If a wafer could be processed completely symmetrically, using the same masks, etching steps, etc, on both sides, dielectric defects from this source could be minimized. A more practical recommendation is to process only one side while maintaining intact oxide on the other.
19. Accomplished Proof that defect density decreases exponentially with increasing oxide thickness and with the square root of oxidation time. Process implications: Use as thick oxide layers as economically feasible where other design criteria are not thereby compromised.
39

20. Accomplished: Demonstration that existing defects in thermal oxides often can be reduced significantly by a pyrolytically deposited oxide. Process implications: This procedure is an expensive extra step and does not really solve the basic defect problem. The effectiveness of this procedure varies considerably among processors. Uniform thickness control of the deposited oxide is difficult to achieve.
21. Accomplished: Proof that the presence of water during oxidation, o r at the termination of a dry oxidation, produces a lower defect incidence than in oxides grown dry. Process implications: This effect of water is inter - preted as a result of a reduction of bond strain from the introduction of hydroxyl groups into the silica network in a manner analogous to that of other oxide additives. The so-called hydroxyl groups, however, are really acidic and capable of yielding protons that may contribute to inversion, as indicated in Items 1 and 3. as an oxidation additive is recommended for most planar processing on the basic that proton migration is a minor problem relative to that of oxide defects.
Nevertheless, the use of water
22. Accomplished Demonstration that variation in wafer cooling rates after oxidation has a negligible effect on dielectric defect incidence. Process implications: Control of cooling rates is unessential. This effect is con- sistent with a thermal expansion mismatch mechanism that is dependent only on AT and not the derivative of AT with respect to time. However, heat soaking at a phase transition temperature within the produce a beneficial bond rearrangement and is being investigated further.
AT interval may
23. Accomplished: Demonstration that addition of nonvolatile mineral salts to steam source does not increase defect densities. Water quality with respect to nonvolatile constituents is not critical. Spray carryover either is negligible o r is trapped by the hot furnace tube before reaching the wafers.
Process implications:
24. Accomplished: Proof that oxide growth rate variations do not affect defect densities significantly. Process implication: Control of such parameters as oxidation temperature, o r steam concentration in the process gas, is not critical from the standpoint of defect densities. However, such con- trol remains cri t ical for other reasons, such as control of layer thickness, diffusion boundaries, etc. Moreover, oxidation rate at the ve ry beginning of oxidation is emerging as an important parameter affecting defect densities in very thin oxides.
25. Accomplished: Demonstration that substrate doping has little effect on defect densities. Process implications: None of significance, unless high boron doping is encountered (Appendix E-8, 9).
26. Accomplished: Proof that oxide defect densities are not associated with dislocation densities or stacking faults pre-existing in the substrate. Process implications: Adjustments in substrate crystal perfection, o r epitaxial deposition perfection, will not avail in improving oxide defect densities, probably because oxide defects generally are at least a thousand times larger than the substrate crystal imperfections. More
40

27.
recent work indicates that macro defects in the substrate may determine the loci of subsequent oxide rupture.
Accomplished: Demonstration that particulate Contamination on silicon wafers, unless exceedingly dense or reactive, does not contribute significantly to oxide defects. Process implications: In process lines where an oxide defect problem exists,' the origin of the problem probably need not be sought in air particle counts o r potential dust deposits on wafers prior to oxidation. Other wafer contaminants of a more adherent character, however, may be contributing factors. The above recornmenda- tion should @ be construed as suggesting the relaxation of general cleanliness standards, In photolithographic procedures, for example , ambient dust may become a source of "artificial" dielectric defects created in subsequent etching steps. The essential purpose here is to rank failure sources according to their relative probability in order to save costly engineering time in real situations.
The above experimental observations were compiled on the basis of their more o r less direct relevance to process techniques. Many additional experiments, how- ever, were directed toward questions of mechanism which, i f properly answered, might provide direct, logical process improvements. Some of the more important observations are especially pertinent to the successful evolution of large scale integration because they deal with the physical nature and origin of oxide dielectric defects.
1.
2.
3.
4.
5.
These a re summarized below:
Accomplished By replicate electron' photomicrography, the detailed definition of the morphology of oxide defects identified independently by electrophoretic decoration. Mechanism implications: Pileups of oxide at the defect site (see Figure 1) suggest a process of compressive upheaval,
Accomplished Demonstration of initial (virtual) defect densities of the order of 100 to 1000 per cm'. initial distribution either of substrate surface irregularities or of process induced inhomogeneities.
Mechanism implications: Suggests an
Accomplished: Proof of a kinetic anomaly at the initiation of oxidation. Mechanism implications: Initial distribution of defects may be oxidation rate dependent.
Accomplished: Demonstratio of a typical defect decay rates versus growth in oxide layers of 750 1 or less. Mechanism implications: Not
hundred , "2 of growth may have a controlling effect on subsequent growth. suggests manipulation of oxidation rates during the first few
Accomplished: Demonstration that oxidative precleaning of wafers (with HNO3) prior to oxidation tends to reduce defect densities except in the very thin oxide range. Mechanism implications: This was first regarded as an indication that moderation of the initial oxygen diffusion rate would become an important defect control parameter. However, see below.
41

6 .
7.
Accomplished: Special nonoxidative precleaning techniques equal to oxidative treatments in reducing defect densities and superior in the very thin oxide range. Mechanism implications: Initial diffusion rate (or thin oxide distribution) is not an important control parameter, but oxidation rate control still may be important on the basis of achieving an initial "equilibrium" distribution of oxide.
Accomplished A chemical polish pretreatment with HC1 which tends to reduce defect densities. Mechanism implications: Present results are not yet quantitative but indicate that macroscopic promontories (of the order of one micron) may be substrate features that determine subsequent oxide defect sites.
Other accomplishments on this program are related to the accumulation of information associated with process techniques o r with the process origins of com- ponent reliability problems. A s such, these compilations are of more general applicability to process problems than the discrete observations derived from experimental studies as outlined above. The information in these compilations is derived in part from previous failure analysis programs at Autonetics and in part from the current literature. They are summarized briefly below:
1.
2.
3.
4.
Accomplihsed: "Instruments for Failure Analysis" (Appendix K). Process implications : Tabulation provides instrumental techniques applicable to the examination of component abnormalities and failure modes. The compilation should be of particular assistance to management decisions required in initiating failure investigations in established processes.
Accomplished "Sensitivities of Instruments" (Appendix K). Process implications: This is a companion tabulation of Item 1 above, which will assist in the choice of instrumentation for particular analytical problems by providing senstitivities, spectral ranges, limits of resolution, etc, of available instruments.
Accomplished: "Thermodynamic Analysis of Ambient Gas Effects'' (Appendix I). Process implications: Useful in settling questions of materials compatibility, particularly at the design stage, by specifying, among those materials in most common use, those gas-solid interactions which are, and those which are not, thermodynamically allowed. Also useful in discovering o r predicting possible slow reactions that may contribute to long-term drift.
Accomplished: List of leak test methods currently in use of under development (pp 29-36). Process implications: A s long as conventional packaging techniques are used, hermeticity will continue to be a problem, and analytical methods for its evaluation will be required. The compila- tion aids in the selection of method and/or helps to assess the reliability of results reported elsewhere. Potential directions of continued test improvement are indicated.
42

It is clear that. the observations and conclusions enumerated above pertain to a still vigorously evolving technology. Also obvious is the corollary fact that reliability and process control problems will continue to abound in such a dynamic situation. One of the more important problems, and an item of particular concern to this program, is the reproducible achievement of the compositional uniformity and physical integrity of dielectric layers. Once this objective is achieved, the foundation for large scale integration will have been laid. It is believed that signifi- cant progress in this direction has been made and that further efforts will be extremely rewarding. On a more general scale, however, there is no doubt that new problems will arise and that constant vigilance should be maintained for their detection and ultimate correction.
43

44

REFERENCES
1. S .R. Hofstein: "Proton and Sodium Transport in Si02 Films," IEEE Trans. Electron Devices ED-14, 749 (1967).
J. P. McCloskey: "Electrograph Method for Locating Pinholes in Thin Silicon Dioxide Films," J. Electrochem. SOC. 114, 643 (1967).
2.
3. D.J. McAdam, G.W. Geil, J. ResearchNatl. Bur. Standards 23, 593 (1942).
4.
5.
6 .
7 .
8 .
9.
J. T. Law, J. Phys. Chem. 6 l , 1200 (1957).
J. W. Evans, S.K. Chatterji, J. Phys. Chem. 62, 1064 (1958).
J.R. Lizanga, W.G. Spitzer, Phys. and Chem. Solids l4, 131 (1960).
P.J. Jorgenson, J. Chem. Phys. 37, 874 (1962).
B.E. Deal, J. Electrochem. SOC. 120, 527 (1963).
B.H. Clausen, M. Flower, ibid, p. 983.
45


APPENDIX A. HYDROGEN I SOTOPE INVESTIGATION OF PASSIVATION SILICON OXIDES*
BY J. E. MEINHARD
AUTONET I C S, A D I V I S I ON OF NORTk AMER I CAN ROC KWIELL COR PORAT I ON, ANAHE I M, CALI FORN I A
The silicon dioxide passivation layers utilized for dielectric isolation in planar silicon devices a r e subject to two general types of failure: dielectric anomalies which give r i s e to shorts between metallizations and the silicon substrate, and field induced accumulations of positive charge which produce invere ion in bipolar transistors and gate threshold voltage instability in MOS-FET's. The present study attempts to shed light on the latter problem by identifying positive charge accumulation with the electromigration of specific positive ions.
Conventional thermal oxidation procedures employ a small proportion of steam in the process a s to promote favorable mechanical and dielectric properties in the
(1000-1200 C), opportunity nevertheless exists for the oxide entrapment of hydrogen derived from the steam. This can be understood from the schematic representation of the process postulated in Figure A-1. Most of the initially produced --- Si-O-H groupings should interact with equivalent nearest neighbors with the elimination of water and the formation of Si-0-Si bridges, A small proportion of such groupings, however, will be.isolated from reactive neighbors in the process and will remain randomly distributed in the oxide, regarded a s acidic si tes capable of releasing protons under the influence of an applied electric field, o r of exchanging protons for other monovalent cations, such as sodium ions, analogous to the function of ion exchange zeolites. The density of residual acidic sites will then be a function of the base concentration (HOH, NaOH) present during oxidation, and they will act as reservoirs of positive ions which may contribute to the inve r s ion phenomenon.
resulting oxide F . Although these procedures a r e conducted a t elevated temperatures
The residual --- Si-O-H groupings may be
In order to demonstrate whether residual hydrogen was present in the oxide a tritiated oxidation run was performed on boron-doped high resistivity silicon wafers using one gram of water containing 100 f 5 millicuries of tritium. Oxidation was con- ducted at 1150 C in the apparatus shown schematically in Figure A-2. Gases were metered and purified by conventional means using an N2:02 flow ratio of 3:2. Tritium labeled water was picked up by the 0 2 stream from a reservoir maintained at 95 C This reservoir was a single, bypass fitted U-tube of sufficient internal diameter to permit evaporation of the water without mechanical carzy-over by the gas stream. The process was timed to produce approximately 2000 A of oxide on the wafers which utilized the entire charge of water in the reservoir. The entire procedure was designed to duplicate a s closely as possible conventional methods of silicon oxidation for planar devices.
'Delivered a t the Electrochemical Society Meeting, Cleveland, Ohio, 3 May 1966.
47

Several technoiques were used to measure the level of tritium present in the tteated samples. A 2 IT counter was employed without any indication of H3 activity. Similar results were obtained with a liquid scintillation counter. A 4 TT counter was then utilized with the results given in Table A-1. The plus-or-minus value represents one standard deviation determined from counting statistics only. In this case, this represents an 82-percen probability that H3 was detected. An approximate hydrogen level of 1O1O atoms/cm B in 2000 of oxide was tentatively inferred from this result.
TABLE A-1 TRITIUM ACTIVITY IN OXIDE DERIVED FROM 100 MC/GRAM WATER
Counting Tot a1 Net Counts Time, Minutes Counts per Minute
Background 45 0 52667
Treated Disc 913 108054 1.32 f 0.93
In view of the somewhat inconclusive nature of these results, it was decided to examine the oxide for other impurities that might displace hydrogen from the oxide matrix and to repeat the experiment using a higher tritium activity. Sodium ions were sought, therefore, by neutron activation analysis of a five-wafer sample. An addi- tional five-wafer sample from which the oxide had been stripped also was activated. The composite samples and a sodium standard were irradiated 1/2 h ur a t 250 kw in a Mark I TRIGA reactor with a thermal neutron flux of 1.8 x loi2 cm-’ sec’l. The activated oxide was stripped off the first sample, concentrated by evaporation, and counted overnight in a NaI well detector coupled to a multichannel pulse-height analyzer. The irradiated sodium standard was counted in identical geometry. The 2.75 Mev photopeak of NaZ4 was used for analysis because of the comparative freedom from interference by other residual activities (e. Si3l) present in the samples.
concentrate (0,97998) was found to contain 0.0196-0.004 u Na which indicates an
Sodium in the stripped wafers was found to be indistinguishable from a slight C U ~ ~ background indicating a level 5 0 . 7 3 ppb, o r 4 x 10¹³ atoms/cm3, Na in the original silicon. It was presumed from these results that the sodium in the oxide originally had boiled out of the quartz tube during the oxidation or had been introduced by the gas stream.
Other peaks attributable to Aulg8, C U ~ ~ , and Mn Ed , also were found. The etch solution
average concentration of approximately 8 x l O I 7 atoms/cm 5 in the original oxide
The tritium labeled oxidation was repeated with the following modifications:
1. On the day prior to the run, the quartz reaction chamber was purged 8 hours at 1200 C with an 02/N2 mixture containing HC1 in an attempt to extract out available sodium (as NaCl) from the quartz surfaces. The quartz wafer holder also was included in this treatment.
2. Specific activity of tritiated water was increased to 1 curie/gram. Total quantity remained 1 gram.
48

3.
4.
After initial purging prior to the oxidation, the 02/N2 car r ie r gas flow was reduced to a' negligible value (about 5 ml/min), while the tritiated water was distilled into the reaction chamber. When transfer of the water was com- plete (about 40 min), gas flow was shut off producing an open-ended static system. The intention here was to extend the catalytic effect of the water for a longer period while maintaining the selected ratio of oxygen to nitrogen. The volume of the system was such that the uptake of oxygen by the silicon would have a negligible effect on this ratio.
Treatment wap prolonged (to 2.5 hours) in order to produce thicker oxide (9000-10,000A) and a more significant sample activity.
Oxideethickness on the treated wafers was estimated visually to be uniformly about 9000 A and confirmed interferometrically a t 9140 A. N e t area of wafer surfaces was 3.38 cm2 per side, giving an oxide volume (2 sides) of 6.19 x 10'4cm3/slice.
Four wafers (of a total of 24 treated) were countedusing 4--IT geometry with an estimated counting efficiency of 50 percent. The loss of 50-percent efficiency was due to the combined absorption of the 9000 A oxide layer on both sides and the 10,000 sample support film on one side of the sample. Calibration for tritium was derived from a pol methylmethacrylate H3 standard from New England Nuclear Corporation.
1 3 The net H. count rates of the four samples had a standard deviation of about 1 percent of the value in each case. The atomic ratio of H :H in the tritiated water employed was 3390:l. Total hydrogen content in the silicon oxide of each wafer, computed from the observed count rates and the data given above is presented in Table A-2.
z
TABLE A-2. TRITIUM ACTIVITY IN OXIDE DERIVED FROM 1 CURIE/GRAM WATER
Net CPM, DPM H3 H3 Atoms Total H Atoms Total H Atoms Sample Total per cm2 per cm2 per cm2 per cm3
16
16
16
16
3.7 x 10
3.6 x 10
2.3 x 10
2.1 x 10
2.9 f 0.7 x 10
12
12
12
12
1 360.5 103 9.8 x lo8 3.4 x 10
2 345 4 1 0 1 , 9.5 x lo8 3.3 x 10
4 199.1 59 5.5 x l o 8 1 . 9 x 10
3 225.2 67 6.2 x lo8 2 . 1 x 10
1 6 Average 2 , 7 & 0.7 x 10 l2
The spread in these results is somewhat higher than expected and difficult to explain inasmuch a s differences in oxide geometry (i. e. , wafer area and oxide thick- ness) were relatively insignificant. However , this variation could not be attributed to differences in surface absorption of tritium labeled water because the oxidation run was terminated by a tracer-free nitrogen purge in excess of 1 hour at the oxidation temperature. Entrapment of hydrogen during formation of the oxide a t 1150 C was thereby established.
49

The last three specimens given in Table A-2 were re-assayed €or beta activity in the 4- IT counter after 550 hours exposure to a laboratory environment ranging from 20- to 40-percent relative humidity.
The average hydrogen concentration in the oxide layers was found to be relatively unchanged, as shown in Table A-3, indicating negligible exchange of the tritium with ambient moisture.
TABLE A-3. TRITIUM EXCHANGE WITH HUMID ENVIRONMENT
I Net CPM, Total H Atoms
Period Sample Total per cm3 Average
2 3 4
345.4 225.2 199.1 2.1 x 10¹⁶
16 3.6 x 10 2 . 3 x 10¹⁶ 2.7 x 10l6
16 After 550 hours 2 354.6 3.7 x 10¹⁶
exposure 4 142.7 1.5 x 10¹⁶ humid 3 270.1 2.8 x 10¹⁶ 2.7 x 10
Assay for sodium in the oxide layers of these wafers was then carried out by the neutron activation method previously described. The average sodium populatibn was found to be 1.1 x 10l8 atoms/cm3. This result is not substantially different from that observed in the f i rs t tritiated oxidation sample, and the HC1 pretreatment was deemed ineffective .
Beta assay on the remaining 20 wafers was performed 5 months after their initial treatment. Results are compared with ear l ier assays in Table A-4.
TABLE A-4. STABILITY OF TRITIUM LABE LED PASSIVATION OXIDE
I Elapsed Average N e t Calculated Time Number of Beta Count/Wafer H Content P a y s ) Samples C/M (x 10l6 Atoms/cc)
0 3 257 f 59 2 . 7 f 0.6
253 f 74 2.7 f 0.8 23 3
150 20 186.7 f. 58.8 1.96 f 0.60" * Corrected for radioactive H3 decay
Loss of activity due to H3 exchange with the environment cannot be inferred from the last entry because of the spread in results (about 33 percent). Nevertheless, a wrapper (pa er) from one of the specimens was analyzed in the 4-IT counter. No evidence of H iY exchange was detected.
50

Tritium activity distribution likewise was examined for internal consistency by inverting the first three wafers (of the group of 20) on the aluminized mylar support film and recounting. Deviation of beta activity between opposite sides was found to be relatively insignificant compared to deviation between wafers, as shown in Table A-5.
TABLE A-5. BETA ACTIVITY VERSUS COUNTING ORIENTATION
l 1 2
A B
A B
88 100
94 6
279 284 288
1.4
3 A 120 118 3 . 3 B 114
It was concluded from these results that significant amounts of hydrogen a r e retained in the oxide matrix if steam is present in the oxidation process gas, and that it does not exchange readily a t room temperature with covalently bonded ambient hydrogen.
In order to investigate whether hydrogen trapped in passivation oxide was capable of contributing to inversion, fabrication of thirty small geometry pnp planar silicon transistors was requested from an established manufacturer" prepared under Identical conditions except that the initial oxide on half the specimens was grown in the presence of 99-percent D20. These devices were subjected to inversion stress (temperature and collector-base reverse bias) and the kinetics of inversion recovery (baking at timed intervals under zero bias) determined. Thermal activation energies of recovery were calculated from the kinetic data according to a previously described method2, and the results for hydrated and deuterated specimens compared. A greater activation energy was expected to be associated with the diffusion of the isotope of higher mass.
All 30 of the transistors were electrically good as-received. Their response to inversion s t ress , however, was variable. Consequently, they were subjected to initial inversion stress of 200 C a t 40 VCB for various lengths of time in order to classify them in te rms of usefulness for recovery experiments. In order to be useful, the inverted device was required to show a leakage about 1 x lo-' amps (with available instrumentation) and have a region where ICBO was independent of voltage. This would indicate surface leakage as distinguished from bulk leakage. Of the 30 specimens, only eight were found to undergo inversions suitable for study, five of which were deuterated.
* Fairchild Semiconductors
51

The group of eight transistors was subjected to two complete evaluations, each of which involved from four to eight inversions and recoveries. The thermal activation energies associated with the recoveries are presented in Table A-6. Results from the first treatment indicate that the deuterated values may be higher than the hydrated values, as expected, but the spread in results does not permit definite conclusions to be drawn. The activation energy of the last listed result may, i n fact, be a result of a trace of sodium for contamination rather than deuterium. Omitting this value, the remaining four deuterated samples yield an average recovery activation energy of 0.67 f 0.06 cv.
TABLE A-6
INVERSION RECOVERY KINETICS OF HYDRATED AND DEUTERATED TRANSISTORS
Process Steam, Initial
Thermal Activation Energy of Recovery (e. v. )
Oxidation First Treatment Second Treatment Third Treatment
0.46 0.86 0.54 0.50 0.74 0.56
H2°
- Average 0.58 f 0.08 0.64 f 0.15
0.56 0.72 0.68 0.40 0 . 7 0 0 . 7 4 0 . 7 4 0.45 1.29 0.82 - 0.55
D2°,
Average 0 . 7 9 f 0.19 0.60 f 0.16
Results from the second treatment appear to be generally more uniform between the two groups but are more erratic. Assuming that inversion is produced by an electrochemical transport of positive ions, one might also expect a contribution from electrode processes. Discharge of such ions in the form of neutral species at the cathodic surface would tend to remove them from participation in the charge transport process. If more than one type of ion is present in the rigid Si02 electrolyte, their ratios should change in succeeding inversion treatments, thus introducing variations in the kinetics of inversion recovery. Moreover, the deuterium, undoubtedly present as a minor component since it was employed only in the f i rs t oxidation, should discharge and escape by normal diffusion ultimately into the can atmosphere leaving residual normal hydrogen as the major participant. This type of proton transport in SiOz has been considered in detail previously by Collins3. Thus, the increasing spread in results and the apparent decrease in difference between the two isotopic groups with succeeding inversions can be explained. Additional evidence of these effects is indicated by the third inversion recovery treatment on the last deuterated specimen given in Table A-6.
52

It can be concluded from these experiments that hydrogen is definitely trapped in conventional steam grown silicon dioxide, that the phenomenon of inversion probably is electrochemical in nature, and that hydrogen ion migration probably is a contributing factor in inversion.
Acknowledgements
The work reported herein was performed under contract with the National Aeronautics and Space Administration, Electronic Research Center, Cambridge, Massachusetts. Thanks also are due H. Sello, C. Bittman, and B. Deal, of Fairchild Semiconductors, who kindly provided the set of deuterated and nondeuterated transistor specimens for study.
References
1. W. A. Pliskin and H. S. Lehman, J. Electrochem. Soc., 112, 1013 (1965).
2. J. E. Forrester, R. E. Harris, J. E. Meinhard, and R. L. Nolder, "Imperfections and Impurities in Silicon Associated with Device Surface Failure Mechanisms, 4th Annual Symposium, Chicago, Illinois, sponsored by the Illinois Institute of Technology and Wright Air Force Development Center, November 16-18, 1965.
presented at the Physics of Failure in Electronics
3. F. C. Collins, J. Electrochem. SOC., 112, 786 (1965).
53

PROCESS GAS)
H2° /" H2 OH OH OH OH OH OH OH OH_
IcI-- Si _ _ _ _ _ Si _ _ _ _ _ Si _ _ _ _ _ Si _ _ _ _ _ Si _ _ _ _ _ Si _ _ _ _ _ Si _ _ _ _ _ Si _ _ _ _ _ I I I I I I I I (SILICON CRYSTAL)
/-3 H2°
OH I
Si',,,,, Si Si _ _ _ _ _ Si _ _ _ _ _ Si Si
Figure A-1. - Interaction of Water With Silicon (Schematic)
MOLECULAR
Figure A-2. -Silicon W a f e r Oxidation Equipment (Schematic)
54

APPENDIX B., INVERSION HARDENING: TECH BRIEF 67-10176
Evidence is presented in Table B-I to show that repeated inversions are capable of producing "inversion hardening" in planar transist.ors . This effect is potentially desirable because it reduces the possibility of long-term drift in transistor performance. Thus inversion hardening may be of some utility in deep space missions where reliable transistor function is needed over extended periods of time.
It should be recognized that these data are preliminary in nature and do not necessarily represent the maximum inversion resistence that may be possible with this technique. It also is evident from the data that considerable variability in response to the treatment exists between transistors. This variability could be used for screening purposes in selecting components for missions of long duration. Some transistors, of course, show no initial tendency to invert, which indicates good process control in their manufacture. Further investigation of inversion phenomena is required before this effect can be assigned a mechanistic model.
TABLE B-1 INVERSION HARDENING O F 2N2412 SMALL SIGNAL P N P TRANSISTORS
Initial Total Time Final Inversion Under Inversion Inversion Leakage Number of Inversion Leakage Hardening
Unit @a) * Inversions (hours) ** @a) * (%>
1 108 8 96 1 7 . 4 84
2 900 8 96 37 5 58
3 19 6 6 50 None
4
5
80
96
2
2
2 34 58
2 27 72
6 50 8 96 25 50
7 3 .5 4 4 1 .65 53
*At 40 VcB, 25 C
**At 40 VcB, 200 C
55

56

APPENDIX C. EPR INVESTIGATION OF THERMALLY GROWN Si02
Introduction
The employment of integrated circuits in electronic systems has shown that a major failure mode is excessive current across reverse biased p-n junctions. The two main conditions that cause this excessive current are silicon surface inversion and contamination of the passivation oxide surface. Silicon dioxide is almost univer- sally used for surface passivation. The basic problem is one of oxide purity and its control during the processing of the integrated circuits. The thermal oxidation of the silicon surface has been found to induce a negative charge near the silicon surface causing i t to become more n type. This is thought to occur by charge trapping in fast states related to chemical impurities or structural defects in the interface region and in slow states related to oxide impurities. Several oxide models have been postulated in the literature to explain the integrated circuit surface inversion problem. These include oxygen vacancy migration, impurity redistribution during oxidation, metallic ion migration, hydrogen or hydroxyl ion migration, oxide surface charge separation, precipitation near bulk oxygen, interface states , and a heterojunction formation. Several recent review articles describe these in detail (Ref C-1, C-2). A compre- hensive bibliography was recently published (Ref C-3). The defect structure of silicon dioxide showing its complexity is shown in Figure C-1 (Ref C-4).
In this study, electron paramagnetic resonance has been used on thermally grown silicon dioxide to investigate the oxygen vacancy model. Four resonance sig- nals have been detected from silicon dioxide samples prepared under various condi - tions of temperature, ambient, and chemical contamination. These data were taken at the X-band frequency of 9 . 3 GHz and 3400 gauss using a dual cavity operating between -180 C and +300 C. In addition to the known silicon line at g = 2.006, several others have been found after oxidation of both intrinsic and extrinsic silicon powder. These have been associated with sodium or fluorine retention in the oxide and hydrogen entrapment. Signals also were obtained from single crystal samples with high purity aluminum vacuum deposited over the oxide. This resonance may be due to oxygen vacancies generated by an electrode reaction between the aluminum and the oxide.
Silicon Dioxide Sample Preparation
The silicon crystals used for oxide growths in this study were obtained in wafer form from major suppliers. They were either chemically or mechanically polished prior to oxidation. A wide range of resistivity was used, which included acceptor type (boron), donor type (phosphorus), and intrinsic material. These parameters are listed in Table C-1. Single crystal samples, with various oxides grown up to 20,000 a thickness showed no resonance absorption, so powdered samples were then used. The powdered samples provide a much larger ratio of silicon dioxide to silicon for the sample tubes used in the resonance cavity. A few oxide samples were made on float zone silicon while most were on the more common Czochralski type. From the reso- nance data, it was shown that the signal characteristics found depended only on the oxidation method and not on the silicon resistivity or type dopant. No signals,
57

n .a C 0
J k
B k Q) s 8 c7 c 0 0
5 M
.rl
.rl
2 w 0
58

TABLE C-1 SILICON MATERIAL PARAMETERS OF SAMPLES USED FOR OXIDE GROWTH
I I Source
Texas Instruments I_____ [ Monosilicon
I--- Dow Corning
I
Original Form
Wafer
Wafer
Wafer
Polycrystalline
Wafer
Wafer
I I
0..004 - 0.005
Intrinsic
however, were found using the heavily doped 0.004 ohm-cm silicon material which is most likely due to the large microwave energy losses expected in a conductive material.
The oxides studied here were thermally grown by the conventional methods being used for integrated circuit manufacturing. The silicon was usually oxidized at temp- eratures between 1100 C to 1150 C in dry oxygen o r wet oxygen. The water bath temperature was at 99 C for the steam of wet oxide growth. The silicon powder was usually etched in HF, rinsed with deionized water, and dried in a nitrogen stream. The powder was carried in a small quartz boat inside the furnace. For the wet oxide growth the silicon was usually exposed to dry oxygen and dry nitrogen for 5 minutes at 1150 C before introduction of wet oxygen for various growth periods. The oxidation time was used to control the oxide thickness. For wet oxides the period was usually extended to 6 hours because resonance signals recorded on thinner oxides had less intensity. For dry oxides the oxidation period was extended to 90 hours to achieve an equivalent t ickness. These two methods gave oxides of thickness between 14,000
near the powder samples during oxidation, Capacitance - voltage measurements were made on these single crystal oxide samples after oxidation. Weight measurements were also made before and after oxidation on a few of the initial samples.
and 18,000 1 . For comparative data a single crystal of silicon was sometimes placed
After resonance data had been taken on the silicon and silicon dioxide samples prepared in the conventional way, a number of special treatments were made on the samples to generate comparative data. These thermal and chemical treatments are listed in Table C-2. The controlled chemical contamination of the samples before and after oxidation had the greatest effect on the resonance spectra. Two other types of samples were briefly studied. One was silicon dioxide baked in hydrogen at 1150 C. The other samples had high purity aluminum vacuum deposited on single crystal oxides. The breakdown of sample treatments for the first set of samples is shown in Figure C-2. Each letter shown denotes the material type o r process step taken.
59

F= Pr eoxida tion Treatment
Post oxidation Treatment
TABLE C-2 , SPECIAL SAMPLE TREATMENTS
Thermal
Anneal in nitrogen between 800 C and 1200 C for per- iods up to 96 hours
Anneal in nitrogen a t 1150 C for various periods
Chemical
NaOH
NaCl
HC1
'2'5
NaCl
HCl
H F
Etch
H F + HN03
H F
Resonance Spectra
Electron spin resonance technique. - The theory of electron paramagnetic resonance is well developed and the technique widely used to study chemical structure and bonding of paramagnetic materials. The interactions that the unpaired electrons have in rea l materials a r e generally complicated. It is through these interactions which perturb the magnetic states of the system, that the materials can be studied by electron spin resonance. A system of free electrons has its electron spins and associated magnetic moments distributed randomly in a l l directions each with the same energy. If a steady magnetic field is applied to the system the electrons will align themselves either with o r opposite to the applied field. These two system states wil l have different energy levels in the applied field. By superimposing a microwave radi- ation on the sample field electron transitions can be made to the higher energy state and this loss in microwave energy detected a s a resonance condition. Those electrons in the higher energy state wil l emit photons and return to the lower energy state. Other mechanisms allow these electrons to give up their energy also and these lead to a study of relaxation processes between the electrons and the lattice or other spins, The simplest condition for microwave absorption of energy is that the microwave frequency f satisfy hf = g p Ho where Ho is the applied constant magnetic field, g is the spectroscopic splitting factor (a tensor in general), with h and p constants. The factor of interest is usually the g-factor. It is analogous to the Lande g-factor which describes the addition of spin angular momentum to orbital angular momentum to give the total angular momentum. The free electron g-factor has a value of 2,0023. Measured g-factors which differ from this valve a r e a measure of interactions involving the orbital angular momentum of the unpaired electron. Since this momentum depends on the chemical environment the g factor also depends on this environment. In a solid the energy levels of the unpaired electrons cannot be taken a s the Zeeman splitting mentioned above since the electron is coupled with many other fields from its sur- rounding environment in addition to the applied magnetic field.
60

LEGEND: M - M1 - T - A1 - A2 - A3 - E - w - D - N - H -
MONOSILICON INTRINSIC SILICON MONOSILICON SILICON (31-34 OE'M CM) BORON TEXAS INSTRUMENTS (8-12 OHM CM) PHOSPHORUS ANNEALED 6 HOURS AT 8OOC IN N2 ANNEALED 96 HOURS AT 8OOC IN N2 ANNEALED 4 HOURS AT 1150C IN N2
WET OXIDE 6 HOURS AT 1150C DRY OXIDE 12-87 HOURS AT 1150C NaOH ADDED DURING OXIDE GROWTH HC1 ADDED DURING OXIDE GROWTH
ETCHED IN HF + HNO3 TO REMOVE 750 MICRONS
Figure C-2.- EPR Sample Preparations
61

The equipment used in this study w a s an X-band Varian Model 4500-IOA EPR spectrometer with 100 Kc modulation. The powdered samples about 1 .5 cm in length were put in a 3 mm diameter quartz tube, and initial experiments were performed at room temperature. The maximum sample width that will f i t into the microwave cavity is one cm; however, it was found necessary to use the thinner samples because of large energy losses when the silicon dioxide sample extended into the electric field in the cavity.
To induce electron spin flipping the silicon dioxide sample is simultaneously subjected to a dc magnetic field Ho and a weak microwave field whose frequency is near the precessional frequency of the electron. A block diagram of the Varian EPR spectrometer used in this investigation is shown in Figure C-3. A Klystron oscillator provides the microwave field a t 9.5 Kmc while a large electro- magnet provides an Ho of about 3400 gauss for this type sample. The EPR cavity is tuned to resonance with the microwave field with the sample in place inside the cavity. The cavity is connected to one arm of a microwave bridge, another a rm of which con- tains a crystal detector, and the bridge is adjusted for balance in the absence of electron resonance, During spin flipping energy is absorbed from the microwave field which unbalances the bridge and is sensed by the crystal detector.
The resonance data taken in this study was recorded on either a single or a dual channel recorder with the sample temperature between -180 C and + 300 C. U s e was made of a dual cavity with the second one providing a reference standard. The resonance spectra to be shown below were recorded by sweeping the field Ho about one hundred gauss on each side of 3300 gauss keeping the microwave frequency fixed at about 9 .3 GHz. The data recorded a s the intensity of the resonance signal is the radio frequency magnetization X"H rather than the susceptibility XI' or the power absorbed 1/2 (wH2X") due to the crystal detectors employed in the type equipment used here. These resonance absorption signals do however represent the first deriva- tion of the energy absorbed a s a function of applied dc field strength. Precise g values can be determined by measuring the microwave frequency and magnetic field strength at resonance or by comparison of the unknown signal with that of a known sample. This latter method was used in this investigation by employing a dual sample cavity.
Signal types detected. - Three basically different electron spin resonance absorption signals were recorded from the powder samples investigated on this part of the program. A fourth type was recorded from single crystal samples with alum- inum deposited over the oxide and might be caused by oxygen vacancies.
The first or main type of signal was detected from all silicon and silicon dioxide powder samples. This signal has been reported by others investigating the properties of silicon alone (Ref C-5 and C-6). The silicon signal is attributed to an oxygen- vacancy pair on the surface formed by the capture of an oxygen atom (or ion). This oxygen is adsorbed in a vacancy created by the mechanical damage when the silicon is crushed into a powder.
The second signal is the one of main interest in this investigation. Both it and the first signal a re shown in Figure C-4 for Sample A (TW) on which it was first detected. These signals were recorded a t room temperature from silicon dioxide
62

Figure C-3.- Block Diagram of the Varian V-4502 EPR Spectrometer Systems
63

0
H-
10
20
30
40
50
6(
7c
8C
9c
10c
SAMPLE AI ROOM T E M P
t- 15G -I
Figure C-4. - Discovery of Second Signal or Silicon Dioxide Grown Wet by Convection Method
64

0 grown wet at 1150 C to a thickness of 12,000 A. The second signal wil l be discussed below in more detail. It is normally only recorded from oxide samples grown wet.
The third signal was found with silicon dioxide baked in hydrogen for one hour at 1150 C. It had been reported earlier by another investigator (Ref. @-7) performing the same type study as being done on this program. H e did not detect any signal from silicon dioxide so he baked his sample in hydrogen and then found an additional reson- ance. This signal is not related to the second one being investigated here and will be only briefly discussed later.
Signal characteristics. - There are many factors which can affect the character of EPR signals made on the silicon dioxide samples. The impurity a t o k s in the unoxidized silicon for the cases of both donors and acceptors do not alter the absorp- tion curves. A f t e r oxidation the sample has oxygen interstitiats, thought to be the predominant diffusing agent during oxidation and leading to acceptor states, a s well as trivalent silicon and oxygen vacancies which are considered to produce donor states. These should contribute to the character of the absorption curves, along with the electron spin interactions with neighboring nuclei and the resulting local magnetic fields that alter the symmetry and lead to hyperfine splitting. Silicon is mostly (92 percent) Siz8, but the Si29 (4.7 percent) atoms, for example, have a nuclear spin of 1/2 while Si28 has zero nuclear spin. Thus, even the Si29 unpaired electron spins can interact with their nuclei and alter the absorption curve. The unoxidized silicon samples produced a strong symmetric absorption curve of about 25 gauss full width, while the oxidized sample showed an asymmetric complex curve indicative of multiple absorptions. The large signal to noise ratio with the unoxidized sample permitted a scan of 50 gauss in 10 minutes, and showed the absorption derivative curve was symmetric and without hyperfine splitting. The detected resonance absorption with the first oxidized sample was a t the lower limits of detection of the equipment. Figure C-5 is the resonance absorption curve for a wet oxide sample, which more clearly shows both the first and second signals at room temperature.
The thermally grown silicon dioxide on powdered silicon produced a multiple absorption curve in contrast to the single symmetric absorption curve obtained from bare silicon. To factor out any effect of the dopant (mainly phosphorus) in initial silicon samples, intrinsic silicon was then used. The absorption curves with intrinsic silicon were found to be nearly identical with the earlier 8-12 ohm-cm n-type samples. Thus the main absorption mechanism observed in both cases appears to be associated with surface damage in the silicon caused by the pulverizing of the single crystal wafers. This was also verified on the oxide samples by using H F to remove the oxide from one sample and comparing its absorption intensity with a bare sample. The use of powder samples was found to be necessary to provide enough surface area for detectable energy absorption.
A s noted above, it is thought that the main absorption curve is caused by oxygen- vacancy pairs produced at vacancy defects by pulverizing the silicon. A 100 cm2 surface area of silicon contains about 1017 atom sites with the surface mostly ( l l l ) , the main cleavage plane for silicon. This main absorption curve is reported to dis- appear if at least 10-4 cm of the silicon surface is removed by HF plus HNOQ but is
65

0
66
0 r(
0 0 0 0 0 0 c3 w u3 CD c- W

not removed by treatment with concentrated HF, HNO3, o r HCl acting alone (Ref C-8). Thus the main absorption appears to be associated with the silicon and the silicon surface which has an estimated ratio of ruptured bonds to surface atoms of 1:5 in these samples. The reduction in intensity of this main signal after oxidation may be caused by annealing effects during the high temperature oxidation process.
A large number of samples with various surface preparations were made in this study to investigate several phenomena reported in the literature. Two of these a r e the removal of surface damage by etching and the atomic surface reconstruction pro- duced by annealing (Ref C-9). A s mentioned above, a removal of more than one micron of silicon surface causes the EPR signal due to silicon surface damage in the powder samples to disappear. Samples ME and MEA had 750 microns of silicon removed from the surface, and yet a relatively strong symmetrical absorption was still present. This signal is still observed, along with the second signal, after growth of an oxide on these samples. It should be noted that the EPR spectrometer used here is one of the best available and has close to the theoretical detection limit of about 3 x 10¹¹ AH spins per gauss where AH is the signal width. The second phen- omenon on the effects of annealing was difficult to determine because of some very broad (1-2 Kg) drift lines recorded from the annealed samples which obscured any detailed line structure.
Figure C-6 shows the second signal (shifted to the left of the main signal) of sample MAlW (Monosilicon intrinsic, Annealed 6 hours in N2 at 800 C, and a Wet oxide grown) taken at -160 C that still has a relatively large second signal intensity after annealing. Figure C-7 shows the second signal being brought out on sample MAlEW at -150 C, which indicates how it could be overlooked at low gains while taking this type of data. that w e r e etched pr ior to oxidation in a and annealed after etch in b.
Figure C-8 shows the second signal on two other samples
Two samples, TW and M, were subjected to heat treatment in dry nitrogen during EPR scanning to seek any changes in the absorption curves. Data were recorded from 0 C to 300 C in 50 C steps. No qualitative change in the shape o r character of the curves was noted. The effect of heat treatment on silicon has been shown by low energy electron diffraction experiments to cause a surface rearrange- ment of silicon atoms (Ref. C-10). Several surface models have been postulated on the basis of these experiments. It is of interest to note that upon admitting oxygen during the low energy electron diffraction study at elevated temperatures the pattern shifted to show that the silicon atoms arranged themselves back to the diamond con- figuration of the bulk crystal. After a few hundred Angstroms of oxide form on the silicon the diffraction patterns disappear,
To more fully study the second signal of the oxides grown wet a temperature controller and a dual cavity were employed. The temperature of the oxide sample could be varied from -180 C to +300 C while continuously scanning. A reference sample of either pitch in KC1 o r DPPH was used in the reference cavity which remained at room temperature.
Samples A (TW) and MEA1W were cooled to -180 C to improve the absorption signal intensity and help in resolving the second peak. A rather unusual and inter- esting phenomenon was observed as the samples cooled, namely, the second peak appeared to shift position with respect to the main peak. This shift of about 30 gauss is shown for sample A in Figures C-9 and C-10. The physical origin of this second
67

Figure C-6.- Sample MAIW a t -160 C
peak and the temperature dependent shift mechanism were considered with known interactions which affect the g values. There a r e two types of magnetic dipole inter- actions that might be considered here since silicon is about 5 percent Si29, which has a nuclear spin I = 1/2. One is called the anisotropic dipolar hyperfine interaction caused by the ordinary coupling of the electron magnetic moment with the nuclear magnetic moment. The other is the Fermi contact, or isotropic hyperfine interaction, arising from the relativistic treatment necessary when the electron motion is near the nucleus, causing a very large kinetic energy increase. This again couples the dipoles and shifts the energy levels. The second signal does not appear to be due to the dipolar hyperfine interaction since this usually produces two separate peaks about the main one, nor is it characteristic of the signals reported in the literature for silicon surface damage or surface reconstruction due to heat treatment of the silicon. Since it has been observed only with the Si02 samples and for both the phosphorus doped and intrinsic silicon, it definitely appeared to be a signal originating from the oxide. It is possible that one of the signals is broadened with the temperature variation and only appears to shift.
68

0 0 rl 0 0, 0 m 0 E- O W 0 % v3
0 m
0 cy 0 rl 0
69

U
10
20
30
40
50
60
70
80
90
100
a. Sample MEW
0
10
20
30
40
50
60
70
80
90
b. Sample MEAlW
Figure 6-8. -Second Signal a t -160 C
70

u 0 cr)
I
u 0 v3
I
u v3 cu r( I
u . . I
u O 3 I 'ij *" 40 a)* . ' . . ' . ' I
u 0 I? I
71

Line shape and spin concentrations. - Another factor in analyzing resonance spectra i s the line shape. The shape of the absorption curve is influenced by many internal interactions that the unpaired electrons undergo and lead to two classes of lines. One class is called homogeneously broadened which arises when all the elec- tron spins have the same local environment. The second class is called inhomogen- eously broadened and refers to electron spins interfacing through a variety of different environments, such a s local impurities and defect centers. In EPR of solids most powdered materials exhibit inhomogeneous broadening depending on the anisotropies of the spin interactions. Two approximate line shape equations a re the Lorentzian and Gaussian:
I O 2 I =
T ( H - Ho) f 1
2 2 -b(H - Ho) T I = I e 0
(Lorentzian)
(Gaussian)
where Io is the intensity of the absorption line at its center, Ho is the magnetic field intensity at the center of resonance, and b and T are constants related to half-widths of the two type curves. By differentiating these equations the maxima a re found and the experimental data normalized for comparison. theoretical position (TP) on the curve versus the experiment position (EP) for a sam- ple of intrinsic powdered silicon. If a straight line results for a given absorption spectrum, then the absorption is either Lorentzian or Gaussian. A s can be seen, the line shape in this case is Lorentzian, and lines having this shape are usually homogeneously broadened. Similar calculations on data for oxidized samples did not produce a straight line for either plot. Physically, the Lorentz shape arises in a manner similar to a harmonically bound electron which, during the emission of radiation, is randomly and rapidly perturbed in its motion, producing a Lorentzian distribution of frequencies. the exchange of equivalent electrons between different paramagnetic silicon a toms when the electron wave functions overlap. For the sample here this would obviously lead to the case of homogeneous broadening. The Gaussian line shape :vi11 arise when each paramagnetic electron sees a slightly different ifiternal magnetic field from neighboring nuclei or electrons. An example of this would be a substitutional impurity producing a variation of the total field the electron sees during the spin flip process. There is no reason to expect that the Si02 samples should produce a Gaussian line shape since in general the data from complex systems such a s this rarely fit either line shape.
Figure C-11 shows the plots of
In EPR measurements this perturbation can occur through
It i s possible to measure the number of unpaired electron spins for a given absorption signal by comparing it to the signal of a known standard. This has been done only on a silicon sample using its signal. A standard sample of 0 . 1 percent pitch in KCl was used in the reference side of the dual cavity and the dual data recorded. The standard has 3 x 10¹⁵ electron spins per centimeter of length. The
72

6
5
4
TP 3
2
1
0 0 1 2 3
EP
L LJSSIAN
4 5
Figure C-11.- Line Shape Calculations
73

two samples were scanned then interchanged and scanned again. Using the observed g a h settings and the measured first moments of tkie absorption derivative curves the spin concentration of the silicon was calculated to be 3.3 x 10¹⁴ spins per cm or a total of 8.4 x 10¹⁴ spins with an estimated accuracy $25 percent, This information provides a qualitative comparison os spin concentration for the silicon dioxide samples where it is not possible to measure their moments because signal one and signal two overlap each other.
Treated oxides. - A s the large number of articles in the literature indicate, there are many effects such as ambient (Ref C-11), thermal (Ref C-12), chemical and oxide growth parameters which can cause changes in the electrical character- istics of silicon devices passivated with silicon dioxide, Most of these are associated with either oxide states, interface states or oxide defects acting as trapping sites. To gain more experimental data on the oxide samples and the second signal studied here, a number of them w e r e treated with chemical contamination. The first samples to be treated w e r e those in which the silicon powder w a s Contaminated with HF, NaOH and NaCl prior to oxidation. The second signal was found to have increased in s ize with these contaminated samples.
It appears from the data that both H F and NaCl contamination produce a larger second signal which exhibits the same thermally activated g value shift o r line broadening. Bare silicon contaminated with NaCl o r H F gave resonance signals with quite a bit of drift and it was not possible to ascertain the presence of a second signal from them. Information relevant to these samples and the resulting EPR data is given in Table C-3 where the notation (MW+HF) means the oxide was grown wet on type M silicon and then HF was added directly to the sample for temperature and time shown. The symbol (M1+NaC1) W means silicon type M1 was soaked in NaCl and the oxide then grown wet on the contaminated oxide.
.
From the data it was found that silicon contaminated with NaCl and silicon dioxide contaminated with H F gave an increased second signal. This increased second signal is shown in Figure C-12 for sample (M1 + NaCl) W. *
This sample was prepared by soaking 32 ohm cm powdered silicon in a 10 percent solution of NaCl. A f t e r the solution had dried the sample was placed inside the oxida- tion furnace a t 1150 C and a wet oxide grown for 8 hours. EPR data recorded a t various temperatures between -184 C to 300 C showed a marked decrease in the signal quality above 0 C.
The scan for -120 C was run in the single cavity while the others were taken with the dual cavity during the same run using pitch in KC1 for a reference. The noise is large from the reference cavity because of the low frequency modulation of 200 cps used on it.
*(Note that dual cavity data was taken in red and blue ink. The oxide samp1e.k identified in the figures here by the arrow. )
74

TABLE C-3 EPR SAMPLE DATA AND RESULTS
Contam- Sample Oxidation Oxidation ination
Preparat ion Period Tempera ture Per iod
(M+HF) W 8 h r 1150 C - (MW+H2) 8 h r 1150 C 1h r
8 h r 1150 C - (MW) (MW+HF) 6 h r 1150 C 6 h r
(MW+Na C 1) 6 h r 1150 C 6 h r
- 6 h r NaC 1)
(MW+HF) W 6 h r 1150 C -
(M+HF+ -
(MEW 6 h r 1150 C - (MEA1W) 6 h r 1150 C -
(MAlW) 6 h r 1150 C - (MD) 87 h r 1150 C - (MEW 87 h r 1150 C - (MIW+D*) 6 h r 1150 C -
(M1+NaC1) W 8 h r 1200 c - (M1+NaC1)D 90 h r 1200 c -
(M 1w +HF) 6 h r 1150 C 1 h r
(MIW+NaC1) 6 h r 1150 C 10 min
(TW) 6 h r 1150 C - (TD) 87 h r 1150 C - T (HCl+W) 7 h r 1150 C -
(T+NaOH) W 6 h r 1150 C - (TW+A *) 6 h r 1150 C
Contam- ination
Temperatur
1150 C
40 C
40 C
40 C
- 1200 c
- -
1200 c -
Type of Silicon
ohm-cm
Intrinsic
Intrinsic
Intrinsic Intrinsic
Intrinsic
Intrinsic
Intrinsic
Intrinsic
Intrinsic
Intrinsic
Intrinsic
Intrinsic
P 32
P 32
P 32
P 32
P 32 n 10
n 10
n 10
n 10
n 10
Signal Data
(See Kej
2M
2M, 3M 2M
ws ws ws
N2
2 s
2 s
2 s
N2
N2
ND
2L
2L
2s
ND
2 s
N2
ws 2M
N2 I I I
2 s - 2nd Signal sma l l 2M - 2nd Signal medium 2L - 2nd Signal la rge 3M - 3rd Signal medium E - Etched silicon WS - U'avy data, inconclusive N2 - No, 2nd Signal
ND - 2nd Signal not detected D* - Dry growth 2 hr, 1150 C A* - Anneal (Nz), 2 hr, 1150 C
A1 - Annealed (N2) 6 hr , 800 C
I I
75

-120 c -150 C
2"
SD
50
V "
-20 c Figure C-12. - Resonance Spectra of Silicon
at Temperatures Between -
+10 c Dioxide Sample (M1 + NaC1) W 180 C and +lo0 C
76

+30 C i-50 C
+60 C +loo c Figure C-12.- (Concluded)
77 .

1 From the data taken on sample (M + NaC1) W, it is seen that going from -150 C to -80 C produces little change in the position of the two signals. A t tempera- tures above 0 C i t is more difficult to interpret the data because of decreased sensitivity. Sample (T-tNaOH) W produced the same type second signal at -180 C as (M1+NaC1) W as shown in Figure C-13, indicating that sodium deserves serious consideration in determining the chemical structure of these oxides. An oxide structure with sodium ions bonded to trivalent silicon atoms near the silicon-silicon dioxide interface has been recently proposed from data on MOS capacitance experi- ments and is among those being studied for correlation with these EPR results (Ref C-13). It appears that the second signal doesn't shift much until the temperature is near 0 C and then it shifts rapidly above 0 C and perhaps broadens out above 40 6 .
To compare effects of contamination after oxide growth several samples shown in Table C-3 were contaminated with NaCl at both 1150 C and 40 C after oxidation and EPR runs made with them. The recorded signals were all very poor in that much drift and wavy patterns were found. It is not yet possible to conclude that the second signal is present on these samples even though a peak was usually found where it would be expected, along with many other nearby peaks. This is in contrast to contamination with HF. Samples contaminated with H F were made by either soaking the silicon prior to oxidation in a 0.5 percent solution of HF, followed by drying at 180 C, or by soaking a silicon dioxide sample in a 0.5 percent H F solution before insertion into the furnace at 1150 C or 40 C. The data were different from those with NaCl contamination above in that the strongest second signals were found with silicon dioxide soaked in HF. Figure C-14 shows the large second signal recorded on (MlW+HF) a t -180 C.
1 Figure C-15 shows a small second signal present for sample (M +NaCl ) which is unique in that no second signal had ever been found with an oxide grown dry. This signal appears in the same location as the second signal on wet oxide samples and also changes shape with temperature.
With the experimental data recorded here it is still very difficult to postulate the identity or origin of the second signal because many substances have g values near this one and the physical system under consideration is quite complex. Even silicon-silicon surfaces without any heat treatment are not well understood. However, it appears that the second signal is related to the presence of sodium in the oxide for those samples contaminated with NaCl o r NaOH prior to oxidation. The effect of baking in hydrogen, annealing in an inert ambient such a s nitrogen and growing a dry oxide is to reduce the intensity of this second signal. For those oxides contaminated with HF it is possible that the H F reacts with bare silicon, either by etching through the oxide, o r by acting on bare silicon caused by incomplete oxidation a t points where the silicon particles were in contact with each other during oxide growth.
Additional EPR data were taken on samples (M W + HF), (M + NaC1) and (TW). Of particular interest are the results on sample (MlW + HF) under atmospheric and reduced pressures shown in Figure 6-16. It is evident from the figure that outgassing of the H F treated sample (at 4 x 10⁻² Torr) produces a significant reduction in the second signal. The second signals of the other two samples, however, were unrespon- sive to outgassing. The evidence appears to implicate the H F + Si system a s a source
1 1
7 8

50
60
70
80
90
100 I I I
Figure C-13.- Sample (T + NaOH) W at -180 C
~~
Figure C-14.- Sample (MIW + HF) a t T = -180 C
79

Figure C-15. - Small Second Signal at -180 C Detected From Oxide Grown Dry on Silicon That Had Been Contaminated With NaCl
80

10
20
30
40
50
60
70
80
90
a. Room Pressure
b. On Vacuum of Torr
Figure C-16.- Second Signal of Oxide Treated by HF Shown at -180 C Under Room Ambient and Then Under Small Vacuum
81

of the second signal. It i s known, for example, that SiF4 (formed in the present experiment by HF + Si02) interacts with silicon a t elevated temperatures to produce the biradical Si2F4 containing unfilled silicon orbitals. However, the reverse of this reaction a t still higher temperatures should result in release of SiF4 and deposition of "atomic" o r finely divided silicon. This possibility fits well with the experimental conditions employed because the specimen (M1W + HF) was baked for ten minutes a t 1150 C in an inert atmosphere after treatment with 0.5 percent H F solution. The residual finely divided silicon then could act a s adsorption sites for condensable gases during EPR Spectrometry. This also is a real possibility because the EPR Spectra were taken a t -185 C, and the second signal reappeared on admission of room a i r to the outgassed sample. Although the possibility of residual contamination by fluorinated species cannot be ruled out, the reversibility of outgassing effects on the EPR signal appears to be associated with the sorption of atmospheric components on surfaces rendered sensitive by the H F treatment.
The implications of this finding with respect to integrated circuit processing may be significant because of the extensive utilization of pattern etching with H F followed by diffusions o r other high temperature treatments. If the EPR second signal can be associated with positively charged atomic vacancies the present evidence indicates that H F may play a role in causing inversion and that steps should be intro- duced to remove it after it has served its function.
The independent main signal on silicon powder has been shown (Ref C-14) to be somewhat sensitive to various ambients and pressures, possibly a s a result of residual surface damage. The lack of main signal change may be due to intact oxide passivation o r to prior removal of surface damage by etching. According to ear l ier evidence it is highly unlikely that this main signal is associated with defects in the oxide structure,
Oxides baked in hydrogen. - Only one other investigator has reported a study of silicon dioxide by EPR (Ref C-7). Silicon powder was made from p-type float zone silicon with a specific resistivity of more than 500 ohm cm. No signals other than the main one were found on these samples after they had been oxidized for two hours a t 1200 C in dry oxygen. The samples w e r e then baked in hydrogen a t 1000 C for 10 minutes and a new signal found at liquid nitrogen temperature. This second signal disappears if the sample is annealed at 1200 C in dry oxygen after the hydrogen bake. It was postulated from a. defect model by Revesz (Ref C-4) that the hydrogen a t high temperature causes the formation of broken oxygen bridges and trivalent silicon with resulting unpaired electrons. This new signal found by Nishi is not one of those found during our investigation except that we w e r e able to reproduce his signal by baking sample M W in hydrogen for one hour at 1150 C. Nishi's failure to find signals relat
because of the large silicon particles used. The signal found with sample (MW + H) here, referred to a s the third signal, did not show any temperature dependence. Since it has a lower g value than the main signal, while the second signal studied here has a higher g value, this third signal has not been pursured further, Many factors associated with heat treatments are possible in silicon-silicon dioxide samples that receive heat treatments (Ref C-15).
le to the silicon dioxide is due to several reasons. His oxide was only 2000 ?? thick, it was grown dry on float zone silicon and the oxide area was small
82

It is also of interest to note that Balk at IBM (Ref C-16) is reported to have performed E PR experiments on thermally-grown silicon dioxide with the results that a signal was found only when the final preparatory step did not include a hydrogen- containing species. This is opposite to the results of this study since only the wet oxides show additional spectra.
Metallized oxides. - Several silicon dioxide samples have been grown on single crystal silicon and then metallized with aluminum dots to measure possible oxygen vacancy generation as proposed by Burkhardt (Ref C-17). samples has produced a very strong single signal. This signal is not thought to be from the aluminum itself since it will be paramagnetic only i f ferromagnetic impurities are present in the aluminum. It does appear likely that this absorption peak may be a result of unfilled atomic orbitals arising from competition between aluminum and silicon for oxygen atoms originally linked only to silicon atoms.
EPR data taken on these
Burkhardt's experiments on the dielectric relaxation of silicon dioxide led him to rule out sodium ions as a source of oxide instability and to postulate an oxygen vacancy generation mechanism based on a reaction of deposited metal with the silicon dioxide. To explore this possibility by EPR several samples of 800 on single crystal silicon (10 ohm-cm, n type) with aluminum dots deposited on them by E-beam evaporation w e r e prepared. long and 3 mm wide. Although the sample area was small (2.5 cm x 0.15 cm) the absorption signal was much larger than any recorded previously, including those of bare silicon powder with its much larger surface area. Silicon dioxide samples grown on single crystal silicon without aluminum have previously produced no signal even at high gains. This sample, (TW + A l ) , was only run at room temperature and produced only the single signal.
oxide grown
The wafers were scribed into strips one in.
It has been reported {Ref C-18) that no resonance signals a re obtained from aluminum between 4K and 300K unless ferromagnetic impurities are present. The aluminum used here was 99.999 percent and had been analyzed by emission spectrog- aphy, showing copper, iron and magnesium present in levels between 0.001 - 0.0001 percent. For the iron this represents about 10 l6 spins per cm3. On a total volume basis the aluminum present in this sample was calculated to have about 3 x 10l1 spins which is too small to produce a detectable absorportion signal with the available equipment. It appears, therefore, that the present signal is derived solely from an interaction between the aluminum deposit and the oxide surface, in sub- stantial agreement with Burkhardt's model. The g value of this single signal has been calculated using the dual cavity and found to be 2.0023 f 0.0004 at -180 C. It does not appear to be temperature dependent. these samples where analyzed with the electron microprobe. No elements above atomic number four other than aluminum were found on the oxide. Two of these samples were etched in HC1 and then tested. These gave a multiple signal at zero C while only showing a single one a t -180 C as shown in Figure C-17. This effect was reversible. Electron microprobe analysis of these two samples revealed carbon and chlorine around the residual aluminum dots. The origin of this carbon contamination of more than 2 percent by weight is unknown and has not been pursued further.
To check for possible trace impurities
83

10
20
30
40
50
60
70
80
90
a. T = -180 C
c
b. T = - 5 0 C
Figure C-17. - Spectra of Single Crystal Silicon With the Aluminum on Oxide Partially Dissolved by HC1.
84

Summary
From the data taken on many oxide samples in this study it appears that sodium and fluorine can be retained in the thermally grown oxides in relatively large amounts. Figure C-18 shows the possible defect structures that can exist in the silicon dioxide samples studied here. Table C-4 presents a summary of the signal types detected.
Attempts have been made to determine g values for these signals by comparison with either pitch in KC1 or DPPH. The main obstacle to this has been the partial overlap of the second signal with the main one due to the silicon. It appears from the data taken with the dual cavity and plots of AH vs g that the second signal has a g value of 2.011 f 0.001 at -180C with AHp-p = 9 gauss which overlaps the reported main signal at g = 2.006. The second signal is either temperature - dependent and shifts 17 gauss past the main signal when going from -180 C to +50 C or one signal has much line broadening with temperature. Introduction of trace contaminants during oxidation increases this signal intensity markedly and leads to the postulated retention of sodium and fluorine impurities as the origin of the second signal.
The unexpected resonance signal for the samples with aluminum over the oxide is considered important because aluminum is widely used as interconnections over the oxide on integrated circuit surfaces. This type oxide sample is actually simplier to investigate than the powder samples since it is on a single crystal of silicon. It could be electrically biased during EPR scanning to provide further data on the capaci- tance voltage behavior of the oxide. It is recommended that this type sample be further studied rather than the silicon powder samples which are very difficult to analyze because of the overlapping temperature dependent behavior of the resonance signals and the more difficult nature of powdered silicon material. The relevance of this type sample to modern planar technology further supports this recommendation.
References
c-1,
c-2
c-3.
c-4.
'Y3ome Phenomena Occurring in Thermally-Grown Silicon Dioxide" P. J. Holmes Royal Aircraft Establishment Technical Report No. 66226, July 1966 also AD644-891
"The Oxide-Silicon Interface" R.P. Donovan Physics of Failure in Electronics Vol. 5 6/67.
"A Bibliography of Metal-Insulator Semiconductor Studies" E. S. Schlegel IEEE Trans. on Electron Devices V O ~ . ED-14, NO. 11, NOV. 1967
"The Defect Structure of Grown Silicon Dioxide Films" A. 6. Revesz IEEE Trans. ED-12 97 (1965)
85

86
O* vi" F:
*"
m a, +-, cd 3f

E
z
rn E
rn $
rn E
rn $
rn E
rn $
rn E
rn $
a E: 0 0 a, m
u 0 Q)
a
87

C-5. llParamagnetic Resonance of Defects Introducted Near the Surface of Solids by Mechanic Damage" G. K. Walters and T. L. Estle J. of Appl, Phy. 32, 10, Oct. 1961 p. 1854
lfAnnealing Effects of Paramagnetic Defects Introduced Near Silicon Surface T. Wada, T. Mizutani, M. Hirose J. of Phy. SOC. of Japan 22 - No. 4, 1060, April 1967.
C-6.
C-7. lfElectron Spin Resonance in Si02 Grown on Silicon" Y. Nishi Japan, J. Appl. Phy. 5 (1966) 333
"Electron Spin Resonance Experiments on Donors in Silicon1' G. Feher Phys. Rev. 114, 1219 (1959) llLow-Energy Electron Diffraction Studies of (100) and (111) Surfaces of Semiconducting Diamond" J. B. Marsh and H. E. Farnsworth
C-10. "The Structure of Crystal Surfaces" L.H. Germer Scientific A me rican - 221 No. 3, 32 (March 1965)
C-8.
C-9.
. Surface Sei. 1 (1964) 3.
C-11. "EPR From Clean Single-Crystal Cleavage Surfaces of Sif1 D, Haneman Phy. Rev. Letters 20 No. 16, p. A4 (April 1968)
C-12. llComparison of Thermal Behavior of Vacuum-Crushed, Air-Crushed, and Mechanically Polished Silicon Surfaces by E PR. D. Haneman, M.F. Chung, A. Taloni Phy. Rev. Letters 20 No. 16, p. A4 (Apri€ 1968)
C-13. "On the Role of Sodium and Hydrogen in the Si - Si02 System'' E. Kooi and K. V. Whelan App. Phy. Letters No. 8, 314 (Oct 66)
C-14. ?lElectron Paramagnetic Resonance Study on Silicon, Germanium, and Gallium Arsenide Surfaces Interacting with Adsorbed Oxygen" P. Chan and A. Steinemann Surface Science 2 (1966) 267.
C-15. rrOn the Nature of Interface States in an Si02 - Si System, and on the Influence of Heat Treatments on Oxide Charge" M.V. Whelan Philips Res. Repts. 22 289 (1967)
88

6-16
C-17,
C-18.
fTracer Evaluation of Hydrogen in %earn-Grown Si% Films" P.J. Burkhardit J. of Electrochemical Soc. 114 No. 2, p 396, Feb, 1967
"Dielectric Relaxation in Thermally Grown SiOz Films" P. J, Burkhardt IEEE Trans, on Electron Devices ED-13 NO. 12, 268 (1966)
"Electron Spin Resonance Absorption in Metals" G. Feher and A. F, Kip Phy. Rev. 9_8, 337 (1955)
89

90

APPENDIX D. ELECTRON SPIN RESONANCE SPECTRA OF IMPURITIES AND OXIDATION STATES IN THERMALLY GROWN SILICON DIOXIDE"
B Y C. W. SCOlT AND J. E. MEINHARD
A previously unreported electron spin resonance signal has been identified with the Si-Si02 system produced by partial thermal oxidation of silicon which may be associated with the trapping states characteristically observed by other techniques. Oxide samples were prepared by pulverizing single crystal intrinsic silicon and exposing them to wet or dry oxygen at 1150C. X-band measurements at 77 K on samples prepared under moist conditions revealed an absorption at g = 2.011 f 0.001 with AH -p = 9G which partially overlapped the silicon crystal defect absorption at g = 2.0& . The g value of the signal at 2.011 was found to be temperature dependent and shifted 17G through the silicon crystal signal in going from 77 K to 350 K. Inroduction of trace contaminants during oxidation, such as sodium or fluorine, increased the signal intensity and led to the postulation of the presence of radical species as the origin of this absorption. Additional independent signals have been detected from samples annealed in hydrogen and from samples with high purity aluminum deposited on the oxide, These have been tentatively associated with the presence of incomplete oxidation states.
(Abstract of talk delivered at the American Physical Society Meeting, University of Washington, September 1967)
*Work supported by NASA-ERC
91

92

APPEND
F. J.
X E. FACTORS INFLUENCING DIELECTRIC DEFECTS IN SILICON OXIDE LAYERS
R V
BESSER, J.E. MEINHAYR'D, AND P.H. EISENBERG
Abstract
The incidence of dielectric defects in thermally grown silicon oxide films has been investigated utilizing previously developed defect detection techniques. The oxide layers exhibited a strong dependence of dielectric defect density on film thick- ness, on moisture content of the oxidizing ambient and on type and concentration of the substrate dopant. Characterization of the defects indicates that they are primarily pores in the oxide layer. Mechanical stress resulting from the mismatch in thermal expansion characteristics of the silicon and the oxide is postulated as an important defect-producing mechanism and the experimental results are interpreted on this basis.
Introduction
In modern silicon planar technology, silicon dioxide layers are required to perform the threefold function of surface passivation, diffusion masking and electrical insulation. the f i rs t two capabilities which are concerned with the migration of atoms, molecules, and ions on o r within the oxide layers. Comparatively little effort has been devoted to the determination of the frequency of incidence, process origin, microscopic nature, and structural basis of regions of anomalously low dielectric breakdown in oxide films. This lack of emphasis has been due partly to the greater urgency attached to the solution of the migration problems, which lead to gross degradation of electrical device parameters, and partly to the lack of adequate techniques for dielectric defect detection. However, it is now evident that oxide dielectric failures represent a serious threat to the reliability and yield of monolithic silicon micro- electronic devices, (see Ref E-1. ) The advent of MOS technology with its stringent requirements on gate oxide purity and dielectric integrity, coupled with the interest in the development of large scale MOS and bipolar arrays, has made the requirement for large areas of dielectrically sound oxide on a silicon slice even more critical.
Extensive experimental and theoretical consideration has been given to
In view of the present and imminent demands on the electrical insulation properties of oxide layers, a systematic investigation was undertaken to examine the physical and chemical processes which influence oxide dielectric quality and to determine the nature and origin of dielectric defects and their relation to the oxide structure. nature and mechanism of defect formation and the establishment of optimum condi- tions, compatible with device requirements, for reduction or elimination of dielectric flaws. The factors whose influences on defect incidence were considered are the condition of the silicon substrate, the growth conditions of the oxide, and the process treatments undergone by the wafer during device fabrication.
*Delivered at the Electrochemical Society Meeting, Philadelphia, Pennsylvania
The ultimate objective was the achievement of an understanding of the
.
13 October 1966.
93

Experimental Method
Silicon substrates. - The silicon wafers used in the portion of the program dealing with effects of silicon substrate condition and oxidation techniques were single crystal Czochralski grown samples with (111) surfaces. Both acceptor (boron) and donor (phosphorus, antimony) doped wafers w e r e examined. The car r ie r concen- trations were in the range from 5 x 10¹⁴/cm3 to 5 x 10¹⁹/cm3. Some wafers with an n-type epitaxial layer on a p-type substrate w e r e studied, but the majority of the s amples were nonepi taxial. Sever a1 different silicon su r face preparation techniques were utilized including chemical polishing, chemical-mechanical polishing sequences, HC1 vapor etching, and preoxidation cleaning. Although no particular degree of crystalline perfection was specified o r maintained on the crystal slices, all specimens were obtained from sources meeting standard cri teria for device fabrication.
For the investigation of the influence of process treatments during device fabrication, groups of wafers were obtained from three major integrated circuit vendors. The wafers were selected fromvarious points in the process of fabrication of a digital integrated circuit and are thus representative of the state-of-the-art in industry processes.
Oxidation conditions. - The slices were oxidized at temperatures from 1050 C to 1180 C in dry oxygen, wet oxygen, and wet nitrogen. The water bath temperature for the wet nitrogen growth was 25 C and for the wet oxygen case was either 25 C o r 99 C. The latter condition is referred to as steam growth during the remaiGder of the paper. Films were grown in the thickness range from 850 A to 12,000 A. ness determination was made by color comparison with previous ly calibrated standards,
Thick-
Defect detection. - A s previously indicated, a prerequisite of any study of this nature is the availability of an adequate means of detection of dielectric defects. Previously utilized techniques such as a high temperature ITCl etch (Ref E-2) o r C1 etching around 9OOC (Ref E-3 and E-4) are not conveniently applicable. Conse- quently, a program was initiated to attempt development of a nondestructive, reproducible, recordable, convenient, and functional test for oxide defects. The results of that program have been previously reported (Ref E-5) and the two techniques which were found to be suitable, electrophoretic decoration and electro- chemical autograph, w e r e utilized in this study for the observation of oxide defects. In the decoration method, a probe voltage of 5 v, a probe-to-wafer spacing of 2 mm, and a probe material of Ni were used. potential was applied for 5 to 10 minutes. Defect values w e r e obtained by counting decorations or autograph sites under a microscope.
In the autograph technique a 5 to 15 volt
Relationship of Experimental Parameters and Dielectric Defect Incidence
Film Thickness. - The experimental data demonstrated that the dielectric integrity of virgin thermal oxides is strongly thickness dependent. This variation with thickness is shown in Figure E-1 for the average of a typical group of samples oxidized under the same conditions. All. of the oxides studied show this same func- tional dependence of defect density and thickness; but the position and shape of the curve are influenced by a number of €actors, some of which are considered in this
94

220
200 - 180 -
m i 160 - I z 140 -
& 4 120 - c2 100 - E 8
8 0 -
60 -
0 2000 4000 6000 8000
OXIDE THICKNESS 6)
Figure E-1. - Defect Density Variation in Virgin Thermal Oxide
paper. The number of defects is relatively independent of thickness in the range greater than 4000 A but generally begins to increase gradually in the 2000-4000 A range with a very rapid increase below 2000 A.
oisture content of oxidizim ambient. - For oxides of a given thickness, the numbey of defects/cm2 is dependent on the amount of water vapor in the oxidizing ambient. The data in Table E-1 shows this effect on samples consisting of oxidized
95

p-type substrates and n-type epitaxial layers on p-type substrates. The doping level in these wafers was ~ 1 0 1 6 carriers/cm3 and there was no significant difference between the readings obtained on the various samples. It can be seen that the presence of water vapor in the growth ambient has a beneficial effect on the oxide defect inci- dence. Consideratiw of only the steam and dry 02 conditions might lead to the alter- nate conclusion that it is the rapid growth rate of the steam oxide whichis the significant factor. However, the wet 0 2 and wet N2 situations require growth times comparable to that of the dry 0 2 and yet their defect density is essentially equivalent to that of the steam grown oxide when film thickness corrections are made. Thus, it appears an oxide grown in a moist ambient will have fewer defects than one grown dry if all other conditions are the same. This effect was observed for all dopant types and concentrations studied, and for both expitaxial and nonepitaxial wafers.
Oxide Thickness
Etched oxide layers. - The same functional dependence of defect density on thickness that was determined on virgin oxides was also observed in oxide layers a s they were thinned by etching. However, the defect density at a particular thickness was greater for the thinned oxide than for the unaltered oxide which is in agreement with the results of Lopez (Ref E-6). Our data, however, does not reveal as great a dif- ference between the virgin and etched oxides of the same thickness as is indicated in his results since even the virgin oxide has a high density of defects in the 3000 A range. When the etched layer is regrown to successively greater thicknesses, the defect density decreases in a manner closely approximating the etch-back curve rather than the curve for the as-grown oxides. The growth, etch-back, and regrowth variations are shown for a steam grown oxide on one ohm-cm boron-doped substrates in Fig- u re E-2. The points on the growth curve represent measurements made on individual wafers grown to the indicated thickness while the etch and regrowth were performed on the slice on which the initial oxide was 8000 A thick. This type of variation is typical of that obtained on dry oxides as well. Thus regrowth provides somewhat of a curative effect in going from thin to thicker oxides, but the resulting oxide at a given thickness has more defects than one originally grown to that specific thickness.
Defect Density (cm-2)
TABLE E-1 EFFECT OF MOISTURE ON DEFECT DENSITY
3650
3100
3950 A
3850 A
Growth Condition
-23
41
22
60
Steam
Wet 0 2
Wet N2
Dry 02
96

400
360
320
28 0
240
200
160
120
80
40
0
I
0 GROWN
0 ETCHED
A REGROWN
0 1000 2000 3000 4000 5000 6000 7000 8000
OXIDE THICKNESS 6) Figure E-2. Comparison of Defect Densities in Grown,
Etched Back, and Regrown Oxides
97

Silicon surface preparation. - The effect of preoxidation surface treatment of a silicon substrate on defect density was also investigated on the wafer groups shown in Table E-2.. The wafers were oxidized under identical conditions and the defects measured on each group. The oxide thickness was 1200 the effect of surface preparation on oxide dielectric integrity is relatively small in this thickness range. The general trend, however, was that oxides grown over sur- faces in which the chemical polish was the final step contained fewer defects than those grown on wafers with a final mechanical o r mechanical-HClvapor polish. It has been shown (Ref E-7) that mechanical polishing results in a certain amount of structural damage to the silicon surface and may leave particles of the polishing compound embedded in the polished surface. This may be the origin of the somewhat higher defect density in the oxide grown on such wafers. Work is proceeding on the evaluation of particulate contamination and substrate crystal defect contributions to oxide flaws, and these results will be reported in a future paper.
and the results indicate that
C
Oxidation temperature and growth rate. - A dependence of dielectric integrity upon growth temperature (or growth rate) was observed for oxide layers less than 2000 A thick grown in dry 02 over heavily boron-diffused regions. The layers grown at lower temperatures contained more defects than those of the same thickness grown at higher temperatures. The variation with growth temperature became less as the film thickness increased. These results are shown in Figure E-3. The results of the steam and wet N2 oxidations shown in Table E-1 also indicate an absence of growth rate effects in thicker layers although it may be that the presence of moisture is the dominant influence in wet oxides. The substrates in Table E-lwere also more lightly doped than those in which the growth rate influence was seen.
D
Substrate impurity type and concentration. - Preliminary work in other phases of this investigation indicated that oxides grown over heavily boron-doped regions i n dry 0 2 were more defect-free than those grown over regions of low boron concentration o r over phosphorus-doped regions. This suggested a possible influence of substrate impurity type and concentration on the integrity of the grown oxide. Since the amount of impurity incorporated in the oxide and the degree of partition of impurity between the oxide and silicon are partially dependent on the growth conditions, it was decided to vary impurity type, impurity concentration, and oxidation conditions on a group of samples to determine the combined influences of impurity and oxidation procedure.
TABLE E-2 SILICON SURFACE PREPARATION
Chemical Polish
Mechanical Polish
Wafer Group
Surface Preparation
Chemical Polish
Mechanical Polish
A
Chemical Polish
Clean*
B
Chemical Polish
Mechanical Polish
Chemical Polish
Clean*
E
Chemical Polish
Mechanical Polish
HC1 Vapor Etch
C1ea.n"
*The clleaning was in deionized water and organic solvents. 98

0 0 d
' 8 d
0 0 0 m
0 0 v) N
0 0 0 cu
0 0 In I4
0 0 0 rl
0 0 v)
B 9 8 n m
+-, 0 Q) tcc
d I
m
Q)
8.
0 ua
'99

The silicon samples consisted of the four groups of wafers shown in Table E-3. A wafer from each group was subjected to each of the oxidation conditions shown in the table.
A chemical-mechanical-chemical polishing sequence was used on the wafers and the oxidation temperature was 1150 C. The defect densities were measured and recorded on each sample after which each film was etched back to 2000 a and the defects remeasured. The results are shown in Table E-4.
The values labeled "etched" a r e the defect densities i n each oxide after the layers had been chemically thinned to 2000 A. There are a number of observations and con- clusions that may be drawn from these data:
1.
2.
3.
4.
In the steam and WD oxides, the heavily boron-doped sample has a much higher defect density than the others initially, but a substantially lower density than the others after etching.
The heavily boron-doped sample has a lower defect density in the dry oxide than in the s t ream oxide in contrast to the other three samples. The den- sitities in the initial oxides of Group C are considered to be anomalously high for reasons which will be presented in the Discussion section.
The WD sequence produces the best overall oxide when evaluated on the basis of freedom from both initial defects and fast-etching imperfections.
Each boron-doped sample has essentially the same density of defects in the initial oxides formed by WD and DW sequences, but the DW etched oxides have more defects than the WD etched oxides. The superior etch- resistance of the WD oxide compared to the DW i s also evident i n the n-type samples, but the initial defects were higher as well.
TABLE E-3 SUBSTRATE IMPURITIES AND OXIDATION CONDITIONS
1 Wafer Group Dopant Carr ie r concentration (cm-3)
A
B
C D
Antimony
Phosphorus
Boron
Boron
Oxidation Conditions
1.
2. 3.
4.
8000 A grown in steam (w)
8000 A grown in dry 0 2 (D)
4000 A grown in dry 02 , followed by 4000 A in steam (DW)
4000 A grown in steam, followed by 4000 in dry 0 2 (WD)

TABLE E-4 EFFECT OF SUBSTRATE DOPANT AND OXIDATION CONDITIONS ON
DIELECTRIC DEFECT DENSITIES IN Si02 LAYERS
Wafer Group Dopant Concentration ( ~ m - ~ )
Oxidation Conditions:
1. Steam
A. Initial
B. Etched
2. Dry Oxygen
A. Initial
B. Etched
3. Steam-=Dry Oxygen (WD)
A. Initial
B. Etched
4. Dry Oxygen-Steam (DW)
A. Initial
B. Etched
Defect Density (cmm2)
A B C D
1017 (Sb) 5 x lOI4 (P) 5 x lo1’ (B) 1015 (B)
20 12 12 6 7
549 5 16 281 449
28 29 21 21
15 15 35 15
527 428 195 2 97
71 44 38 19
66 3 46 9 414 388
(1) Oxide destroyed by etching.
(2) Etched to 1850 rather than 2000 A. Comparison of this value with 2000 ft films is not completely valid because of the sharp increase in defect density with decreasing thickness in this region. .
5. Oxides from sample group C are consistently better than those from the other groups after etch-back except in the case of the DW sequence where they are comparable to Group D oxides.
6 . The phosphorus- and antimony-doped wafers have consistently poorer oxides after etch-back than the boron-doped wafers.
The interpretation of these results is deferred to the Discussion section.
101

Integrated circuit fabrication processes. - The wafer samples obtained from commercial manufacturers of integrated circuits w e r e subjected to evaluation to determine the variation of defect density with processing and to compare the vendors' processes. The data are shown in Table E-5.
The difference in defect variation with process stage is a manifestation of the difference in techniques between vendors and points out the sensitivity of oxide integrity to changes in processing.
One of the most significant points of this evaluation which does not appear explicitly in the table is the observation that a significant portion (30-90 percent) of the total defects after the initial oxide stage occur at abrupt transitions in the oxide thickness such as diffusion window perimeters.
As can be seen in the case of vendor A, a suitable pyrolytic oxide can be effec- tive as a late process step in reducing defect density to a low level while a thermally regrown oxide appears to be relatively unsatisfactory.
Previously reported data (Ref E-5) 3n stress levels in oxide films a s a function of process steps undergone indicated that defects generally increase with stress level and amount of mechanical flexing due to repeated temperature excursions from room temperature to the vicinity of 1000 C.
TABLE E-5 COMPARISON OF DEFECT DENSITY (cm-2) AMONG PROCESSORS
Process Step Vendor A Vendor B Vendor C (non-epi) @Pi) @Pi)
1 Initial Oxide 5" 23
I After Isolation Diffusion 3.4 10
After Collector Diffusion 5
After Etch Pr ior to Base Diffusion
After Base Diffusion
After Emitter Diffusion
After Contact Opening and Thermal Oxide Regrowth** 250
2.0
3.1
3 . 1 0 . 8
After Contact Opening and Oxide Deposition 3 4.7
*Eachnumerical entry represents the average of the counts on a group of wafers.
**Experimental run only; not characteristic of present product
102

Nature and Origin of Dielectric Defects
A number of possibilities can be visualized as the source of regions of anoma- lously low dielectric breakdown in insulating layers. These would include actual holes or pores in regions of surrounding continuous oxide, high conductivity or f ast-etching loci in sound oxide due to foreign inclusions or intrinsic structure anomalies, and thin spots or depressions in a nominally uniform thickness layer.
Techniques such as optical microscopy, Nomarksy phase contrast microscopy, preferential etching, and replicate electron miscroscopy were used in conjunction with the developed detection techniques in an attempt to characterize the dielectric defect loci. The evidence, as reported previously (Ref E-5) and in a forthcoming paper (Ref E-8) indicates that dielectric fa i lures are a result primarily of actual physical openings in the insulating layer rather than regions of enhanced conductivity in uniformly thick oxide. In some cases the fissures occur in mound-like elevations in the oxide which may be a result of foreign particle inclusion or buckling of the oxide. Electron microscope replica photographs of typical defects are shown in Ref 8.
One of the origins of dielectric defects is felt to be the mechanical stress in the oxide layer as a result of the difference in coefficient of thermal expansion between Si and Si02. This effect is considered in detail below in conjunction with a proposed model to explain the experimental results. Other possible sources of dielectric defects, such as particulate contamination of the wafer surface and crystal defects in the substrate, are being investigated; but the results are incomplete at present.
Discussion
Consideration of the experimental data from this investigation in conjunction with the present knowledge and conception of the silicon oxide structure and the results of other studies on the properties of Si02 and silicate glasses leads to a consistent picture of the nature, structural roots, and process origins of regions of anomalously low dielectric breakdown.
Basic to our understanding of the oxide properties is the concept of an intrinsic oxide. Revesz (Ref E-9) has pointed out the ideal amorphous network of silicon- oxygen tetrahedra can be considered as an intrinsic or defect-free material and any deviation from it as a structural defect. This definition will obviously include some structural defects which are unrelated to dielectric breakdown loci. It will be seen, however, that certain types of oxide structural modifications are intimately connected with oxide dielectric integrity,
The intrinsic silica structure is quite rigid with strong bonding between the Si and 0 atoms in the tetrahedra and with the tetrahedra joined at the vertices. The thermal expansion characteristics of Si and Si02 are quite different in the range from room temperature to diffusion-oxidation temperatures (1000- 1200C), and consequently mechanical stresses resulting from this differential are expected in the oxide and the substrate of siliaon wafers thermally oxidized and subsequently cooled to room
103

temperature. * The linear thermal expansions of silicon, bulk amorphous fused silica and a borosilicate glass are shown as a function of temperature in Figure E-4. The silicon data are taken from Ref E-10 and the silica and glass data from Ref E-12. can be seen that the expansion of the oxide is smaller than that of the silicon below 700 C. Thus, a compressive stress would be expected in the oxide layer at room temperature. Rupture of the oxide as a result of this stress could produce dielectric flaws in the oxide layer, This stress has been experimentally verified (Ref E-5 and E-11) and is found to be in the range from 30,000 to 60,000 psi. The expansion characteristic of silicon apparently exhibits unusual behavior (Ref 13) above - 1000 C. However, no measurable stress can develop in the Si-Si02 structure until the tempera- ture drops to a value where the oxide becomes essentially rigid. This setting point is generally taken to be between the strain and annealing points for a glass (Ref E-12) 990 C and 1050 C respectively for pure Si02. The actual value is not sharply defined and depends on the thermal history of the sample. Thus, the significant region to consider in the thermal expansion characteristics is below the setting point of the silica (-1000 C). If curves such as shown in Figure E-4 a r e plotted to intersect at the setting point a display of the expansion mismatch at lower temperatures is obtained.
It
The effect of structural defects such as hydroxyl groups and network forming or modifying cations is to alter the silica structure producing a less rigid network. This alteration is reflected in changed physical and electrical properties. For example, the introduction of either boron (Ref E-12) o r hydroxyl (Ref E-14) into the Si02 structure increases the thermal expansion coefficient and decreases the viscosity (lowering the setting temperature) of the modified material relative to the intr insic oxide. The low temperature (0-400 C) expansion coefficient and setting point for a borosilicate glass such as Corning 7740 a r e 33 x pared to 5.5 x lov7 and -1000 C for pure Si02. Such a glass would provide a better match to the thermal expansion characteristics of Si than the pure oxide. A similar improvement would be obtained by the introduction of hydroxyl groups into the intrinsic silica. It is seen therefore that both of these structural modifications should lower the low temperature compressive stress in an oxide layer formed on a silicon substrate a t temperatures in the vicinity of 1000 C. The properties of phosphorus-modified silica are not as well known, but it is expected that they would follow the same general tendency toward a less rigid structure having greater thermal expansion and less viscosity than pure silica.
and-500 C respectively a s com-
It has been demonstrated that hydroxyl groups can be introduced into silica by high temperature exposure to water vapor (Ref E-15), that oxides grown in steam or wet ambients contain measurable amounts of hydrogen (Ref E-16, E-17, and E-18) and that thermally grown oxides incorporate varying amounts of the substrate dopant into the oxide structure (Ref E-19 and E-20). Therefore, the substrate dopant will be responsible for a defect structure in the thermal oxide under both wet and dry oxidation conditions with hydroxyl groups included in the former case. The experimental data are considered below in terms of these concepts of oxide structure.
*There is no assurance that the detailed structure of bulk silica glass is identical to that of amorphous oxide films grown on silicon substrates. However, the published properties of silica glass and thermally grown oxide films are in sufficient agreement to allow the assumption of approximate€y identical expansion characteristics.
104

0 0 0 Q n ea
0
h d d ) NOISWdX3 'IVNU3H& UV3NI7
0 0 P-
O 0 eo
0 0 VJ
0 0 w
0 0 n
0 0 N
0 0 ?4
rn 0
m k a,
3 -4
J-,
3 k cd c u
%I 0
m k Ed a 0 u I
.a+
E
-? w
105

When a uniformly doped silicon wafer is thermally oxidized, there occurs a partition of the substrate dopant between the oxide layer and the substrate, and the final distribution of the dopant in each material is essentially dependent upon the following factors:
1. The ratio of the equilibrium concentrations of the dopant in the oxide and in the silicon
2. The diffusion constants of the dopant in the oxide and the silicon
3. The oxidation rate and temperature
It has been determined (Ref E-20) from a consideration of the above factors that the growing oxide has an affinity for boron but rejects phosphorus and antimony. Therefore, oxidation of doped silicon wafers results in impurity profiles in the oxidized wafers a s summarized in Figure E-5. The depletion of boron from the substrate is a considerably stronger effect than the pile-up of phosphorus and antimony, Consequently we neglect changes in the substrate impurity profile for phosphorus- and antimony- doped wafers and consider only the redistribution of boron. The profile in the silicon is strongly dependent upon the temperature and rate of oxidation. The least deviation from the uniform bulk distribution occurs when the oxidation temperature is high and the oxidation rate is low. These conditions are best met by high temperature (>1100 C) growth in dry oxygen. The conditions which produce the smallest perturbation of the bulk profile also result in the incorporation of the greatest amount of impurity in the oxide layer. This means that more boron should be present in dry oxides than in steam oxides. It is expected, therefore, that the impurity concentrations in the oxide layers on boron-doped substrates, as a result of the oxidation techniques used in this experi- ment, will be as shown in Figure E-6.
In addition to the substrate dopant level and profile in the oxide, there a r e other factors which must be considered in attempting to understand the experimental results, These are the effect of hydroxyl groups, substrate crystalline imperfections, and particle contamination on the oxide structure and dielectric quality. Previous dis- cussions indicated that modification of the oxide by hydroxyl groups would be beneficial to the dielectric quality of the silicon oxide. The presence or absence of a definite relationship between oxide dielectric defects and substrate crystal defects and/or surface particle contamination has not yet been established so it is not possible to eliminate these factors from consideration as defect sources.
It can now be seen that most of the experimental data can be explained by con- sidering oxide dielectric defects to result from microscopic cracks o r fissures in the layer produced by the mechanical stress resulting from the differential thermal expansion characteristics of the Si-Si02 system. It should be pointed out that glass always fails from a tensile component of stress even when the loading is compressive. Since the stress originates at the interface between the silicon and the oxide, it is expected that ruptures in the oxide will occur at this boundary and propagate toward the outer surface of the oxide. In thicker films the propagating stress, which should be partially relieved by the rupture of the oxide, may not be sufficient to allow all of the defects to penetrate the entire thickness of the layer. This would account for the observed decrease in defect density with increasing oxide thickness. In an oxide grown to any thickness on a silicon wafer, there is presumably a distribution in the local stress levels. Those regions which are just below the rupture level or see only

DISTANCE FROM OXIDE SURFACE DISTANCE FROM OXIDE SURFACE
(a) BORON (b) PHOSPHORUS, ANTIMONY
Figure E-5. - Impurity Profiles in Oxidized Silicon Wafers. CB denotes bulk impurity concentration.
(From Grove, et al, Reference 20)
si
DRY WET WET-DRY DRY-WET '
OMDATION TECHNIQUE
Figure E-6. - Postulated Boron Distributions in Thermally Grown Oxides
107

compressive components of stress would be attacked more rapidly by chemical etching. This is thought to be the basis of the higher density of defects in an etched film as compared to a virgin layer of the same thickness. Since diffusion of impurities may also be enhanced in a strained region, the fast etching imperfections described by Lopez (Ref E-6) may be high s t r e s s sites in the oxide. The ineffectiveness of thermal regrowth of oxide as a defect elimination technique is apparently a result of the appear- ance of additional defects in previously sound oxide as a result of the thermal (and s t ress) cycling. This was demonstrated by measuring the defects on an initial oxide, taking the wafer through five temperature cycles from room temperature to 1150 C in an inert atmosphere, and remeasuring the defect density. It was found that the temper- ature cycling produced an order to magnitude increase in the number of dielectric flaws.
The beneficial effect of moisture in the oxidizing ambient is attributed to the incorporation of hydroxyl groups in the oxide and the resulting improvement in the oxide thermal expansion characteristics relative to the silicon. The contribution of this factor to improved oxide dielectric quality can be partly offset by the ion trapping characteristic associated with the exchange of protons for other positive ions at these sites. The variation of the defect density versus thickness characteristic with growth temperature shown in Figure E-3 can be explained on the basis of incorporation of more boron in the oxide grown at the higher temperature. This is a result of the increased ratio of oxidation ra te constant to diffusion coefficient of the impurity in the silicon a s the temperature is increased. Since the setting point of the oxide is -1000 C, the temperature range over which the mechanical s t ress develops is the same for each oxidation temperature and may even be less for the more heavily boron-doped oxide. The 1100 C oxide should also have a higher expansion coefficient resulting in a lower stress level and fewer ruptures in the film as experimentally observed. Also, as shown in Figure E-5 and E-6, the impurity profile i n the oxide is such that the best match in expansion characteristics occurs at the oxide-silicon interface where the stress originates.
The data in the samples described in Table E-2 indicate that the surface prepa- ration techniques investigated had relatively little influence on the oxide integrity. Preliminary work on wafers deliberately contaminated with particles at levels differing by an order of magnitude has shown little variation of oxide integrity with particulate contamination. However, it will be seen that not all the results of Table E-4 can be explained readily without postulating defect-producing mechanisms in addition to mechanical stress. No attempt was made here to confirm the results of Nassibian and Whiting (Ref E-21) that particulate contaminations on the oxide surface act a s loci for the formation of high concentration regions of P2O5 during a depostion of phosphorus. In the subsequent diffusion, the phosphorus is considered to penetrate the oxide preferentially beneath these high concentration sources, doping the silicon substrate in localized regions under the oxide. It is possible that Lopez, in his utiliza- tion of a phosphorus deposition and diffusion as a defect detection method, obtained contributions from such sources.
The variation of defect densities shown in Table E-4 is regarded a s arising mainly from s t r e s s produced cracks or fissures in the oxide layer. The modifying factors are incorporation of substrate dopants and hydroxyl groups in the grown oxide. However, from the previous discussion we would expect the samples from group C to contain the fewest defects in the initial oxide layer since these oxides have the highest boron content. It was also expected that the wet oxide of group C wouM be the best
10 8

since both structural modifications should reduce stress-induced defects. The high defect values found in the initial oxides of group C are therefore considered to be a result of other def ect-producing mechanisms such as particle contamination or sub- s t ra te crystalline imperfections. This possibility is supported by the observation that the oxides of group C are quite sound after etch-back, indicating that the high density in the initial oxide results from certain localized imperfections. The average of all our previous and subsequent measurements has shown that oxides grown on heavily boron-doped substrates have fewer defects than those grown on more lightly boron- doped slices. The preliminary work on contamination tends to promote the conclusion that its contribution to defect incidence is relatively small. If substrate crystal imperfections are sources of oxide flaws, the defect density obtained on a heavily doped wafer would represent a compromise between the two competing tendencies of boron incorporation and silicon cyrstalline perfection. This would seem to be the case in group C with its poor initial layers which are relatively sound after etching. Also, if localized crystal defects are dielectric defect sources, their contribution would tend to be greater during a rapid oxidation than during a slow one in which lateral rearrangement of structural groups could take place in the plane of the oxide. This "annealingT1 would account for the superiority of the group C oxides in which the final oxidation was dry rather than wet. Since the grown oxide will contain more boron than phosphorus or antimony, it would be expected that stress produced failures would be more prevalent in the inital oxides in groups A and B than in groups C and D. It can be seen that this is indeed the case. The difference in oxide impurity content would also explain the variation in etch resistance between the n- and p-type samples since oxides on groups A and B will more highly stressed during cooling and thus more susceptible to etch-produced defects by the processes previously described. An addi- tional factor in the quality of the etched layers is the more rapid etching of phosphorus- doped silica in comparison to boron-doped and pure silica. (See Ref E-22 and E-23.) Boron-doped Si02 etches somewhat faster than pure Si02 but would be less strained and so could be sounder after etching as shown by the data on the etched layers of groups C and D which differ considerably in boron content.
The data on the layers formed by sequences WD and DW provide additional verification of the proposed model for defect origins since they produce a disparity in the impurity profile in the oxide and in the interface structure. Consider first the layers grown by the WD sequence. These are expected to be somewhat freer from substrate related defects (particles and crystal imperfections) than the totally wet oxide since the dry portion of the cycle would be expected to llannealT1 some of the particle or crystal defect sources of the oxide flaws. Thus, the WD sample in group C is expected to have fewer defects than the corresponding W sample as shown. The etch-back characteristics of C and D are comparable to those for the dry oxide as expected. Again, the heavily boron-doped sample has the best resistance to etch- produced defects, indicating a generally uniform. and sound oxide with localized imperfections.
Superficially, it might be anticipated that the DW sequence would produce essentially the same results as the WD sequence. Reference to Figure E-6, however, indicates that the former case could produce an impurity distribution in the oxide which is significantly different from that of the other three cases in that it is not monotonically decreasing with distance from the Si-Si02 interface. The D, W, and WD oxidations produce impurity profiles in the oxide in which the best match to the thermal expansion characteristic of the silicon occurs at the oxide-silicon interface,, but this is not the case in the DW film. This would account for the higher initial
109

densities found and the poorer quality of the etched layers. Also, from previous discussion, terminating with a wet (rapid) oxidation step may produce in the lower portion of the film a higher incidence of substrate-related oxide defects. This is thought to be an additional reason for the generally poorer quality of the etched DW films in comparison to the WD films, especially in the case of the etched group C sample.
The observations on the wafers obtained from commercial integrated circuit vendors were invariant with respect to source and support the proposed mechanism of mechanical stress as a principal origin of oxide dielectric defects.
Summary
Application of previously developed methods for the detection of dielectric defects to silicon oxides formed on silicon wafers has made possible a determination of the dependence of dielectric integrity on various factors involved in device fabrica- tion. Most of the results can be consistently explained by a model which postulates the mechanical s t ress deve€oped as a result of the thermal expansion mismatch between Si and Si02 as a principal source of dielectric failures by the mechanism of film rupture. Other possible defect origins are being investigated but have not been verified.
E-1.
E-2.
E-3.
E-4.
E-5.
E-6.
E-7.
E-8.
E-9.
I10
References
G. V. Browning, 'IFailure Mechanisms in Microcircuits, If presented to NATO Advisory Group for Aerospace Research and Development in Europe, June 1966, Autonetics Report X6-1188/3111.
Electronics,11 No. 4, IR-8-140 (IV), Motorola, Inc., January 1965 - 197 . Manufacturing In-Process Control and Measuring Techniques for Integral
E. F. Duffek, E. A. Benjamini, and C Mylroie, Electrochem. Tech. -7 3 75 (1965).
S. W. Ing, R . E. Morrison, and J. E. Sandor, J. Electrochem. SOC. -9 109 221 (1962).
P. J. Besser and J. E. Meinhard, Proceedings of Symposium on Manufacturing In-Process Control and Measuring Techniques €or Semiconductors, Phoenix, Arizona, March 1966, Vol. 11, p. 16-1.
A. D. Lopez, J. Electrochem. SOC. 113, 89 (1966).
H. G . Carlson, private communication.
R. L. Nolder, "De€ects in Silicon Oxide Films on Integrated Circuits, published.
A. G . Revesz, TEEE Trans. on Electron Devices, J ED-12 97 (1965).
to be

E-10. Handbook of Thermophysical Properties of Solid Materials, Vol. I, p. 581, Macmillan, New York, (1961).
E-11. S. S. Baird, Annals New York Academy of Sciences, 101, 869 (1963).
E-12. Corning Glas s Works, ??Properties of Selected Commercial Glasses, 8-83, Corning, New York, (1961).
E-13. H. A. Robinson, J. Phys, Chem. Solids -9 26 209 (1965).
E-14. G. Hetherington and K. H. Jack, Phys. Chem. Glasses?, 129 (1962).
E-15. R . W. Lee, Physics and Chemistry of Glasses, 2, 35 (1964).
E-16. J. E. Meinhard, Electrochemical Society Spring Meeting, 1966, Cleveland, Ohio, Recent Newspaper No. 19.
E-17. T. E. Burgess and F. M. Fowkes, Extended Abstracts of the Electronics Division of the Electrochemical Society -9 15 No. 1, 110 (1966).
E-18. P. J. Burkhardt, Electrochemical Society Spring Meeting, 1966, Cleveland, Ohio, Recent News Paper No. 18.
E-19. M. M. Atalla and E. Tannebaum, Bell System Techn. J. 39, 933 (1960).
E-20. A. S. Grove, 0, Leistiko, Jr., and C. T. Sah, J. Appl. Phys. -9 35 2695 (1964).
E-21. A. G. Nassibian and G. Whiting, Solid State Electronics -9 7 873 (1964).
E-22. M. Yamin, IEEE Trans. on Electron Devices, ED-13, 256 (1966).
E-23. E. H. Snow and B. E. Deal, J. Electrochem. SOC. - 113, 263 (1966).
111


APPENDIX F. INVESTIGATION OF METHODS FOR THE DETECTION OF STRUCTURAL DEFECTS IN SIL ICON OXIDE LAYERS
BY P. J. BESSER AND J.E. MEINHARD
INTRODUCTION
Present information indicates that passivation oxide is subject to two general process-dependent structural anomalies; ionic impurities in sound oxide (device failure modes: high or unstable MOS gate threshold voltages, inversion in bipolar devices), and unsound oxide penetrated by local dielectric defects (failure mode: metallization to substrate shorts). Although the latter problem has been cited frequently in the past, it has received comparatively little intensive study, partly because of the lack of adequate detection methods and partly because of the urgency to resolve the ionic impurity problem. The incidence of oxide dielectric defects, often called pinholes, is now recognized as a serious reliability problem, particularly with respect to MOS gate structures, metal intraconnections over thinned oxide regions, - and abrupt thickness transitions in the oxide. The structural discontinuities comprising such defects offer far less resistance to eiectrical discharge than sound oxide which is capable pf supporting fields up to 10-1 V/A a s compared with breakdown fields of about 10-4 V/6 for air. MOS gate voltage parameters seldom involve fields in excess of
V/A which is well within the dielectric capability of sound oxide but considerably higher than that of gaseous insulation at ordinary pressures. Thus, shorting may occur regardless of whether the overlying metallization has penetrated a crack or pinhole in the oxide.
A major purpose of this investigation was to develop and evaluate test methods for the detection of dielectric defects in passivation layers. Selection of methods was based on the following performance criteria: nondestructiveness, reproducibility, recordability, and convenience of use a s a process screening technique. Previously described techni ues, such as the high temperature HC1 etch(1) o r chlorine etching at around 900C(2)(37, fall short of this goal in terms of convenience and nondestructive- ness. Metallization techniques likewise are impractical and lack the resolution necessary for the accurate location of defects. Both methods were useful, however, in corroborating results obtained with the new techniques under study.
Additional objectives were to gain an understanding of the physical nature of the defects and to determine, if possible, their process origins. For example, the presence of fast-etching loci in grown silicon dioxide, as reported by Lopez(4), would appear to contraindicate etch- thinning procedures for adjustment of oxide thickness. Defects therefore may be classified as inherent or latent, and may consist of physical openings in the oxide (pores, microcracks), thin spots, foreign inclusions (e, g . , glass- forming metal oxides), or abrupt variations in Si02 density. The latter three categories would be more vulnerable to H F attack (fast etching) than adjacent sound ,
oxide, and more subject to electrical breakdown as well. Likewise factors contributing to the formation of dielectric defects would include the inherent mismatch in thermal expansion between the oxide' and the substrate, as well as initial and subsequent *Proceedings, Symposium on Manufacturing In-Process Control and Measuring
*
Techniques for Semiconductors, Phoenix, Arizona, March 1966, Vol 11, p 26-1.
113

processing irregularities. Some of these process origins are: etch undercutting of oxide due to mechanical strains originally present or to poor adhesion of photoresist, localized etch spots due to mask flaws or variations in photoresist quality and appli- cation, local excesses of dopants or contaminant particles capable of forming silicate glasses at oxidizing temperatures, high temperature attack of active metals on oxide layers, and mechanical flexing of wafers by repeated growth and unbalanced removal of oxide layers. Conceivably, therefore, the elimination of dielectric defects might involve scrutiny of a large part of the major processing operations - a very difficult task without the availability of simple, recordable defect test methods.
TEST METHODS
Direct observation of oxide dielectric defects is hampered by their small physical size (approximately 2 to 20 p diameter), the high reflectivity of the silicon and oxide surfaces, the lack of inherent color contrasts, and the apparent absence of a charac- teristic morphology for differentiating dielectric defects from other defects which a re dielectrically sound. It became evident therefore that a suitable test method would require a combination of visual enhancement and transmission of charge at defect sites. Two of the more promising techniques, electrophoretic decoration and electro- chemical autograph, are described below, followed by other techniques of more limited application. Succeeding sections deal with intertest correlations and process applications.
Electrophoretic Decoration
This technique provides a functional test (transmission of charge) and a visible record of the oxide anomalies sought. A passivated wafer, whose reverse side is etched and connected to a dc circuit, as shown in Figure F-1, is immersed in a dissociable dielectric fluid and the circuit completed by a copper probe situated in the f h i d above the oxide surface. A mechanical stage is employed to adjust the relative position of the wafer under the probe. With a negative polarity (10-100 v) on the wafer, electrolysis at oxide anomalies is observed, under low power magnification, as trains of fine bubbles (identified as hydrogen by gas chromatography) associated with the electrochemical decomposition of the fluid or of minute traces of dissolved water. Concurrently, anodic attack of the copper probe releases colloidal par ticles of insoluble oxysalts of copper which are propelled by the potential gradient toward the oxide defects. This was confirmed by chemical and electron beam microprobe analysis of deposited material. Instead of plugging the defects, the insoluble matter accumulates on the surface of the surrounding oxide, covering areas - 100 diameters larger than those of the original holes. Figure F-2 shows the decorations on a portion of a wafer after removal from the cell and drying. The deposits were readily removed by acid treatment. A photograph of a decorated defect, and a microprobe photo of Cu radiation corresponding to the decoration, are shown in Figure F-3.
114

COPPER ELECTRODE
\ r"" ORGANIC LIQUID
GLASS CYLINDER
OXLDIZED SILICON WAFER
METAL SUPPORT (CATHODE) 1
U
r
Figure F-1. -Electrophoretic Decoration Test Assembly
Figure F-2. - Oxide Defect Decoration A f t e r Fluid Evaporation. lOOX
115

a. Photograph of decoration, 19OX
b. Cu radiation from decoration
Figure F-3. -Photograph of Decoration and Cu Radiation From Electron Beam Microprobe of the Decoration
116

Verification of the method was obtained by correlation with other test methods. Reproducibility was checked by rinsing off the deposited material with dilute sulfuric acid and resubmitting the wafer to test. A typical sequence of this type on initial oxide is shown in Figure F-4. In its present form, this method employs a 20-point probe which decorates the complete wafer in 5-10 minutes. It is applicable as a pilot test and potentially useful as a screening test. The complete removal of copper by an acid wash has not yet been experimentally verified, and the potential gradient across the oxide and substrate has not been determined. The method is not yet completely qualified therefore as a nondestructive test. Further work is underway to characterize the nature of the decorated defects. Preliminary observations indicate that the decorated sites are actual pores in the oxide rather than regions of high conductivity.
In an earlier version of the test, attempts were made to achieve a visible record of the defects utilizing the electrolytic rather than the electrophoretic aspect of the reaction. A thin film of gelatin was applied to the wafer prior to immersion in the fluid. The electrolytically generated gas was trapped under the film causing delamina- tion of the film from the oxide in the regions of gas evolution which revealed the characteristic oxide thickness color. The wafer could be removed from the cell with the film and trapped gases still intact. A photograph of a typical trapped gas pattern thus obtained is shown in Figure F-5. Subsequent tests, however, revealed a lack of reproducibility probably due to a nonuniform lifting of the gelatin film by the evolved gas. Various weakly acidic organic fluids such as acetone, isopropanol, and methanol are suitable for this process. Deionized and tap water were not found to be suitable.
Electrochemical Autograph
A simple electrochemical screening test for oxide defects is in the final stages of development. It can be applied to a wafer prior to final metallization or at any preceding process step, and shows promise of becoming a generally applicable technique for the location of oxide defects. It does not introduce metallic impurities and does not require large potential gradients. The method consists of making the silicon substrate an anode of an electrochemical cell and of revealing openings in the oxide by anodic oxidation of the electrolyte wherever it is in electrical contact with the under 1 yin g silicon.
The electrolyte employed consists of an aqueous solution of a benzidine salt (e. g., acetate o r chloride) containing an organic nonsulfonated surfactant and a protec- tive colloid. The function of the surfactant is to assist penetration of the electrolyte into small oxide pores. The protective colloid inhibits deposition of crystalline benzidine salts which tend to blur boundary definition. The colloid also promotes image sharpness by inhibiting lateral diffusion of dye. In principle other redox reagents will serve the same purpose as benzidine in this technique.
The electrolyte, soaked in a Millipore filter paper, is applied to the oxide surface and the assembly outgassed under vacuum. This treatment removes residual gas that might otherwise prevent pore penetration by the electrolyte. The assembly is then placed face down on a porous flexible support also soaked in electrolyte and situated on a stainless steel plate, as shown diagrammatically in Figure F-6. The purpose of the flexible support is to achieve conformal contact with the wafer surface,
117

Figure F-4. - Sequential Electrophoretic Decoration of the Same Wafer
118

Figure F-5. -Trapped Gas Pattern Under Gelatin Film
STAINLESS STEEL WEIGHT
SILICON WAFER (FACE DOWN)
MILLIPORE (ELECTROLYTE SATURATED)
CUSHION (ELECTROLYTE SATURATED)
STAINLESS STEEL PLATE
Figure F-6. - Electrochemical Autograph Assembly
119

which is not quite planar, and to minimize the possible transmission of a bending moment to the wafer through electrode pressure. The top stainless steel electrode, which is of sufficient mass to ensure intimate electrical contact between the assembled layers, is then placed on the oxide-free back (upper surface) of the wafer and external electrical connections made as illustrated.
Electrolysis is conducted a t a potential of 2 to 5 volts for a 5-minute period. Anodic oxidation of the benzidine to a blue-black product stains the filter paper at points corresponding to openings in the oxide such as pinholes, contact and diffusion windows, and scribe lines. and the Millipore filter paper is removed for microscopic examination and photography.
Following electrolysis, the apparatus is disassembled,
A photomicrograph of a typical wafer pattern after oxide removal prior to a diffusion step is shown in Figure F-7a and an enlarged view of the same pattern with an arrow indicating an oxide defect in Figure F-7b.
Substantial correlation has been obtained between this test and the electrophoretic decoration technique. Consecutive repeatability also has been confirmed many times. The detection limit is approximately 2 microns in hole diameter. This limit may be extended by more prolonged electrolysis. The wafer i s easily cleaned from the electrolyte components with deionized water.
Electric Field Excitation Photography
Direct photographic recording of oxide defect sites was attempted using an alternating electric field to stimulate electron or photon emission from defect loci in o r under the oxide placed in direct contact with a photographic film. Preferential exposure of the film w a s obtained, giving a light emission pattern that is developed only on oxidized wafers .
The field across the oxide and the silicon layers are unknown but may be high enough to damage device junctions in the silicon. Such damage would not necessarily occur only at oxide defect sites. Until direct evidence of non-destructiveness is obtained and the required exposure periods (1/2-2 hours) are substantially shortened, the method cannot be recommended as a screening test. It is a potentially useful tool in the investigation of oxide defect origins. Its correlation with the electric probe method is described in the following section.
Replicate Electron Microscopy
Although electron microscopy is impractical as a screening technique, it is capable of minute definition of surface morphology which may give clues to the process origins of oxide defects. The replica technique employed in this investigation involved the attainment of a large area replica. Such a replica can be used to study the original specimen after laboratory testing destructive to the original surface character. Thus, replicas made before and after a particular detection test can be examined to determine the effect of the test on the oxide.
120

'I 3)
Figure F-7. -Oxide Openings Displayed by Electrochemical Autograph Technique
121

The richness of detail produced by this technique poses a problem of interpreta- tion. Only a very small percent of the observed structure is likely to delineate oxide defects capable of dielectric failure. Therefore, correlations of this technique with known sites of dielectric breakdown are especially important. Achieving such correlations, however, is a serious problem because of the minute field area covered at high magnification. Although many photographs were made, it w a s not possible to correlate unequivocally an observed structure with a dielectric anomaly. One correlation was made, however, by ordinary light microscopy of a replica prepared for for electron microscopy and is reported in the following section.
Microscopy
Observations by dark field, normal lighting (metallurgical illumination), and Nomarsky phase contrast were made in an attempt to develop a direct nondestructive procedure. Small defects in the oxide were readily observable at 500 to 1000 X. Covering an entire 1.25-inch diameter wafer by this method, however, is impractical because of the small field diameters (0.35 mm or 0.014 inch at 500 X; 0.17 mm o r 0.007 inch at 1000 X) involved. Interpretation of observed Structures also is difficult and requires correlation with other visual enhancement detection techniques. It is not yet possible to make any structural generalizations describing dielectric defects in the oxide. The method ultimately should be applicable to the inspection of single integrated circuit dice where topographical detail is available as landmarks. Automatic comput- erized scanning of whole wafers is foreseeable.
Preferential Etching
Chemical attack of silicon provides a direct visual enhancement of oxide holes where silicon is exposed. The etchant employed (25:3 HN03:HF) also corrodes the oxide to a significant degree, and probably causes a widening and deepening of the defects present as well as exposing silicon at fast etching sites as previously observed(4). The test is therefore destructive. Defects are readily visible under dark field illumination at 500 X. The method suffers from the same limitations indicated above and is not applicable as a screening test. It holds promise, however, as a failure analysis test on defective integrated circuits. It also should be useful in stress-corrosion investigations of the origins of oxide defects.
Dye Autograph
This method was expected to locate oxide anomalies through dye o r pigment color reactions similar to histological and biological staining techniques. The reasons for employing dyes are analogous in the two cases: to make morphological detail visible to ordinary light microscopy by the development of color contrasts. Although many experimental approaches were undertaken, no methods deserving continued investigation were found. The high reflectivity of the surfaces, and the chemical and physical inertness of the silica (in contrast to biological specimens) rendered ordinary s taining methods ineffective .
122

Staining was attempted by applying soluble dyes, dye suspensions, pigment suspensions, in situ chemical reactions, commercial dye penetrants, and x-ray absorbers. Vacuum outgassing and pressurization were utilized as inoculation adjuncts, and visual enhancement was sought by applying monochromatic illumination and by ultraviolet excitation of fluorescent dyes.
Thermal Plotter
The infrared thermal plotter was considered a potential means of discovering 77incipient17 dielectric breakdown through an oxide defect covered with metallization. The heating effects associated with this phenomenon were found to be too small and too rapidly dissipated to be observed experimentally. Previously broken down loci dissipating approximately one watt (rms) were unambiguously detected and, almost without exception, could be related to readily discernible anomalies on the surface. Based on these negative results, the effort to detect incipient breakdown was discontinued.
Other techniques such as visual o r photographic observation of defects in a low pressure gas discharge and luminescence of electrophoretically deposited phosphors were investigated but did not prove fruitful.
VERIFICATION OF METHOD
Inter-and Intra-Test Correlations
Verification of test methods under development required an independent proof relating analytical observations to anamolously low dielectric breakdown regions. Two techniques were used to induce dielectric breakdown: a bare metal probe in point contact with the oxide and vacuum-deposited metallizations on the oxide.
A potential was applied to the metal probe to break down sound oxide at known locations on the wafer. These were used as functional checks on other methods. Metallizations were deposited in the pattern shown in Figure F-8. The A1 dots are 13 mils in diameter with an on-center spacing of 40 mils. Metal coverage is - 15 per- cent within the pattern boundaries.
The central test employed in this investigation was the electrophoretic decoration test. It was therefore essential to check its validity against dielectric breakdown dis- tribution. Results employing the aluminized dot pattern a re shown in Table F-1.
The results clearly indicate a correlation between defect density and dielectric breakdown. With only about 15-percent coverage by the dot pattern, a low coincidence with defects at low density is expected, as indicated for the first two samples. The high defect density in the third sample is reflected in the dielectric breakdown distribution.
123

.
Figure F-8. -Metallization Pattern for Dielectric Breakdown Test
TABLE F-1 DIELECTRIC BREAKDOWN VS DECORATED DEFECT DENSITY
Wafer Description
8000 Initial Oxide
4000 Initial Oxide
Defect Density (cm-2)
< 5
<5
oxide removal step, then 2000 A of additional steam
Dielectric Breakdown Distribution
Further verification of the electrophoretic decoration technique was obtained on known breakdown sites deliberately introduced by the bare metal probe. Positive identification of the breakdown sites by decoration was obtained in every case.
124

Correlation of the electrophoretic decoration technique with electric field excita- tion photography also was obtained, as represented in Figure F-9. Not all of the defects decorated with copper salts are successfully reproduced in the decoration photograph. However, the number density of spots on the field excitation photograph was still higher than that detected by decoration and may be due to the presence of thin oxide spots not detected by the probe method. Further investigation is required to establish correlation limits.
Cross-correlation between the electrophoretic decoration technique and the electrochemical autograph technique was performed on two wafers with initial steam grown oxide. One wafer was first decorated and photographed, and then subjected to the electrochemical autograph test while the reverse sequence was followed for the second wafer. Comparison of apparent defects determined by the two methods resulted in a significant, but not complete, correlation between the two methods. Extraneous sites were observed by both techniques. The autograph sites which did not correspond to decorations were, in general, very minute and may have been experimental artifacts unrelated to oxide defects, or to oxide defects of a size beyond the limit of detection by the electrophoretic decoration method. The absence of autograph sites at some decorations may be due to incomplete wetting of the wafer by the autograph electrolyte, a problem that has persisted in this technique, or an indication of induced breakdown at thin oxide regions by the higher fields employed in the decoration test. A t the time of this writing, significant improvement in electrochemical autograph pattern coverage has been achieved, and it is expected that the correlation between the autograph and decoration techniques will improve. Since the decorated defects have not been definitely characterized solely as physical openings in the oxide, some of the decora- tions may correspond to regions of normal oxide thickness but of high conductivity, which might not be detected by the autograph.
Evidence of the Nature of Dielectric Anomalies
Some characterization of the microscopic structure of a defect was obtained using a surface replica prepared for electron microscopy. A photo-microgrdph of this replica under normal illumination (at - lOOOX) is shown in the upper photograph of Figure F-10. The centrally located oxide blemish (about 1 0 microns in diameter) in this photograph was indicated as a dielectric defect by the electrophoretic decoration method. The lower photograph shows the same defect after the decoration test. The oxide structure is seen to be relatively undisturbed by this treatment, but the under- lying silicon has acquired a triangular etch-pit. Such etch-pits frequently have been observed after decoration testing. Since the silicon is at a negative potential during the test, the etch-pit formation cannot be associated with anodic oxidation. More detailed investigation may reveal that the etch-pits result from impurities or precipi- tates originally embedded in the silicon which act as precursors of the oxide defects and are expelled during the test. This result, plus the observation that deliberately induced breakdown loci are always detected by the decoration technique, apparently indicates that the test is not likely to introduce oxide defects where none previously existed, with the possible exception of unusually thin oxide regions noted above.
A preferential etch (25:3 HN03:HF) was applied to one of the two wafers used in the cross-correlation between the autograph and decoration methods. Considerable correlation between decoration sites and etch-pits in the silicon was found. However,
125

Figure F-9. -Top: W a f e r Photographed by Electric Field Excitation; Bottom: Same Wafer Treated by Electrophoretic Decoration Method
126

Figure F-10. - Oxide Defect Before (Top) and After Electrophoretic Decoration Test (Bottom). Top Photograph from Replica. Parallel Boundary Interval: 42 Microns
127

since this etchant does attack the oxide to some degree, it does not resolve unambigu- ously the question of whether the decorated points correspond to actual oxide pores or to other anomalies such as fast-etching imperfections or thin spots.
The other wafer from the cross-correlation was subjected to a high temperature (1150 C, 10 minutes) HC1 vapor etch which should not attack the oxide but preferen- tially etches any Si exposed by holes in the oxide. The etch pattern actually observed had a high degree of coincidence with the decoration pattern, but there were extra- neous points in each case leaving the complete characterization of the defect nature unresolved.
Study by replicate electron microscopy is being continued in order to learn more about the physical nature of oxide defects and whether the electrophoretic decoration test induces defects at increasing probe voltages.
PROCESS CORRELATIONS
An additional objective of this program although somewhat ambitious for the allotted time and manpower, was at least partially fulfilled. The test data consisted principally of decorated defect counts and mechanical s t ress measurements on wafers selected a t various stages of processing. The results are presented in Table F- 2 . Stress measurements were obtained from strain gage data, and Proficorder traces, before and after removal of one oxide layer from the wafer.
A number of inferences can be drawn from this tabulation. Most significant, perhaps, is the apparent gradual increase of both stress and defect density with processing (cf. wafer groups 1, 2, 5) and the defect healing effect of deposited oxide (wafer group 6). The deposition of uniform oxide, however, may be a continuing process problem, as indicated by wafer 6-B. The presence of an additional thermally grown oxide layer prior to final contact oxide removal w a s not very beneficial in reducing the defect count (cf. group 5).
The possible contribution of mechanical stress as a process origin of dielectric defects is somewhat subtle. A correlation of increasing stress with decreasing thick- ness (wafer groups 1, 3) is not accompanied by a corresponding increase in defect density in single-step oxides. Multiple-step oxides, however (wafer groups 2, 5), show a positive correlation between defect density and stress. To explain these observations, it can be postulated that mechanical stress induces dielectric defects through localized spalling of the oxide which serves to relieve a portion of the stress. Thus, highly stressed oxides, such as those in wafer group 5, would be under still higher s t ress a t lower defect densities. The occurrence of such spalling would be expected to require a threshold stress for initiation which would decrease with increasing thickness of oxide. Thus, thinner oxides should tolerate higher stresses. Multiple heating and cooling, however, would be expected to increase spalling signifi- cantly through mechanical flexing (due to thermal expansion mismatch). Consequently, multiple-step oxides would be expected to display higher defect densities, as appears to be t rue from Table F-2.
128

TABLE F-2 OCCURRENCE OF DIELECTRIC DEFECTS AND MECHANICAL STRESS IN OXIDE
Wafer Group
1 A
1B 1c 2A
2B
2 c
3A
3B
4A
4B
5A
5B
6A
6B
AS A FUNCTION OF
Description
8500 initial steam grown oxide
8000 steam grown in
2000 ;i increments
4000 i initial steam grown oxide
8500 - 2000 steam grown after first diffusion
Wafers after contact oxide removal step + additional steam grown oxide
Wafers after contact oxide removal step + additional deposited oxide
Defect Den si ty (cm-2)
< 5
<5 5-10
15
45
25
< 5
<5
<5 <5
90-100
400-600
1-2 2 -4*
'ROCESSING
Distribution
Random
Random
Random
Random
Random
Random
Random
Random
Random
Random
Almost all along grid lines and at diffusion windows
Random
Random except where deposited oxide very thin; one area > ~ O O O cm-2
Average Stress
(Psi)
29,000
39,000
38,000
40,000
62,000
*Excluding high density region of thin deposited oxide.
Probably most of the inferred spalling does not produce dielectric defects directly, but small surface pits. Such pits would be especially vulnerable to etchant attack a t later processing steps because of localized high surface energies. It would be possible therefore for such pits to grow into dielectric defects under succeeding chemical treatments. This conclusion is suggested by comparison of wafer groups 2 and 5. The former group experienced no intermediate chemical treatments, and the average defect density is only slightly higher than single-step oxide of the same thickness.
All of the data in Table F-2 were obtained on nonepitaxial wafers. Measurements on oxidized epitaxial layers have s h o p that the defect density and stress in thermally grown initial oxides - 8000 A thick are not significantly different from those of oxides grown on nonepitaxial surfaces.
129

130

CONCLUSlONS
The electrophoretic decoration test provides a recordable, reproducible test for sites of anomalously low oxide dielectric strength. The test w a s checked by inde- pendent dielectric breakdown measurements and was used extensively in seeking process correlations with the incidence of dielectric defects. The test provides enormous visual magnification of the defects which are estimated from optical micros- copy to be pores a few microns in diameter. Optical observation of a defect site before and after the probe test indicated that the test is not destructive to adjacent oxide although regions of thin oxide may be vulnerable to this treatment as suggested by other test correlations,
The electrochemical autograph test has overcome early problems of technique and is now capable of providing completely reproducible replicas of openings in oxide layers. It does not provide any appreciable magnification but appears to be non- destructive and noncontaminating. Complete correlation with the decoration technique has not been achieved but is expected to improve with present refinements and the continued characterization of oxide defects.
The contact photography test shows promise, but additional development and correlation will be needed before it can qualify as a useful screening or detection technique. The other methods and approaches that were investigated in some cases assisted in the verification of techniques and the interpretation of results, but have not appeared promising enough a s screening tests to warrant continued development.
The decoration and autograph techniques are most applicable to testing at the wafer level. Although either is potentially available for use at any process stage, they are more efficiently applied in a complementary manner. The decoration technique is generally superior when applied to an oxide with no intentional openings (i. e., initial oxide or afkr a diffusion-oxide growth step), whereas the electrochemical autograph technique is more convenient when applied to a wafer with diffusion windows, grid lines, o r contact windows opened in the oxide to provide a reference pattern for the location of defects on the autograph. The resolution of the methods is unknown but is at least of the order of a few microns.
Analysis of the test observations indicates an increasing incidence of dielectric defects with processing. The results also showed that deposited oxide is effective in reducing such defects but may be a difficult process to control. Evidence that residual mechanical stress in the oxide plays a significant role in the incidence of defects was obtained. Interpretation of this evidence led to an oxide spalling hypothesis as a possibly significant source of defect sites. It was also concluded that high stresses associated with thinner oxides do not necessarily portend increases in defect density. No particular processing step w a s indicated a s a predominating source of dielectric defects
Continued investigations a re expected to reveal more clearly the physical structure of the observed defects and their process origins. Further examination of the nondestructive and noncontaminating aspects of these tests, and additional inter- correlation of test results, also are needed to define completely the limits of applicability and resolution of these methods
1'31

132

Acknowledgements
Valuable suggestions and experimental contributions were made by the following: J. L. Kersey, J. P. McCloskey, C. G . Jennings, C . W. Scott, and S. Merrill.
References
Manufacturing In-Process Control and Measuring Techniques for Integral Electronics, No. 4, IR-8-140 (IV), Motorola, Inc., January 1965, 1. 97.
E. F. Duffek, E. A. Benjamini, and C. Mylroie, Electrochem. Tech. 3 75 (1965).
S. W. Ing, R. E. Morrison, and J. E. Sandor, J. Electrochem. SOC. 109, 221 (1962).
A . D. Lopez, J. Electrochem. SOC. 113, - 89 (1966).
133

134

APPENDIX 6. ELECTROGRAPH METHOD FOR LOCATING PINHOLES IN THIN SILICON DIOXIDE FILMS
BY J. P. McCLOSKEY I. INTRODUCTION
The electrochemical procedure (Ref 1) described i n this paper enables simple nondestructive determinations of the precise location of pinholes o r other oxide anoma- lies i n thin dielectric material that has been superimposed on and is in contact with a conductive substrate base. The basic principles of the method were first disclosed in a presentation by P. J. Besser and J. E. Meinhard (Ref 2). The particular appli- cation presently described relates specifically to a technique used for locating oxide anomalies i n thermally grown silicon dioxide passivation layers formed on both phosphorus and boron doped silicon wafers. A need exists in the industry for locating the surface defects at an early stage in production, since electrical failures subse- quently occur when vacuum deposited interconnects placed over the holes are short circuited to the conductive substrate beneath. If the faulty areas could be located in the early processing stages, great cost savings and improved reliability would be realized,
An apparatus and technique for carring out the electrograph method is given in detail in Scott (Ref 3). This apparatus could very well be used to advantage for the present application i f a sensitive pressure gage were included to permit accurate control of contact pressure and thereby prevent possible damage to the wafers. The objective of the method, as described in (Ref 3), is to obtain qualitative identification of surface components by anodic dissolution in order to chemically transfer small amounts of the surface elements to a suitable medium, usually paper. Distinctive color reactions then occur at specific areas reflecting the compositional differences in the surface. The present electrograph method, however, utilizes a different principle in that a colorless organic reagent, namely benzidine, is anodically oxidized to a colored product only at conductive sites, and does not form a colored compound with any reacting species dissolved from the surface. Since conductive sites represent areas of exposed substrate, the method is conveniently applied to the location of holes in passivation layers.
Experiment a1
Apparatus. - The apparatus used (see Figure G-1) consists of an electrochemical cell using an aqueous acidified solution of benzidine hydrochloride as an electrolyte. The cell is provided with a supporting stainless steel cathode, 1.5 inch in diameter by 1.5 inch high o r slightly wider than the 1.25 inch silicon safers electrographed, and an anode of the same material, 1.0 inch in diameter by 6 inch in length, o r slightly smaller in diameter than the wafers, As a support pad, a soft cloth such as felt, velvet, certain broadcloths and the like, proved satisfactory. Plain white "Milliporeff membrane filter papers were used for recording the electrographs. The 47 mm diameter papers with a 0.45 micron pore s ize furnished excellent results for the 1.25 inch silicon wafers.
"Journal of the Electrochemical Society Vol 114, No. 6, June 1967

Procedure. - Cover the top of the cathode base of the electrograph assembly with a soft cloth pad. Add the benzidine-hydrochloride electrolyte dropwise to the pad until it is completely saturated with the reagent. Immediately place a suitable s ize membrane filter paper saturated with the electrolyte on top of the pad. The membrane paper may be conveniently saturated by immersing it in a small petri dish containing the electrolyte. Add a few drops of electrolyte to the paper after placing it on the pad to ensure complete saturation. Immediately place the silicon wafer , oxide surface down, on top of the membrane paper. The oxide layer of the wafer should have pre- viously been degassed by immersing, oxide surface up, in a petri dish containing sufficient electrolyte to cover the wafer, and evacuating for 5 minutes or longer under a vacuum of at least 20 mm of mercury. The evacuation step removes entrapped air from pinhoIes i n the oxide and fills them with electrolyte. Place the anode rod on top of the conductive side of the wafer. Remove all excess electrolyte from around the anode base using an absorbent paper, such as a Millipore pad. If the excess electrolyte is not removed, it will tend to cause external short circuits around the wafer. Apply sufficient potential to produce a current of about 1 milliampere (usually about 5 to 10 volts) at the start, and maintain at this voltage for 5 to 10 minutes. Turn off the power supply, disassemble the apparatus, then remove the membrane paper for microscopic examination. Open areas in the oxide will be replicated on the paper with black markings or patterns corresponding exactly in s ize and shape to a mirror image of the conductive areas present in the wafer.
If repetitive electrographs are to be made of the same wafer, place the pre- viously electrographed wafer in a large plastic beaker cover, preferably Teflon. Cover the wafer with a few ml of 6NHC1 and allow 2 to 3 minutes for reaction. Rinse wel l with pure water to remove most of the benzidine hydrochloride. Repeat this operation once more. Cover the wafer with a few m l of 0.5 percent H F etchant and allow to react for exactly one minute. This treatment removes about 25 angstroms of silicon dioxide in this time period and should be sufficient to remove all of the oxide formed during the electrographing process, Rinse well with pure water to remove the etchant and reaction products. The wafer is now ready for producing another electro- graph. If, however, the wafer is now to be returned to the production line, the final pure water rinse must be of 18 megohm o r better quality.
Preparation of Reagents
Benzidine-hydrochloride electrolyte. - To a small beaker add 50 m l of pure water, 10 m l of concentrated hydrochloric acid and 10 grams of ACS grade benzidine. Warm on a hot plate until completely dissolved. In another beaker prepare a 5 percent solution by adding 5 grams of gelatin to 100 m l of boiling water. Boil for three to five minutes. Combine and mix the contents of the two beakers, Filter through a Whatman No. 40 filter paper into a one liter dark glass bottle. Dilute the filtrate to approxi- mately one liter. Stopper bottle then invert to mix well. The reagent may be used for long periods of time if filtered each time before use.
Hydrofluoric acid etchant. - Prepare an approximately 0.5 percent hydro- fluoric acid etchant solution by diluting 10 m l of 48 percent hydrofluoric acid to about one liter with pure wa te r in a plastic bottle.
136

Discussion
Benzidine in acid solution can be oxidized electrochemically to a blue oxidation product (Ref 4), in accordance with the following chemical reaction:
NH2 ox + [ H N - a - N H . ..d] . HC1
Colorless Blue
The above sensitive reaction is the basis of the electrochemical method described in this paper.
The simplified drawing of Figure G-1 illustrates the principle of the technique as applied to the determination of the location of conductive areas or holes through the silicon dioxide dielectric of silicon wafers. When a suitable anodic potential is applied to the silicon wafer, oxidation of the colorless benzidine occurs only at conducting areas such as at unwanted pinholes, etched microcircuitry and the like. The dark blue to black oxidation product formed at the conductive sites produces markings or patterns on the paper having the same size, shape, and location as a mirror image of the conductive areas of the wafer electrographed.
Figure G-2 is a photograph of an electrograph prepared on a ffMilliporef' type membrane paper. circuits etched into the silicon dioxide passivation Iayer. uniformity of the pattern is broken in two areas, one to the right of center and the other in the upper left hand area. Successive electrographs duplicated the same incomplete pattern in the identical areas. The broken pattern areas represent faulty etching of the microcircuitry patterns in the oxide produced during processing of the wafer. A faulty circuitry pattern, pinhole or other oxide anomaly recorded on an electrographed membrane is not considered as such until it has been duplicated at le as t o nee.
The silicon wafer electrographed contained 280 complete integrated It will be noted that the
Figure G-3 is a photomicrograph (50x) of one of the individual integrated circuits selected from the electrograph shown in Figure G-2. The pinhole designated by an arrow illustrates the appearance of an oxide anomaly of this type when observed by micro- scopic examination of an electrograph.
Figure G-4 is an electron micrograph replica of an oxide anomaly on an actual wafer magnified 5000 diameters. The anomaly on the wafer was located by means of the electrograph shown in Figure G-3.
During the course of the development of the electrolyte for the process, the benzidine was first dissolved in a slight excess of acetic acid. It wits later discovered that when hydrochloric acid was substituted for the dissolution of the benzidine, a dark blue to black pattern was achieved instead of the light blue color resulting with the former acid. To further improve on the quality of the electrograph produced, a protective colloid such as gelatin was incorporated into the electrolyte to inhibit crystallization of the benzidine and thereby enhance the definition obtained.
137

STAINLESS STEEL WEIGHT
\ MEMBRANE PAPER
(ELECTROLYTE SATURATED)
1
SILICON WAFER (FACE DOWN)
/ CUSHION
(ELECTROLYTE SATU
HOLE IN OXIDE (OXIDATION HERE)
STAINLESS STEEL BASE
Figure G-1. Electrograph Assembly Diagram
HOLE IN OXIDE (OXIDATION HERE) I I
STAINLESS STEEL BASE I Figure G-1. Electrograph Assembly Diagram
Figure G-2. Electrograph of Silicon Wafer Containing Etched Microcircuitry Patterns
138

Figure G-3. One of Individual Integrated Circuits of the Electrograph of Figure 2 Showing Pinhole Location
Figure G-4. Replica Electron Micrograph of Oxide Anomaly Located by Means of the Electrograph Method
139

Successive E lec trogr aphs
When a silicon wafer is electrographed, it is made the anode of an electro- chemical cell and therefore some anodic oxidation of the exposed silicon occurs. If a second electrograph of the same wafer is attempted, no dark areas will form on the membrane paper since the formerly conductive sites are now covered with a thin oxide film. Chemical tests indicate that this developed oxide has an approximate thickness of about 25 angstroms. In order that successive electrographs may be processed on the same wafer, a mild etchant was developed which would remove this ultra-thin oxide without serious attack of the main passivation layer. The etchant found suitable was an aqueous 0.5 percent hydrofluoric acid solution. Figure G-5 shows the relation-- ship between the thickness of silicon dioxide removed by the acid per unit contact time. It will be noted that the etching rate was linear in the time interval studied. The data fo r preparing the graph were obtained by treating a wafer having a silicon dioxide passivation layer of approximately 8500 angstroms thickness, with sufficient etchant to just cover the oxide layer side for successive one minute intervals. The amount of dissolved silicon in the etchant w a s then determined by a spectrophotometric chemical procedure developed for this purpose. The thickness of the oxide removed was then calculated from the micrograms of silicon dissolved in the etchant, the measured surface area in cm2 and an assumed density of 2.15 €or the silicon dioxide.
Summary
A simple nondestructive electrograph procedure has been developed for locating pinholes or other oxide anomalies in silicon dioxide passivation layers of silicon wafers. The method is most suitable for the determination of oxide anomalies in silicon wafers that contain etched patterns, such as for microcircuitry, which serve as reference guide lines in establishing the precise coordinates of the defects in the passivation layer. It is estimated that pinholes as small as 1000 angstroms in diameter can be located by the method.
The electrograph procedure described should find applicability in the determi- nation of surface defects in any thin dielectric material that is superimposed on and is in contact with a conductive substrate base. For example, it should be possible to determine surface defects in silicon nitride dielectric over silicon, germanium oxide over germanium, aluminum oxide over aluminum, and many others.
Acknowledgements
The author wishes to acknowledge the help derived from useful discussions with Drs . J. E. Meinhard and P. J. Besser, during development of the process. He also wishes to thank Dr. R. Nolder for the replica electron micrograph shown in Figure G-4. Also, Mr. J. Kersey is thanked for preparing the photomicrographs of the electro- graphed membrane papers.
140

10 15 20
Figure G-5. Etching of Silicon Dioxide With 0.5 Percent Hydrofluoric Acid
References
1, Autonetics patent file No. 66ER21, for J. P. McCloskey.
2. P. J. Besser and J. E. Meinhard, Proceedings of the Symposium on manufacturing i n process control and measuring techniques for semiconductors. Presentation entitled, "Investigation of Methods for the Detection of Structural Defects in Silicon Dioxide Layers, l 1 Phoenix, Arizona, March 9, 10, 11, 1966.
W. Vi'. Scott, "Standard Methods of Chemical Analysis, Vol. 3, Part A, Page 502, D. VanNostrand, New York (1966).
3. F. J. Welcher, Editor,
4. F. Feigal, "Spot Tests in Organic Analysis, Page 365, Elsevier Publishing Co., New York (1960).
14 1


APPENDIX H. EVIDENCE OF MECHANICAL STRESS AS A CAUSE OF DIELECTRIC DEFECTS IN SILICON DIOXIDE LAYERS
The presence of compressive s t ress in room temperature specimens of silicon dioxide grown on silicon at elevated temperatures has been previously recognized (Ref H-1). The effect of this stress has been considered insufficient to affect the band gap and, therefore, the performance of planar silicon devices passivated by such oxide layers (Ref H-2), and correlations with other effects, such as the presence of interface surface states, have been regarded as purely conjectural (Ref H-3). More recently the existence of residual mechanical stress in oxide layers grown on silicon has been confirmed (Ref H-4), and evidence has been advanced implicating this s t ress in the formation of structural defects in the oxide that a re susceptible to dielectric breakdown under the influence of a potential gradient (Hef H-4, 5). Such defects have the practical effect of severely limiting the fabrication of large area planar arrays on a single silicon chip. Until now no single definitive experiment associating oxide dielectric defects with mechanical stress has been performed.
Compressive s t ress in grown silicon dioxide layers originates in the fact that the coefficient of linear thermal expansion of silicon is a factor of -10 higher than that of vitreous silica, and in the fact that oxide layers are grown at temperatures 21000 C followed by cooling to room temperature. Therefore, an etching test for
defects on freshly grown oxide prior to cooling, followed by a decoration test (Ref H-4) of defects present after coding, should yield a direct indication whether a correlation exists between dielectric defect incidence and thermal contraction-induced mechanical stress.
Eight mechanically polished silicon wafers with (111) surfaces were oxidized in a conventional processing furnace in a 1 : l 02 /N2 atmosphere. Water vapor was carried by the 0 2 stream from a reservoir maintained at 100 C.
layers as determined subsequently be conventional optical interference technique, Water injection then was discontinued and HC1 gas introduced into the N2 line at a flow rate sufficient to provide a 0.1 mole ratio in the process gas. However, residual water in the system w a s present during this treatment. Vapor phase etching in this ambient was continued for ten minutes followed by a forty-minute flush with N2 alone. Wafer temperature was held constant within a. 5 C during the entire sequence, after which the oxide-coated wafers were cooled to room temperature in an inert ambient. Dielectric defects in the oxide layers of each wafer were revealed by a previously developed (Ref H-4) electrophoretic decoration procedure. The defect locations appear as roughly circular deposits as shown in Figure H-1. Af te r photographing and counting the defects on each wafer, the decorations were removed with an acid rinse and the vitreous silica layers with hydrofluoric acid. The thoroughly cleansed wafers were then examined microscopically for etch-pits that may have formed in the silicon during the HC1 treatment.
e treatment was continued for 1.5 hours at a temperature of 1150°C producing 8000 T vitreous oxide
The results of electrophoretic oxide defect decorations are given in Table H-1. However, in all of the wafers only one etch-pit in the silicon was found by microscopy after removal of the oxide layers. A photomicrograph (Nomarsky phase contrast) of the etch-pit is shown in the center area of figure H-2. This etch-pifcorresponds to
143

Figure H-1. - Oxide Defect Decorations on Silicon Wafer Specimen No. 4 of Table H-1 (outer diameter 2 . 3 em).
Figure H-2. - Etch Pit in Silicon (center) and Surrounding Structure (outer diameter 600 microns).
144

TABLE H-1 OXIDE DIELECTRIC DEFECTS LOCATED BY ELECTROPHORETIC DECORATION*
Wafer Specimen
Total
Total Defects
33 27 15 24 28 18 13 27
195
*Procedure given in Reference H-4.
one of the total of 195 decorated spots and may have originated from one o r more lapping grits originally embedded in the wafer. A t present, the crow-foot structure surrounding this pit is an unexplained experimental artifact. However, this pattern has been observed previously (Ref H-6) in studies of HC1 etching at 1150 C through oxide "pinholes" deliberately introduced by photolithographic procedure. In these previous studies a five-minute rather than a ten-minute treatment with HC1 was used. The structure appears to adopt a three-fold symmetry pattern induced by the (111) surface orientation and may be a region of redeposited (epitaxial) silicon. No evidence of the more characteristic triangular etch-pits was found.
It is clear from the foregoing results that there is a better than 99 percent correlation between the formation of silicon dioxide structural defects and the process of wafer cobling from >lo00 C to room temperature. The only obvious origin of this effect is the thermal contraction mismatch between the respective layers. A sub- stantial amount of less direct evidence exists (Ref H-4, H-5) in support of this conclusion.
Thanks are due Dr. P. J. Besser and T.E. Hagey for experimental support, and to NASA-ERC for funded support under Contract NAS 12-4.
References
H-1. S.S. Baird, Ann. N.Y Acad. Sci. 101, 869 (1963). - H-2. J. J. Wortman, J. R. Hauser and R. M, Burger, J. Appl. Phys. 35, - 2122 (1964).
H-3. Research Triangle Institute, "Integrated Silicon Device Technologyft VII, - 143, Technical Report ASD-TDR-63-316 (1965).
H-4. P. J. Besser and J. E. Meinhard, Proceedings of the Symposium on Manufacturing In-Process Control and Measuring Techniques for Semiconductors, Phoenix, Arizona, March 1966, Vol. 11, p. 16-1.
.
145

H-5. P. J. Besser, J. E. Meinhard and P. H. Eisenberg, Electrochemical Society Meeting, Philadelphia, Pennsylvania, October 10-14, 1966. (To be published).
H-6. Manufacturing In-Process Control and Measuring Techniques €or Integral Electronics, No. 4, IR-8-140 (IV), Motorola, Inc., January, 1965, p, 97.
146

APPENDIX 1. THERMODYNAMIC ANALYSIS OF AMBIENT GAS EFFECTS
Introduction
Silicon device and integrated circuit technology, which represents one of the major areas of progress in electronics, depends heavily on the sophisticated use of highly specialized materials. The juxtaposition of such materials needed to produce the desired electronic function also often contains the seeds of long-term drift or deterioration of that very function. The mechanistic reasons for this frequenctly are unobvious because of the specialized nature of the materials and the intricate manner in which they are assembled. A s a f i rs t step in anticipating such long-term interac- tions it should at least be determined which of them are thermodynamically permissible and which can be eliminated from further consideration. attempts to do this for gaseous components that have been encountered by instrumental techniques, such. as gas chromatography and mass spectrometry, in the packages of integrated circuits.
The present analysis
Gases considered were: nitrogen, hydrogen, argon, helium, methane, oxygen, water vapor, carbon dioxide, carbon monoxide, benzene, toluene, methylcyclohexane, and freon. Additional gases will be included as they are revealed by instrumental analysis.
Solid surfaces under examination were: silicon, silicon dioxide, aluminum, and aluminum oxide. general reactivity.
Other surface compositions will be added in order of frequency and
Chemical reactions for the foregoing gases and solids were considered in terms of the simple thermodynamic free energy of reaction.
A literature survey concerned with integrated circuits and ambient gases i s appended.
Free Energy Values
An important thermodynamic property i s the free energy of reaction, for it i s the magnitude and algebraic sign of this quantity which describes the chemical species which will exist under equilibrium conditions at a given temperature. Thus, the free energy of reaction or the change in free energy for a chemical reaction and its sign offers a means for the prediction that ambient gases will o r will not chemically react with the solid surface materials present in packaged integrated circuits. With this connotation in mind Tables 1-1 and 1-2 summarize pertinent standard freeoenergy values for temperatures, 298, 500 and 1000 K. The standard state is 298 K at atmospheric pressure. For gases a correction must be made for fact that a real gas is not a perfect gas (Ref 1-1). Furthermore, it i s important to note that the standard f ree energy of formation of an element is, by definition, zero for the standard state. It i s through application of an equation that the standard change in free energy i s calculated for possible chemical reaction between ambient gases and solids in packaged integrated circuits. .
147

% a c m a, 0 d
x 1 i? 8
i
cd
.4 c1
k 0 Fr w 0 3 bJ k a, c w a, a, k Fr a k cd m ki .c, tn
-
. . . . . . . . . 0 0 4 N 4 4 A A i - i 4 C 4 l - i O m N m m I l l l l + + + l l l + + + l d
I
. . . . . . . . . . 0 0 4 a 4 4 A A d d C 4 d o m a m m 1 1 1 1 1 + + - t ~ 1 1 1 + + + 1 d
I
m 0 0 r l * a m m * m d m Q , w 0 0
I " m m Q , m * M Q , " m d m m r s l m + I
. . . . . . . . . . . . . e
o b ~ a ~ 4 Q , r l b w ~ o b w o m w I I I I + + + I I I + d + r ; l r n
0"
$ n
- c
2 32 u b
148

cu W m 0 0 m rl rl M cu co c-
d 2-4
0 0 dr c- W co OD co dr c- c- m cu cu d W 4
I d I I I I d I I
43 Q, t- Q, 00 m Q, Q, dr m Q) co m W
I l-l I I I I d I I
. co W 4 cu 0 CD 4
0 M 0 m Go M Q,
m 0 0 Go 0 M cu 0 m 4 d Q) W rl M rl I I d cu I I I . I I
4
0 Q, 0 m c- co W
W cu W M Q, 00 4 00 W m W rl M cu rl M I I I l-l M I I I I
W rl 0 W rl c- dr 00 Eo m 0 0 c- c- M W cu m M m I I I d M
I I I I
d cu
M m
m c c
149

Conclusions
The results of free energy calculations are summarized in Table 1-3. The data predict for the indicated ambient gas-solid surfaces in contact, at the indicated temperatures, chemical reactions in all cases where the standard free energies are negative. and carbon monoxide o r carbon dioxide, gaseous benzene and solid silicon to form silicon carbide and hydride, toluene vapors and solid silicon to form the carbide or hydride, and CF2Cl2 and silicon to form silicon fluoride, silicon chloride and carbon.
These are the reactions between solid silicon and oxygen gas, solid silicon
Silicon dioxide solid is very stable and much less reactive than silicon. Free energy calculations for solid silicon dioxide with ambient gases were negative in only one instance, i. e. , the chemical reaction with difluoro-dichloro-methane.
Aluminum metal is a common component in integrated circuit technology. Accordingly, simple standard free energies of reaction were calculated for solid aluminum-ambient gas systems. These thermodynamic data disclosed that the forma- tion of aluminum nitride solid, aluminum oxide solid, (from both water vapor and oxygen, as well as carbon monoxide and dioxide), are probable reactions which occur between ambient gases and solids in packaged integrated circuits. A s in the case of silicon metal and silica, the freon, dichloro-difluoro-methane, reacts with aluminum to form halide salts and carbon.
Aluminum oxide, solid, showed no chemical reactivity with any of the ambient gases commonly found in circuit packages.
A few general statements can be made concerning the calculated data in Table 1-3.
1.
2.
3.
4.
5.
6.
150
Only chemical reactions between ambient gases and solids most commonly used in packaged integrated circuits were considered. can be included.
Other materials
Free energy calculations for methylcyclohexane reactions are not shown as the results show that these reactions are less favorable than those of benzene and toluene.
No limits of e r r o r w e r e associated with thermodynamic values used as they were not available in many cases.
The predictions made concerning ambient gas-solid chemical reactions are for the equilibrium condition. The kinetic picture can be quite different. For example, the kinetic removal of one chemical product from the reaction at equilibrium can cause a complete shift in the equilibrium to form more of the reaction products. During this shifting condition the processes may be steady state and are kinetic in nature until the new equilibrium i s achieved.
Only over-all chemical reactions were considered. potential chemical intermediates and/or activated states was omitted from consideration.
Reaction of hydrogen with Si, Si02, A1 and A1203 i s thermodynamically di s a1 lowed.
The participation of

El crl 0 M t
3 E-r <
a a, k 0 k
' R
n n n Y Y Y M r n M
E* 0" 2 .rl .r( M M M "
t i t i t i
S G G Y Y Y
n rn
YY n
M Y
.rl Xw m
t i
n M Y
f n
rn Y
.rl
M
G Y
n bo W
X" +n
9 M Y
M
n M W
0 .rl
M "
n M Y u " + n rn W
0" .r(
M
n M W
Q" n
m Y u
.r( m "
n m
YY n
M Y
-4 0" M
n M Y
0" " +n
Y rn Y
M " t l t i t i f+ tC t i
n M
0-
$ n
m Y
.rl M
n rn Y
.rl 0" M +n rn Y
.d M
n M
0-
+n
u " rn Y
.rl m
n bn
0-
+n
u " rn Y
.rl m
G Y
B n
rn Y z
n ha Y
0" u " + n rn Y
.rl
M "
zij W
X" m + u n m Y
.rl M W
fi
n M Y
XW
u" n
rn Y
.rl
M (D
S 5.
t i t i

rn G c, E1 a,
c c 0 0
m .rl H .rl
3 4 0 m
0
d m rl I
0
0 rl
I
4
0
" 00
I
a)
" Q, rl +
0
m 0 N +
00
c- rl @a +
" 00 a) rl +
rl
rl rl " +
Q,
Q, " " +
0
m a) " +
m rl 0 m +
0
c- cif m +
W
W a) m +
a)
W 0 * +
W
i * +
0
0
+ 2
t? 0 W " +
00
00 t? cif +
Q,
0
% W
" 0 m +
Q,
0 00 00 +
cv 0 W t? +
m
i Q, +
* 4 x rl +
a, rl m rl I
0
2 rl
I
0
W W
1
0 W
" 0 Q, m m I +
0 m c3 m 0 W m I +
a) W
c- 00 f- W m I +
W
0 * +
W
0 u5 +
0
u5 Lo +
M
m " m I
Q,
" W m I
d
a) c- m
1
Q,
Q, m rl +
c-
cn rl + i
M
a) 0 " +
t l tr t+
n n W c - G ? s s e -
h
W m
0" " + n m Y
.d E* m
h
Y bo
0" m + u m "
h
Y M
..-.I
n M Y
0" " + n rn Y
2 m
n m Y
Y - 3 - 3
n M
OW E" +n
m
u1 Y u
m CD .rl
n M
OW X" * + u v1 c-
n rn Y
.d
n M " Y
0 m +n rn Y
n" m .d m
n ba
OW E" +n
9
" rn " Y
m
n M
OW z?
9
+ n rn " Y
M "
h
Y ba
0" Y
2
n rn " Y
m
n M Y
v" n
rn N Y
2 m W
F;d Y
Xa)
$- n
rn Y
....I 0" m c-
n M Y
cif z"
.d 0"
+n m Y
m M
n n
c v " Y Y M M
2 2 +n n
+ r l r l
m r n Y Y
- 4 c n n W c - E ? .

n m Y
Y XW
%ij
rl
tl.
%ij Y
f n
m Y
rl c *
n bn Y
X"
0"
t i
" + n m Y
cil l-l c
n bn
OW E" +n
3
" m Y
rl
n m W u " + n bn Y
0"
tl.
" rl c
%ij Y
0 u " + n m Y
rl
%ij W
z" " + u n bn Y
rl
n m Y u " + n bn Y
0" " l-l
" c tC
n bn Y
0" u " +n m Y
l-l c *
n m W u
+ b
n bn
zY rl
t l
n bn Y
X*
u" n
m Y
rl
n m Y
k"
3 l-l
+ n m " Y
rl
l-l u c +n m Y u "
tl
k"
n bn Y
" rl u u " +n m Y
rl
3
%ij W
0"
zY
tC
s n m
+
rl
" c
n bn W F
0" " rl e
%ij
z" +-
OW z" +n
2 3 tC
Y
bn
02
bn Y
n bn Y
X*
0"
u " +n m Y
" rl c
n bn Y
0"
X i
3
" +n
bn
rl
tl.
n bn
0- X" +A
0"
m Y
cv l-l c
n bn Y
0" ? Lo + u c
n bn W
rl
%ij x +A
OW
0 " bn
'
M + u c
n bn Y
l-l
W
tC n bn Y
XW
0"
CD u +n m Y
" rl
cr) c
n bn Y
X" +n
OW X*
bn
" + n bn W
0 u " +n
bn Y u
rl c * t i
n bn Y
E*
0"
u" n
m Y
cv rl
n bn 6 3 Y
0 rl " + 55 Y
k" l-l c w + n bn " Y
4
2 +n
3 tC
c w
M Y u
rl
n bn " Y
F;c
u 0"
0"
W +n m Y
" rl
b e
n m Y
.r( 0" r%l " + rl
n m Y
t i
n m W
.r(
" +n m Y
Ocil 2 "
153

1-1.
1-2.
1-3.
1-4.
1-1.
1-2.
1-3.
1-4.
1-5.
154
References
G. N. Lewis and M. Randall, Thermodynamics, 2nd Edition, McGraw-Hill, New York, 1961.
Stull, D. R., Proj. Director, Janaf Thermochemical Tables, Advanced Research Projects Agency Program. Chemical Co., Midland, Michigan.
US A i r Force Contract No. AF04(611)7554 Dow
Glasser, A., "A Survey of the Free Energies of Formation of the Fluorides, Chlorides and Oxides of the Elements to 2500"K", ANL-5107, August 1953.
Chu, T. L., Lee, C. H., and Gruber, G. A. , J. Electrochem. SOC., Solid State. 114, No. 7, 717-722 (1967).
Bibliography (1925 - 1968)
Swets, D. E., Lee, R. W., Frank, R. C. "Diffusion Coefficient of Helium in Fused Quartz", J. Chem. Phys., 3 4 , 17 (1961).
Diffusion coefficient of helium in silicon dioxide glass measured by permeation method using a mass spectrometer.
Leiby, C. C. and Chen, C. L. , "Diffusion Coefficients, Solubilities and Permeabilities for He, Ne, H2 and N 2 in Vycor Glass". J. Appl. Phys., 31, 268 (1960).
In 96% silicon dioxide glass (vycor) helium diffusion rate i s higher than in pure silicon dioxide glass, but i s lower in most other glasses. The higher diffusion rate in vycor i s probably due to the method of fabrication leading to greater porosity.
Mouison, A. J., Roberts, J. P., "Water in Silica Glass?', Trans. Brit. Ceram. SOC., 59, 388-399 (1960), Trans. Faraday SOC., 5_9, 1208-1216 (1961).
Diffusion measured by IR absorption at 2.7 microns. to whether water or hydroxyl i s diffusing species.
Some question as
Zaininger, K. H., Warfield, G . , llHydrogen Induced Surface States at a Si-Si02 Interface", Proc. IEEE, 52, 972-973, August (1964).
Hydrogen increases the inversion layer capacitance upon contact with a n MOS structure at high temperature.
Haas, C. "The Diffusion of Oxygen Into Silicon, J. Phys. Chem. Solids 15, 108-111, August (1960).
Assumption is made that internal friction and diffusion, or both, due to the same relaxation phenomenon. The diffusion coefficient for oxygen in silicon is calculated from experimental data on internal friction. Diffusion constant: O . 2 1 cm2/sec, energy of activation: 2.44 electron volts.

1-6.
1-7.
1-8.
1-9.
Logan, R. A. and Peter, A. J., "Diffusion of Oxygen in Silicon". J. Appl. Phys. 28, 819-820, July 19 (1957).
Experimental results on oxygen diffusion coefficient in silicon support Haas.
Frosch, C. J. and Derick, L. "Diffusion Control in Silicon by Carrier Gas composition". J. Electro-Chem. SOC. 105, 695-699, December (1958).
Antimony tetroxide at 950"C, one hour diffusion at 1200°C produces a junction 1.5 microns deep in a 5 ohm-cm p-type silicon. The surface concentration depends upon the quantity of water vapor in the nitro e n flow gas, from 3.3 x 10¹⁹ atoms/cm-3 for dry nitrogen to 8 x lOlfatoms/ cm3 for nitrogen bubbled through water at 70°C.
Thompson, C. "The Effects of Ambients on Performance of CdS Thin Film Transistors'?. Science Abstracts B. Electrical Engineering 68, 11389 (1965); Japan J. Appl. Phys. 4, No. 3, 207-211 March (1965).
Describes the operating mechanisms of the thin film CdS transistor at several pertinent temperatures and ambients. The effects of the ambients are correlated to device parameters with further implications.
Lehman, H. S., "Chemical and Ambient Effects on Surface Conduction in Passivated Silicon Semiconductors". Science Abstracts B. Electrical Engineering a, 9843 (1965); IBM J. Res. and Development (USA) 8, No. 4, 422-426 September (1964).
The effect of processing variables on the surface conduction properties of passivated silicon junction devices has been studied. Insulated gate field effect transistors fabricated in p-type silicon were used as an experi- mental tool. Varying the metal used as the gate electrode i s shown to strongly influence the surface conductivity of the field effect device. The effects of heat treatment in various ambients and variation in the insulators used are also discussed. Surface conduction is shown to be a complex function of materials thermal history and processing.
1-10. Brattain, V. H. and Garrett, C. G. "Protection of Silicon Conductive Devices by Gaseous Ambients". January 15, 1957.
(Bell Telephone Lab.) US Pat. No. 2,777,974,
The use of ambient atmosphere of oxygen to control the surface characteristics of junction devices by preventing or inhibiting the forma- tion of undesirable conducting paths (channels) at o r near the surfaces of these devices is discussed. The effects of the oxygen is to form a layer of p-type material on the surface of the crystal which prevents the formation of n-type channels on the p-type region.
155

1-11. Many, A. and Gerlick, D. "The Effect of Gaseous Ambients on the Interface Structure of Germanium. Electrochem. SOC., Semiconductor Symposium, May (1957).
(Hebrew Univ. ) Recent news abstracts of the
Simultaneous measurements of surface recombination velocity and trapped charge density in the fast state as a function of surface potential were reported. The surface potential was varied over a wide range by the application of large AC fields normal to the surface. It was found that the distribution and characteristics of the fast state were markedly affected by the surrounding ambients. vacuum, rapid changes in interface structure took place. After a few days stabilization was essentially reached. Following repeated exposures to the different ambients reproducible changes resulted which presisted for many weeks.
Initially with the sample in
1-12. Jauffe, K. "Gas Reaction on Semiconducting Surfaces and Space Charge Boundary Layers". Press, 259-282 (1957).
Semiconductor Surface Physics, Univ. of Pennsylvania
The Fermi potential of a catalyst is related to the electronic exhange level of the reacting molecules. Applying a three dimensional term scheme the relations are generalized. On the basis of results one can determine whether an n- o r p-type catalyst must be used for a reaction. Furthermore, the important rule of the space charge in the catalyst i s discussed with i ts effect upon the reaction kinetics.
I
1-13. Stattz, H., DeMars , G. A . , Davis, L. Jr., Adams, A. Jr., (Raytheon Manufacturing eo. ) Semiconductor Surface Physics (University of Pennsylvania Press) 139-168 Q957).
Steady state and nonsteady state inversion layer conductance on silicon and germanium are discussed in terms of two types of surface states. The second type state is located at the surface of the oxide with perhaps some states in the oxide film. The states result mainly from adsorbed gas molecules. Depending upon the surrounding gas they are either predominantly acceptor or donor type and it i s principally the states which determine the directions in which the bands at the surface are bent. It i s possible to determine the number and energy of the interface states from nonsteady state inversion layer conductance measurement. It i s found that high fields across the oxide film can influence the density of these states in silicon lying above the middle of the gap. Anomalous inversion layer conductances are found when vapors of certain liquids are adsorbed.
1-14. Kozlouskaya, V. M. Composition of Gases Adsorbed on the Surface of Germanium and Silicon Mono- crystals". 940-946 January (1960).
"Mass Spectrometric Determination of the Amount and
Solid State Abstract &, 6046 (1960-1961); Soviet Phys., Solid State 1,
1 56

1-15. Gleason, F. R . , Greiner, J. H. and Yetter, L. R. "Gas Absorption by Vacuum Evaporated Magnetic Films". (IBM) Vacuum 2, 301 November (1959).
Solid State Abstract 1, 6149 (1960-1961);
Mass spectrometric determination of the types and amounts of gases absorbed during the deposition of vacuum evaporated thin films were reported. Most of the gases came from the oil pump. The absorbed gas molecules pe r metal atom degassed was independent of film thickness, indicating that the gas is trapped in the film structure as well as on the surface.
1-16. Kammere, H. C . , "Thermal Evaluation of High Density Electronic Packages". Solid State Abstract 3, 16912 (1962) Electron Design 2, 121-122 December (1961).
A monograph to determine the design limitation of microminiature packages exposed to thermal stress. Five basic parameters investigated were: total temperature between ambient environment and the center of the package, thermal conductivity of package material, cooling technique and size and configuration of maximum.
1-17. Kislev, A. U. and Lygin, V. I. "University of MOSCOW". Solid State Abstract 5, 28828 (1964); Surface Science - 2, 236-244 (1964).
The shift of the absorption band of silica surface hydroxyl groups on adsorption of mulecules of different electronic structures is in accordance with their heats of adsorption and ionization potentials. On the basis of vibrational theory the spectra of water and ammonia molecyles adsorbed on silica and zeolites have been analyzed.
1-18. Boutin, H. and Prask, H. Alumina and Silica by Slow Neutron Inelastic Scattering".
"Study of Water Vapor Absorption on Gamma . Solid State
. Abstract 3, 28830 (1964); Surface Science 2, 261-266 (1964).
The energy spectrum of neutrons, inelastically scattered by hydrogenous groups adsorbed on the solid surface is able to provide information con- cerning the degree of mobility of those groups, the nature and strength of the binding with the adsorbent and the frequencies of rotational o r vibrational motions ranging from 20 to 1,000 cm'l. The principle of the technique i s given and i s applied to water adsorbed on silica and gamma alumina after the samples have been heated to a 150" under vacuum. Two types of water molecules exist on the surface: distorted molecules with hydroxyl groups hydrogen-bonded to oxygen atoms, and tetrahedral molecules similar to the liquid. Additional water layers on the surface become more water-like.
1-19. Volkenstein, F. F. and Karpenke, I. V. "Theory of Photoadsorptive Effect in Semiconductors". December (1964) AD605733.
Solid State Abstract 5, 30709 (1964); STAR 2, 3457A
157

The sign of the photo-adsorptive effect in semiconductors depends on selection of the system, on the mode of experiment and the preparation of the sample for experiment. Report offers formulas for establishing basic cri teria for determination of the photo-adsorption effect.
1-20. Farnsworth, H. E. and Campbell, B. D. (Brown University) "Study of the Surface Properties of Atomically Clean Metal and Semiconductors". State Abstract 5, 37205 (1966); Contract DA28304 ANC 0029E US Government Research and Development Reports 40, 146A May 20, (1965) AD 31-699.
Solid
Oxygen adsorption on the (0001) matte surface was enhanced when an intense light was incident on the crystal. A 3-5 Torr-min oxygen exposure in intense light extinguished the diffraction pattern whereas a 759 Torr- min exposure in the dark had little effect upon the pattern, but did cause a slight decrease in conductivity of the surface. increased the dark conductivity and greatly decreased the effect of intense light. Photo-adsorption of oxygen is indicated. Unlike matte surface (0001) specular surface was not effected by exposure to light.
Ion bombardment
1-21. Hobson, J. P. "A New Method for Finding Heterogeneous Energy Distributions from Physical Adsorption Isotherms". Canadian J. Phys. 4, 1934 November (1965).
Solid State Abstracts 5 41617 (1966);
A model is described which assumes that a hetergeneous surface has a distribution of adsorption energies for physical adsorption. A new solu- tion is presented giving a number of step types: local isotherms, which are chosen to represent varying degrees of adsorbate-adsorbate inter- action. The solution permits energy distributions to be obtained quite simply from isotherm data at one temperature. This solution may be used to calculate isotherms at other temperatures.
1-22. Howling, D. H. Atmospheres". 1844 (1966).
"Photoelectric Response of Metal Surfaces in Ambient Solid State Abstract 7, 48029 (1967); J. Appl. Phys. 37,
Experiments are described which examine variations in the photo- electric response of metal surfaces immersed in gas atmospheres. Work function changes have been produced by gas bombardment, electrode heating, deposition of small amounts of K on the surface. By operating the electrode under study as the cathode of geiger muller photon counter, photocurrents as low as A could be measured. Factors which influence irreversible changes in work functions have been explored. A less well known increase in work function which is thermally activated has been demonstrated. Systems included were: tungsten/hydrogen, nickel/hydrogen, iron/hydrogen, platinum/hydrogen, paladium/hydrogen, rhenium/hydrogen; also nitrogen, neon, argon and ammonia.
158

1-23. Logan, R. M. and Stickney, R. E., "Simple Classical Model for the Scattering of Gas Atoms from a Solid Surface". Solid State Abstract 7, 46668 (1967); J. Chem. Phys. 44, 195 (1966).
A simple classical model for the scattering of gas atoms from a solid surface is proposed and its characteristics discussed. Results are obtained for the angular distribution of scattered particles. The model correctly predicts the general appearance of the scattering pattern, and its dependence upon the angle of incidence of the beam and on the tem- perature and masses of the gas and surface atoms.
1-24. Lu, Wei-Kao, "The General Rate Equation for Gas Solid Reaction in Metal- lurgical Processes with the Restrictions of Reversibility of Chemical Reaction and Gaseous Equimolar Counter-Diffusion". (1967); AIME. Trans. 236, 531 (1965).
Solid State Abstract 7, 46669
An improved general rate equation for a one dimensional gas-solid system has been derived. The concentrations of gaseous reactant and product have been calculated with relations furnished by the following constraints on the system: quasi-steady state and equimolar counter diffusion of gases. The interfacial chemical reaction is taken as 1st order with respect to the concentration of the gases involved. The equation has proper dependence on gas composition and on solid structure through the relative values of Knudsen and normal diffusivities.
1-25. Micheletti, F. ' B., and Mark, P., "Effects of Chemi-sorbed Oxygen on the Electrical Properties of Chemically Sprayed CdS Thin Films". and Communications Abstracts c, 4467 (1967); Appl. Phys. Letters lo, No. 4,
Electronics
136-138 (1967).
Measurements with spray deposited semiconducting CdS films are reported that demonstrate the primary effect of oxygen chemi-sorption i s the reduction of hall mobility.
1-26, Blum, J., Warwick, R. and Genser, M. "Surface Studies with Silicon Planar Junction Structures". Presented at the Spring Meeting of the Electrochemical Society, Toronto, Canada, May 3-7 (1964) (Gen. Prec. Aerospace., Kearfott Div. )
Changes in: emitter current gain, beta, with collector current. Surface recombination velocity limits beta and is in turn determined by the density of fast interface states and the surface potential. Changes in characteristics of silicon npn planar transistors were observed after heating for various times at temperatures between 300-350°C in forming gas (15% H2, 85% Nz), oxygen, vacuum and nitrogen.
159

160

AP PENDlX J. FINAL REPORT ON CASE NO. CQF-101
X-Radiography. - Components were examined for foreign particles, percent void area in the die to header bond and other anomalies. The void area data a r e given in Table 5-1 and indicate an excess of 40 percent voids in 50 percent of the sample. Foreign particles were noted in seven devices using the Search-Ray. Typical findings a re shown in Figures 5-1 to 5-3. Shake testing was performed simultaneously to determine particle mobility but no particle displacement was noted. Particles remained in position after cautious delidding.
Hermeticity. The fine leak test (Veeco) revealed no failures per Autonetics All procurement specification which requires a leak rate not to exceed 5.0 x
helium leak rates fell between 1 x and 3 x 10”. However, 25 percent of the devices failed the gross leak test per specification using ethylene glycol a t 150 C. These failures a r e identified in Table 5-2,
Electrical parameters. - Electrical failures are listed in Table 5-3. The parameters not meeting specifications a r e identified with an asterisk (*). The remaining devices performed according to specification.
Electrical dynamics. - Components were subjected to vibrational s t ress while observing electrical characteristics on a Tektronix 575 Curve Tracer. Eight com- ponents displayed an excessive forward voltage drop a t high forward conductance (2 volts a t 200 ma); one of these was intermittent. are identified in Table 5-4.
The components and failure modes
Optical examination. - Eight components were delidded for optical examination of surface anomalies. Evidences of tool damage, or other mishandling, prior to lidding resulting in damage to metallization on two devices are shown in Figures 5-4 and 5-5. The remaining devices were free of obvious anomalies except for No. 35 (Part No. 00995, Log No. 433) which had a detached post bond weld.
Metallurgical examination. - The eight components delidded for optical examina- tion also were subjected to metallurgical sectioning and microscopy, revealing several previously unobvious anomalies. Partial post bonds a r e shown in Figures 5-6 and 5-7 with electrical contact constricted through intermetallic fragments. Figure 5-8 shows approximately 60 percent of aluminum wire destroyed in welding and the presence of intermetallic formation a t a base post bqnd. Cracks probably due to excessive deformation on an emitter pad bond a r e shown in Figure 5-9. An interface between aluminum wire and aluminum pad is shown in Figure 5-10; Figure J-11 indicates excessive w i r e deformation during welding and cracking from intermetallic formation. . A partial base post bond with intermetallic formation is shown in Figure 5-12, Each numbered figure represents a separate device identified by the caption,
Tensile strengths, Au/A 1 post bonds. - The metallographic anomalies enum- erated above suggested the presence of a general bond reliability problem in this group of transistors. Accordingly, tensile strengths were measured on the post bonds of 25 delidded specimens using the test equipment shown in Figure 5-13 at a pull angle of 45 degrees. Criteria of acceptance a r e defined in an Autonetics procurement speci- fication which requires a minimum allowable breaking strength of 2.0 grams a t .
16 1

TABLE J-1 VOIDS OBSERVED BY X-RADIOGRAPHY I N SAMPLE CQF-101
Greater Than 40%
1 4 5 9
10 11 12 18 20 21 24 25 27 28 30 31 32 34 35 36 37 38 40 45 47 48 51 52 53 55 57 58 62 64 65 66 68 69 70 72 73 76 80 88 89
16 2
Part No.
03750 03749 03748 03742 03711 037 03 03747 03681 03698 00125 00153 00156 00285 00399 00542 00556 00821 00943 00995 00032 00617 006260 00630 00666 OOG7 5 006 86 00727 00731 00732 00738 01002 01065 01222 01262 01282 01291 01310 02259 02322 02458 02475 02620 05079 03739 037’50
Lot No,
437 435 435 435 437 435 435 435 43 5 433 433 439 439 433 436 436 433 433 433 433 436 436 438 438 438 433 436 438 438 439 439 439 432 432 432 432 432 434 434 434 434 434 435 435 435
% Voids in
Bonding Less of Chip Than 40%
27 30 25 20 15 15 30 20 20( FP) 25 15 20( FP) 30 20 20 30 25 30 30 25 25 30 35 20 30(FP) 30 20 30 20 25 20 30 20 30 15 30 20 30 20 20 20 35 20 20 30
2 3 6 7 8
13 14 15 16 17 19 22 23 26 29 33 39 41 42 43 44 46 49 50 54 56 59 60 61 63 67 71 74 75 77 78 79 81 82 83 84 85 86 87
Part No.
03767 03729 03756 03743 03740 03714 03773 03719 03734 03728 03691 00135 00143 00256 00463 00879 00626 00638 00639 00650 00653 00673 00704 00708 00736 00788 01176 01122 01221 01261 01300 02426 02567 02592 05028 05055 05072 05144 05274 05314 05318 03740 03744 03741,
Lot No.
437 437 437 437 437 435 437 435 435 435 435 433 433 433 439 433 439 436 438 436 43 8 436 433 439 438 433 433 433 432 432 432 434 434 434 435 435 435 435 43 5 435 435 435 435 435
% Voids in
Bonding of Chip
80 55 40 65 65 60 70 80 50(FP) 60 60 60 40 75 40 50( FP) 60 60 55 50 70 45 70 40 40 60 70 80 60 60 50(FP) 40 45 60 50 60 60 50 60(FP) 60 70 60 80 60

Figure J-1. Lot No. 435, Part No. 03698
Figure 5-2. - Part No. 03698, Lot No, 435
163

No.
6 8
13 14 15 18 19 20 23 26 32 34 38 43 66 67 70 74 76 82
-
164
Figure J-3. - Part No. 00156, Lot No. 439
TABLE 5-2 GROSS LEAK FAILURES
Part No. Lot No.
03756 03740 03714 03773 03719 03681 03691 03698 00143 00256 00821 00943 006260 00650 01291 01300 02322 02567 02620 05274
437 437 435 437 435 435 435 435 433 433 433 433 436 436 432 432 434 434 434 435

TABLE 5-3 ELECTRICAL FAILURES
No. Part No.
1 10 13 14 19 25 29 34 41 47 61 62 75 78 81 85
No
5 8
13 35 40 44 58 61
-
037 50 03711 03714 03773 03691 00156 00463 00943 00638 00675 001221 001222 02567 05055 05144 03740
Lot No.
437 437 435 437 435 439 439 433 436 438 432 432 434 435 435 43 5
Parameter
IC BO h * * * * * * * * * * * * * * *
* *
*
TABLE 5-4 DYNAMIC ELECTRICAL FAILURES
High Forward Part No. Lot No. Voltage Drop Intermi ttents
03748 03740 03714 00995 00630 00653 01065 01221
435 437 435 433 438 43 8 439 432
*
the bond edge (BE) and 3.0 grams for a complete bond (CB) failure. Obviously a BE rupture below 3.0 grams could mask a potential CB failure. The parent strength of the aluminum lead wi re was 12-15 grams.
The results of these tests are given in Table 5-5 with the mode of rupture identified in each case as BE or CB except where detached leads or zero pull strengths w e r e encountered. The BE failures &e ascribed to a possible excessive pinching during bonding resulting in reduction of wi re cross section at the bond egges. The CB failures may have resulted from insufficient weld interface, granule formations or oxide contaminations at interfaces.
165

166
Figure J-4. Part No. 03748, Lot No. 435
Figure 5-5. Part No. 00653, Lot No. 438

Figure J-6. - Part No. 03740, Lot No. 437
Figure 5-7. - Part No. 03714, Lot No. 435
167

Figure 5-8. - Part No. 00630, Lot No. 438
Figure J-9. - Part No. 00653, Lot No. 438
16 8

Figure J-10. - Part No. 01065, Lot No. 439
Figure J-lle - Part No. 01065, Lot No. 439
169

Figure 3-12. - Part No. 01221, Lot No. 432
Figure 3-13. - Lead Bond Tensile Tester
170

TABLE 5-5 POST DATA YIELD STRENGTH DATA
No. - 63 67 66 70 89 80 87 62 69 64 75 79 76 74 68 81 86 83 78 65 85 77 82 84 88
Part No,
01261 01300 01291 02322 03750 05079 03741 01222 02259 01262 02592 05072 02620 02567 01310 05144 03744 05314 05055 01282 03740 05028 05274 05318 03739
Lot No.
432 432 432 434 435 435 435 432 434 432 434 435 434 434 432 435 435 435 435 432 435 435 435 435 435
Emitter Pull
Strength (grams 1
0 1.7 3.3 3.5 2.0 3.5 2.6 5.0 3.2 3.7 3.5 3.5 1.0 2.0 2.6 4.0 2.0 0 3.9 2.0 2.1 0 2.0 3.0 2.9
Mode of Failure
-- BE* CB* BE CB* CB BE BE CB BE CB BE C B* CB* BE BE BE
(detached) CB CB* CB*
(detached) BE BE BE
Base Pull Strength (grams 1
0 2.0 2.0 1.7 0 1.5 2.5 3.7 0 . 1.5 4.2 5.3 1.3
(detached) 3.3 5.2 2.0 0 0.5 3.2 .
(detached) 3.5 0 3.3 4.1 .
Mode of Fzilure
-- BE CB* CB*
CB* BE BE
BE* BE CB CB*
BE BE CB*
CB* CB
--
--
--
--
CB -- . CB
BE .
*Below specifications.
Tensile strengths, Al/Al pad bonds. - Ten devices were picked a t random and delidded for investigation of the A1 w i r e to A1 pad ultrasonic bonds. Both the emitter and base pad bonds were tensile tested. These bonds were tested with the same equipment and at the same 45 deg angle as the post bonds. The results of these tests a r e listed in Table J-6. The average pull strength of these bonds is 2.2 grams which just exceeds the minimum per specification, Four of the ten devices a r e considered acceptable.
Moisture analysis of package ambient. - Moisture analyses were carried out on five devices mounted individually in a test holder designed specifically for the TO-18 package which was plumbed into the car r ie r gas system of a gas chromatograph. Sampling was accomplished by driving hollow pins through the case of the package and sweeping the ambient gas out of the package through one of the pins and into the instrument for analysis. Results obtained are presented in Table 5-7,
17 1

TABLE J-6 PAD BOND YIELD STRENGTH DATA
No.
15 19 18 14 23 26 32 34 38 43
- Part No.
03719 03691 03681 03773 00143 00256 00821 00943 00626 006 50
E mi tter
Strength Mode of Strength Lot No. (grams) Failure (grams)
Pull Base Pull
435 435 435 437 433 433 433 433 436 436
0 2.6 1.9 2.7 3.4 3.1 0 2.1 3.4 5.1
-- BE BE * BE BE BE
BE BE BE
--
0 2.7 2.5 0 2.8 2.4* 3.0 2.4 4.2 0
Mode of Failure
-- BE BE
BE CB BE BE BE
--
--
*Below specification.
TABLE 5-7 MOISTURE CONTENT OF SELECTED DEVICES
Sample No. Par t No. Lot No. % Water by Weight Absolute H20 Content
-- 11 03703 435 Lost 10 03711 437 85 1.51 x grams
41 00638 436 77 1.29 x l o m 5 grams
51 00727 436 53 2. o . x grams
52 00731 43 8 88 1.47 x grams
These moisture levels are considered to be intolerably high.
Package ambient analysis. - Analysis of package gas composition was performed on five TO-18 packages by gas chromatography using helium as a car r ie r gas. In view of the excessive moisture levels found in the five previous analyses, the water peak i n this group also was estimated. All five devices had survived fine and gross leak tests and static and dynamic electrical tests. Chromatography was performed on a dual column system consisting of a 12 f t x 1/8 in. Poropak Q column and an 8 f t x 1/8 in. Molecular Sieve 5 A column. Conditions employed are as follows:
Columns - Dual, Molecular Sieve 5 A, Poropak Q
Temperature - 70°C
Carr ier Gas - Helium
C ar ri er Pressure - 20 psi
Bridge Current - 300 ma 172

The analytical results a r e given in Table 5-8, These results indicate that the intended ambient was pure nitrogen. However, considerable contamination with oxygen is present, and the moisture levels are again excessive, in all cases exceeding the dew point of the contained gas. In view of this latter fact the moisture levels given in.Table 5-8 a r e split into gas phase content a t 100 percent relative humidity (25 C) and liquid phase.
of their manufacture. The presence of oxygen suggests ineffective process control of lidding atmospheres. The presence of moisture is more difficult to explain (because the samples were hermetic) but may be due to incomplete curing of the Pyroceram prior to lidding.
The gas ambient compositions in these devices appear to warrant investigation
Electron microprobe analysis of Al/A1 bonds, A f t e r ambient analysis these devices were delidded and examined microscopically (optical) for corrosion. In spite of the excessive moisture no evidence of metal corrosion was found. Electron microprobe analysis of one of these specimens yielded no evidence of the presence of corrosive contaminants. Taken together these observations indicate that the manufacturer employs a clean process except for the anomalies noted in the previous paragraph.
In summary, this group of devices i s characterized by several defective conditions which could impair long term electrical performance. These defects are: excessive voids in die-header bonds, gross leak failures, hFE degradation, inferior post bonds and pad bonds and extreme moisture levels in packages, Other anomalous conditions a r e present to an extent of less than ten percent of the sample and do not necessarily portend serious reliability problems or indicate substandard control of process techniques. The manufacturer could avoid most of these problems by applying s t r ic t quality control measures.
TABLE 5-8 GAS CONTENTS OF SELECTED DEVICES
Gas Phase ppm H 0 Excess H 2 0
Sample Par t Lot 0 2 % b y N2%by H20 in Gas Phase (weight) 2 Liquid No, No. Volume Volume -- No.
73 02475 434 42.7 54 .4 1 x 1Ow6.gms 18000 3 . 2
71 02426 434 11.3 85 .8 5 X gms 18000 3 .14
72 0'2458 434 5 . 1 92.0 4 X low7 gms 18000 2 .84
45 00666 438 3.7 93.4 4 x low7 gms 18000 2 .7
46 00673 436 11.5 85.6 2 X gms 18000 2 . 8
Accuracy f 5 Percent
173


APPENDIX E(. INSTRUMENTAL CAPABILITY PROFILE
INSTRUMENTS FOR FAILURE ANALYSIS
Instrument
Dye penetrant
Etching and microscopy
Binocular micro- scope (3- 120X magnification)
Abnormality Observed (physical)
Cracks in package seals
Dislocation distribution
Pits, cracks, and chips
Pinholes and I cracks in oxide
insulating layer
Inhomogeneity (Oxidation, contamination, intermetallics o r rub marks.)
Opened bonds
Cracked dice
Cracks in package lead seals
Related Failure Modes
Leaks
Soft junction (gradual ra ther than sharp increase in cur- rent characteristic across junction)
Opens
Shorts
Weak bonds or electrical leakage
Electrical open circuit
Open circuit or shift in resistance
Leaks
Probable Failure Mechanisms
Inversion (change in semiconductor type)
Electrical param- eter drifts
Mechanical failure
Migmting of metallization
Poor surface wetting Migration of charged con- taminant causes inversion.
Intermetallics form by diffusion,
May have resulted from overheating.
Mishandling, over- heating, o r con- taminated surface.
Pressure during die or lead bonding.
Rough handling, misalignment, thermal mismatch, o r bubbles in glass.
17 5

Instrument
Binocular micro- scope (3- 120X magnivication) (continued)
Phase contract microscope
Dark field ,
microscope
Interferometer
INSTRUMENTS FOR FAILURE ANALYSIS (Cont)
Abnormality Observed (physical)
Pits and pyramids on dice
Poor regis t ry o r masking
Scratches on dice o r intraconnects
Microplasma in operating device
Stacking faults
Transparent contaminants
Improper oxid e metalliza.tion topography
Photoresist residues, dust
Bubbles in Sealant glass
Oxide and surface topography varies from design
Related Failure Modes
High leakage o r hot spots a t thinner base areas
High leakage, shorts o r opens
Open o r high res is t a nce
Soft junction
Soft junctions
Surface inversion
Electrical leak- age, shorts, o r opens
Inversion
Leaks
Electrical leak- age, shorts o r opens
Probable Failure Mechanisms
Poor epitaxial growth control results in thin localized base a reas (after diffusion).
Narrow insulating path may short, or inversion may cause high leakage current.
Handling and testing.
Current con- centrates a t stacking faults, dislocations, o r thin spots in base.
Shifting electrical parameters.
Ionic contaminants migrate and result in reverse leakage.
Misalignment creates narrow insulating paths which short or leak a s result of inversion.
Diffusion of charged contaminants.
Inversion.
Mis ai i gnmen t creates narrow insulating paths which short or leak a.s resdt of inver- sion.

INSTRUMENTS FOR FAILURE ANALYSIS (Cont)
Instrument
Interferometer (continued)
Electron micro- scope (magnifies to 100,000x) .
Abnormality Observed (physical)
Oxide thickness varies from design
Metal thickness varies f rom design
Dislocation and stacking faults distribution
Contaminant and corrosion location
Etch pits, scratches dust, and deposit roughness
Pattern alignment and topology e r r o r s
Undercut etched edges
Weld porosity
Porous diffusion products
Related Failure Modes
Stray capacitance, electrical leakage or inversion
Opens
Soft junctions
Weak bonds or electrical leakage
Opens, shorts, o r parameter drift
Shorts or opens
Opens o r inversion
Contaminants
contaminants or weak bonds
Probable Failure Mechanisms
Meager contacts melt and open.
Metal diffuses' through oxide and causes leakage.
Thin metal areas burn out.
Precipitates in bulk silicon.
Electrochemical reaction.
Sur fa ce roughness cause thin spots in conductor deposits which may heat and melt.
Meager contacts burn open. Narrow isolation area.s short across;
Contaminants cause corrosion and opens or migrate and cause inversion.
Contaminants cause corrosion and opens or migrate and cause inversion.
Contaminants cause corrosion and opens or migrate and cause inversion, Kirkenda 11 effect (mismatched dif- fusion rates of dissimilar metals)
177

INSTRUMENTS FOR FAILURE ANALYSIS (Cont)
Instrument
Electron Micro- scope (magnifies
(continued) to 100, OOOX)
Radiographic equipment
Controlled etching
X-ray diffraction
Abnormality Observed (physical)
Scribe cracks
Voids in welds
Metal migration
Contaminant pa r t ides
Cracks
Long wi re s
Misalignment of metal par ts
Depth of inversion charge
Identity of con- taminant compounds o r corrosion.pro- duct compounds
Identity of materials
Related Failure Modes
Opens (if cracks propagate)
Leaks in package; opens if voids a re a s s oc ia t ed with bonding of wires and package to IC die
Shorts or opens
Shorts
Opens or leaks
Shorts
Leaks, opens, or shorts
Inversion
Weak bonds or electrical leakage
Abnormal electri- cal parameters
Probable Failure Mechanisms
causes voids. Thin spots may heat and melt.
Thermal or mechanical stress causes cracks to propagate.
Inversion corrosion, poor welding control.
Kirkendall voids form weak bonds.
Mobile metallic contaminants shorts.
Cracks propagate and open connections.
Wi res sag, cause shorts.
Misalignment causes weak bonds, shorts, opens, or leaky packages.
Inversion
Electrochemical reaction
Drift of electrical parameters.

INSTRUMENTS FOR FAILURE ANALYSIS (Cont)
Instrument
Metallograph
Electron back- scatter thickness meter
Instrument
Hot stage metallograph
Abnormality Observed (physical)
Observes same abnormalities a s binocular micro- scope; also:
Poorly adherent interconnects o r bond structures
Abnormal junction depth (by angle lapping)
Voids in thermo- compr es s ion bonds
Incomplete or poor welds
Thin o r non- adherent plating
Thickness of oxide, plating or photoresist
Abnormality Observed (chemical)
Contaminant melting point and reactivity (for identification)
Interdiffusion of metals, for example
Ti-Au, Kovar-Au A l-Au, MO-Au,
Whisker growth
Related Failure Modes
Opens
Improper electri- cal character- istics.
Bond has high electrical and/or thermal resistance and may be mechanically weak
Leak in package
Poor joints
Stray capacitance, electrical leakage, inversion or opens
Related Failure Modes -
Weak bonds or electrical leakage
Parameter drift
Shorts o r opens
Probable Failure Mechanisms
Improper deposition and/or bonding conditions,
Bad junction depth.
Hot spots, poor electrical characteristics or opens.
Faulty package seals.
opens bonds and/or package leaks,
Electrical parameter drift
Probable Failure Mechanisms
Electrochemical reaction.
Intermetallics form from diffusion,
Metal whiskers grow and make shorts.
Removal of metal leaves opens
179
. .

INSTRUMENTS FOR FAILUR-E ANALYSIS (Cont)
Instrument
Hot stage metallograph (continued)
Electron diffraction
Low- energy electron diffraction
Electron micro- probe (elemental chemical analysis
Abnormality Observed (chemical)
Grain growth
Surface diffusion or metal films
Contaminant crystal structure and identity of inter- metallic compounds
Deposit csys tallinity
Presence of absorbed sub- stances in surface
Contaminant o r rub mark residue identity and map
Dopant and Dopant concentration
Intermetallic analysis
Corrosion product identity
Deposit topography map by chemical demen t
'Deposit thickness map by chemica1 element '
Crack, pit, and pinhole maps .
Related Failure Modes
Pa.rame t e r drift
Shorts, opens or parameter drift
Weak bonds or electrical 1eaka.ge
Open, shorts, o r para.meter drift
Inversion
Weak bonds o r electrical leakage
Related to pro- cess control
Weak bonds o r electrical leakage
Weak bonds or electrical leakage
Opens, shorts, or parameter drift
Opens
Opens or shorts
Probable Failure Mechanisms
Dr i f t in braze, bond, o r inter- connect resistance.
Metal films cause shorts o r inversion. Lack of diffusion barriers.
Electrochemical reaction.
Migration of charged a bs orbates causes inversion.
Migration of charged contamin- ants causes inver s ion.
Thin areas melt and open,
Thin or narrow areas on inter- connects open, Pinholes.
180

INSTRUMENTS FOR FAILURE ANALYSIS (Cont)
Instrument
Electron micro- probe (elemental chemical analysis) (continued)
Gas chromatograpl
Ma s s spectrograph
Gas chromatograpl and mass spectro- graph in combination
Infrared absorp- tion spectrograph
Emission ultra- violet and visible spectrographs
Abnormality Observed (chemical)
Junction misalign- ment or movement
Opens, short and current and/or voltage nonuniform i ty map
Abnormal pa.ckage ambients
Leaks (by presence of a i r or test fluid)
Leaks. Also: reaction of device to ambient changes in the spectrograph
Leaks. Also: reaction of device to ambient changes in the spectrograph
Thin oxide
Abnormal oxygen content in silicon
Abnormal epitaxy thickness
Impure photoresist
Water
Analysis and identity of con- taminants
Related Failure Modes
Electrical leakage, shorts, opens, or inversion Abnormal electrical param- eters
Inversion o r grain drift
Inversion or grain drift
Inversion or grain drift
Inversion or grain drift
Shorts o r electri- cal leakage
Drift of electrical pa.rameters
Slow switching, punch- through
Inversion
Surface current leakage
Parameter drift, opens, inversion
Probable Failure Mechanisms
Migration of metal is evidence of inversion. Cause of abnormal electrical param- eter may pinpoint failure mechanism.
Absorption, then charge migration causes inversion.
Absorption, then charge migration causes inversion.
Absorption, then charge migration causes inversion.
Absorption, then charge migration causes inversion.
Abnormal electri- cal parameters
R ec omb ina ti on centers
Drift of marginal electrical param- eters.
Migration of impurities.
Water vapor enters through leak.
Contaminants migrate and change electrical properties or cause corrosion.
181

INSTRUMENTS FOR FAILURE ANALYSIS (Cont)
Instrument
Visible and ultra- violet absorption spectrographs
Neutron activation ana€yz er
Instrument
Strain gauges
Bubble tester
Helium leak tester o r Radioflo tester
Abnormality Observed (chemical)
Analysis and identity of contaminants
Same as emission spectrograph but a t lower con- centrations
Abnormality Observed (mechanical)
Loose headers or dice
Poor 1 y bra zed headers o r dice
Gross leaks in packages
Small leaks
Related Failure Modes
Parameter drift, >pens, inversion
Parameter drift, )pens, inversion
Related Failure Modes
Thermal
Channeling o r inversion
Opens o r shorts
Uncontrolled package ambient causes inversion and corrosion
Probable Failure Mechanisms
Contaminants migrate and change electrical properties or cause corrosion.
Contaminants migrate and change electrical properties o r cause corrosion.
Probable Failure Mechanisms
Nonadhesion of braze evident from thermal expansion of can. Poor thermal path causes overheating.
Nonadhesion of braze evident from thermal expansion of can. Poor thermal path causes overheating.
Nonadhes ion of braze evident from thermal expans ion of can. Poor thermal path causes overheating.
Corrosion causes opens o r shorts.
Charged absorbates from ambient migrate and cause inversion. Corrosion by ambient causes opens o r shorts
182

Instrument
Thermal plotter
Curve tracer
INSTRUMENTS FOR FAILURE ANALYSIS (Concluded)
Abnormality Observed (mechanical)
Hot spots due to voids
Hot spots due to thin base a reas
Rot spots due to dis- location or stacking faults
Shorts
Opens o r inter- mittent contacts
Soft junctions
Abnorma.1 resistance
Leakage currents and inversion
Related Failure Modes
Excess currents
Excess currents
Excess currents
Shorts
3pens or inter- mittent contact
3of t junctions
Abnormal resistance
h v e r s ion
Probable Failure Mechanisms
Material degradation.
Uneven diffusion and thin base areas.
Faster diffusion along fault causes thin base area.
Sagging wire, punch through o r surface creep of metal.
Mishandling, intermetallic forma tion.
Surface 1eaka.ge.
Mechanical damage or corrosion.
Surface charge migration o r surface contamination,
183

SENSITIVITIES OF INSTRUMENTS
Instrument and Procedure
Optical microscope Phase contrast
Electron microscope
Interferometer Single beam Multiple beam
Proficorder
Contour projector
Ellipsometer
Electron dif fr ac tograph Reflection Transmission
Low energy electron diffraction (4 00)
Scanning electron microscope
Radiography unit
X-ray diffract ion
184
(Physical Proper ties)
Parameters Measured
Surface topography Stacking faults
Crystal imperfections Dislocations & stack-
ing faults
Film thickness or surface roughness
Surface texture
Surface contour along a line shadow
Film thickness, die-
Film thickness, lec t r ic
silicon
Crystal character Crys ta l lattice
parameters
Surface structure (generally) indicates presence of absorbed material s
Device topography, voltage contrast
Inner topography
Phase analysis Crystallite size
Dislocation mapping
Sensitivity, * Resolution o r Power
3X to ZOOOX, 0.5 micron To lOOOX, 0.5 micron
10 angstroms, 300, OOOX 100 angstroms apart
300 angstroms 25 to 10 angstroms
100 angstroms
10 microns
2 angstroms
10 microns
0 .01 angstroms
1 to 2 atomic layers deep
0.05 to 0.5 micron, 50, OOOX
0.1 micron
0.5% to 10% 0.5 to 0 . 3 and 10 to 1,000
Over 5 microns apart micron ranges
5,000 psi or 500 ppm strain over area 0.010 in. across

SENSITIVITIES OF INSTRUMENTS (Cont)
(Physical Proper ties)
Instrument and Procedure
Strain gauges
Tensile testers
Thermal plotter
Etching
Oscilloscopes
Ammeters, electro- meters
Voltmeters, Poten- tiometer
Capacitance bridges
Ohmmeter, bridge
Parameters Measured
Strain, thus stress
Bond strength
Surface temperature
Dislocations or stacking faults
(E le c tr ical Proper tie s )
Current and Voltage
Current
Voltage difference
Capacitance
Res is tance, impedance
Sensitivity, * Resolution or Power
1 ppm over 0,015 in, 100 pic0 strains
0.1 gram
2 0 ~ over 0.35 mil. 0. ~ O C
over 1 mil diameter
10 microns apart
amperes
amperes
5 x 10- l0 volts ,
farads, static
to 1014 ohms
185

SENSITIVITIES OF INSTRUMENTS (Cont)
Instrument and Procedure
Absorption spectro- scopy atomic
Infrared, attenuated total reflection
X-ray spectroscopy
Emission spectro- scopy
Visible X-ray Neutron activation
Mass spectroscopy Gas Spark
Sputter
Gas chromatography
Electron spin resonance
(Chemical Properties)
Parameters Measurec
Detection of metallic & semi-metallic el emen t s
S u r face composition
Chemical composition, oxidation state
Chemical composition
Concentration of impurities
Chemical composition
Chemica compos ition
Dangling bonds, free radicals, excited states
Sensitivity, * Resolution o r Power
55 elements in ppm.
Depth is about 1 wave- length, depending on the angle of reflection.
10 to 1,000 ppm
1 ppm of most elements 10 ppm of most elements 1 ppb of most elements,
1 ppm of oxygen
0.02 to 200 ppm 10- l~ torr 1 ppb of many elements 20
to 200 ppb of H, N, C, 0 1 to 10 ppm in surface which
is removed at 10 to 100 monolayers per second. Area 0 . 1 mm across may be analyzed.
1 ppb hydrocarbons on milligram sample
1 ppm H, 10 ppm Ar, 50 ppm water
lo1' H electron 'spins per gauss with 1 second integration time.
186

SENSITIVITIES OF INSTRUMENTS (Concluded)
(Electrical Properties)
Instrument and Procedure
Nuclear magnetic resonance
Charged particle spectroscopy
E 1 e c tr on microprobe X-ray mode
Backscattered
Speciment current electrons
mode
Wet chemistry Colorimetric Fluorimetric Ion exchange
Carbon analyzer
Vacuum fusion
Chemical composition
Molecular structure
Surface contaminant identification
Identification & amount of chemical elements
variations Relative At. No
Device topography
Chemical composition
Carbon determina- nation
Chemical compo sition
Sensitivity, * Resolution or Power
2, 000 ppm, 3 x spins/cm 3
Atomic number difference of 1
10 ppm in bulk (1,000 ppm for lightest elements)
0.5 to 1 micron
10 picograms 1 picogram of most elements Concentrates ions 1OOX
10 PPm
50 ppb H, 200 ppb or 0 or N
*Sensitivities quoted are the highest given in apparatus maker's literature.
187

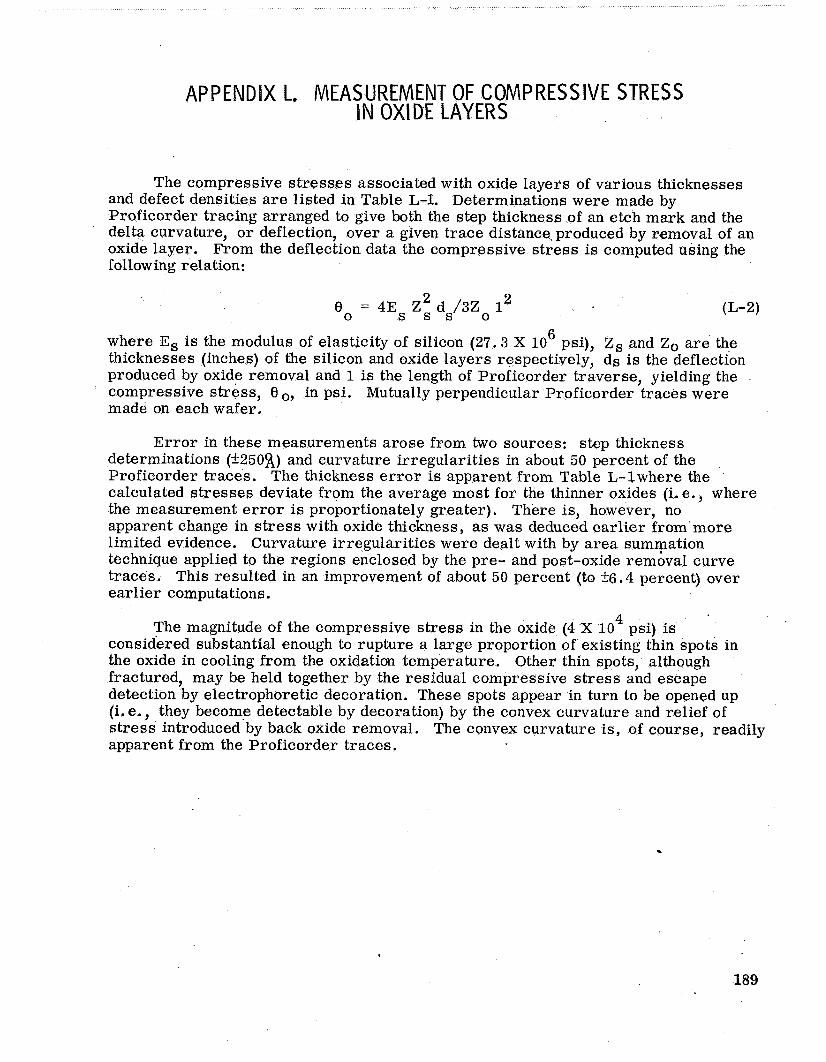
APPENDIX L. MEASUREMENT OF COMPRESSIVE STRESS IN OXIDE LAYERS
The compressive s t resses associated with oxide layers of various thicknesses and defect densities are listed in Table L-1. Determinations were made by Proficorder tracing arranged to give both the step thickness of an etch mark and the delta curvature, or deflection, over a given trace distance produced by removal of an oxide layer. From the deflection data the compressive s t ress is computed using the following relation;
8 0 = 4Es Z : ds/3Zo l2
6 where E, is the modulus of elasticity of silicon (27.3 X 10 psi), Zs and Z o are the thicknesses (inches) of the silicon and oxide layers respectively, ds is the deflection produced by oxide removal and 1 is the length of Proficorder traverse, yielding the compressive stress, 8 o, in psi. Mutually perpendicular Proficorder traces were made on each wafer.
E r ro r in these measurements arose from two sources: step thickness determinations (k250B) and curvature irregularities in about 50 percent of the Proficorder traces. The thickness e r r o r is apparent from Table L-lwhere the calculated stresses deviate from the average most for the thinner oxides (i. e., where the measurement e r r o r is proportionately greater). apparent change in stress with oxide thickness, as was deduced earlier from more limited evidence. Curvature irregularities were dealt with by area summation technique applied to the regions enclosed by the pre- and post-oxide rembval curve traces. This resulted in an improvement of about 50 percent (to 26.4 percent) over earlier computations.
There is, however, no
4 The magnitude of the compressive s t ress in the oxide (4 X 10 psi) is considered substantial enough to rupture a large proportion of existing thin spots in the oxide in cooling from the oxidation temperature. Other thin spots, although fractured, may be held together by the residual compressive stress and escape detection by electrophoretic decoration. These spots appear in turn to be opened up (i. e., they become detectable by decoration) by the convex curvature and relief of s t ress introduced'by back oxide removal. The convex curvature is, of course, readily apparent from the Proficorder traces.
.
189

Run
A
B
C
D
E
J
F
G
TABLE L-1 CORRELATION OF DEFECT DENSITIES WITH OXIDATION AND STRESS
Oxidation
Time, t 1/2 (Minutes)
2.24
3.16
3.87
4.47
5.00
5.00
6.32
7.81
Thickness (Angstroms)
1720
1995
2590
3125
2945
3760
4010
5325
Defects vs Stress (No. /Wafer)
No Stress"
131
35
10
5
8
0.5
1
0
Full Stressb
545
511
343
111
170
205
31
24
Partial Stress'
987
644
479
146
3 53
333
140
90
Av :
Measured Stress
(Psi x d
40.3
49.5
36.8
40.0
42.1
37.3
41.4
42.6
41.3 &6.4%
a. Silicon etch pit count produced before cooling. b. Decoration count after cooling. c. Decoration count after removal of back oxide layer. d. By Proficorder trace method described in text.
190

APPENDIX M. EFFECT OF HYDROGEN ON INTEGRATED CIRCUIT PERFORMANCE
Present process control of packaging techniques is inadequate in several respects and fosters a variety of modes of failure. These include variations in gas ambient compositions, nonhermeticity, corrosion of leads, inferior heat sinks and cracked dice. These problems often are interdependent and augment each other or additional failure modes. Nonhermeticity may contribute to variations in package ambients and corrosion of leads; inferior heat sinks may contribute to cracked dice, degradation of hFE and metallization mass transport, all of which a re current reliability problems. Associated with the problem of nonhermetic package is the lack of an adequate gross leak test. The objective of this investigation is to locate the sources of these problems in process control techniques and to seek remedies therefor.
Previous program activities in this area have been limited mainly to the analysis of package ambients and the investigation of the effects of certain of these gases on transistor function. Using mass spectrometric and gas chromatographic techniques a large variety of gaseous species were detected in the packages of transistors and integrated circuits. It was shown that the presence of moisture seriously affected the low temperature performance of mesa transistors but not of planar transistors. It also was shown that baking for limited periods in a hydrogen ambient produced irreversible increases in the betas of some groups of transistors but not in others. General conclusions could not be reached because of the limited sampling and the insufficiency of available process histories.
Improved facilities were established for similar investigations on integrated circuits providing considerable flexibility in the selection of test ambient compo- sitions, temperatures and pressures. Investigations also were extended to the major problems indicated above. The general approach to these problems consisted of examining current practice for clues to the process origins of component defects followed by chemical and instrumental failure analysis by established procedures.
Environmental testing on a first group of integrated circuits was inconclusive as a result of poor versatility of the external circuitry. A second group of 15 type 947 GPA integrated circuits were selected and prepared for environmental testing using an improved electrical connection network which permitted both beta and voltage breakdown measurements on the output section without the need to rebond any compo- nents inside the package. However, four separate connections were needed for each device which limited the number inside the vacuum chamber to seven plus two control devices.
The devices were placed on a special pyrex platen grooved to accept each device lead in a separate 0.010 inch deep by 0.025 inch wide slot (Figure M-1). Gold- plated Kovar 0.003 by 0.010 inch ribbon lead wires connecting the devices to the bakeable high vacuum feed-through connector inside the chamber were attached to the devices by thermal compression welding. Exact positioning of each device and lead wi re on the platen was maintained by pyrex cover plates mechanically clamped to the base platen. Location and clamping is such that stress loads are not applied to
191

Figure M-1. - Integrated Circuitry Mounted on Paper Platen
either the device or lead. Insulation of leads between the vacuum feed-through connector and platen was teflon sleeving which had been punctured along each length to reduce virtual gas loads. any bonding adhesives to attach either the devices o r connecting leads.
This new mounting configuration eliminated the u s e of
It was found necessary to develop special methods of delidding and lead bonding to eliminate mechanical failures due to handling. These problems were solved by constructing a special furnace for freeing the lids from the packages and by adapting a split tip welder of Autonetics design to the bonding process. Electrical tests on a group of five IC's performed before and after the applications of both techniques revealed no change in BVceo, BVcer and beta, thereby establishing nondestructive- ness of the procedures.
The initial test sequence adopted for nine Norden IC's was designed to approach ambient survival limits cautiously. It was found that moderate heating in vacuum (100 C and 150 C) produced no significant change in the room temperature character- istics although large changes were noted at the elevated temperatures. The reversible nature of the high temperature effects indicate generally good device stability.
192

In a second test sequence, the nine IC's (two of which remained lidded) were thermally cycled from room temperature to 150 C in vacuum and in "forming gasf1 (15 percent H2 and 85 percent N2). Only two of the devices (both delidded) survived this treatment, both of which returned to their original room temperature character- istics. The performance (average beta) of the two devices is plotted in Figure M-2 as a function of ambient treatment and indicates that an ambient of 15 percent hydrogen at 150 C produces no irreversible change, even under a constant electrical load of potentially destructive magnitude. This result once again suggests that the effects of hydrogen on the characteristics of most planar devices is largely insignificant. Figure M-2 also indicates that high temperature performance in the presence of hydrogen is scarcely different from that in vacuum.
Optical examination of the seven failed devices revealed that failure invariably occurred at the transistor emitter-to-pad metallization (Figure M-3). The failure mode was an open circuit produced by fusion and parting of the metallization, followed by contraction of the molten metal by surface tension into a module adjacent to the pad bond. The evidence indicates excessive heat generation in the vicinity of the emitter- base region combined with inadequate dissipation. It also appears possible that the failures may have been initiated by prior mass transport of metallization because the devices had endured previous periods of treatment at 150 C under the same current load without evidence of change. The two lidded devices not exposed to hydrogen suffered the same failures.
The two unlidded devices that survived the above thermal treatments were remounted on the Pyrex platen as shown in Figure M-4 and reinserted in the environ- mental test chamber shown in Figures M-5 and M-6. In this figure the right-hand
2oo r 0
150 c E; m w u 3 100 > c
50 VACUUM, to TORR
0
TEMPERATUE(OC) RT 24 100 24 150 26 23 119 21 100 150 20
Figure M-2. - Behavior of Two Surviving Units in 15-Percent Hydrogen Ambient
193

Figure M-3 e - High Temperature Failure of Emitter-to-Pad Metallization
194

Figure M-4. - IC's Mounted on Platen
19 5

Figure M-5. - Insertion of Test Specimens Into Environmental Chamber
Figure M-6. - Environmental Test Assembly
196

cylindrical structure, mounted with thermocouples and heating tapes, is the assembled test chamber containing the devices and the left-hand cylindrical structure is the ion pump. Roughing pump, trap and gas metering devices are not shown. Thermal treatments to 350 C under vacuum and zero bias w e r e conducted on the two IC's with the results shown in Figure M-7. All electrical measurements w e r e made after cooling the chamber to room temperature but under continuous vacuum. The 350 C bake in vacuum was followed by a six hour treatment with forming gas at 250 6 .
The upper curves (p-8 and p-13) in Figure M-7 represent the individual betas of the respective outboard transistors while the lower curves represent the combined betas simultaneously measured. It is seen that the individual betas are much more sensitive indicators of the effects of these treatments than the combined betas. Specifically, the individual betas drop significantly above 300 C. Heating in forming gas, however, tends to revive them, suggesting that the reason for the degradation in betas is a gas desorption process under vacuum at elevated temperatures. Rebaking the devices under vacuum again produced a drop in beta showing the process to be reversible. It was found in subsequent experiments that the transistor betas could be completely revived by baking either in a pure nitrogen atmosphere or a pure hydrogen atmosphere, thus eliminating hydrogen as a unique agent in the recovery of transistor betas. It is worth pointing out that this effect of hydrogen was observed on an earlier group of transistors as indicated in the second paragraph of this section. It is possible that this former group of transistors may have been vacuum baked prior to sealing, and that baking in nitrogen might have accomplished the same effect as hydrogen.
40
4 c W m
30
50 t -
-
40
m
30
2o
2 o t DEVICEA
-
- 0 n IT
Y
DEVICEB
50 I-
1 1 . 1 I
INITIAL 2 o o c 250 c 300 c 350 C 250 c VAC VAC VAC VAC N2/H2 9 HR 10.5 HR 7 H R
6 H R
Figure M-7. - Effects of Vacuum and Forming Gas on Beta at Elevated Temperatures
197

A second group of five identical IC's was baked in nitrogen ambient without prior vacuum treatment. The baking was conducted at successively increasing temperature intervals with room temperature electrical testing after each bake. The final bake was at 525 C for nineteen hours. Except for one IC, which succumbed at a 375 C treatment (emitter/base short), these devices endured the entire sequence with- out significant degradation of room temperature electrical characteristics. Thus it was established that the thermal exposures used in earlier experiments were not excessive with respect to ambient temperature alone.
On the basis of present and earlier results it appears that the effects, if any, of hydrogen ambients on planar devices are curative rather than degradative and are not likely to occur at significant rates except at well above use temperatures. It also appears that hydrogen is not unique in this respect and that improvement in betas after vacuum baking may be effected by other "inert" gases, such as nitrogen. The precise reason for the effects of vacuum baking are not known at this time but should be further investigated in view of the deep space nature of NASA missions.
198

NEW TECHNOLOGY APPENDIX
A main innovation from the activities of this program has been the development and use of new techniques to locate and characterize structural defects in silicon dioxide layers used in the passivation of integrated circuit surfaces. These methods a re described in Appendix F on page 113 under Tnvestigation of Methods For The Detection of Structural Defects in Silicon Dioxide Layers. t t
improvements investigated in this program a r e described in the section ttConclusionstf on pages 37 through 43.
Other process
199