Pro-Poor Economic Growth Issues Papers Volume I - USAID
70
PRO-POOR ECONOMIC GROWTH RESEARCH STUDIES CONTRACT NO. PCE-I-02-00-00015-00 Pro-Poor Economic Growth Issues Papers Volume I
-
Upload
khangminh22 -
Category
Documents
-
view
1 -
download
0
Transcript of Pro-Poor Economic Growth Issues Papers Volume I - USAID
PRO-POOR ECONOMIC GROWTH RESEARCH STUDIESCONTRACT NO. PCE-I-02-00-00015-00
Pro-Poor Economic Growth Issues Papers Volume I

Deliverable 1: Research and Results Dissemination Plan and Time Line Deliverable 2: Website Deliverable 3: Pro-Poor Economic Growth: A Review of Recent Literature Deliverable 4: Poverty-Problem Countries Typologies Deliverable 5: Selection Criteria for Pro-Poor Economic Growth Policies Deliverable 6: Preliminary Policy Recommendations Deliverable 7: Poverty Reduction Strategy Papers: A Preliminary Analysis of the Process and Outputs Deliverable 8: Meeting: Presentation of Phase One Results Deliverable 9: Workshop: Phase One Results, Preliminary Findings, and Planned Research Deliverable 10: Poverty, Economic Growth, and Development Policies and Activities: A Case Study of:
▪ Brazil ▪ Egypt ▪ Indonesia ▪ Peru ▪ Uganda ▪ Ukraine ▪ Zambia ▪ India or Sri Lanka
Deliverable 11: Pro-Poor (Sector) Policies, Reforms and Activities
▪ Agriculture ▪ Education ▪ Finance
Deliverable 12: Pro-Poor Economic Growth Policies, Reforms, and Activities Deliverable 13: Workshop: Research Findings and Implications for USAID Programming Deliverable 14: Pro-Poor Economic Growth and Poverty Reducing Policies, Reforms, and Activities
(Guidance Manual) Deliverable 15: Workshop: Final Findings and Presentation of Guidance Manual Deliverable 16: Dissemination of Findings of Guidance Manual Deliverable 17: Final Project Report Deliverable 18: Issues Papers on:
▪ Conflict and Post-Conflict Recovery ▪ The Environment ▪ Gender ▪ Health ▪ HIV/AIDS ▪ Privatization

Pro-Poor Economic Growth Issues
Papers—Volume I
Health Issues
HIV/AIDS’ Impact on Pro-Poor Economic Growth
Privatization and the Poor: Issues and Evidence
The Pro-Poor Economic Growth Research Studies and Guidance Manual Activity, implemented by Development Alternatives, Inc. and Boston Institute for Developing Economies, is funded by the Bureau for Economic Growth, Agriculture, and Trade, U.S. Agency for International Development, under the terms of Contract No. PCE-I-02-00-00015-00, Task Order #2. This document represents Deliverable #18 under this task order.
Health Issues
by
James C. Knowles
Deliverable 18: Health Issues
i
TABLE OF CONTENTS INTRODUCTION AND OBJECTIVES..........................................................................................1 HEALTH AND PRO-POOR ECONOMIC GROWTH .....................................................................1
Macro Relationships between Health and Pro-Poor Growth...................................1 Micro Relationships between Health and Pro-Poor Growth....................................2
HEALTH AND POVERTY.........................................................................................................6
Poor Health in Broader Definitions of Poverty........................................................6 Poor Health as a Cause of Poverty...........................................................................7
BARRIERS TO IMPROVED HEALTH AMONG THE POOR AND NEAR POOR ................................8
Limited Access to and Utilization of Good-Quality Health Care............................9 Lack of Education and Information .......................................................................10 Poor Nutritional Status...........................................................................................10 Limited Access to Safe Water and Sanitation........................................................11 Poor Housing Conditions.......................................................................................11 Environmental Problems........................................................................................11 Market Failures ......................................................................................................11
RECOMMENDATIONS...........................................................................................................12 REFERENCES .......................................................................................................................15 ANNEX A: ESTIMATES OF THE GLOBAL BURDEN OF DISEASE IN 2001 A-1

Deliverable 18: Health Issues
1
INTRODUCTION AND OBJECTIVES The focus of this issues paper is poverty reduction from economic growth and, specifically, how health sector policy can contribute to poverty reduction by increasing pro-poor economic growth. The paper begins by reviewing the potential contributions of improved health to pro-poor economic growth. It then briefly examines some of the ways improved health can also contribute directly to poverty reduction. The paper also reviews the obstacles to optimal health investments by the poor and concludes with recommendations designed to strengthen the contribution of improved health to pro-poor economic growth and to poverty reduction directly.
HEALTH AND PRO-POOR ECONOMIC GROWTH Pro-poor economic growth, which always leads to decreases in absolute income poverty, is defined as economic growth (for example, increases in per capita gross domestic product) in which the incomes of the poor increase more rapidly than those of the non-poor. Accordingly, health can contribute to pro-poor economic growth either by increasing the overall rate of economic growth or by increasing the share of income from economic growth that is received by the poor. Although it is widely believed that health investments can make an important contribution to pro-poor growth, a balanced assessment of the available evidence is not as conclusive as some accounts suggest. This uncertainty may in part reflect a lack of attention given to relationships between health and economic development in development research (Strauss and Thomas, 1998). Macro Relationships between Health and Pro-Poor Growth Some recent studies suggest that improved health is strongly and positively related to economic growth (Barro and Sala-I-Martin, 1995; Bloom and Sachs, 1998; Bhargava et al., 2001). In fact, a recent major research effort on the relationships between health and economic growth supported by the World Health Organization (WHO) concludes that “investments in health should be a central part of an overall development and poverty reduction strategy” (Commission on Macroeconomics and Health, 2001). The same study reports that typical econometric estimates of the relationship between health and economic growth indicate that each 10 percent improvement in life expectancy at birth is associated with an increase in economic growth of at least 0.3 to 0.4 percent per year, with other factors held constant. The study also reports that high prevalence of diseases such as malaria or HIV/AIDS are also associated with reduced rates of economic growth. According to one study, for example, annual economic growth in a country with a zero prevalence of malaria is about 1 percent higher than in a country with a high prevalence of malaria (Gallup and Sachs, 2001). Unfortunately, although some international studies on health and economic growth suggest a strong association between health and economic growth, they do not establish beyond reasonable doubt that economic growth is causally related to changes in health status, possibly because of econometric problems such as endogeneity, measurement error, and omitted variables.

Development Alternatives, Inc.–Boston Institute for Developing Economies
2
Micro Relationships between Health and Pro-Poor Growth Health and Labor Supply and Productivity Because labor is the main productive resource of the poor, pro-poor economic growth should be labor-using growth. The fact that the labor supplied by the poor is mostly manual increases the potential importance of improved health (including nutrition). Recent reviews of the available evidence conclude that improved health and nutrition likely increases the supply of labor and possibly also the productivity of labor (Strauss and Thomas, 1998; Thomas, 2001). In addition, there is some evidence that the effects of improved health and nutrition on labor supply and productivity are stronger among the poor, among those engaged in manual labor, and among men as compared with women. Although studies in this area must confront problems of endogeneity and measurement error in health and nutrition measures, the following examples include some carefully designed randomized experiments that were relatively successful in avoiding these problems:
A study in Tanzania that provided chemotherapy to randomly selected sugarcane workers infected with schistosomiasis found that their earnings increased (but not quite to the levels of uninfected individuals), while the earnings of untreated workers were unchanged (Fenwick and Figenschou, 1972). A study in Indonesia that involved increasing the price of public health services in randomly selected districts found evidence that some measures of health status that worsened as the result of the increased cost of health care in the treatment districts were negatively related to labor supply and possibly also to wages (Dow et al., 1997). A study using data from the 1993 Indonesia Family Life Survey investigated relationships between symptoms of mental illness (depression) and labor market outcomes (Bir and Frank, 2001). The study found that the symptoms of depression were negatively related (but only at the 0.10 level of significance) both to the likelihood of employment and to the number of hours worked among males but not among females. The estimated coefficients were substantial in magnitude—that is, a male with symptoms of depression was only 52 percent as likely to be employed at the sample mean and, if employed, was estimated to be working about 27 percent fewer hours, as compared with a male without symptoms of depression. A longitudinal study of 302 rubber tappers and weeders in Indonesia found that about one-half were initially anemic, recording about 20 percent lower productivity per day than non-anemic workers (Basta et al., 1979). After a randomly selected group of the workers were given a special iron supplement for 60 days (the controls were given a placebo), the hemoglobin levels,

Deliverable 18: Health Issues
3
aerobic capacity, and productivity of initially anemic workers receiving the treatment rose practically to the same levels as those of non-anemic workers. A study randomly assigned 47 Kenyan road construction workers to receive either calorie supplementation or a placebo (Wolgemuth et al., 1982). Those receiving the calorie supplement were observed to dig slightly more dirt per hour compared with those receiving the placebo. Similarly, a study in urban Brazil in which calorie intakes were weighed and measured found that wages were positively and significantly related to calories consumed at low intake levels (Thomas and Strauss, 1997). Several studies have found a positive relationship between height and wages and labor force participation, with other factors (such as schooling) held constant (Strauss and Thomas, 1998; Thomas, 2001). Some studies have also found wages related to body weight (conditional on height), particularly among males performing physically demanding jobs (Strauss and Thomas, 1998; Thomas, 2001).
Apart from a few health disorders mentioned above (for example, schistosomiasis, iron deficiency anemia, and depression), not much is known about the impact of specific health disorders on labor productivity and supply. However, there have been substantial efforts in recent years to quantify levels of disability associated with a wide range of health disorders in connection with the preparation of Global Burden of Disease estimates (Murray and Lopez, 1996; WHO, 2002). Estimates for 2001 (discussed in Annex A) indicate that: ▪ The health disorders that cause disability differ markedly from those that cause mortality;
and ▪ There are important age, gender, regional, and income differences in the health disorders
that cause disabilities. In the Africa WHO region, for example, the 10 leading causes of years lived with disabilities (YLDs) among working-age adults (15-59) are estimated to be (in descending order of importance): HIV/AIDS (accounting for 12.3 percent of all YLDs among working-age adults); all pregnancy-related health conditions (9.1 percent); unipolar depressive disorders (7.3 percent); other unintentional injuries (4.6 percent); adult hearing loss (3.9 percent); bipolar disorders (3.4 percent); schizophrenia (3.4 percent); other digestive diseases (3.3 percent); violence (3.3 percent); and sexually transmitted diseases, excluding HIV (3.3 percent). The 10 leading causes of YLDs in the South/East Asia WHO region include 8 of the same causes as those for the Africa WHO region. However, in evaluating this information, it is important to consider that the estimates of disability used have not been empirically related to economic consequences, such as reduced labor supply or reduce labor productivity.
Development Alternatives, Inc.–Boston Institute for Developing Economies
4
Health and Human Capital Investments Improved health may also contribute to human capital investments, increasing the supply and the productivity of labor over the longer term. For example, improved health may increase the marginal productivity of both health and education investments by increasing the likelihood of a person surviving through his or her working life (Bloom et al., 2001). Selected investments in the health and nutrition of school-age children have also been shown in some studies to be effective in improving school performance (Behrman, 1996; Strauss and Thomas, 1998). Examples include:
Several randomized experiments have demonstrated that iron supplements provided to school-age children improve their cognitive achievement (Pollitt, 1997; Nokes et al., 1998). However, although behavioral studies indicate significant differences between iodine-deficient and normal children in cognitive skills, randomized trials with iodine supplementation alone have failed to find any benefit for cognitive function of school children (Belli and Appaix, 2002). Some (but not all) randomized experiments have demonstrated that school-based de-worming interventions can improve cognitive achievement (Dickson et al., 2000; Knowles and Behrman, 2003a). In Busia District of western Kenya, a World Bank-sponsored randomized experiment has been evaluating the effect of mass deworming treatment (that is, treating all students in a school) on education outcomes (Miguel and Kremer, 2001; Glewwe, 2002). After two years, observed effects of deworming treatment included fewer absences (a 25 percent reduction in the treatment schools), lower dropout rates, and evidence of reduced helminthic infection in populations not treated (externalities). However, there was no effect on test scores. Based on the effect of the treatment in reducing absences among both the students in treatment schools and the surrounding population, Miguel and Kremer (2001) estimate the benefit-cost ratio for the intervention to be about 10 to 1. In the Philippines, a randomized experiment was conducted in 30 schools in which two of the four interventions tested, included school feeding (Glewwe, 2002). Large effects were observed with respect to test scores, with the largest effects recorded for the intervention that combined parent-teacher partnerships (through structured meetings) with school feeding—that is, ranging between 0.28 and 0.44 standard deviations for math, Filipino, and English test scores. School feeding alone had statistically significant effects on English (and for math in one of three specifications).
There is also some evidence that health and nutrition investments in pre-school children (and possibly even in the health and nutrition of their mothers during pregnancy) enhance their subsequent performance in school and in the labor force. Adult height, for example, largely reflects nutrition during the first two years of life. Adult height is strongly associated with higher earnings among both men and women (Strauss and Thomas, 1998). In addition, recent

Deliverable 18: Health Issues
5
estimates suggest 15 percent lower earnings as adults for every kilogram less of weight at birth (Behrman and Rosenzweig, 2002). Reproductive health interventions targeted to youth may also help them (and particularly young women) remain in school by reducing teen pregnancies (as well as the risk of HIV infection). However, the empirical evidence on the effects of reproductive health interventions targeted to youth, as well as the duration of any effects, is very limited in developing countries (FOCUS on Young Adults, 2001; Knowles and Behrman, 2003a). Health, Demographic Change, and Pro-Poor Growth The evidence continues to accumulate that demographic change may play an important role in pro-poor economic growth by increasing both the overall rate of growth and the share of income received by the poor (Eastwood and Lipton, 1999, 2000; Barro, 2000; Osmani, 2000; Birdsall et al., 2001). Changes in the dependency burden (that is, the ratio of the population of non-working ages to the working-age population) are one of the main channels through which demographic change is believed to affect economic growth (Merrick, 2002). A lower dependency burden increases per capita household incomes in the short run. Over the longer term, a lower dependency burden may induce additional household savings and investment in both human and material capital (Bloom et al., 2001). Health can affect the dependency burden in two ways: ▪ Reductions in infant and child mortality as well as reductions young adult mortality (for
example, HIV/AIDS prevention) may reduce the demand for children sufficiently to initiate a demographic transition in which fertility and the youth dependency burden begin to decline, especially in the presence of other reinforcing changes (that is, an effective family planning program, increased female education, and improved status of women).
▪ Some diseases (such as HIV/AIDS) increase the dependency burden directly by raising
mortality rates among working-age adults, whereas some other diseases reduce the dependency burden directly (for example, fatal diseases of the elderly).
Other Health Effects on Pro-Poor Growth Some endemic diseases can limit the productivity of land for agriculture or tourism (Commission on Macroeconomics and Health, 2001; Gallup and Sachs, 2001). Examples of diseases that have prevented agricultural development in some countries include malaria and onchocerciasis, while diseases that may negatively affect tourism include malaria, dengue fever, and HIV/AIDS. Improved health also extends the lifespan of the population, possibly leading to higher savings rates (Bloom et al., 2001).

Development Alternatives, Inc.–Boston Institute for Developing Economies
6
HEALTH AND POVERTY The relationships between poverty and health are numerous and complex. The available evidence suggests that improved health and nutrition can contribute to pro-poor economic growth. In addition, poor health is an important element in most broader definitions of poverty, while poor health can also be a direct cause of poverty under certain conditions. Poor Health in Broader Definitions of Poverty Any discussion of the role of improved health in poverty reduction should consider that poor health is an important aspect of most broader definitions of poverty, such as those used in the U.N.’s Human Development Reports (Deaton, 2001; Wagstaff, 2001). Targets for several health indicators are also included in the Millennium Development Goals adopted at the Millennium Summit in 2000. The available evidence indicates that the poor are severely disadvantaged in their health status (Strauss and Thomas, 1998). Such evidence is most abundant in the case of the health status of young children (Wagstaff, 2002). In Bolivia, for example, the poorest quintile of the population has an under-5 child mortality rate of 150, compared with 32 in the richest quintile (Wagstaff, 2001). However, not all countries exhibit such marked differentials in health outcomes by income. Those in Vietnam, although still substantial, are considerably smaller, while there is almost no poor-rich child mortality differential in Kazakhstan. An interesting question is, What seems to explain the variation in the size of the rich-poor differentials in child health status among countries? One recent study addressing this question found, surprisingly, that there is only a weak relationship between inequality in health status and either overall income inequality or the degree of public financing of health care (Wagstaff, 2002). However, the study found a strong positive relationship between the degree of inequality in health status and per capita income. The study also found a positive relationship between changes in the degree of health inequality over time and the rate of economic growth—that is, health inequality tended to increase during periods of rapid economic growth in both developed and developing countries. In contrast, information on differences in health outcomes by income group among adults is limited. Information on adult mortality by socioeconomic status is rarely available. Morbidity data are more readily available. However, there is evidence of systematic reporting biases in morbidity data (Strauss and Thomas, 1998). Better-educated people tend to report more illness than less-educated people. Some of this tendency may be because the better educated are more often employed in the formal sector, where they enjoy sick leave benefits unavailable to the poor. Awareness of health problems may also be closely related to contacts with health providers. Richer people tend to visit health providers more often than the poor, so their awareness of health problems may be greater.
Deliverable 18: Health Issues
7
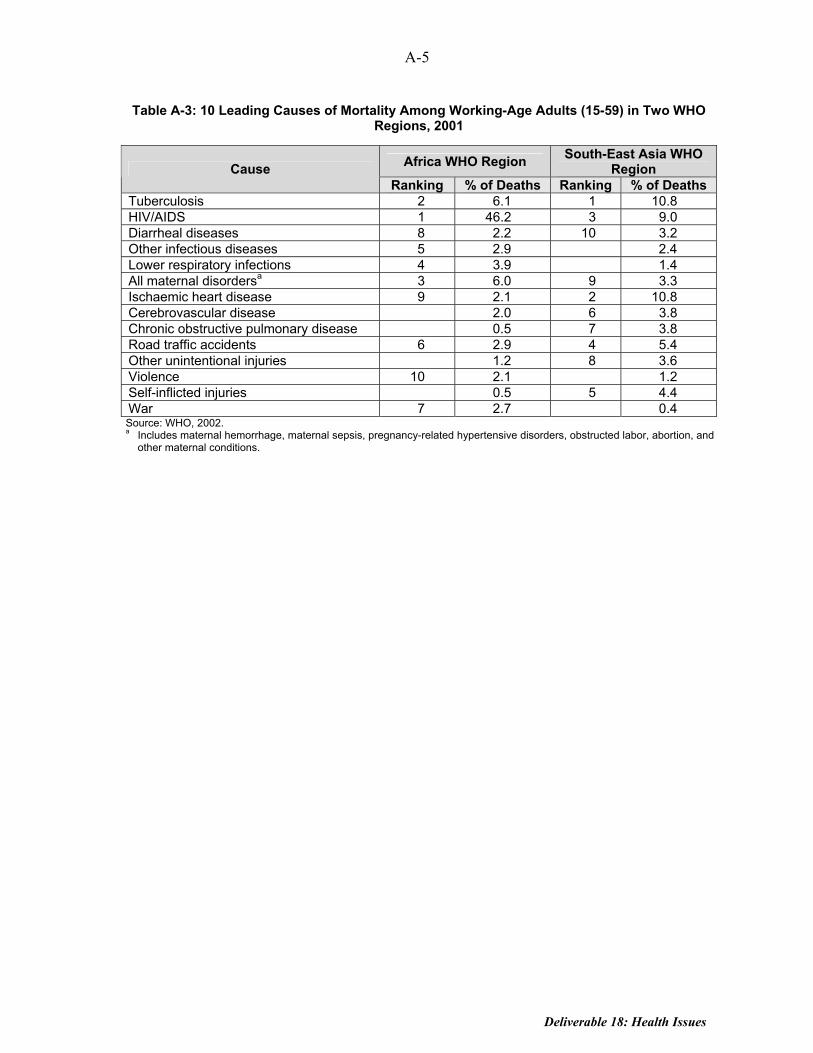
Poor Health as a Cause of Poverty Poor health can also be an important cause of poverty (Wagstaff, 2001). The channels through which poor health can lead to increased poverty include: ▪ Mortality and disability among working-age adults; and ▪ Catastrophic health care costs. Adult Mortality and Disability The death of a working adult, and particularly of a parent, can be a catastrophic shock to a household. Apart from the loss in household earnings, the death of a husband in some parts of South Asia may result in severe social exclusion, including loss of property by the surviving wife. Death of a mother is also generally a severe shock, particularly for the health and welfare of her children (Commission on Macroeconomics and Growth, 2001). The leading causes of adult mortality differ markedly from those of the general population, which are dominated by deaths among very young children and the elderly. According to Global Burden of Disease estimates for 2001 (see Annex A), the leading causes of adult mortality in the Africa WHO region include HIV/AIDS (accounting for 46.2 percent of deaths among adults of working age), tuberculosis (6.1 percent), and all maternal disorders (6 percent). The leading causes of adult mortality in the South/East Asia WHO region include tuberculosis (10.8 percent), ischaemic heart disease (10.8 percent), HIV/AIDS (9 percent), and road traffic accidents (5.4 percent). Although premature mortality of a working adult may provide a strong impetus toward poverty in some settings, particularly if death follows a long period of illness involving large household outlays on health care, this is not always the case. In situations in which the adult consumes more than he or she produces, the impetus toward poverty is much weaker. For example, in several Southeast Asian countries, female-headed households (including those headed by widows) are less likely to be poor than male-headed households. The most serious impact of health on a household’s economic welfare can occur when an otherwise working adult becomes permanently disabled as the result of illness. The disabled adult may not contribute any income to the household but is likely to consume at least as much as other adult household members. In this case, health-related disabilities serve to raise the household’s effective dependency burden. Catastrophic Health Care Costs Very few of the poor and near poor in developing countries have health insurance. Under these circumstances, the fees, both formal and informal, that are increasingly charged at government hospitals can themselves be an important cause of poverty (Wagstaff, 2001). The effect can be immediate, either by reducing post-payment household incomes of the near
Development Alternatives, Inc.–Boston Institute for Developing Economies
8
poor below the poverty line or by increasing the poverty gap for those who are already poor (Wagstaff, 2001). There may also be a dynamic effect on poverty of catastrophic health care costs, which often lead to the sale of a household’s productive assets (for example, land, livestock, and agricultural equipment) to pay for needed medical care (Commission on Macroeconomics and Health, 2001). In Cambodia, for example, catastrophic illness (including HIV/AIDS) was found to be the leading reason for the loss of land among landless households (Oxfam, 2000). Alternatively, households may go heavily into debt and subsequently lose productive assets when the loan cannot be repaid. While the household is attempting to pay off debts incurred to pay for medical care expenses, it may also pull children out of school and put them to work, or it may substitute cheaper, less nutritious foods for more nutritious foods.
BARRIERS TO IMPROVED HEALTH AMONG THE POOR AND NEAR POOR The preceding discussion suggests that households may have strong economic incentives to make the kinds of investments necessary to maintain the health stocks of their members, and particularly those of working-age adults. However, particularly among the poor, there are important constraints that impede households from making optimal levels of health investments (Wagstaff, 2001; Commission on Macroeconomics and Health, 2001). These constraints include: ▪ Limited access to good-quality health care; ▪ Lack of education and information; ▪ Poor nutritional status; ▪ Limited access to safe water and sanitation; ▪ Poor housing conditions; ▪ Unhealthy environmental conditions; and ▪ Market failures. The collective effect of these constraints is to raise the cost of health investments to the poor (Wagstaff, 2001). Consequently, the poor generally do not invest as much in their health as the non-poor. In fact, in most developing countries, the poor fail even to capture a pro-poor (that is, greater than proportionate) share of the public health subsidies that are often officially intended mainly for their benefit (Castro-Leal et al., 2000; Yaqub, 1999). Although pro-poor distributions of public health subsidies have been found in some countries (for example, Malaysia, the Indian state of Kerala, some Latin American countries, Denmark, and the United Kingdom), pro-rich distributions are mostly found in low-income developing countries (Wagstaff, 2002). In Guinea, for example, the poorest quintile of the population has been estimated to capture only 4 percent of public health subsidies, compared with 48 percent received by the richest quintile (Castro-Leal et al., 2000). The share of public subsidies directed to hospitals (and particularly to hospital outpatient care) is almost uniformly pro-rich. The imposition of user fees for hospital services, in the presence of high continuing absolute unit subsidies, has exacerbated this situation.
Deliverable 18: Health Issues
9
Limited Access to and Utilization of Good-Quality Health Care For health care, the poor are more likely to use primary care facilities, traditional care, and self-treatment or to go without any treatment, whereas the rich are more likely to use private doctors and public hospitals. These differences reflect the following differences between the rich and the poor: ▪ The poor have less favorable physical access to good-quality health care than the rich; ▪ Good-quality health care is less affordable for the poor than for the rich; and ▪ The poor and other disadvantaged groups face other barriers to the utilization of health
care that are less often faced by the rich. Physical Access to Good-Quality Health Services The poor generally reside farther away from health facilities, especially hospitals (Wagstaff, 2001). Roads serving the poor are often lacking or are in poor condition, and the poor do not usually have access to private means of transportation (such as cars, motorbikes, and boats). Although reliable information on the quality of care by socioeconomic groups is limited, the available data indicate that facilities serving the poor are also generally of poorer quality (Filmer et al., 2000; Wagstaff, 2001). Affordability of Good-Quality Health Services Fees, both formal and informal, can be an important barrier to the use of health care by the poor (Wagstaff, 2001). In fact, the poor often do not even know how much they will have to pay when visiting a public health facility. Although it may be official government policy to exempt the poor from having to pay fees at public health facilities, fee exemptions are often difficult to get and may depend on ad hoc decisions made by providers on the basis of criteria such as the client’s physical appearance. Another problem is that exemptions are often inadequately funded, so that providers lose money on every exemption granted. The available evidence suggests that most fee exemptions granted under these conditions are received by the non-poor—for example, friends and relatives of providers, civil servants, and influential persons (Gilson et al., 1995; Gwatkin, 2000; Wagstaff, 2001). The fact that formal fees may limit access of the poor in some settings does not mean that charging user fees is always a bad policy for the poor. Some studies have found, for example, that introducing formal fees has improved quality and actually increased health care utilization among the poor (for example, Litvack and Bodard, 1993; Diop et al., 1995). This is more likely to happen, however, when overall funding is too low to permit good quality care or where political pressures lead to distortions in public health budgets (such as when almost the entire budget is absorbed by salary costs). Informal fees are also common in the public health systems of most developing and transitional countries (Ensor and Savelyeva, 1998; Delcheva et al., 1997; Killingsworth et al.,
Development Alternatives, Inc.–Boston Institute for Developing Economies
10
1999). When the quality of services is very poor, informal fees (like formal fees) may improve the quality of care and may improve access even for the poor (for example, when the quality of care in the absence of informal fees is very poor). However, in other cases the effects of informal fees are simply to transfer public subsidies intended for patients to providers and to restrict levels of output. In addition to fees (formal and informal), the poor face many other costs in obtaining health care (Abel-Smith and P. Rawall, 1992). Most important is probably the opportunity cost of the time required to obtain health care from distant health facilities. However, other costs are also incurred for transportation (including transportation of an accompanying family member in the case of hospitalization), for drugs and other materials that the patient is instructed to purchase, and for accommodation for accompanying family members (and frequently also for food for the patient). Some studies have found that these non-fee costs are several times higher than the fees paid to providers. Other Barriers to Access Faced by the Poor The poor often confront other barriers to access. In some countries, for example, it may be difficult for poor women to travel from their home to visit health facilities. Poor ethnic minority groups (such as Indians in many Latin American countries) may face discrimination from providers and may additionally be disadvantaged by not being able to speak the same language as health providers. In addition, few of the poor have health insurance, so they are most often required to pay out of pocket for their health services (Wagstaff, 2001). Lack of Education and Information The poor are usually poorly educated (often illiterate), and their lack of education reinforces their poor health status. The poor are often particularly ill informed about the kinds of practices that maintain good health and avoid illness, and their ignorance about modern health care makes them susceptible to traditional treatments and self-treatment that are often ill-advised (Glewwe, 1999). Income-related inequalities in knowledge about HIV/AIDS in many countries illustrate this point (Wagstaff, 2001). Lack of education can also make it more difficult for the poor to interact effectively with trained health providers. Poor Nutritional Status The poor (especially children and pregnant and nursing women) often do not have enough to eat, and the quality of their diet, in terms of adequate levels of protein, vitamins, and other micronutrients, is often poor. There is some evidence (although mixed) that food prices and distance to a food market influence child survival and nutritional status (Wagstaff, 2001). The economic constraints faced by the poor in obtaining a nutritionally adequate diet are often exacerbated by a lack of information about nutritional needs and how they can be met most economically by available foods. These nutritional deficiencies lower resistance to

Deliverable 18: Health Issues
11
many types of diseases and, in the case of reproductive-age women, increase the risk of pregnancy-related complications and children with low birth weight. Limited Access to Safe Water and Sanitation The poor, and particularly the rural poor, often do not have access to safe water (and in some cases even to an adequate supply of water) and sanitation facilities. This increases their exposure to disease (particularly in the case of young children) and raises the level of investment required to maintain their health stock (Vaz and Jha, 2001; Wagstaff, 2001). Poor Housing Conditions The poor often live in sub-standard housing, and this exposes them additionally to the risk of many types of illnesses. For example, they often share a very limited living area, increasing the risk of tuberculosis and other infectious diseases. The temporary nature of the building materials often used to construct the dwellings of the poor exposes them to the elements, including rain and cold. The poor also often share living space with livestock, exposing themselves to additional health risks, and frequently cook indoors over open wood fires, exposing themselves to dangerous levels of indoor air pollution (von Schirnding et al., 2001). Environmental Problems In addition to problems of indoor air pollution, the poor (and especially the urban poor) often live in areas that are exposed to dangerous levels of air and water pollution. The poor also often live in areas where they are exposed to a variety of endemic diseases, such as malaria and dengue fever. Market Failures Market failures in insurance and credit markets, as well as information asymmetries between health providers and clients, also limit the ability of the poor to invest optimally in their health. Market failures in insurance markets include adverse selection and moral hazard. Their effect is to prevent private markets for health insurance from developing to serve the poor. Providing group insurance to employees of large firms, instead of to individuals, is one approach used by health insurers (including most social insurance schemes in developing countries) to control adverse selection. However, most of the poor are self-employed or employed in the informal sector, so they do not usually have access to health insurance (Preker et al., 2001). The inability to use human capital as loan collateral, together with limited ownership of non-human capital by the poor, limits the ability of the poor to borrow to finance investments in their health. Asymmetries in information between health providers and clients (exacerbated by lack of education among the poor) often lead the poor to invest in
Development Alternatives, Inc.–Boston Institute for Developing Economies
12
ineffective (and frequently dangerous) private health care, thereby reducing the rate of return to health investments (Mills et al., 2002).
RECOMMENDATIONS Recommendation #1: Adjust health sector priorities in individual countries (if necessary) so they better reflect the contribution that improved health can make to pro-poor economic growth. The information presented in this paper suggests that health sector priorities that contribute most to pro-poor economic growth (1) increase the supply and productivity of labor and land, (2) complement human capital investments, and (3) reduce the dependency burden. In some cases, the health disorders that limit progress in these areas are already effectively targeted by interventions supported by public health systems (for example, HIV prevention and treatment; the prevention, detection, and treatment of sexually transmitted diseases; maternal health interventions; tuberculosis detection and treatment; malaria prevention and treatment; and micronutrient supplements). The main concern is that current public health systems place a very strong emphasis (at least in official policy statements) on programs targeted to children under age 5. Such an emphasis can be justified on many grounds, including targeting. However, when the emphasis shifts from relatively narrow public health objectives (that is, getting the largest health impact per dollar spent) to a broader objective, such as poverty reduction, focusing health resources on children under age 5 is less clearly a priority. Adjusting health sector priorities to reflect the potential contributions of improved health to pro-poor growth may mean giving more attention to health disorders that cause disabilities and less attention to health disorders that result in mortality. However, the appropriate balance needs to be carefully struck on an individual country basis because there can be important differences among countries in the social impact of adult mortality. Some health disorders have probably received too little attention in the past. For example, mental health disorders (and particularly unipolar depression) are important causes of disability among both working-age adults and school-age children. Treating some mental disorders (such as, depression and schizophrenia) may be cost-effective from the standpoint of poverty reduction, even though it may not be cost-effective from a narrower public health perspective—that is, in terms of cost per disability-adjusted life year gained (Shah and Jenkins, 2000; Whiteford et al., 2001; Institute of Medicine, 2001; WHO, 2001). The prevention of injuries, which are an important cause of death and disability among both working-age adults and school-age children, may also provide opportunities for cost-effective poverty reduction investments. Unfortunately, there is little information on the cost-effectiveness of injury prevention interventions in developing countries. However, in the case of road injuries (which are a rapidly increasing cause of injuries in most developing countries), many of the injuries involve public transportation. More effective regulation of public transportation (for example, stricter licensing requirements for drivers and safety checks of vehicles) is likely to be a cost-effective approach to reducing injuries. Other

Deliverable 18: Health Issues
13
possibly cost-effective approaches to reducing road accidents include regulations requiring the use of helmets by motorcycle and bicycle riders and stricter measures designed to reduce the consumption of alcohol and drugs by persons operating motor vehicles. Recommendation #2: Give higher priority to health investments that prevent poverty directly. Investments that reduce the prevalence of long-term disabilities among working-age adults—that is, investments that reduce a household’s effective dependency burden—can directly contribute to poverty reduction. In addition to cost-effective investments to improve mental health and reduce injuries, such investments might include those designed to prevent and/or treat blindness and other visual impairments (such as cataracts), adult hearing loss, and osteoarthritis. The knowledge base in this area is currently weak, and its expansion should be another research priority. Investments that reduce a poor or near-poor household’s vulnerability to the risk of catastrophic health care costs can also reduce poverty. The easiest way to do this in the short run may be by increasing the share of public funding allocated to public hospitals. This recommendation contrasts with the conventional public health prescription that the hospital sector should be starved while the bulk of public funding is allocated to primary (and particularly preventive) health care. Another practical way to reduce vulnerability to the risk of catastrophic health care costs (and to improve access to needed care) is to expand opportunities for rural saving and access to affordable rural credit (such as through rural microcredit and savings schemes). Another approach that has been successfully piloted in Cambodia is the use of publicly financed equity funds to pay for the hospital costs of the poor (van Damme and Meesen, 2001; De Loof and Bonnet, 2001; Knowles, 2001). Community health insurance (as well as other community health financing schemes) is another approach that has been used in many countries (with varying success) to reduce vulnerability to the risk of catastrophic health care costs (Preker et al., 2001). Recommendation #3: Make efficient investments that are complementary to health investments made by poor and near poor households. Complementary investments include investments in education, food security, rural infrastructure (particularly roads and water and sanitation), access to improved housing, and improved environmental conditions. Absence of these complementary investments increases the cost of health investments to the poor. Economic evaluation of the benefits and costs of these investments should include health benefits, although in most cases the health benefits alone will be insufficient to justify the investment. Many of these complementary investments already figure prominently in developing country poverty reduction strategies (for example, formal education, rural roads, and water and sanitation). However, in education, more attention should probably be given to adult basic education and literacy training because (1) their effects are immediate, and (2) they are self-targeted to the poor. In the environmental area, more attention ought to be given to policies that promote efficient alternatives to the indoor use of biomass- and coal-burning stoves (von Schirnding et al., 2001).
Development Alternatives, Inc.–Boston Institute for Developing Economies
14
Recommendation #4: Make efficient investments that remove or reduce barriers to health investments made by poor and near poor households. Investments that are likely to help in removing or reducing barriers to effective health investments by the poor and near poor include: ▪ Better health education for the poor and near poor (such as through adult basic education
and literacy programs); ▪ More effective regulation of private health care (for example, control of unlicensed drug
vendors, regulation of the sale of potentially harmful prescription drugs without a prescription, and reducing the prescription and/or direct sale of unnecessary and/or excessively expensive drugs by private providers);
▪ Adoption of transparent fee and exemption policies in public health facilities (for
example, use of a simple fee schedule that is prominently displayed in a hospital, adequate funding of exemptions, and use of formal targeting mechanisms for exemptions);
▪ Targeted demand-side subsidies (such as vouchers and subsidized health insurance) to
improve access by the poor to key health services (see Recommendation #1); ▪ Targeted subsidies for health care-related transportation costs, including reimbursement
of costs from home village to primary care facilities and subsidized ambulance (or public transportation) costs from primary care facilities to referral providers;
▪ Use of pro-poor formulas for the geographic allocation of public health resources; and ▪ Contracting out the operation (or the management) of public health facilities to NGOs or
commercial providers. Unfortunately, there is relatively little evidence (or the evidence is limited to one or only a few countries) establishing the effectiveness of policies, such as those listed above, that are designed to improve access and utilization of health services by the poor and near poor (Wagstaff, 2001). This suggests that initiatives such as those listed above should be implemented on a national level only after careful evaluation has established their effectiveness.
Deliverable 18: Health Issues
15
REFERENCES Abel-Smith, B. and P. Rawall. 1992. “Can the poor afford ‘free’ health services? A case study of Tanzania.” Health Policy and Planning 7(4): 329-341. Barro, Robert. 2000. “Inequality and Growth in a Panel of Countries.” Journal of Economic Growth 5:5-32. Barro, Robert and X. Sala-I-Martin. 1995. Economic Growth. New York: McGraw-Hill. Basta, Samir, Ms. Soekirman, D. Karyadi, and N. Scrimshaw. 1979. “Iron Deficiency Anemia and Productivity of Adult Males in Indonesia.” American Journal of Clinical Nutrition 32(4): 916-25. Behrman, Jere R. 1996. “The Impact of Health and Nutrition on Education.” World Bank Research Observer 11(1):23-37. Behrman, Jere R. and Mark R. Rosenzweig. 2002. “The Returns to Increasing Body Weight.” Mimeo. Philadelphia: University of Pennsylvania,. Belli, Paolo and Olivier Appaix. 2002. “Exploring the economic benefits of investing in child health.” Draft report (September). Washington, D.C.: The World Bank. Bhargava, A., D. Jamison, and C. Murray. 2001. “Modeling the Effects of Health on Economic Growth.” Journal of Health Economics 20:423-440. Bir, Anupa and Richard G. Frank. 2001. “Mental Illness and the Labor Market in Developing Nations.” CMH Working Paper Series (Working Paper No. WG1:6). Geneva: World Health Organization. Birdsall, Nancy, Allen Kelley, and Steven Sinding, eds. 2001. Population Matters: Demographic Change, Economic Growth, and Poverty in the Developing World. New York: Oxford University Press. Bloom, David and Jeffrey Sachs. 1998. “Geography, Demography, and Economic Growth in Africa.” Brookings Papers on Economic Activity 2:207-295. Bloom, David. E., D. Canning, and B. Graham. 2001. “Health, Longevity and Life-Cycle Savings.” Commission on Macroeconomics and Health Working Paper Series (WG1:9). Geneva: WHO. Castro-Leal, F., J. Dayton, L. Demry, and K. Mehra. 2000. “Public spending on health care in Africa: do the poor benefit?” Bulletin of the World Health Organization 78(1):66-74. Commission on Macroeconomics and Health. 2001. Macroeconomics and Health: Investing in Health for Economic Development. Geneva: World Health Organization.

Development Alternatives, Inc.–Boston Institute for Developing Economies
16
Deaton, Angus. 2001. “Counting the World’s Poor: Problems and Possible Solutions.” The World Bank Research Observer 16(2):125-47. De Loof, F., F. Bonnet et al. 2001. “Takeo referral hospital 1997-2000: pioneering a hospital financing scheme in the Kingdom of Cambodia.” Phnom Penh, Swiss Red Cross. Delcheva, E., D. Balabanova, and M. McKee. 1997. “Under the counter payments for health care: Evidence from Bulgaria.” Health Policy 42:89-100. Dickson, Rumona, S. Awasthi, P. Williamson, C. Demellweek, and P. Garner. 2000. “Effect of treatment for intestinal helminth infection on growth and cognitive performance in children: systematic review of randomized trials.” British Medical Journal 320 (June 24):1697-1701. Diop, Francois, Abdo Yazbeck, and Ricardo Bitran. 1995. “The impact of alternative cost recovery schemes on access and equity in Niger.” Health Policy and Planning 10(3):223-240. Dow, William, P. Gertler, R. Schoeni, J. Strauss, and D. Thomas. 1997. “Health Care Prices, Health and Labor Outcomes: Experimental Evidence.” Labor and Population Program Working Paper Series 97-01, RAND, Santa Monica, California (January). Eastwood, Robert and Michael Lipton. 1999. “The Impact of Human Fertility on Poverty.” Journal of Development Studies 31(1):1-30. Eastwood, Robert and Michael Lipton. 2000. “Pro-poor Growth and Pro-growth Poverty Reduction: Meaning, Evidence, and Policy Implications.” Asian Development Review, 18(2):22-58. Ensor, T. and L. Savelyeva. 1998. “Informal payments for health care in the former Soviet Union: Some evidence from Kazakhstan.” Health Policy and Planning 13(1):41-49. Fenwick, A. and B.M. Figenschou. 1972. “The Effect of Schistosoma Mansoni on the Productivity of Cane Cutters on a Sugar Estate in Tanzania.” Bulletin of the World Health Organization 47(5):567-72. Filmer, Deon, Jeffrey S. Hammer, and Lant H. Pritchett. 2000. “Weak Links in the Chain: A Diagnosis of Health Policy in Poor Countries.” The World Bank Research Observer 15(2):199-224. FOCUS on Young Adults. 2001. “Advancing Young Adult Reproductive Health: Actions for the Next Decade End of Program Report to USAID.” Pathfinder International, Washington, D.C.

Deliverable 18: Health Issues
17
Gallup, John Luke and Jeffrey D. Sachs. 2001. “The Economic Burden of Malaria.” Commission on Macroeconomics and Health Working Paper Series (WG1:10), Geneva: WHO. Gilson, L., S. Russell, and K. Buse. 1995. “The political economy of user fees with targeting: Developing equitable health financing policy.” Journal of International Development 7(3):369-401. Glewwe, Paul. 1999. “Why does mother’s schooling raise child’s health in developing countries?” Journal of Human Resources 34(1):124-59. Glewwe, Paul. 2002. “Schools and Skills in Developing Countries: Education Policies and Socioeconomic Outcomes.” Journal of Economic Literature 40(2):436-82. Goudge, Jane, Nondumiso Khumalo, and Lucy Gilson. 2002. “Policy options to improve access to health care.” Mimeo. Center for Health Policy, School of Public Health, University of Witwatersrand, South Africa (November). Gwatkin, Davidson R. 2000. “The Current State of Knowledge about Targeting Health Programs to Reach the Poor.” Mimeo. Washington, D.C.: The World Bank (February). Gwatkin, Davidson R. and Michel Guillot. 2000. “The Burden of Disease among the Global Poor.” Human Development Network. Washington, D.C.: The World Bank. Institute of Medicine. 2001. Neurological, Psychiatric, and Developmental Disorders: Meeting the Challenges in the Developing World. Washington, D.C.: National Academy of Sciences. Keller, Sheryl and J. Brad Schwartz. 2001. “Final Evaluation Report: Contracting for Health Services Pilot Project (CHSPP): A Component of the Basic Health Services Project.” ADB Loan No. 1447–CAM, Phnom Penh (November). Killingsworth, J. et al. 1999. “Unofficial fees in Bangladesh: Price, equity, and institutional issues.” Health Policy and Planning 14(2):152-163. Knowles, James C. 1995. “Price Uncertainty and the Demand for Health Care in Developing Countries.” Health Policy and Planning 10(3). Knowles, James C. 2001. “An Economic Evaluation of the Health Services for the Urban Poor Component.” Report to Options (UK), London (September). Knowles, James C. and Jere R. Behrman. 2003a. “The Economic Returns to Investing in Youth in Developing Countries: A Review of the Literature.” Mimeo. Bangkok/Philadelphia, Pennsylvania: University of Pennsylvania, for World Bank Human Development Network.

Development Alternatives, Inc.–Boston Institute for Developing Economies
18
Knowles, James C. and Jere R. Behrman. 2003b. “Assessing the Economic Returns to Investing in Youth in Developing Countries.” Mimeo. Bangkok/Philadelphia, Pennsylvania: University of Pennsylvania, for World Bank Human Development Network. Litvack, J. and C. Bodard. 1993. “User fees plus quality equal improved access to health care: results of a field experiment in Cameroon.” Social Science and Medicine 37:367-383. Mathers, C., C. Stein, D. Ma Fat, C. Rao, M. Inoue, N. Tomijima, C. Bernard, A. Lopez, and C. Murray. 2002. “Global Burden of Disease 2000: Version 2 methods and results.” Global Programme on Evidence for Health Policy Discussion Paper No. 50, Geneva: World Health Organization. Merrick, Thomas W. 2002. “Population and Poverty: New Views on an Old Controversy.” International Family Planning Perspectives 28(1):41-46. Miguel, Edward and Michael Kremer. 2001. “Worms: Education and Health Externalities in Kenya.” Harvard University and University of California-Berkeley, NBER Working Paper #8481. Mills, Anne, R. Brugha, K. Hanson, and B. McPake. 2002. “What can be done about the private health sector in low-income countries?” Bulletin of the World Health Organization 80(4):325-30. Murray, C.J.L. and A.D. Lopez, eds. 1996. The Global Burden of Disease: A Comprehensive Assessment of Mortality and Disability from Diseases, Injuries and Risk Factors in 1990 and Projected to 2020. Cambridge, Massachusetts: Harvard University Press (Global Burden of Disease and Injury Series, Executive Summary and Vol. 1). Nokes, C., C. van den Bosch, and D.A.P. Bundy. 1998. “The Effects of Iron Deficiency Anemia on Mental and Motor Performance, Educational Achievement, and Behavior in Children: A Report of the International Nutritional Anemia Consultative Group.” Washington, D.C.: USAID. Osmani, Siddiqur Rahman. 2000. “Growth Strategies and Poverty Reduction.” Asian Development Review 18(2):85-130. Oxfam. 2000. “Health and Landlessness.” Draft (15 October). Oxfam GB Cambodia Land Study Project. Phnom Pehn: OXFAM GB. Pollitt, Ernesto. 1997. “Iron Deficiency and Educational Deficiency.” Nutritional Review 55(4): 133-40. Preker, A., G. Carrin, D. Dror, M. Jakab, W. Hsiao, and D. Arhin-Tenkorang. 2001. “A Synthesis Report on the Role of Communities in Resource Mobilization and Risk Sharing.” CMH Working Paper Series (Paper No. WG3:4), Geneva: World Health Organization.
Deliverable 18: Health Issues
19
Shah, A. and R. Jenkins. 2000. “Mental health economic studies from developing countries reviewed in the context of those from developed countries.” Acta Psychiatrica Scandinavica 101(2):87-103. Strauss J. and D. Thomas. 1998. “Health, nutrition and economic development.” Journal of Economic Literature, 36:766-817. Thomas, Duncan. 2001. “Health, Nutrition, and Economic Prosperity: A Microeconomic Perspective.” CMH Working Paper Series (Paper No. WG1:7), Geneva: WHO. Thomas, Duncan and John Strauss. 1997. “Health and Wages: Evidence on Men and Women in Urban Brazil.” Journal of Econometrics 77(1):159-86. Van Damme, W. and B. Meessen. 2001. “Sotnikum New Deal, the first year.” Phnom Penh, MSF Holland/Belgium. Vaz, L. and P. Jha. 2001. “Note on the Health Impact of Water and Sanitation Services.” CMH Working Paper Series (Paper No. WG5:23). Von Schirnding, N. Bruce, K. Smith, G. Ballard-Tremeer, M. Ezzati, and K. Lvovsky. 2001. “Addressing the Impact of Household Energy and Indoor Air Pollution on the Health of the Poor—Implications for Policy Action and Intervention Measures.” CMH Working Paper Series (Paper No. WG5:12), Geneva: World Health Organization. Wagstaff, Adam. 2001. “Poverty and Health.” CMH Working Paper Series, Paper No. WG1:5, Washington, D.C.: The World Bank. Wagstaff, Adam. 2002. Inequalities in Health in Developing Countries: Swimming Against the Tide? Washington, D.C.: The World Bank. Whiteford, Harvey, M. Teeson, R. Scheurer, and D. Jamison. 2001. “Responding to the Burden of Mental Illness.” CMH Working Paper Series (Paper No. WG1:12), Geneva: World Health Organization. Wilkinson, D., J. Holloway et al. 2001. “The impact of user fees on access, equity and health provider practices in Cambodia.” Phnom Penh, Health Economics Task Force, MoH/WHO Health Sector Reform Phase III Project. Wolgemuth, June, M. Latham, A. Hall, A. Chesher, and D. Crompton. 1982. “Worker Productivity and the Nutritional Status of Kenyan Road Construction Laborers.” American Journal of Clinical Nutrition 36(7):68-78. World Bank. 2002. “Review of World Bank supported projects in adult basic education and literacy, 1997-2002.” Washington, D.C.: The World Bank.
Development Alternatives, Inc.–Boston Institute for Developing Economies
20
World Health Organization (WHO). 2001. “World Health Report 2001: Mental Health: New Understandings, New Hopes.” Geneva. World Health Organization (WHO). 2002. “World Health Report 2002: Reducing risks, promoting healthy life.” Geneva. Yaqub, S. 1999. “How equitable is public spending on health and education? Background paper for WDR 2000/1.” Washington, D.C.: The World Bank.
Deliverable 18: Health Issues
A-1
ANNEX A
ESTIMATES OF THE GLOBAL BURDEN OF DISEASE IN 2001

Development Alternatives, Inc.–Boston Institute for Developing Economies
A-2
ESTIMATES OF THE GLOBAL BURDEN OF DISEASE IN 2001 Recently updated estimates of the Global Burden of Disease in 2001 (WHO, 2002) indicate that the 10 leading causes of years lived with disabilities (YLDs) worldwide include several types of mental illness (unipolar depressive disorders, bipolar disorders, alcohol use disorders, and schizophrenia), adult hearing loss, other unintentional injuries, other digestive diseases, osteoarthritis, (all) maternal health disorders, and (all) perinatal disorders. This list of leading causes of disability differs markedly from the leading causes of mortality worldwide. However, there are important differences in the leading causes of disability by age, gender, region, and income. Age differences are particularly important in the context of labor supply and productivity effects, which are mainly confined to the age group 15-59. For this age group, there are some differences in the leading causes of disability as compared with those for all ages listed above. Apart from several changes in rankings among the 10 leading causes, chronic obstructive pulmonary disease is added to the list for the age group 15-59, whereas (all) perinatal conditions is dropped from the list. There are also some important differences by gender. Restricting attention to the 15-59 year age group, Group I disorders (which include communicable diseases and pregnancy-related health disorders) account for 21.3 percent of YLDs among women, compared with only 11.7 percent of YLDs among men. There is relatively little difference in the importance of Group II disorders (noncommunicable diseases) between men and women (74 and 72 percent, respectively). However, Group III disorders (injuries) are more important causes of disability among men (14.3 percent of YLDs, versus 6.7 percent among women). The rankings of leading causes of disability discussed above refer to the entire world. Unfortunately, the most recent estimates are not presented separately for developed and developing countries. From previous work, however, it is known that the relative importance of Group I (communicable and maternal) disorders is much greater among poorer groups (Gwatkin and Guillot, 2000). Such differences are reflected in the rankings for the Africa and South/East Asia WHO regions (two regions consisting mainly of low- and middle-income developing countries and that together contain most of the world’s poor) that are presented in the table below.
Deliverable 18: Health Issues
A-3
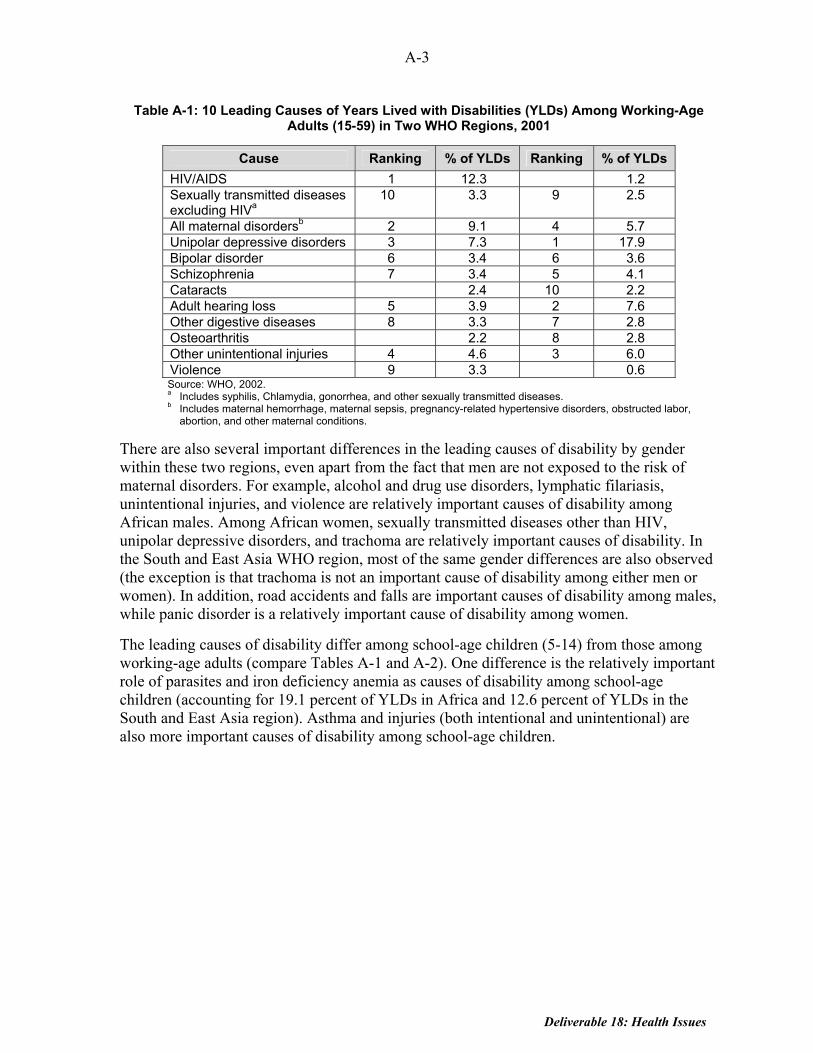
Table A-1: 10 Leading Causes of Years Lived with Disabilities (YLDs) Among Working-Age Adults (15-59) in Two WHO Regions, 2001
Cause Ranking % of YLDs Ranking % of YLDs HIV/AIDS 1 12.3 1.2 Sexually transmitted diseases excluding HIVa
10 3.3 9 2.5
All maternal disordersb 2 9.1 4 5.7 Unipolar depressive disorders 3 7.3 1 17.9 Bipolar disorder 6 3.4 6 3.6 Schizophrenia 7 3.4 5 4.1 Cataracts 2.4 10 2.2 Adult hearing loss 5 3.9 2 7.6 Other digestive diseases 8 3.3 7 2.8 Osteoarthritis 2.2 8 2.8 Other unintentional injuries 4 4.6 3 6.0 Violence 9 3.3 0.6 Source: WHO, 2002. a Includes syphilis, Chlamydia, gonorrhea, and other sexually transmitted diseases. b Includes maternal hemorrhage, maternal sepsis, pregnancy-related hypertensive disorders, obstructed labor,
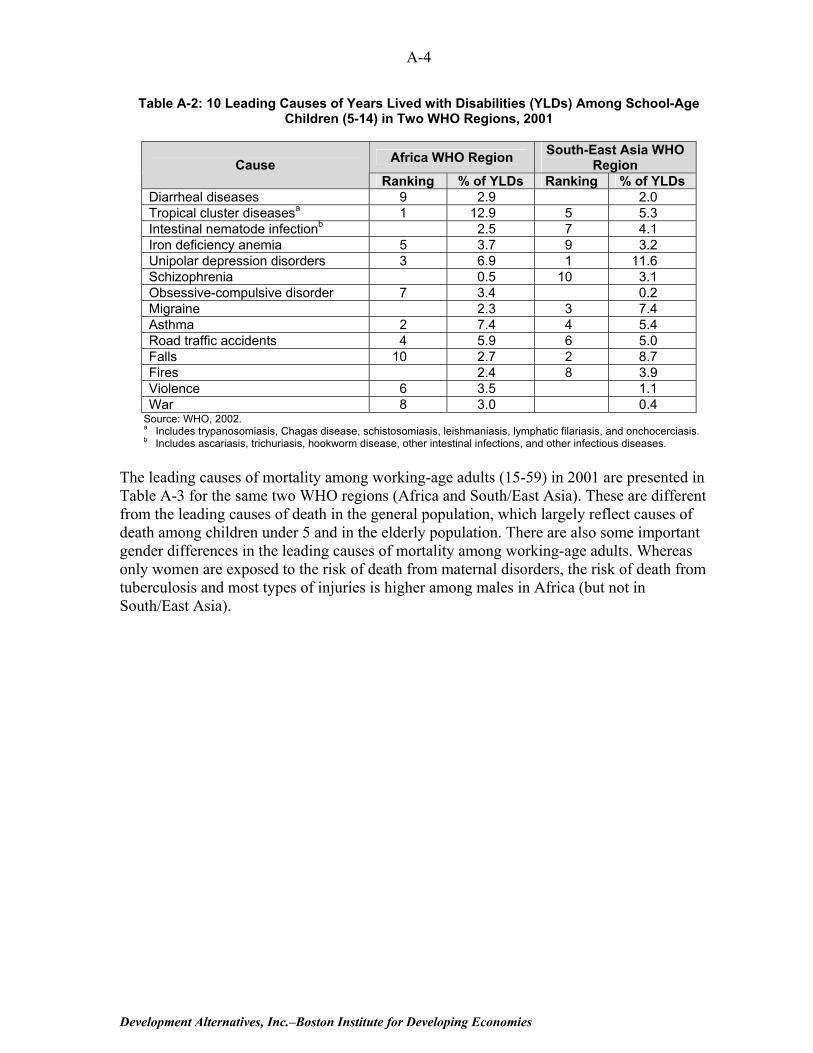
abortion, and other maternal conditions. There are also several important differences in the leading causes of disability by gender within these two regions, even apart from the fact that men are not exposed to the risk of maternal disorders. For example, alcohol and drug use disorders, lymphatic filariasis, unintentional injuries, and violence are relatively important causes of disability among African males. Among African women, sexually transmitted diseases other than HIV, unipolar depressive disorders, and trachoma are relatively important causes of disability. In the South and East Asia WHO region, most of the same gender differences are also observed (the exception is that trachoma is not an important cause of disability among either men or women). In addition, road accidents and falls are important causes of disability among males, while panic disorder is a relatively important cause of disability among women. The leading causes of disability differ among school-age children (5-14) from those among working-age adults (compare Tables A-1 and A-2). One difference is the relatively important role of parasites and iron deficiency anemia as causes of disability among school-age children (accounting for 19.1 percent of YLDs in Africa and 12.6 percent of YLDs in the South and East Asia region). Asthma and injuries (both intentional and unintentional) are also more important causes of disability among school-age children.
Development Alternatives, Inc.–Boston Institute for Developing Economies
A-4
Table A-2: 10 Leading Causes of Years Lived with Disabilities (YLDs) Among School-Age Children (5-14) in Two WHO Regions, 2001
Africa WHO Region South-East Asia WHO
Region Cause Ranking % of YLDs Ranking % of YLDs
Diarrheal diseases 9 2.9 2.0 Tropical cluster diseasesa 1 12.9 5 5.3 Intestinal nematode infectionb 2.5 7 4.1 Iron deficiency anemia 5 3.7 9 3.2 Unipolar depression disorders 3 6.9 1 11.6 Schizophrenia 0.5 10 3.1 Obsessive-compulsive disorder 7 3.4 0.2 Migraine 2.3 3 7.4 Asthma 2 7.4 4 5.4 Road traffic accidents 4 5.9 6 5.0 Falls 10 2.7 2 8.7 Fires 2.4 8 3.9 Violence 6 3.5 1.1 War 8 3.0 0.4
Source: WHO, 2002. a Includes trypanosomiasis, Chagas disease, schistosomiasis, leishmaniasis, lymphatic filariasis, and onchocerciasis. b Includes ascariasis, trichuriasis, hookworm disease, other intestinal infections, and other infectious diseases.
The leading causes of mortality among working-age adults (15-59) in 2001 are presented in Table A-3 for the same two WHO regions (Africa and South/East Asia). These are different from the leading causes of death in the general population, which largely reflect causes of death among children under 5 and in the elderly population. There are also some important gender differences in the leading causes of mortality among working-age adults. Whereas only women are exposed to the risk of death from maternal disorders, the risk of death from tuberculosis and most types of injuries is higher among males in Africa (but not in South/East Asia).
Deliverable 18: Health Issues
A-5
Table A-3: 10 Leading Causes of Mortality Among Working-Age Adults (15-59) in Two WHO Regions, 2001
Africa WHO Region South-East Asia WHO Region Cause
Ranking % of Deaths Ranking % of Deaths Tuberculosis 2 6.1 1 10.8 HIV/AIDS 1 46.2 3 9.0 Diarrheal diseases 8 2.2 10 3.2 Other infectious diseases 5 2.9 2.4 Lower respiratory infections 4 3.9 1.4 All maternal disordersa 3 6.0 9 3.3 Ischaemic heart disease 9 2.1 2 10.8 Cerebrovascular disease 2.0 6 3.8 Chronic obstructive pulmonary disease 0.5 7 3.8 Road traffic accidents 6 2.9 4 5.4 Other unintentional injuries 1.2 8 3.6 Violence 10 2.1 1.2 Self-inflicted injuries 0.5 5 4.4 War 7 2.7 0.4 Source: WHO, 2002. a Includes maternal hemorrhage, maternal sepsis, pregnancy-related hypertensive disorders, obstructed labor, abortion, and
other maternal conditions.

HIV/AIDS’ Impact on Pro-Poor Economic Growth
by
Joan C. Parker
Deliverable 18: HIV/AIDS’ Impact on Pro-Poor Economic Growth
i
TABLE OF CONTENTS HIV/AIDS: A BRIEF INTRODUCTION TO THE EPIDEMIC........................................................1
Scale and Spread of HIV/AIDS ...............................................................................1 Is HIV/AIDS a Unique Health Crisis?.....................................................................2
POVERTY-INCREASING IMPACTS OF HIV/AIDS....................................................................3
Challenges of Capturing the Impact of AIDS on Poverty .......................................3 Process of Impoverishment......................................................................................4
GROWTH-REDUCING IMPACTS OF HIV/AIDS.......................................................................5 SECTORAL IMPACTS OF HIV/AIDS.......................................................................................8
Agriculture ...............................................................................................................8 Education .................................................................................................................9 Health.....................................................................................................................10 Private Formal Sector ............................................................................................10
RECOMMENDATIONS IN THE FACE OF HIV/AIDS ...............................................................11
Policy-level Opportunities .....................................................................................12 Project-level Opportunities ...................................................................................12
CONCLUSION ......................................................................................................................13 ANNEX A: ILLUSTRATIVE EMPIRICAL EVIDENCE OF ECONOMIC IMPACT OF HIV/AIDS ON HOUSEHOLDS A-1 ANNEX B: BIBLIOGRAPHY B-1

ii
Deliverable 18: HIV/AIDS’ Impact on Pro-Poor Economic Growth
1
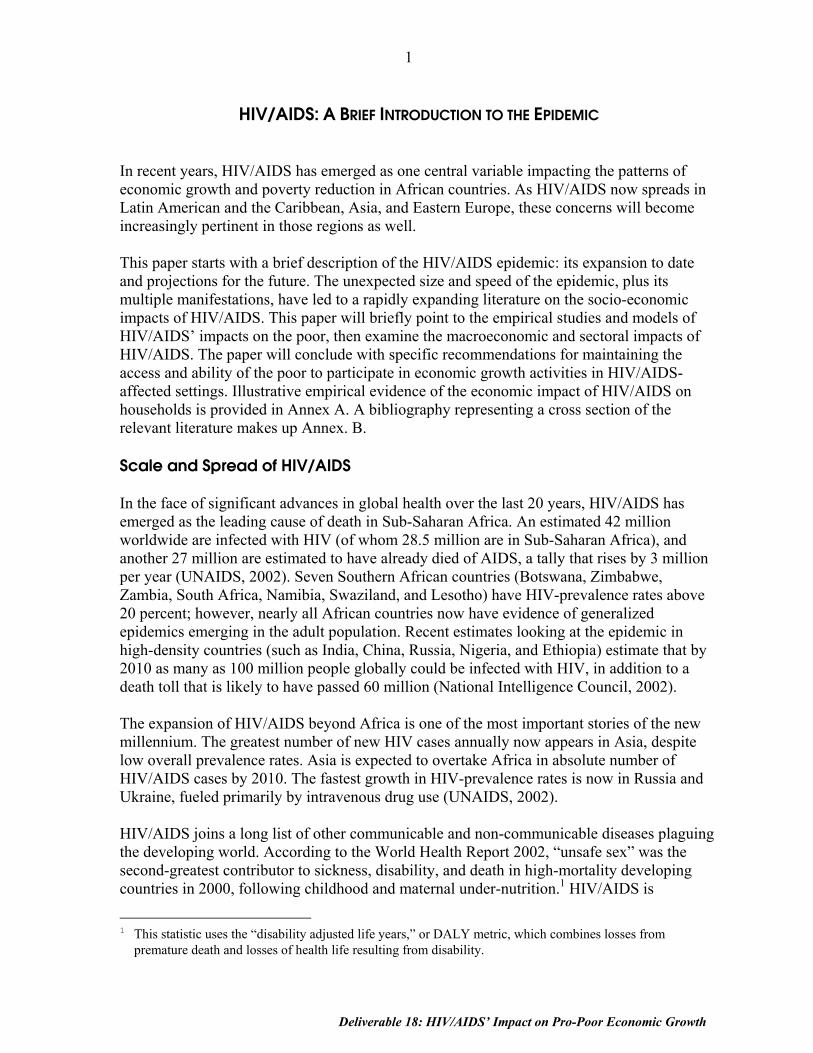
HIV/AIDS: A BRIEF INTRODUCTION TO THE EPIDEMIC In recent years, HIV/AIDS has emerged as one central variable impacting the patterns of economic growth and poverty reduction in African countries. As HIV/AIDS now spreads in Latin American and the Caribbean, Asia, and Eastern Europe, these concerns will become increasingly pertinent in those regions as well. This paper starts with a brief description of the HIV/AIDS epidemic: its expansion to date and projections for the future. The unexpected size and speed of the epidemic, plus its multiple manifestations, have led to a rapidly expanding literature on the socio-economic impacts of HIV/AIDS. This paper will briefly point to the empirical studies and models of HIV/AIDS’ impacts on the poor, then examine the macroeconomic and sectoral impacts of HIV/AIDS. The paper will conclude with specific recommendations for maintaining the access and ability of the poor to participate in economic growth activities in HIV/AIDS-affected settings. Illustrative empirical evidence of the economic impact of HIV/AIDS on households is provided in Annex A. A bibliography representing a cross section of the relevant literature makes up Annex. B. Scale and Spread of HIV/AIDS In the face of significant advances in global health over the last 20 years, HIV/AIDS has emerged as the leading cause of death in Sub-Saharan Africa. An estimated 42 million worldwide are infected with HIV (of whom 28.5 million are in Sub-Saharan Africa), and another 27 million are estimated to have already died of AIDS, a tally that rises by 3 million per year (UNAIDS, 2002). Seven Southern African countries (Botswana, Zimbabwe, Zambia, South Africa, Namibia, Swaziland, and Lesotho) have HIV-prevalence rates above 20 percent; however, nearly all African countries now have evidence of generalized epidemics emerging in the adult population. Recent estimates looking at the epidemic in high-density countries (such as India, China, Russia, Nigeria, and Ethiopia) estimate that by 2010 as many as 100 million people globally could be infected with HIV, in addition to a death toll that is likely to have passed 60 million (National Intelligence Council, 2002). The expansion of HIV/AIDS beyond Africa is one of the most important stories of the new millennium. The greatest number of new HIV cases annually now appears in Asia, despite low overall prevalence rates. Asia is expected to overtake Africa in absolute number of HIV/AIDS cases by 2010. The fastest growth in HIV-prevalence rates is now in Russia and Ukraine, fueled primarily by intravenous drug use (UNAIDS, 2002). HIV/AIDS joins a long list of other communicable and non-communicable diseases plaguing the developing world. According to the World Health Report 2002, “unsafe sex” was the second-greatest contributor to sickness, disability, and death in high-mortality developing countries in 2000, following childhood and maternal under-nutrition.1 HIV/AIDS is
1 This statistic uses the “disability adjusted life years,” or DALY metric, which combines losses from
premature death and losses of health life resulting from disability.
2
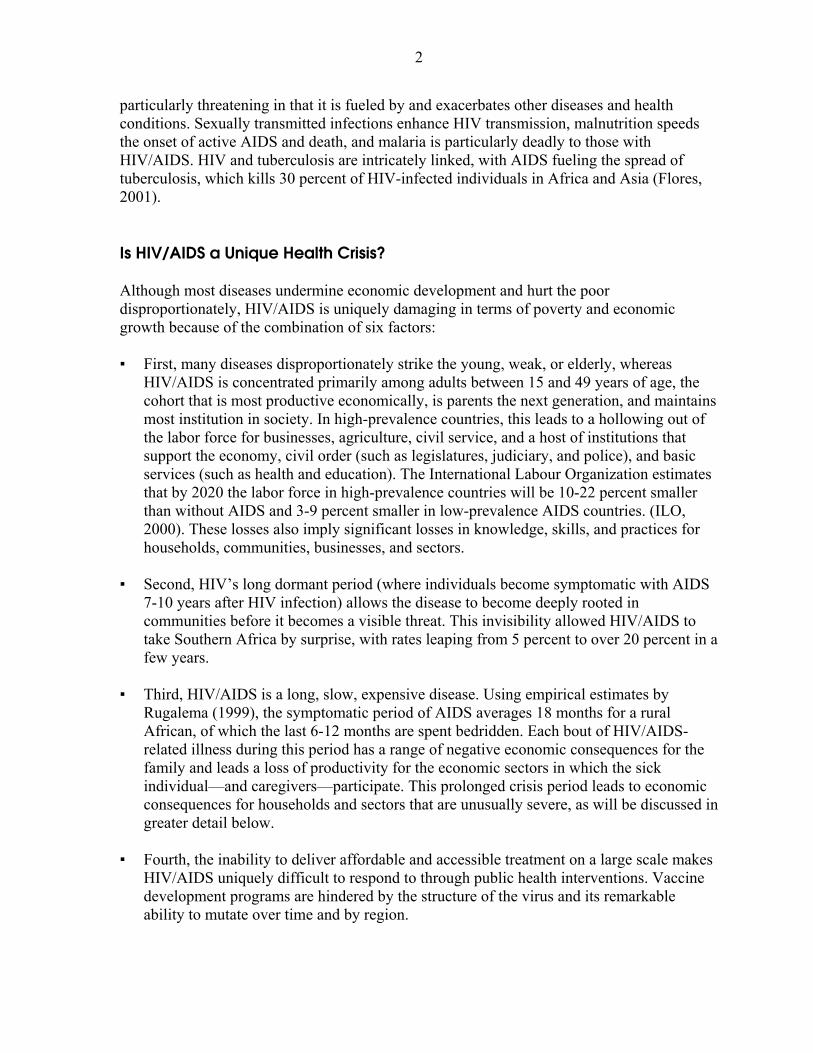
particularly threatening in that it is fueled by and exacerbates other diseases and health conditions. Sexually transmitted infections enhance HIV transmission, malnutrition speeds the onset of active AIDS and death, and malaria is particularly deadly to those with HIV/AIDS. HIV and tuberculosis are intricately linked, with AIDS fueling the spread of tuberculosis, which kills 30 percent of HIV-infected individuals in Africa and Asia (Flores, 2001). Is HIV/AIDS a Unique Health Crisis? Although most diseases undermine economic development and hurt the poor disproportionately, HIV/AIDS is uniquely damaging in terms of poverty and economic growth because of the combination of six factors: ▪ First, many diseases disproportionately strike the young, weak, or elderly, whereas
HIV/AIDS is concentrated primarily among adults between 15 and 49 years of age, the cohort that is most productive economically, is parents the next generation, and maintains most institution in society. In high-prevalence countries, this leads to a hollowing out of the labor force for businesses, agriculture, civil service, and a host of institutions that support the economy, civil order (such as legislatures, judiciary, and police), and basic services (such as health and education). The International Labour Organization estimates that by 2020 the labor force in high-prevalence countries will be 10-22 percent smaller than without AIDS and 3-9 percent smaller in low-prevalence AIDS countries. (ILO, 2000). These losses also imply significant losses in knowledge, skills, and practices for households, communities, businesses, and sectors.
▪ Second, HIV’s long dormant period (where individuals become symptomatic with AIDS
7-10 years after HIV infection) allows the disease to become deeply rooted in communities before it becomes a visible threat. This invisibility allowed HIV/AIDS to take Southern Africa by surprise, with rates leaping from 5 percent to over 20 percent in a few years.
▪ Third, HIV/AIDS is a long, slow, expensive disease. Using empirical estimates by
Rugalema (1999), the symptomatic period of AIDS averages 18 months for a rural African, of which the last 6-12 months are spent bedridden. Each bout of HIV/AIDS-related illness during this period has a range of negative economic consequences for the family and leads a loss of productivity for the economic sectors in which the sick individual—and caregivers—participate. This prolonged crisis period leads to economic consequences for households and sectors that are unusually severe, as will be discussed in greater detail below.
▪ Fourth, the inability to deliver affordable and accessible treatment on a large scale makes
HIV/AIDS uniquely difficult to respond to through public health interventions. Vaccine development programs are hindered by the structure of the virus and its remarkable ability to mutate over time and by region.

Deliverable 18: HIV/AIDS’ Impact on Pro-Poor Economic Growth
3
▪ Fifth, no other disease has created a generation of orphans, with yet-unknown social, economic, political, and cultural consequences. Currently, 13 million children in Sub-Saharan Africa under the age of 15 have lost a parent to AIDS. This number is projected to rise to over 25 million by 2010 (TvT Associates, 2002).
▪ Sixth, HIV/AIDS interacts in a particularly pernicious way with a scourge of many
African countries—drought and famine. These conditions make it harder for everyone, but especially the poor, to survive economically and physically because people become weak for lack of food and to produce enough to survive now involves more work, when it is possible at all. An HIV/AIDS-afflicted community is already weakened and thus vulnerable to less-severe drought conditions than would normally have been the case. This synergy has been cited in the context of the current (mid-2003) severe food shortage afflicting 15 million people in Lesotho, Zimbabwe, Malawi, and Zambia.
Thus, it appears that HIV is positioned to continue to expand over time, extract productive capacity, and exact a wide range of social and economic costs for this and future generations.
POVERTY-INCREASING IMPACTS OF HIV/AIDS HIV/AIDS did not begin as a disease of poverty. In the mid 1990s, HIV/AIDS was still described as the disease of “men, money, and mobility.” However, as AIDS has progressed and spread into the general population, it has increasingly taken root in poorer populations, particularly those who migrate in search of work, resort to transactional sex as an economic survival strategy, engage in illicit drug use, or are sexual partners of any of these people. In high-prevalence countries today, HIV/AIDS has no economic boundaries and affects rich and poor alike. However, as will be described below, its impacts are likely to be much more damaging for the poor and the near-poor, pushing them into, or more deeply into, poverty. Challenges of Capturing the Impact of AIDS on Poverty In trying to draw a picture of the poverty-related impacts of HIV/AIDS, one discovers many bits of information drawn primarily from small sample surveys, alongside predictive models based on a range of assumptions and methodologies. Each of these surveys and models provides an estimate of the nature and size of the poverty-related impacts of HIV/AIDS. In sum, however, this work leaves unresolved the true magnitude or causality of these relationships. However, from this body of work, a story emerges that is consistent with the available information and observation. This story is presented below, illustrated only sparingly by the available flood of data. Annex A provides additional empirical details from specific studies.
4
Process of Impoverishment What is the process by which families become impoverished by HIV/AIDS? The most immediate impact on a family is the loss of labor, both of the person who falls ill and eventually dies and of the person who provides care during the period of sickness. This loss of labor steadily increases for the sick individual, until his or her labor (and skills and experience) is completely lost to the household. Decreases in caregiver labor can also be significant: surveys estimate that caregivers, most of whom are women, lose 30-60 percent of time spent on productive activities when caring for someone bedridden with AIDS. Of course, loss of labor implies loss of income for the household. Agricultural households see declines of 50 percent in household income as a result of an HIV/AIDS illness or death. At the same time income falls, household medical expenses and ultimately funeral expenses go up dramatically. A UNAIDS model based on data from Côte d’Ivoire (UNAIDS, 2000) estimated a 60 percent reduction of household income coupled with a 400 percent increase in medical expenditures during the period of illness, leading to significant dissavings or to use of household assets. Families respond to this long period of illness and loss of income through a range of coping strategies. Drawing down savings is the most obvious coping strategy. Other common strategies are pledges of future crops or labor, borrowing, removing children from school, and sale of household or productive assets. As described by Donahue (2001), coping strategies range from reversible (such as use of savings, which can be replaced; reduced food consumption; or pledging of labor in return for cash) to those that permanently increase the family’s poverty level (such as sale of land or draught animals, or truncation of children’s education). The poorest households are most likely to resort to non-reversible coping strategies simply because of a lack of other means to cope with the length and severity of the crisis, which means that the burden of AIDS is likely to fall most heavily on the poorest households. Unfortunately, HIV/AIDS typically affects multiple individuals in the same household. For example, if a male head of household has HIV/AIDS, his spouse is likely to be HIV positive as well. Households with sufficient pre-AIDS resources may still be able to manage the second illness without becoming impoverished. However, for poor households already reduced in capacity from the first HIV/AIDS event, a second cycle such as that described above can lead to even more extreme coping strategies and ultimate impoverishment. Women, children, and elderly caregivers are the hardest hit by this cycle and must manage both caregiving and income-earning roles in a context of fewer physical assets and savings and lower social capital in the community. Many surviving children are further disadvantaged by being permanently removed from school in response to their parents’ illness or death, thus reducing the ability of the next generation to climb out of poverty. Needless to say, not only are these trends impoverishing families affected by HIV/AIDS but the reductions in household labor, assets, skills, and vision for the future all bode ill for the ability of these families to participate in the activities linking the poor to economic growth.
Deliverable 18: HIV/AIDS’ Impact on Pro-Poor Economic Growth
5
GROWTH-REDUCING IMPACTS OF HIV/AIDS There is uniform agreement that HIV/AIDS reduces economic growth. The discussion to date has been based largely upon simulation models enhanced with limited empirical data. Early models of HIV/AIDS impact on GDP were developed in the 1990s. These models focused on the impact of HIV/AIDS on economic output, costs, market size, and private sector investment. Examples include the work of Cuddington (1993) and Kambou et al. (1992). The models predicted small annual changes in GDP growth, ranging from 0.8 percent to 1.4 percent per year. In some models, the HIV/AIDS impacts were dwarfed by other variables such as economic policies, even in countries with high-prevalence epidemics (Bloom and Mahal, 1997). In retrospect, these models are now considered fairly “stylized” because they captured only limited indirect and dynamic impacts of HIV/AIDS. In addition, they reflected expectations of continuing low-prevalence rates for HIV, figures that were nullified by the startling rise in HIV prevalence in Southern Africa in the late 1990s. More recent models have been refined through nearly a decade of additional evidence of the impacts of HIV/AIDS, including growing evidence of sectoral impacts. These models have included more dynamic and indirect impacts, such as changing public sector priorities in the face of the AIDS crisis, drags on human and capital development over time, and significant changes in the composition of the labor force over time. In addition, the current models factored in more accurate HIV-prevalence rates for Southern Africa. All of this combined to raise the estimates of HIV impact on GDP significantly. The ING Barings’ model of South Africa in 1999 was one of the first to incorporate dynamic effects of AIDS; however, it still dramatically underestimated the potential scale of the epidemic. Ultimately, the ING model predicted only 0.3-0.4 percent reductions in annual GDP growth rates but highlighted new concerns: the potential for a domestic savings squeeze and a deterrence effect on foreign investment because of AIDS. One year later, Arndt and Lewis’s model incorporated even more indirect and dynamic effects. Also focused on South Africa, it predicted that GDP growth rates would ultimately be 2.6 percent lower per year as a result of AIDS, leading to a 17 percent reduction in GDP (and 7 percent reduction in per capita GDP) over the next 10 years. Government studies in Botswana (cited by UNDP, 2000) predict that GDP will drop by 24-38 percent because of HIV/AIDS by 2021 (whereas per capita income is expected to drop 8-10 percent). These expanded models have led analysts at the World Bank and Harvard University to suggest “thresholds” of economic impact based on HIV prevalence, where countries with 15 percent prevalence rates or higher will see GDP growth rates decline by at least 1 percent annually. Over time, this annual drag on the growth of GDP leads to numbers similar to those projected by Arndt and Lewis. Less significant impacts on GDP are projected for countries with lower prevalence rates. Anand et al. (1999) estimated that HIV/AIDS costs India 1 percent of GDP per year as a result of lost productivity and the costs of treating secondary infections. Shelton et al. (2000) estimated that GDP in Jamaica, Trinidad, and Tobago would be as much as 4.2 percent lower over a 15-20 year period because of HIV/AIDS. Although the precision of these estimates

6
may be debated, these models remind policy makers that even low-prevalence countries benefit from slowing the spread of HIV. The models include distributional projections as well. In Burkina Faso (with a prevalence rate of 6.4 percent), the UNDP estimates that the number of people living in poverty will increase from 45 percent to nearly 60 percent by 2010 because of AIDS (Bjorkman, 2001). In Botswana, the number of families living below the poverty line is expected to increase 8 percent over the next 10 years because of AIDS (Loewenson and Whiteside, 2001). Widening inequality in wealth is also projected: a cross-country study of Rwanda, Uganda, and Burkina Faso projects that the percentage of people living in extreme poverty in those countries will increase from 45 percent in 2000 to 65 percent in 2015 (UNAIDS, 2002). However, remembering the caveat above, the absolute value of these numbers is less important (and reliable) than the story they tell—that HIV/AIDS will worsen poverty overall and will worsen distribution of economic resources within high-prevalence countries. What are the driving forces behind predictions of slowed GDP as result of AIDS? At the macroeconomic level, composition of the population (and labor force) is a key factor because HIV/AIDS erodes the primary production and consumption band of the population. The second set of driving forces are the private sector impacts of AIDS—reduced productivity, increased cost structures, reduced market size, and reduced national investment and savings patterns. The third set of variables reflects the reduced ability of the public sector to support economic growth because of both reduced revenues and diversion of revenues to respond to AIDS. Some of the more immediate impacts of AIDS have been documented empirically, usually within the more concrete sectoral impact studies (discussed below). The dynamic and indirect effects are more likely to appear gradually in the future as the epidemic progresses. To date, there is little empirical evidence with regard to these dynamic and indirect factors, but they are increasingly the centerpiece of discussion: ▪ Lower Individual Savings as a Result of AIDS: According to the ING Barings’ estimates
of the macroeconomic impact of AIDS in South Africa, “a key factor likely to lower potential GDP growth after 2005 is the diversion of funds away from savings to pay for the costs of the illness” (ING Barings, 1999).
▪ Lower Public Sector Investments: The UNDP National Human Development Report
2000 for Botswana estimates that public revenues will be reduced by 20 percent because of the impacts of HIV/AIDS (Bjorkman, 2001) whereas resource requirements to respond to HIV/AIDS are increasing. In South Africa, ING Barings notes that if the public sector spends additional funds, rather than diverting existing public funds to fight AIDS, the public borrowing may begin to crowd out potential private investment as well.
▪ Reduced Investment in Capital: As worker productivity falls, equipment will increasingly
be left idle or managed by less experienced workers. In such cases, increased investment in capital is unlikely, despite the expected labor-to-capital shift in a high morbidity and mortality environment. A more likely outcome, predicted by Haacker (2002), is not only
Deliverable 18: HIV/AIDS’ Impact on Pro-Poor Economic Growth
7
a failure to attract new capital but also the potential for capital flight at its earliest opportunity.
▪ Less Experienced Workforce: The workforce will become less experienced because of
losses of experienced workers in all job categories (highly skilled, skilled, semi-skilled, and unskilled). Based on analysis of 15 countries (13 in Africa plus Thailand and Haiti), the ILO predicts that the aggregate formal sector workforce is expected to have an average of two years less experience by 2020 as a result of AIDS (ILO, 2000). Accepting that each year's drop in experience results in an aggregate decline of 1.5 percent of GDP (Ferreira and Pessoa, 2003),2 this would translate into a 3 percent negative impact on GDP from this factor alone.
Models of the impact of AIDS are still emerging. New work examines AIDS-induced changes at the household and individual levels, modeling the possible long-term impacts of those changes as macroeconomic outcomes. Analysts point to the already-visible downward slide in the health and education levels of AIDS-affected households; this is documented in community-level studies but is not yet factored into the macroeconomic models. If these trends are national in scope, they suggest a downward trend in productivity of the general population. This trend is likely to be even larger for the next generation, a significant number of whom will have reduced basic education, life skills, health, and social mentoring because of AIDS. In high-prevalence countries, this cohort may make up to 30 percent of the next generation’s workforce. Also of emerging concern is a possible change in behavior and investment patterns of individuals and households. Will people purposefully invest less in themselves if they feel that HIV/AIDS will make that investment useless? In the face of a 6.5-year decline in life expectancy in the 35 most-affected countries, Ferreira and Pessoa (2003) developed a model to explore whether a population facing a shortened life will continue to invest in its own skills and experience and to save and invest in productive activities. Their model predicts that likely changes in individuals’ education and savings decisions alone will result in per capita income declines of 25 percent over time. McPherson (2003) also voices concerns that the current models remain too optimistic, failing to capture the future impact of HIV/AIDS on the disintegration of a wide range of institutions; declining social capital; and incentives toward widespread disinvestments in human, physical, and other assets. In sum, HIV/AIDS is likely to exert a negative impact on GDP for countries that have reached a certain level of prevalence. For countries with over 15 percent prevalence rates, aggregate GDP can be expected to decline by 10 percent or more, depending on how quickly the epidemic is brought under control. What is more, the emerging consensus is that the impacts of AIDS on GDP will grow stronger in the future as a result of the indirect and dynamic impacts of the epidemic on economic growth and because of the still-growing scale of the epidemic.
2 Ferreira and Pessoa report that the average gain in GDP in the United States from one more year of
experience in the workforce is 1.5 percent, which “is in line with similar specifications from Haacker (2002) and with estimated rates of return in Africa's manufacturing sector in Bigsten (2000).”
8
SECTORAL IMPACTS OF HIV/AIDS Although the macroeconomic and household-level impacts of HIV/AIDS are terrible, the impact of HIV/AIDS is most visible when looking at particular sectors, where illness and death can have a measurable impact on institutions, businesses, activities, and outcomes. HIV/AIDS strikes certain sectors harder than others, particularly those that use migrant labor (such as mining, transport, construction, and agriculture). Certain sectors within the civil service and professions also have greater exposure: teachers, health care professionals, military, and police tend to have rates higher than the average population and tend to have a more skill-intensive workforce than activities heavily dependent on migrant labor. In each sector, loss of key skilled workers can cause major disruptions that take years to remedy. The loss of highly-skilled water engineers in Malawi is one such example (Topouzis, 1998). The literature on the impact of HIV/AIDS on each of these sectors is growing rapidly. Below is a brief summary of the impact of HIV/AIDS on four sectors that play a significant role in pro-poor economic growth: agriculture, education, health, and the formal private sector. Agriculture One of the most disturbing and well-documented findings on rural households affected by HIV/AIDS is their transition out of small-scale commercial agriculture, which is replaced by subsistence agriculture. Early data from Zimbabwe drew attention to the potential magnitude of agricultural impacts, where an AIDS death led to a 61 percent decline in maize output, 49 percent decline in vegetable output, and 47 percent decline in cotton output (UNAIDS, 2000). Why does this reduction take place? When a male head of household is ill, his agricultural tasks are left to others or halted. In addition, the caregiver’s agricultural contributions fall dramatically. In Tanzania, for example, Rugalema (1998) found that women caregivers spent 60 percent less time on agricultural activities. After the death of a male household head, the surviving spouse has increased difficulties with tasks traditionally carried out by the man: marketing, managing the farm schedule, and maintaining crop storage facilities are a few of the areas where there is a documented decline in effort (CARE/Malawi, 2002). These changes can have dramatic effects on the household’s agricultural income. In Kenya, for example, the death of a rural household head was associated with a 68 percent decline in the household income (Leighton, 1996). In general, the agricultural decisions of caregivers and those who survive the family’s HIV/AIDS crisis involve moving toward labor-saving agricultural practices. Increasing amounts of land may lie fallow (with more distant fields most likely to be least tended; preparation of new agricultural land slows or stops, and the family shifts to low-labor (and typically lower-nutrition) subsistence crops, such as cassava. As Malcolm McPherson (Barks-Ruggles et al., 2001) says, the impact of AIDS (on the agricultural sector in this case) is akin to running Adam Smith in reverse.

Deliverable 18: HIV/AIDS’ Impact on Pro-Poor Economic Growth
9
As households reduce agricultural activities through these different coping strategies, many AIDS-affected households are in serious danger of becoming food insecure. This food insecurity may result from declining nutritional status of the household’s food production, declining amounts of food grown for home consumption, or decreased ability to purchase adequate food. This pattern is already being played out in Southern Africa, where HIV-prevalence rates are highest and are combined with unfavorable weather patterns. Monitoring the impacts of HIV/AIDS within the context of agricultural production is difficult, particularly because those most affected tend to disappear from the sector (by exiting commercial activities, through death, or through family dissolution). Therefore, to assess the magnitude of changes in agricultural activities from a programmatic perspective, special efforts must be made to track changes in aggregate output or land use patterns (including changes in crop volumes, land left fallow, and changing crop patterns). If food security is a major concern, a program may want to track household food stocks to identify newly vulnerable households. Education Education is central to the ability of the poor to participate in economic growth activities (as articulated in the sector study, “Deliverable 11:Educational Sector Study: Pro-Poor Economic Growth Effects of Policies and Activities,” by Jere Bermann). Education of women is highly correlated with an increase in the family’s overall physical and economic well-being, which enhances their productive capacity. In Asia, educational growth has been shown to be a central component of the strategy that led to more equitable patterns of pro-poor economic growth. Education is a sector where HIV/AIDS impact is most visible not only because of teacher losses but also because the dropout of children affected by AIDS. Teacher losses are so large in high-prevalence HIV/AIDS countries that teaching colleges are unable to train sufficient numbers of replacement teachers. UNICEF estimated that, in 1999 alone, 860,000 students across Africa lost teachers to AIDS. In Zambia, teachers have HIV infection rates 70 percent higher than the general population (World Bank, 2001). In South Africa, teacher death rates have risen 40 percent (UNAIDS, 2002). The ability of children to stay in school is heavily affected by AIDS. A study of the Central African Republic and Swaziland reports school enrollments have declined 20-36 percent because of AIDS-orphan dropouts. A study of orphaned and non-orphaned children in Kenya found that, although 98 percent of non-orphaned children were in school, 47 percent of orphaned boys and 56 percent of orphaned girls had dropped out within a year of a parent’s death (UNAIDS, 2002). These trends have significant implications for the future ability of these children to participate in economic activities. In response, several African governments have lifted school fee requirements for primary school, resulting in a large-scale return of orphans to the classroom.
10
Health Like education, a certain level of health is a critical precondition for the participation of the poor in economic activities and in their ultimate productivity (as spelled out in “Deliverable 18: Health Issues” by James Knowles). As Knowles notes, HIV/AIDS is now the number one cause not only of death but also of years lived with disabilities for adults 15-49 years of age in Africa. This is the health care burden of HIV/AIDS to the health system of the estimated 25.8 million adults now living with HIV/AIDS. This represents an increase in health care demand is from a group normally among the most healthy in Africa—young, productive adults. As a result, the impact on the health care system is immense, adding a new, growing, and very sick cohort to the load traditionally borne by the health sector. The impact of HIV/AIDS on the health sector is immense. By 1995, HIV/AIDS-related care accounted for 27 percent of the public health budget in Zimbabwe, and 66 percent in Rwanda (Whiteside, 2002). Looking forward, Ministry of Health allocations to HIV/AIDS treatment may rise as high as 30 percent in Ethiopia by 2014, 50 percent in Kenya by 2005, and 60 percent in Zimbabwe by 2005 (Stover and Bollinger, 1999). The World Bank estimates that 100 percent of hospital beds will be needed to respond to the AIDS-related demand in Swaziland by 2004 and in Namibia by 2005 (two countries with HIV-prevalence rates above 20 percent), despite a trend that individuals with advanced AIDS are increasingly treated at home (UNAIDS, 2002). These sorts of dire statistics not only point to the public costs of HIV/AIDS but also to the diversion of health sector resources from other major health concerns such as maternal and child health and malaria. The second form of impact on the health sector, as in education, is on the professional cadre of health care workers. For example, Malawi and Zambia—two high-prevalence countries—are experiencing five- to six-fold increases in health worker illness and death (predominantly because of sexual behavior rather than occupational risk). South Africa projects that a 25-40 percent increase in training of doctors and nurses by 2010 is required to meet projected medical needs in Southern Africa (UNAIDS, 2002). In addition, absenteeism, and the relative inexperience of new health care workers undermine the ability of the system to deliver services. Formal Private Sector The literature on the impact of HIV/AIDS on private business is voluminous. Overall, the impacts of HIV/AIDS on the private sector can be grouped in terms of productivity and profitability. The loss of skilled, experienced workers is a major business concern. Although senior managers and those in the “critical path” of a company are the most expensive to replace, even semi-skilled and unskilled workers can cause major disruptions in production, idling of capital, and overall declines in output. The Center for International Health at Boston University’s School of Public Health studied six companies in different sectors and countries (in the ARCH program). It found that each new HIV infection created a liability to the

Deliverable 18: HIV/AIDS’ Impact on Pro-Poor Economic Growth
11
company ranging from 1.3 percent to 4 percent of the worker’s annual salary, depending on the structure and operations of the company. These costs varied based upon the company’s medical, retirement, death, and disability benefits; recruitment and training investments; labor productivity (where capital-intensive industries are hit harder); ability to outsource unskilled tasks; and discount rate. Those sectors that are most labor-intensive and those that have a higher proportion of migrant or seasonal workers are more heavily impacted by HIV/AIDS in terms of sheer numbers of infections, morbidity, and mortality. These sectors include mining, construction, transportation, and commercial agriculture. However, the total AIDS-related costs in capital-intensive sectors are actually higher, where skilled and semi-skilled workers are essential to productivity. Lost workers in these sectors are harder to replace and more expensive to train. As a whole, HIV/AIDS affects the ability of the private sector to remain profitable and competitive. The total cost to business varies by study. Estimates from several East African studies, for example, estimate that the costs of HIV/AIDS-related absenteeism (including hire of temporary workers, production cycle disruptions, loss of know-how, and loss of quality) accounted for as much as 25-54 percent of total business costs (UNAIDS, 2002). Aventin and Huard (2000) studied companies in Côte d’Ivoire and found that a 10 percent prevalence rate among workers could lead to AIDS-related costs equal to 10 percent of the total labor cost because of absenteeism and low productivity stemming from ill health. If this ratio holds, multiplying by prevalence rates in high-prevalence countries (which reach up to 39 percent in Botswana) leads to the level of business costs cited by UNAIDS for the East African studies. Costs of benefits are particularly onerous in the HIV/AIDS environment, with health care costs skyrocketing. One expected business survival tactic is the outsourcing of unskilled labor tasks (such as cleaning and food service), which will reduce the company’s financial exposure to HIV/AIDS by removing the costs of medical care and funeral contributions from the company. However, the effect is to place these costs back on the subcontractor (whether a smaller business or an individual). This trend, if it is borne out, is likely to maintain the number of poor and unskilled workers in the formal economy but at a lower effective wage (because of the loss of benefits). Finally, for producers of domestically or regionally consumed commodities, the private sector is likely to face shrinkage of demand as AIDS-affected consumers shift spending from consumer goods or durables to essentials such as food and medical care. There is little the private sector can do in response to this change in high-prevalence areas.
RECOMMENDATIONS IN THE FACE OF HIV/AIDS In countries coping with HIV/AIDS, reversing the epidemic must be a top priority in protecting gains to economic growth and poverty reduction. For countries with low-prevalence levels, this task is easier and can be accomplished largely within the realm of health-related programs. For highly affected countries, the task turns to protecting hard-won
12
development gains from the economic, social, and human ravages of HIV/AIDS, and the response requires participation far beyond the health field. Those working on economic growth and poverty reduction often find it difficult to identify a role in the response to a health-related crisis of such magnitude and complexity as HIV/AIDS. However, there are some opportunities to have an impact in (1) slowing the epidemic and (2) protecting the poors’ access to economic growth activities even in an HIV/AIDS-affected environment. These ideas are presented at two levels below: the policy level and the project level. Policy-level Opportunities ▪ For low-prevalence settings, slow the spread of HIV before it becomes entrenched in the
general population. Only a few countries have actually slowed or turned the epidemic at that early stage: Senegal and Thailand are usually cited as the most prominent in stopping the epidemic before it became widespread. The common element between these two countries was a committed national political leadership. Therefore, encouragement and support to indigenous, national leadership on HIV/AIDS even where AIDS is least visible may be the most important ways to reduce the long-term economic impacts of the epidemic.
▪ In high-prevalence countries, help national policy-makers establish priorities with regard
to AIDS response around sectors that will secure long-term development gains, such as education, health, and agriculture. In the African context, these sectors must continue to function throughout the AIDS crisis for the country to maintain the preconditions for long-term pro-poor economic growth. USAID’s Mobile Task Team) on Education provides an example of how to deliver intensive support to a priority sector, working with Ministries of Education in high-prevalence countries to assess the changing situation, develop and budget for response strategies, then implement and monitor operational plans. Such targeted support to key sectors can have a major impact on the ability of countries to maintain their human and economic capacity through the multiple phases of the AIDS crisis.
▪ Encourage donors and development partners to include HIV/AIDS in development and
poverty reduction planning, including the Poverty Reduction Strategy Paper process. UNDP has developed a checklist with guidance on how to integrate HIV/AIDS into poverty reduction strategies, and recommends that HIV/AIDS be placed in the center of discussions on reaching the Millennium Development Goals (UNDP, 2002).
Project-level Opportunities In moderate- and high-prevalence countries, modify projects to allow labor- and capital-
poor AIDS-affected families to continue to participate in development activities. For example, in agriculture, innovations may come in the form of labor- and capital-saving technologies or those that allow women-, elderly-, or child-headed households to
Deliverable 18: HIV/AIDS’ Impact on Pro-Poor Economic Growth
13
accomplish agricultural tasks previously undertaken by men. In the education sector, programs in girls’ education may include a distance learning (radio) component, recognizing that girls are most often removed from school in AIDS-affected households.
In moderate- and high-prevalence countries, explore mechanisms of channeling resources
to families that will otherwise resort to irreversible coping behaviors. Such support might give incentives to keep children in school, avoid sale of land, or allow child-headed households to receive direct grant support. These resources are likely to be most essential for women, children, and the elderly—groups that bear the heaviest burden in coping with the costs and impacts of AIDS.
In moderate- and high-prevalence countries, monitor the impacts and systemic costs of
HIV/AIDS in each priority sector. This information is critical for effective planning and response.
In any country, ensure that development activities are not putting participants at risk of
HIV infection. For example, development efforts that encourage population mobility could also put individuals at greater risk of exploitation (such as programs that shift women from subsistence to commercial agriculture). The first principle of responding to AIDS is to ensure that programs do no harm.
In any country, use development platforms as an opportunity to transmit information on
how to avoid HIV infection, how to support those coping with HIV/AIDS, and how to live positively with HIV/AIDS. This sort of call to arms was part of t Uganda’s success in turning around an advanced epidemic because it reduces stigma about AIDS and provides information within fora where people already work together and can support one another (for example, within a school system, a health care clinic, a farmers’ association, and a local government institution). Tools now available to provide workplace programs in prevention education can be expanded to better match these alternative platforms.
CONCLUSION
HIV/AIDS is now part of the environment within which poverty reduction, economic growth, and pro-poor economic growth takes place. Only when it is considered as a development risk can its impact be managed and minimized. In high-prevalence countries, this is a necessity. In low-prevalence countries, this is an opportunity.

14
A-1
ANNEX A
ILLUSTRATIVE EMPIRICAL EVIDENCE OF ECONOMIC IMPACT OF HIV/AIDS ON HOUSEHOLDS

A-2
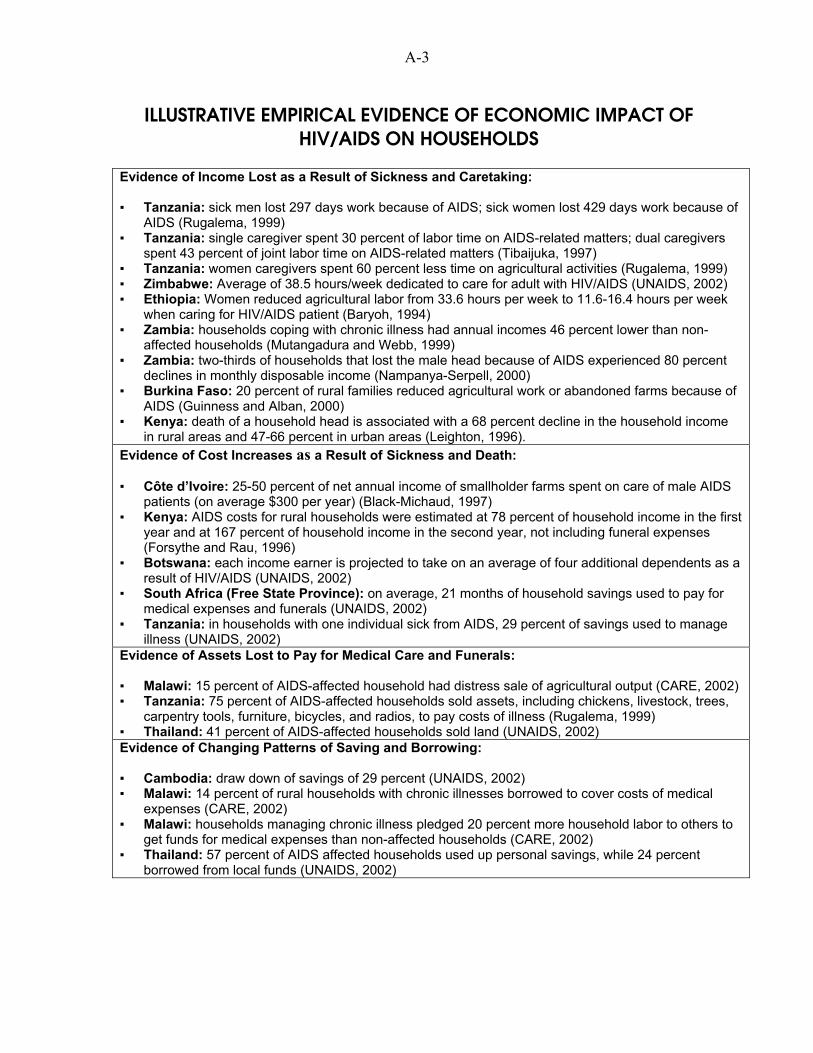
A-3
ILLUSTRATIVE EMPIRICAL EVIDENCE OF ECONOMIC IMPACT OF HIV/AIDS ON HOUSEHOLDS
Evidence of Income Lost as a Result of Sickness and Caretaking: ▪ Tanzania: sick men lost 297 days work because of AIDS; sick women lost 429 days work because of
AIDS (Rugalema, 1999) ▪ Tanzania: single caregiver spent 30 percent of labor time on AIDS-related matters; dual caregivers
spent 43 percent of joint labor time on AIDS-related matters (Tibaijuka, 1997) ▪ Tanzania: women caregivers spent 60 percent less time on agricultural activities (Rugalema, 1999) ▪ Zimbabwe: Average of 38.5 hours/week dedicated to care for adult with HIV/AIDS (UNAIDS, 2002) ▪ Ethiopia: Women reduced agricultural labor from 33.6 hours per week to 11.6-16.4 hours per week
when caring for HIV/AIDS patient (Baryoh, 1994) ▪ Zambia: households coping with chronic illness had annual incomes 46 percent lower than non-
affected households (Mutangadura and Webb, 1999) ▪ Zambia: two-thirds of households that lost the male head because of AIDS experienced 80 percent
declines in monthly disposable income (Nampanya-Serpell, 2000) ▪ Burkina Faso: 20 percent of rural families reduced agricultural work or abandoned farms because of
AIDS (Guinness and Alban, 2000) ▪ Kenya: death of a household head is associated with a 68 percent decline in the household income
in rural areas and 47-66 percent in urban areas (Leighton, 1996). Evidence of Cost Increases as a Result of Sickness and Death: ▪ Côte d’Ivoire: 25-50 percent of net annual income of smallholder farms spent on care of male AIDS
patients (on average $300 per year) (Black-Michaud, 1997) ▪ Kenya: AIDS costs for rural households were estimated at 78 percent of household income in the first
year and at 167 percent of household income in the second year, not including funeral expenses (Forsythe and Rau, 1996)
▪ Botswana: each income earner is projected to take on an average of four additional dependents as a result of HIV/AIDS (UNAIDS, 2002)
▪ South Africa (Free State Province): on average, 21 months of household savings used to pay for medical expenses and funerals (UNAIDS, 2002)
▪ Tanzania: in households with one individual sick from AIDS, 29 percent of savings used to manage illness (UNAIDS, 2002)
Evidence of Assets Lost to Pay for Medical Care and Funerals: ▪ Malawi: 15 percent of AIDS-affected household had distress sale of agricultural output (CARE, 2002) ▪ Tanzania: 75 percent of AIDS-affected households sold assets, including chickens, livestock, trees,
carpentry tools, furniture, bicycles, and radios, to pay costs of illness (Rugalema, 1999) ▪ Thailand: 41 percent of AIDS-affected households sold land (UNAIDS, 2002) Evidence of Changing Patterns of Saving and Borrowing: ▪ Cambodia: draw down of savings of 29 percent (UNAIDS, 2002) ▪ Malawi: 14 percent of rural households with chronic illnesses borrowed to cover costs of medical
expenses (CARE, 2002) ▪ Malawi: households managing chronic illness pledged 20 percent more household labor to others to
get funds for medical expenses than non-affected households (CARE, 2002) ▪ Thailand: 57 percent of AIDS affected households used up personal savings, while 24 percent
borrowed from local funds (UNAIDS, 2002)
A-4
Evidence of Changing Consumption of Household: ▪ Tanzania: food consumption dropped 15 percent in poorest households after death of an adult
(UNAIDS, 2002) ▪ Zambia: those who lost breadwinners showed the following signs of impoverishment: 61 percent
moved to cheaper housing, 39 percent lost piped water, and 21 percent of girls dropped out of school (Nampanya-Serpell, 2000)
Evidence of Impact on Women: ▪ Tanzania: main problem for women after death of spouse was access to cash income to purchase
inputs rather than labor shortage (Rugalema, 1999) ▪ After male death, reduction in household’s animal husbandry, marketing, farm management, and farm
infrastructure (Topouzis, 1999)

B-1
ANNEX B
BIBLIOGRAPHY

B-2
B-3
BIBLIOGRAPHY Ainsworth, Martha, L. Fransen, and M. Over (eds.), Confronting AIDS: Evidence from the developing world: Selected background papers for the World Bank Policy Research Report. Brussels: European Commission, 1998 Anand, K., C.S. Pandav, and L.M. Nath, “The Impact of HIV/AIDS on the National Economy of India,” Health Policy 47, pp. 195-205, 1999. Arndt, C. and Jeffrey D. Lewis, “The Macro Implications of HIV/AIDS in South Africa: A Preliminary Assessment,” South African Journal of Economics, Special Edition: Vol. 68, December 2000. Aventin, L. and P. Huard, “The Costs of AIDS to Three Manufacturing Firms in Côte d’Ivoire,” Journal of African Economics 9(2): 161-188, 2000. Barnett, Tony and Piers Blaikie, AIDS in Africa, London: Belhaven, 1992. Bjorkman, UNDP National Human Development Report, Burkina Faso, 2001. Barks-Ruggles, E., T. Fantan, M. McPherson, and A. Whiteside, “The Economic Impact of HIV/AIDS in Southern Africa,” Brookings Institute: Conference Report #9, September 2001. Baryoh, A., “Socio-Economic Impact of HIV/AIDS on Women and Children in Ethiopia,” unpublished manuscript, UNDP, Addis Ababa, 1994. Black-Michaud, A., Impact du VIH/SIDA sur les systemes d’exploitation agricoles en Afrique de l’Ouest, FAO, 1997. Bloom, David and Ajay Mahal, “Does the AIDS epidemic threaten economic growth?” Journal of Econometrics 77(1): 105-24, 1997. Bloom, David, Ajay Mahal, Jaypee Sevilla, and River Path Associates, “AIDS and Economics,” Paper prepared for Working Group 1 of the WHO Commission on Macroeconomics and Health, November 2001. Bloom, David, River Path Associates, and Jaypee Sevilla, “Health, wealth, AIDS and poverty,” Cambridge: Harvard School of Public Health, 2002. CARE/Malawi, “The Impact of HIV/AIDS on Agricultural Production Systems and Rural Livelihoods in the Central Region of Malawi,” 2002. Center for International Health, Boston University School of Public Health, “The economic impact of HIV/AIDS on South African Businesses,” ARCH program document, 2002.

B-4
Cuddington, J.T., “Modeling the Macroeconomic Effects of AIDS, with an Application to Tanzania,” The World Bank Economic Review 7(2): 173-189, 1993. Dixon, S., S. McDonald, and J. Roberts, “The Impact of HIV and AIDS on Africa’s Economic Development,” BMJ, 324:232-234, 2000. Donahue, Jill, “Community-Based Economic Support for Households Affected by HIV/AIDS,” Discussion Paper on HIV/AIDS Care and Support #6, USAID, June 1998. Donahue, Jill, "HIV/AIDS and Economic Strengthening via Microfinance." Displaced Children and Orphans Fund, 2000. Donahue, J., Kabbucho, K. and Osinde, S. "HIV/AIDS – Responding to the Silent Economic Crisis Among Microfinance Clients in Kenya and Uganda." Micro-Save Africa, 2001 (www.microsave-africa.com). Dorrington, R. “The Actuarial Society of South Africa (ASSA) National AIDS Model—ASSA600,” http://assa.org.za, 1998. Ferreira, Pedro Cavalcanti and Samuel Pessoa, “The Long-Run Economic Impact of AIDS,” Rio de Janeiro: Graduate School of Economics, Fundacao Getulio Vargas, Praia de Botafogo, February 2003. Flores, Rafael, “Health and Nutrition Emerging and Reemerging Issues in Developing Countries,” Brief 1 of 11, 2020 Focus, IFPRI, February 2001. Forsythe, Steven (ed.), State of the Art: AIDS and Economics, International AIDS Economics Network July 2002. Forsythe, Stephen and Bill Rau (eds.), AIDS in Kenya: Socio-Economic Impact and Policy Implications, Arlington, Virginia: Family Health International, 1996. Greener, R., K. Jefferis, and H. Siphambe, “The Impact of HIV/AIDS on Poverty and Inequality in Botswana,” Journal of South African Economics, Vol. 68: 5, pp. 888-915, 2000. Guinness, L. and Anita Alban, “The Economic Impact of AIDS in Africa, A Review of the Literature,” UNAIDS Background Paper, 2000. Haacker, Markus, "The Economic Consequences of HIV/AIDS in Southern Africa," IMF Working Papers 02/38, 2002. International Labour Organization, “HIV/AIDS: A threat to decent work, productivity, and development,” Document for discussion at the Special High-Level Meeting on HIV/AIDS and the World of Work, Geneva, June 8, 2000.

B-5
ING Barings/South Africa, “The Demographic Impact of AIDS on the South African Economy,” Johannesburg, 1999. ING Barings, “Economic Impact of AIDS in South Africa: A dark cloud on the horizon,” Johannesburg, April 2000. Haacker, Markus, “Modeling the Macroeconomic Impact of HIV/AIDS,” IMF Working Paper WP/02/195, International Monetary Fund, 2002. Kambou, G., S. Devarajan, and M. Over, “The Economic Impact of AIDS in an African Country: Simulations with a General Equilibrium Model of Cameroon,” Journal of African Economies, Vol. 1: 1, pp. 103-130, 1992. Kwaramba, Phil, The Socio-Economic Impact of HIV/AIDS on Communal Agricultural Production Systems in Zimbabwe, Zimbabwe Farmers Union and Friederich Ebert Stiftung, Harare, 1997. Leighton, C., “The Direct and Indirect Costs of HIV/AIDS,” AIDS in Kenya: Socio-Economic Impact and Policy Implications, edited by S. Forsythe and B. Rau, 1996. Loewenson, Rene and Alan Whiteside, “HIV/AIDS Implications for Poverty Reduction,” UNDP Background Paper prepared for the UNDP for the United Nations General Assembly Special Session on HIV/AIDS, June 25-27, 2001. McPherson, Malcolm, “Macroeconomic Models of the Impact of HIV/AIDS,” draft paper, Center for Business and Government, JFK School of Government, Harvard University, 2003. Mutangadura, Gladys, Helen Jackson et al., AIDS and African Smallholder Agriculture, Harare: SafAids, 1999. Mutangadura, Gladys and Douglas Webb, The Socio-Economic Impact of Adult Morbidity and Mortality on Households in Kafue District, Zambia, Harare: SafAids, 1999. Nampanya-Serpell, Namposya, “Social and Economic Risk Factors for HIV/AIDS-Affected Families in Zambia,” Paper presented at the International AIDS Economics Network Symposium, Durban, July 7-8, 2000. National Intelligence Council, “The Next Wave of HIV/AIDS; Nigeria, Ethiopia, Russia, India and China,” ICA 2002-04 D, www.cia.gov, September 2002. Over, Mead, “The Macroeconomic Impact of AIDS in Sub-Saharan Africa,” Technical Working Paper No. 3, Washington, DC: The World Bank, 1992. Rugalema, Gabriel, Adult Mortality as an Entitlement Failure: AIDS and the Crisis of Rural Livelihoods in a Tanzanian Village, 1999.
B-6
Rugalema, Gabriel, “Consequences of Loss of Labour due to HIV/AIDS in Smallholder Households in a Buhaya Village, Bukoba District, Tanzania,” Paper presented at the East and Southern Africa Regional Conference Responding to HIV/AIDS: Development Needs of African Smallholder Agriculture,” Harare, June 8-12, 1998. Shelton, Nicholls, Roger McLean, Karl Theodore, Ralph Henry, and Camara Bilali, “Modelling the Macroeconomic Impact of HIV/AIDS in the English Speaking Caribbean: The Case of Trinidad and Tobago and Jamaica,” 2000. Stover and Bollinger, “The Economic Impact of AIDS,” The Futures Group International: The Policy Project, 1999. Tibaijuka, A.K., “AIDS and Economic Welfare of Peasant Agriculture: Case studies from Kagabiro Village, Kagera Region, Tanzania,” World Development, Vol.. 15, No. 6, 1997, pp. 963-975. Topouzis, Daphne, “The Implications of HIV/AIDS for Rural Development Policy and Programming: Focus on Sub-Saharan Africa,” Study Paper No. 6, UNDP, 1998. Topouzis, Daphne, “Sustainable Agricultural/Rural Development and Vulnerability to HIV/AIDS,” UNAIDS Best Practice Paper, FAO/UNAIDS, 1999. Topouzis, Daphne, “Measuring the Impact of HIV/AIDS on the Agriculture Sector in Africa,” Background Paper, UNAIDS, December 2000. TvT Associates, ed., “Children on the Brink 2002: A Joint Report on Orphan Estimates and Orphan Strategies,” USAID Synergy Project, July 2002. UNAIDS, Report on the Global HIV/AIDS Epidemic, 2000. UNAIDS, Report on the Global HIV/AIDS Epidemic, 2002. UNDP National Human Development Report, Botswana, 2000. UNDP, “Policy Note: HIV/AIDS and Poverty Reduction Strategies,” August 2002. White, Joanna, and Elizabeth Robinson, HIV/AIDS and Rural Livelihoods in Sub-Saharan Africa, National Resource Institute/DFID, Policy Series 6, 1999. Whiteside, Alan, “HIV/AIDS, Health, and Education,” Chapter 4 in The State of the Art: AIDS and Economics (Stephen Forsythe, ed.), 2002. World Bank, Confronting AIDS: Priorities in a Global Epidemic, Oxford: Oxford University Press, pp. 215-216, 1997. World Bank, World Development Indicators, 2001.

B-7
World Health Organization, "World Health Report," 2002. (www.ilo.org)

Privatization and the Poor: Issues and Evidence
By Leroy P. Jones
Deliverable 18: Privatization and the Poor: Issues and Evidence
i
TABLE OF CONTENTS ISSUES ..................................................................................................................................1 CONSUMER IMPACT ..............................................................................................................1 LABOR ..................................................................................................................................2 INDIRECT EFFECTS ................................................................................................................3 RELATIVE IMPACT ................................................................................................................4 IMPLICATIONS.......................................................................................................................5 BIBLIOGRAPHY .....................................................................................................................6


Development Alternatives, Inc.–Boston Institute for Developing Economies
1
ISSUES Does privatization harm the poor? More specifically, what is the distributional impact of privatization? The efficiency effects of privatization are well-known, substantial, and overwhelmingly positive, as shown by a survey in the Journal of Economic Literature (Megginson and Netter, 2001). The equity effects, however, are less well-understood and far less uniform. This is obviously unsatisfactory for those who care about equity, but it also matters to those concerned with generating further efficiency gains. The momentum of privatization, which accelerated through the 1990s, has recently slowed considerably in most, if not all, countries. In part, this is because the “easier” countries and companies have been “done.” It is also because widespread public perception persists that privatization’s benefits have not been shared equitably, with the rich gaining at the expense of the poor. The poor are said to suffer absolutely as consumers faced with increased prices and as workers who are laid off. In addition, they are said to be made relatively worse off as the benefits of efficiency gains go to corrupt officials, rich domestic businessmen, and foreigners. To what extent are these charges substantiated by empirical findings? The impact on consumers, workers, and overall distribution are addressed below. Indirect effects (fiscal and macroeconomic activation) are then considered, followed by a section on the special problems of transition economies and consideration of the implications for future research and policy.
CONSUMER IMPACT This discussion focuses on the utility sectors, because these sectors probably account for more than half the value of privatizations, and because privatizing tradable/competitive goods cannot harm consumers. Furthermore, the poor consume little of other privatized goods and services, such as air travel, banking, and steel. Most important, we focus on the utility sectors because they involve price increases, a popular concern. This is only natural, because fear that private monopolists would exploit consumers is a major reason these sectors were made public in the first place. Post-privatization price regulation is not always done well (witness electricity in California and electricity and rail service in the United Kingdom). Even if regulators succeed in preventing exploitive pricing, consumers could still lose if a subsidized price changes to an efficient price that covers all costs. This could result, however, in a trade-off between a higher price and wider access, as higher revenues permit capacity expansion once constrained by a lack of funds under government operation. In this scenario, existing consumers lose but new consumers gain, as they are given, for the first time, access to water, electricity, or phone service. Which effect dominates? Intuitively, one would expect that the gains to a household that obtains access would be much larger than the losses to a household that pays a little more. Yet how many households are there of each type? A balanced evaluation of the impact on consumers must ask questions such as this, but few do.

Deliverable 18: Privatization and the Poor: Issues and Evidence
2
A notable exception is a set of recent studies done for Argentina (Ennis and Pinto, 2002), Bolivia (Barja, McKenzie, and Urquiola, 2002), Mexico (Lopez-Calva and Rosellon, 2002), and Nicaragua (Freije and Rivas, 2002) and summarized in McKenzie and Mookherjee (2003).1 Using household-expenditure survey data and Engel curve theory, the authors econometrically estimate the welfare effects of changes in price and access for 10 expenditure deciles. Results vary widely by country, region, sector, and assumption, but some of the more interesting results follow:2 Did prices rise? Only in half the cases. The biggest rise was 48 percent; the biggest fall, 33 percent. No prices were unchanged. Where prices rose, did the price or access effect dominate? In Bolivia, there were net gains for 9 of the 10 deciles in both electricity and telephone service; all deciles gained from water in La Paz and El Alto, but all lost in Cochabamba, where privatization failed after one year and there were zero access effects. In Nicaragua, half the deciles had a net gain in electricity. Where results varied by decile, who won and who lost? It depends on who already had access and where the expansion margin falls in income distribution. In Nicaraguan electricity, the four richest deciles lost because they already had access, and the poorest decile lost because either its take-up rate was low or service was not extended to where residents live. The winners were the poor, but not the poorest of the poor. In both Bolivian telephone service and electricity, the single losing decile was the richest, because it already had access and had nothing to gain. While these results are preliminary, they at minimum call into question the validity of popular wisdom once access effects are taken into account. This is reinforced by the fact that similar conclusions were reached in the one other set of studies that have looked at both price and access effects (Galal et al., 1994, which is discussed later). Given the small country samples involved, what might similar studies reveal elsewhere? An important factor to consider is that many of the world’s poor, in Sub-Saharan Africa or South Asia, currently have no electricity, telephone service, or clean water service, so access effects could be even more important there.
LABOR State-owned enterprises (SOEs) are typically overstaffed. The best available survey of the impact of privatization on labor (Kikeri, 1998) cites worldwide redundancy rates of 20 to 50 percent and corresponding layoffs of up to 50 percent of the preprivatization labor force (in Argentina). There is high variance, however. In Malaysia, for example, in an effort to disarm labor opposition, the government forced bidders to agree to keep the entire work force for three years, and there were few, if any, firings. How much of the world is like Argentina and
1 For more information on this subject, one may download this paper from
www.bu.edu/econ/ied/dp/papers/dp128.pdf. 2 Mexican results are not included in their current, interim draft.

Development Alternatives, Inc.–Boston Institute for Developing Economies
3
how much like Malaysia? We do not know. Studies for individual companies and countries abound, but no one seems to have assembled statistics for more than a handful. For someone who is laid off, the impact depends on the magnitude of severance payments and the length of time the individual remains unemployed. Here again, experience is all over the map, but no broad survey exists. What is the poverty impact of someone losing his or her job and not finding another? This seems like a silly question, but in Zambia, a study found that despite losses in income, laid-off workers were less likely to be poor than the average for the country (London Economics, 1996). The explanation is that poverty is a function of household income, and SOE workers often come from politically well-connected households that can absorb the loss of one wage without falling into poverty. Finally, one needs to assess the impact not just on the individual, but on the labor market as a whole. Such an assessment reveals good news and bad news. The bad news is that whether or not a particular individual finds a new job, the person who would have otherwise gotten the job is worse off; what matters for distribution purposes is the loss of the job. The good news is that privatized enterprises often grow and create jobs, with a lag. Some workers lose now, others gain later, and the net present value of the latter can outweigh that of the former.
INDIRECT EFFECTS Indirect effects are difficult to measure, and only one study has seriously attempted to do so in this area; therefore, this section is brief. The first indirect effect is fiscal. Data on government sale revenue are widely available, but one must also take into account the decrease in subsidies and increase in taxes. Sheshinski and Lopez-Calva provide considerable data on the magnitude of this effect. One of their studies (1999) that combines all effects finds that the subsidy/tax effects usually exceed the sale effect. Even if these data were available, however, it would be difficult to estimate the distributional impact, which depends on the use to which the fiscal gains are put. If they are used for rural roads, schools, or health-care services, the poor benefit. If they are used to reduce taxes, the poor do not benefit. Some suggest that when sale proceeds are earmarked appropriately (such as Bolivia’s contributing 45 percent to a pension plan), the poor can benefit. If, however, funds are fungible and the pension plan might have been done anyway, then while this might be an excellent public relations ploy, it does not necessarily measure the true economic impact of privatization. A second indirect effect of privatization is the macroeconomic activation effect. How many jobs for the poor are created elsewhere in the economy because electricity is now reliably available without brownouts and blackouts or because some of the gains to government and domestic buyers result in greater investment? A third set of indirect effects involves externalities. Of these, probably the most significant is the health impact of improved access to water. A study in Argentina estimates that privatization of water caused a 5- to 7-percent fall in child mortality rates (Galiani et al., 2002). The one notable attempt to incorporate indirect effects is a computable general equilibrium model for Argentina (Chisary et al., 1997). Of primary interest here is that the model showed that all elements of the income distribution gained.
Deliverable 18: Privatization and the Poor: Issues and Evidence
4
RELATIVE IMPACT Thus far, we have focused on absolute gains and losses by particular groups. Here, we look at the relative impact across groups as revealed in two sets of studies. First, the studies summarized in McKenzie and Mookherjee (2003) calculated the impact of price and access on the Gini coefficient and several other measures of inequality and poverty. Their first conclusion was that with the single exception of Cochabamba, privatization either improved income distribution and reduced poverty or had no significant effect. Their second conclusion was that because of the small budget shares of the goods and services, and because price and access worked in opposite directions, the net effect was quite small. For example, improvements in the Gini were all less than .02. The other set of studies looked at privatization of a sample of 17 firms in Chile, Malaysia, Mexico, and the United Kingdom (Galal et al., 1994) and Côte d’Ivoire (Jones et al., 1999). It first used traditional Harbergarian benefit–cost analysis to estimate the net gains of the difference between a constructed counterfactual (what would have happened without privatization) and what actually happened. An extension of the methodology then permitted decomposition of the total into net benefits accruing to consumers, workers, competitors, the government, and the new domestic owners and foreign owners. Key results were as follows: Consumers were made worse off in 5 cases and better off or neutral in 12 cases. Three of
the negative cases were in Mexico and resulted from moving to something like international efficiency pricing from highly subsidized prices.
Labor in no case lost as a class: workers who lost their jobs were worse off, but this was
more than compensated for by the gains to the remainder through some combination of higher wages, eventually increased employment, and appreciating share values.
The government gained in 14 cases, with the 3 cases of losses being small. In general, the
biggest source of such gains was not from the initial sale price itself, but from increased tax revenues from (and reduced subsidies to) the newly profitable firms. In several cases, revenue from deferred tranches also exceeded that from the initial sale.
Domestic buyers did well, suffering net losses in only a single case.
Foreign buyers also did well, gaining in all cases where they existed.
How big were the gains and losses of each group? There is high variance, but as
measured (badly) by a simple average of the percentage gains, the biggest winners were the government and domestic buyers (about 20 percent lower than the government).3 Worker and consumer gains were much smaller (at 20 or 30 percent of the government’s). Finally, 80 percent of the benefits went to domestic groups and 20 percent to foreigners.
3 Some unknown share of the new owners’ gains often goes to corrupt officials, but both businessmen and
bureaucrats are at the top of the income distribution, so this makes no difference for our present purposes.
Development Alternatives, Inc.–Boston Institute for Developing Economies
5
If these results are seen as broadly positive, what explains them? There is a clear sample bias. The authors’ methodology required access to detailed financial accounts of the firms involved for at least three years before and after privatization, plus extensive and intrusive interviewing to develop a believable counterfactual. Governments and companies cooperated only when they thought they had a very good tale to tell. So, the results can by no means be generalized to other cases. The results only say that, done well, privatization need not have a significantly deleterious distributional impact. A contrary example is electricity in Britain, where Newbery and Pollitt (1997) found small gains for consumers and government and large gains for owners.
IMPLICATIONS This review suggests that popular opinions on the negative distributional impact of privatization are not broadly supported by the available empirical literature. However, the literature is sparse and spotty enough that very–well-informed observers can take the opposite view. Birdsall and Nellis (2002) know as much about privatization as anyone and “conclude that most privatization programs appear to have worsened the distribution of assets and income, at least in the short run.”4 This review, then, has three implications. First, we need to know considerably more. Second, we might need to do a better job of informing the public of what actually happened. Third, we need to help future privatizations apply best-practice techniques to enhance equity without sacrificing efficiency. A good deal is already known in this area, as illustrated by the following. To benefit poor consumers, one must focus on access effects by requiring bidders to commit to extending service at some specified rate. Also, carefully targeted lifeline pricing schemes are needed to subsidize poor consumers. Both cases will yield a price in terms of government gains, but that will be a transfer and may often be worthwhile. To benefit poor workers, privatizers should consider banning layoffs of at least unskilled workers for three years, but with a clear provision that work rules can be reformed so efficiency gains will not be imperiled. Again, there will be a price in terms of government sale revenue, but where labor redundancy is not egregious (say, less than 20 percent), the price will often be small, because redundancies will be eliminated through natural attrition and the labor demands of an expanding enterprise. Finally, privatizers should enhance government returns by retaining some shares (in nonvoting shares, so as not to reduce efficiency gains) and earmark the proceeds for projects to help the poor.
4 The difference is in part due to the authors’ inclusion of the transition economies. To assess their evidence, go
to www.cgdev.org/wp/cgd_wp006.pdf.

Deliverable 18: Privatization and the Poor: Issues and Evidence
6
BIBLIOGRAPHY Barja, Gopver, David McKenzie, and Miguel Urquiola. 2002. “Capitalization and Privatization in Bolivia.” Ithaca, N.Y.: Cornell University. Birdsall, Nancy, and John Nellis. 2002. “Winners and Losers: Assessing the Distributional Impact of Privatization.” Working Paper Number 6, May 2002. Washington, D.C.: Center for Global Development. Chisary, Umar, Antonio Estache, and Carlos Romero. 1997. “Winners and Losers from Utility Privatization in Argentina: Lessons from a General Equilibrium Model.” Washington, D.C.: The World Bank, Economic Development Institute. Ennis, Huberto, and Santiago Pinto. 2002. “Privatization and Income Distribution in Argentina.” Morgantown, W.Va.: West Virginia University. Freije, Samuel, and Luis Rivas. 2002. “Privatization, Inequality and Welfare: Evidence from Nicaragua.” Caracas, Venezuela: Centro Desarrollo Humano y Organizaciones, Instituto de Estudios Superiores de Administración Venezuela (IESA). Galal, Ahmed, Leroy Jones, Pankaj Tandon, and Ingo Vogelsang. 1994. Welfare Consequences of Selling Public Enterprises: An Empirical Analysis. New York: Oxford University Press. Galiani, Sebastian, Paul Bertler, and Ernesto Schargrodsky. 2002. “Water for Life: The Impact of the Privatization of Water Services on Child Mortality.” Buenos Aires, Argentina: Universidad Torcuato Di Tella. Jones, Leroy, Yahya Jammal, and Nilgun Gokgur. 1999. Impact of Privatization in Cote d’Ivoire. Washington, D.C.: Boston Institute for Developing Economies, for the World Bank. Kikeri, Sunita. 1998. “Privatization and Labor: What Happens to Workers When Governments Divest.” Technical Paper 396, February 1998. Washington, D.C.: The World Bank. London Economics. 1996. The Impact of Privatization on Labour in Africa. Report for the World Bank. London: London Economics. Lopez-Calva, Luis Felipe, and Juan Rosellon. 2002. “Privatization and Inequality: The Mexican Case.” Puebla, Mexico: Universidad de las Americas. McKenzie, David, and Dilip Mookherjee. 2003. “The Distributive Impact of Privatization in Latin America: Evidence from Four Countries.” Discussion Paper 128. Boston: Boston University, Institute for Economic Development.

Development Alternatives, Inc.–Boston Institute for Developing Economies
7
Megginson, William L., and Jeffry M. Netter. 2001. “From State to Market: A Survey of Empirical Studies on Privatization.” Journal of Economic Literature, June 2001, pp. 321–389. Newbery, David, and Michael Pollitt. 1997. “The Restructuring and Privatization of the CEGB—Was It Worth It?” Journal of Industrial Economics 45(3):239–303. Sheshinski, Eytan, and Luis Felipe Lopez-Calva. 1999. “Privatization and Its Benefits: Theory and Evidence.” Discussion Paper 35, January 1999. Cambridge, Mass.: Harvard Institute for Economic Development.
The goal of the USAID-funded Pro-Poor Economic Growth Research Studies and Guidance Manual Activity is to identify and
disseminate policies, reforms, and activities that USAID decision makers can incorporate into their programs and that they can
recommend to countries wishing to pursue strongly pro-poor, poverty-reducing, economic growth objectives.
The fi ndings, interpretations, and conclusions expressed in this paper are entirely those of the author. They do not necessarily
represent the views of USAID.
Development Alternatives, Inc.7250 Woodmont Avenue, Suite 200Bethesda, Maryland 20814 USA
301-718-8699 [email protected] www.dai.com
BIDEBoston Institute for Developing Economies, Ltd.4833 West Lane, Suite 100Bethesda, Maryland 20814
301-652-9740 [email protected] www.bide.com
U.S. Agency for International DevelopmentBureau for Economic Growth, Agriculture, and Trade1300 Pennsylvania Avenue, N.W.Washington, D.C. 20523
www.usaid.gov