Prevalence and risk factors of childhood anemia in Nepal
18
RESEARCH ARTICLE Prevalence and risk factors of childhood anemia in Nepal: A multilevel analysis Mohammad Rocky Khan Chowdhury ID 1 *, Md. Mobarak Hossain Khan 2 , Hafiz T. A. KhanID 3 , Md. Shafiur RahmanID 4 , Md Rashedul Islam 5 , Md Moinul Islam 6 , Baki Billah 7 1 Department of Public Health, First Capital University of Bangladesh, Chuadanga, Bangladesh, 2 Department of Social Relation, East West University, Dhaka, Bangladesh, 3 College of Nursing, Midwifery and Healthcare, University of West London, London, United Kingdom, 4 Research Center for Child Mental Development, Hamamatsu University School of Medicine, Japan, 5 Department of Global Health Policy, Graduate School of Medicine, University of Tokyo, Tokyo, Japan, 6 School of Business, Middlesex University, London, United Kingdom, 7 Department of Epidemiology and Preventive Medicine, School of Public Health and Preventive Medicine, Monash University, Melbourne, Australia * [email protected] Abstract Introduction Anemia is a common problem in children particularly in developing countries and taking steps to tackle it is one of the major public health challenges for Nepal. The objective of this study is to investigate the prevalence of individual, household and community level determi- nants of childhood anemia in Nepal. Methods Data was taken from a nationally representative sample of 1,942 Nepalese children aged from 6–59 months. The Chi-square test was used to determine the bivariate relationship between the selected variables and childhood anemia and a multilevel logistic regression model with a random intercept at household and community level was used to identify important determinants of this kind of anemia. Results The results showed that 52.6% (95% CI: 49.8%-55.4%) of the children were anemic while 26.6% (95% CI: 24.0%-29.3%) of them were moderate to severe. The prevalence of overall anemia was higher among children aged less than 11 months as well as in underweight chil- dren, children of underweight, anemic and uneducated mothers and those in the terrain eco- logical regions. Multivariable analysis showed that children aged less than 11 months, who were underweight and had anemic mothers were more likely to have moderate or severe anemia. Children in the hilly ecological region were less likely to have it compared to moun- tain and terrain ecological regions. Children in middle-class families and children of mothers who completed secondary education were more likely to have anemia. PLOS ONE PLOS ONE | https://doi.org/10.1371/journal.pone.0239409 October 6, 2020 1 / 18 a1111111111 a1111111111 a1111111111 a1111111111 a1111111111 OPEN ACCESS Citation: Chowdhury MRK, Khan M.MH, Khan HTA, Rahman M.S, Islam MR, Islam MM, et al. (2020) Prevalence and risk factors of childhood anemia in Nepal: A multilevel analysis. PLoS ONE 15(10): e0239409. https://doi.org/10.1371/journal. pone.0239409 Editor: Russell Kabir, Anglia Ruskin University, UNITED KINGDOM Received: July 1, 2020 Accepted: September 5, 2020 Published: October 6, 2020 Copyright: © 2020 Chowdhury et al. This is an open access article distributed under the terms of the Creative Commons Attribution License, which permits unrestricted use, distribution, and reproduction in any medium, provided the original author and source are credited. Data Availability Statement: The data underlying the results presented in the study are publicly accessible and available on the The Demographic and Health Surveys program website (https:// dhsprogram.com/data/available-datasets.cfm). The title of the dataset is Nepal Demographic and Health Survey (NDHS) 2016. Funding: The authors received no specific funding for this work. Competing interests: The authors have declared that no competing interests exist.
-
Upload
khangminh22 -
Category
Documents
-
view
1 -
download
0
Transcript of Prevalence and risk factors of childhood anemia in Nepal
RESEARCH ARTICLE
Prevalence and risk factors of childhood
anemia in Nepal: A multilevel analysis
Mohammad Rocky Khan ChowdhuryID1*, Md. Mobarak Hossain Khan2, Hafiz T.
A. KhanID3, Md. Shafiur RahmanID
4, Md Rashedul Islam5, Md Moinul Islam6, Baki Billah7
1 Department of Public Health, First Capital University of Bangladesh, Chuadanga, Bangladesh,
2 Department of Social Relation, East West University, Dhaka, Bangladesh, 3 College of Nursing, Midwifery
and Healthcare, University of West London, London, United Kingdom, 4 Research Center for Child Mental
Development, Hamamatsu University School of Medicine, Japan, 5 Department of Global Health Policy,
Graduate School of Medicine, University of Tokyo, Tokyo, Japan, 6 School of Business, Middlesex
University, London, United Kingdom, 7 Department of Epidemiology and Preventive Medicine, School of
Public Health and Preventive Medicine, Monash University, Melbourne, Australia
Abstract
Introduction
Anemia is a common problem in children particularly in developing countries and taking
steps to tackle it is one of the major public health challenges for Nepal. The objective of this
study is to investigate the prevalence of individual, household and community level determi-
nants of childhood anemia in Nepal.
Methods
Data was taken from a nationally representative sample of 1,942 Nepalese children aged
from 6–59 months. The Chi-square test was used to determine the bivariate relationship
between the selected variables and childhood anemia and a multilevel logistic regression
model with a random intercept at household and community level was used to identify
important determinants of this kind of anemia.
Results
The results showed that 52.6% (95% CI: 49.8%-55.4%) of the children were anemic while
26.6% (95% CI: 24.0%-29.3%) of them were moderate to severe. The prevalence of overall
anemia was higher among children aged less than 11 months as well as in underweight chil-
dren, children of underweight, anemic and uneducated mothers and those in the terrain eco-
logical regions. Multivariable analysis showed that children aged less than 11 months, who
were underweight and had anemic mothers were more likely to have moderate or severe
anemia. Children in the hilly ecological region were less likely to have it compared to moun-
tain and terrain ecological regions. Children in middle-class families and children of mothers
who completed secondary education were more likely to have anemia.
PLOS ONE
PLOS ONE | https://doi.org/10.1371/journal.pone.0239409 October 6, 2020 1 / 18
a1111111111
a1111111111
a1111111111
a1111111111
a1111111111
OPEN ACCESS
Citation: Chowdhury MRK, Khan M.MH, Khan
HTA, Rahman M.S, Islam MR, Islam MM, et al.
(2020) Prevalence and risk factors of childhood
anemia in Nepal: A multilevel analysis. PLoS ONE
15(10): e0239409. https://doi.org/10.1371/journal.
pone.0239409
Editor: Russell Kabir, Anglia Ruskin University,
UNITED KINGDOM
Received: July 1, 2020
Accepted: September 5, 2020
Published: October 6, 2020
Copyright: © 2020 Chowdhury et al. This is an
open access article distributed under the terms of
the Creative Commons Attribution License, which
permits unrestricted use, distribution, and
reproduction in any medium, provided the original
author and source are credited.
Data Availability Statement: The data underlying
the results presented in the study are publicly
accessible and available on the The Demographic
and Health Surveys program website (https://
dhsprogram.com/data/available-datasets.cfm). The
title of the dataset is Nepal Demographic and
Health Survey (NDHS) 2016.
Funding: The authors received no specific funding
for this work.
Competing interests: The authors have declared
that no competing interests exist.

Conclusion
Nepal is facing a serious public health problem due to the high prevalence of childhood ane-
mia. This adverse situation occurs due to socio-demographic and geographical factors such
as age, malnutrition status, mother’s anemia status, socio-economic status and regional
variations. Prevention of childhood anemia should be given top priority in Nepal and should
be considered as a major public health intervention.
Introduction
Childhood anemia is a major nutritional problem throughout low- and middle-income countries,
particularly those in Africa and Asia where it comprises around 45% of cases [1]. In 2016, the esti-
mated prevalence was approximately 55% in South Asia and 60% in Sub-Saharan Africa [1]. The
World Health Organization (WHO) has estimated that globally, over 293 million children under
five are anemic, with a prevalence of around 47.4% [2]. All forms of anemia, particularly a severe
form of it, may cause permanent cognitive damage and impaired psychomotor development in
children by decreasing attention span and shortening memory [3]. Iron deficiency anemia
accounts for around 60% of all cases of anemia and is also associated with many psychosocial and
economic disadvantages that can affect child development [4, 5]. Also, children in younger age
groups with severe anemia, caused by malaria and iron deficiency, are at an increased risk of mor-
tality [6, 7]. In 2010, roughly 0.12 million preventable deaths of women and children occurred
due to iron deficiency anemia [5]. Anemia should therefore be viewed as a serious public health
problem in Nepal with a higher prevalence found among preschool children [8].
Considerable public health achievements have been made in Nepal for reducing maternal
and child mortality, but anemia prevention remains a significant challenge [9]. Iron deficiency
anemia is one of the common types of malnutrition in the country comprising over 48% of
anemic children [2] and is one of the leading causes of childhood morbidity and death [10].
A number of studies on childhood anemia conducted in Nepal looked into the significance
of socio-demographic, anthropometric and geographical factors. However, well-documented
research on the impact of these risk factors is still scarce [11–13]. Existing studies were unable
to draw out the relationships between multilevel factors and childhood anemia due to, for
example, involving a limited number of variables and inadequate use of statistical methods
[11–13]. Several studies used fixed-effect models, such as binary logistic regression, Poisson
models to identify the determinants of anemia but none of them addressed variations at indi-
vidual, household and community levels for identifying further determinants of moderate to
severe childhood anemia [5, 14]. Therefore, the aim of this study was to estimate the preva-
lence of childhood anemia in Nepal including its determinants with multilevel variations. An
understanding of these determinants through a comprehensive study of all the factors would
greatly assist in the formulation of policy on this issue in Nepal.
Materials and methods
Data
Data was extracted from the 2016 Nepal Demographic Health Survey (NDHS), a nationally
representative cross-sectional study conducted from June 2016 to January 2017. This survey
was carried out under the aegis of the Ministry of Health and by a Nepali research organization
called ‘New ERA’ and had nearly 100 per cent response rate. Technical support was provided
PLOS ONE Risk factors of childhood anemia in Nepal
PLOS ONE | https://doi.org/10.1371/journal.pone.0239409 October 6, 2020 2 / 18
by ICF International of Calverton, Maryland, USA and financial support was given by the
United States Agency for International Development (USAID). The sample for the 2016
NDHS was drawn from Nepali adults residing in non-institutional dwellings by use of an
updated version of a sampling frame that was originally designed for the 2011 National Popu-
lation and Housing Census (NPHC). There are seven administrative provinces in Nepal with
sub-divisions of urban and rural areas that are in turn divided into wards. In rural areas, the
wards are small in size each with an average of 104 households, whereas in urban areas each
ward has an average of 800 households. The 2016 NDHS samples were selected in two stages
in rural areas and in three stages in urban areas. In rural areas, wards were selected as primary
sampling units (PSUs) to help select households and in urban areas, one Enumeration Area
(EA) was selected form each PSU drawn from a ward, and then households were selected from
the sample EAs. The PSUs and EAs were selected using probability proportionate to ward size.
In the first stage, a total of 383 wards were selected and in the second stage, one EA was ran-
domly selected from each urban ward. Households were then identified from the selected sam-
pling clusters (either rural wards or urban EAs) and each of those that comprised more than
200 households was selected with probability proportional to segment size. In the final stage, a
fixed number of 30 households was selected from each cluster with an equal probability sys-
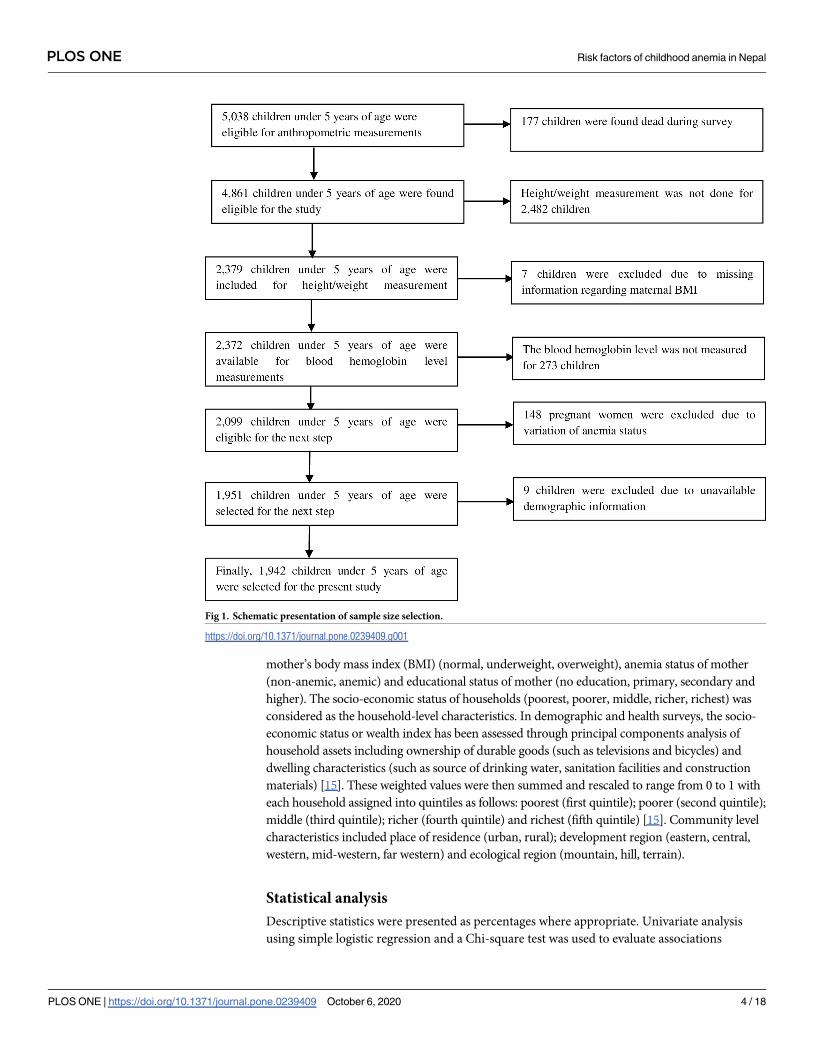
tematic selection. The 2016 NDHS survey identified 5,038 children of which 1,942 aged from
6–59 months were selected for this study (Fig 1 below). This survey was conducted to collect
social and-demographic data, health and nutritional data to monitor a wide range of the popu-
lation. Details of the sampling technique, selection of households, questionnaire and its valida-
tion procedure were published elsewhere [15].
Measuring anemia, outcome variables and independent variables
In the 2016 NDHS, six questionnaires were used involving a household questionnaire, wom-
an’s questionnaire, man’s questionnaire, biomarker questionnaire, fieldworker questionnaire,
and verbal autopsy questionnaire. All men aged 15–49 years of age living in every second
household were interviewed with a biomarker questionnaire only used in the subsample of
households selected for the man’s questionnaire. The biomarker questionnaire was used to
record anthropometry measurements, hemoglobin testing, and blood pressure measurement.
In these households, women aged 15–49 years and children aged 6–59 months were consid-
ered eligible for testing for anemia. Blood specimens for hemoglobin testing were gathered
with consent from women and children that involved taking a drop of blood from a finger
prick (or a heel prick in the case of children aged 6–11 months) and collected in a microcuv-
ette. Analysis was carried out on-site using a battery-operated portable HemoCue analyzer
that could measure the concentration of hemoglobin in the blood. The Nepal Health Research
Council and the ICF Macro Institutional Review Board in Calverton, Maryland, USA
approved the protocol for the hemoglobin testing [15].
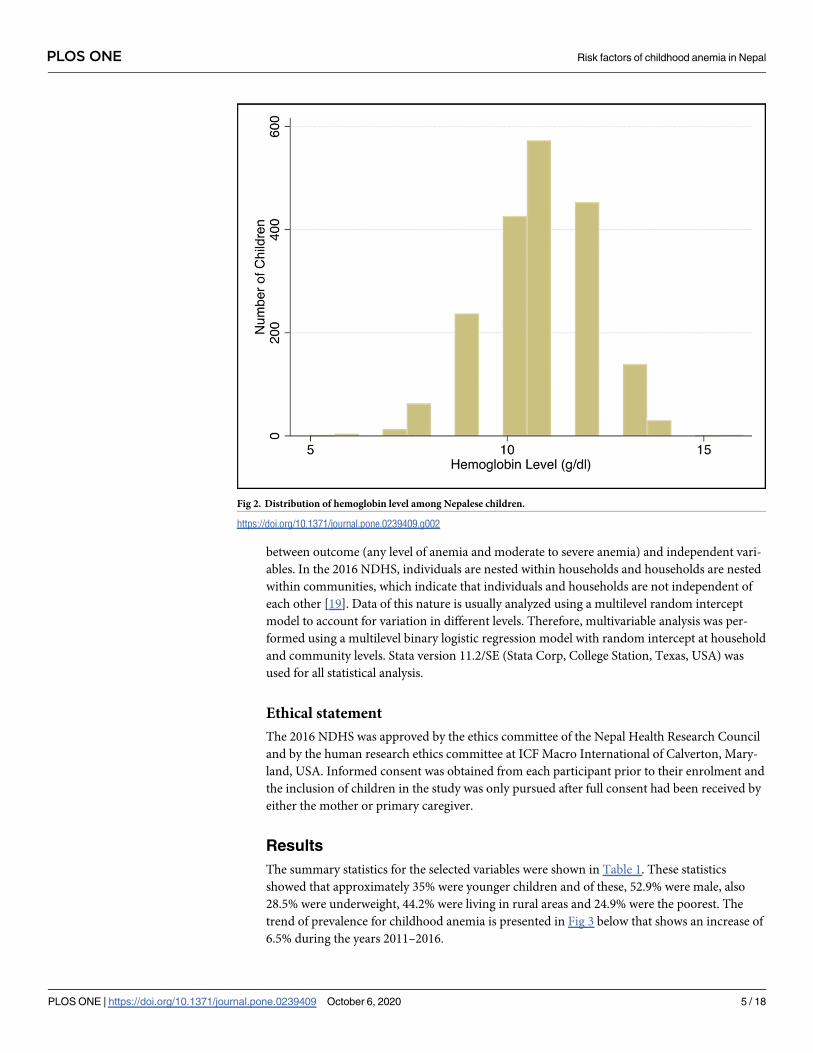
The distribution of hemoglobin levels (gm/dl) is presented in Fig 2 below. A child was con-
sidered to be anemic when the estimated hemoglobin level was <11.0 gm/dl. Children were
classified as severely (<7.0 gm/dl), moderately (7.0–9.9 gm/dl), and mildly (10.0–10.9 gm/dl)
anemic while mothers were classified as anemic (<12.0 gm/dl) according to guidelines pro-
vided by the WHO [16].
Socio-demographic, anthropometric and geographical variables of the study were selected
based on previously reported studies [5, 14, 17, 18]. Covariates were classified into three charac-
teristic levels: individual, household and community. Individual-level characteristics were child’s
age (<11 months, 12–23 months, 24–35 months, 36–47 months, 47–59 months), sex of child
(boys, girls), birth order (first, second, third and above), and underweight children (no, yes),
PLOS ONE Risk factors of childhood anemia in Nepal
PLOS ONE | https://doi.org/10.1371/journal.pone.0239409 October 6, 2020 3 / 18
mother’s body mass index (BMI) (normal, underweight, overweight), anemia status of mother
(non-anemic, anemic) and educational status of mother (no education, primary, secondary and
higher). The socio-economic status of households (poorest, poorer, middle, richer, richest) was
considered as the household-level characteristics. In demographic and health surveys, the socio-
economic status or wealth index has been assessed through principal components analysis of
household assets including ownership of durable goods (such as televisions and bicycles) and
dwelling characteristics (such as source of drinking water, sanitation facilities and construction
materials) [15]. These weighted values were then summed and rescaled to range from 0 to 1 with
each household assigned into quintiles as follows: poorest (first quintile); poorer (second quintile);
middle (third quintile); richer (fourth quintile) and richest (fifth quintile) [15]. Community level
characteristics included place of residence (urban, rural); development region (eastern, central,
western, mid-western, far western) and ecological region (mountain, hill, terrain).
Statistical analysis
Descriptive statistics were presented as percentages where appropriate. Univariate analysis
using simple logistic regression and a Chi-square test was used to evaluate associations
Fig 1. Schematic presentation of sample size selection.
https://doi.org/10.1371/journal.pone.0239409.g001
PLOS ONE Risk factors of childhood anemia in Nepal
PLOS ONE | https://doi.org/10.1371/journal.pone.0239409 October 6, 2020 4 / 18
between outcome (any level of anemia and moderate to severe anemia) and independent vari-
ables. In the 2016 NDHS, individuals are nested within households and households are nested
within communities, which indicate that individuals and households are not independent of
each other [19]. Data of this nature is usually analyzed using a multilevel random intercept
model to account for variation in different levels. Therefore, multivariable analysis was per-
formed using a multilevel binary logistic regression model with random intercept at household
and community levels. Stata version 11.2/SE (Stata Corp, College Station, Texas, USA) was
used for all statistical analysis.
Ethical statement
The 2016 NDHS was approved by the ethics committee of the Nepal Health Research Council
and by the human research ethics committee at ICF Macro International of Calverton, Mary-
land, USA. Informed consent was obtained from each participant prior to their enrolment and
the inclusion of children in the study was only pursued after full consent had been received by
either the mother or primary caregiver.
Results
The summary statistics for the selected variables were shown in Table 1. These statistics
showed that approximately 35% were younger children and of these, 52.9% were male, also
28.5% were underweight, 44.2% were living in rural areas and 24.9% were the poorest. The
trend of prevalence for childhood anemia is presented in Fig 3 below that shows an increase of
6.5% during the years 2011–2016.
Fig 2. Distribution of hemoglobin level among Nepalese children.
https://doi.org/10.1371/journal.pone.0239409.g002
PLOS ONE Risk factors of childhood anemia in Nepal
PLOS ONE | https://doi.org/10.1371/journal.pone.0239409 October 6, 2020 5 / 18
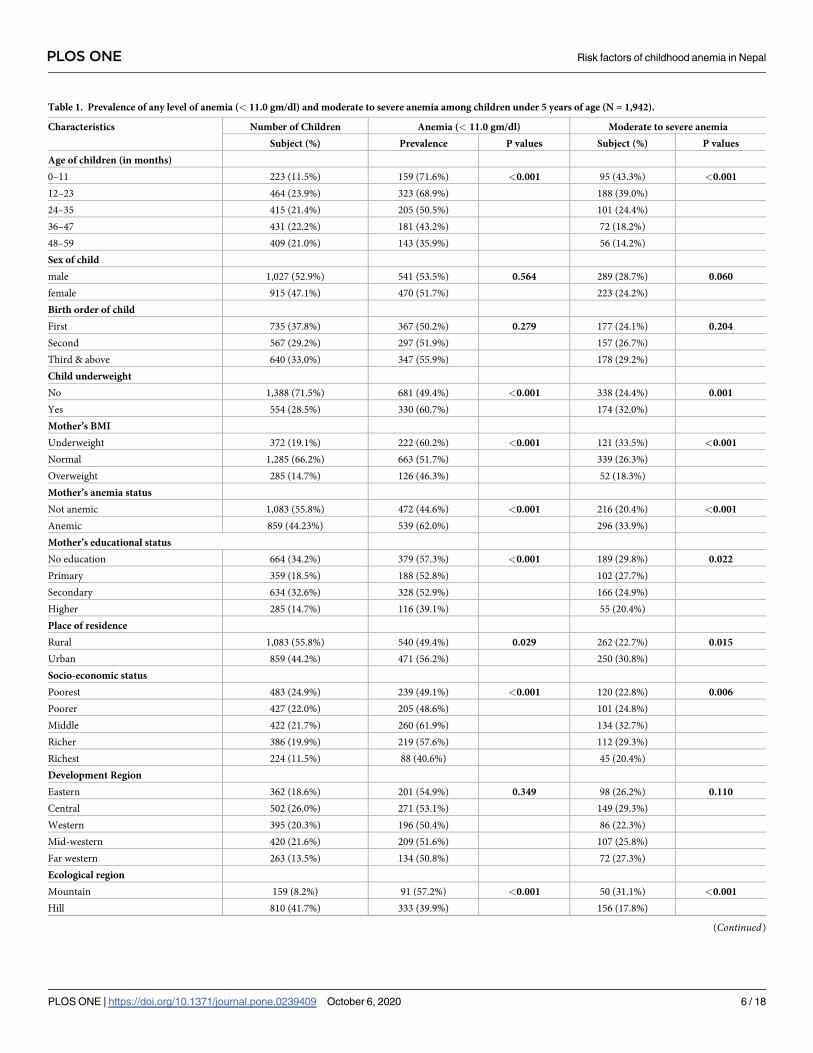
Table 1. Prevalence of any level of anemia (< 11.0 gm/dl) and moderate to severe anemia among children under 5 years of age (N = 1,942).
Characteristics Number of Children Anemia (< 11.0 gm/dl) Moderate to severe anemia
Subject (%) Prevalence P values Subject (%) P values
Age of children (in months)
0–11 223 (11.5%) 159 (71.6%) <0.001 95 (43.3%) <0.001
12–23 464 (23.9%) 323 (68.9%) 188 (39.0%)
24–35 415 (21.4%) 205 (50.5%) 101 (24.4%)
36–47 431 (22.2%) 181 (43.2%) 72 (18.2%)
48–59 409 (21.0%) 143 (35.9%) 56 (14.2%)
Sex of child
male 1,027 (52.9%) 541 (53.5%) 0.564 289 (28.7%) 0.060
female 915 (47.1%) 470 (51.7%) 223 (24.2%)
Birth order of child
First 735 (37.8%) 367 (50.2%) 0.279 177 (24.1%) 0.204
Second 567 (29.2%) 297 (51.9%) 157 (26.7%)
Third & above 640 (33.0%) 347 (55.9%) 178 (29.2%)
Child underweight
No 1,388 (71.5%) 681 (49.4%) <0.001 338 (24.4%) 0.001
Yes 554 (28.5%) 330 (60.7%) 174 (32.0%)
Mother’s BMI
Underweight 372 (19.1%) 222 (60.2%) <0.001 121 (33.5%) <0.001
Normal 1,285 (66.2%) 663 (51.7%) 339 (26.3%)
Overweight 285 (14.7%) 126 (46.3%) 52 (18.3%)
Mother’s anemia status
Not anemic 1,083 (55.8%) 472 (44.6%) <0.001 216 (20.4%) <0.001
Anemic 859 (44.23%) 539 (62.0%) 296 (33.9%)
Mother’s educational status
No education 664 (34.2%) 379 (57.3%) <0.001 189 (29.8%) 0.022
Primary 359 (18.5%) 188 (52.8%) 102 (27.7%)
Secondary 634 (32.6%) 328 (52.9%) 166 (24.9%)
Higher 285 (14.7%) 116 (39.1%) 55 (20.4%)
Place of residence
Rural 1,083 (55.8%) 540 (49.4%) 0.029 262 (22.7%) 0.015
Urban 859 (44.2%) 471 (56.2%) 250 (30.8%)
Socio-economic status
Poorest 483 (24.9%) 239 (49.1%) <0.001 120 (22.8%) 0.006
Poorer 427 (22.0%) 205 (48.6%) 101 (24.8%)
Middle 422 (21.7%) 260 (61.9%) 134 (32.7%)
Richer 386 (19.9%) 219 (57.6%) 112 (29.3%)
Richest 224 (11.5%) 88 (40.6%) 45 (20.4%)
Development Region
Eastern 362 (18.6%) 201 (54.9%) 0.349 98 (26.2%) 0.110
Central 502 (26.0%) 271 (53.1%) 149 (29.3%)
Western 395 (20.3%) 196 (50.4%) 86 (22.3%)
Mid-western 420 (21.6%) 209 (51.6%) 107 (25.8%)
Far western 263 (13.5%) 134 (50.8%) 72 (27.3%)
Ecological region
Mountain 159 (8.2%) 91 (57.2%) <0.001 50 (31.1%) <0.001
Hill 810 (41.7%) 333 (39.9%) 156 (17.8%)
(Continued)
PLOS ONE Risk factors of childhood anemia in Nepal
PLOS ONE | https://doi.org/10.1371/journal.pone.0239409 October 6, 2020 6 / 18

Prevalence of any anemia and moderate to severe anemia
Table 1 showed that the prevalence of both any level of anemia (<11.0 gm/dl) and moderate to
severe anemia were significantly higher among children aged less than 11 months (71.6% were
anemic and 43.3% were moderate to severe anemic) and children of uneducated mothers
(57.3% were anemic and 29.8% were moderate to severe anemic). The prevalence of anemia in
both cases (e.g., any level of anemia and moderate to severe anemia) was also higher among
underweight children (60.7% were anemic and 32% were moderate to severe anemic), children
of underweight mothers (60.2% were anemic and 33.5% were moderate to severe anemic) and
children of anemic mothers (62% were anemic and 33.9% were moderate to severe anemic).
The prevalence of anemia, however, was higher among children from middle class families
(61.9% were anemic and 32.7% were moderate to severe anemic) and also higher among chil-
dren in terrain ecological regions (60.6% were anemic and 32% were moderate to severe ane-
mic). Regional variations in prevalence are presented in Figs 4 and 5 below.
Table 1. (Continued)
Characteristics Number of Children Anemia (< 11.0 gm/dl) Moderate to severe anemia
Subject (%) Prevalence P values Subject (%) P values
Terrain 973 (50.1%) 587 (60.6%) 306 (32.0%)
Overall 1,942 (100.0%) 1011 (52.6%) 512 (26.6%)
Significant at 5% level
https://doi.org/10.1371/journal.pone.0239409.t001
Fig 3. Trend of prevalence for childhood anemia from 2006 to 2016 in Nepal.
https://doi.org/10.1371/journal.pone.0239409.g003
PLOS ONE Risk factors of childhood anemia in Nepal
PLOS ONE | https://doi.org/10.1371/journal.pone.0239409 October 6, 2020 7 / 18
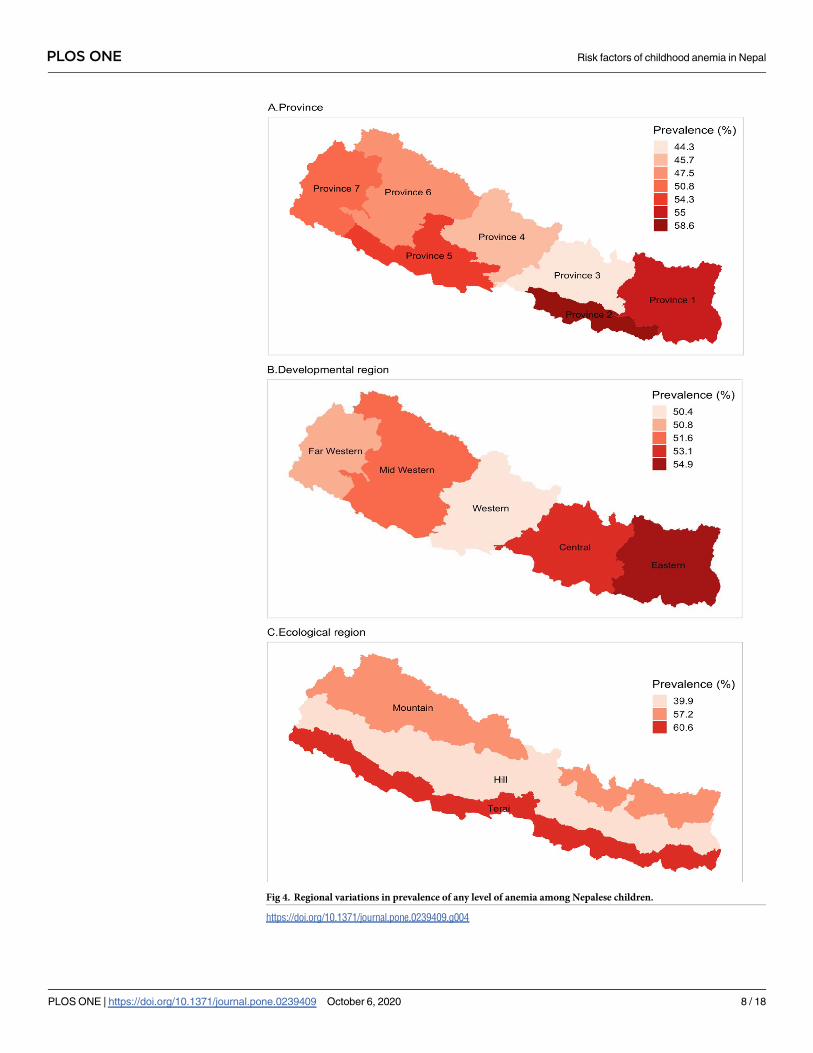
Fig 4. Regional variations in prevalence of any level of anemia among Nepalese children.
https://doi.org/10.1371/journal.pone.0239409.g004
PLOS ONE Risk factors of childhood anemia in Nepal
PLOS ONE | https://doi.org/10.1371/journal.pone.0239409 October 6, 2020 8 / 18
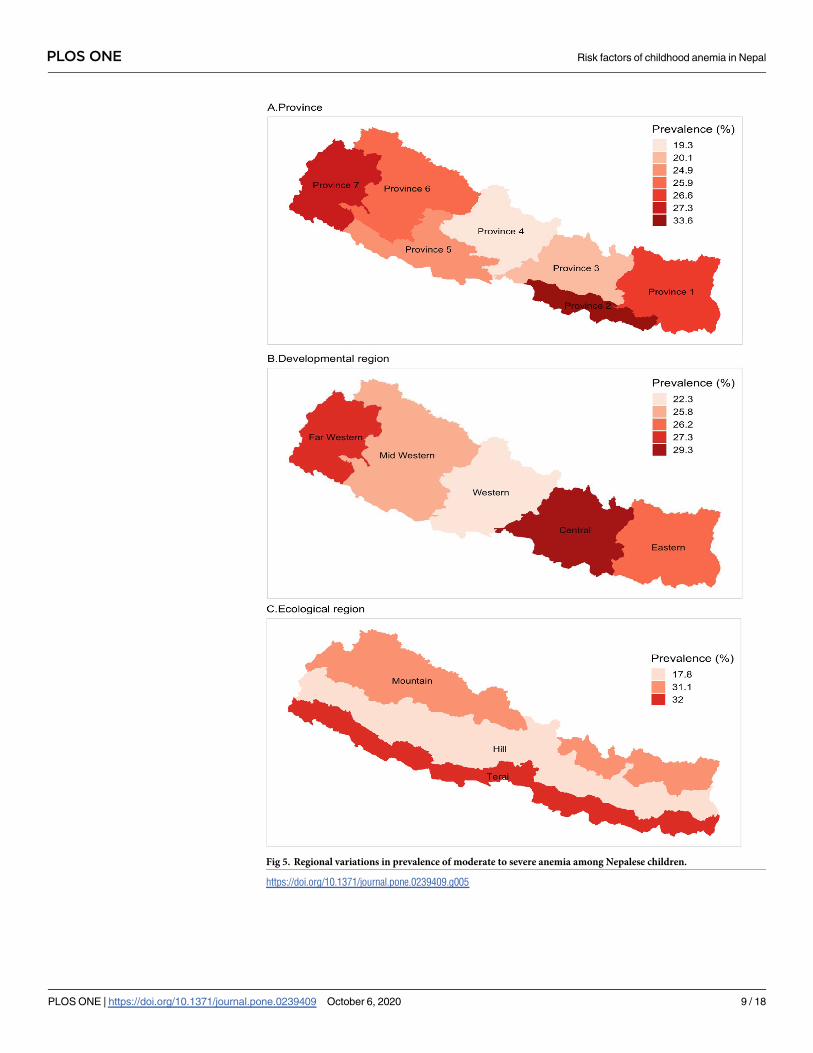
Fig 5. Regional variations in prevalence of moderate to severe anemia among Nepalese children.
https://doi.org/10.1371/journal.pone.0239409.g005
PLOS ONE Risk factors of childhood anemia in Nepal
PLOS ONE | https://doi.org/10.1371/journal.pone.0239409 October 6, 2020 9 / 18
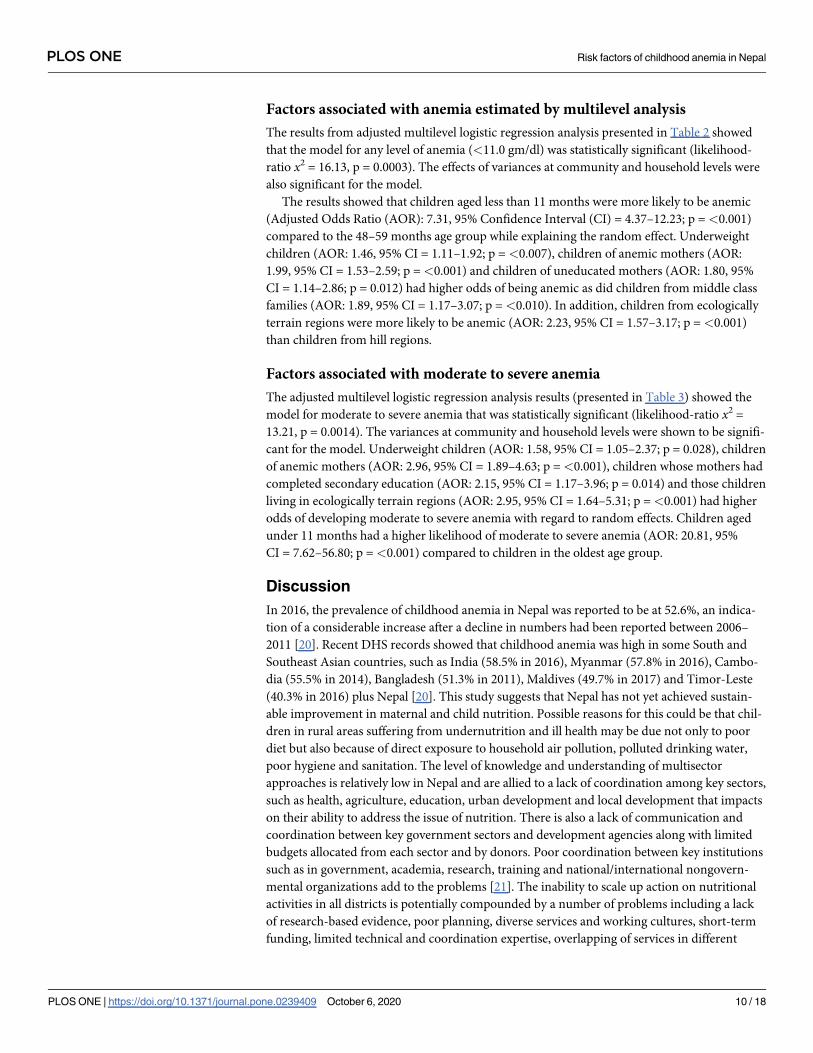
Factors associated with anemia estimated by multilevel analysis
The results from adjusted multilevel logistic regression analysis presented in Table 2 showed
that the model for any level of anemia (<11.0 gm/dl) was statistically significant (likelihood-
ratio x2 = 16.13, p = 0.0003). The effects of variances at community and household levels were
also significant for the model.
The results showed that children aged less than 11 months were more likely to be anemic
(Adjusted Odds Ratio (AOR): 7.31, 95% Confidence Interval (CI) = 4.37–12.23; p =<0.001)
compared to the 48–59 months age group while explaining the random effect. Underweight
children (AOR: 1.46, 95% CI = 1.11–1.92; p =<0.007), children of anemic mothers (AOR:
1.99, 95% CI = 1.53–2.59; p =<0.001) and children of uneducated mothers (AOR: 1.80, 95%
CI = 1.14–2.86; p = 0.012) had higher odds of being anemic as did children from middle class
families (AOR: 1.89, 95% CI = 1.17–3.07; p =<0.010). In addition, children from ecologically
terrain regions were more likely to be anemic (AOR: 2.23, 95% CI = 1.57–3.17; p =<0.001)
than children from hill regions.
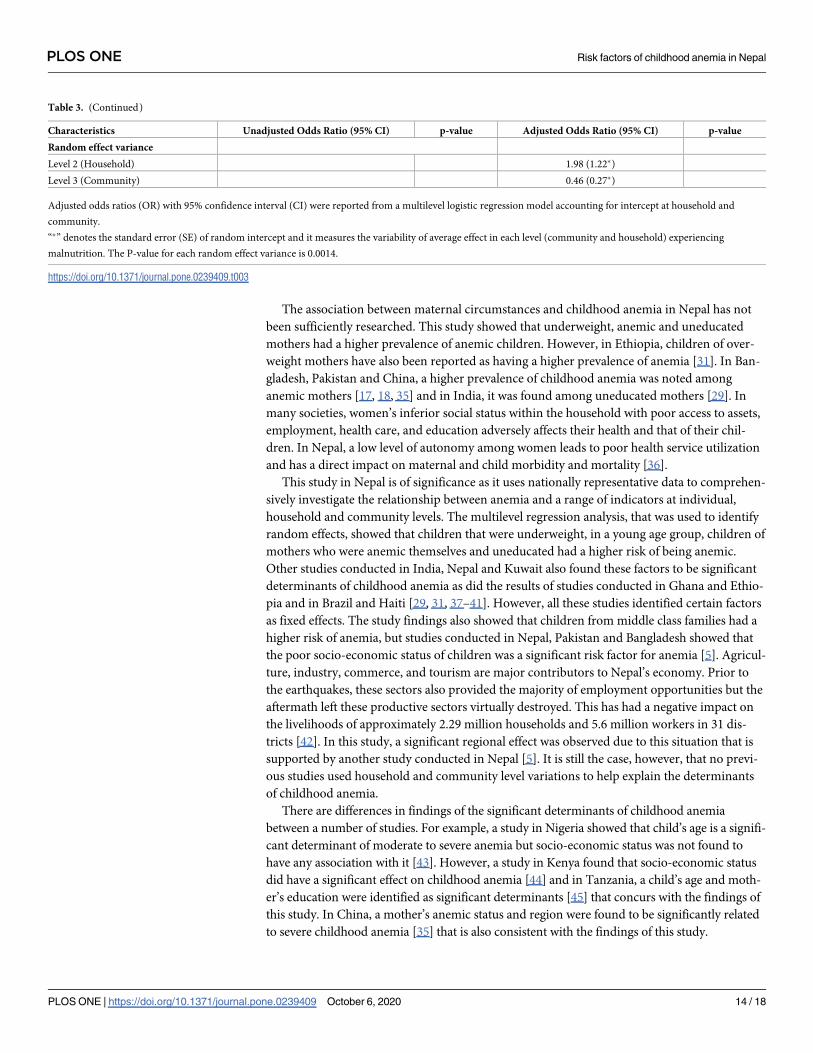
Factors associated with moderate to severe anemia
The adjusted multilevel logistic regression analysis results (presented in Table 3) showed the
model for moderate to severe anemia that was statistically significant (likelihood-ratio x2 =
13.21, p = 0.0014). The variances at community and household levels were shown to be signifi-
cant for the model. Underweight children (AOR: 1.58, 95% CI = 1.05–2.37; p = 0.028), children
of anemic mothers (AOR: 2.96, 95% CI = 1.89–4.63; p =<0.001), children whose mothers had
completed secondary education (AOR: 2.15, 95% CI = 1.17–3.96; p = 0.014) and those children
living in ecologically terrain regions (AOR: 2.95, 95% CI = 1.64–5.31; p =<0.001) had higher
odds of developing moderate to severe anemia with regard to random effects. Children aged
under 11 months had a higher likelihood of moderate to severe anemia (AOR: 20.81, 95%
CI = 7.62–56.80; p =<0.001) compared to children in the oldest age group.
Discussion
In 2016, the prevalence of childhood anemia in Nepal was reported to be at 52.6%, an indica-
tion of a considerable increase after a decline in numbers had been reported between 2006–
2011 [20]. Recent DHS records showed that childhood anemia was high in some South and
Southeast Asian countries, such as India (58.5% in 2016), Myanmar (57.8% in 2016), Cambo-
dia (55.5% in 2014), Bangladesh (51.3% in 2011), Maldives (49.7% in 2017) and Timor-Leste
(40.3% in 2016) plus Nepal [20]. This study suggests that Nepal has not yet achieved sustain-
able improvement in maternal and child nutrition. Possible reasons for this could be that chil-
dren in rural areas suffering from undernutrition and ill health may be due not only to poor
diet but also because of direct exposure to household air pollution, polluted drinking water,
poor hygiene and sanitation. The level of knowledge and understanding of multisector
approaches is relatively low in Nepal and are allied to a lack of coordination among key sectors,
such as health, agriculture, education, urban development and local development that impacts
on their ability to address the issue of nutrition. There is also a lack of communication and
coordination between key government sectors and development agencies along with limited
budgets allocated from each sector and by donors. Poor coordination between key institutions
such as in government, academia, research, training and national/international nongovern-
mental organizations add to the problems [21]. The inability to scale up action on nutritional
activities in all districts is potentially compounded by a number of problems including a lack
of research-based evidence, poor planning, diverse services and working cultures, short-term
funding, limited technical and coordination expertise, overlapping of services in different
PLOS ONE Risk factors of childhood anemia in Nepal
PLOS ONE | https://doi.org/10.1371/journal.pone.0239409 October 6, 2020 10 / 18
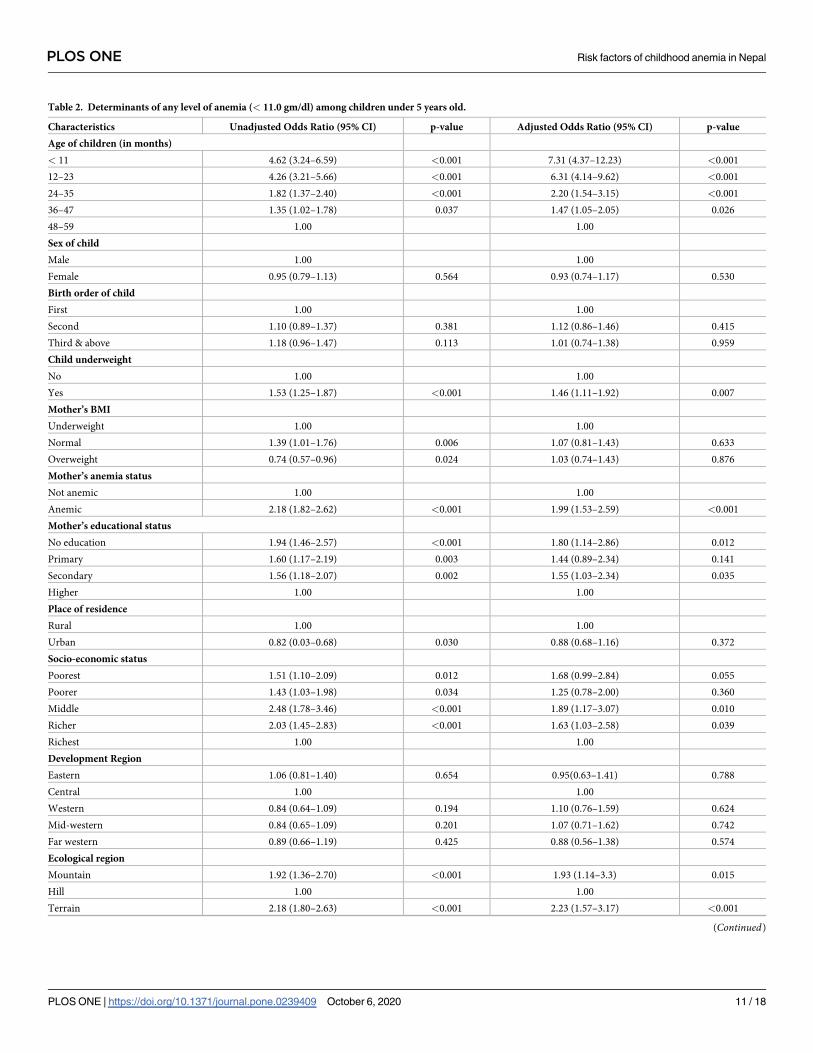
Table 2. Determinants of any level of anemia (< 11.0 gm/dl) among children under 5 years old.
Characteristics Unadjusted Odds Ratio (95% CI) p-value Adjusted Odds Ratio (95% CI) p-value
Age of children (in months)
< 11 4.62 (3.24–6.59) <0.001 7.31 (4.37–12.23) <0.001
12–23 4.26 (3.21–5.66) <0.001 6.31 (4.14–9.62) <0.001
24–35 1.82 (1.37–2.40) <0.001 2.20 (1.54–3.15) <0.001
36–47 1.35 (1.02–1.78) 0.037 1.47 (1.05–2.05) 0.026
48–59 1.00 1.00
Sex of child
Male 1.00 1.00
Female 0.95 (0.79–1.13) 0.564 0.93 (0.74–1.17) 0.530
Birth order of child
First 1.00 1.00
Second 1.10 (0.89–1.37) 0.381 1.12 (0.86–1.46) 0.415
Third & above 1.18 (0.96–1.47) 0.113 1.01 (0.74–1.38) 0.959
Child underweight
No 1.00 1.00
Yes 1.53 (1.25–1.87) <0.001 1.46 (1.11–1.92) 0.007
Mother’s BMI
Underweight 1.00 1.00
Normal 1.39 (1.01–1.76) 0.006 1.07 (0.81–1.43) 0.633
Overweight 0.74 (0.57–0.96) 0.024 1.03 (0.74–1.43) 0.876
Mother’s anemia status
Not anemic 1.00 1.00
Anemic 2.18 (1.82–2.62) <0.001 1.99 (1.53–2.59) <0.001
Mother’s educational status
No education 1.94 (1.46–2.57) <0.001 1.80 (1.14–2.86) 0.012
Primary 1.60 (1.17–2.19) 0.003 1.44 (0.89–2.34) 0.141
Secondary 1.56 (1.18–2.07) 0.002 1.55 (1.03–2.34) 0.035
Higher 1.00 1.00
Place of residence
Rural 1.00 1.00
Urban 0.82 (0.03–0.68) 0.030 0.88 (0.68–1.16) 0.372
Socio-economic status
Poorest 1.51 (1.10–2.09) 0.012 1.68 (0.99–2.84) 0.055
Poorer 1.43 (1.03–1.98) 0.034 1.25 (0.78–2.00) 0.360
Middle 2.48 (1.78–3.46) <0.001 1.89 (1.17–3.07) 0.010
Richer 2.03 (1.45–2.83) <0.001 1.63 (1.03–2.58) 0.039
Richest 1.00 1.00
Development Region
Eastern 1.06 (0.81–1.40) 0.654 0.95(0.63–1.41) 0.788
Central 1.00 1.00
Western 0.84 (0.64–1.09) 0.194 1.10 (0.76–1.59) 0.624
Mid-western 0.84 (0.65–1.09) 0.201 1.07 (0.71–1.62) 0.742
Far western 0.89 (0.66–1.19) 0.425 0.88 (0.56–1.38) 0.574
Ecological region
Mountain 1.92 (1.36–2.70) <0.001 1.93 (1.14–3.3) 0.015
Hill 1.00 1.00
Terrain 2.18 (1.80–2.63) <0.001 2.23 (1.57–3.17) <0.001
(Continued)
PLOS ONE Risk factors of childhood anemia in Nepal
PLOS ONE | https://doi.org/10.1371/journal.pone.0239409 October 6, 2020 11 / 18
sectors leading to duplication and differing health messages, low priority assigned to nutri-
tional needs at all levels and lack of clarity as to how each sector should engage with the issue
of nutrition [22]. Significant progress has been observed in Sri Lanka where the current preva-
lence of anemia among children stands at 26% that may be due to the successful implementa-
tion of various strategic plans and programmes that focused on reducing it [1, 23, 24].
The prevalence of moderate to severe childhood anemia in Nepal is reported to be at 26.6%. In
2011 in Bangladesh, it stood at 22.1%, in 2016 in India it was 30.8% and in 2017 in Maldives it
was 20.3% [20]. The higher prevalence of childhood anemia indicates that there is a serious prob-
lem and this study can help with the process of reviewing child health policy in order to combat
it. Food insecurity due to the effects of climate change on agricultural productivity, the continuing
global financial crisis and an undermined socioeconomic future may also be having an impact on
the present state of childhood anemia in South Asian countries and need to be addressed [25].
This study showed that the prevalence of anemia was higher among children aged under 11
months and in underweight children. This high prevalence in the younger age group was also
found in neighboring countries, such as China and Bangladesh [6, 26]. Breastfeeding after six
months of age is no longer sufficient, on its own, for a child’s physical and mental develop-
ment, meaning that foods such as solid and semi-solid products have an important role to play
to complement the breast milk. Appropriate complementary feeding practices may help to
reduce the chances of children in the younger age groups from developing anemia. Childhood
anemia was found to be higher among female children in Bangladesh, Sudan and Brazil [26–
28] and also among the third and above birth order children in Indian and Egyptian families
[29, 30]. This could possibly be explained by a scarcity of food for sharing among children in
larger families. Underweight children in Bangladesh, Pakistan, Ethiopia and India were found
to have a higher prevalence of anemia [17, 18, 29, 31]. The reasons for being underweight may
be due to poor distribution of inadequate food within the family, food insecurity, poverty and
micronutrient deficiencies that often tend to coexist with other macronutrient deficiencies
[29]. Overall poverty in Nepal stood at 25% and food insecurity at 23%, with both compara-
tively higher in mountainous regions followed by hills and terrain regions [32]. In this study,
the prevalence of anemia was found to be significantly higher in terrain regions that is poten-
tially due to deprivation and lack of basic education and health related facilities. The ethnic
populations in these regions are socially, culturally and economically excluded from main-
stream development and experience particular challenges in accessing health, education and
other resources [33]. Western terrain regions are less developed with regard to economic infra-
structure, job market and transportation and lack of quality farming soil, rainfall and duration
of the crop growing season all leading to less productive farming. Lower consumption of iron-
rich foods that is associated with childhood anemia has been reported in the terrain regions
but not in the hills and mountain regions [34].
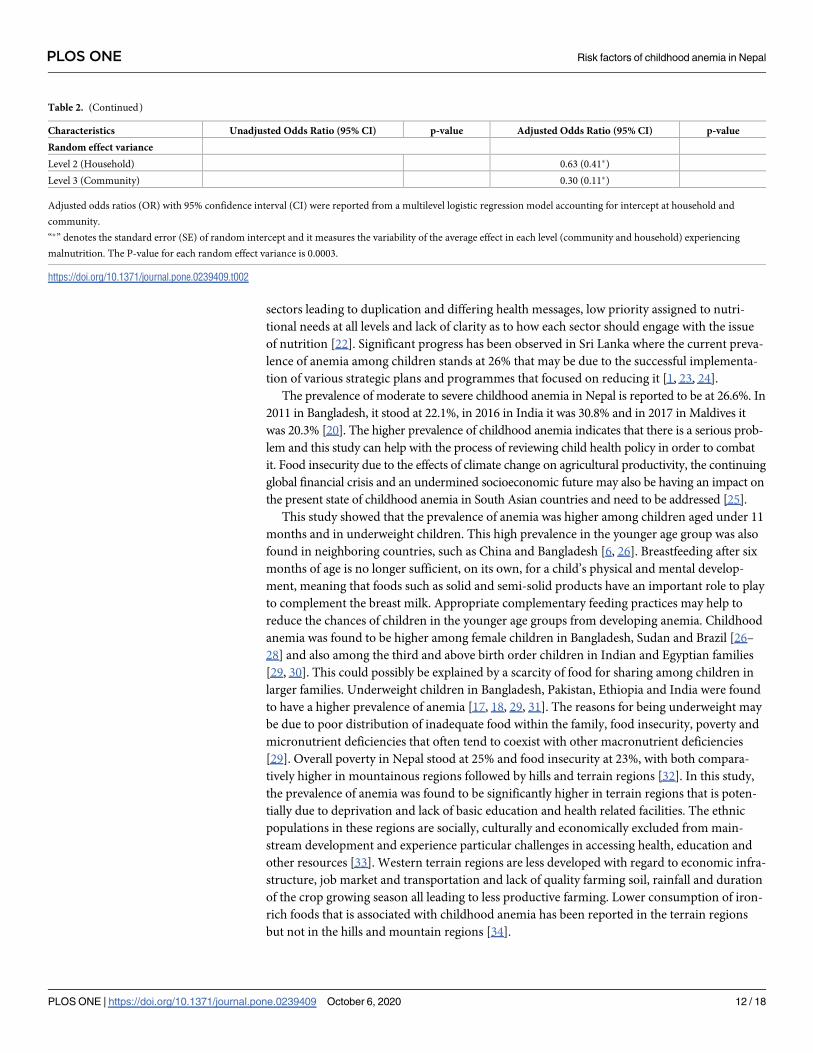
Table 2. (Continued)
Characteristics Unadjusted Odds Ratio (95% CI) p-value Adjusted Odds Ratio (95% CI) p-value
Random effect variance
Level 2 (Household) 0.63 (0.41�)
Level 3 (Community) 0.30 (0.11�)
Adjusted odds ratios (OR) with 95% confidence interval (CI) were reported from a multilevel logistic regression model accounting for intercept at household and
community.
“�” denotes the standard error (SE) of random intercept and it measures the variability of the average effect in each level (community and household) experiencing
malnutrition. The P-value for each random effect variance is 0.0003.
https://doi.org/10.1371/journal.pone.0239409.t002
PLOS ONE Risk factors of childhood anemia in Nepal
PLOS ONE | https://doi.org/10.1371/journal.pone.0239409 October 6, 2020 12 / 18
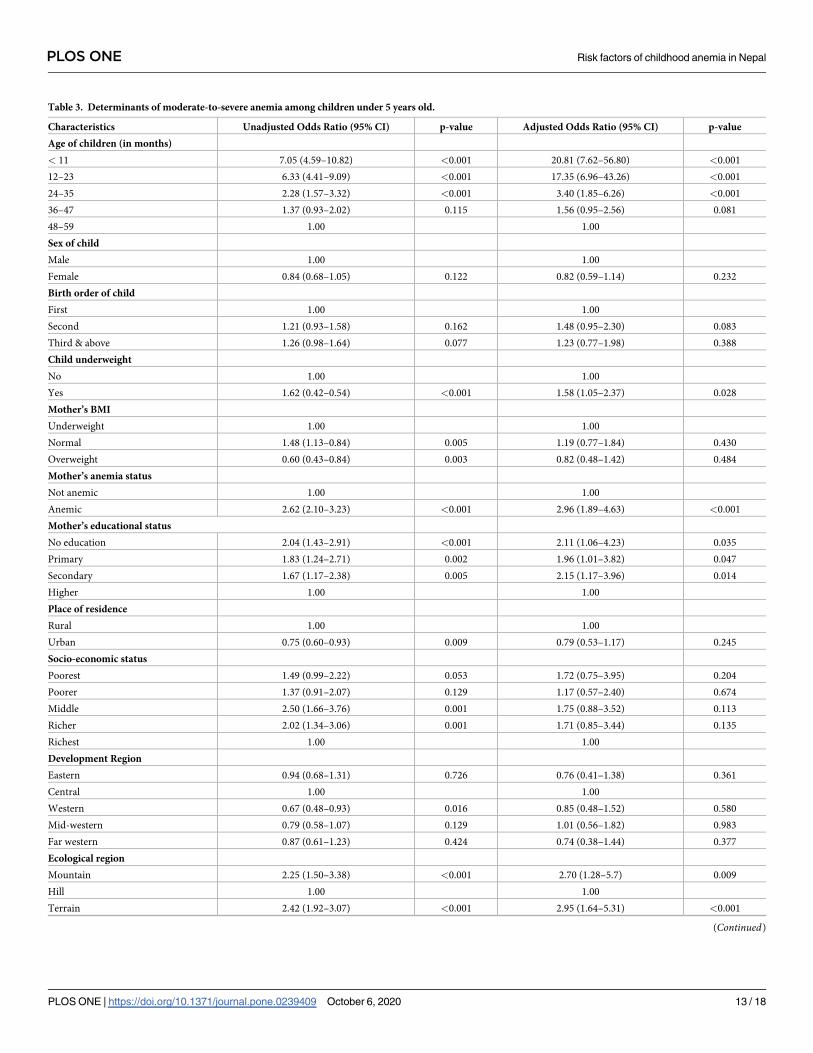
Table 3. Determinants of moderate-to-severe anemia among children under 5 years old.
Characteristics Unadjusted Odds Ratio (95% CI) p-value Adjusted Odds Ratio (95% CI) p-value
Age of children (in months)
< 11 7.05 (4.59–10.82) <0.001 20.81 (7.62–56.80) <0.001
12–23 6.33 (4.41–9.09) <0.001 17.35 (6.96–43.26) <0.001
24–35 2.28 (1.57–3.32) <0.001 3.40 (1.85–6.26) <0.001
36–47 1.37 (0.93–2.02) 0.115 1.56 (0.95–2.56) 0.081
48–59 1.00 1.00
Sex of child
Male 1.00 1.00
Female 0.84 (0.68–1.05) 0.122 0.82 (0.59–1.14) 0.232
Birth order of child
First 1.00 1.00
Second 1.21 (0.93–1.58) 0.162 1.48 (0.95–2.30) 0.083
Third & above 1.26 (0.98–1.64) 0.077 1.23 (0.77–1.98) 0.388
Child underweight
No 1.00 1.00
Yes 1.62 (0.42–0.54) <0.001 1.58 (1.05–2.37) 0.028
Mother’s BMI
Underweight 1.00 1.00
Normal 1.48 (1.13–0.84) 0.005 1.19 (0.77–1.84) 0.430
Overweight 0.60 (0.43–0.84) 0.003 0.82 (0.48–1.42) 0.484
Mother’s anemia status
Not anemic 1.00 1.00
Anemic 2.62 (2.10–3.23) <0.001 2.96 (1.89–4.63) <0.001
Mother’s educational status
No education 2.04 (1.43–2.91) <0.001 2.11 (1.06–4.23) 0.035
Primary 1.83 (1.24–2.71) 0.002 1.96 (1.01–3.82) 0.047
Secondary 1.67 (1.17–2.38) 0.005 2.15 (1.17–3.96) 0.014
Higher 1.00 1.00
Place of residence
Rural 1.00 1.00
Urban 0.75 (0.60–0.93) 0.009 0.79 (0.53–1.17) 0.245
Socio-economic status
Poorest 1.49 (0.99–2.22) 0.053 1.72 (0.75–3.95) 0.204
Poorer 1.37 (0.91–2.07) 0.129 1.17 (0.57–2.40) 0.674
Middle 2.50 (1.66–3.76) 0.001 1.75 (0.88–3.52) 0.113
Richer 2.02 (1.34–3.06) 0.001 1.71 (0.85–3.44) 0.135
Richest 1.00 1.00
Development Region
Eastern 0.94 (0.68–1.31) 0.726 0.76 (0.41–1.38) 0.361
Central 1.00 1.00
Western 0.67 (0.48–0.93) 0.016 0.85 (0.48–1.52) 0.580
Mid-western 0.79 (0.58–1.07) 0.129 1.01 (0.56–1.82) 0.983
Far western 0.87 (0.61–1.23) 0.424 0.74 (0.38–1.44) 0.377
Ecological region
Mountain 2.25 (1.50–3.38) <0.001 2.70 (1.28–5.7) 0.009
Hill 1.00 1.00
Terrain 2.42 (1.92–3.07) <0.001 2.95 (1.64–5.31) <0.001
(Continued)
PLOS ONE Risk factors of childhood anemia in Nepal
PLOS ONE | https://doi.org/10.1371/journal.pone.0239409 October 6, 2020 13 / 18
The association between maternal circumstances and childhood anemia in Nepal has not
been sufficiently researched. This study showed that underweight, anemic and uneducated
mothers had a higher prevalence of anemic children. However, in Ethiopia, children of over-
weight mothers have also been reported as having a higher prevalence of anemia [31]. In Ban-
gladesh, Pakistan and China, a higher prevalence of childhood anemia was noted among
anemic mothers [17, 18, 35] and in India, it was found among uneducated mothers [29]. In
many societies, women’s inferior social status within the household with poor access to assets,
employment, health care, and education adversely affects their health and that of their chil-
dren. In Nepal, a low level of autonomy among women leads to poor health service utilization
and has a direct impact on maternal and child morbidity and mortality [36].
This study in Nepal is of significance as it uses nationally representative data to comprehen-
sively investigate the relationship between anemia and a range of indicators at individual,
household and community levels. The multilevel regression analysis, that was used to identify
random effects, showed that children that were underweight, in a young age group, children of
mothers who were anemic themselves and uneducated had a higher risk of being anemic.
Other studies conducted in India, Nepal and Kuwait also found these factors to be significant
determinants of childhood anemia as did the results of studies conducted in Ghana and Ethio-
pia and in Brazil and Haiti [29, 31, 37–41]. However, all these studies identified certain factors
as fixed effects. The study findings also showed that children from middle class families had a
higher risk of anemia, but studies conducted in Nepal, Pakistan and Bangladesh showed that
the poor socio-economic status of children was a significant risk factor for anemia [5]. Agricul-
ture, industry, commerce, and tourism are major contributors to Nepal’s economy. Prior to
the earthquakes, these sectors also provided the majority of employment opportunities but the
aftermath left these productive sectors virtually destroyed. This has had a negative impact on
the livelihoods of approximately 2.29 million households and 5.6 million workers in 31 dis-
tricts [42]. In this study, a significant regional effect was observed due to this situation that is
supported by another study conducted in Nepal [5]. It is still the case, however, that no previ-
ous studies used household and community level variations to help explain the determinants
of childhood anemia.
There are differences in findings of the significant determinants of childhood anemia
between a number of studies. For example, a study in Nigeria showed that child’s age is a signifi-
cant determinant of moderate to severe anemia but socio-economic status was not found to
have any association with it [43]. However, a study in Kenya found that socio-economic status
did have a significant effect on childhood anemia [44] and in Tanzania, a child’s age and moth-
er’s education were identified as significant determinants [45] that concurs with the findings of
this study. In China, a mother’s anemic status and region were found to be significantly related
to severe childhood anemia [35] that is also consistent with the findings of this study.
Table 3. (Continued)
Characteristics Unadjusted Odds Ratio (95% CI) p-value Adjusted Odds Ratio (95% CI) p-value
Random effect variance
Level 2 (Household) 1.98 (1.22�)
Level 3 (Community) 0.46 (0.27�)
Adjusted odds ratios (OR) with 95% confidence interval (CI) were reported from a multilevel logistic regression model accounting for intercept at household and
community.
“�” denotes the standard error (SE) of random intercept and it measures the variability of average effect in each level (community and household) experiencing
malnutrition. The P-value for each random effect variance is 0.0014.
https://doi.org/10.1371/journal.pone.0239409.t003
PLOS ONE Risk factors of childhood anemia in Nepal
PLOS ONE | https://doi.org/10.1371/journal.pone.0239409 October 6, 2020 14 / 18
Several barriers that are present in Nepal impede its ability to develop effective anemia pre-
vention and control strategies. These barriers include poverty, illiteracy, low coverage of mater-
nal and child health care facilities, poor quality of health services, chronic food insecurity,
ethnicity and geography. In order to improve the nutritional status of vulnerable citizens, the
government in Nepal should put forward an integrated nutrition-sensitive social protection sys-
tem [46]. The adverse consequences of anemia can be tackled by identifying and addressing the
local determinants and by development of effective strategies to deal with them [47]. For exam-
ple, one strategy could be to introduce community based short term and long term sustainable
maternal education and awareness programmes, with a focus on feeding practices for infant
and young children [23, 48]; another strategy could be to design specific cultural interventions
to target the most marginalized subpopulations such as low caste families [13].
This study fills gaps in knowledge relating to social determinants of childhood anemia in
Nepal, and its documented evidence can play a major role in spearheading positive change to
deal with the challenges. The main strength of this study is the identification of the pervasive
relationship between multilevel factors with variation at individual, household and community
levels and childhood anemia derived from a large nationally representative dataset. Limitations
of the study include the cross-sectional nature of the data that does not enable an assessment
to be made of the cause and effect relationship between selected factors and outcomes. In addi-
tion, information bias due to self-reporting age, education and household assets of respon-
dents in the national dataset could also limit the findings of this study. The covariates used in
this study did not include food frequency or dietary habits, circumstances at birth, immuniza-
tion status, morbidity and ethnicity. In spite of these limitations, this study provides important
evidence-based information that will help public health policy makers in Nepal.
Conclusion
As this study shows, the prevalence of anemia among children in Nepal is a severe public
health issue. Many factors for this situation have been identified (for example, age, birth order
of child, underweight child, mother’s BMI, mother’s anemia status, mother’s educational sta-
tus, socio-economic status and regions) as having significant random effects on childhood ane-
mia at community and household levels. The estimated magnitude of the effects of the selected
predictors from this multilevel analysis is higher than the values identified by those studies
that concentrated on fixed effects. The significant variation at community level indicates an
inequality of access to healthcare at that level.
Present strategies aimed at reducing childhood anemia in Nepal need to be addressed and
developed using multi-sectoral and comprehensive approaches. The strategies should include
increasing the countrywide coverage and compliance of iron/folate supplementation for
women; reducing the burden of parasitic infections (helminth and malaria) among women
and children, especially in vulnerable areas and promoting dietary modification and improved
maternal and child care practices and services in underprivileged areas, among others. Further
in-depth research using a wide range of variables, including gender and urban-rural differ-
ences, will help inspire further ingenuity in developing effective population-based strategies to
reduce the prevalence of childhood anemia in children under five years of age in Nepal.
Acknowledgments
The authors thank the MEASURE DHS project for their support and for free access to the
original data and the Department of Public Health, First Capital University of Bangladesh for
enabling the scope of the research.
PLOS ONE Risk factors of childhood anemia in Nepal
PLOS ONE | https://doi.org/10.1371/journal.pone.0239409 October 6, 2020 15 / 18
Author Contributions
Conceptualization: Mohammad Rocky Khan Chowdhury, Md. Shafiur Rahman.
Formal analysis: Md Moinul Islam.
Methodology: Md. Shafiur Rahman, Md Rashedul Islam.
Supervision: Baki Billah.
Writing – original draft: Mohammad Rocky Khan Chowdhury, Md. Mobarak Hossain Khan.
Writing – review & editing: Md. Mobarak Hossain Khan, Hafiz T. A. Khan, Baki Billah.
References1. The World Bank. Prevalence of anemia among children (% of children under 5). World Development
Indicators. World Bank, IBRD and IDA; 2016. Available from: https://data.worldbank.org/indicator/SH.
ANM.CHLD.ZS
2. De Benoist B, McLean E, Egli I, Cogswell M. The World Health Report: Worldwide prevalence of anemia
1993–2005: WHO global database on anemia. Geneva: World Health Organization; 2008.
3. Grantham-McGregor S, Anit C. A review of studies on the effect of iron deficiency on cognitive develop-
ment in children. Journal of Nutrition 2001; 131(2S-2):649S–668S. https://doi.org/10.1093/jn/131.2.
649S PMID: 11160596
4. Grantham-McGregor S, Baker-Henningham H. Iron Deficiency in Childhood: Causes and Conse-
quences for Child Development. Ann Nestle 2010; 68(3):105–119. https://doi.org/10.1159/000319670
5. Harding KL, Aguayo VM, Namirembe G, Webb P. Determinants of anemia among women and children
in Nepal and Pakistan: An analysis of recent national survey data. Maternal and Child Nutrition 2018; 14
(Suppl 4):e12478. https://doi.org/10.1111/mcn.12478 PMID: 28857410
6. Hu S, Tan H, Peng A, Jiang H, Wu J, Guo S, et al. Disparity of anemia prevalence and associated fac-
tors among rural to urban migrant and the local children under two years old: a population based cross-
sectional study in Pinghu, China. BMC Public Health 2014; 14:601. https://doi.org/10.1186/1471-2458-
14-601 PMID: 24928085
7. Black RE, Victora CG, Walker SP, Bhutta ZA, Christian P, Onis MD, et al. Maternal and child undernutri-
tion and overweight in low-income and middle-income countries. Lancet 2013; 382:427–451. https://
doi.org/10.1016/S0140-6736(13)60937-X PMID: 23746772
8. Annan S, Abhishek G, Sujata P. Prevalence of anemia in children aged 6 months to 15 years: a hospital
based study. Journal of Pathology of Nepal 2017; 7:1168–1171. https://doi.org/10.3126/jpn.v7i2.17996
9. Lamichhane R, Zhao Y, Paudel S, Adewuyi EO. Factors associated with infant mortality in Nepal: a
comparative analysis of Nepal demographic and health surveys (NDHS) 2006 and 2011. BMC Public
Health 2017; 17:53. https://doi.org/10.1186/s12889-016-3922-z PMID: 28068969
10. Joshi PC. Malnutrition in Children: A Serious Public Health Issue in Nepal. Health Prospect 2012;
11:61–62. https://doi.org/10.3126/hprospect.v11i0.7439
11. Mathema S, Shrestha A. Prevalence and causes of anemia in six to sixty months old children: A cross-
sectional study at Kathmandu Medical College and Teaching Hospital. Journal of Nepal Paediatric Soci-
ety 2013; 33(3):163–165. https://doi.org/10.3126/jnps.v33i3.8847
12. Sinha AK, Padmavathi P, Dubey RK, Gautam N, Archana J, Neupane Y. Prevalence of anemia
amongst children under 59 months old in south western Nepal. International Journal of Pharmaceutical
Science and Health Care 2013; 4(3):1–6.
13. Siegel EH, Stoltzfus RJ, Khatry SK, LeClerq S, Katz J, Tielsch JM. Epidemiology of anemia among 4 to
17 month children living in south central Nepal. European Journal of Clinical Nutrition 2006; 60(2):228–
235. https://doi.org/10.1038/sj.ejcn.1602306 PMID: 16234835
14. Khanal V, Karkee R, Adhikari M, Gavidia T. Moderate-to-severe anaemia among children aged 6–59
months in Nepal: An analysis from Nepal Demographic and Health Survey, 2011. Clinical Epidemiology
and Global Health 2016; 4(2):57–62. https://doi.org/10.1016/j.cegh.2015.07.001
15. Ministry of Health and Population (MOHP) [Nepal]. New ERA, and Macro International Inc. Nepal
Demographic and Health Survey. Kathmandu, Nepal. Ministry of Health and Population, New ERA and
Macro International Inc; 2016.
16. DeMaeyer EM, Dallman P, Gurney JM, Hallberg L, Sood SK, Srikantia SG. Preventing and controlling
iron deficiency anemia through primary health care: A guide for health administrators and program man-
agers. Geneva, Switzerland: World Health Organization; 1989.
PLOS ONE Risk factors of childhood anemia in Nepal
PLOS ONE | https://doi.org/10.1371/journal.pone.0239409 October 6, 2020 16 / 18
17. Habib MA, Black K, Soofi SB, Hussain I, Bhatti Z, Bhutta ZA, et al. Prevalence and Predictors of Iron
Deficiency Anemia in Children under Five Years of Age in Pakistan, A Secondary Analysis of National
Nutrition Survey Data 2011–2012. PLoS ONE 2016; 11(5):e0155051. https://doi.org/10.1371/journal.
pone.0155051 PMID: 27171139
18. Khan JR, Awan N, Misu F. Determinants of anemia among 6–59 months aged children in Bangladesh:
evidence from nationally representative data. BMC pediatrics 2016; 16:3. https://doi.org/10.1186/
s12887-015-0536-z PMID: 26754288
19. Rahman MM, Gilmour S, Akter S, Abe SK, Saito E, Shibuya K. Prevalence and control of hypertension
in Bangladesh: a multilevel analysis of a nationwide population-based survey. Journal of Hypertension
2014; 33(3):465–472. https://doi.org/10.1097/HJH.0000000000000421 PMID: 25380166
20. ICF International. Percentage of children under age 5 classified as having anemia. The DHS Program
STAT compiler; 2015. Available from: http://www.statcompiler.com
21. Gaihre S, Kyle J, Semple S, Smith J, Marais D, Subedi M, et al. Bridging barriers to advance multisector
approaches to improve food security, nutrition and population health in Nepal: transdisciplinary perspec-
tives. BMC Public Health 2019; 19(1):961. https://doi.org/10.1186/s12889-019-7204-4 PMID:
31319837
22. Shrestha RM, Ghimire M, Shakya P, Ayer R, Dhital R, Jimba M. School health and nutrition program
implementation, impact, and challenges in schools of Nepal: stakeholders’ perceptions. Tropical Medi-
cine and Health 2019; 47:32. https://doi.org/10.1186/s41182-019-0159-4 PMID: 31114429
23. De Silva A, Mahamithawa AMASB, Piyasena C. Maternal & child nutrition: The Sri Lankan perspective.
Indian Journal of Medical Research 2009; 130(5):609–611. PMID: 20090115
24. United Nation Children’s Fund (UNICEF). Progress for children. A report card on nutrition; 2006. Avail-
able from: https://www.unicef.org/publications/files/Progress_for_Children_-_No._4.pdf
25. Pasricha SR, Black J, Muthayya S, Shet A, Bhat V, Nagaraj S, et al. Determinants of anemia among
young children in rural India. Pediatrics 2010; 126(1):e140–e149. https://doi.org/10.1542/peds.2009-
3108 PMID: 20547647
26. Uddin MK, Sardar MH, Hossain MZ, Alam MM, Bhuya MF, Uddin MM, et al. Prevalence of anaemia in
children of 6 months to 59 months in Narayanganj, Bangladesh. Journal of Dhaka Medical College
2010; 19(2):126–130. https://doi.org/10.3329/jdmc.v19i2.7084
27. Dos Santos RF, Gonzalez ESC, de Albuquerque EC, de Arruda IKG, Diniz AS, Figueroa JN, et al. Prev-
alence of anemia in under five-year-old children in a children’s hospital in Recife, Brazil. Revista Brasi-
leira de Hematologia e Hemoterapia 2011; 33(2):100–104. https://doi.org/10.5581/1516-8484.
20110028 PMID: 23284255
28. Hussein MD, Mohamed S. Prevalence of anaemia in preschool children in Karma Albalad area, North-
ern State, Sudan. Eastern Mediterranean Health Journal 2014; 20(1):33–38. Available from: https://
apps.who.int/iris/handle/10665/118620 PMID: 24932931
29. Sinha PRN, Garg DBS. Epidemiological correlates of nutritional anemia among children (6–35 months)
in rural Wardha, Central India. Indian Journal of Medical Sciences 2008; 62(2):45–54. https://doi.org/
10.4103/0019-5359.39366 PMID: 18319531
30. Barakat AA, Nada KH, Ezzat DA. Prevalence and determining factors of anemia and malnutrition
among Egyptian children. Indian Journal of Medical Sciences 2013; 67:168–177. https://doi.org/10.
4103/0019-5359.125878 PMID: 24469561
31. Gebreegziabiher G, Etana B, Niggusie D. (2014). Determinants of anemia among children aged 6–59
months living in Kilte Awulaelo Woreda, Northern Ethiopia. Anemia 2014;1–9. https://doi.org/10.1155/
2014/245870 PMID: 25302116
32. Shrestha MB, Chaudhary SK. The impact of food inflation on poverty in Nepal. NRB Economic Review
2012; 24(2):1–14. Available from: https://pdfs.semanticscholar.org/540f/
e73baa6f1b6a85b9d99b25f52fc91f8057d3.pdf
33. Angdembe MR, Dulal BP, Bhattarai K, Karn S. Trends and inequalities in stunting in Nepal: a secondary
data analysis of four Nepal demographic health surveys from 2001 to 2016. BMC Nutrition 2019; 5:19.
https://doi.org/10.1186/s40795-019-0283-x PMID: 32153932
34. Osguei NK, Mascie-Taylor CN. Association of nutritional status with socio-economic and demographic
variables of under five year old Nepalese children. Medical Journal of the Islamic Republic of Iran 2019;
33:28. https://doi.org/10.34171/mjiri.33.28 PMID: 31380318
35. Gao W, Yan H, Wang D, Dang S, Pei L. Severity of anemia among children under 36 months old in rural
western China. PLOS ONE 2013; 8(4):e62883. https://doi.org/10.1371/journal.pone.0062883 PMID:
23626861
36. Adhikari R, Podhisita C. Household headship and child death: Evidence from Nepal. BMC International
Health and Human Rights 2010; 10:13. https://doi.org/10.1186/1472-698X-10-13 PMID: 20529249
PLOS ONE Risk factors of childhood anemia in Nepal
PLOS ONE | https://doi.org/10.1371/journal.pone.0239409 October 6, 2020 17 / 18
37. Osei A, Pandey P, Spiro D, Nielson J, Shrestha R, Talukder Z, et al. Household food insecurity and
nutritional status of children aged 6 to 23 months in Kailali District of Nepal. Food and Nutrition Bulletin
2010; 31(4):483–493. https://doi.org/10.1177/156482651003100402
38. Al-Qaoud NM, Al-Shami E, Prakash P. Anemia and associated factors among Kuwaiti preschool chil-
dren and their mothers. Alexandria Journal of Medicine 2015; 51(2):161–166. https://doi.org/10.1016/j.
ajme.2014.06.006
39. Borbor FM, Kumi-Kyereme A, Yendaw E, Adu-Opong A. A study of the determinants of anaemia
among under-five children in Ghana. International Journal of Development Research 2014; 4(4):858–
867.
40. Assis AMO, Barreto ML, Gomes GSS, Prado MS, Santos NS, Santos LMP, et al. Childhood anemia
prevalence and associated factors in Salvador, Bahia, Brazil. Cadernos de Saude Publica 2004;
20:1633–1641. https://doi.org/10.1590/s0102-311x2004000600022 PMID: 15608866
41. Ayoya MA, Ngnie-Teta I, Seraphin MN, Mamadoultaibou A, Boldon E, Saint-Fleur JE. Prevalence and
risk factors of anemia among children 6–59 months old in Haiti. Anemia 2013;1–3. https://doi.org/10.
1155/2013/502968 PMID: 23555053
42. Wendelbo M, La China F, Dekeyser H, Taccetti L, Mori S, Aggarwal V. et al. The Crisis Response to the
Nepal Earthquake: Lessons Learned. European Institute for Asian Studies (EIAS), Research Paper.
Brussels, Belgium; 2016.
43. Ughasoro MD, Emodi IJ, Okafor HU, Ibe BC. Prevalence of moderate and severe anaemia in children
under 5 in university of Nigeria teaching hospital Enugu, Southeast Nigeria. Pediatric Research 2011;
70:489–489. https://doi.org/10.1203/PDR.0b013e31822d7ef2 PMID: 21772224
44. Ngesa O, Mwambi H. Prevalence and risk factors of anemia among children aged between 6 months
and 14 years in Kenya. PLoS ONE 2014; 9(11):e113756. https://doi.org/10.1371/journal.pone.0113756
PMID: 25423084
45. Simbauranga R. Prevalence of anemia and factors associated with severe anemia among under five
children admitted at Bugando Medical Centre Mwanza, Tanzania. National Institute for Medical
Research, Dar Es Salaam, Tanzania, United Republic of Tanzania; 2013.
46. Save the Children. Malnutrition in Bangladesh. Harnessing social protection for the most vulnerable;
2015. Available from: https://resourcecentre.savethechildren.net/node/8886/pdf/malnutrition_in_
bangladesh.pdf
47. Balarajan Y, Ramakrishnan U, Ozaltin E, Shankar AH, Subramanian SV. Anaemia in low-income and
middle-income countries. Lancet 2011; 378:2123–35. https://doi.org/10.1016/S0140-6736(10)62304-5
PMID: 21813172
48. Charles CV, Summerlee AJS, Dewey CE. Anemia in Cambodia: prevalence, etiology and research
needs. Asia Pacific Journal of Clinical Nutrition 2012; 21(2):171–181. PMID: 22507602
PLOS ONE Risk factors of childhood anemia in Nepal
PLOS ONE | https://doi.org/10.1371/journal.pone.0239409 October 6, 2020 18 / 18