Prevalence and risk factors for stunting and severe stunting among under-fives in North Maluku...
10
BioMed Central Page 1 of 10 (page number not for citation purposes) BMC Pediatrics Open Access Research article Prevalence and risk factors for stunting and severe stunting among under-fives in North Maluku province of Indonesia Ramli †1 , Kingsley E Agho* 2 , Kerry J Inder †1 , Steven J Bowe †1 , Jennifer Jacobs †2 and Michael J Dibley †3 Address: 1 Centre for Clinical Epidemiology and Biostatistics, the University of Newcastle, NSW, Australia, 2 School of Medicine, the University of Western Sydney, NSW, Australia and 3 School of Public Health, the University of Sydney, NSW, Australia Email: Ramli - [email protected]; Kingsley E Agho* - [email protected]; Kerry J Inder - [email protected]; Steven J Bowe - [email protected]; Jennifer Jacobs - [email protected]; Michael J Dibley - [email protected] * Corresponding author †Equal contributors Abstract Background: Adequate nutrition is needed to ensure optimum growth and development of infants and young children. Understanding of the risk factors for stunting and severe stunting among children aged less than five years in North Maluku province is important to guide Indonesian government public health planners to develop nutrition programs and interventions in a post conflict area. The purpose of the current study was to assess the prevalence of and the risk factors associated with stunting and severe stunting among children aged less than five years in North Maluku province of Indonesia. Methods: The health and nutritional status of children aged less than five years was assessed in North Maluku province of Indonesia in 2004 using a cross-sectional multi-stage survey conducted on 750 households from each of the four island groups in North Maluku province. A total of 2168 children aged 0-59 months were used in the analysis. Results: Prevalence of stunting and severe stunting were 29% (95%CI: 26.0-32.2) and 14.1% (95%CI: 11.7-17.0) for children aged 0-23 months and 38.4% (95%CI: 35.9-41.0) and 18.4% (95%CI: 16.1-20.9) for children aged 0-59 months, respectively. After controlling for potential confounders, multivariate analysis revealed that the risk factors for stunted children were child's age in months, male sex and number of family meals per day (≤2 times), for children aged 0-23 months, and income (poorest and middle-class family), child's age in months and male sex for children aged 0-59 months. The risk factors for severe stunting in children aged 0-23 months were income (poorest family), male sex and child's age in months and for children aged 0-59 months were income (poorest family), father's occupation (not working), male sex and child's age in months. Conclusion: Programmes aimed at improving stunting in North Maluku province of Indonesia should focus on children under two years of age, of male sex and from families of low socioeconomic status. Published: 6 October 2009 BMC Pediatrics 2009, 9:64 doi:10.1186/1471-2431-9-64 Received: 28 January 2009 Accepted: 6 October 2009 This article is available from: http://www.biomedcentral.com/1471-2431/9/64 © 2009 Ramli et al; licensee BioMed Central Ltd. This is an Open Access article distributed under the terms of the Creative Commons Attribution License (http://creativecommons.org/licenses/by/2.0 ), which permits unrestricted use, distribution, and reproduction in any medium, provided the original work is properly cited.
-
Upload
independent -
Category
Documents
-
view
1 -
download
0
Transcript of Prevalence and risk factors for stunting and severe stunting among under-fives in North Maluku...
BioMed CentralBMC Pediatrics
ss
Open AcceResearch articlePrevalence and risk factors for stunting and severe stunting among under-fives in North Maluku province of IndonesiaRamli†1, Kingsley E Agho*2, Kerry J Inder†1, Steven J Bowe†1, Jennifer Jacobs†2 and Michael J Dibley†3Address: 1Centre for Clinical Epidemiology and Biostatistics, the University of Newcastle, NSW, Australia, 2School of Medicine, the University of Western Sydney, NSW, Australia and 3School of Public Health, the University of Sydney, NSW, Australia
Email: Ramli - [email protected]; Kingsley E Agho* - [email protected]; Kerry J Inder - [email protected]; Steven J Bowe - [email protected]; Jennifer Jacobs - [email protected]; Michael J Dibley - [email protected]
* Corresponding author †Equal contributors
AbstractBackground: Adequate nutrition is needed to ensure optimum growth and development ofinfants and young children. Understanding of the risk factors for stunting and severe stunting amongchildren aged less than five years in North Maluku province is important to guide Indonesiangovernment public health planners to develop nutrition programs and interventions in a postconflict area. The purpose of the current study was to assess the prevalence of and the risk factorsassociated with stunting and severe stunting among children aged less than five years in NorthMaluku province of Indonesia.
Methods: The health and nutritional status of children aged less than five years was assessed inNorth Maluku province of Indonesia in 2004 using a cross-sectional multi-stage survey conductedon 750 households from each of the four island groups in North Maluku province. A total of 2168children aged 0-59 months were used in the analysis.
Results: Prevalence of stunting and severe stunting were 29% (95%CI: 26.0-32.2) and 14.1%(95%CI: 11.7-17.0) for children aged 0-23 months and 38.4% (95%CI: 35.9-41.0) and 18.4% (95%CI:16.1-20.9) for children aged 0-59 months, respectively. After controlling for potential confounders,multivariate analysis revealed that the risk factors for stunted children were child's age in months,male sex and number of family meals per day (≤2 times), for children aged 0-23 months, and income(poorest and middle-class family), child's age in months and male sex for children aged 0-59 months.The risk factors for severe stunting in children aged 0-23 months were income (poorest family),male sex and child's age in months and for children aged 0-59 months were income (poorestfamily), father's occupation (not working), male sex and child's age in months.
Conclusion: Programmes aimed at improving stunting in North Maluku province of Indonesiashould focus on children under two years of age, of male sex and from families of lowsocioeconomic status.
Published: 6 October 2009
BMC Pediatrics 2009, 9:64 doi:10.1186/1471-2431-9-64
Received: 28 January 2009Accepted: 6 October 2009
This article is available from: http://www.biomedcentral.com/1471-2431/9/64
© 2009 Ramli et al; licensee BioMed Central Ltd. This is an Open Access article distributed under the terms of the Creative Commons Attribution License (http://creativecommons.org/licenses/by/2.0), which permits unrestricted use, distribution, and reproduction in any medium, provided the original work is properly cited.
Page 1 of 10(page number not for citation purposes)
BMC Pediatrics 2009, 9:64 http://www.biomedcentral.com/1471-2431/9/64
BackgroundThe optimal growth and development of infants andyoung children are fundamental for their future [1]. Stunt-ing, a deficit in height or length relative to a child's age isa major health problem in South Asia where half of chil-dren aged less than five years are stunted [2]. In Indonesia,37% of children aged less than five years are stunted [3].Promoting better eating habits in an effort to improvenutrition is one of the most challenging tasks in Indonesiaas malnutrition remains one of the most important publichealth problems facing almost every district [4].
In Indonesia, like many developing countries, the mostcommon nutritional problems in infancy and early child-hood are stunting, wasting; iron-deficiency anaemia, pov-erty and low birth weight [5,6]. Malnutrition during thefirst 2 years of life can lead to mortality and morbidity inchildhood [7,8] and is one of the most preventable riskfactors for mortality [9].
Past studies have also shown that lower intelligence quo-tient (IQ), mother's height, male sex, mother and fatherlevel of education, poverty, socioeconomic status, resi-dence, child care behaviour (inadequate complimentaryfeeding and breastfeeding), cultural beliefs, access tohealth care and environmental ecosystems [10,11] are fac-tors associated with stunting in children aged less thanfive years.
Despite the persistently high prevalence of stunted chil-dren in Indonesia, there is a lack of information about theprevalence and risk factors associated with stunted andseverely stunted children in the North Maluku province ofIndonesia using the new Growth reference from theWorld Health Organisation [12]. This province is an areain Indonesia that in 2004 had recently emerged from aperiod of prolonged civil conflict. This paper assesses theprevalence and risk factors associated with stunting andsevere stunting in children aged 0-59 months old in NorthMaluku province of Indonesia.
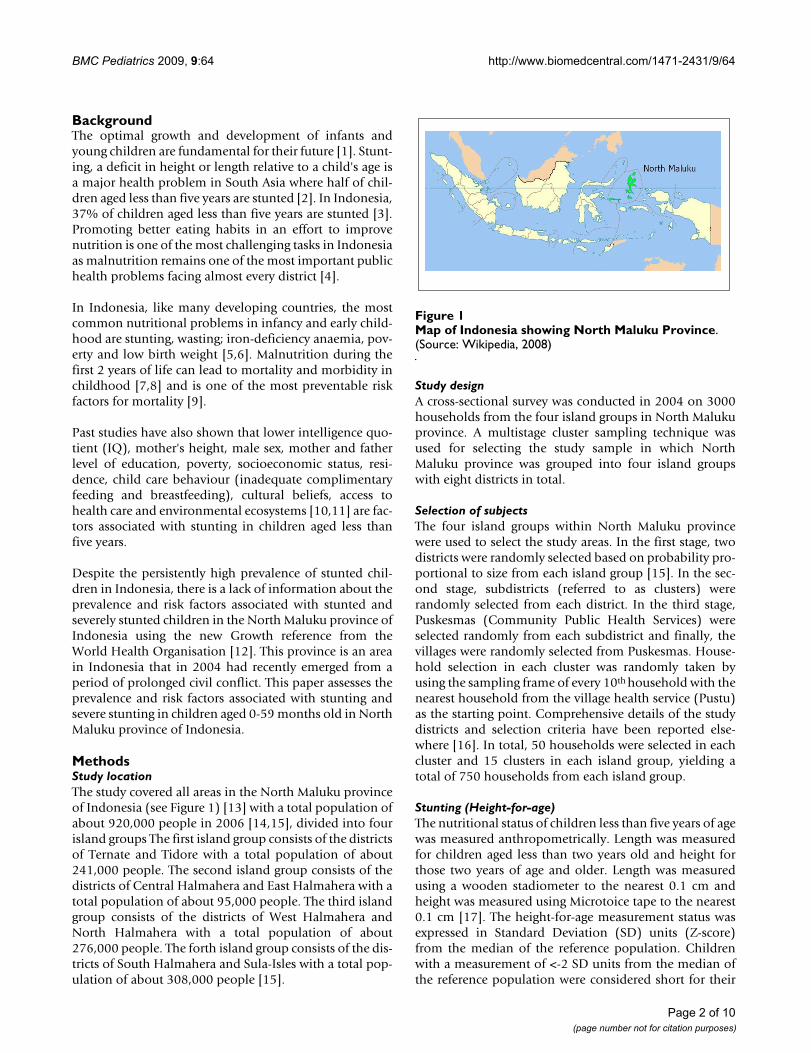
MethodsStudy locationThe study covered all areas in the North Maluku provinceof Indonesia (see Figure 1) [13] with a total population ofabout 920,000 people in 2006 [14,15], divided into fourisland groups The first island group consists of the districtsof Ternate and Tidore with a total population of about241,000 people. The second island group consists of thedistricts of Central Halmahera and East Halmahera with atotal population of about 95,000 people. The third islandgroup consists of the districts of West Halmahera andNorth Halmahera with a total population of about276,000 people. The forth island group consists of the dis-tricts of South Halmahera and Sula-Isles with a total pop-ulation of about 308,000 people [15].
Study designA cross-sectional survey was conducted in 2004 on 3000households from the four island groups in North Malukuprovince. A multistage cluster sampling technique wasused for selecting the study sample in which NorthMaluku province was grouped into four island groupswith eight districts in total.
Selection of subjectsThe four island groups within North Maluku provincewere used to select the study areas. In the first stage, twodistricts were randomly selected based on probability pro-portional to size from each island group [15]. In the sec-ond stage, subdistricts (referred to as clusters) wererandomly selected from each district. In the third stage,Puskesmas (Community Public Health Services) wereselected randomly from each subdistrict and finally, thevillages were randomly selected from Puskesmas. House-hold selection in each cluster was randomly taken byusing the sampling frame of every 10th household with thenearest household from the village health service (Pustu)as the starting point. Comprehensive details of the studydistricts and selection criteria have been reported else-where [16]. In total, 50 households were selected in eachcluster and 15 clusters in each island group, yielding atotal of 750 households from each island group.
Stunting (Height-for-age)The nutritional status of children less than five years of agewas measured anthropometrically. Length was measuredfor children aged less than two years old and height forthose two years of age and older. Length was measuredusing a wooden stadiometer to the nearest 0.1 cm andheight was measured using Microtoice tape to the nearest0.1 cm [17]. The height-for-age measurement status wasexpressed in Standard Deviation (SD) units (Z-score)from the median of the reference population. Childrenwith a measurement of <-2 SD units from the median ofthe reference population were considered short for their
Map of Indonesia showing North Maluku ProvinceFigure 1Map of Indonesia showing North Maluku Province. (Source: Wikipedia, 2008)
Page 2 of 10(page number not for citation purposes)
BMC Pediatrics 2009, 9:64 http://www.biomedcentral.com/1471-2431/9/64
age (stunted) and children with measurement of <-3SDunits from the median of the reference population wereconsidered to be severely stunted.
Socioeconomic factorsA structured household questionnaire was used for col-lecting information about the following family level fac-tors: region (urban and rural), district (total of eight),father's level of education (completed elementary school[6 years of schooling], completed middle school [9 yearsof schooling] and completed high school [12 years ofschooling]; mother's level of education; parental educa-tion (both with higher education, father with high educa-tion, mother with high education, neither with higheducation); father's occupation, mother's occupation;parental occupation; household wealth index (calculatedfrom household's ownership of consumer items includingrefrigerators, VCR players, satellite dishes, televisions,lounges, boats, cars, motorcycles; flooring material; typeof drinking-water source; toilet facilities; and other char-acteristics that are related to wealth status - categorisedinto poorest, middle and least poor); number of house-hold members in the family and number of family mealsper day. In addition, the following child level factors werecollected: child's age in months; gender; provision ofnutritional status information during pregnancy andnumber of antenatal visits. The questionnaires wereadministered after a signed informed consent was col-lected. The questionnaires were checked daily for accu-racy, consistency, and completeness by field supervisors.
Ethical permissionThis study had the approval of the Ministry of Health inIndonesia and the protocol for secondary data analysiswas approved by Human Ethics Research Committee,University of Newcastle - Australia.
Statistical analysesData were entered into a computerised database andcleaned using the data entry program EPIINFO [18]. Dataon nutritional status were analysed based on the newgrowth reference from the World Health Organisation.The household ownership of consumer items describedabove were used in constructing the wealth index scoresby using a method similar to that described by Filmer andPritchett [19] and were divided into three categories. Thebottom 40% of the households was referred to as thepoorest households, the next 40% as the middle-classhouseholds, and the top 20% as the least poor house-holds. The analysis for stunted and severely stunted chil-dren was categorised into two groups (1) children aged 0-23 months, and (2) children aged 0-59 months.
To determine the level of stunting and severe stunting thedependent variable was expressed as a dichotomous vari-
able: category 0 if not stunted (≥-2SD) or severely stunted(≥-3SD) and category 1 if stunted (<-2SD) or severelystunted (<-3SD).
Firstly, univariate binary logistic regression analysis wasperformed to examine the association between stuntedand severely stunted children aged 0-23 months andstunted children 0-59 months. Secondly, the factors asso-ciated with stunting and severe stunting were examined ina multiple logistic regression model. A stepwise backwardelimination approach was applied. At the start variableswere selected for inclusion in the model if their univariateanalysis p-value was <= 0.25. Only variables which werestatistically associated with stunted and severely stuntedchildren (p < 0.05) remained in the final model. Unad-justed and adjusted odds ratios from a logistic model arepresented with 95% confidence intervals. The 'SVY' com-mands from Stata version 9.2 (Stata Corp) were used fordata analysis to adjust for the cluster sampling design andappropriate sampling weights.
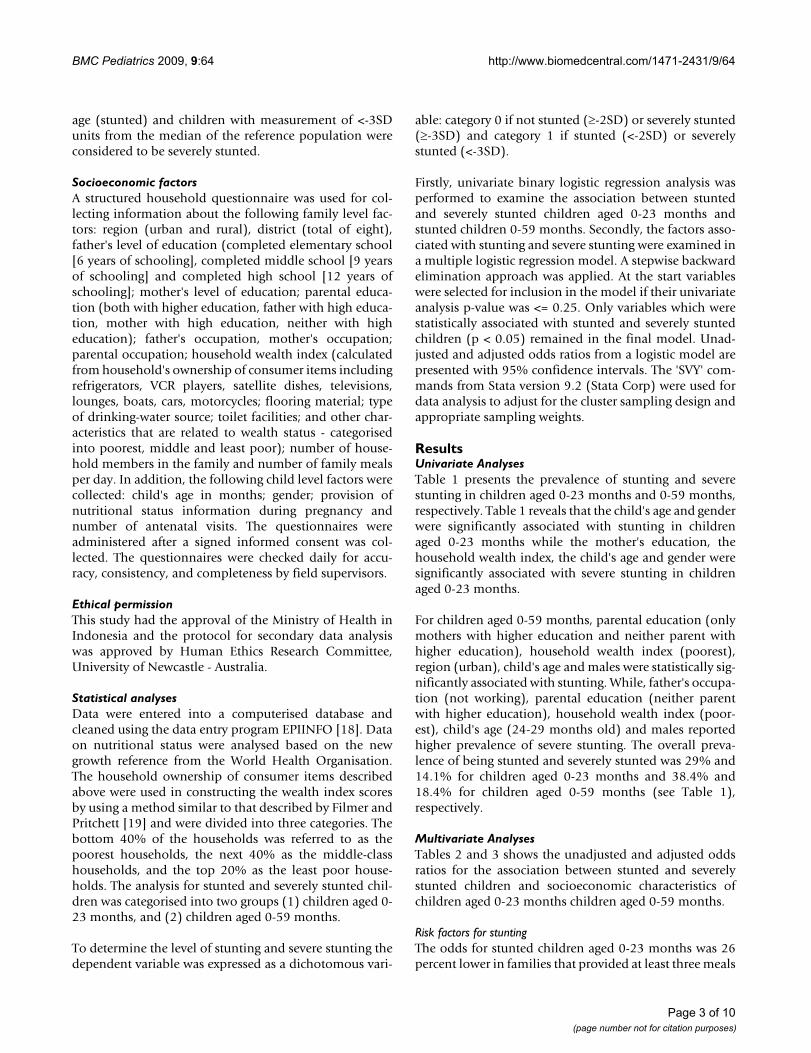
ResultsUnivariate AnalysesTable 1 presents the prevalence of stunting and severestunting in children aged 0-23 months and 0-59 months,respectively. Table 1 reveals that the child's age and genderwere significantly associated with stunting in childrenaged 0-23 months while the mother's education, thehousehold wealth index, the child's age and gender weresignificantly associated with severe stunting in childrenaged 0-23 months.
For children aged 0-59 months, parental education (onlymothers with higher education and neither parent withhigher education), household wealth index (poorest),region (urban), child's age and males were statistically sig-nificantly associated with stunting. While, father's occupa-tion (not working), parental education (neither parentwith higher education), household wealth index (poor-est), child's age (24-29 months old) and males reportedhigher prevalence of severe stunting. The overall preva-lence of being stunted and severely stunted was 29% and14.1% for children aged 0-23 months and 38.4% and18.4% for children aged 0-59 months (see Table 1),respectively.
Multivariate AnalysesTables 2 and 3 shows the unadjusted and adjusted oddsratios for the association between stunted and severelystunted children and socioeconomic characteristics ofchildren aged 0-23 months children aged 0-59 months.
Risk factors for stuntingThe odds for stunted children aged 0-23 months was 26percent lower in families that provided at least three meals
Page 3 of 10(page number not for citation purposes)
BMC Pediatrics 2009, 9:64 http://www.biomedcentral.com/1471-2431/9/64
Table 1: Prevalence of stunting and severe stunting in children aged 0-23 months and 0-59 months
Characteristic n Stunted children 0-23 Months
Severely stunted children 0-23 Months
Stunted children 0-59 Months
Severely stunted children 0-59 Months
% (95% CI) % (95% CI) % (95% CI) % (95% CI)
RegionRural 536 27.1 (21.0-34.3) 13.8 (9.5-19.5) 33.4 (28.6-38.6)* 15.9 (12.4-20.1)Urban 1632 29.6 (26.2-33.2) 14.2 (11.4-17.6) 40.0 (37.2-42.9) 19.2 (16.4-22.3)DistrictTernate 387 30.9 (23.8-39.1) 14.2 (9.9-19.9) 36.4 (31.0-42.2) 16.0 (12.3-20.6)Tidore 149 19.1 (10.4-32.5) 12.8 (4.9-29.2) 25.5 (18.9-33.4) 15.4 (8.6-26)Central Halmahera 280 32.3 (25.7-39.7) 15.5 (11.3-21) 42.9 (36.5-49.5) 23.2 (18.1-29.3)East Halmahera 280 37.0 (28.3-46.7) 21.9 (13.2-34.3) 42.5 (33.2-52.4) 23.6 (14.6-35.8)West Halmahera 178 23.7 (15.9-33.8) 6.2 (3.1-12.0) 38.2 (33.2-43.5) 16.3 (12.5-21)North Halmahera 279 31.1 (24.5-38.6) 13.3 (9.1-19.1) 41.6 (34.5-49.0) 17.2 (12.6-23.0)South Halmahera 446 24.7 (19.7-30.5) 12.4 (8.2-18.2) 38.6 (35.2-42.1) 19.3 (15.1-24.3)Sula-Isles 169 27.4 (20.7-35.3) 10.7 (6.7-16.8) 34.3 (29.6-39.4) 11.2 (9-14.0)Household factorsFather's educationCompleted Elementary School (aged 7-12)
832 32.0 (27.2-37.2) 16.2 (12.6-20.7) 41.8 (37.8-45.9)* 20.9 (17.6-24.7)*
Completed Middle School (aged 13-15)
557 28.4 (23.4-34.0) 13.2 (9.7-17.6) 39.3 (35.2-43.6) 19.0 (15.5-23.2)
Completed High School (aged 16-18)
779 26.3 (22.0-31.2) 12.6(9.2-17) 34.0 (30.3-37.9) 15.2 (12.1-18.8)
Mother's educationCompleted Elementary School (aged 7-12)
1163 30.8 (27.0-34.9) 16.7 (13.6-20.30* 41.6 (38.4-44.9)** 20.9 (18.0-24.3)**
Completed Middle School (aged 13-15)
514 29.7 (24.5-35.5) 11.5 (8-16.4) 37.7 (32.8-43) 15.8 (12.4-19.8)
Completed High School (aged 16-18)
491 24.5 (19.6-30.2) 11.2 (7.7-16.1) 31.4 (27.0-36.0) 14.9 (11.7-18.8)
Parental EducationBoth with high education 871 26.2 (22.1-30.7) 11.3 (8.4-14.9) 33.6 (30-37.5)** 15.4 (12.7-18.6)*Father with high education 134 33.3 (22.7-46.0) 12.0 (5.6-23.7) 41.0 (32.6-50.1) 14.9 (9.4-22.9)Mother with high education
465 29.2 (23.5-35.7) 16.1 (11.8-21.5) 41.1 (37.1-45.1) 19.4 (15.6-23.8)
Neither with high education
698 31.7 (26.9-37.1) 17.1 (13.1-21.9) 41.9 (37.7-46.4) 22.1 (18.4-26.2)
Provided with nutritional information during pregnancy (n = 2110)No 729 29.9 (25.4-35.0) 16.0 (12.8-19.9) 42.0 (37.7-46.4) 21.1 (17.6-25.1)Yes 1381 28.2 (24.9-31.9) 12.9 (10.1-16.3) 36.6 (33.7-39.7) 17.0 (14.3-20.1)Father's occupationAny Labour 1396 29.3 (25.6-33.3) 15.1 (12.2-18.7) 40.0 (36.9-43.2) 19.3 (16.7-22.3)**Fisher man 355 27.9 (22.6-33.8) 12.5 (8.5-18) 35.5 (30.8-40.5) 18.0 (14.5-22.1)No work 60 35.9 (21.7-53.1) 20.5 (10.4-36,5) 45.0 (34.0-56.5) 28.3 (18.5-40.5)Government private officer 357 27.7 (20.9-35.7) 10.8 (6.9-16.5) 33.9 (29-39.2) 13.2 (9.8-17.5)Mother's occupationAny Labour 694 29.9 (25.3-34.9) 14.4 (11.4-18.2) 39.5 (35.4-43.8) 18.4 (15.4-22)Fisher woman 96 30.6 (20.6-42.8) 18.4 (9.8-31.8) 38.5 (30.8-46.9) 22.9 (15.5-32.5)No work 1302 28.4 (24.4-32.7) 13.6(10.4-17.6) 37.9 (34.5-41.4) 18.1 (15.2-21.5)Government private officer 76 29.2 (17.7-44.0) 14.6 (8.0-25.0) 36.8 (27.6-47.2) 15.8 (10.2-23.7)Parental employmentBoth working 838 29.8 (25.8-34.2) 14.9 (11.9-18.6) 38.7 (35.3-42.2) 18.1 (15.4-21.3)Father only working 1270 28.1 (24.1-32.4) 13.2 (10.0-17.2) 37.9 (34.5-41.4) 18.0 (15.1-21.4)Mother only working 28 33.3 (14.2-60.2) 13.3 (2.8-44.8) 53.6 (38.5-68.1) 35.7 (19.7-56.8)Neither working 32 37.5 (21.1-57.4) 25.0 (11.7-45.7) 37.5 (23.1-54.6) 21.9 (11.4-38.0)Household wealth IndexPoorest 867 32.9 (27.6-38.7) 17.4 (13.4-22.4)** 43.1 (39.0-44.0)** 21.1 (17.4-25.4)**Middle 867 28.2 (24.3-32.5) 13.9 (11.0-17.6) 37.4 (33.9-40.9) 18.9 (16.3-21.9)Least Poor 434 23.4 (18.1-29.7) 8.3 (5.1-13.4) 30.9 (26.4-35.8) 11.8 (8.7-15.7)
Page 4 of 10(page number not for citation purposes)
BMC Pediatrics 2009, 9:64 http://www.biomedcentral.com/1471-2431/9/64
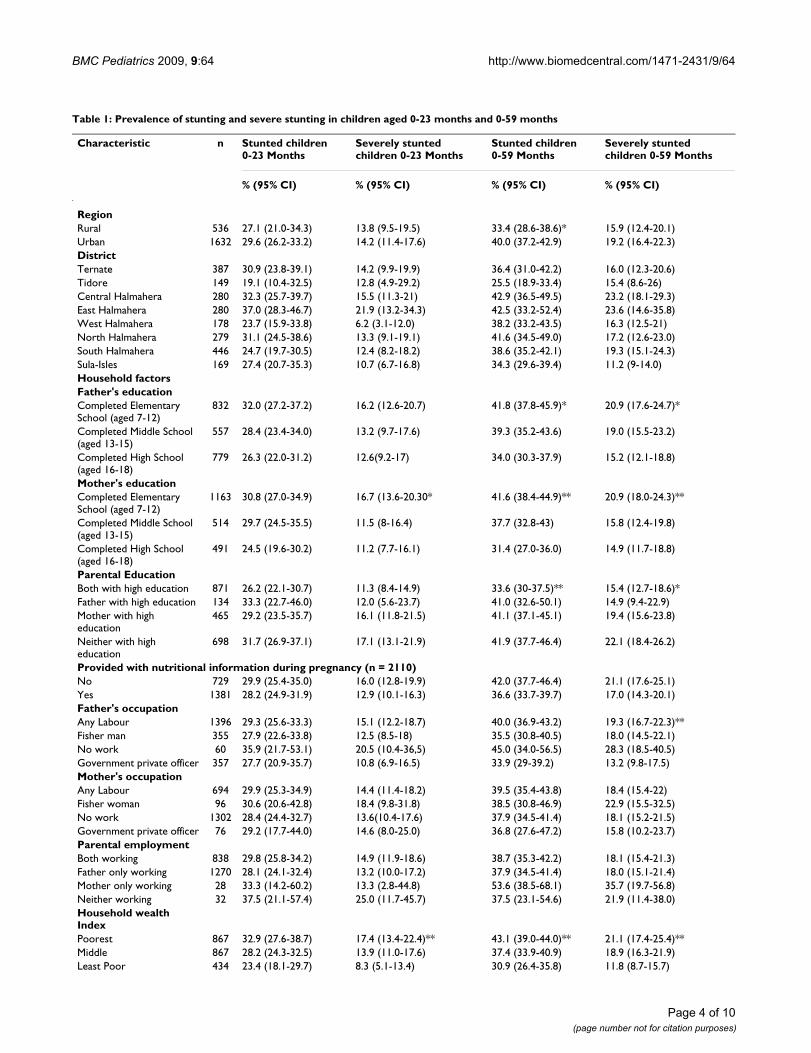
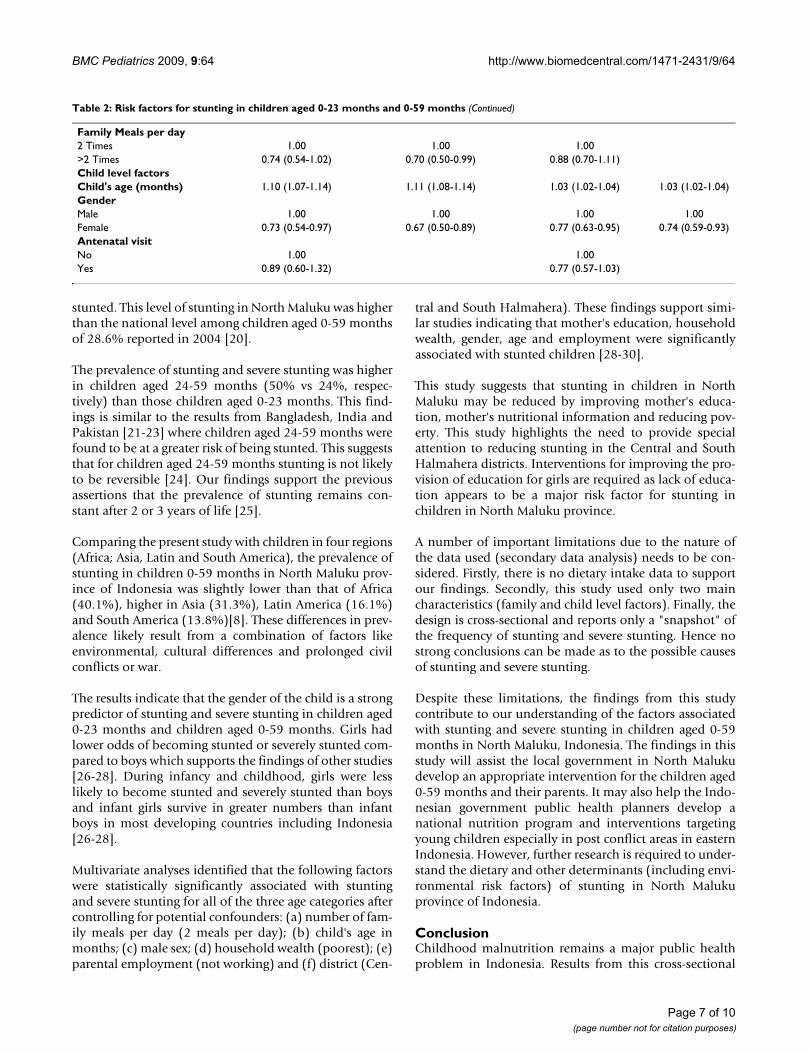
per day. Increased child age in months was statisticallyassociated with stunting in children aged 0-23 months(adjusted OR (AOR) = 1.11, 95%CI: 1.08 - 1.14; p <0.001) and girls had reduced odds of being stunted com-pared to boys (AOR = 0.67, 95%CI: 0.50 - 0.89; p =0.006).
Children aged 0-59 months from families in the leastpoor or middle household wealth index categories hadreduced odds of being stunted compared to those fromthe poorest families. Increased age of the child was statis-tically associated with stunting in children aged 0-59months (AOR = 1.03, 95%CI: 1.02 - 1.04; p < 0.001).Girls aged 0-59 months had statistically significantlyreduced odds of being stunted compared to boys aged 0-59 months (AOR = 0.72, 95% CI: 0.58 - 0.90; p = 0.005).
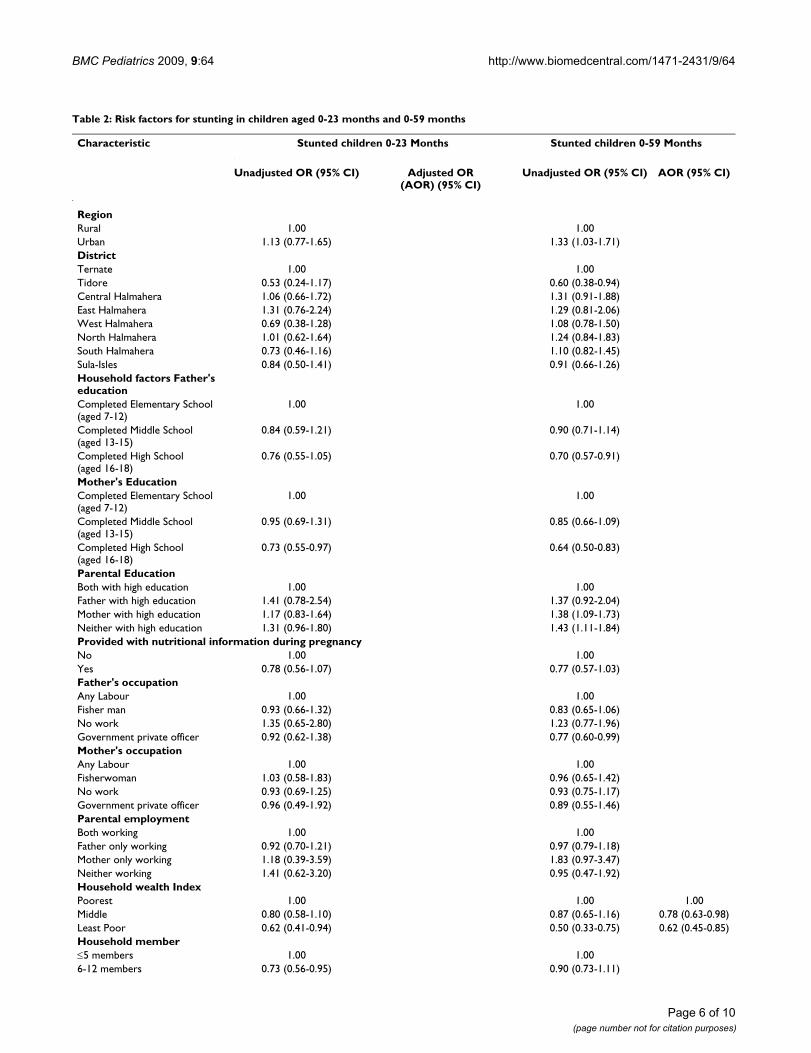
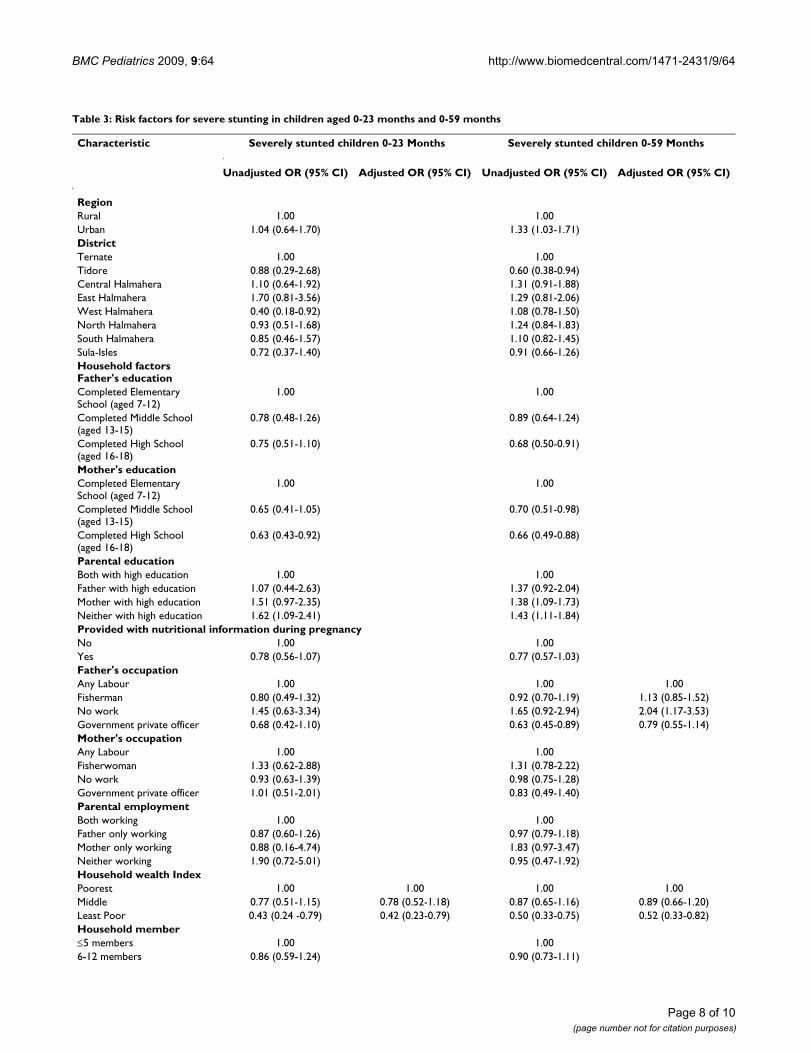
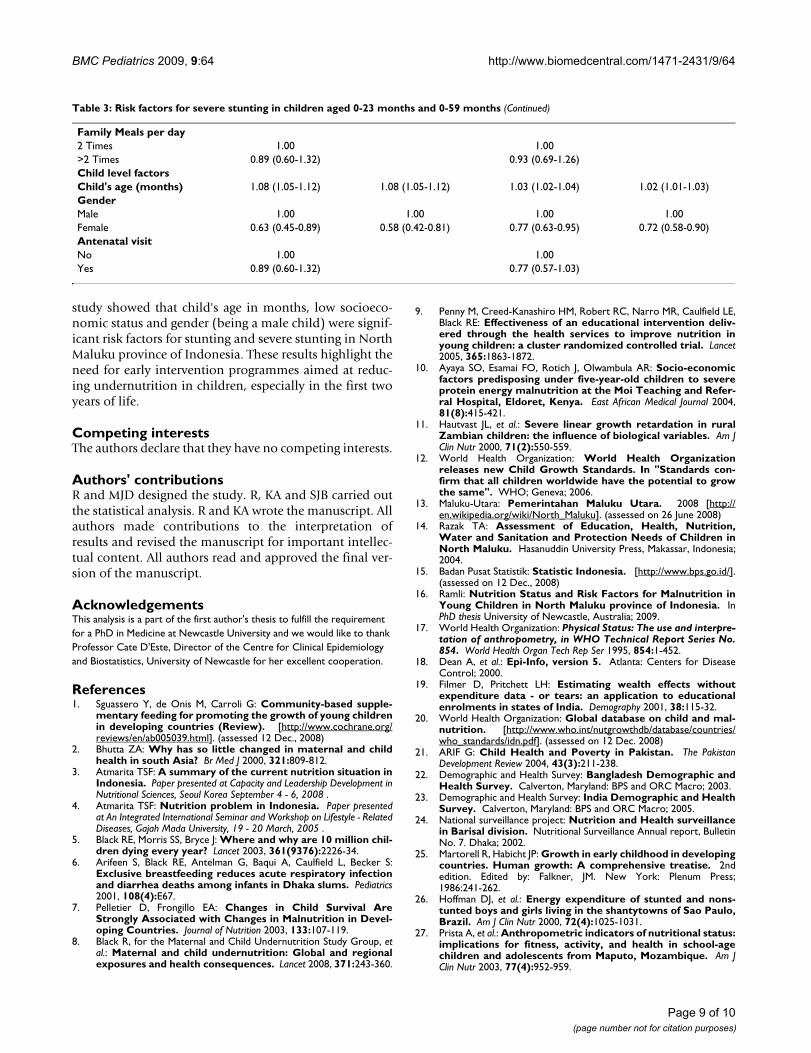
Risk factors for severe stuntingAs shown in Table 3 the AOR indicated that children aged0-23 months from families in the least poor or middlehousehold wealth index categories had reduced odds ofbeing severely stunted compared to those from the poor-est families. Increasing age of the child was significantlyassociated with severe stunting (AOR = 1.08, 95%CI: 1.05- 1.12; p < 0.001). Boys aged 0-23 months had increased
odds of being severely stunted compared with girls aged 0-23 months (AOR = 0.58, 95%CI: 0.42 - 0.81; p = 0.002).
Children aged 0-59 months from least poor families hadreduced odds of being severely stunted (AOR = 0.52,95%CI: 0.33 - 0.83; p = 0.005) compared with those frommiddle and poorest families. Increasing age of the childwas significantly associated with severe stunting in chil-dren aged 0-59 months (AOR = 1.02, 95%CI: 1.01 - 1.03;p < 0.001). Boys aged 0-59 months had increased odds ofbeing severely stunted compared to girls aged 0-59months (AOR = 0.72, 95%CI: 0.58 - 0.90; p = 0.005).
DiscussionThis paper presents data on the prevalence and risk factorsassociated with stunting and severe stunting in children inNorth Maluku province of Indonesia. This is the firststudy to assess the prevalence and factors associated withstunting and severe stunting in children aged less than fiveyears in North Maluku province of Indonesia.
The prevalence of stunting in children in this populationwas high with 29% of the children aged 0-23 months and38.4% of the children aged 0-59 months being stuntedwhile, 14.1% and 18.4%, respectively were severely
Household member≤5 members 1359 31.3 (27.6-35.4) 14.8 (11.6-18.7) 39.3 (36.2-42.5) 18.5 (15.7-21.7)6-12 members 809 24.9 (21-29.4) 12.9 (10.1-16.4) 36.8 (33.0-40.8) 18.1 (15.2-21.3)Number of family Meals per day2 Times 675 24.9 (20.5-29.8) 13.1 (9.9-17.1) 36.3 (32.2-40.6) 17.6 (14.3-21.6)>2 Times 1493 30.8 (27.0-34.8) 14.5 (11.5-18.2) 39.3 (36.22-42.5) 18.7 (16-21.8)Child level factorsChild's age in category0-5 266 12.8 (9.1-17.7)*** 7.9 (5.6-11.0)*** 12.8 (9.1-17.7)*** 7.9 (5.6-11.0)***6-11 365 24.1 (19.3-29.7) 10.1 (5.6-11.0)*** 24.1 (19.3-29.7) 10.1 (6.6-15.2)12-17 318 33.9 (28.6-39.7) 15.7 (5.6-11.0)*** 33.9 (28.6-39.7) 15.7 (11.7-20.8)18-23 234 48.3 (40.3-56.3) 25.2 (5.6-11.0)*** 48.3 (40.3-56.3) 25.2 (18.8-32.9)24-29 238 48.7 (42.2-55.4) 26.5 (20.4-33.6)30-35 169 51.5 (42.9-60.0) 23.1 (16.8-30.8)36-41 215 52.6 (45.9-59.1) 25.6 (20.5-31.5)42-47 147 47.6 (37.7-57.7) 19.7 (13-28.8)48-53 135 49.6 (39.9-59.4) 23.7 (16.8-32.3)54-59 81 44.4 (34.6-54.8) 16.1 (8.7-27.6)GenderMale 1115 32.2 (28.0-36.7)* 16.7 (13.2-21.1)** 41.4 (37.9-44.8)* 20.5 (17.4-24.1)**Female 1053 25.6 (21.6-30.1) 11.3 (8.9-14.3) 35.2 (31.8-38.8) 16.1 (13.7-18.7)Antenatal visit (n = 2110)No 91 39.6 (27.2-53.4) 16.7 (7.6-32.7) 44.0 (35.1-53.2) 23.1 (15.4-33.1)Yes 2019 28.4 (25.4-31.5) 16.7 (11.5-16.6) 38.2 (35.6-40.9) 18.2 (15.9-20.8)
Overall 29.0 (26.0-32.2) 16.7 (11.7-17.0) 38.4 (35.9-41.0) 18.4 (16.1-20.9)
*P < 0.05; **P < 0.01, ***P < 0.001; X2-test was applied to test statistical significanceWeighted total was 2168 otherwise stated within brackets
Table 1: Prevalence of stunting and severe stunting in children aged 0-23 months and 0-59 months (Continued)
Page 5 of 10(page number not for citation purposes)
BMC Pediatrics 2009, 9:64 http://www.biomedcentral.com/1471-2431/9/64
Table 2: Risk factors for stunting in children aged 0-23 months and 0-59 months
Characteristic Stunted children 0-23 Months Stunted children 0-59 Months
Unadjusted OR (95% CI) Adjusted OR (AOR) (95% CI)
Unadjusted OR (95% CI) AOR (95% CI)
RegionRural 1.00 1.00Urban 1.13 (0.77-1.65) 1.33 (1.03-1.71)DistrictTernate 1.00 1.00Tidore 0.53 (0.24-1.17) 0.60 (0.38-0.94)Central Halmahera 1.06 (0.66-1.72) 1.31 (0.91-1.88)East Halmahera 1.31 (0.76-2.24) 1.29 (0.81-2.06)West Halmahera 0.69 (0.38-1.28) 1.08 (0.78-1.50)North Halmahera 1.01 (0.62-1.64) 1.24 (0.84-1.83)South Halmahera 0.73 (0.46-1.16) 1.10 (0.82-1.45)Sula-Isles 0.84 (0.50-1.41) 0.91 (0.66-1.26)Household factors Father's educationCompleted Elementary School (aged 7-12)
1.00 1.00
Completed Middle School (aged 13-15)
0.84 (0.59-1.21) 0.90 (0.71-1.14)
Completed High School (aged 16-18)
0.76 (0.55-1.05) 0.70 (0.57-0.91)
Mother's EducationCompleted Elementary School (aged 7-12)
1.00 1.00
Completed Middle School (aged 13-15)
0.95 (0.69-1.31) 0.85 (0.66-1.09)
Completed High School (aged 16-18)
0.73 (0.55-0.97) 0.64 (0.50-0.83)
Parental EducationBoth with high education 1.00 1.00Father with high education 1.41 (0.78-2.54) 1.37 (0.92-2.04)Mother with high education 1.17 (0.83-1.64) 1.38 (1.09-1.73)Neither with high education 1.31 (0.96-1.80) 1.43 (1.11-1.84)Provided with nutritional information during pregnancyNo 1.00 1.00Yes 0.78 (0.56-1.07) 0.77 (0.57-1.03)Father's occupationAny Labour 1.00 1.00Fisher man 0.93 (0.66-1.32) 0.83 (0.65-1.06)No work 1.35 (0.65-2.80) 1.23 (0.77-1.96)Government private officer 0.92 (0.62-1.38) 0.77 (0.60-0.99)Mother's occupationAny Labour 1.00 1.00Fisherwoman 1.03 (0.58-1.83) 0.96 (0.65-1.42)No work 0.93 (0.69-1.25) 0.93 (0.75-1.17)Government private officer 0.96 (0.49-1.92) 0.89 (0.55-1.46)Parental employmentBoth working 1.00 1.00Father only working 0.92 (0.70-1.21) 0.97 (0.79-1.18)Mother only working 1.18 (0.39-3.59) 1.83 (0.97-3.47)Neither working 1.41 (0.62-3.20) 0.95 (0.47-1.92)Household wealth IndexPoorest 1.00 1.00 1.00Middle 0.80 (0.58-1.10) 0.87 (0.65-1.16) 0.78 (0.63-0.98)Least Poor 0.62 (0.41-0.94) 0.50 (0.33-0.75) 0.62 (0.45-0.85)Household member≤5 members 1.00 1.006-12 members 0.73 (0.56-0.95) 0.90 (0.73-1.11)
Page 6 of 10(page number not for citation purposes)
BMC Pediatrics 2009, 9:64 http://www.biomedcentral.com/1471-2431/9/64
stunted. This level of stunting in North Maluku was higherthan the national level among children aged 0-59 monthsof 28.6% reported in 2004 [20].
The prevalence of stunting and severe stunting was higherin children aged 24-59 months (50% vs 24%, respec-tively) than those children aged 0-23 months. This find-ings is similar to the results from Bangladesh, India andPakistan [21-23] where children aged 24-59 months werefound to be at a greater risk of being stunted. This suggeststhat for children aged 24-59 months stunting is not likelyto be reversible [24]. Our findings support the previousassertions that the prevalence of stunting remains con-stant after 2 or 3 years of life [25].
Comparing the present study with children in four regions(Africa; Asia, Latin and South America), the prevalence ofstunting in children 0-59 months in North Maluku prov-ince of Indonesia was slightly lower than that of Africa(40.1%), higher in Asia (31.3%), Latin America (16.1%)and South America (13.8%)[8]. These differences in prev-alence likely result from a combination of factors likeenvironmental, cultural differences and prolonged civilconflicts or war.
The results indicate that the gender of the child is a strongpredictor of stunting and severe stunting in children aged0-23 months and children aged 0-59 months. Girls hadlower odds of becoming stunted or severely stunted com-pared to boys which supports the findings of other studies[26-28]. During infancy and childhood, girls were lesslikely to become stunted and severely stunted than boysand infant girls survive in greater numbers than infantboys in most developing countries including Indonesia[26-28].
Multivariate analyses identified that the following factorswere statistically significantly associated with stuntingand severe stunting for all of the three age categories aftercontrolling for potential confounders: (a) number of fam-ily meals per day (2 meals per day); (b) child's age inmonths; (c) male sex; (d) household wealth (poorest); (e)parental employment (not working) and (f) district (Cen-
tral and South Halmahera). These findings support simi-lar studies indicating that mother's education, householdwealth, gender, age and employment were significantlyassociated with stunted children [28-30].
This study suggests that stunting in children in NorthMaluku may be reduced by improving mother's educa-tion, mother's nutritional information and reducing pov-erty. This study highlights the need to provide specialattention to reducing stunting in the Central and SouthHalmahera districts. Interventions for improving the pro-vision of education for girls are required as lack of educa-tion appears to be a major risk factor for stunting inchildren in North Maluku province.
A number of important limitations due to the nature ofthe data used (secondary data analysis) needs to be con-sidered. Firstly, there is no dietary intake data to supportour findings. Secondly, this study used only two maincharacteristics (family and child level factors). Finally, thedesign is cross-sectional and reports only a "snapshot" ofthe frequency of stunting and severe stunting. Hence nostrong conclusions can be made as to the possible causesof stunting and severe stunting.
Despite these limitations, the findings from this studycontribute to our understanding of the factors associatedwith stunting and severe stunting in children aged 0-59months in North Maluku, Indonesia. The findings in thisstudy will assist the local government in North Malukudevelop an appropriate intervention for the children aged0-59 months and their parents. It may also help the Indo-nesian government public health planners develop anational nutrition program and interventions targetingyoung children especially in post conflict areas in easternIndonesia. However, further research is required to under-stand the dietary and other determinants (including envi-ronmental risk factors) of stunting in North Malukuprovince of Indonesia.
ConclusionChildhood malnutrition remains a major public healthproblem in Indonesia. Results from this cross-sectional
Family Meals per day2 Times 1.00 1.00 1.00>2 Times 0.74 (0.54-1.02) 0.70 (0.50-0.99) 0.88 (0.70-1.11)Child level factorsChild's age (months) 1.10 (1.07-1.14) 1.11 (1.08-1.14) 1.03 (1.02-1.04) 1.03 (1.02-1.04)GenderMale 1.00 1.00 1.00 1.00Female 0.73 (0.54-0.97) 0.67 (0.50-0.89) 0.77 (0.63-0.95) 0.74 (0.59-0.93)Antenatal visitNo 1.00 1.00Yes 0.89 (0.60-1.32) 0.77 (0.57-1.03)
Table 2: Risk factors for stunting in children aged 0-23 months and 0-59 months (Continued)
Page 7 of 10(page number not for citation purposes)
BMC Pediatrics 2009, 9:64 http://www.biomedcentral.com/1471-2431/9/64
Table 3: Risk factors for severe stunting in children aged 0-23 months and 0-59 months
Characteristic Severely stunted children 0-23 Months Severely stunted children 0-59 Months
Unadjusted OR (95% CI) Adjusted OR (95% CI) Unadjusted OR (95% CI) Adjusted OR (95% CI)
RegionRural 1.00 1.00Urban 1.04 (0.64-1.70) 1.33 (1.03-1.71)DistrictTernate 1.00 1.00Tidore 0.88 (0.29-2.68) 0.60 (0.38-0.94)Central Halmahera 1.10 (0.64-1.92) 1.31 (0.91-1.88)East Halmahera 1.70 (0.81-3.56) 1.29 (0.81-2.06)West Halmahera 0.40 (0.18-0.92) 1.08 (0.78-1.50)North Halmahera 0.93 (0.51-1.68) 1.24 (0.84-1.83)South Halmahera 0.85 (0.46-1.57) 1.10 (0.82-1.45)Sula-Isles 0.72 (0.37-1.40) 0.91 (0.66-1.26)Household factors Father's educationCompleted Elementary School (aged 7-12)
1.00 1.00
Completed Middle School (aged 13-15)
0.78 (0.48-1.26) 0.89 (0.64-1.24)
Completed High School (aged 16-18)
0.75 (0.51-1.10) 0.68 (0.50-0.91)
Mother's educationCompleted Elementary School (aged 7-12)
1.00 1.00
Completed Middle School (aged 13-15)
0.65 (0.41-1.05) 0.70 (0.51-0.98)
Completed High School (aged 16-18)
0.63 (0.43-0.92) 0.66 (0.49-0.88)
Parental educationBoth with high education 1.00 1.00Father with high education 1.07 (0.44-2.63) 1.37 (0.92-2.04)Mother with high education 1.51 (0.97-2.35) 1.38 (1.09-1.73)Neither with high education 1.62 (1.09-2.41) 1.43 (1.11-1.84)Provided with nutritional information during pregnancyNo 1.00 1.00Yes 0.78 (0.56-1.07) 0.77 (0.57-1.03)Father's occupationAny Labour 1.00 1.00 1.00Fisherman 0.80 (0.49-1.32) 0.92 (0.70-1.19) 1.13 (0.85-1.52)No work 1.45 (0.63-3.34) 1.65 (0.92-2.94) 2.04 (1.17-3.53)Government private officer 0.68 (0.42-1.10) 0.63 (0.45-0.89) 0.79 (0.55-1.14)Mother's occupationAny Labour 1.00 1.00Fisherwoman 1.33 (0.62-2.88) 1.31 (0.78-2.22)No work 0.93 (0.63-1.39) 0.98 (0.75-1.28)Government private officer 1.01 (0.51-2.01) 0.83 (0.49-1.40)Parental employmentBoth working 1.00 1.00Father only working 0.87 (0.60-1.26) 0.97 (0.79-1.18)Mother only working 0.88 (0.16-4.74) 1.83 (0.97-3.47)Neither working 1.90 (0.72-5.01) 0.95 (0.47-1.92)Household wealth IndexPoorest 1.00 1.00 1.00 1.00Middle 0.77 (0.51-1.15) 0.78 (0.52-1.18) 0.87 (0.65-1.16) 0.89 (0.66-1.20)Least Poor 0.43 (0.24 -0.79) 0.42 (0.23-0.79) 0.50 (0.33-0.75) 0.52 (0.33-0.82)Household member≤5 members 1.00 1.006-12 members 0.86 (0.59-1.24) 0.90 (0.73-1.11)
Page 8 of 10(page number not for citation purposes)
BMC Pediatrics 2009, 9:64 http://www.biomedcentral.com/1471-2431/9/64
study showed that child's age in months, low socioeco-nomic status and gender (being a male child) were signif-icant risk factors for stunting and severe stunting in NorthMaluku province of Indonesia. These results highlight theneed for early intervention programmes aimed at reduc-ing undernutrition in children, especially in the first twoyears of life.
Competing interestsThe authors declare that they have no competing interests.
Authors' contributionsR and MJD designed the study. R, KA and SJB carried outthe statistical analysis. R and KA wrote the manuscript. Allauthors made contributions to the interpretation ofresults and revised the manuscript for important intellec-tual content. All authors read and approved the final ver-sion of the manuscript.
AcknowledgementsThis analysis is a part of the first author's thesis to fulfill the requirement for a PhD in Medicine at Newcastle University and we would like to thank Professor Cate D'Este, Director of the Centre for Clinical Epidemiology and Biostatistics, University of Newcastle for her excellent cooperation.
References1. Sguassero Y, de Onis M, Carroli G: Community-based supple-
mentary feeding for promoting the growth of young childrenin developing countries (Review). [http://www.cochrane.org/reviews/en/ab005039.html]. (assessed 12 Dec., 2008)
2. Bhutta ZA: Why has so little changed in maternal and childhealth in south Asia? Br Med J 2000, 321:809-812.
3. Atmarita TSF: A summary of the current nutrition situation inIndonesia. Paper presented at Capacity and Leadership Development inNutritional Sciences, Seoul Korea September 4 - 6, 2008 .
4. Atmarita TSF: Nutrition problem in Indonesia. Paper presentedat An Integrated International Seminar and Workshop on Lifestyle - RelatedDiseases, Gajah Mada University, 19 - 20 March, 2005 .
5. Black RE, Morris SS, Bryce J: Where and why are 10 million chil-dren dying every year? Lancet 2003, 361(9376):2226-34.
6. Arifeen S, Black RE, Antelman G, Baqui A, Caulfield L, Becker S:Exclusive breastfeeding reduces acute respiratory infectionand diarrhea deaths among infants in Dhaka slums. Pediatrics2001, 108(4):E67.
7. Pelletier D, Frongillo EA: Changes in Child Survival AreStrongly Associated with Changes in Malnutrition in Devel-oping Countries. Journal of Nutrition 2003, 133:107-119.
8. Black R, for the Maternal and Child Undernutrition Study Group, etal.: Maternal and child undernutrition: Global and regionalexposures and health consequences. Lancet 2008, 371:243-360.
9. Penny M, Creed-Kanashiro HM, Robert RC, Narro MR, Caulfield LE,Black RE: Effectiveness of an educational intervention deliv-ered through the health services to improve nutrition inyoung children: a cluster randomized controlled trial. Lancet2005, 365:1863-1872.
10. Ayaya SO, Esamai FO, Rotich J, Olwambula AR: Socio-economicfactors predisposing under five-year-old children to severeprotein energy malnutrition at the Moi Teaching and Refer-ral Hospital, Eldoret, Kenya. East African Medical Journal 2004,81(8):415-421.
11. Hautvast JL, et al.: Severe linear growth retardation in ruralZambian children: the influence of biological variables. Am JClin Nutr 2000, 71(2):550-559.
12. World Health Organization: World Health Organizationreleases new Child Growth Standards. In "Standards con-firm that all children worldwide have the potential to growthe same". WHO; Geneva; 2006.
13. Maluku-Utara: Pemerintahan Maluku Utara. 2008 [http://en.wikipedia.org/wiki/North_Maluku]. (assessed on 26 June 2008)
14. Razak TA: Assessment of Education, Health, Nutrition,Water and Sanitation and Protection Needs of Children inNorth Maluku. Hasanuddin University Press, Makassar, Indonesia;2004.
15. Badan Pusat Statistik: Statistic Indonesia. [http://www.bps.go.id/].(assessed on 12 Dec., 2008)
16. Ramli: Nutrition Status and Risk Factors for Malnutrition inYoung Children in North Maluku province of Indonesia. InPhD thesis University of Newcastle, Australia; 2009.
17. World Health Organization: Physical Status: The use and interpre-tation of anthropometry, in WHO Technical Report Series No.854. World Health Organ Tech Rep Ser 1995, 854:1-452.
18. Dean A, et al.: Epi-Info, version 5. Atlanta: Centers for DiseaseControl; 2000.
19. Filmer D, Pritchett LH: Estimating wealth effects withoutexpenditure data - or tears: an application to educationalenrolments in states of India. Demography 2001, 38:115-32.
20. World Health Organization: Global database on child and mal-nutrition. [http://www.who.int/nutgrowthdb/database/countries/who_standards/idn.pdf]. (assessed on 12 Dec. 2008)
21. ARIF G: Child Health and Poverty in Pakistan. The PakistanDevelopment Review 2004, 43(3):211-238.
22. Demographic and Health Survey: Bangladesh Demographic andHealth Survey. Calverton, Maryland: BPS and ORC Macro; 2003.
23. Demographic and Health Survey: India Demographic and HealthSurvey. Calverton, Maryland: BPS and ORC Macro; 2005.
24. National surveillance project: Nutrition and Health surveillancein Barisal division. Nutritional Surveillance Annual report, BulletinNo. 7. Dhaka; 2002.
25. Martorell R, Habicht JP: Growth in early childhood in developingcountries. Human growth: A comprehensive treatise. 2ndedition. Edited by: Falkner, JM. New York: Plenum Press;1986:241-262.
26. Hoffman DJ, et al.: Energy expenditure of stunted and nons-tunted boys and girls living in the shantytowns of Sao Paulo,Brazil. Am J Clin Nutr 2000, 72(4):1025-1031.
27. Prista A, et al.: Anthropometric indicators of nutritional status:implications for fitness, activity, and health in school-agechildren and adolescents from Maputo, Mozambique. Am JClin Nutr 2003, 77(4):952-959.
Family Meals per day2 Times 1.00 1.00>2 Times 0.89 (0.60-1.32) 0.93 (0.69-1.26)Child level factorsChild's age (months) 1.08 (1.05-1.12) 1.08 (1.05-1.12) 1.03 (1.02-1.04) 1.02 (1.01-1.03)GenderMale 1.00 1.00 1.00 1.00Female 0.63 (0.45-0.89) 0.58 (0.42-0.81) 0.77 (0.63-0.95) 0.72 (0.58-0.90)Antenatal visitNo 1.00 1.00Yes 0.89 (0.60-1.32) 0.77 (0.57-1.03)
Table 3: Risk factors for severe stunting in children aged 0-23 months and 0-59 months (Continued)
Page 9 of 10(page number not for citation purposes)
BMC Pediatrics 2009, 9:64 http://www.biomedcentral.com/1471-2431/9/64
Publish with BioMed Central and every scientist can read your work free of charge
"BioMed Central will be the most significant development for disseminating the results of biomedical research in our lifetime."
Sir Paul Nurse, Cancer Research UK
Your research papers will be:
available free of charge to the entire biomedical community
peer reviewed and published immediately upon acceptance
cited in PubMed and archived on PubMed Central
yours — you keep the copyright
Submit your manuscript here:http://www.biomedcentral.com/info/publishing_adv.asp
BioMedcentral
28. Moestue H, Huttly S: Adult education and child nutrition: therole of family and community. J Epidemiol Community Health2008, 62(2):153-159.
29. Harpham T, De Silva MJ, Tuan T: Maternal social capital and childhealth in Vietnam. J Epidemiol Community Health 2006,60(10):865-871.
30. Addison CC: Nutrition and an active lifestyle. From knowl-edge to action. J Epidemiol Community Health 2006, 60(8):735.
Pre-publication historyThe pre-publication history for this paper can be accessedhere:
http://www.biomedcentral.com/1471-2431/9/64/prepub
Page 10 of 10(page number not for citation purposes)