Prevalence and correlates of physical disability and functional limitation among community dwelling...
13
RESEARCH ARTICLE Open Access Prevalence and correlates of physical disability and functional limitation among community dwelling older people in rural Malaysia, a middle income country Noran N Hairi 1,2,3* , Awang Bulgiba 1,3 , Robert G Cumming 2,4,5 , Vasi Naganathan 4 , Izzuna Mudla 6 Abstract Background: The prevalence and correlates of physical disability and functional limitation among older people have been studied in many developed countries but not in a middle income country such as Malaysia. The present study investigated the epidemiology of physical disability and functional limitation among older people in Malaysia and compares findings to other countries. Methods: A population-based cross sectional study was conducted in Alor Gajah, Malacca. Seven hundred and sixty five older people aged 60 years and above underwent tests of functional limitation (Tinetti Performance Oriented Mobility Assessment Tool). Data were also collected for self reported activities of daily living (ADL) using the Barthel Index (ten items). To compare prevalence with other studies, ADL disability was also defined using six basic ADL’s (eating, bathing, dressing, transferring, toileting and walking) and five basic ADL’s (eating, bathing, dressing, transferring and toileting). Results: Ten, six and five basic ADL disability was reported by 24.7% (95% CI 21.6-27.9), 14.4% (95% CI 11.9-17.2) and 10.6% (95% CI 8.5-13.1), respectively. Functional limitation was found in 19.5% (95% CI 16.8-22.5) of participants. Variables independently associated with 10 item ADL disability physical disability, were advanced age (≥ 75 years: prevalence ratio (PR) 7.9; 95% CI 4.8-12.9), presence of diabetes (PR 1.8; 95% CI 1.4-2.3), stroke (PR 1.5; 95% CI 1.1-2.2), depressive symptomology (PR 1.3; 95% CI 1.1-1.8) and visual impairment (blind: PR 2.0; 95% CI 1.1- 3.6). Advancing age (≥ 75 years: PR 3.0; 95% CI 1.7-5.2) being female (PR 2.7; 95% CI 1.2-6.1), presence of arthritis (PR 1.6; 95% CI 1.2-2.1) and depressive symptomology (PR 2.0; 95% CI 1.5-2.7) were significantly associated with functional limitation. Conclusions: The prevalence of physical disability and functional limitation among older Malaysians appears to be much higher than in developed countries but is comparable to developing countries. Associations with socio- demographic and other health related variables were consistent with other studies. Background The world’s population is aging. The most rapid growth of older people is seen in the developing world [1]. At present, developed nations are experiencing relatively lit- tle change in the increase in older people as compared to the developing nations (middle income and low income countries) [1]. Malaysia is an example of such a population. The proportion of older Malaysians (age 60 years and above) will grow from 6.3% (1.4 million) in 2000 to 12% (4.9 million) by 2030, doubling in propor- tion but more than tripling in number [2]. Malaysia’s economy has changed from agriculture to one that is supported by manufacturing, and high tech- nology industry. As a result of this, the younger popula- tion are migrating to the urban areas, seeking employment. The older population, being less likely to * Correspondence: [email protected] 1 Department of Social and Preventive Medicine, Faculty of Medicine, University Malaya, Kuala Lumpar, Malaysia Full list of author information is available at the end of the article Hairi et al. BMC Public Health 2010, 10:492 http://www.biomedcentral.com/1471-2458/10/492 © 2010 Hairi et al; licensee BioMed Central Ltd. This is an Open Access article distributed under the terms of the Creative Commons Attribution License (http://creativecommons.org/licenses/by/2.0), which permits unrestricted use, distribution, and reproduction in any medium, provided the original work is properly cited.
Transcript of Prevalence and correlates of physical disability and functional limitation among community dwelling...
RESEARCH ARTICLE Open Access
Prevalence and correlates of physical disabilityand functional limitation among communitydwelling older people in rural Malaysia, a middleincome countryNoran N Hairi1,2,3*, Awang Bulgiba1,3, Robert G Cumming2,4,5, Vasi Naganathan4, Izzuna Mudla6
Abstract
Background: The prevalence and correlates of physical disability and functional limitation among older peoplehave been studied in many developed countries but not in a middle income country such as Malaysia. The presentstudy investigated the epidemiology of physical disability and functional limitation among older people in Malaysiaand compares findings to other countries.
Methods: A population-based cross sectional study was conducted in Alor Gajah, Malacca. Seven hundred andsixty five older people aged 60 years and above underwent tests of functional limitation (Tinetti PerformanceOriented Mobility Assessment Tool). Data were also collected for self reported activities of daily living (ADL) usingthe Barthel Index (ten items). To compare prevalence with other studies, ADL disability was also defined using sixbasic ADL’s (eating, bathing, dressing, transferring, toileting and walking) and five basic ADL’s (eating, bathing,dressing, transferring and toileting).
Results: Ten, six and five basic ADL disability was reported by 24.7% (95% CI 21.6-27.9), 14.4% (95% CI 11.9-17.2)and 10.6% (95% CI 8.5-13.1), respectively. Functional limitation was found in 19.5% (95% CI 16.8-22.5) ofparticipants. Variables independently associated with 10 item ADL disability physical disability, were advanced age(≥ 75 years: prevalence ratio (PR) 7.9; 95% CI 4.8-12.9), presence of diabetes (PR 1.8; 95% CI 1.4-2.3), stroke (PR 1.5;95% CI 1.1-2.2), depressive symptomology (PR 1.3; 95% CI 1.1-1.8) and visual impairment (blind: PR 2.0; 95% CI 1.1-3.6). Advancing age (≥ 75 years: PR 3.0; 95% CI 1.7-5.2) being female (PR 2.7; 95% CI 1.2-6.1), presence of arthritis(PR 1.6; 95% CI 1.2-2.1) and depressive symptomology (PR 2.0; 95% CI 1.5-2.7) were significantly associated withfunctional limitation.
Conclusions: The prevalence of physical disability and functional limitation among older Malaysians appears to bemuch higher than in developed countries but is comparable to developing countries. Associations with socio-demographic and other health related variables were consistent with other studies.
BackgroundThe world’s population is aging. The most rapid growthof older people is seen in the developing world [1]. Atpresent, developed nations are experiencing relatively lit-tle change in the increase in older people as comparedto the developing nations (middle income and low
income countries) [1]. Malaysia is an example of such apopulation. The proportion of older Malaysians (age 60years and above) will grow from 6.3% (1.4 million) in2000 to 12% (4.9 million) by 2030, doubling in propor-tion but more than tripling in number [2].Malaysia’s economy has changed from agriculture to
one that is supported by manufacturing, and high tech-nology industry. As a result of this, the younger popula-tion are migrating to the urban areas, seekingemployment. The older population, being less likely to
* Correspondence: [email protected] of Social and Preventive Medicine, Faculty of Medicine,University Malaya, Kuala Lumpar, MalaysiaFull list of author information is available at the end of the article
Hairi et al. BMC Public Health 2010, 10:492http://www.biomedcentral.com/1471-2458/10/492
© 2010 Hairi et al; licensee BioMed Central Ltd. This is an Open Access article distributed under the terms of the Creative CommonsAttribution License (http://creativecommons.org/licenses/by/2.0), which permits unrestricted use, distribution, and reproduction inany medium, provided the original work is properly cited.
migrate, are left behind to look after themselves. In2000, 8% of Malaysian rural population comprised olderpeople age 60 years and above as compared to only 5%in the urban population[2]. Malaysian health care deliv-ery is provided by the government and private sectors.Health care in the rural areas is delivered through anetwork of health facilities supported by an organizedsystem of referral. Mobile teams make regular visits topockets of population in remote areas. Even though sig-nificant progress has been made in establishing anextensive health care delivery system for Malaysian ruralpopulation, the recent National Health and MorbiditySurvey III in 2006 revealed that prevalence of hyperten-sion, hypercholesterolemia, being underweight andsmoking is much higher among the rural populationthan their urban counterparts[3]. A World Health Orga-nization (WHO) study also revealed that Malaysianelderly residing in rural areas experienced greater finan-cial hardship and express more need for health servicesthan those in urban areas[4].Physical disability and functional limitation are com-
mon among older people [5], leading to adverse conse-quences such as dependency and institutionalisation.Older people’s ability to function independently isimportant, as physical disability and functional limitationhave profound public health implications with increasedutilization of health care and a need for supportive ser-vices and long term care [6]. This highlights the need tostudy the prevalence of physical disability and functionallimitation especially in a rural underserved populationof older adults.Many studies on physical disability and functional lim-
itation have been carried out in developed countries [7].However, data are sparse for developing countries. Weconducted a cross sectional study with the aim of deter-mining the prevalence of physical disability and func-tional limitation in a developing middle income countryand comparing these estimates to what has beenreported in other countries. This study also aimed todetermine the factors associated with physical disabilityand functional limitation in our Malaysian population.
MethodsSample and ProcedureThe participants were rural older people aged 60 yearsand above from the Alor Gajah Older People HealthSurvey (AGOPHS). This is a community survey of thephysical and mental health of rural older people inMalaysia. In Malaysia 8% of the rural population areolder people as compared to 5% of the urban popula-tion. AGOPHS was conducted between May 2007 andNovember 2008. This survey was conducted in MukimMasjid Tanah, one of the sub-districts in Alor Gajah.Alor Gajah is a rural community situated in the
northwest region of the State of Malacca. Eligible parti-cipants were those who had lived in Masjid Tanah for atleast 12 months and who were 60 years of age andolder; age was confirmed by their identity card. Exclu-sion criteria were non-Malaysian citizens, older peopleresiding in nursing homes and admitted to hospitals.Survey participants were identified from a comprehen-sive community list. This list was developed by the Vil-lage Development Security Committee, a governmentinstitution at the village level. This organization admin-isters and manages the villages and collects populationand village profile annually. Interviews were conductedin participant’s own home and participants were invitedto the Health Clinic for the clinical assessments. Olderpeople who missed the appointment were contactedtwice in the subsequent weeks. The interviews and clini-cal assessments were conducted by five medical stu-dents. The medical students were given three daytraining by the study coordinator. The first day coveredbackground to the AGOPHS and survey administration.The second and third days focused on the clinicalassessments: the performance based functional limita-tion using the Tinetti Performance Oriented MobilityAssessment Tool and visual screening.As majority of older people in the rural areas converse
in Malay, the AGOPHS questionnaire was design in abi-lingual (Malay and English) manner. The question-naire had been pre-tested prior to the survey. The vali-dated Malay version of Geriatric Depression Scale(GDS) and Elderly Cognitive Assessment Questionnaire(ECAQ) was used in this survey. Certain terminologyand items in the questionnaire were made available inthe languages of the main ethnic groups in Malaysia;Hokkien and Cantonese for the Chinese and Tamil forthe Indians.
Definition and measurement of physical disability andfunctional limitationTwo physical function measures were used in the analy-sis: performance-based functional limitation and self-reported physical disability. The Tinetti PerformanceOriented Mobility Assessment Tool is a measure offunctional limitation that assesses older people’s gaitand balance abilities [8,9]. Briefly, the participants beganthe assessments seated in a hard, straight-backed, arm-less chair. Participants’ balance abilities were assessed byperforming manoeuvres such as sitting in chair, risingfrom chair, immediate standing balance (first three tofive seconds after standing), further standing balance,balance with eyes closed, turning balance, ability towithstand displacement when nudged on sternum, neckturning, one leg standing balance, back extension, reach-ing up, bending down and finally sitting down. For gaitassessment, participants were asked to stand with the
Hairi et al. BMC Public Health 2010, 10:492http://www.biomedcentral.com/1471-2458/10/492
Page 2 of 13
examiner in an obstacle-free hallway. Participants usedtheir usual walking aid and were asked to walk downthe hallway at their usual pace. Participants’ gaits wereobserved for initiation of gait, step height, step length,step symmetry, step continuity, path deviation, trunkstability, walk stance and turning while walking. Formanoeuvres such as path deviation, trunk stability, walkstance, the examiner walked behind the participants andfor others, next to the participants. Participants werethen asked to walk back at a “more rapid than usual butsafe pace” using usual walking aids. Each activity wasscored 0-1 or 0-2, where a score of 0 meant inability toperform the activity and a score of 1 or 2 meant abilityto perform the activity. The maximum score for the gaitcomponent was 12 points and for the balance compo-nent it was 16 points. Participants with scores of lessthan 12 (for gait) or less than 16 (for balance) weredefined as having performance based functionallimitation.Physical disability was determined by the ten-item
Barthel Index. This is an assessment of patients’ level ofindependence in activities of daily living (ADL) [10].The ten ADL items assessed were feeding, bathing, dres-sing, grooming, toileting, bladder control, bowel control,transfer from bed to chair, walking and stair climbing.For this study, physical disability was defined as needinghelp in one or more of these ADL activities. For com-parison with other studies, physical disability was alsodetermined based on six Katz ADL items related to self-care (feeding, dressing, bathing, toileting, transferringand walking) [11-14] and five items related to self-care(feeding, dressing, bathing, toileting and transferring)[15-19].
Socio-demographic and health related variablesData on the following socio-demographic characteristicswere collected by face-to-face interview: age, gender,ethnicity, education level, marital status, living arrange-ments and social support. Ethnic group was selfreported and categorised as Malays, Chinese, Indiansand Others. Information on the following health relatedvariables was obtained: cognitive function, presence ofchronic conditions, depressive symptomology, weightand height measurement and presenting visual acuity.Cognitive function was assessed using the Elderly Cogni-tive Assessment Questionnaire (ECAQ) [20]. ECAQ hasbeen shown to be a valid tool for assessment of cogni-tive impairment among older people living in developingcountries [20]. ECAQ scores range from 0-10. A scoreof 0 to 4 indicates probable cognitive impairment, 5 to 6borderline and 7 and above as normal. Respondentswere asked about the presence of chronic diseases usingthe following question: “Has your doctor ever told youthat you suffer from.......(disease)?” The disease include:
diabetes, epilepsy, hypertension, heart attack, coronaryor myocardial infarction, angina, congestive heart failure,chronic lung disease, asthma, stroke and arthritis.Depressive symptomology was assessed using the shortversion of the Geriatric Depression Scale 15 item (GDS)[21]. Scores ranges from 0-15, with scores of six ormore indicate depressive symptomology. Visual Acuity,height and weight were assessed at the Masjid TanahHealth Clinic and the Health Promotion Centre. Pre-senting visual acuity (PVA) was assessed using a stan-dard metric Snellen Chart of E type or alphabets at 6meters. Participants’ presenting visual acuity (PVA) wasascertained with them wearing their habitual optical cor-rections (spectacles). The WHO definition of visualimpairment defines mild or moderate visual impairmentas PVA of less than 6/18 but equal to or better than 3/60 [22]. Blindness is defined as PVA of less than 3/60 inthe better eye [22]. Height and weight were measuredwith the participants in light clothing and withoutshoes. Body mass index was calculated as weight (kg)/height (m)2.
Statistical AnalysisThe SAS version 9.1 (SAS Institute, Inc., Cary, NC,USA) was used for all analyses. Participants with cogni-tive impairment identified through scores of less thanfive based on the Elderly Cognitive Assessment Ques-tionnaire (ECAQ), were removed from the analysis (n =27). The prevalence of six item ADL dependence andfive item ADL dependence was estimated to allow com-parison with prevalence of ADL disability reported inother studies. For comparison purposes, the prevalenceof disability among older population in other studieswas age standardized to our population using the directstandardization method. We also used direct standardi-zation for comparing prevalence of physical disabilityand functional limitation across the three ethnic groupsin our study Malays, Chinese and Indians, using theMalays as the standard population.Due to the high prevalence of physical disability and
functional limitation, prevalence ratios (PR) were calcu-lated instead of odds ratio (OR) [23]. All analyses werecarried out using SAS Proc Genmod’s log binomialregression and Poisson regression with robust variance(when binomial regression models did not converge)[24]. Two sets of univariate analyses were performedusing chi-square tests:-first, analyses were done to iden-tify associations between the ten item physical disabilityand socio-demographic and health related variables and,second, similar analysis were done with functional lim-itation. Then, multivariate Poisson regression withrobust variance was performed to test which of thesocio-demographic and health-related variables wereindependently associated with physical disability and
Hairi et al. BMC Public Health 2010, 10:492http://www.biomedcentral.com/1471-2458/10/492
Page 3 of 13
functional limitation. Variables with clinical and statisti-cal significance (p value of < 0.25 in the univariate ana-lysis) were included in the model.
EthicsEthics approval was granted by the Medical Ethics Com-mittee, University Malaya Medical Centre, Kuala Lum-pur and the Ministry of Health, Malaysia. Informed(verbal) consent was obtained from all participants.
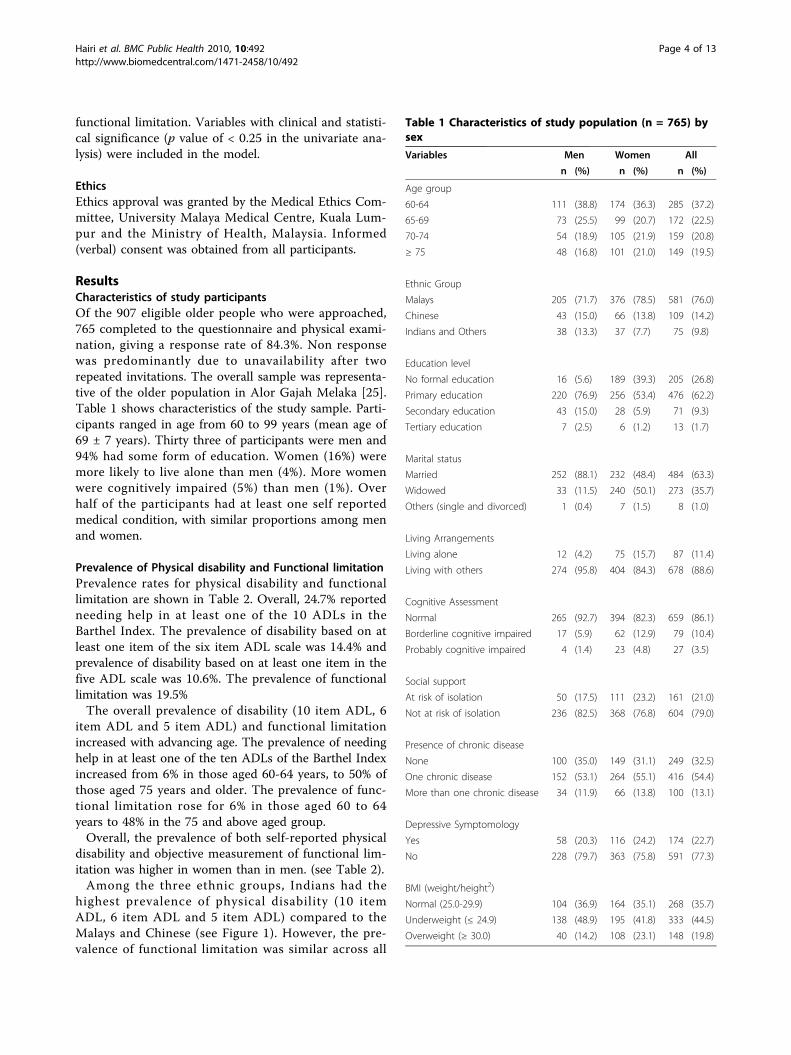
ResultsCharacteristics of study participantsOf the 907 eligible older people who were approached,765 completed to the questionnaire and physical exami-nation, giving a response rate of 84.3%. Non responsewas predominantly due to unavailability after tworepeated invitations. The overall sample was representa-tive of the older population in Alor Gajah Melaka [25].Table 1 shows characteristics of the study sample. Parti-cipants ranged in age from 60 to 99 years (mean age of69 ± 7 years). Thirty three of participants were men and94% had some form of education. Women (16%) weremore likely to live alone than men (4%). More womenwere cognitively impaired (5%) than men (1%). Overhalf of the participants had at least one self reportedmedical condition, with similar proportions among menand women.
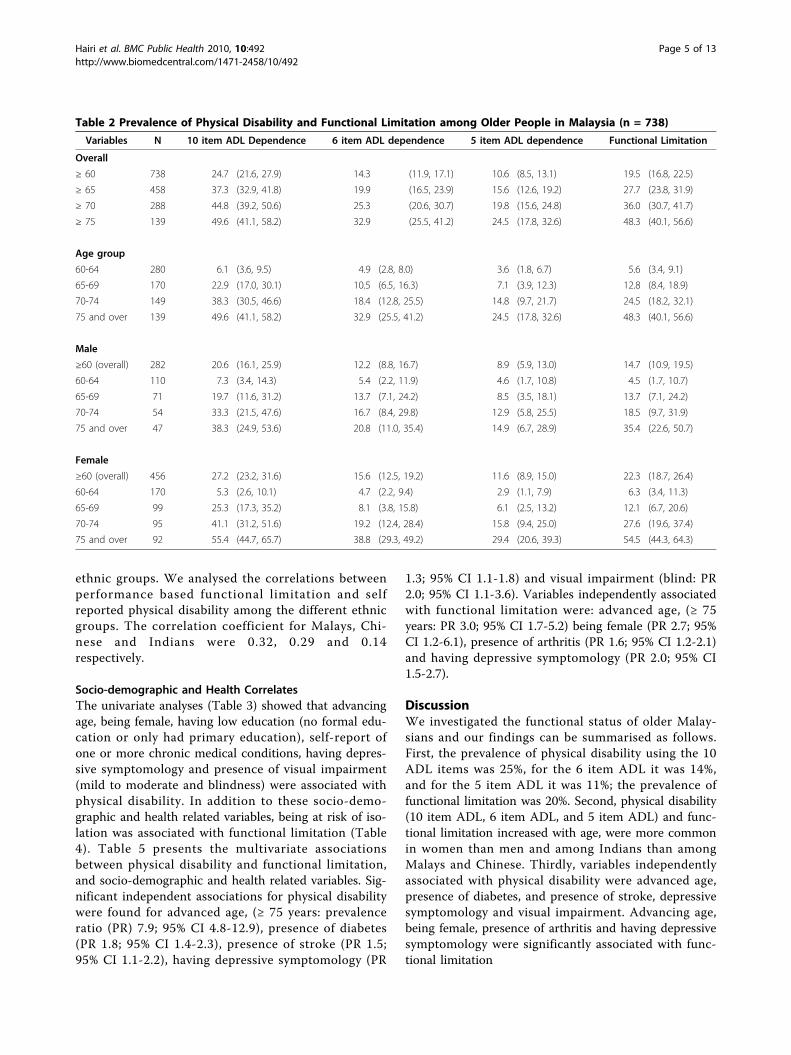
Prevalence of Physical disability and Functional limitationPrevalence rates for physical disability and functionallimitation are shown in Table 2. Overall, 24.7% reportedneeding help in at least one of the 10 ADLs in theBarthel Index. The prevalence of disability based on atleast one item of the six item ADL scale was 14.4% andprevalence of disability based on at least one item in thefive ADL scale was 10.6%. The prevalence of functionallimitation was 19.5%The overall prevalence of disability (10 item ADL, 6
item ADL and 5 item ADL) and functional limitationincreased with advancing age. The prevalence of needinghelp in at least one of the ten ADLs of the Barthel Indexincreased from 6% in those aged 60-64 years, to 50% ofthose aged 75 years and older. The prevalence of func-tional limitation rose for 6% in those aged 60 to 64years to 48% in the 75 and above aged group.Overall, the prevalence of both self-reported physical
disability and objective measurement of functional lim-itation was higher in women than in men. (see Table 2).Among the three ethnic groups, Indians had the
highest prevalence of physical disability (10 itemADL, 6 item ADL and 5 item ADL) compared to theMalays and Chinese (see Figure 1). However, the pre-valence of functional limitation was similar across all
Table 1 Characteristics of study population (n = 765) bysex
Variables Men Women All
n (%) n (%) n (%)
Age group
60-64 111 (38.8) 174 (36.3) 285 (37.2)
65-69 73 (25.5) 99 (20.7) 172 (22.5)
70-74 54 (18.9) 105 (21.9) 159 (20.8)
≥ 75 48 (16.8) 101 (21.0) 149 (19.5)
Ethnic Group
Malays 205 (71.7) 376 (78.5) 581 (76.0)
Chinese 43 (15.0) 66 (13.8) 109 (14.2)
Indians and Others 38 (13.3) 37 (7.7) 75 (9.8)
Education level
No formal education 16 (5.6) 189 (39.3) 205 (26.8)
Primary education 220 (76.9) 256 (53.4) 476 (62.2)
Secondary education 43 (15.0) 28 (5.9) 71 (9.3)
Tertiary education 7 (2.5) 6 (1.2) 13 (1.7)
Marital status
Married 252 (88.1) 232 (48.4) 484 (63.3)
Widowed 33 (11.5) 240 (50.1) 273 (35.7)
Others (single and divorced) 1 (0.4) 7 (1.5) 8 (1.0)
Living Arrangements
Living alone 12 (4.2) 75 (15.7) 87 (11.4)
Living with others 274 (95.8) 404 (84.3) 678 (88.6)
Cognitive Assessment
Normal 265 (92.7) 394 (82.3) 659 (86.1)
Borderline cognitive impaired 17 (5.9) 62 (12.9) 79 (10.4)
Probably cognitive impaired 4 (1.4) 23 (4.8) 27 (3.5)
Social support
At risk of isolation 50 (17.5) 111 (23.2) 161 (21.0)
Not at risk of isolation 236 (82.5) 368 (76.8) 604 (79.0)
Presence of chronic disease
None 100 (35.0) 149 (31.1) 249 (32.5)
One chronic disease 152 (53.1) 264 (55.1) 416 (54.4)
More than one chronic disease 34 (11.9) 66 (13.8) 100 (13.1)
Depressive Symptomology
Yes 58 (20.3) 116 (24.2) 174 (22.7)
No 228 (79.7) 363 (75.8) 591 (77.3)
BMI (weight/height2)
Normal (25.0-29.9) 104 (36.9) 164 (35.1) 268 (35.7)
Underweight (≤ 24.9) 138 (48.9) 195 (41.8) 333 (44.5)
Overweight (≥ 30.0) 40 (14.2) 108 (23.1) 148 (19.8)
Hairi et al. BMC Public Health 2010, 10:492http://www.biomedcentral.com/1471-2458/10/492
Page 4 of 13
ethnic groups. We analysed the correlations betweenperformance based functional limitation and selfreported physical disability among the different ethnicgroups. The correlation coefficient for Malays, Chi-nese and Indians were 0.32, 0.29 and 0.14respectively.
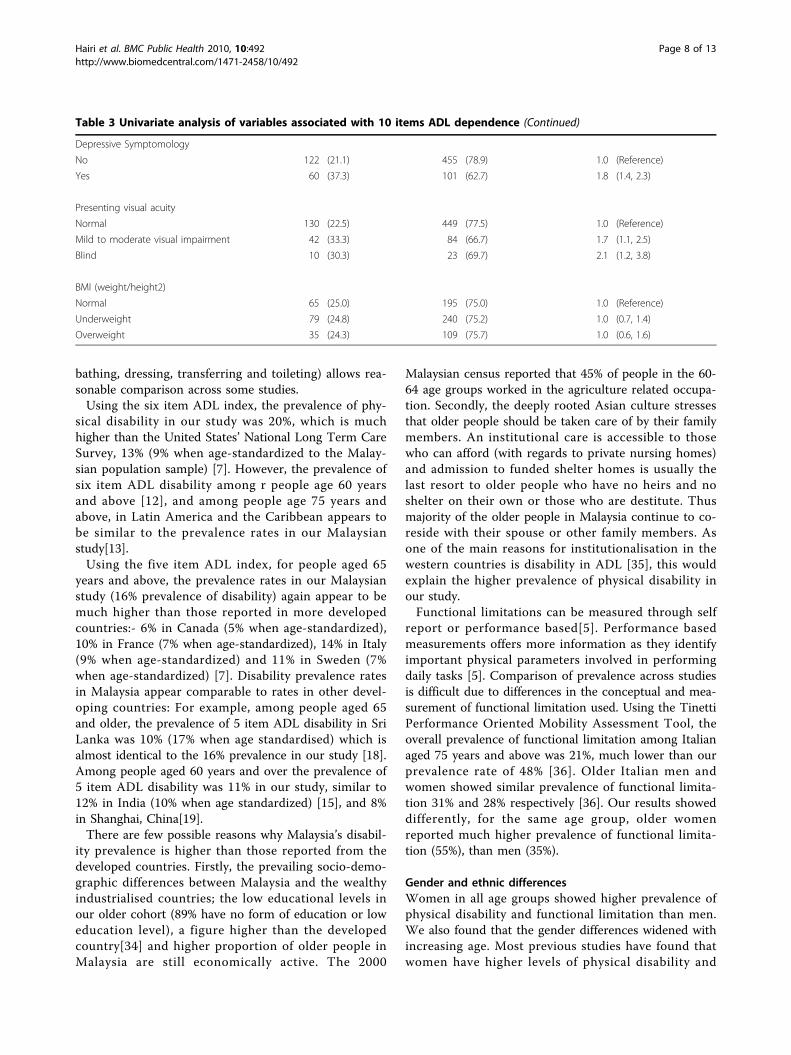
Socio-demographic and Health CorrelatesThe univariate analyses (Table 3) showed that advancingage, being female, having low education (no formal edu-cation or only had primary education), self-report ofone or more chronic medical conditions, having depres-sive symptomology and presence of visual impairment(mild to moderate and blindness) were associated withphysical disability. In addition to these socio-demo-graphic and health related variables, being at risk of iso-lation was associated with functional limitation (Table4). Table 5 presents the multivariate associationsbetween physical disability and functional limitation,and socio-demographic and health related variables. Sig-nificant independent associations for physical disabilitywere found for advanced age, (≥ 75 years: prevalenceratio (PR) 7.9; 95% CI 4.8-12.9), presence of diabetes(PR 1.8; 95% CI 1.4-2.3), presence of stroke (PR 1.5;95% CI 1.1-2.2), having depressive symptomology (PR
1.3; 95% CI 1.1-1.8) and visual impairment (blind: PR2.0; 95% CI 1.1-3.6). Variables independently associatedwith functional limitation were: advanced age, (≥ 75years: PR 3.0; 95% CI 1.7-5.2) being female (PR 2.7; 95%CI 1.2-6.1), presence of arthritis (PR 1.6; 95% CI 1.2-2.1)and having depressive symptomology (PR 2.0; 95% CI1.5-2.7).
DiscussionWe investigated the functional status of older Malay-sians and our findings can be summarised as follows.First, the prevalence of physical disability using the 10ADL items was 25%, for the 6 item ADL it was 14%,and for the 5 item ADL it was 11%; the prevalence offunctional limitation was 20%. Second, physical disability(10 item ADL, 6 item ADL, and 5 item ADL) and func-tional limitation increased with age, were more commonin women than men and among Indians than amongMalays and Chinese. Thirdly, variables independentlyassociated with physical disability were advanced age,presence of diabetes, and presence of stroke, depressivesymptomology and visual impairment. Advancing age,being female, presence of arthritis and having depressivesymptomology were significantly associated with func-tional limitation
Table 2 Prevalence of Physical Disability and Functional Limitation among Older People in Malaysia (n = 738)
Variables N 10 item ADL Dependence 6 item ADL dependence 5 item ADL dependence Functional Limitation
Overall
≥ 60 738 24.7 (21.6, 27.9) 14.3 (11.9, 17.1) 10.6 (8.5, 13.1) 19.5 (16.8, 22.5)
≥ 65 458 37.3 (32.9, 41.8) 19.9 (16.5, 23.9) 15.6 (12.6, 19.2) 27.7 (23.8, 31.9)
≥ 70 288 44.8 (39.2, 50.6) 25.3 (20.6, 30.7) 19.8 (15.6, 24.8) 36.0 (30.7, 41.7)
≥ 75 139 49.6 (41.1, 58.2) 32.9 (25.5, 41.2) 24.5 (17.8, 32.6) 48.3 (40.1, 56.6)
Age group
60-64 280 6.1 (3.6, 9.5) 4.9 (2.8, 8.0) 3.6 (1.8, 6.7) 5.6 (3.4, 9.1)
65-69 170 22.9 (17.0, 30.1) 10.5 (6.5, 16.3) 7.1 (3.9, 12.3) 12.8 (8.4, 18.9)
70-74 149 38.3 (30.5, 46.6) 18.4 (12.8, 25.5) 14.8 (9.7, 21.7) 24.5 (18.2, 32.1)
75 and over 139 49.6 (41.1, 58.2) 32.9 (25.5, 41.2) 24.5 (17.8, 32.6) 48.3 (40.1, 56.6)
Male
≥60 (overall) 282 20.6 (16.1, 25.9) 12.2 (8.8, 16.7) 8.9 (5.9, 13.0) 14.7 (10.9, 19.5)
60-64 110 7.3 (3.4, 14.3) 5.4 (2.2, 11.9) 4.6 (1.7, 10.8) 4.5 (1.7, 10.7)
65-69 71 19.7 (11.6, 31.2) 13.7 (7.1, 24.2) 8.5 (3.5, 18.1) 13.7 (7.1, 24.2)
70-74 54 33.3 (21.5, 47.6) 16.7 (8.4, 29.8) 12.9 (5.8, 25.5) 18.5 (9.7, 31.9)
75 and over 47 38.3 (24.9, 53.6) 20.8 (11.0, 35.4) 14.9 (6.7, 28.9) 35.4 (22.6, 50.7)
Female
≥60 (overall) 456 27.2 (23.2, 31.6) 15.6 (12.5, 19.2) 11.6 (8.9, 15.0) 22.3 (18.7, 26.4)
60-64 170 5.3 (2.6, 10.1) 4.7 (2.2, 9.4) 2.9 (1.1, 7.9) 6.3 (3.4, 11.3)
65-69 99 25.3 (17.3, 35.2) 8.1 (3.8, 15.8) 6.1 (2.5, 13.2) 12.1 (6.7, 20.6)
70-74 95 41.1 (31.2, 51.6) 19.2 (12.4, 28.4) 15.8 (9.4, 25.0) 27.6 (19.6, 37.4)
75 and over 92 55.4 (44.7, 65.7) 38.8 (29.3, 49.2) 29.4 (20.6, 39.3) 54.5 (44.3, 64.3)
Hairi et al. BMC Public Health 2010, 10:492http://www.biomedcentral.com/1471-2458/10/492
Page 5 of 13

Comparison with previous studies in MalaysiaThere have been several previous studies of physical dis-ability among older people in Malaysia [3,26-32]. Differ-ences in the way disability was measured and samplecharacteristics make comparisons with our study diffi-cult. However, a population based study of 300 olderpeople in Bangi, Selangor, in 2004 used the 10 itemBarthel Index and found that 23% of older people aged60 years and above were dependent in at least one ADL;similar to the results in our study[28]. A population-based study in 2002 of 223 older people in Sepang,Selangor, using the 10 item Barthel Index found that16% of older people aged 60 years and above weredependent in at least one ADL. A study done by Siddahet al using the 2003 Mental Health and Quality of Lifeof Older Malaysians Survey assessed self-reported func-tional limitations, using two questions “do you have anydifficulty in climbing stairs?” and “do you have any diffi-culty in sitting and standing?”. Overall, 13% reporteddifficulty in climbing stairs, 18% of women and 8% of
men. Overall, 10% reported difficulty in sitting andstanding, 13% women and 6% of men.
International comparisons of prevalence of physicaldisabilityWe assessed physical disability using the Barthel Indexwhich consists of 10 items of activity in daily living..Based on the 10-item Barthel Index, a study in Singa-pore found a much lower disability prevalence than inour study: 11% in people aged 60 years and above (9%when age-standardized to our population sample), 14%in people aged 65 and above and 26% among those aged75 and above. In our study in rural Malaysia, disabilityrates in these same groups were twice as high: 25%, 37%and 52% respectively [33]Comparison with studies in other countries is difficult
due to use of different ADL measurements; however,narrowing ADL disability to receiving help for at leastone of five ADL items (eating, bathing, dressing, trans-ferring and toileting) or six ADL items (walking, eating,
Figure 1 Prevalence of poor physical function by ethnic group among older people in rural Malaysia.
Hairi et al. BMC Public Health 2010, 10:492http://www.biomedcentral.com/1471-2458/10/492
Page 6 of 13
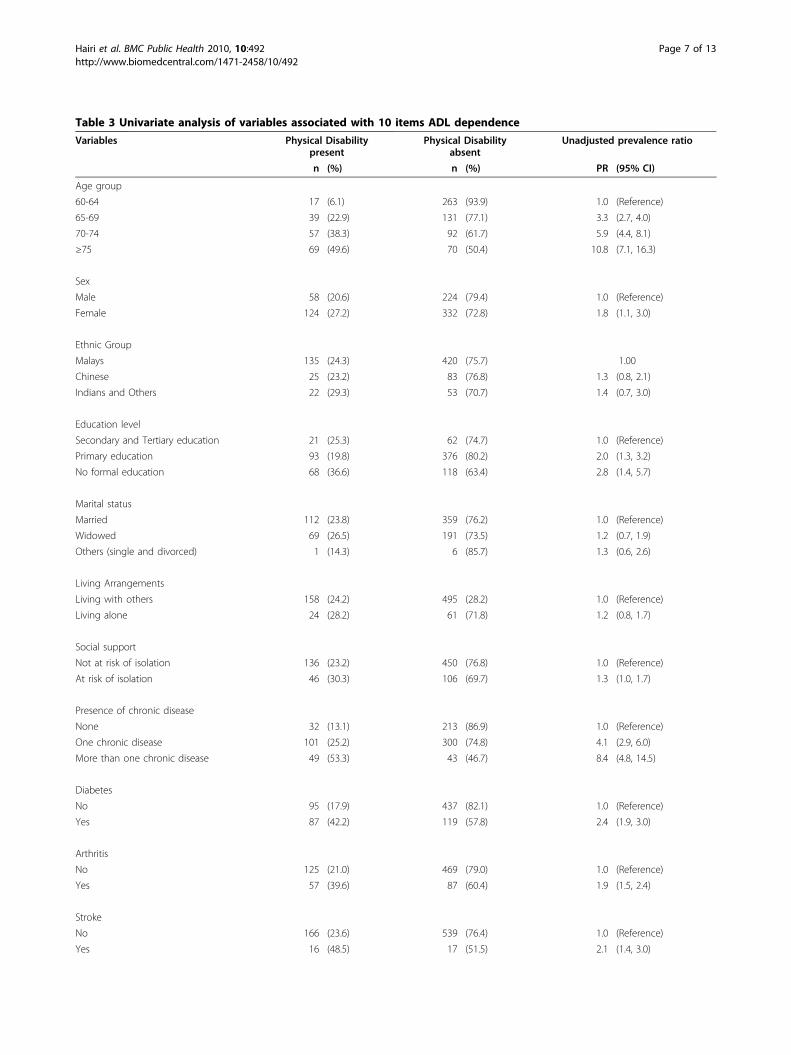
Table 3 Univariate analysis of variables associated with 10 items ADL dependence
Variables Physical Disabilitypresent
Physical Disabilityabsent
Unadjusted prevalence ratio
n (%) n (%) PR (95% CI)
Age group
60-64 17 (6.1) 263 (93.9) 1.0 (Reference)
65-69 39 (22.9) 131 (77.1) 3.3 (2.7, 4.0)
70-74 57 (38.3) 92 (61.7) 5.9 (4.4, 8.1)
≥75 69 (49.6) 70 (50.4) 10.8 (7.1, 16.3)
Sex
Male 58 (20.6) 224 (79.4) 1.0 (Reference)
Female 124 (27.2) 332 (72.8) 1.8 (1.1, 3.0)
Ethnic Group
Malays 135 (24.3) 420 (75.7) 1.00
Chinese 25 (23.2) 83 (76.8) 1.3 (0.8, 2.1)
Indians and Others 22 (29.3) 53 (70.7) 1.4 (0.7, 3.0)
Education level
Secondary and Tertiary education 21 (25.3) 62 (74.7) 1.0 (Reference)
Primary education 93 (19.8) 376 (80.2) 2.0 (1.3, 3.2)
No formal education 68 (36.6) 118 (63.4) 2.8 (1.4, 5.7)
Marital status
Married 112 (23.8) 359 (76.2) 1.0 (Reference)
Widowed 69 (26.5) 191 (73.5) 1.2 (0.7, 1.9)
Others (single and divorced) 1 (14.3) 6 (85.7) 1.3 (0.6, 2.6)
Living Arrangements
Living with others 158 (24.2) 495 (28.2) 1.0 (Reference)
Living alone 24 (28.2) 61 (71.8) 1.2 (0.8, 1.7)
Social support
Not at risk of isolation 136 (23.2) 450 (76.8) 1.0 (Reference)
At risk of isolation 46 (30.3) 106 (69.7) 1.3 (1.0, 1.7)
Presence of chronic disease
None 32 (13.1) 213 (86.9) 1.0 (Reference)
One chronic disease 101 (25.2) 300 (74.8) 4.1 (2.9, 6.0)
More than one chronic disease 49 (53.3) 43 (46.7) 8.4 (4.8, 14.5)
Diabetes
No 95 (17.9) 437 (82.1) 1.0 (Reference)
Yes 87 (42.2) 119 (57.8) 2.4 (1.9, 3.0)
Arthritis
No 125 (21.0) 469 (79.0) 1.0 (Reference)
Yes 57 (39.6) 87 (60.4) 1.9 (1.5, 2.4)
Stroke
No 166 (23.6) 539 (76.4) 1.0 (Reference)
Yes 16 (48.5) 17 (51.5) 2.1 (1.4, 3.0)
Hairi et al. BMC Public Health 2010, 10:492http://www.biomedcentral.com/1471-2458/10/492
Page 7 of 13
bathing, dressing, transferring and toileting) allows rea-sonable comparison across some studies.Using the six item ADL index, the prevalence of phy-
sical disability in our study was 20%, which is muchhigher than the United States’ National Long Term CareSurvey, 13% (9% when age-standardized to the Malay-sian population sample) [7]. However, the prevalence ofsix item ADL disability among r people age 60 yearsand above [12], and among people age 75 years andabove, in Latin America and the Caribbean appears tobe similar to the prevalence rates in our Malaysianstudy[13].Using the five item ADL index, for people aged 65
years and above, the prevalence rates in our Malaysianstudy (16% prevalence of disability) again appear to bemuch higher than those reported in more developedcountries:- 6% in Canada (5% when age-standardized),10% in France (7% when age-standardized), 14% in Italy(9% when age-standardized) and 11% in Sweden (7%when age-standardized) [7]. Disability prevalence ratesin Malaysia appear comparable to rates in other devel-oping countries: For example, among people aged 65and older, the prevalence of 5 item ADL disability in SriLanka was 10% (17% when age standardised) which isalmost identical to the 16% prevalence in our study [18].Among people aged 60 years and over the prevalence of5 item ADL disability was 11% in our study, similar to12% in India (10% when age standardized) [15], and 8%in Shanghai, China[19].There are few possible reasons why Malaysia’s disabil-
ity prevalence is higher than those reported from thedeveloped countries. Firstly, the prevailing socio-demo-graphic differences between Malaysia and the wealthyindustrialised countries; the low educational levels inour older cohort (89% have no form of education or loweducation level), a figure higher than the developedcountry[34] and higher proportion of older people inMalaysia are still economically active. The 2000
Malaysian census reported that 45% of people in the 60-64 age groups worked in the agriculture related occupa-tion. Secondly, the deeply rooted Asian culture stressesthat older people should be taken care of by their familymembers. An institutional care is accessible to thosewho can afford (with regards to private nursing homes)and admission to funded shelter homes is usually thelast resort to older people who have no heirs and noshelter on their own or those who are destitute. Thusmajority of the older people in Malaysia continue to co-reside with their spouse or other family members. Asone of the main reasons for institutionalisation in thewestern countries is disability in ADL [35], this wouldexplain the higher prevalence of physical disability inour study.Functional limitations can be measured through self
report or performance based[5]. Performance basedmeasurements offers more information as they identifyimportant physical parameters involved in performingdaily tasks [5]. Comparison of prevalence across studiesis difficult due to differences in the conceptual and mea-surement of functional limitation used. Using the TinettiPerformance Oriented Mobility Assessment Tool, theoverall prevalence of functional limitation among Italianaged 75 years and above was 21%, much lower than ourprevalence rate of 48% [36]. Older Italian men andwomen showed similar prevalence of functional limita-tion 31% and 28% respectively [36]. Our results showeddifferently, for the same age group, older womenreported much higher prevalence of functional limita-tion (55%), than men (35%).
Gender and ethnic differencesWomen in all age groups showed higher prevalence ofphysical disability and functional limitation than men.We also found that the gender differences widened withincreasing age. Most previous studies have found thatwomen have higher levels of physical disability and
Table 3 Univariate analysis of variables associated with 10 items ADL dependence (Continued)
Depressive Symptomology
No 122 (21.1) 455 (78.9) 1.0 (Reference)
Yes 60 (37.3) 101 (62.7) 1.8 (1.4, 2.3)
Presenting visual acuity
Normal 130 (22.5) 449 (77.5) 1.0 (Reference)
Mild to moderate visual impairment 42 (33.3) 84 (66.7) 1.7 (1.1, 2.5)
Blind 10 (30.3) 23 (69.7) 2.1 (1.2, 3.8)
BMI (weight/height2)
Normal 65 (25.0) 195 (75.0) 1.0 (Reference)
Underweight 79 (24.8) 240 (75.2) 1.0 (0.7, 1.4)
Overweight 35 (24.3) 109 (75.7) 1.0 (0.6, 1.6)
Hairi et al. BMC Public Health 2010, 10:492http://www.biomedcentral.com/1471-2458/10/492
Page 8 of 13
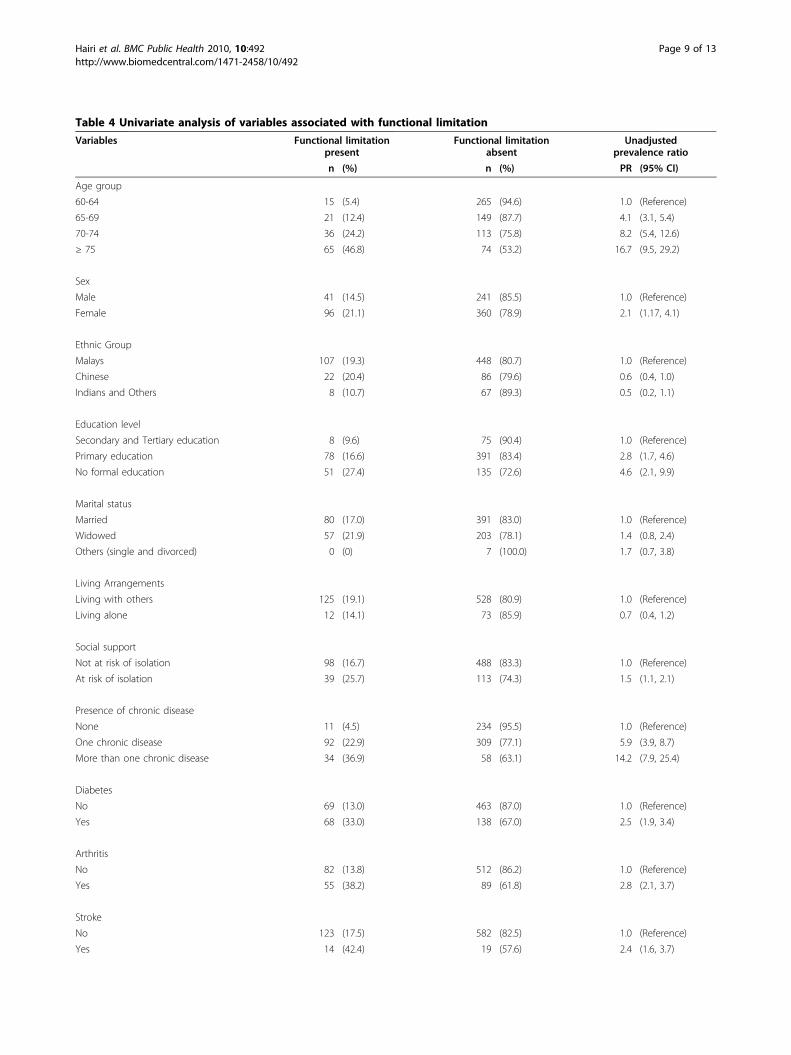
Table 4 Univariate analysis of variables associated with functional limitation
Variables Functional limitationpresent
Functional limitationabsent
Unadjustedprevalence ratio
n (%) n (%) PR (95% CI)
Age group
60-64 15 (5.4) 265 (94.6) 1.0 (Reference)
65-69 21 (12.4) 149 (87.7) 4.1 (3.1, 5.4)
70-74 36 (24.2) 113 (75.8) 8.2 (5.4, 12.6)
≥ 75 65 (46.8) 74 (53.2) 16.7 (9.5, 29.2)
Sex
Male 41 (14.5) 241 (85.5) 1.0 (Reference)
Female 96 (21.1) 360 (78.9) 2.1 (1.17, 4.1)
Ethnic Group
Malays 107 (19.3) 448 (80.7) 1.0 (Reference)
Chinese 22 (20.4) 86 (79.6) 0.6 (0.4, 1.0)
Indians and Others 8 (10.7) 67 (89.3) 0.5 (0.2, 1.1)
Education level
Secondary and Tertiary education 8 (9.6) 75 (90.4) 1.0 (Reference)
Primary education 78 (16.6) 391 (83.4) 2.8 (1.7, 4.6)
No formal education 51 (27.4) 135 (72.6) 4.6 (2.1, 9.9)
Marital status
Married 80 (17.0) 391 (83.0) 1.0 (Reference)
Widowed 57 (21.9) 203 (78.1) 1.4 (0.8, 2.4)
Others (single and divorced) 0 (0) 7 (100.0) 1.7 (0.7, 3.8)
Living Arrangements
Living with others 125 (19.1) 528 (80.9) 1.0 (Reference)
Living alone 12 (14.1) 73 (85.9) 0.7 (0.4, 1.2)
Social support
Not at risk of isolation 98 (16.7) 488 (83.3) 1.0 (Reference)
At risk of isolation 39 (25.7) 113 (74.3) 1.5 (1.1, 2.1)
Presence of chronic disease
None 11 (4.5) 234 (95.5) 1.0 (Reference)
One chronic disease 92 (22.9) 309 (77.1) 5.9 (3.9, 8.7)
More than one chronic disease 34 (36.9) 58 (63.1) 14.2 (7.9, 25.4)
Diabetes
No 69 (13.0) 463 (87.0) 1.0 (Reference)
Yes 68 (33.0) 138 (67.0) 2.5 (1.9, 3.4)
Arthritis
No 82 (13.8) 512 (86.2) 1.0 (Reference)
Yes 55 (38.2) 89 (61.8) 2.8 (2.1, 3.7)
Stroke
No 123 (17.5) 582 (82.5) 1.0 (Reference)
Yes 14 (42.4) 19 (57.6) 2.4 (1.6, 3.7)
Hairi et al. BMC Public Health 2010, 10:492http://www.biomedcentral.com/1471-2458/10/492
Page 9 of 13
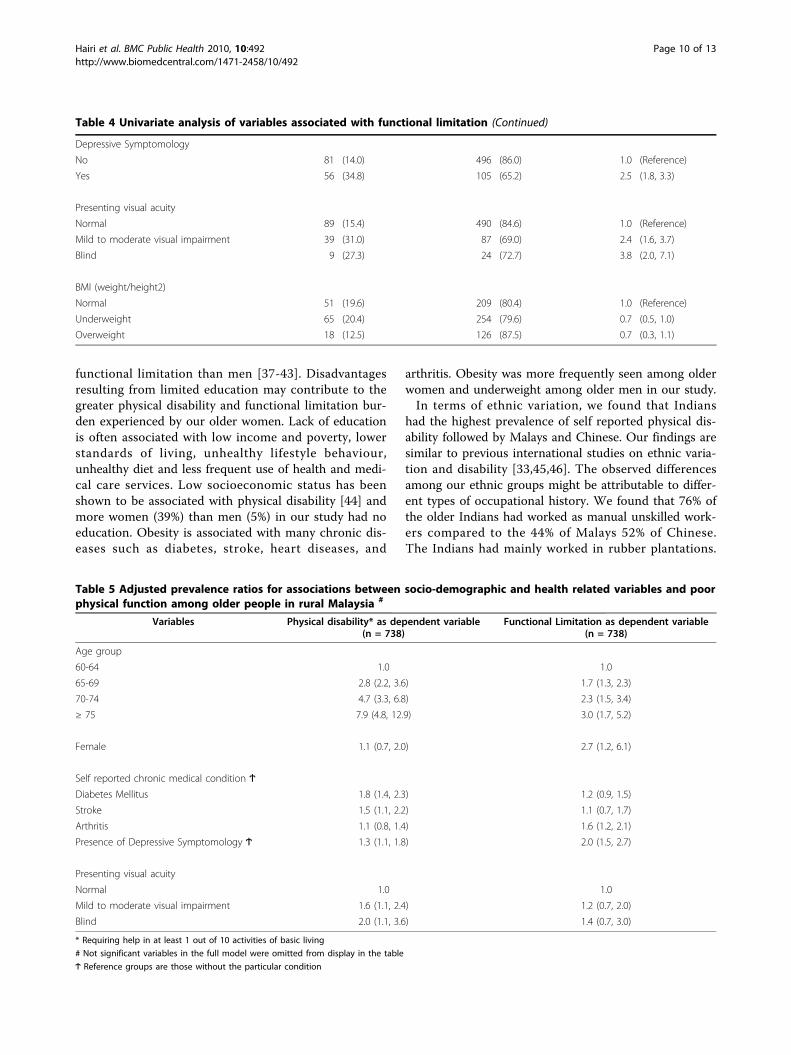
functional limitation than men [37-43]. Disadvantagesresulting from limited education may contribute to thegreater physical disability and functional limitation bur-den experienced by our older women. Lack of educationis often associated with low income and poverty, lowerstandards of living, unhealthy lifestyle behaviour,unhealthy diet and less frequent use of health and medi-cal care services. Low socioeconomic status has beenshown to be associated with physical disability [44] andmore women (39%) than men (5%) in our study had noeducation. Obesity is associated with many chronic dis-eases such as diabetes, stroke, heart diseases, and
arthritis. Obesity was more frequently seen among olderwomen and underweight among older men in our study.In terms of ethnic variation, we found that Indians
had the highest prevalence of self reported physical dis-ability followed by Malays and Chinese. Our findings aresimilar to previous international studies on ethnic varia-tion and disability [33,45,46]. The observed differencesamong our ethnic groups might be attributable to differ-ent types of occupational history. We found that 76% ofthe older Indians had worked as manual unskilled work-ers compared to the 44% of Malays 52% of Chinese.The Indians had mainly worked in rubber plantations.
Table 4 Univariate analysis of variables associated with functional limitation (Continued)
Depressive Symptomology
No 81 (14.0) 496 (86.0) 1.0 (Reference)
Yes 56 (34.8) 105 (65.2) 2.5 (1.8, 3.3)
Presenting visual acuity
Normal 89 (15.4) 490 (84.6) 1.0 (Reference)
Mild to moderate visual impairment 39 (31.0) 87 (69.0) 2.4 (1.6, 3.7)
Blind 9 (27.3) 24 (72.7) 3.8 (2.0, 7.1)
BMI (weight/height2)
Normal 51 (19.6) 209 (80.4) 1.0 (Reference)
Underweight 65 (20.4) 254 (79.6) 0.7 (0.5, 1.0)
Overweight 18 (12.5) 126 (87.5) 0.7 (0.3, 1.1)
Table 5 Adjusted prevalence ratios for associations between socio-demographic and health related variables and poorphysical function among older people in rural Malaysia #
Variables Physical disability* as dependent variable(n = 738)
Functional Limitation as dependent variable(n = 738)
Age group
60-64 1.0 1.0
65-69 2.8 (2.2, 3.6) 1.7 (1.3, 2.3)
70-74 4.7 (3.3, 6.8) 2.3 (1.5, 3.4)
≥ 75 7.9 (4.8, 12.9) 3.0 (1.7, 5.2)
Female 1.1 (0.7, 2.0) 2.7 (1.2, 6.1)
Self reported chronic medical condition Ϯ
Diabetes Mellitus 1.8 (1.4, 2.3) 1.2 (0.9, 1.5)
Stroke 1.5 (1.1, 2.2) 1.1 (0.7, 1.7)
Arthritis 1.1 (0.8, 1.4) 1.6 (1.2, 2.1)
Presence of Depressive Symptomology Ϯ 1.3 (1.1, 1.8) 2.0 (1.5, 2.7)
Presenting visual acuity
Normal 1.0 1.0
Mild to moderate visual impairment 1.6 (1.1, 2.4) 1.2 (0.7, 2.0)
Blind 2.0 (1.1, 3.6) 1.4 (0.7, 3.0)
* Requiring help in at least 1 out of 10 activities of basic living
# Not significant variables in the full model were omitted from display in the table
Ϯ Reference groups are those without the particular condition
Hairi et al. BMC Public Health 2010, 10:492http://www.biomedcentral.com/1471-2458/10/492
Page 10 of 13
We also found that Malays (77%) were more likely tohave one or more chronic diseases than Chinese (40%)and Indians (33%).
Health CorrelatesWe found similar variables to be related to physical dis-ability as in other studies: presence of diabetes mellitus[47], stroke [37,40], arthritis [37,48], depressive sympto-mology [37,49] and visual impairment [50]. Similar toour findings, living alone[40], poor social support [43],were not associated with physical disability.We found significant associations between functional
limitations and advanced age, being female, havingarthritis and having depressive symptomology. Livingalone, poor social support, being overweight or under-weight, presence of diabetes mellitus, stroke and visualimpairment were not associated with functional limita-tion. Our results correspond with previous findings foradvanced age [51], female gender [51], presence ofarthritis [52] and depressive symptomology [49,52].This study has some limitations. First, our findings are
relevant to community dwelling older adults, similar tomost disability studies. This underestimates the preva-lence of physical disability and functional limitation as itdoes not include older people in institutions. Secondly,as with any cross sectional design, it is not appropriateto draw causal inferences between health-related vari-ables and physical disability or functional limitation.This study has a number of strengths. This is the first
study to assess the prevalence and correlates of perfor-mance based functional limitation among older Malay-sians. We used validated measures of disability that fitwith theories of aging. In the Nagi model of disable-ment, functional limitation precedes disability [53].Unlike physical disability, functional limitation repre-sents an outcome that is free of the environmental influ-ences. This adds clarity in understanding the dynamicsof the pathway from conditions or diseases to disability.Our study population was randomly selected from ageographically defined rural community and weachieved a high participation rate. The age and ethnicgroup distribution of older people in AGOPHS isconsistent with that of older men and women in ourtarget population, according to the 2000 MalaysianCensus [25].
ConclusionsWe found that physical disability and functional limita-tion is common among older people in Malaysia. Ourrates appears to be much higher than in developedcountries but comparable to other middle-income devel-oping countries. Based on our study findings, theIndians and older people who are underweight shouldbe given priority for additional studies focused on
reducing or preventing disability in this population. Ourresults also show that women, the oldest old, those withchronic diseases, depressive symptomology and visualimpairment are at greatest risk of disability and func-tional limitation. These findings are important for tar-geting appropriate prevention and interventionstrategies. It enables our rural health care professionalsto identify older people at risk of developing physicaldisability and functional limitation. As a result, thesepeople could be referred to interventions aimed at redu-cing poor physical function such as health education,visits to the homes of high-risk individuals and physicalactivity programmes for community-living older people,such as taichi.
AcknowledgementsThis work was supported by the Fundamental ResearchGrant Scheme (FRGS), from the Ministry of HigherEducation, Malaysia. Dr. Noran N. Hairi’s work on thisstudy was supported by the Public Service Department(PSD) of Malaysia. The authors would like to expresstheir appreciation to Dr. Siti Halimah Shaikh and allhealth care providers of Masjid Tanah Health Clinic,Ministry of Health Malaysia, for their contributions tothis research.
Author details1Department of Social and Preventive Medicine, Faculty of Medicine,University Malaya, Kuala Lumpar, Malaysia. 2School of Public Health,University of Sydney, Sydney, Australia. 3Julius Centre University of Malaya,Faculty of Medicine, University of Malaya, Kuala Lumpar, Malaysia. 4Centre forEducation and Research on Ageing, Concord Hospital, Australia. 5ANZACResearch Institute, Concord Hospital, University of Sydney, NSW, Australia.6Ministry of Health, Malaysia.
Authors’ contributionsNNH: study concept, chief investigator, designing research protocol, dataanalysis, interpretation of data and writing manuscript. AB, IM contributed inconceptualizing the research and data collection. RGC, VN and ABcontributed in critically editing the manuscript. All authors read andapproved the final manuscript.
Competing interestsThe authors declare that they have no competing interests.
Received: 12 May 2010 Accepted: 18 August 2010Published: 18 August 2010
References1. Kinsella KWH: U.S. Census Bureau. International Population Reports, P95/
09-1, An Aging World 2008. US Government Printing Office, Washington DC2009.
2. Population and Housing Census of Malaysia: Population Aging Trends inMalaysia. Monograph Series No.1. Malaysia DoS: Department of StatisticsMalaysia 2005.
3. Institute for Public Health I: The Third National Health and MorbiditySurvey (NHMS III) 2006, Executive Summary. Ministry of Health M 2008.
4. Chen PCY AG, Josef R, Chan KE, Arokiasamy JT: Health and Ageing inMalaysia. University Malaya, Kuala Lumpur 1986.
5. Jack MG, Luigi F: Assessing the building blocks of function: Utilizingmeasures of functional limitation. American journal of preventive medicine2003, 25(3):112-121.
Hairi et al. BMC Public Health 2010, 10:492http://www.biomedcentral.com/1471-2458/10/492
Page 11 of 13
6. Fried L, Guralnik J: Disability in older adults: evidence regardingsignificance, etiology, and risk. J Am Geriatr Soc 1997, 45:92-100.
7. Lafortune GGB: Trends in Severe Disability Among Elderly People:Assessing the Evidence in 12 OECD Countries and the FutureImplications. OECD Health Working Papers, No 26, OECD Publishing 2007.
8. Tinetti M: Performance-oriented assessment of mobility problems inelderly patients. Journal of the American Geriatrics Society 1986,34(2):119-126.
9. Ferrucci L, Koh C, S B, Guralnik JM: Disability, Functional Status andActivities of Daily Living. Encyclopedia of Gerontology Amsterdam; Boston:Academic PressBirren JE 2007, 1:427-436.
10. Wade DT, Collin C: The Barthel ADL Index: A standard measure ofphysical disability? Disability & Rehabilitation 1988, 10(2):64-67.
11. Katz S, Downs TD, Cash HR, Grotz RC: Progress in Development of theIndex of ADL. The Gerontologist 1970, 10(1 Part 1):20-30.
12. Rose A, Hennis A, Hambleton I: Sex and the city: Differences in disease-and disability-free life years, and active community participation ofelderly men and women in 7 cities in Latin America and the Caribbean.BMC Public Health 2008, 8(1):127.
13. Carlos AR-O, Glenn VO, Martha P, Kenneth JO: Cross-national comparisonof disability in Latin American and Caribbean persons aged 75 andolder. Archives of gerontology and geriatrics 2006, 42(1):21-33.
14. Zhe T, Hui-Xin W, Chen M, Xiao-Guang W, Kjerstin E, Bengt W, Jin-Jing P:The prevalence of functional disability in activities of daily living andinstrumental activities of daily living among elderly Beijing Chinese.Archives of gerontology and geriatrics 1999, 29(2):115-125.
15. Shantibala K, Naorem B, Ak J, Ak B, E Vijaya D, Y Manihar S: Disability inADL Among the Elderly in an Urban Area of Manipur. Indian Journal ofPhysical Medicine and Rehabilitation 2007, 18(2):41-43.
16. Jose CM-C, Javier T, Salvador P-F, Isabel G-A, Trinidad L, Teresa F-A, Ana M:Prevalence of functional disability in activities of daily living (ADL),instrumental activities of daily living (IADL) and associated factors, aspredictors of morbidity and mortality. Archives of gerontology andgeriatrics 50(3):306-310.
17. Katz S, Ford AB, Moskowitz RW, Jackson BA, Jaffe MW: Studies of Illness inthe Aged: The Index of ADL: A Standardized Measure of Biological andPsychosocial Function. JAMA 1963, 185(12):914-919.
18. Nugegoda DB, Balasuriya S: Health and social status of an elderly urbanpopulation in Sri Lanka. Social Science & Medicine 1995, 40(4):437-442.
19. Chen P, Yu E, Zhang M, et al: ADL dependence and medical conditions inChinese older persons: a population-based survey in Shanghai, China. JAm Geriatr Soc 1995, 43:378-383.
20. Kua E-HK, S M: A questionnaire to screen for cognitive impairmentamong elderly people in developing countries. Acta Psychiatr Scand 1992,85:119-122.
21. Yesavage JAB, T L. Rose TL, et al: Development and validation of ageriatric depression scale: a preliminary report. J Psychiatr Res 1983,17:37-49.
22. Congdon N, Friedman D, Lietman T: Important causes of visualimpairment in the world today. JAMA 2003, 290:2057-2060.
23. Barros AHVN: Alternative for logistic regression in cross-sectional studies:an empirical comparison of models that directly estimate prevalenceratio. BMC Med Res Methdol 2003, 3:21.
24. Spiegelman D, Hertzmark E: Easy SAS Calculations for Risk or PrevalenceRatios and Differences. Am J Epidemiol 2005, 162(3):199-200.
25. Department of Statistics M: Population and Housing Census 2000.Department of Statistics, MalaysiaDepartment of Statistics M 2000.
26. Tengku-Azian H, Chai S, Jariah M, Nurizan Y: Socioeconomic Status andHealth of Older Women in Malaysia. Asia-Pacific Journal of Public Health2006, 18(S3):42-51.
27. Shahar S, Earland J, Abd Rahman S: Social and Health Profiles of RuralElderly Malays. Singapore Med J 2001, 42(5):208-213.
28. Sherina M, Rampal L, Aini M, Norhidayati H: The prevalence of depressionamong elderly in an urban area of Selangor, Malaysia. The InternationalMedical Journal 2005, 4(2):57-63.
29. Sherina M, Rampal L, Mustaqim A: Physical and Mental Health Problemsof the elderly in a rural community of Sepang, Selangor. MalaysianJournal of Medical Sciences 2004, 11(1):52-59.
30. Zaiton A, Nor Afiah M, Latifah A: Functional status of the eldely residingin public shelter homes in Peninsular Malaysia. Asia-Pacific Journal ofPublic Health 2006, 18(S3):60-63.
31. Loh K, Khairani O, Norlaili T: The prevalence of functional impairmentamong elderly aged 60 years and above attending Klinik Kesihatan Batu9, Ulu Langat, Selangor. The Medical Journal of Malaysia 2005,60(4):526-529.
32. Shahar S, Ibrahim Z, Fatah ARA, Rahman SA, Yusoff NAM, Arshad F,Yassin Z, Adznam SNA: A multidimensional assesment of nutritional andhealth status of rural elderly Malays. Asia Pac J Cli Nutr 2007,16(2):346-353.
33. Ng T-P, Niti M, Chiam P-C, Kua E-H: Prevalence and Correlates ofFunctional Disability in Multiethnic Elderly Singaporeans. Journal of theAmerican Geriatrics Society 2006, 54(1):21-29.
34. Federal Interagency Forum on Aging-Related Statistics: Older Americans2008: Key Indicators of Well-Being. DC: U.S. Government PrintingOfficeFederal Interagency Forum on Aging-Related Statistics W 2008.
35. Guralnik JM, Fried LP, Salive ME: Disability as a Public Health Outcome inthe Aging Population. Annual Review of Public Health 1996, 17(1):25-46.
36. Bergamini L, Burgoni M, Federzoni G, Goldoni C, Martini E, Neviani F,Neri M: Multidimensional evaluation of home-dwelling elderly: theimpact of medical social factors on health status indices. Arch GerontolGeriatr 2007, , Suppl 1: 75-81.
37. Tas U, Verhagen A, Bierma-Zeinstra S, Hofman A, Odding E, Pols H, Koes B:Incidence and risk factor of disability in the elderly: the RotterdamStudy. Prev Med 2007, 44(3):272-278.
38. Dunlop D, Hughes S, Manheim L: Disability in activities of daily living:patterns of change and a hierarchy of disability. Am J Public Health 1997,87:378-383.
39. Lyons R, Crome P, Monaghan S, et al: Health status and disability amongelderly in three UK districts. Age Ageing 1997, 26:203-209.
40. Kelly-Hayes M, Jette A, Wolf P, et al: Functional limitations and disabilityamong elders in the Framingham Study. Am J Public Health 1992,82:841-845.
41. Gill T, Williams C, Tinetti M: Assessing risk for the onset of functionaldeprendence among older adults: the role of physical performance. JAm Geriatr Soc 1995, 43:603-609.
42. Stuck A, Walthert J, Nikolaus T, Bula C, Hohmann C, Beck J: Risk factors forfunctional status decline in the community-living elderly people: asystematic literature review. Soc Sci Med 1999, 48:445-469.
43. Tas U, Verhagen A, Bierma-Zeinstra S, Odding E, Koes B: Prognostic factorsof disability in older people: a systematic review. Br J Gen Pract 2007,57(537):319-323.
44. Koster A, Bosma H, Broese van Groenou M, Kempen G, Penninx B, vanEijk J, Deeg D: Explanations of socioeconomic differences in changes inphysical function in older adults: results from the Longitudinal AgingStudy Amsterdam. BMC Public Health 2006, 6(1):244.
45. Kelly-Moore J, Ferraro K: The black/white disability gap: Persistentinequality in later life? J Gerontol B Psychol Sci Soc Sci 2004, 59B:534-543.
46. Kingston R, Smith J: Socioeconomic status and racial and ethnicdifferences in function status associated with chronic diseases. Am JPublic Health 1997, 87:805-810.
47. Gregg E, Beckles G, Williamson D, Leveille S, Langlois J, Engelgau M,Narayan K: Diabetes and physical disability among older US adults.Diabetes Care 2000, 23(9):1272-1277.
48. Jagger C, Matthews R, Matthews F, Spiers N, Nickson J, Paykel E, Huppert F,Brayne C, Function tMRCC, Study A: Cohort differences in disease anddisability in the young-old: findings from the MRC Cognitive Functionand Ageing Study (MRC-CFAS). BMC Public Health 2007, 7(1):156.
49. Dalle Carbonare L, Maggi S, Noale M, Giannini S, Rozzini R, Lo Cascio V,Crepaldi G, Group ftIW: Physical Disability and DepressiveSymptomatology in an Elderly Population: A Complex Relationship. TheItalian Longitudinal Study on Aging (ILSA). American Journal of GeriatricPsych 2009, 17(2):144-154, 110.1097/JGP.1090b1013e31818af31817.
50. Rudberg M, Furner S, Dunn J, et al: The relationship of visual and hearingimpairments to disability: An analysis using the longitudinal study ofaging. J Gerontol 1993, 48:M261-M265.
51. Melzer D, Parahyba MI: Socio-demographic correlates of mobilitydisability in older Brazilians: results of the first national survey. AgeAgeing 2004, 33(3):253-259.
52. Melzer D, Gardener E, Guralnik JM: Mobility disability in the middle-aged:cross-sectional associations in the English Longitudinal Study of Ageing.Age Ageing 2005, 34(6):594-602.
Hairi et al. BMC Public Health 2010, 10:492http://www.biomedcentral.com/1471-2458/10/492
Page 12 of 13
53. Nagi S: An epidemiology of disability among adults in the United States.Milbank Mem Fund Q Health Soc 1976, 54:439-467.
Pre-publication historyThe pre-publication history for this paper can be accessed here:http://www.biomedcentral.com/1471-2458/10/492/prepub
doi:10.1186/1471-2458-10-492Cite this article as: Hairi et al.: Prevalence and correlates of physicaldisability and functional limitation among community dwelling olderpeople in rural Malaysia, a middle income country. BMC Public Health2010 10:492.
Submit your next manuscript to BioMed Centraland take full advantage of:
• Convenient online submission
• Thorough peer review
• No space constraints or color figure charges
• Immediate publication on acceptance
• Inclusion in PubMed, CAS, Scopus and Google Scholar
• Research which is freely available for redistribution
Submit your manuscript at www.biomedcentral.com/submit
Hairi et al. BMC Public Health 2010, 10:492http://www.biomedcentral.com/1471-2458/10/492
Page 13 of 13