Prescribing behavior of General Practitioners: competition matters!
21
Electronic copy available at: http://ssrn.com/abstract=2422330 PRESCRIBING BEHAVIOR OF GENERAL PRACTITIONERS: COMPETITION MATTERS! by Catherine Schaumans April 2014 TILEC Discussion Paper No. 2014-014 CentER Discussion Paper No. 2014-025 ISSN 2213-9532 ISSN 2213-9419 http://ssrn.com/abstract=2422330
-
Upload
tilburguniversity -
Category
Documents
-
view
0 -
download
0
Transcript of Prescribing behavior of General Practitioners: competition matters!
Electronic copy available at: http://ssrn.com/abstract=2422330
PRESCRIBING BEHAVIOR OF GENERAL PRACTITIONERS: COMPETITION MATTERS!
by
Catherine Schaumans
April 2014
TILEC Discussion Paper No. 2014-014 CentER Discussion Paper No. 2014-025
ISSN 2213-9532 ISSN 2213-9419
http://ssrn.com/abstract=2422330
Electronic copy available at: http://ssrn.com/abstract=2422330
1
Prescribing behavior of General Practitioners: competition matters!
by Catherine Schaumans (TILEC, CentER, Tilburg University)1
Abstract
Background: General Practitioners have limited means to compete. As quality is hard to observe by
patients, GPs have incentives to signal quality by using instruments patients perceive as quality.
Objectives: We investigate whether GPs exhibit different prescribing behavior (volume and value of
prescriptions) when confronted with more competition. As there is no monetary benefit in doing so,
this type of (perceived) quality competition originates from GPs satisfying patients’ expectations.
Method: We look at market level data on per capita and per contact number of items prescribed by
GPs and the value of prescriptions for the Belgian market of General Practitioners. We test to which
extent different types of variables explain the observed variation. We consider patient
characteristics, GP characteristics, number and type of GP contacts and the level of competition. The
level of competition is measured by GP density, after controlling for the number of GPs and a HHI.
Results: We find that a higher number of GPs per capita results in a higher number of units
prescribed by GPs, both per capita and per contact. We argue that this is consistent with quality
competition in the GP market. Our findings reject alternative explanations of GP scarcity, availability
effect in GP care consumption and GP dispersing prescription in time due to competition.
Keywords: competition, General Practitioners, prescription, drugs, quality
JEL Classifications: D22; I10; I11; L11; L15
1 The author likes to thank IMSHealth and RIZIV/INAMI for the support in collecting the data.
Contact: [email protected] (P.O. Box 90153, 5000 LE Tilburg, tel: +31 13 466 2044)
Electronic copy available at: http://ssrn.com/abstract=2422330
2
1. Introduction
As the primary care market is characterized by asymmetric information and a dual role of the
physician, there has been a lot of work describing and explaining the use of primary care and the
behavior of General Practitioners (GPs). There are studies investigating the demand for and the
quality of primary care, the existence of supplier inducement by GPs and the referring and testing
behavior of GPs2. One of the prevailing questions in this literature is whether competition matters:
does the number of GPs in the local market affect the volume, type and quality of care and referral
and testing behavior? Whereas in most product market, we want highly competitive markets,
competition in health care markets has been found to have many undesirable effects. Porter and
Teisberg (2004) even states "we believe that competition is the root of the problem with U.S. health
care performance". Most work is however on the impact of competition on hospital markets
(Propper et al. 2004, Gaynor and Town 2011), while work on individual health providers such as GPs
remains scarce or topical. Theoretical work shows that competition is socially useful as it limits
physicians misusing their information advantage (Allard et al. 2009), but other frameworks predict
that competition increases the incentives to e.g. induce demand (Carlson and Grytten 1998). With
respect to quality of care, theory predicts that competition improves quality only in case quality
elasticity is large compared to price elasticity, which remains an empirical question (Dranove and
Satterthwaite 2000, Gaynor 2006). Also empirical studies are not consistent in their finding of an
impact of competition on inducing behavior (Delattre and Dormont 2003, Carlson and Grytten 1998,
Schaumans 2008) nor on quality of care (Sorensen and Grytten 1999, Pike 2010). Finally, Godager et
al. (2012) finds negligible or small positive effects on referrals to medical specialists, while Iversen
and Ma (2011) find a positive impact of competition on radiology referrals .
More generally, it remains an open question how GPs compete3. If we don’t understand competition,
well-intentioned regulations and policies are less likely to be effective and can even be harmful. In
social health insurance systems, the price for GP care is typically regulated, be it in a fee-for-service
or capitation way, as governments want to guarantee access to primary care. Furthermore, it is
common that GPs are not allowed to advertise their services.
As a result, GPs have to compete in quality. While Biorn and Godager (2010) does find a positive
impact of quality on the demand for a GP in Norway, inferring the quality of a General Practitioner
(GP) remains a very hard task for patients. The information asymmetry in the market makes it
virtually impossible to judge whether a GP is good in diagnosing and proposing/performing
treatment. While GPs have incentives to communicate and signal quality, measures of quality in the
GP market are scarce and unreliable. As such, quality competition in this market would entail GPs
focusing on specific actions that are measurable, visible to patients and perceived as indicating good
quality by patients (i.e. perceived quality). Looking through the literature, quality competition for GPs
concerns opening hours and availability of appointments, access to the practice by phone or internet,
facilities and the degree to which GPs involve patients in their decisions (see e.g. Pike 2010).
2 Look at Scott (2000) for an overview.
3 Look at Gaynor and Town (2011) for a general overview of competition in health care markets.
3
An unvisited topic concerns the prescribing behavior of the GP. In most countries, as in the country
we investigate, GP do not benefit from their prescriptions. That is, the profession of pharmacist and
GP are strictly separated4. Therefore, whether a GP prescribes few or many units of medication
should not depend on the economic environment in which a GP operates. However, considering that
GPs have little means to compete and signal quality, changes the story. That is, patients visiting a GP
with a specific health concern can to some extent expect the GP to end the contact with writing a
prescription. This would confirm their health concern and indicates that the GP is taking it seriously.
This argument is analogue to Iversen and Ma (2011), where a GP satisfies patients’ requests for
referrals to compete for patients and to retain them. Furthermore, putting on paper the exact names
and quantities of medication to take, even though it can concern over-the-counter (OTC) drugs, can
be seen as an extra service towards patients. Prescribing cheaper medication could also be a quality
signal, although patients might still be suspicious of generics.
In this paper, we therefore investigate the determinants of both the volume and the value of GP
prescriptions by Belgian GPs. Previous work on Belgian GPs already indicated that GPs do behave
differently in the face of competition. More precisely, Schaumans (2014) indicates the presence of
supplier inducement in GP dense areas and that GPs use consultations (as opposed to home visits) to
do so. Whereas these findings indicate that Belgian GPs do respond to competitive pressure to
increase their income level, we now look at behavior that has no direct monetary impact on GP
income. As such, we focus on pure quality or perceived quality competition. Note also that we focus
on the number of units of medication, both OTC- and prescription drugs, prescribed by GPs. We thus
focus on explaining the prescribing behavior of GPs, rather than investigating consumption of drugs.
Our analysis considers four types of variables to potentially determine the prescribing behavior of
GPs. First, patient characteristics determine the demand for GP prescriptions and can impact the way
GP prescribe. Second, the number of times patients contact GPs and the type of contact they have
(home visits versus office consultations) are indicative of the health conditions of the population.
Third, GP characteristics such as their gender or experience level can result in variation in
prescriptions. And finally, we consider whether the competitive environment of GPs impact the
volume and value of prescriptions.
Our findings indicate that competition does play a role. That is, after correcting for market structure,
GP density has a positive and significant effect on the volume of GP prescriptions. We look at the
impact on both per capita and per contact volume to exclude alternative explanations of this effect
(GP scarcity, availability effects and dispersion in time due to competition). We conclude that in the
face of competition, GPs use the number of prescriptions to signal quality and to increase service to
patients. Hence, we find evidence of quality or 'perceived quality' competition. We furthermore find
that local markets with same-size GP practices account for a lower per patient volume of
prescriptions of a higher value.
4 In some countries, some exceptions can be given for dispensing GPs in case population is very low and a
pharmacy is not viable.
4
The paper is structured as follows. We start in section 2 by explaining the institutional background
with respect to the prescribing behavior of general practitioners in Belgium and elaborate on our
data sources. Section 3 continues with a discussion on potential determinants of the volume and
value of GP prescriptions, discusses how GP competition affects the prescribing behavior and puts
forward a testable hypothesis. Whereas section 4 presents the data, section 5 reports and discusses
the findings of our empirical study. Section 6 concludes.
2. The Belgian market of General Practitioners
The General Practitioners (GPs) we study in this paper are active in a reimbursement system of fee-
for-service, based on the number and type of contact, in combination with a third-payer system with
copayments. The fee is set annually at national level in a convention between physicians and
mutualities, which is underwritten by the majority of GPs (60% in 2005). Other GPs are free to charge
a different price, but this price differential is carried entirely by their patients as the contribution of
social security for a GP visit remains constant. While GPs get a higher fee for contacts with patients at
their home and during the weekend, the content of the contact nor the GP's testing or prescribing
behavior adds to his/her income.
GPs are free to locate wherever they want (i.e. no location restrictions), with the exception of
physical and business separation of pharmacies. Moreover, GPs are joined in a system of night and
weekend duty organized on local market level (LKO’s) to guarantee permanent access to primary
care. GPs can furthermore differentiate themselves by getting an accreditation. Obtaining an
accreditation is conditional on registration and sharing requirements of patient contacts and quality
management (continuous education and participation to the local consultative committee of GPs).
GPs with an accreditation get a premium per patient contact as well as an annual reimbursement to
cover extra costs. As 80% of Belgian GPs have this accreditation and the accreditation is not
systematically communicated to patients, its signaling function is however limited.
Since 1996, the prescribing behavior of individual GPs has been recorded carefully and is made
available to GPs for self-evaluation (Farmanet). Institutional incentives for GPs concerning their
prescribing behavior only came into place starting 2004. The fees of GPs were increased as part of
the 2004-agreement as a compensation for GPs to put in effort to decrease the consumption of
antibiotics. Since then, GPs receive feedback on their prescription behavior of antibiotics, which is
discussed in local groups of GPs5. More importantly, GPs are urged to prescribe more generics or to
prescribe based on the active component. In September 2005, targets were agreed upon with
respect to the percentage of 'cheaper' daily doses prescribed per semester. While this was merely
informative in the early days, from April 2006 onwards, GPs needed to explain their lack of 'cheap
prescriptions'. If this explanation is deemed insufficient, the GP becomes subject to a six month
investigation of his/her prescription behavior with instant feedback. If his/her behavior does not
5 There is a lot of doubt whether this has had a real effect. The consumption of antibiotics has reduced, but this
can be due to a marketing campaign that was launched at the same time. A report by KCE indicates that GPs
experience the feedback as an attempt for the government to check and control and that the individual
feedback is barely discussed with other GPs in their consultative committee (LKO's). A report by RIZIV/INAMI
indicates that still too much antibiotics are prescribed in 2008.
5
change in favor of cheap prescriptions, sanctions can be taken. In short, GPs are given incentives to
prescribe more generics since 2006. Apart from that, there is neither institutional incentive nor
monetary benefit with respect to the frequency of prescribing and to the number of units prescribed.
GPs typically prescribe all the products a patient needs from the pharmacy. That is, a GP would write
a prescription for both over-the-counter drugs (OTCs) and prescription drugs. Whereas there is no
institutional incentive to prescribe at every patient contact, patients might include the prescribing
behavior as part of the quality of the GP. That is, patients feel they are helped better or are better
understood when a GP prescribes something at the end of the contact. Furthermore, taking the
effort of writing down the names and quantities of all products recommended to use, can be
experienced as a service. That is, at the very least, it helps patients remember that they can for
example take pain killers or reminds them to ask for it at the pharmacy. As real quality is hard to
judge, this visible element can potentially play an important role.
A population survey by WIV (2006) gives some insight in the use of GP care and of medication by the
Belgian population in 20046. 79% of the population indicated visiting a GP at least once in 2004, and
on average Belgians contacted their GP 4.6 times per year. Of these contacts, 31% takes place at the
patient’s home (i.e. home visits, 38% in our data). Information on the use of medication relates to a
two-week consumption period only. 47% of the population indicates the use of medication
prescribed by a physician in the two weeks prior to the questionnaire, and another 24% used non-
prescribed medication. The study furthermore indicates that the use of prescribed medication does
not depend on the urbanization or education level, but is related to age and gender: females
consume more prescribed medication, especially in the age group 15-34 years. Whereas there is an
increase in the use of prescribed medication according to age, the study shows a U-shaped relation
between age and non-prescribed drugs. Finally, there seems to be different consumption patterns
according to the regions of Belgium. The use of medication is higher in the Walloon region compared
to both the Brussels region and to Flanders.
Data sources
To study the prescribing behavior of GPs, we combine three independent data sets to get
information at market level on the prescription behavior of GPs, the number and characteristics of
GPs and the demand for care. We use the postal code as the relevant market level, as in Schaumans
and Verboven (2008): in general, studies indicate that patients typically do not travel far for GP care.
In WIV (2006), 95% of Belgian patients indicate having a single fixed physician in 2004, who is
conceivably located close to the patient’s home.
First, we have information on the number of units and its value (in producer prices) sold in Belgian
pharmacies following a prescription of a GP in 2003. Note that Belgian pharmacies have the
professional monopoly to sell not only prescription drugs but also OTC-drugs. This facilitates the
tracking of the prescription to a large extent. Furthermore, even nowadays internet pharmacies play
a negligible role in the Belgian market. This data is made available by IMSHealth Belgium and
organized by the individual GP (i.e. prescriber). Due to privacy concerns, the data is anonymized
6 The definition of prescribed medication in this study is close to what we are looking at in this paper. That is, it
is asked whether people have been consuming medication that has been prescribed or suggested by a
physician. As our data contains only prescribed medication, the definition in this study is a bit wider.
6
except for a location measure, which indicates in which of the 592 IMSHealth-areas of Belgium the
GP is active. These areas are defined based on a grouping of eight pharmacies and are therefore very
heterogeneous in terms of magnitude and characteristics. A second dataset on all 13,866 prescribing
GPs, their postal code and the relevant IMSHealth-area allows transferring the data on prescription
behavior to the postal code level. For every Belgian postal code with at least one active GP, we thus
have information on the number of prescribing GPs, the number of units prescribed (packages) and
the value of the prescriptions for the year 2003. On average, a local market holds 13.46 prescribing
GPs which on average prescribe 121,235 units in 2003. This results in a total of €1.502 billion across
Belgian markets in 2003 for prescribed drugs alone. Note that OTC's which are bought without GP
prescription and medication prescribed by medical specialists are not included in this dataset. The
data is therefore not a good indicator of total drug consumption, but focuses on the GP prescription
behavior only.
Second, we have information on the identity of active GPs in Belgium and the number of contacts
they have with patients for the year 2003. This data is made available by the National Institute of
Health Insurance (RIZIV/INAMI). A first data file contains an address list of all active GPs in Belgium,
with name, location and date of initial membership of RIZIV. From this, we retrieve the gender and
experience composition of GPs per postal code. A second data file gives information on the number
and type of patient contacts of GPs. Due to privacy concerns, the latter data is anonymized up to the
level of postal codes. We have insight, per postal code, in the total number of active GPs, the total
number of contacts of these GPs with patients, the percentage of these contacts that took place at
patients' homes (i.e. home visits) and the percentage of these contacts performed during the
weekend7.
Finally, we add information on the demographics of the Belgian postal codes. The demographic
characteristics are collected from the NIS (National Institute of Statistics), Ecodata (Federal
Government Agency for Economics), and RSZ (National Institute of Social Security). For the 1,044
postal codes in Belgium, we have information on the population size and density, the average income
and the unemployment rate, the gender, age and nationality composition of the population and the
geographic location of the postal code. We also add information on the location and size of hospitals
and clinics. Due to the specific nature of GPs related to hospitals, local markets containing a hospital
are dropped from the analysis.
3. What determines the prescribing behavior of GPs?
The question at hand is whether GP prescribing behavior is influenced by market characteristics. GPs
learn how and what to prescribe during their education and on the job, from others’ experience and
from medical representatives. But do GPs exhibit different prescribing patterns according to the
demographic and economic reality in which they function? Note that as we look at data from 2003,
7 We do not select GPs based on their performance, but include all GPs registered at RIZIV and with a positive
number of contacts. We do this to match the dataset of IMSHealth as closely as possible. We use a more
precise measure of active GPs as robustness check (see Schaumans 2014 for more information).
7
none of the programs to control GP prescribing behavior were yet in place8. To answer this question,
we look at two aspects of prescribing behavior: volume (measured by the per capita number of units
prescribed and the number of units prescribed per contact) and value (measured by the average
value of the units prescribed).
We organize explanatory variables in four groups. A first group contains characteristics of the
population of the local market, i.e. patient characteristics. A second groups considers characteristics
of the local market that are simultaneously determined by patients and GPs, i.e. patient-GP
characteristics. A third category groups characteristics of the GPs that are active in the local market,
i.e. GP characteristics. Finally, we want to control for the degree of competition in the GP market, i.e.
GP competition.
Patient characteristics
The amount of prescribed medication is in first instance determined by the demographic
characteristics of the population. Clearly, it is important to correct for the size of the market to
correctly compare the number of units prescribed across markets. This is done by focusing on the
variation in the per capita number of units prescribed. Furthermore, patient and GP behavior can
differ according to the size of the market and its population density. Population density is a good
proxy for network density, type of accommodation and distances between people. We expect that
the demand for care and medication is higher the more dense the market, as decease is more easily
transmitted.
Furthermore, when a specific local market is made up of a less healthy population, the need for
medical care and the use of medication will be higher. As indicated above, there is significant
variation in the consumption of prescribed medication according to population characteristics.
Females and Walloons consume more prescribed medication and the higher the age of patients, the
higher the consumption of prescribed drugs. This can be due to multiple reasons. First, the general
health condition of these people can be worse. Second, the perceived health status or cultural
differences make these people contact GPs more often and therefore increasing the opportunity to
get prescriptions. Third, GPs might have a differential approach in terms of prescribing toward
different type of patients.
Controlling for the number and type of contacts with GPs in the local market allows differentiation
between the demand driven and GP driven explanations. That is, as the first two options also imply
an increase in the number of GP contacts, controlling for this variable will leave only that part of the
variation in population characteristics due to GP behavior.
8 We are thus not picking up differences in response time to the feedback across markets (e.g. young GPs more
quickly following new standards as habit formation in prescribing is less).
8
Patient-GP characteristics
The number of contacts with GPs and the type of contacts GPs have with patients – home visits or
office visits, or in the weekend – can influence the prescribing behavior too. However, these results
from a combination of patient characteristics and GP choice behavior which clouds their
interpretation9.
The number of GP contacts in a market can be seen as a proxy of the general health status in the
local market. For 2004, we know that 80% of GP contacts originate based on patient's initiative. Data
from 2008 (WIV, 2010) indicates the 30% of these contacts concern a new medical complaint, 65%
concern chronic problems or a follow-up contact and in 5% of the cases a GP is contacted without
any specific medical complaint. Of this latter group, 11% concern a renewal of a prescription. In sum,
less than 1% of GP contacts specifically concern getting a prescription. As most of the contacts do
concern a medical problem, the number of GP contacts can be used as a measure of the
opportunities for GPs to prescribe medication. We thus expect a positive relationship between
prescriptions and the per capita number of GP contacts. However, a high number of GP contacts
might also be a result of GPs inducing contacts or following-up the patient more closely, or by
patients contacting the GP more regularly without specific medical concerns. If this occurs, we do not
expect to find any relation between prescriptions and the per capita number of GP contacts.
Furthermore, we would expect that the number of units prescribed per contact decreases in the
number of contacts.
GPs typically perform home visits for their elderly patients that have limited mobility (either because
of illness or context). The remainder of the home visits concerns people with severe illness and
immobility and thus unable to come and sit in the waiting room of the GP (claimed by the patient).
Data for 2004 (WIV, 2006) indicates that female patients have home visits more often compared to
male patients, also after correcting for age. With respect to age, the percentage home visits follows a
J-shaped curve: barely any home visits for the young and almost exclusively home visits for the
elderly. Less educated people and Walloons have more home visits compared to office contacts. As
home visits imply a lower average health status of the population, we expect to find a positive impact
of the percentage home visits on per capita prescriptions. Note that a GP receives a higher fee for
home visits compared to office contacts. In the case that the variation in the percentage of home
visits is purely driven by GP behavior, no effect is to be expected.
Visits during the weekend are performed by the on-call GP and typically take place at the homes of
patients. The severity of the illness is on average higher, as patients would prefer to wait and contact
their own GP because of the lower price and because of the personal connection (medical history
and social contact), if they considered this to be an option. It is thus expected that the number of
units prescribed is higher the more contacts take place during the weekend. Furthermore, the on-call
GP is visiting patients of his/her competitors, which might make him/her more inclined to prescribe
more units signaling quality, in the hope to enlarge his/her patientele (see later)10.
9 We refer to Schaumans (2014) for a discussion on GPs choice on the type of visits and on supplier inducement
in the Belgian GP markets. 10
Remark that in case follow-up contacts are needed, the on-call GP will ask the patient to contact his own GP
for this, as a part of the gentlemen-agreement in the local duty-system.
9
GP characteristics
Differences in prescribing behavior might alternatively originate from differences in the GPs’
characteristics across local markets. First, the level of experience can play a role. Starting GPs might
feel insecure and prescribe more than is needed, while experienced GPs have built up a lot of
knowledge on which medication works best under different circumstances, and thus prescribe more
targeted. On the other hand, starting GPs exhibit no habit formation yet and might therefore be
more critical in what they prescribe. Experienced GPs are also more visited by medical
representatives (as they also have in general larger practices) which can results in different
prescribing behavior. We expect that the largest variation in prescribing behavior between starting
and established GPs however is located in the exact products that are prescribed and no so much in
the volume prescribed, although this remains an empirical question. Second, the gender of a GP
might influence his/her prescribing behavior. We refrain from any conjecture on the expected
effects. Finally, whether or not a GP is accredited can play a role. Although the accreditation is not
linked to any requirement concerning prescribing medication, an accredited GP takes part in local
groups meetings and follows extra training. This might impact the prescribing behavior. Accredited
GPs have administrative requirements which systematically confronts them with medication history
of the patients. And accredited GPs have more opportunities to compare their own behavior with
others’ and to get feedback, due to the requirement to take part in the local consultative committee.
We have no strong conjectures on how the GP characteristics would impact the number and value of
prescriptions. Furthermore, remark that we are looking at data on market level and not with respect
to an individual GP and his/her characteristics (due to privacy concerns). We are thus comparing
markets with a high percentage of starters to markets with a low percentage of starters, and markets
with a high percentage of female GPs with markets with a low percentage of female GPs. The
variation in the data is thus limited and careful interpretation is warranted.
GP competition
Not only the characteristics of the patients and GPs can cause differences in prescribing behavior
across markets, also the economic situation can have an impact. That is, GPs might exhibit different
behavior if there is more competition in the market, i.e. more GPs per capita. The effect however has
to be indirect as GPs do not benefit monetarily from prescribing more units. We put forward four
hypotheses to explain a relationship between GP density (i.e. the level of competition in the GP
market) and the prescription behavior of GPs. To differentiate between them, we do not only
consider the per capita amount of prescriptions filled, but also look at the number of prescriptions
per patient contact.
As it is hard to differentiate in the market and as GP quality is hard to observe by patients, GPs
compete for patients through quality or perceived quality. This perceived quality can be linked to the
prescribing behavior of GPs. That is, patients typically expect the GP to write a prescription at the
end of a contact based on a health complaint. Patients might feel better understood and confirmed
in their health concern when they get prescriptions. To satisfy the expectation of patients, GPs are
therefore, in the face of competition, inclined to prescribe more units. Also, having all recommended
medication on paper, even when it concerns OTCs or medication that people typically have in their
medicine box, can be seen as an additional service. Under this ‘perceived quality competition’
10
hypothesis, GPs prescribe more medication at every contact in GP dense areas. As such, GP density
has a positive impact on both the number of units prescribed per capita and per contact11
.
Note that it might be the case that the prescriptions that are ‘induced’ by patient satisfaction are
cheaper, because of consideration of the cost for patients (perceived quality) or because ‘simpler’
and ‘cheaper’ medication suffices to treat the patient. We therefore also want to look at whether the
average value of prescribed drugs is affected by market conditions.
Alternatively, the impact of GP density on the number of prescriptions might originate from markets
with a low number of GPs per capita. That is, in GP scarce areas, there might be an under capacity of
GP care reflected in long waiting times and a lower level of service (e.g. shorter contacts, little room
for home visits). Patients can therefore on average visit GPs less often, which results in fewer
opportunities to prescribe and patients contacting GPs in a later stage of the decease. This ‘GP
scarcity’ hypothesis implies a positive impact of GP density on the per capita units prescribed.
However, it also entails a higher number of prescriptions in GP scarce areas as patients would on
average have a worse health status. This implies a negative impact of GP density on per contact units
prescribed.
Not only GPs can respond to a higher GP density in the market. Also patients are influenced by the
higher number of GPs in the market. That is, their shadow price of care decreases as the availability
of GPs increases (lower travel times, lower waiting times). This availability effect can induce them to
contact the GP more often. As GPs have more patient contacts, they might prescribe more drugs. A
higher GP density would thus result in a higher (or constant) per capita number of prescriptions. But
as this additional care would only concern minor health issues, the per contact number of
prescription is likely to be lower (or constant).
Finally, in the face of competition, GPs might prescribe more dispersed in time. That is, for some
patients and illnesses, the GP has some control over the number of contacts he/she has with
patients. For example, a significant part of GP contacts concerns beginning illness (coughing, a sore
throat, and headache). Often, the health issue is self-resolving in time with rest and the need for
antibiotics is limited to severe, persisting cases. The GP is unable to judge with certainty whether a
patient will need antibiotics. Since the use of antibiotics is being discouraged, the GP can do two
things. He/she can ask the patient to return in case the condition does not improve over the next few
days and at that time prescribe antibiotics. Alternatively, he/she can prescribe antibiotics at the first
contact, for the patient to fill only in case the condition does not improve over the next few days. The
same goes for patients with chronic conditions or systematic use of a specific drug (think of birth
control pills or insulin for diabetics): either the GP prescribes multiple packages at a single contact or
he/she follows the patient more closely and has the patient come back multiple times for a same
prescription. The total amount of prescribed medication (per capita) is independent of whether or
not the GP is dispersing the prescriptions in time. However, the number of contacts with patients in
the market will be higher the higher the level of GP competition in the market.
11
Remark that Schaumans (2014) indicates the presence of supplier inducement as a response to higher
competitive pressure. Inducement would increase the number of GP contacts in GP dense areas. To prevent GP
contacts to be void, GPs might want to signal the necessity of the visit by prescribing more. However, the
inherent need of prescribing might lie lower.
11
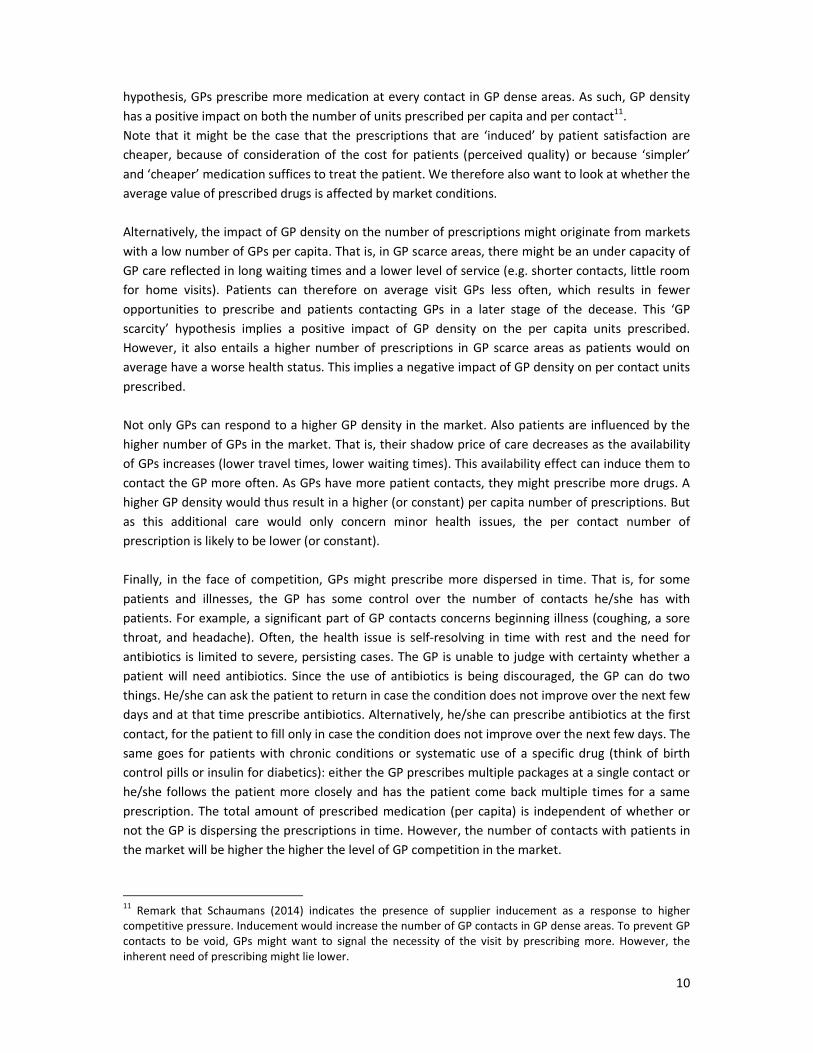
Table 1 collects the expected impact of GP density on GP prescribing behavior according to different
hypotheses on GPs reaction to increased competition. The table makes clear that analyzing both the
per capita amount of prescriptions filled and the number of prescriptions per patient contact allows
differentiation between the alternative hypotheses.
Table 1: Impact of GP density on GP prescribing behavior according to hypothesis
Hypothesis Impact of GP density on
units prescribed per capita
Impact of GP density on
units prescribed per contact
Perceived quality competition + +
GP scarcity + -
Availability +/0 -/0
Dispersion in time 0 -
Next to GP density, the variation in practice size can influence the extent to which GPs experience
competition and can thus have an impact on the prescribing behavior of GPs. When a GP is a
monopolist, he/she will not experience any competitive pressure, despite of a high GP density. When
the local market is dominated by a single GP and other GPs only have small practices (i.e. a
concentrated market), the economic incentives are different from when all GPs have same-size
practices. It is thus important to control for the market structure and market concentration.
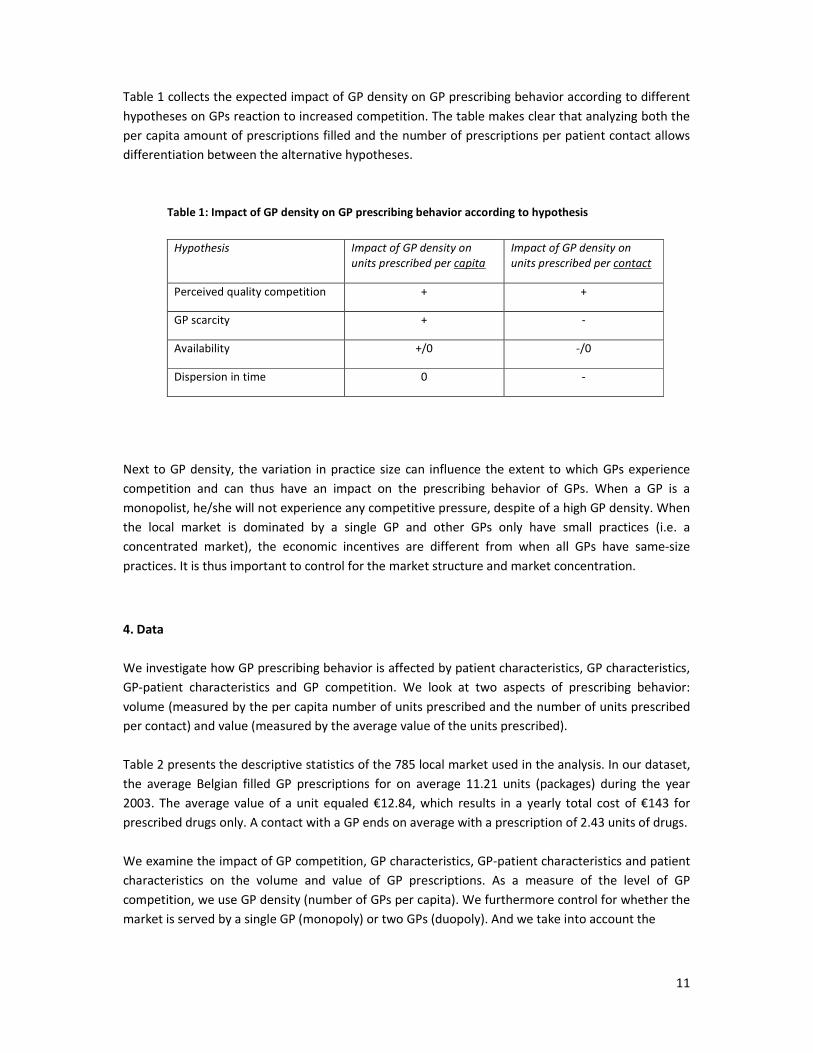
4. Data
We investigate how GP prescribing behavior is affected by patient characteristics, GP characteristics,
GP-patient characteristics and GP competition. We look at two aspects of prescribing behavior:
volume (measured by the per capita number of units prescribed and the number of units prescribed
per contact) and value (measured by the average value of the units prescribed).
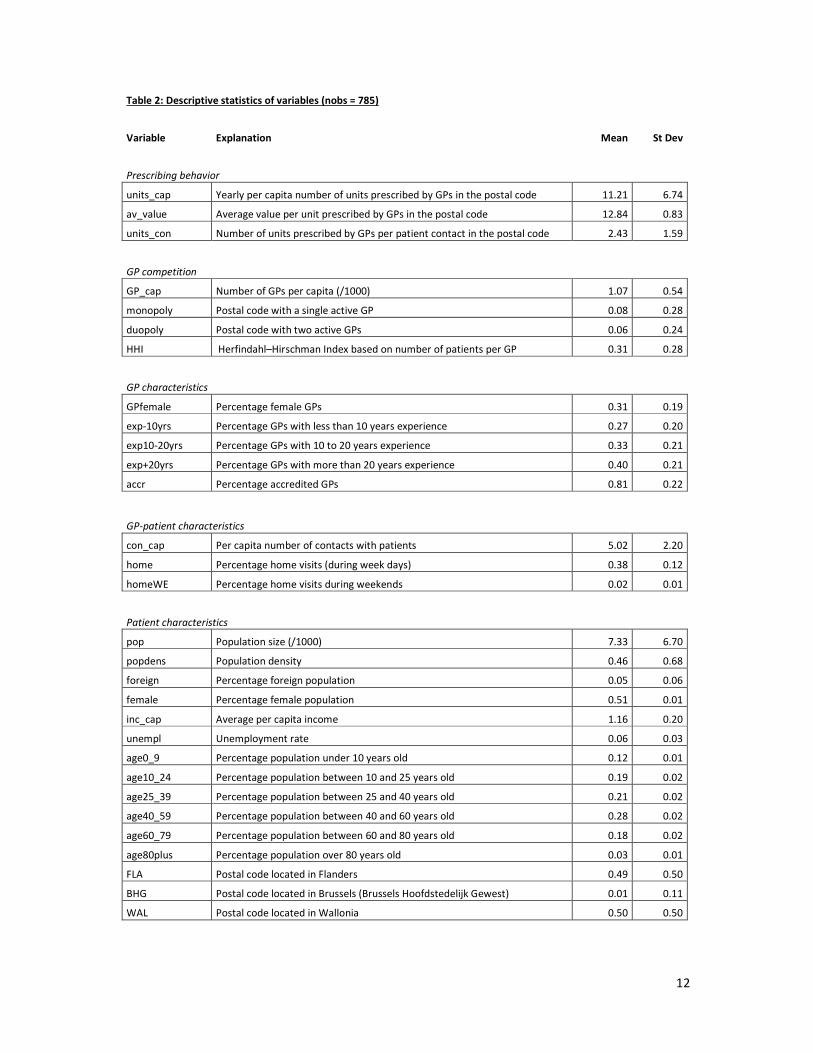
Table 2 presents the descriptive statistics of the 785 local market used in the analysis. In our dataset,
the average Belgian filled GP prescriptions for on average 11.21 units (packages) during the year
2003. The average value of a unit equaled €12.84, which results in a yearly total cost of €143 for
prescribed drugs only. A contact with a GP ends on average with a prescription of 2.43 units of drugs.
We examine the impact of GP competition, GP characteristics, GP-patient characteristics and patient
characteristics on the volume and value of GP prescriptions. As a measure of the level of GP
competition, we use GP density (number of GPs per capita). We furthermore control for whether the
market is served by a single GP (monopoly) or two GPs (duopoly). And we take into account the
12
Table 2: Descriptive statistics of variables (nobs = 785)
Variable Explanation Mean St Dev
Prescribing behavior
units_cap Yearly per capita number of units prescribed by GPs in the postal code 11.21 6.74
av_value Average value per unit prescribed by GPs in the postal code 12.84 0.83
units_con Number of units prescribed by GPs per patient contact in the postal code 2.43 1.59
GP competition
GP_cap Number of GPs per capita (/1000) 1.07 0.54
monopoly Postal code with a single active GP 0.08 0.28
duopoly Postal code with two active GPs 0.06 0.24
HHI Herfindahl–Hirschman Index based on number of patients per GP 0.31 0.28
GP characteristics
GPfemale Percentage female GPs 0.31 0.19
exp-10yrs Percentage GPs with less than 10 years experience 0.27 0.20
exp10-20yrs Percentage GPs with 10 to 20 years experience 0.33 0.21
exp+20yrs Percentage GPs with more than 20 years experience 0.40 0.21
accr Percentage accredited GPs 0.81 0.22
GP-patient characteristics
con_cap Per capita number of contacts with patients 5.02 2.20
home Percentage home visits (during week days) 0.38 0.12
homeWE Percentage home visits during weekends 0.02 0.01
Patient characteristics
pop Population size (/1000) 7.33 6.70
popdens Population density 0.46 0.68
foreign Percentage foreign population 0.05 0.06
female Percentage female population 0.51 0.01
inc_cap Average per capita income 1.16 0.20
unempl Unemployment rate 0.06 0.03
age0_9 Percentage population under 10 years old 0.12 0.01
age10_24 Percentage population between 10 and 25 years old 0.19 0.02
age25_39 Percentage population between 25 and 40 years old 0.21 0.02
age40_59 Percentage population between 40 and 60 years old 0.28 0.02
age60_79 Percentage population between 60 and 80 years old 0.18 0.02
age80plus Percentage population over 80 years old 0.03 0.01
FLA Postal code located in Flanders 0.49 0.50
BHG Postal code located in Brussels (Brussels Hoofdstedelijk Gewest) 0.01 0.11
WAL Postal code located in Wallonia 0.50 0.50
13
extent of market concentration, by including the Herfindahl–Hirschman Index (HHI) of market
concentration. This measure is computed based on the division of patients over the different active
GPs in the market. The closer HHI to 1, the more concentrated the market, the higher the
concentration of patients with few GPs and thus the more diverse the GP practices in terms of size of
patientele. The Belgian local markets have an average of 1.07 GPs per 1,000 inhabitants. Eight
percent of postal codes holds only one active GP and six percent are duopoly markets. The average
HHI is 0.31. There however is a large variation and the average is skewed because of the markets
with few GPs. The median HHI is only 0.20 and looking at markets with more than 2 active GPs, the
average HHI equals 0.19 (s.d. 0.12). Furthermore, 34% of all markets have a HHI under 0.15, which is
considered the threshold of being competitive (same sizes)12
.
The GP characteristics we control for are the gender and experience composition of the GPs, the
extent to which GPs are accredited. In the average market 31% of GPs is female, 27% has less than 10
years of experience and 40% has more than 20 years of experience, and 81% has an additional
accreditation. The number and type of contacts GPs perform are used as GP-patient characteristics.
On average GPs have yearly 5.02 contacts with his/her patients. 38% of these contacts are home
visits and two percent are contacts during the weekend (on-call visits). Patient characteristics include
the population size and density, the average income and the unemployment rate, the gender, age
and nationality composition of the population and the geographic location of the postal code.
5. Analysis
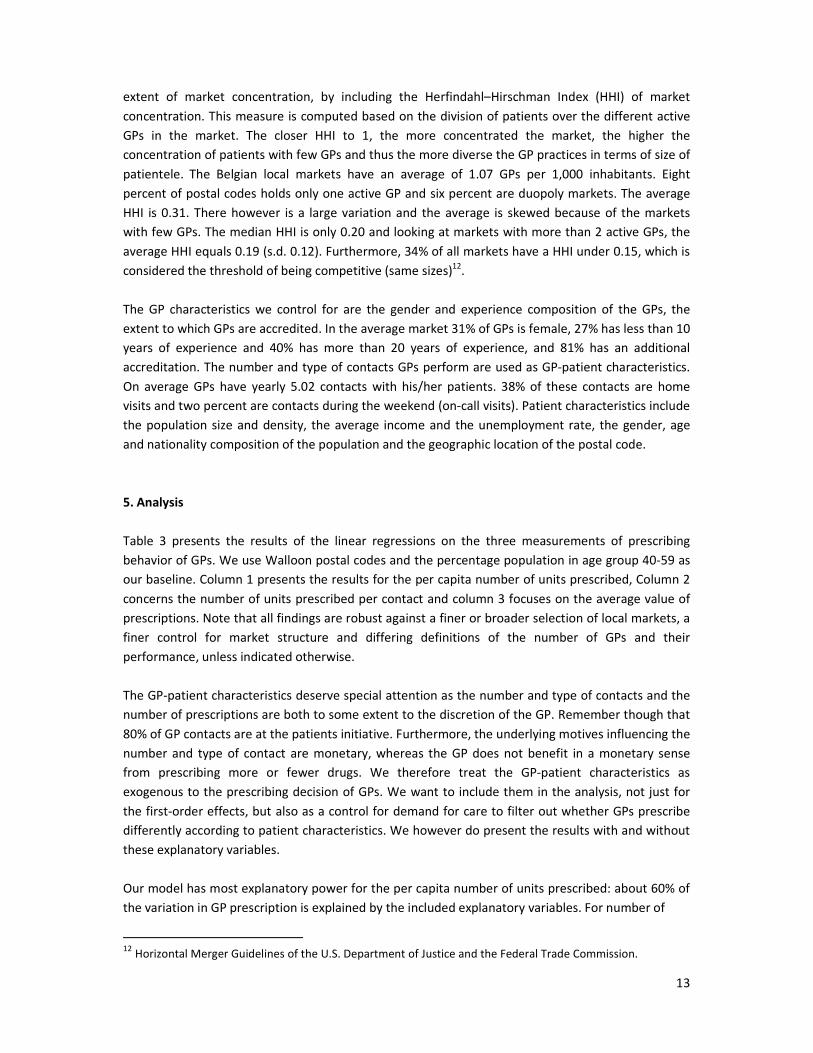
Table 3 presents the results of the linear regressions on the three measurements of prescribing
behavior of GPs. We use Walloon postal codes and the percentage population in age group 40-59 as
our baseline. Column 1 presents the results for the per capita number of units prescribed, Column 2
concerns the number of units prescribed per contact and column 3 focuses on the average value of
prescriptions. Note that all findings are robust against a finer or broader selection of local markets, a
finer control for market structure and differing definitions of the number of GPs and their
performance, unless indicated otherwise.
The GP-patient characteristics deserve special attention as the number and type of contacts and the
number of prescriptions are both to some extent to the discretion of the GP. Remember though that
80% of GP contacts are at the patients initiative. Furthermore, the underlying motives influencing the
number and type of contact are monetary, whereas the GP does not benefit in a monetary sense
from prescribing more or fewer drugs. We therefore treat the GP-patient characteristics as
exogenous to the prescribing decision of GPs. We want to include them in the analysis, not just for
the first-order effects, but also as a control for demand for care to filter out whether GPs prescribe
differently according to patient characteristics. We however do present the results with and without
these explanatory variables.
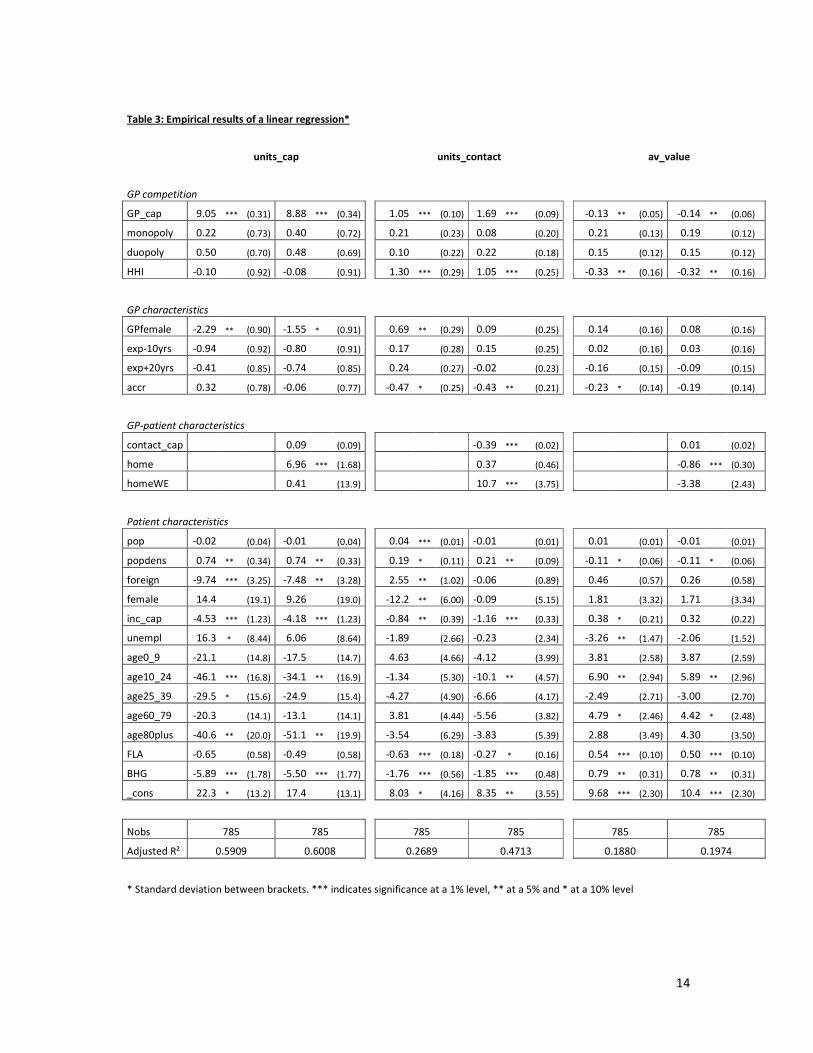
Our model has most explanatory power for the per capita number of units prescribed: about 60% of
the variation in GP prescription is explained by the included explanatory variables. For number of
12
Horizontal Merger Guidelines of the U.S. Department of Justice and the Federal Trade Commission.
14
Table 3: Empirical results of a linear regression*
units_cap
units_contact
av_value
GP competition
GP_cap 9.05 *** (0.31) 8.88 *** (0.34) 1.05 *** (0.10) 1.69 *** (0.09) -0.13 ** (0.05) -0.14 ** (0.06)
monopoly 0.22 (0.73) 0.40 (0.72) 0.21 (0.23) 0.08 (0.20) 0.21 (0.13) 0.19 (0.12)
duopoly 0.50 (0.70) 0.48 (0.69) 0.10 (0.22) 0.22 (0.18) 0.15 (0.12) 0.15 (0.12)
HHI -0.10
(0.92) -0.08
(0.91)
1.30 *** (0.29) 1.05 *** (0.25)
-0.33 ** (0.16) -0.32 ** (0.16)
GP characteristics
GPfemale -2.29 ** (0.90) -1.55 * (0.91)
0.69 ** (0.29) 0.09 (0.25)
0.14 (0.16) 0.08 (0.16)
exp-10yrs -0.94 (0.92) -0.80 (0.91) 0.17 (0.28) 0.15 (0.25) 0.02 (0.16) 0.03 (0.16)
exp+20yrs -0.41 (0.85) -0.74 (0.85) 0.24 (0.27) -0.02 (0.23) -0.16 (0.15) -0.09 (0.15)
accr 0.32 (0.78) -0.06 (0.77) -0.47 * (0.25) -0.43 ** (0.21) -0.23 * (0.14) -0.19 (0.14)
GP-patient characteristics
contact_cap 0.09 (0.09) -0.39 *** (0.02) 0.01 (0.02)
home 6.96 *** (1.68)
0.37 (0.46)
-0.86 *** (0.30)
homeWE 0.41 (13.9) 10.7 *** (3.75) -3.38 (2.43)
Patient characteristics
pop -0.02 (0.04) -0.01 (0.04) 0.04 *** (0.01) -0.01 (0.01) 0.01 (0.01) -0.01 (0.01)
popdens 0.74 ** (0.34) 0.74 ** (0.33) 0.19 * (0.11) 0.21 ** (0.09) -0.11 * (0.06) -0.11 * (0.06)
foreign -9.74 *** (3.25) -7.48 ** (3.28) 2.55 ** (1.02) -0.06 (0.89) 0.46 (0.57) 0.26 (0.58)
female 14.4 (19.1) 9.26 (19.0)
-12.2 ** (6.00) -0.09 (5.15)
1.81 (3.32) 1.71 (3.34)
inc_cap -4.53 *** (1.23) -4.18 *** (1.23) -0.84 ** (0.39) -1.16 *** (0.33) 0.38 * (0.21) 0.32 (0.22)
unempl 16.3 * (8.44) 6.06 (8.64) -1.89 (2.66) -0.23 (2.34) -3.26 ** (1.47) -2.06 (1.52)
age0_9 -21.1 (14.8) -17.5 (14.7) 4.63 (4.66) -4.12 (3.99) 3.81 (2.58) 3.87 (2.59)
age10_24 -46.1 *** (16.8) -34.1 ** (16.9)
-1.34 (5.30) -10.1 ** (4.57)
6.90 ** (2.94) 5.89 ** (2.96)
age25_39 -29.5 * (15.6) -24.9 (15.4) -4.27 (4.90) -6.66 (4.17) -2.49 (2.71) -3.00 (2.70)
age60_79 -20.3 (14.1) -13.1 (14.1) 3.81 (4.44) -5.56 (3.82) 4.79 * (2.46) 4.42 * (2.48)
age80plus -40.6 ** (20.0) -51.1 ** (19.9) -3.54 (6.29) -3.83 (5.39) 2.88 (3.49) 4.30 (3.50)
FLA -0.65 (0.58) -0.49 (0.58)
-0.63 *** (0.18) -0.27 * (0.16)
0.54 *** (0.10) 0.50 *** (0.10)
BHG -5.89 *** (1.78) -5.50 *** (1.77) -1.76 *** (0.56) -1.85 *** (0.48) 0.79 ** (0.31) 0.78 ** (0.31)
_cons 22.3 * (13.2) 17.4 (13.1) 8.03 * (4.16) 8.35 ** (3.55) 9.68 *** (2.30) 10.4 *** (2.30)
Nobs 785 785
785 785
785 785
Adjusted R² 0.5909 0.6008 0.2689 0.4713 0.1880 0.1974
* Standard deviation between brackets. *** indicates significance at a 1% level, ** at a 5% and * at a 10% level
15
units prescribed per contact and the average value of prescriptions, the empirical model only
explains respectively 47% and 20% of the variation in the data. The R² furthermore indicates that the
inclusion of GP-patient characteristics is especially relevant for explaining the per contact
prescriptions. Likelihood-ratio tests indicate that the inclusion of GP competition, GP-patient
characteristics and patient characteristics each statistically significant improve the model fit for all
three models. The inclusion of GP characteristics on the other hand improves both models of volume
of GP prescriptions slightly (LR-test only significant at a 10% level) and are not relevant in explaining
the value of the prescriptions (LR-test is not significant).
GP competition
Our primary finding is that competition does seem to matter. That is, the higher the number of GPs
per capita, the higher both the number of units per capita and the number of units per contact
prescribed by a GP. These findings are robust for controlling for GP characteristics (i.e. this is not due
to sorting of GPs) and for market structure. The evidence is consistent with the hypothesis of
perceived quality competition. That is, the more competition for patients, the higher the likelihood of
GPs to satisfy the expectation of patients to receive a prescription at the end of a contact. Since the
average value of the prescriptions is negatively affected by GP density, there also is some evidence
that when GPs satisfy the patients’ expectation for prescriptions, they do so with cheaper
medication. Important to note here is that the finding of the negative impact of GP density on the
average value of prescriptions is not robust to changes in the definition of GP density.
The fact that our findings indicate that higher competition in the market results in a higher number
of units prescribed per consult, refutes the alternative hypotheses of GP scarcity and availability
effects. Under the scarcity hypothesis, low levels of competition would results in a higher number of
units prescribed per contact. And the availability hypothesis predicts, if anything, that high GP
density goes together with lower per contact prescriptions. Furthermore, the evidence is not
consistent with the hypothesis of GP dispersing prescriptions over time when there is more
competition in the GP market. If anything, competition makes GPs cluster prescriptions in a single
contact, which can be consistent with the perceived quality argument to the extent that it would not
concern patients with comorbidities that require close follow-up. It would then be considered a
service and a sign of trust by your GP that the patient does not have to return in the short or medium
run to receive a repeat-prescription.
The volume and value prescribed is not different in monopoly or duopoly markets compared to
market with more GPs. However, the Herfindahl–Hirschman Index does have a significant impact on
prescribing behavior of GPs. The higher the HHI, higher the number of prescriptions per contact and
the lower the value of the prescriptions. As the HHI is typically used as a measure of market
concentration, one would conclude that a lower the degree of competition, as the market is
dominated by few players, results in more but cheaper prescriptions per contact. This goes against
the intuition that competition drives the prescribing behavior. However, we can interpret the HHI
differently. That is, it can be seen as the extent to which GP practices differ in size. Conditional on the
number of GPs in the market, the more alike GP practices are, the lower the HHI. As our findings are
unaffected by adding additional dummy variables for the number of GPs in the local market, we thus
conclude that local market with same-size GP practices render a lower number of prescriptions per
16
patient contact of a higher value. Put differently, when there is a dominant GP practice in the market,
there is a higher number of prescriptions per patient contact of a lower value.
In sum, the higher is the GP density, the higher is the volume of prescriptions and the lower is the
value of prescription. These effects are magnified the more different the GP practices are in size. A
possible explanation is that GPs are more inclined to use prescriptions to signal quality when they are
small and attempt to attract patients of a GP with a large practice. As such, this type of quality
competition would occur less when GPs are more similar in terms of number of patients.
GP characteristics
As expected, we find little impact of the GP composition in a local market on the prescribing behavior
in the market. Likelihood-ratio tests indicate that these variables only have a minor or no significantly
impact on the predicting power of our models.
We find some indication that a higher proportion of female GPs in the local market decreases the
total number of units per capita prescribed, but increases the number of prescriptions per contact.
Correcting for the number and type of contacts in the market however decreases the importance of
this effect. That is, the number of units per contact is unaffected, as is the value of prescriptions. This
is consistent with female GPs performing fewer contacts with their patients, while contacts do result
in the same outcome as with male GPs (same value and same number of prescriptions). Our findings
can be explained by self-selection of patients to female GPs or a higher likelihood of part-time
employment by female GPs and their choice to perform home visits.
The number of years of experience as a GP seems not to play any significant role. The higher the
proportion GPs that has an additional accreditation does seem to reduce the number of units
prescribed per contact. This might be explained by accreditation implying a closer follow-up with
patients and thus dispersing prescriptions in time. Alternatively, the results can be explained by a
disciplining or signaling effect of the accreditation.
As our level of aggregation reduces the variability in the data, it would be interesting to see whether
there are more significant effects on the volume and value prescribed when considering GP level
information.
GP-patient characteristics
With respect to the number of GP contacts per capita, we find somewhat unexpected results. When
there are more GP contacts per capita in the market, there is no increase in the per capita number of
prescriptions. This implies that the demand for GP care is not systematically related to the demand
for prescriptions. In other words, when patients contact the GP more often, GPs will not prescribe
more medication. As the number of units prescribed per contact decreases in the number of contacts
with patients, it seems that GPs in general are dispersing prescriptions in time (although unrelated to
the level of competition in the market). This can be indicative of GPs inducing contacts or following-
up the patient more closely, or by patients contacting the GP more regularly without specific medical
concerns.
17
The higher the percentage home visits in a local market, the higher the per capita number of units
prescribed, but there is no significant impact on the number of units prescribed per contact. As this
variable indicates a worse health status of the average patient, the higher the demand for care and
medication. The results on per contact number of prescriptions is consistent with GPs systematically
visiting elderly patients with comorbidities every month to closely follow-up the health status and
the co-use of different drugs. We furthermore find that the average value of the prescriptions is
significantly lower the more home visits are performed. This can indicate that GPs take into account
the monetary restrictions of elderly.
The percentage visits during the weekend in turn does not significantly affect the per capita number
of units prescribed, but impacts the number of units prescribed per contact positively. The size of the
latter effect is also very big. The results are consistent with a higher demand for medication in the
urgent cases and with signaling quality.
Patient characteristics
With respect to patient characteristics, we find that, as expected, population density has a positive
significant impact on number of units prescribed per capita and per contact. We moreover find that
in population dense areas, the average value of the prescriptions is lower.
The nationality of the population matters as well: the higher the percentage foreigners, the lower the
number of units prescribed per capita but the higher the per contact units prescribed. The latter
effect however disappears once we control for the number and type of contacts with GPs. Other
studies (Schaumans and Verboven 2008) indicate that foreigners attend a GP less regularly13
. This is
consistent with our findings: the higher the percentage foreigners, the lower the demand for GP care
and thus GP prescriptions. When foreigners contact a GP though, their general health condition is
typically worse (as they postpone getting care) which results in a higher number of prescriptions per
contact. Once we control for number and type of GP contacts (foreigners contact GPs less often),
there is no residual effect: GPs thus not prescribe differently for foreign patients.
Contrary to expectations and the findings in WIV (2006), we find no effect of the percentage females
on per capita number of prescriptions. Even more, females have a negative impact on the per
contact number of prescriptions, but this effect does not remain once controlled for number and
type of GP contacts. Our findings can be explained by females contacting GPs more often (as found in
WIV, 2006) and that in response GPs disperse prescriptions more in time. We find no evidence in our
data that females consume more prescribed medication and that GPs would prescribe differently for
female patients.
With respect to per capita income, our findings are consistent with the hypothesis that a lower
income population has a lower health condition and thus consuming GP care and GP prescriptions
more. That is, a higher per capita income in a market results in a lower number of units prescribed,
both per capita and per contact. Alternatively, our findings can be explained by high income people
substituting GP care for specialist care, as there is no gatekeeping in place in Belgium, and visiting
GPs only for trivial cases that require little care (and thus prescriptions). There is also some indication
13
There are multiple explanations for this. Foreigners have a tendency to travel home for health care
consumption and to use the emergency room as care provider.
18
that GP prescriptions concern more expensive medication if the patientele has a higher average
income, but this effect disappears once we control for the number and type of contacts.
The unemployment rate plays a minor or no role in explaining the volume of prescriptions or the
prescribing behavior of GPs. With respect to age, our findings indicate that our base group of the age
cohort 40-59 is part of the population that receives the highest number of GP prescriptions. Taken
together, a high population proportion between 25 and 79 years old results in a high number of units
prescribed. We find that the higher the percentage population between 10 and 25, the lower the per
capita and per contact prescriptions. This is consistent with the young requiring less GP care and
medication and GPs being less inclined to prescribe medication for this age group14
. Surprisingly, the
higher the percentage elderly (over 80) the lower the number of GP prescriptions per capita. Remark
that this finding is persistent after correcting for the number and type of contacts with GPs and thus
indicates a different prescribing behavior of the GPs (as opposed to a lower need for medication). A
potential explanation can be that elderly are more quickly referred to medical specialists in light of
comorbidities.
Finally, we find systematic difference between the regions of Belgium. Consistent with the findings in
WIV (2006), there is a higher number of prescription in the Walloon area, especially compared to the
Brussels region. We furthermore find that the average value of prescriptions in Wallonia is however
lower. As these results persist after correcting for other patient characteristics and GP-patient
characteristics, the difference in the volume and value of prescriptions is due to differences in GP
behavior.
6. Conclusion
In this paper, we study the prescribing behavior of General Practitioners in Belgium in 2003. More
precisely, we investigate whether the volume and the value of prescriptions systematically differs
across markets and test which market characteristics are relevant in explaining these differences.
Apart from patient characteristics, we find that GP density in the local market and the characteristics
of these GPs plays a role in explaining especially the volume of the prescriptions by GPs.
Our evidence indicates that the higher the competitive pressure, the higher the volume of
medication prescribed, both per capita and per contact. This is somewhat surprising as there is no
direct monetary benefit for the GP in prescribing more medication. As these results are not
consistent with other GP behavior in response to competition, we conclude that GPs seem to use
prescriptions as a signal of quality in order to compete with other GPs in the market. This type quality
competition stems from GPs having little means to compete, from patients' expectation to receive a
prescription at the end of a GP contact and from the inability of patients to measure or observe real
GP quality. Furthermore, GPs seem to use this quality signal more, the different the GP practices are
in size.
14
Note that this age group is very vulnerable muscular-skeletal problems, which are typically not treated by a
GP or medication (think of physiotherapy).
19
Notice that we are focusing on GP prescribing behavior in this paper and not the consumption of
medication. Our data does not allow us to differentiate between OTC-drugs prescriptions and
prescriptions related to prescription drugs and the data only comprises what GPs prescribed and not
with the consumption of medication as a whole. Policy conclusions are therefore limited and
premature. Further and complementary research would be able to clarify whether for example there
is a higher consumption of non-prescribed OTC-drugs in regions with a lower GP density. The higher
number of GP prescriptions in GP dense markets, might therefore not results in a higher
consumption of medication as a whole (patients would use GP contacts to guide their drug
consumption). Depending on complementary results, our findings can both support a limitation on
the number of GPs per local market (if GP prescribing behavior results in a higher total consumption
of medication) and stimulating entry of GPs in markets with fewer GPs (if GP prescribing behavior
does not results in a higher total consumption of medication).
Our empirical results also indicate that per capita volume of prescribed medication by GPs is
positively affected by the percentage of home visits and population density. It however decreases
the higher is the percentage female GPs, the percentage foreign patients and patients in age cohort
10-24 and over eighty, the average per capita income and in the Brussels area. Per contact volume is
positively affected by the percentage of home visits during the weekend and population density and
negatively affected by the per capita number of GP contacts. The per contact volume is also lower
the lower the average per capita income, the lower the percentage patients in age cohort 10-24 and
in the Brussels area. Finally, the average value of a GP prescription is positively influenced by the
percentage patients in age cohorts 10-24 and 60-79 and lies higher in Flanders and the Brussels area.
A lower value is prescribed when there are more home visits and in high population dense areas. In
sum, GPs do have a different tendency to prescribe medication for different patient types and GPs
behave differently according to their economic and cultural environment. Note that, due to
confidentiality, our analysis is based on market level data. It would be interesting to study the
prescribing behavior on GP level to study the impact of GP characteristics more closely. For example,
do female GPs, GPs with a lot of experience or GPs with few patients prescribe differently?
References
Allard M., Léger P.T. and Rochaix L., "Provider Competition in a Dynamic Setting" in Journal of
Economics & Management Strategy, Vol 18(2), 2009.
Carlsen F. and Grytten J., "More Physicians: improved availability or induced demand?" in Health
Economics Vol. 7, 1998.
Delattre E. and Dormont B., "Fixed fees and physician-induced demand: a panel data study on French
physicians" in Health Economics Vol. 12, 2003.
Dranove D. and Satterthwaite M, "Chapter 20: The industrial organization of health care markets", in
The Handbook of Health Economics, Edited by Edited by A.J. Culyer and J.R Newhouse, 2000.
Gaynor M., "What Do We Know About Competition and Quality in Health Care Markets?", NBER
Working Papers 12301, 2006
20
Gaynor M. and Town R.J., "Chapter Nine - Competition in Health Care Markets" in Handbook of
Health Economics Volume 2, Edited by Mark V. Pauly, Thomas G. McGuire and Pedro P. Barros, Pages
499-637, 2011.
Godager G., Iversen T. and Ma C., "Competition, Gatekeeping, and Health Care Access", HERO
working paper 2012 (2).
Iversen T. and Ma C. . "Market conditions and general practitioners’ referrals," in International
Journal of Health Care Finance and Economics, Vol 11(4), 2011.
Biørn, E. and Godager G., "Does quality influence choice of general practitioner? An analysis of
matched doctor-patient panel data", in Economic Modelling, Vol 27(4), 2010.
Pike C., “An Empirical Analysis of the Effects of GP Competition”, MPRA Paper No. 27613, 2010.
Porter M.E. and Teisberg E.O., "Redefining competition in health care", Harvard Business review,
June 2004.
Propper C., Burgess S., Green K., "Does competition between hospitals improve the quality of care?:
Hospital death rates and the NHS internal market", in Journal of Public Economics, Vol 88(7-8), 2004.
Schaumans C. and Verboven F., "Entry and regulation: Evidence from health care professionals",
RAND Journal of Economics, Vol. 39 (4), 2008.
Schaumans C., "Supplier induced demand in Belgian primary care markets", working paper 2014.
Schaumans C., "What's up doc? Competition in GP markets revisited", working paper 2014.
Scott A., “Chapter 22 – Economics of General Practice” Handbook of Health Economics, Volume 1,
Edited by A.J. Culyer and J.R Newhouse, pages 1176 – 1200, 2000.
Sorensen R.J. and Grytten J., " Competition and supplier-induced demand in a health care system
with fixed fees" in Health Economics, Vol 8 (6), 1999.
Wetenschappelijk Instituut Volksgezondheid, “Gezondheidsenquête door middel van Interview,
België, 2004”, by Bayingana K., Demarest S., Gisle L., Hesse E., Miermans P.J., Tafforeau J., Van der
Heyden J., Depotnummer: D/2006/250/4, IPH/EPI REPORTS N° 2006 – 035, 2006.
Wetenschappelijk Instituut Volksgezondheid, “Gezondheidsenquête België, 2008. Rapport I -
Gezondheidstoestand.”, by Van der Heyden J., Gisle L., Demarest S., Drieskens S., Hesse E. and
Tafforeau J., ISSN: 2032-9172 - Depotnummer. D/2010/2505/06 – IPH/EPI REPORTS N° 2010/004,
2010.