
preparation of magnetic nano composite beads and their
196
PREPARATION OF MAGNETIC NANO COMPOSITE BEADS AND THEIR APPLICATION TO REMEDIATION OF MINE WASTEWATERS Report to the Water Research Commission by Nikita Tavengwa, Luke Chimuka, Ewa Cukrowska School of Chemistry, University of the Witwatersrand, Johannesburg WRC Report No. 2014/1/13 ISBN 978-1-4312-0478-6 November 2013
-
Upload
khangminh22 -
Category
Documents
-
view
1 -
download
0
Transcript of preparation of magnetic nano composite beads and their
PREPARATION OF MAGNETIC NANO COMPOSITE BEADS AND THEIR APPLICATION TO REMEDIATION OF MINE WASTEWATERS
Report to the
Water Research Commission
by
Nikita Tavengwa, Luke Chimuka, Ewa Cukrowska School of Chemistry, University of the Witwatersrand, Johannesburg
WRC Report No. 2014/1/13 ISBN 978-1-4312-0478-6
November 2013

ii
Obtainable from Water Research Commission Private Bag X03 Gezina, 0031 [email protected] or download from www.wrc.org.za
DISCLAIMER This report has been reviewed by the Water Research Commission (WRC) and approved for
publication. Approval does not signify that the contents necessarily reflect the views and policies of the WRC nor does mention of trade names or commercial products constitute
endorsement or recommendation for use.
© WATER RESEARCH COMMISSION
iii
EXECUTIVE SUMMARY In this project, magnetic ion imprinted polymers with high recognition for uranyl (UO2
2+) and chromium Cr(VI} ions were prepared for the first time. The prepared magnetic ion imprinted polymers were characterised and optimised in the laboratory. They were then applied to wastewaters from acid mine drainage and influent from wastewater treatment plant.
The optimum extraction parameters in batch format for magnetic ion imprinted polymers for urany ions were found to be sample pH of 4, 50 mg of magnetic ion imprinted polymers for a 25 ml sample volume. The optimum contact time was found to be 45 minutes at a stirring speed of 1500 rpm. The lower maximum extraction time implies that the magnetic ion imprinted polymers have fast binding kinetics. Under these optimum conditions, the recovery of urany ions was found to be above 80%. The binding of urany ions on the magnetic ion imprinted polymers were found to follow pseudo second order kinetics with rate constant (k2) and correlation coefficient (R2) ranging between 0.273-0.678 and 0.9811-0.9992 respectively. This implied a chemisorptions interaction of the uranyl ions with the magnetic polymers. The adsorption of uranyl ions onto the polymers fitted both Freundlich and Langmuir models. The maximum adsorption capacity was found to be around 1.2 mg g-1 which is in the same range as other magnetic ion imprinted polymers but lower than other ordinary polymers or imprinted polymers without magnetic ions. Despite low binding capacity, the prepared magnetic ion imprinted polymers when tested for selectivity were found to have superior selectivity for uranyl ions compared to major competitors of Fe3+, Pb2+, Ni2+ and Mg2+ that have similar ionic radius. The selectivity order observed was as follows: UO2
2+ > Fe3+ > Pb2+ > Ni2+ > Mg2+. The same selectivity and recovery was observed when the magnetic ion imprinted polymers were applied to wastewaters from acid mine drainage and influent from wastewater treatment plant.
The optimum extraction conditions for the prepared magnetic ion imprinted polymers for Cr (VI) were found to be as follows; sample pH of 4, adsorbent amount of 20 mg for a 25 ml sample volume. The extraction time was 40 minutes at stirring speed of 1500 rpm. The low extraction time indicates fast binding kinetics of Cr(VI) to the prepared polymers. At optimum conditions, the recovery of Cr(VI) was above 80%. The maximum adsorption capacity for the magnetic polymers was found to be 6.20 mg g-1. The optimum time for the adsorption of the Cr (VI) analyte was determined as 40 minutes at stirring speed of 600 rpm. The binding of Cr(VI) on the magnetic ion imprinted polymers were found to follow pseudo second order kinetics. This implied a chemisorptions interaction of the Cr(VI) ions with the magnetic polymers. The adsorption of Cr(VI) onto the polymers fitted neither Freundlich nor Langmuir models. The prepared magnetic ion imprinted polymers were found to very selective towards Cr(VI) compared to other ions such as SO4
2-, F- and NO3
-. The order of selectivity of anions followed the trend: Cr2O7
2- > SO42- > F- > NO3
-.
The prepared magnetic materials may not be suited for remediation of polluted wastewater for uranyl and Cr(VI) ions on a large scale because of high cost of preparing them but are very good as sample extraction materials before final quantification. This is very important because direct analysis of these metal ions from wastewaters is a huge challenge because of
iv
other interfering ions. Since the materials can be reused more than six times, this makes them cheap materials for sample extraction purposes. Besides, in sample extraction, only few mg of material is used ranging from 25-500 mg depending on the sample volume.
ACKNOWLEDGEMENTS
The following reference group members are acknowledged for their input throughout the project:
• Dr Jo Burgess, Water Research Commission (Chairperson)
• Prof Bobby Naidoo, Vaal University of Technology
• Prof Matthew Nindi, University of South Africa
• Dr Patricia Forbes, University of Pretoria
• Prof Nana Agyei, University of Limpopo, Medunsa Campus
• Prof James Darkwa, University of Johannesburg
• Prof Leslie Petrik, University of the Western Cape
• Ms Kerry Slatter, Anglo American
• Ms Ritva Muhlbauer, Anglo American
The following people from University of the Witwatersrand are also acknowledged for help in the characterisation of the prepared materials:
• Mr T. Makgata for Atomic force microscopy analysis
• Prof A. Ziegler for TEM and EDS analysis
• Prof N. Coville for BET and TGA analysis
• Prof D. Billing for PXRD
• Mr R. Erasmus for Raman spectroscopy and DRS analysis
• Ms J. Gama for FTIR
• Ms I. Khumalo for UV-Vis

v
TABLE OF CONTENTS
1 Background .............................................................................................................................. 1
1.1 Introduction ........................................................................................................................... 1
2 Literature Review.....................................................................................................................3
2.1 Background on uranium ........................................................................................................ 3
2.1.1 Uranium mining as a source of pollution ........................................................................... 4
2.1.2 Toxicity and fate of uranium .............................................................................................. 5
2.1.3 Uranium speciation ............................................................................................................ 6
2.2 Background of chromium ..................................................................................................... 7
2.2.1 Chromium mining as a source of pollution........................................................................ 8
2.2.2 Speciation and fate of chromium in the environment ........................................................ 8
2.2.3 Health and environmental concerns of chromium ........................................................... 11
2.3 South African regulation on waste and pollution ............................................................... 11
2.4 Water contamination and permissible limits of U(VI) and Cr(VI) ..................................... 12
2.5 Conventional methods of uranium and chromium removal ............................................... 13
2.5.1 Bioremediation ................................................................................................................. 14
2.5.2 Permeable reactive barriers (PRBs) ................................................................................. 15
2.5.3 Chemical precipitation ..................................................................................................... 15
2.5.4 Ion exchange .................................................................................................................... 16
2.5.5 Phytoextraction ................................................................................................................ 16
2.5.6 Electrodialysis .................................................................................................................. 17
2.6 Adsorption techniques ........................................................................................................ 17
2.7 Magnetic nanoparticles ....................................................................................................... 18
2.7.1 Superparamagnetism ........................................................................................................ 19
2.7.2 Magnetic properties of magnetic particles ....................................................................... 19
2.7.3 Magnetite and its magnetic properties ............................................................................. 20

vi
2.7.4 Synthesis of magnetic nanoparticles ................................................................................ 21
2.7.4.1 Co-Precipitation ............................................................................................................ 21
2.7.4.2 Thermal decomposition ................................................................................................ 22
2.7.4.3 Microemulsion .............................................................................................................. 22
2.7.4.4 Hydrothermal synthesis ................................................................................................ 23
2.7.5 Coating of magnetite ........................................................................................................ 23
2.8 Ion imprinted polymers ....................................................................................................... 24
2.8.1 Magnetic ion imprinted polymers .................................................................................... 25
2.8.2 Types of template/monomer interactions ......................................................................... 26
2.8.3 Polymerization reagents ................................................................................................... 26
2.8.3.1 Functional monomers.................................................................................................... 27
2.8.3.2 Cross-linkers ................................................................................................................. 27
2.8.3.3 Initiators ....................................................................................................................... .29
2.8.3.4 Porogen ........................................................................................................................ .29
2.8.4 Approaches in preparation of IIPs ................................................................................... 32
2.8.4.1 Cross-linking of bifunctional reagents with linear chain polymers .............................. 32
2.8.4.2 Chemical immobilization .............................................................................................. 32
2.8.4.3 Surface imprinting ........................................................................................................ 33
2.8.4.4 Trapping ........................................................................................................................ 34
2.8.4.5 Metal coordination ........................................................................................................ 35
2.8.5 Types of polymerizations ................................................................................................. 36
2.8.5.1 Bulk polymerization...................................................................................................... 37
2.8.5.2 Precipitation polymerization ......................................................................................... 38
2.8.5.3 Suspension polymerization ........................................................................................... 38
2.8.5.4 Emulsion polymerization .............................................................................................. 38
2.8.6 Application of imprinting technology .............................................................................. 38
2.8.7 Concluding remarks ......................................................................................................... 42

vii
3 Research Aims ....................................................................................................................... 43
3.1 Aims .................................................................................................................................... 43
3.2 Key questions ...................................................................................................................... 43
3.3 Significance of the research ................................................................................................ 43
3.4 Hypothesis........................................................................................................................... 43
3.5 Novelty ................................................................................................................................ 44
3.6 Scope and limitations .......................................................................................................... 44
4 Materials and Methods...........................................................................................................45
4.1 Chemicals, stock solutions and equipment ......................................................................... 45
4.1.1 Chemicals ......................................................................................................................... 45
4.1.2 Stock solutions ................................................................................................................. 45
4.1.3 Equipment ........................................................................................................................ 46
4.2 Analytical and characterization equipment ......................................................................... 46
4.2.1 Ultraviolet visible (UV-vis) spectroscopy) ...................................................................... 46
4.2.2 Raman spectroscopy ........................................................................................................ 46
4.2.3 Transmission electron microscopy (TEM) ...................................................................... 46
4.2.4 Size distribution ............................................................................................................... 46
4.2.5 Powder X-ray diffraction (PXRD) analysis ..................................................................... 47
4.2.6 Brunauer, Emmett and Teller (BET) analysis .................................................................. 47
4.2.7 Fourier-transformed infra red (FTIR) .............................................................................. 48
4.2.8 Thermo-gravimetric analysis (TGA) ............................................................................... 48
4.2.9 Carbon, hydrogen, nitrogen and sulphur (CHNS) analysis ............................................. 48
4.2.10 Diffuse reflectance spectroscopy (DRS) ........................................................................ 49
4.2.11 Atomic force microscopy (AFM) .................................................................................. 49
4.2.12 Ion chromatography (IC) analysis ................................................................................. 49
4.2.13 Inductively coupled plasma-optical emission spectrometer (ICP-OES) ....................... 49
4.2.14 Atomic absorption spectroscopy (AAS) ........................................................................ 50

viii
4.3 Synthesis of the magnetic IIPs and NIPs ............................................................................ 51
4.3.1 Synthesis of the magnetite ............................................................................................... 51
4.3.1.1 Coating of magnetite with γ-MPS ................................................................................. 51
4.3.1.2 Coating of magnetite with oleic acid ............................................................................ 52
4.3.1.3 Bulk polymerization...................................................................................................... 52
4.3.1.4 Precipitation polymerization ......................................................................................... 52
4.3.1.5 Leaching of γ-MPS and OA based polymers ................................................................ 52
4.3.2 Optimization of parameters for U(VI) uptake ................................................................. 53
4.3.2.1 Effect of sample pH ...................................................................................................... 53
4.3.2.2 Effect of the amount of magnetic polymer ................................................................... 54
4.3.2.3 Effect of contact time .................................................................................................... 54
4.3.2.4 Effect of initial uranium concentration ......................................................................... 54
4.3.2.5 Selectivity of the magnetic polymers ............................................................................ 54
4.3.2.6 Reusability of the magnetic uranyl IIPs ........................................................................ 55
4.3.3 Kinetic modelling............................................................................................................. 55
4.3.3.1 Pseudo-first-order kinetic model ................................................................................... 56
4.3.3.2 Pseudo-second-order kinetic model .............................................................................. 56
4.3.4 Adsorption isotherm models ............................................................................................ 57
4.3.4.1 Freundlich isotherm model ........................................................................................... 57
4.3.4.2 Langmuir isotherm mode ..............................................................................................57
4.3.5 Sampling sites .................................................................................................................. 58
4.3.6 Application of magnetic U(VI) IIPs to real water samples .............................................. 61
4.4 Synthesis of imprinted polymers for Cr(VI) recovery ........................................................ 61
4.4.1 Synthesis of magnetic poly (4-vinylpyridine) ................................................................. 61
4.4.2 Synthesis of poly (4-vinylpyridine) ................................................................................. 61
4.4.3 Preparation of magnetic and poly (n-propyl-4 vinylpyridinium) bromide ..................... 62
ix
4.4.4 Preparation of magnetic and non-magnetic poly (n-propyl-4-vinylpyridinium) dichromate................................................................................................................................. 62
4.4.5 Leaching of chromium ..................................................................................................... 62
4.5 Optimization of parameters for Cr(VI) uptake ................................................................... 62
4.5.1 Effect of initial pH of Cr(VI) solution ............................................................................. 62
4.5.2 Effect of the amount of the magnetic polymer ................................................................ 62
4.5.3 Effect of contact time on chromium(VI) adsorption ........................................................ 63
4.5.4 Effect of initial concentration of chromium(VI) on its uptake ........................................ 63
4.5.5 Selectivity studies on the adsorption of Cr(VI) by magnetic IIP ..................................... 63
4.5.6 Reusability of chromium(VI) IIP ..................................................................................... 63
5 Results and Discussions........................................................................................................ 64
5.1 Synthesis and characterization of magnetic uranyl-imprinted polymers ............................ 64
5.1.1 Synthesis of the magnetite ............................................................................................... 64
5.1.1.1 Powder X-ray diffraction (PXRD) analysis .................................................................. 65
5.1.2 γ-MPS and OA functionalization of magnetite ................................................................ 65
5.1.2.1 Functionalization of magnetite with γ-MPS ................................................................. 65
5.1.2.2 Functionalization of magnetite with oleic acid ............................................................. 68
5.1.2.3 Carbon, hydrogen, nitrogen and sulphur (CHNS) analysis .......................................... 69
5.1.2.4 Diffuse reflectance spectroscopy (DRS) ....................................................................... 70
5.1.2.5 Raman spectroscopy ..................................................................................................... 71
5.1.2.6 Transmission electron microscopy (TEM) analysis ..................................................... 74
5.1.2.7 Size distributions ........................................................................................................... 74
5.1.2.8 Fourier-transformed infra red (FTIR) analysis ............................................................. 76
5.1.3 Magnetic polymer synthesis ............................................................................................ 78
5.1.4 Leaching analysis ............................................................................................................. 80
5.1.4.1 Atomic force microscopy (AFM) ................................................................................. 83
5.1.4.2 Brunauer, Emmett and Teller (BET) surface area analysis .......................................... 86

x
5.1.4.3 Fourier-transformed infra red (FTIR) analysis ............................................................. 88
5.1.4.4 Thermo-gravimetric analysis (TGA) ............................................................................ 89
5.1.5 Magnetic response ........................................................................................................... 91
5.1.6 Optimization of parameters for U(VI) uptake ................................................................. 91
5.1.6.1 Effect of sample pH ...................................................................................................... 92
5.1.6.2 Effect of the amount of magnetic polymer ................................................................... 95
5.1.6.3 Effect of contact time .................................................................................................... 98
5.1.6.4 Effect of initial uranium concentration ....................................................................... 101
5.1.6.5 Selectivity studies ....................................................................................................... 104
5.1.6.6 Reusability of the magnetic uranyl imprinted polymers ............................................. 109
5.1.7 Kinetic modelling........................................................................................................... 112
5.1.8 Adsorption isotherm modelling ..................................................................................... 113
5.1.8.1 Langmuir model ......................................................................................................... .113
5.1.8.2 Freundlich model ....................................................................................................... .114
5.1.9 Application of magnetic U(VI) IIPs to real water samples ............................................ 114
5.2 Synthesis and characterization of magnetic Cr(VI) polymers .......................................... 118
5.2.1 Synthesis of magnetic poly (4-vinylpyridine) ............................................................... 118
5.2.2 Quaternization of magnetic poly (4-vinylpyridine) ....................................................... 119
5.2.2.1 Quaternization study using Fourier-transformed infra red ........................................ .121
5.2.3 Addition of the dichromate imprint to the magnetic poly (4 vinylpyridine) ................. 121
5.2.3.1 Fourier-transformed infra red (FTIR) analysis ........................................................... 122
5.2.4 Cross-linking and leaching of dichromate from the magnetic polymers ....................... 123
5.2.4.1 Brunauer, Emmett and Teller surface analysis ........................................................... 125
5.2.4.2 Thermo-gravimetric analysis (TGA) analysis ............................................................ 127
5.2.5 Optimization of parameters for Cr(VI) uptake .............................................................. 128
5.2.5.1 Effect of sample pH .................................................................................................... 128
5.2.5.2 Effect of the amount of the adsorbent ......................................................................... 130

xi
5.2.5.3 Effect of contact time .................................................................................................. 131
5.2.5.4 Effect of initial Cr(VI) concentration ......................................................................... 132
5.2.5.5 Selectivity of Cr(VI) ................................................................................................... 133
5.2.5.6 Reusability of Cr-magnetic polymers ......................................................................... 136
5.2.6 Kinetic modelling........................................................................................................... 137
5.2.6.1 Pseudo-first order kinetics .......................................................................................... 137
5.2.6.2 Pseudo-second order kinetics ...................................................................................... 138
5.2.7 Freundlich and Langmuir isotherm modelling .............................................................. 138
6 Conclusions and Recommendations for Future Work ......................................................... 143
6.1 Conclusions ....................................................................................................................... 141
6.2 Recommendations for future work ................................................................................... 141
References ............................................................................................................................... 143
Appendix ................................................................................................................................. 171

xii
LIST OF FIGURES Figure 2.1: Supply and demand of uranium................................................................................ 3
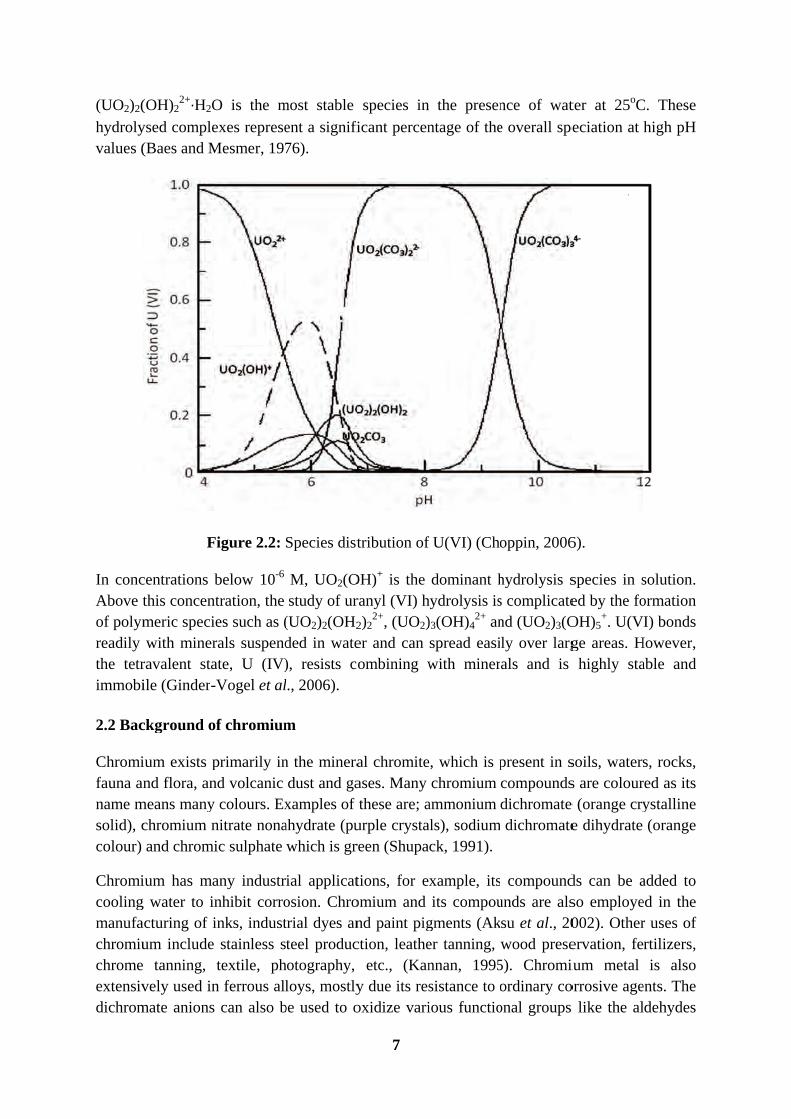
Figure 2.2: Species distribution of U(VI) ................................................................................... 7
Figure 2.3: The pH-Eh diagram of stability of different chromium species ............................... 9
Figure 2.4: Species distribution diagram of Cr(III) and Cr(VI) in an aqueous system ............ 10
Figure 2.5: Structures of the (a) chromate and (b) dichromate anions. .................................... 11
Figure 2.6: Uranium(VI) reduction driven by microbial respiration ........................................ 14
Figure 2.7: Orientation of domains in (a) ferromagnetism (b) aniferrimagnetism and (c) ferrimagnetism. ......................................................................................................................... 19
Figure 2.8: The Hysteresis loop of a superparamagnetic material. ........................................... 20
Figure 2.9: Electronic configuration in magnetite .................................................................... 21
Figure 2.10: Schematic diagram depicting imprinting polymerization .................................... 24
Figure 2.11: Common functional monomers used in imprinted polymerizations. ................... 27
Figure 2.12: Common cross-linkers used in imprinted polymerization. .................................. 29
Figure 2.13: An example of a linear polymer with 4-VP anchored in the polymer matrix. ..... 32
Figure 2.14: An example of the chemical immobilization approach in IIP preparation ........... 33
Figure 2.15: An example of surface imprinting approach in IIP preparation ........................... 34
Figure 2.16: An example of trapping approach in IIP preparation ........................................... 35
Figure 2.17: A scheme showing the metal coordination approach for zinc ion imprinted polymers .................................................................................................................................... 36
Figure 2.18: Scheme outlining the main applications envisaged for MIPs and IIPs ................ 39
Figure 4.1: Schematic diagram of grahite furnace atomic absorption spectrophotometer. ...... 50
Figure 4.2: The heating programme for uranium in the graphite furnace. ............................... 51
Figure 4.3: (a) Germiston site (b) Google map of the Germiston area with pointers 26o13`07.10 ``S and 28o08`03.79``E and an elevation height of 1652 m. ................................ 59
Figure 4.4: (a) Goudkoppies Wastewater Treatment Plant site (b) its google map with pointers 25o66`42.12``S and 27o69`17.07``E and an elevation height of 1378 m. ................................. 60
Figure 5.1: Magnetic response of magnetite. ............................................................................ 64
xiii
Figure 5.2: Magnetite showing the adsorbed hydroxyl ions. .................................................... 64
Figure 5.3: PXRD pattern for the synthesized magnetite. ........................................................ 65
Figure 5.4: The hydrolysis of γ-MPS. ....................................................................................... 66
Figure 5.5: Coating of the magnetite with the hydrolysed γ-MPS. .......................................... 67
Figure 5.6: An illustration of the arrangement of γ-MPS around the magnetic core. ............... 67
Figure 5.7: The structure of oleic acid. ..................................................................................... 68
Figure 5.8: Charge delocalization on the carboxylate of the oleic acid. ................................... 68
Figure 5.9: Scheme for the functionalization of magnetite with OA. ....................................... 69
Figure 5.10: DR spectra of magnetite as well as γ-MPS and OA coated magnetite. ................ 70
Figure 5.11: Oxidation of magnetite through two different routes. .......................................... 71
Figure 5.12: Raman spectrum of pure magnetite. ..................................................................... 73
Figure 5.13: Raman spectrum of the unmodified magnetite..................................................... 73
Figure 5.14: Raman spectrum of the γ-MPS modified magnetite. ........................................... 73
Figure 5.15: Transmisssion Electron Micrographs of (a) uncoated and (b) γ-MPS coated magnetite. .................................................................................................................................. 74
Figure 5.16: Particle size distribution of the uncoated magnetite. ............................................ 75
Figure 5.17: Particle size distribution of the coated magnetite. ................................................ 76
Figure 5.18: FTIR spectra of (a) uncoated magnetite and (b) γ-MPS coated magnetite. ......... 77
Figure 5.19: FTIR spectrum of OA-Fe3O4. ............................................................................... 78
Figure 5.20: Polymerization on the γ-functionalized Fe3O4 particles. ...................................... 79
Figure 5.21: Volumes of the porogenic solvent used to effect bulk and precipitation polymerization. ......................................................................................................................... 79
Figure 5.22: The leaching of the uranyl ion from the magmetic polymeric matrix. ................. 80
Figure 5.23: Polymers leached with 1 mol dm-1 NaHCO3: (a) bulk magnetic IIP (b) precipitate magnetic IIP. ............................................................................................................................. 81
Figure 5.24: Polymers leached with 1 mol dm-1 HCl: (a) bulk magnetic IIP (b) precipitate magnetic IIP. ............................................................................................................................. 82
Figure 5.25: Optical view of magnetic IIP with an AFM tip of width ~25 micro metres. ....... 84

xiv
Figure 5.26: AFM image of NaHCO3 leached magnetic IIP. ................................................... 84
Figure 5.27: AFM image of HCl leached magnetic IIP. ........................................................... 85
Figure 5.28: Image Roughness of the NaHCO3 and HCl leached magnetic IIPs. .................... 85
Figure 5.29: A three dimensional AFM image of NaHCO3 leached polymer. ......................... 86
Figure 5.30: (a) The nitrogen adsorption-desorption isotherms for the unleached bulk magnetic IIP and (b) its corresponding BET plot. .................................................................... 87
Figure 5.31: Fourier-transformed infra red spectra for γ-MPS based polymers. ...................... 89
Figure 5.32: Thermo-gravimetric analysis results for γ-MPS-Fe3O4. ....................................... 90
Figure 5.33: Thermo-gravimetric analysis of precipitation magnetic polymers. ...................... 90
Figure 5.34: Thermo-gravimetric analysis of bulk magnetic polymers. ................................... 91
Figure 5.35: Uranium imprinted polymer showing heteroatoms responsible for the uptake of uranyl ions. ................................................................................................................................ 93
Figure 5.36: Effect of sample pH for OA IIP bulk NaHCO3 leached. Experimental conditions: Amount of magnetic polymer, 20 mg; sample volume, 25 mL; uranium concentration, 2 mg L-1; contact time, 45 minutes; stirring speed, 1500 rpm; temperature, room temperature. ...... 93
Figure 5.37: Effect of sample pH for OA NIP bulk NaHCO3 leached (Experimental conditions: Same as those in Figure 5.39). ............................................................................... 94
Figure 5.38: Effect of sample pH for γ-MPS IIP precipitate NaHCO3 leached (Experimental conditions: Same as those in Figure 5.39). ............................................................................... 94
Figure 5.39: Effect of sample pH for γ-MPS IIP precipitate HCl leached (Experimental conditions: Same as those in Figure 5.39). ............................................................................... 95
Figure 5.40: Adsorption efficiency obtained by varying the mass of (a) γ-MPS IIP ppt-HCl leached and (b) γ-MPS NIP ppt-HCl leached. Experimental conditions: Sample pH, 4; sample volume, 25 mL; uranium concentration, 2 mg L-1; Contact time, 45 minutes; stirring speed, 1500 rpm; temperature, room temperature. .............................................................................. 96
Figure 5.41: Adsorption efficiency obtained by varying the mass of (a) γ-MPS IIP bulk-NaHCO3 leached and (b) γ-MPS NIP bulk-NaHCO3 leached (Experimental conditions: Same as those in Figure 5.43). ............................................................................................................ 96
Figure 5.42: Adsorption efficiency obtained by varying the mass of (a) OA IIP bulk-NaHCO3 leached and (b) OA NIP bulk-NaHCO3 leached (Experimental conditions: Same as those in Figure 5.43). .............................................................................................................................. 97

xv
Figure 5.43: Adsorption efficiency obtained by varying the mass of (a) γ-MPS IIP ppt-NaHCO3 leached and (b) γ-MPS NIP ppt-NaHCO3 leached (Experimental conditions: Same as those in Figure 5.43). ................................................................................................................ 97
Figure 5.44: Adsorption efficiency obtained by varying the mass of (a) OA IIP ppt-NaHCO3
leached and (b) OA NIP ppt-NaHCO3 leached (Experimental conditions: Same as those in Figure 5.43). .............................................................................................................................. 98
Figure 5.45: Effect of contact time on the uptake of uranium by (a) γ-MPS IIP ppt-HCl leached and (b) γ-MPS NIP ppt-HCl leached. Experimental conditions: Sample pH, 4; sample volume, 25 mL; uranium concentration, 2 mg L-1; polymer weight, 50 mg; stirring speed, 1500 rpm; temperature, room temperature. .............................................................................. 99
Figure 5.46: Effect of contact time on the uptake of uranium by (a) γ-MPS IIP bulk-NaHCO3 leached and (b) γ-MPS NIP bulk-NaHCO3 leached (Experimental conditions: Same as those in Figure 5.48). .......................................................................................................................... 99
Figure 5.47: Effect of contact time on the uptake of uranium by (a) OA IIP bulk-NaHCO3 leached and (b) OA NIP bulk-NaHCO3 leached (Experimental conditions: Same as those in Figure 5.48). ............................................................................................................................ 100
Figure 5.48: Effect of contact time on the uptake of uranium by (a) γ-MPS IIP ppt-NaHCO3
leached and (b) γ-MPS NIP ppt-NaHCO3 leached (Experimental conditions: Same as those in Figure 5.48). ............................................................................................................................ 100
Figure 5.49: Effect of contact time on the uptake of uranium by (a) OA IIP ppt-NaHCO3
leached and (b) OA NIP ppt-NaHCO3 leached (Experimental conditions: Same as those in Figure 5.48). ............................................................................................................................ 101
Figure 5.50: Effect of initial concentration on the uptake of uranium by (a) γ-MPS IIP bulk-NaHCO3 leached and (b) γ-MPS NIP bulk-NaHCO3 leached. Experimental conditions: Sample pH, 4; sample volume, 25 mL; polymer weight, 50 mg; stirring speed, 1500 rpm; temperature, room temperature. .............................................................................................. 102
Figure 5.51: Effect of initial concentration on the uptake of uranium by (a) OA IIP bulk-NaHCO3 leached and (b) OA NIP bulk-NaHCO3 leached (Experimental conditions: Same as those in Figure 5.53). .............................................................................................................. 102
Figure 5.52: Effect of initial concentration on the uptake of uranium by (a) γ-MPS IIP ppt-NaHCO3 leached and (b) γ-MPS NIP ppt-NaHCO3 leached (Experimental conditions: Same as those in Figure 5.53). .............................................................................................................. 103
Figure 5.53: Effect of initial concentration on the uptake of uranium by (a) OA IIP ppt-NaHCO3 leached and (b) OA NIP ppt-NaHCO3 leached (Experimental conditions: Same as those in Figure 5.53). .............................................................................................................. 103
Figure 5.54: Extraction efficiencies of ions extracted by the magnetic IIP and NIP of γ-MPS bulk-NaHCO3 leached from the spiked 2 mg L-1 binary mixtures of solutions. ..................... 104

xvi
Figure 5.55: Extraction efficiencies of the ions extracted by the magnetic IIP and NIP of γ-MPS ppt-NaHCO3 leached from the spiked 2 mg L-1 binary mixtures of solutions. .............. 105
Figure 5.56: Extraction efficiencies of the ions extracted by the magnetic IIP and NIP of γ-MPS ppt-HCl leached from the spiked 2 mg L-1 binary mixtures of solutions. ..................... 106
Figure 5.57: Extraction efficiencies of the ions extracted by the magnetic IIP and NIP of OA ppt-NaHCO3 leached from the spiked 2 mg L-1 binary mixtures of solutions. ....................... 107
Figure 5.58: Extraction efficiencies of ions extracted by the magnetic IIP and NIP of OA bulk-NaHCO3 leached from the spiked 2 mg L-1 binary mixtures of solutions. ..................... 108
Figure 5.59: Reusability and stability of magnetic IIP and NIP of γ-MPS ppt-HCl leached. Adsorption conditions: Amount of materials, 50 mg; solution pH 4; solution volume, 25 mL; contact time, 45 min, U(VI) concentration, 2 mg L-1, Desorption conditions: Solution volume, 25 mL; contact time, 45 min, [HCl] leachant, 1 M. ................................................................ 110
Figure 5.60: Reusability and stability of magnetic IIP and NIP of γ-MPS bulk-NaHCO3 leached. Adsorption conditions: Amount of materials, 50 mg; solution pH 4; solution volume, 25 mL; contact time, 45 min, U(VI) concentration, 2 mg L-1, Desorption conditions: Solution volume, 25 mL; contact time, 45 min, [HCl] leachant, 1 M. .................................................. 110
Figure 5.61: Reusability and stability magnetic IIP and NIP of OA bulk-NaHCO3 leached. Adsorption conditions: Amount of materials, 50 mg; solution pH 4; solution volume, 25 mL; contact time, 45 min, U(VI) concentration, 2 mg L-1, Desorption conditions: Solution volume, 25 mL; contact time, 45 min, [HCl] leachant, 1 M. ................................................................ 111
Figure 5.62: Reusability and stability magnetic IIP and NIP of γ-MPS ppt-NaHCO3 leached. Adsorption conditions: Amount of materials, 50 mg; solution pH 4; solution volume, 25 mL; contact time, 45 min, U(VI) concentration, 2 mg L-1, Desorption conditions: Solution volume, 25 mL; contact time, 45 min, [HCl] leachant, 1 M. ................................................................ 111
Figure 5.63: Reusability and stability magnetic IIP and NIP of OA ppt-NaHCO3 leached. Adsorption conditions: Amount of materials, 50 mg; solution pH 4; solution volume, 25 mL; contact time, 45 min, U(VI) concentration, 2 mg L-1, Desorption conditions: Solution volume, 25 mL; contact time, 45 min, [HCl] leachant, 1 M. ................................................................ 112
Figure 5.64: Synthetic routes of (a) homopolymer and (b) magnetic polymer of poly (4-vinylpyridine) where the blach dot indicates γ-MPS coated magnetite. ................................. 119
Figure 5.65: Structure of magnetic poly (4-vinylpyridine). .................................................... 119
Figure 5.66: Reaction for the quaternization of magnetic poly (4-vinylpyridinium) bromide.120
Figure 5.67: FTIR spectra of quaternized poly (4-vinylpyridine) after (a) 0 hrs, (b) 14 hrs and (c) 42 hrs. ................................................................................................................................ 121

xvii
Figure 5.68: Substitution reaction of the bromide ions from magnetic poly (4-vinylpyridinium) bromide by dichromate ions. ...................................................................... 122
Figure 5.69: FTIR spectra of quaternized poly (4-vinylpyridine) after addition of Na2Cr2O7. ................................................................................................................................ 123
Figure 5.70: Cross-linking of the magnetic polymer. ............................................................. 123
Figure 5.71: Leaching of the dichromate with 1 M HCl. ........................................................ 124
Figure 5.72: Aliquots collected after different leaching times. .............................................. 124
Figure 5.73: Leaching of chromium and iron from the magnetic IIP. .................................... 125
Figure 5.74: Washing of magnetite from magnetic NIP. ........................................................ 125
Figure 5.75: (a) The nitrogen adsorption-desorption isotherms for the unleached non- magnetic poly (n-propyl-4-vinylpyridinium) dichromate polymer and (b) its corresponding BET plot. ................................................................................................................................. 126
Figure 5.76: Thermogravimetric analysis of chromium magnetic polymer. .......................... 128
Figure 5.77: The effect of pH and also the demonstration of the chromate/ hydroxyl competition. ............................................................................................................................ 129
Figure 5.78: Effect of sample pH. Experimental conditions: Polymer amount, 20 mg; sample volume, 25 mL; chromium concentration, 5 mg L-1; contact time, 45 minutes; stirring speed, 600 rpm; temperature, room temperature. .............................................................................. 130
Figure 5.79: Adsorption percentages obtained by varying the mass of magnetic polymers for chromium adsorption. Experimental conditions: Sample pH, 4; sample volume, 25 mL; chromium concentration, 5 mg L-1; contact time, 45 minutes; stirring speed, 600 rpm; temperature, room temperature. .............................................................................................. 131
Figure 5.80: Effect of contact time on the uptake of chromium by magnetic polymers. Experimental conditions: Sample pH, 4; sample volume, 25 mL; shromium concentration, 5 mg L-1; polymer weight (20 mg for magnetic IIP and 65 mg for magnetic NIP); stirring speed, 600 rpm; temperature, room temperature. .............................................................................. 132
Figure 5.81: Effect of initial concentration on the uptake of chromium by magnetic IIP and NIP. Experimental conditions: Sample pH, 4; sample volume, 25 mL; polymer weight, (20 mg for magnetic IIP and 65 mg for magnetic NIP); contact time 35 min; stirring speed, 600 rpm; temperature, room temperature. ..................................................................................... 133
Figure 5.82: A 5 mg L-1 anionic mixture standard. ................................................................. 134
Figure 5.83: Calibration curve for four dichromate anionic competitors. .............................. 134
Figure 5.84: An example of a fluoride ion dichromate competitor. ....................................... 135
xviii
Figure 5.85: Calibration curve for the dichromate anionic standards. .................................... 135
Figure 5.86: Extraction efficiencies of anions extracted by the magnetic Cr(VI) IIP and NIP from 2 mg L-1 spiked binary mixtures of solutions. ................................................................ 136
Figure 5.87: Reusability and stability magnetic IIP and NIP selective to chromium. Adsorption conditions: Sample pH, 4; sample volume, 25 mL; polymer weight, (20 mg for magnetic IIP and 65 mg for magnetic NIP); contact time 35 min; initial dichromate concentration, 5 mg L-1; stirring speed, 600 rpm; temperature, room temperature, Desorption conditions: Solution volume, 20 mL; contact time, 20 min, [NaOH] leachant, 1 M. ............. 137
Figure 5.88: Pseudo first-order plots for the adsorption of chromium onto magnetic polymers. ................................................................................................................................. 137
Figure 5.89: Pseudo second-order plots for the adsorption of chromium onto magnetic polymers. ................................................................................................................................. 138
Figure 5.90: (a) Freundlich and (b) Langmuir isotherm model for magnetic IIP. .................. 139
Figure 5.91: (a) Freundlich and (b) Langmuir isotherm model for magnetic NIP. ................ 140
Figure A1: TEM micrograms of the uncoated magnetite. ...................................................... 173
Figure A2: TEM micrograms of the coated γ-MPS-magnetite. .............................................. 174
xix
LIST OF TABLES
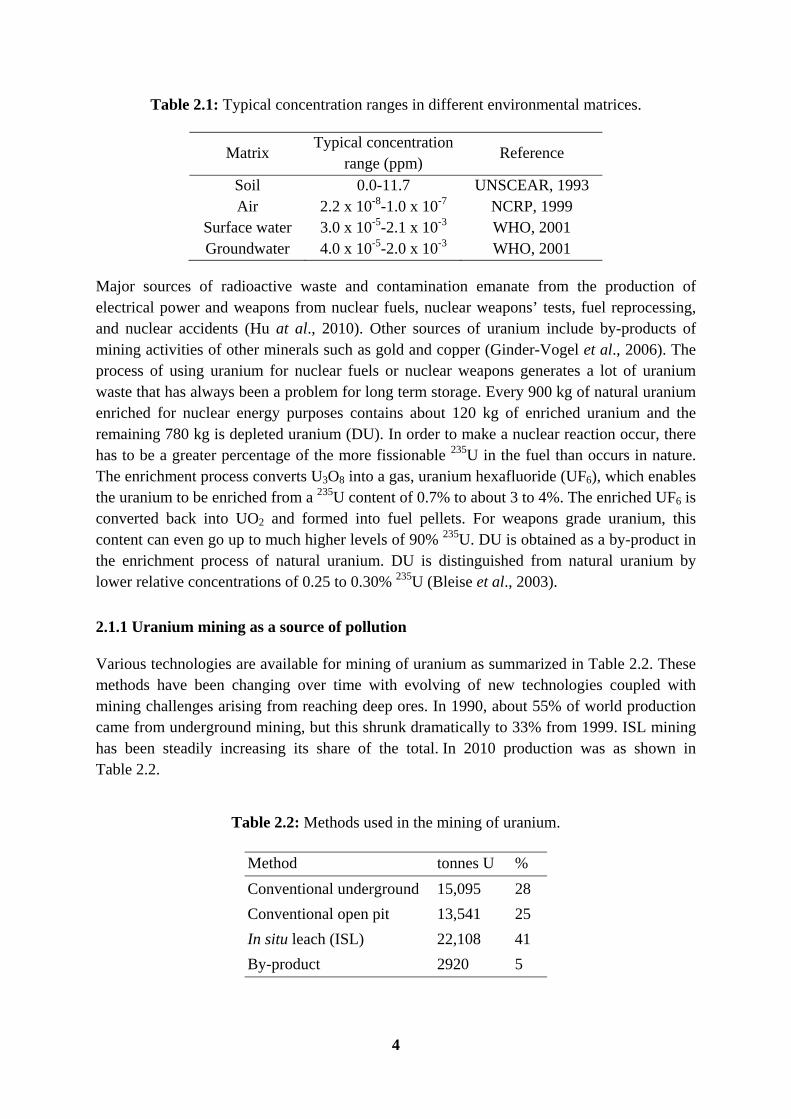
Table 2.1: Typical concentration ranges in different environmental matrices. .......................... 4
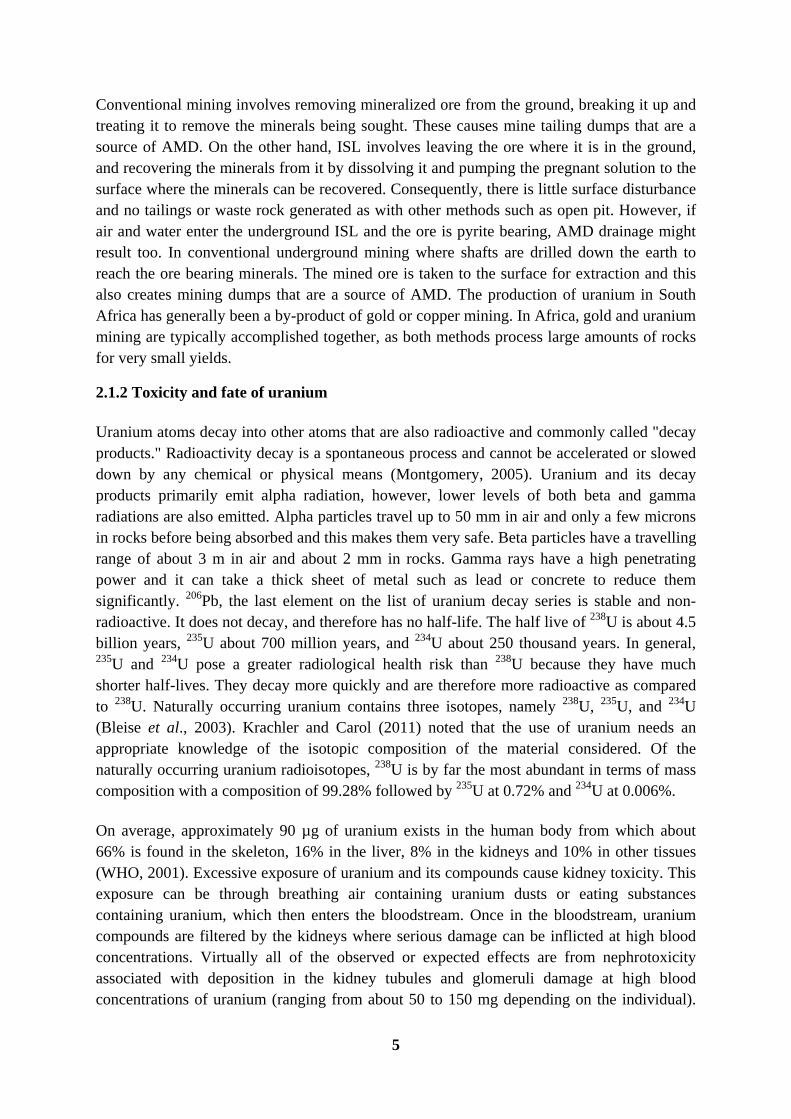
Table 2.2: Methods used in the mining of uranium. ................................................................... 4
Table 2.3: Maximum allowable limits of uranium and chromium(VI) in water by different bodies. ....................................................................................................................................... 12
Table 2.4: Advantages and disadvantages of some convectional removal techniques. ............ 13
Table 2.5: Examples of porogens used in molecular imprinting preparation and their physical properties................................................................................................................................... 31
Table 2.6: Summary of some reported IIPs and polymerization techniques used. ................... 37
Table 2.7: Polymeric sorbents for the removal of U(VI) and Cr(VI) from environmental samples. ..................................................................................................................................... 41
Table 4.1: Operating conditions of the ICP-OES. .................................................................... 50
Table 4.2: Volume composition of the polymer washing solution. .......................................... 52
Table 5.1: CHNS elemental analysis of coated magnetite. ....................................................... 70
Table 5.2: Colours of different iron oxides. .............................................................................. 71
Table 5.3: Raman bands for magnetite, maghemite and hematite. ........................................... 72
Table 5.4: BET suface areas and constants for the bulk magnetic IIPs. ................................... 88
Table 5.5: Summary of the prepared types of magnetic ion imprinted polymers for U(VI)..92
Table 5.6: Physical properties of the uranyl ion together with those of its competitors. ........ 104
Table 5.7: Kd, K and K` values for the magnetic IIP and NIP of γ-MPS bulk-NaHCO3 in binary mixtures. ...................................................................................................................... 105
Table 5.8: Kd, K and K` values for the magnetic IIP and NIP of γ-MPS ppt- NaHCO3 leached in binary mixtures. .................................................................................................................. 105
Table 5.9: Kd, K and K` values for the magnetic IIP and NIP of γ-MPS ppt-HCl leached in binary mixtures. ...................................................................................................................... 106
Table 5.10: Kd, K and K` values for the magnetic IIP and NIP of OA ppt-NaHCO3 leached in binary mixtures. ...................................................................................................................... 107
Table 5.11: Kd, K and K` values for the magnetic IIP and NIP of OA bulk-NaHCO3 leached in binary mixtures. ...................................................................................................................... 108

xx
Table 5.12: Summary of results of calculated kinetic parameters of pseudo-first order and pseudo-second order for U(VI) adsorption with an initial concentration of 5 mg L-1. ........... 112
Table 5.13: Types of adsorption with respect to Langmuir isotherms. .................................. 113
Table 5.14: The Langmuir constants and the RL values for adsorption of U(VI) on magnetic polymers. ................................................................................................................................. 114
Table 5.15: Freundlich constants of different uranium magnetic polymers. .......................... 114
Table 5.16: Metal composition in real water samples. ........................................................... 115
Table 5.17: Application of magnetic γ-MPS IIP bulk-NaHCO3 leached and the corresponding NIP on unspiked and spiked real water samples. Sample pH = 4; solution volume = 25 mL; sorbent mass = 20 and 65 mg for the magnetic IIP and NIP respectively. ............................. 116
Table 5.18: Application of magnetic OA IIP bulk-NaHCO3 leached and the corresponding NIP on unspiked and spiked real water samples. Sample pH = 4; solution volume = 25 mL; sorbent mass = 20 and 65 mg for the magnetic IIP and NIP respectively. ............................. 116
Table 5.19: Application of magnetic γ-MPS IIP ppt-NaHCO3 leached and the corresponding NIP on unspiked and spiked real water samples. Sample pH = 4; solution volume = 25 mL; sorbent mass = 20 and 65 mg for the magnetic IIP and NIP respectively. ............................. 117
Table 5.20: Application of magnetic OA IIP bulk-NaHCO3 leached and the corresponding NIP on unspiked and spiked real water samples. Sample pH = 4; solution volume = 25 mL; sorbent mass = 20 and 65 mg for the magnetic IIP and NIP respectively. ............................. 117
Table 5.21: Application of magnetic γ-MPS IIP ppt-NaHCO3 leached and the corresponding NIP on unspiked and spiked real water samples. Sample pH = 4; solution volume = 25 mL; sorbent mass = 20 and 65 mg for the magnetic IIP and NIP respectively. ............................. 118
Table 5.22: BET suface areas and constants for the magnetic polymers. ............................... 127
Table 5.23: Kd, K and K` values for the magnetic Cr(VI) IIP and NIP in binary mixtures. .. 136
Table 5.24: Calculated kinetic parameters of pseudo-first and pseudo-second orders for initial Cr(VI) concentration of 5 mg L-1. ........................................................................................... 138
Table 5.25: The Langmuir constants and the RL values for adsorption of Cr(VI) on magnetic polymers. ................................................................................................................................. 140

xxi
LIST OF ABBREVIATIONS AND ACRONYMS
AAS Atomic absorption spectroscopy Acac Acetylacetone AFM Atomic force spectroscopy AMD Acid mine drainage BET Brunauer, Emmett and Teller CDs Cyclodextrins CHNS Carbon, hydrogen, nitrogen and sulphur CNTs Carbon nanotubes DL Detection limit DMRB Dissimilatory metal reducing bacteria DRS Diffuse reflective spectroscopy DU Depleted uranium DVB Divinylbenzene EDS Energy dispersive spectrometry EGDMA Ethylene glycol dimethacrylate F Force FTIR Fourier-transformed infra-red FWHM Full width at half maximum GFAAS Graphite furnace atomic absorption spectroscopy GTF Glucose-tolerance factor ICP-OES Inductively coupled plasma optical emission spectroscopy IIP Ion imprinted polymer ISL In-situ leaching MAA Methacrylic acid MCL Maximum contaminant level MIP Molecularly imprinted polymer NECSA Nuclear Energy Corporation of South Africa NEMA National Environmental Management Act NIP Non imprinted polymer Nufcor Nuclear Fuels Corporation of South Africa OA Oleic acid ORNL Oak Ridge National Laboratory PRBs Permeable Reactive Barriers PXRD Powdered X-ray diffraction r.f Radio frequency rpm Rotations per minute SA South Africa SABS South African Bureau of Standards SALO Salicylaldoxime SD Standard deviation SEM Scanning electron microscopy SRB Sulphate reducing bacteria

xxii
t yr-1 Tonnes per year TEM Transmission electron microscopy TEOS Tetraethyl orthosilicate TGA Thermo-gravimetric analysis TRIM Trimethylolpropane trimethacrylate UNSCEAR United Nations Scientific Committee on the Effects of Atomic
Radiation WHO World Health Organization 4-VP 4-Vinyl pyridine γ-MPS γ-Methacryloxypropyltrimethoxysilane

1
Chapter One: Background
1.1 Introduction
One of the most critical global issues is water pollution (Brown, 1996; Ramakrishna et al., 2006) and it has led to alteration of the physiochemical properties of water (Richardson, 1988). Pollution of water bodies due to the indiscriminate disposal of heavy metals has been a concern for a long time. The rapid increase in the levels of environmental pollution over recent decades has resulted in increasing concern for people's well-being and for global ecosystems (Kot and Namiesnèik, 2000). Inorganic pollutants of great physiological significance are heavy metals (Ramakrishna et al., 2006), because of their toxicity towards aquatic-life, human beings and the environment (Qdaisa and Moussab, 2004, Luo et al., 2011). Pollution due to heavy metals is now seen as a priority (Fu and Wang, 2011). There is a lot of evidence in literature that trace back pollution generation to anthropogenic sources in the quest for exploiting nature as a source of means of livelihood by man (Agbontalor, 2007). Industrialization and urbanization have caused excessive discharge of heavy metals into the environment (Khan et al., 2004).
Mining industry accounts for major environmental threats in countries like South Africa because it has large reserves for several minerals (Ochieng et al., 2010). As an example, South Africa is the world's largest producer of ferrochrome which holds about 70% of the world’s total chrome reserves, mostly located in the Bushveld Igneous Complex (BIC) ores and produces 75% of the world’s ferrochrome. In some cases, platinum group’s metals (PGMs) contain chromium as well. The so called Witwatersrand Basin has a lot of gold tailing dumps that are source of pollution either from dust particles or from acid mine drainage. The issue of AMD is a hot subject in South Africa and is always in the media. This is because of the catastrophic effects of AMD on animals, plants and the environment. In order to assist the mining industry with the mitigation of AMD, the Department of Minerals and Energy (DMR) in South Africa had subsidies for the months of January, February and March 2010 worthy R7.5 million. However due to the extent of the problem, this amount fell dangerously short of the funds that are necessary to treat AMD.
Acid mine drainage (AMD) is highly acidic water, usually containing high concentrations of metals, sulphides and salts. AMD have been identified to be the single most significant threat to South Africa’s environment. In South Africa, this is being driven home by the AMD problems being experienced at the East Rand operations of Pamodzi Gold. Pyrite (FeS2) is responsible for starting acid generation. When pyrite is exposed to oxygen and water, it will be oxidized, resulting in protons release. Mining increases the exposed surface area of sulphur bearing rocks. The oxidation process occurs in undisturbed rocks as well but at a slower rate. These wastewaters containing heavy metals such as uranium and chromium are directly or indirectly discharged into the environment killing aquatic life

2
(Fu and Wang, 2011). Both uranium and chromium in their hexavalent states are very toxicity because they are very mobile and can easily cross the biological membranes. Direct water contamination also arises from many other industries such as metal cleaning; metal finishing (Luo et al., 2011), textile industry (Halimoon and Yin, 2010) and wastewater treatment plant influents.
The most common remediation techniques in the removal of heavy metals from water include chemical precipitation (Pavlović et al., 2007), ion exchange (Mier et al., 2001; Wojtówicz and Stokłosa, 2002; Bai and Bartkiewicz, 2009), electrodeposition (Meunier et al., 2006; Lewinsky, 2007), membrane technology (Sanga et al., 2008; Ahmad et al., 2011), lime neutralization and phytoremediation (Lone et al., 2008; Liao and Chang, 2004; Raskin et al., 1997). Most of these remediation techniques have got disadvantages such as creating by products that are toxic, expensive in terms capital and operational costs and requires specialised personnel (Nameni et al., 2008; Luo et al., 2011; Zhan et al., 2011).
This has led to the search of new techniques and/or materials that can be used for remediation of such polluted wastewaters. Most of the research now is focused on new materials that are selective and cheap that can be used for removal of metal ions from wastewater streams. These materials are usually contained in a large column and wastewater is pumped through trapping the target compounds. The trapped metals ions are eluted and the column is regenerated for further use. Magnetic synthetic polymeric sorbents are such new materials that are currently studied for use in remediation of wastewaters (Zhao et al., 2010; Wang et al., 2011; Fan et al., 2012). However, many of the studied magnetic polymers are not selective because they are synthesized without a template molecule (Zhao et al., 2010; Wang et al., 2011; Fan et al., 2012). The incorporation of a template during polymerisation allows to prepare polymers that are highly selective towards the target chemical during use (Oliveira et al., 2004). This is because after polymerisation; the template is removed leaving a magnetic polymer that has cavities complimentary to the template in size, shape and functionality.
3
Chapter Two: Literature Review 2.1 Background on uranium
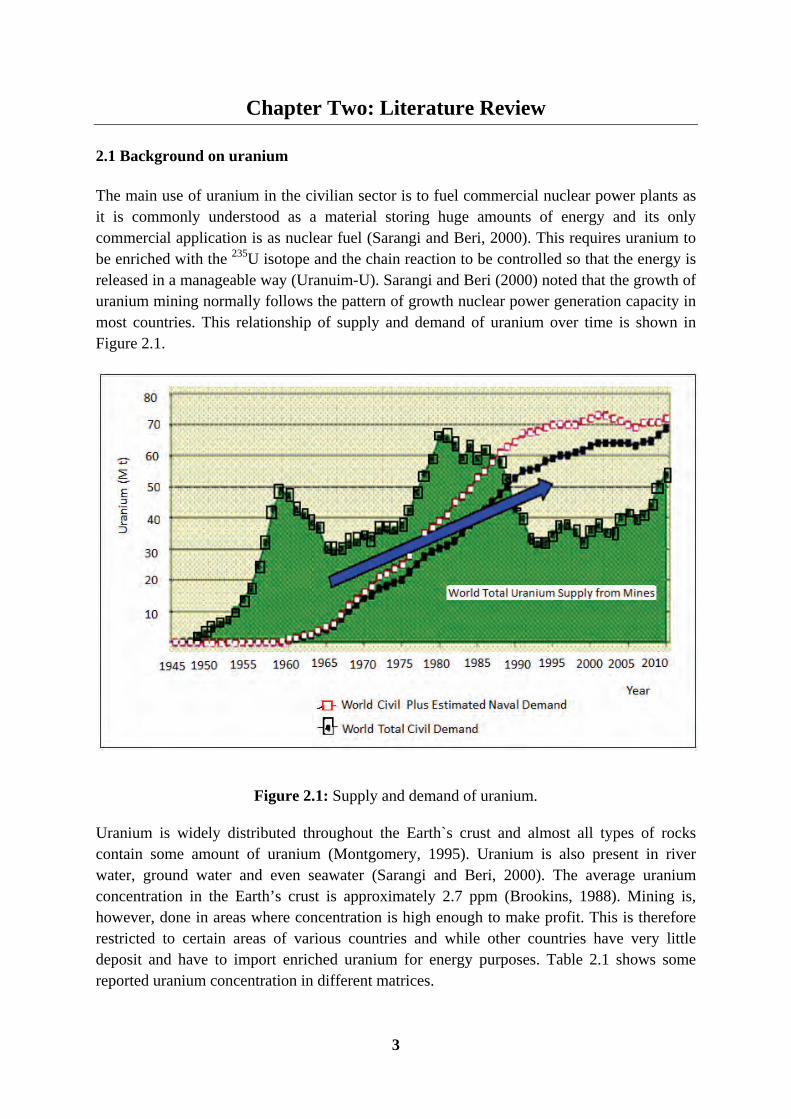
The main use of uranium in the civilian sector is to fuel commercial nuclear power plants as it is commonly understood as a material storing huge amounts of energy and its only commercial application is as nuclear fuel (Sarangi and Beri, 2000). This requires uranium to be enriched with the 235U isotope and the chain reaction to be controlled so that the energy is released in a manageable way (Uranuim-U). Sarangi and Beri (2000) noted that the growth of uranium mining normally follows the pattern of growth nuclear power generation capacity in most countries. This relationship of supply and demand of uranium over time is shown in Figure 2.1.
Figure 2.1: Supply and demand of uranium.
Uranium is widely distributed throughout the Earth`s crust and almost all types of rocks contain some amount of uranium (Montgomery, 1995). Uranium is also present in river water, ground water and even seawater (Sarangi and Beri, 2000). The average uranium concentration in the Earth’s crust is approximately 2.7 ppm (Brookins, 1988). Mining is, however, done in areas where concentration is high enough to make profit. This is therefore restricted to certain areas of various countries and while other countries have very little deposit and have to import enriched uranium for energy purposes. Table 2.1 shows some reported uranium concentration in different matrices.
4
Table 2.1: Typical concentration ranges in different environmental matrices.
Matrix Typical concentration
range (ppm) Reference
Soil 0.0-11.7 UNSCEAR, 1993 Air 2.2 x 10⁻⁸-1.0 x 10⁻⁷ NCRP, 1999
Surface water 3.0 x 10⁻⁵-2.1 x 10⁻³ WHO, 2001 Groundwater 4.0 x 10⁻⁵-2.0 x 10⁻³ WHO, 2001
Major sources of radioactive waste and contamination emanate from the production of electrical power and weapons from nuclear fuels, nuclear weapons’ tests, fuel reprocessing, and nuclear accidents (Hu at al., 2010). Other sources of uranium include by-products of mining activities of other minerals such as gold and copper (Ginder-Vogel et al., 2006). The process of using uranium for nuclear fuels or nuclear weapons generates a lot of uranium waste that has always been a problem for long term storage. Every 900 kg of natural uranium enriched for nuclear energy purposes contains about 120 kg of enriched uranium and the remaining 780 kg is depleted uranium (DU). In order to make a nuclear reaction occur, there has to be a greater percentage of the more fissionable 235U in the fuel than occurs in nature. The enrichment process converts U3O8 into a gas, uranium hexafluoride (UF6), which enables the uranium to be enriched from a 235U content of 0.7% to about 3 to 4%. The enriched UF6 is converted back into UO2 and formed into fuel pellets. For weapons grade uranium, this content can even go up to much higher levels of 90% 235U. DU is obtained as a by-product in the enrichment process of natural uranium. DU is distinguished from natural uranium by lower relative concentrations of 0.25 to 0.30% 235U (Bleise et al., 2003).
2.1.1 Uranium mining as a source of pollution
Various technologies are available for mining of uranium as summarized in Table 2.2. These methods have been changing over time with evolving of new technologies coupled with mining challenges arising from reaching deep ores. In 1990, about 55% of world production came from underground mining, but this shrunk dramatically to 33% from 1999. ISL mining has been steadily increasing its share of the total. In 2010 production was as shown in Table 2.2.
Table 2.2: Methods used in the mining of uranium.
Method tonnes U %
Conventional underground 15,095 28
Conventional open pit 13,541 25
In situ leach (ISL) 22,108 41
By-product 2920 5
5
Conventional mining involves removing mineralized ore from the ground, breaking it up and treating it to remove the minerals being sought. These causes mine tailing dumps that are a source of AMD. On the other hand, ISL involves leaving the ore where it is in the ground, and recovering the minerals from it by dissolving it and pumping the pregnant solution to the surface where the minerals can be recovered. Consequently, there is little surface disturbance and no tailings or waste rock generated as with other methods such as open pit. However, if air and water enter the underground ISL and the ore is pyrite bearing, AMD drainage might result too. In conventional underground mining where shafts are drilled down the earth to reach the ore bearing minerals. The mined ore is taken to the surface for extraction and this also creates mining dumps that are a source of AMD. The production of uranium in South Africa has generally been a by-product of gold or copper mining. In Africa, gold and uranium mining are typically accomplished together, as both methods process large amounts of rocks for very small yields.
2.1.2 Toxicity and fate of uranium
Uranium atoms decay into other atoms that are also radioactive and commonly called "decay products." Radioactivity decay is a spontaneous process and cannot be accelerated or slowed down by any chemical or physical means (Montgomery, 2005). Uranium and its decay products primarily emit alpha radiation, however, lower levels of both beta and gamma radiations are also emitted. Alpha particles travel up to 50 mm in air and only a few microns in rocks before being absorbed and this makes them very safe. Beta particles have a travelling range of about 3 m in air and about 2 mm in rocks. Gamma rays have a high penetrating power and it can take a thick sheet of metal such as lead or concrete to reduce them significantly. 206Pb, the last element on the list of uranium decay series is stable and non-radioactive. It does not decay, and therefore has no half-life. The half live of 238U is about 4.5 billion years, 235U about 700 million years, and 234U about 250 thousand years. In general, 235U and 234U pose a greater radiological health risk than 238U because they have much shorter half-lives. They decay more quickly and are therefore more radioactive as compared to 238U. Naturally occurring uranium contains three isotopes, namely 238U, 235U, and 234U (Bleise et al., 2003). Krachler and Carol (2011) noted that the use of uranium needs an appropriate knowledge of the isotopic composition of the material considered. Of the naturally occurring uranium radioisotopes, 238U is by far the most abundant in terms of mass composition with a composition of 99.28% followed by 235U at 0.72% and 234U at 0.006%.
On average, approximately 90 µg of uranium exists in the human body from which about 66% is found in the skeleton, 16% in the liver, 8% in the kidneys and 10% in other tissues (WHO, 2001). Excessive exposure of uranium and its compounds cause kidney toxicity. This exposure can be through breathing air containing uranium dusts or eating substances containing uranium, which then enters the bloodstream. Once in the bloodstream, uranium compounds are filtered by the kidneys where serious damage can be inflicted at high blood concentrations. Virtually all of the observed or expected effects are from nephrotoxicity associated with deposition in the kidney tubules and glomeruli damage at high blood concentrations of uranium (ranging from about 50 to 150 mg depending on the individual).

6
Studies have shown that uranium causes birth defects in foetuses and infants and that the risk of leukaemia is increased. Uranium also mutates human DNA and chromosomes and deforms them. Since uranium isotopes mainly emit alpha particles that have little penetrating ability, one possible radiological toxicity source can be from some of the radioactive decay products. This is indeed the case as it was already proved in the 1920`s that contamination with radon (Schnessberger disease), a decay product of 238U, can cause bronchial and lung cancer. For these reasons, several research groups have been stimulated, for many years, to investigate the chemistry and toxicology of uranium in all its chemical forms in order to assess the potential chemical and radiological risk for the environment and human health (Berto et al., 2011).
2.1.3 Uranium speciation
The need to determine different species of trace elements in environmental and biological materials is important since the effects or toxicity of an element and its behaviour depend to a great extent on its chemical form and concentration (Kot and Namiesnèik, 2000). The geochemical speciation of uranium influences its solubility, mobility and biological availability in the environment. Geochemical speciation information on uranium has been used to evaluate potential in situ remediation approaches (Lovely et al., 1991; U.S. DOE, 1999; Fredrickson et al., 2000).
Since the mobility and transport of uranium in soils occurs via water it is of great importance to investigate the aqueous chemistry of this element and its speciation in natural waters (Berto et al., 2011). Some previous studies already underlined the importance and complexity of uranium speciation in ground waters mainly in the context of uranium milling for predicting radionuclide migration and for remediation strategies on contaminated sites (Teprat et al., 2009). The distribution of uranium ions in aqueous solution is dependent on both the solution pH and the total uranium concentration (Kotrba et al., 2011).
In nature, uranium ions normally occur in tetravalent and hexavalent form. The hexavalent form is easily soluble in acidic water (Sarangi and Beri, 2000). In oxygen-containing groundwater, uranium is most commonly found predominantly in the hexavalent oxidation state, U(VI), (Langmuir, 1978; Sandino et al., 1992; Farrel et al., 1999; Kilislioglu and Bilgin, 2003; Ginder-Vogel et al., 2006; Konstantinou, 2007) a highly soluble, mobile and therefore troublesome form. In these oxidizing conditions, the uranyl predominates and behaves as strong acid in a Lewis acidity scale (Kotrba et al., 2011). Uranyl ions show high capacity of interacting with a variety of organic and inorganic ligands to form complex species of different stabilities (Kotrba et al., 2011). In systems with high dissolved carbonate concentrations, uranyl-carbonate complexes may become dominant (Gascoyne, 1992) and it forms soluble carbonate complexes in solution, Figure 2.2 (Langmuir, 1978; Pavel et al., 2009). These stable dissolved ternary complexes can effectively compete with mineral surfaces as "reservoirs" for U(VI) (Grenthe et al., 1992).
The hydrolysis of the uranyl ions in aqueous solution is significant at high pH values. A larger number of uranyl hydroxides, oxyhydrates and uranates are known, but
(UO2)2(
hydrolyvalues (
In concAbove tof polymreadily the tetrimmobi
2.2 Bac
Chromifauna anname msolid), ccolour)
Chromicoolingmanufachromiuchromeextensivdichrom
(OH)22+∙H2O
ysed comple(Baes and M
F
centrations bthis concenmeric speciwith miner
ravalent staile (Ginder-
ckground o
ium exists pnd flora, an
means manychromium nand chromi
ium has mag water to inacturing of ium include
e tanning, vely used in
mate anions
O is the m
exes represeMesmer, 197
Figure 2.2:
below 10-6 ntration, the ies such as (rals suspendate, U (IV)-Vogel et al
of chromium
primarily innd volcanic y colours. Exnitrate nonaic sulphate
any industrnhibit corroinks, induststainless stextile, ph
n ferrous all can also b
most stable
ent a signifi76).
Species dist
M, UO2(Ostudy of ur
(UO2)2(OH2
ded in wate), resists col., 2006).
m
n the mineradust and gaxamples of ahydrate (puwhich is gr
ial applicatosion. Chrotrial dyes anteel produc
hotography, loys, mostly
be used to o
7
species in
ficant percen
tribution of
OH)+ is the ranyl (VI) h
2)22+, (UO2)
er and can ombining w
al chromiteases. Many these are; a
urple crystareen (Shupa
tions, for eomium and nd paint pigction, leathe
etc., (Kany due its resoxidize vari
n the presen
ntage of the
f U(VI) (Cho
dominant hhydrolysis is)3(OH)4
2+ anspread easiwith miner
e, which is pchromium
ammonium als), sodiumck, 1991).
xample, itsits compou
gments (Aker tanning, nnan, 1995sistance to oious functio
nce of wat
e overall spe
oppin, 2006
hydrolysis ss complicatend (UO2)3(Oly over largals and is
present in scompoundsdichromate dichromate
compoundunds are alsksu et al., 20wood prese
5). Chromiordinary co
onal groups
ter at 25oC
eciation at
6).
species in sed by the foOH)5
+. U(Vge areas. Hhighly sta
soils, waterss are coloure (orange crye dihydrate
ds can be aso employe002). Otherervation, feium metal orrosive age like the al
C. These
high pH
solution. ormation I) bonds
However, able and
s, rocks, red as its ystalline (orange
added to ed in the r uses of rtilizers, is also
ents. The ldehydes
8
and alcohols, but their limited solubility in non-aqueous solutions has seen a continued interest in the development of new chromium(VI) reagents for the effective oxidation of organic substrates, especially under mild aprotic conditions. Considering this drawback, new polymer supported dichromates based on quaternised polyvinylpyridine were synthesized by several groups including that of Tamami and Kiasat (1997). Polymer supported solid phase organic reagents have an advantage that excess reagents and by-products can easily be separated from the reaction product which is not the case with their monomeric counterparts (Sherrington and Hodge, 1988).
2.2.1 Chromium mining as a source of pollution
The world has large reserves of chromite estimated to be 12 billion tons. Of this, over 95% of the world’s chromium resources are concentrated in Southern Africa and Kazakhstan. The world's largest producer of ferrochrome is South Africa having about 70% of the world's total chrome reserves. Chromium is normally mined in the form of the mineral chromite (Cammarota, 1992). These are mostly located in the Bushveld Igneous Complex (BIC) ores covering an area of approximately 12 000 square kilometres. In total, there are 10 mining sites around South Africa (Mining industry of South Africa). In total, the combined chromium ore reserves exceed 450 million tons, calculated to a depth of 300 metres, with an annual production capacity of more than 4 million tons. An estimation of over 200 000 jobs and a contribution of over R42 billion in Gross Domestic Product per annum by South Africa’s chrome value (www.meraferesources.co.za), underscores the importance of this chromium to the nation.
All of the mining activities of chromium that involves both underground and open pit produce a lot of mine tailing dumps that are a source of AMD. The dust particles from these mine tailing dumps is a source of air pollution.
2.2.2 Speciation and fate of chromium in the environment
Chromium is one of those heavy metals which exist in variable oxidation states of which the trivalent Cr(III) and hexavalent Cr(VI) oxidation states are the most common in the environment (Toral et al., 2009). The oxidation states of chromium can go from -2 to +6. The electron configuration of the element in the ground state is 3d54s1, while that for the trivalent state is 3d34so and that for the hexavalent state is 3d°4so. Chromium(III) oxidation state is the most stable form of chromium. Energy is required to convert the trivalent state to lower or higher states. The negative standard potential (Eo) of the Cr(III)/Cr (II) metal ion couple signifies that Cr (II) is readily oxidized to Cr(III), and Cr (II) species are stable only in the absence of any oxidant (Kotas and Stasicka, 2000). The reduction potential of Cr (II) is -0.91 V and that of Cr(III) is -0.74 V (De la Guardia and Morales-Rubio, 2003).
Just like other metals, chromium enters the environment as a result of effluents discharged from industries (Gómez and Callao, 2006). Once it enters the natural water system, chromium exists primarily in trivalent and hexavalent forms (Chen-Jen, 2002). The need to study chromium speciation emanates from drastic differences in biochemical properties of Cr(III)

and Cr(for huminsulin consideand anihumanscarcinomembraproperti2.3, proconditio
Figure Nordstr
Trivalen(Petruzeretainedmakingsoluble state. Inoxospec
(VI) compomans and an
metabolismered a microimal tissuess and causgenic becauanes (Udy, ies as an oxovides a geons.
2.3: The rom, 1998; N
nt chromiuelli et al., 1d and adsog it relativel
and can ben aqueous cies, namel
ounds (Paninimals and pm (Langard o nutrient fs. The hexases chronicuse of its h1956; Lin
xidant (Katzeneralized d
pH-Eh diaNieboer and
um has a lo1995; Zhao rbed to solly immobile transported
solution, tly, dichrom
chev et al.,plays an impand Norset
for many livavalent formc adverse high oxidatand Huangz and Salemdepiction o
agram of sd Jusys, 198
ow solubilitet al., 1998
lid particlese in the aqd over a grethe hexava
mate (Cr2O7
9
, 2008). Formportant role
th, 1990; Flving organim of chromeffects (La
tion potentig, 2001). Thm, 1992). Tof the aqueo
stability of 88; Richard
ty in aqueo8). Low sols or it prec
quatic systemeat distance
alent chrom
72-), hydroc
r instance, e as the gluclorence andisms while mium is alsangard andial and its he toxicity
The Eh-pH dous species
f different d and Bourg
ous mediumlubility of ccipitates, Joms. On thee before it i
mium speciechromate (H
Cr(III) is ancose-toleranBatley, 19Cr(VI) is a
so known td Norseth, ability to pof Cr(VI) i
diagram fors stabilities
chromium , 1991).
m in alkalinhromium(IIohnson et ae other hands reduced bes may exiHCrO4
-) or
an essential nce factor (
980). Also Can irritant tto be very
1990). Crpenetrate biis as a resur chromium
in differen
species (B
ne and neuII) means ital. (1992), d, Cr(VI) iback to the tist in a vachromate
element GTF) in
Cr(III) is to plants toxic to r(VI) is iological ult of its
m, Figure nt redox
Ball and
utral pH, t will be thereby
s highly trivalent
ariety of (CrO4
2-)

10
depending on concentration and pH (Neagua and Mikhalovsky, 2010; Namasivayam and Sureshkumar, 2008; Chanda and Rempel, 1993), Figure 2.4.
Figure 2.4: Species distribution diagram of Cr(III) and Cr(VI) in an aqueous system (Hagendorfer and Goessler, 2008).
According to Toral et al. (2009), the different species of Cr(VI) in aqueous solutions are given by equilibrium equations 2.1 and 2.2.
HCrO4- → H+ + CrO4
2- K = 3.2 x 10⁻⁷ (2.1)
2HCrO4- → Cr2O7
2- + H2O K = 33.1 (2.2)
Changing between the chromate and dichromate requires making the solution acidic or alkaline. In acidic solution yellow dichromate is favoured while in alkaline solution, chromate blue colour is seen.
The structures of the chromate and dichromate anions shows that the Cr-O bond lengths are 166 pm and 163 pm, respectively, and the bridging Cr-O bond is 179 pm, while the Cr-O-Cr bond angle is 126o (Shupack, 1991). The structures of these two anionic forms of chromium are based on the sharing of a corner of the tetrahedral structure of the chromate ion as polymerization proceeds as pH is lowered, (Figure 2.5).
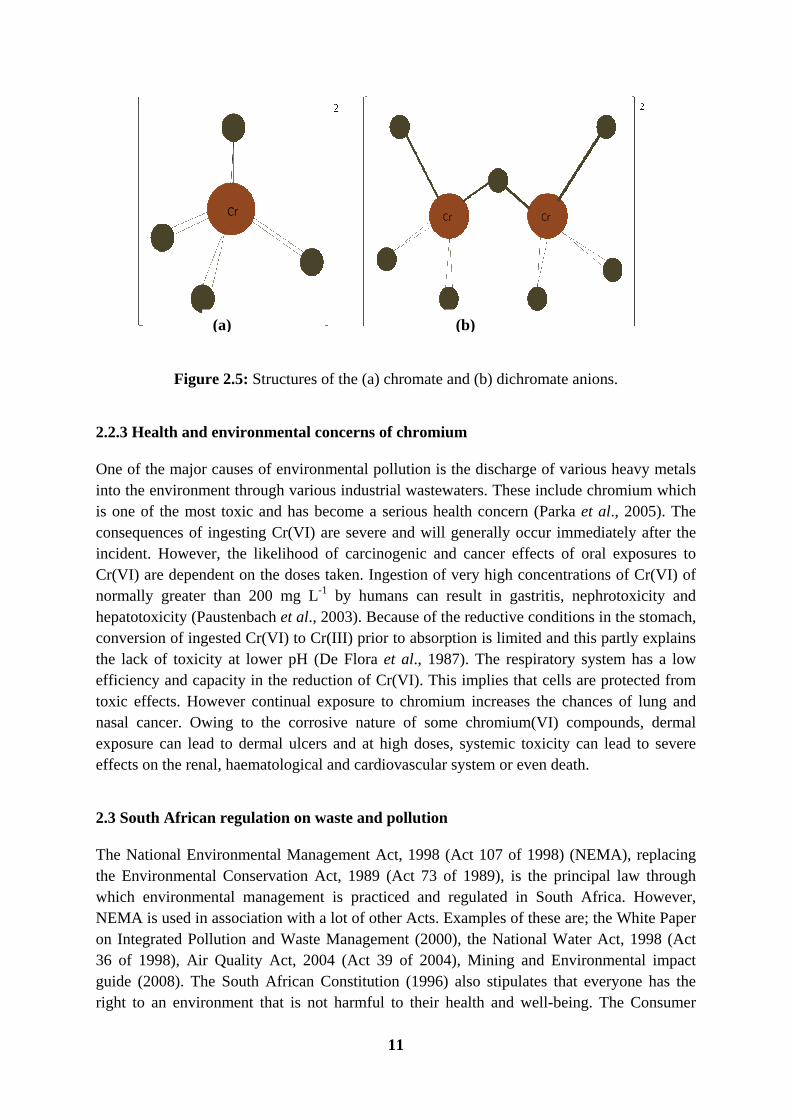
11
Figure 2.5: Structures of the (a) chromate and (b) dichromate anions.
2.2.3 Health and environmental concerns of chromium
One of the major causes of environmental pollution is the discharge of various heavy metals into the environment through various industrial wastewaters. These include chromium which is one of the most toxic and has become a serious health concern (Parka et al., 2005). The consequences of ingesting Cr(VI) are severe and will generally occur immediately after the incident. However, the likelihood of carcinogenic and cancer effects of oral exposures to Cr(VI) are dependent on the doses taken. Ingestion of very high concentrations of Cr(VI) of normally greater than 200 mg L-1 by humans can result in gastritis, nephrotoxicity and hepatotoxicity (Paustenbach et al., 2003). Because of the reductive conditions in the stomach, conversion of ingested Cr(VI) to Cr(III) prior to absorption is limited and this partly explains the lack of toxicity at lower pH (De Flora et al., 1987). The respiratory system has a low efficiency and capacity in the reduction of Cr(VI). This implies that cells are protected from toxic effects. However continual exposure to chromium increases the chances of lung and nasal cancer. Owing to the corrosive nature of some chromium(VI) compounds, dermal exposure can lead to dermal ulcers and at high doses, systemic toxicity can lead to severe effects on the renal, haematological and cardiovascular system or even death.
2.3 South African regulation on waste and pollution
The National Environmental Management Act, 1998 (Act 107 of 1998) (NEMA), replacing the Environmental Conservation Act, 1989 (Act 73 of 1989), is the principal law through which environmental management is practiced and regulated in South Africa. However, NEMA is used in association with a lot of other Acts. Examples of these are; the White Paper on Integrated Pollution and Waste Management (2000), the National Water Act, 1998 (Act 36 of 1998), Air Quality Act, 2004 (Act 39 of 2004), Mining and Environmental impact guide (2008). The South African Constitution (1996) also stipulates that everyone has the right to an environment that is not harmful to their health and well-being. The Consumer
(a) (b)
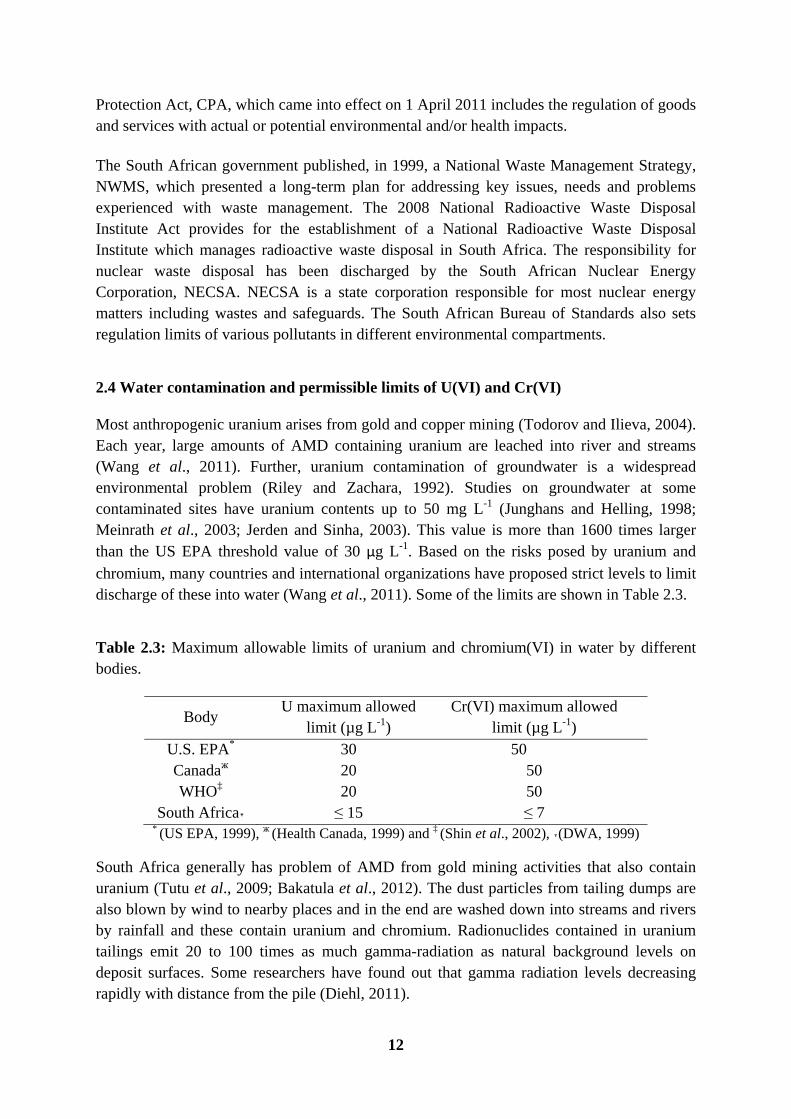
12
Protection Act, CPA, which came into effect on 1 April 2011 includes the regulation of goods and services with actual or potential environmental and/or health impacts.
The South African government published, in 1999, a National Waste Management Strategy, NWMS, which presented a long-term plan for addressing key issues, needs and problems experienced with waste management. The 2008 National Radioactive Waste Disposal Institute Act provides for the establishment of a National Radioactive Waste Disposal Institute which manages radioactive waste disposal in South Africa. The responsibility for nuclear waste disposal has been discharged by the South African Nuclear Energy Corporation, NECSA. NECSA is a state corporation responsible for most nuclear energy matters including wastes and safeguards. The South African Bureau of Standards also sets regulation limits of various pollutants in different environmental compartments.
2.4 Water contamination and permissible limits of U(VI) and Cr(VI)
Most anthropogenic uranium arises from gold and copper mining (Todorov and Ilieva, 2004). Each year, large amounts of AMD containing uranium are leached into river and streams (Wang et al., 2011). Further, uranium contamination of groundwater is a widespread environmental problem (Riley and Zachara, 1992). Studies on groundwater at some contaminated sites have uranium contents up to 50 mg L-1 (Junghans and Helling, 1998; Meinrath et al., 2003; Jerden and Sinha, 2003). This value is more than 1600 times larger than the US EPA threshold value of 30 μg L-1. Based on the risks posed by uranium and
chromium, many countries and international organizations have proposed strict levels to limit discharge of these into water (Wang et al., 2011). Some of the limits are shown in Table 2.3.
Table 2.3: Maximum allowable limits of uranium and chromium(VI) in water by different bodies.
Body U maximum allowed
limit (µg L-1) Cr(VI) maximum allowed
limit (µg L-1)
U.S. EPA* 30 50 Canadaж 20 50 WHO‡ 20 50
South Africa˕ ≤ 15 ≤ 7 * (US EPA, 1999), ж (Health Canada, 1999) and ‡ (Shin et al., 2002), ˕(DWA, 1999)
South Africa generally has problem of AMD from gold mining activities that also contain uranium (Tutu et al., 2009; Bakatula et al., 2012). The dust particles from tailing dumps are also blown by wind to nearby places and in the end are washed down into streams and rivers by rainfall and these contain uranium and chromium. Radionuclides contained in uranium tailings emit 20 to 100 times as much gamma-radiation as natural background levels on deposit surfaces. Some researchers have found out that gamma radiation levels decreasing rapidly with distance from the pile (Diehl, 2011).

13
2.5 Conventional methods of uranium and chromium removal
A number of conventional methods have been used for the removal of both chromium and uranium in various environmental compartments. However, the conventional methods have both advantages and disadvantages. In some cases, disadvantages exceed the advantages as seen in Table 2.4. This has therefore led to continued research in removal technologies. Current research is focused on improving the existing ones or developing new ones altogether. Some of the conventional technologies are briefly discussed below.
Table 2.4: Advantages and disadvantages of some convectional removal techniques (Wang et al., 2010).
Method Disadvantages Advantages
Chemical precipitation
pH dependence Difficult separation Adverse effect by chelating agents Result in sludges Chemical required
Simple and cheap
Ion exchange
Sensitive to particles High operational costs No selectivity to alkaline metals Membrane fouling
No sludge generation Pure effluent recovery possible
Membrane technology
Membrane fouling Limited life of membrane Expensive High pressure
Pure effluent
Flocculation Chemicals required Depend on basin design
Generate very fine particles of precipitates
Flotation Less selective for heavy metals Costly
Electrodialysis
Takes time Large electrode surface area used Fouling Expensive
Metal selective

14
2.5.1 Bioremediation
This is the use microorganisms such as bacteria to remediate polluted environmental compartments. For uranium(VI) bioremediation, a possible viable alternative approach is that of reducing the soluble and thus mobile U(VI) to relatively insoluble U (IV) which precipitates in solution (Lovley et al., 1991; Finneran et al., 2002; Anderson et al., 2003) using microorganisms. This can prevent further migration and spread of the uranium contamination (Kelvin et al., 2005). Several researchers, like that at Stanford University and Oak Ridge National Laboratory (ORNL) have shown that several common types of bacteria can be used to convert an unstable form of uranium, U(VI), into a more stable form, U (IV). This reduces the environmental and health threat of uranium contamination (Ginder-Vogel et al., 2006).
Numerous common dissimilatory metal reducing bacteria (DMRB) and sulphate reducing bacteria (SRB) are known. These include Shewanella, Geobacteraceae, and Desulfovibrio species. They couple the oxidation of organic matter and H2 to the reduction of U(VI) resulting in U (IV) and the subsequent precipitation of uraninite (UO2) (Gorby and Lovley, 1992; Fredrickson et al., 2000) a sparingly soluble phase. Figure 2.6 demonstrates how Geobacteraceae species can be used to effectively remove uranium from contaminated groundwater by reducing soluble U(VI) to the relatively insoluble U(IV) with organic compounds serving as electron donors.
Figure 2.6: Uranium(VI) reduction driven by microbial respiration (modified from Ginder-Vogel et al., 2006).
Polti et al. (2009) provided quantitative information on the reduction of Cr(VI) in soil samples by an indigenous actinomycete. Streptomyces sp. MC1. This species, previously isolated from sugarcane demonstrated its ability to reduce Cr(VI) in liquid minimal medium. Chatterjee et al. (2011) studied the Cr(VI) reduction capability of a bacterial strain Cellulosimicrobium cellulans in two environments, of nutrient-supplemented and non-supplemented. In the former, the bacterial strain was observed to reduce 54.89% Cr(VI) from the wastewater. In their study, Mishra et al. (2012) investigated the Cr (VI) resistance in
Soluble
U(VI)
Insoluble
U(IV)
Organic
Carbon
CO2
e-

15
Lactobacillus strains and they also evaluated the reduction of Cr (VI) by the same species. A complete bacterial reduction of 32 mg L-1 of Cr (VI) was observed within 6 to 8 hours.
2.5.2 Permeable reactive barriers (PRBs)
Permeable Reactive Barriers are trenches or fence-like arrays of non-pumping wells placed in the subsurface at depths of up to 45 m to intercept the flow of contaminated ground water (Freethey et al., 2002). The fill materials contained within the PRBs react by degrading or sequestering the dissolved contaminants. The PRBs act as large in-situ filters for cleaning up ground water. Some of the advantages for the use of PRB technologies are that they offer lower operating costs, are highly energy efficient and require no surface facilities or ground water pumping (Freethey et al., 2002; Morrison and Spangler, 1992; Shoemaker et al., 1995). The use of PRBs is a relatively new technology that offers promise to overcome these problems encountered with conventional methods such as pump-and-treat which is ineffective especially when dealing with large contaminated areas. Two commonly used PRBs contaminant-removal mechanisms are: (a) precipitation reactions in which metal contaminants are sequestered within freshly formed mineral phases, and (b) oxidative degradation of contaminants by particulate iron metal. For PRBs to be cost-effective they should be reusable for a longer period of time. They should not be susceptible to clogging or rapid passivation by reaction products.
2.5.3 Chemical precipitation
Chemical precipitation is a method of wastewater treatment where chemicals are added to form particles which settle and remove contaminants. It is a favourable method especially when dealing with large volume of matter which contains heavy metal ions in low concentration (Eisazadeh, 2008). The solubility of precipitated metal compounds should be known for the successful implementation of the chemical precipitation approach. If a metal can form an insoluble compound, then the compound can be removed via clarification and filtration (Amer, 1998). However, this technique has a disadvantage that it produces a large amount of sludge precipitate that requires further treatment (Acheampong et al., 2010). Iron mediated reductive precipitation of redox active metal species has been proposed for the removal of soluble metals and radionuclides from contaminated ground water (Cantrell et al., 1995). Cantrell et al. (1995) and Gu et al. (1998), attributed the removal of the soluble uranium to reductive precipitation of U(VI) to less soluble U (IV) species and adsorption of the uranyl to iron corrosion products. Zero valent iron can reduce uranium species adsorbed on its surface (Fiedor et al., 1998). Under anaerobic conditions, the thermodynamics of U(VI) reduction by zero valent iron can be described by the following redox couples (Pourbaix, 1966):
UO22+ + 2e = UO2
o E = 0.221 + 0.0295 log [UO22+] (2.3)
Feo = Fe2+ + 2e E = 0.440 - 0.0295 log [Fe2+] (2.4)

16
Iron can be used to precipitate chromium(VI). However, this is pH dependent as investigations of Olazabal et al. (1997) showed. Precipitation equilibria and spectroscopic studies of the Cr(VI)/Fe(III)/H2O system have been performed and the identified precipitates which existed were FeOHCrO4, FeOHCrO4·2Fe(OH)3 and Fe(OH)3, depending on the pH used. Gheju and Balcu (2011) investigated the total removal of chromium from Cr(VI) aqueous solutions by reduction with scrap iron and subsequent precipitation of the resulted cations with NaOH. Another precipitation reagent is sodium metabisulphite which was used by Ramakrishnaiah and Prathima (2012) as reducing agent for the reduction of hexavalent chromium to trivalent chromium. Their results showed that total chromium can be removed from synthetic and industrial effluents by chemical.
2.5.4 Ion exchange
Ion exchange is an exchange of ions between two electrolytes or between an electrolyte solution and a complex using solid polymeric or materialistic ion exchangers. Synthetic resins have been widely reported to be efficient in removing uranium from contaminated groundwater. Pakalns (1980) stated that Chelex-100 resin (a weakly acidic metal-chelating resin) conditioned at pH 4.6 separated uranium from fresh and saline waters. Diphonix is also a chelating resin that was found to remove uranium from water at near-neutral pH conditions (Chiarizia et al., 1997). At low pH conditions, uranium was found to be strongly adsorbed by strong-base anion exchange resins (DowexTM 1-X8 and Purolite A-520E) (Gu et al., 2004).
2.5.5 Phytoextraction
Phytotechnologies involving use of plants for pollutant removal have gained importance during the last two decades. The sequestration of heavy metals in plants is achieved mainly by absorption and accumulation mechanisms (Dhir, 2010). Phytoremediation technology involving use of aquatic plants can provide an economical and eco-friendly option for treating wastewaters containing heavy metals (Dhir, 2010). Many plants have been used for the remediation of uranium from soils and aquatic environments and some of them are Brassica juncea and Brassica chinensis (Huang et al., 1998), Lemna gibba L. (duckweed) (Mkandawire et al., 2004).
Ipomoea aquatica exhibits uniform absorption characteristics showing over 75% removal of added Cr(VI) and this plant was selected due to its easy establishment, tolerance and growing easiness. Since in its use it showed no toxicity symptoms, it a potential phytoremediant (Weerasinghe et al., 2008). Revathi et al. 2011 successfully used a hyperaccumulator, sorghum plant, phytoremediation of chromium metal from polluted soil of Ranipet Tanneries.
Phytoremediation has many limitations which include death of the plants if contaminant concentrations are too high. The toxicity and bioavailability of biodegradation products is not always known. The success of phytoremediation may be seasonal depending on location. Other climatic factors will also influence its effectiveness. If the plants contain high levels of heavy metals, disposal of harvested plants can be a problem.
17
2.5.6 Electrodialysis
Electrodialysis is a decontamination technique used to transport salt from one solution, the diluate, to another solution, the concentrate, by applying an electric current in an electrodialysis cell. Inside an electrodialysis unit, the solutions can be separated by alternately arranged anion exchange membranes, permeable only for anions and cation exchange membranes, permeable only for cations. By this, two kinds of compartments are formed. By applying a current, cations within the diluate move toward the cathode passing the cation exchange membrane facing this side and anions move towards the anode passing the anion exchange membrane. A further transport of these ions, now being in a chamber of the concentrate is stopped by the respective next membrane. Zaheri et al. (2010) investigated the ability of electrodialysis for continuous removal of uranium from aqueous solutions in a bench scale unit.
2.6 Adsorption techniques
The shortfalls of the conventional methods have prompted the use of adsorbents as an alternative approach. Adsorption techniques are used mainly for metal recovery from dilute solutions. Thus, to find out an effective adsorbent that can be used repeatedly to adsorb metals is particularly important (Wang et al., 2011). Some of the common adsorbents that have been used to remove uranium(VI) and chromium from wastewaters are reviewed in the next section.
Zeolites are hydrated aluminosilicate materials having cage-like structures with internal and external surface areas of up to several hundred square meters per gram and cation exchange capacities of up to several milliequivalents per kilogram. At least 41 types of natural zeolites are known to exist, and many others have been synthesized. Both natural and synthetic zeolites are used in industry as adsorbents (Baker et al., 2009). Camacho et al. (2010) used clinoptilolite zeolite to remove uranium from groundwater. Mongolian natural zeolite was applied to adsorptive removal of hexavalent chromium contained in tannery wastewater (Bolortamir and Egashira, 2008).
Activated carbon with low polar properties is a typical adsorbent commonly used for the removal of polar organic material in water and wastewater (Ying et al., 1990). Adsorption using commercial activated carbon (CAC) can also remove heavy metals such as Cd, Ni, Cr and Cu from wastewater (Demirbas et al., 2004, Ahn et al., 2009). Pellet-600 and PVA-300 with high mesoporous volumes and surface area were used by Yue et al. (2009) as a low-cost, chemically activated carbon materials. Their findings were that these two showed more effective removal efficiency of Cr(VI) from water than commercially available activated carbons tested. Acharya et al. (2009) activated carbon prepared from Tamarind wood with zinc chloride. They also studied the uptake of chromium(VI) on this adsorbent and the results indicated effective adsorption of chromium(VI) from aqueous solutions.
Due to a large surface area, small, hollow and layered structures, carbon nanotubes (CNTs) have already been investigated as promising adsorbents (Chen et al., 2009). Extensive efforts

18
have been put in the utilization of CNTs for removal of metal ions. Unlike many adsorbents, CNTs possess different features that contribute to the superior removal capacities such as fibrous shape with high aspect ratio, large accessible external surface area and well developed mesopores (Gupta et al., 2011). Recently, it was shown that magnetic CNTs are very promising materials for efficient removal of heavy metal ions from aqueous solutions. Magnetic CNTs are composed of metallic cores of the diameter range of 5-100 nm, which are completely wrapped in carbon coatings of thickness range 1-5 nm. The carbon coatings perfectly isolate the encapsulated nanoparticles. The crystallinity of these coatings is similar to carbon nanotubes. The magnetic CNTs-based sorbents are fully mobile as they can be very easily moved and separated by external permanent magnets.
2.7 Magnetic nanoparticles
One of the most important research and development frontiers in modern science is nanoscience (Faraji et al., 2010). Nanoparticle materials have drawn a lot of attention because most of their physical properties differ significantly from those of the corresponding bulk materials (Franco et al., 2005; Burke et al., 2002; Dimitrov and Wysin, 1994). These properties include electrical, optical, magnetic, and chemical properties (Hyeon, 2002). In literature, there are many nanoparticles that have been used and they include metals such as gold, iron, nickel, platinum, silver, cobalt, semiconductors like cadmium selenite, lead selenite, or hybrids like CdSe/Zn selenite (ZnS) (Burda et al., 2005). Among these magnetic particles, metal oxides are often preferred over pure metals (Schmidt, 2007: Ramanujan and Yeow, 2005) because they are more stable to oxidation. An example of these metal oxides is magnetite, Fe3O4.
These magnetic nanoparticles, have attracted a lot of attention over the past years and have found wide applications in many biomedical fields such as bioseparation, site-specific drug delivery and magnetic resonance imaging (Pankhurst et al., 2003). Good physicochemical properties of magnetic nanoparticles are taken advantage of in order to make full use of them. The ideal magnetic nanoparticles are expected to be of high magnetic properties, small size with narrow size distribution and superparamagnetic characteristics (Yang et al., 2004). Magnetic susceptibility is normally used to characterize magnetic materials and these materials can be classified into three main categories namely, ferromagnetic, paramagnetic and diamagnetic. In antiferromagnetism, which includes certain metals and alloys in addition to some ionic solids, there is a spontaneously alignment of electrons at relatively low temperatures into opposite directions throughout the material. This antiparallel arrangement implies that there is no net spontaneous magnetization. Iron, Co and Ni are materials associated with ferromagnetism, together with their alloys. There are also many other materials which exhibit ferromagnetic behaviour. Typical ferromagnetic substances show permanent spontaneous magnetization even without external applied fields. For a ferromagnetic material, a material specific constant, magnetic susceptibility is greater than the susceptibility of paramagnetic or diamagnetic materials. In ionic compounds, such as oxides, more complex forms of magnetic ordering can occur as a result of crystal structures. One type of magnetic ordering is called ferrimagnetism where the magnetic structure is

composare mealignmethe subFigure 2
Figure ferrima
2.7.1 Su
Lu et alof the typicallmagnetblockin2009). Nabsence
By defisingle-dor antifby nanofield, exarise fronanopar
2.7.2 M
Instead magnet(Gangumagnet
sed of two mdiated by tent of spinslattices are 2.7 shows th
2.7: Oriengnetism.
uperparam
l. (2007) nonanoparticlly around 10ic domain a
ng temperatuNanoparticle of the field
inition, supdomain magferromagnetoparticles apxtra anisotroom finite sirticles (Tart
Magnetic pr
of the ferric composi
uly, 2005). ic materials
magnetic suthe oxygen
s between thnot equal
he orientati
ntation of d
magnetism
oted that, in les is below0-20 nm. Band shows sure (Lu et les can be d.
perparamagngnetic partictically (Shawpart from suopy contribize and surftaj et al., 20
roperties of
romagnetic ition of a mThe hyster
s and an illu
ublattices sen anions. She two sublto each othon of electr
domains in
most applicw a criticalBelow this csuperparamaal., 2007) easily magn
netism is acles which w and Heasuperparama
butions or shface effects 003).
f magnetic p
behaviour omagnetic pesis loop o
ustration of t
19
eparated by Superexchanlattices. In fher and as arons in diffe
(a) ferrom
cations, thel value, whcritical valueagnetic behand this isnetized and
name giveare themse
sley, 1967).agnetism arehifted loops that domin
particles
observed inparticle can or magnetizthis is show
oxygen atonge interactferrimagneta result, theerent enviro
magnetism (
e nanopartichich is depee, each nan
haviour whes contrary td keep no r
en to a paraelves interna
Other new e high fields after field nate the mag
n bulk magnlead to a
zation curvewn in Figure
ms. The exctions resultism, the ma
ere is a net nments.
(b) aniferrim
les performendent on t
noparticle wen the tempeto bulk matremanent m
amagnetic bally coupledphysical beirreversibilcooling. Algnetic beha
netic materisuperparam
e can be use 2.8.
xchange intet in an antagnetic mommagnetic m
magnetism
m best whenthe materia
will become erature is abterials (Frey
magnetizatio
behaviour od ferromagnehaviours elity, high sall these phe
aviour of in
rials, the namagnetic besed to char
eractions tiparallel ments of moment.
and (c)
the size al but is a single
bove the y et al.,
on in the
of small netically xhibited
aturation enomena ndividual
anometre ehaviour racterize
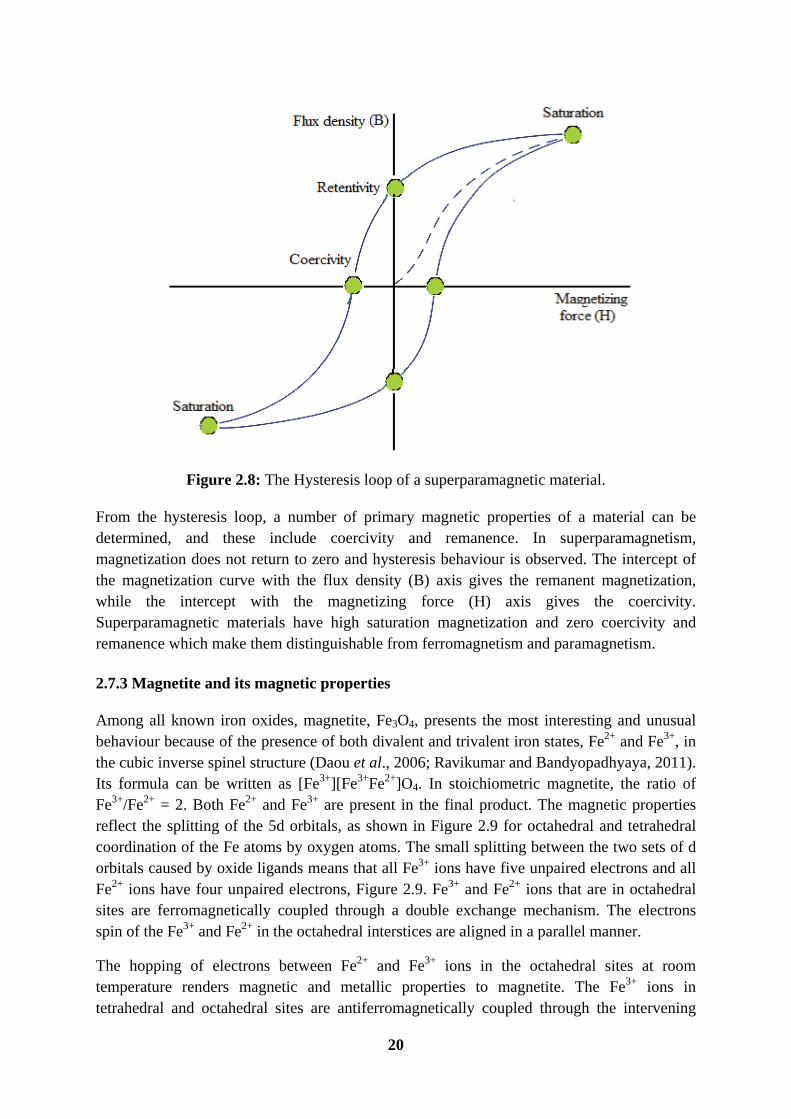
20
Figure 2.8: The Hysteresis loop of a superparamagnetic material.
From the hysteresis loop, a number of primary magnetic properties of a material can be determined, and these include coercivity and remanence. In superparamagnetism, magnetization does not return to zero and hysteresis behaviour is observed. The intercept of the magnetization curve with the flux density (B) axis gives the remanent magnetization, while the intercept with the magnetizing force (H) axis gives the coercivity. Superparamagnetic materials have high saturation magnetization and zero coercivity and remanence which make them distinguishable from ferromagnetism and paramagnetism.
2.7.3 Magnetite and its magnetic properties
Among all known iron oxides, magnetite, Fe3O4, presents the most interesting and unusual behaviour because of the presence of both divalent and trivalent iron states, Fe2+ and Fe3+, in the cubic inverse spinel structure (Daou et al., 2006; Ravikumar and Bandyopadhyaya, 2011). Its formula can be written as [Fe3+][Fe3+Fe2+]O4. In stoichiometric magnetite, the ratio of Fe3+/Fe2+ = 2. Both Fe2+ and Fe3+ are present in the final product. The magnetic properties reflect the splitting of the 5d orbitals, as shown in Figure 2.9 for octahedral and tetrahedral coordination of the Fe atoms by oxygen atoms. The small splitting between the two sets of d orbitals caused by oxide ligands means that all Fe3+ ions have five unpaired electrons and all Fe2+ ions have four unpaired electrons, Figure 2.9. Fe3+ and Fe2+ ions that are in octahedral sites are ferromagnetically coupled through a double exchange mechanism. The electrons spin of the Fe3+ and Fe2+ in the octahedral interstices are aligned in a parallel manner.
The hopping of electrons between Fe2+ and Fe3+ ions in the octahedral sites at room temperature renders magnetic and metallic properties to magnetite. The Fe3+ ions in tetrahedral and octahedral sites are antiferromagnetically coupled through the intervening

21
oxygen atom and their spins are anti-parallel. Thus, the Fe3+ spins in the tetrahedral and octahedral sites cancel and what remains are unpaired spins from the Fe2+ ions in octahedral sites.
Figure 2.9: Electronic configuration in magnetite.
2.7.4 Synthesis of magnetic nanoparticles
Magnetic properties of magnetic nanoparticles can be tailored by their particle sizes and size distributions. The particle sizes and size distributions of magnetic nanoparticles are in turn, affected by their synthetic routes (Chin et al., 2011). Tartaj et al. (2003) further noted that the performance of nanoparticles will be dependent on their chemical and physical characteristics. In order to take maximum advantage of those novel properties, synthetic protocols are needed in which significant control can be exercised over those parameters (Chen et al., 2007). For these reasons, numerous physical and chemical synthesis approaches have been developed to produce Fe3O4 nanoparticles in order to obtain the desired properties (Chin et al., 2011). Some of these synthetic routes are briefly discussed in the following section.
2.7.4.1 Co-Precipitation
Co-precipitation is the simplest chemical pathway to synthesize magnetite (Burda et al., 2005; Laurent et al., 2008). This method has attracted a lot attention as it is environmental friendly because the synthesis is carried out in aqueous solutions without using any organic solvents under mild reaction conditions at relatively low temperatures (Iwasaki et al., 2009). The synthesis involves addition of the ferrous and ferric salts to an aqueous solution followed by the addition of a base, equation 2.5, in an alkaline hydrolysis reaction (Finotelli et al., 2008). A black Fe3O4 precipitate forms upon addition of a base.

22
Fe2+ + 2Fe3+ + 8OH- → Fe3O4 + 4H2O (2.5)
Magnetite can be formed over a wide pH range for given concentrations of Fe2+ and Fe3+. A complete precipitation of Fe3O4 is expected in the pH range of 7.5-14 while maintaining a molar ratio of Fe2+:Fe3+ at 1:2 under an inert atmosphere. However, under oxidative environment, Fe3O4 may be oxidized to other forms of iron oxide as given by the equations 2.6 and 2.7 (Kim et al., 2003).
Fe3O4 + 0.25 O2 + 4.5 H2O → 3 Fe(OH)3 (2.6)
Fe3O4 + 0.25 O2 → 1.5 Fe2O3 (2.7)
2.7.4.2 Thermal decomposition
Highly crystalline and monodisperse Fe3O4 nanoparticles have been synthesized by conducting reactions at high temperature (>200oC) through thermal decomposition of organometallic precursors in nonpolar organic solvents (Sun et al., 2003; Park et al., 2005). Park et al. (2005), performed a thermal decomposition of iron pentacarbonyl, [Fe(CO)5], for the preparation of monodisperse γ-Fe2O3 nanoparticles with average diameters in the nanoscale range. They achieved this by controlling the molar ratio of [Fe(CO)5] and the surfactant, oleic acid. This synthetic route is however unpopular since [Fe(CO)5] is very expensive and toxic. Chin et al. (2011) used different concentrations of iron (III) acetylacetonate, Fe(acac)3 and varied volumes of polyethylene oxide in a quest to study their effects on the particle size of Fe3O4 nanoparticles formed. In their research, Maity et al. (2009) proposed a mechanism for solubility of the as-prepared by using surface charges and surface coating of the magnetite nanoparticles in aqueous suspension. They also used thermal decomposition of Fe(acac)3 in tri(ethyleneglycol).
2.7.4.3 Microemulsion
For microemulsion to occur, the mixture system has to consist of an oil phase, a surfactant phase and an aqueous phase (Koutzarova et al., 2006). Generally in this method, nano-particles are synthesized in oil-in-water micro-emulsions by suspending a ferrous salt-surfactant to a water solution. The magnetic precipitate will then form as soon as a base is added to the reaction mixture (Thorek et al, 2006). In water-in-oil micro-emulsions, the aqueous phase is dispersed as micro-droplets surrounded by a monolayer of surfactant molecules in a continuous non-aqueous (hydrocarbon) phase. The soluble metal salt will reside within the aqueous droplets surrounded by the oil (Ha et al., 2008). In this method, co-precipitation occurs in tiny droplets of water embedded with a surfactant, so-called reverse micelles, which are distributed in an oil phase (Makovec et al., 2005). Nassar and Husein (2005) subjected FeCl3
bulk solid powder to the action of microemulsion formed with sodium
bis (2-ethylhexyl) sulfosuccinate. Iron chloride was first solubilized in water of the microemulsions and then reacted with sodium hydroxide to eventually form the iron oxide nanoparticles.

23
2.7.4.4 Hydrothermal synthesis
Hydrothermal synthesis is a method to produce metal oxide crystals from metal salt aqueous solutions by application of heat (Dawson, 1988; Matijevic and Hsu, 1987). For example, hydrothermal treatment of iron salt could generate iron oxides when the applied conditions are appropriate (Mohapatra and Anand, 2010).
Hu et al. (2010) developed a hydrothermal method to fabricate sheet-like and pseudo-octahedral magnetite crystals. NaOH was added to K4[Fe(CN)6] aqueous solution with constant stirring. Hydrothermal treatment was done at 160oC after which magnetite precipitate was collected. In another study, Togashi et al. (2012) synthesized water dispersible magnetite (Fe3O4) nanoparticles in an aqueous environment under high temperature and pressure in the presence of 3, 4-dihydroxyhydrocinnamic acid by using a tubular flow reactor. Haw et al. (2010) synthesized Fe3O4 nanoparticles by precipitating FeSO4·7H2O and FeCl3 in NaOH. However, prior to the addition of a base, dilute HCl was used to prevent the formation of other iron oxides. The precipitated black product was immediately added into a Teflon-lined stainless steel autoclave which was then placed in a furnace at 200oC for 1 h.
2.7.5 Coating of magnetite
Due to the van der Waals’ forces and magnetic dipole-dipole interactions resulting from residual magnetic moments, unmodified magnetite nanoparticles have a tendency to agglomerate and flocculate, Kim et al. (2003), thereby inhibiting the advantages of the specific properties by single-domain (Sun et al., 2005). This is also true for ferrofluids which are stable colloidal suspensions of single domain ferro or ferrimagnetic particles in a liquid carrier (Voit et al., 2001). Among other parameters, Häfeli et al. (2002) noted that surface coating and aggregation tendencies can influence the overall magnetic responsiveness of magnetic particles. Coating of the magnetite particle surfaces can effectively prevent agglomeration and this is achieved by covering the magnetite with a surfactant or coating layer. Coating of the ferrofluids enables stabilization of the particles against gravimetrical forces and to avoid strong interaction and also agglomeration of the particles (Voit et al., 2001).
Selection of the appropriate core and monolayer material will then become critical as each layer or coating agent dictates a specific function (Lodhia et al., 2010). There are several choices of coating agents which include organosilanes, having C18 or aminopropyl groups, polymers (Inoue et al., 1990), biomass, hemimicelles/admicelles of ionic surfactant, alkyl carboxylates and many others.
As already mentioned, these polymeric networks of the coating agents or surfactants encapsulate oxide monodomains and hold them apart against clustering together. Apart from this, the formation of a polymer layer on the surface of the magnetite nano-particles prevents further oxidation (Kim et al., 2003). According to Lee et al. (2003), if not properly coated, iron oxide can produce secondary contaminants when it comes into contact with water and
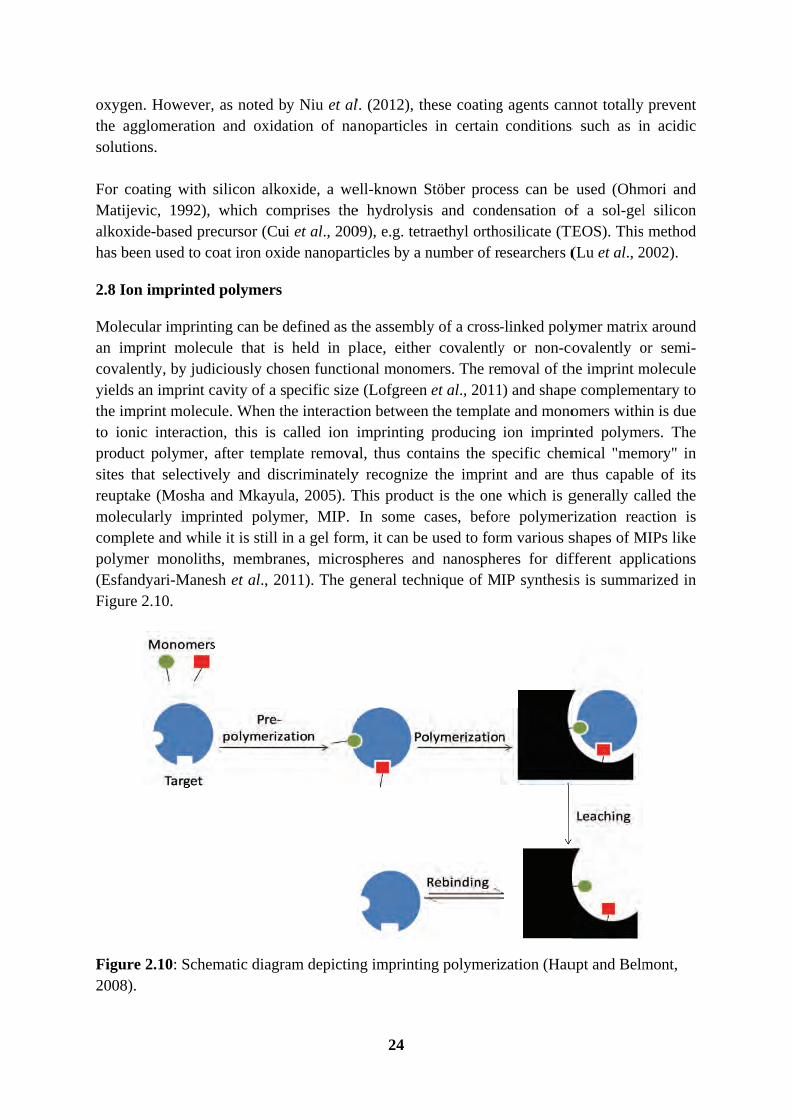
oxygenthe aggsolution For coaMatijevalkoxidhas bee
2.8 Ion
Molecuan impcovalenyields athe impto ionicproductsites threuptakmolecucompletpolyme(EsfandFigure 2
Figure 2008).
. However, glomerationns.
ating with svic, 1992), de-based pren used to co
imprinted
ular imprintiprint molecuntly, by judian imprint cprint molecuc interactiot polymer,
hat selectiveke (Mosha alarly imprite and whil
er monolithdyari-Manes2.10.
2.10: Schem
as noted bn and oxida
silicon alkowhich com
ecursor (Cuoat iron oxi
d polymers
ing can be dule that is iciously chocavity of a sule. When thon, this is cafter templely and disand Mkayulinted polyme it is still i
hs, membransh et al., 20
matic diagra
y Niu et alation of nan
oxide, a wemprises thei et al., 200de nanopart
defined as thheld in pl
osen functiopecific sizehe interactiocalled ion iate removacriminatelyla, 2005). Tmer, MIP.n a gel formnes, micros011). The g
am depictin
24
l. (2012), thnoparticles
ell-known Se hydrolysis09), e.g. tetrticles by a n
he assemblylace, either
onal monome (Lofgreen on between imprinting
al, thus cony recognize This producIn some c
m, it can be spheres and
general techn
ng imprintin
hese coatingin certain
Stöber procs and condraethyl orthonumber of r
y of a cross-r covalently
mers. The reet al., 2011the templatproducing
ntains the spthe imprin
t is the onecases, befor
used to ford nanosphenique of M
ng polymeri
g agents canconditions
ess can be densation oosilicate (TEesearchers (
-linked polyy or non-comoval of th
1) and shapete and monoion imprin
pecific chemnt and are te which is gre polymerm various s
eres for difMIP synthesi
zation (Hau
nnot totally s such as in
used (Ohmof a sol-gelEOS). This(Lu et al., 2
ymer matrixovalently o
he imprint me complemeomers withi
nted polymemical "memthus capablgenerally carization reashapes of Mfferent applis is summa
upt and Belm
prevent n acidic
mori and l silicon method
2002).
x around or semi-molecule entary to in is due ers. The
mory" in le of its alled the action is
MIPs like lications arized in
mont,
25
These recognition sites mimic the binding sites of biological receptor molecules such as antibodies and enzymes (Karim et al., 2005; Haupt and Belmont, 2008). The concept of molecular imprinting was first introduced in 1931 and has attracted wide interest from the beginning of the 1970s. Organic polymers with predetermined ligand selectivities were prepared independently in 1972 by Wulff and Sarhan (1972) and Klots and Takagishi (1972) (Park and Seo, 2002). Over decades of research, molecularly imprinted polymers (MIPs) have gained more and more acceptance with respect to their application as polymeric antibodies in analytical chemistry and separation science (Yu and Lai, 2010).
The use of MIP sorbents was firstly directed at extracting of organic chemicals from complex samples. Pichon and Chapuis-Hugon (2008) and Turiel and Martin-Esteban (2010) have reviewed the role of MIPs for selective extraction of various organic compounds. Recently, a lot of publications have also been reported on selective extraction of metal ions using ion imprinted polymers, IIPs. IIPs are similar to MIPs but they can recognize metal ions after imprinting and retain all the advantages of MIPs (Daniel et al., 2005). Roa et al. (2004; 2006) have reviewed the metal ion imprinted polymers as novel materials for selective recognition of inorganics. Metal ion-imprinted resins which could adsorb the target metal ion from weakly acidic solutions were first reported by Nishide et al. (1976). Ion imprinted polymers are currently being increasingly explored in many techniques because of many outstanding advantages such as predetermined selectivity in addition to being simple and convenient to prepare (Metilda et al., 2004). The selectivity of these IIPs comes from the specificity of the ligand on the coordination geometry of the ion-template complex, coordination number of the ions, charges on the ions and on their sizes (Zhan et al., 2011). The synthesis process of IIPs is easy, low-cost and the resulting polymers are stable, versatile and resistant to a wide range of pHs, solvents and temperatures (Scorrano et al., 2011).
2.8.1 Magnetic ion imprinted polymers
Ion-imprinted polymers cannot be separated rapidly and effectively after treatment from polluted water. If the ion-imprinted polymers encapsulating Fe3O4 as magnetic cores could be synthesized, the adsorbing polymers would be separated easily by use of external magnetic fields replacing the centrifugation and filtration process in a convenient and economical way (Zhan et al., 2011; Philippova et al., 2011; Ansell, 2008; Pan et al., 2011). Synthesis and properties of magnetic polymer beads constitute a new topic of research rapidly developing in the last 15 years. The magneto responsive polymeric beads benefit from the combination of features inherent to both their components: magnetic particles and polymers. Magnetic separation method is considered rapid and effective as compared to the traditional centrifugation and filtration techniques. Synthesis of magnetic polymer beads is generally performed in three different ways (Philippova et al., 2011):
Synthesis of magnetic particles inside polymer matrix.
Synthesis of the polymer in the presence of magnetic particles.
Preparation of from pre-formed polymer and magnetic particles.
26
2.8.2 Types of template/monomer interactions
A crucial step in the synthesis of imprinted polymers is the prearrangement stage. At this stage, a complex is formed between the template and a functional monomer or a number of functional monomers. This complex is formed through a pre-polymerization reaction. The quantity and quality of the imprinted polymer recognition sites relates directly to the function of the mechanisms and extent the functional monomer-template interactions present in the pre-polymerization mixture (Karim et al., 2005). Depending on the type of interaction between functional monomer(s) and template involved in the imprinting and binding processes, molecular imprinting can be classified into three different categories (Esfandyari-Manesh et al., 2011; Turiel and Martín-Esteban, 2010) namely, the covalent, the semicovalent or sacrificial spacer and the non-covalent approaches.
In the covalent approach, reversible covalent bonds are formed between the template and the functional monomer(s). However, this approach is not so popular since it is not easy to come up with an appropriate template-monomer complex in which covalent bond formation and cleavage are readily reversible under mild conditions. Non-covalent imprinting is based on the formation of relatively weak non-covalent interactions between selected monomer(s) and template molecule before polymerization. The monomer(s) and template are simply mixed together and allowed to interact via self assembly (Cai and Gupta, 2004). Non-covalent imprinting approach uses intermolecular forces such as hydrogen bonding, electrostatic, hydrophobic interactions, ion pairs, dipole-dipole interactions, and van der Waals forces to form template-functional monomer(s) species in solution (Mayes and Whitcombe, 2005). This technique of non-covalent approach is most widely used because of the easiness of removing the template from the MIP resulting in greater number of affinity sites (Jiang et al., 2007). The imprinting process in semi-covalent imprinting is approached in the same way as the covalent method (Tulla-Puche and Albericio, 2008). However, this approach differs from covalent imprinting in that the rebinding step is non-covalent in nature (Qi et al., 2010). When the template, covalently embedded in the polymer matrix is removed from the MIP, functional groups capable of interacting non-covalently with the template species are left behind in the MIP at the cleavage site (Tulla-Puche and Albericio, 2008).
2.8.3 Polymerization reagents
There are several factors and reagents that influence polymerization, and hence the subsequent performance of the imprinted polymers. These include the nature of monomers, crosslinkers, porogen, template, initiator used, method of initiation, polymerization time and the dielectric constant of the porogens employed. Some of these reagents are reviewed in the following section.
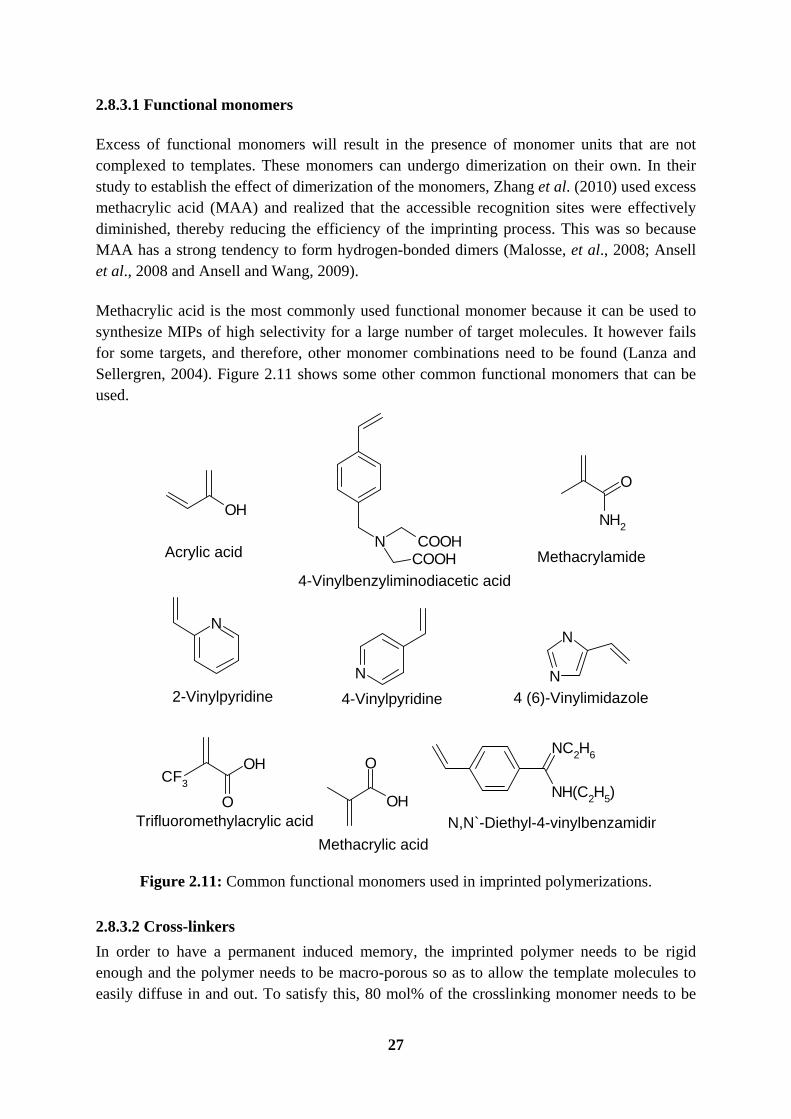
27
2.8.3.1 Functional monomers
Excess of functional monomers will result in the presence of monomer units that are not complexed to templates. These monomers can undergo dimerization on their own. In their study to establish the effect of dimerization of the monomers, Zhang et al. (2010) used excess methacrylic acid (MAA) and realized that the accessible recognition sites were effectively diminished, thereby reducing the efficiency of the imprinting process. This was so because MAA has a strong tendency to form hydrogen-bonded dimers (Malosse, et al., 2008; Ansell et al., 2008 and Ansell and Wang, 2009).
Methacrylic acid is the most commonly used functional monomer because it can be used to synthesize MIPs of high selectivity for a large number of target molecules. It however fails for some targets, and therefore, other monomer combinations need to be found (Lanza and Sellergren, 2004). Figure 2.11 shows some other common functional monomers that can be used.
OH
OH
O
NH2
O
N
N
N
N
CF3
O
OH
NH(C2H5)
NC2H6
N COOHCOOHAcrylic acid
Methacrylic acid
Methacrylamide
2-Vinylpyridine 4-Vinylpyridine 4 (6)-Vinylimidazole
Trifluoromethylacrylic acid
4-Vinylbenzyliminodiacetic acid
N,N`-Diethyl-4-vinylbenzamidin
Figure 2.11: Common functional monomers used in imprinted polymerizations.
2.8.3.2 Cross-linkers
In order to have a permanent induced memory, the imprinted polymer needs to be rigid enough and the polymer needs to be macro-porous so as to allow the template molecules to easily diffuse in and out. To satisfy this, 80 mol% of the crosslinking monomer needs to be
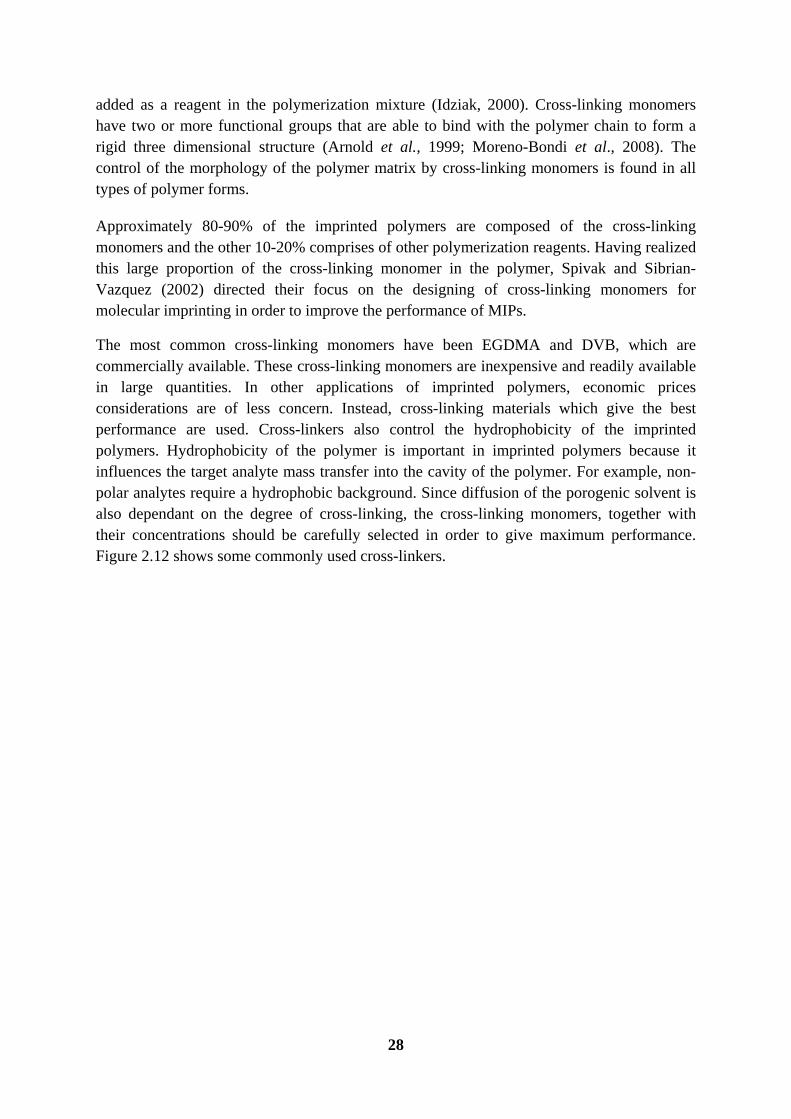
28
added as a reagent in the polymerization mixture (Idziak, 2000). Cross-linking monomers have two or more functional groups that are able to bind with the polymer chain to form a rigid three dimensional structure (Arnold et al., 1999; Moreno-Bondi et al., 2008). The control of the morphology of the polymer matrix by cross-linking monomers is found in all types of polymer forms.
Approximately 80-90% of the imprinted polymers are composed of the cross-linking monomers and the other 10-20% comprises of other polymerization reagents. Having realized this large proportion of the cross-linking monomer in the polymer, Spivak and Sibrian-Vazquez (2002) directed their focus on the designing of cross-linking monomers for molecular imprinting in order to improve the performance of MIPs.
The most common cross-linking monomers have been EGDMA and DVB, which are commercially available. These cross-linking monomers are inexpensive and readily available in large quantities. In other applications of imprinted polymers, economic prices considerations are of less concern. Instead, cross-linking materials which give the best performance are used. Cross-linkers also control the hydrophobicity of the imprinted polymers. Hydrophobicity of the polymer is important in imprinted polymers because it influences the target analyte mass transfer into the cavity of the polymer. For example, non-polar analytes require a hydrophobic background. Since diffusion of the porogenic solvent is also dependant on the degree of cross-linking, the cross-linking monomers, together with their concentrations should be carefully selected in order to give maximum performance. Figure 2.12 shows some commonly used cross-linkers.

29
NH
O
NH
O
O
OO
O
NH
ONH
O
NN
O
O
O
O
O
O
O
O
Divinylbenzene (DVB)
N,N`-Methylenebisacrylamide
Etthylene glycol dimethylacrylate (EDMA)
Trimethylolpropane trimethacrylate
1`4-Bis(2-methyl-1-oxo-2-propenyl)piperazine
N,N`-Phenylenebisacrylamide
Figure 2.12: Common cross-linkers used in imprinted polymerization.
2.8.3.3 Initiators
The initiation step within the polymerization reaction is a two part process in which the initiator breaks up into free radicals. These radicals will then attach themselves onto monomers, thereby forming monomeric radicals. The cleavage of the radicals is normally as a result of subjecting them to heat, electromagnetic radiation or chemical reaction, which will homolyse them to radicals with higher reactivity than the monomer radicals. However the reactivity must be low enough to allow the initiator radical to react with the monomer.
Azo and peroxide initiators with bond energies of 105-170 kJ mol-1 are particularly useful in this regard and are the mostly used initiators in the synthesis of molecular imprinted polymers (Sellergre, 2003). Azoinitiators (R-N=N-R) normally have tertiary R groups that are able to stabilize the incipient radicals (Moad and Solomon, 1995).
2.8.3.4 Porogen
Most imprinting techniques reported to date have employed relatively apolar and aprotic porogens such as toluene or chloroform (Yoshizako et al., 1998). These choices of porogens
30
are clearly useful for obtaining accurate formation of the assembly (Yoshizako et al., 1998). In their investigations, Gladis and Rao (2004) found out that the selectivity varies with the polarity of the porogen used during polymerization. Uranyl-IIPs prepared in 2-methoxyethanol porogen gave high retention capacity and selectivity over thorium as compared to other porogens which were methanol, tetrahydrofuran, acetic acid, dichloroethane, N, N-dimethyl formamide and toluene.
Haginaka et al. (2008) also investigated the effect and influence of various porogens on the performance of the MIPs on the uptake of d-chlorpheniramine. Of the four porogens used, the specific surface areas and pore volumes followed the order toluene > phenylacetonitrile > benzylacetonitrile > chloroform.
In general, a low polarity solvent is normally chosen to preserve the interaction between the functional monomer(s) and the template during the pre-polymerization reaction. This came as an observation that there is a high correlation between the dielectric constant and the hydrogen bond donor/acceptor ability of the porogen (Mirsky and Yatsimirsky, 2011), Table 2.5.

31
Table 2.5: Examples of porogens used in molecular imprinting preparation and their physical properties.
*Mirsky and Yatsimirsky, 2011
Name
Chemical structure
Dielectric constant (20oC)
H-Bonding
Toluene 2.4 Poor
Chloroform
ClCl
Cl 4.8 Poor
Acetone
O
21.0 Moderate
Acetonitrile N 36.6 Moderate
Dimethyl sulfoxide
S
O 47.2 Moderate
Methanol OH 33.0 Strong
Water HO
H 80.1 Strong
*Benzene 2.3 Poor
*DimethylformamideH N
O
36.7 Poor
*1-Propanol OH 20.1 Strong

32
2.8.4 Approaches in preparation of IIPs
2.8.4.1 Cross-linking of bifunctional reagents with linear chain polymers
In this approach, a linear polymer is formed with one ligand (with two functional groups) capable of forming metal-ligand complex. The ligand has functional groups that can help to polymerize at the same. A good example is 4-vinyl pyridine. Polymerization is performed in the presence of a metal ion in a suitable solvent. The ligand therefore acts both as monomer and cross linker forming a linear polymer. Nishide et al. (1976) cross linked poly (4-vinylpyridine) with 1, 4-dibromobutane in the presence of metal ions such as Cu(II), Zn(II), Co(II), Ni(II), Hg(II) and Cd(II) as templates. The linear polymer can also be made up of two different monomers. Both or one of the monomers can act as a ligand for the metal ion. Kabanov et al. (1979) is reported to have cross linked a copolymer of diethyl vinyl phosphonate and acrylic acid with N, N-methylene diacrylamide in the presence of metals. Figure 2.13 shows a typical linear chain polymer from bifunctional reagent.
Figure 2.13: An example of a linear polymer with 4-VP anchored in the polymer matrix.
2.8.4.2 Chemical immobilization
In this approach, a vinylated ligand is chemically immobilized in the polymer matrix Figure 2.14. The ligand is chemically anchored to the cross linked polymer. It is the common used method for preparing IIPs (Rao et al., 2006). A new IIP based on chemical immobilization has been reported for palladium ions by Rao et al. (2006). The IIP was synthesized by bulk polymerization using palladium iodide/thiocyanate-4-vinyl pyridinium ternary ion association complex in the presence of 2-hydroxyethymethacrylate and ethylene glycol diamine methacrylic acid (Daniel et al., 2006). Along the same lines, platinum IIP has been reported (Daniel et al., 2005). Many other IIPs based on this approach have been prepared for metal ions such as those of copper (Say et al., 2003), nickel (Ersoz et al., 2004), calcium and magnesium (Rosatzin et al., 1991) and zinc (Chen et al., 1997).

33
Figure 2.14: An example of the chemical immobilization approach in IIP preparation (Rao et al., 2006).
2.8.4.3 Surface imprinting
This approach involves emulsion polymerization using a functional monomer, an emulsion stabilizer, a polymer matrix forming co-monomer and print template. It is thus specific to emulsion polymerization. It is called surface imprinting because the microspheres are allowed first to form but before they are fully swollen, a metal ion is added to achieve complexation with ligand on the surface and then polymerization proceeds at room temperature. After polymerization, the template is removed which results in polymeric resins with functional groups on the surface giving recognition sites with preferential rebinding potential for the template ions. Surface imprinting is also called water-in-oil or oil-in-water emulsion IIPs. A number of IIPs have been reported for various metal ions such as Cu(II), Ni(II) and Co(II) (Tsukaghoshi et al., 1993; 1995; Yu et al., 1992; Okubo et al., 1987; Watanabe and Bunseki, 1977). It is however not as popular as chemical immobilization approach. Figure 2.15 shows an example of the preparation using this approach.
[PdL4]2-
NC
CH3
O
NC
H3C
O
+
+
Ternary ion association complex
Pd2+ + 4L- + 2VP
Where L = SCN-/I-
NC
CH3
O
NC
H3C
O
+
+
[PdL4]2-
NC
CH3
O
NC
H3C
O
+
+
Acid Leaching
Leached polymer Unleached polymer
HE
MA
, EG
DM
A
AIB
N, 60
oC
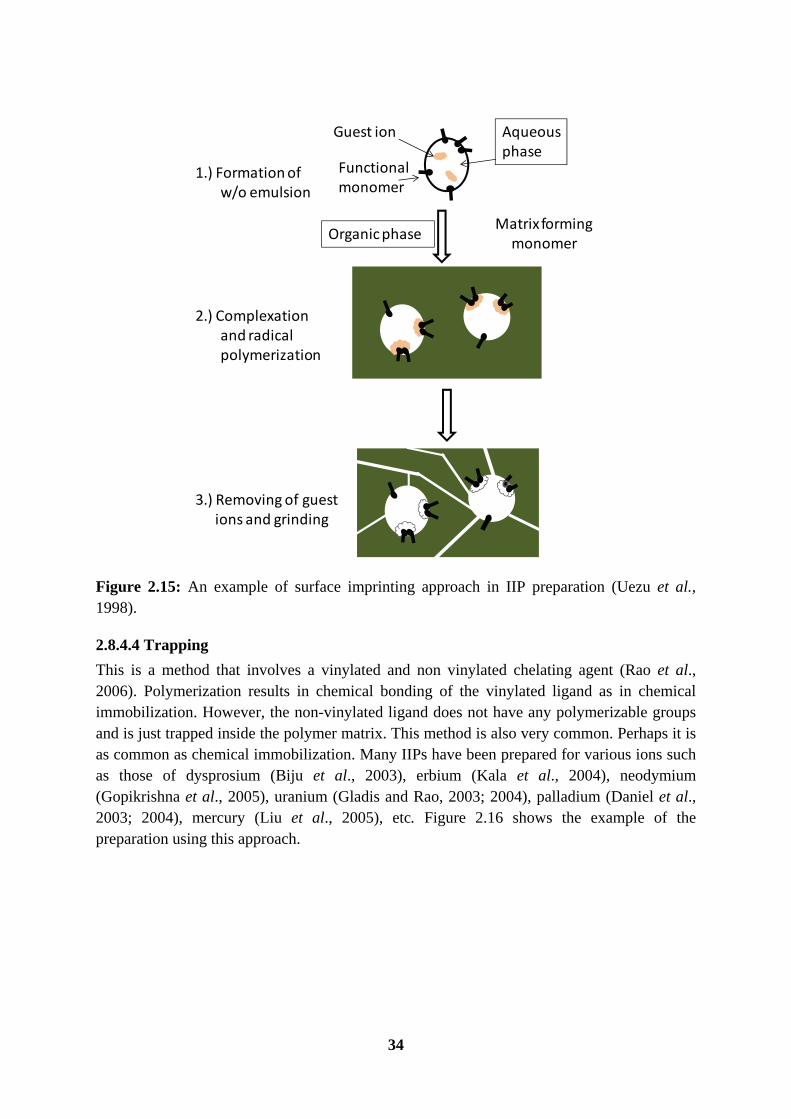
34
Figure 2.15: An example of surface imprinting approach in IIP preparation (Uezu et al., 1998).
2.8.4.4 Trapping
This is a method that involves a vinylated and non vinylated chelating agent (Rao et al., 2006). Polymerization results in chemical bonding of the vinylated ligand as in chemical immobilization. However, the non-vinylated ligand does not have any polymerizable groups and is just trapped inside the polymer matrix. This method is also very common. Perhaps it is as common as chemical immobilization. Many IIPs have been prepared for various ions such as those of dysprosium (Biju et al., 2003), erbium (Kala et al., 2004), neodymium (Gopikrishna et al., 2005), uranium (Gladis and Rao, 2003; 2004), palladium (Daniel et al., 2003; 2004), mercury (Liu et al., 2005), etc. Figure 2.16 shows the example of the preparation using this approach.
Functional monomer
Organic phase
Guest ion Aqueous phase
Matrix forming monomer
1.) Formation of w/o emulsion
2.) Complexationand radical polymerization
3.) Removing of guest ions and grinding

Fig
2.8.4.5
In metawhere iapproacrepresen
gure 2.16: A
Metal coor
al coordinatit is bound. ch has beenntation is sh
An example
rdination
tion, the teThese ligan
n reported hown in Fig
e of trappin
emplate ionnds at least for IIP for
gure 2.17.
35
ng approach
n is a centrat donate oner zinc ions
in IIP prep
al ion surroe pair of ele
(Fan and
aration (Rao
ounded by ectrons to thWang, 201
ao et al., 200
an array ohe central i10). The sc
06).
of ligand on. This
chematic

Figure polyme
The strligand cThis apCo2+ whpyridinegeometrinteracthave beorganicligands amino cetc. (Beligands,
2.8.5 Ty
The polBulk poconsum
2.17: A scers (Fan and
ength of thcharacteristi
pproach has here they ue as pre-pory and cantion concepeen a lot ofc and inorga
are presencarboxylic erto et al., 2, showing a
ypes of pol
lymerizationolymerizati
ming and l
cheme showd Wang, 201
he interactioics but it caalso been used dibenzo
olymerization strongly ipt as compaf investigatianic ligandsnt in most oacids, lipid
2011). UO22
a partial “sof
lymerizatio
n techniqueon has beelabour inte
wing the m10).
on depends an be as stroused by Maoyl methaneon reagents.interact witared to otheons and rep
s in solutionof naturallyds, (poly) ph2+ has also aft” behaviou
ons
es in IIPs arn the mostnsive. Oth
36
metal coord
on the oxiong as a covatsui et al. (e, cobalt(II). Uranyl ionth oxygen der actinide iports on thens (Guillaumy occurring henols, acida tendency our (Berto et
re similar fot commonlyher method
dination app
idation statevalent bond
(1996) in th) ion, styrenns have a udonating ligions (Fasihie complexatmont et al., organic co
dic (poly) sof reacting wt al., 2011).
or MIPs for y used methds such as
proach for
e of the med (Moreno-Bheir researchne, divinylbunique shapgands accoi et al., 201tion of uran2006). Oxy
mpounds, laccharides, with nitroge
organic andhod though
precipitati
zinc ion im
etal ion andBondi et alh on the rembenzene andpe and coorording to ha11). As sucnium with dygen donorlike carboxy, humic suben and sulfu
d ionic comh it is seen tion and e
mprinted
d on the ., 2008).
moval of d 4-vinyl rdination ard-hard ch, there different r organic ylic and
bstances, ur donor
mpounds. as time
emulsion
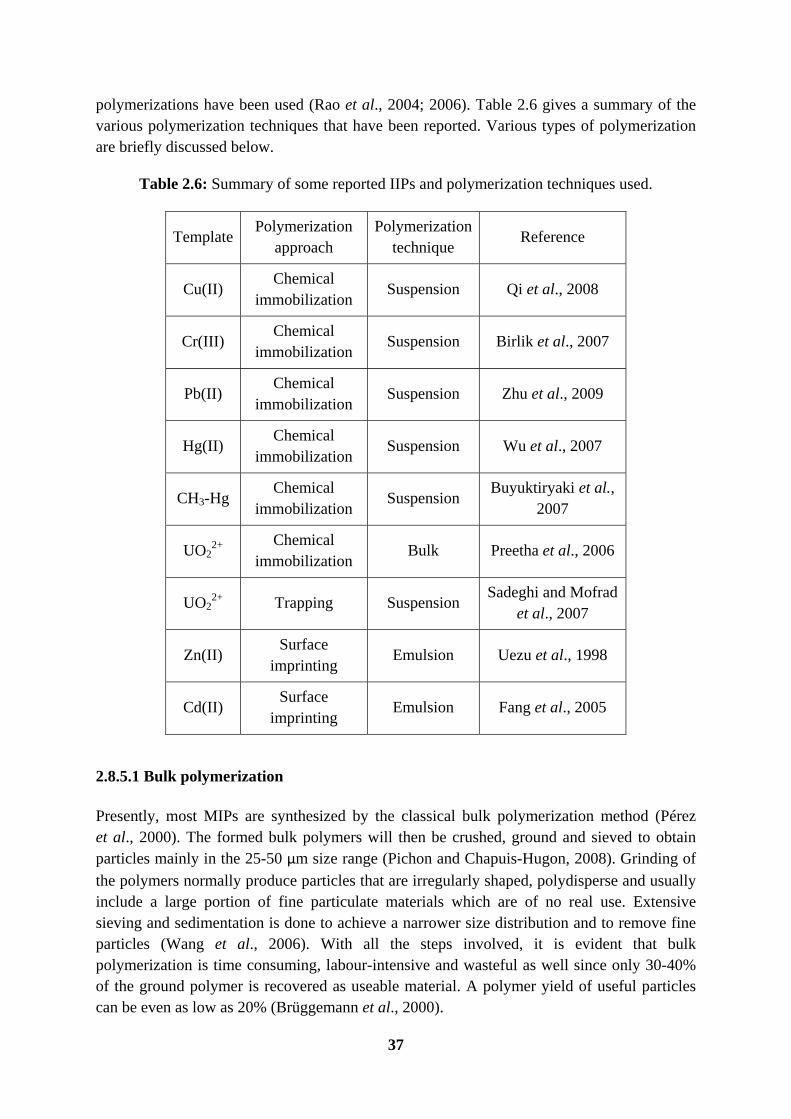
37
polymerizations have been used (Rao et al., 2004; 2006). Table 2.6 gives a summary of the various polymerization techniques that have been reported. Various types of polymerization are briefly discussed below.
Table 2.6: Summary of some reported IIPs and polymerization techniques used.
TemplatePolymerization
approach Polymerization
technique Reference
Cu(II) Chemical
immobilization Suspension Qi et al., 2008
Cr(III) Chemical
immobilization Suspension Birlik et al., 2007
Pb(II) Chemical
immobilization Suspension Zhu et al., 2009
Hg(II) Chemical
immobilization Suspension Wu et al., 2007
CH3-Hg Chemical
immobilization Suspension
Buyuktiryaki et al., 2007
UO22+
Chemical immobilization
Bulk Preetha et al., 2006
UO22+ Trapping Suspension
Sadeghi and Mofrad et al., 2007
Zn(II) Surface
imprinting Emulsion Uezu et al., 1998
Cd(II) Surface
imprinting Emulsion Fang et al., 2005
2.8.5.1 Bulk polymerization
Presently, most MIPs are synthesized by the classical bulk polymerization method (Pérez et al., 2000). The formed bulk polymers will then be crushed, ground and sieved to obtain particles mainly in the 25-50 μm size range (Pichon and Chapuis-Hugon, 2008). Grinding of
the polymers normally produce particles that are irregularly shaped, polydisperse and usually include a large portion of fine particulate materials which are of no real use. Extensive sieving and sedimentation is done to achieve a narrower size distribution and to remove fine particles (Wang et al., 2006). With all the steps involved, it is evident that bulk polymerization is time consuming, labour-intensive and wasteful as well since only 30-40% of the ground polymer is recovered as useable material. A polymer yield of useful particles can be even as low as 20% (Brüggemann et al., 2000).
38
2.8.5.2 Precipitation polymerization
The main difference between bulk polymerization and precipitation polymerization is in the amount of the volume of the porogenic solvent used (Mohajeri et al., 2011). The key point in precipitation polymerization is the use of a porogen in which the monomers are soluble in it but the resulting polymers are not (Biffis et al., 2012).
2.8.5.3 Suspension polymerization
Suspension polymerization is an important process in industrial polymerization practice (Polacco et al., 2000). In aqueous suspension polymerization systems, one or more monomers are dispersed into droplets. This is normally achieved by rapid stirring as well as addition of small amounts of water-soluble dispersing agents (Kalfas et al., 1993). The size of the monomer droplets can be controlled by adjusting the stirring speed. Oil soluble initiators are normally used and the polymers are produced inside the drops in the same manner bulk polymers are produced (Brooks, 2010).
The function of the stabilizers in suspension polymerization is to hinder the coalescence of the functional monomer(s) droplets and of the formed polymer particles whose tendency to agglomerate may become critical when the polymerization has advanced (Kalfas et al., 1993). Wang et al. (2006) used liquid paraffin as a dispersing agent. Water and liquid perfluorocarbon have generally been used as an aqueous continuous phase and an organic phase respectively (Wang et al., 2006).
The temperature that is normally used for suspension polymerizations is usually in the range of 40-90oC under atmospheric pressure or it can be elevated to around 160oC but at elevated pressure since operation must always be below the boiling point of the continuous phase (Kalfas et al., 1993).
2.8.5.4 Emulsion polymerization
Emulsion polymerization is a unique chemical process widely used to produce waterborne resins with various colloidal and physicochemical properties (Büttiker et al., 2011). Dvorakova et al. (2010) synthesized nanosized MIP particles by non-aqueous emulsion polymerization. Their motivation was that the standard emulsion polymerization for MIP synthesis of using water disrupts the functional monomer-template interactions. This is owing to the strong polarity and high hydrogen bonding capability of water. Ultimately, the efficiency of the imprinting process is greatly reduced. In Pickering emulsion, dispersed liquid droplets are stabilized by solid particles instead of conventional surfactants. The stabilizing particles are located at the interface between the two immiscible liquids, thereby preventing coalescence. She et al. (2011) used SiO2 as stabilizing particles.
2.8.6 Application of imprinting technology
Synthetic molecularly selective receptors such as MIPs and IIPs find a widespread application in many areas of science as depicted in Figure 2.18. A particularly promising

39
application of IIP is in solid phase extraction, SPE, where it is used to pre-concentrate and/or separate target species from other co-existing ions from complex matrices (Daniel et al., 2005). Not much has been reported for use of these materials for environmental remediation. MIPs as sorbents with better selectivities than those of traditional SPE adsorbents have recently been introduced as novel adsorbents for the extraction and clean-up of target compounds from various matrices such as wastewater or river water samples (Ersöz et al., 2004; She et al., 2010).
Figure 2.18: Scheme outlining the main applications envisaged for MIPs and IIPs, adapted from Sellergren and Allender, 2005.
In polymeric sorbents, the chelating functionality usually consists of some type of mono-, bi-, or polydentate moieties with donor groups contain atoms like nitrogen, oxygen and sulphur. A review of some recent synthetically-prepared polymeric sorbents obtained by immobilizing a particular type of chemical moiety on magnetic materials is presented in Tables 2.7. Some polymeric sorbents have high capacity. The higher capacity of the sorbent is very important in applications to real samples. This is because of possible competition for adsorption with other anions such as SO4
2- for Cr(VI) (Pakade et al., 2011). High capacity of the polymer allows the Cr(VI) to still being extracted in the presence of such competitors. The situation could be different for selectivity polymers such as ion imprinted polymers where even with low adsorption capacity is still capable of binding target metal ion (Pakade et al., 2011). However, even in such selective polymers, the cavities might still be large enough to allow co-extraction of other competitors like F- (Pakade et al., 2011).
The synthetic polymeric sorbents or modified natural sorbents in theory should have high selectivity and fast mass transfers kinetics because the final functional groups of the sorbents are tailored to bind target metal ions. However, in many reported publications, selectivity
TherapeuticsDrug deliveryOral absorbers Blood purification Therapeutic monitoring
Chemical sensors
Environmental analysis
Bioanalysis
Analytical separations (SPE)
Preparative separation Enantiomer separations Scavengers
Enzyme-like catalysts
Drug discovery Library screening tools Library screening tools

40
studies are often not done and this makes it difficult to compare performance on this aspect. The equilibration time seem to depend on the actual sorbent and not the type. However, on average, synthetic polymeric sorbents and modified natural sorbents seem to have low equilibration time (20-60 min), thus with fast mass transfer kinetics. Most sorbents, regardless of the type, work best in acidic pH of the sample. This is perhaps expected especially since Cr(VI) is negatively charged so a sorbent with positively charged functional groups is needed for this metal ion. Most of these functional groups are amine based and therefore work best in acidic media that favours the positive charge on the functional group (Zhao et al., 2010). Duranoglu et al. (2010) observed the reduction of Cr(VI) to Cr(III) during the adsorption of the former onto activated carbon derived from acrylonitrile-divinylbenzene copolymer at sample pH of 2. This might not influence the overall adsorption if the formed Cr(III) is also adsorbed by the sorbent. For sorbents that are selective for Cr(VI), this reduction process could lower the amount adsorbed.
Most application of the prepared sorbents is to remediate polluted wastewaters such as acid mine drainage water where the pH of such wastewaters is generally acidic (Pakade et al., 2011). Most reported polymers are therefore very suitable for application to such polluted wastewaters. The only disadvantage is that at such low pH, samples have also high concentration of Fe3+ and SO4
2- which are the major competitors for adsorption with uranium and Cr(VI), respectively (Pakade et al., 2011; 2012). Duranoglu et al. (2010) studied the various anionic competitors (Cl-, NO3
-, SO42-, PO4
3-) during the adsorption of Cr(VI) onto activated carbon derived from acrylonitrile-divinylbenzene copolymer at sample pH of 2. Factors that influence adsorption of these competitors include size, charge and hydration degree. In their study, Duranoglu et al. (2010) experienced a maximum fall in adsorption of Cr(VI) by the sorbent owing to PO4
3-. The reason for this is that PO43- has more negative
charges and is also polyatomic with similar molecular dimensions and consequently same hydration degree (Duranoglu et al., 2010). Cl- has similar charge to Cr(VI) but has higher charge density due to the small molecular dimensions. However it has higher hydration than HCrO4
-. Cl- had therefore the least influence on adsorption of Cr(VI) on the sorbent. In the pH range of 1-6, chromium ions coexist in forms of Cr2O7
2-, HCrO4-, Cr3O10
2- and Cr4O132- of
which HCrO4 - is the most dominant while at higher pHs, CrO4
2- and Cr2O7 2- are the most
dominant species (Garg et al., 2007).

41
Table 2.7: Polymeric sorbents for the removal of U(VI) and Cr(VI) from environmental samples.
Sorbent Target Binding capacity (mg g-1)
Equilibrium time (min)
Initial pH
Reference
Ion-imprinted chitosan composite magnetic microspheres
U(VI) 9 30 3.5 Wang et al., 2011
3-Aminopropyl triethoxysilane on silica coated Fe3O4
U(VI) 26 30 4.0 Sadeghi and
Aboobakri, 2012
Magnetic Fe3O4-SiO2 composite particles
U(VI) 52 16 6.0 Fan et al., 2012
Magnetic poly-(MA-DVB) graft dendrimer microspheres
Cr(VI) 232 12 3.0 Wang et al., 2012
Biofunctional magnetic beads
Cr(VI) 7 480 1.0 Li et al., 2008
Magnetic poly-(GMA-EGDMA)
Cr(VI) 138 120 2.0 Bayramoglu and
Arica, 2008 Ethylenediamine on Fe3O4 magnetic polymer
Cr(VI) 137
30 2.5 Zhao et al., 2010
Ethylenetriamine on Fe3O4 magnetic polymer
Cr(VI) 150
30 2.5 Zhao et al., 2010
Triethylenetetramine on Fe3O4 magnetic polymer
Cr(VI) 204
30 2.5 Zhao et al., 2009
Tetraethylenepentamine on Fe3O4 magnetic polymer
U(VI) 370 30 2.5 Zhao et al., 2010
Tetraethylenepentamine on Fe3O4 magnetic polymer
Cr(VI) - 60 2.0 Yao et al., 2012
N, N`-bis (3-methoxylsalicylidene)-1,2-phenylenediamine on Fe3O4
U(VI) 94 360 2.0 Zhang et al.,
2012
42
2.8.7 Concluding remarks
It is clear from a review of remediation technique that current available technologies have got limitations especially for treating acid mine drainage because of extreme pH, high amounts of other anions (e.g. sulphates) and cations (e.g. Iron). Efforts are being devoted to improving the traditional techniques or developing new techniques. One area that is currently exploited is the use of large columns packed with appropriate sorbent for trapping target chemicals in acid mine drainage water. The problem with is finding new materials that can withstand harsh conditions such as extreme pH of acid mine drainage and that is selective towards the target chemicals. Traditional silica columns cannot without extreme pH conditions and are not selective. Normal linear or branched polymers that are insoluble in water are not selective but can withstand extreme pH conditions. The so called smart polymers especially based on molecularly imprinted polymers are a potential alternative because they are selective and can withstand extreme pH conditions. In order to avoid parking these sorbents as in columns that has got problems of flow blockage, alternative set-ups are required. One possible approach is holding these sorbents using a strong magnet in a flow system. For this to be feasible, one need to prepare magnet ion imprinted polymers instead of normal ion imprinted polymers. The project thus focused on preparing magnetic ion imprinted polymers for Cr(VI) and U(VI). In literature, many polymers that been prepared that can trap Cr(VI) or U(VI). However, very little has been done on preparing magnetic ion imprinted polymers for these metal ions. Further, few literature that is available never carried out a detailed study on the selectivity of such materials or application to acid mine drainage. This is very important for feasibility studies of the potential application of these materials. The reusability of such materials is also not demonstrated especially under extreme conditions of acid mine drainage. During leaching of the template from the prepared polymer, the magnetite can also be leached out and no detailed documentation of this is available including best possible leaching solutions. This project tried to fill some of the gaps in magnetic ion imprinted polymer materials mentioned above.

43
Chapter Three: Research Aims
3.1 Aims
The aims of the project were as follows:
a) To prepare magnetic nano composite materials based on molecularly imprinted polymers specific for chromium(VI) and uranium(VI).
b) To characterize the prepared magnetic nano composite beads in order to understand their morphology and functional groups.
c) To study the binding, capacity and selectivity of the prepared magnetic nano composite beads for chromium(VI) and uranium(VI) in deionised water, acid mine drainage and wastewater treatment plants influent.
d) To discuss of the results with relevant stakeholders such as the mining industry.
e) To apply for provisional patent on the synthesis of magnetic nano composite beads for Cr(VI) and uranium(VI)
3.2 Key questions
1. Can the synthesized nano-magnetic IIPs be used in the remediation and recovery of U(VI) and Cr(VI) from wastewaters?
2. Is the adsorption of U(VI) and Cr(VI) onto synthesized nano-magnetic IIPs selective?
3.3 Significance of the research
Most methods of adsorption of metal ions in wastewaters are non-selective. In this study, effective and selective removal of U(VI) and Cr(VI) from acid mine drainage and wastewater using nano-magnetic IIPs was established. The preparation and use of magnetic materials for remediation of polluted wastewaters is a relatively new field. The South African mining sector has huge problems with polluted wastewaters. The potential use of selective sorbents based on magnetic materials is therefore of interest.
3.4 Hypothesis
Nanomagnetic-ion imprinted polymers can be used to selectively remove U(VI) and Cr(VI) from wastewaters and the polymers removed from the solutions by application of an external magnetic field. The performance of nano-magnetic IIPs is better than that of nano-magnetic NIPs in the uptake of uranium and chromium from wastewaters.

44
3.5 Novelty
Although the technology of smart polymers based on molecularly imprinted polymers is now well known, preparation of magnetic ion imprinted polymers for U(VI) and Cr(VI) is still very scarce (Wang et al., 2011).
This study is therefore one of the first ones that has made attempt to prepare smart polymers for U(VI) and Cr(VI) that are magnetic. Further, this study carried out a detailed study on the selectivity of the prepared magnetic ion imprinted polymer which has rarely been done in previous studies (Li et al., 2008; Bayramoglu and Arica, 2008 Zhao et al., 2010; Wang et al., 2011; Fan et al., 2012).
3.6 Scope and limitations
The project attempted to prepare magnetic selective polymers for chromium(VI) and uranium using molecular imprinting technology in order to try and fulfil the project aims. The synthesis of the magnetic ion imprinted polymers was made by modifying some of the existing procedures from literature. The modified procedures are therefore new in the sense that there is very little literature on the magnetic ion imprinted polymers for the studied metal ion complexes. Magnetite was prepared, coated with anchoring ligands and then polymerization for the formation of ion imprinted polymers was performed in the presence of coated magnetic nano particles. The final magnetic ion imprinted polymers were characterised and optimised for the binding of these metal ions in deionised water and real samples. Objectives a, b and c were thus fulfilled. The study even went further to study the binding kinetics of the prepared magnetic ion imprinted polymers.

45
Chapter Four: Materials and Methods
4.1 Chemicals, stock solutions and equipment
4.1.1 Chemicals
For the synthesis of magnetite, FeCl2∙4H2O and FeCl3∙6H2O, of analytical grades supplied by Sigma Aldrich (Steinheim, Germany) were coprecipitated in the presence of NH4OH from Sigma Aldrich (Steinheim, Germany). Methanol, from Sigma Aldrich (Steinheim, Germany), was used for washing magnetite.
For the synthesis of the magnetic polymers, the following chemicals were used: ethylene glycol dimethacrylate (EDGMA), methacrylic acid (MAA), 1,1`-azobis(cyclohexanecarbonitrile), salicylaldoxime (SALO), 4-vinylpyridine (4-VP), 2-methoxyethanol as well as surfactants for coating magnetite, γ-methacryloxypropyltrimethoxysilane (γ-MPS) and oleic acid (OA) all purchased from Sigma Aldrich (Steinheim, Germany). The imprint, uranyl nitrate (UO2(NO3)2·6H2O) was bought from BDH Chemical Ltd, (Poole, England). All other chemicals used were of the highest analytical grades and were from Sigma Aldrich (Steinheim, Germany). The leachants used for uranyl removal were HCl and NaHCO3 all from Sigma Aldrich (Steinheim, Germany).
Deionized water was prepared from Millipore instrument (Massachusetts, USA) and was used in preparation of all aqueous solutions. Analytical grade solutions from Merck (Darmstadt, Germany) were used to prepare different buffers systems for pH optimization and adjustments: for pH 1 and 2, HCl/KCl was used, Na2HPO4/citric acid was used for pH 3, CH3COOH/CH3COONa was used for ph 4, 5 and 6, borax/H3BO3 was used for pH 7, 8 and 9.
4.1.2 Stock solutions
A uranium(VI) stock solution was prepared by dissolving an appropriate amount of uranyl nitrate hexahydrate in one litre of deionized water with 0.05% (v;v) HNO3. Stock solutions of 1000 mg L-1 (for selectivity of Cr(VI)-magnetic ion imprinted polymers) were prepared by dissolving the following appropriate amounts of dried salts in 1 L volumetric flasks: NaF, NaNO3, KH2PO4, Na2SO4 and Na2Cr2O7∙2H2O. All salts were purchased from Sigma
Aldrich (Steinheim, German). A 1000 mg L-1 stock solution of chromium(VI) was prepared by dissolving an appropriate amount of sodium dichromate, Na2Cr2O7 (analytical reagent grade) in deionized water. Working solutions were prepared daily from the stock solution through serial dilutions. The stock solution was stored at 4°C when not in use.

46
4.1.3 Equipment
All pH measurements were performed on a 766 Calimatic pH meter equipped with a Shott N61 pH electrode from Knick (Berlin, Germany). In batch adsorption studies, a Laser Photo/Contact Tachometer DT-1236L from Lutron (Taipei, Taiwan) was used to measure the rotational speed of the magnetic stirrer. A Fritsch pulveriser (Idar-Oberstein, Germany) was used to crush the synthesized bulk polymers for homogenization.
4.2 Analytical and characterization equipment
All instruments used in this study for quantification and determination of analytes (U(VI) and Cr(VI)) in solution as well as characterization of U(VI) and Cr(VI) magnetic ion imprinted polymers and other materials are briefly described below.
4.2.1 Ultraviolet visible (UV-vis) spectroscopy)
A Varian Cary 50 Conc, UV-Vis spectrophotometer with a Varian Cary 1E double beam spectrophotometer (Palo Alto, CA, USA) scanning from 200 to 750 nm was used for obtaining UV-Vis absorption spectra.
4.2.2 Raman spectroscopy
Raman spectra were acquired using a Jobin-Yvon T64000 Raman spectrograph from Wirsam Scientific (Pty) Ltd (Johannesburg, South Africa) operated in single spectrograph mode and the 514.5 nm of an argon ion laser as the excitation source. An Olympus BX40 microscope attachment was used to focus the incoming light on the sample and the backscattered light was dispersed via a 600 lines mm-1 grating onto a liquid nitrogen cooled CCD detector for acquisition via LabSpec v 4.18 software.
4.2.3 Transmission electron microscopy (TEM)
A FEI TECNAI SPIRIT (TEM-EDS) electron microscope (Eindhoven, Netherlands) was used. Approximately 0.2 g of the powdered samples where put in eppendorf tubes where 1 mL of methanol was added. The mixtures were then sonicated for 15 minutes. After this, an aliquot was drawn and applied to a Cu grid coated with carbon film. For the excess liquid to dry, the grids were placed on the Whatman filter paper for about 5 minutes. These were then loaded into the TEM microsope where they were viewed under an electron microscope.
4.2.4 Size distribution
Because of their ultra small size, the actual diameter of each particle cannot be measured precisely, hence the use of particle size distribution. To achieve this, the size diameters for both the uncoated magnetite and the γ-MPS coated magnetite were done on the respective TEM micrographs by use of the image j, a public domain image processing program.
47
4.2.5 Powder X-ray diffraction (PXRD) analysis
A crystallographic study was performed on a synthesized iron oxide powder by a D2 Bruker Powdered X-ray Diffractometer (Karlsruhe, German), using Cu Kα radiation (= 1.5418 Å). The positions and the intensities of the peaks are used for identifying the underlying structure (or phase) of the material. The particle sizes of the magnetic nanoparticles were deduced from PXRD using Scherrer equation which can be written as in equation 4.1:
Where D is the mean size of the ordered (crystalline) domain, which may be smaller or
equal to the grain size, k is shape factor, λ is the wavelength of the radiation corresponding to
the Cu Kα peak, β is the full-width at half maximum (FWHM) and θ is the Bragg`s angle.
The factor 57.3 is used for conversion of β from degree to radians. The Scherrer equation is limited to nano-scale particles. It is not applicable to grains larger than about 0.1 μm.
4.2.6 Brunauer, Emmett and Teller (BET) analysis
Surface area, pore volume and pore size were determined for both the uranyl-imprinted magnetic polymers and the control polymers. The effect of 1 mol dm-3 HCl and 1 mol dm-3 NaHCO3 leachants on surface area formation was also investigated. An amount of 0.2 g of each of the above samples was degassed in N2 at 150oC for 4 hours prior to analysis with the Micromeritics Flow Prep 060 instrument (Aachen, Germany). After the degassing stage, surface area, pore volume and pore size were determined at -196oC. This was achieved through N2 adsorption and desorption using the Micromeritics Tristar surface area and porosity analyzer. BET is the commonly used gas sorption model which extends the model of gas sorption to multi-layer. It is normally solved graphically by plotting 1/[v(p/po)-1] versus p/po. The BET specific surface areas of the polymeric adsorbents are calculated from the corresponding isothermal adsorption of nitrogen within the partial pressure range of 5% to 35% (p/po) by use of the BET equation 4.2:
Where p is adsorbate pressure, po is adsorbate vapour pressure and v is adsorbed volume vm is monomolecular layer volume and c is a quantity related to heats of adsorption and liquefaction. These two constants can be calculated from the slope, s, and the intercept, i, through use of equations 4.3 and 4.4.
D = 57.3kλβCosθ (4.1)
(4.2)

48
4.2.7 Fourier-transformed infra red (FTIR)
Fourier-transformed infra red spectra were recorded in the frequency range of 400-4000 cm-1 using a Bruker FTIR spectrometer, Model Tensor 27 (Ettlingen, Germany) and the spectra were recorded in the solid state. This technique is useful in the identification of functional groups in a sample.
4.2.8 Thermo-gravimetric analysis (TGA)
Thermogavimetric analysis for the prepared materials was performed with Perkin Elmer Pyris 1 TGA Thermogavimetric Analyser (Massachusetts, USA) using nitrogen as the purge gas, at a flow rate of 20 mL min-1 and a heating rate of 5oC per minute from 0-1000oC. This technique was used to investigate changes in a sample weight as the heating temperature was changed. These changes are usually associated with weight loss resulting from dehydration or decomposition of the sample as the temperature increases. About 0.05 g of the sample was used for the thermal gravimetric analysis.
4.2.9 Carbon, hydrogen, nitrogen and sulphur (CHNS) analysis
A LECO-932 CHNS analyser from LECO Corporation (Michigan, USA) was used to determine the amount of carbon, hydrogen and nitrogen in the organic moiety which coated the magnetite. The products of combustion in CHNS analysis are CO2, H2O, N2 and SOx, though depends on composition. High temperature combustion was used as the means of removing the elements from material. Samples (2 mg) were weighed into tin boats, compressed and encapsulated into capsules and taken to sample loading and then dropped into the furnace. The sample was combusted in the heated oxygen rich environment. Programmable control of the direct oxygen jet injection during high-temperature combustion guaranteed complete combustion. The gaseous combustion products were purified, separated into their components by special adsorption traps, and sequentially analyzed with universally used thermoconductivity detector (TCD). Calibration was performed with corn gluten for this CHNS test.
(4.3)
(4.4)
49
4.2.10 Diffuse reflectance spectroscopy (DRS)
Varian Cary 500 UV-Vis-NIR spectrophotometer using a diffuse reflectance attachment from SMM Instruments (Johannesburg, South Africa) was used in the scanning range of 200 to 1000 cm-1. In DRS, different types of iron oxides exhibit different colours. These differences are the basis for distinction to some extent among Fe oxides. The analysis of corresponding DRS can be used to identify and characterize different types of iron oxides.
4.2.11 Atomic force microscopy (AFM)
Atomic force microscopy was applied to study pore formation in the polymer from the study of the images of the samples before and after leaching of the uranyl ions. A Veeco/Digital Instruments Dimension 3100 Scanning Probe Microscope (Santa Barbara, USA) was used in AFM-tapping mode.
4.2.12 Ion chromatography (IC) analysis
Metrohm 762 Compact Ion Chromatograph (Leonberg, Germany) with a Metrosep A Supp 5 (6.1006.520) 150 × 4.0 mm analytical column was used for the determination of fluoride, nitrate, sulphate and phosphate anions. The eluent solution was of the composition of 1.0 mM NaHCO3 and 3.2 mM Na2CO3. The eluent was pumped at 0.7 mL min-1. The suppressor solution was 50 mM H2SO4 and deionized. All the solutions, including eluents used were degassed by ultrasonication and filtered through a 0.45 μm filter paper before being used in the IC.
4.2.13 Inductively coupled plasma-optical emission spectrometer (ICP-OES)
ICP-OES from Spectro Genesis End-on-plasma Spectro Analytical Instruments (Pty) Ltd, (Johannesburg, South Africa), was used for the determination of the metals’ concentration in multi-elemental solutions with parameters shown in Table 4.1.

4.2.14 A
AAS mcoated uraniumschemeFigure 4
Figur
The graconsist namelyramping
Atomic abs
measurementHGA-76 g
m wavelenge diagram fo4.1.
re 4.1: Sche
aphite furnaof many st, drying, ag and holdin
Table 4
Param
RF P
Coola
Auxi
Nebu
Samp
Samp
RepliPlasmSprayNebuProce
sorption sp
ts were madraphite furn
gth with a sfor the grap
ematic diag
ace is electteps. In thisshing, atomng times are
4.1: Operati
meter
ower
ant Gas Flo
liary Gas Fl
ulizer Gas fl
ple Pump Fl
ple Aspirati
icates ma Torch y Chamberulizer essing Mod
ectroscopy
de on a PGnace. A uraspectral wid
phite furnac
ram of grap
trically heats work, the mization ande shown gra
50
ing conditio
ow
low
low
low
on Rate
de
y (AAS)
G-990 AASanium hollodth of 0.2
ce atomic ab
phite furnac
ted and undheating pro
d cleaning.aphically in
ons of the IC
Setting
1400 W
14.00 L
1.00 L m
1.00 L m
2.00 L m
2.00 L m
3 QuartzSingle pCrossfloArea
model (Leiow cathodenm. Argonbsorption sp
e atomic ab
dergoes a hogramme ap. The tempFigure 4.2.
CP-OES.
min-1
min-1
min-1
min-1
min-1
pass ow
icestershire,e lamp was n was used pectrophoto
bsorption sp
heating progpplied conseratures co.
, UK) pyros used at 35
as a purgeometer is sh
pectrophotom
gramme whsisted of fouorresponding
lytically 58.5 nm e gas. A hown in
meter.
hich can ur steps, g to the

51
Figure 4.2: The heating programme for uranium in the graphite furnace.
4.3 Synthesis of the magnetic IIPs and NIPs
4.3.1 Synthesis of the magnetite
Synthesis via the co-precipitation of ferrous and ferric salts in an alkaline medium (Thorek et al., 2006) was used. A volume of 180 mL of an aqueous solution containing 11.2 mmol Fe3+ and 5.6 mmol Fe2+ was heated to 50oC. After heating, 12.5 mL of ammonia was added under vigorous stirring. After 30 min, the reaction was heated and kept at 90oC for 30 min again. An inert atmosphere of N2 was used for the whole experiment. After completion of the reaction, the black precipitate was collected by an external magnetic field, washed with water and ethanol and dried under vacuum.
4.3.1.1 Coating of magnetite with γ-MPS
In this study γ-methacryloxypropyltrimethoxysilane (γ-MPS) was used as a coating agent. This was chosen because of its physio-chemical properties. γ-MPS have the hydrophobic olefinic end which ushers a platform for polymerization.
Kan et al. (2010) approach was used to modify the magnetic nanoparticles with a double bond. In this method, 4 mL γ -MPS was added dropwise into the mixture of solvents of ethanol and water (1:1, v/v) containing dispersed Fe3O4 nanoparticles and the reaction was carried out for 12 h at 40oC under N2 gas. Then the product was separated and washed by ethanol for several times and dried under vacuum. In these conditions, the methoxyl groups are firstly hydrolyzed to produce the hydrophilic silanol groups which directly covalently
0
500
1000
1500
2000
2500
3000
0 10 20 30 40 50
Tem
pera
ture
(o C)
Time (s)
Drying Ashing
Atomization Cleaning
52
bond with the hydroxyl groups around the magnetite. On the other end of the γ-MPS, there is a hydrophobic olefinic group which ushers a platform for polymerization with the monomers during polymer preparation stage.
4.3.1.2 Coating of magnetite with oleic acid
An amount of 1.0 g Fe3O4 particles was dispersed in 200 mL ethanol under ultrasonication, and then 5 mL oleic acid was added dropwisely into the above mixture under stirring at 80oC for 1 h. The oleic acid coated Fe3O4 particles were isolated by application of an external magnetic field and washed with water and ethanol to remove redundant oleic acid (Zhao et al., 2010).
4.3.1.3 Bulk polymerization
The polymers were synthesized according to the method of Singh and Mishra (2009) with some modifications. Ion-imprinted polymers were prepared by thermal polymerization. The imprint ion (0.270 g) was complexed with 2 mM salicylaldoxime (SALO) and 2 mM 4-vinylpyridine (4-VP) in 10 mL of 2-methoxyethanol in which 2 g of the functionalized magnetite was suspended. The above ternary complex solutions were then mixed with 12 mmol of methacrylic acid (MAA), 36 mmol of ethylene glycol dimethacrylate (EGDMA) and 50 mg of 1,1`-azobis(cyclohexanecarbonitrile). The polymerization mixture was cooled to 0oC and purged with N2 for 10 min, sealed and thermally polymerized in an oil bath at 80oC while stirring for 3 h. The bulk polymers were dried at 70oC to remove the solvent (porogen). The polymers were then washed with ethanol, then ethanol and water mixture with increasing amounts of water until only water was used, Table 4.2. Finally, the resulting polymer was then ground and sieved to obtain the ion-imprinted polymers in the size range of 27 and 53 μm. Magnetic NIPs were prepared likewise except that the imprint ion was not
included.
Table 4.2: Volume composition of the polymer washing solution.
Wash number 1 2 3 4 5
Ethanol (mL) 10 6 5 4 0
Water (mL) 0 4 5 6 10
4.3.1.4 Precipitation polymerization
In precipitation polymerization, the same protocol for the bulk polymerization was followed except that the volume of the porogenic solvent, 2-methoxyethanol, was increased ten-fold to 100 mL.
4.3.1.5 Leaching of γ-MPS and OA based polymers
An amount of 3 g of the magnetic polymer (from bulk and precipitate) was transferred to a 250 mL volumetric flask upon which a 100 mL of 2 mol dm-3 HCl was added. The mixture

53
was stirred gently for 6 hours, after which filtration was done under vacuum. The filtrate was retained for metals analysis. A freshly prepared HCl leachant, with the same concentration and volume as above, was added to the magnetic polymer. This procedure was repeated for three more times.
A second leachant, 1 mol dm-3 NaHCO3 was used in the same way as HCl leachant. Leaching of the oleic acid functionalized magnetite was done in the same way as γ-MPS based polymers but only 1 mol dm-3 NaHCO3 was used. The magnetic NIPs were subjected to the same treatment.
4.3.2 Optimization of parameters for U(VI) uptake
Sample pH, magnetic polymer amount, contact time and initial U(VI) concentration were optimized. Optimization of was achieved by varying one parameter while keeping the others constant. All experiments were carried out in triplicates. The influence of these parameters was evaluated by calculating the extraction efficiency or recovery as shown in equation 4.5: (%) = ( ) ×
Where: Co (mg L-1) is the initial concentration and Ce (mg L-1) represents the final equilibrium concentration after adsorption.
The adsorption capacity, q (mg g-1), is defined as mass of substrate bound on a gram of adsorbent. Equation 4.6 shows the mathematical equation for the calculation of the adsorption capacity in which Co (mg L-1) and Ce (mg L-1) are as described for in equation 4.5 and V (L) is the volume of the sample solution and the mass of the adsorbent is given as W (g) (Zeinali et al., 2010; Kumar and Kirthika, 2009; Maarof and Hameed, 2004).
4.3.2.1 Effect of sample pH
In this study, 2 mg L-1 of uranium solutions were prepared from a 1000 mg L-1 stock solution in 8 volumetric flasks. In order to investigate the effect of sample pH, the uranium solutions were adjusted between pH 2-9 and 25 mL of these were then transferred to 30 mL vials where 20 mg of an adsorbent (magnetic IIP and NIP) were added. After this, the uranyl-IIP mixture was allowed to equilibrate with stirring at 1500 rpm for 45 minutes. The loaded magnetic-IIPs were then separated from the mixture by application of an external magnetic field and the filtrate analyzed for uranium content. All adsorption experiments were carried out at room temperature.
q = (C0 − Ce)VW
(4.5)
(4.6)
54
4.3.2.2 Effect of the amount of magnetic polymer
Adsorption was carried out in a series of 30 mL vials at room temperature. Each vial was filled with 25 mL of an initial concentration of 2 mg L-1 solution of uranium. An optimized sample pH was used. The added magnetic polymer mass was varied between 10 to 100 mg. After stirring the solution for 45 minutes at 1500 rpm, separation of the magnetic polymers was achieved by use of a magnet. The solution was then analysed for uranium content from which the amount adsorbed on the polymer was calculated.
4.3.2.3 Effect of contact time
In order to establish the optimum contact time and adsorption kinetic behaviour of the magnetic polymers, adsorption of uranium onto the magnetic polymers was investigated at various time intervals (10-90 min).
The initial concentration of uranium was kept constant at 2 mg L-1. The optimized amount of the polymer was added into 25 mL uranium solution. This mixture was then mixed at room temperature under a stirring speed of 1500 rpm. After adsorption, the polymers were separated from aqueous phase by use of an external magnetic field and the supernatant analyzed for uranium. Mass balance was then used to calculate the amount of uranium adsorbed onto the polymer. All adsorption experiments were carried out at room temperature.
4.3.2.4 Effect of initial uranium concentration
Adsorption was carried out in a series of 30 mL vials at room temperature. Each vial was filled with 25 mL of uranium solution of five varied initial concentrations ranging from 0.5-10 mg L-1. The pH and amount of the magnetic polymer used were those optimized. After stirring the solution for the optimum period of time at 1500 rpm, separation of the magnetic polymers was achieved by use of a magnet. The solution was then analysed for uranium content from which the amount adsorbed on the magnetic polymers was calculated.
4.3.2.5 Selectivity of the magnetic polymers
Stock solutions (1000 mg L-1) were prepared by weighing out an appropriate amount of the salts, namely: U(NO3)2·6H2O, Ca(NO3)2·6H2O, Mg(NO3)2·6H2O, Pb(NO3)2, Ni(NO3)2·6H2O and Fe(NO3)3·9H2O by dissolving them in de-ionized water. The pH adjustments were conducted using an appropriate buffer system that gave maximum adsorption capacity in section above. The working standard solution was obtained by serial dilution of the stock solution. For selectivity studies, a binary metal solution was made from 2 mg L-1 of U(VI) and of another metal ion. Aliquots of 25 mL of these binary metal solutions were transferred to 30 mL vials where the optimized weight (50 mg) of the magnetic IIP was added. A batch adsorption experiment was then performed at room temperature for a prescribed time of 45 minutes at 1500 rpm. Separation of the polymers was then carried by application of a magnetic field. The metals remaining in solution were then quantified with ICP-OES but uranium was quantified with GFAAS. The respective magnetic NIP was used for the control experiment.

55
The distribution coefficients, Kd, of UO22+, Mg2+, Fe3+, Ni2+ and Pb2+ were calculated using
equation 4.7: Kd = (Co − Ce)VCo W
Where: Kd is the distribution coefficient (L g-1) and the other variables are as described for equations 4.5 and 4.6. Equation 4.8 was used to calculate the selectivity coefficients for the binding of a uranyl ion in the presence of other competing ion in a binary system: K =Kd(UO22+)Kd(B)
Where: K represents the selectivity coefficient and B represents U(VI) competing ions mentioned above. The value of K gives an indication as to how selective the polymer is for U(VI) ions in the presence of other competing species in solution. If K = 1, it means competing ions and uranyl ions are bound equally. A large value of K is therefore preferred indicating that the magnetic polymer favours uranyl ions.
Another important parameter is the relative selectivity coefficient, K’, which represents the enhanced effect of imprinting on selectivity and adsorption affinity for the template onto the polymer. The K’ of the magnetic-IIP against the magnetic-NIP was calculated using equation 4.9: K′ = KIIPKNIP
Where: KIIP and KNIP are the selectivity coefficients of the IIP and NIP, respectively.
4.3.2.6 Reusability of the magnetic uranyl IIPs
In order to test the stability and reusability of the magnetic imprinted polymers, a 25 mL uranyl solution with an initial concentration of 2 mg L-1 was exposed to 50 mg of the magnetic polymers. After 45 min of extraction and equilibration, the aqueous solution was filtered and the magnetic polymer particles were transferred to another sample vial. After filtering the mixture, the filtrate was analyzed for U(VI) content while the magnetic polymer residues were regenerated by leaching out uranium with 25 mL of 1 M HCl solution at a stirring rate of 1500 rpm at room temperature for 45 min. These magnetic polymers were then used for the next rebinding studies.
4.3.3 Kinetic modelling
Kinetic modelling is important in order to gain insight into the mechanism and rate controlling steps affecting the kinetics of adsorption.
(4.7)
(4.9)
(4.8)
56
Adsorption data can be modelled using the Elovich equation, Intraparticle diffusion Weber-Morris kinetic model, the film diffusion model according to the Reichenberg equation, the film diffusion model according to Vermeulen’s approximation, pseudo-first order or pseudo-second order models. The last two are the most widely used models for the adsorption of a solute from aqueous solution and were the ones used in this research.
4.3.3.1 Pseudo-first-order kinetic model
The pseudo-first-order kinetic model is given by: dqtdt = k1(qe − qt )
Where: qt (mg g-1) is the amount of adsorbed metal ion on the adsorbent at time t (min), qe (mg g-1) the amount adsorbed at equilibrium and k1 (min-1) is the rate constant of first-order adsorption.
After integration between boundary conditions t = 0 to t and qt = 0 to qe, equation 4.10 becomes:
log(qe −qt) = log qe − k12.303 t
Where: qe and k1 can be determined from the intercept and slope of the plot, respectively. A plot of log (qe – qt) against t gives a straight line and the constants qe and k1 are obtained from the intercept and gradient respectively.
4.3.3.2 Pseudo-second-order kinetic model
Pseudo-second order mode is applied when the applicability of the first-order kinetics becomes unattainable. It is based on the sorption capacity of the solid phase. The equation of pseudo second-order is given in the equation below. dqtdt = k1(qe − qt)2
Where: k2 is the rate constant of second-order model. For boundary conditions t = 0 to t and qt = 0 to qe, equation 4.12 becomes: tqt = 1k2qe2 + 1qe t
The plot of versus t should give a straight line if pseudo-second-order kinetic model is
applicable and qe and k2 can be determined from the slope and intercept of the plot, respectively.
(4.11)
(4.10)
(4.13)
(4.12)

57
4.3.4 Adsorption isotherm models
Equilibrium relationships of how adsorbates interact with the adsorbent materials are generally described by adsorption isotherms. These adsorption isotherms are important for optimization of the adsorption mechanism pathways, expression of the surface properties and capacities of adsorbents (El-Khaiary, 2008; Thompson, 2001). In literature, there are many adsorption isotherms which include models like Langmuir, Freundlich, Dubinin-Radushkevich, Temkin and BET but the first two still remain the two most commonly used adsorption isotherm equations (Kinniburgh, 1986). The applicability of the isotherm equations is judged by the value of their correlation coefficients, R2 and is also used in order to understand the extent and degree of favourability of adsorption (Treybal, 1981).
4.3.4.1 Freundlich isotherm model
The Freundlich model is an empirical equation which assumes that the adsorbent has a heterogeneous surface composed of adsorption sites with different adsorption potentials. The model equation is as follows:
qe = KfCe1n
Where: qe (mg g-1) is amount adsorbed at equilibrium and Ce (mg L-1) is the equilibrium concentration. Kf (L g-1) and n are equilibrium constants and Freundlich coefficients which are temperature dependent and are related to adsorption capacity and intensity, respectively. The linearized form of the Freundlich sorption isotherm is:
lnqe = lnKf + 1n lnCe
A plot of lnqe versus lnCe gives a linear graph where coefficients Kf and n can be
calculated from the intercept and slope respectively; is an indicator of adsorption
effectiveness. The Freundlich coefficient, n, should have values in the range of 0 < n < 1 for a favourable adsorption reaction.
4.3.4.2 Langmuir isotherm model
The Langmuir equation is based on a kinetic approach and assumes a uniform surface, a single layer of adsorbed material and constant temperature. The model is useful when there is a strong specific interaction between the surface and the adsorbate so that a single adsorbed layer forms and no multi-layer adsorption occurs. It also assumes that the surface is homogeneous. The Langmuir isotherm can be expressed by the equation:
qe = qmbCe1 + bCe
(4.14)
(4.16)
(4.15)

58
Where: qe (mg g-1) is the substance amount of adsorbate adsorbed per gram of the adsorbent, qm (mg g-1) is the maximal substance amount of adsorbate per gram, b (mg-1 dm3) is the adsorption constant, Ce (mg dm-3) is the equilibrium concentration of the adsorbate in solution. The linearized form of the Langmuir equation becomes: 1qe = 1qmbCe + 1qm
A plot of versus gives a straight line and the constants qm and b are obtained from the
intercept and gradient respectively.
4.3.5 Sampling sites
The performance and potential future application of the magnetic U(VI) IIPs on the removal of hexavalent uranium from wastewater samples in the presence of other competing metal ions was tested on two types of waters. These were the acid mine drainage from Germiston and the treated wastewater effluent from Goudkoppies Wastewater Treatment Plant in Soweto. The sampling sites from which the real waters were sampled from are shown encircled in red in Figures 4.3 (b) and 4.4 (b). The Germiston area is located in the Central Rand area and is part of the Witwatersrand Basin where some 70 different ore minerals have been identified in the conglomerates. The most abundant ones include pyrite (FeS2) and uranite (UO2). This site is near an old gold mining tailings dump that underwent reprocessing. The other sampling site, Goudkoppies Wastewater Treatment Plant treats domestic and industrial wastewater from the City Centre and South-Eastern areas of Johannesburg before being discharged to a stream that eventually flows into Klip River. Raw water treatment at Goudkoppies involves several stages; among them are degritting, digestion and chlorination.
(4.17)

Figure 26o13`0
4.3: (a) G07.10 ``S an
Germiston nd 28o08`03
site (b) G.79``E and
59
Google mapan elevation
p of the Gn height of
Germiston a1652 m.
area with
(b)
pointers
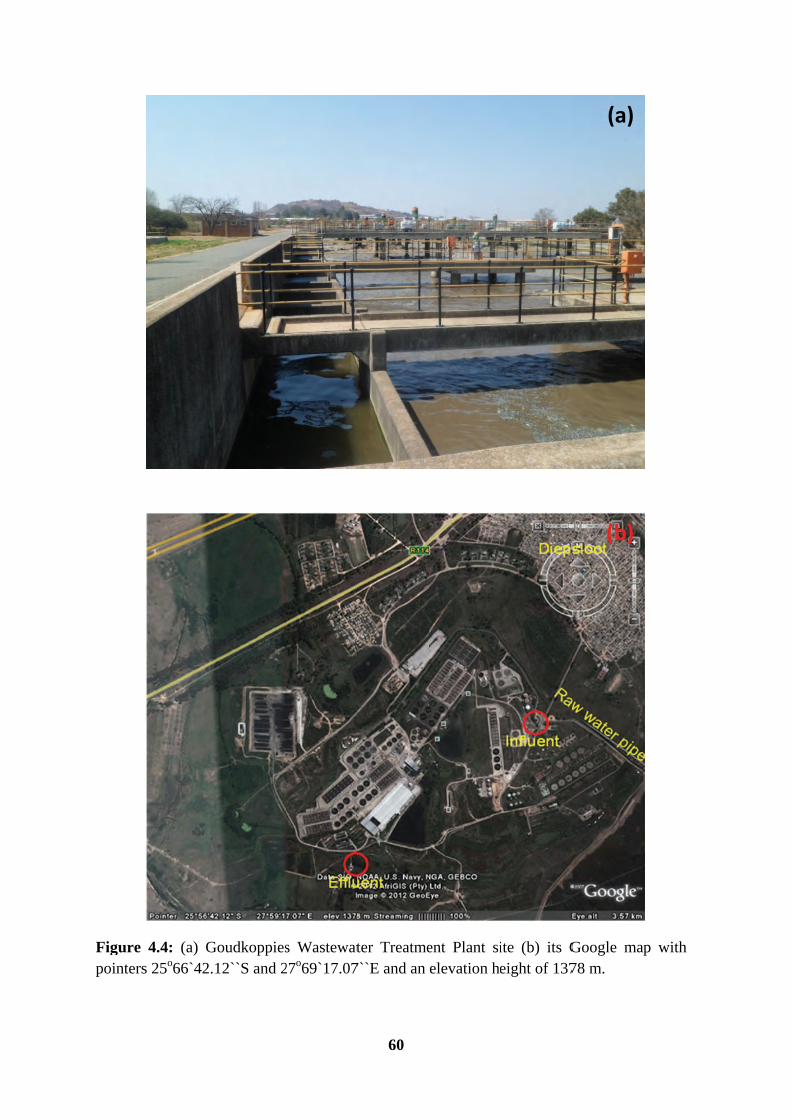
Figure pointers
4.4: (a) Gs 25o66`42.
Goudkoppies12``S and 2
s Wastewat27o69`17.07
60
ter Treatme7``E and an
ent Plant sielevation he
ite (b) its Geight of 137
Google map78 m.
(a)
(b)
p with

61
4.3.6 Application of magnetic U(VI) IIPs to real water samples
The samples were collected, treated and stored according to published procedures (Parks et al., 2004) and before the application of magnetic IIPs to real water samples, analysis of the metal content in these samples was performed with ICP-OES in triplicate. The pH and conductivity of solutions were measured in the field. The extraction of U(VI) from real water sample was then carried out in batch mode.
Mine decant sample from Germiston was buffered at pH 4 and divided into three 150 mL portions, which were spiked with 0, 5 and 10 mg L-1 of uranium solution. In triplicate, 25 mL of each sample was contacted with 20 mg of magnetic IIP particles while stirring at room temperature for 45 min. The uranium adsorbed on magnetic IIP particles was then leached out with 20 mL of 3 M HCl solution at a stirring rate of 1500 rpm at room temperature for 45 min. All solutions were then filtered through a 0.45 μm filter paper and analysed for uranium content using ICP-OES.
Goudkoppies wastewater was buffered at pH 4 and divided into four 25 mL portions which were spiked with 0, 1, 5 and 10 mg L-1 uranium. These solutions were then subjected to the same treatment as the AMD water sample from Germiston (described above).
4.4 Synthesis of imprinted polymers for Cr(VI) recovery
4.4.1 Synthesis of magnetic poly (4-vinylpyridine)
Prior to the synthesis of poly (4-vinylpyridine), the monomer 4-vinylpyridine was distilled at 65oC to remove the inhibitor, hydroquinone (Berkowitz et al., 1958).
An amount of 2.5 mg of γ-MPS-coated magnetite was added to a volume of 28 mL of the distilled 4-vinylpyridine. This mixture was then transferred to a 50 mL volumetric flask to which 50 mg benzoyl peroxide was added with magnetic stirring. The flask was then placed into an oil bath at 85oC for 2 hours and then the temperature was elevated to 135oC where it was maintained for an hour. The whole reaction was performed under an inert atmosphere of nitrogen. The polymerization was then stopped by cooling it to 0oC. All the unreacted 4-vinylpyridine monomers were removed by washing the poly (4-vinylpyridine) with 35 mL of methanol. The free bulk poly (4-vinylpyridine) polymer was recovered by heating off the methanol solvent by use of Rotavapour II (Buchi, Switzerland).
4.4.2 Synthesis of poly (4-vinylpyridine)
The synthesis of non magnetic poly (4-vinylpyridine) followed exactly the same procedure for the synthesis of poly (4-vinylpyridine) except that γ-MPS-coated magnetite was not added.

62
4.4.3 Preparation of magnetic and poly (n-propyl-4 vinylpyridinium) bromide
Quaternization of magnetic and non-magnetic poly (4-vinylpyridine) was achieved by refluxing 11.34 g of magnetic and non-magnetic poly (4-vinylpyridine) in 40 mL of DMF with a slight stoichiometric excess of 1-bromopropane (10 mL). These reactions were carried out for 42 hrs at 60oC.
4.4.4 Preparation of magnetic and non-magnetic poly (n-propyl-4-vinylpyridinium) dichromate
Magnetic poly (n-propyl-4-vinylpyridinium) bromide was dissolved in 50 mL of DMF containing 0.34 g of dissolved sodium dichromate. This solution was stirred at room temperature for 2 hours. Magnetic poly (n-propyl-4-vinylpyridinium) dichromate was then obtained by driving off the excess solvent by use of a rotary vapour. The corresponding magnetic NIP was similarly synthesized except that the dichromate imprint was excluded.
4.4.5 Leaching of chromium
After polymerization has ceased, the synthesized magnetic IIPs and NIPs of chromium were ground and sieved to a particle size range of 27-53 μm range. The particles were then washed repeatedly with de-ionized water to remove all unreacted pre-polymerization reagents. The imprinted chromium was then removed by stirring 5 g of the magnetic polymers in 100 mL of 1 M HCl for 6 hours. Magnetic IIP and NIP particles were filtered through a 0.45 μm filter paper where the filtrate was analyzed for chromium content and the residue was subjected to the a fresh HCl leachant for the same period of time. This cycle was repeated several times until the chromium content detected in the filtrate was almost zero.
4.5 Optimization of parameters for Cr(VI) uptake
4.5.1 Effect of initial pH of Cr(VI) solution
The effect of pH on the adsorption of Cr(VI) onto the magnetic IIP and NIP was investigated in the pH range of 2-8. This was achieved by stirring 25 mg of the polymer particles at a stirring speed of 600 rpm in a 25 mL solution of Cr(VI) with initial concentration of 5 mg L-1 for 60 min at room temperature. After 60 min, the solution was equilibrated for 10 min followed by filtration and the chromium content was then determined by FAAS.
4.5.2 Effect of the amount of the magnetic polymer
After adjusting the pH of the sample solution to pH 4, a batch adsorption was carried out in a series of 30 mL vials at room temperature. Each vial was filled with 25 mL of an initial concentration of 5 mg L-1 chromium solution. The added magnetic polymer mass was varied between 5 to 120 mg. After stirring the solution for 60 minutes at a stirring speed of 600 rpm, separation of the magnetic polymers was achieved by use of a magnet. The solution was then

63
analysed for chromium content from which the amount adsorbed on the magnetic polymer was calculated.
4.5.3 Effect of contact time on chromium(VI) adsorption
The effect of contact time on the extraction of Cr(VI) was investigated by stirring 20 mg of magnetic IIP and NIP at room temperature in a solution containing 25 mL of 2 mg L-1 of Cr(VI) at a fixed pH. The time intervals investigated were 5, 15, 45, 60 and 90 min. After each stirring time, the Cr(VI) amount was determined as described earlier.
4.5.4 Effect of initial concentration of chromium(VI) on its uptake
The effect of 25 mL of various initial Cr(VI) concentrations (2, 5, 8 and 10 mg L-1) on the adsorption removal efficiency by magnetic IIP and NIP was investigated by stirring the 20 mg of the magnetic polymers at room temperature. The initial pH of the solutions was adjusted to that optimized above. After 45 min. the mixture was filtered and the filtrate was analyzed for Cr(VI) content with the FAAS.
4.5.5 Selectivity studies on the adsorption of Cr(VI) by magnetic IIP
Four point calibration standards were prepared from a mixture of four anions, namely, F-, NO3
-, SO42- and PO4
3-. The concentrations used were 1, 5 and 10 and 20 mg L-1. Selective adsorption of Cr(VI) onto magnetic polymers was investigated by means of binary mixtures with other anionic species which were F-, NO3
-, SO42- and PO4
3-. The initial concentration of Cr(VI) and the other analyte was 2 mg L-1. Twenty five millilitres of these mixtures were then equilibrated with 20 and 65 mg of magnetic IIP and NIP respectively. After adjusting the pH to 4 with NaOH and HCl, the contact time was set at 45 min and the stirring rate was 600 rpm. These experiments were performed in a batch mode and the unadsorbed concentration of each anionic species was measured using ion chromatography and AAS for the dichromate. The results obtained were used to calculate the distribution ratios, the selectivity coefficients and the relative selectivity coefficients through application of equations 4.7, 4.8 and 4.9 respectively.
4.5.6 Reusability of chromium(VI) IIP
The stability and reusability of the magnetic polymers was investigated by adding to the 50 mg of the polymer 2 mg L-1 chromium(VI) solution. Other conditions used where those optimum in previous experiments. The contact was allowed for 45 min after which the mixture was filtered. The magnetic polymer residue was then stripped off the adsorbed chromium(VI) by stirring it in a 20 mL solution of 1 M NaOH for 20 min. This was followed by filtration and analysis of dichromate anions in the filtrate by FAAS. This procedure was repeated for a number of times in order to investigate the stability and reusability of these magnetic polymers.

64
Chapter Five: Results and Discussion
5.1 Synthesis and characterization of magnetic uranyl-imprinted polymers
5.1.1 Synthesis of the magnetite
The synthesis of magnetite by co-precipitation of the ferrous and ferric salts produced a black precipitate upon increasing of pH by addition of ammonia. The magnetic response of the magnetite towards a magnet is demonstrated in Figure 5.1.
Figure 5.1: Magnetic response of magnetite.
Since this synthesis is carried out in aqueous environment, it means there is likely to be water and hydroxyl ions adsorbed on the surface of the magnetite as depicted in Figure 5.2.
Figure 5.2: Magnetite showing the adsorbed hydroxyl ions.
OH
OH
HO OH
OH
HO
HO
OH

5.1.1.1
PowderIn the c57.0o (AFe3O4 pas obser
The parfound toTEM an
The PX(2012) PXRD (2012) i62.8o wand ethysix peakthe datamagnet
5.1.2 γ- 5.1.2.1
The stosilica. I
Powder X-
r X-ray diffcase of magAguilar-Artephase, Figurrved from p
F
rticle size oo be 11.9 nmnalysis (11.
XRD patterngave the crpatterns of in the 2θ re
which were cylenediaminks at 2θ = 3abase in JCic iron oxid
-MPS and O
Functional
ober-sol-gelt relies on t
-ray diffrac
fraction wasgnetite, theega et al., 2re 5.3. It is
peaks at 2θ =
Figure 5.3:
of the magnm. The resu39 ± 2.54 n
ns of the drystallite sizf the syntheegion of 10-characteristine-modified30.1, 35.4, 4
CPDS file (Pde were pure
OA functio
lization of m
l method isthe use of si
ction (PXR
s used as a e characteris2010). It is
however e= 60o.
: PXRD pat
netite nanopult is consistnm).
dried samplze of 10 nmsized Fe3O80° displayic of spinel d magnetic 43.0, 53.5, PDF No. 65e Fe3O4 with
onalization
magnetite w
the most wilicon alkox
65
RD) analysis
diagnostic tstic peaks oclear that t
evident that
ttern for the
particles, as tent and in p
le of Fe3O4
m after appli
4 nanopartiyed diffracti
structure ochitosan sy57.0 and 655-3107), theth a spinel s
of magneti
with γ-MPS
widely usexides as the
s
tool to checoccur at 2θhe bulk of there are s
synthesized
deduced frperfect agre
4 from the ication of thcles obtaineion lines at 2f Fe3O4. Th
ynthesized b5.2o. After ce researchertructure.
ite
S
d method fsource of s
ck the phaseθ = 30.1, 35the particleome impuri
d magnetite
rom the Scheement with
studies of Ehe Scherrer ed by Sade2θ = 30.3, 3
he PXRD spby Wang et comparing trs conclude
for coating ilica matrix
e of the iro5.5, 43.1, 5
es consist mities in the
e.
herrer equath that obtain
El Ghandooformula. T
eghi and Ab35.4, 43.3, 5pectra of bar
al. (2011), the peaks to
ed that the r
nanoparticx (Kan et al
n oxide. 53.4 and
mainly of samples
tion was ned from
or et al. he other
boobakri 57.3 and re Fe3O4 showed
o that of resultant
les with ., 2010).
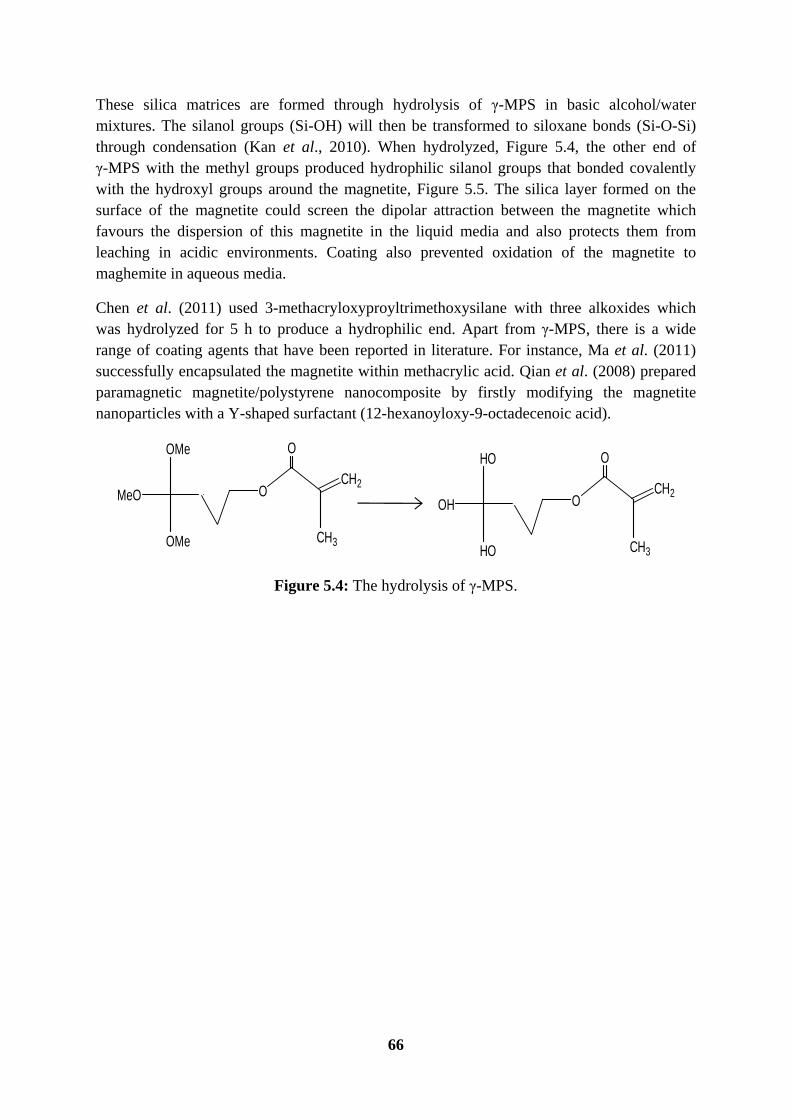
66
These silica matrices are formed through hydrolysis of γ-MPS in basic alcohol/water mixtures. The silanol groups (Si-OH) will then be transformed to siloxane bonds (Si-O-Si) through condensation (Kan et al., 2010). When hydrolyzed, Figure 5.4, the other end of γ-MPS with the methyl groups produced hydrophilic silanol groups that bonded covalently with the hydroxyl groups around the magnetite, Figure 5.5. The silica layer formed on the surface of the magnetite could screen the dipolar attraction between the magnetite which favours the dispersion of this magnetite in the liquid media and also protects them from leaching in acidic environments. Coating also prevented oxidation of the magnetite to maghemite in aqueous media.
Chen et al. (2011) used 3-methacryloxyproyltrimethoxysilane with three alkoxides which was hydrolyzed for 5 h to produce a hydrophilic end. Apart from γ-MPS, there is a wide range of coating agents that have been reported in literature. For instance, Ma et al. (2011) successfully encapsulated the magnetite within methacrylic acid. Qian et al. (2008) prepared paramagnetic magnetite/polystyrene nanocomposite by firstly modifying the magnetite nanoparticles with a Y-shaped surfactant (12-hexanoyloxy-9-octadecenoic acid).
Figure 5.4: The hydrolysis of γ-MPS.
MeO
OMe
OMe
O
O
CH3
CH2
OH
HO
HO
O
O
CH3
CH2
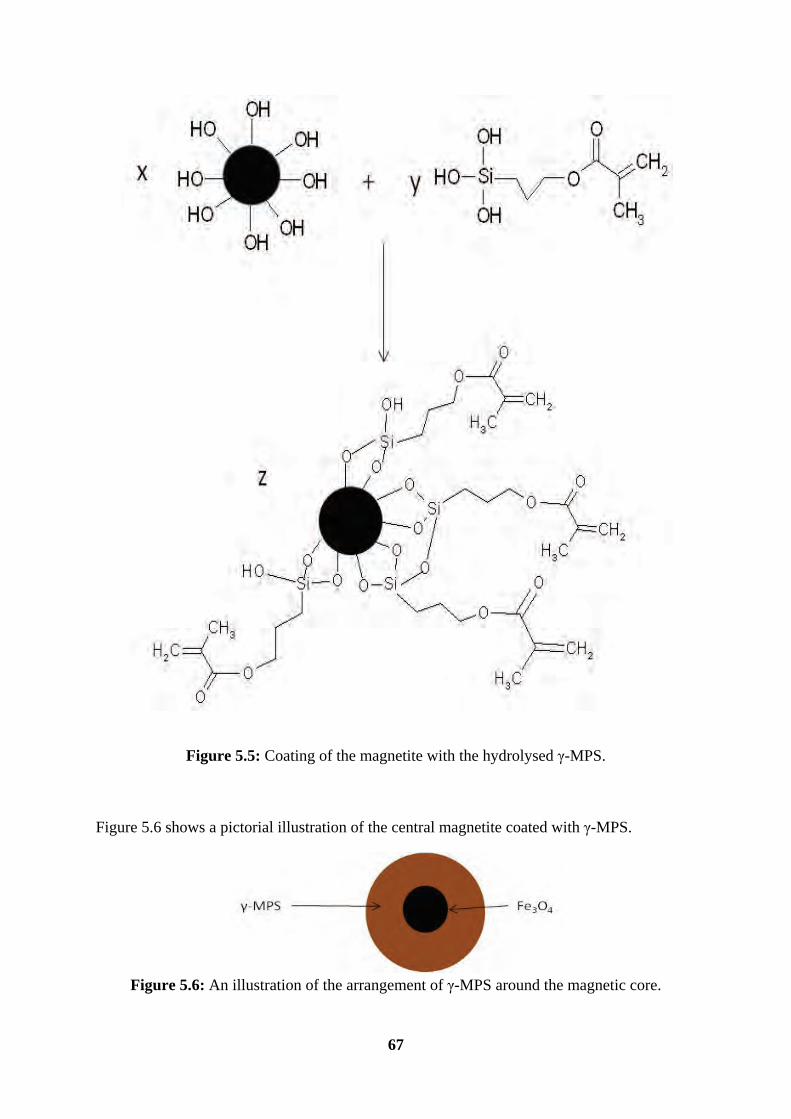
67
Figure 5.5: Coating of the magnetite with the hydrolysed γ-MPS.
Figure 5.6 shows a pictorial illustration of the central magnetite coated with γ-MPS.
Figure 5.6: An illustration of the arrangement of γ-MPS around the magnetic core.
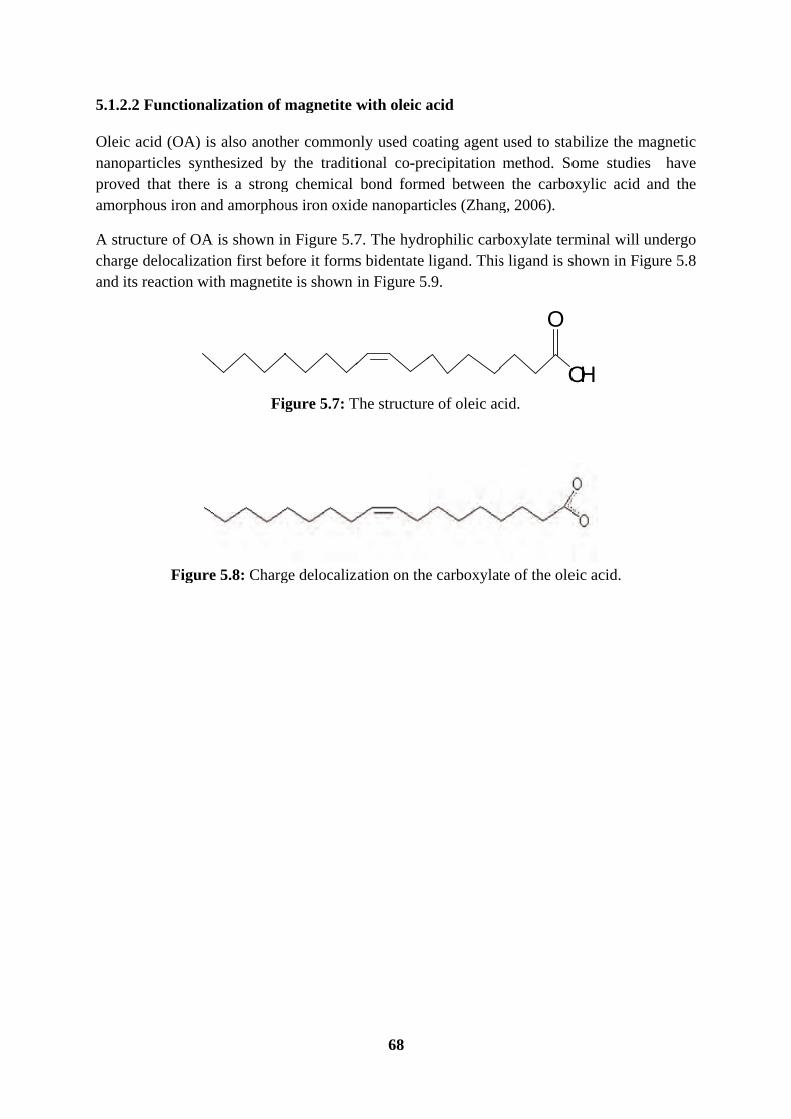
5.1.2.2
Oleic acnanoparproved amorph
A structcharge dand its r
Functional
cid (OA) isrticles syntthat there
hous iron an
ture of OA delocalizatireaction wit
Figure
lization of m
s also anoththesized byis a strong
nd amorphou
is shown inion first befth magnetit
Fig
e 5.8: Charg
magnetite w
her commony the traditig chemical us iron oxid
n Figure 5.7fore it formse is shown i
gure 5.7: T
ge delocaliza
68
with oleic a
nly used coaional co-prebond form
de nanoparti
7. The hydrs bidentate lin Figure 5.
The structure
ation on the
acid
ating agentecipitation
med betweenicles (Zhang
rophilic carbligand. This.9.
e of oleic ac
e carboxylat
used to stamethod. So
n the carbog, 2006).
boxylate ters ligand is s
O
O
cid.
te of the ole
abilize the mome studie
oxylic acid
rminal will shown in Fi
OH
eic acid.
magnetic es have
and the
undergo gure 5.8

5.1.2.3
Elemenand OAcontent
Figur
Carbon, hy
ntal analysisA on magne
in the orga
re 5.9: Sche
ydrogen, ni
s (CHNS) wetite, Table anic moietie
eme for the
itrogen and
was done in5.1. This ws.
69
functionaliz
d sulphur (
n order to dwas achieve
zation of ma
(CHNS) an
determine thd by measu
agnetite wit
alysis
he degree ofuring the ca
th OA.
f coating ofarbon and h
f γ-MPS hydrogen
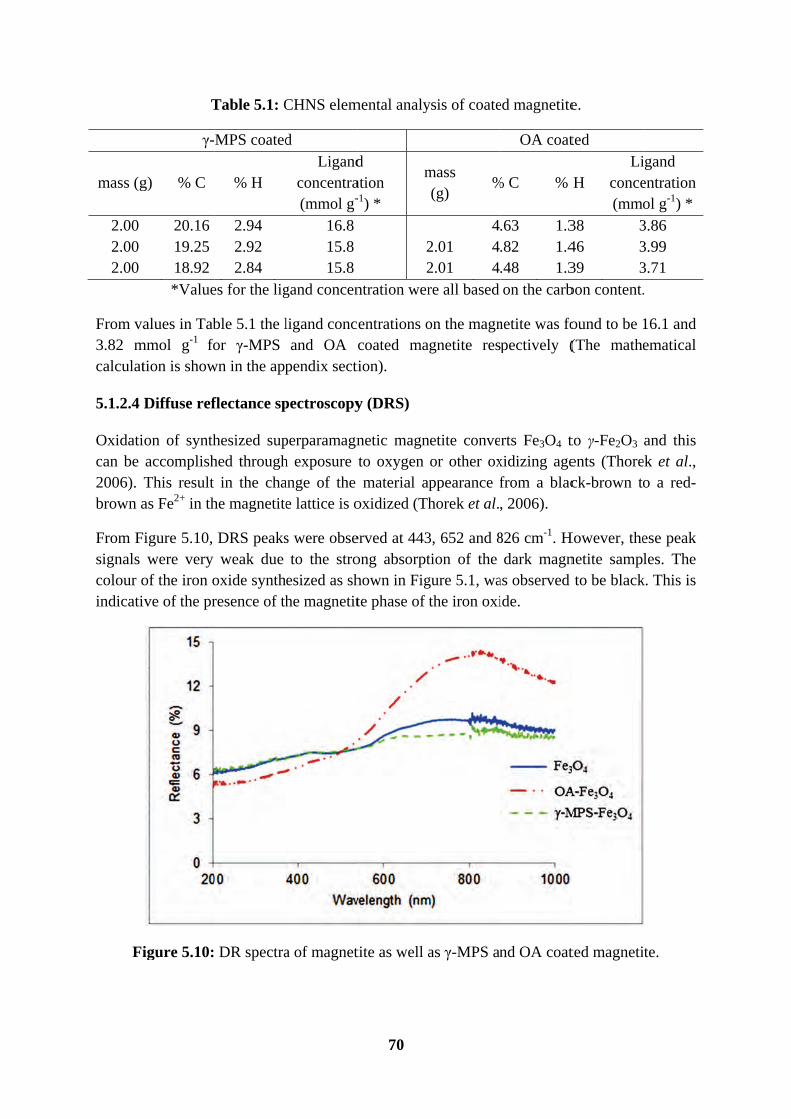
mass (g
2.00 2.00 2.00
From va3.82 mcalculat
5.1.2.4
Oxidatican be 2006). brown a
From Fsignals colour oindicati
Fi
T
γ-
g) % C
20.16 19.25 18.92 *Value
alues in Tabmmol g-1 fotion is show
Diffuse ref
ion of synthaccomplishThis result as Fe2+ in th
Figure 5.10, were very
of the iron oive of the pr
igure 5.10:
Table 5.1: C
MPS coated
% H
2.94 2.92 2.84
es for the lig
ble 5.1 the lor γ-MPS
wn in the app
flectance sp
hesized suphed through
in the chahe magnetite
DRS peaksweak due
oxide synthresence of th
DR spectra
CHNS elem
d Ligand
concentra(mmol g-
16.815.815.8
gand concen
ligand concand OA c
pendix secti
pectroscopy
perparamagnh exposure ange of the e lattice is o
s were obseto the stro
esized as shhe magnetit
a of magnet
70
mental analy
d ation -1) *
m
22
ntration wer
entrations ocoated ma
tion).
y (DRS)
netic magnto oxygen material ap
oxidized (Th
erved at 443ong absorpthown in Figte phase of t
tite as well a
ysis of coate
mass (g)
%
42.01 42.01 4re all based
on the magngnetite res
netite conveor other oxppearance fhorek et al.
3, 652 and 8tion of the gure 5.1, wathe iron oxi
as γ-MPS an
ed magnetite
OA coat
% C %
.63 1.3
.82 1.4
.48 1.3on the carb
netite was fopectively (
rts Fe3O4 txidizing agefrom a blac, 2006).
826 cm-1. Hdark magn
as observed ide.
nd OA coat
e.
ted
H Li
conce(mmo
38 346 339 3bon content.
ound to be 1(The mathe
to γ-Fe2O3 ents (Thoreck-brown to
However, thenetite sampto be black
ted magneti
igand entration ol g-1) * 3.86 3.99 3.71 .
16.1 and ematical
and this ek et al., o a red-
ese peak les. The
k. This is
te.
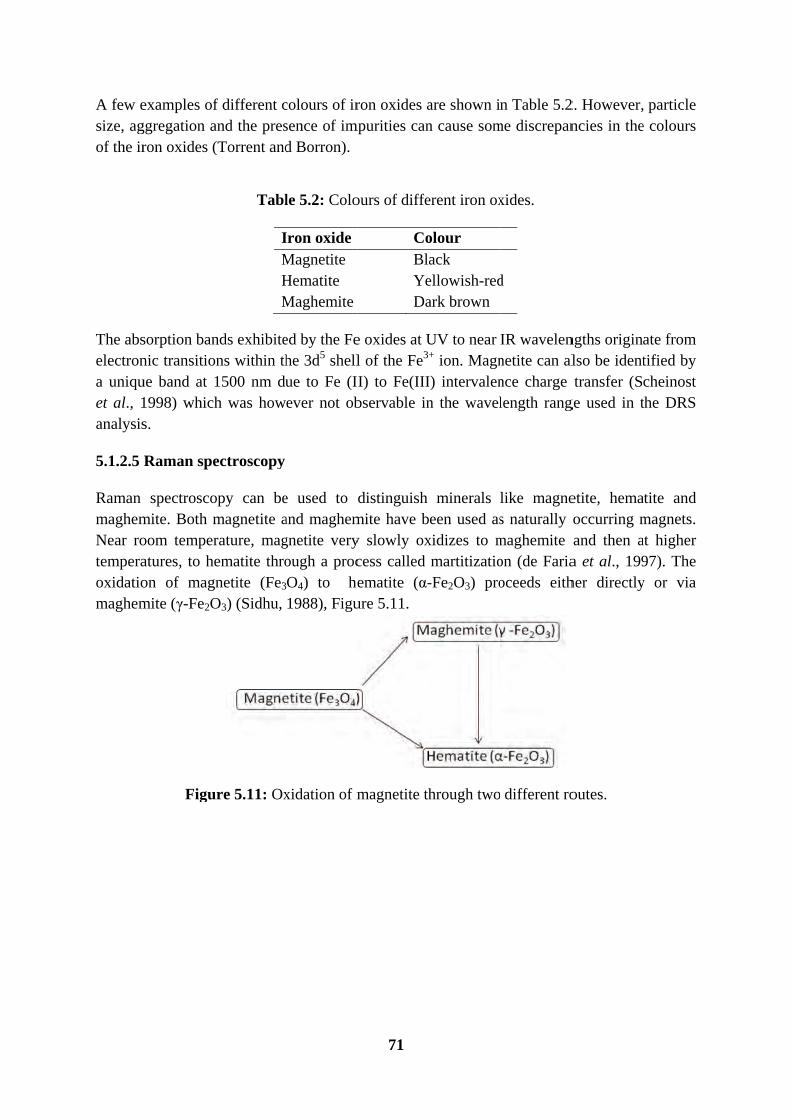
A few esize, agof the ir
The abselectrona uniquet al., 1analysis
5.1.2.5
Raman maghemNear rotemperaoxidatiomaghem
examples ofggregation aron oxides (
sorption bannic transitioue band at 1998) whichs.
Raman spe
spectroscomite. Both moom temperatures, to heon of magmite (γ-Fe2O
Figu
f different cand the pres(Torrent and
Tabl
IMHM
nds exhibiteons within th1500 nm duh was how
ectroscopy
opy can bemagnetite arature, magematite thro
gnetite (Fe3
O3) (Sidhu,
ure 5.11: Ox
colours of irsence of impd Borron).
le 5.2: Colo
Iron oxideMagnetite Hematite Maghemite
ed by the Fehe 3d5 shellue to Fe (Iever not ob
e used to and maghemgnetite veryough a procO4) to he1988), Figu
xidation of m
71
ron oxides ampurities can
ours of diffe
CoBlYeDa
e oxides at Ul of the Fe3+
I) to Fe(IIIbservable in
distinguish mite have by slowly oxcess called ematite (α-ure 5.11.
magnetite th
are shown in cause som
erent iron ox
olour ack ellowish-redark brown
UV to near + ion. MagnI) intervalenn the wavel
minerals een used as
xidizes to mmartitizatio
-Fe2O3) pro
hrough two
n Table 5.2me discrepan
xides.
d
IR wavelennetite can alnce charge length rang
like magnes naturally maghemite on (de Fariaoceeds eith
different ro
2. However,ncies in the
ngths originalso be identtransfer (S
ge used in t
etite, hemaoccurring mand then aa et al., 199her directly
outes.
particle e colours
ate from tified by cheinost the DRS
atite and magnets. at higher 97). The y or via

72
These three phases of iron oxide (magnetite, hematite and maghemite) have very distinct bulk Raman spectra and this was used to determine the phase of the uncoated and coated iron oxide particles. The nanoparticles showed a diagnostic Raman peak at around 672 cm-1 which corresponds to magnetite (Tang et al., 2003). Other assignments of the band positions for phase identification were compiled by Slavov et al. (2010) and are presented in Table 5.3. Iron oxide and γ-MPS-iron oxide under study are also included in the table together with their corresponding wavelength bands.
Table 5.3: Raman bands for magnetite, maghemite and hematite.
Iron oxide Wavelengths (cm-1) Literature
Fe3O4 (magnetite) 193, 306, 538, 668 γ-Fe2O3 (maghemite) 350, 500, 700 α-Fe2O3 (hematite) 225, 247, 299, 412, 497, 613
Observed Iron oxide 667 γ-MPS-iron oxide 670, 1400, 1600
The presence of the strong peaks around 667 cm-1 in Figures 5.12, 5.13 and 5.14 indicated that the phase of the iron oxide present was magnetite (Fe3O4).
According to Wang et al. (1990), all carbon systems show only a few prominent bands, no matter the final structure, and these intense bands occur between 1000-2000 cm-1. In this work, the carbon system used was from γ-MPS, which is an organic moiety, had a lot of carbon atoms. The exact peaks of the carbon peaks in the Raman spectrum for this γ-MPS were identified at 1400 cm-1 and 1600 cm-1.
However, the same peaks, but of low intensity, were observed in the unmodified magnetite. This was unexpected and can be attributed to some organic contamination. It can be therefore concluded that the synthesized iron oxide was magnetite and it remained in this phase even in γ-MPS-Fe3O4 as evidenced by the presence of the 670 cm-1 band. This might have been a due to the use of a nitrogen protective layer purged for 10 minutes during functionalization which prevented oxidation of the magnetite.
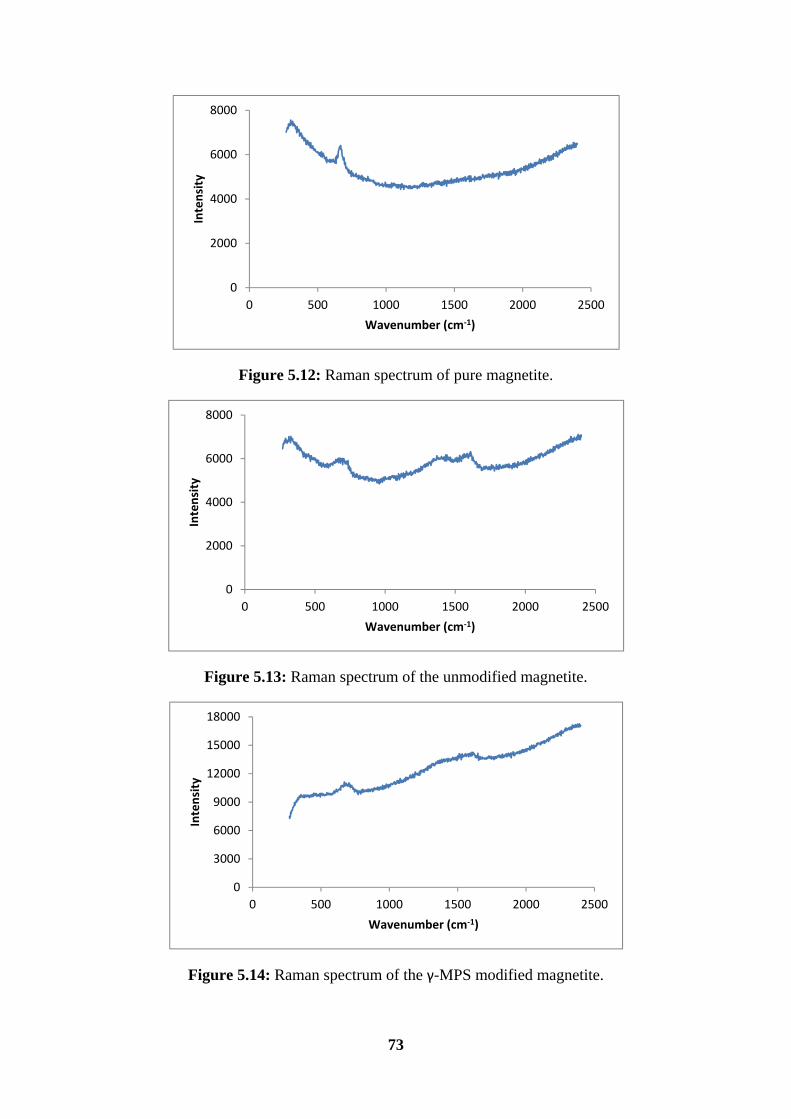
73
Figure 5.12: Raman spectrum of pure magnetite.
Figure 5.13: Raman spectrum of the unmodified magnetite.
Figure 5.14: Raman spectrum of the γ-MPS modified magnetite.
0
2000
4000
6000
8000
0 500 1000 1500 2000 2500
Inte
nsity
Wavenumber (cm-1)
0
2000
4000
6000
8000
0 500 1000 1500 2000 2500
Inte
nsity
Wavenumber (cm-1)
0
3000
6000
9000
12000
15000
18000
0 500 1000 1500 2000 2500
Inte
nsity
Wavenumber (cm-1)

5.1.2.6
The proparticleaqueouscoating hydrophthe γ-Mpolymeevident mostly retained
From thsphericawere obparticleprepareFeSO4 asize of 5
Figu
5.1.2.7
For the images of the uby Lu amagnet
Transmiss
ominent lares have a tens medium.
agents anhilic silanolMPS, the erization to
though to spherical i
d their spher
he microgrally shapedbtained. In
es were dised by coprecadded to 1M5.0 nm with
ure 5.15: Tr
Size distrib
uncoated mto get the p
uncoated maand Forcadaite by co-pr
ion electro
rge black sndency of agOne of thed surfactanl reacted wihydrophoboccur. The a lesser de
in shape. Wrical shapes
raph of Fe3
d particles wanother stu
spersed vercipitation oM NaOH soh a standard
ransmission
butions
magnetite, aparticle sizeagnetite wasa (2006) whrecipitation
n microsco
spots on thgglomeratinways to st
nts. In Figuith the hydr
bic end, coagglomera
egree. It waWhen they s.
3O4 obtainewith a narroudy by Qiary well, wif a mixture olution of etd deviation o
n Electron M
a total of 23e distributios 11.39 ± 2.ho obtained
n. Pan et al.
74
opy (TEM)
he TEM imng. This is etabilize the ure 5.15 (broxyl groupontained a
ation of the as also obseare coated
ed by El Gow size distran et al. (2ith an averof ferric an
thanol and of 0.2 (Roca
Micrographsmagnetite.
37 particles on, Figure 5.54 nm. Thid a mean di. (2011) als
analysis
mage, Figurespecially somagnetite
b), the coatps around tha double w
coated magerved that twith silica
Ghandoor etribution wit2008), it warage diamend ferrous swater (1:1,a et al., 200
s of (a) unco
were meas5.16. It was is diameter iameter of so obtained
re 5.15 (a)o when theyis by functiing agent w
he magnetitewhich madgnetite, aftethe synthesa, the magn
t al. (2012)th mean diaas revealed
eter of 10 salt solution
v/v) and ga09).
oated and (b
sured from ffound that
was consist10 nm aftera mean dia
), indicate y are syntheionalizing iwas γ-MPSe. The othe
de it possier coating, wsized particlnetite partic
), it was sameter of 1d that the m
nm. Nanopns, of Fe(NOave a mean
b) γ-MPS co
four differethe mean d
tent with thr synthesiziameter of 1
that the esized in it with a S whose er end of ible for was still les were cles still
een that 0.59 nm
magnetic particles O3)3 and particle
oated
ent TEM diameter at found ing their 0 nm in
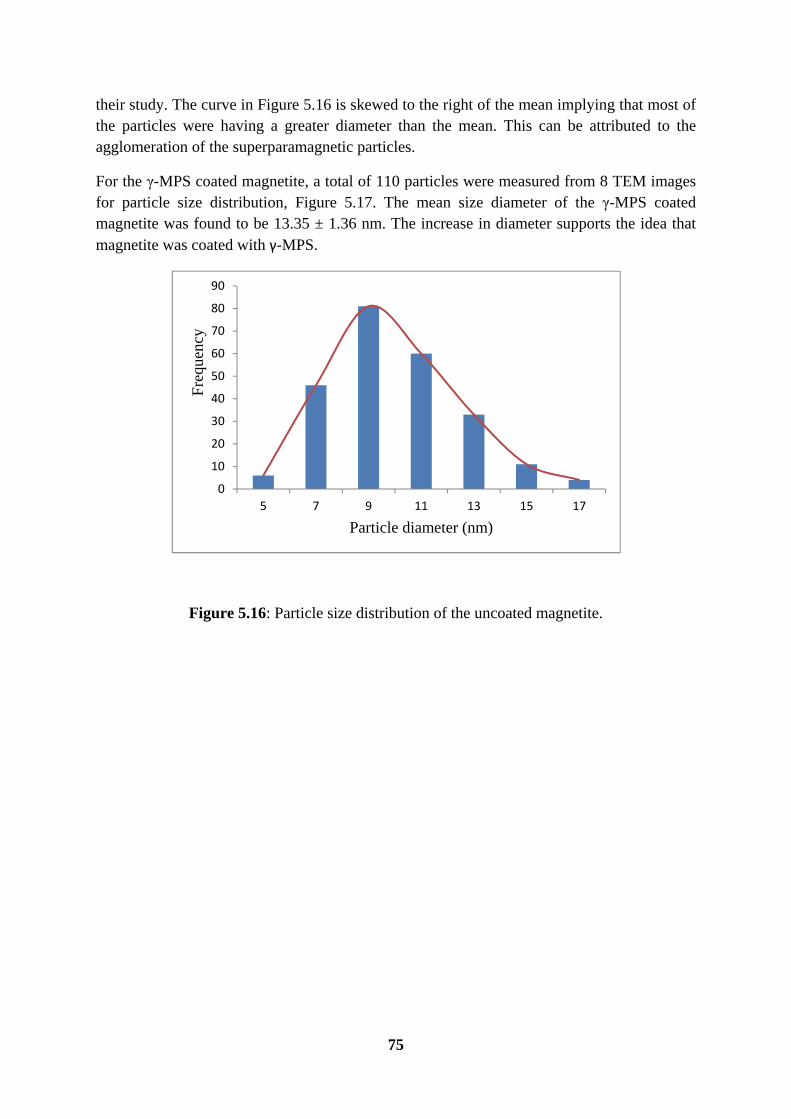
75
their study. The curve in Figure 5.16 is skewed to the right of the mean implying that most of the particles were having a greater diameter than the mean. This can be attributed to the agglomeration of the superparamagnetic particles.
For the γ-MPS coated magnetite, a total of 110 particles were measured from 8 TEM images for particle size distribution, Figure 5.17. The mean size diameter of the γ-MPS coated magnetite was found to be 13.35 ± 1.36 nm. The increase in diameter supports the idea that magnetite was coated with γ-MPS.
Figure 5.16: Particle size distribution of the uncoated magnetite.
0
10
20
30
40
50
60
70
80
90
5 7 9 11 13 15 17
Fre
quen
cy
Particle diameter (nm)
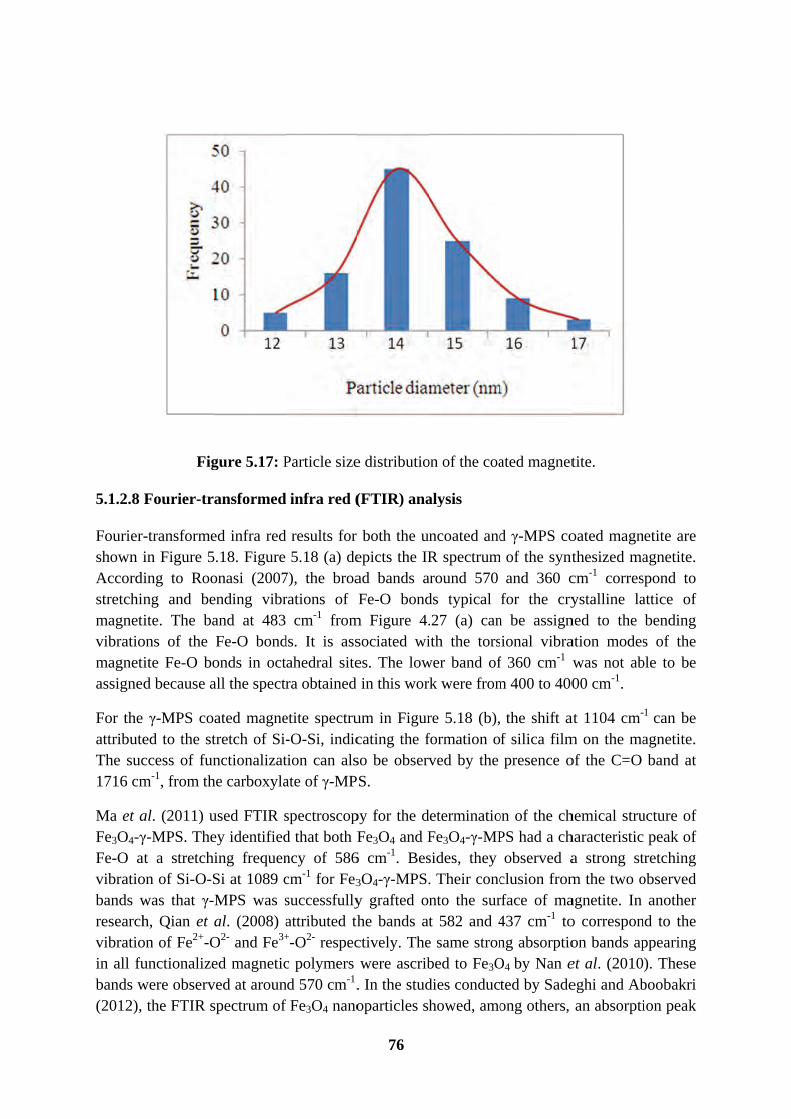
5.1.2.8
Fouriershown iAccordstretchinmagnetvibratiomagnetassigne
For theattributeThe suc1716 cm
Ma et aFe3O4-γFe-O avibratiobands wresearchvibratioin all fubands w(2012),
Fig
Fourier-tra
-transformein Figure 5ing to Roong and beite. The ba
ons of the ite Fe-O bod because a
γ-MPS coed to the stccess of funm-1, from th
al. (2011) uγ-MPS. Theat a stretchion of Si-O-Swas that γ-Mh, Qian et aon of Fe2+-Ounctionalizewere observ
the FTIR s
gure 5.17: P
ansformed
ed infra red.18. Figure
onasi (2007ending vibrand at 483Fe-O bondonds in octall the spectr
ated magnetretch of Si-nctionalizat
he carboxyla
used FTIR sey identifieding frequenSi at 1089 cMPS was sal. (2008) a
O2- and Fe3+
ed magneticved at arounspectrum of
Particle size
infra red (
results for 5.18 (a) de
7), the broarations of
cm-1 fromds. It is assahedral sitera obtained
etite spectru-O-Si, indiction can alsate of γ-MP
spectroscopd that both Fncy of 586cm-1 for Fe3
successfullyattributed th+-O2- respecc polymers nd 570 cm-1.f Fe3O4 nano
76
e distributio
(FTIR) ana
both the uepicts the IRad bands aFe-O bond
m Figure 4.sociated wies. The lowin this wor
um in Figurcating the fso be observS.
py for the dFe3O4 and F
6 cm-1. Bes
3O4-γ-MPS.y grafted ohe bands atctively. Thewere ascrib
. In the studoparticles sh
on of the coa
alysis
ncoated andR spectrum
around 570 ds typical .27 (a) canith the tors
wer band ofrk were from
re 5.18 (b),formation oved by the
determinatioFe3O4-γ-MPsides, they . Their concnto the surt 582 and 4
e same stronbed to Fe3Odies conduchowed, amo
ated magnet
d γ-MPS com of the synt
and 360 cfor the cry
n be assignional vibra
f 360 cm-1 wm 400 to 400
the shift af silica filmpresence o
on of the chPS had a chobserved a
clusion fromrface of ma437 cm-1 tong absorptio
O4 by Nan eted by Sadeong others,
tite.
oated magnthesized macm-1 corresystalline la
ned to the ation modeswas not ab00 cm-1.
at 1104 cm-
m on the maof the C=O
hemical struharacteristica strong stm the two oagnetite. In o corresponon bands apet al. (2010eghi and Aban absorpti
netite are agnetite. spond to attice of bending s of the
ble to be
1 can be agnetite. band at
ucture of peak of
tretching observed
another nd to the ppearing ). These
boobakri ion peak

at 577 coccur bet al., 2
Figu
One str
frequenFigure 5was a smagnetexpectedelocalifor the and 280oleic ac
cm-1 which between 5602011).
ure 5.18: F
riking featur
ncy, Figure 55.7, it can bpecial type ite, as seen
ed that the ization of thinteraction 00 cm-1 attricid.
they attribu0 and 660 c
TIR spectra
re of the FT
5.19. This wbe seen thatof interactifrom its sttype of inthe carboxylof OA and ibuted to th
uted to the m-1 are asso
a of (a) unco
TIR spectrum
was expectet the carbonion betweenructure in Fteraction oflate, Figuremagnetite i
he asymmetr
77
Fe-O vibraociated with
oated magn
m of OA-F
ed to be presnyl group isn the magneFigure 5.2, f it and olee 5.8, a bideis shown inric CH2 stre
ation frequenh the metal
netite and (b
e3O4 is the
sent since fr present. Thetite and thehas hydroxeic acid be entate liganFigure 5.9.
etch and the
ncy. In gen-O stretchin
b) γ-MPS co
absence of
from the struhis therefore oleic acid yl groups aesterificati
d was form. The two be symmetric
neral, the bang vibration
oated magne
the C=O st
ucture of olre implies thd coating agaround it anion. But by
med and the bands betwec CH2 stretc
ands that n (Wang
etite.
tretching
eic acid, hat there ent. The
nd it was y charge
scheme een 2900 ch of the

5.1.3 M
Both thFigure 5direct incation tbonds c
γ-MPS-polymestructur
Magnetic po
he bulk and5.20. In thisnteraction wthrough co-co-ordinativ
-Fe3O4 or Oerization is ral rigidity.
Figu
olymer synt
d the precips mechanismwith the uraordination w
vely through
OA-Fe3O4 ieffected. A
ure 5.19: FT
thesis
pitation polm, 4-vinyl panyl in the with the lon
h the lone pa
is added toAlso added
78
TIR spectru
lymerizationpyridine (4-pre-polymene pair of eair of electr
o the pre-pis the cross
um of OA-F
n follow th-VP) and saerization steelectron on trons on its N
olymerizatis-linker eth
e3O4.
he same mealicylaldoxiep. SALO bthe N and O
N atom.
ion mixturehylene glyco
echanism shime (SALObonds to thO atoms. 4-
e before thol methycry
hown in O) have a
e uranyl -VP also
e actual ylate for
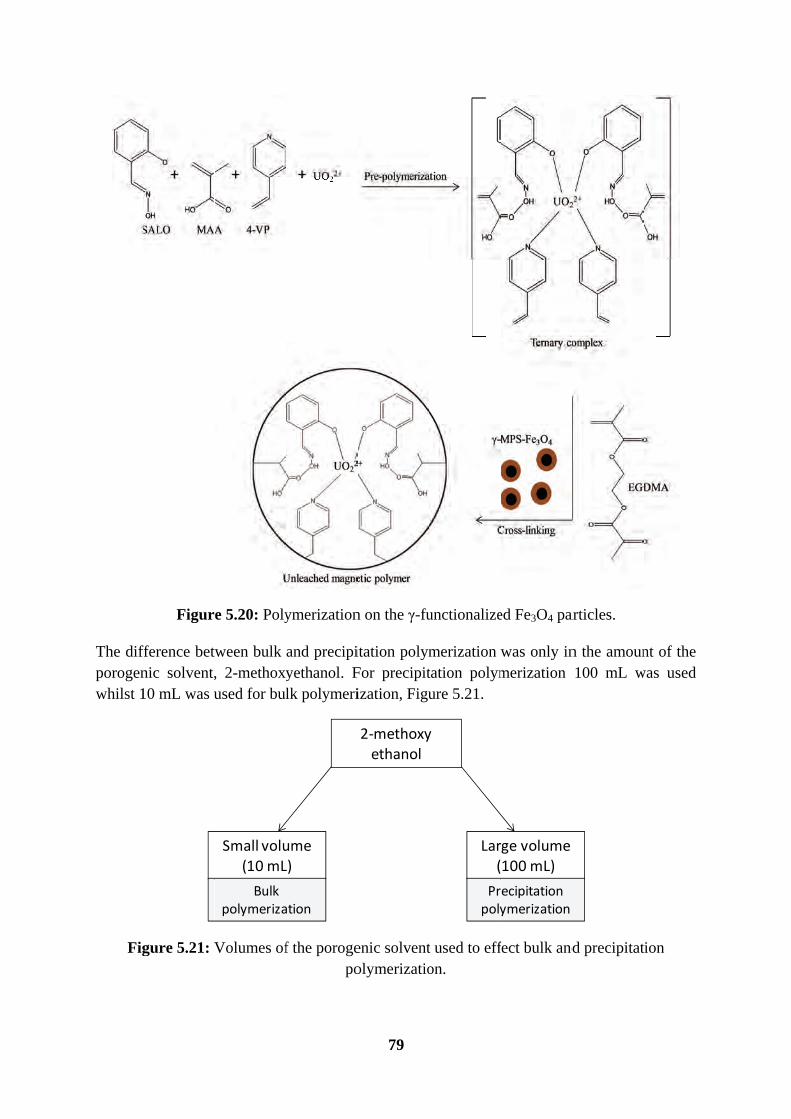
The difporogenwhilst 1
Fig
Figur
fference betnic solvent,10 mL was u
gure 5.21: V
e 5.20: Poly
tween bulk , 2-methoxyused for bul
Volumes of
Small volu(10 mL
Bulk polymeriza
ymerization
and precipiyethanol. Flk polymeri
f the porogepo
umeL)
ation
79
n on the γ-fu
itation polymFor precipitization, Figu
enic solventolymerizatio
2-methoxyethanol
unctionalize
merization tation polymure 5.21.
t used to effon.
Lar(
y
Prpoly
ed Fe3O4 pa
was only inmerization
fect bulk and
rge volume100 mL)
recipitation ymerization
articles.
n the amoun100 mL w
nd precipitat
nt of the was used
tion
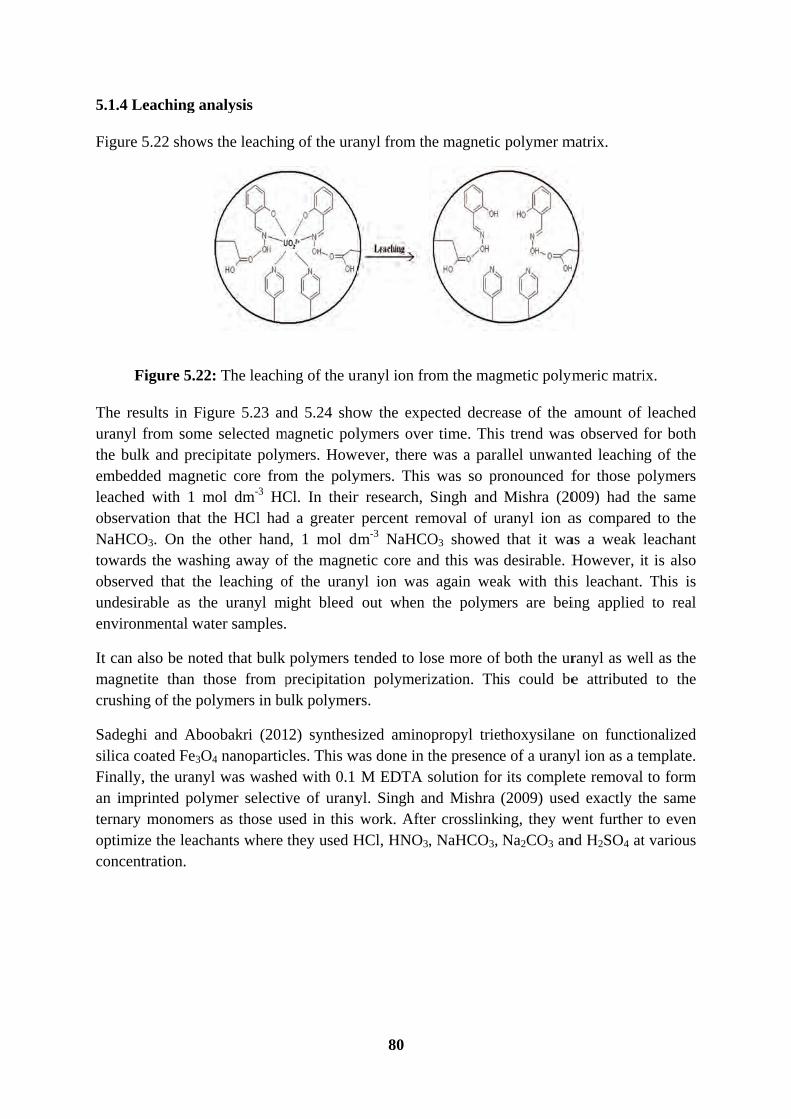
5.1.4 Le
Figure 5
F
The resuranyl fthe bulkembeddleachedobservaNaHCOtowardsobserveundesirenviron
It can amagnetcrushin
Sadeghsilica coFinally,an imprternary optimizconcent
eaching an
5.22 shows
Figure 5.22:
sults in Figfrom some k and precided magnetd with 1 mation that thO3. On the s the washined that the able as the
nmental wat
also be noteite than thg of the pol
i and Aboooated Fe3O4
, the uranylrinted polymmonomers
ze the leachatration.
nalysis
the leachin
: The leachi
ure 5.23 anselected m
ipitate polymtic core fro
mol dm-3 HChe HCl hadother hand
ng away ofleaching o
e uranyl mter samples.
ed that bulk hose from plymers in bu
obakri (201
4 nanoparticl was washemer selectivas those u
ants where
ng of the ura
ing of the ur
nd 5.24 shomagnetic pol
mers. Howm the polyCl. In theird a greater d, 1 mol dmf the magneof the urany
might bleed
polymers tprecipitationulk polymer
12) synthescles. This wed with 0.1 ve of uranysed in this they used H
80
anyl from th
ranyl ion fr
ow the expelymers over
wever, there ymers. Thisr research,
percent remdm-3 NaHCOetic core anyl ion was out when
tended to lon polymerirs.
ized aminowas done in t
M EDTA syl. Singh anwork. Afte
HCl, HNO3
he magnetic
om the mag
ected decrer time. Thiswas a para
s was so prSingh andmoval of uO3 showed nd this was
again weathe polym
ose more of ization. Th
opropyl triethe presencesolution fornd Mishra
er crosslinki, NaHCO3,
polymer m
gmetic polym
ease of the s trend wasallel unwantronounced fMishra (20
uranyl ion athat it wadesirable. H
ak with thisers are bei
f both the uris could be
thoxysilanee of a uranyr its comple(2009) useding, they wNa2CO3 an
matrix.
meric matri
amount of s observed nted leachinfor those p009) had thas compareas a weak However, is leachant. ing applied
ranyl as wee attributed
e on functioyl ion as a teete removal d exactly th
went further nd H2SO4 at
ix.
leached for both
ng of the polymers he same d to the leachant it is also
This is d to real
ell as the d to the
onalized emplate. to form
he same to even
t various
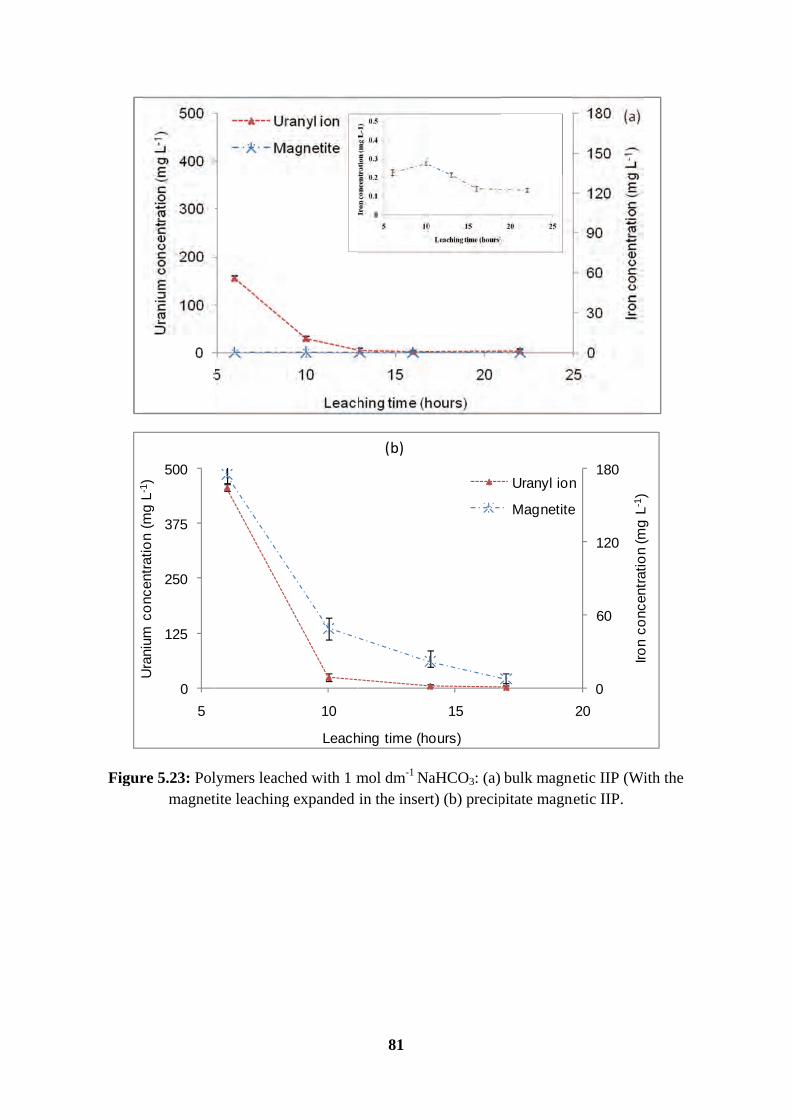
Figur
Ui
tti
(L
1)
re 5.23: Polmagnet
0
125
250
375
500
5
Ura
nium
co
ncen
trat
ion
(mg
L-1
)
lymers leachtite leaching
hed with 1 mg expanded
10
Leach
81
mol dm-1 Nin the inser
hing time (ho
(b)
aHCO3: (a)rt) (b) precip
15
ours)
bulk magnpitate magn
Uranyl ion
Magnetite
netic IIP (Wnetic IIP.
0
60
120
180
20
Iron
conc
entr
atio
n(m
gL-
1)
n
e
ith the
Iron
conc
entr
atio
n (m
g L
)

Fig
Anotherpolymedeep in
Accordtemplatduring pspecies to verify
gure 5.24: Pmagnet
r concern ers. This had
the polyme
ing to Sellte cluster fopolymerizatimprinted.
fy its identity
0
10
20
30
40
50
60
5
Ura
nium
co
ncen
trat
ion
(mg
L-1
)
Polymers letite leaching
was the pd a potentiaer matrix.
lergre (2003ormation. Ation, the temIt is therefoy.
ached with g expanded
ossible proal of causin
3), the uneAlso, since mplate mayore importa
10
Leac
82
1 mol dm-1
in the inser
oblem of swng slow blee
extracted temthe solvatin
y again formant to carefu
ching time (
(b)
HCl: (a) burt) (b) precip
welling aneding of the
mplate mayng properti
m clusters wully determi
15
(hours)
ulk magnetipitate magn
d shrinkagee residual te
y act as a es of the m
which wouldine the reco
Uranyl i
Magnet
ic IIP (Withnetic IIP.
e of the memplates em
nucleation media are cd then be thovered temp
0
2
4
6
8
20
Iron
conc
entr
atio
n (m
g L
-1)
on
tite
h the
magnetic mbedded
site for changing he actual plate and
oco
cea
o(
g)
83
5.1.4.1 Atomic force microscopy (AFM)
Imaging of unleached magnetic IIPs using tapping mode AFM proved difficult, as the tip was repelled from the surface it was supposed to image. The encircled black spots highlighted in the optical view of the magnetic IIP in Figure 5.25 are the magnetic particles responsible for this repulsion. However, imaging of the leached magnetic polymers was successful. This was made possible by the fact that some magnetite was lost during leaching hence the residual magnetite did not have sufficient power to repel the AFM probing tip.
Figures 5.26 and 5.27 are the AFM images of 20 µm2 magnetic IIPs leached with 1M NaHCO3 and 1M HCl solutions respectively. From the two Figures and the surface roughness data in Figure 5.29, it can be concluded that HCl was stronger leachant than NaHCO3. Figure 5.30 shows a three dimensional AFM image of NaHCO3 leached polymer and it clearly shows the pores formed by the leaching of the uranyl ions from the polymer surface.
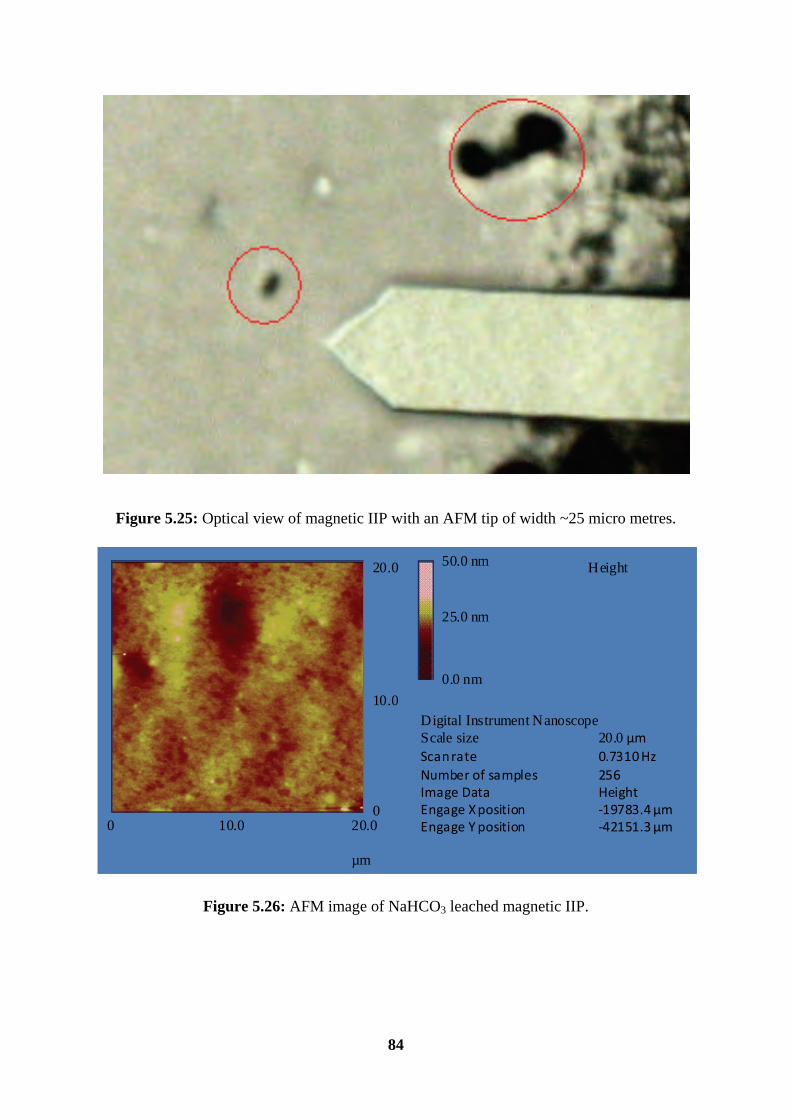
84
Figure 5.25: Optical view of magnetic IIP with an AFM tip of width ~25 micro metres.
Figure 5.26: AFM image of NaHCO3 leached magnetic IIP.
0
10.0
10.0 20.0
20.0
0
50.0 nm
25.0 nm
0.0 nm
Digital Instrument NanoscopeScale size 20.0 µmScan rate 0.7310 HzNumber of samples 256Image Data HeightEngage X position -19783.4 µmEngage Y position -42151.3 µm
Height
µm

0
Figure 5.28
Figure 5.2
8: Image ro
10.0
27: AFM im
oughness of
µm
20.
85
mage of HCl
f the NaHCO
0
3
6
DigScaScaNumImaEngEng
m
20.0
10.0
0.0
l leached ma
O3 and HCl
0.0 nm
30.0 nm
60.0 nm
gital Instrumale sizean ratember of samage Datagage X positigage Y positi
agnetic IIP.
leached ma
Height
ment Nanosco
mples
onon
.
agnetic IIPs
ope20.0 µm1.001 Hz256Height-19783.4 -42151.3
.
µmµm

86
Figure 5.29: A three dimensional AFM image of NaHCO3 leached polymer.
5.1.4.2 Brunauer, Emmett and Teller (BET) surface area analysis
Typical BET surface area measurement is given in Figures 5.30. The results demonstrated that there was an increase in the surface area of the magnetic polymers as a result of leaching action. The bulk unleached IIP had a measured surface area of 8.8 m² g-1 whilst that of the corresponding HCl and NaHCO3 leached were increased to 88.1 and 65.2 m² g-1 respectively. These values are single point surface area measured at p/po = 0.2998. The results show consistence with the other characterization techniques, like the AFM results. These results show that the leaching with HCl resulted in magnetic polymers with a greater surface area. This is because there was a greater leaching of the uranyl from the polymer as well as the magnetic core as supported by the EDS results. The removal of these two ions left some voids which enhanced the surface area, because these pores became available for the nitrogen adsorption in the BET analysis. On the other hand, leaching with NaHCO3 did not remove the uranyl as well as the magnetite completely. The implication of this is that the BET surface area was kept low because some of these two ions are still much present and embedded in the polymer matrix of the magnetic IIPs. The monomolecular layer volume, vm and BET constant, c, for the bulk polymers were calculated from the slopes and intercepts of such plots such as in Figure 5.30 and the results are summarized in Table 5.4.
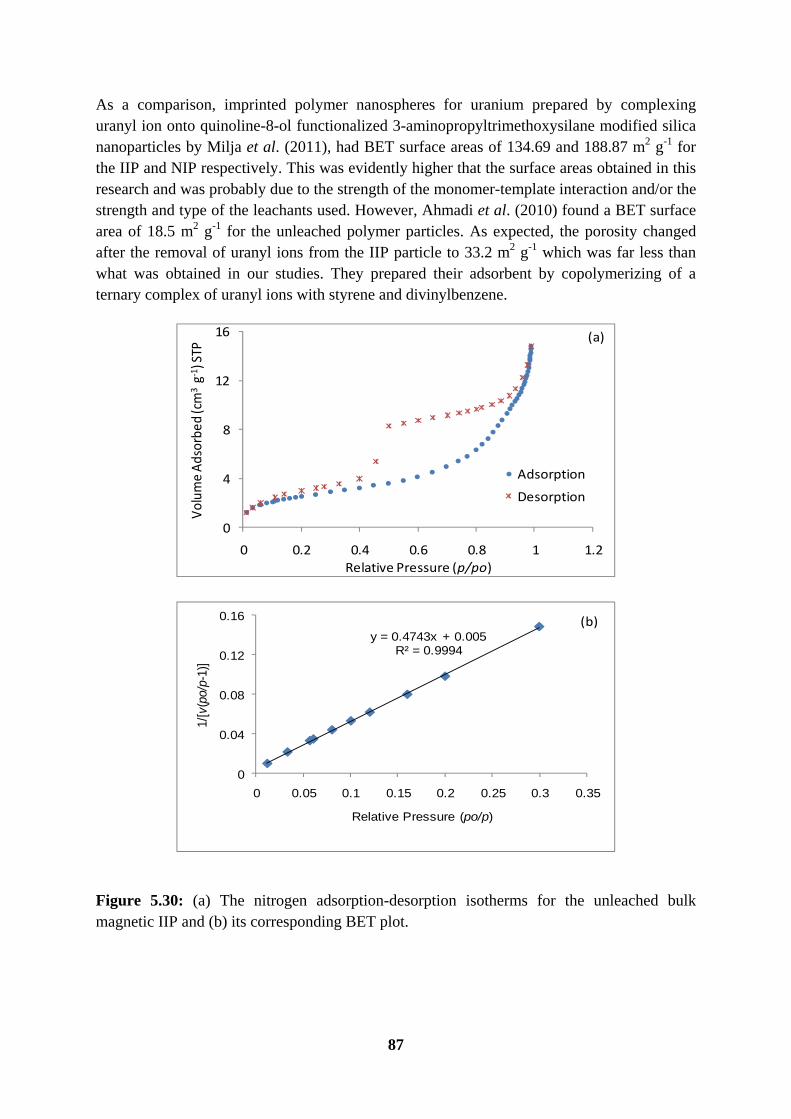
87
As a comparison, imprinted polymer nanospheres for uranium prepared by complexing uranyl ion onto quinoline-8-ol functionalized 3-aminopropyltrimethoxysilane modified silica nanoparticles by Milja et al. (2011), had BET surface areas of 134.69 and 188.87 m2 g-1 for the IIP and NIP respectively. This was evidently higher that the surface areas obtained in this research and was probably due to the strength of the monomer-template interaction and/or the strength and type of the leachants used. However, Ahmadi et al. (2010) found a BET surface area of 18.5 m2 g-1 for the unleached polymer particles. As expected, the porosity changed after the removal of uranyl ions from the IIP particle to 33.2 m2 g-1 which was far less than what was obtained in our studies. They prepared their adsorbent by copolymerizing of a ternary complex of uranyl ions with styrene and divinylbenzene.
0
4
8
12
16
0 0.2 0.4 0.6 0.8 1 1.2
Volu
me A
dsor
bed (
cm3
g-1) S
TP
Relative Pressure (p/po)
Adsorption
Desorption
(a)
y = 0.4743x + 0.005R² = 0.9994
0
0.04
0.08
0.12
0.16
0 0.05 0.1 0.15 0.2 0.25 0.3 0.35
1/[v
(po/
p-1)
]
Relative Pressure (po/p)
(b)
Figure 5.30: (a) The nitrogen adsorption-desorption isotherms for the unleached bulk magnetic IIP and (b) its corresponding BET plot.
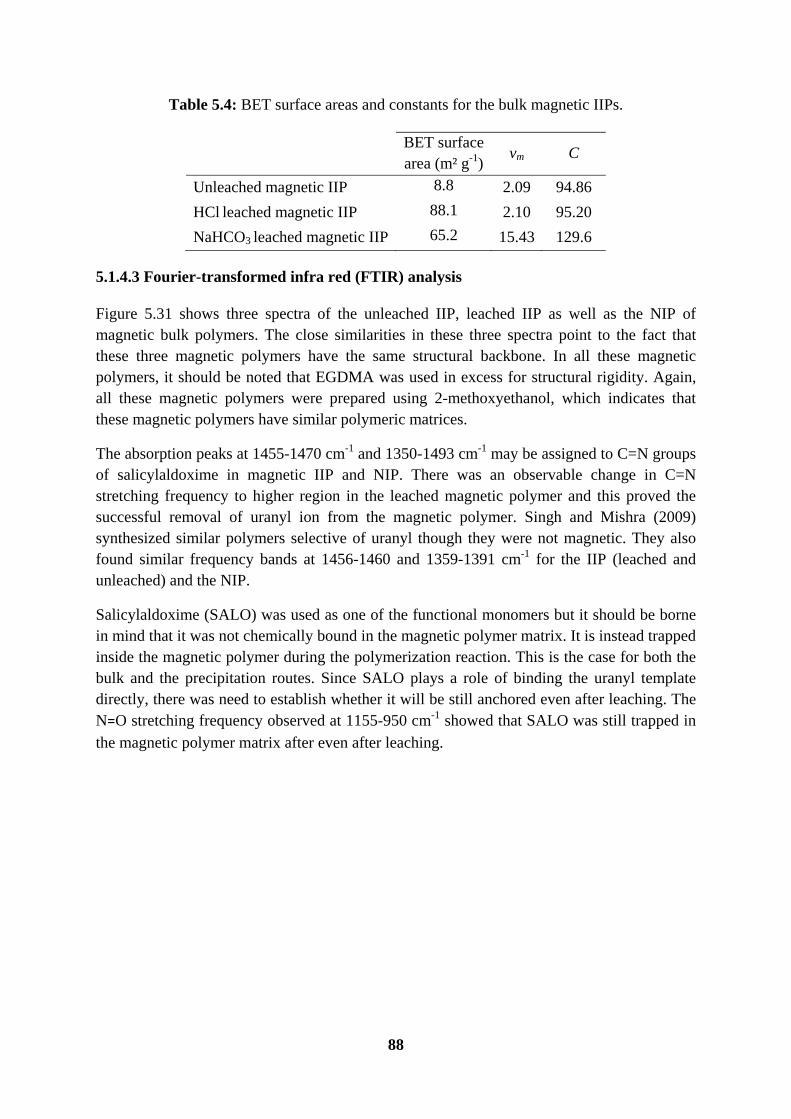
88
Table 5.4: BET surface areas and constants for the bulk magnetic IIPs.
BET surface area (m² g-1)
vm C
Unleached magnetic IIP 8.8 2.09 94.86
HCl leached magnetic IIP 88.1 2.10 95.20
NaHCO3 leached magnetic IIP 65.2 15.43 129.6
5.1.4.3 Fourier-transformed infra red (FTIR) analysis
Figure 5.31 shows three spectra of the unleached IIP, leached IIP as well as the NIP of magnetic bulk polymers. The close similarities in these three spectra point to the fact that these three magnetic polymers have the same structural backbone. In all these magnetic polymers, it should be noted that EGDMA was used in excess for structural rigidity. Again, all these magnetic polymers were prepared using 2-methoxyethanol, which indicates that these magnetic polymers have similar polymeric matrices.
The absorption peaks at 1455-1470 cm-1 and 1350-1493 cm-1 may be assigned to C=N groups of salicylaldoxime in magnetic IIP and NIP. There was an observable change in C=N stretching frequency to higher region in the leached magnetic polymer and this proved the successful removal of uranyl ion from the magnetic polymer. Singh and Mishra (2009) synthesized similar polymers selective of uranyl though they were not magnetic. They also found similar frequency bands at 1456-1460 and 1359-1391 cm-1 for the IIP (leached and unleached) and the NIP.
Salicylaldoxime (SALO) was used as one of the functional monomers but it should be borne in mind that it was not chemically bound in the magnetic polymer matrix. It is instead trapped inside the magnetic polymer during the polymerization reaction. This is the case for both the bulk and the precipitation routes. Since SALO plays a role of binding the uranyl template directly, there was need to establish whether it will be still anchored even after leaching. The N=O stretching frequency observed at 1155-950 cm-1 showed that SALO was still trapped in
the magnetic polymer matrix after even after leaching.

5.1.4.4
Thermothe magenvironused for
The TGheating 5.38, itconsidedecomp
From Fof the decompbulk anexplainmagnet
Figure 5.3
Thermo-gr
o-gravimetrignetic parti
nment to prr further str
GA spectra ithroughou
t was noteered to be thposition was
Figure 5.35, γ-MPS-Fe
posed organnd precipitated by the fic core as w
1: Fourier-t
ravimetric
ic analysis icles (Zhan revent the oructural eluc
in Figures 5ut the tempeed that thehe decompos 393°C.
it was also
3O4 was 6nic surface cte magnetic fact that th
well, Figures
transformed
analysis (T
was employet al., 201
oxidation ocidation of t
5.32, 5.33 aerature range decompososition of th
o observed t69.17%. Thcoating agepolymers r
he leaching s 5.33 and 5
89
d infra red s
TGA)
yed to quan1). The ana
of the Fe3Othe γ-MPS-
and 5.34 shoge of 0-100sition temp
he coating ag
that after thhis meant
ent, γ-MPS. reduced the of the uran
5.34.
pectra for γ
ntify the amalysis was
4. Thermo-Fe3O4.
owed that th00oC. Fromperature at gent γ-MPS
e analysis, that the oIt was alsoresidual we
nyl resulted
γ-MPS based
mount of Fe3
carried out gravimetric
he magnetitm the first d
305oC waS. The temp
at 1000oC, other 30.83
o noted that eight signifid in the wa
d polymers
3O4 encapsut in an oxygc analysis w
te was stabderivative inas the temperature of m
the residua3% was frthe leachin
ficantly. Thiashing away
.
ulated in gen free was also
le under n Figure
mperature maximal
al weight rom the ng of the is can be y of the

90
Figure 5.32: Thermo-gravimetric analysis results for γ-MPS-Fe3O4.
Figure 5.33: Thermo-gravimetric analysis of precipitation magnetic polymers.
-2
-1.5
-1
-0.5
0
0.5
0
20
40
60
80
100
120
0 200 400 600 800 1000
Deriv
ativ
e w
eigh
t (%
/min
)
Wei
ght (
%)
Temperature (OC)
0
20
40
60
80
100
0 200 400 600 800 1000
Perc
enta
ge w
eigh
t los
s (%
)
Temperature (oC)
Magnetite
MPS-magnetite
HCl leached IIP
NaHCO3 leached IIP
Washed NIP
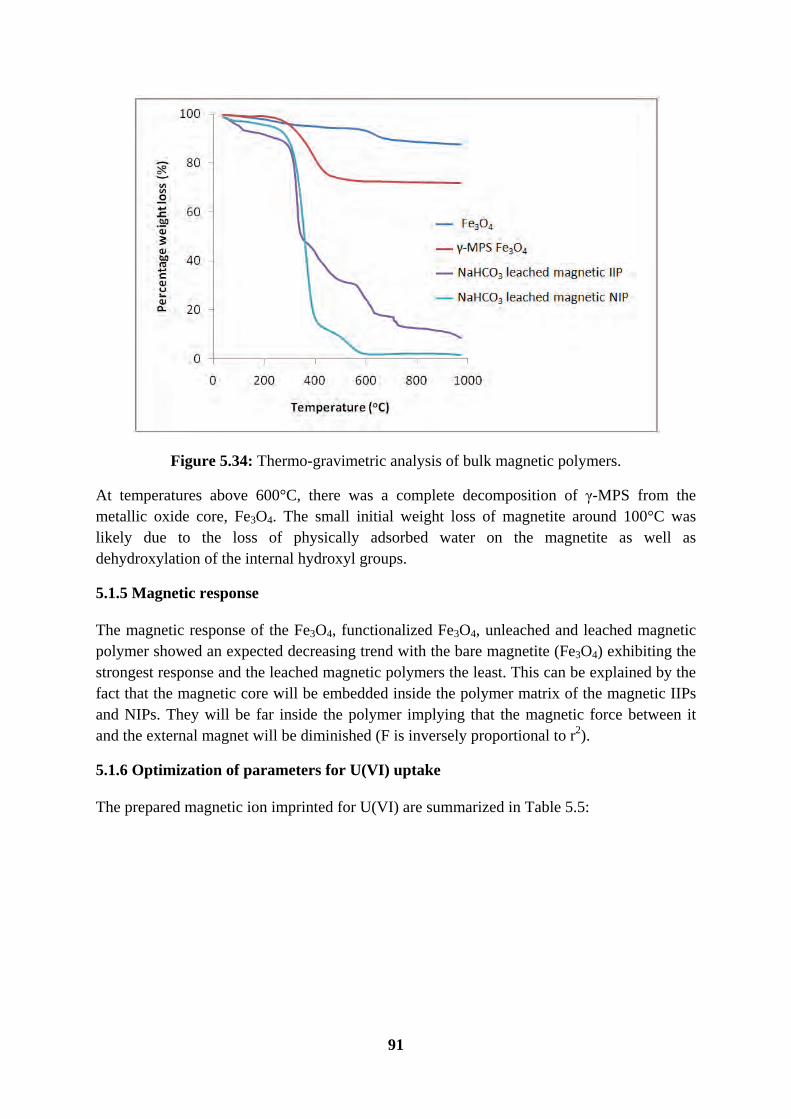
91
Figure 5.34: Thermo-gravimetric analysis of bulk magnetic polymers.
At temperatures above 600°C, there was a complete decomposition of γ-MPS from the metallic oxide core, Fe3O4. The small initial weight loss of magnetite around 100°C was likely due to the loss of physically adsorbed water on the magnetite as well as dehydroxylation of the internal hydroxyl groups.
5.1.5 Magnetic response
The magnetic response of the Fe3O4, functionalized Fe3O4, unleached and leached magnetic polymer showed an expected decreasing trend with the bare magnetite (Fe3O4) exhibiting the strongest response and the leached magnetic polymers the least. This can be explained by the fact that the magnetic core will be embedded inside the polymer matrix of the magnetic IIPs and NIPs. They will be far inside the polymer implying that the magnetic force between it and the external magnet will be diminished (F is inversely proportional to r2).
5.1.6 Optimization of parameters for U(VI) uptake
The prepared magnetic ion imprinted for U(VI) are summarized in Table 5.5:

92
Table 5.5: Summary of the prepared types of magnetic ion imprinted polymers for U(VI).
Polymer number
Type of polymerisation Coating agent Leaching solution
1 Bulk Oleic acid HCl
2 Bulk Oleic acid NaHCO3
3 Bulk γ-MPS HCl
4 Bulk γ-MPS NaHCO3
5 Precipitation Oleic acid HCl
6 Precipitation Oleic acid NaHCO3
7 Precipitation γ-MPS HCl
8 Precipitation γ-MPS NaHCO3
For each type of magnetic ion imprinted polymer, the corresponding non imprinted polymer was also prepared giving four non imprinted polymer types. This was used for comparison and as control.
5.1.6.1 Effect of sample pH
The adsorption efficiencies of uranyl ions by magnetic polymers at various pH values are presented in Figures 5.36-5.39.
The general trend for all magnetic polymers was as expected, i.e. the magnetic IIPs had superior extraction efficiencies compared to their corresponding magnetic NIPs. Bearing in mind that the magnetic polymers are to be used in AMD there was a need to investigate the efficiency of these magnetic IIPs and NIPs in acidic conditions as well. The variation of the adsorption percentages with the pH is clearly noticeable as they are lower in acidic medium whereas at pH > 4, the adsorption of uranium reached the maximum.
This result is important as it indicates that the pH plays an influential role in the adsorption of uranium. Complex formation between 4-VP, SALO, MAA and uranyl ions present in a sample is pH dependent. The low uptake of uranium at low pH values may be due to the fact that there is a higher concentration of H+ ions which are preferentially adsorbed ahead of uranium.
Another point for the low uptake of uranium at low pH is that the amine and the hydroxyl chelating groups in the polymer matrix are protonated. This protonation means that the lone pairs for coordination with the cationic uranyl will not be present for coordination. There will be rather electrostatic repulsion of the cationic uranyl from the adsorption sites in the

magnetexperim
In anothHowevechitosansome fupH (= 5uranyl uoligome
Figure the nitsalicylacoordin
Figure uranyl i
Figure conditioconcentroom te
ic polymer ments.
her study iner they usedn which alsunctional gr5) as that ouptake afteeric and mo
5.35 showstrogens onaldoxime. Bnate bonding
5.35: Uranions.
5.36: Effons: Amoutration, 2 memperature.
0
20
40
60
80
100
120
140
% E
xtra
ctio
n ef
ficie
ny
matrix. Th
nvolving urd a differeno performedroups withinobtained in er the optimonomeric hy
s that the atn 4-vinyl pBoth these ag.
ium imprint
fect of samunt of magmg L-1; con
0
he optimum
anyl uptakent adsorbentd poorly at n the adsorbthis work
mum value aydrolyzed sp
oms responpyridine a
atoms have
ted polymer
mple pH fognetic polyntact time, 4
2
93
m pH was ta
e, Wang et t in the formlower pH a
bent. Zhou (= 4). Howand they atpecies of ur
nsible for thand salicylalone pairs o
r showing h
for OA IIPymer, 20 m45 minutes
4pH
aken to be 4
al. (2011) om of ethyle
and this waset al. (2012
wever they ttributed thiranyl.
he coordinataldoxime aof electrons
heteroatoms
P bulk NaHmg; samples; stirring sp
6
4 and was u
obtained anenediamine-s also as a re2) obtained aexperiencedis to the fo
tion with thas well ass which are
s responsible
HCO3 leace volume, peed, 1500
8
used in sub
n optimum p-modified mesult of proan almost od a decreasormation of
he uranyl cas the oxyresponsible
e for the up
ched. Exper25 mL; u
0 rpm; temp
10
bsequent
pH of 3. magnetic tonation
optimum se in the f various
ation are ygen on e for the
ptake of
rimental uranium perature,
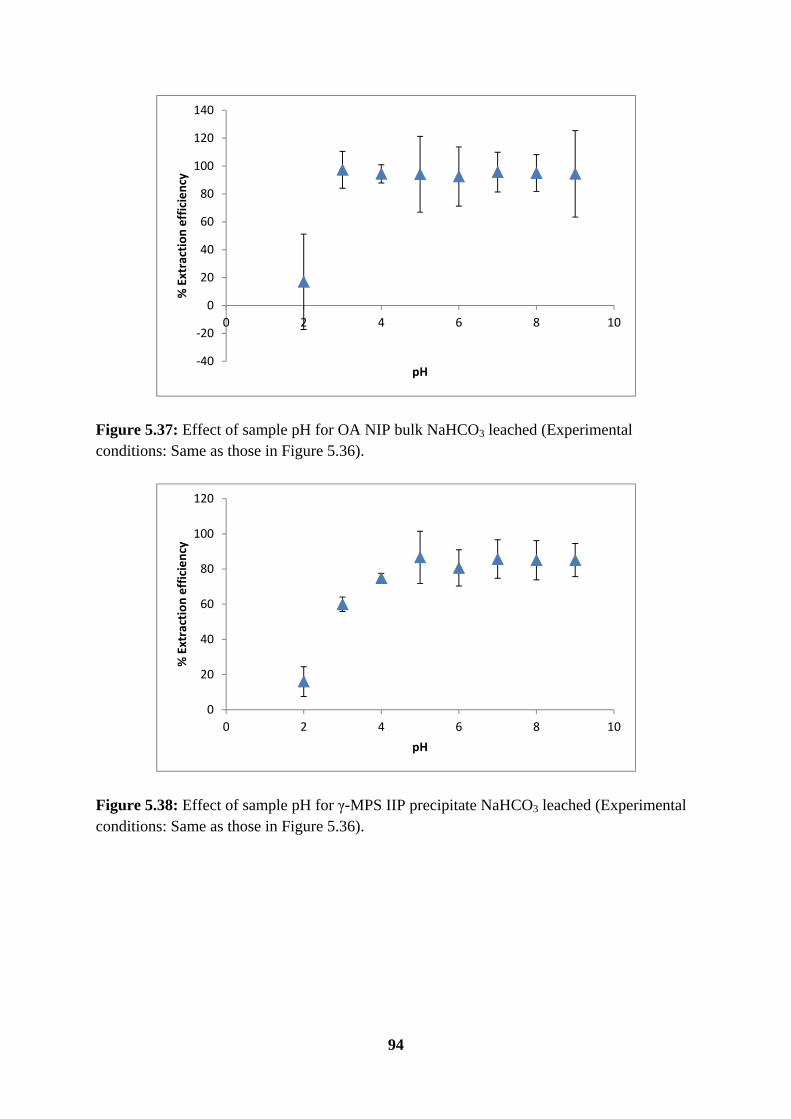
94
Figure 5.37: Effect of sample pH for OA NIP bulk NaHCO3 leached (Experimental conditions: Same as those in Figure 5.36).
Figure 5.38: Effect of sample pH for γ-MPS IIP precipitate NaHCO3 leached (Experimental conditions: Same as those in Figure 5.36).
-40
-20
0
20
40
60
80
100
120
140
0 2 4 6 8 10
% E
xtra
ctio
n ef
ficie
ncy
pH
0
20
40
60
80
100
120
0 2 4 6 8 10
% E
xtra
ctio
n ef
ficie
ncy
pH
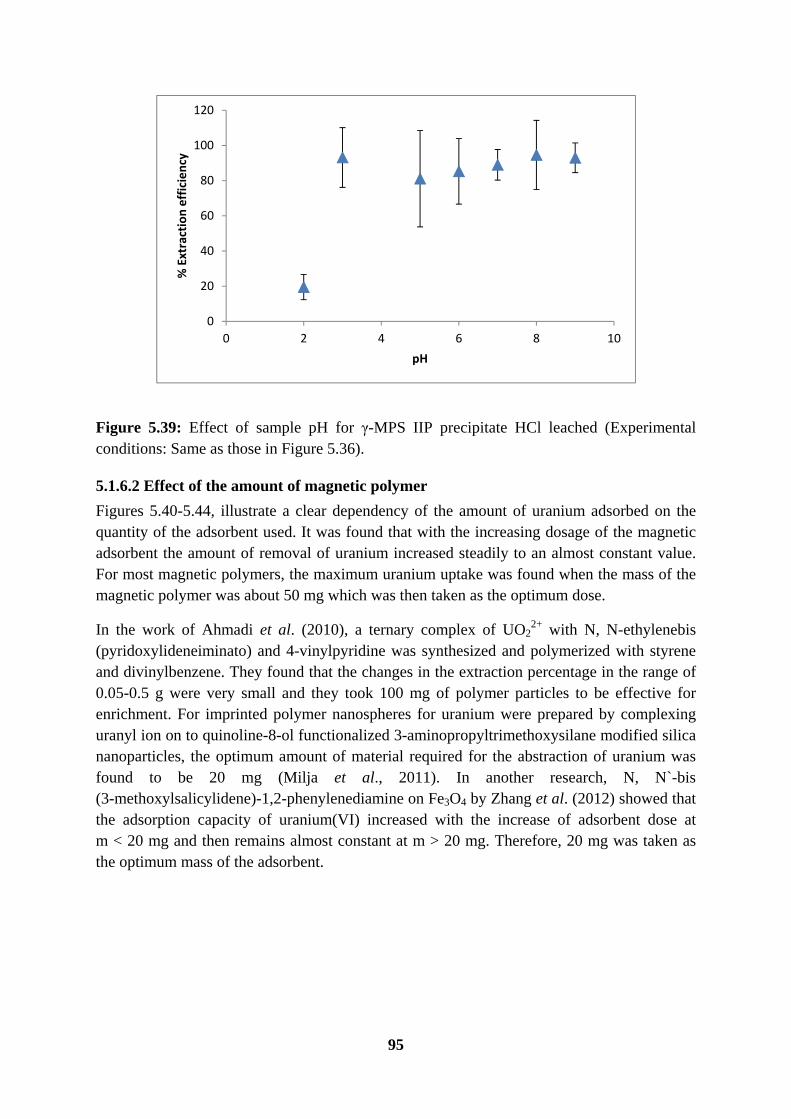
95
Figure 5.39: Effect of sample pH for γ-MPS IIP precipitate HCl leached (Experimental conditions: Same as those in Figure 5.36).
5.1.6.2 Effect of the amount of magnetic polymer
Figures 5.40-5.44, illustrate a clear dependency of the amount of uranium adsorbed on the quantity of the adsorbent used. It was found that with the increasing dosage of the magnetic adsorbent the amount of removal of uranium increased steadily to an almost constant value. For most magnetic polymers, the maximum uranium uptake was found when the mass of the magnetic polymer was about 50 mg which was then taken as the optimum dose.
In the work of Ahmadi et al. (2010), a ternary complex of UO22+ with N, N-ethylenebis
(pyridoxylideneiminato) and 4-vinylpyridine was synthesized and polymerized with styrene and divinylbenzene. They found that the changes in the extraction percentage in the range of 0.05-0.5 g were very small and they took 100 mg of polymer particles to be effective for enrichment. For imprinted polymer nanospheres for uranium were prepared by complexing uranyl ion on to quinoline-8-ol functionalized 3-aminopropyltrimethoxysilane modified silica nanoparticles, the optimum amount of material required for the abstraction of uranium was found to be 20 mg (Milja et al., 2011). In another research, N, N`-bis (3-methoxylsalicylidene)-1,2-phenylenediamine on Fe3O4 by Zhang et al. (2012) showed that the adsorption capacity of uranium(VI) increased with the increase of adsorbent dose at m < 20 mg and then remains almost constant at m > 20 mg. Therefore, 20 mg was taken as the optimum mass of the adsorbent.
0
20
40
60
80
100
120
0 2 4 6 8 10
% E
xtra
ctio
n ef
ficie
ncy
pH
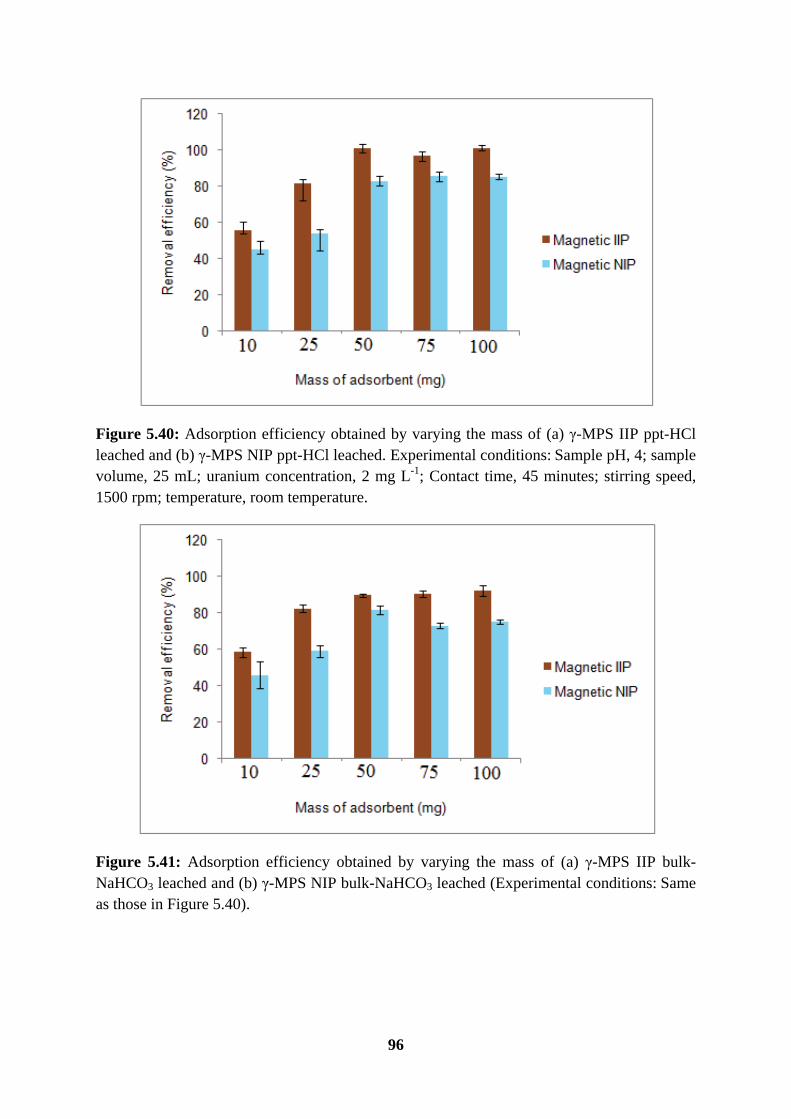
96
Figure 5.40: Adsorption efficiency obtained by varying the mass of (a) γ-MPS IIP ppt-HCl leached and (b) γ-MPS NIP ppt-HCl leached. Experimental conditions: Sample pH, 4; sample volume, 25 mL; uranium concentration, 2 mg L-1; Contact time, 45 minutes; stirring speed, 1500 rpm; temperature, room temperature.
Figure 5.41: Adsorption efficiency obtained by varying the mass of (a) γ-MPS IIP bulk-NaHCO3 leached and (b) γ-MPS NIP bulk-NaHCO3 leached (Experimental conditions: Same as those in Figure 5.40).

97
Figure 5.42: Adsorption efficiency obtained by varying the mass of (a) OA IIP bulk-NaHCO3 leached and (b) OA NIP bulk-NaHCO3 leached (Experimental conditions: Same as those in Figure 5.40).
Figure 5.43: Adsorption efficiency obtained by varying the mass of (a) γ-MPS IIP ppt-NaHCO3 leached and (b) γ-MPS NIP ppt-NaHCO3 leached (Experimental conditions: Same as those in Figure 5.40).

98
Figure 5.44: Adsorption efficiency obtained by varying the mass of (a) OA IIP ppt-NaHCO3
leached and (b) OA NIP ppt-NaHCO3 leached (Experimental conditions: Same as those in Figure 5.40).
5.1.6.3 Effect of contact time
The relationships between the amounts of uranium adsorbed and contact time for different magnetic polymers are shown in Figures 5.45-5.49. Under the used experimental conditions, it was observed that there was an increase in the amount of uranium adsorbed by all magnetic polymers from 0 to 45 minutes, after which equilibrium was reached. A contact time of 45 minutes was therefore selected as the optimum time as it was sufficient for the attainment of equilibrium. A further increase in time had no effect on the adsorption of uranium onto the magnetic polymers. As expected, the adsorption performances of the magnetic IIPs were all higher than of the corresponding magnetic NIPs.
Other studies for the selective uranyl uptake have demonstrated long abstraction times. For instance, from the prepared magnetic Schiff of N, N`-bis (3-methoxylsalicylidene)-1, 2-phenylenediamine synthesized by Zhang et al. (2012) it was observed that the adsorption rate increased rapidly during the initial stages of the adsorption process. After that, uptake rate slowly declined with lapse of time and tends to be equilibrium at 6 h. This was extremely slower than our prepared magnetic IIP. On the other hand some polymeric adsorbents which were faster in the uptake of uranium(VI) were prepared by Wang et al. (2011); Sadeghi and Aboobakri (2012); Fan et al. (2012) with the first two at 30 min and the last 16 min.
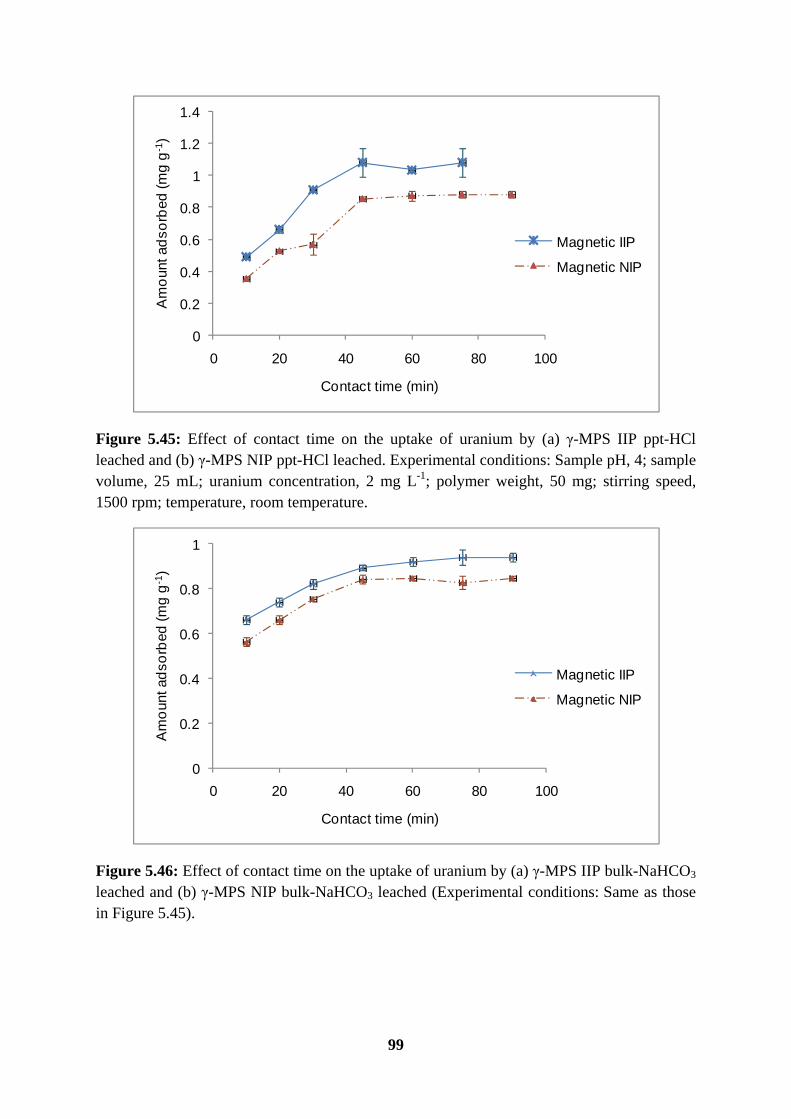
99
Figure 5.45: Effect of contact time on the uptake of uranium by (a) γ-MPS IIP ppt-HCl leached and (b) γ-MPS NIP ppt-HCl leached. Experimental conditions: Sample pH, 4; sample volume, 25 mL; uranium concentration, 2 mg L-1; polymer weight, 50 mg; stirring speed, 1500 rpm; temperature, room temperature.
Figure 5.46: Effect of contact time on the uptake of uranium by (a) γ-MPS IIP bulk-NaHCO3 leached and (b) γ-MPS NIP bulk-NaHCO3 leached (Experimental conditions: Same as those in Figure 5.45).
0
0.2
0.4
0.6
0.8
1
1.2
1.4
0 20 40 60 80 100
Am
oun
t ad
sorb
ed (m
g g
-1)
Contact time (min)
Magnetic IIP
Magnetic NIP
0
0.2
0.4
0.6
0.8
1
0 20 40 60 80 100
Am
oun
t ad
sorb
ed (m
g g
-1)
Contact time (min)
Magnetic IIP
Magnetic NIP
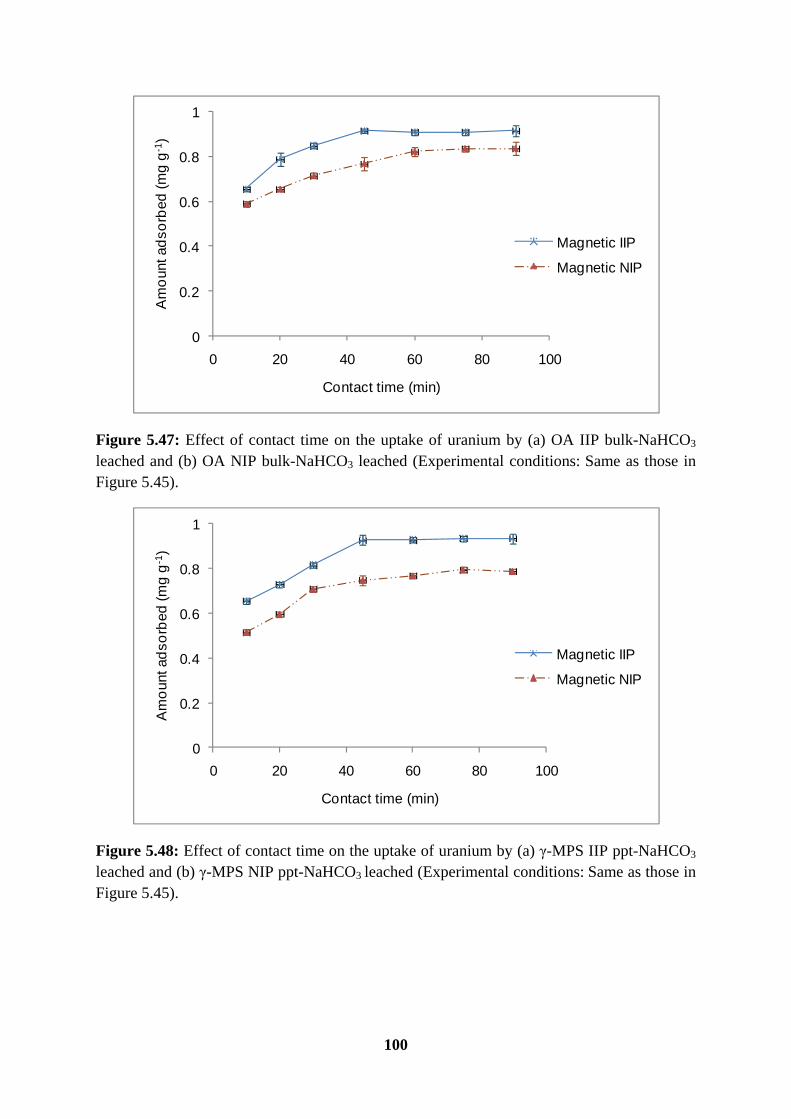
100
Figure 5.47: Effect of contact time on the uptake of uranium by (a) OA IIP bulk-NaHCO3 leached and (b) OA NIP bulk-NaHCO3 leached (Experimental conditions: Same as those in Figure 5.45).
Figure 5.48: Effect of contact time on the uptake of uranium by (a) γ-MPS IIP ppt-NaHCO3
leached and (b) γ-MPS NIP ppt-NaHCO3 leached (Experimental conditions: Same as those in Figure 5.45).
0
0.2
0.4
0.6
0.8
1
0 20 40 60 80 100
Am
oun
t ad
sorb
ed (m
g g
-1)
Contact time (min)
Magnetic IIP
Magnetic NIP
0
0.2
0.4
0.6
0.8
1
0 20 40 60 80 100
Am
oun
t ad
sorb
ed (m
g g
-1)
Contact time (min)
Magnetic IIP
Magnetic NIP

101
Figure 5.49: Effect of contact time on the uptake of uranium by (a) OA IIP ppt-NaHCO3
leached and (b) OA NIP ppt-NaHCO3 leached (Experimental conditions: Same as those in Figure 5.45).
5.1.6.4 Effect of initial uranium concentration
Figures 5.50-5.53 present the dependence of adsorption capacities of various uranium ion concentrations onto different magnetic polymers for fixed magnetic polymer dose, contact time and sample pH. A point of note is that all magnetic polymers showed similar trends. As the amount of uranium ions concentration increased so was the adsorption capacity. This can be attributed to the increasing number of U(VI) ions in solution that competed for a finite number of binding sites on the magnetic polymer surface. This equilibrium loading of uranyl ions per unit mass of the magnetic polymer increased almost linearly upon increasing the initial concentration of U(VI) ions in solution up to an adsorption capacity of between 0.8 and 1.2 mg g-1 for all polymers investigated. After reaching maximum adsorption, any further increase in the U(VI) concentration only saturated the binding sites, therefore there wasn`t any further increase in the amount of adsorbed U(VI) ions. In all cases, adsorption performance of magnetic IIPs was always higher than their corresponding magnetic NIPs.
0
0.2
0.4
0.6
0.8
1
0 20 40 60 80 100
Am
oun
t ad
sorb
ed (m
g g
-1)
Contact time (min)
Magnetic IIP
Magnetic NIP

102
Figure 5.50: Effect of initial concentration on the uptake of uranium by (a) γ-MPS IIP bulk-NaHCO3 leached and (b) γ-MPS NIP bulk-NaHCO3 leached. Experimental conditions: Sample pH, 4; sample volume, 25 mL; polymer weight, 50 mg; stirring speed, 1500 rpm; temperature, room temperature.
Figure 5.51: Effect of initial concentration on the uptake of uranium by (a) OA IIP bulk-NaHCO3 leached and (b) OA NIP bulk-NaHCO3 leached (Experimental conditions: Same as those in Figure 5.50).
0
0.2
0.4
0.6
0.8
1
1.2
1.4
0 2 4 6 8 10
Am
oun
t ad
sorb
ed (m
g g
-1)
Inintial concentration (mg L-1)
Magnetic IIP
Magnetic NIP
0
0.2
0.4
0.6
0.8
1
1.2
1.4
0 2 4 6 8 10
Am
oun
t ad
sorb
ed (m
g g
-1)
Initial concentration (mg L-1)
Magnetic IIP
Magnetic NIP
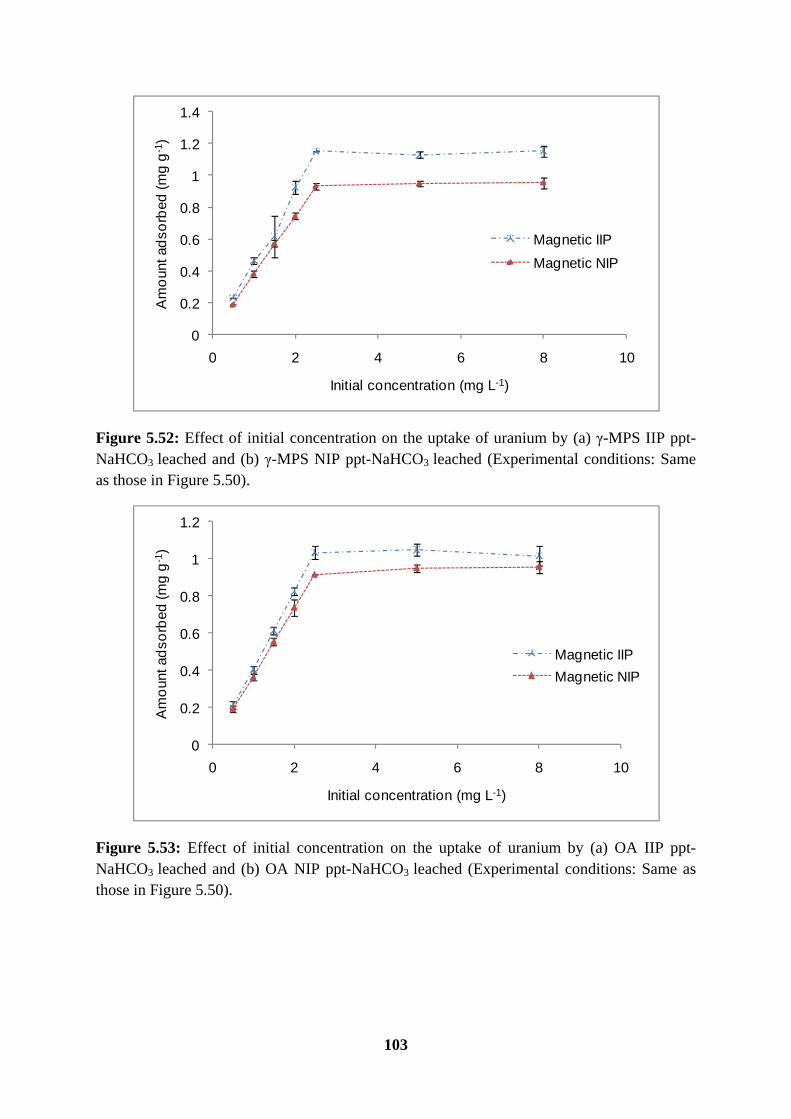
103
Figure 5.52: Effect of initial concentration on the uptake of uranium by (a) γ-MPS IIP ppt-NaHCO3 leached and (b) γ-MPS NIP ppt-NaHCO3 leached (Experimental conditions: Same as those in Figure 5.50).
Figure 5.53: Effect of initial concentration on the uptake of uranium by (a) OA IIP ppt-NaHCO3 leached and (b) OA NIP ppt-NaHCO3 leached (Experimental conditions: Same as those in Figure 5.50).
0
0.2
0.4
0.6
0.8
1
1.2
1.4
0 2 4 6 8 10
Am
oun
t ad
sorb
ed (m
g g
-1)
Initial concentration (mg L-1)
Magnetic IIP
Magnetic NIP
0
0.2
0.4
0.6
0.8
1
1.2
0 2 4 6 8 10
Am
oun
t ad
sorb
ed (m
g g
-1)
Initial concentration (mg L-1)
Magnetic IIP
Magnetic NIP
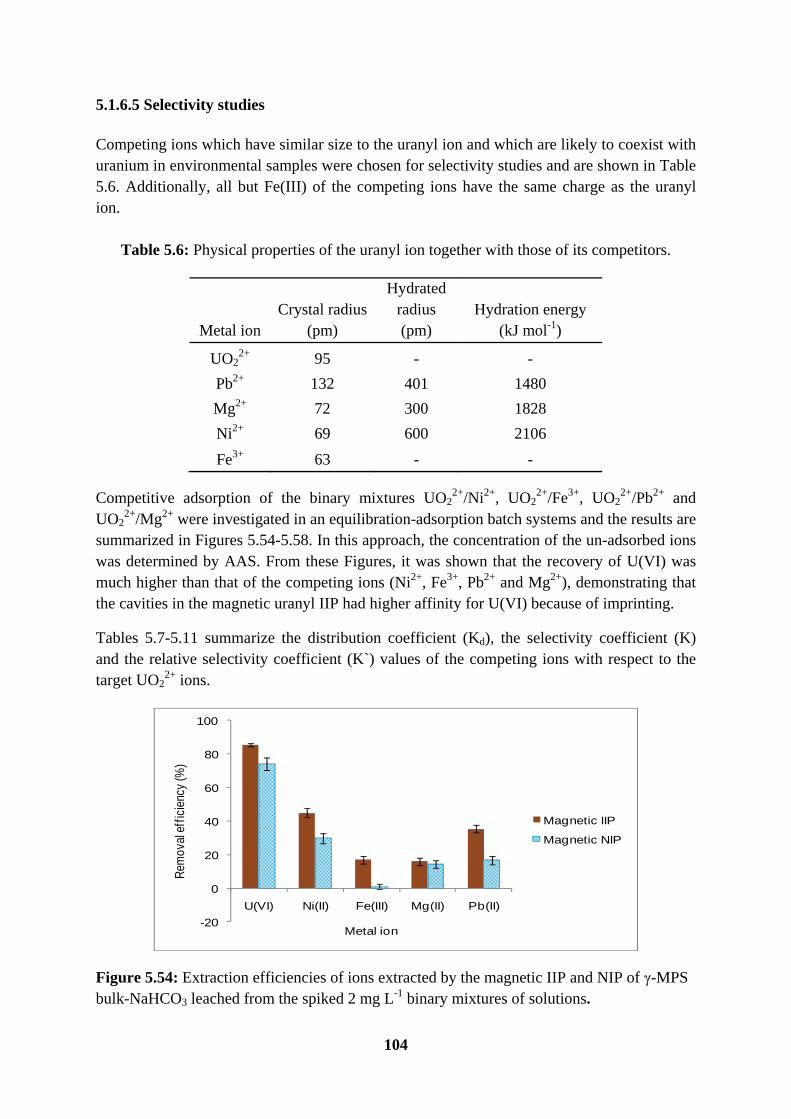
104
5.1.6.5 Selectivity studies
Competing ions which have similar size to the uranyl ion and which are likely to coexist with uranium in environmental samples were chosen for selectivity studies and are shown in Table 5.6. Additionally, all but Fe(III) of the competing ions have the same charge as the uranyl ion.
Table 5.6: Physical properties of the uranyl ion together with those of its competitors.
Metal ion Crystal radius
(pm)
Hydrated radius (pm)
Hydration energy (kJ mol-1)
UO22+ 95 - -
Pb2+ 132 401 1480
Mg2+ 72 300 1828
Ni2+ 69 600 2106
Fe3+ 63 - -
Competitive adsorption of the binary mixtures UO22+/Ni2+, UO2
2+/Fe3+, UO22+/Pb2+ and
UO22+/Mg2+ were investigated in an equilibration-adsorption batch systems and the results are
summarized in Figures 5.54-5.58. In this approach, the concentration of the un-adsorbed ions was determined by AAS. From these Figures, it was shown that the recovery of U(VI) was much higher than that of the competing ions (Ni2+, Fe3+, Pb2+ and Mg2+), demonstrating that the cavities in the magnetic uranyl IIP had higher affinity for U(VI) because of imprinting.
Tables 5.7-5.11 summarize the distribution coefficient (Kd), the selectivity coefficient (K) and the relative selectivity coefficient (K`) values of the competing ions with respect to the target UO2
2+ ions.
Figure 5.54: Extraction efficiencies of ions extracted by the magnetic IIP and NIP of γ-MPS bulk-NaHCO3 leached from the spiked 2 mg L-1 binary mixtures of solutions.
-20
0
20
40
60
80
100
U(VI) Ni(II) Fe(III) Mg(II) Pb(II)
Rem
oval
eff
icie
ncy
(%)
Metal ion
Magnetic IIP
Magnetic NIP

105
Table 5.7: Kd, K and K` values for the magnetic IIP and NIP of γ-MPS bulk-NaHCO3 in binary mixtures.
UO22+
cationic competitor
Kd (L g-1) K K` UO2
2+
IIP UO2
2+ NIP
Magnetic IIP
Magnetic NIP
Magnetic IIP
Magnetic NIP
Ni2+ 3.07 2.83 0.18 1.33 17.06 2.13 8.01
Fe3+ 2.85 2.78 5.95 0.41 0.48 6.78 0.07
Mg2+ 3.12 3.18 0.10 0.13 31.20 24.46 1.28
Pb2+ 2.93 3.03 0.33 1.17 8.88 2.59 3.43
Figure 5.55: Extraction efficiencies of the ions extracted by the magnetic IIP and NIP of γ-MPS ppt-NaHCO3 leached from the spiked 2 mg L-1 binary mixtures of solutions.
Table 5.8: Kd, K and K` values for the magnetic IIP and NIP of γ-MPS ppt- NaHCO3 leached in binary mixtures.
UO22+
cationic competitor
Kd (L g-1) K K` UO2
2+ IIP
UO22+
NIP Magnetic
IIP Magnetic
NIP Magnetic
IIP Magnetic
NIP
Ni2+ 2.03 0.85 0.12 0.61 16.92 1.39 12.17
Fe3+ 1.88 0.81 0.53 1.17 3.55 0.69 5.14
Mg2+ 1.79 0.89 0.19 0.50 9.42 1.78 5.29
Pb2+ 1.93 0.86 0.23 0.95 8.39 0.91 9.22
0
20
40
60
80
100
U(VI) Ni(II) Fe(III) Mg(II) Pb(II)
Rem
oval e
ffic
iency (%
)
Metal ion
Magnetic IIP
Magnetic NIP
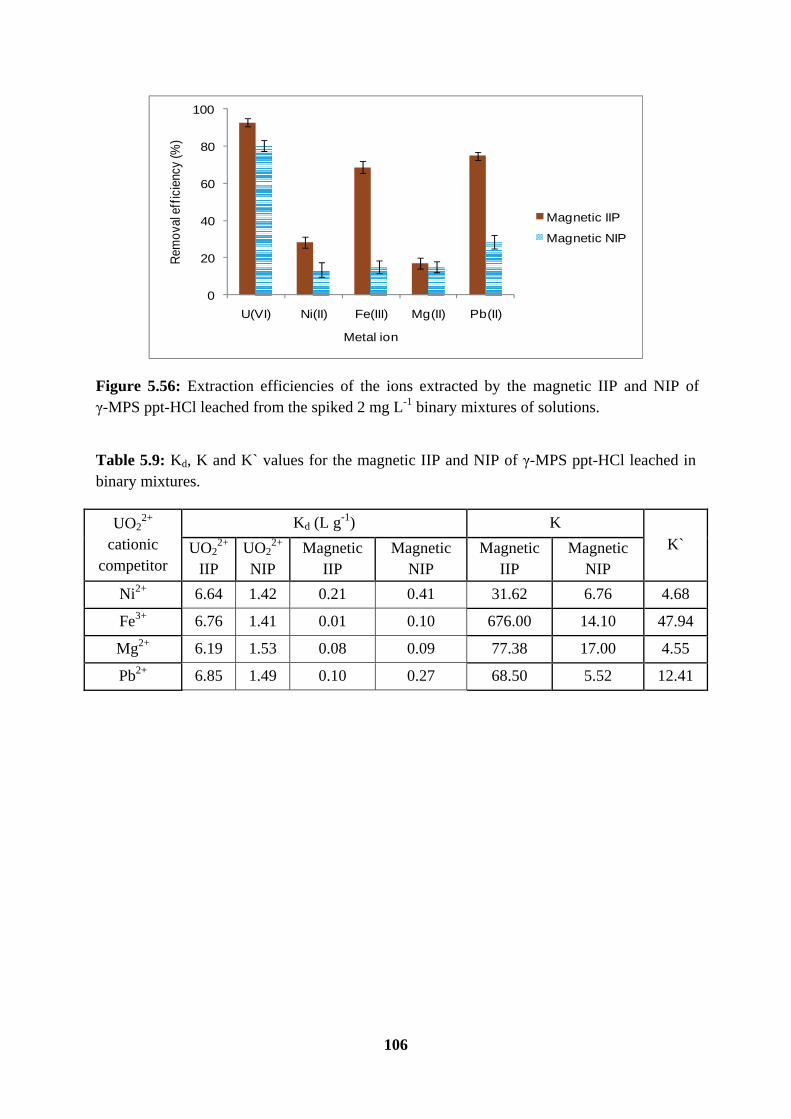
106
Figure 5.56: Extraction efficiencies of the ions extracted by the magnetic IIP and NIP of γ-MPS ppt-HCl leached from the spiked 2 mg L-1 binary mixtures of solutions.
Table 5.9: Kd, K and K` values for the magnetic IIP and NIP of γ-MPS ppt-HCl leached in binary mixtures.
UO22+
cationic competitor
Kd (L g-1) K K` UO2
2+ IIP
UO22+
NIP Magnetic
IIP Magnetic
NIP Magnetic
IIP Magnetic
NIP
Ni2+ 6.64 1.42 0.21 0.41 31.62 6.76 4.68
Fe3+ 6.76 1.41 0.01 0.10 676.00 14.10 47.94
Mg2+ 6.19 1.53 0.08 0.09 77.38 17.00 4.55
Pb2+ 6.85 1.49 0.10 0.27 68.50 5.52 12.41
0
20
40
60
80
100
U(VI) Ni(II) Fe(III) Mg(II) Pb(II)
Rem
oval
eff
icie
ncy
(%)
Metal ion
Magnetic IIP
Magnetic NIP

107
Figure 5.57: Extraction efficiencies of the ions extracted by the magnetic IIP and NIP of OA ppt-NaHCO3 leached from the spiked 2 mg L-1 binary mixtures of solutions.
Table 5.10: Kd, K and K` values for the magnetic IIP and NIP of OA ppt-NaHCO3 leached in binary mixtures.
UO22+
cationic competitor
Kd (L g-1) K K` UO2
2+ IIP
UO22+
NIP Magnetic
IIP Magnetic
NIP Magnetic
IIP Magnetic
NIP
Ni2+ 1.58 0.81 0.10 0.61 15.80 1.33 11.88
Fe3+ 1.63 0.75 0.58 1.08 2.81 0.69 4.07
Mg2+ 1.19 0.82 0.09 0.49 13.22 1.67 7.92
Pb2+ 1.84 0.63 0.41 0.84 4.49 0.75 5.99
0
20
40
60
80
100
U(VI) Ni(II) Fe(III) Mg(II) Pb(II)
Rem
ova
l eff
icie
ncy
(%
)
Metal ion
Magnetic IIP
Magnetic NIP
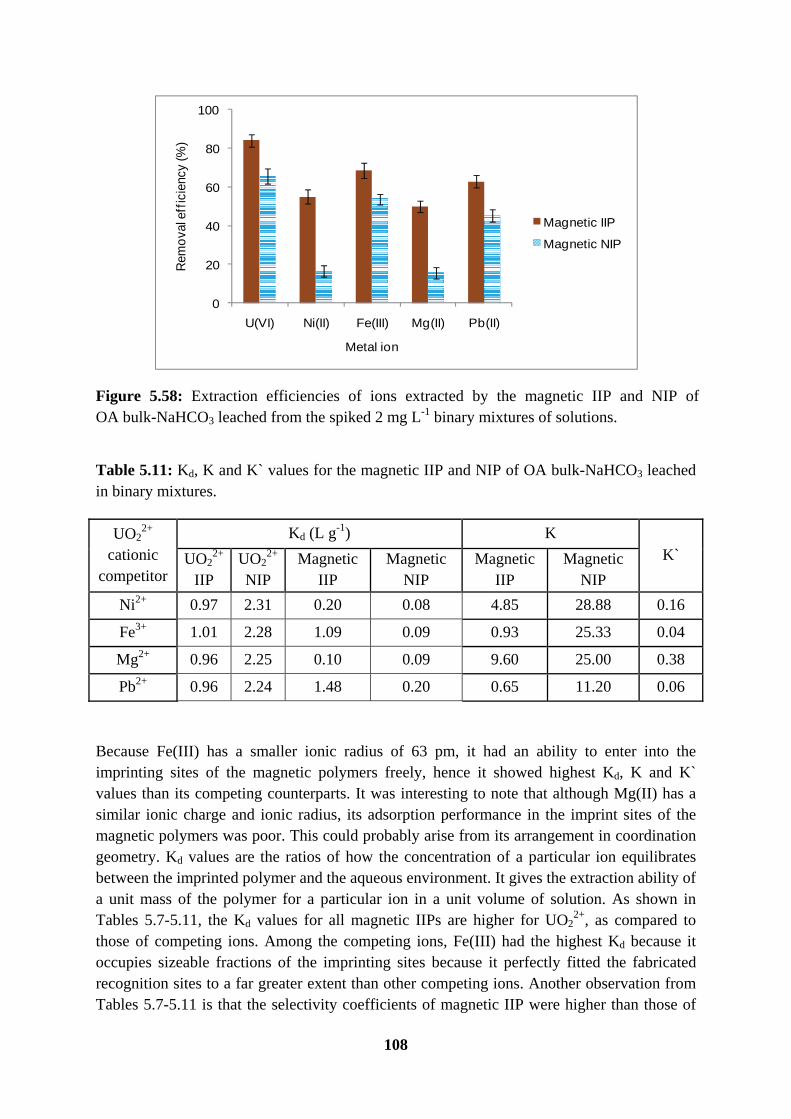
108
Figure 5.58: Extraction efficiencies of ions extracted by the magnetic IIP and NIP of OA bulk-NaHCO3 leached from the spiked 2 mg L-1 binary mixtures of solutions.
Table 5.11: Kd, K and K` values for the magnetic IIP and NIP of OA bulk-NaHCO3 leached in binary mixtures.
UO22+
cationic competitor
Kd (L g-1) K K` UO2
2+ IIP
UO22+
NIP Magnetic
IIP Magnetic
NIP Magnetic
IIP Magnetic
NIP
Ni2+ 0.97 2.31 0.20 0.08 4.85 28.88 0.16
Fe3+ 1.01 2.28 1.09 0.09 0.93 25.33 0.04
Mg2+ 0.96 2.25 0.10 0.09 9.60 25.00 0.38
Pb2+ 0.96 2.24 1.48 0.20 0.65 11.20 0.06
Because Fe(III) has a smaller ionic radius of 63 pm, it had an ability to enter into the imprinting sites of the magnetic polymers freely, hence it showed highest Kd, K and K` values than its competing counterparts. It was interesting to note that although Mg(II) has a similar ionic charge and ionic radius, its adsorption performance in the imprint sites of the magnetic polymers was poor. This could probably arise from its arrangement in coordination geometry. Kd values are the ratios of how the concentration of a particular ion equilibrates between the imprinted polymer and the aqueous environment. It gives the extraction ability of a unit mass of the polymer for a particular ion in a unit volume of solution. As shown in Tables 5.7-5.11, the Kd values for all magnetic IIPs are higher for UO2
2+, as compared to those of competing ions. Among the competing ions, Fe(III) had the highest Kd because it occupies sizeable fractions of the imprinting sites because it perfectly fitted the fabricated recognition sites to a far greater extent than other competing ions. Another observation from Tables 5.7-5.11 is that the selectivity coefficients of magnetic IIP were higher than those of
0
20
40
60
80
100
U(VI) Ni(II) Fe(III) Mg(II) Pb(II)
Rem
ova
l eff
icie
ncy
(%)
Metal ion
Magnetic IIP
Magnetic NIP
109
magnetic NIPs. The functional monomers immobilized within the polymer matrix of the host magnetic IIPs had strict configurations suitable for the guest uranyl ions. Furthermore, the ionic recognition was also influenced by the nature of metal ion, its ionic radius and charge. In conclusion, for all synthesized magnetic polymers, it was generally be deduced that the relative order of magnitude of metal sorption followed the order: UO2
2+ > Fe3+ > Pb2+ > Ni2+ > Mg2+. These results were in agreement from those of Pakade et al. (2012) who found the selectivity order UO2
2+ > Fe3+ > Cu2+ > Co2+ > Mn2+ > Zn2+ > Ni2+. Their IIP was not magnetic though, but was just a ternary complex of a uranyl imprint with 1-(prop-2-en-1-yl)-4-(pyrid-2-yl) piperazine and methacrylic acid which they crosslinked. Closer to this work, Singh and Mishra (2009) observed an almost similar trend of selectivity with the order of Th4+ > UO2
2+ > Fe3+ > Zn2+ > Co2+ > Cu2+ > Ni2+ > CrO42- > Mn2+ as
deduced from the distribution ratios they reported.
5.1.6.6 Reusability of the magnetic uranyl imprinted polymers
The repeated use of the magnetic U(VI)-imprinted polymers is a key factor that determines the applicability of these adsorbents in decontamination of wastewaters. In order to show the reusability and regeneration of the magnetic U(VI)-imprinted polymers, sorption-desorption cycles were repeated 6 times by using the same adsorbents repeatedly. These sorption-desorption cycles of the five magnetic U(VI)-imprinted polymeric sorbents with their corresponding controls are shown in Figures 5.59-5.63. The results clearly demonstrated that the magnetic U(VI) imprinted beads can be used repeatedly without significant decrease in their adsorption capacities. Similar polymers, though not magnetic, showed good reusability and stability towards uranyl ion up to the tenth cycles of repeated experiments (Singh and Mishra, 2009). For Pakade et al. 2012, the stability of the polymers were observed up to the eighth cycle of reuse, maintaining a 99% recovery of the uranyl from aqueous solution.

110
Figure 5.59: Reusability and stability of magnetic IIP and NIP of γ-MPS ppt-HCl leached. Adsorption conditions: Amount of materials, 50 mg; solution pH 4; solution volume, 25 mL; contact time, 45 min, U(VI) concentration, 2 mg L-1, Desorption conditions: Solution volume, 25 mL; contact time, 45 min, [HCl] leachant, 1 M.
Figure 5.60: Reusability and stability of magnetic IIP and NIP of γ-MPS bulk-NaHCO3 leached. Adsorption conditions: Amount of materials, 50 mg; solution pH 4; solution volume, 25 mL; contact time, 45 min, U(VI) concentration, 2 mg L-1, Desorption conditions: Solution volume, 25 mL; contact time, 45 min, [HCl] leachant, 1 M.
60
70
80
90
100
0 1 2 3 4 5 6
Rem
ova
l eff
icie
ncy
(%)
Cycle number
Magnetic IIP
Magnetic NIP
60
70
80
90
100
0 1 2 3 4 5 6
Rem
ova
l eff
icie
ncy
(%)
Cycle number
Magnetic IIP
Magnetic NIP
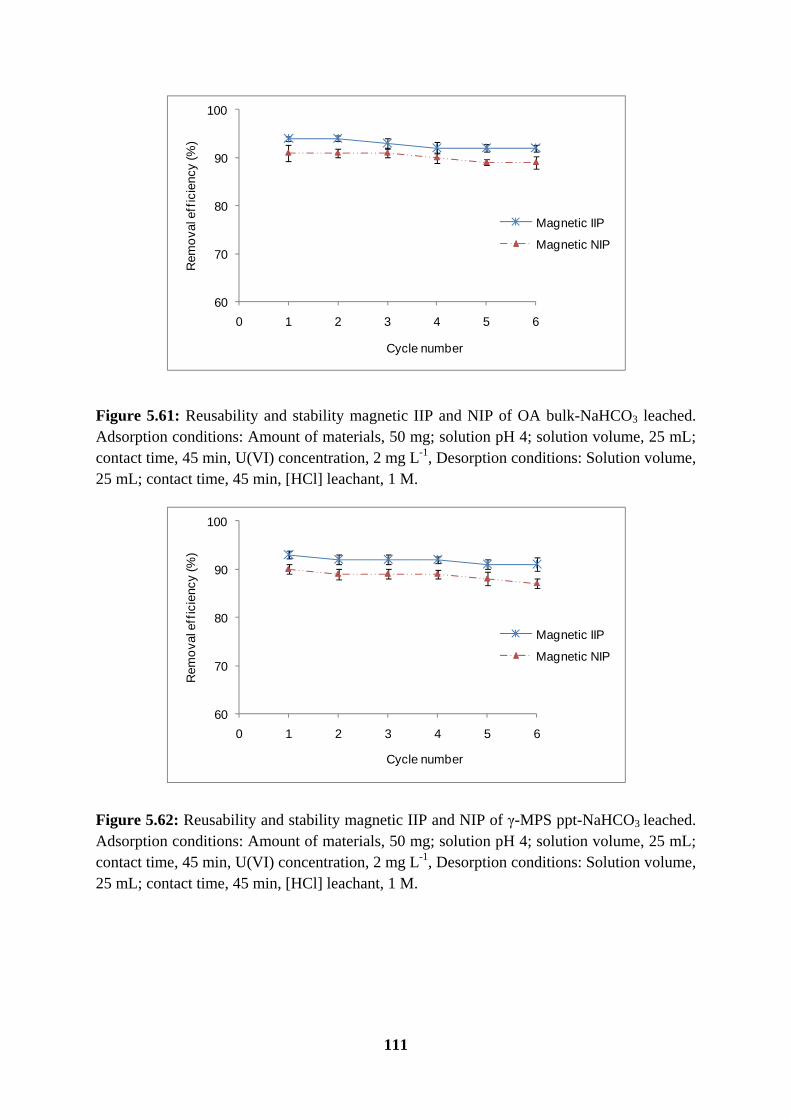
111
Figure 5.61: Reusability and stability magnetic IIP and NIP of OA bulk-NaHCO3 leached. Adsorption conditions: Amount of materials, 50 mg; solution pH 4; solution volume, 25 mL; contact time, 45 min, U(VI) concentration, 2 mg L-1, Desorption conditions: Solution volume, 25 mL; contact time, 45 min, [HCl] leachant, 1 M.
Figure 5.62: Reusability and stability magnetic IIP and NIP of γ-MPS ppt-NaHCO3 leached. Adsorption conditions: Amount of materials, 50 mg; solution pH 4; solution volume, 25 mL; contact time, 45 min, U(VI) concentration, 2 mg L-1, Desorption conditions: Solution volume, 25 mL; contact time, 45 min, [HCl] leachant, 1 M.
60
70
80
90
100
0 1 2 3 4 5 6
Rem
ova
l eff
icie
ncy
(%)
Cycle number
Magnetic IIP
Magnetic NIP
60
70
80
90
100
0 1 2 3 4 5 6
Rem
ova
l eff
icie
ncy
(%)
Cycle number
Magnetic IIP
Magnetic NIP

112
Figure 5.63: Reusability and stability magnetic IIP and NIP of OA ppt-NaHCO3 leached. Adsorption conditions: Amount of materials, 50 mg; solution pH 4; solution volume, 25 mL; contact time, 45 min, U(VI) concentration, 2 mg L-1, Desorption conditions: Solution volume, 25 mL; contact time, 45 min, [HCl] leachant, 1 M.
5.1.7 Kinetic modelling
Table 5.12 gives the calculated results of the pseudo first and second-order rate equation. When the two modelling approaches are compared, the pseudo-second-order model showed better correlation because of the high values of correlation coefficients based on the linear regression, R2 > 0.97.
Table 5.12: Summary of results of calculated kinetic parameters of pseudo-first order and pseudo-second order for U(VI) adsorption with an initial concentration of 5 mg L-1.
Pseudo first-order Pseudo second-order
Polymer* R2 k1 (L min-1) qe (mg g-1) R2 k2 (g mg-1 min-1) qe (mg g-1)
1 0.982 0.052 1.005 0.9811 0.042 1.354 2 0.928 0.093 2.163 0.9721 0.039 1.142 3 0.915 -0.026 11.32 0.9940 0.157 1.012 4 0.602 0.048 3,035 0.9976 0.183 0.910 5 0.962 0.061 0.419 0.9992 0.261 0.961 6 0.928 0.056 0.542 0.9988 0.163 0.901 7 0.885 0.088 1.100 0.9979 0.163 1.008 8 0.986 0.054 0.478 0.9988 0.163 0.859 9 0.979 0.071 0.659 0.9982 0.163 0.923 10 0.991 0.057 0.612 0.9977 0.163 0.864
Polymer*: 1. γ-MPS IIP ppt-HCl leached, 2. γ-MPS NIP ppt-HCl leached, 3. γ-MPS IIP bulk-NaHCO3 leached, 4. γ-MPS NIP bulk-NaHCO3 leached, 5. OA IIP bulk-NaHCO3 leached, 6. OA NIP bulk-NaHCO3 leached, 7. γ-MPS IIP ppt- NaHCO3 leached, 8. γ-MPS NIP ppt- NaHCO3 leached, 9. OA IIP ppt- NaHCO3 leached, 10. OA NIP ppt-NaHCO3
leached.
60
70
80
90
100
0 1 2 3 4 5 6
Rem
ova
l eff
icie
ncy
(%)
Cycle number
Magnetic IIP
Magnetic NIP
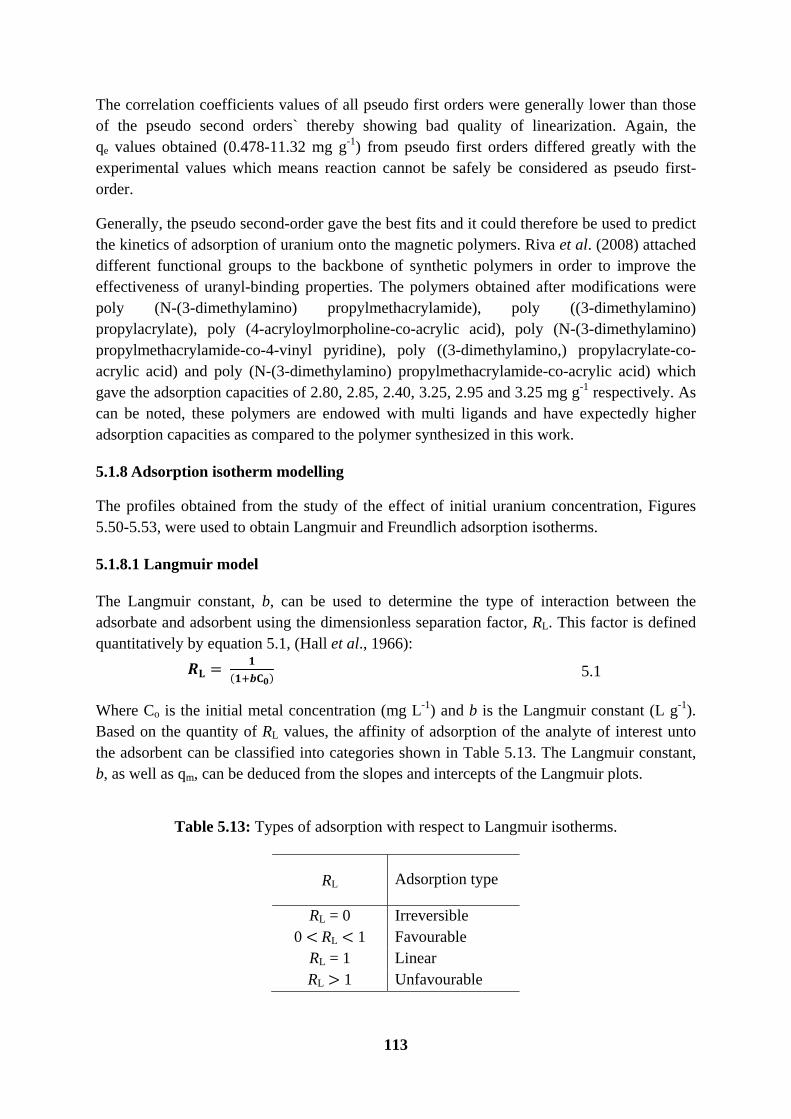
113
The correlation coefficients values of all pseudo first orders were generally lower than those of the pseudo second orders` thereby showing bad quality of linearization. Again, the qe values obtained (0.478-11.32 mg g-1) from pseudo first orders differed greatly with the experimental values which means reaction cannot be safely be considered as pseudo first-order.
Generally, the pseudo second-order gave the best fits and it could therefore be used to predict the kinetics of adsorption of uranium onto the magnetic polymers. Riva et al. (2008) attached different functional groups to the backbone of synthetic polymers in order to improve the effectiveness of uranyl-binding properties. The polymers obtained after modifications were poly (N-(3-dimethylamino) propylmethacrylamide), poly ((3-dimethylamino) propylacrylate), poly (4-acryloylmorpholine-co-acrylic acid), poly (N-(3-dimethylamino) propylmethacrylamide-co-4-vinyl pyridine), poly ((3-dimethylamino,) propylacrylate-co-acrylic acid) and poly (N-(3-dimethylamino) propylmethacrylamide-co-acrylic acid) which gave the adsorption capacities of 2.80, 2.85, 2.40, 3.25, 2.95 and 3.25 mg g-1 respectively. As can be noted, these polymers are endowed with multi ligands and have expectedly higher adsorption capacities as compared to the polymer synthesized in this work.
5.1.8 Adsorption isotherm modelling
The profiles obtained from the study of the effect of initial uranium concentration, Figures 5.50-5.53, were used to obtain Langmuir and Freundlich adsorption isotherms.
5.1.8.1 Langmuir model
The Langmuir constant, b, can be used to determine the type of interaction between the adsorbate and adsorbent using the dimensionless separation factor, RL. This factor is defined quantitatively by equation 5.1, (Hall et al., 1966):
= ( ) Where Co is the initial metal concentration (mg L-1) and b is the Langmuir constant (L g-1). Based on the quantity of RL values, the affinity of adsorption of the analyte of interest unto the adsorbent can be classified into categories shown in Table 5.13. The Langmuir constant, b, as well as qm, can be deduced from the slopes and intercepts of the Langmuir plots.
Table 5.13: Types of adsorption with respect to Langmuir isotherms.
RL Adsorption type
RL = 0 Irreversible 0 <RL < 1 Favourable
RL = 1 Linear RL > 1 Unfavourable
5.1
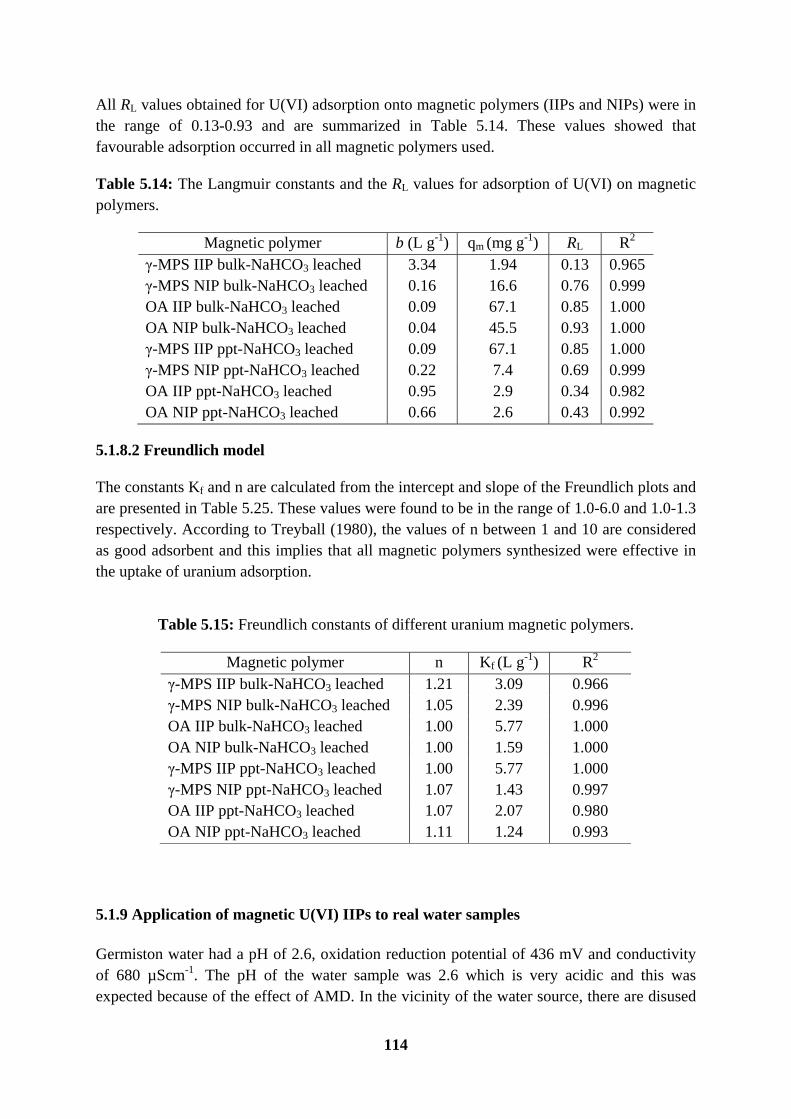
114
All RL values obtained for U(VI) adsorption onto magnetic polymers (IIPs and NIPs) were in the range of 0.13-0.93 and are summarized in Table 5.14. These values showed that favourable adsorption occurred in all magnetic polymers used.
Table 5.14: The Langmuir constants and the RL values for adsorption of U(VI) on magnetic polymers.
Magnetic polymer b (L g-1) qm (mg g-1) RL R2 γ-MPS IIP bulk-NaHCO3 leached 3.34 1.94 0.13 0.965 γ-MPS NIP bulk-NaHCO3 leached 0.16 16.6 0.76 0.999 OA IIP bulk-NaHCO3 leached 0.09 67.1 0.85 1.000 OA NIP bulk-NaHCO3 leached 0.04 45.5 0.93 1.000 γ-MPS IIP ppt-NaHCO3 leached 0.09 67.1 0.85 1.000 γ-MPS NIP ppt-NaHCO3 leached 0.22 7.4 0.69 0.999 OA IIP ppt-NaHCO3 leached 0.95 2.9 0.34 0.982 OA NIP ppt-NaHCO3 leached 0.66 2.6 0.43 0.992
5.1.8.2 Freundlich model
The constants Kf and n are calculated from the intercept and slope of the Freundlich plots and are presented in Table 5.25. These values were found to be in the range of 1.0-6.0 and 1.0-1.3 respectively. According to Treyball (1980), the values of n between 1 and 10 are considered as good adsorbent and this implies that all magnetic polymers synthesized were effective in the uptake of uranium adsorption.
Table 5.15: Freundlich constants of different uranium magnetic polymers.
Magnetic polymer n Kf (L g-1) R2 γ-MPS IIP bulk-NaHCO3 leached 1.21 3.09 0.966 γ-MPS NIP bulk-NaHCO3 leached 1.05 2.39 0.996 OA IIP bulk-NaHCO3 leached 1.00 5.77 1.000 OA NIP bulk-NaHCO3 leached 1.00 1.59 1.000 γ-MPS IIP ppt-NaHCO3 leached 1.00 5.77 1.000 γ-MPS NIP ppt-NaHCO3 leached 1.07 1.43 0.997 OA IIP ppt-NaHCO3 leached 1.07 2.07 0.980 OA NIP ppt-NaHCO3 leached 1.11 1.24 0.993
5.1.9 Application of magnetic U(VI) IIPs to real water samples
Germiston water had a pH of 2.6, oxidation reduction potential of 436 mV and conductivity of 680 µScm-1. The pH of the water sample was 2.6 which is very acidic and this was expected because of the effect of AMD. In the vicinity of the water source, there are disused
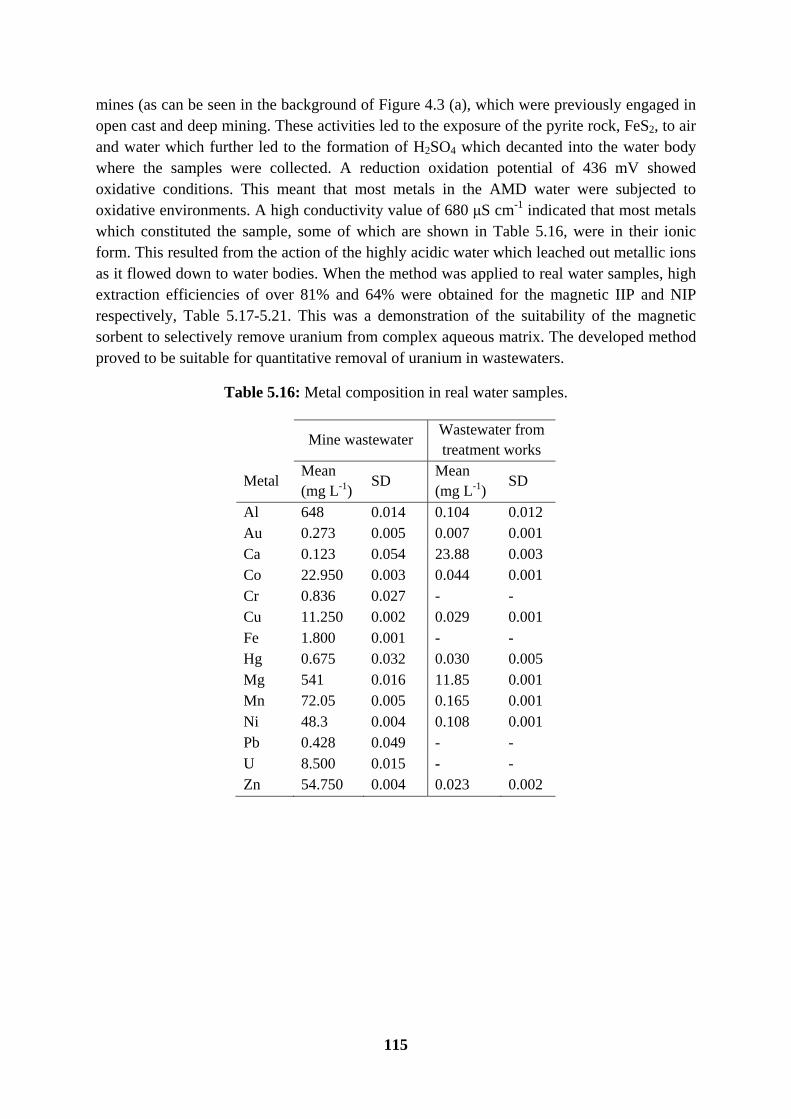
115
mines (as can be seen in the background of Figure 4.3 (a), which were previously engaged in open cast and deep mining. These activities led to the exposure of the pyrite rock, FeS2, to air and water which further led to the formation of H2SO4 which decanted into the water body where the samples were collected. A reduction oxidation potential of 436 mV showed oxidative conditions. This meant that most metals in the AMD water were subjected to oxidative environments. A high conductivity value of 680 μS cm-1 indicated that most metals which constituted the sample, some of which are shown in Table 5.16, were in their ionic form. This resulted from the action of the highly acidic water which leached out metallic ions as it flowed down to water bodies. When the method was applied to real water samples, high extraction efficiencies of over 81% and 64% were obtained for the magnetic IIP and NIP respectively, Table 5.17-5.21. This was a demonstration of the suitability of the magnetic sorbent to selectively remove uranium from complex aqueous matrix. The developed method proved to be suitable for quantitative removal of uranium in wastewaters.
Table 5.16: Metal composition in real water samples.
Mine wastewater
Wastewater from treatment works
Metal Mean (mg L-1)
SD Mean (mg L-1)
SD
Al 648 0.014 0.104 0.012 Au 0.273 0.005 0.007 0.001 Ca 0.123 0.054 23.88 0.003 Co 22.950 0.003 0.044 0.001 Cr 0.836 0.027 - - Cu 11.250 0.002 0.029 0.001 Fe 1.800 0.001 - - Hg 0.675 0.032 0.030 0.005 Mg 541 0.016 11.85 0.001 Mn 72.05 0.005 0.165 0.001 Ni 48.3 0.004 0.108 0.001 Pb 0.428 0.049 - - U 8.500 0.015 - - Zn 54.750 0.004 0.023 0.002
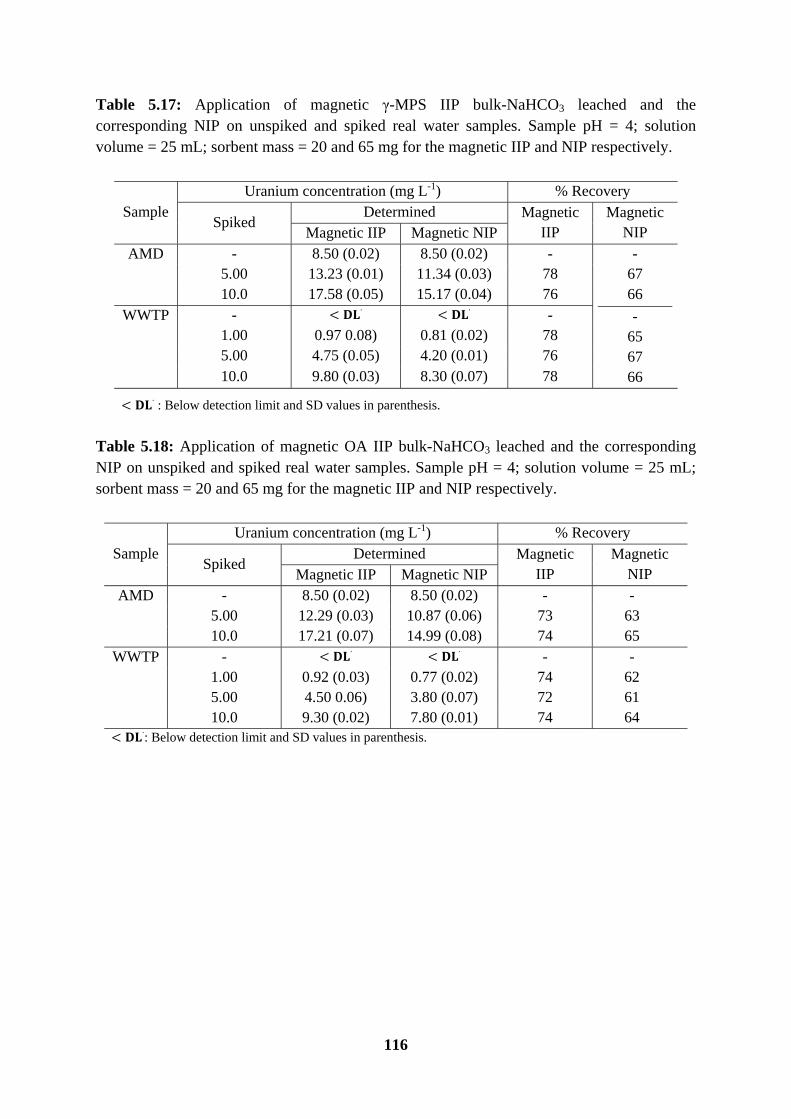
116
Table 5.17: Application of magnetic γ-MPS IIP bulk-NaHCO3 leached and the corresponding NIP on unspiked and spiked real water samples. Sample pH = 4; solution volume = 25 mL; sorbent mass = 20 and 65 mg for the magnetic IIP and NIP respectively.
Table 5.18: Application of magnetic OA IIP bulk-NaHCO3 leached and the corresponding NIP on unspiked and spiked real water samples. Sample pH = 4; solution volume = 25 mL; sorbent mass = 20 and 65 mg for the magnetic IIP and NIP respectively.
Sample Uranium concentration (mg L-1) % Recovery
Spiked Determined Magnetic
IIP Magnetic
NIP Magnetic IIP Magnetic NIP AMD - 8.50 (0.02) 8.50 (0.02) - -
67 66
- 65 67 66
5.00 13.23 (0.01) 11.34 (0.03) 78 10.0 17.58 (0.05) 15.17 (0.04) 76
WWTP - < ∙ < ∙ - 1.00 0.97 0.08) 0.81 (0.02) 78 5.00 4.75 (0.05) 4.20 (0.01) 76 10.0 9.80 (0.03) 8.30 (0.07) 78 < ∙ : Below detection limit and SD values in parenthesis.
Sample Uranium concentration (mg L-1) % Recovery
Spiked Determined Magnetic
IIP Magnetic
NIP Magnetic IIP Magnetic NIP AMD - 8.50 (0.02) 8.50 (0.02) - -
5.00 12.29 (0.03) 10.87 (0.06) 73 63 10.0 17.21 (0.07) 14.99 (0.08) 74 65
WWTP - < ∙ < ∙ - - 1.00 0.92 (0.03) 0.77 (0.02) 74 62 5.00 4.50 0.06) 3.80 (0.07) 72 61 10.0 9.30 (0.02) 7.80 (0.01) 74 64 < ∙: Below detection limit and SD values in parenthesis.

117
Table 5.19: Application of magnetic γ-MPS IIP ppt-NaHCO3 leached and the corresponding NIP on unspiked and spiked real water samples. Sample pH = 4; solution volume = 25 mL; sorbent mass = 20 and 65 mg for the magnetic IIP and NIP respectively.
Sample Uranium concentration (mg L-1) % Recovery
Spiked Determined Magnetic
IIP Magnetic
NIP Magnetic IIP Magnetic NIP AMD - 8.50 (0.02) 8.50 (0.02) - -
5.00 12.15 (0.08) 9.59 (0.07) 72 57 10.0 16.47 (0.06) 13.32 (0.03) 71 57
WWTP - ∙ ∙ - - 1.00 0.88 (0.04) 0.72 (0.02) 70 56 5.00 4.45 (0.06) 3.75 (0.02) 71 60 10.0 9.10 (0.02) 7.60 (0.02) 73 61
∙: Below detection limit and SD values in parenthesis.
Table 5.20: Application of magnetic OA IIP bulk-NaHCO3 leached and the corresponding NIP on unspiked and spiked real water samples. Sample pH = 4; solution volume = 25 mL; sorbent mass = 20 and 65 mg for the magnetic IIP and NIP respectively.
Sample Uranium concentration (mg L-1) % Recovery
Spiked Determined Magnetic
IIP Magnetic
NIP Magnetic IIP Magnetic NIP AMD - 8.50 (0.02) 8.50 (0.02) - -
5.00 11.75 (0.04) 9.18 (0.05) 70 54 10.0 15.73 (0.04) 12.40 (0.03) 68 54
WWTP - < ∙ < ∙ - - 1.00 0.87 (0.05) 0.66 (0.04) 70 53 5.00 4.30 (0.07) 3.40 (0.06) 69 54 10.0 8.70 (0.03) 6.80 (0.02) 70 54 < ∙: Below detection limit and SD values in parenthesis.

118
Table 5.21: Application of magnetic γ-MPS IIP ppt-NaHCO3 leached and the corresponding NIP on unspiked and spiked real water samples. Sample pH = 4; solution volume = 25 mL; sorbent mass = 20 and 65 mg for the magnetic IIP and NIP respectively.
5.2 Synthesis and characterization of magnetic Cr(VI) polymers
5.2.1 Synthesis of magnetic poly (4-vinylpyridine)
4-vinylpyridine was homopolymerized and copolymerized with functionalized magnetite as shown in the schemes in Figure 5.64. The expanded structure of the magnetic poly (4-vinylpyridine) is shown in Figure 5.65.
Sample Uranium concentration (mg L-1) % Recovery
Spiked Determined Magnetic
IIP Magnetic
NIP Magnetic IIP Magnetic NIP AMD - 8.50 (0.02) 8.50 (0.02) - -
5.00 10.94 (0.03) 8.75 (0.07) 65 52 10.0 15.36 (0.06) 11.47 (0.01) 66 50
WWTP - < ∙ < ∙ - - 1.00 0.82 (0.06) 0.63 (0.04) 66 50 5.00 4.15 (0.01) 3.25 (0.02) 66 52 10.0 8.10 (0.08) 6.40 (0.09) 65 51 < ∙: Below detection limit and SD values in parenthesis.

119
Figure 5.64: Synthetic routes of (a) homopolymer and (b) magnetic polymer of poly (4-vinylpyridine) where the black dot indicates γ-MPS coated magnetite.
Figure 5.65: Structure of magnetic poly (4-vinylpyridine).
5.2.2 Quaternization of magnetic poly (4-vinylpyridine)
In order to remove metallic oxy-anions in aqueous environments, a positive charge has to be introduced by contacting poly (4-vinylpyridine) particles with acids such as hydrochloric acid (Barakat and Sahiner, 2008). However, in order to introduce a permanent positive charge in the polyelectrolyte, an alkyl group was chosen in this study. N-propyl reacted with the pyridine nitrogen to give quaternized magnetic poly (4-vinylpyridine). In order to have a high positive charge building up in the polymer, a solvent of high dielectric constant should be used (Masamoto et al., 1960). In this work, DMF was used as a solvent and the bromide ions formed diffused away from the pyridinium ions of the cationic polyelectrolyte. The proposed reaction of the n-propyl bromide with magnetic poly (4-vinylpyridine) is shown in Figure 5.66.
*
N N N N
*
n
.. .. .. ..
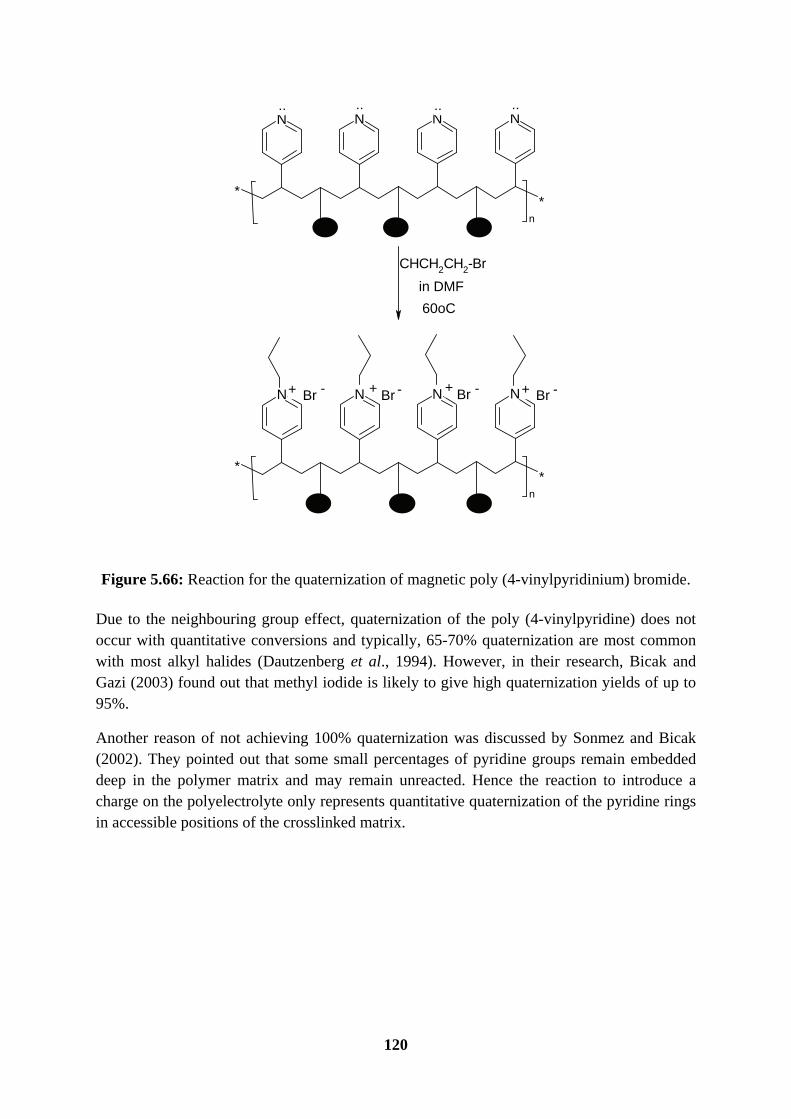
120
Figure 5.66: Reaction for the quaternization of magnetic poly (4-vinylpyridinium) bromide.
Due to the neighbouring group effect, quaternization of the poly (4-vinylpyridine) does not occur with quantitative conversions and typically, 65-70% quaternization are most common with most alkyl halides (Dautzenberg et al., 1994). However, in their research, Bicak and Gazi (2003) found out that methyl iodide is likely to give high quaternization yields of up to 95%.
Another reason of not achieving 100% quaternization was discussed by Sonmez and Bicak (2002). They pointed out that some small percentages of pyridine groups remain embedded deep in the polymer matrix and may remain unreacted. Hence the reaction to introduce a charge on the polyelectrolyte only represents quantitative quaternization of the pyridine rings in accessible positions of the crosslinked matrix.
*
N N N N
*
n
*
N N N N
*
n
CHCH2CH2-Br
+ + + +Br Br Br Br- - - -
in DMF
60oC
.... ....
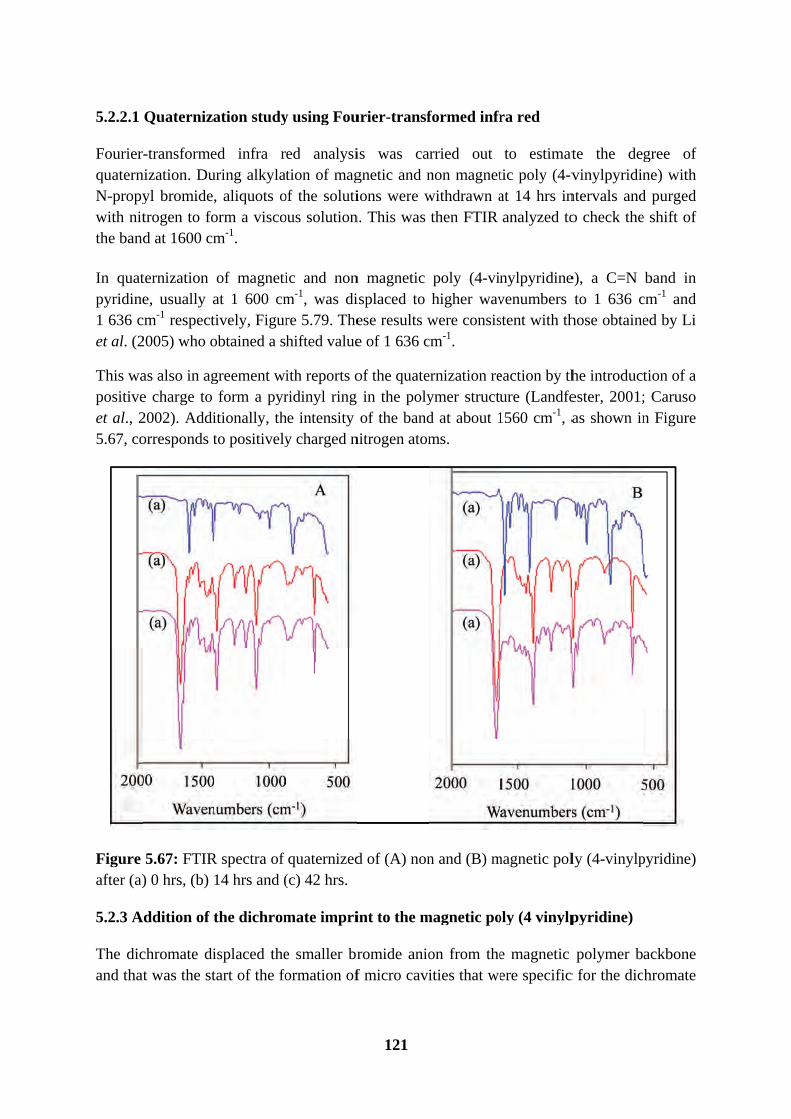
5.2.2.1
FourierquaternN-propywith nitthe band
In quatpyridine1 636 cet al. (2
This wapositiveet al., 25.67, co
Figure after (a)
5.2.3 A
The dicand that
Quaterniza
-transformenization. Duyl bromide,trogen to fod at 1600 cm
ternization e, usually a
cm-1 respect2005) who o
as also in age charge to 2002). Addiorresponds t
5.67: FTIR) 0 hrs, (b)
Addition of t
chromate dit was the st
ation study
ed infra ruring alkylat, aliquots oorm a viscom-1.
of magnetiat 1 600 cmtively, Figurobtained a s
greement wiform a pyr
itionally, thto positively
R spectra of 14 hrs and (
the dichrom
isplaced thetart of the fo
y using Fou
ed analysition of mag
of the solutious solution
ic and nonm-1, was dire 5.79. Thehifted value
ith reports oridinyl ring
he intensity y charged n
quaternized(c) 42 hrs.
mate impri
e smaller brormation of
121
urier-transf
is was cagnetic and nions were w
n. This was
n magnetic isplaced to ese results we of 1 636 c
of the quatein the polyof the band
nitrogen atom
d of (A) non
int to the m
romide aniof micro cavi
formed infr
arried out non magnetwithdrawn athen FTIR
poly (4-vinhigher wav
were consiscm-1.
ernization reymer structud at about 1ms.
n and (B) m
magnetic po
on from theities that we
ra red
to estimattic poly (4-vat 14 hrs inanalyzed to
nylpyridinevenumbers stent with th
eaction by thure (Landfe1560 cm-1, a
magnetic pol
oly (4 vinylp
e magnetic ere specific
te the devinylpyridin
ntervals ando check the
e), a C=N to 1 636 c
hose obtaine
he introductester, 2001;as shown in
ly (4-vinylp
pyridine)
polymer bc for the dic
gree of ne) with
d purged e shift of
band in cm-1 and ed by Li
tion of a ; Caruso n Figure
pyridine)
ackbone hromate

122
ion. The addition of sodium dichromate to magnetic poly (4-vinylpyridinium) bromide is demonstrated in Figure 5.68.
Figure 5.68: Substitution reaction of the bromide ions from magnetic poly (4-vinylpyridinium) bromide by dichromate ions.
5.2.3.1 Fourier-transformed infra red (FTIR) analysis
Evidence of the embedment of dichromate into the magnetic polymer is shown by the resonance peak of the Cr-O and Cr=O bonds at 943 cm-1 in the spectra in Figures 5.69. In two separate studies by Arslan et al. (2006) and Ortiz-Palacios (2008), these resonance peaks were assigned to 943 and 934 cm-1 respectively.
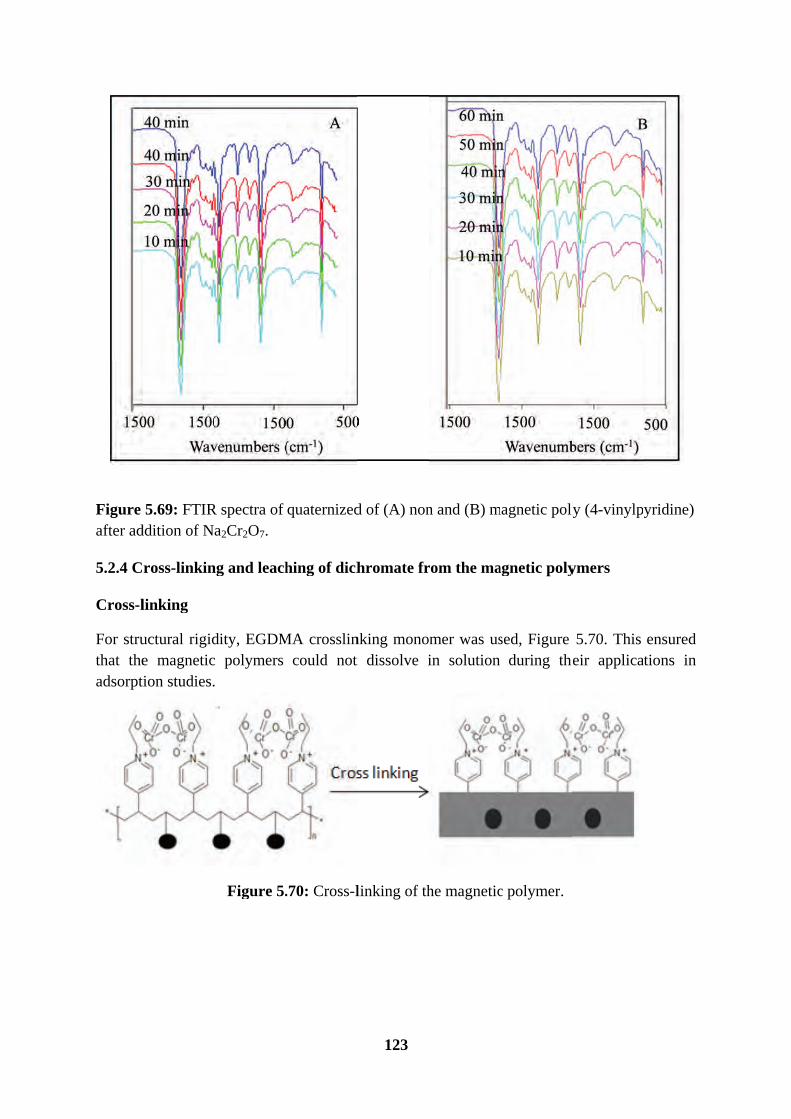
Figure after ad
5.2.4 C
Cross-l
For struthat theadsorpt
5.69: FTIRddition of N
ross-linkin
linking
uctural rigide magneticion studies.
R spectra of a2Cr2O7.
ng and leach
dity, EGDMc polymers
Figure 5.
quaternized
hing of dich
MA crosslincould not
.70: Cross-l
123
d of (A) non
hromate fr
nking monot dissolve i
linking of th
n and (B) m
rom the ma
mer was usin solution
he magnetic
magnetic poly
agnetic poly
sed, Figure during the
c polymer.
ly (4-vinylp
ymers
5.70. This heir applica
yridine)
ensured ations in

Leachin
After cr5.72 sh1M HConly stowere thfrom HC
Leachin
The mawith thHowevewas goilast wasiron resmagnet
ng of dichr
rosslinking,hows the fiCl. These solopped after hen conditioCl leachant
ng studies
agnetite washe leaching er, an impoing to defeashing of thespectively, ic NIP was
Fig
romate from
, the magnerst seven slutions werthe chromi
oned with dt and dried i
Figure 5.7
s observed of the chr
ortant note wat the whole magnetic Figure 5.73washed and
gure 5.72: A
m the magn
etic polymersolutions coe analyzed ium conten
deionized win the oven
1: Leaching
washing awromium to
was that thele purpose oIIP detecte
3. Figure 5d the last wa
Aliquots co
124
netic polym
rs were leacollected aftfor chromiu
nt was zero water in ord
at 50°C for
g of the dich
way from thform pore
e magnetite of the projeed 0.3 mg L5.74 shows ashing had
ollected afte
mers
ched for maer washingum content or close to er to remov12 hours.
hromate wit
he polymeries within thwas not tot
ect (makingL-1 and 8.6 the decreaan iron con
r different l
any cycles, F the magnewith the FAzero. The
ve all the ex
th 1 M HCl
ic matrix. The magnetitally washedg the polymmg L-1 for se of the m
ntent of 11.7
leaching tim
Figure 5.71etic polymeAAS. Leachmagnetic pxcess chlor
.
This was in ic polymer d away othe
mers magnetthe chromi
magnetite w7 mg L-1.
mes.
1. Figure ers with hing was polymers ride ions
parallel matrix.
erwise it tic). The ium and
when the
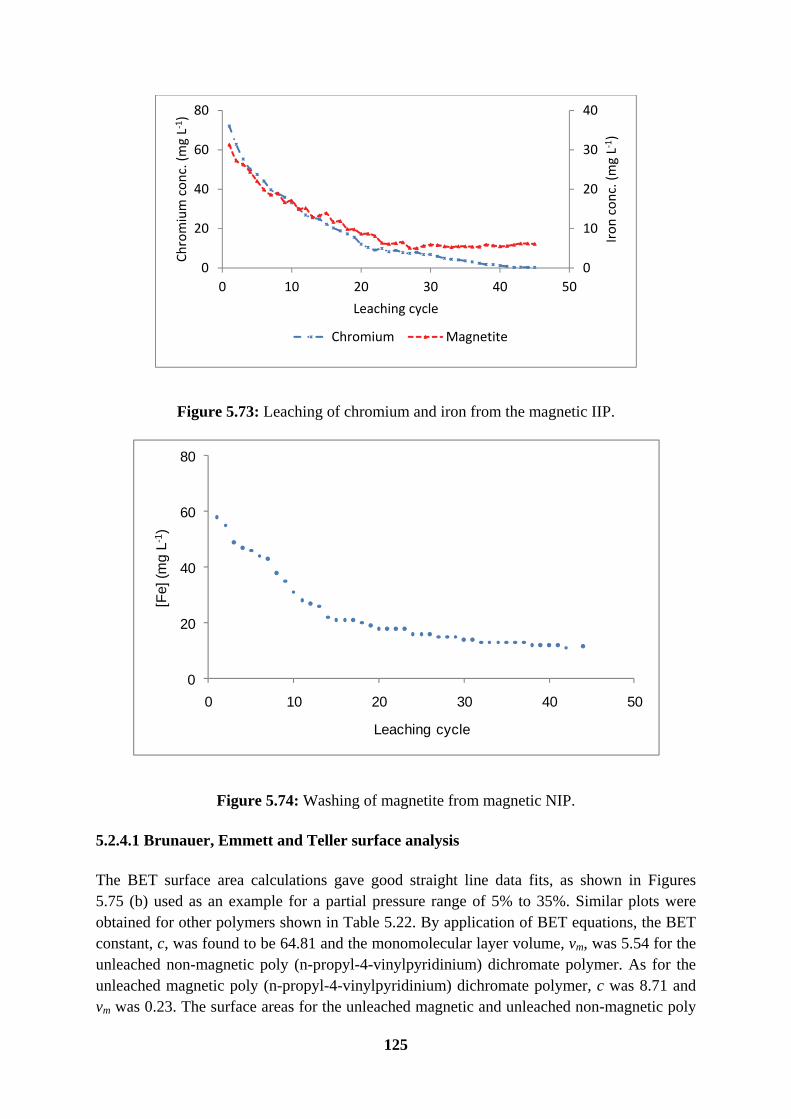
125
Figure 5.73: Leaching of chromium and iron from the magnetic IIP.
Figure 5.74: Washing of magnetite from magnetic NIP.
5.2.4.1 Brunauer, Emmett and Teller surface analysis
The BET surface area calculations gave good straight line data fits, as shown in Figures 5.75 (b) used as an example for a partial pressure range of 5% to 35%. Similar plots were obtained for other polymers shown in Table 5.22. By application of BET equations, the BET constant, c, was found to be 64.81 and the monomolecular layer volume, vm, was 5.54 for the unleached non-magnetic poly (n-propyl-4-vinylpyridinium) dichromate polymer. As for the unleached magnetic poly (n-propyl-4-vinylpyridinium) dichromate polymer, c was 8.71 and vm was 0.23. The surface areas for the unleached magnetic and unleached non-magnetic poly
0
10
20
30
40
0
20
40
60
80
0 10 20 30 40 50
Iron
conc
. (m
g L-1
)
Chro
miu
m c
onc.
(mg
L-1)
Leaching cycle
Chromium Magnetite
0
20
40
60
80
0 10 20 30 40 50
[Fe]
(mg
L-1
)
Leaching cycle

126
(n-propyl-4-vinylpyridinium) dichromate polymer were found to be 1.00 ± 0.02 m² g-1 and 25.4 ± 0.3 m² g-1 respectively.
After leaching of the chromium from the magnetic IIP, there was an increase in the surface area to 132 ± 1 m² g-1 which corresponded to 132% increase. However, even though there was an increase in the surface area of the magnetic NIP (16.8%), it was not as significant as that obtained from the magnetic IIP. The BET constants, c, for the leached magnetic IIP and NIP were found to be 163 and 124 respectively. The monomolecular layer volumes, vm, were 30.5 and 6.7 respectively. All the BET surface areas and constants for the magnetic polymers are summarized in Table 5.22. Bayramoglu and Arica (2008), found that the specific surface area of the IIP and the corresponding NIP particles to be 34.5 m2 g-1 and 21.7 m2 g-1 respectively which indicated the presence of microporous on the surface of the Cr(VI)-imprinted particles.
Figure 5.75: (a) The nitrogen adsorption-desorption isotherms for the unleached non-magnetic poly (n-propyl-4-vinylpyridinium) dichromate polymer and (b) its corresponding
BET plot.
0
10
20
30
40
50
0 0.2 0.4 0.6 0.8 1 1.2
Volu
me
adso
rbed
(cm
3g-1
) STP
Relative Pressure (p/po)
Adsorption
Desorption
(a)
y = 0.1685x + 0.0026R² = 0.999
0
0.01
0.02
0.03
0.04
0 0.05 0.1 0.15 0.2 0.25
1/[v
(po/
p-1)
]
Relative Pressure (p/po)
(b)

127
Table 5.22: BET surface areas and constants for the magnetic polymers.
BET surface area (m² g-1)
vm c
Unleached non-magnetic 25.4 5.54 64.81
Unleached magnetic 1.0 0.23 8.71
Leached non-magnetic 132 30.5 163
Leached magnetic 16.8 7.7 124
5.2.4.2 Thermo-gravimetric analysis (TGA) analysis
In order to gain insight into the thermal changes in the magnetic polymers, the thermal stability was probed with TGA. Thermal degradation profiles of leached and unleached Cr(VI) magnetic polymers are shown in Figure 5.76. The maximum weight loss occurred at 425°C, corresponding to degradation of the polymer backbone, and a small peak that occurred at around 220°C can be attributed to the loss of moisture from the magnetic polymers. It can also be observed from the TGA spectrum of the Cr(VI) loaded magnetic polymer that the maximum weight loss due to the decomposition of the backbone occurred at a slightly lower temperature. This indicated that the unleached magnetic polymer was slightly more stable than the leached one. It was also observed that the leached and unleached Cr(VI) magnetic polymers had total weight losses of 82.5 and 59.2%. The remaining mass corresponds to the presence of Cr(VI) and magnetite in the unleached magnetic polymer and magnetite in the leached magnetic polymer.
In almost similar studies by Toral et al. (2009), where they quaternized the polymer with an octyl moiety, the stability of the Cr(VI) loaded polymer was also stable as compared to the leached one. The decomposition of the two polymers occurred at around 500 and 400oC respectively. However, in terms of the residual weight of the leached polymer, they found it to be close to 100%. In our work it was observed to be 59.2% because of the embedded magnetite in the polymer matrix.

128
Figure 5.76: Thermogravimetric analysis of chromium magnetic polymer.
5.2.5 Optimization of parameters for Cr(VI) uptake
5.2.5.1 Effect of sample pH
Sample pH dictates the speciation of metals in solution and also the form of protonation on the active sites within the adsorbent. The positive charge on the quaternized nitrogen is responsible for the Cr2O7
2- uptake and other anions. Since the hydroxyl ions are possible competitors for dichromate sorption, it therefore becomes apparent that sample pH affects this adsorption. This effect is demonstrated in Figure 5.77.

129
Figure 5.77: The effect of pH and also the demonstration of the chromate/ hydroxyl competition.
The effect of pH on the removal of Cr(VI) was investigated in the pH range of 1-10 at room temperature. The experimental results are presented in Figure 5.78 where it was observed that the maximum adsorption occurred at pH 2-6. The optimum pH for the uptake of Cr(VI) was then chosen to be 4 which corresponded to 90 and 73% Cr(VI) removal for the magnetic IIP and NIP respectively. The Cr(VI) removal efficiency decreased at pH values greater than 6 for both the magnetic IIP and its control polymer. Beyond this pH, there is an anticipated strong competition between hydroxyl ions and the dichromate ions in solution. These two anions compete for the fabricated active adsorption sites on the magnetic polymers. Similar results were obtained by Bayramoglu and Arica (2008) who showed that at high acidic pH of 2-4, adsorption was very high and decreased rapidly after pH 5. However, they did not quaternize their polymers but rather they used 4-VP as a functional monomer. Their Cr(VI)-ion imprinted poly (4-vinyl pyridine-co-2-hydroxyethyl methacrylate) particles were prepared by bulk polymerization. On poly (4-vinylpyridine) coating onto a granular activated carbon Fang et al. (2007) observed a 90% Cr(VI) removal at a pH of 2 which was almost maintained but decreased sharply at pH 6 to 8 and no apparent sorption was observed when pH was above 9. After firstly forming a linear copolymer from 4-VP and styrene, Pakade et al. (2011) prepared an IIP selective of Cr(VI) by quaternizing the linear copolymer with 1,4 dichlorobutane. The pH trend they got did not show a drop in Cr(VI) absorption after pH 4-5 because their pH only ranged from 1 up to 4.

130
Figure 5.78: Effect of sample pH. Experimental conditions: Polymer amount, 20 mg; sample volume, 25 mL; chromium concentration, 5 mg L-1; contact time, 45 minutes; stirring speed, 600 rpm; temperature, room temperature.
5.2.5.2 Effect of the amount of the adsorbent
The removal of chromium by magnetic polymers at different adsorbent doses (5-120 mg) from a Cr(VI) concentration of 5 mg L-1 was investigated. The results (Figure 5.79) showed that, initially, the percent removal of Cr(VI) increased with the increase in the dose of magnetic polymers due to the greater availability of the adsorption sites within the adsorbent. For the magnetic IIP, the increase in adsorbent dosage from 5.0 to 20 mg resulted in an increase from 47 to 95% in adsorption efficiency of Cr(VI) ions whilst an increase from 83 to around 90% was observed for the dose from 5.0 to 65 mg for the magnetic NIP. The optimum amounts of magnetic polymer were then chosen to be 20 and 65 mg for the magnetic IIP and NIP respectively. Considering an initial volume of 25 mL for both the magnetic IIP and NIP, the normalized volume became 0.8 g L-1 and 2.6 g L-1 respectively.
Investigating the effect of polypyrrole/Fe3O4 nanocomposite dosage on adsorption of Cr(VI) from aqueous solution showed that Cr(VI) removal efficiency increased with an increase in polypyrrole/Fe3O4 dose (Bhaumik et al., 2011). The extent of Cr(VI) removal from 50 mL of 200 mg L-1 Cr(VI) solution changed from 16.3% at a dose of 25 mg to 100% at a dose of 100 mg which is equivalent to an optimum of 2 g L-1 of polypyrrole/Fe3O4. In another study by Hadjmohammadi et al. (2011), who used pine needles powder as a biosorbent, the uptake of Cr(VI) from 50 mL of 50 mg L-1 solutions, the adsorbent dose reached a plateau at 0.5 g of sorbent. This translated to 10 mg L-1. Using tetraethylenepentamine on Fe3O4 magnetic polymer adsorbent, Yao et al. (2012) found a proportion of 20 mg per 250 mL (0.8 mg L-1) water sample would ensure efficient preconcentration of Cr(VI).
20
40
60
80
100
0 2 4 6 8 10 12
Rem
ova
l eff
icie
ncy
(%)
pH
Magnetic IIP
Magnetic NIP
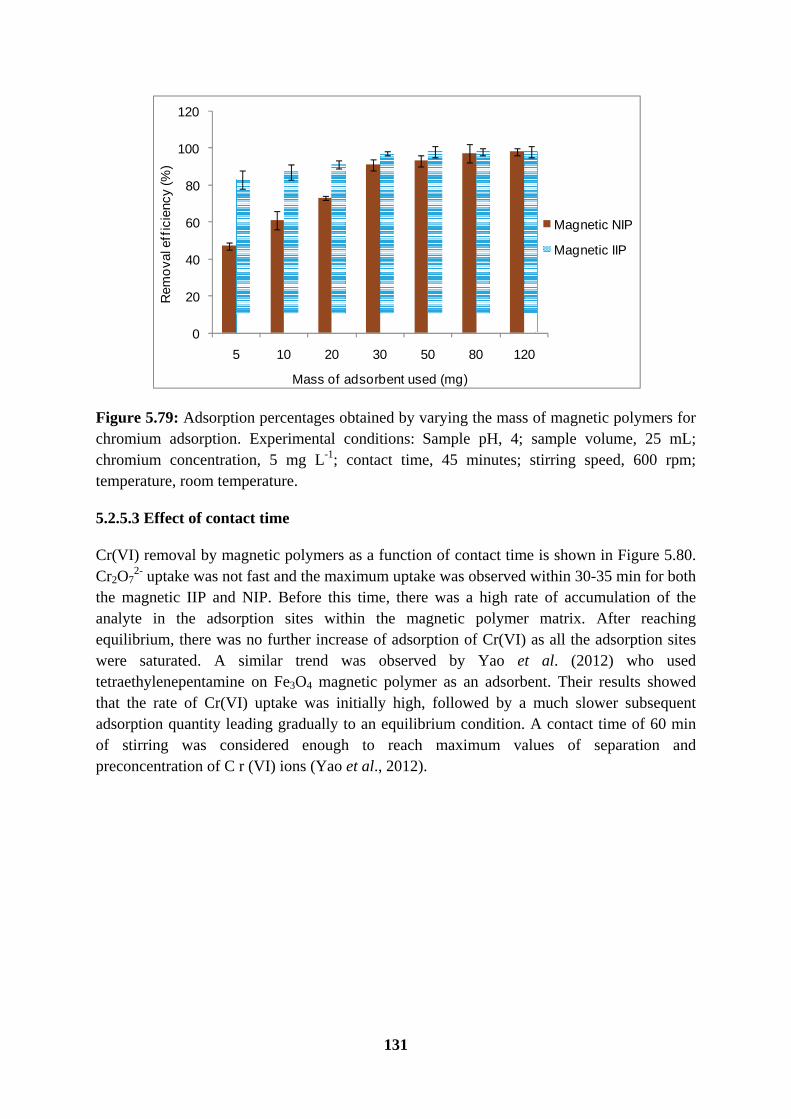
131
Figure 5.79: Adsorption percentages obtained by varying the mass of magnetic polymers for chromium adsorption. Experimental conditions: Sample pH, 4; sample volume, 25 mL; chromium concentration, 5 mg L-1; contact time, 45 minutes; stirring speed, 600 rpm; temperature, room temperature.
5.2.5.3 Effect of contact time
Cr(VI) removal by magnetic polymers as a function of contact time is shown in Figure 5.80. Cr2O7
2- uptake was not fast and the maximum uptake was observed within 30-35 min for both the magnetic IIP and NIP. Before this time, there was a high rate of accumulation of the analyte in the adsorption sites within the magnetic polymer matrix. After reaching equilibrium, there was no further increase of adsorption of Cr(VI) as all the adsorption sites were saturated. A similar trend was observed by Yao et al. (2012) who used tetraethylenepentamine on Fe3O4 magnetic polymer as an adsorbent. Their results showed that the rate of Cr(VI) uptake was initially high, followed by a much slower subsequent adsorption quantity leading gradually to an equilibrium condition. A contact time of 60 min of stirring was considered enough to reach maximum values of separation and preconcentration of C r (VI) ions (Yao et al., 2012).
0
20
40
60
80
100
120
5 10 20 30 50 80 120
Rem
ova
l eff
icie
ncy
(%)
Mass of adsorbent used (mg)
Magnetic NIP
Magnetic IIP

132
Figure 5.80: Effect of contact time on the uptake of chromium by magnetic polymers. Experimental conditions: Sample pH, 4; sample volume, 25 mL; shromium concentration, 5 mg L-1; polymer weight (20 mg for magnetic IIP and 65 mg for magnetic NIP); stirring speed, 600 rpm; temperature, room temperature.
5.2.5.4 Effect of initial Cr(VI) concentration
The results obtained for the effect of initial concentration on the uptake of chromium by magnetic IIP and NIP are presented in Figure 5.81. An initial chromium concentration of 1-20 mg L-1 was investigated. In this experiment, the magnetic polymer dose was fixed as well as the contact time and solution pH of which the values are indicated in the caption of Figure 5.80. It was observed that the magnetic polymers` Cr(VI) removal increased significantly from 1-2.5 mg L-1 and 1-1.5 mg L-1 for the magnetic IIP and NIP respectively. An initial Cr(VI) concentration of 5 mg L-1 was taken to be the optimum. After this value, equilibrium was attained as there was no appreciable increase in the amount of the analytes adsorbed on the magnetic polymers. The maximum adsorption capacities for the magnetic polymers corresponding to the considered optimum Cr(VI) concentration of 5 mg L-1 were 6.20 and 1.87 mg g-1 for the magnetic IIP and NIP respectively.
0
1
2
3
4
5
6
7
0 10 20 30 40 50 60 70 80
Ad
sorp
tion
cap
acity
(mg
g-1
)
Contact time (min)
Magnetic IIP
Magnetic NIP

133
Figure 5.81: Effect of initial concentration on the uptake of chromium by magnetic IIP and NIP. Experimental conditions: Sample pH, 4; sample volume, 25 mL; polymer weight, (20 mg for magnetic IIP and 65 mg for magnetic NIP); contact time 35 min; stirring speed, 600 rpm; temperature, room temperature.
5.2.5.5 Selectivity of Cr(VI)
Competing anions are known to influence Cr(VI) uptake. However, because HCl was used as a leachant, it was likely that the chloride ion would have interfered with the selectivity studies, hence it was not used. The other ions selected, such as the sulphate and phosphate ions were selected as potential competitors because of their chemical similarities to the dichromate ion with respect to charge and oxy-ionic nature. Figure 5.82 is an example of the IC chromatogram of a 5 mg L-1 anionic mixture standard. Similar chromatograms of 1, 10 and 20 were obtained and were used to construct calibration curves for the respective anions, Figure 5.83. For the binary mixture, Cr2O7
2-/anionic competitor, the anion was also determined by IC and an example is illustrated for the fluoride ion in Figure 5.84. However, the equilibrium dichromate concentrations for all binary systems were determined by use of FAAS after the construction of a calibration curve, Figure 5.85. The selectivity performances of the magnetic polymers are summarized in Figure 5.86 and Table 5.23. The order of selectivity of the investigated anions followed the sequence: Cr2O7
2- > SO42- > F- > NO3
-.
Pakade et al. (2011) investigated the influence of coexisting ions on the uptake of Cr(VI) onto 1, 4 dichlorobutane quaternized linear copolymer. Their findings were that the selectivity order was Cr2O7
2- > SO42- > F- > PO4
3- > NO3- > Cl-. After considering two
Cr(VI) competitors, Neagu and Mikhalovsky (2010) found that there was also a rather remarkable selectivity towards hexavalent chromium over the sulfate anion. The full order of selectivity was Cr2O7
2- > SO42- > Cl- which was almost what was obtained in our studies.
However, the same authors reported that the adsorption selectivity for the common anions
0
1
2
3
4
5
6
7
0 5 10 15 20 25
Am
oun
t ad
sorb
ed (m
g g
-1)
Initial concentration (mg L-1)
Magnetic IIP
Magnetic NIP

onto co> Cl-. FCr(VI) competpyridinethe adsothose of
Pk
ommercial sFang et al. (
and founditors investie-co-hydroxorption capf the Cr(III)
Figure
0
50
100
150
200
0
Pea
k ar
ea
tyrene anio(2007) also d the selecigated by Bxyethyl metacity of IIP) and Ni(II)
Figure 5
5.83: Calib
5
n exchangeperformed tivity order
Bayramoglu thacrylate) p
P particles foions respec
5.82: A 5 m
ration curve
5Co
Fluoride
134
ers and it fosome selectr of PO4
2-
and Arica (particles shor Cr(VI) anctively.
mg L-1 anion
e for four di
y = 9.79x +R² = 0.
10oncentration
e Sulphat
llowed the tivity studie
> SO42- >
(2011), it whowed excelnions was 1
nic mixture
ichromate a
+ 6.7225.9932
y
y =
15n (mg L-1)
te Nitrate
order: SO42
es on three > NO3
-. Fowas demonsllent selectiv13.8 and 11
standard.
anionic com
= 6.3053x -R² = 0.99
= 5.922x - 1R² = 0.999
20
2- > I- > CrOcompetitor or the twostrated that ivity for Cr(.7 fold grea
mpetitors.
1.4211996
.300292
2
O42- >Br-
ions for Cr(VI) (4-vinyl (VI) and ater than
5
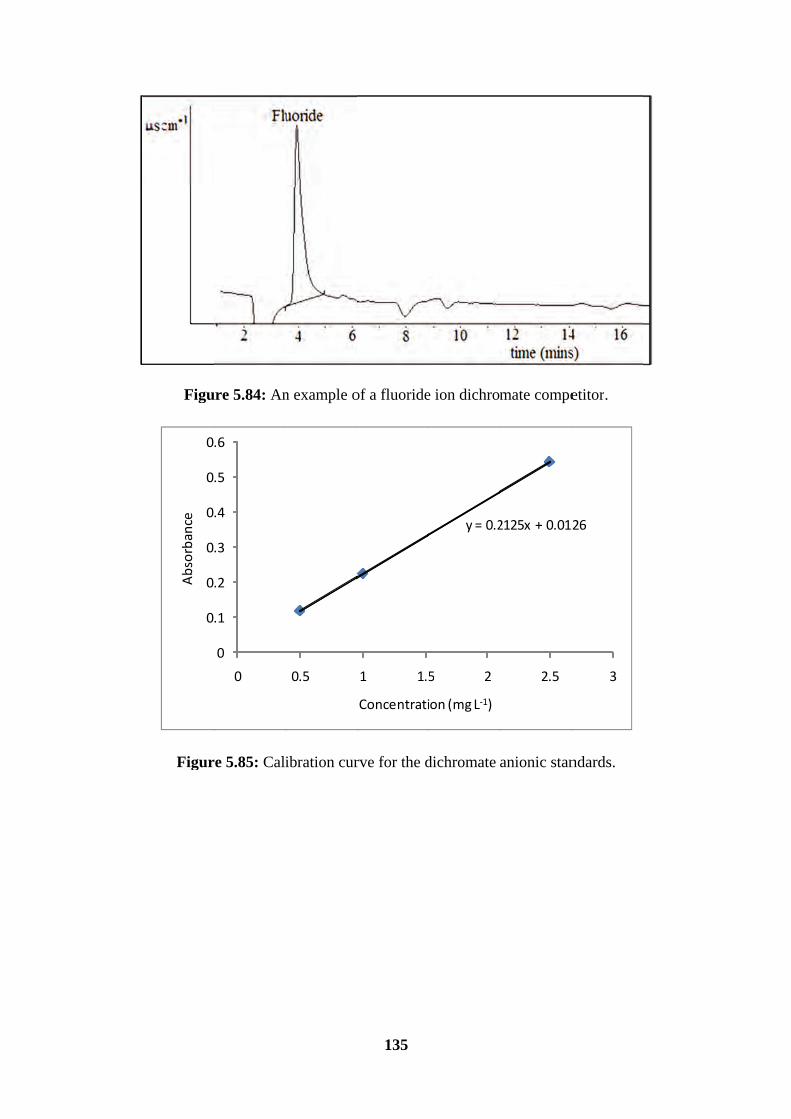
Figu
0.
0.
0.
0.
0.
0.
Abso
rban
ce
Figur
re 5.84: An
0
.1
.2
.3
.4
.5
.6
0
e 5.85: Cali
n example o
0.5
ibration cur
135
of a fluoride
1 1.5
Concentrati
rve for the d
e ion dichrom
y = 0.2
5 2
ion (mg L-1)
dichromate
mate compe
2125x + 0.012
2.5
anionic stan
etitor.
26
3
ndards.

136
Figure 5.86: Extraction efficiencies of anions extracted by the magnetic Cr(VI) IIP and NIP from 2 mg L-1 spiked binary mixtures of solutions.
Table 5.23: Kd, K and K` values for the magnetic Cr(VI) IIP and NIP in binary mixtures.
Cr2O72- ion
Competitor
Kd (L g-1) K K`
Cr2O72-
IIP Cr2O7
2- NIP
Magnetic IIP
Magnetic NIP
Magnetic IIP
Magnetic NIP
Magnetic NIP
SO42- 11.70 3.06 1.98 0.30 5.91 10.20 0.58
F- 23.50 1.90 1.69 0.22 13.91 8.64 1.61
NO3- 33.00 5.53 0.79 0.035 41.77 158 0.26
5.2.5.6 Reusability of Cr-magnetic polymers
Since the reusability of the magnetic polymers is an important factor, six adsorption-desorption cycles were performed, Figure 5.87. What was observed was that the magnetic polymers maintained their stability as well as their chromium abstraction capacity of 98.5% and 89% for the magnetic IIP and NIP respectively. This high robustness of the imprinted polymers has the significance that they can be cleaned, thereby regenerating their adsorption capabilities. For up to 5 cycles, the IIP synthesized by Pakade et al. (2011) was still stable as it showed 96% extraction efficiency.
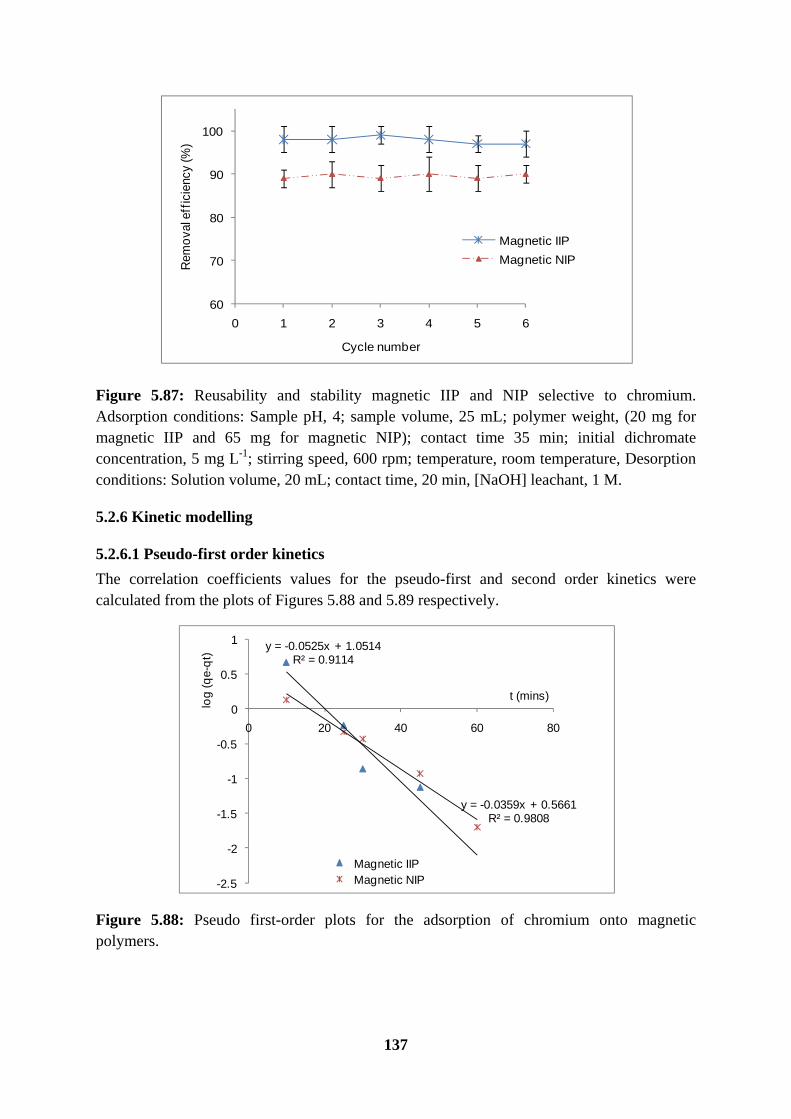
137
Figure 5.87: Reusability and stability magnetic IIP and NIP selective to chromium. Adsorption conditions: Sample pH, 4; sample volume, 25 mL; polymer weight, (20 mg for magnetic IIP and 65 mg for magnetic NIP); contact time 35 min; initial dichromate concentration, 5 mg L-1; stirring speed, 600 rpm; temperature, room temperature, Desorption conditions: Solution volume, 20 mL; contact time, 20 min, [NaOH] leachant, 1 M.
5.2.6 Kinetic modelling
5.2.6.1 Pseudo-first order kinetics
The correlation coefficients values for the pseudo-first and second order kinetics were calculated from the plots of Figures 5.88 and 5.89 respectively.
Figure 5.88: Pseudo first-order plots for the adsorption of chromium onto magnetic polymers.
60
70
80
90
100
0 1 2 3 4 5 6
Rem
ova
l eff
icie
ncy
(%)
Cycle number
Magnetic IIP
Magnetic NIP
y = -0.0525x + 1.0514R² = 0.9114
y = -0.0359x + 0.5661R² = 0.9808
-2.5
-2
-1.5
-1
-0.5
0
0.5
1
0 20 40 60 80
log
(qe-
qt)
t (mins)
Magnetic IIPMagnetic NIP

138
5.2.6.2 Pseudo-second order kinetics
Figure 5.89: Pseudo second-order plots for the adsorption of chromium onto magnetic polymers.
Table 5.24: Calculated kinetic parameters of pseudo-first and second orders for initial Cr(VI) concentration of 5 mg L-1.
Pseudo first-order Pseudo second-order
Polymer R2 k1 (L min-1) qe (mg g-1) R2 k2 (g mg-1 min-1) qe (mg g-1)
IIP 0.9114 0.121 11.256 0.9987 0.078 3.098 NIP 0.9808 0.083 3.682 0.9959 0.029 2.178
It was observed that correlation coefficients values of the pseudo-second order kinetics produced better quality of linearization compared to the pseudo-first order kinetics. Moreso, the adsorption capacity values obtained by this method were much closer to those reported before in this work (6.20 and 1.87 mg g-1 for the magnetic IIP and NIP respectively). A pseudo-second order further suggests that the type of interaction between the target template and the adsorbent surface was chemisorptions as a rate controlling step (Wang et al. 2011). This interaction was probably due to the exchange of electrons on the dichromate and the quaternized nitrogens.
5.2.7 Freundlich and Langmuir isotherm modelling
Figure 5.90 and 5.91 present the Freundlich and the Langmuir isotherm model for magnetic IIP and NIP respectively.
y = 0.1582x + 0.3228R² = 0.9987
y = 0.4592x + 7.2934R² = 0.9959
0
10
20
30
40
50
20 30 40 50 60 70 80
t/qt
t (mins)Magnetic IIP Magnetic NIP

139
Figure 5.90: (a) Freundlich and (b) Langmuir isotherm model for magnetic IIP.
y = 0.4483x + 1.0645R² = 0.8405
-1
-0.5
0
0.5
1
1.5
2
2.5
-4 -3 -2 -1 0 1 2 3
ln q
e
ln Ce
y = 0.0622x + 0.2629R² = 0.8805
0
0.5
1
1.5
2
0 5 10 15 20 25 30
1/q
e
1/Ce
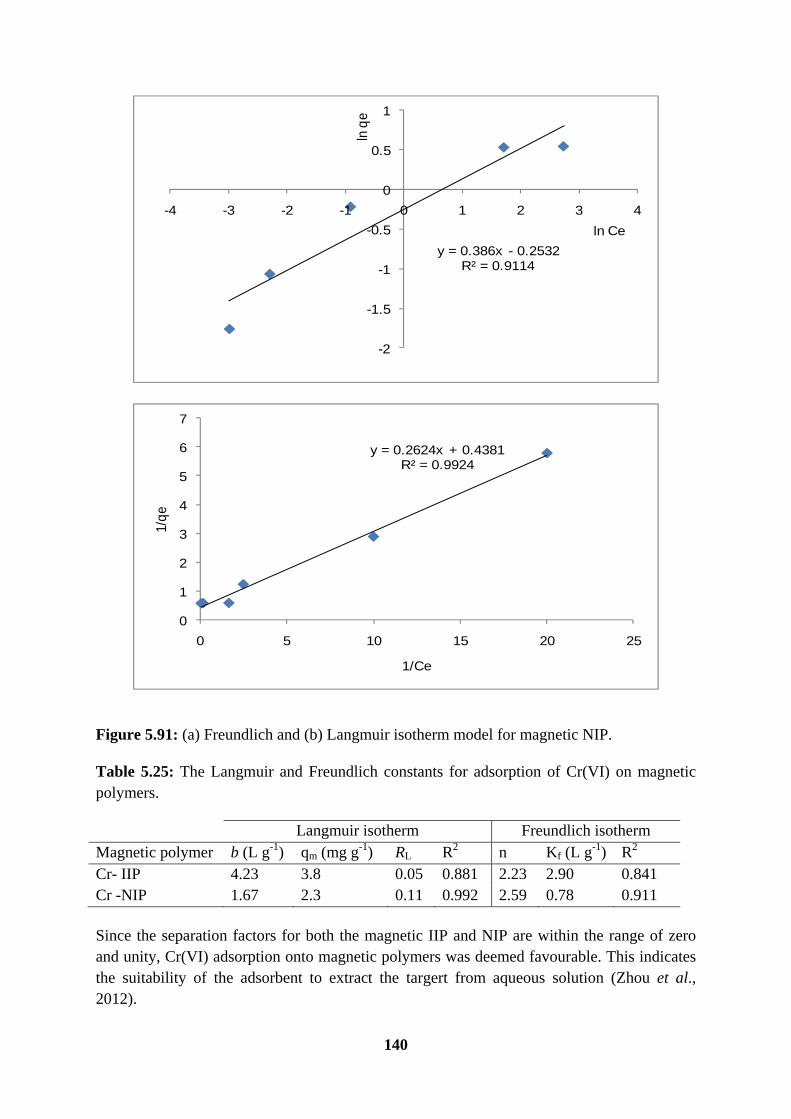
140
Figure 5.91: (a) Freundlich and (b) Langmuir isotherm model for magnetic NIP.
Table 5.25: The Langmuir and Freundlich constants for adsorption of Cr(VI) on magnetic polymers.
Langmuir isotherm Freundlich isotherm Magnetic polymer b (L g-1) qm (mg g-1) RL R2 n Kf (L g-1) R2 Cr- IIP 4.23 3.8 0.05 0.881 2.23 2.90 0.841 Cr -NIP 1.67 2.3 0.11 0.992 2.59 0.78 0.911
Since the separation factors for both the magnetic IIP and NIP are within the range of zero and unity, Cr(VI) adsorption onto magnetic polymers was deemed favourable. This indicates the suitability of the adsorbent to extract the targert from aqueous solution (Zhou et al., 2012).
y = 0.386x - 0.2532R² = 0.9114
-2
-1.5
-1
-0.5
0
0.5
1
-4 -3 -2 -1 0 1 2 3 4
ln q
e
ln Ce
y = 0.2624x + 0.4381R² = 0.9924
0
1
2
3
4
5
6
7
0 5 10 15 20 25
1/qe
1/Ce

141
Chapter Six: Conclusions and Recommendations for future work
6.1 Conclusions
The imprinting technique proved that a memory of the targets U(VI) and Cr(VI) can be induced in the magnetic polymer such that in subsequent use, even in the presence of other competing ions in aqueous media, selectivity was enhanced. After adsorption the adsorbents were traditionally removed from the solutions via centrifugation and filtration. This approach is however not economically viable on a large industrial scale. The technique of endowering magnetic particles into the polymer matrix, as demonstrated in this research, makes the whole polymer particles magnetic and this necessitated their easy removal from solutions. The successful incorporation of the magnetite into the polymer was evident from the FTIR where a band at was observe implying that the general objective of this to synthesize magnetic polymers selective to U(VI) and Cr(VI) was realized.
Both magnetic IIPs and NIPs showed potential in the uptake of uranium and chromium from contaminated solutions as these imprinted magnetic polymers were successfully applied for the selective extraction of the respective analytes from various complex samples which were AMD and treated wastewater effluent. Adsorption capacities for the Cr(VI) magnetic IIP were 6.20 and 1.87 mg g-1 for the magnetic IIP and NIP respectively and the order of selectivity for the U(VI) magnetic IIP was UO2
2+ > Fe3+ > Pb2+ > Ni2+ > Mg2+ and that for the Cr(VI) magnetic IIP was: Cr2O7
2- > SO42- > F- > NO3
-. Magnetic IIPs always expectedly showed a higher uranyl and dichromate uptake as compared to their corresponding magnetic NIPs.
The uptake of the uranyl was made possible by the presence organic ligands (functional groups) with oxygen and nitrogen atoms that provided lone pairs of electrons to the cationic uranyl ion through coordinate bonding. For the adsorption of the Cr(VI), quaternization enabled the extraction of anionic dichromate target.
6.2 Recommendations for future work
There is need to carry out the polymerization reaction in aqueous media rather than the organic solvents in order to avoid the swelling and shrinkage of magnetic polymers. This however means changing of the initiator to those compatible with water.
The application of the synthesized magnetic polymers can be applied to a pilot plant scale and ultimately to real environmental systems. It is therefore important to carry out the same adsorption studies in a continuous flow system that mimic a river system. In this approach, the magnetic polymers need to be contained in cartridges such as those used in SPE.
To use natural adsorbents like chitosan, cellulose that can be compatible with magnetic materials. This is because synthetic polymeric reagents becomes expensive

142
especially when large quantities are required to decontaminate large volumes of wastewaters in real environmental situations. Most natural adsorbents are cheap and readily available.
To try other methods for coating the magnetite wholly as this is important so that no part of the exposed magnetic core takes part in the adsorption of the uranyl and dichromate ions from solution. Adsorption studies of the uranyl and dichromate ion by a bare magnetite should also be carried out to show its contribution in the case of partial coating.
In this study, only oxygen and nitrogen bearing functional monomers were used (for uranium magnetic IIP). It is however important that monomers with electron lone pair donating atoms like sulpfur be investigated in order to see if there can be an improvement in the adsorption capacity.
143
References
ACHARYA J, SAHU JN, SAHOO BK, MOHANTY CR and MEIKAP BC (2009) Removal of chromium(VI) from wastewater by activated carbon developed from Tamarind wood activated with zinc chloride. Chemical Engineering Journal 150 25-39.
ACHEAMPONG MA, MEULEPAS RJW and LENS PNL (2010) Removal of heavy metals and cyanide from gold mine wastewater. Journal of Chemical Technology and Biotechnology 85 590-613.
AGBONTALOR A. (2007) Phytoremediation: an environmentally sound technology for pollution prevention, control and remediation in developing countries Erakhrumen. Educational Research and Review 2 151-156.
AHMAD AL, KUSUMASTUTI A, DEREK, CJC and OOI BS (2011) Emulsion liquid membrane for heavy metal removal: An overview on emulsion stabilization and destabilization. Chemical Engineering Journal 171 870-882.
AHMADI SJ, NOORI-KALKHORAN O and SHIRVANI-ARANI S (2010) Synthesis and characterization of new ion-imprinted polymer for separation and preconcentration of uranyl (UO2
2+) ions. Journal of Hazardous Materials 175 193-197.
AHN CK, PARK D, WOO SH and PARK JM (2009) Removal of cationic heavy metal from aqueous solution by activated carbon impregnated with anionic surfactants. Journal of Hazardous Materials 164 1130-1136.
AKSU Z, GÖNEN F and DEMIRCAN Z (2002) Biosorption of chromium(VI) ions by Mowital B30H resin immobilized activated sludge in a packed bed: comparison with granular activated carbon. Process Biochemistry 38 175-186.
AL-OMAIR M.A and EL-SHARKAWY EA (2007) Removal of heavy metals via adsorption on activated carbon synthesized from solid wastes. Environmental Technology 28 443-451.
Amer SI (1998) Treating Metal Finishing Wastewater. Environmental Technology 832 539-1020.
ANDERSON RT, VRIONIS HA, ORTIZ-BERNAD I, RESCH CT, LONG PE, DAYVAULT R, KARP K, MARUTZKY S, METZLER DR, PEACOCK A and WHITE DC (2003) Stimulating the in situ activity of Geobacter species to remove uranium from the groundwater of a uranium-contaminated aquifer. Applied and Environmental Microbiology 69 5884-91.
ANSELL RJ, WANG DY and KUAH JKL (2008) Imprinted polymers for chiral resolution of (±)-ephedrine. Part 2: probing pre-polymerization equilibria in different solvents by NMR. Analyst 133 1673-1683.
144
ANSELL RJ and WANG DY (2009) Imprinted polymers for chiral resolution of (±)-ephedrine. Part 3: NMR predictions and HPLC results with alternative functional monomers. Analyst 134 564-576.
ARNOLD BR, EULER AC, JENKINS AL, UY OM and MURRAY GM (1999) Progress in the Development of Molecularly Imprinted Polymer Sensors. Johns Hopkins Apl Technical Digest 20 190-198.
ARSLAN M, YIGITOGLU M and SOYSAL A (2006) Removal of Chromium(VI) from Aqueous Solutions Using Poly (4-vinyl pyridine) Beads. Journal of Applied Polymer Science 101 2865-2870.
ATIA AA (2005) Studies on the interaction of mercury(II) and uranyl(II) with modified chitosan resins. Hydrometallurgy 80 13-22.
Australia's Uranium Mines, Available on: www.world-nuclear.org/info/ Australia_mines /emines.html, Accessed on 13/12/2012.
BAI Y and BARTKIEWICZ B (2009) Removal of Cadmium from Wastewater Using Ion Exchange Resin Amberjet 1200H Columns. Polish Journal of Environmental Studies 18 1191-1195.
BAES CFJ and MESMER RE (1976) The hydrolysis of cations, Wiley-Interscience, John Wiley & Sons, New York, 197-240.
BAKER HM, MASSADEH AM and YOUNES HA (2009) Natural Jordanian zeolite: Removal of heavy metal ions from water samples using column and batch methods. Environmental Monitoring and Assessment 157 319-330.
BALL JW and NORDSTROM DK (1998) Critical evaluation and selection of standard state thermodynamic properties for chromium metal and its aqueous ions, hydrolysis species, oxides, and hydroxides. Journal of Chemical and Engineering Data 43 895-918.
BAMGBOSE JT, ADEWUYI S, BAMGBOSE O and ADETOYE AA (2010) Adsorption kinetics of cadmium and lead by chitosan, African Journal of Biotechnology 9 2560-2565.
BARAKAT MA and SAHINER N (2008) Cationic hydrogels for toxic arsenate removal from aqueous environment. Journal of Environmental Management 88 955-961.
BARKHORDAR B and GHIASSEDDIN M (2004) Comparison of Langmuir and Freundlich Equilibriums in Cr, Cu and Ni Adsorption by Sargassum. Iranian Journal of Environmental Health, Science and Engineering 1 58-64.
BAYRAMOGLU G and ARICA YM (2008) Adsorption of Cr(VI) onto PEI immobilized acrylate-based magnetic beads: Isotherms, kinetics and thermodynamics study. Chemical Engineering Journal 139 20-28.

145
BAYRAMOGLU G and ARICA MY (2011) Synthesis of Cr(VI)-imprinted poly (4-vinyl pyridine-co-hydroxyethyl methacrylate) particles: Its adsorption propensity to Cr(VI). Journal of Hazardous Materials 187 213-221.
BERKOWITZ JB, YAMIN M and FUOSS RM (1958) The Flory Constants for Poly-4-vinylpyridine in Ethanol. Journal of Polymer Science XXVIII 69-82.
BERTO S, CREA F, DANIELE PG, GIANGUZZA A, PETTIGNANO A and SAMMARTANO S (2011) Advances in the investigation of dioxouranium(VI) complexes of interest for natural fluids. Coordination Chemistry Reviews 256 63-81.
BICAK. N and GAZI G (2003) Quantitative Quaternization of Poly (4-Vinyl Pyridine), Journal of macromolecular science. Part A-Pure and Applied Chemistry 40 A 585-591.
BIFFI, A, DVORAKOVA G and FALCIMAIGNE-CORDIN A (2012) Physical Forms of MIPs. Topics in Current Chemistry 325 29-82.
BIJU VM, GLADIS JM and RAO TP (2003) Effect of γ-irradiation of ion imprinted polymer (IIP) particles for the preconcentrative separation of dysprosium from other selected lanthanides. Talanta 60 747-754.
BIRLIK E, ERSOZ A, AQIKKALP E, DENIZLI A and SAY R (2007) Cr(III)-imprinted polymeric beads: Sorption and preconcentration studies. Journal of Hazardous Materials B140 110-116.
BLEISE A, DANESI PR and BURKART W (2003) Properties, use and health effects of depleted uranium (DU): a general overview. Journal of Environmental Radioactivity 64 93-112.
BOLORTAMIR T and EGASHIRA R (2008) Removal of Hexavalent Chromium from Model Tannery Wastewater by Adsorption Using Mongolian Natural Zeolite. Journal of Chemical Engineering of Japan 41 1003-1009.
BRAM V, CHANTAL B, DRIES H, PATRICK L, MIROSLAVA V, KATARINA S, GEORGIOS G and CARLO V (2012) Removal of Molybdate Anions from Water by Adsorption on Zeolite-Supported Magnetite. Water Environment Research 84 753-760.
BROOKINS DG (1988) The indoor radon problem: Studies in the Albuquerque, New Mexico area. Environmental Geology and Water Sciences 12 187-196.
BROOKS BW (2010) Suspension Polymerization Processes. Chemical Engineering Technology 33 1737-1744.
BROWN LM (1996) Removal of heavy metals from water with microalgal resins: Process development. Water Treatment Technology Program Report 74 1.
146
BRŰGGEMANN O, HAUPT K, YE L, YILMAZ E and MOSBACH K (2000) New configurations and applications of molecularly imprinted polymers. Journal of Chromatography A 889 15-24.
BRYNDA M, WESOLOWSKI TA and WOJCICHOWSKI K (2004) Theoretical Investigation of the Anion Binding Affinities of the Uranyl Salophene Complexes. Journal of Physical Chemistry A 108 5091-5099.
BURDA C, CHEN X, NARAYANAN R and EL-SAYED MA (2005) Chemistry and properties of nanocrystals of different shapes. Chemical Reviews 105 1025-102.
BURKE NAD, STÖVER HDH and DAWSON FP (2002) Magnetic Nanocomposites: Preparation and Characterization of Polymer-Coated Iron Nanoparticles. Chemistry of Materials 14 4752-4761.
BÜTTIKER R, EBERT J, HINDERLING C and ADLHART C (2011) Membranes for Specific Adsorption: Immobilizing Molecularly Imprinted Polymer Microspheres using Electrospun Nanofibers. CHIMIA: International Journal for Chemistry 65 182-186.
BÜYÜKTIRYAKI S, SAY R, DENIZLI A and ERSÖZ A (2007) Mimicking receptor for methylmercury preconcentration based on ion-imprinting. Talanta 71 699-705.
CAI W and GUPTA RB (2004) Molecularly-imprinted polymers selective for tetracycline binding. Separation and Purification Technology 35 215-221.
CAMACHO LM, DENG S and PARRA RR (2010) Uranium removal from groundwater by natural clinoptilolite zeolite: Effects of pH and initial feed concentration. Journal of Hazardous Materials 175 393-398.
CAMMAROTA VA (1992), Commodity review in SME Mining Engineering Handbook, second edition (edited by Hartman, H.L.) 70.
CAMPBELL SE, COLLINS M. XIE L and BELBRUNO JJ (2009) Surface morphology of spin-coated molecularly imprinted polymer films. Surface and Interface Analysis 41 347-356.
CANTRELL KJ, KAPLAN DI and WEITMA TW (1995) Zero-valent iron for the in situ remediation of selected metals in ground water. Journal of Hazardous Materials 42 201-212.
CARUSO U, MARIA DA, PANUNZI B and ROVIELLO AJ (2002) Poly(4-vinylpyridine) as the host ligand of metal-containing chromophores for second-order nonlinear optical active materials. Journal of Polymer Science Part A: Polymer Chemistry 40 2987-2993.
CHANDA M and REMPEL GL (1993) Selective chromate recovery with quaternized poly (4-vinylpyridine). Reactive Polymers 21 77-88.
147
CHATTERJEE S, SAU GB and MUKHERJEE SK (2011) Bioremediation of Cr(VI) from Chromium-Contaminated Wastewater by Free and Immobilized Cells of Cellulosimicrobium cellulans KUCr3. Bioremediation Journal 15 173-180.
CHEN CL, WANG XK and NAGATSU M (2009), Europium Adsorption on Multiwall Carbon Nanotube/Iron Oxide Magnetic Composite in the Presence of Polyacrylic Acid. Environmental Science and Technology 43 2362-2367.
CHEN F, WANG R and SHI Y (2012) Molecularly imprinted polymer for the specific solid-phase extraction of kirenol from Siegesbeckia pubescens herbal extract. Talanta 89 505-512.
CHEN Y, PENG D, LIN D and LUO X (2007) Preparation and magnetic properties of nickel nanoparticles via the thermal decomposition of nickel organometallic precursor in alkylamines, Nanotechnology 18 1-6.
CHEN-JEN L (2002) The chemical transformation of chromium in natural waters-A model study. Water, Air and Soil Pollution 139 137-158.
CHEN Z, YANG Q, PENG K and GUO Y (2011), Surface-Initiated Nitroxide-Mediated Radical Polymerization of 4-Vinylpyridine on Magnetite Nanoparticles. Journal of Applied Polymer Science 119 3582-3590.
CHIARIZIA, R, HORWITZ EP, ALEXANDRATOS SD and GULA MJ (1997) Diphonixs resin: a review of its properties and applications. Separation Science and Technology 32 1-35.
CHIN SF, PANG SC and TAN CH (2011) Green Synthesis of Magnetite Nanoparticles (via Thermal Decomposition Method) with Controllable Size and Shape. Journal of Materials and Environmental Science 2 299-302.
CHOPPIN GR (2006) Actinide speciation in aquatic systems. Marine Chemistry 99 83-92.
CLARKE JH and PARKER FL (2009) Uranium Recovery and Remediation of Uranium Mill Tailings: Russian and U.S. Experience. Cleaning Up Sites Contaminated with Radioactive Materials: International Workshop Proceedings.
CUI H, FENG Y, REN W, ZENG T, LV H and PAN Y. (2009) Strategies of Large Scale Synthesis of Monodisperse Nanoparticles. Recent Patents on Nanotechnology 3 32-41.
DANG F, ENOMOTO N, HOJO J and ENPUKU K (2008). A Novel Method to Synthesize Monodispersed Magnetite Nanoparticles. Chemistry Letters 37 530.
DANIEL S, BABU PEJ and RAO TP (2005) Preconcentrative separation of palladium(II) using palladium(II) ion-imprinted polymer particles formed with different quinoline derivatives and evaluation of binding parameters based on adsorption isotherm models. Talanta 65 441-452.
148
DANIEL S, GLADIS JM and RAO TP (2003) Synthesis of imprinted polymer material with palladium ion nanopores and its analytical application. Analytica Chimica Acta 488 173-182.
DANIEL S, RAO PP and RAO TP (2005) Investigation of different polymerization methods on the analytical performance of palladium(II) ion imprinted polymer materials. Analytica Chimica Acta 536 197-206.
DAOU TJ, POURROY G, BÉGIN-COLIN S, GRENÉCHE JM, ULHAQ-BOUILLET C, LEGARE P, BERNHARDT P, LEUVREY C and ROGEZ G (2006) Hydrothermal Synthesis of Monodisperse Magnetite Nanoparticles. Chemistry of Materials 18 4399-4404.
DAUTZENBERG H, JAEGER W, KÖTZ J, PHILIPP B, SEIDEL CH and STSCHERBINA D (1994), Synthesis of polyelectrolytes. Polyelectroytes: Hanser/Gardner Publications Inc. Cincinnati 9-86.
DAWSON WJ (1988) Hydrothermal Synthesis of Advanced Ceramic Powders. American Ceramic Society Bulletin, 67, pp. 1673.
DE FARIA DLA, SILVA, SV and DE OLIVEIRA MT (1997) Raman microspectroscopy of some iron oxides and oxyhydroxides. Journal of Raman Spectroscopy 28 873-878.
DE FLORA S, CAMOIRANO A, BAGNASCO M, BENNICELLI C, CORBETT, GE and KERGER BD (1997) Estimates of the chromium(VI) reducing capacity in human body compartments as a mechanism for attenuating its potential toxicity and carcinogenicity. Carcinogenesis 18 531-537.
DE LA GUARDIA M and MORALES-RUBIO A (2003), Sample Preparation of Trace Element Analysis. Elsevier Chapter 35 1115.
DEMIRBAS E, KOBYA M, SENTURK E and OZKAN T (2004) Adsorption kinetics for the removal of chromium(VI) from aqueous solutions on the activated carbons prepared from agricultural wastes. Water SA 533-540.
DHIR B (2010) Use of aquatic plants in removing heavy metals from Wastewater. International Journal of Environmental Engineering 2 185-200.
DIEHL P (2011) Uranium Mining and Milling Wastes: An Introduction, Available from: http://www.wise-uranium.org/uwai.html, Accessed on 11/11/2011.
DIMITROV D and WYSIN G (1994), Effects of surface anisotropy on hysteresis in fine magnetic particles. Physical Review B Condensed Matter 50 3077-3084.
DWA (Department of Water Affairs), 1999, Available from: http://www://dwaf.gov.za, Accessed: 3/02/2012.

149
DURANOGLU D, TROCHIMCZUK AW and BEKER U (2010) A comparison study of peach stone and acrylonitrile-divinylbenzene copolymer based activated carbons as chromium(VI) sorbents. Chemical Engineering Journal 165 56-63.
DVORAKOVA G, HASCHICK R, CHIAD K, KLAPPER M, MÜLLEN K and BIFFIS A (2010) Molecularly Imprinted Nanospheres by Nonaqueous Emulsion Polymerization. Macromolecular Rapid Communications 31 2035-2040.
EISAZADEH H (2008) Removal of Arsenic in Water Using Polypyrrole and its Composites. World Applied Sciences Journal 3 10-13.
EL-GHANDOOR H, ZIDAN HM, KHALIL MMH and ISMAIL MIM (2012) Synthesis and Some Physical Properties of Magnetite (Fe3O4) Nanoparticles. International Journal of Electrochemical Science 7 5734-5745.
EL-KHAIARY MI (2008) Least-squares regression of adsorption equilibrium data: comparing the options. Journal of Hazardous Materials 158 73-87.
El-Sayed AA (2008) Kinetics and thermodynamics of adsorption of trace amount of uranium on activated carbon. Radiochimica Acta 96 481-486.
ERDEM E, KARAPINAR N and DONAT R (2004) The removal of heavy metal cations by natural zeolites. Journal of Colloid and Interface Science 280 309-314.
ERSÖZ A, SAY R and DENIZLI A (2004) Ni(II) ion-imprinted solid-phase extraction and preconcentration in aqueous solutions by packed-bed columns. Analytica Chimica Acta 502 91-97.
ESFANDYARI-MANESH M, JAVANBAKHT M, ATYABI F, BADIEI A and DINARVAND R (2011) Effect of porogenic solvent on the morphology, recognition and release properties of carbamazepine-molecularly imprinted polymer nanospheres. Journal of Applied Polymer Science 121 1118-1126.
FAN P and WANG B (2010) Regulatory Effects of Zn(II) on the Recognition Properties of Metal Coordination Imprinted Polymers. Journal of Applied Polymer Science 116 258-266.
FARAJI M, YAMINI Y and REZAEE M (2010) Magnetic Nanoparticles: Synthesis, Stabilization, Functionalization, Characterization and Applications. Journal of the Iranian Chemical Society 7 1-37.
FARREL J, BOSTICK WD, JARABEK RJ and FIEDOR JN (1999) Uranium removal from ground water using zero valent iron media. Ground Water 37 618-624.
FASIHI J, ALAHYARI SA, SHAMSIPUR M, SHARGHI H and CHARKHI A (2011) Adsorption of uranyl ion onto an anthraquinone based ion-imprinted copolymer. Reactive and Functional Polymers 71 803-808.
150
FENDORF SE (1995) Surface reactions of chromium in soils and water. Geoderma 67 55-71.
FANG GZ, TAN J and YAN XP (2005) An ion-imprinted functionalized silica gel sorbent prepared by a surface imprinting technique combined with a sol-gel process for selective solid-phase extraction of cadmium(II). Analytical Chemistry 77 1734-1739.
FANG J, GU Z, GANG D, LIU C, ILTON ES and DENG B (2007) Cr(VI) Removal from Aqueous Solution by Activated Carbon Coated with Quaternized Poly (4-vinylpyridine). Environmental Science and Technology 41 4748-4753.
FIEDOR JN, BOSTICK WD, JARABEK RJ and FARREL J (1998), Understanding the mechanism of uranium removal from ground water by zero valent iron using X-ray photoelectron spectroscopy. Environmental Science and Technology 32 1466-1473.
FINNERAN KT, ANDERSON RT, NEVIN KP and LOVLEY DR (2002) Potential for bioremediation of uranium-contaminated aquifers with microbial U(VI) reduction. Soil and Sediment Contamination 11 339-357.
FINNERAN KT, HOUSEWRIGHT ME and LOVLEY DR (2002) Multiple influences of nitrate on uranium solubility during bioremediation of uranium-contaminated subsurface sediments. Environmental Microbiology 4 510-516.
FINOTELLI PV, SAMPAIO DA, MORALES MA, ROSSI AM and ROCHA-LEÃO MH (2008) Ca alginate as scaffold for iron oxide nanoparticles synthesis. Brazilian Journal of Chemical Engineering 25 759-764.
FLORENCE TM and BATLEY GE (1980) Chemical speciation in natural waters. Critical Review in Analytical Chemistry 9 219-296.
FRANCO V, CONDE CF, CONDE A and KISS LF (2005), Relationship between coercivity and magnetic moment of superparamagnetic particles with dipolar interaction. Physical Review 72 1-10.
FRANZREB M, SIEMANN-HERZBERG M, HOBLEY TJ and THOMAS ORT (2006) Protein purification using magnetic adsorbent particles. Applied Microbiology and Biotechnology 70 505-516.
FREDRICKSON JK, ZACHARA JM, KENNEDY DW, DUFF MC, GORBY YA, LI SMW and KRUPKA KM (2000) Reduction of U(VI) in goethite (a-FeOOH) suspensions by a dissimilatory metal-reducing bacterium. Geochimica et Cosmochimica Acta 64 3085-3098.
FREETHEY GF, NAFTZ DL, ROWLAND RC and DAVIS JA (2002) Deep Aquifer Remediation Tools: Theory, Design, and Performance Modeling. In Handbook of Groundwater Remediation Using Permeable Reactive Barriers (ed. Naftz DL, Morrison SJ, Davis JA and Fuller CC), Academic Press 133-163.
151
FREY NA, PENG S, CHENG K and SUN S (2009) Magnetic nanoparticles: synthesis, functionalization, and applications in bioimaging and magnetic energy storage. Chemical Society Reviews 38 2532-2542.
FU F and WANG Q (2011) Removal of heavy metal ions from wastewaters: A review. Journal of Environmental Management 92 407-418.
GANGULY R (2005) Ferrofluid transport analysis for thermal, biomedical and mems applications. In Mechanical Engineering. University of Illinois at Chicago, Chicago.
GARG UK, KAUR MP, GARG VK and SUD D (2007) Removal of hexavalent chromium from aqueous solution by agricultural waste biomass. Journal of Hazardous Materials 140 60-68.
GASCOYNE M (1992) Geochemistry of the actinides and their daughters. In Uranium-series Disequilibrium: Applications to Earth, Marine, and Environmental Sciences, second edition (editors, Ivanovich M and Harmon RS), Clarendon Press 34-61.
GHEJU M and BALCU I (2011) Removal of chromium from Cr(VI) polluted wastewaters by reduction with scrap iron and subsequent precipitation of resulted cations. Journal of Hazardous Materials, 196, pp. 131-138.
GINDER-VOGEL M, WU W, CARLEY J, JARDINE P, FENDORF S and CRIDDLE C (2006) In Situ Biological Uranium Remediation within a Highly Contaminated Aquifer, Available from: http://www-ssrl.slac.stanford.edu/research/highlights_ archive/u_remed.pdf, Accessed on 17/04/2012.
GLADIS JM and RAO TP (2004) Effect of Porogen Type on the Synthesis of Uranium Ion Imprinted Polymer Materials for the Preconcentration/Separation of Traces of Uranium. Microchimica Acta 146 251-258.
GLADIS JM and RAO TP (2003) Synthesis and Analytical Applications of Uranyl Ion Imprinted Polymer Particles. Analytical Letters, 36, pp. 2107-2121.
GÓMEZ V and CALLAO MP (2006) Chromium determination and speciation since 2000. Trends in Analytical Chemistry 25 1006.
GORBY YA and LOVLEY DR (1992) Enzymatic uranium precipitation. Environmental Science and Technology 26 205-207.
GRENTHE I, FUGER J, KONINGS RJM, LEMIRE RJ, MULLER, AB, NGUYEN-TRUNG C and WANNER H (1992) Chemical thermodynamics of uranium; North-Holland Elsevier Science Publishers B.V. Amsterdam.

152
GU B, KU YK and JARDINE PM (2004) Sorption and binary exchange of nitrate, sulfate, and uranium on an anion-exchange resin. Environmental Science and Technology 38 3184-3188.
GU B, LIANG L, DICKEY MJ, YIN X and DAI S (1998), Reductive precipitation of uranium(VI) by zero-valent iron. Environmental Science and Technology 32 3366-3373.
GUILLAUMONT R, FANGHÄNEL T, FUGER I, GRENTHE I, NECK V, PALMER DA and RAND MH (2003) Update on the Chemical Thermodynamics of Uranium, Neptunium, Plutonium, Americium and Technetium. Elsevier Science.
GUPTA VK, AGARWAL S and SALEH TA (2011) Chromium removal by combining the magnetic properties of iron oxide with adsorption properties of carbon nanotubes. Water Research 45 2207-2212.
HA NT, HAI NH, LUONG NH, CHAU N and CHINH HD (2008) Effects of the conditions of the microemulsion preparation on the properties of Fe3O4 nanoparticles, VNU Journal of Science. Natural Sciences and Technology 24 9-15.
HÄFELI UO, CIOCAN R and DAILEY JP (2002) Characterization of magnetic particles and microspheres and their magnetophoretic mobility using a digital microscopy method. European Cells and Materials 3 24-27.
HAGINAKA J, TABO H and KAGAWA C (2008) Uniformly sized molecularly imprinted polymers for d-chlorpheniramine: Influence of a porogen on their morphology and enantioselectivity. Journal of Pharmaceutical and Biomedical Analysis 46 877-881.
HAGENDORFER H and GOESSLER W (2008) Separation of chromium(III) and chromium(VI) by ion chromatography and an inductively coupled plasma mass spectrometer as element-selective detector. Talanta 76 656-661.
HALIMOON N and YIN RGS (2010) Removal of Heavy Metals from Textile Wastewater using Zeolite. Environment Asia 3 124-130.
HALL KR, EAGLETON LC, ACRIVOS A and VERMEULEN T (1966) Pore and solid diffusion Kinetics in fixed bed adsorption under constant pattern conditions. Industrial and Engineering Chemistry, Fundamentals 212-223.
HAUPT K and BELMONT AS (2008) Molecularly Imprinted Polymers as Recognition Elements in Sensors, Handbook of Biosensors and Biochips, Wiley-Interscience, Hoboken, NJ.
HAW CY, MOHAMED F, CHIA C.H, RADIMAN S, ZAKARIA S, HUANG NM and LIM HN (2010) Hydrothermal synthesis of magnetite nanoparticles as MRI contrast agents. Ceramics International 36 1417-1422.
153
Health Canada (1999) “Uranium in Drinking Water,” Document for Public Comment Prepared by Federal Provincial Subcommittee on Drinking Water.
HU M, JI R and JIANG J (2010) Hydrothermal synthesis of magnetite crystals: From sheet to pseudo-octahedron. Materials Research Bulletin 45 1811-1815.
HUANG JW, BLAYLOCK MJ, PULNIK Y and ENSLEY BD (1998) Phytoremediation of Uranium-Contaminated Soils: Role of Organic Acids in Triggering Uranium Hyperaccumulation in Plants. Environmental Science and Technology 32 2004-2008.
HYEON T (2002) Chemical synthesis of magnetic nanoparticles. Chemical Communications 927-934.
IDZIAK I (2010) Molecular imprinting-a way to make “Smart Polymers”, Canadian Chemical News Jarvis, K.E., Gray, A.L. and Houk, R.S. (1992), Handbook of Inductively Coupled Plasma Mass Spectrometry. Chapman and Hall: New York.
IGWE JC and ABIA AA (2006) A bioseparation process for removing heavy metals from waste water using biosorbents. African Journal of Biotechnology 5 1167-1179.
ILHAN S, NOURBAKHSH MN, KILICARSLAN S and OZDAG H (2004) Removal of Chromium, Lead and Copper ions from industrial wastewaters by Staphylococcus saprophyticus. Turkish Electronic Journal of Biotechnology 2 50-57.
INOUE H, FUKKE H and KATSUMOTO M (1990) Effect of polymer adsorbed layer on magnetic particle dispersion. IEEE Transaction on magnetic 26 75-77.
IWASAKI T, KOSAKA K, YABUUCHI T, WATANO S, YANAGIDA T and KAWAI T (2009) Novel mechanochemical process for synthesis of magnetite nanoparticles using co-precipitation method. Advanced Powder Technology, 20, pp. 521-528.
JERDEN JL and SINHA AK (2003) Phosphate based immobilization of uranium in an oxidizing bedrock aquifer. Applied Geochemistry 18 823-843.
JIANG X, JIANG N, ZHANG H and LIU M (2007) Small organic molecular imprinted materials: their preparation and application. Analytical and Bioanalytical Chemistry 389 355-368.
JOHNSON BB (1990) Effect of pH, Temperature, and Concentration on the Adsorption of Cadmium on Goethite. Environmental Science and Technology 24 112-118.
JUNGHANS M and HELLING C. (1998) Historical Mining, uranium tailings and waste disposal at one site: Can it be managed? A hydrogeological analysis, in Tailings and Mine Waste '98, Balkema, Rotterdam 117-126.
154
KABANOV VA, EFENDIEV AA and ORUJEV DD (1979) Complex-forming polymeric sorbents with macromolecular arrangement favourable for ion sorption. Journal of Applied Polymer Science 24 259-267.
KADIRVELU K, THAMARAISELVI K and NAMASIVAYAM C (2001) Removal of heavy metals from industrial wastewaters by adsorption onto activated carbon prepared from an agricultural solid waste. Bioresource Technology 76 63-65.
KALA R, BIJU VM and RAO TP (2005) Synthesis, characterization, and analytical applications of erbium (III) ion imprinted polymer particles prepared via γ-irradiation with different functional and crosslinking monomers. Analytica Chimica Acta 549 51-58.
KALA R, GLADIS JM and RAO TP (2004) Preconcentrative separation of erbium from Y, Dy, Ho, Tb and Tm by using ion imprinted polymer particles via solid phase extraction. Analytica Chimica Acta 518 143-150.
KALFAS G, YUAN H and RAY WH (1993) Modeling and Experimental Studies of Aqueous Suspension Polymerization Processes. Experiments in Batch Reactors. Industrial and Engineering Chemistry Research 32 1831-1838.
KAN XW, ZHAO, Q, SHAO DL, GENG ZR, WANG ZL and ZHU J (2010) Preparation and Recognition Properties of Bovine Hemoglobin Magnetic Molecularly Imprinted Polymers. Journal of Physical Chemistry B 114 3999-4004.
KANNAN K (1995) In Fundamentals of Environmental Pollution, S. Chand & Co., New Delhi, 1995.
KARIM K, BRETON F, ROUILLON R, PILETSKA EV, GUERREIRO A, CHIANELLA I and PILETSKY SA (2005) How to find effective functional monomers for effective molecularly imprinted polymers? Advanced Drug Delivery Reviews 57 1795-1808.
KATZ SA and SALEM H (1992) The toxicology of chromium with respect to its chemical speciation: A review. Journal of Applied Toxicology 13 217-224.
KELVIN B, GREGOR Y and LOVELY DR (2005) Remediation and Recovery of Uranium from Contaminated Subsurface Environments with Electrodes. Environmental Science and Technology 39 8943-8947.
KILISLIOGLU A and BILGIN B (2003) Thermodynamic and kinetic investigations of uranium adsorption on amberlite IR-118H resin. Applied Radiation and Isotopes 58 155-160.
KIM D, MIKHAYLOVA M, ZHANG Y and MUHAMMED M (2003) Protective Coating of Superparamagnetic Iron Oxide Nanoparticles. Chemistry of Materials 15 1617-1627.
KINNIBURGH DG (1986) General Purpose Adsorption Isotherms. Environmental Science and Technology 20 895-904.
155
KHAN NA, IBRAHIM S and SUBRAMANIAM P (2004) Elimination of Heavy Metals from Wastewater Using Agricultural Wastes as Adsorbents. Malaysian Journal of Science 23 43-51.
KONSTANTINOU M, DEMETRIOU A and PASHALIDIS I (2007), Adsorption of hexavalent uranium on Dunite. Global NEST Journal 9 229-236.
KOSA SA, AL-ZHRANI G and SALAM MA (2012) Removal of heavy metals from aqueous solutions by multi-walled carbon nanotubes modified with 8-hydroxyquinoline. Chemical Engineering Journal 181-182 159-168.
KOT A and NAMIESNÈIK J (2000) The role of speciation in analytical chemistry. Trends in Analytical Chemistry 19 69-79.
KOTAS J and STASICKA Z (2000) Chromium occurrence in the environment and methods of its speciation. Environmental Pollution, 107, pp. 263-283.
KOTRBA P, MACKOVA M and MACEK T (2011) Microbial Biosorption of metals. Springer 26-27.
KOUTZAROVA T, KOLEV S, GHELEV C, PANEVA D and NEDKOV I (2006) Microstructural study and size control of iron oxide nanoparticles produced by microemulsion technique Physica Status Solidi 5 1302-1307.
KRACHLER M and CARBOL P (2011) Validation of isotopic analysis of depleted, natural and enriched uranium using high resolution ICP-OES. Journal of Analytical Atomic Spectrometry 26 293-299.
KRISHNA P, GLADIS JM, RAO TP and NAIDU GRK (2005) Selective recognition of neodymium(III) using ion imprinted polymer particles. Journal of Molecular Recognition 18 109-116.
KUGIMIYA A, KUWADA Y and TAKEUCHI T (2001) Preparation of sterol-imprinted polymers with the use of 2-(methacryloyloxy)ethyl phosphate. Journal of Chromatography A 938 131-135.
KUMAR PS and KIRTHIKA K (2009) Equilibrium and kinetic study of adsorption of Nickel from aqueous solution onto Bael leaf powder. Journal of Engineering Science and Technology 4 351-363.
KUNTAKAPUN J, CHUNGSIRIPORN J, HUSSAIN NH and INTAMANEE J (2010) Adsorption of Zn(II) Metal Ion from an Aqueous Solution Using Tea Waste Char, The Eighth PSU Engineering Conference.
LANDFESTER K (2001) The Generation of Nanoparticles in Miniemulsions. Advanced Materials 13 765-768.
156
LANGARD S and NORSETH T In FRIBERG L, NORDBERG GF and VOUK VB (Editors) (1990) Handbook on the Toxicology of Metals, Vol. II, Specific Metals, Elsevier, Amsterdam, 2nd ed. 185-210.
LANGMUIR D (1978) Uranium solution-mineral equilibria at low temperature with applications to sedimentary ore deposits. Geochimica et Cosmochimica Acta 42 547-569.
LAURENT S, FORGE D, PORT M, ROCH A, ROBIC C, VANDER ELST L and MULLER RN (2008) Magnetic iron oxide nanoparticles: synthesis, stabilization, vectorization, physicochemical characterizations, and biological applications. Chemical Reviews 108 2064-2110.
LANZA F and SELLERGREN B (2004) Molecularly Imprinted Polymers via High-Throughput and Combinatorial Techniques. Macromolecular Rapid Communications 25 59-68.
LEWINSKY AA (2007) Hazardous Materials and Wastewater, Treatment, Removal and Analysis, Nova Science Publishers, Inc. New York.
LI H, LI Z, LIU T, XIAO X, PENG Z and DENG L (2008) A novel technology for biosorption and recovery hexavalent chromium in wastewater by biofunctional magnetic beads. Bioresource Technology 99 6271-6279.
LI FT, LI X, ZHANG BR and OUYANG QH (2004) Removal of Heavy Metals in Effluent by Adsorption and Coagulation. Chinese Chemical Letters 15 83-86.
LI Y, YANG MJ and SHE Y (2005) Humidity sensitive properties of crosslinked and quaternized poly (4-vinylpyridine-co-butyl methacrylate). Sensor and Actuators B: Chemical 107 252-257.
LIAO S and CHANG AW (2004) Heavy Metal Phytoremediation by Water Hyacinth at Constructed Wetlands in Taiwan. Journal of Aquatic Plant Management 42 60-68.
LIN TW and HUANG SD (2001) Direct and simultaneous determination of copper, chromium, aluminum, and manganese in urine with a multielement graphite furnace atomic absorption spectrometer. Analytical Chemistry 73 4319-4325.
LIU Y, CAO X, LE Z, LUO M, XU W and HUANG G (2010), Pre-concentration and determination of trace uranium(VI) in environments using ion-imprinted chitosan resin via solid phase extraction. Journal of the Brazilian Chemical Society 21 533-540.
LIU Y, CHANG X, YANG D, GUO Y and MENG S (2005) Highly selective determination of inorganic mercury(II) after preconcentration with Hg(II)-imprinted diazoaminobenzene-vinylpyridine copolymers. Analytica Chimica Acta 538 85-91.

157
LODHIA J, MANDARANO G, FERRIS NJ and COWELL SF (2010) Development and use of iron oxide nanoparticles (Part 1): Synthesis of iron oxide nanoparticles for MRI. Biomedical Imaging and Intervention Journal 6 1-10.
LOFGREEN JE, MOUDRAKOVSKI IL and OZIN GA (2011) Molecularly Imprinted Mesoporous Organosilica. American Chemical Society Nano 5 2277-2287.
LONE MI, HE Z, STOFFELLA PJ and YANG X (2008) Phytoremediation of heavy metal polluted soils and water: Progresses and perspectives. Journal of Zhejiang University Science B 9 210-220.
LOVLEY DR, PHILLIPS EJP, GORBY YA and LANDA ER (1991) Microbial reduction of uranium. Nature 350 413-416.
LOWRY JD and LOWRY SB (1988) Radionuclides in drinking water. Journal of the American Water Works Association 80 51-64.
LU Y, YIN Y, MAYERS BT and XIA Y (2002) Modifying the Surface Properties of Superparamagnetic Iron Oxide Nanoparticles through A Sol-Gel Approach. Nano Letters 2 183-186.
LU S and FORCADA J (2006) Preparation and Characterization of Magnetic Polymeric Composite Particles by Miniemulsion Polymerization. Journal of Polymer Science 44 4187-4203.
LUO X, LUO S, ZHAN Y, SHU H, HUANG Y and TU X (2011) Novel Cu(II) magnetic ion imprinted materials prepared by surface imprinted technique combined with a sol-gel process. Journal of Hazardous Materials 192 949-955.
MA W, XU S, LI J, LIN, Y and WANG C (2011) Hydrophilic Dual-Responsive Magnetite/PMAA Core/Shell Microspheres with High Magnetic Susceptibility and pH Sensitivity via Distillation-Precipitation Polymerization. Journal of Polymer Science Part A: Polymer Chemistry 49 2725-2733.
MAAROF HI and HAMEED BH (2004) Adsorption Isotherms for Phenol Onto Activated Carbon. Asean Journal of Chemical Engineering 4 70-76.
MAITY D, KALE SN, KAUL-GHANEKAR R, XUE J and DING J (2009) Studies of magnetite nanoparticles synthesized by thermal decomposition of iron(III) acetylacetonate in tri (ethyleneglycol). Journal of Magnetism and Magnetic Materials 321 3093-3098.
MAKOVEC D, KOŠAKA A, ŽNIDARŠIČ Z and DROFENIK M (2005) The synthesis of spinel-ferrite nanoparticles using precipitation in microemulsions for ferrofluid applications. Journal of Magnetism and Magnetic Materials 289 32-35
Manual of Acid ISL Uranium mining technology, International Atomic Energy Agency, 2001

158
MASAMOTO RM, WATAXABE M and COLEMAX BD (1960) Quaternization Kinetics of Poly-4-Vinylpyridine. Journal of Polymer Science XVLIII 5-15.
MATIJEVIC E and HSU WP (1987) Preparation and Properties Monodispersed Colloidal Particles of Lanthanide Compounds 1. Gadolinium, Europium, Terbium, Samarium, and Cerium(III). Journal of Colloid and Interface Science 118 506.
MATSUNO R, YAMAMOTO K, OTSUKA H and TAKAHARA A (2003) Polystyrene-Grafted Magnetite Nanoparticles Prepared through Surface-Initiated Nitroxyl-Mediated Radical Polymerization. Chemistry of Materials 15 3-5.
MATSUI J, NICHOLLS IA, TAKEUCHI T, MOSBACH K and KARUBEA I. (1996) Metal ion mediated recognition in molecularly imprinted polymers. Analytica Chimica Acta 335 71-77.
MAYES AG and WHITCOMBE MJ (2005) Synthetic strategies for the generation of molecularly imprinted organic polymers. Advanced Drug Delivery Reviews 57 1742-1778.
MEINRATH A, SCHNEIDER P and MEINRATH G (2003) Uranium ores and depleted uranium in the environment - with a reference to uranium in the biosphere from the Erzgebirge / Sachsen, Germany. Journal of Environmental Radioactivity 64 175-193.
METILDA P, GLADIS JM and RAO TP (2004) Influence of binary/ternary complex of imprint ion on the preconcentration of uranium(VI) using ion imprinted polymer materials. Analytica Chimica Acta 512 63-73.
MEUNIER N, DROGUI P, MONTAN C, HAUSLER R, MERCIER G and BLAIS J (2006) Comparison between electrocoagulation and chemical precipitation for metals removal from acidic soil leachate. Journal of Hazardous Materials B137 581-590.
MIER MV, CALLEJAS RLP, GEHR R, CISNEROS BEJN and ALVAREZ PJJ (2001) Heavy metal removal with Mexican clinoptilolite: Multi-component ionic exchange. Water Research 35 373-378.
MILGRAM S, CARRIÈRE M, THIEBAULT C, MALAVAL L and GOUGET B (2008) Cytotoxic and phenotypic effects of uranium and lead on osteoblastic cells are highly dependent on metal speciation. Toxicology 250 62-69.
MILJA TE, PRATHISH KP and RAO TP (2011) Synthesis of surface imprinted nanospheres for selective removal of uranium from simulants of Sambhar salt lake and ground water. Journal of Hazardous Materials 188 384-390.
MIRSKY V and YATSIMIRSKY A (2011) Artificial receptors for chemical sensors. Wiley-VCH Verlag and Co. KGaA 402-403.

159
MISHRA R, SINHA V, KANNAN A and UPRETI RK (2012) Reduction of Chromium(VI) by Chromium Resistant Lactobacilli: A Prospective Bacterium for Bioremediation. Toxicology International 19 25-30.
MKANDAWIRE M, TAUBERT B and DUDEL EG (2004Capacity of Lemna gibba L. (duckweed) for uranium and arsenic phytoremediation in mine tailing waters. International Journal of Phytoremediation 6 347-62.
MOAD G and SOLOMON DH (1995) The Chemistry of Free Radical Polymerization, Pergamon, Oxford.
MOHAJERI SA, KARIMI G, AGHAMOHAMMADIAN J and KHANSARI MR (2011) Clozapine Recognition via Molecularly Imprinted Polymers; Bulk Polymerization versus Precipitation Method. Journal of Applied Polymer Science 121 3590-3595.
MOHAPATRA M and ANAND S (2010) Synthesis and applications of nano-structured iron oxides/hydroxides-a review. International Journal of Engineering, Science and Technology 2 127-146.
MONTGOMERY CW (1995) Environmental geology, fourth edition, WCB Inc., Iowa, USA 344-345.
MORADI O, ZARE K and YARI M (2011) Interaction of some heavy metal ions with single walled carbon nanotube. International Journal of Nano Dimension 1 203-220.
MORENO-BONDI MC, NAVARRO-VILLOSLADA F, BENITO-PEÑA E and URRACA JL (2008). Molecularly Imprinted Polymers as Selective Recognition Elements in Optical Sensing. Current Analytical Chemistry 4 316-340.
MORRISON SJ and SPANGLER RR (1992) Chemical barriers for controlling groundwater contamination. Environmental Progress 12 175-181.
MOSBACH K The Technique of Molecular Imprinting and Applications of the Imprinted Resulting Materials in Various Areas Molecular Imprinting-Principle Available from, http://www.klausmosbach.com/Principlemolecularimprinting .htm , Accessed on 11/01/2013.
MOSHA DMS and MKAYULA LL (2005) Metal ion sequestration: An exciting dimension for molecularly imprinted polymer technique. Tanzania Journal of Science 31 91-98.
MURRAY GM and SOUTHARD GE (2002) Molecularly Imprinted lonomers. Materials Research Society Symposium Proceedings 723 67-76.
NAMASIVAYAM C and SURESHKUMAR, MV (2008) Removal of chromium(VI) from water and wastewater using surfactant modified coconut coir pith as a biosorbent. Bioresource Technology 99 2218-2225.

160
NAMENI M, ALAVI MR and ARAMI M (2008) Adsorption of hexavalent chromium from aqueous solutions by wheat bran. International Journal of Environmental Science and Technology 5 161-168.
NAN A, TURCU
MR, BRATU
I,
LEOSTEAN
C,
CHAUVET
O,
GAUTRON
E and LIEBSCHER J (2010) Novel magnetic core-shell Fe3O4
polypyrrole nanoparticles
functionalized by peptides or albumin. General Papers, ARKIVOC 185-198.
NASSAR N and HUSEIN M (2005) Preparation of iron oxide nanoparticle from FeCl3 solid powder using microemulsions. Poster presentation.
NCRP (National Council on Radiation Protection and Measurements), 1999. Biological Effects and Exposure Limits for ‘Hot Particles’. NCRP-Report 130.
NEAGUA V and MIKHALOVSKY S (2010) Removal of hexavalent chromium by new quaternized crosslinked poly (4-vinylpyridines). Journal of Hazardous Materials 180 533-540.
NIEBOER E and JUSYS AA (1988) Biologic chemistry of chromium, In: Nriagu JO and Nieboer E (Eds.) Chromium in Natural and Human Environments. (Wiley Interscience, New York) 21-81.
NISHIDE H, DEGUCHI J and TSUCHIDA E (1976) Selective adsorption of metal ions on crosslinked poly(vinylpyridine) resin prepared with a metal ion as a template. Chemistry Letters 5 169-174.
NIU H, WANG Y, ZHANG X, MENG Z and CAI Y (2012) Easy Synthesis of Surface-Tunable Carbon-Encapsulated Magnetic Nanoparticles: Adsorbents for Selective Isolation and Preconcentration of Organic Pollutants. American Chemical Society Applied Materials and Interfaces 4 286-95.
NOMANBHAY SM and PALANISAMY K (2005) Removal of heavy metals from industrial wastewater using chitosan coated oil palm shell charcoal. Environmental Biotechnology 8 43-53.
OCHIENG GM, SEANEGO ES and NKWONTA EI (2010) Impacts of mining on water resources in South Africa. Scientific Research and Essays 22 3351-3357.
OHMORI M and MATIJEVIC E (1992) Preparation and properties of uniform coated colloidal particles. VII. Silica on hematite. Journal of Colloid and Interface Science 150 594-598.
OLAZABAL MA, NIKOLAIDIS NP, SUIB SA and MADARIAGA JM (1997) Precipitation Equilibria of the Chromium(VI)/Iron(III) System and Spectroscopic Characterization of the Precipitates. Environmental Science and Technology 31 2898-2902.

161
OLIVEIRA LCA, PETKOWICZ DI, SMANIOTTO A and PERGHER SBC (2004) Magnetic zeolites: a new adsorbent for removal of metallic contaminants from water. Water Research 38 3699-3704.
ORTIZ-PALACIOS J, CARDOSO J and MANERO O (2008) Production of Macroporous Resins for Heavy-Metal Removal. I. Nonfunctionalized Polymers. Journal of Applied Polymer Science 107 2203-2210.
OTTON JK (1992) The geology of radon. Washington, DC: US Geological Survey.
PAKADE VE (2012) Development and application of imprinted polymers selective adsorption of metal ions and flavonols in complex samples. A Thesis submitted to the Faculty of Science, University of the Witwatersrand, Johannesburg, in fulfilment of the requirements for the degree of Doctor of Philosophy.
PAKADE VE, CUKROWSKA E, DARKWA J, TORTO N and CHIMUKA L (2011) Selective removal of chromium(VI) from sulphates and other metal anions using an ion-imprinted polymer. Water SA 37 529-537.
PAKALNS P (1980) Separation of uranium from natural waters on Chelex-100 resin. Analytica Chimica Acta 120 289-296.
PAN J, YAO H, XU L, OU H, HUO P, LI X and YAN Y (2011) Selective Recognition of 2,4,6-Trichlorophenol by Molecularly Imprinted Polymers Based on Magnetic Halloysite Nanotubes Composites. Journal of Physical Chemistry 115 5440-5449.
PANICHEV N, MABASA W, NGOBENI P, MANDIWANA K and PANICHEVA S (2008) The oxidation of Cr(III) to Cr(VI) in the environment by atmospheric oxygen during the bush fires. Journal of Hazardous Materials 153 937-941.
PANKHURST QA, CONNOLLY J, JONES SK and DOBSON JJ (2003) Applications of magnetic nanoparticles in biomedicine. Journal of Physics D: Applied Physics 36 R167-R181.
PARK J, LEE E, HWANG NM, KANG M, KIM SC, HWANG Y, PARK JG, NOH HJ, KIM JY, PARK JH and HYEON T (2005), One-Nanometer-Scale Size-Controlled Synthesis of Monodisperse Magnetic Iron Oxide Nanoparticles, Angewandte Chemie International Edition 44 2872-2877.
PARK JK and SEO J (2002) Characteristics of Phenylalanine Imprinted Membrane Prepared by the Wet Phase Inversion Method. Korean Journal of Chemical Engineering 19 940-948.
PARKA D, YUN Y, JOA JH and PARKA JM (2005) Mechanism of hexavalent chromium removal by dead fungal biomass of Aspergillus niger. Water Research 39 533-540.
162
PAUSTENBACH DJ, FINLEY BL, MOWAT FS and KERGER BD (2003) Human health risk and exposure assessment of chromium(VI) in tap water. Journal of Toxicology and Environmental Health, Part A 66 1295-1339.
PAVEL LV, CRETESCU I and GAVRILESCU M (2009) Characterization and remediation of soils contaminated with uranium. Journal of Hazardous Materials 163 475-510.
PAVLOVIĆ J, STOPIĆ S, FRIEDRICH B and KAMBEROVIĆ Z (2007) Selective removal of heavy metals from metal-bearing wastewater in a cascade line reactor. Environmental Science and Pollution Research International 14 518-522.
PÉREZ N, WHITCOMBE MJ and VULFSON EN (2000) Molecularly imprinted nanoparticles prepared by core-shell emulsion polymerization. Applied Polymer Science 77 1851-1859.
PETRUZELLI D, PASSINO R and TIRAVANTI G (1995) Ion exchange process for chromium removal, recovery from tannery wastes. Industrial and Engineering Chemistry Research 34 2612-2617.
PHILIPPOVA O, BARABANOVA A, MOLCHANOV V and KHOKHLOV A (2011) Magnetic polymer beads: Recent trends and developments in synthetic design and applications. European Polymer Journal 47 542-559.
PICHON V and CHAPUIS-HUGON F (2008) Role of molecularly imprinted polymers for selective determination of environmental pollutants. Analytica Chimica Acta 622 48-61.
POLACCO G BASILE C PALLA M and SEMINO D (2000) A simple technique for measuring particle size distributions during suspension polymerization. Polymer Journal 32 688-693.
POLTI, M.A., GARCÍA, R.O., AMOROSO, M.J. and ABATE, C.M. (2009), Bioremediation of chromium(VI) contaminated soil by Streptomyces sp. MC1, Journal of Basic Microbiology 49 285-292.
POURBAIX M (1966) Atlas of Electrochemical Equilibriua. Oxford: Pergamon Press.
PREETHA CR, GLADIS JM, RAO TP and VENKATESWARAN G (2006) Removal of toxic uranium from synthetic nuclear power reactor effluents using uranyl ion imprinted polymer particles. Environmental Science and Technology 140 3070-3074.
PYRZYŃSKA K and BYSTRZEJEWSKI M (2010) Comparative study of heavy metal ions sorption onto activated carbon, carbon nanotubes, and carbon-encapsulated magnetic nanoparticles. Colloids and Surfaces A: Physicochemical and Engineering Aspects 362 102-109.

163
QDAISA HA and MOUSSAB H (2004) Removal of heavy metals from wastewater by membrane processes: a comparative study. Desalination 164 105-110.
QI J, LI X, LI Y, ZHU J and QIANG L (2008) Selective removal of Cu(II) from contaminated water using molecularly imprinted polymer. Frontiers of Chemical Engineering in China 2 109-114.
QI P, WANG J, WANG L, LI Y, JIN J, SU F, TIAN Y and CHEN J (2010) Molecularly imprinted polymers synthesized via semi-covalent imprinting with sacrificial spacer for imprinting phenols. Polymer 51 5417-5423.
QIAN Z, ZHANG Z and CHEN Y (2008) A novel preparation of surface-modified paramagnetic magnetite/polystyrene nanocomposite microspheres by radiation-induced miniemulsion polymerization. Journal of Colloid and Interface Science 327 354-361.
Radiation Effects - Effects by Radionuclides, Available from: http://hps.org/publicinformation/ate/q754.html, Accessed on 02/12/2010.
RAMAKRISHNA S, FUJIHARA K, TEO W, YONG T, MA Z and RAMASESHAN R (2006) Electrospun nanofibres: Solving Global Issues. Materials Today 9 40-50.
RAMAKRISHNAIAH CR and PRATHIMA B (2012) Hexavalent chromium removal from industrial watsewater by chemical precipitation method. International Journal of Engineering Research and Research and Applications 2 599-603.
RANA MS, HALIM MA, SAFIULLAH S, MOLLAH MM, AZAM MS, GONI MA, HOSSAIN MK and RANA MM (2009) Removal of Heavy Metal from Contaminated Water by Biopolymer Crab Shell Chitosan. Journal of Applied Sciences 9 2762-2769.
RAO TP, DANIEL S and GLADIS JM (2004) Tailored materials for preconcentration or separation of metals by ion-imprinted polymers for solid-phase extraction (IIP-SPE). Trends in Analytical Chemistry 23 28-35. RAO TP, KALA R and DANIEL S (2006) Review: Metal ion-imprinted polymers-Novel materials for selective recognition of inorganics. Analytica Chimica Acta 578 105-116.
RAO TP, PRAVEEN RS and DANIEL S (2004) Styrene-Divinylbenzene Copolymers: Synthesis, Characterization, and Their Role in Inorganic Trace Analysis. Critical Reviews in Analytical Chemistry 34 177-193.
RASKIN I, SMITH RD and SALT DE (1997) Phytoremediation of metals: using plants to remove pollutants from the environment. Current Opinion in Biotechnology 8 221-226.
RAVIKUMAR C and BANDYOPADHYAYA R (2011) Mechanistic Study on Magnetite Nanoparticle Formation by Thermal Decomposition and Coprecipitation Routes. Journal of Physical Chemistry C 115 1380-1387.
164
REKACEWIC P (2005) Mining effects on rainfall drainage, Available from: http://www.grida.no/graphicslib/detail/mining-effects-on-rainfall-drainage_cac4, Accessed on 26/01/2013.
REVATHI K, HARIBABU TE and SUDHA PN (2011) Phytoremediation of chromium contaminated soil using Sorghum plant. International Journal of Environmental Sciences 2 417-428.
RICHARD FC and BOURG ACM (1991) Aqueous geochemistry of chromium: a review. Water Research 25 807-816.
RICHARDSON (1988) Constructed wetland in water pollution progem press. New York, NY.605 p reports no 212.
RILEY RG and ZACHARA JM (1992) U.S. Department of Energy, Office of Energy Research, Subsurface Science Program: Washington, DC 1-71.
RIVA BL, PERIC IV, VILLEGAS S and RUF B (2008) Binding of uranyl ions by water-insoluble polymers containing miltiligand groups. Journal of the Chilean Chemical Society 53 1356- 1359.
ROCA AG, NIZNANSKY D, POLTIEROVA-VEJPRAVOVA J, BITTOVA B, GONZÁLEZ-FERNÁNDEZ MA, SERNA CJ and MORALES MP (2009) Magnetite nanoparticles with no surface spin canting. Journal of Applied Physics, 105 114309 1-7.
ROONASI P (2007) Adsorption and Surface Reaction Properties of Synthesized Magnetite Nano-Particles, Division of Chemistry Department of Chemical Engineering and Geosciences, Luleå University of Technology S-971 87 Luleå, Sweden.
ROSATZIN T, ANDERSSON LT, SIMON W and MOSBACH K (1991) Preparation of Ca2+ selective sorbents by molecular imprinting using polymerizable ionophores, Journal of the Chemical Society. Perkin Transactions 2 0 1261-1265.
SAAD DMG, CUKROWSKA EM and TUTU H (2012) Phosphonated cross-linked polyethylenimine for selective removal of uranium ions from aqueous solutions. Water Science and Technology 66 122-129.
SADEGHI S and ABOOBAKRI E (2012) Magnetic nanoparticles with an imprinted polymer coating for the selective extraction of uranyl ions. Microchimica Acta 178 89-97.
SADEGHI S and MOFRAD AA (2007) Synthesis of a new ion imprinted polymer material for separation and preconcentration of traces of uranyl ions Reactive and Functional Polymers 67 966-976.
165
SANDINO A and BRUNO J. (1992) The solubility of (UO2)3(PO4)2·4H2O(s) and the formation of U(VI) phospate complexes: Their influence in uranium speciation in natural waters. Geochimica et Cosmochimica Acta 56 4135-4145.
SANGA Y, LIB F, GUB Q, LIANGA C and CHENA J (2008) Heavy metal-contaminated groundwater treatment by a novel nanofiber membrane. Desalination 223 349-360.
SARANGI AK and BERI KK (2000) Uranium mining by in-situ leaching. Presented and published in the proceedings of the International conference on “Technology management for mining, processing and environment,” IIT, Kharagpur.
SAY R, BIRLIK E, ERSÖZ A, YILMAZ F, GEDIKBEY T and DENIZLI A (2003), Preconcentration of copper ion-selective imprinted polymer microbeads. Analytica Chimica Acta 480 251-258.
SCHEINOST AC, CHAVERNAS A, BARRON V and TORRENT J (1998) Use and limitations of second-derivative diffuse reflectance spectroscopy in the visible to near infrared range to identify and quantify Fe oxide minerals in soils. Clays and Clay Minerals 46 528-536.
SCHMIDT AM (2007) Thermoresponsive magnetic colloids. Colloid and Polymer Science 285 953-966.
SCORRANO S, MERGOLA L, SOLE RD and VASAPOLLO G (2011) Synthesis of Molecularly Imprinted Polymers for Amino Acid Derivates by Using Different Functional Monomers. International Journal of Molecular Sciences 12 1735-1743.
SELLERGRE B (2003) Molecularly imprinted polymers man-made mimics of antibodies and their applications in analytical chemistry, second edition. Elsevier Science B.V pp. 23-24.
SELLERGREN B and ALLENDER CJ (2005) Molecularly imprinted polymers: A bridge advanced drug delivery. Advanced Drug Delivery Reviews 57 1733-1741.
SHAW RR and HEASLEY JH (1967) Superparamagnetic Behavior of MnFe2O4, and α-Fe2O3, Precipitated from Silicate Melts. Journal of The American Ceramic Society 50 297-302.
SHE Y, CAO W, SHI X, LV X, LIU J, WANG R, JIN F, WANG J and XIAO H (2010) Class-specific molecularly imprinted polymers for the selective extraction and determination of sulfonylurea herbicides in maize samples by high performance liquid chromatography-tandem mass spectrometry. Journal of Chromatography B 878 2047-2053.
SHERRINGTON DC and HODGE P (1988) Synthesis and Sepm.ats Uartg Functional Polymers, John Wiley, New York.

166
SHEVADE S and FORD RG (2004) Use of synthetic zeolites for arsenate removal from pollutant water. Water Research 38 3197-3204.
SHIN DC, KIM YS, MOON JY, PARK HS, HIM JY and PARK SK (2002) International Trends in Risk Management of Groundwater Radionuclides. Journal of Environmental Toxicology 17 273-284.
SHOEMAKER SH, GREINER JF and GILLHAM RW (1995) Permeable Reactive Barriers, In Assessment of Barrier Containment Technologies (ed. Rumer RR and Mitchell JK). National Technical Information Service, 301-353.
SHUPACK SI (1991) The Chemistry of Chromium and Some Resulting Analytical Problems. Environmental Health Perspectives 92 7-11.
SIDHU PS (1988) Transformation of trace element-substituted maghemite to hematite. Clays and Clay Minerals 36 31-38.
SINGH DK and MISHRA S (2009) Synthesis and characterization of UO22+-ion imprinted
polymer for selective extraction of UO22+. Analytica Chimica Acta 644 42-47.
SLAVOV L, ABRASHEV MV, MERODIISKA T, GELEV C, VANDENBERGHE RE, MARKOVA-DENEVA I and NEDKOV I (2010) Raman spectroscopy investigation of magnetite nanoparticles in ferrofluids. Journal of Magnetism and Magnetic Materials 1-8.
SONMEZ HB and BICAK N (2002) Quaternization of poly (4-vinylpyridine) beads with 2-chloroacetamide for selective mercury extraction. Reactive and Functional Polymers 51 55-60.
SOUAG R, TOUAIBIA D, BENAYADA B and BOUCENNA A (2009) Adsorption of Heavy Metals (Cd, Zn and Pb) from Water Using Keratin Powder Prepared from Algerian Sheep Hoofs. European Journal of Scientific Research 35 416-425.
SPIVAK DA and SIBRIAN-VAZQUEZ M (2002) Development of Improved Crosslinking Monomers for Molecularly Imprinted Materials. Materials Research Society Symposium Proceedings 723 1-7.
SUN S, ZENG H, ROBINSON DB, RAOUX S, RICE PM, WANG SX and LI GJ (2003) Journal of the American Chemical Society 126 273-279.
SUN Y, DUAN L, GUO Z, DUANMU Y, MA M, XU L, ZHANG Y and GU N (2005) An improved way to prepare superparamagnetic magnetite-silica core-shell nanoparticles for possible biological application. Journal of Magnetism and Magnetic Materials 285 65-70.
TAMAMI B and KIASAT AR (1997) Synthesis and Application of Quaternized Polyvinylpyridine Supported Dichromate As a New Polymeric Oxidizing Agent. Iranian Polymer Journal 6 273-279.

167
TANG J, MYERS M, BOSNICK KA and BRUS LE (2003), Magnetite Fe3O4 Nanocrystals, Spectroscopic Observation of Aqueous Oxidation Kinetics. Journal of Physical Chemistry B 107 7501-7506.
TARTAJ P, MORALES M, VEINTEMILLAS-VERDAGUER S, GONŹALEZ-CARRENO T and SERNA CJ (2003) The preparation of magnetic nanoparticles for applications in biomedicine. Journal of Physics D: Applied Physics 36 R182-R197.
TEPRAT O, VERCOUTER T, ANSOBOTLO E, FICHET P, PERRET P, KURTTIO P and SALONEN L (2009) Uranium Speciation in Drinking Water from Drilled Wells in Southern Finland and Its Potential Links to Health Effects. Environmental Science and Technology 43 3941-3946.
THOMPSON G, SWAIN J, KAY M and FORSTER CF (2001) The treatment of pulp and paper mill effluent: a review. Bioresource Technology 7 275-286.
THOREK DLJ, CHEN AK, CZUPRYNA J and TSOURKAS A (2006) Superparamagnetic Iron Oxide Nanoparticle Probes for Molecular Imaging. Annals of Biomedical Engineering 34 23-38.
TODOROV P and ILIEVA EN (2004) Contamination with uranium from natural and anthropological sources. Romanian Journal of Physics 51 27-34.
TOGASHI T, TAKAMI S, KAWAKAMI K, YAMAMOTO H, NAKA T, SATO K, ABE K and ADSCHIRI T (2012) Continuous hydrothermal synthesis of 3,4-dihydroxyhydrocinnamic acid-modified magnetite nanoparticles with stealth-functionality against immunological response. Journal of Materials Chemistry 22 9041-9045.
TORAL MI, GONZÁLEZ-NAVARRETE J, LEIVA A, RÍOS HE and URZÚA MD (2009) Chromium retention properties of N-alkyl quaternized poly (4-vinylpyridine). European Polymer Journal 45 730-737.
TORRENT J and BARRON V Diffuse reflectance spectroscopy of iron oxides.
TREYBALL RE (1980) Mass transfer operations. 3rd ed, McGraw Hill, New York
TSUKAGOSHI K, YU KY, MAEDA M and TAKAGI M (1993) Metal Ion-Selective Adsorbent Prepared by Surface-Imprinting Polymerization. Bulletin of the Chemical Society of Japan 6 114-120.
TSUKAGOSHI K, YU KY, MAEDA M, TAKAGI M and MIYAJIMA T (19950) Surface Imprinting. Characterization of a Latex Resin and the Origin of the Imprinting Effect. Bulletin of the Chemical Society of Japan 68 3095-3103.
TULLA-PUCHE J and ALBERICIO F (2008) The Power of Functional Resins in Organic Synthesis, Wiley-VCH Verlag GmbH and Co. KGaA, Weinheim 19.
168
TURIEL E and MARTÍN-ESTEBAN A (2010) Molecularly imprinted polymers for sample preparation: A review. Analytica Chimica Acta 668 8799.
UDY MJ (1956) Chromium: Chemistry of Chromium and its Compounds, 1, Reinhold Publishing Corporation, New York; Chapman and Hall Ltd. London.
UEZU K, GOTO M and NAKASHIO F (1998) Metal Ion-Imprinted Polymers Prepared by Surface Template Polymerization with Water-in-Oil Emulsions, Chapter 19, in Molecular and Ionic Recognition with Imprinted Polymers 278-289.
UNSCEAR (United Nations Scientific Committee on the Effects of Atomic Radiation). 1993, Report to the General Assembly, with scientific annexes, New York.
U.S. DOE. (1999), From Cleanup to Stewardship. U.S. D.O.E. Office Environ. Management.
US EPA, (1999), National Primary Drinking Water Regulation: Radon-222: Proposed Rule.
VOIT W, KIM DK, ZAPKA W, MUHAMMED M and RAO KV (2001) Magnetic behaviour of coated superparamagnetic iron oxide nanoparticles in ferrofluids. Materials Research Society 676 Y7.8.1-Y7.8.6.
WANG J, BAO Z, CHEN S and YANG J (2011) Removal of Uranium From Aqueous Solution by Chitosan and Ferrous Ions. Journal of Engineering for Gas Turbines and Power 133 1-3.
WANG J, PENG R, YANG J, HE Q and LIU Y (2011) Selective Adsorption of Uranium(VI) on U(VI) Ion-Imprinted Chitosan Composite Magnetic Microsphers, Computer Distributed Control and Intelligent Environmental Monitoring (CDCIEM). International Conference 1714-1717.
WANG LK, TAY J, TAY STL and HUNG Y (2010) Handbook of Environmental Engineering, Environmental Bioengineering. Hamana Press 11 377-379.
WANG XB, ZHENG ZH, DING XB, CHENG X, HU XH and PENG YX (2006) Synthesis of Molecularly Imprinted Polymer Particles by Suspension Polymerization in Silicon Oil. Chinese Chemical Letters 17 1243-1246.
WANG Y, ALSMEYER DC and MCCREERY RL (1990) Raman Spectroscopy of Carbon Materials: Structural Basis of Observed Spectra. Chemistry of Materials 2 557-563.
WANG Q, GUAN Y, LIU X, REN X and YANG M (2012) High-capacity adsorption of hexavalent chromium from aqueous solution using magnetic microspheres by surface dendrimer graft modification. Journal of Colloid and Interface Science 375 160-166.
WEERASINGHE A, ARIYAWNASA S and WEERASOORIYA R (2008) Phyto-remediation potential of Ipomoea aquatica for Cr(VI) mitigation. Chemosphere 30 521-524.

169
WHO (2001) Depleted Uranium, Sources, Exposure and Health Effects, WHO, Geneva.
WOJTÓWICZ A and STOKŁOSA A (2002) Removal of Heavy Metal Ions on Smectite Ion-Exchange Column. Polish Journal of Environmental Studies 11 97-101.
World Supply of Uranium, Available on: www.purepoint.ca/abouturanium/worldsupply.php, Accessed on 04/11/2012.
WU G, WANG G, WANG J and HE C (2007) Hierarchically imprinted organic-inorganic hybrid sorbent for selective separation of mercury ion from aqueous solution. Analytica Chimica Acta 582 304-310.
YANG C, XING J, GUAN Y, LIU J and LIU H (2004) Synthesis and characterization of superparamagnetic iron nanocomposites by hydrazine reduction. Journal of Alloys and Compounds 385 283-287.
YAO X. FU Z, ZHAO Y, WANG L, FANG L and SHEN H (2012) Use of tetraethylenepentamine-functional Fe3O4 magnetic polymers for matrix solid phase dispersion extraction and preconcentration of Cr(VI) in water samples at ultratrace levels. Talanta 97 124-130.
YING WC, DIETZ EA and WOEHR GC (1990) Adsorptive capacities of activated carbon for organic constituents of waste waters. Environmental Progress 9 1-9.
YOSHIZAKO K, HOSOYA K, IWAKOSHI Y, KIMATA K and TANAKA N (1998), Porogen Imprinting Effects. Analytica Chimica Acta 70 386-389.
YU JCC and LAI EPC (2010) Molecularly Imprinted Polymers for Ochratoxin A Extraction and Analysis. Toxins 2 1536-1553.
YUE Z, BENDER SE, WANG J and ECONOMY J (2009) Removal of chromium Cr(VI) by low-cost chemically activated carbon materials from water. Journal of Hazardous Materials 166 74-78.
ZAHERI A, MOHEB A, KESHTKAR AR and SHIRANI AS (2010) Uranium Seperation from Wastewater by Electrodialysis. Iranian Journal of Environmental Health, Science and Engineering 7 429-436.
ZEINALI F, GHOREYSHI AA and NAJAFPOUR GD (2010) Adsorption of Dichloromethane from Aqueous Phase Using Granular Activated Carbon: Isotherm and Breakthrough Curve Measurements. Middle-East Journal of Scientific Research 5 191-198.
ZHAN Y, LUO X, NIE S, HUANG Y, TU X and LUO S (2011) Selective Separation of Cu (II) from Aqueous Solution with a Novel Cu (II) Surface Magnetic Ion-Imprinted Polymers. Industrial and Engineering Chemistry Research 50 6355-6361.

170
ZHANG X, JIAO C, WANG J, LIU Q, LI R, YANG P and ZHANG M (2012) Removal of uranium(VI) from aqueous solutions by magnetic Schiff base: Kinetic and thermodynamic investigation. Chemical Engineering Journal 198-199 412-419.
ZHANG Y, SONG D, LANNI LM and SHIMIZU KD (2010) Importance of Functional Monomer Dimerization in the Molecular Imprinting Process. Macromolecules 43 6284-6294.
ZHAO D, SENGUPTA AK and STEWART L (1998) Selective removal of Cr(VI) oxyanions with a new anion exchanger. Industrial and Engineering Chemistry Research 37 4383-4387.
ZHAO WH, SHENG N, ZHU R, WEI FD, CAI Z, ZHAI MJ, DU SH and HU Q (2010) Preparation of dummy template imprinted polymers at surface of silica microparticles for the selective extraction of trace bisphenol A from water samples. Journal of Hazardous Materials 179 223-229.
ZHAO YG, SHEN HY, PAN SD and HU MQ (2010) Synthesis, characterization and properties of ethylenediamine-functionalized Fe3O4 magnetic polymers for removal of Cr(VI) in wastewater. Journal of Hazardous Materials 182 295-302.
ZHU X, CUI Y, CHANG X, ZOU X and LI Z (2009) Selective solid-phase extraction of lead(II) from biological and natural water samples using surface-grafted lead(II)-imprinted polymers. Microchimica Acta 164 125-132.

171
Appendix
A.1 Calculation of the amount of γ-MPS on the surface of the magnetite using CHNS Analysis
Mass of the sample = 2 mg
C in the sample = 20.16%
Mass of carbon in the sample = 20.16% x 2
= 0.4032 mg
Ligand concentration = ( . )
= 3.36 x 10⁻⁵ moles (in 2 mg-sample)
Ligand concentration per g = ( . )( . )
= 16.8 mmol C g-1
The three other values for the ligand concentration per gram were similarly calculated and the values were both 15.8 mmol C g-1.
Ligand concentration = (11) x (16.1)
= 177.1 mmol H g-1
Mass of H per g = (177.1) x (1)
= 177.1 mg H g-1
= 17.71%
A.2 Calculation of the amount of OA on the surface of the magnetite using CHNS Analysis
Mass of the sample = 2.05 mg
% C in the sample = 4.627%
Mass of carbon in the sample = 4.627% x 2.05
= 0.9485 mg
Ligand concentration = ( . )
= 7.9 x 10⁻⁵ moles (in 2 mg-sample)

172
Ligand concentration per g = ( . )( . )
= 38.1 mmol C g-1
Ligand concentration = (33) x (3.85)
= 42.35 mmol H g-1
Mass of H per g = (42.35) x (1)
= 42.35 mg H g-1
= 4.24%
A.3 PXRD analysis: Particle size analysis
= . ∙ ∙
= . ∙ ∙
= ( . )( . )( . )( . )( . )
= 119.1 Å
= 11.9 nm

A.4 TE
EM microgr
F
rams of the
Figure A1:
e uncoated
TEM micr
173
and coated
rograms of t
d γ-MPS-m
the uncoated
magnetite.
d magnetitee.

Figgure A2: TEEM microgr
174
rams of the coated γ-MMPS-magnettite.