Prensado Menor Formación de Ptas Evaporadores
10
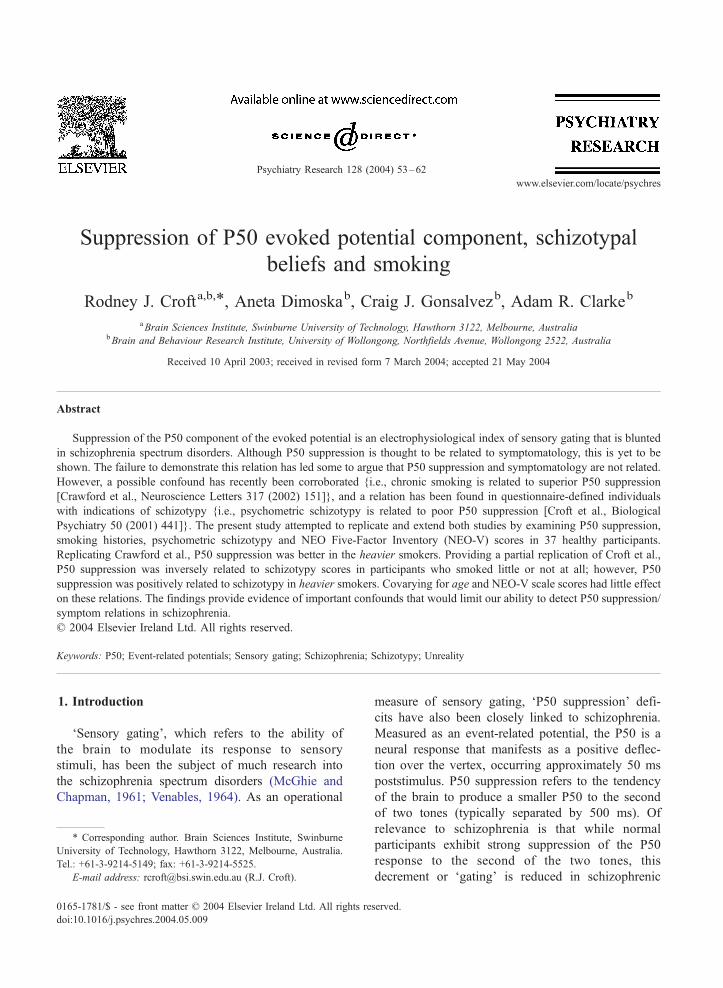
Suppression of P50 evoked potential component, schizotypal beliefs and smoking Rodney J. Croft a,b, * , Aneta Dimoska b , Craig J. Gonsalvez b , Adam R. Clarke b a Brain Sciences Institute, Swinburne University of Technology, Hawthorn 3122, Melbourne, Australia b Brain and Behaviour Research Institute, University of Wollongong, Northfields Avenue, Wollongong 2522, Australia Received 10 April 2003; received in revised form 7 March 2004; accepted 21 May 2004 Abstract Suppression of the P50 component of the evoked potential is an electrophysiological index of sensory gating that is blunted in schizophrenia spectrum disorders. Although P50 suppression is thought to be related to symptomatology, this is yet to be shown. The failure to demonstrate this relation has led some to argue that P50 suppression and symptomatology are not related. However, a possible confound has recently been corroborated {i.e., chronic smoking is related to superior P50 suppression [Crawford et al., Neuroscience Letters 317 (2002) 151]}, and a relation has been found in questionnaire-defined individuals with indications of schizotypy {i.e., psychometric schizotypy is related to poor P50 suppression [Croft et al., Biological Psychiatry 50 (2001) 441]}. The present study attempted to replicate and extend both studies by examining P50 suppression, smoking histories, psychometric schizotypy and NEO Five-Factor Inventory (NEO-V) scores in 37 healthy participants. Replicating Crawford et al., P50 suppression was better in the heavier smokers. Providing a partial replication of Croft et al., P50 suppression was inversely related to schizotypy scores in participants who smoked little or not at all; however, P50 suppression was positively related to schizotypy in heavier smokers. Covarying for age and NEO-V scale scores had little effect on these relations. The findings provide evidence of important confounds that would limit our ability to detect P50 suppression/ symptom relations in schizophrenia. D 2004 Elsevier Ireland Ltd. All rights reserved. Keywords: P50; Event-related potentials; Sensory gating; Schizophrenia; Schizotypy; Unreality 1. Introduction ‘Sensory gating’, which refers to the ability of the brain to modulate its response to sensory stimuli, has been the subject of much research into the schizophrenia spectrum disorders (McGhie and Chapman, 1961; Venables, 1964). As an operational measure of sensory gating, ‘P50 suppression’ defi- cits have also been closely linked to schizophrenia. Measured as an event-related potential, the P50 is a neural response that manifests as a positive deflec- tion over the vertex, occurring approximately 50 ms poststimulus. P50 suppression refers to the tendency of the brain to produce a smaller P50 to the second of two tones (typically separated by 500 ms). Of relevance to schizophrenia is that while normal participants exhibit strong suppression of the P50 response to the second of the two tones, this decrement or ‘gating’ is reduced in schizophrenic 0165-1781/$ - see front matter D 2004 Elsevier Ireland Ltd. All rights reserved. doi:10.1016/j.psychres.2004.05.009 * Corresponding author. Brain Sciences Institute, Swinburne University of Technology, Hawthorn 3122, Melbourne, Australia. Tel.: +61-3-9214-5149; fax: +61-3-9214-5525. E-mail address: [email protected] (R.J. Croft). www.elsevier.com/locate/psychres Psychiatry Research 128 (2004) 53 – 62
-
Upload
independent -
Category
Documents
-
view
1 -
download
0
Transcript of Prensado Menor Formación de Ptas Evaporadores
www.elsevier.com/locate/psychres
Psychiatry Research 128 (2004) 53–62
Suppression of P50 evoked potential component, schizotypal
beliefs and smoking
Rodney J. Crofta,b,*, Aneta Dimoskab, Craig J. Gonsalvezb, Adam R. Clarkeb
aBrain Sciences Institute, Swinburne University of Technology, Hawthorn 3122, Melbourne, AustraliabBrain and Behaviour Research Institute, University of Wollongong, Northfields Avenue, Wollongong 2522, Australia
Received 10 April 2003; received in revised form 7 March 2004; accepted 21 May 2004
Abstract
Suppression of the P50 component of the evoked potential is an electrophysiological index of sensory gating that is blunted
in schizophrenia spectrum disorders. Although P50 suppression is thought to be related to symptomatology, this is yet to be
shown. The failure to demonstrate this relation has led some to argue that P50 suppression and symptomatology are not related.
However, a possible confound has recently been corroborated {i.e., chronic smoking is related to superior P50 suppression
[Crawford et al., Neuroscience Letters 317 (2002) 151]}, and a relation has been found in questionnaire-defined individuals
with indications of schizotypy {i.e., psychometric schizotypy is related to poor P50 suppression [Croft et al., Biological
Psychiatry 50 (2001) 441]}. The present study attempted to replicate and extend both studies by examining P50 suppression,
smoking histories, psychometric schizotypy and NEO Five-Factor Inventory (NEO-V) scores in 37 healthy participants.
Replicating Crawford et al., P50 suppression was better in the heavier smokers. Providing a partial replication of Croft et al.,
P50 suppression was inversely related to schizotypy scores in participants who smoked little or not at all; however, P50
suppression was positively related to schizotypy in heavier smokers. Covarying for age and NEO-V scale scores had little effect
on these relations. The findings provide evidence of important confounds that would limit our ability to detect P50 suppression/
symptom relations in schizophrenia.
D 2004 Elsevier Ireland Ltd. All rights reserved.
Keywords: P50; Event-related potentials; Sensory gating; Schizophrenia; Schizotypy; Unreality
1. Introduction measure of sensory gating, ‘P50 suppression’ defi-
‘Sensory gating’, which refers to the ability of
the brain to modulate its response to sensory
stimuli, has been the subject of much research into
the schizophrenia spectrum disorders (McGhie and
Chapman, 1961; Venables, 1964). As an operational
0165-1781/$ - see front matter D 2004 Elsevier Ireland Ltd. All rights re
doi:10.1016/j.psychres.2004.05.009
* Corresponding author. Brain Sciences Institute, Swinburne
University of Technology, Hawthorn 3122, Melbourne, Australia.
Tel.: +61-3-9214-5149; fax: +61-3-9214-5525.
E-mail address: [email protected] (R.J. Croft).
cits have also been closely linked to schizophrenia.
Measured as an event-related potential, the P50 is a
neural response that manifests as a positive deflec-
tion over the vertex, occurring approximately 50 ms
poststimulus. P50 suppression refers to the tendency
of the brain to produce a smaller P50 to the second
of two tones (typically separated by 500 ms). Of
relevance to schizophrenia is that while normal
participants exhibit strong suppression of the P50
response to the second of the two tones, this
decrement or ‘gating’ is reduced in schizophrenic
served.

R.J. Croft et al. / Psychiatry Research 128 (2004) 53–6254
patients, their first-degree relatives (Adler et al.,
1982; Siegel et al., 1984; Waldo et al., 1991;
Clementz et al., 1998a) and patients with schizo-
typal personality disorder (Cadenhead et al., 2000).
Furthermore, there is evidence that this P50 sup-
pression deficit may be a genotypic marker for
schizophrenia as it has been linked to chromosome
15q13–14, which in turn has been linked to both
the disorder and other deficits related to the disorder
(Freedman et al., 1997).
However, while schizophrenic symptoms are
thought by some to be related to an inability to filter
out irrelevant stimuli (McGhie and Chapman, 1961;
Venables, 1964) and the P50 suppression deficit has
been implicated as a neural substrate of this process
(Freedman et al., 1997), no clear link between P50
suppression and symptomatology has been demon-
strated in the population (see the inconsistent findings
of Adler et al., 1990; Boutros et al., 1993; Erwin et al.,
1998; Jin et al., 1998; Nagamoto et al., 1999). This
has led some to argue that the P50 suppression deficit
in schizophrenia is not related to the disorder’s symp-
tomatology (Jin et al., 1998).
There are a number of inherent complexities in
schizophrenia research, however, that make it difficult
to explore such relations. For example, patients’
medication history and in-patient lifestyle are likely
confounding factors; it is difficult to obtain valid
measures of patients’ experiences (Light and Braff,
1998) or a broad enough range of P50 suppression
scores to adequately assess the issue, and the possible
link between schizophrenics’ smoking patterns and
P50 suppression. Adler et al., (1998) suggests that
there are many reasons why we might not observe
consistent symptom/P50 suppression relations in
schizophrenic populations. It is thus important to
determine whether these possible confounds are in-
deed likely (the negative argument) and to look for
less direct evidence of such relations (the positive
argument).
In support of the positive argument, we recently
employed nonclinical participants to help clarify this
issue by comparing scores on a psychometric schiz-
otypy scale with P50 suppression. This was based on
the assumptions that psychometric schizotypy is
related to the schizophrenia spectrum and that its
use would overcome the patient-related confounds
discussed above. Consistent with the thesis that poor
P50 suppression is related to symptoms in schizo-
phrenia, we found that poor P50 suppression was
related to schizophrenic-like beliefs and behaviours
in this nonclinical sample (Croft et al., 2001). In
terms of support for the negative argument, Light
and Braff (1998) put forward a strong case, high-
lighting the difficulty of detecting such relations
within a population renowned for inaccurate self-
report, and although not discussed in terms of this
issue, Crawford et al. (2002) found that chronic
smoking was related to superior P50 suppression in
nonclinical participants. This latter demonstration is
important because schizophrenic patients are typical-
ly very heavy smokers, which suggests that even if
there is a P50 suppression/symptom relation in
schizophrenia, it would be difficult to detect because
there are two opposing influences on P50 suppres-
sion (one related to the disorder and one related to
smoking). In support of this link, smoking tempo-
rarily normalises both P50 suppression (Adler et al.,
1993) and certain saccadic intrusion abnormalities
found in schizophrenic patients (Olincy et al., 2003)
with both abnormalities, and schizophrenia linked to
the same gene locus (Freedman et al., 1997). Sim-
ilarly, chronic smoking was found by one group to
be related to greater medication levels in schizo-
phrenic patients, with this smoking group exhibiting
a (nonsignificant) trend to improved P50 suppression
(Ward et al., 1996).
However, to enhance confidence in the findings of
Crawford et al. (2002) and Croft et al. (2001), both
studies need to be replicated and a few issues
clarified. In terms of Croft et al. (2001), we found
that nonclinical participants who had poorer P50
suppression reported more unreality features such as
perceptual anomalies and magical ideation (Gruzelier
and Doig, 1996). We interpreted the psychometric
schizotypy scores as being representative of a schizo-
phrenia spectrum belief set and believe that there is
good evidence in support of this position (Eckblad
and Chapman, 1983; Miller and Chapman, 1983;
Thalbourne, 1994; Gruzelier et al., 1995; Duchene
et al., 1998). However, even if we are justified in this
position, it does not follow that the P50 suppression/
psychometric schizotypy relation corresponds to a
P50 suppression/schizophrenia spectrum relation.
For example, as neuroticism covaries with psycho-
metric schizotypy (e.g., Eysenck and Barrett, 1993;

R.J. Croft et al. / Psychiatry Research 128 (2004) 53–62 55
Lipp et al., 1994), it may be that it is neuroticism and
not schizotypy per se that is responsible for the
relation with P50 suppression. As well as providing
a replication, the present study thus assessed the
relation between P50 suppression and unreality after
covarying for the primary personality dimensions of
the NEO Five-Factor Inventory (NEO-V; Costa and
McCrae, 1991).
With regard to Crawford et al. (2002), their finding
that heavy tobacco smokers had better P50 suppres-
sion than nonsmokers has particular relevance to the
Croft et al. (2001) study, as it demonstrated that an
important confound was not accounted for. That is,
smoking is overrepresented in schizophrenia spectrum
disorders (de Leon et al., 1995), and so we would
expect that coincident with the positive correlation
between poor P50 suppression and psychometric
schizotypy, there would also have been a negative
correlation due to the greater smoking levels in
subjects with high scores on psychometric schizotypy.
Participants’ smoking histories were not obtained in
that study and so it cannot be determined whether
smoking was related to its findings. However, partic-
ipants in that study did score moderately low on
unreality. This raises the possibility that its findings
are not generalisable to psychometric schizotypy as a
whole and instead that the results may be restricted to
moderate levels of schizotypy and any factor repre-
sentative of that group (such as low levels of smok-
ing). The present study thus provides a replication of
the Crawford et al. (2002) findings and furthermore
extends the design to include a range of smoking
histories, offering a more detailed account of the
relation.
2. Methods
2.1. Participants
Participants (16 males, 27 females) were drawn
primarily from an undergraduate psychology student
population. Participants gave written informed con-
sent and were free to withdraw from the study at any
time without penalty. Individuals were excluded on
the basis of self-reported neurological (e.g., severe
head injury, periods of unconsciousness) or psychiat-
ric histories, if they reported the use of illicit sub-
stances at least once a month for the last 6 months or
if they were not fluent in English (due to the use of
English questionnaires). This reduced the sample to
14 males and 23 females, ranging in age from 16 to 33
years (mean = 21.3 years), of which 34 were right-
handed and 3 were left-handed.
2.2. Apparatus and procedure
Upon arrival at the laboratory, participants
completed a consent form and were fitted with
EEG recording apparatus. They then completed a
series of questionnaires including the Personality
Syndrome Questionnaire (PSQ; see below) and the
NEO-V Inventory (Costa and McCrae, 1991).
Participants were then seated in a recording booth
where they performed the P50 paradigm. Partic-
ipants were instructed to count the number of tone
pairs that they heard during the P50 session. The
minimum smoking abstinence period was 2 h. The
experiment was approved by the local ethics
committee.
2.3. EEG data collection
EEG data were recorded from 19 scalp sites (Fp1,
Fp2, Fz, F3, F4, F7, F8, Cz, C3, C4, Pz, P3, P4, T3,
T4, T5, T6, O1, O2; international 10–20 system)
referenced to linked ears using tin electrodes and
grounded midway between Fpz and Fz. Electroocu-
lographic (EOG) data were recorded from above
(E1) and below (E3) the left eye and from the outer
canthi of the left (E5) and right (E6) eyes, and for
later EOG correction, vertical EOG, horizontal EOG
and radial EOG channels were derived as E1–E3,
E5–E6 and (E1 + E3)/2, respectively. Impedances
were below 5 kV at the start of the recording, and
data were continuously digitised at 500 Hz with an
0.01 to 120 Hz bandpass (24 dB/octave roll-off).
2.4. P50 presentation characteristics
Fifty 89-dB click pairs, each with a 500-ms inter-
click interval, were presented through earphones, with
10-s interpair intervals. Clicks were 100-As duration
square waves with near instantaneous rise and fall
times. The paradigm ran continuously and lasted 8 min
and 20 s.
try Research 128 (2004) 53–62
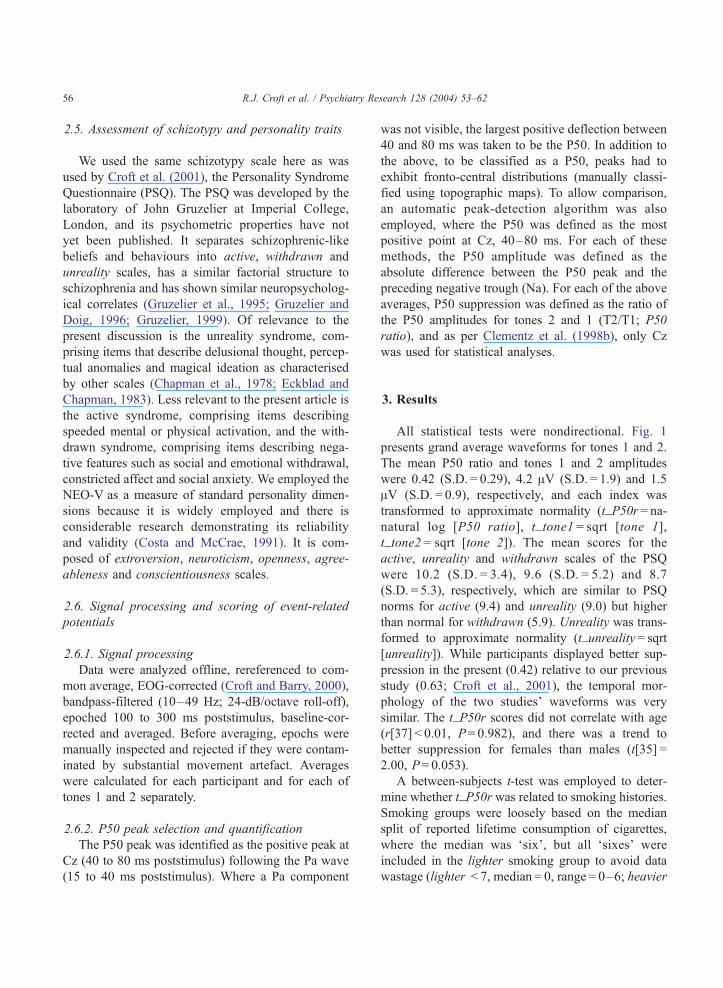
2.5. Assessment of schizotypy and personality traits
We used the same schizotypy scale here as was
used by Croft et al. (2001), the Personality Syndrome
Questionnaire (PSQ). The PSQ was developed by the
laboratory of John Gruzelier at Imperial College,
London, and its psychometric properties have not
yet been published. It separates schizophrenic-like
beliefs and behaviours into active, withdrawn and
unreality scales, has a similar factorial structure to
schizophrenia and has shown similar neuropsycholog-
ical correlates (Gruzelier et al., 1995; Gruzelier and
Doig, 1996; Gruzelier, 1999). Of relevance to the
present discussion is the unreality syndrome, com-
prising items that describe delusional thought, percep-
tual anomalies and magical ideation as characterised
by other scales (Chapman et al., 1978; Eckblad and
Chapman, 1983). Less relevant to the present article is
the active syndrome, comprising items describing
speeded mental or physical activation, and the with-
drawn syndrome, comprising items describing nega-
tive features such as social and emotional withdrawal,
constricted affect and social anxiety. We employed the
NEO-V as a measure of standard personality dimen-
sions because it is widely employed and there is
considerable research demonstrating its reliability
and validity (Costa and McCrae, 1991). It is com-
posed of extroversion, neuroticism, openness, agree-
ableness and conscientiousness scales.
2.6. Signal processing and scoring of event-related
potentials
2.6.1. Signal processing
Data were analyzed offline, rereferenced to com-
mon average, EOG-corrected (Croft and Barry, 2000),
bandpass-filtered (10–49 Hz; 24-dB/octave roll-off),
epoched 100 to 300 ms poststimulus, baseline-cor-
rected and averaged. Before averaging, epochs were
manually inspected and rejected if they were contam-
inated by substantial movement artefact. Averages
were calculated for each participant and for each of
tones 1 and 2 separately.
2.6.2. P50 peak selection and quantification
The P50 peak was identified as the positive peak at
Cz (40 to 80 ms poststimulus) following the Pa wave
(15 to 40 ms poststimulus). Where a Pa component
R.J. Croft et al. / Psychia56
was not visible, the largest positive deflection between
40 and 80 ms was taken to be the P50. In addition to
the above, to be classified as a P50, peaks had to
exhibit fronto-central distributions (manually classi-
fied using topographic maps). To allow comparison,
an automatic peak-detection algorithm was also
employed, where the P50 was defined as the most
positive point at Cz, 40–80 ms. For each of these
methods, the P50 amplitude was defined as the
absolute difference between the P50 peak and the
preceding negative trough (Na). For each of the above
averages, P50 suppression was defined as the ratio of
the P50 amplitudes for tones 2 and 1 (T2/T1; P50
ratio), and as per Clementz et al. (1998b), only Cz
was used for statistical analyses.
3. Results
All statistical tests were nondirectional. Fig. 1
presents grand average waveforms for tones 1 and 2.
The mean P50 ratio and tones 1 and 2 amplitudes
were 0.42 (S.D. = 0.29), 4.2 AV (S.D. = 1.9) and 1.5
AV (S.D. = 0.9), respectively, and each index was
transformed to approximate normality (t_P50r = na-
natural log [P50 ratio], t_tone1 = sqrt [tone 1],
t_tone2 = sqrt [tone 2]). The mean scores for the
active, unreality and withdrawn scales of the PSQ
were 10.2 (S.D. = 3.4), 9.6 (S.D. = 5.2) and 8.7
(S.D. = 5.3), respectively, which are similar to PSQ
norms for active (9.4) and unreality (9.0) but higher
than normal for withdrawn (5.9). Unreality was trans-
formed to approximate normality (t_unreality = sqrt
[unreality]). While participants displayed better sup-
pression in the present (0.42) relative to our previous
study (0.63; Croft et al., 2001), the temporal mor-
phology of the two studies’ waveforms was very
similar. The t_P50r scores did not correlate with age
(r[37] < 0.01, P= 0.982), and there was a trend to
better suppression for females than males (t[35] =
2.00, P= 0.053).
A between-subjects t-test was employed to deter-
mine whether t_P50r was related to smoking histories.
Smoking groups were loosely based on the median
split of reported lifetime consumption of cigarettes,
where the median was ‘six’, but all ‘sixes’ were
included in the lighter smoking group to avoid data
wastage (lighter < 7, median = 0, range = 0–6; heavier

Fig. 1. Evoked potentials to tones 1 and 2 are shown averaged over all participants, along with the scalp distribution of the P50 peak (where
black represents + 2 AVand white � 1 AV). The P50 deflection can be seen as a positive deflection maximal at 60 ms poststimulus onset, where
it is considerably larger for tone 1 than tone 2, and has a fronto-central distribution.
R.J. Croft et al. / Psychiatry Research 128 (2004) 53–62 57
>6, median = 1825, range = 7–51,100 lifetime ciga-
rettes). While none of the lighter smokers had ever
smoked regularly, the heavier smokers varied greatly
in smoking patterns (daily consumption: median = 3.5,
range = 0.1–30.0; duration of use in years: medi-
an = 2.5, range = 0.6–8.0; time since last cigarette:
median = 18 weeks, range = 2 h to 14 years). It may
be noted that only two of the heavier smokers had only
abstained for the minimum requirement of 2 h, with the
next smallest abstinence period being 12 h. It was
found that heavier smokers had smaller t_P50r’s than
lighter smokers (mean = 0.28, S.D. = 0.18 and
mean = 0.53, S.D. = 0.33, respectively; t(35) = 2.63,
P= 0.013). Furthermore, consistent with Crawford et
al. (2002), this effect was related to an enhancement of
tone 1 in the heavier relative to the lighter smokers
(t[35] = 3.31, P= 0.002), with no effect on tone 2
(t[35] = 0.73, P= 0.471). The P50 suppression en-
hancement for heavier smokers was still present when
analysed using the automatic rather than manual peak
detection method (t[35] = 2.51, P= 0.017).
In order to determine whether the particular meth-
od of splitting the groups into lighter and heavier was
important to the results, the groups were reallocated
based on splits at 6, 12, 52 or 112 lifetime cigarettes
(the closest naturally occurring values to the median
split described above) and this made little difference
to the results (P= 0.002, P= 0.012, P= 0.024 and
P= 0.033, respectively). This smoking/t_P50r relation
was found to be linear and strong, irrespective of the
tobacco use index employed (years of use: r[37] =
� 0.40, P= 0.016; cigarettes per day: r[37] =� 0.43,
P= 0.008; total lifetime cigarettes: r[37] =� 0.50,
P= 0.002; Pearson’s correlation; all indexes natural
log-transformed to approximate normality). As can be
seen in Fig. 2, this relation appears to be due to there
being fewer poor P50 suppression ratios with increas-
ing cigarette smoking.
As per Croft et al. (2001), Pearson’s correlation
was employed to determine whether unreality was
related to t_P50r. Across the entire sample, the Croft
et al. (2001) finding of a positive relation between P50
ratio and unreality was not replicated (r[37] = 0.01;
P= 0.963). This finding was not affected by the use of
the automatic rather than the manual peak detection
measure (r[37] =� 0.07, P= 0.674). However, based
on the Crawford et al. (2002) and present findings of
important P50 suppression/smoking relations, these
analyses were also performed for the two smoking
groups separately. In the lighter smokers, there was a
positive relation between t_P50r and t_unreality
(r[20] = 0.54, P= 0.014), and in the heavier smokers,
there was an equally strong but inverted relation
(r[17] =� 0.57, P= 0.018). These findings were not
affected appreciably by the use of the automatic rather
than the manual peak detection measure (r[20] = 0.47,
P= 0.037 and r[17] =� 0.70, P= 0.002, respectively).
These relations were heavily dependent on tone 2
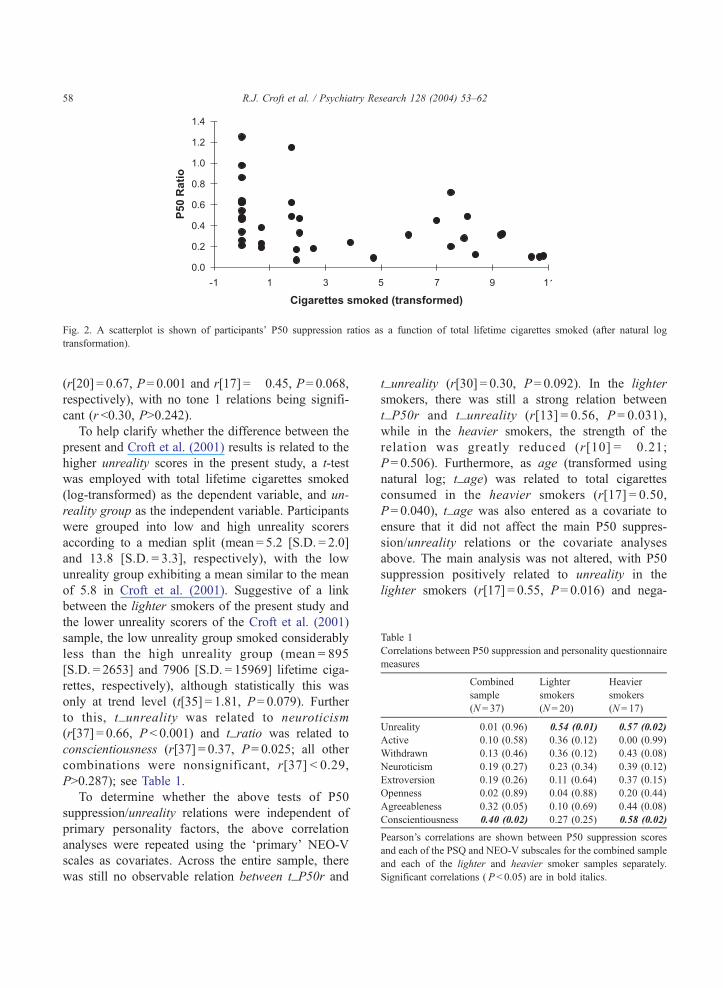
Table 1
Correlations between P50 suppression and personality questionnaire
measures
Combined
sample
(N = 37)
Lighter
smokers
(N= 20)
Heavier
smokers
(N= 17)
Unreality 0.01 (0.96) 0.54 (0.01) � 0.57 (0.02)
Active 0.10 (0.58) 0.36 (0.12) � 0.00 (0.99)
Withdrawn � 0.13 (0.46) 0.36 (0.12) � 0.43 (0.08)
Neuroticism � 0.19 (0.27) 0.23 (0.34) � 0.39 (0.12)
Extroversion 0.19 (0.26) � 0.11 (0.64) 0.37 (0.15)
Openness � 0.02 (0.89) � 0.04 (0.88) 0.20 (0.44)
Agreeableness 0.32 (0.05) 0.10 (0.69) 0.44 (0.08)
Conscientiousness 0.40 (0.02) 0.27 (0.25) 0.58 (0.02)
Pearson’s correlations are shown between P50 suppression scores
and each of the PSQ and NEO-V subscales for the combined sample
and each of the lighter and heavier smoker samples separately.
Significant correlations ( P< 0.05) are in bold italics.
Fig. 2. A scatterplot is shown of participants’ P50 suppression ratios as a function of total lifetime cigarettes smoked (after natural log
transformation).
R.J. Croft et al. / Psychiatry Research 128 (2004) 53–6258
(r[20] = 0.67, P= 0.001 and r[17] =� 0.45, P= 0.068,
respectively), with no tone 1 relations being signifi-
cant (r <0.30, P>0.242).
To help clarify whether the difference between the
present and Croft et al. (2001) results is related to the
higher unreality scores in the present study, a t-test
was employed with total lifetime cigarettes smoked
(log-transformed) as the dependent variable, and un-
reality group as the independent variable. Participants
were grouped into low and high unreality scorers
according to a median split (mean = 5.2 [S.D. = 2.0]
and 13.8 [S.D. = 3.3], respectively), with the low
unreality group exhibiting a mean similar to the mean
of 5.8 in Croft et al. (2001). Suggestive of a link
between the lighter smokers of the present study and
the lower unreality scorers of the Croft et al. (2001)
sample, the low unreality group smoked considerably
less than the high unreality group (mean = 895
[S.D. = 2653] and 7906 [S.D. = 15969] lifetime ciga-
rettes, respectively), although statistically this was
only at trend level (t[35] = 1.81, P= 0.079). Further
to this, t_unreality was related to neuroticism
(r[37] = 0.66, P < 0.001) and t_ratio was related to
conscientiousness (r[37] = 0.37, P= 0.025; all other
combinations were nonsignificant, r[37] < 0.29,
P>0.287); see Table 1.
To determine whether the above tests of P50
suppression/unreality relations were independent of
primary personality factors, the above correlation
analyses were repeated using the ‘primary’ NEO-V
scales as covariates. Across the entire sample, there
was still no observable relation between t_P50r and
t_unreality (r[30] = 0.30, P= 0.092). In the lighter
smokers, there was still a strong relation between
t_P50r and t_unreality (r[13] = 0.56, P= 0.031),
while in the heavier smokers, the strength of the
relation was greatly reduced (r[10] = � 0.21;
P= 0.506). Furthermore, as age (transformed using
natural log; t_age) was related to total cigarettes
consumed in the heavier smokers (r[17] = 0.50,
P= 0.040), t_age was also entered as a covariate to
ensure that it did not affect the main P50 suppres-
sion/unreality relations or the covariate analyses
above. The main analysis was not altered, with P50
suppression positively related to unreality in the
lighter smokers (r[17] = 0.55, P= 0.016) and nega-

R.J. Croft et al. / Psychiatry Research 128 (2004) 53–62 59
tively related to unreality in the heavier smokers
(r[14] =� 0.55, P= 0.028). The covariate analysis
was not altered in the lighter smokers (r[12] = 0.57,
P= 0.033), but the negative relation between P50
suppression and unreality in the heavier smokers
was largely restored with the addition of age as a
covariate (r[9] =� 0.53, P= 0.091).
4. Discussion
The present study has replicated Crawford et al.
(2002) by finding that within a nonclinical sample,
tobacco smoking was related to superior P50 suppres-
sion. This replication was particularly strong given
that differences between the groups’ smoking levels
were far less in the present than in the original study
and that results were consistent in that the effect of
smoking was principally on the tone 1 response in
both studies. It may be noted that as nicotine has a
half-life of 2 h (Benowitz and Jacob, 1999) and only a
2-h abstinence period was required from participants,
the possibility that the smoking/P50 suppression rela-
tion of the present study was due to acute effects of
smoking cannot be discounted. However, Crawford et
al. (2002) were able to show that their effects were not
due to acute smoking effects by demonstrating that
there was no difference between P50 suppression
immediately after smoking and that following pro-
longed abstinence (9–15 h), most participants in the
present study abstained considerably longer than the
minimum 2-h period, and nicotine effects on P50
suppression have been found to be negligible after
30 min (Adler et al., 1993). So although the present
study was not equipped to replicate this aspect of the
Crawford et al. (2002) study, we would presume that
we are observing the same chronic phenomenon.
As more schizophrenic patients smoke, and smoke
far more than nonclinical populations (de Leon et al.,
1995), their smoking behaviour may thus affect their
P50 suppression scores in addition to the effect of the
disorder itself. This complexity suggests that any
relation between P50 suppression and symptomatolo-
gy in schizophrenia will be difficult to identify and
thus that the failure of science to consistently detect
such a relation (e.g., Jin et al., 1998) is not a strong
reason for concluding that P50 suppression is not
related to symptomatology.
This smoking/P50 suppression relation is particu-
larly important when we consider the attempted
replication of a relation between P50 suppression
and unreality. That is, in the lighter smokers, poor
P50 suppression was strongly related to high unre-
ality scores, and in the heavier smokers, the relation
was inverted. While it cannot be determined why the
Croft et al. (2001) study was only replicated within
the lighter smokers, the finding that this group had
similar unreality scores to that of the Croft et al.
(2001) study and that this moderate range of unre-
ality scoring participants smoked less than the higher
scorers of the present study suggests that the relation
only holds for moderate unreality participants or
those who do not regularly smoke. It may be posited
that this may be because the lighter smokers’ P50
suppression scores are the only scores that have not
been heavily affected by smoking and therefore are
the only scores not to have their P50 suppression/
unreality relations masked.
The present study has provided a limited replica-
tion of our previous finding (Croft et al., 2001) of a
relation, within a nonclinical sample, between poor
P50 suppression and psychometric schizotypy. It was
originally argued that this relation provided support
for the proposition that the early sensory gating
deficits and unusual belief systems that characterise
schizophrenia are related. However, as can be seen
in Fig. 3, in the present study, this relation was
restricted to the lighter smokers, corresponding to
similar levels of unreality to those reported in our
previous study and did not extend to high unreality
scorers.
That the relation did not hold at higher levels of
unreality in the present sample is problematic for the
‘positive’ argument that this relation provides support
for a link between symptomatology and poor P50
suppression in schizophrenia. This stems from the
assumption of a continuum moving from low to high
schizotypy and extending beyond this to clinical
populations such as schizotypal personality disorder
and schizophrenia itself. Thus, as the relation holds at
low to moderate but not high levels of schizotypy, this
may suggest that there is no simple extension of the
relation from moderate schizotypy to schizophrenia.
However, due to the strong relation between P50
suppression and smoking in the present study and
the Crawford et al. (2002) study, it may merely be that

Fig. 3. A scatterplot is shown of participants’ P50 suppression ratios (after natural log transformation) as a function of their unreality scores
(after square root transformation), for lighter (empty diamonds and dotted line) and heavier (filled markers and solid line) smokers separately.
R.J. Croft et al. / Psychiatry Research 128 (2004) 53–6260
as with schizophrenia itself, the relation is difficult to
study in samples with higher schizotypy scores and/or
larger smoking histories.
In terms of providing a ‘negative’ argument against
the claim that ‘‘if there was a relation between
schizophrenia symptoms and P50 suppression, then
it would have been detected by now’’, the present
study shows that schizophrenia-like beliefs and
behaviours are heavily dependent on smoking levels.
That is, not only are both P50 suppression and
schizophrenia-like beliefs related to tobacco smoking,
but the relation between the two is also influenced by
tobacco smoking.
It is important to note that the P50 suppression/
unreality relation in the lighter smokers was not
explicable in terms of any of the NEO-V personality
dimensions. Relations were found between P50 sup-
pression and the conscientiousness scale (r = 0.37) and
between unreality and the neuroticism scale (r = 0.66),
but covarying for these dimensions did not affect the
P50 suppression/unreality relation appreciably. Thus,
while replicating the relation between psychometric
schizotypy and neuroticism (Eysenck and Barrett,
1993; Lipp et al., 1994), the present study argues
against the possibility that the relation between P50
suppression and psychometric schizotypy observed in
the lighter smokers/moderate unreality scorers here
and in the moderate unreality scores previously (Croft
et al., 2001) was merely due to standard personality
dimensions. This issue is less clear in relation to the
heavier smokers of the present study, as covarying for
the NEO-V scales did remove the relation, but it was
essentially restored with the addition of age as another
covariate. Furthermore, it may be noted that as unre-
ality scores were independently related to neural
function, this is consistent with other research (Lipp
et al., 1994) suggesting that schizotypy may itself
represent a unique personality dimension.
It is concluded that the present study has repli-
cated the results of Crawford et al. (2002), in that
tobacco smoking was related to stronger P50 sup-
pression, and Croft et al. (2001) in part, in that
psychometric schizotypy was related to poor P50
suppression within the lighter smokers/low to mod-
erate unreality scorers. It was also found that within
the heavier smokers, unreality was related to im-
proved P50 suppression. Together, the complexity
that these findings demonstrate provides strong evi-
dence contrary to the view that ‘‘if there was a
relation between schizophrenia symptoms and P50
suppression, then it would have been detected by
now’’. Furthermore, as findings were not affected by
the statistical removal of NEO-V personality dimen-
sions, this demonstrates that relations between P50
suppression and unreality are not due to other
‘primary’ personality factors.
Acknowledgements
The authors thank John H. Gruzelier, Cognitive
Neuroscience and Behaviour, Imperial College, Lon-
don, for helpful comments regarding interpretation of
the data.

R.J. Croft et al. / Psychiatry Research 128 (2004) 53–62 61
References
Adler, L.E., Pachtman, E., Franks, R.D., Pecevich, M., Waldo, M.C.,
Freedman, R., 1982. Neurophysiological evidence for a defect in
neuronal mechanisms involved in sensory gating in schizophre-
nia. Biological Psychiatry 17, 639–654.
Adler, L.E., Waldo, M.C., Tatcher, A., Cawthra, E., Baker, N.,
Freedman, R., 1990. Lack of relationship of auditory gating
defects to negative symptoms in schizophrenia. Schizophrenia
Research 3, 131–138.
Adler, L.E., Hoffer, L.D., Wiser, A., Freedman, R., 1993. Nor-
malisation of auditory physiology by cigarette smoking in
schizophrenic patients. American Journal of Psychiatry 150,
1856–1861.
Adler, L.E., Olincy, A., Waldo, M., Harris, J.G., Griffith, J., Stevens,
K., Flach, K., Nagamoto, H., Bickford, P., Leonard, S., Freed-
man, R., 1998. Schizophrenia, sensory gating, and nicotinic
receptors. Schizophr. Bull. 24, 189–202.
Benowitz, N.L., Jacob III, P., 1999. Pharmacokinetics and metabo-
lism of nicotine and related alkaloids. In: Arneric, S.P., Brioni,
J.D. (Eds.), Neuronal Nicotinic Receptors. Wiley-Liss, New
York, pp. 213–234.
Boutros, N., Zouridakis, G., Rustin, T., Peabody, C., Warner, D.,
1993. The P50 component of the auditory evoked potential and
subtypes of schizophrenia. Psychiatry Research 47, 243–254.
Cadenhead, K.S., Light, G.A., Geyer, M.A., Braff, D.L., 2000.
Sensory gating deficits assessed by the P50 event-related poten-
tial in subjects with schizotypal personality disorder. American
Journal of Psychiatry 157, 55–59.
Chapman, L.J., Chapman, J., Raulin, M.L., 1978. Body image ab-
erration in schizophrenia. Journal of Abnormal Psychology 87,
399–407.
Clementz, B.A., Geyer, M.A., Braff, D.L., 1998a. Poor P50 suppres-
sion among schizophrenia patients and their first-degree biolog-
ical relatives. American Journal of Psychiatry 155, 1691–1694.
Clementz, B.A., Geyer, M.A., Braff, D.L., 1998b. Multiple site
evaluation of P50 suppression among schizophrenia and normal
comparison subjects. Schizophrenia Research 30, 71–80.
Crawford, H.J., McClain-Furmanski, D., Castagnoli Jr., N., Castag-
noli, K., 2002. Enhancement of auditory sensory gating and
stimulus-bound gamma band (40 Hz) oscillations in heavy to-
bacco smokers. Neuroscience Letters 317, 151–155.
Croft, R.J., Barry, R.J., 2000. EOG correction of blinks with sac-
cade coefficients: a test and revision of the aligned-artifact av-
erage solution. Clinical Neurophysiology 3, 444–455.
Croft, R.J., Lee, A., Bertolot, J., Gruzelier, J.G., 2001. Associations
of P50 suppression and habituation with perceptual and cogni-
tive features of ‘‘unreality’’ in schizotypy. Biological Psychiatry
50, 441–446.
Costa, P.T., McCrae, R.R., 1991. NEO Five Factor Inventory (Form
S). PAR Psychological Assessment Resources, Florida, U.S.A.
de Leon, J., Dadvand, M., Canuso, C., White, A.O., Stanilla, J.K.,
Simpson, G.M., 1995. Schizophrenia and smoking: an epidemi-
ological survey in a state hospital. American Journal Psychiatry
152, 453–455.
Duchene, A., Graves, R.E., Brugger, P., 1998. Schizotypal think-
ing and associative processing: a response commonality anal-
ysis of verbal fluency. Journal of Psychiatry and Neuroscience
23, 56–60.
Eckblad, M., Chapman, L.J., 1983. Magical ideation as an indicator
of schizotypy. Journal of Consulting and Clinical Psychology
51, 215–225.
Erwin, R.J., Turetsky, B.I., Moberg, P., Gur, R.C., Gur, R.E., 1998.
P50 abnormalities in schizophrenia: relationship to clinical and
neuropsychological indices of attention. Schizophrenia Research
33, 157–167.
Eysenck, H.J., Barrett, P., 1993. The nature of schizotypy. Psycho-
logical Reports 73, 59–63.
Freedman, R., Coon, H., Myles-Worsley, M., Orr-Urteger, A.,
Olincy, A., Davis, A., Polymeropoulos, M., Holik, J., Hopkins,
J., Hoff, M., Rosenthal, J., Waldo, M.C., Reimherr, F., Wender,
P., Yaw, J., Young, D.A., Breese, C.R., Adams, C., Patterson,
D., Adler, L.E., Kruglyak, L., Leonard, S., Byerley, W.,
1997. Linkages of a neurophysiological deficit in schizophre-
nia to chromosome 15 locus. Proceedings of the National
Academy of Sciences of the United States of America 94,
587–592.
Gruzelier, J., 1999. Functional neuro-psychophysiological asymme-
try in schizophrenia: a review and reorientation. Schizophrenia
Bulletin 25, 91–120.
Gruzelier, J.H., Doig, A., 1996. The factorial structure of schizo-
typy: Part II. Cognitive asymmetry, arousal, handedness, and
sex. Schizophrenia Bulletin 22, 621–634.
Gruzelier, J., Burgess, A., Stygall, J., Irving, G., Raine, A., 1995.
Patterns of cerebral asymmetry and syndromes of schizotypal
personality. Psychiatry Research 56, 71–79.
Jin, Y., Bunney Jr., W.E., Sandman, C.A., Patterson, J.V., Fleming,
K., Moenter, J.R., Kalali, A.H., Hetrick,W.P., Potkin, S.G., 1998.
Is P50 suppression a measure of sensory gating in schizophrenia?
Biological Psychiatry 43, 873–878.
Light, G.A., Braff, D.L., 1998. The ‘‘incredible shrinking’’ P50
event-related potential. Biological Psychiatry 43, 918–920.
Lipp, O.V., Arnold, S.L., Siddle, D.A.T., 1994. Psychosis proneness
in a non-clinical sample: I. A psychometric study. Personality
and Individual Differences 17, 395–404.
McGhie, A., Chapman, J.S., 1961. Disorders of attention and per-
ception in early schizophrenia. British Journal of Medical Psy-
chology 34, 103–116.
Miller, E.N., Chapman, L.J., 1983. Continued word association in
hypothetically psychosis-prone college students. Journal of Ab-
normal Psychology 92, 468–478.
Nagamoto, H.T., Adler, L.E., McRae, K.A., Huettl, P., Cawthra,
E., Gerhardt, G., Hea, R., Griffith, J., 1999. Auditory P50 in
schizophrenics on clozapine: improved gating parallels clini-
cal improvement and changes in plasma 3-methoxy-4-hydro-
xyphenylglycol. Neuropsychobiology 39, 10–17.
Olincy, A., Johnson, L.L., Ross, R.G., 2003. Differential effects of
cigarette smoking on performance of a smooth pursuit and a
saccadic eye movement task in schizophrenia. Psychiatry Re-
search 117, 223–226.
Siegel, C., Waldo, M.C., Mizner, G., Adler, L.E., Freedman, R.,
1984. Deficits in sensory gating in schizophrenia patients and
their relatives. Archives of General Psychiatry 41, 607–612.
Thalbourne, M.A., 1994. Belief in the paranormal and its relation-

R.J. Croft et al. / Psychiatry Research 128 (2004) 53–6262
ship to schizophrenia-relevant measures: a confirmatory study.
British Journal of Clinical Psychology 33, 78–80.
Venables, P.H., 1964. Selectivity of attention in schizophrenia. In:
Maher, B.A. (Ed.), Progress in Experimental Personality Re-
search, vol. 1. Academic Press, New York, pp. 1–47.
Waldo, M.C., Carey, G., Myles-Worsley, M., Cawthra, E., Adler,
L.E., Nagamoto, H.T., Wender, P., Byerley, W., Plaetke, R.,
Freedman, R., 1991. Codistribution of a sensory gating def-
icit and schizophrenia in multi-affected families. Psychiatry
Research 39, 257–268.
Ward, P.B., Hoffer, L.D., Liebert, B.J., Catts, S.V., O’Donnell, M.,
Adler, L.E., 1996. Replication of a P50 auditory gating deficit in
Australian patients with schizophrenia. Psychiatry Research 64,
121–135.