Preliminary Results on Biomimetic Methods Based on Soluble Ammonium Phosphate Precursors for the...
29
Chapter 22 Preliminary Results on Biomimetic Methods Based on Soluble Ammonium Phosphate Precursors for the Consolidation of Archaeological Wall Paintings Magdalena Balonis-Sant, *,1 Xiao Ma, 1 and Ioanna Kakoulli 1,2 1 Department of Materials Science and Engineering, University of California Los Angeles, 410 Westwood Plaza, 3111 Engineering V, BOX 159510, Los Angeles, California 90005-1595 2 UCLA/Getty Conservation Program and Cotsen Institute of Archaeology, University of California Los Angeles, 308 Charles E. Young Drive North, A210 Fowler Building, Box 951510, Los Angeles, California 90095-1510 * E-mail: [email protected] This research develops hydroxyapatite (HAP)-based, inorganic mineral systems for the consolidation of powdery wall paintings of archaeological significance. The scientific approach exploits biomimetic (biologically inspired design) principles to induce in situ the formation of protective HAP crystals by triggering reactions between the calcium carbonate-rich layers in wall paintings and ammonium phosphate precursors. The high solubility and absence of toxicity of ammonium phosphate precursors and the stability of the hydroxyapatite reaction product at varying pH, renders this treatment extremely promising for consolidation and protection of weathered wall paintings. Experimental trials were carried out on wall painting test blocks applying cellulose compresses of 1M and 2M solutions of diammonium hydrogen phosphate for 3 to 6 hours contact time. The consolidating effect was evaluated through microstructurally and compositionally-sensitive analytics including VPSEM-EDS, XRF, water sorption test and scotch tape test. Preliminary results indicated the formation of a porous hydroxyapatite network at the surface and subsurface of the test blocks with improved cohesion, pH-resistivity and © 2013 American Chemical Society Downloaded by UNIV OF CALIFORNIA LOS ANGELES on October 29, 2013 | http://pubs.acs.org Publication Date (Web): October 15, 2013 | doi: 10.1021/bk-2013-1147.ch022 In Archaeological Chemistry VIII; Armitage, R., et al.; ACS Symposium Series; American Chemical Society: Washington, DC, 2013.
Transcript of Preliminary Results on Biomimetic Methods Based on Soluble Ammonium Phosphate Precursors for the...
Chapter 22
Preliminary Results on Biomimetic MethodsBased on Soluble Ammonium PhosphatePrecursors for the Consolidation of
Archaeological Wall Paintings
Magdalena Balonis-Sant,*,1 Xiao Ma,1 and Ioanna Kakoulli1,2
1Department of Materials Science and Engineering, University of CaliforniaLos Angeles, 410 Westwood Plaza, 3111 Engineering V, BOX 159510,
Los Angeles, California 90005-15952UCLA/Getty Conservation Program and Cotsen Institute of Archaeology,University of California Los Angeles, 308 Charles E. Young Drive North,A210 Fowler Building, Box 951510, Los Angeles, California 90095-1510
*E-mail: [email protected]
This research develops hydroxyapatite (HAP)-based, inorganicmineral systems for the consolidation of powdery wall paintingsof archaeological significance. The scientific approach exploitsbiomimetic (biologically inspired design) principles to inducein situ the formation of protective HAP crystals by triggeringreactions between the calcium carbonate-rich layers in wallpaintings and ammonium phosphate precursors. The highsolubility and absence of toxicity of ammonium phosphateprecursors and the stability of the hydroxyapatite reactionproduct at varying pH, renders this treatment extremelypromising for consolidation and protection of weathered wallpaintings. Experimental trials were carried out on wall paintingtest blocks applying cellulose compresses of 1M and 2Msolutions of diammonium hydrogen phosphate for 3 to 6 hourscontact time. The consolidating effect was evaluated throughmicrostructurally and compositionally-sensitive analyticsincluding VPSEM-EDS, XRF, water sorption test and scotchtape test. Preliminary results indicated the formation of aporous hydroxyapatite network at the surface and subsurfaceof the test blocks with improved cohesion, pH-resistivity and
© 2013 American Chemical Society
Dow
nloa
ded
by U
NIV
OF
CA
LIF
OR
NIA
LO
S A
NG
EL
ES
on O
ctob
er 2
9, 2
013
| http
://pu
bs.a
cs.o
rg
Pub
licat
ion
Dat
e (W
eb):
Oct
ober
15,
201
3 | d
oi: 1
0.10
21/b
k-20
13-1
147.
ch02
2
In Archaeological Chemistry VIII; Armitage, R., et al.; ACS Symposium Series; American Chemical Society: Washington, DC, 2013.

reduced water absorption. These data show the potential of thistreatment for the consolidation of powdery wall paintings andtheir protection from weathering and deterioration induced bynatural aging and environmental action-linked effects.
Introduction
Wall paintings provide a testimony of artistic, cultural, and intellectualdevelopments and are often of great archaeological, historical and culturalsignificance. Physically and chemically, wall paintings are highly complex,heterogeneous composites consisting of a layered structure of at least threephases: binder, aggregate and pigment (1).
Owing to their nature and context, wall paintings are faced with imminentthreats of deterioration both natural and manmade with broad impact causingchemical, physical and mechanical damage to the constituent materials. Theseinclude but are not limited to: moisture, microbiological growth, pollution,seismic activity, vandalism and others. The most common manifestations ofweathering on wall paintings include staining of microbiological or chemicalorigin and color alteration, pitting and severe powdering leading to loss ofcohesion within the different layers at the microscopic scale.
Extensive studies have been carried out using a variety of consolidationtreatments to improve the condition of surfaces (2–7). These studies criticallyindicate that choosing a proper consolidant for porous materials is challenging.This is specifically related to being able to ensure sufficient penetration beneaththe surface, while also providing mechanical strength and abrasion resistance (2,7, 8). The definition of a consolidant provided by Warren can be used as a pointof reference (9):
A consolidant acts at the near-molecular level by fixing or inhibiting thecapacity for movement between very small particles, thereby altering thecharacteristics of the material in terms of its behavior, particularly in thepresence of water. It tends to make the material stronger in compressionand tension, and may affect inherent characteristics, such as heat andsound transmission and rigidity. (121)
Further, a consolidant should not severely alter the original “nature of theporosity” (10), and not be extremely hydrophobic, which could lead to furtherdamage. Ideally, the consolidant should also be photochemically stable to preventoptical changes of the surface of the paint that could affect significantly thesaturation of color, gloss and texture (8). Also, one of the key factors in theconsolidation of wall paintings in particular is retreatability, enabling futuretreatments, if necessary (11).
Polymers, mainly acrylic, vinyl and silicone based, have been widely usedas consolidants for cultural heritage objects (12–17). However, contrary toexpectation, in many cases polymers used for the consolidation of wall paintingshave often induced further degradation of the artwork by changing greatly the
420
Dow
nloa
ded
by U
NIV
OF
CA
LIF
OR
NIA
LO
S A
NG
EL
ES
on O
ctob
er 2
9, 2
013
| http
://pu
bs.a
cs.o
rg
Pub
licat
ion
Dat
e (W
eb):
Oct
ober
15,
201
3 | d
oi: 1
0.10
21/b
k-20
13-1
147.
ch02
2
In Archaeological Chemistry VIII; Armitage, R., et al.; ACS Symposium Series; American Chemical Society: Washington, DC, 2013.

physicochemical properties of the plasters and paint layers (18). An alternativemethod to organic polymers is the in situ formation of more compatible inorganicmineral phases re-establishing the loss of cohesion in disintegrated plaster layers(3, 7, 19–26). An example is the application of Ca(OH)2-based consolidantsthat has been practiced extensively (3, 7, 27, 28). The consolidation mechanismis based on the transformation of Ca(OH)2 into calcium carbonate (CaCO3)through a carbonation process induced by the CO2 in the atmosphere througha chemical reaction similar to the setting of the original plaster. However,the low solubility of calcium hydroxide in water (1.73 g/L at 20°C), the lowstability of the system and high surface tension of water (as the medium) causeaggregation and phase separation resulting in inefficient penetration, poorconsolidation strength and whitening of the surface. Several strategies including“sucrose methods” to increase Ca(OH)2 solubility (7, 29) and the synthesis ofCa(OH)2 nanoparticle-alcohol dispersions to prevent agglomeration and improvepenetration have been reported (21). Yet, in spite of improved working andperformance properties, the sensitivity of CaCO3 to a drop in the pH (caused byacid rain and other acid local environments for example) or a phase transformationinto gypsum (CaSO4.2H2O) in the presence of sulfate ions (known as ‘sulfation’)poses limitations in the use of Ca(OH)2-based consolidants. Other inorganicmineralization treatments based on barium or oxalate salts have been questioneddue to concerns related to the toxicity of barium (not all nations permit the useof barium in conservation) and the limited penetration of oxalates into a porousmedium (3, 30, 31).
Recent studies (31–35) have demonstrated a considerable potential fordeveloping much improved consolidation methods by bio-mimicking the growthof hydroxyapatite (Ca10(PO4)6(OH)2, HAP), the main mineralogical component ofteeth and bones on limestone matrices (31, 32, 34, 36). In this research, we exploresimilar principles to induce the in situ formation of protective HAP crystalsby triggering reactions between the Ca in the calcium carbonate (CaCO3)-richplaster layers of wall paintings and ammonium phosphate precursors. Bothmonoammonium (MAP) and diammonium hydrogen phosphate (DAP) precursorswere tested though here only the use of the latter is discussed. Other solublephosphate-based salts such as potassium/sodium phosphates could also serve as asource of phosphorous. However, in conservation applications it is not advisableto use Na+ and K+ cations as upon penetration they may combine with anionspresent in the system (or deposited from the atmosphere) to form Na and K saltsthat could be detrimental to the preservation of the wall paintings (37, 38).
The theoretical chemical pathway of the HAP formation using DAP as theprecursor is presented below (Reaction 1) (35) and a schematic diagram of theanticipated consolidation effect in Figure 1.
In reality, the HAP formed through this reaction may be non-stoichiometric;Ca deficient or HAP containing substituted carbonate species may form (34, 35,39, 40). The HAP precipitation is expected to be preceded by the formation
421
Dow
nloa
ded
by U
NIV
OF
CA
LIF
OR
NIA
LO
S A
NG
EL
ES
on O
ctob
er 2
9, 2
013
| http
://pu
bs.a
cs.o
rg
Pub
licat
ion
Dat
e (W
eb):
Oct
ober
15,
201
3 | d
oi: 1
0.10
21/b
k-20
13-1
147.
ch02
2
In Archaeological Chemistry VIII; Armitage, R., et al.; ACS Symposium Series; American Chemical Society: Washington, DC, 2013.

of intermediate metastable phases, such as amorphous calcium phosphate,monocalcium phosphate monohydrate, dicalcium phosphate dehydrate and/oroctacalcium phosphate. These intermediate phases whose formation depends onthe reaction conditions (e.g., degree of supersaturation, temperature, pH, presenceof foreign ions, etc.), are expected to transform into HAP or its ion-substitutedanalogues (34, 36, 39, 41, 42). The resulting hydroxyapatite network is expectedto improve cohesion between loose particles at the immediate subsurface ofwall painting. Since hydroxyapatite is reported to be stable in a wide pH range(between ~pH 4 and 14) (43), increased resistivity towards an acid environmentis anticipated (44).
Figure 1. Schematic representation of the in situ consolidation of a wall paintingplaster. HAP (black dotted surface) forms on the top of the surface treated,
preferentially in areas occupied by microcrystalline CaCO3 (plaster binder). Thelarge grey/whitish particles represent aggregates in the plaster layer. Not in scale.
Experimental Methods
Materials for the Preparation of Wall Painting Test Blocks
Wall painting plaster test blocks were used to test the hydroxyapatite (HAP)consolidation effect. The test blocks were prepared by mixing 1) commercialcalcium hydroxide (lime putty) withmarble dust (0.2-0.6mm) and deionized waterat 1:4:1 volumetric ratio and 2) commercial lime putty with sand (0.2-0.6 mm) atthe same ratio as above. The mixtures at a consistency of a dense paste (mortar)were subsequently placed in custom-made stainless-steel molds (5cm x 5cm x2cm) and left to dry at 25° C and ~60% RH for one week. Consequently thesamples were de-molded and left to set fully for 6 months in order to ensure fullconversion of the Ca(OH)2 binder to CaCO3.
The lime putty, marble dust and sand were purchased from Kremer PigmentsInc.
422
Dow
nloa
ded
by U
NIV
OF
CA
LIF
OR
NIA
LO
S A
NG
EL
ES
on O
ctob
er 2
9, 2
013
| http
://pu
bs.a
cs.o
rg
Pub
licat
ion
Dat
e (W
eb):
Oct
ober
15,
201
3 | d
oi: 1
0.10
21/b
k-20
13-1
147.
ch02
2
In Archaeological Chemistry VIII; Armitage, R., et al.; ACS Symposium Series; American Chemical Society: Washington, DC, 2013.

Application and in Situ Formation of HAP
For the application of the reagent, cellulose compresses (poultices) wereprepared of 1 and 2 M DAP. Each compress was approximately 1 cm thick. Apermeable very thin tissue of compact weave was placed at the interface betweenthe wall painting test block and the cellulose poultice to prevent cellulose fibersfrom sticking on the surface of blocks (Figure 2). Three and six hours of contacttime were tested. Cellophane foil was used to cover the cellulose compress inorder to prevent the solution from evaporating too fast. During the reaction, afaint smell of ammonia was detected. After completion of the treatment, thecellulose poultice was removed and the test blocks were left to dry in air.
The DAP solutions were made using deionized water and analytical reagentgrade diammonium hydrogen phosphate purchased from Fisher Scientific. Eachcellulose compress was prepared by mixing Arbocel cellulose fibers: BC 200 andBWW 40 at a volumetric ratio of 0.4 (BC 200) : 0.6 (BWW 40) : 0.9 (DAPsolution). Tengucho tissue purchased from Hiromi Paper, Inc. was used as theintermediate supporting layer.
Figure 2. Example of an application of the consolidation treatment on the wallpainting test blocks (a: schematic, b: actual).
Determination of Carbonation Level of Simulated Wall Painting SubstrateTest Blocks
The calcium carbonate/calcium hydroxide content was determined usingthermal analysis (TG/DTG) performed in a nitrogen environment using a PerkinElmer STA 6000 thermal analyzer. Temperatures were scanned in the rangebetween 35-980°C and heating rate was set for 10°C/min.
423
Dow
nloa
ded
by U
NIV
OF
CA
LIF
OR
NIA
LO
S A
NG
EL
ES
on O
ctob
er 2
9, 2
013
| http
://pu
bs.a
cs.o
rg
Pub
licat
ion
Dat
e (W
eb):
Oct
ober
15,
201
3 | d
oi: 1
0.10
21/b
k-20
13-1
147.
ch02
2
In Archaeological Chemistry VIII; Armitage, R., et al.; ACS Symposium Series; American Chemical Society: Washington, DC, 2013.
Morphological and Physicochemical Characterization of HAP andAssessment of Treatment Efficiency
The effectiveness of the treatment in providing consolidation actionand the formation of HAP network was evaluated using scanning electronmicroscopy (SEM) at variable pressure (VP) coupled with energy dispersive x-rayspectroscopy (EDS); X-ray fluorescence spectroscopy (XRF); water sorption testand scotch tape test.
SEM-EDS
SEM analysis was performed using the FEI Nova™NanoSEM 230. To avoidthe necessity of carbon or metal sputtering, a low vacuummode (variable pressure)was applied during the analysis.
Morphological and topographic characteristics of the surface before andafter treatment were recorded using the secondary electron detector (SE). Thedepth of penetration and spatial localization of the newly phosphate-containingforms was assessed using backscattered electron detector (BSE) and energydispersive x-ray spectroscopy (EDS) on polished sections. Polished sections wereprepared by embedding samples in epoxy resin (Buehler EpoxiCure®) mixedwith EpoxiCure® Epoxy Hardener and placed under vacuum using the BuehlerCast n’ Vac 1000. Once the resin had set, the samples were cut using Labcut 1010low speed diamond saw and ground using Buehler silicon carbide grinding papersfrom 240 to 1200 grit. Samples were subsequently polished on a Leco® GP-25polishing turntable using water-based diamond suspensions of 6 μm and 1 μmfollowed by colloidal silica of 0.2 μm spread on Buehler® MasterTex polishingcloths.
XRF
XRF data provided complementary semi-quantitative results on thephosphorous content using the Thermo Scientific Niton® XL3t Series GOLDD™technology handheld XRF analyzer with a silver anode and silicon drift detector.As all the consolidation trials were performed on the test blocks positionedvertically, it was anticipated that measured P content would be higher for theslices taken from the bottom of the sample due to the gravity, while slightly lowerfor the slices taken from the top of the wall painting test blocks. To have the mostrepresentative and consistent information sections from the center of the sampleswere chosen for the preliminary XRF analysis. More detailed XRF informationon the gravity effect will be conducted in the scope of future analysis.
424
Dow
nloa
ded
by U
NIV
OF
CA
LIF
OR
NIA
LO
S A
NG
EL
ES
on O
ctob
er 2
9, 2
013
| http
://pu
bs.a
cs.o
rg
Pub
licat
ion
Dat
e (W
eb):
Oct
ober
15,
201
3 | d
oi: 1
0.10
21/b
k-20
13-1
147.
ch02
2
In Archaeological Chemistry VIII; Armitage, R., et al.; ACS Symposium Series; American Chemical Society: Washington, DC, 2013.
Water Sorption Test
The water sorption test was conducted following a modified version of theASTM standard C1585. For this test both untreated and treated test blocks werekept in the atmospheric air at 20 ± 3°C at around 60% RH (relative humidity)for the period of 7 days prior to testing. All sides of each test block (except thesurface receiving the treatment) were sealed tightly with duct tape. The surfacesof untreated and treated samples were placed in contact with the water (immersedbetween 1-3 mm) and the mass of each sample was monitored to the nearest 0.01g at the intervals specified in the standard.
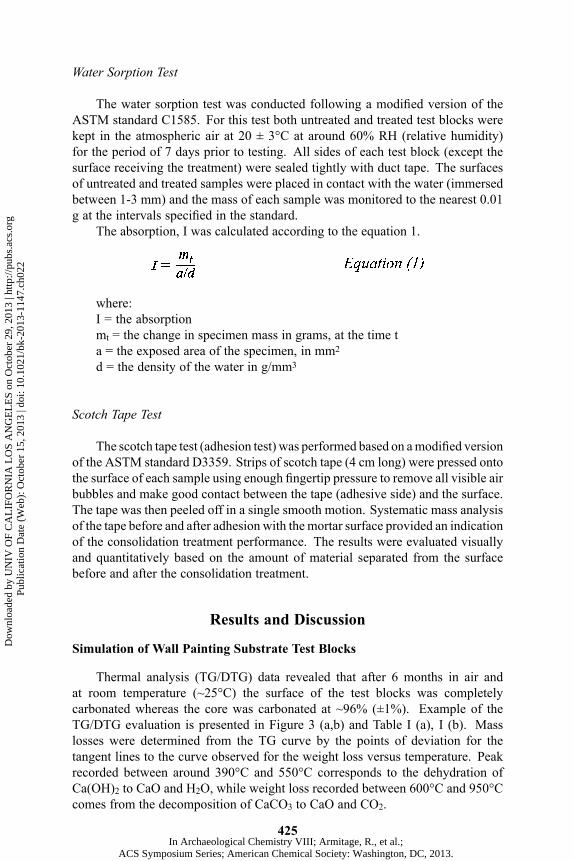
The absorption, I was calculated according to the equation 1.
where:I = the absorptionmt = the change in specimen mass in grams, at the time ta = the exposed area of the specimen, in mm2
d = the density of the water in g/mm3
Scotch Tape Test
The scotch tape test (adhesion test) was performed based on amodified versionof the ASTM standard D3359. Strips of scotch tape (4 cm long) were pressed ontothe surface of each sample using enough fingertip pressure to remove all visible airbubbles and make good contact between the tape (adhesive side) and the surface.The tape was then peeled off in a single smooth motion. Systematic mass analysisof the tape before and after adhesion with themortar surface provided an indicationof the consolidation treatment performance. The results were evaluated visuallyand quantitatively based on the amount of material separated from the surfacebefore and after the consolidation treatment.
Results and Discussion
Simulation of Wall Painting Substrate Test Blocks
Thermal analysis (TG/DTG) data revealed that after 6 months in air andat room temperature (~25°C) the surface of the test blocks was completelycarbonated whereas the core was carbonated at ~96% (±1%). Example of theTG/DTG evaluation is presented in Figure 3 (a,b) and Table I (a), I (b). Masslosses were determined from the TG curve by the points of deviation for thetangent lines to the curve observed for the weight loss versus temperature. Peakrecorded between around 390°C and 550°C corresponds to the dehydration ofCa(OH)2 to CaO and H2O, while weight loss recorded between 600°C and 950°Ccomes from the decomposition of CaCO3 to CaO and CO2.
425
Dow
nloa
ded
by U
NIV
OF
CA
LIF
OR
NIA
LO
S A
NG
EL
ES
on O
ctob
er 2
9, 2
013
| http
://pu
bs.a
cs.o
rg
Pub
licat
ion
Dat
e (W
eb):
Oct
ober
15,
201
3 | d
oi: 1
0.10
21/b
k-20
13-1
147.
ch02
2
In Archaeological Chemistry VIII; Armitage, R., et al.; ACS Symposium Series; American Chemical Society: Washington, DC, 2013.
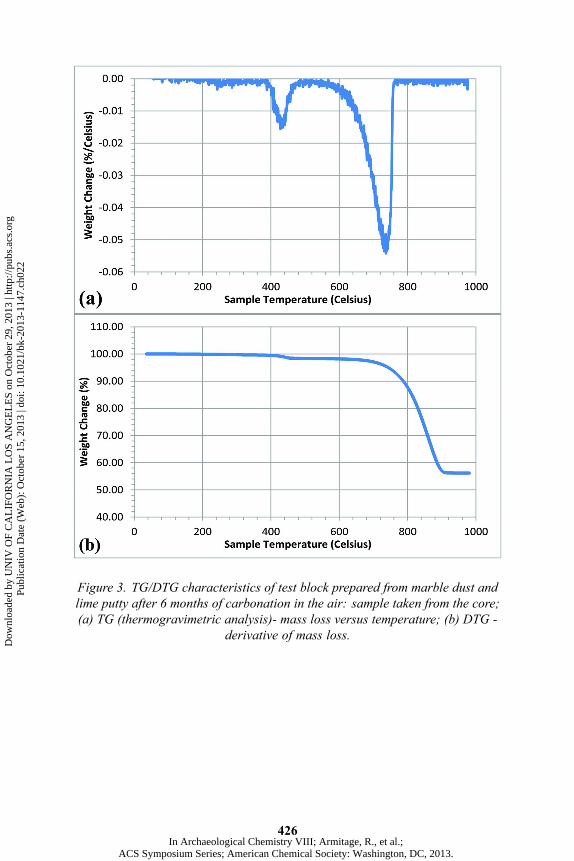
Figure 3. TG/DTG characteristics of test block prepared from marble dust andlime putty after 6 months of carbonation in the air: sample taken from the core;(a) TG (thermogravimetric analysis)- mass loss versus temperature; (b) DTG -
derivative of mass loss.
426
Dow
nloa
ded
by U
NIV
OF
CA
LIF
OR
NIA
LO
S A
NG
EL
ES
on O
ctob
er 2
9, 2
013
| http
://pu
bs.a
cs.o
rg
Pub
licat
ion
Dat
e (W
eb):
Oct
ober
15,
201
3 | d
oi: 1
0.10
21/b
k-20
13-1
147.
ch02
2
In Archaeological Chemistry VIII; Armitage, R., et al.; ACS Symposium Series; American Chemical Society: Washington, DC, 2013.
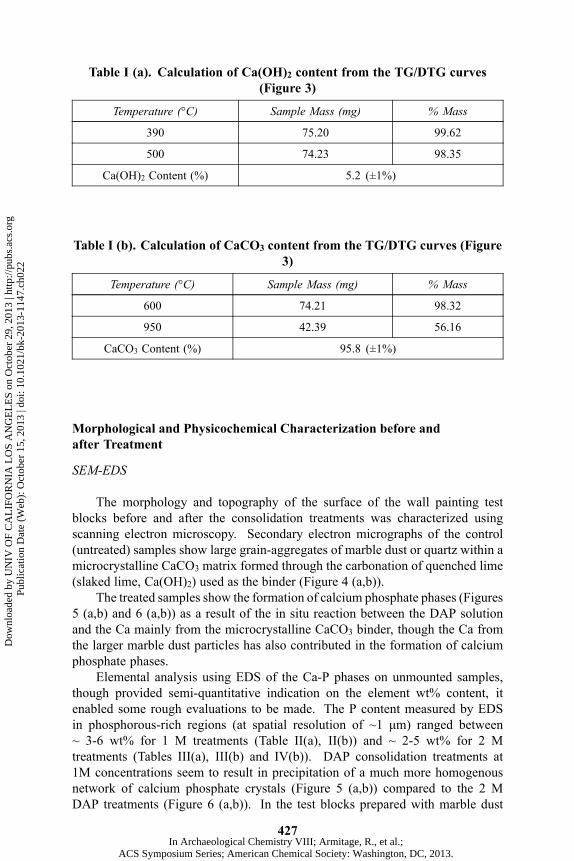
Table I (a). Calculation of Ca(OH)2 content from the TG/DTG curves(Figure 3)
Temperature (°C) Sample Mass (mg) % Mass
390 75.20 99.62
500 74.23 98.35
Ca(OH)2 Content (%) 5.2 (±1%)
Table I (b). Calculation of CaCO3 content from the TG/DTG curves (Figure3)
Temperature (°C) Sample Mass (mg) % Mass
600 74.21 98.32
950 42.39 56.16
CaCO3 Content (%) 95.8 (±1%)
Morphological and Physicochemical Characterization before andafter Treatment
SEM-EDS
The morphology and topography of the surface of the wall painting testblocks before and after the consolidation treatments was characterized usingscanning electron microscopy. Secondary electron micrographs of the control(untreated) samples show large grain-aggregates of marble dust or quartz within amicrocrystalline CaCO3 matrix formed through the carbonation of quenched lime(slaked lime, Ca(OH)2) used as the binder (Figure 4 (a,b)).
The treated samples show the formation of calcium phosphate phases (Figures5 (a,b) and 6 (a,b)) as a result of the in situ reaction between the DAP solutionand the Ca mainly from the microcrystalline CaCO3 binder, though the Ca fromthe larger marble dust particles has also contributed in the formation of calciumphosphate phases.
Elemental analysis using EDS of the Ca-P phases on unmounted samples,though provided semi-quantitative indication on the element wt% content, itenabled some rough evaluations to be made. The P content measured by EDSin phosphorous-rich regions (at spatial resolution of ~1 μm) ranged between~ 3-6 wt% for 1 M treatments (Table II(a), II(b)) and ~ 2-5 wt% for 2 Mtreatments (Tables III(a), III(b) and IV(b)). DAP consolidation treatments at1M concentrations seem to result in precipitation of a much more homogenousnetwork of calcium phosphate crystals (Figure 5 (a,b)) compared to the 2 MDAP treatments (Figure 6 (a,b)). In the test blocks prepared with marble dust
427
Dow
nloa
ded
by U
NIV
OF
CA
LIF
OR
NIA
LO
S A
NG
EL
ES
on O
ctob
er 2
9, 2
013
| http
://pu
bs.a
cs.o
rg
Pub
licat
ion
Dat
e (W
eb):
Oct
ober
15,
201
3 | d
oi: 1
0.10
21/b
k-20
13-1
147.
ch02
2
In Archaeological Chemistry VIII; Armitage, R., et al.; ACS Symposium Series; American Chemical Society: Washington, DC, 2013.

in particular (but also those prepared with quartz aggregate), large crystals ofa different Ca-P phase were also present (Figure 7 (a,b)). The P content ofthis phase ranged between ~9 and 17.5 wt% (Table IV(a), IV(b)). Traces ofmagnesium (Mg) were also identified.
Though it has not been directly confirmed, it is thought that the newly formedcalcium phosphate phase using 1 M DAP is in fact hydroxyapatite. Taking intoconsideration the experimental conditions (25°C and pH~8 which correspondsto 1M DAP), HAP seems to be thermodynamically the most favored phase toform due to its low solubility and crystallographic compatibility with calcite (thesolubility product of HAP at 25 °C being Ksp = 1.6·10−117) (34, 39). The theoreticalP content of the ideal hydroxyapatite is approximately 18.5 wt% and the Ca/Pmolar ratio is close to 1.67. These values significantly differ from what we haveobserved. However, as alreadymentioned above, an ideal hydroxyapatite in naturerarely precipitates from the aqueous solutions and therefore it is more commonto form hydroxyapatite which is non-stoichiometric and substituted by variousions, such as carbonate ions. Also in this research, the reaction between the DAPand the CaCO3-rich matrices does not involve complete transformations and theoverwhelming signal of the unreacted CaCO3 affects the measured Ca to P ratio.
XRD analysis of samples taken from the treated with DAP surfaces (for 3and 6 hours of reactant treatment time) did not yield a positive identification ofCa-P phases owing to the very strong signal of the dominating CaCO3 and/or SiO2particles used as aggregates in the test blocks.
The phosphorous content and profile distribution was also assessedthrough SEM-EDS on polished cross-sectional areas at the core of the sample.Micrographs and EDS elemental spectra and maps were taken at specific areasalong the sample width: a) close to treated surface; b) in the center and c) atthe bottom margin (furthest from the surface). Phosphorous (P) maps indicatednewly formed calcium phosphate phases located in areas originally occupied bythe microcrystalline CaCO3 matrix (Table V(a), V(b), Figures 8 (a,b), 9 (a,b,c)and 10 (a, b,c)). Phosphorus content (measured at 1 μm2 of surface area) rangedbetween 1 and 7 wt% for samples treated with 1 M DAP (Tables VI and VII) andbetween 1 and 10 wt% for samples treated with 2 M DAP. Traces of chlorine (Cl)were attributed to the epichlorohydrin in the hardener of the epoxy resin used forthe preparation of the cross-sections.
The P concentration was found to be higher closer to the surface of thesample which was in contact area with the DAP saturated compresses and inareas surrounded by large pores as more of the DAP solution could enter andfill up nearby pores and react with surrounding CaCO3. As SiO2 particles arenot expected to react with the DAP solution, the formation of calcium phosphatephases for the quartz-based test blocks is considered as the result of the DAPinteraction with the microcrystalline CaCO3 binder surrounding the quartzaggregate (Figure 10 (a-d)). Since the marble dust is composed of calcite (CaCO3)it is believed that in the case of the marble dust test blocks, the calcite aggregatesalso partially react with the DAP solution (Figure 9 (a-c)). The extent of thisreaction may be kinetically restrained due to the short contact times (between 3-6hours) of the proposed consolidation treatments.
428
Dow
nloa
ded
by U
NIV
OF
CA
LIF
OR
NIA
LO
S A
NG
EL
ES
on O
ctob
er 2
9, 2
013
| http
://pu
bs.a
cs.o
rg
Pub
licat
ion
Dat
e (W
eb):
Oct
ober
15,
201
3 | d
oi: 1
0.10
21/b
k-20
13-1
147.
ch02
2
In Archaeological Chemistry VIII; Armitage, R., et al.; ACS Symposium Series; American Chemical Society: Washington, DC, 2013.
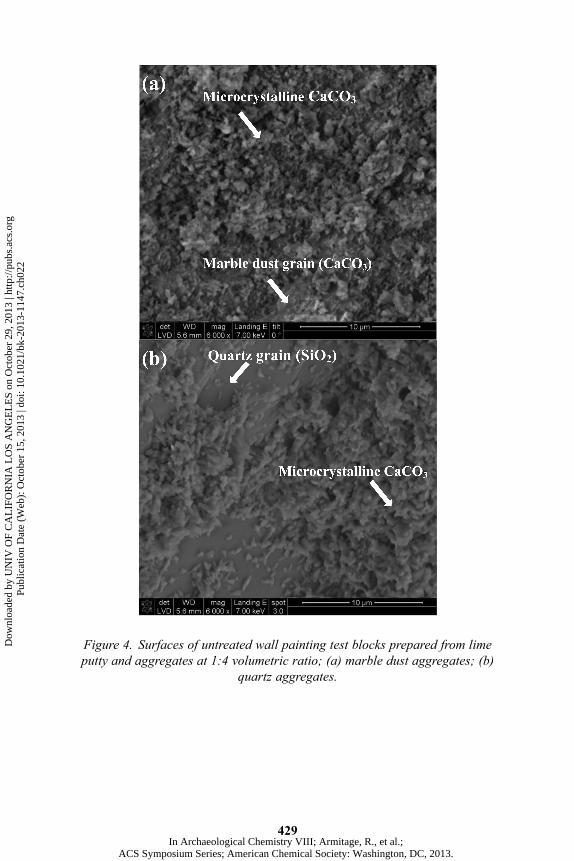
Figure 4. Surfaces of untreated wall painting test blocks prepared from limeputty and aggregates at 1:4 volumetric ratio; (a) marble dust aggregates; (b)
quartz aggregates.
429
Dow
nloa
ded
by U
NIV
OF
CA
LIF
OR
NIA
LO
S A
NG
EL
ES
on O
ctob
er 2
9, 2
013
| http
://pu
bs.a
cs.o
rg
Pub
licat
ion
Dat
e (W
eb):
Oct
ober
15,
201
3 | d
oi: 1
0.10
21/b
k-20
13-1
147.
ch02
2
In Archaeological Chemistry VIII; Armitage, R., et al.; ACS Symposium Series; American Chemical Society: Washington, DC, 2013.
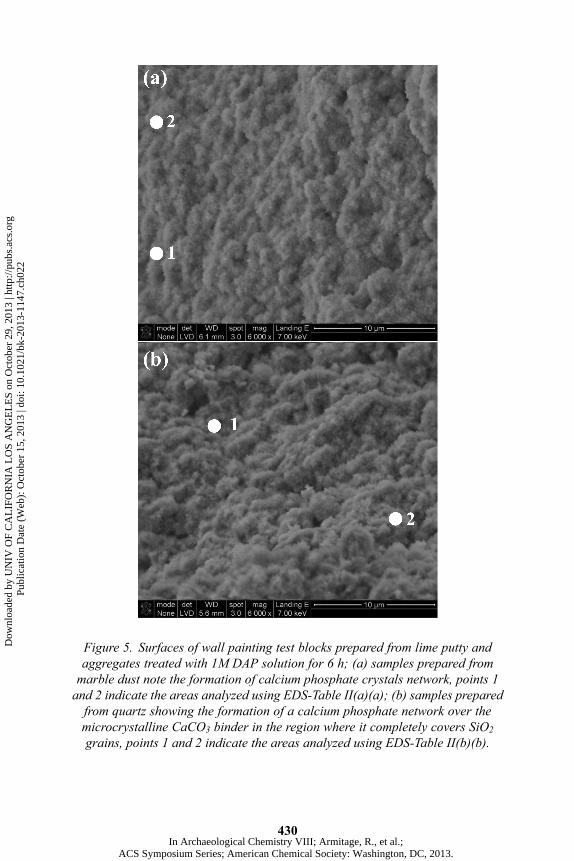
Figure 5. Surfaces of wall painting test blocks prepared from lime putty andaggregates treated with 1M DAP solution for 6 h; (a) samples prepared frommarble dust note the formation of calcium phosphate crystals network, points 1and 2 indicate the areas analyzed using EDS-Table II(a)(a); (b) samples preparedfrom quartz showing the formation of a calcium phosphate network over themicrocrystalline CaCO3 binder in the region where it completely covers SiO2grains, points 1 and 2 indicate the areas analyzed using EDS-Table II(b)(b).
430
Dow
nloa
ded
by U
NIV
OF
CA
LIF
OR
NIA
LO
S A
NG
EL
ES
on O
ctob
er 2
9, 2
013
| http
://pu
bs.a
cs.o
rg
Pub
licat
ion
Dat
e (W
eb):
Oct
ober
15,
201
3 | d
oi: 1
0.10
21/b
k-20
13-1
147.
ch02
2
In Archaeological Chemistry VIII; Armitage, R., et al.; ACS Symposium Series; American Chemical Society: Washington, DC, 2013.

Figure 6. Surfaces of wall painting test blocks prepared from lime putty andaggregates treated with 2M DAP solution for 3 h; (a) samples prepared frommarble dust, points 1, 2 and 3 indicate the areas analyzed with EDS-Table
III(a)(a); (b) samples prepared from quartz aggregates, points 1, 2 and 3 indicateareas analyzed using EDS-Table III(b)(b).
431
Dow
nloa
ded
by U
NIV
OF
CA
LIF
OR
NIA
LO
S A
NG
EL
ES
on O
ctob
er 2
9, 2
013
| http
://pu
bs.a
cs.o
rg
Pub
licat
ion
Dat
e (W
eb):
Oct
ober
15,
201
3 | d
oi: 1
0.10
21/b
k-20
13-1
147.
ch02
2
In Archaeological Chemistry VIII; Armitage, R., et al.; ACS Symposium Series; American Chemical Society: Washington, DC, 2013.

Figure 7. Surface of wall painting test block prepared from lime putty andaggregates treated with 2M DAP solution for 3 h showing the formation ofdifferent calcium phosphate phases; (a) samples prepared from marble dustaggregates, points 1,2 and 4 show large Ca-P crystals of ~150-250 μm2, points1-4 indicate the areas analyzed using EDS-Table IV(a)(a); (b) samples preparedfrom quartz aggregates, points 1, 2, and 3 show areas analyzed using EDS-Table
IV(b)(b).
432
Dow
nloa
ded
by U
NIV
OF
CA
LIF
OR
NIA
LO
S A
NG
EL
ES
on O
ctob
er 2
9, 2
013
| http
://pu
bs.a
cs.o
rg
Pub
licat
ion
Dat
e (W
eb):
Oct
ober
15,
201
3 | d
oi: 1
0.10
21/b
k-20
13-1
147.
ch02
2
In Archaeological Chemistry VIII; Armitage, R., et al.; ACS Symposium Series; American Chemical Society: Washington, DC, 2013.

Table II(a). Weight % of elements measured on the surface of the wallpainting test block (prepared using marble dust aggregates and treated with
1M DAP solution for 6 h) in areas 1 and 2 as indicated in Figure 5(a)
Measuredpoint
Ccontent
Ocontent
Pcontent
Cacontent
1M marble-1 7.21 37.40 3.75 51.64
1M marble-2 6.94 38.38 5.57 49.10
Table II(b). Weight % of elements measured on the surface of the of the wallpainting test block (prepared using quartz aggregates and treated with 1M
DAP solution for 6 h) in areas 1 and 2 as indicated in Figure 5(b)
Measuredpoint
Ccontent
Ocontent
Mgcontent
Sicontent
Pcontent
Cacontent
1M quartz-1 14.72 48.66 0.00 1.00 3.37 32.25
1M quartz-2 14.69 56.06 0.39 1.12 3.15 24.58
Table III(a). Weight % of elements measured on the surface of the wallpainting test block in (prepared using marble dust aggregates and treatedwith 2M DAP solution for 3 h) areas 1, 2 and 3 as indicated in Figure 6(a)
Measuredpoint
Ccontent
Ocontent
Pcontent
Cacontent
2M marble-1 11.20 29.29 2.05 57.46
2M marble-2 9.05 31.72 2.54 56.69
2M marble-3 16.62 50.91 2.71 29.76
433
Dow
nloa
ded
by U
NIV
OF
CA
LIF
OR
NIA
LO
S A
NG
EL
ES
on O
ctob
er 2
9, 2
013
| http
://pu
bs.a
cs.o
rg
Pub
licat
ion
Dat
e (W
eb):
Oct
ober
15,
201
3 | d
oi: 1
0.10
21/b
k-20
13-1
147.
ch02
2
In Archaeological Chemistry VIII; Armitage, R., et al.; ACS Symposium Series; American Chemical Society: Washington, DC, 2013.
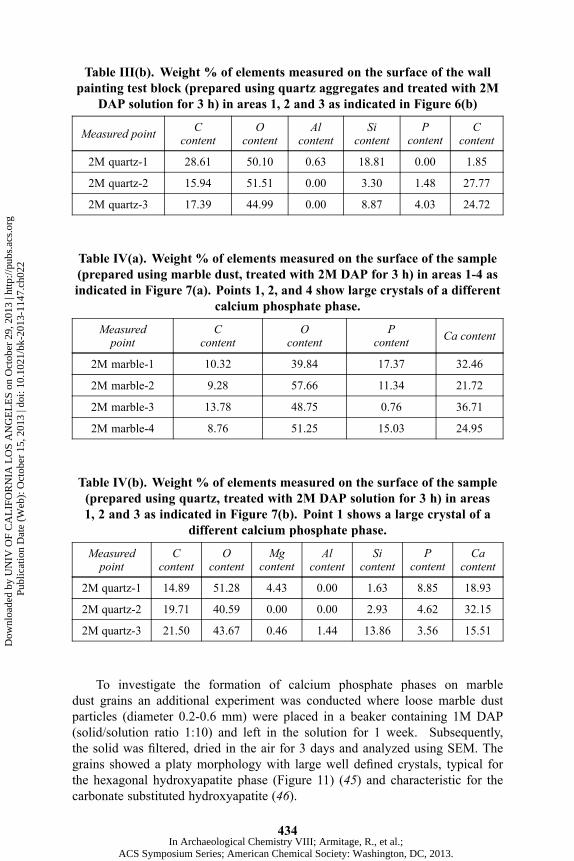
Table III(b). Weight % of elements measured on the surface of the wallpainting test block (prepared using quartz aggregates and treated with 2M
DAP solution for 3 h) in areas 1, 2 and 3 as indicated in Figure 6(b)
Measured point Ccontent
Ocontent
Alcontent
Sicontent
Pcontent
Ccontent
2M quartz-1 28.61 50.10 0.63 18.81 0.00 1.85
2M quartz-2 15.94 51.51 0.00 3.30 1.48 27.77
2M quartz-3 17.39 44.99 0.00 8.87 4.03 24.72
Table IV(a). Weight % of elements measured on the surface of the sample(prepared using marble dust, treated with 2M DAP for 3 h) in areas 1-4 asindicated in Figure 7(a). Points 1, 2, and 4 show large crystals of a different
calcium phosphate phase.
Measuredpoint
Ccontent
Ocontent
Pcontent Ca content
2M marble-1 10.32 39.84 17.37 32.46
2M marble-2 9.28 57.66 11.34 21.72
2M marble-3 13.78 48.75 0.76 36.71
2M marble-4 8.76 51.25 15.03 24.95
Table IV(b). Weight % of elements measured on the surface of the sample(prepared using quartz, treated with 2M DAP solution for 3 h) in areas1, 2 and 3 as indicated in Figure 7(b). Point 1 shows a large crystal of a
different calcium phosphate phase.
Measuredpoint
Ccontent
Ocontent
Mgcontent
Alcontent
Sicontent
Pcontent
Cacontent
2M quartz-1 14.89 51.28 4.43 0.00 1.63 8.85 18.93
2M quartz-2 19.71 40.59 0.00 0.00 2.93 4.62 32.15
2M quartz-3 21.50 43.67 0.46 1.44 13.86 3.56 15.51
To investigate the formation of calcium phosphate phases on marbledust grains an additional experiment was conducted where loose marble dustparticles (diameter 0.2-0.6 mm) were placed in a beaker containing 1M DAP(solid/solution ratio 1:10) and left in the solution for 1 week. Subsequently,the solid was filtered, dried in the air for 3 days and analyzed using SEM. Thegrains showed a platy morphology with large well defined crystals, typical forthe hexagonal hydroxyapatite phase (Figure 11) (45) and characteristic for thecarbonate substituted hydroxyapatite (46).
434
Dow
nloa
ded
by U
NIV
OF
CA
LIF
OR
NIA
LO
S A
NG
EL
ES
on O
ctob
er 2
9, 2
013
| http
://pu
bs.a
cs.o
rg
Pub
licat
ion
Dat
e (W
eb):
Oct
ober
15,
201
3 | d
oi: 1
0.10
21/b
k-20
13-1
147.
ch02
2
In Archaeological Chemistry VIII; Armitage, R., et al.; ACS Symposium Series; American Chemical Society: Washington, DC, 2013.

Figure 8. SEM-BSE micrograph of a polished section of the wall painting testblock prepared from lime putty and aggregates; (a) marble dust aggregates:untreated, points 1-5 indicate the areas analyzed using EDS-Table V(a)(a); (b)quartz aggregates: untreated, points 1,2 and 3 indicate areas analyzed using
EDS-Table V(b)(b).
435
Dow
nloa
ded
by U
NIV
OF
CA
LIF
OR
NIA
LO
S A
NG
EL
ES
on O
ctob
er 2
9, 2
013
| http
://pu
bs.a
cs.o
rg
Pub
licat
ion
Dat
e (W
eb):
Oct
ober
15,
201
3 | d
oi: 1
0.10
21/b
k-20
13-1
147.
ch02
2
In Archaeological Chemistry VIII; Armitage, R., et al.; ACS Symposium Series; American Chemical Society: Washington, DC, 2013.

Figure 9. SEM-EDS images of a polished section of a wall painting test blockprepared from lime putty and marble dust aggregates and treated for 6 h with 1MDAP solution; (a) points 1-5 indicate areas analyzed using EDS-Table VI; (b)elemental map indicating the spatial distribution of Ca in a cross-sectional viewof a test. This image shows that the Ca is located in areas corresponding to themarble dust particles as well as the microcrystalline CaCO3 binding matrix; (c)elemental map indicating the spatial distribution of P in a cross-sectional view ofa test block. This image shows that the P is located in areas corresponding tothe microcrystalline CaCO3 binding matrix and at the boundaries of the large
Ca-rich particles.
436
Dow
nloa
ded
by U
NIV
OF
CA
LIF
OR
NIA
LO
S A
NG
EL
ES
on O
ctob
er 2
9, 2
013
| http
://pu
bs.a
cs.o
rg
Pub
licat
ion
Dat
e (W
eb):
Oct
ober
15,
201
3 | d
oi: 1
0.10
21/b
k-20
13-1
147.
ch02
2
In Archaeological Chemistry VIII; Armitage, R., et al.; ACS Symposium Series; American Chemical Society: Washington, DC, 2013.

437
Dow
nloa
ded
by U
NIV
OF
CA
LIF
OR
NIA
LO
S A
NG
EL
ES
on O
ctob
er 2
9, 2
013
| http
://pu
bs.a
cs.o
rg
Pub
licat
ion
Dat
e (W
eb):
Oct
ober
15,
201
3 | d
oi: 1
0.10
21/b
k-20
13-1
147.
ch02
2
In Archaeological Chemistry VIII; Armitage, R., et al.; ACS Symposium Series; American Chemical Society: Washington, DC, 2013.
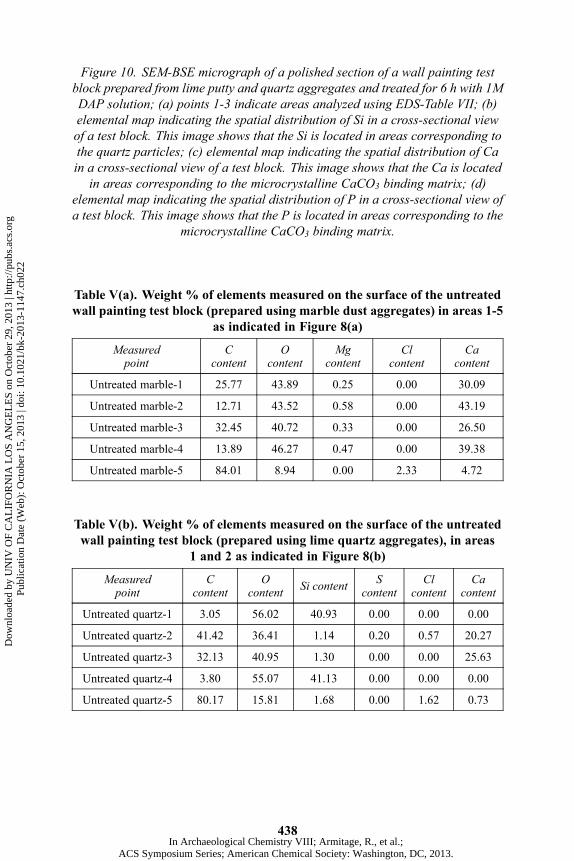
Figure 10. SEM-BSE micrograph of a polished section of a wall painting testblock prepared from lime putty and quartz aggregates and treated for 6 h with 1MDAP solution; (a) points 1-3 indicate areas analyzed using EDS-Table VII; (b)elemental map indicating the spatial distribution of Si in a cross-sectional viewof a test block. This image shows that the Si is located in areas corresponding tothe quartz particles; (c) elemental map indicating the spatial distribution of Cain a cross-sectional view of a test block. This image shows that the Ca is locatedin areas corresponding to the microcrystalline CaCO3 binding matrix; (d)
elemental map indicating the spatial distribution of P in a cross-sectional view ofa test block. This image shows that the P is located in areas corresponding to the
microcrystalline CaCO3 binding matrix.
Table V(a). Weight % of elements measured on the surface of the untreatedwall painting test block (prepared using marble dust aggregates) in areas 1-5
as indicated in Figure 8(a)
Measuredpoint
Ccontent
Ocontent
Mgcontent
Clcontent
Cacontent
Untreated marble-1 25.77 43.89 0.25 0.00 30.09
Untreated marble-2 12.71 43.52 0.58 0.00 43.19
Untreated marble-3 32.45 40.72 0.33 0.00 26.50
Untreated marble-4 13.89 46.27 0.47 0.00 39.38
Untreated marble-5 84.01 8.94 0.00 2.33 4.72
Table V(b). Weight % of elements measured on the surface of the untreatedwall painting test block (prepared using lime quartz aggregates), in areas
1 and 2 as indicated in Figure 8(b)
Measuredpoint
Ccontent
Ocontent Si content S
contentCl
contentCa
content
Untreated quartz-1 3.05 56.02 40.93 0.00 0.00 0.00
Untreated quartz-2 41.42 36.41 1.14 0.20 0.57 20.27
Untreated quartz-3 32.13 40.95 1.30 0.00 0.00 25.63
Untreated quartz-4 3.80 55.07 41.13 0.00 0.00 0.00
Untreated quartz-5 80.17 15.81 1.68 0.00 1.62 0.73
438
Dow
nloa
ded
by U
NIV
OF
CA
LIF
OR
NIA
LO
S A
NG
EL
ES
on O
ctob
er 2
9, 2
013
| http
://pu
bs.a
cs.o
rg
Pub
licat
ion
Dat
e (W
eb):
Oct
ober
15,
201
3 | d
oi: 1
0.10
21/b
k-20
13-1
147.
ch02
2
In Archaeological Chemistry VIII; Armitage, R., et al.; ACS Symposium Series; American Chemical Society: Washington, DC, 2013.
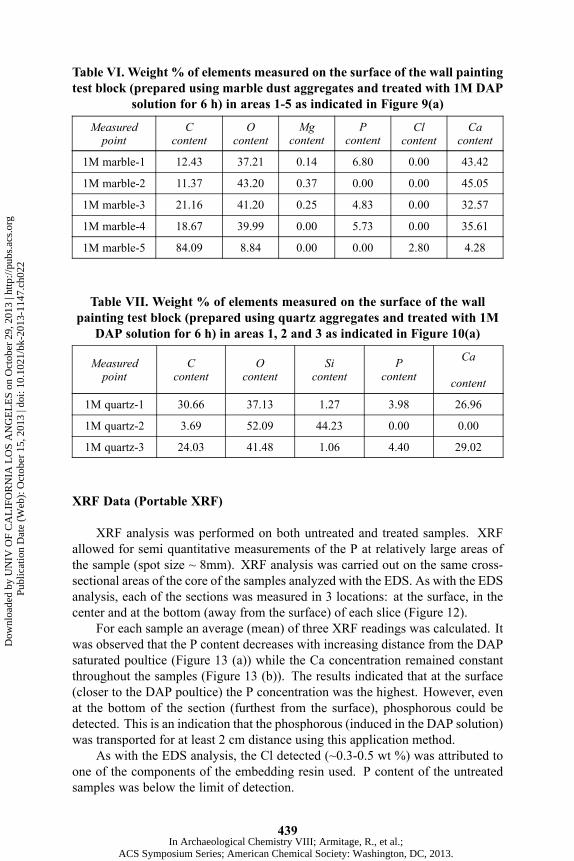
Table VI. Weight % of elements measured on the surface of the wall paintingtest block (prepared using marble dust aggregates and treated with 1M DAP
solution for 6 h) in areas 1-5 as indicated in Figure 9(a)
Measuredpoint
Ccontent
Ocontent
Mgcontent
Pcontent
Clcontent
Cacontent
1M marble-1 12.43 37.21 0.14 6.80 0.00 43.42
1M marble-2 11.37 43.20 0.37 0.00 0.00 45.05
1M marble-3 21.16 41.20 0.25 4.83 0.00 32.57
1M marble-4 18.67 39.99 0.00 5.73 0.00 35.61
1M marble-5 84.09 8.84 0.00 0.00 2.80 4.28
Table VII. Weight % of elements measured on the surface of the wallpainting test block (prepared using quartz aggregates and treated with 1M
DAP solution for 6 h) in areas 1, 2 and 3 as indicated in Figure 10(a)
Measuredpoint
Ccontent
Ocontent
Sicontent
Pcontent
Ca
content
1M quartz-1 30.66 37.13 1.27 3.98 26.96
1M quartz-2 3.69 52.09 44.23 0.00 0.00
1M quartz-3 24.03 41.48 1.06 4.40 29.02
XRF Data (Portable XRF)
XRF analysis was performed on both untreated and treated samples. XRFallowed for semi quantitative measurements of the P at relatively large areas ofthe sample (spot size ~ 8mm). XRF analysis was carried out on the same cross-sectional areas of the core of the samples analyzed with the EDS. As with the EDSanalysis, each of the sections was measured in 3 locations: at the surface, in thecenter and at the bottom (away from the surface) of each slice (Figure 12).
For each sample an average (mean) of three XRF readings was calculated. Itwas observed that the P content decreases with increasing distance from the DAPsaturated poultice (Figure 13 (a)) while the Ca concentration remained constantthroughout the samples (Figure 13 (b)). The results indicated that at the surface(closer to the DAP poultice) the P concentration was the highest. However, evenat the bottom of the section (furthest from the surface), phosphorous could bedetected. This is an indication that the phosphorous (induced in the DAP solution)was transported for at least 2 cm distance using this application method.
As with the EDS analysis, the Cl detected (~0.3-0.5 wt %) was attributed toone of the components of the embedding resin used. P content of the untreatedsamples was below the limit of detection.
439
Dow
nloa
ded
by U
NIV
OF
CA
LIF
OR
NIA
LO
S A
NG
EL
ES
on O
ctob
er 2
9, 2
013
| http
://pu
bs.a
cs.o
rg
Pub
licat
ion
Dat
e (W
eb):
Oct
ober
15,
201
3 | d
oi: 1
0.10
21/b
k-20
13-1
147.
ch02
2
In Archaeological Chemistry VIII; Armitage, R., et al.; ACS Symposium Series; American Chemical Society: Washington, DC, 2013.

Figure 11. Detail of newly formed Ca-P phases on marble dust particles afterimmersion in 1M DAP solution for 1 week; note platy morphology typical for
carbonate-substituted hydroxyapatite.
Figure 12. Polished cross-section of the sample analyzed using XRFspectroscopy. Elemental analysis (semi-quantitative) was performed on the
surface, in the center and the bottom of the sample; white dots show the locationsof the measurements.
440
Dow
nloa
ded
by U
NIV
OF
CA
LIF
OR
NIA
LO
S A
NG
EL
ES
on O
ctob
er 2
9, 2
013
| http
://pu
bs.a
cs.o
rg
Pub
licat
ion
Dat
e (W
eb):
Oct
ober
15,
201
3 | d
oi: 1
0.10
21/b
k-20
13-1
147.
ch02
2
In Archaeological Chemistry VIII; Armitage, R., et al.; ACS Symposium Series; American Chemical Society: Washington, DC, 2013.

Figure 13. Mean values (n=3) of phosphorus (a) and calcium; (b) contentsmeasured in wt%, at the surface, in the center and at the bottom of the wall
painting test blocks at different consolidation treatments.
Water Sorption Test
The water sorption tests between untreated and treated samples show a finalreduction in water sorptivity in the range of ~8-11 wt%. The results (Figure 14(a,b)), show an exponential trend with noticeably reduced initial sorptivity in theDAP treated samples, compared to the untreated ones (time measured up to ~5min). The delay in the water intake at the beginning of the test for the treatedsamples suggests potential change (reduction) in porosity, inhibiting water from
441
Dow
nloa
ded
by U
NIV
OF
CA
LIF
OR
NIA
LO
S A
NG
EL
ES
on O
ctob
er 2
9, 2
013
| http
://pu
bs.a
cs.o
rg
Pub
licat
ion
Dat
e (W
eb):
Oct
ober
15,
201
3 | d
oi: 1
0.10
21/b
k-20
13-1
147.
ch02
2
In Archaeological Chemistry VIII; Armitage, R., et al.; ACS Symposium Series; American Chemical Society: Washington, DC, 2013.

entering easily (34). In particular, the 2 MDAP-treated sample exhibited an initialsorption rate markedly lower (between ~ 20-32 wt%) than the untreated sample,possibly as a result of the higher pore system modification that occurred on thesurface. For the 2 M DAP treatments, excessive whitening and formation of athin ‘crust’ on the surface was also detected. This indicated the formation of amuch denser layer of calcium phosphates in comparison to the 1 M treatments.However the sorptivity trends > 300 minutes seemed to be similar regardless tothe DAP concentration.
Figure 14. Water sorptivity measured for wall painting test blocks preparedfrom lime putty and (a) marble dust aggregates; (b) quartz aggregates, which
undergone different consolidation treatments.
442
Dow
nloa
ded
by U
NIV
OF
CA
LIF
OR
NIA
LO
S A
NG
EL
ES
on O
ctob
er 2
9, 2
013
| http
://pu
bs.a
cs.o
rg
Pub
licat
ion
Dat
e (W
eb):
Oct
ober
15,
201
3 | d
oi: 1
0.10
21/b
k-20
13-1
147.
ch02
2
In Archaeological Chemistry VIII; Armitage, R., et al.; ACS Symposium Series; American Chemical Society: Washington, DC, 2013.
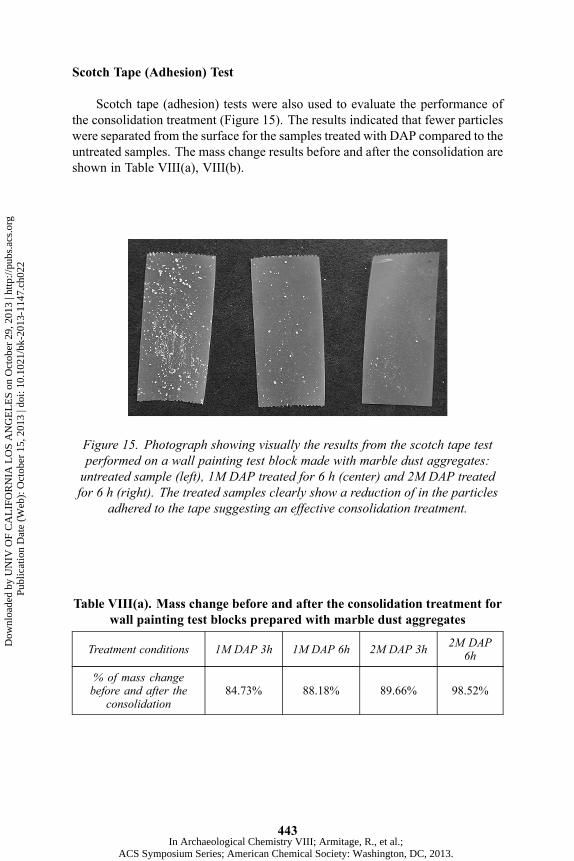
Scotch Tape (Adhesion) Test
Scotch tape (adhesion) tests were also used to evaluate the performance ofthe consolidation treatment (Figure 15). The results indicated that fewer particleswere separated from the surface for the samples treated with DAP compared to theuntreated samples. The mass change results before and after the consolidation areshown in Table VIII(a), VIII(b).
Figure 15. Photograph showing visually the results from the scotch tape testperformed on a wall painting test block made with marble dust aggregates:untreated sample (left), 1M DAP treated for 6 h (center) and 2M DAP treatedfor 6 h (right). The treated samples clearly show a reduction of in the particles
adhered to the tape suggesting an effective consolidation treatment.
Table VIII(a). Mass change before and after the consolidation treatment forwall painting test blocks prepared with marble dust aggregates
Treatment conditions 1M DAP 3h 1M DAP 6h 2M DAP 3h 2M DAP6h
% of mass changebefore and after the
consolidation84.73% 88.18% 89.66% 98.52%
443
Dow
nloa
ded
by U
NIV
OF
CA
LIF
OR
NIA
LO
S A
NG
EL
ES
on O
ctob
er 2
9, 2
013
| http
://pu
bs.a
cs.o
rg
Pub
licat
ion
Dat
e (W
eb):
Oct
ober
15,
201
3 | d
oi: 1
0.10
21/b
k-20
13-1
147.
ch02
2
In Archaeological Chemistry VIII; Armitage, R., et al.; ACS Symposium Series; American Chemical Society: Washington, DC, 2013.

Table VIII(b). Mass change before and after the consolidation treatment forwall painting test blocks prepared with quartz aggregates
Treatment conditions 1M DAP 3h 1M DAP 6h 2M DAP 3h 2M DAP6h
% of mass changebefore and after the
consolidation68.45% 69.90% 67.48% 83.01%
The smaller the percentage is, the better the consolidation effect of the surface.The best consolidation effect was observed for samples treated for 6 hours with 2M diammonium hydrogen phosphate solution (DAP) e.g. for marble dust-basedwall painting test blocks, 98% fewer particles detached in comparison with theuntreated samples. However, excessive whitening of the surface was observed.Whitening is not desired as it aesthetically affects wall painting’s appearance.
ConclusionsIn situ phosphate-based consolidation utilizing ammonium phosphate
precursors is a promising treatment to re-establish cohesion of powdery Ca-richmatrices such as wall paintings (like frescoes). Preliminary results indicated theformation of a porous hydroxyapatite network at the surface and subsurface ofthe wall painting test blocks; reduction of water absorption and insignificant colorchange. Less ‘whitening’ of the surface due to the formation of new phases wasobserved on samples treated with 1 M DAP solutions in comparison with 2 MDAP solutions. It was found that phosphate solution enters deeply into the wallpainting test blocks and penetration depth of the proposed consolidation methodis at least up to 2 cm.
Due to hydroxyapatite’s wide pH stability an improved resistance againstlow pH (acid rains) is expected. Consolidation treatment seems effective forwall paintings and calcareous stones but is believed to have also potential forarchaeological tooth, bone and fossil reconstruction. Investigations on boneconsolidation are in progress in the scope of another conservation project.
Future Work
Future work will involve testing of different application methods (controlledspraying) and pre-treatment with nanoparticle calcium hydroxide, peptides andchitosan. Interactions of mineral and organic pigments such as cinnabar, greenearth, malachite, orpiment, lead white, hematite, madder lake will be evaluated.Mechanical properties such as measurement of dynamic elastic modulus aswell as porosity will be assessed for untreated and treated wall painting testblocks. Different precursors including monoammonium dihydrogen phosphate(MAP) and their consolidation applicability are currently being evaluated.Thermodynamic equilibrium-based modeling to predict and optimize formation
444
Dow
nloa
ded
by U
NIV
OF
CA
LIF
OR
NIA
LO
S A
NG
EL
ES
on O
ctob
er 2
9, 2
013
| http
://pu
bs.a
cs.o
rg
Pub
licat
ion
Dat
e (W
eb):
Oct
ober
15,
201
3 | d
oi: 1
0.10
21/b
k-20
13-1
147.
ch02
2
In Archaeological Chemistry VIII; Armitage, R., et al.; ACS Symposium Series; American Chemical Society: Washington, DC, 2013.

of calcium phosphate phases is in progress. Weathering tests as well as resistancetowards acid rains and aggressive salts ingress will be performed in the last stageof the project.
Acknowledgments
Authors would like to acknowledge the National Science Foundation (Award# 1139227, Solid State and Materials Chemistry program, Division of MaterialsResearch) for the full financial support of this work.
References
1. Kickelbick, G. In Hybrid Materials. Synthesis, Characterization, andApplications; Wiley-VCH, Verlag GmbH & Co. KGaA: Weinheim,Germany, 2007; pp 1−46.
2. Borgia, G. C.; Camaiti, M.; Cerri, F.; Fantazzini, P.; Piacenti, F. Stud.Conserv. 2003, 48, 217–226.
3. Baglioni, P.; Giorgi, R. Soft Matter 2006, 2, 293–303.4. Miliani, C.; Velo-Simpson, M. L.; Scherrer, G. W J. Cult. Herit. 2007, 8,
1–6.5. Dardes, K., Rothe, A., Eds.; The Structural Conservation of Panel Paintings;
Proceedings of a symposium at The J. Paul Getty Museum, Los Angeles,April 24−28, 1993.
6. Lanterna, G.; Mairani, A.; Matteini, M.; Rizzi, M.; Scuto, S.; Vincenzi, F.;Zannini, P. InProceedings of the 9th International Congress onDeteriorationand Conservation of Stone; Fassina, V., Ed.; Elsevier: New York, 2000; pp387−394.
7. Hansen, E.; Doehne, E.; Fidler, J.; Larson, J.; Matteini, M.; Ridriguez-Navarro, C.; de Tagle, A.; Teutonico, J. M.; Weiss, N. Rev. Conserv. 2003,4, 13–25.
8. Laurenzi Tabasso, M. APT Bull. 1995, 26, 17–21.9. Warren, J. In Conservation of Earth Structures; Butterworth-Heinemann:
Oxford, U.K., 1999; p 121.10. Chiari, G. In 6th International Conference on the Conservation of Earthen
Architecture; Adobe 90 preprints; Las Cruces, NewMexico, October 14−19,1990; Grimstad; K., Ed.; The Getty Conservation Institute: Los Angeles,1990; Vol. 273, pp 267−273.
11. Agnew, N.; Preusser, F.; Druzik, J. R. In 5th International Meeting of Expertson the Conservation of Earthen Architecture; ICCROM: Rome, 1987; pp75−79.
12. Brus, J.; Kotlik, P. Stud. Conserv. 1996, 41, 109–119.13. Karatasios, I.; Theoulakis, P.; Kalagri, A.; Sapalidis, A.; Kilikoglou, V.
Constr. Build. Mater. 2009, 23, 2803–2812.14. Wheeler, G. Research in Conservation; The Getty Conservation Institute:
Los Angeles, 2005.15. Carretti, E.; Dei, L.; Baglioni, P. Langmuir 2003, 19, 7867–7872.
445
Dow
nloa
ded
by U
NIV
OF
CA
LIF
OR
NIA
LO
S A
NG
EL
ES
on O
ctob
er 2
9, 2
013
| http
://pu
bs.a
cs.o
rg
Pub
licat
ion
Dat
e (W
eb):
Oct
ober
15,
201
3 | d
oi: 1
0.10
21/b
k-20
13-1
147.
ch02
2
In Archaeological Chemistry VIII; Armitage, R., et al.; ACS Symposium Series; American Chemical Society: Washington, DC, 2013.
16. Wayne Smith, C. InArchaeological ConservationUsing Polymers: PracticalApplications for Organic Artifact Stabilization; Texas A&M UniversityPress: College Station, TX, 2003; pp 1−144.
17. Scherrer, G. W.; Wheeler, G. S. Key Eng. Mater. 2009, 391, 1–25.18. Giorgi, R.; Baglioni, M.; Berti, D.; Baglioni, P Acc. Chem. Res. 2010, 43,
695–704.19. Ambrosi, M.; Baglioni, P.; Dei, L.; Giorgi, R.; Neto, C. Langmuir 2001, 17,
4251–4255.20. Baglioni, P.; Giorgi, R. Soft Matter 2006, 2, 293–303.21. Baglioni, P.; Giorgi, R.; Dei, L. C. R. Chim. 2009, 12, 61–69.22. Elert, K.; Sebastian, E.; Valverde, I.; Rodriguez-Navarro, C. Appl. Clay Sci.
2008, 39, 122–132.23. Giorgi, R.; Dei, L.; Baglioni, P. Stud. Conserv. 2000, 45, 154–161.24. Matteini, M.; Lanterna, G.; Nepoti, M. R. In The Oxalate Films in
the Conservation of Works of Art; Proceedings in the II InternationalSymposium; Realini, M., Toniolo, L., Eds.; Milan, Italy, March 25−27,1996.
25. Matteini, M.; Moles, A.; Giovannoni, S. In The Conservation of Monumentsin the Mediterranean Basin. Stone and Monuments: Methodologies forthe Analysis of Weathering and Conservation; Proceedings of the 3rdInternational Symposium; Fassina, V., Ott, H., Zezza, F., Eds.; 1994; pp155−161.
26. Church, A. H. British Patent 220, 1862.27. Warren, J. In Conservation of Earth Structures; Butterworth-Heinemann:
Oxford, U.K., 1999.28. Chelazzi, D.; Poggi, G.; Jaidar, Y.; Toccafondi, N.; Giorgi, R.; Baglioni, P. J.
Colloid Interface Sci. 2013, 392, 42–49.29. Hansen, E.; Doehne, E.; Fidler, J.; Larson, J.; Martin, B.; Matteini, M.;
Rodriguez-Navarro, C.; Pardo, E. S.; Price, C.; Tagle, A.; Teutonico, J. M.;Weiss, N. Rev. Conserv. 2003, 1–13.
30. Matteini, M. In Conserving the Painted Past: Developing Approaches toWall PaintingConservation; Post-prints of a conference organized by EnglishHeritage; Gowing, R., Heritage, A., Eds.; James & James: London, 2003; pp110−115.
31. Matteini, M. In Works of Art & Conservation Science Today; Thessaloniki:Greece, November 26−28, 2010.
32. Yang, F.; Zhang, B.; Liu, Y.; Wei, G.; Zhang, H.; Chen, W.; Xu, Z. New J.Chem. 2011, 35, 887–892.
33. Liu, Q.; Zhang, B. J. Mater. Sci. Forum 2011, 675-677, 317–320.34. Sassoni, E.; Naidu, S.; Scherer, G. W. J. Cult. Herit. 2011, 12, 346–355.35. Kamiya, M.; Hatta, J.; Shimida, E.; Ikuma, Y.; Yoshimura, M.; Monma, H.
Mater. Sci. Eng. 2004, B 111, 226–231.36. Matteini, M.; Rescic, S.; Fratini, F.; Botticelli, G. Int. J. Archit. Herit. 2011,
5, 717–736.37. Steiger, M. Restor. Build. Monum. 2005, 11, 419–431.38. Scherer, G. W.; Flatt, R; Wheeler, G. MRS Bull. 2001, 26, 44–50.39. Dorozhkin, S. V. Mater. Struct. 2009, 2, 399–498.
446
Dow
nloa
ded
by U
NIV
OF
CA
LIF
OR
NIA
LO
S A
NG
EL
ES
on O
ctob
er 2
9, 2
013
| http
://pu
bs.a
cs.o
rg
Pub
licat
ion
Dat
e (W
eb):
Oct
ober
15,
201
3 | d
oi: 1
0.10
21/b
k-20
13-1
147.
ch02
2
In Archaeological Chemistry VIII; Armitage, R., et al.; ACS Symposium Series; American Chemical Society: Washington, DC, 2013.
40. Lee, Y.; Hahm, Y. M.; Matsuya, S.; Nakagawa, M.; Ishikawa, K. J. Mater.Sci. 2007, 42, 7843–7849.
41. Wang, L.; Nancollas, G. H. Chem. Rev. 2008, 108, 4628–4669.42. Zhao, J.; Liu, W.; Zhang, H. Chem. Cent. J. 2011, 5, DOI: 10.1186/1752-
153X-5-40.43. Giere, R.; Stille, P. Geol. Sci. 2004, 451, Special Publication 236.44. Pan, H.; Darvell, B. W. Arch. Oral. Biol. 2007, 52, 618–24.45. Kobayashi, T.; Ono, S.; Hirakura, S.; Oaki, Y.; Imai, H. Cryst. Eng. Comm.
2012, 14, 1143–1149.46. Xia, W.; Lin, K.; Gou, Z.; Engqvist, H. In Hydroxyapatite: Synthesis,
Properties and Applications; Gshalaev, V. S., Demirchan, A. C., Eds.; NovaScience Publishers, Inc.: New York, 2012; pp 243−264.
447
Dow
nloa
ded
by U
NIV
OF
CA
LIF
OR
NIA
LO
S A
NG
EL
ES
on O
ctob
er 2
9, 2
013
| http
://pu
bs.a
cs.o
rg
Pub
licat
ion
Dat
e (W
eb):
Oct
ober
15,
201
3 | d
oi: 1
0.10
21/b
k-20
13-1
147.
ch02
2
In Archaeological Chemistry VIII; Armitage, R., et al.; ACS Symposium Series; American Chemical Society: Washington, DC, 2013.