Climate Sensitivity of Moderate and Low-Resolution Versions of CCSM3 to Preindustrial Forcings
Upload
independentCategory
view
1download
0
Preliminary estimate of calibration of the moderate resolution imaging
spectroradiometer thermal infrared data using Lake Titicaca
Zhengming Wana,*, Yulin Zhanga, Zhao-liang Lia,1, Ruibo Wanga, Vincent V. Salomonsonb,Arnaud Yvesc, Roland Bossenoc, Jean Francois Hanocqd
aInstitution for Computational Earth System Science, University of California, Santa Barbara, CA 93106, USAbEarth Sciences Directorate, Goddard Space Flight Center, Greenbelt, MD 20771, USA
cFrench Institute of Research and Development, La Paz, BoliviadINRA Bioclimatology, Avignon Cedex, France
Received 26 February 2001; received in revised form 8 October 2001; accepted 10 October 2001
Abstract
The absolute radiometric accuracy of Moderate Resolution Imaging Spectroradiometer (MODIS) thermal infrared (TIR) data was
evaluated with in situ data collected in a vicarious calibration field campaign conducted in Lake Titicaca, Bolivia during May 26 and June 17,
2000. The comparison between MODIS TIR data produced by the version 2.5.4 Level-1B code and the band radiances calculated with
atmospheric radiative transfer code MODTRAN4.0 based on lake surface kinetic temperatures measured by five IR radiometers deployed in
the high-elevation Lake Titicaca and the atmospheric temperature and water vapor profiles measured by radiosondes launched on the lake
shore on June, 15 2000, a calm clear-sky day, shows good agreements in bands 31 and 32 (within an accuracy of 0.4%) in the daytime
overpass case. Sensitivity analysis indicates that the changes on the measured atmospheric temperature and water vapor profiles result in
negligible or small effects on the calculated radiances in the atmospheric window bands (bands 20–23, 29, and 31–32). Therefore,
comparisons for these bands were made for cases when lake surface temperature measurements were available but no radiosonde data were
available and in subareas of 10� 16 pixels where there was no in situ measurement but MODIS brightness temperatures in band 31 vary
within ± 0.15 K by using the validated band 31 to determine lake surface temperatures through the MODTRAN4.0 code. Comparisons and
error analysis show that the specified absolute radiometric accuracies are reached or nearly reached in MODIS bands 21, 29, and 31–33 and
that there is a calibration bias of 2–3% in bands 20, 22, and 23. The error analysis also shows that the radiosondes cannot provide accurate
atmospheric temperature and water vapor profiles to estimate the calibration accuracies in the atmospheric sounding bands (bands 24–25,
27–28, and 34–36) at the specified 1% level and that the calibration accuracy in the ozone band 30 cannot be estimated without in situ
measurements of ozone. D 2002 Elsevier Science Inc. All rights reserved.
1. Introduction
The Moderate Resolution Imaging Spectroradiometer
(MODIS) was developed as the keystone instrument (Salo-
monson, Barnes, Maymon, Montgomery, & Ostrow, 1989)
on the Earth Observing System (EOS) AM-1 (also named
Terra) and EOS PM (named Aqua) platforms (King, Herring,
& Diner, 1995) for global studies of atmosphere, land, and
ocean processes (Esaias et al., 1998; Justice et al., 1998;
King, Kaufman, Menzel, & Tanre, 1992). The MODIS
instrument scans ± 55� from nadir in 36 bands, with bands
1–19 and 26 in the visible and near infrared (IR) range and
the remaining bands in the thermal IR (TIR) from 3 to 15 mm.
Barnes, Pagano, and Salomonson (1998) described the
prelaunch characteristics of the MODIS Proto-Flight Model
(PFM) flown on Terra, including the relative spectral
response (RSR) functions and calibration. The specification
of noise equivalent temperature difference (NEDT) for
MODIS bands are given in Table 1. The MODIS TIR bands
are calibrated through the full-aperture onboard blackbody
(BB) and space views. The effective emissivity of the BB is
better than 0.992, and BB temperature measurements are
made via 12 evenly spaced precision thermometers. The scan
mirror views the BB and space during each scan line,
0034-4257/01/$ – see front matter D 2002 Elsevier Science Inc. All rights reserved.
PII: S0034 -4257 (01 )00327 -3
* Corresponding author. Tel.: +1-805-893-4541; fax: +1-805-893-
2578.
E-mail address: [email protected] (Z. Wan).1 On temporary leave from GRTR/LSIIT/ENSPS, Parc d’Innovation,
5 Bd. Sebastien Brant, 67400 Illkirch-Graffenstaden, France.
www.elsevier.com/locate/rse
Remote Sensing of Environment 80 (2002) 497–515

enabling a two-point radiometric calibration of the 16
thermal bands every 1.477 s (Barnes et al., 1998). The spec-
ification of absolute radiometric accuracy for MODIS TIR
bands is ± 1% for all bands, except 0.75% for band 20, 10%
for band 21, and 0.5% for bands 31 and 32 (Guenther et al.,
1998). The Earth scenes are sampled 1354 times over the
range of principle scan angles from � 55 to 55� in 1KM
bands, which are composed of 10 channels (individual
detector elements) in each band. The MODIS level-1B data
product is broken into granules approximately 5-min long
each and stored in hierarchical data format (HDF). The
MODIS level-1B 1KM Earth view science data set (SDS)
for the TIR bands, EV_1KM_Emissive, is stored as 15-bit
unsigned integers, with the high-order bit of the 16-bit word
set to 1. Associated with each SDS value is uncertainty
information about that value. The information is reported in
EV_1KM_Emissive_Uncert_Indexes as an 8-bit word, with
the four most significant bits used for an uncertainty index
and the other four bits used for a scene contrast index. More
details are available at the MODIS Calibration Support Team
(MCST) homepage mcstweb.gsfc.nasa.gov/Home.html),
where there are listed areas of known concerns with the
MODIS level-1B TIR data including incomplete knowledge
of sensor response across scan (RVS), optical cross-talk from
band 31 to 32–36, and electronic cross-talk amongst bands
5–7 and 20–26.
The MODIS was successfully launched from Vandenberg
Air Force Base, California on December 18, 1999. The
MODIS first light, early engineering image over the Gulf of
Mexico and Eastern North America was acquired on Febru-
ary 24, 2000. TheMODIS calibrated radiance, daily level-1B
data product (MOD02), and geolocation product (MOD03)
are available to the public at the EOS Data Gateway (http://
redhook.gsfc.nasa.gov/ � imswww/pub/imswelcome).
According to a recent study (Wan, in press) of the
channel-dependent noise and systematic error in MODIS
TIR channel data, using early MODIS data acquired over
lake and ocean sites in clear-sky days, in 14 cases of
subarea sites with a size of 10 lines by 16 pixels each line,
where the brightness temperature in band 31 changes
within ± 0.1 K, the NEDT specification is reached in all
channels of the 16 MODIS TIR bands except three noisy
channels (corresponding to the ninth detector in bands 21
and 24 and the fourth detector in band 22). Therefore, it is
possible and necessary to evaluate the radiometric accuracy
with real MODIS TIR data. It is important to evaluate the
absolute radiometric calibration accuracy of the MODIS
TIR data in its normal operations in orbit so that it is
possible to assess the effects of uncertainties in the cal-
ibration accuracy on the MODIS products that depend on
the MODIS TIR data, such as land surface temperature
(LST; Wan & Dozier, 1996; Wan & Li 1997), sea surface
temperature (SST), and atmospheric temperature and water
vapor profiles. Because the difference between brightness
temperatures in bands 31 and 32 is used in split-window
algorithms to correct the atmospheric effects in order to
retrieve SST and LST values, any error in the temperature
difference will be amplified (because it is multiplied by a
coefficient much larger than one in these algorithms) and
propagated into the SST and LST products. Therefore, the
SST and LST algorithms need a tight requirement for the
relative calibration accuracy between bands 31 and 32, i.e.,
accuracy of the difference between brightness temperatures
in these two bands.
Table 1
Specifications of the EOS MODIS bands and the TIR band NEDT values (in column 9) estimated from early MODIS data (Wan, 2002)
Band Bandwidth (nm) IFOV Primary usea Band Bandwidth (mm) IFOV (km)
NEDT
specified (K)
NEDT estimated
(Wan, 2002) Primary usea
1 620–670 250 m L 20 3.660–3.840 1 0.05 0.06 O, L
2 841– 876 250 m A, L 21 3.929–3.989 1 2.00 0.64 fire, volcano
3 459–479 500 m L 22 3.929–3.989 1 0.07 0.07 A, L
4 545–565 500 m L 23 4.020–4.080 1 0.07 0.05 A, L
5 1230–1250 500 m L 24 4.433–4.498 1 0.25 0.13 A
6 1628–1652 500 m A, L 25 4.482–4.549 1 0.25 0.08 A
7 2105–2155 500 m A, L 27 6.535–6.895 1 0.25 0.12 A
8 405–420 1 km O 28 7.175–7.475 1 0.25 0.09 A
9 438–448 1 km O 29 8.400–8.700 1 0.05 0.03 L
10 483–493 1 km O 30 9.580–9.880 1 0.25 0.08 ozone
11 526–536 1 km O 31 10.780–11.280 1 0.05 0.03 A, L
12 546–556 1 km O 32 11.770–12.270 1 0.05 0.05 A, L
13 662–672 1 km O 33 13.185–13.485 1 0.25 0.16 A, L
14 673–683 1 km O 34 13.485–13.785 1 0.25 0.27 A
15 743–753 1 km A 35 13.785–14.085 1 0.25 0.23 A
16 862–877 1 km A 36 14.085–14.385 1 0.35 0.41 A
17 890–920 1 km A
18 931– 941 1 km A
19 915–965 1 km A
26 1360–1390 1 km cirrus
a A: atmospheric studies, L: land studies, O: ocean studies.
Z. Wan et al. / Remote Sensing of Environment 80 (2002) 497–515498
In the following sections, we will discuss why Lake
Titicaca is used as a vicarious calibration site. Then, we will
present an approach to the quantitative estimation of the
calibration of MODIS TIR data with in-depth discussion on
some technical issues related to this approach. Lastly, results
of in situ measurement data and atmospheric radiative
transfer simulations and comparison to real MODIS data
will be presented along with error analysis leading to some
final conclusions.
2. The use of Lake Titicaca as a vicarious calibration site
According to the experience gained in our field cam-
paigns for the validation of the MODIS and the MODIS
Airborne Simulator (MAS) LST algorithms and products
(Snyder, Wan, Zhang & Feng, 1997; Wan & Dozier, 1996;
Wan & Li 1997; Wan et al., 1999), the major sources of
uncertainties in the validation of TIR products include the
uncertainties in atmospheric temperature and water vapor
profiles and the spatial variations in surface temperature and
emissivity within the TIR scene.
The radiosonde measurement usually takes more than
1 h to acquire a set of atmospheric temperature and water
vapor profiles. During this time, the radiosonde balloon
may shift 20–50 km in the horizontal direction in windy
conditions. Considering the high temporal and spatial
variations in the atmospheric status (especially water vapor)
and the errors in radiosonde data, the differences between
the measured temperature and water vapor profiles and the
actual profiles for the real satellite observation may be quite
large. Padilla, Leyva, and Mosino (1993) made psychro-
metric measurements for study of atmospheric humidity
behavior at two places in Mexico, one in the Chaoultepec
Heights in the western zone of Mexico City at 2300-m MSL
and another in Rancho Viejo, a mountainous wooded area at
2700-m MSL. The distance between these places is approx-
imately 68 km. They found that the mixing ratio mean
values for clear-sky days in the 1989 rainy season vary 30%
in the period of 09:00–12:00 h local time and 40% in
12:00–15:00 h. Bruegge et al. (1992) reported that water
vapor column abundances retrieved from the Airborne
Visible IR Imaging Spectrometer (AVIRIS) data during
the First ISLSCP Field Experiment (FIFE) over the Konza
Prairie, KS on August 31, 1990 indicated that the spatial
variability over scales associated with surface topography
and the underlying vegetation may be greater than 10%.
Therefore, the accuracy and representativeness of measured
atmospheric profiles are crucial for the success of vicarious
calibration activities.
It is easy to rationalize the use of clear-sky oceans or
lakes as the validation sites for the absolute calibration of
TIR radiance because the flat water surface (under low
wind conditions) provides the only Earth scene in which
emissivity and its polarization can be accurately calculated
(Born & Wolfe, 1980) from the refractive index of water
(Hale & Querry, 1973). For example, the performance of
the MAS has been validated in field campaigns conducted
in the Gulf of Mexico (King et al., 1996) and Mono Lake
(Wan et al., 1999). Although the emissivities of snow and
ice are comparable to water emissivity in the TIR range
of interest, they, however, change with particle size,
surface roughness, and the presence of meltwater so that
it is difficult to know the exact values of the spectral
emissivities of snow and ice in the field to the accuracy
required for the validation of MODIS absolute radiance in
the TIR region.
Smith et al. (1996) showed that the SST was measured to
an accuracy believed to be better than 0.1 �C with the
Atmospheric Emitted Radiance Interferometer (AERI) over
the Gulf of Mexico during a 5-day oceanographic cruise in
January 1995. They also showed an advantage of micro-
windows (the narrow windows between absorption lines),
where the atmospheric effects are small when observed with
high-spectral resolution instruments such as High-Resolu-
tion Interferometer Sounder (HIS) on the NASA ER-2. In
these microwindows, the uncertainty in the calculated top of
the atmosphere (TOA) radiances based on measured atmo-
spheric temperature and water vapor profile is weakly
dependent on the accuracy of the atmospheric temperature
and water vapor profile. However, for other narrow bands of
HIS and for moderate-resolution TIR channels of MODIS,
this uncertainty may be strongly dependent on the accuracy
of the atmospheric temperature and water vapor profile and
on the accuracy of the empirical water vapor continuum
absorption (Clough, Kneizys, Shettle, & Anderson, 1986)
used in atmospheric radiative transfer calculations. Another
consideration is the spatial variation in SST, which is often
larger than 0.1 �C.Lake Titicaca is a very good validation site for the TIR
absolute radiances because of the following reasons: (a) it
is a high-elevation (3841 m above sea level) lake located
in a large plateau; (b) it has a large size of open water
surface (8100 km2); (c) there are only very light boating
activities on the lake in the winter; (d) the spatial variation
in the lake surface temperature is often very small so that
the maximum difference in brightness temperatures of
MODIS band 31 in a subarea larger than 30� 30 km is
not larger than 0.5 K, for example, in the MODIS data on
May 24 and June 3, 15, 21, and 23, 2000; (e) over the lake
area and its surroundings, the atmosphere is dry in the
winter; and (f) there is a high chance of clear-sky days in
the winter and high visibilities (low aerosol densities) in
clear-sky days. Therefore, the effects of the uncertainties
in atmospheric conditions, aerosol distribution, and the
empirical water vapor continuum absorption on the sat-
ellite TIR data will be smaller over Lake Titicaca.
Fig. 1 is a map of Lake Titicaca. The west side is in Peru
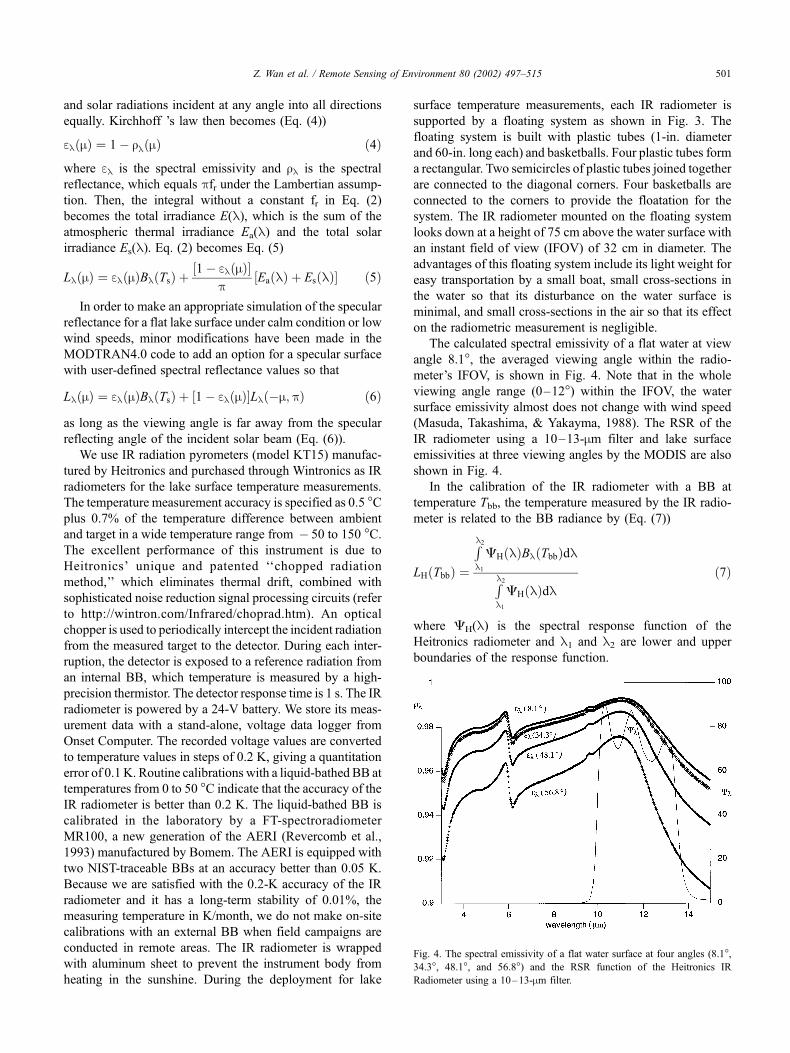
and its east side is in Bolivia. Fig. 2 is a MODIS color
composite image over Bolivia on June 15, 2000, with
brightness temperatures in bands 20, 29, and 31 as RGB
(red, green, and blue) components. The uniformly gray area
Z. Wan et al. / Remote Sensing of Environment 80 (2002) 497–515 499
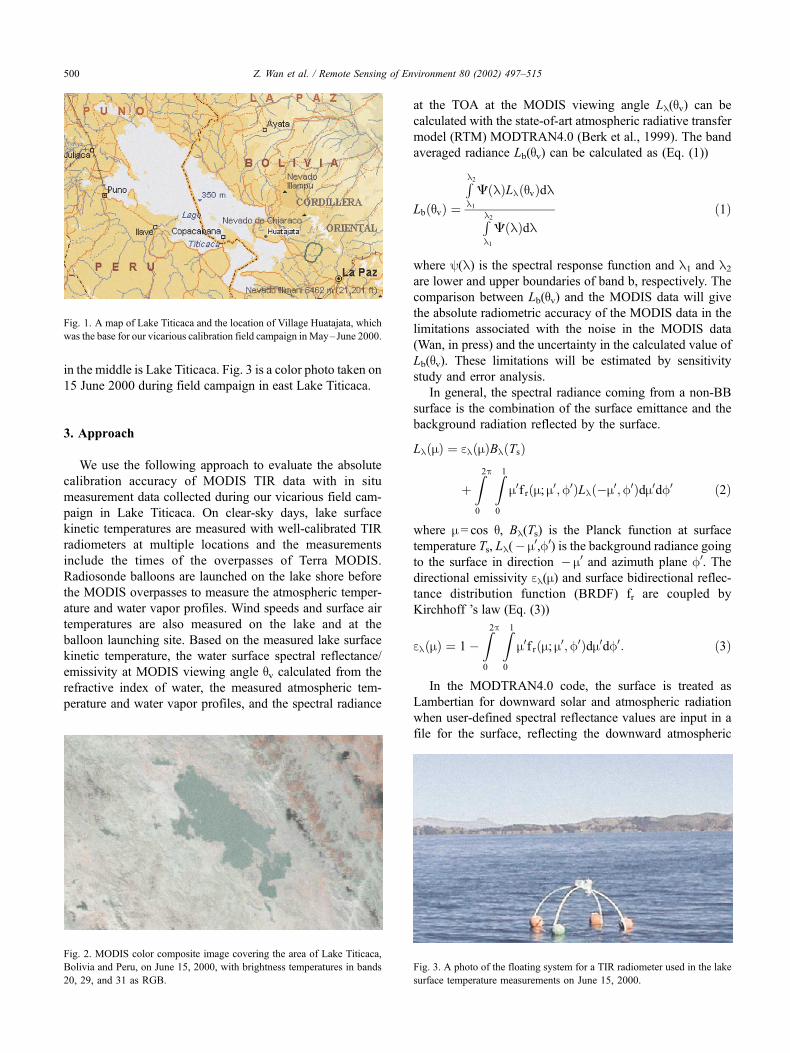
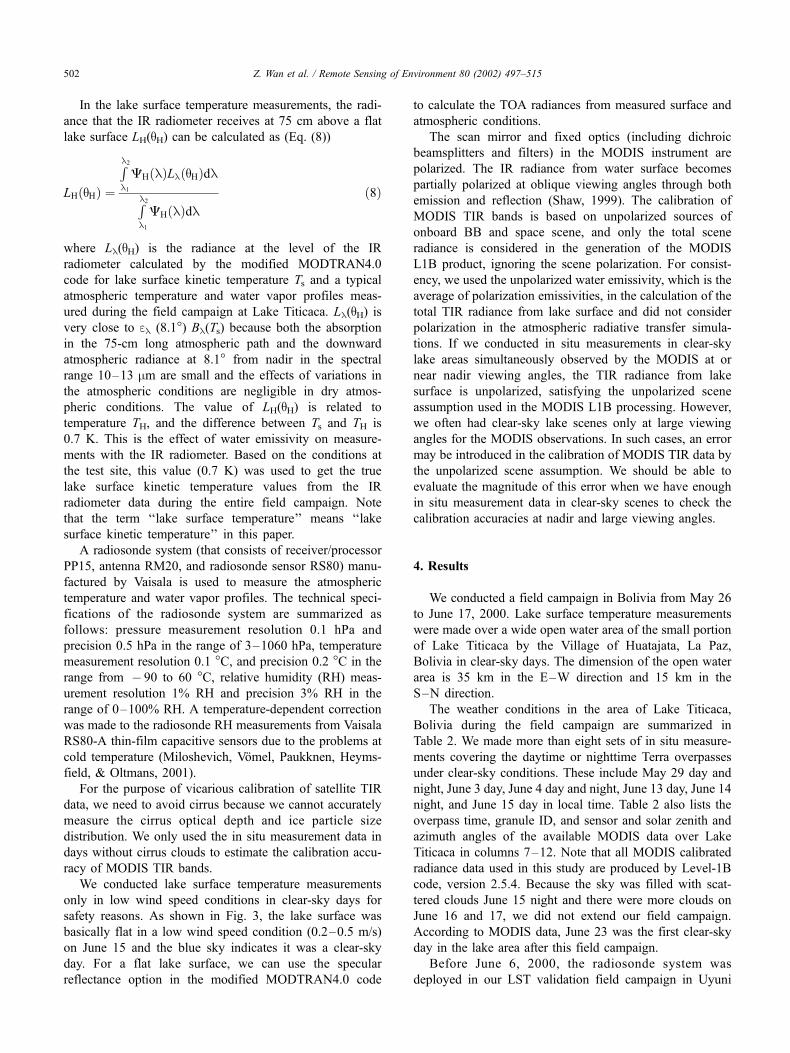
in the middle is Lake Titicaca. Fig. 3 is a color photo taken on
15 June 2000 during field campaign in east Lake Titicaca.
3. Approach
We use the following approach to evaluate the absolute
calibration accuracy of MODIS TIR data with in situ
measurement data collected during our vicarious field cam-
paign in Lake Titicaca. On clear-sky days, lake surface
kinetic temperatures are measured with well-calibrated TIR
radiometers at multiple locations and the measurements
include the times of the overpasses of Terra MODIS.
Radiosonde balloons are launched on the lake shore before
the MODIS overpasses to measure the atmospheric temper-
ature and water vapor profiles. Wind speeds and surface air
temperatures are also measured on the lake and at the
balloon launching site. Based on the measured lake surface
kinetic temperature, the water surface spectral reflectance/
emissivity at MODIS viewing angle qv calculated from the
refractive index of water, the measured atmospheric tem-
perature and water vapor profiles, and the spectral radiance
at the TOA at the MODIS viewing angle Ll(qv) can be
calculated with the state-of-art atmospheric radiative transfer
model (RTM) MODTRAN4.0 (Berk et al., 1999). The band
averaged radiance Lb(qv) can be calculated as (Eq. (1))
LbðqvÞ ¼
Rl1
l2CðlÞLlðqvÞdl
Rl1
l2CðlÞdl
ð1Þ
where y(l) is the spectral response function and l1 and l2are lower and upper boundaries of band b, respectively. The
comparison between Lb(qv) and the MODIS data will give
the absolute radiometric accuracy of the MODIS data in the
limitations associated with the noise in the MODIS data
(Wan, in press) and the uncertainty in the calculated value of
Lb(qv). These limitations will be estimated by sensitivity
study and error analysis.
In general, the spectral radiance coming from a non-BB
surface is the combination of the surface emittance and the
background radiation reflected by the surface.
LlðmÞ ¼ elðmÞBlðTsÞ
þZ2p
0
Z1
0
m0f rðm; m0;f0ÞLlð�m0;f0Þdm0df0 ð2Þ
where m= cos q, Bl(Ts) is the Planck function at surface
temperature Ts, Ll(� m0,f0) is the background radiance going
to the surface in direction � m0 and azimuth plane f0. The
directional emissivity el(m) and surface bidirectional reflec-
tance distribution function (BRDF) fr are coupled by
Kirchhoff ’s law (Eq. (3))
elðmÞ ¼ 1�Z2p
0
Z1
0
m0f rðm; m0;f0Þdm0df0: ð3Þ
In the MODTRAN4.0 code, the surface is treated as
Lambertian for downward solar and atmospheric radiation
when user-defined spectral reflectance values are input in a
file for the surface, reflecting the downward atmospheric
Fig. 1. A map of Lake Titicaca and the location of Village Huatajata, which
was the base for our vicarious calibration field campaign inMay–June 2000.
Fig. 2. MODIS color composite image covering the area of Lake Titicaca,
Bolivia and Peru, on June 15, 2000, with brightness temperatures in bands
20, 29, and 31 as RGB.
Fig. 3. A photo of the floating system for a TIR radiometer used in the lake
surface temperature measurements on June 15, 2000.
Z. Wan et al. / Remote Sensing of Environment 80 (2002) 497–515500
and solar radiations incident at any angle into all directions
equally. Kirchhoff ’s law then becomes (Eq. (4))
elðmÞ ¼ 1� rlðmÞ ð4Þwhere el is the spectral emissivity and rl is the spectral
reflectance, which equals pfr under the Lambertian assump-
tion. Then, the integral without a constant fr in Eq. (2)
becomes the total irradiance E(l), which is the sum of the
atmospheric thermal irradiance Ea(l) and the total solar
irradiance Es(l). Eq. (2) becomes Eq. (5)
LlðmÞ ¼ elðmÞBlðTsÞ þ½1� elðmÞ
p½EaðlÞ þ EsðlÞ ð5Þ
In order to make an appropriate simulation of the specular
reflectance for a flat lake surface under calm condition or low
wind speeds, minor modifications have been made in the
MODTRAN4.0 code to add an option for a specular surface
with user-defined spectral reflectance values so that
LlðmÞ ¼ elðmÞBlðTsÞ þ ½1� elðmÞLlð�m;pÞ ð6Þ
as long as the viewing angle is far away from the specular
reflecting angle of the incident solar beam (Eq. (6)).
We use IR radiation pyrometers (model KT15) manufac-
tured by Heitronics and purchased through Wintronics as IR
radiometers for the lake surface temperature measurements.
The temperature measurement accuracy is specified as 0.5 �Cplus 0.7% of the temperature difference between ambient
and target in a wide temperature range from � 50 to 150 �C.The excellent performance of this instrument is due to
Heitronics’ unique and patented ‘‘chopped radiation
method,’’ which eliminates thermal drift, combined with
sophisticated noise reduction signal processing circuits (refer
to http://wintron.com/Infrared/choprad.htm). An optical
chopper is used to periodically intercept the incident radiation
from the measured target to the detector. During each inter-
ruption, the detector is exposed to a reference radiation from
an internal BB, which temperature is measured by a high-
precision thermistor. The detector response time is 1 s. The IR
radiometer is powered by a 24-V battery. We store its meas-
urement data with a stand-alone, voltage data logger from
Onset Computer. The recorded voltage values are converted
to temperature values in steps of 0.2 K, giving a quantitation
error of 0.1 K. Routine calibrations with a liquid-bathed BB at
temperatures from 0 to 50 �C indicate that the accuracy of the
IR radiometer is better than 0.2 K. The liquid-bathed BB is
calibrated in the laboratory by a FT-spectroradiometer
MR100, a new generation of the AERI (Revercomb et al.,
1993) manufactured by Bomem. The AERI is equipped with
two NIST-traceable BBs at an accuracy better than 0.05 K.
Because we are satisfied with the 0.2-K accuracy of the IR
radiometer and it has a long-term stability of 0.01%, the
measuring temperature in K/month, we do not make on-site
calibrations with an external BB when field campaigns are
conducted in remote areas. The IR radiometer is wrapped
with aluminum sheet to prevent the instrument body from
heating in the sunshine. During the deployment for lake
surface temperature measurements, each IR radiometer is
supported by a floating system as shown in Fig. 3. The
floating system is built with plastic tubes (1-in. diameter
and 60-in. long each) and basketballs. Four plastic tubes form
a rectangular. Two semicircles of plastic tubes joined together
are connected to the diagonal corners. Four basketballs are
connected to the corners to provide the floatation for the
system. The IR radiometer mounted on the floating system
looks down at a height of 75 cm above the water surface with
an instant field of view (IFOV) of 32 cm in diameter. The
advantages of this floating system include its light weight for
easy transportation by a small boat, small cross-sections in
the water so that its disturbance on the water surface is
minimal, and small cross-sections in the air so that its effect
on the radiometric measurement is negligible.
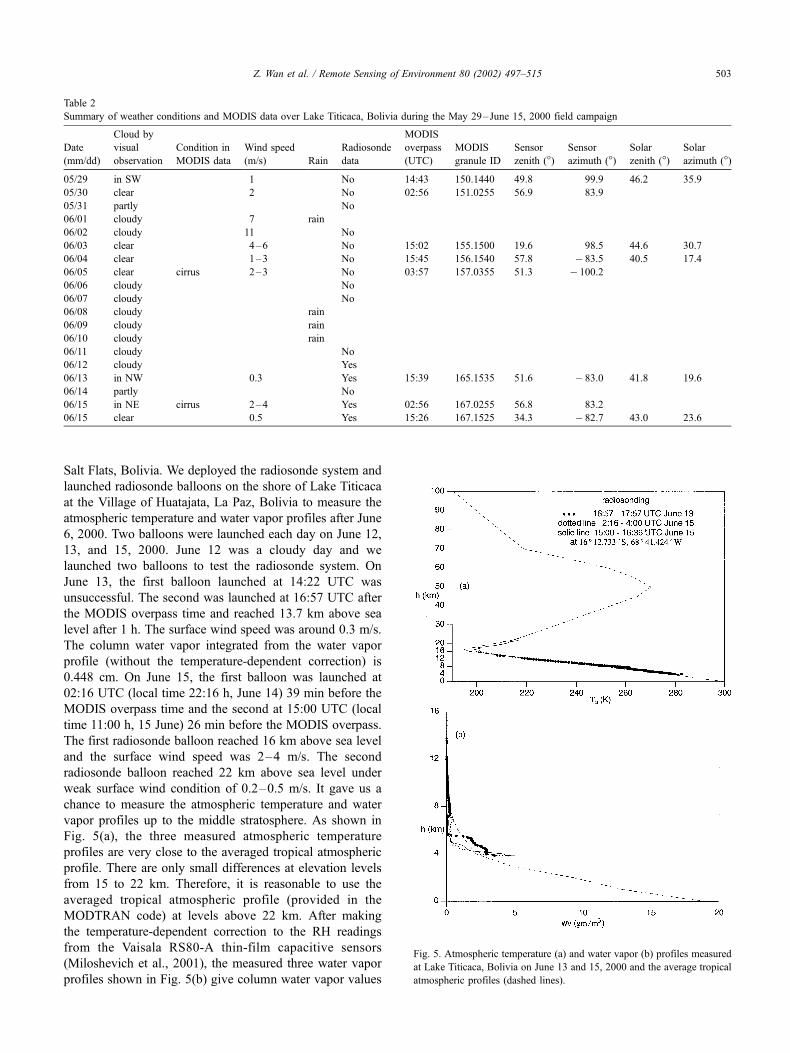
The calculated spectral emissivity of a flat water at view
angle 8.1�, the averaged viewing angle within the radio-
meter’s IFOV, is shown in Fig. 4. Note that in the whole
viewing angle range (0–12�) within the IFOV, the water
surface emissivity almost does not change with wind speed
(Masuda, Takashima, & Yakayma, 1988). The RSR of the
IR radiometer using a 10–13-mm filter and lake surface
emissivities at three viewing angles by the MODIS are also
shown in Fig. 4.
In the calibration of the IR radiometer with a BB at
temperature Tbb, the temperature measured by the IR radio-
meter is related to the BB radiance by (Eq. (7))
LHðTbbÞ ¼
Rl1
l2CHðlÞBlðTbbÞdl
Rl1
l2
CHðlÞdlð7Þ
where CH(l) is the spectral response function of the
Heitronics radiometer and l1 and l2 are lower and upper
boundaries of the response function.
Fig. 4. The spectral emissivity of a flat water surface at four angles (8.1�,34.3�, 48.1�, and 56.8�) and the RSR function of the Heitronics IR
Radiometer using a 10–13-mm filter.
Z. Wan et al. / Remote Sensing of Environment 80 (2002) 497–515 501
In the lake surface temperature measurements, the radi-
ance that the IR radiometer receives at 75 cm above a flat
lake surface LH(qH) can be calculated as (Eq. (8))
LHðqHÞ ¼
Rl1
l2
CHðlÞLlðqHÞdl
Rl1
l2CHðlÞdl
ð8Þ
where Ll(qH) is the radiance at the level of the IR
radiometer calculated by the modified MODTRAN4.0
code for lake surface kinetic temperature Ts and a typical
atmospheric temperature and water vapor profiles meas-
ured during the field campaign at Lake Titicaca. Ll(qH) isvery close to el (8.1�) Bl(Ts) because both the absorption
in the 75-cm long atmospheric path and the downward
atmospheric radiance at 8.1� from nadir in the spectral
range 10–13 mm are small and the effects of variations in
the atmospheric conditions are negligible in dry atmos-
pheric conditions. The value of LH(qH) is related to
temperature TH, and the difference between Ts and TH is
0.7 K. This is the effect of water emissivity on measure-
ments with the IR radiometer. Based on the conditions at
the test site, this value (0.7 K) was used to get the true
lake surface kinetic temperature values from the IR
radiometer data during the entire field campaign. Note
that the term ‘‘lake surface temperature’’ means ‘‘lake
surface kinetic temperature’’ in this paper.
A radiosonde system (that consists of receiver/processor
PP15, antenna RM20, and radiosonde sensor RS80) manu-
factured by Vaisala is used to measure the atmospheric
temperature and water vapor profiles. The technical speci-
fications of the radiosonde system are summarized as
follows: pressure measurement resolution 0.1 hPa and
precision 0.5 hPa in the range of 3–1060 hPa, temperature
measurement resolution 0.1 �C, and precision 0.2 �C in the
range from � 90 to 60 �C, relative humidity (RH) meas-
urement resolution 1% RH and precision 3% RH in the
range of 0–100% RH. A temperature-dependent correction
was made to the radiosonde RH measurements from Vaisala
RS80-A thin-film capacitive sensors due to the problems at
cold temperature (Miloshevich, Vomel, Paukknen, Heyms-
field, & Oltmans, 2001).
For the purpose of vicarious calibration of satellite TIR
data, we need to avoid cirrus because we cannot accurately
measure the cirrus optical depth and ice particle size
distribution. We only used the in situ measurement data in
days without cirrus clouds to estimate the calibration accu-
racy of MODIS TIR bands.
We conducted lake surface temperature measurements
only in low wind speed conditions in clear-sky days for
safety reasons. As shown in Fig. 3, the lake surface was
basically flat in a low wind speed condition (0.2–0.5 m/s)
on June 15 and the blue sky indicates it was a clear-sky
day. For a flat lake surface, we can use the specular
reflectance option in the modified MODTRAN4.0 code
to calculate the TOA radiances from measured surface and
atmospheric conditions.
The scan mirror and fixed optics (including dichroic
beamsplitters and filters) in the MODIS instrument are
polarized. The IR radiance from water surface becomes
partially polarized at oblique viewing angles through both
emission and reflection (Shaw, 1999). The calibration of
MODIS TIR bands is based on unpolarized sources of
onboard BB and space scene, and only the total scene
radiance is considered in the generation of the MODIS
L1B product, ignoring the scene polarization. For consist-
ency, we used the unpolarized water emissivity, which is the
average of polarization emissivities, in the calculation of the
total TIR radiance from lake surface and did not consider
polarization in the atmospheric radiative transfer simula-
tions. If we conducted in situ measurements in clear-sky
lake areas simultaneously observed by the MODIS at or
near nadir viewing angles, the TIR radiance from lake
surface is unpolarized, satisfying the unpolarized scene
assumption used in the MODIS L1B processing. However,
we often had clear-sky lake scenes only at large viewing
angles for the MODIS observations. In such cases, an error
may be introduced in the calibration of MODIS TIR data by
the unpolarized scene assumption. We should be able to
evaluate the magnitude of this error when we have enough
in situ measurement data in clear-sky scenes to check the
calibration accuracies at nadir and large viewing angles.
4. Results
We conducted a field campaign in Bolivia from May 26
to June 17, 2000. Lake surface temperature measurements
were made over a wide open water area of the small portion
of Lake Titicaca by the Village of Huatajata, La Paz,
Bolivia in clear-sky days. The dimension of the open water
area is 35 km in the E–W direction and 15 km in the
S–N direction.
The weather conditions in the area of Lake Titicaca,
Bolivia during the field campaign are summarized in
Table 2. We made more than eight sets of in situ measure-
ments covering the daytime or nighttime Terra overpasses
under clear-sky conditions. These include May 29 day and
night, June 3 day, June 4 day and night, June 13 day, June 14
night, and June 15 day in local time. Table 2 also lists the
overpass time, granule ID, and sensor and solar zenith and
azimuth angles of the available MODIS data over Lake
Titicaca in columns 7–12. Note that all MODIS calibrated
radiance data used in this study are produced by Level-1B
code, version 2.5.4. Because the sky was filled with scat-
tered clouds June 15 night and there were more clouds on
June 16 and 17, we did not extend our field campaign.
According to MODIS data, June 23 was the first clear-sky
day in the lake area after this field campaign.
Before June 6, 2000, the radiosonde system was
deployed in our LST validation field campaign in Uyuni
Z. Wan et al. / Remote Sensing of Environment 80 (2002) 497–515502
Salt Flats, Bolivia. We deployed the radiosonde system and
launched radiosonde balloons on the shore of Lake Titicaca
at the Village of Huatajata, La Paz, Bolivia to measure the
atmospheric temperature and water vapor profiles after June
6, 2000. Two balloons were launched each day on June 12,
13, and 15, 2000. June 12 was a cloudy day and we
launched two balloons to test the radiosonde system. On
June 13, the first balloon launched at 14:22 UTC was
unsuccessful. The second was launched at 16:57 UTC after
the MODIS overpass time and reached 13.7 km above sea
level after 1 h. The surface wind speed was around 0.3 m/s.
The column water vapor integrated from the water vapor
profile (without the temperature-dependent correction) is
0.448 cm. On June 15, the first balloon was launched at
02:16 UTC (local time 22:16 h, June 14) 39 min before the
MODIS overpass time and the second at 15:00 UTC (local
time 11:00 h, 15 June) 26 min before the MODIS overpass.
The first radiosonde balloon reached 16 km above sea level
and the surface wind speed was 2–4 m/s. The second
radiosonde balloon reached 22 km above sea level under
weak surface wind condition of 0.2–0.5 m/s. It gave us a
chance to measure the atmospheric temperature and water
vapor profiles up to the middle stratosphere. As shown in
Fig. 5(a), the three measured atmospheric temperature
profiles are very close to the averaged tropical atmospheric
profile. There are only small differences at elevation levels
from 15 to 22 km. Therefore, it is reasonable to use the
averaged tropical atmospheric profile (provided in the
MODTRAN code) at levels above 22 km. After making
the temperature-dependent correction to the RH readings
from the Vaisala RS80-A thin-film capacitive sensors
(Miloshevich et al., 2001), the measured three water vapor
profiles shown in Fig. 5(b) give column water vapor values
Table 2
Summary of weather conditions and MODIS data over Lake Titicaca, Bolivia during the May 29–June 15, 2000 field campaign
Date
(mm/dd)
Cloud by
visual
observation
Condition in
MODIS data
Wind speed
(m/s) Rain
Radiosonde
data
MODIS
overpass
(UTC)
MODIS
granule ID
Sensor
zenith (�)Sensor
azimuth (�)Solar
zenith (�)Solar
azimuth (�)
05/29 in SW 1 No 14:43 150.1440 49.8 99.9 46.2 35.9
05/30 clear 2 No 02:56 151.0255 56.9 83.9
05/31 partly No
06/01 cloudy 7 rain
06/02 cloudy 11 No
06/03 clear 4–6 No 15:02 155.1500 19.6 98.5 44.6 30.7
06/04 clear 1–3 No 15:45 156.1540 57.8 � 83.5 40.5 17.4
06/05 clear cirrus 2–3 No 03:57 157.0355 51.3 � 100.2
06/06 cloudy No
06/07 cloudy No
06/08 cloudy rain
06/09 cloudy rain
06/10 cloudy rain
06/11 cloudy No
06/12 cloudy Yes
06/13 in NW 0.3 Yes 15:39 165.1535 51.6 � 83.0 41.8 19.6
06/14 partly No
06/15 in NE cirrus 2–4 Yes 02:56 167.0255 56.8 83.2
06/15 clear 0.5 Yes 15:26 167.1525 34.3 � 82.7 43.0 23.6
Fig. 5. Atmospheric temperature (a) and water vapor (b) profiles measured
at Lake Titicaca, Bolivia on June 13 and 15, 2000 and the average tropical
atmospheric profiles (dashed lines).
Z. Wan et al. / Remote Sensing of Environment 80 (2002) 497–515 503
of 0.458, 0.242, and 0.289 cm, indicating very dry atmo-
spheric conditions for the nighttime and daytime MODIS
overpasses in these 2 days.
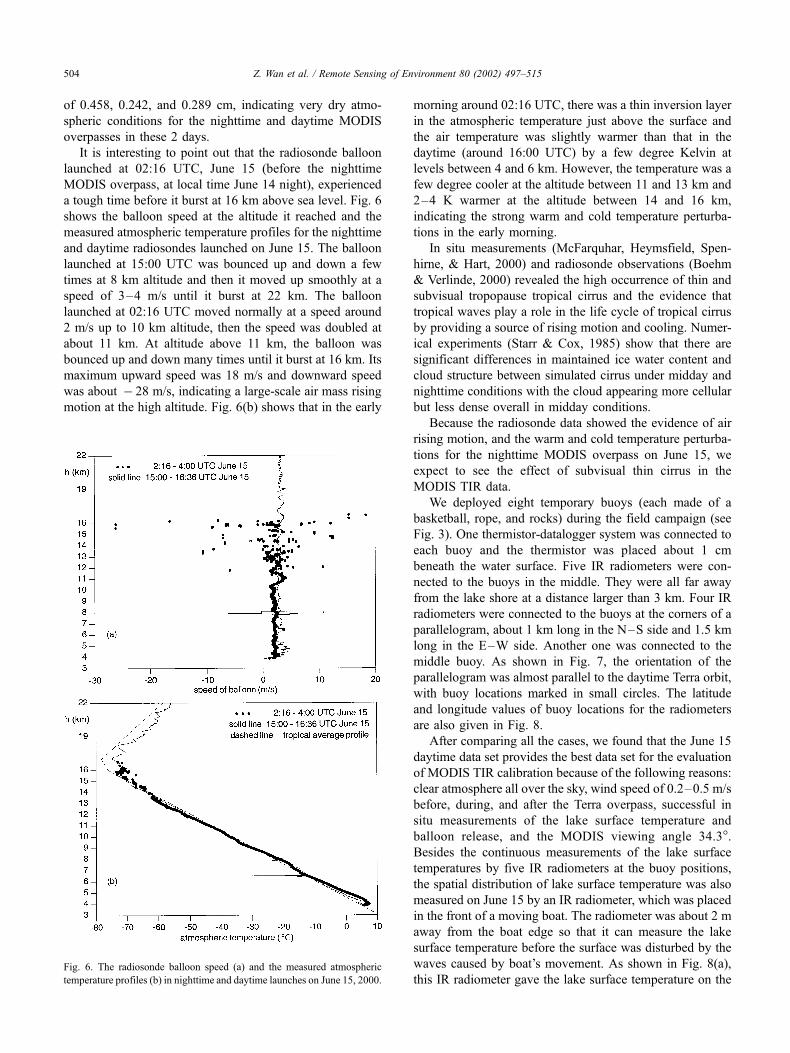
It is interesting to point out that the radiosonde balloon
launched at 02:16 UTC, June 15 (before the nighttime
MODIS overpass, at local time June 14 night), experienced
a tough time before it burst at 16 km above sea level. Fig. 6
shows the balloon speed at the altitude it reached and the
measured atmospheric temperature profiles for the nighttime
and daytime radiosondes launched on June 15. The balloon
launched at 15:00 UTC was bounced up and down a few
times at 8 km altitude and then it moved up smoothly at a
speed of 3–4 m/s until it burst at 22 km. The balloon
launched at 02:16 UTC moved normally at a speed around
2 m/s up to 10 km altitude, then the speed was doubled at
about 11 km. At altitude above 11 km, the balloon was
bounced up and down many times until it burst at 16 km. Its
maximum upward speed was 18 m/s and downward speed
was about � 28 m/s, indicating a large-scale air mass rising
motion at the high altitude. Fig. 6(b) shows that in the early
morning around 02:16 UTC, there was a thin inversion layer
in the atmospheric temperature just above the surface and
the air temperature was slightly warmer than that in the
daytime (around 16:00 UTC) by a few degree Kelvin at
levels between 4 and 6 km. However, the temperature was a
few degree cooler at the altitude between 11 and 13 km and
2–4 K warmer at the altitude between 14 and 16 km,
indicating the strong warm and cold temperature perturba-
tions in the early morning.
In situ measurements (McFarquhar, Heymsfield, Spen-
hirne, & Hart, 2000) and radiosonde observations (Boehm
& Verlinde, 2000) revealed the high occurrence of thin and
subvisual tropopause tropical cirrus and the evidence that
tropical waves play a role in the life cycle of tropical cirrus
by providing a source of rising motion and cooling. Numer-
ical experiments (Starr & Cox, 1985) show that there are
significant differences in maintained ice water content and
cloud structure between simulated cirrus under midday and
nighttime conditions with the cloud appearing more cellular
but less dense overall in midday conditions.
Because the radiosonde data showed the evidence of air
rising motion, and the warm and cold temperature perturba-
tions for the nighttime MODIS overpass on June 15, we
expect to see the effect of subvisual thin cirrus in the
MODIS TIR data.
We deployed eight temporary buoys (each made of a
basketball, rope, and rocks) during the field campaign (see
Fig. 3). One thermistor-datalogger system was connected to
each buoy and the thermistor was placed about 1 cm
beneath the water surface. Five IR radiometers were con-
nected to the buoys in the middle. They were all far away
from the lake shore at a distance larger than 3 km. Four IR
radiometers were connected to the buoys at the corners of a
parallelogram, about 1 km long in the N–S side and 1.5 km
long in the E–W side. Another one was connected to the
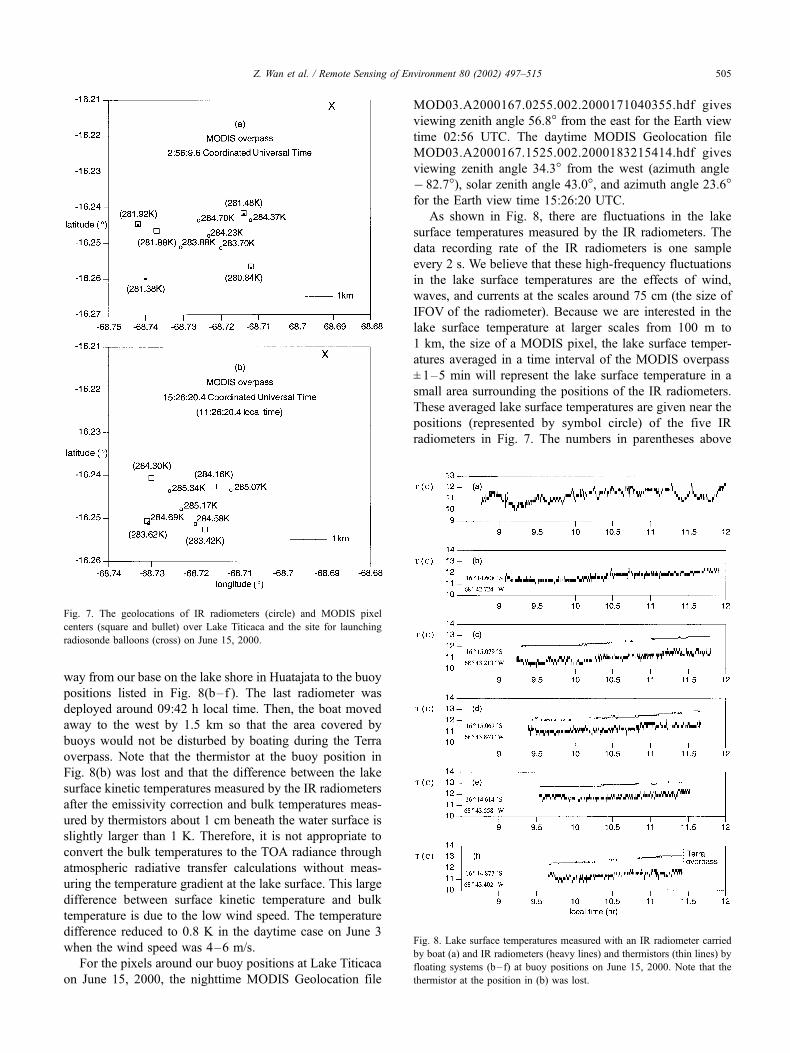
middle buoy. As shown in Fig. 7, the orientation of the
parallelogram was almost parallel to the daytime Terra orbit,
with buoy locations marked in small circles. The latitude
and longitude values of buoy locations for the radiometers
are also given in Fig. 8.
After comparing all the cases, we found that the June 15
daytime data set provides the best data set for the evaluation
of MODIS TIR calibration because of the following reasons:
clear atmosphere all over the sky, wind speed of 0.2–0.5 m/s
before, during, and after the Terra overpass, successful in
situ measurements of the lake surface temperature and
balloon release, and the MODIS viewing angle 34.3�.Besides the continuous measurements of the lake surface
temperatures by five IR radiometers at the buoy positions,
the spatial distribution of lake surface temperature was also
measured on June 15 by an IR radiometer, which was placed
in the front of a moving boat. The radiometer was about 2 m
away from the boat edge so that it can measure the lake
surface temperature before the surface was disturbed by the
waves caused by boat’s movement. As shown in Fig. 8(a),
this IR radiometer gave the lake surface temperature on theFig. 6. The radiosonde balloon speed (a) and the measured atmospheric
temperature profiles (b) in nighttime and daytime launches on June 15, 2000.
Z. Wan et al. / Remote Sensing of Environment 80 (2002) 497–515504
way from our base on the lake shore in Huatajata to the buoy
positions listed in Fig. 8(b–f ). The last radiometer was
deployed around 09:42 h local time. Then, the boat moved
away to the west by 1.5 km so that the area covered by
buoys would not be disturbed by boating during the Terra
overpass. Note that the thermistor at the buoy position in
Fig. 8(b) was lost and that the difference between the lake
surface kinetic temperatures measured by the IR radiometers
after the emissivity correction and bulk temperatures meas-
ured by thermistors about 1 cm beneath the water surface is
slightly larger than 1 K. Therefore, it is not appropriate to
convert the bulk temperatures to the TOA radiance through
atmospheric radiative transfer calculations without meas-
uring the temperature gradient at the lake surface. This large
difference between surface kinetic temperature and bulk
temperature is due to the low wind speed. The temperature
difference reduced to 0.8 K in the daytime case on June 3
when the wind speed was 4–6 m/s.
For the pixels around our buoy positions at Lake Titicaca
on June 15, 2000, the nighttime MODIS Geolocation file
MOD03.A2000167.0255.002.2000171040355.hdf gives
viewing zenith angle 56.8� from the east for the Earth view
time 02:56 UTC. The daytime MODIS Geolocation file
MOD03.A2000167.1525.002.2000183215414.hdf gives
viewing zenith angle 34.3� from the west (azimuth angle
� 82.7�), solar zenith angle 43.0�, and azimuth angle 23.6�for the Earth view time 15:26:20 UTC.
As shown in Fig. 8, there are fluctuations in the lake
surface temperatures measured by the IR radiometers. The
data recording rate of the IR radiometers is one sample
every 2 s. We believe that these high-frequency fluctuations
in the lake surface temperatures are the effects of wind,
waves, and currents at the scales around 75 cm (the size of
IFOV of the radiometer). Because we are interested in the
lake surface temperature at larger scales from 100 m to
1 km, the size of a MODIS pixel, the lake surface temper-
atures averaged in a time interval of the MODIS overpass
± 1–5 min will represent the lake surface temperature in a
small area surrounding the positions of the IR radiometers.
These averaged lake surface temperatures are given near the
positions (represented by symbol circle) of the five IR
radiometers in Fig. 7. The numbers in parentheses above
Fig. 8. Lake surface temperatures measured with an IR radiometer carried
by boat (a) and IR radiometers (heavy lines) and thermistors (thin lines) by
floating systems (b– f) at buoy positions on June 15, 2000. Note that the
thermistor at the position in (b) was lost.
Fig. 7. The geolocations of IR radiometers (circle) and MODIS pixel
centers (square and bullet) over Lake Titicaca and the site for launching
radiosonde balloons (cross) on June 15, 2000.
Z. Wan et al. / Remote Sensing of Environment 80 (2002) 497–515 505

or below the square symbols are the brightness temperatures
in band 31 from the MODIS L1B data. In Fig. 7(a) for the
nighttime overpass, the four bullet symbols represent the
centers of pixels in scan lines 490 and 491, while the square
symbols represent the centers of pixels in scan lines 491,
490, and 487 that are closest to the averaged buoy position
because of the bowtie effect by the end of swath (sensor
zenith angle at 56.8�). In Fig. 7(b) for the daytime overpass,
the two square symbols in the upper positions are the centers
of pixels in scan line 523 (viewed by the fourth channel or
detector element in each band) and the square symbols in the
lower positions represent the centers of pixels viewed by the
fifth detector in each band.
Before making detailed comparisons, we need to make a
sensitivity study for the following reasons. As shown in
Table 2, we only have three sets of radiosonde data in clear-
sky conditions (possibly with thin cirrus for the nighttime
data set). We want to know what is the effect of the problem
with RH measurements of the radiosonde at cold temper-
atures and for which TIR bands it is appropriate to apply the
measured atmospheric temperature and water vapor profiles
to the MODIS data in the large portion of Lake Titicaca on
the same days and to the in situ lake surface temperature
data on other days. The daytime atmospheric temperature
and water vapor profile measured on June 15 up to 22 km
altitude combined with the averaged tropical atmospheric
profile above 22 km was used as the base profile in the
sensitivity study with the MODTRAN4.0 code. The mean
tropical profiles of atmospheric compositions including
ozone, carbon dioxide, methane, nitrous oxide, nitric acid,
and other trace gasses were also used in the radiative
transfer simulations. The column ozone integrated from
the averaged tropical atmospheric ozone profile is 0.266
ATM CM (equivalent to 266 Dobson units). The EP/TOMS
total ozone map on June 15, 2000 gives a range of 250–275
DU for the Lake Titicaca region (thanks to the NASA
TOMS webpage http://toms.gsfc.nasa.gov). The error in
values of the TOMS total ozone map may be significantly
larger than a few percent (Chesters & Neuendorffer, 1991).
The simulation results for the sensitivity study are shown in
Table 3. The effect of standard cirrus (absorption and
scattering) with optical depth 0.007 on the brightness
temperature in MODIS TIR bands is shown in column 2,
and the effect of thin subvisual cirrus in the same optical
depth is shown in column 3. Note that there is a forward
peak in the scattering of cirrus and the absorption effect of
thin cirrus is much stronger in long wavelengths. The values
in columns 4–8 are the effects of variations in atmospheric
conditions: temperature variation dTa of 0.5 K, water vapor
variation dwv of 10%, set RH to 30% at levels between 9
and 12 km altitude (column 6), CO2 variation by 10 ppm,
and O3 variation by � 6%, respectively. The viewing zenith
angle is 56.9� for the case in column 8 and 34.3� for all
other cases. The effects of variations in water vapor in
columns 5 and 6 indicate that the calibration of MODIS
water vapor bands 27 and 28 cannot be validated with the
water vapor profile measured by Vaisala RS80-A radio-
sondes because of its problem at cold temperatures (Milosh-
evich et al., 2001). The effects of increasing lake surface
kinetic temperature by 0.25 K are shown in column 9, and
effects of changing lake surface from a flat mirror surface
(for specular reflectance) to a completely rough surface with
random slopes and aspects (for Lambertian reflectance) are
shown in columns 10 and 11 in night and day cases,
respectively. The dTb value required to meet the specified
radiometer accuracy in MODIS TIR bands is also given in
column 12. From this sensitivity study, we can get the
following insights into the requirements for field campaigns
Table 3
Sensitivities of the calculated MODIS TIR band brightness temperatures on the variations in the surface and the atmospheric conditions and the dTb (K) valuesrequired for the specified radiometric accuracies
Band
no.
Visible cirrus
64-mm mode
Subvisual cirrus
4-mm mode
dTa0.5 (K) dwv 10%
Set RH 30%
(9–12 km)
dCO2
10 ppm
dO3 � 6%
(qv 56.9�)dTs 0.25(K)
Surface
S!L night
(qv 34.3�)
Surface
S!L day
(qs 43�)
dTb (K)for specified
radiometric
accuracy (%)
20 � 0.15 � 0.18 0.02 � 0.02 � 0.02 0.23 0.01 4.80 0.16 (0.75)
21 � 0.16 � 0.20 0.02 0.24 0.01 2.55 2.23 (10)
22 � 0.16 � 0.19 0.02 0.24 0.02 2.71 0.22 (1)
23 � 0.16 � 0.20 0.04 � 0.01 0.23 0.02 1.99 0.22 (1)
24 � 0.18 � 0.23 0.26 � 0.10 0.08 0.02 0.13 0.20 (1)
25 � 0.18 � 0.24 0.16 � 0.01 � 0.01 0.01 0.15 0.04 0.27 0.22 (1)
27 � 0.27 � 0.34 0.48 � 0.69 � 4.29 0.30 (1)
28 � 0.30 � 0.36 0.37 � 0.47 � 1.41 0.04 0.03 0.02 0.36 (1)
29 � 0.25 � 0.36 0.04 � 0.05 � 0.05 0.01 0.23 0.04 0.03 0.47 (1)
30 � 0.40 � 0.28 0.18 � 0.01 � 0.01 0.55 0.16 0.04 0.03 0.47 (1)
31 � 0.44 � 0.30 0.02 � 0.03 � 0.01 0.24 0.02 0.01 0.31 (0.5)
32 � 0.49 � 0.46 0.02 � 0.04 � 0.02 0.24 0.05 0.04 0.33 (0.5)
33 � 0.54 � 0.60 0.17 � 0.04 � 0.09 � 0.19 0.04 0.15 0.21 0.12 0.65 (1)
34 � 0.56 � 0.62 0.27 � 0.02 � 0.04 � 0.28 0.03 0.07 0.13 0.09 0.61 (1)
35 � 0.56 � 0.64 0.33 � 0.01 � 0.01 � 0.26 0.04 0.04 0.07 0.05 0.58 (1)
36 � 0.68 � 0.66 0.40 � 0.01 � 0.04 � 0.27 0.01 0.53 (1)
Note that zero values are not shown in the blank spaces for clarity and that ‘‘surface S!L’’ means changing surface reflectance from specular to Lambertian.
Z. Wan et al. / Remote Sensing of Environment 80 (2002) 497–515506
to validate the calibration accuracies of MODIS TIR bands.
Firstly, for the bands in atmospheric windows (i.e., bands
20–23, 29, and 31–32), the effects due to uncertainties in
atmospheric temperature and water vapor profiles are equal
or smaller than instrument’s NEDT in the high altitude site
in dry seasons. The accuracy in measured lake surface
kinetic temperatures is the limiting factor. The effect of lake
surface roughness related to surface wind speed is very small
at night. The water bulk temperature in the surface layer of
about 1 cm thick measured by thermistors will be close to
the surface kinetic temperature in high wind speed condi-
tions. However, it is not safe to deploy radiometers in the
lake under high wind speed conditions, especially at night.
Low wind speed conditions are required in daytime cases in
order to avoid the difficulty to deal with the reflected solar
radiation in bands 20–23. The effects of these uncertainties
are larger in band 33 but are still significantly smaller than
1%, the specified calibration accuracy for TIR bands.
Secondly, for these atmospheric window bands, it may be
possible to apply the measured atmospheric temperature and
water vapor profiles to other sites about 60 km away from
the radiosonde launch site or to other days in a period of a
few weeks as long as the sky is clear in all directions and
there is no significant changes in the surface atmospheric
conditions (air temperature, RH, and wind speed). However,
an overall consistency check and error analysis must be
made for all possible effects of the variations and uncertain-
ties in atmospheric conditions. Thirdly, for the atmospheric
temperature sounding bands (i.e., bands 24–25 and 34–36),
real-time in situ measurements of atmospheric temperature
and water vapor profiles are required. The effects of tem-
poral and spatial variations in the measured atmospheric
temperature and water vapor profiles may be too large to
validate the calibration accuracy at the 1% level. Lastly, it is
difficult to validate band 30 (the ozone band) without in situ
measurement of the ozone profile.
According to the above insights and the weather con-
ditions listed in Table 2, we decided that (1) the estimate of
calibration accuracy will be made only for eight MODIS
bands, i.e., bands 20–23, 29, and 31–33; (2) the three
MODIS overpass cases on June 13 and 15 will be our
primary cases; (3) the daytime atmospheric temperature and
water vapor profile measured on June 15 will be used for the
May 29 case. However, the June 3 daytime case will not be
used because of the relatively high wind speed. The June 4
daytime case will also not be used because the measured air
surface temperature was about 3 K warmer. (4) The night-
time atmospheric temperature and water vapor profile meas-
ured on June 15 will be used for cases of May 30 and June 5.
Lastly, (5) the daytime and nighttime atmospheric temper-
ature and water vapor profiles measured on June 15 will be
used for sites in the large portion of Lake Titicaca, where
brightness temperatures in band 31 are highly uniformed so
that we can check the effects of the instrument noise and the
spatial variation in MODIS TIR data on the comparison
between MODIS TIR data and the calculated TOA radian-
ces based on the measured lake surface kinetic temperatures
and atmospheric profiles. We decided to make comparisons
in more cases because we have to consider many factors
related to the estimate of calibration accuracy, including
sensor NEDT and spatial variations in MODIS data, sensor
response across scan, viewing angle-dependent scene polar-
ization, and possible thin subvisual cirrus.
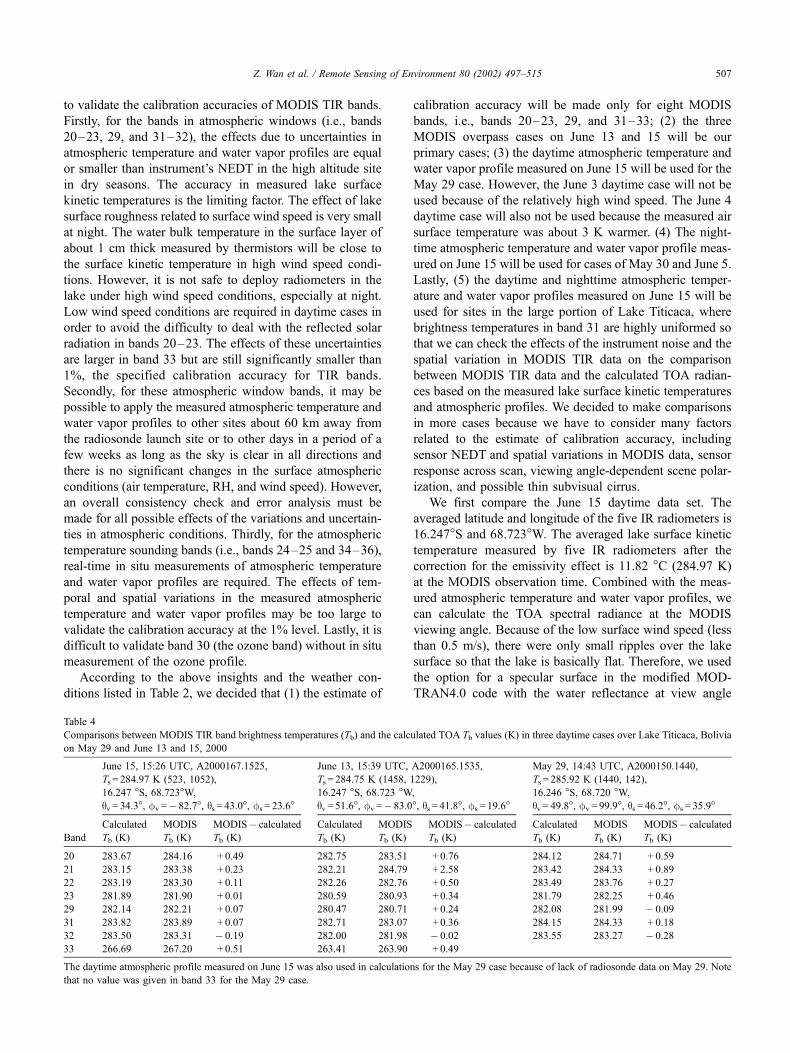
We first compare the June 15 daytime data set. The
averaged latitude and longitude of the five IR radiometers is
16.247�S and 68.723�W. The averaged lake surface kinetic
temperature measured by five IR radiometers after the
correction for the emissivity effect is 11.82 �C (284.97 K)
at the MODIS observation time. Combined with the meas-
ured atmospheric temperature and water vapor profiles, we
can calculate the TOA spectral radiance at the MODIS
viewing angle. Because of the low surface wind speed (less
than 0.5 m/s), there were only small ripples over the lake
surface so that the lake is basically flat. Therefore, we used
the option for a specular surface in the modified MOD-
TRAN4.0 code with the water reflectance at view angle
Table 4
Comparisons between MODIS TIR band brightness temperatures (Tb) and the calculated TOA Tb values (K) in three daytime cases over Lake Titicaca, Bolivia
on May 29 and June 13 and 15, 2000
June 15, 15:26 UTC, A2000167.1525,
Ts = 284.97 K (523, 1052),
16.247 �S, 68.723�W,
qv = 34.3�, fv =� 82.7�, qs = 43.0�, fs = 23.6�
June 13, 15:39 UTC, A2000165.1535,
Ts = 284.75 K (1458, 1229),
16.247 �S, 68.723 �W,
qv = 51.6�, fv =� 83.0�, qs = 41.8�, fs = 19.6�
May 29, 14:43 UTC, A2000150.1440,
Ts = 285.92 K (1440, 142),
16.246 �S, 68.720 �W,
qv = 49.8�, fv = 99.9�, qs = 46.2�, fs = 35.9�
Band
Calculated
Tb (K)
MODIS
Tb (K)
MODIS� calculated
Tb (K)
Calculated
Tb (K)
MODIS
Tb (K)
MODIS� calculated
Tb (K)
Calculated
Tb (K)
MODIS
Tb (K)
MODIS� calculated
Tb (K)
20 283.67 284.16 + 0.49 282.75 283.51 + 0.76 284.12 284.71 + 0.59
21 283.15 283.38 + 0.23 282.21 284.79 + 2.58 283.42 284.33 + 0.89
22 283.19 283.30 + 0.11 282.26 282.76 + 0.50 283.49 283.76 + 0.27
23 281.89 281.90 + 0.01 280.59 280.93 + 0.34 281.79 282.25 + 0.46
29 282.14 282.21 + 0.07 280.47 280.71 + 0.24 282.08 281.99 � 0.09
31 283.82 283.89 + 0.07 282.71 283.07 + 0.36 284.15 284.33 + 0.18
32 283.50 283.31 � 0.19 282.00 281.98 � 0.02 283.55 283.27 � 0.28
33 266.69 267.20 + 0.51 263.41 263.90 + 0.49
The daytime atmospheric profile measured on June 15 was also used in calculations for the May 29 case because of lack of radiosonde data on May 29. Note
that no value was given in band 33 for the May 29 case.
Z. Wan et al. / Remote Sensing of Environment 80 (2002) 497–515 507
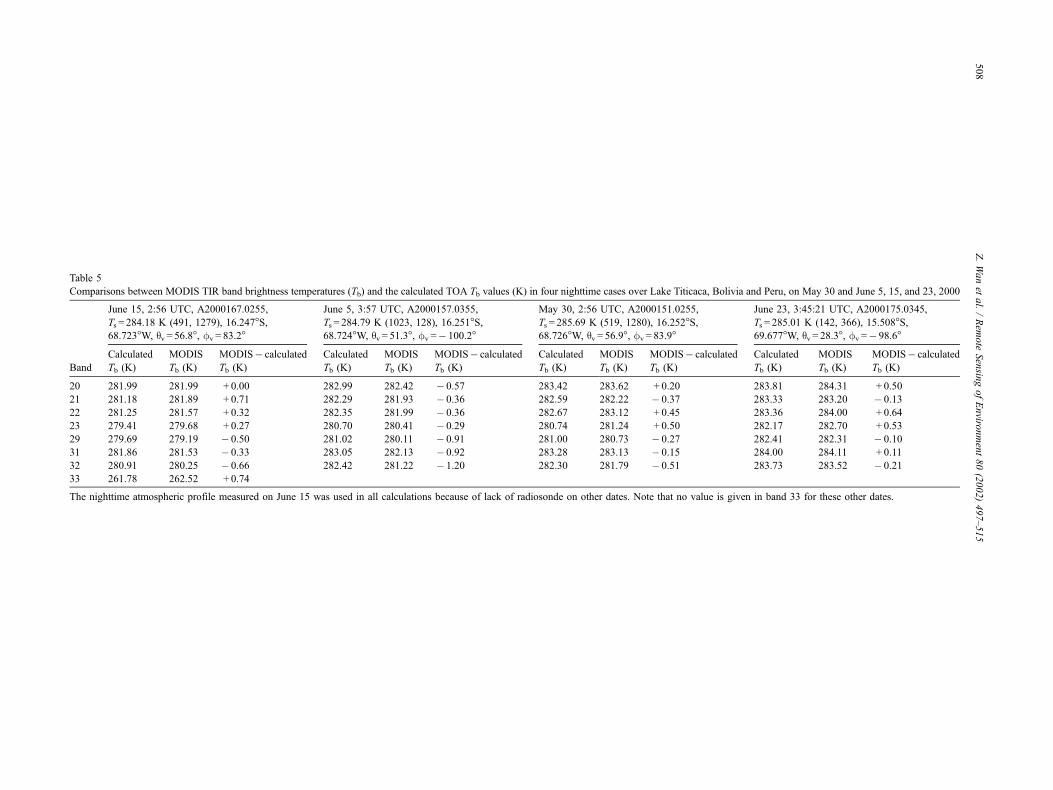
Table 5
Comparisons between MODIS TIR band brightness temperatures (Tb) and the calculated TOA Tb values (K) in four nighttime cases over Lake Titicaca, Bolivia and Peru, on May 30 and June 5, 15, and 23, 2000
June 15, 2:56 UTC, A2000167.0255,
Ts = 284.18 K (491, 1279), 16.247�S,68.723�W, qv = 56.8�, fv = 83.2�
June 5, 3:57 UTC, A2000157.0355,
Ts = 284.79 K (1023, 128), 16.251�S,68.724�W, qv = 51.3�, fv =� 100.2�
May 30, 2:56 UTC, A2000151.0255,
Ts = 285.69 K (519, 1280), 16.252�S,68.726�W, qv = 56.9�, fv = 83.9�
June 23, 3:45:21 UTC, A2000175.0345,
Ts = 285.01 K (142, 366), 15.508�S,69.677�W, qv = 28.3�, fv =� 98.6�
Band
Calculated
Tb (K)
MODIS
Tb (K)
MODIS� calculated
Tb (K)
Calculated
Tb (K)
MODIS
Tb (K)
MODIS� calculated
Tb (K)
Calculated
Tb (K)
MODIS
Tb (K)
MODIS� calculated
Tb (K)
Calculated
Tb (K)
MODIS
Tb (K)
MODIS� calculated
Tb (K)
20 281.99 281.99 + 0.00 282.99 282.42 � 0.57 283.42 283.62 + 0.20 283.81 284.31 + 0.50
21 281.18 281.89 + 0.71 282.29 281.93 � 0.36 282.59 282.22 � 0.37 283.33 283.20 � 0.13
22 281.25 281.57 + 0.32 282.35 281.99 � 0.36 282.67 283.12 + 0.45 283.36 284.00 + 0.64
23 279.41 279.68 + 0.27 280.70 280.41 � 0.29 280.74 281.24 + 0.50 282.17 282.70 + 0.53
29 279.69 279.19 � 0.50 281.02 280.11 � 0.91 281.00 280.73 � 0.27 282.41 282.31 � 0.10
31 281.86 281.53 � 0.33 283.05 282.13 � 0.92 283.28 283.13 � 0.15 284.00 284.11 + 0.11
32 280.91 280.25 � 0.66 282.42 281.22 � 1.20 282.30 281.79 � 0.51 283.73 283.52 � 0.21
33 261.78 262.52 + 0.74
The nighttime atmospheric profile measured on June 15 was used in all calculations because of lack of radiosonde on other dates. Note that no value is given in band 33 for these other dates.
Z.Wanet
al./Rem
ote
Sensin
gofEnviro
nment80(2002)497–515
508
34.3� as the user-defined spectral reflectance to calculate the
TOA radiance. Because MODIS viewing angle (zenith
angle 34.3� and azimuth angle � 82.7�) was far away from
the specular reflecting direction of the incident solar beam at
zenith angle 43.0� and azimuth angle 23.6�, the solar
radiation was not included in the radiative transfer calcu-
lations. The calculated spectral atmospheric transmission
at viewing angle 34.3� is greater than 0.95 for most of the
3.7–4.1- and 8.13-mm atmospheric windows.
With the MODIS RSR functions, we can calculate the
band brightness temperatures (Tb) for the MODIS TIR bands.
Then, we pick up the calibrated radiance values in the eight
MODIS TIR bands and convert them into band brightness
temperatures for the four pixels close to the locations of the
five IR radiometers from the MODIS L1B data granule
MOD021KM.A2000167.1525.002.2000354204307.hdf,
which is generated by v2.5.4 L1B code. With 2-D interpola-
tions, we can get the MODIS measured Tb values at the
averaged position of the five IR radiometers. As shown in
Table 4, we compared the calculated Tb values (in column 2)
with the MODIS measured Tb values (in column 3), giving
their differences in column 4. Related information and
parameters are shown on the top of this table, including
date, MODIS overpass time, granule ID, measured surface
temperature Ts, the line and sample numbers of the pixel
closest to the averaged buoy position, latitude, and longi-
tude of the averaged position, sensor observation zenith and
azimuth angles, and solar zenith and azimuth angles. As
shown in column 4, the Tb difference between calculated
value and the MODIS value in band 22 is 0.11 K. There
are more errors in band 22 than others in this case because
pixels of the fourth detector (in scan line 523) are used in
the 2-D interpolation for the MODIS Tb at the averaged
buoy position. Since the fourth detector in band 22 is too
noisy (Wan, in press), its radiance value is replaced with
the average value of the neighboring detectors (i.e., the
third and fifth) at the same sample number.
Similarly, the comparison results are shown in columns
5–7 for the June 13 daytime case where the atmospheric
profiles measured by the second radiosonde balloon
launched on June 13 were used in the MODTRAN calcu-
lations. For the May 29 case, the more complete atmospheric
profile measured by the daytime radiosonde balloon
launched on June 15 was used in the radiative transfer
simulations because there were no measurements of the
atmospheric profile on this day. Comparison results are
shown in columns 8–10 only for the atmospheric window
TIR bands. The corresponding L1B files are MOD021-
KM.A2000165.1535.002.2000354201825.hdf and
MOD021KM.A2000150.1440.002.2000354204059.hdf.
Note the slight differences in latitude and longitude values of
the averaged buoy position because only three buoys were
deployed on May 29. Comparing the three cases of May 29
and June 13 and 15, the Tb difference in band 31 ranges from
0.07 to 0.36 K. We consider these numbers quite compatible
because of the error contributions from in situ lake surface
temperature measurements, detector noise, incomplete
knowledge of sensor response across scan, and uncertainties
in the temporal and spatial variations of the atmospheric
profiles. Detailed error analysis will be made in Section 5.
Comparison results for four nighttime cases are given in
Table 5. The first three cases shown in columns 2–10 are for
June 15 and 5 and May 30. The lake surface kinetic temper-
atures were measured by the IR radiometers and the atmo-
spheric profile used in MODTRAN simulations was the one
measured by the radiosonde balloon launched on June 15
because of lack of radiosonde on other days. The MODIS Tbvalues in band 31 are all smaller than the calculated values by
different amounts. TheMODIS observed the buoy location at
almost the same viewing angle on May 30 and June 15.
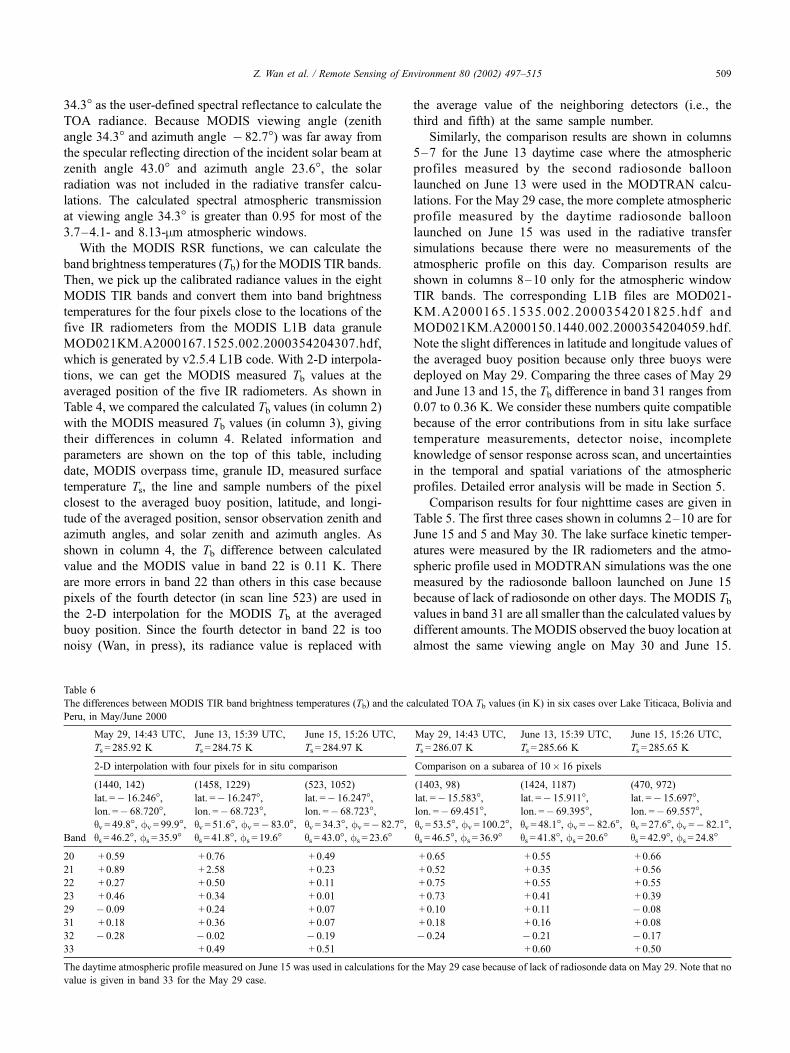
Table 6
The differences between MODIS TIR band brightness temperatures (Tb) and the calculated TOA Tb values (in K) in six cases over Lake Titicaca, Bolivia and
Peru, in May/June 2000
May 29, 14:43 UTC,
Ts = 285.92 K
June 13, 15:39 UTC,
Ts = 284.75 K
June 15, 15:26 UTC,
Ts = 284.97 K
May 29, 14:43 UTC,
Ts = 286.07 K
June 13, 15:39 UTC,
Ts = 285.66 K
June 15, 15:26 UTC,
Ts = 285.65 K
2-D interpolation with four pixels for in situ comparison Comparison on a subarea of 10� 16 pixels
Band
(1440, 142)
lat. =� 16.246�,lon. =� 68.720�,qv = 49.8�, fv = 99.9�,qs = 46.2�, fs = 35.9�
(1458, 1229)
lat. =� 16.247�,lon. =� 68.723�,qv = 51.6�, fv =� 83.0�,qs = 41.8�, fs = 19.6�
(523, 1052)
lat. =� 16.247�,lon. =� 68.723�,qv = 34.3�, fv =� 82.7�,qs = 43.0�, fs = 23.6�
(1403, 98)
lat. =� 15.583�,lon. =� 69.451�,qv = 53.5�, fv = 100.2�,qs = 46.5�, fs = 36.9�
(1424, 1187)
lat. =� 15.911�,lon. =� 69.395�,qv = 48.1�, fv =� 82.6�,qs = 41.8�, fs = 20.6�
(470, 972)
lat. =� 15.697�,lon. =� 69.557�,qv = 27.6�, fv =� 82.1�,qs = 42.9�, fs = 24.8�
20 + 0.59 + 0.76 + 0.49 + 0.65 + 0.55 + 0.66
21 + 0.89 + 2.58 + 0.23 + 0.52 + 0.35 + 0.56
22 + 0.27 + 0.50 + 0.11 + 0.75 + 0.55 + 0.55
23 + 0.46 + 0.34 + 0.01 + 0.73 + 0.41 + 0.39
29 � 0.09 + 0.24 + 0.07 + 0.10 + 0.11 � 0.08
31 + 0.18 + 0.36 + 0.07 + 0.18 + 0.16 + 0.08
32 � 0.28 � 0.02 � 0.19 � 0.24 � 0.21 � 0.17
33 + 0.49 + 0.51 + 0.60 + 0.50
The daytime atmospheric profile measured on June 15 was used in calculations for the May 29 case because of lack of radiosonde data on May 29. Note that no
value is given in band 33 for the May 29 case.
Z. Wan et al. / Remote Sensing of Environment 80 (2002) 497–515 509
Possible variations in the atmospheric conditions would
make some contributions to the Tb difference. By comparing
the spectral features in the Tb differences, we believe that the
negative values of the Tb difference are mainly due to the
effect of subvisual cirrus as shown in Table 3 column 3. We
expected the effect of a thin subvisual cirrus in the June 15
nighttime case because of the evidence of air mass rising
motion shown in the radiosonde data (Fig. 6). Occurrences of
nighttime subvisual cirrus (on all three nighttime MODIS
overpasses during the field campaign) are consistent with the
existing in situ measurements (McFarquhar et al., 2000),
radiosonde observations (Boehm & Verlinde, 2000), and
numerical experiments (Starr & Cox, 1985). Column 10 in
Table 5 shows that the effect of subvisual cirrus was quite
small in the nighttime case of May 30. It is interesting to
compare this nighttime case with the May 29 daytime case
because the time difference between these two cases is only
approximately 12 h. The Tb difference values in bands 22–23
and 29 are compatible within ± 0.2 K in these two cases
(Table 4 column 10 versus Table 5 column 10), supporting
our conclusion based on the specular assumption for lake
surface reflectance under low wind speed conditions: the
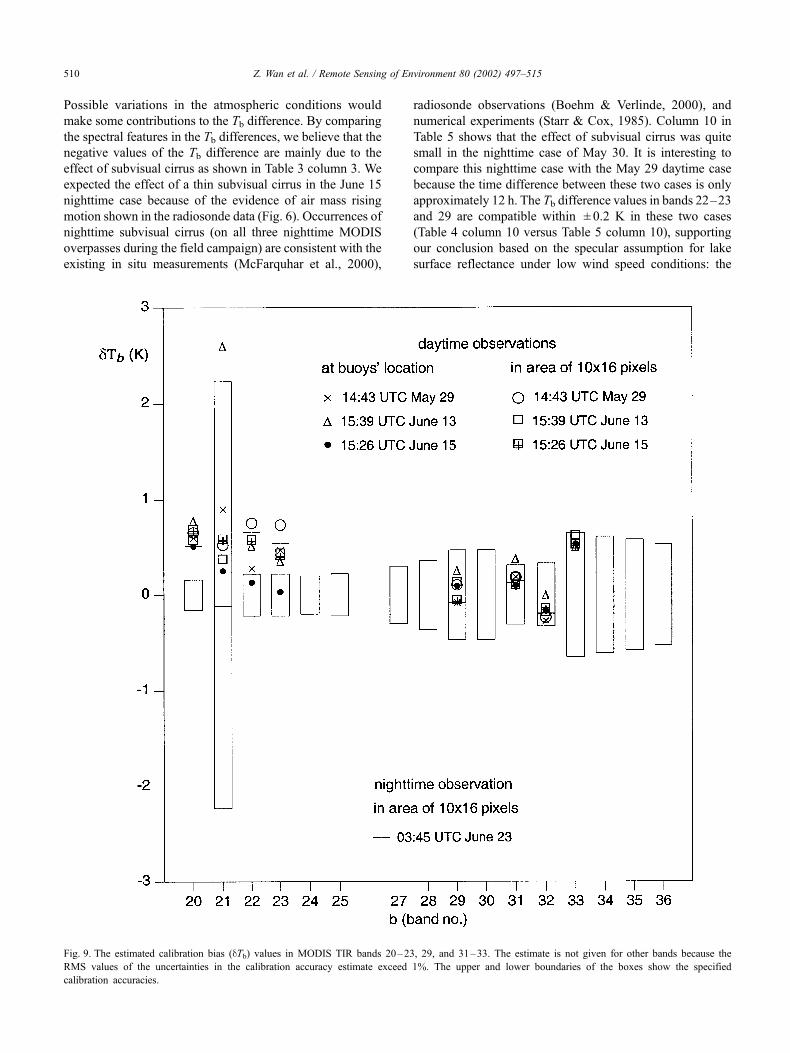
Fig. 9. The estimated calibration bias (dTb) values in MODIS TIR bands 20–23, 29, and 31–33. The estimate is not given for other bands because the
RMS values of the uncertainties in the calibration accuracy estimate exceed 1%. The upper and lower boundaries of the boxes show the specified
calibration accuracies.
Z. Wan et al. / Remote Sensing of Environment 80 (2002) 497–515510
positive values of Tb difference in bands 20–23 in daytime
cases are not caused by the solar reflectance. We also
compared the nighttime case of June 23 even though there
is no in situ measurement for the lake surface temperature and
atmospheric profile because we found a subarea of 10� 16
pixels in the large portion of Lake Titicaca where the Tb value
in band 31 varies within ± 0.1 K in L1B data file MOD021-
KM.A2000175.0345.002.2001004203223.hdf. We used the
average Tb difference in band 31 given in Table 5 to infer
the lake surface kinetic temperature of this subarea through
the MODTRAN4.0 simulations based on the nighttime at-
mospheric profile measured 1 week earlier in our field cam-
paign. The important point we want tomake here is that the Tbdifference values in this nighttime case are very compatible to
the values for three daytime cases in Table 4. This will be one
more reason to support our conclusion: the positive values of
Tb difference in bands 20–23 are not caused by the solar
reflectance. The main reason for this conclusion is that lake
surface is almost flat in low wind speed conditions and the
MODIS instrument observed the location of interest far from
the specular reflecting direction of the sun in the three
daytime cases. There is another reason to support this
conclusion. If the solar reflectance made significant contri-
butions to the positive value Tb difference in bands 20–23,
the value in band 20 should be much larger than the values in
bands 22 and 23 as shown in Table 3 column 11 because of
stronger solar irradiance and stronger reflectance in band 20
(reflectance being 1 minus emissivity shown in Fig. 4).
As mentioned earlier, the error sources in the direct
comparisons of the MODIS Tb values to the calculated
values include the noisy detectors in bands 21 and 22, the
MODIS instrument NEDT, and the spatial variation in lake
surface temperatures, which is larger in the small portion of
Lake Titicaca. Sensitivity analysis shown in Table 3 indi-
cates that the changes on the measured atmospheric tem-
perature and water vapor profiles result in negligible or
small effects on the calculated radiances in bands 20–23,
29, and 31–33. Therefore, it is useful to make comparisons
in subareas of 10� 16 pixels where there was no in situ
measurement but MODIS brightness temperatures in band
31 vary within a few tenths degree Kelvin by using the
validated band 31 to determine lake surface temperatures.
We found such subareas in the large portion of Lake Titicaca
in cases of May 29 and June 13 and 15. The brightness
temperatures in band 31 vary within ± 0.13, 0.11, and 0.07 K
in these subareas, respectively. The comparison results are
given in Table 6. The values in columns 2–4 are copied
from Table 4, while the values of the Tb difference in
columns 5–7 are calculated from these three subareas. Note
that no value is given in band 33 for the May 29 case in
order to avoid the effect of a possible large temporal
variation in the atmospheric temperature and water vapor
profile because no profile was measured on May 29. If we
use these Tb difference values as estimated calibration bias
(dTb) in MODIS TIR bands, Fig. 9 shows the dTb values inthe six cases of daytime observations in Table 6 and the
nighttime case of June 23 (Table 5 column 13). Because
atmospheric profiles were measured by radiosonde balloons
on June 13 and 15, we should place more weights on the
two cases in subareas of 10� 16 pixels in these 2 days.
From these two cases, the averaged dTb value is 0.12 and
� 0.19 K in bands 31 and 32. It ranges from 0.4 to 0.6 K in
bands 20–23, representing a calibration bias of 2–3% in the
MODIS radiances according to Table 3 column 12.
We noticed that the averaged focal plane temperature was
higher than the normal operational value by 0.35–0.60 K in
the short-wave and mid-wave IR (SW/MWIR) focal plane
and by 0.07–0.32 K in the long-wave (LWIR) focal plane in
the period of our field campaign. The effect of changes in
the averaged focal plane temperature was considered in the
MODIS TIR calibration procedure. Any error in the coef-
ficient for the effect of averaged focal plane temperature
changes would result in a residual error in the calibration
procedure. In order to estimate this residual error, we
compared two nighttime cases through the same approach
with the atmospheric temperature and water vapor profile
measured on June 15, one on May 24 before the field
campaign, another on June 23 after the field campaign. In
the nighttime case of May 24, the average focal plane
temperature was at the normal operational value, 83.02 K,
in the LWIR focal plane and slightly higher than the normal
operational value by 0.27 K in the SW/MWIR focal plane.
From May 24 to June 23, the averaged focal plane temper-
ature at the time of MODIS nighttime overpass changed by
0.51 and 0.47 K in the SW/MWIR and LWIR focal planes,
respectively. The differences in the estimated calibration
bias in bands 20, 29, and 31–32 between these two cases
are less than 0.1 K. Therefore, we cannot simply attribute
the calibration bias to the change of focal plane temper-
atures. However, the effect of changes in focal plane
temperatures on the calibration of MODIS TIR bands needs
further investigations.
The MODIS sensor was reconfigured on October 31 and
November 1 to the B-side Science Mode from the A-side
Science Mode [see Terra (PFM) Instrument Status and Terra
MODIS History on webpage http://mcstweb.gsfc.nasa.gov/
Home.html]. It appears that optical cross-talk from bands 31
to 32–36 is reduced by a significant amount, and cross-talk
amongst bands 5–7 and 20–26 is also significantly reduced
by transition to latest focal plane bias voltage (see Level-1B
Code and Product Information on webpage http://
mcstweb.gsfc.nasa.gov/Home.html and Bruce Guenther,
2001, personal communication). Vicarious calibration field
campaigns are needed to provide quantitative estimates of
these improvements and to evaluate the consistency (at
different viewing angles and in different scenes) and
stability (over a long period of time) of the radiometric
accuracy of the MODIS TIR channels. Once the Aqua
(EOS-PM-1) satellite is launched in the near future, the
calibration accuracies of MODIS instruments aboard both
Terra and Aqua platforms as well as the Atmospheric IR
Sounder (AIRS) on the Aqua platform will be evaluated
Z. Wan et al. / Remote Sensing of Environment 80 (2002) 497–515 511
with in situ measurement data from vicarious calibration
field campaigns.
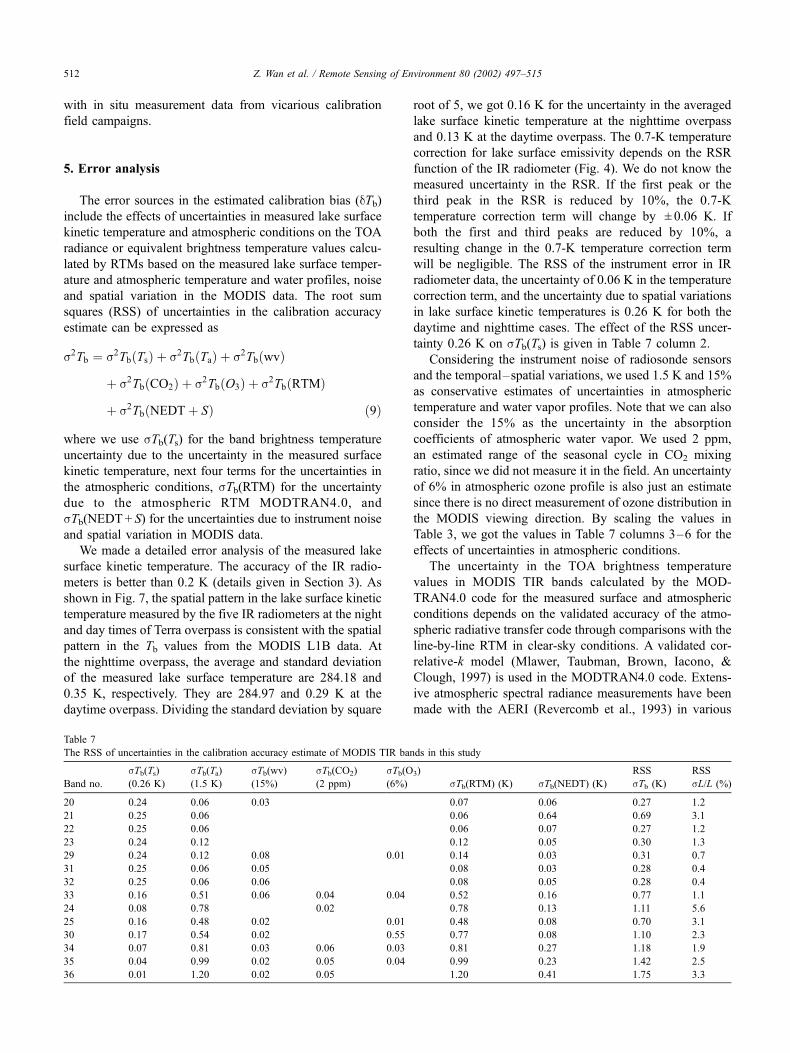
5. Error analysis
The error sources in the estimated calibration bias (dTb)include the effects of uncertainties in measured lake surface
kinetic temperature and atmospheric conditions on the TOA
radiance or equivalent brightness temperature values calcu-
lated by RTMs based on the measured lake surface temper-
ature and atmospheric temperature and water profiles, noise
and spatial variation in the MODIS data. The root sum
squares (RSS) of uncertainties in the calibration accuracy
estimate can be expressed as
s2Tb ¼ s2TbðTsÞ þ s2TbðTaÞ þ s2TbðwvÞ
þ s2TbðCO2Þ þ s2TbðO3Þ þ s2TbðRTMÞ
þ s2TbðNEDTþ SÞ ð9Þ
where we use sTb(Ts) for the band brightness temperature
uncertainty due to the uncertainty in the measured surface
kinetic temperature, next four terms for the uncertainties in
the atmospheric conditions, sTb(RTM) for the uncertainty
due to the atmospheric RTM MODTRAN4.0, and
sTb(NEDT+ S) for the uncertainties due to instrument noise
and spatial variation in MODIS data.
We made a detailed error analysis of the measured lake
surface kinetic temperature. The accuracy of the IR radio-
meters is better than 0.2 K (details given in Section 3). As
shown in Fig. 7, the spatial pattern in the lake surface kinetic
temperature measured by the five IR radiometers at the night
and day times of Terra overpass is consistent with the spatial
pattern in the Tb values from the MODIS L1B data. At
the nighttime overpass, the average and standard deviation
of the measured lake surface temperature are 284.18 and
0.35 K, respectively. They are 284.97 and 0.29 K at the
daytime overpass. Dividing the standard deviation by square
root of 5, we got 0.16 K for the uncertainty in the averaged
lake surface kinetic temperature at the nighttime overpass
and 0.13 K at the daytime overpass. The 0.7-K temperature
correction for lake surface emissivity depends on the RSR
function of the IR radiometer (Fig. 4). We do not know the
measured uncertainty in the RSR. If the first peak or the
third peak in the RSR is reduced by 10%, the 0.7-K
temperature correction term will change by ± 0.06 K. If
both the first and third peaks are reduced by 10%, a
resulting change in the 0.7-K temperature correction term
will be negligible. The RSS of the instrument error in IR
radiometer data, the uncertainty of 0.06 K in the temperature
correction term, and the uncertainty due to spatial variations
in lake surface kinetic temperatures is 0.26 K for both the
daytime and nighttime cases. The effect of the RSS uncer-
tainty 0.26 K on sTb(Ts) is given in Table 7 column 2.
Considering the instrument noise of radiosonde sensors
and the temporal–spatial variations, we used 1.5 K and 15%
as conservative estimates of uncertainties in atmospheric
temperature and water vapor profiles. Note that we can also
consider the 15% as the uncertainty in the absorption
coefficients of atmospheric water vapor. We used 2 ppm,
an estimated range of the seasonal cycle in CO2 mixing
ratio, since we did not measure it in the field. An uncertainty
of 6% in atmospheric ozone profile is also just an estimate
since there is no direct measurement of ozone distribution in
the MODIS viewing direction. By scaling the values in
Table 3, we got the values in Table 7 columns 3–6 for the
effects of uncertainties in atmospheric conditions.
The uncertainty in the TOA brightness temperature
values in MODIS TIR bands calculated by the MOD-
TRAN4.0 code for the measured surface and atmospheric
conditions depends on the validated accuracy of the atmo-
spheric radiative transfer code through comparisons with the
line-by-line RTM in clear-sky conditions. A validated cor-
relative-k model (Mlawer, Taubman, Brown, Iacono, &
Clough, 1997) is used in the MODTRAN4.0 code. Extens-
ive atmospheric spectral radiance measurements have been
made with the AERI (Revercomb et al., 1993) in various
Table 7
The RSS of uncertainties in the calibration accuracy estimate of MODIS TIR bands in this study
Band no.
sTb(Ts)(0.26 K)
sTb(Ta)(1.5 K)
sTb(wv)(15%)
sTb(CO2)
(2 ppm)
sTb(O3)
(6%) sTb(RTM) (K) sTb(NEDT) (K)RSS
sTb (K)RSS
sL/L (%)
20 0.24 0.06 0.03 0.07 0.06 0.27 1.2
21 0.25 0.06 0.06 0.64 0.69 3.1
22 0.25 0.06 0.06 0.07 0.27 1.2
23 0.24 0.12 0.12 0.05 0.30 1.3
29 0.24 0.12 0.08 0.01 0.14 0.03 0.31 0.7
31 0.25 0.06 0.05 0.08 0.03 0.28 0.4
32 0.25 0.06 0.06 0.08 0.05 0.28 0.4
33 0.16 0.51 0.06 0.04 0.04 0.52 0.16 0.77 1.1
24 0.08 0.78 0.02 0.78 0.13 1.11 5.6
25 0.16 0.48 0.02 0.01 0.48 0.08 0.70 3.1
30 0.17 0.54 0.02 0.55 0.77 0.08 1.10 2.3
34 0.07 0.81 0.03 0.06 0.03 0.81 0.27 1.18 1.9
35 0.04 0.99 0.02 0.05 0.04 0.99 0.23 1.42 2.5
36 0.01 1.20 0.02 0.05 1.20 0.41 1.75 3.3
Z. Wan et al. / Remote Sensing of Environment 80 (2002) 497–515512

sites of the Atmospheric Radiation Measurement (ARM)
program (Stokes & Schwartz, 1994). The validation activ-
ities for the line-by-line RTM model indicate that the
limiting error in these validations is due to the specification
of the water vapor profile (Mlawer et al., 1997) and that the
major contributions to the error are the uncertainties in the
temperature and water vapor profiles (Walden, Warren, &
Murcray, 1998). These conclusions indicate that sTb(RTM)
should be site dependent, i.e., the error in the atmospheric
radiative transfer simulations would be smaller in high-
altitude sites in dry seasons. Therefore, we used the RSS
of values in Table 7 columns 3–6 as the estimate of
sTb(RTM) in column 7. In this way, the effects of the
uncertainties in atmospheric conditions are considered twice
in Eq. (9). We think that this represents the worst scenario.
In other words, the actual sTb(RTM) value may be smaller.
The sTb(NEDT) values in column 8 are copied from
Table 3 column 9 that were estimated from real MODIS data
(Wan, in press). Based on the values in columns 2–8, Eq. (9)
gives sTb values in column 9 and corresponding relative
radiance errors in column 10.
In the point comparison between MODIS data and the
TOA brightness temperatures calculated from the measured
atmospheric profiles and lake surface kinetic temperatures in
the small portion of Lake Titicaca by the Village of Huata-
jata, we need to consider the uncertainty due to noise and the
spatial variation in MODIS data. The actual NEDT in a
single MODIS pixel may be two to three times the standard
deviation value listed in Table 7 and could be up to five times
the value in worst cases. Therefore, it is reasonable to assume
a NEDT value of 0.1–0.2 K for bands 20, 22–23, 29, and
31–32, even a larger value for other bands. However, the
effect of NEDT is much smaller in the cases of subareas of
10� 16 pixels (shown in column 13 of Table 5 and columns
5–7 in Table 6) because the MODIS Tb value was averaged
over 160 pixels. Because there was no radiosonde balloon
launched at these subareas, the effect of uncertainties in
atmospheric conditions may be larger. However, these cases
of subareas were selected only in calm clear-sky conditions.
We expect that the difference in atmospheric conditions over
the large and small portions of Lake Titicaca would be less
than 1.5 K in temperature profile and 15% in the low portion
of the water vapor profile. We confirmed this by comparing
the values between columns 3 and 6 and between columns 4
and 7 in Table 6, their differences all being less than the
values in Table 7 column 9. If the error in radiances
calculated by the MODTRAN4.0 code in dry atmospheric
conditions is much less than the values in column 7, we do
not need to consider the effects of uncertainties in atmo-
spheric conditions twice. Then, we can use the values in
column 7 as RSS sTb because both the sTb(Ts) and
sTb(NEDT) are much smaller. This means that the actual
RSS sTb may be smaller than the values in Table 7 column 9.
According to the RSS sTb values in Table 7 column 9, the 14
MODIS TIR bands (excluding the water vapor sounding
bands 27 and 28 that are too sensitive to the uncertainty in
measured water vapor profile) were listed in two groups. The
first group includes six bands in the atmospheric windows
(i.e., bands 20–23, 29, and 31–32) and band 33. The second
group includes five atmospheric temperature sounding bands
(i.e., bands 24–25 and 34–36) and the ozone band 30. We
can see that in the first group the RSS sTb values are smaller
or slightly larger than the dTb values for the specified
calibration accuracies given in Table 3 column 12. The
corresponding RSS of errors in the calibration accuracy
estimate is about 0.4% in bands 31 and 32, 0.7% in band
29, 3% in band 21, and slightly larger than 1% in bands 20,
22–23, and 33. However, the RSS sTb values in the second
group are much larger than the values that are required to
achieve the specified calibration accuracies. This means that
the radiosondes cannot provide accurate atmospheric tem-
perature and water vapor profiles to estimate the calibration
accuracies in the atmospheric sounding bands (bands 24–25,
27–28, and 34–36) at the specified 1% level and that the
calibration accuracy in the ozone band 30 cannot be esti-
mated without in situ measurements of ozone. In order to
estimate the calibration accuracy in these bands, it is neces-
sary to launch multiple radiosondes at more than one sites
and to measure the atmospheric radiation continuously at the
direction toward the MODIS instrument during the overpass
so that the temporal and spatial variations in atmospheric
temperature and water vapor profiles can be analyzed to
better estimate the actual uncertainties in the profiles.
As shown in Table 3, the difference of brightness temper-
atures in bands 31 and 32 is much less sensitive to the
variations in atmospheric conditions because of the dry
atmospheric condition. If we use the four cases of June 13
and 15 (columns 3–4 and 6–7 in Table 6) to estimate this
difference, it is 0.32 ± 0.06 K.
Because the polarization of thermal emittance from water
surface is zero at nadir direction and it increases with viewing
angle (Shaw, 1999), the calibration error caused by the
unpolarized scene assumption in the MODIS L1B processing
would also increase with viewing angle if it is a major error
source. In the six daytime cases and one nighttime case
shown in Fig. 9 (see Table 6 and column 13 in Table 5 for
details), the MODIS Earth view zenith angle (defined at the
surface) ranges from 53.5�, 49.8�, and 19.6� before the Earthnadir view to 27.6�, 34.3�, 48.1�, and 51.6� after the Earth
nadir view.We could not see obvious evidence of the viewing
angle dependence in the dTb values. Therefore, we could not
make a quantitative estimate of the polarization-related
calibration error. However, it appears that the dTb values inthese cases indicate that this polarization-related calibration
errors is not larger than 0.2 K in bands 29 and 31–32.We also
compared the MODIS TIR data over a subarea of 10� 16
pixels in the large portion of Lake Titicaca in the nighttime
overpass onMay 24with the calculated TOA radiances based
on the atmospheric temperature and water vapor profiles
measured on June 15. In that granule (A2000145.0330), the
viewing zenith angle was 1.2�. The dTb values in bands 20,
29, and 31–32 agree with the values shown in Fig. 9 within
Z. Wan et al. / Remote Sensing of Environment 80 (2002) 497–515 513
± 0.1 K, giving another evidence that the polarization-related
calibration error is small.
We understand that it has been an ongoing research
activity for a long time to accurately validate the absolute
accuracy of atmospheric RTMs such as MODTRAN and
line-by-line RTMs in the TIR region. As shown in the above
error analysis, the effect of uncertainties in the accuracy of
atmospheric RTMs on the estimate of calibration bias in the
eight MODIS TIR bands is small when using high-elevation
Lake Titicaca as a calibration site. Therefore, we can
estimate a calibration bias of 2–3% in MODIS bands 20,
22 and 23, with a RSS uncertainty not larger than 1.3%,
estimate the calibration accuracy in band 33 barely at the
specification, and estimate calibration accuracies in other
four bands better than the specifications.
6. Conclusion
The absolute radiometric accuracy of MODIS TIR chan-
nel data was evaluated with in situ measurement data
collected in Lake Titicaca, Bolivia during May and June
2000. Sensitivity and error analysis was made to study the
effects of uncertainties in measured surface temperatures and
atmospheric profiles. The absolute radiometric accuracies
specified for the MODIS bands above 3 mm are achieved or
nearly achieved in bands 21, 29, and 31–33. The radio-
metric calibration error is less than 0.4% in bands 31 and 32.
The calibration error in the high-temperature band 21 for fire
detection is less than 1 K at scene temperatures around 285 K
in most cases. Comparisons indicate a calibration bias of
2–3% in bands 20, 22, and 23. The sensitivity study and
error analysis show that the radiosondes cannot provide
accurate atmospheric temperature and water vapor profiles
to estimate the calibration accuracies in other bands at the
specified 1% level. The relative calibration accuracy
between the split-window bands 31 and 32 (i.e., the accu-
racy in the difference of brightness temperatures in these two
bands) was estimated as 0.32 ± 0.06 K, which is enough to
make a significant impact on the MODIS SST retrieval and a
moderate impact on the MODIS LST retrieval.
Acknowledgments
This work was supported by EOS Program contract
NAS5-31370 of the National Aeronautics and Space
Administration. The authors would like to thank Dr. Xingfa
Gu, INRA-Bioclimatology, France, Ms. Sophie Moreau,
National Coordinator of Bolivia Association of Remote
Sensing for the Environment (ABTEMA), Mr. Carlos Diaz,
National Director of the National Service of Meteorology
and Hydrology, Bolivia, and Dr. Bernard Pouyaud, Director
of the French Institute of Research for Development
(IRD), Bolivia, for their help in the preparation and
implementation of the field campaign conducted in Bolivia
in May/June 2000. The MODIS data were generated by the
Goddard DAAC and MODAPS under the support of
MODIS MCST and SDDT. We also used the EP/TOMS
total ozone image of 15 June 2000 from the NASA TOMS
webpage (http://toms.gsfc.nasa.gov). The authors would
like to thank the three anonymous reviewers for their
valuable detailed comments and suggestions, which helped
to improve the paper.
References
Barnes, W. L., Pagano, T. S., & Salomonson, V. V. (1998). Prelaunch
characteristics of the Moderate Resolution Imaging Spectroradiometer
(MODIS) on EOS-AM1. IEEE Transactions on Geoscience and Remote
Sensing, 36 (4), 1088–1100.
Berk, A., Anderson, G. P., Bernstein, L. S., Acharya, P. K., Dothe, H.,
Matthew, M. W., Adler-Golden, S. M., Chetwynd Jr., J. H., Richtmeier,
S. C., Pukall, B., Allred, C. L., Jeong, L. S., & Hoke, M. L. (1999).
MODTRAN4 radiative transfer modeling for atmospheric correction.
In: Optical spectroscopic techniques and instrumentation for atmos-
pheric and space research III, Proc. SPIE, Bellingham, Washington.
vol. 3756 (pp. 348–353).
Boehm, M. T., & Verlinde, J. (2000). Stratospheric influence on upper
tropospheric tropical cirrus. Geophysical Research Letters, 27 (19),
3209–3212.
Born, M., & Wolfe, E. (1980). Principles of optics (6th ed.). New York:
Pergamon.
Bruegge, C. J., Conel, J. E., Green, R. O., Margolis, J. S., Holm, R. G., &
Toon, G. (1992). Water vapor column abundance retrievals during FIFE.
Journal of Geophysical Research, 97 (D17), 18759–18768.
Chesters, D., & Neuendorffer, A. (1991). Comparison between TOMS,
TOVS and DOBSON observations: satellite and surface views of total
column ozone. Global and Planetary Changes, 90, 61–67.
Clough, S. E., Kneizys, F. X., Shettle, E. P., & Anderson, G. P. (1986).
Atmospheric radiance and transmission: FASCOD2. In: Proc. of the sixth
conference on atmospheric radiation, Williamsburg, VA (pp. 141–144).
Boston, MA: American Meteorological Society.
Esaias, W. E., Abbott, M. R., Barton, I., Brown, O. W., Campbell, J. W.,
Carder, K. L., Clark, D. K., Evans, R. L., Hoge, F. E., Gordon, H. R.,
Balch, W. P., Letelier, R., & Minnett, P. J. (1998). An overview of
MODIS capabilities for ocean science observations. IEEE Transactions
on Geoscience and Remote Sensing, 36 (4), 1250–1265.
Guenther, B., Godden, G. D., Xiong, X., Knight, E. J., Qiu, S.-Y., Mont-
gomery, H., Hopkins, M. M., Khayat, M. G., & Hao, Z. (1998). Prel-
aunch algorithm and data format for the level 1 calibration product for
the EOS-AM1 Moderate Resolution Imaging Spectroradiometer
(MODIS). IEEE Transactions on Geoscience and Remote Sensing, 36
(4), 1142–1151.
Hale, G. M., & Querry, M. R. (1973). Optical constants of water in the
200-nm to 200-mmwavelength region. Applied Optics, 12 (3), 555–641.
Justice, C. O., Vermote, E., Townshend, J. R. G., Defries, R., Roy, D. O.,
Hall, D. K., Salomonson, V. V., Privette, J. L., Riggs, G., Strahler,
A., Lucht, W., Myneni, R. B., Knyazikhin, K., Running, S. W., Ne-
mani, P. R., Wan, Z., Huete, A. R., van Leeuwen, W., Wolfe, R. E.,
Giglio, L., Muller, J.-P., Knyazikhin, Y., & Barnsley, M. J. (1998).
The Moderate Resolution Imaging Spectroradiometer (MODIS): land
remote sensing for global change research. IEEE Transactions on Geo-
science and Remote Sensing, 36, 1228–1249.
King, M. D., Herring, D. D., & Diner, D. J. (1995). The Earth Observing
System (EOS): a space-based program for assessing mankind’s impact
on the global environment. Optical Photometry News, 6, 34–39.
King, M. D., Kaufman, Y. J., Menzel, W. P., & Tanre, D. (1992). Remote
sensing of cloud, aerosol, and water vapor properties from the Moderate
Z. Wan et al. / Remote Sensing of Environment 80 (2002) 497–515514
Resolution Imaging Spectrometer (MODIS). IEEE Transactions on
Geoscience and Remote Sensing, 30 (1), 2–27.
King, M. D., Menzel, W. P., Grant, P. S., Myers, J. S., Arnold, G. T.,
Platnick, S. E., Gumley, L. E., Tsay, S. C., Moeller, C. C., Fitzgerald,
M., Brown, K. S., & Osterwisch, F. G. (1996). Airborne scanning
spectrometer for remote sensing of cloud, aerosol, water vapor and
surface properties. Journal of Atmospheric and Oceanic Technology,
13, 777–794.
Masuda, K., Takashima, T., & Yakayma, Y. (1988). Emissivity of pure and
sea waters for the model sea surface in the infrared window regions.
Remote Sensing of Environment, 24, 313–329.
McFarquhar, G. M., Heymsfield, A. J., Spenhirne, J., & Hart, B. (2000).
Thin and subvisual tropopause tropical cirrus: observation and radiative
impacts. Journal of Atmospheric Science, 29 (20), 1841–1853.
Miloshevich, L. M., Vomel, H., Paukknen, A., Heymsfield, A. J., & Olt-
mans, S. J. (2001). Characterization and correction of relative humidity
measurements from Vaisala RS80-A radiosondes at cold temperatures.
Journal of Atmospheric and Oceanic Technology, 18, 135–156.
Mlawer, E. J., Taubman, S. J., Brown, P. D., Iacono, M. J., & Clough, S. A.
(1997). Radiative transfer for inhomogeneous atmospheres: RRTM, a
validated correlated-k model for the longwave. Journal of Geophysical
Research, 102 (D14), 16663–16682.
Padilla, H. G., Leyva, A. C., & Mosino, P. A. (1993). An analysis of daily
humidity patterns at a mountainous and urban site in a tropical high-
altitude region. Journal of Applied Meteorology, 32, 1638–1646.
Revercomb, H. E., Best, F. A., Dedecker, R. G., Dirkx, T. P., Herbsleb,
R. A., Knuteson, R. O., Short, J. F., & Smith, W. L. (1993). Atmos-
pheric emitted radiance interferometer (AERI) for ARM. In: Fourth
symposium on global change studies, Am. Meteorol. Soc., Boston,
Mass. ( pp. 46–49).
Salomonson, V., Barnes, W., Maymon, P., Montgomery, H., & Ostrow, H.
(1989). MODIS: advanced facility instrument for studies of the Earth as
a system. IEEE Transactions on Geoscience and Remote Sensing, 27
(2), 145–153.
Shaw, J. A. (1999). Degree of linear polarization in spectral radiances
from water-viewing infrared radiometers. Applied Optics, 38 (15),
3157–3165.
Smith, W. L., Knuteson, R. O., Revercomb, H. E., Feltz, W., Howell, H. B.,
Menzel, W. P., Nalli, N. R., Brown, O., Brown, J., Minnett, P., &
Mckeown, W. (1996). Observations of the infrared radiative properties
of the ocean— implications for the measurement of sea surface temper-
ature via satellite remote sensing. Bulletin of the American Meteorolog-
ical Society, 77 (1), 41–51.
Snyder, W., Wan, Z., Zhang, Y., & Feng, Y.-Z. (1997). Requirements for
satellite land surface temperature validation using a silt playa. Remote
Sensing of Environment, 61 (2), 279–289.
Starr, D. O., & Cox, S. K. (1985). Cirrus clouds: part II. Numerical experi-
ments on the formation and maintenance of cirrus. Journal of Atmos-
pheric Science, 42 (23), 2682–2694.
Stokes, G. M., & Schwartz, S. E. (1994). The Atmospheric Radiation
Measurement (ARM) program: programmatic background and design
of the Cloud and Radiation Test Bed. Bulletin of the American Mete-
orological Society, 75, 1201–1221.
Walden, V. P., Warren, S. G., & Murcray, F. J. (1998). Measurements of the
downward longwave radiation spectrum over the Antarctic Plateau and
comparisons with a line-by-line radiative transfer model for clear skies.
Journal of Geophysical Research, 103 (D4), 3825–3846.
Wan, Z. (2002). Estimate of noise and systematic error in early thermal
infrared data of the Moderate Resolution Imaging Spectroradiometer
(MODIS). Remote Sensing of Environment, 80 (1), 47–54.
Wan, Z., & Dozier, J. (1996). A generalized split-window algorithm for
retrieving land-surface temperature from space. IEEE Transactions on
Geoscience and Remote Sensing, 34 (4), 892–905.
Wan, Z., & Li, Z.-L. (1997). A physics-based algorithm for retrieving land-
surface emissivity and temperature from EOS/MODIS data. IEEE
Transactions on Geoscience and Remote Sensing, 35 (4), 980–996.
Wan, Z., Zhang, Y., Ma, X., King, M. D., Myers, J. S., & Li, X. (1999).
Vicarious calibration of the Moderate-Resolution Imaging Spectroradi-
ometer Airborne Simulator thermal infrared channels. Applied Optics,
38 (20), 6294–6306.
Z. Wan et al. / Remote Sensing of Environment 80 (2002) 497–515 515
Copyright © 2022 FDOKUMEN