Prefrontal Dopamine D1 Receptors and Working Memory in Schizophrenia
Upload
independentCategory
view
0download
0
(This is a sample cover image for this issue. The actual cover is not yet available at this time.)
This article appeared in a journal published by Elsevier. The attachedcopy is furnished to the author for internal non-commercial researchand education use, including for instruction at the authors institution
and sharing with colleagues.
Other uses, including reproduction and distribution, or selling orlicensing copies, or posting to personal, institutional or third party
websites are prohibited.
In most cases authors are permitted to post their version of thearticle (e.g. in Word or Tex form) to their personal website orinstitutional repository. Authors requiring further information
regarding Elsevier’s archiving and manuscript policies areencouraged to visit:
http://www.elsevier.com/copyright
Author's personal copy
Prefrontal hyperactivity in older people during motor planning
Marika Berchicci a,⁎, Giuliana Lucci a, Caterina Pesce b, Donatella Spinelli a,c, Francesco Di Russo a,c
a Dept. of Education in Sports and Human Movement, University of Rome “Foro Italico”, Piazza Lauro de Bosis 15, 00135 Rome (RM), Italyb Dept. of Human Movement Sciences, University of Rome “Foro Italico”, Piazza Lauro de Bosis 15, 00135 Rome (RM), Italyc Neuropsychological Unit, Santa Lucia Foundation IRCCS, via Ardeatina 280, 00144 Rome (RM), Italy
a b s t r a c ta r t i c l e i n f o
Article history:Accepted 17 June 2012Available online 23 June 2012
Keywords:Middle-agedElderlyMRCPGo/No-GoFrontal hyperactivationExecutive function
The aim of this study was to assess the influence of age-related changes in cortical activity related to the motorpreparation involved in simple- and discriminative-reaction tasks. To distinguish between age effects on motorplanning and stimulus processing, both movement- and stimulus-locked event related potentials (ERPs) wereinvestigated in 14 younger, 14middle-aged, and 14 older adults (mean ages 24.4, 49, and 70 years, respectively).The novel results of the present study are the prefrontal over-recruitment observed in older adults inmovement-related cortical potentials (MRCPs) and the differential pattern of aging effects observed at behavioral and atelectrophysiological level between middle-aged and older adults. Overall, the following results were observed:(i) behavioral results confirmed the well-known slowing of responses in aging people, which were associatedwith optimal accuracy; (ii) the age-related differences in cortical activity underlying the generation of voluntarymovements in response to external stimuli were more pronounced for the motor planning than the stimulusprocessing stage; (iii) the source and the time-course analysis of the over-recruitment in the older adults indicat-ed tonic involvement of prefrontal areas regardless of task complexity; and (iv) middle-aged adults showed a‘young adult-like’ behavioral speed, but an ‘older adult-like’ overactivation of prefrontal areas. In summary, toreach the same accuracy, older subjects prepared the actionwith greater anticipation and higher cost, as indexedby the earlier latency onset and larger prefrontal cortical activation.
© 2012 Elsevier Inc. All rights reserved.
Introduction
Aging is associated with cognitive decline that disproportionally af-fects executive functions and can, in part, be explained by functional al-terations and changes in neuronal morphology (see Burke and Barnes,2006 for a review). Given these changes, particularly at the level ofthe prefrontal cortex, it is not surprising that performance on tasks re-quiring information processing declines with age, causing selective be-havioral impairments. Indeed, behavioral measures show a generalizeddelay in reaction time (RT), a slowing of movements and a loss of finemotor skills (see Seidler et al., 2010 for a review); these changes, inturn, reflect age-related modifications of the underlying brain systems.Compensatory processes such as neurogenesis, recruitment of frontalareas, distribution of information processing among different areas,and bilateralization can be observed in the elderly (see Park andReuter-Lorenz, 2009 for a review).
To evaluate how behavioral slowing is generated at the brain level,neuroimaging (particularly fMRI) studies have investigated the age-related changes in functional activation during sensorimotor and cogni-tive performance and have found greater involvement of the prefrontal
cortex (PFC) and dorsolateral frontal cortex (DLFC) in older comparedwith younger adults. Further, in contrast to young adults, older peopleshow activation of the PFC and DLFC not only in complex tasks but alsoin simple tasks (e.g., Di Girolamo et al., 2001; Heuninckx et al., 2008).This additional activation has been interpreted as a “compensatorymechanism” that older people apply to support successful performancedespite age-related declines (see Reuter-Lorenz, 2002 for a review).Older people may require more computational resources to achieveaccuracy levels similar to younger people and may also use additionalor alternative brain areas (Heuninckx et al., 2008). These adaptivemech-anisms can be considered to be in linewith brain plasticity and continualbrain reorganization (Ward, 2006), although these mechanisms can alsobe considered the expression of greater motivation and effort during thetask preparation (Falkenstein et al., 2006). Alternatively, the age-relatedoveractivation could reflect a decreased specialization or a non-selectiverecruitment of neural systems (i.e., dedifferentiation) that results in lessefficient performance rather than compensation or irrelevance to perfor-mance (for reviews, see Reuter-Lorenz, 2002; Heuninckx et al., 2008;Seidler et al., 2010).
Given the low temporal resolution of neuroimaging techniques,event-related potentials (ERPs) are more suitable for investigating thetiming of the neural activity underpinning motor and cognitive slowingin the elderly because ERPs allow for distinctions between the age-related changes that occur at different processing stages (i.e., perception,response selection and response generation; Kolev et al., 2006). The bulk
NeuroImage 62 (2012) 1750–1760
⁎ Corresponding author at: Dept. of Education forMotor Activity and Sports, Universityof Rome “Foro Italico”, Piazza Lauro de Bosis 15, 00135, Roma (RM), Italy. Fax:+39 06 36733 387.
E-mail address: [email protected] (M. Berchicci).
1053-8119/$ – see front matter © 2012 Elsevier Inc. All rights reserved.doi:10.1016/j.neuroimage.2012.06.031
Contents lists available at SciVerse ScienceDirect
NeuroImage
j ourna l homepage: www.e lsev ie r .com/ locate /yn img

Author's personal copy
of the ERP literature on aging generally shows that the slowing associat-edwith agingmight be due to delayed perceptual and cognitive process-es involved in stimulus identification and response selection in parietaland frontal brain areas (Anderer et al., 1996; Iragui et al., 1993; Labytet al., 2004; Vallesi et al., 2009; Vallesi, 2011; Wild-Wall et al., 2007;see also Rossini et al., 2007 for a review). In contrast to the aforemen-tioned studies that focus on brain responses to stimuli (stimulus-lockedERPs), little information is available on the contribution of motor pro-gramming (movement-locked ERPs) to age-related behavioral slowing.The few and not very recent ERP studies comparing the cortical activityinvolved in motor planning by means of movement-related cortical po-tentials (MRCPs) in young and elderly subjects yielded inconsistent re-sults. Indeed, MRCPs preceding voluntary movements in the elderly, ascompared to the MRCPs of younger individuals, have been reported tobe smaller in amplitude (Barrett et al., 1986), longer in latency(Ishizuka et al., 1996), or not different (Golob et al., 2005; Singh et al.,1990). More recent findings showed that the age-related RT slowing insensorimotor tasks might originate at the motor response generationstage (about 400 ms before the response) and be attributable to a puta-tive reduction in interhemispheric inhibition between themotor corticesvia the corpus callosum (Kolev et al., 2006; Naccarato et al., 2006). Trans-cranialmagnetic stimulation (TMS) studies showed that older adults dis-play less excitability of intracortical inhibitory circuits than young adults(Peinemann et al., 2001) and a reduction of motor evoked potential(MEP) amplitude (Pitcher et al., 2003) that may originate from centralor peripheral neural deficits (see Rossini et al., 2007 for a review). Fur-ther, some electrophysiological studies examining the lateralized readi-ness potential (LRP) have indicated that aging people exhibit slowermotor responses than younger adults because of a functional dys-regulation of executive control mechanisms involved in motor responsegeneration in the contralateral motor cortex, and this deficit becomesprogressively more evident with greater task complexity (Falkensteinet al., 2006; Yordanova et al., 2004). The latter effect is known as “thecomplexity effect”, which indicates that slowing is not constant acrosstasks but increases with task complexity (see Salthouse, 2000 for a re-view). Other studies have shown an increase of LRP amplitudes inolder, compared to younger, adults despite a lack of difference betweengroups in the onset of the LRPs (Roggeveen et al., 2007; Sterr andDean, 2008), supporting the idea that greater amplitudes might reflectmore inhibitory failures.
Thus far, there are no electrophysiological correlates of the age-related increases in prefrontal activity found in fMRI studies (Davis etal., 2008; Di Girolamo et al., 2001; Heuninckx et al., 2008; Park andReuter-Lorenz, 2009; Vallesi et al., 2010). This failure can be explainedby the type of tasks used in electrophysiological investigations, the ab-sence of recording electrodes at prefrontal locations (or neglect of thedata recorded at these sites) and the time window of interest.
In the present study, to assess age-related changes in cortical activity,we used a simple and a discriminative RT task (Go/No-Go). The discrim-inative RT task involves more complex stimulus–response mapping, de-cision making, response execution or inhibition, and ERPs associatedwith the discriminative task clearly show the involvement of the frontallobes (Di Russo et al., 2006). The questions addressedwere twofold. First,are there age effects on the activity of frontal areas that are related tostimulus processing and/or motor preparation? According to theaforementioned fMRI evidence, we hypothesized that the older brain ac-tivates more resources than the younger brain to fulfill task require-ments. The novelty of the present study is that, because of the hightemporal resolution of the ERP technique and the joint investigation ofbothmovement- and stimulus-locked ERPs,we could distinguish the rel-ative contribution of motor preparation and stimulus processing to thepattern of age-related changes. Second, are age effects modulated bytask complexity? According to the “complexity effect”, the differencesbetween younger and older subjects in behavioral performance(Salthouse, 2000) and its underlying neural mechanisms (Falkensteinet al., 2006; Yordanova et al., 2004) should be maximized by the more
complex task. To better understand the aging trend, we did not limitthe present investigation to the comparison of younger vs. older adultsbut considered three age classes across the adult lifespan: the twenties,the fifties and the seventies.
Material and methods
Participants
A total of 42 participants volunteered. They were equally distributedacross the following three adult age classes: younger (n=14, fivefemales, mean age 23.4 years, SD=3.2), middle-aged (n=14, threefemales, mean age 49.0 years, SD=2.2), and older adults (n=14, tenfemales, mean age 70.0 years, SD=7.0). All participants were healthyand without a history of neurological, psychiatric, or chronic somaticproblems. The participants were taking nomedication during the exper-imental sessions and had normal or corrected-to-normal vision. All par-ticipants were fully right-handed (Edinburgh handedness inventory;Oldfield, 1971). The older groups were recruited among friends of theauthors and were employed in a wide range of professional activities(e.g., lawyer, medical doctor, technician, businessman, engineer). Theyounger group was recruited from the local (Roman) student popula-tion. Education levels were similar in the two older groups (years ofstudy: 16.2±2.1 years for the middle-aged group and 16.0±2.9 yearsfor the older group), and slightly lower for the young group (14.9±1.6 years). Consent was obtained from all participants according to theDeclaration of Helsinki after approval by the local ethical committee.
For the analysis of movement-locked ERPs, the data of all 42 partic-ipants were used. Because of the high number of artifacts in the EEG forstimulus-locked ERPs, the data from 6 participants were discarded, anda total of 36 participants were divided into the three age groups: youn-ger (n=12, four females, mean age 24 years, SD=2.6), middle-aged(n=12, three females, mean age 49 years, SD=2.4), and older adults(n=12, eight females, mean age 70 years, SD=7.2).
Materials and task
Participants were tested individually in a sound-attenuated, dimlylit room after a 64-channel EEG cap was mounted on their scalp. Par-ticipants were seated comfortably in an armchair with their left armrelaxed and their moving (i.e., right) arm positioned palm down ona push button board so that the fingers could move freely. Visualstimuli were presented through a computer display at a distance of114 cm. The fixation point was a yellow circle (0.15×0.15°of visualangle) in the center of the computer monitor. Squared configurationsmade by vertical and horizontal bars subtending 4×4° were pres-ented for 260 ms on a dark gray background (Fig. 1). The four config-urations were displayed randomly with equal probability (p=0.25);Stimulus-onset asynchrony varied from 1000 to 2000 ms to avoidtime prediction effects on the RTs.
In separate runs, the participants performed two tasks: a simpleresponse task (SRT) and a discriminative response task (DRT). Theorder of the tasks was counterbalanced across participants. In theSRT, the participants had to press a button with their right hand asquickly as possible when any of the four configurations appeared onthe screen (Go stimuli; p=1). In the DRT, two configurations weredefined as targets, and two configurations were defined as non-targets. The participants had to press a button with their right handwhen a target appeared on the screen (Go stimuli; p=0.5) and with-hold the response when a non-target appeared (No-Go stimuli;p=0.5). The order of presentation was randomized within blocks.The duration of each run was 2 min with a pause interleaved (totalduration of about 30 min). Five runs of SRT and ten runs of DRTallowed us to obtain 500 trials for each task.
1751M. Berchicci et al. / NeuroImage 62 (2012) 1750–1760

Author's personal copy
Analysis of behavioral data
Median RTs for correct trials were calculated and submitted to a3×2 mixed analysis of variance (ANOVA) design with Age (youngervs. middle-aged vs. older) as a between-subjects factor and Task (SRTvs. DRT) as a within-subjects factor. Median RTs were used because ofthe disproportional contribution of outliers, which are more frequentin older than younger adults, on mean RTs. Moreover, RT distributionsare usually positively skewed, and the median is the appropriate mea-sure under such conditions as long as RT differences, not absolute RTs,are relevant.To evaluate the stability of individual performances, theintra-individual RT variability was obtained using the intra-individualcoefficient of variation (ICV) [ICV=standard deviation of RT/mean ofRT] calculated for each subject within each task. Accuracy was mea-sured by the percentage of omissions (i.e., missed response), anticipa-tions (i.e., responses shorter than 150 ms or longer than 1000 ms,respectively), and false alarms (i.e., responses to No-Go stimuli inDRT). RTs, ICVs, omissions, and anticipations were submitted to arepeated-measures 3×2 ANOVA design with Age (younger vs.middle-aged vs. older) as a between-subjects factor and Task (SRT vs.DRT) as a within-subjects factor. False alarms were submitted to aone-way ANOVA with Age as a between-subjects factor. Post-hoc com-parisonswere conducted using the Tukey's honest significant difference(HSD) test. The overall alpha level was fixed at 0.05 after the Geisser–Greenhouse correction.
Electrophysiological recording and ERP computation
EEGs were recorded using the BrainVisionTM system (BrainProductsGmbH, Munich, Germany) using 64 sensors mounted according to the10–10 International System that were initially referenced to the leftmastoid. EEGs were digitized at 250 Hz, amplified (bandpass of 0.01–80 Hz including a 50 Hz notch filter) and stored for off-line averaging.For more details, see Appendix A (Supplementary Material 1.1).
For stimulus-locked ERPs, epochs starting 100 ms prior to stimulusonset and lasting 1100ms were averaged. To further reduce high- andlow-frequency noise, the group-averaged ERPs were band-pass filtered(0.1–30 Hz) and sorted into two categories: 1) ERPs for the go stimuli inthe SRT and 2) ERPs for the go stimuli in the DRT. The first trial of eachblock and trials with RTs outside 150–1000 ms were discarded fromfurther analysis. Peak amplitudes (measured with respect to the100 ms pre-stimulus baseline) and latencies of the major ERP compo-nents were calculated for each subject in the following standard time
windows: P1: 80–150 ms; N1: 130–200 ms; P2: 180–300 ms; and P3:250–700 ms. The N2 (180–300 ms) component was not considered be-cause it was not evident in the studied waveforms. This component isusually clear in no-go conditions that require the participant to refrainfrom responding to the appearance of a non-target (Smith et al.,2010). The identification of components was also guided by their polar-ity and topography as previously described (Di Russo and Spinelli,2010; Di Russo et al., 2006, 2010). The selection of electrodes used forthe analyses was based on the greatest activity for a given componentat the group level, and the selection of different scalp sites for the P3in different RT tasks was also based on the topographic distributionreported in the literature (Polich, 2007) (i.e., the P1 and P2 on PO7 orPO8, the N1 on O1 or O2, the P3 in SRT on Pz and the P3 in the DRT atCz).
For movement-locked ERPs (MRCPs), conditions (i.e., SRT and DRT)were separately segmented and averaged into non-overlapping epochsof 2000 ms (1500 ms before to 500 ms after the movement onset). Thebaseline was defined by themean voltage over the initial 300 ms of theaveraged epochs. To further reduce high frequency noise, the group-averaged MRCPs were low-pass filtered (i.e., Butterworth) at 15 Hz.MRCP onset latency was calculated as the first deflection larger thantwice the absolute value of the baseline mean. The amplitude of theBP was measured as the mean amplitude between 900 and 600 ms be-fore the movement in the AFz and Cz electrodes. The aforementionedtime window was selected for statistical analysis because it is knownto reflect BP activity (e.g., Shibasaki and Hallett, 2006) and it is not con-taminated by stimulus-related artifacts. The selection of the electrodeswas based on the scalp topography, which allowed us to identify theelectrodes where the signal was maximal.
Statistical analysis
The data for the P1, N1 and P3 were submitted to separate mixedmodel ANOVAs with Age (younger vs. middle-aged vs. older) as abetween-subjects factor and Task (SRT vs. DRT) as a within-subjectsfactor. As the P2 was present in the SRT only, it was submitted to aone-way ANOVA with Age as a between-subjects factor. The sameANOVAmodel was applied to the latency and amplitude of the BP iden-tified in the MRCPs. Analyses performed on the other MRCP compo-nents (pre-movement positivity and post-movement activity) arereported in Supplementary material 1.2. Post-hoc comparisons wereconducted using Tukey's HSD test. The overall alpha level was fixed at0.05 after the Geisser–Greenhouse correction.
Fig. 1. Schematic illustration of the sequence of stimuli in the Go/No-Go paradigm employed in the present experiment.
1752 M. Berchicci et al. / NeuroImage 62 (2012) 1750–1760
Author's personal copy
Furthermore, given the well-known age-related behavioral slowing(indexed by RTs; i.e., Vallesi et al., 2009) and the slowing of the cogni-tive processing required by the task (indexed by its electrophysiologicalmarker, the P3 peak latency; i.e., Roggeveen et al., 2007), we exploredthe relationship between those variables and the BP peak latency,whichwe considered a sensitive index of executive functions. Thus, cor-relations (Pearson's r coefficients) were computed, separately for theSRT and the DRT tasks, between age and RT and between RT and P3and BP latencies, with particular focus on the older group. The alphalevel was fixed at pb0.05 (two-tailed).
Source analysis
Estimation of dipolar sources of the MRCPs was carried out usingBESA ver. 5.1.8 (MEGIS Software GmbH, Gräfelfing, Germany), whichcalculated the cerebral areas involved in cortical motor preparation.The employed spatio-temporal dipole analysis of BESA estimates the lo-cation, orientation and time course of multiple equivalent dipolarsources by calculating the scalp distribution, which is obtained for anygiven source model (forward solution). This distribution was then com-pared with actual MRCPs. Interactive changes in the location and orien-tation of dipole sources led to the minimization of residual variance(RV) between the model and the observed spatio-temporal distributionof MRCPs. The goodness of the fit of the dipole model was evaluated bymeasuring its RV as a percentage of the signal variance, as described bythe model, and applying residual orthogonality tests (ROT; e.g., Bockeret al., 1994). The resulting individual time series for the dipole moments(the sourcewaves) can also be submitted to an orthogonality test, whichwe refer to as a sourcewave orthogonality test (SOT; Bocker et al., 1994).All t-statistics were evaluated for significance at the 5% level. The posi-tions of the electrodes were digitized and averaged across subjects. The3-D coordinates for each dipole of the BESA model were determinedwith respect to the Talairach axes and scaled according to brain size. Inthese calculations, BESA utilized a realistic approximation of the head(which was based on MRIs of 24 subjects), and the radius was obtainedfrom the group average (86 mm). To limit the number of parameters tobe estimated, symmetry constraints were applied for each bilateral di-pole pair in the scalp distributions that indicated bilateral foci. The possi-bility that dipoleswould interactwas reduced by selecting solutionswithrelatively low dipole moments with the aid of an “energy” constraint(which was weighed at 20% in the compound cost function as opposedto 80% for the RV). The optimal set of parameters was identified in an it-erative manner by searching for a minimum in the compound cost func-tion. Dipoles were fitted sequentially. Latency ranges for fitting werechosen to minimize overlap among successive, topographically distinctcomponents. To minimize cross-talk and interactions between sources,dipoles that accounted for earlier portions of the waveform were left inplace as additional dipoles were added.
Results
Behavioral data
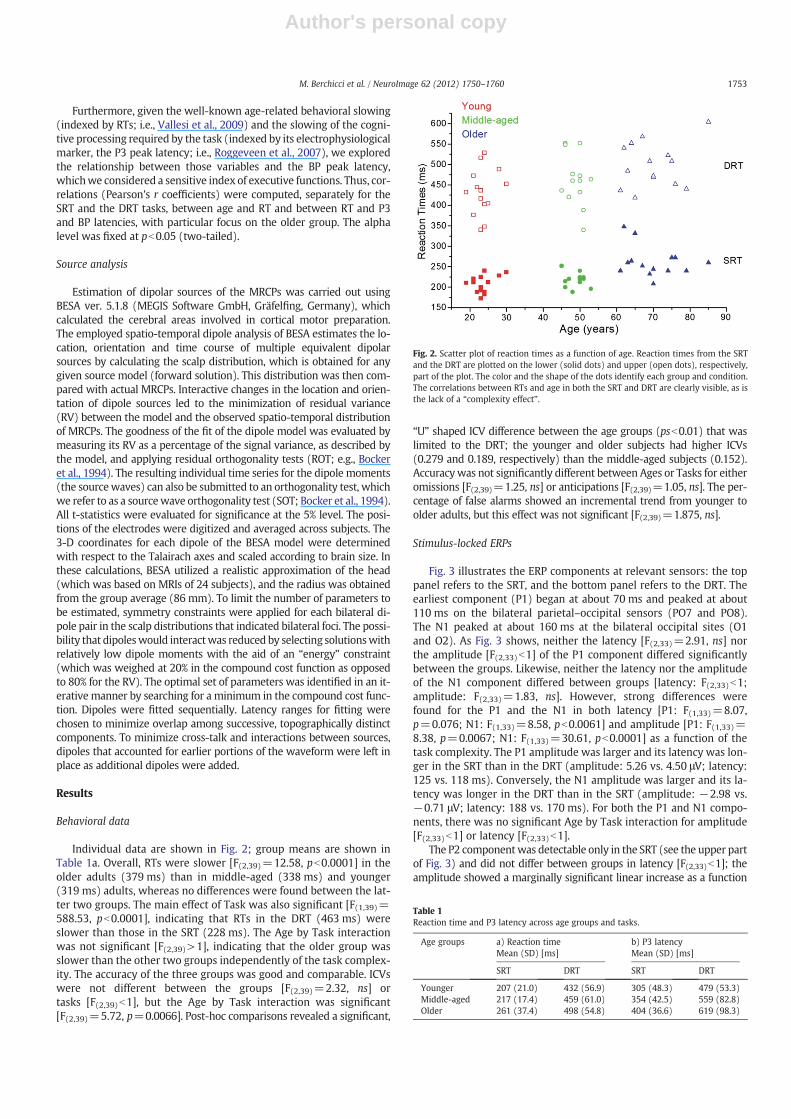
Individual data are shown in Fig. 2; group means are shown inTable 1a. Overall, RTs were slower [F(2,39)=12.58, pb0.0001] in theolder adults (379 ms) than in middle-aged (338 ms) and younger(319 ms) adults, whereas no differences were found between the lat-ter two groups. The main effect of Task was also significant [F(1,39)=588.53, pb0.0001], indicating that RTs in the DRT (463 ms) wereslower than those in the SRT (228 ms). The Age by Task interactionwas not significant [F(2,39)>1], indicating that the older group wasslower than the other two groups independently of the task complex-ity. The accuracy of the three groups was good and comparable. ICVswere not different between the groups [F(2,39)=2.32, ns] ortasks [F(2,39)b1], but the Age by Task interaction was significant[F(2,39)=5.72, p=0.0066]. Post-hoc comparisons revealed a significant,
“U” shaped ICV difference between the age groups (psb0.01) that waslimited to the DRT; the younger and older subjects had higher ICVs(0.279 and 0.189, respectively) than the middle-aged subjects (0.152).Accuracywas not significantly different between Ages or Tasks for eitheromissions [F(2,39)=1.25, ns] or anticipations [F(2,39)=1.05, ns]. The per-centage of false alarms showed an incremental trend from younger toolder adults, but this effect was not significant [F(2,39)=1.875, ns].
Stimulus-locked ERPs
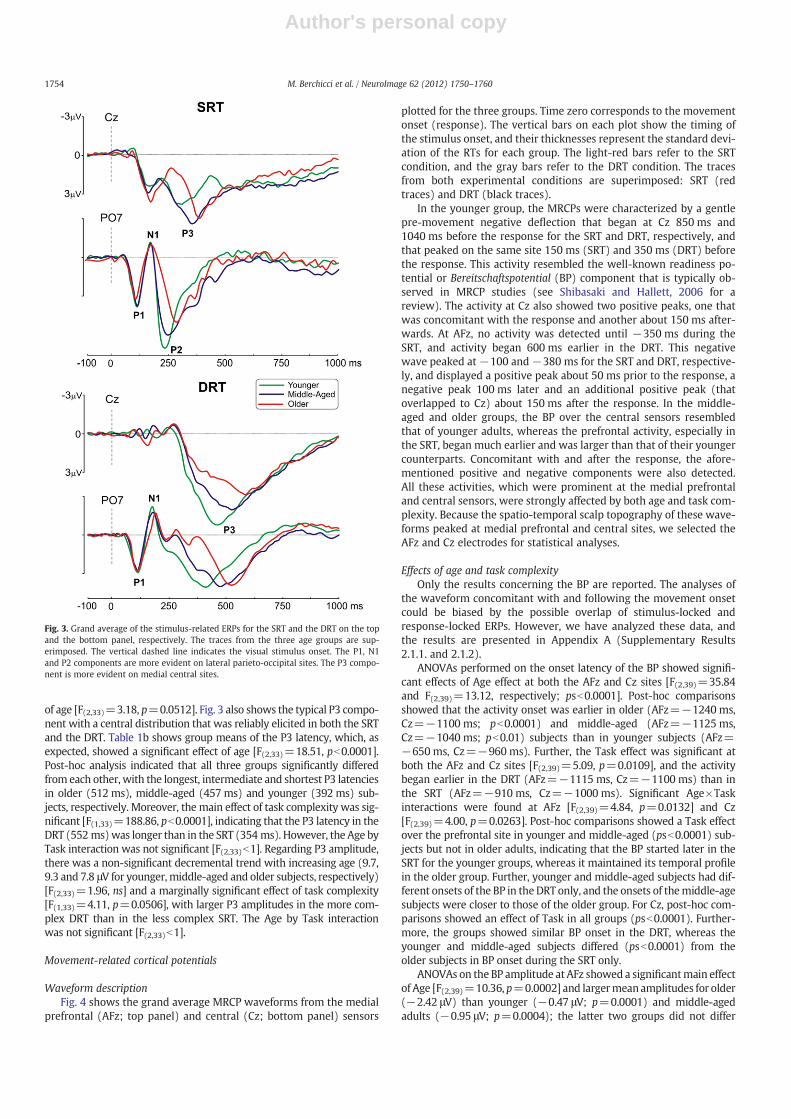
Fig. 3 illustrates the ERP components at relevant sensors: the toppanel refers to the SRT, and the bottom panel refers to the DRT. Theearliest component (P1) began at about 70 ms and peaked at about110 ms on the bilateral parietal–occipital sensors (PO7 and PO8).The N1 peaked at about 160 ms at the bilateral occipital sites (O1and O2). As Fig. 3 shows, neither the latency [F(2,33)=2.91, ns] northe amplitude [F(2,33)b1] of the P1 component differed significantlybetween the groups. Likewise, neither the latency nor the amplitudeof the N1 component differed between groups [latency: F(2,33)b1;amplitude: F(2,33)=1.83, ns]. However, strong differences werefound for the P1 and the N1 in both latency [P1: F(1,33)=8.07,p=0.076; N1: F(1,33)=8.58, pb0.0061] and amplitude [P1: F(1,33)=8.38, p=0.0067; N1: F(1,33)=30.61, pb0.0001] as a function of thetask complexity. The P1 amplitude was larger and its latency was lon-ger in the SRT than in the DRT (amplitude: 5.26 vs. 4.50 μV; latency:125 vs. 118 ms). Conversely, the N1 amplitude was larger and its la-tency was longer in the DRT than in the SRT (amplitude: −2.98 vs.−0.71 μV; latency: 188 vs. 170 ms). For both the P1 and N1 compo-nents, there was no significant Age by Task interaction for amplitude[F(2,33)b1] or latency [F(2,33)b1].
The P2 componentwas detectable only in the SRT (see the upper partof Fig. 3) and did not differ between groups in latency [F(2,33)b1]; theamplitude showed a marginally significant linear increase as a function
Fig. 2. Scatter plot of reaction times as a function of age. Reaction times from the SRTand the DRT are plotted on the lower (solid dots) and upper (open dots), respectively,part of the plot. The color and the shape of the dots identify each group and condition.The correlations between RTs and age in both the SRT and DRT are clearly visible, as isthe lack of a “complexity effect”.
Table 1Reaction time and P3 latency across age groups and tasks.
Age groups a) Reaction timeMean (SD) [ms]
b) P3 latencyMean (SD) [ms]
SRT DRT SRT DRT
Younger 207 (21.0) 432 (56.9) 305 (48.3) 479 (53.3)Middle-aged 217 (17.4) 459 (61.0) 354 (42.5) 559 (82.8)Older 261 (37.4) 498 (54.8) 404 (36.6) 619 (98.3)
1753M. Berchicci et al. / NeuroImage 62 (2012) 1750–1760
Author's personal copy
of age [F(2,33)=3.18, p=0.0512]. Fig. 3 also shows the typical P3 compo-nent with a central distribution that was reliably elicited in both the SRTand the DRT. Table 1b shows group means of the P3 latency, which, asexpected, showed a significant effect of age [F(2,33)=18.51, pb0.0001].Post-hoc analysis indicated that all three groups significantly differedfrom each other, with the longest, intermediate and shortest P3 latenciesin older (512 ms), middle-aged (457 ms) and younger (392 ms) sub-jects, respectively. Moreover, the main effect of task complexity was sig-nificant [F(1,33)=188.86, pb0.0001], indicating that the P3 latency in theDRT (552 ms)was longer than in the SRT (354 ms). However, the Age byTask interaction was not significant [F(2,33)b1]. Regarding P3 amplitude,there was a non-significant decremental trend with increasing age (9.7,9.3 and 7.8 μV for younger, middle-aged and older subjects, respectively)[F(2,33)=1.96, ns] and a marginally significant effect of task complexity[F(1,33)=4.11, p=0.0506], with larger P3 amplitudes in the more com-plex DRT than in the less complex SRT. The Age by Task interactionwas not significant [F(2,33)b1].
Movement-related cortical potentials
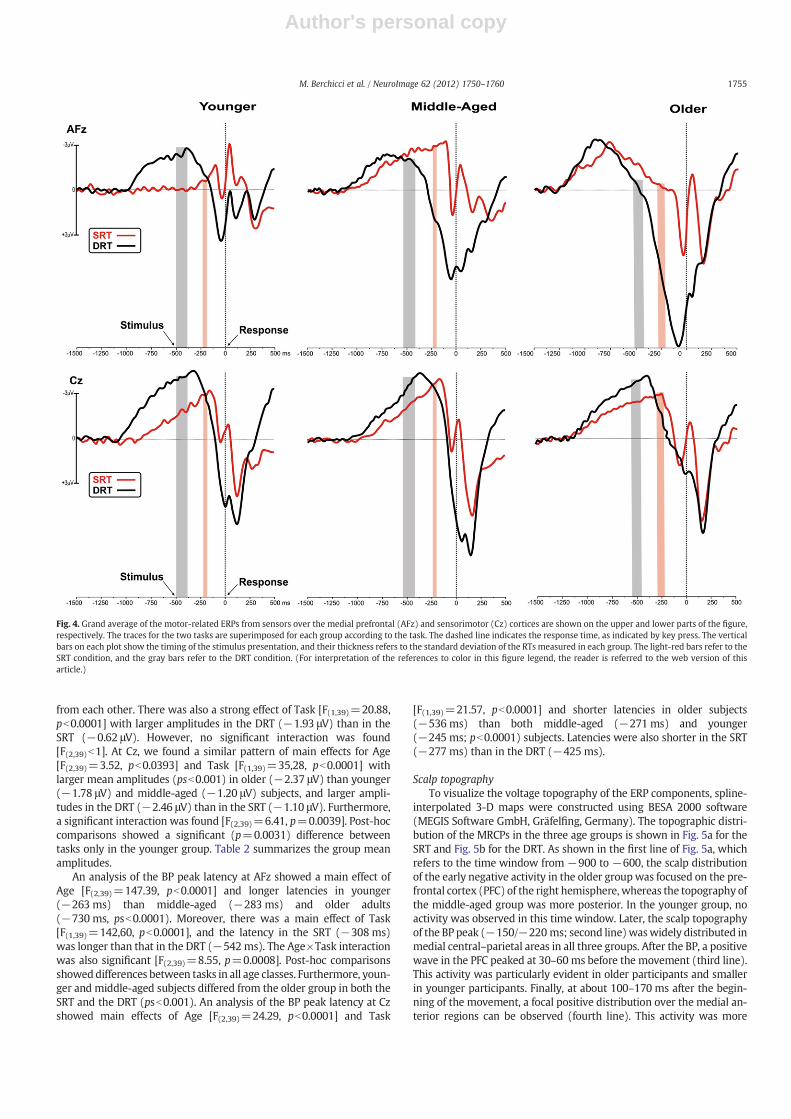
Waveform descriptionFig. 4 shows the grand average MRCP waveforms from the medial
prefrontal (AFz; top panel) and central (Cz; bottom panel) sensors
plotted for the three groups. Time zero corresponds to the movementonset (response). The vertical bars on each plot show the timing ofthe stimulus onset, and their thicknesses represent the standard devi-ation of the RTs for each group. The light-red bars refer to the SRTcondition, and the gray bars refer to the DRT condition. The tracesfrom both experimental conditions are superimposed: SRT (redtraces) and DRT (black traces).
In the younger group, the MRCPs were characterized by a gentlepre-movement negative deflection that began at Cz 850 ms and1040 ms before the response for the SRT and DRT, respectively, andthat peaked on the same site 150 ms (SRT) and 350 ms (DRT) beforethe response. This activity resembled the well-known readiness po-tential or Bereitschaftspotential (BP) component that is typically ob-served in MRCP studies (see Shibasaki and Hallett, 2006 for areview). The activity at Cz also showed two positive peaks, one thatwas concomitant with the response and another about 150 ms after-wards. At AFz, no activity was detected until −350 ms during theSRT, and activity began 600 ms earlier in the DRT. This negativewave peaked at −100 and−380 ms for the SRT and DRT, respective-ly, and displayed a positive peak about 50 ms prior to the response, anegative peak 100 ms later and an additional positive peak (thatoverlapped to Cz) about 150 ms after the response. In the middle-aged and older groups, the BP over the central sensors resembledthat of younger adults, whereas the prefrontal activity, especially inthe SRT, began much earlier and was larger than that of their youngercounterparts. Concomitant with and after the response, the afore-mentioned positive and negative components were also detected.All these activities, which were prominent at the medial prefrontaland central sensors, were strongly affected by both age and task com-plexity. Because the spatio-temporal scalp topography of these wave-forms peaked at medial prefrontal and central sites, we selected theAFz and Cz electrodes for statistical analyses.
Effects of age and task complexityOnly the results concerning the BP are reported. The analyses of
the waveform concomitant with and following the movement onsetcould be biased by the possible overlap of stimulus-locked andresponse-locked ERPs. However, we have analyzed these data, andthe results are presented in Appendix A (Supplementary Results2.1.1. and 2.1.2).
ANOVAs performed on the onset latency of the BP showed signifi-cant effects of Age effect at both the AFz and Cz sites [F(2,39)=35.84and F(2,39)=13.12, respectively; psb0.0001]. Post-hoc comparisonsshowed that the activity onset was earlier in older (AFz=−1240 ms,Cz=−1100 ms; pb0.0001) and middle-aged (AFz=−1125 ms,Cz=−1040 ms; pb0.01) subjects than in younger subjects (AFz=−650 ms, Cz=−960 ms). Further, the Task effect was significant atboth the AFz and Cz sites [F(2,39)=5.09, p=0.0109], and the activitybegan earlier in the DRT (AFz=−1115 ms, Cz=−1100 ms) than inthe SRT (AFz=−910 ms, Cz=−1000 ms). Significant Age×Taskinteractions were found at AFz [F(2,39)=4.84, p=0.0132] and Cz[F(2,39)=4.00, p=0.0263]. Post-hoc comparisons showed a Task effectover the prefrontal site in younger and middle-aged (psb0.0001) sub-jects but not in older adults, indicating that the BP started later in theSRT for the younger groups, whereas it maintained its temporal profilein the older group. Further, younger and middle-aged subjects had dif-ferent onsets of the BP in the DRT only, and the onsets of themiddle-agesubjects were closer to those of the older group. For Cz, post-hoc com-parisons showed an effect of Task in all groups (psb0.0001). Further-more, the groups showed similar BP onset in the DRT, whereas theyounger and middle-aged subjects differed (psb0.0001) from theolder subjects in BP onset during the SRT only.
ANOVAs on the BP amplitude at AFz showed a significantmain effectof Age [F(2,39)=10.36, p=0.0002] and largermeanamplitudes for older(−2.42 μV) than younger (−0.47 μV; p=0.0001) and middle-agedadults (−0.95 μV; p=0.0004); the latter two groups did not differ
Fig. 3. Grand average of the stimulus-related ERPs for the SRT and the DRT on the topand the bottom panel, respectively. The traces from the three age groups are sup-erimposed. The vertical dashed line indicates the visual stimulus onset. The P1, N1and P2 components are more evident on lateral parieto-occipital sites. The P3 compo-nent is more evident on medial central sites.
1754 M. Berchicci et al. / NeuroImage 62 (2012) 1750–1760
Author's personal copy
from each other. There was also a strong effect of Task [F(1,39)=20.88,pb0.0001] with larger amplitudes in the DRT (−1.93 μV) than in theSRT (−0.62 μV). However, no significant interaction was found[F(2,39)b1]. At Cz, we found a similar pattern of main effects for Age[F(2,39)=3.52, pb0.0393] and Task [F(1,39)=35,28, pb0.0001] withlarger mean amplitudes (psb0.001) in older (−2.37 μV) than younger(−1.78 μV) and middle-aged (−1.20 μV) subjects, and larger ampli-tudes in the DRT (−2.46 μV) than in the SRT (−1.10 μV). Furthermore,a significant interaction was found [F(2,39)=6.41, p=0.0039]. Post-hoccomparisons showed a significant (p=0.0031) difference betweentasks only in the younger group. Table 2 summarizes the group meanamplitudes.
An analysis of the BP peak latency at AFz showed a main effect ofAge [F(2,39)=147.39, pb0.0001] and longer latencies in younger(−263 ms) than middle-aged (−283 ms) and older adults(−730 ms, psb0.0001). Moreover, there was a main effect of Task[F(1,39)=142,60, pb0.0001], and the latency in the SRT (−308 ms)was longer than that in the DRT (−542 ms). The Age×Task interactionwas also significant [F(2,39)=8.55, p=0.0008]. Post-hoc comparisonsshoweddifferences between tasks in all age classes. Furthermore, youn-ger and middle-aged subjects differed from the older group in both theSRT and the DRT (psb0.001). An analysis of the BP peak latency at Czshowed main effects of Age [F(2,39)=24.29, pb0.0001] and Task
[F(1,39)=21.57, pb0.0001] and shorter latencies in older subjects(−536 ms) than both middle-aged (−271 ms) and younger(−245 ms; pb0.0001) subjects. Latencies were also shorter in the SRT(−277 ms) than in the DRT (−425 ms).
Scalp topographyTo visualize the voltage topography of the ERP components, spline-
interpolated 3-D maps were constructed using BESA 2000 software(MEGIS Software GmbH, Gräfelfing, Germany). The topographic distri-bution of the MRCPs in the three age groups is shown in Fig. 5a for theSRT and Fig. 5b for the DRT. As shown in the first line of Fig. 5a, whichrefers to the time window from −900 to −600, the scalp distributionof the early negative activity in the older groupwas focused on the pre-frontal cortex (PFC) of the right hemisphere, whereas the topography ofthe middle-aged group was more posterior. In the younger group, noactivity was observed in this time window. Later, the scalp topographyof the BP peak (−150/−220 ms; second line)waswidely distributed inmedial central–parietal areas in all three groups. After the BP, a positivewave in the PFC peaked at 30–60 ms before the movement (third line).This activity was particularly evident in older participants and smallerin younger participants. Finally, at about 100–170 ms after the begin-ning of the movement, a focal positive distribution over the medial an-terior regions can be observed (fourth line). This activity was more
Fig. 4. Grand average of the motor-related ERPs from sensors over the medial prefrontal (AFz) and sensorimotor (Cz) cortices are shown on the upper and lower parts of the figure,respectively. The traces for the two tasks are superimposed for each group according to the task. The dashed line indicates the response time, as indicated by key press. The verticalbars on each plot show the timing of the stimulus presentation, and their thickness refers to the standard deviation of the RTs measured in each group. The light-red bars refer to theSRT condition, and the gray bars refer to the DRT condition. (For interpretation of the references to color in this figure legend, the reader is referred to the web version of thisarticle.)
1755M. Berchicci et al. / NeuroImage 62 (2012) 1750–1760

Author's personal copy
posterior in younger andmiddle-aged (peaking at Cz) participants, andit was more anterior and showed two foci of activity over both medialfrontal and prefrontal regions in older participants.
Fig. 5b shows the scalp topography in the DRT. The older partici-pants showed a large negative activity focused on the right medialPFC at the beginning of the averaged epochs (−900/−600 ms; firstline). This activity was less pronounced in the middle-aged group andabsent in the younger group. Later, the BP scalp topography peaked inmedial central–parietal areas in all three groups (between −350 and−400 ms; second line). Right before the movement onset (between−45 and −80ms; third line), the topography changed polarity andshowed a positive activity in medial prefrontal regions; this positive ac-tivity was strongest in older groups and more posterior in the youngergroup. Similar to the SRT, a positive distribution was focused over thecentral-frontal regions in all groups (100–170 ms, fourth line). At the
same latency, another positive focus of activity was present over thePFC in older participants only.
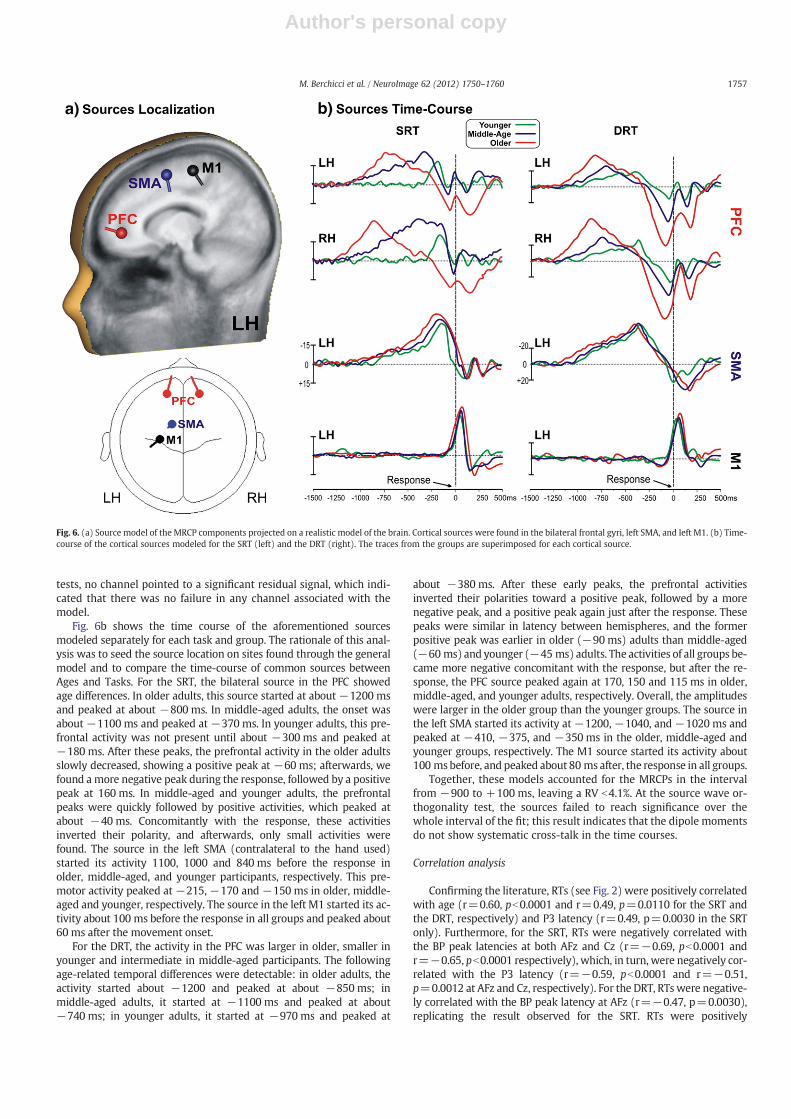
Source localizationConsidering the similar spatio-temporal structure of the MRCPs
between age groups and tasks (compare Figs. 5a and b) and the typ-ical low signal to noise ratio of these kinds of potentials, an initialgeneral model was calculated averaging data across all groups andtasks, as shown in Fig. 6a. This general model suggested that theMRCPs are produced by a minimum of three neural structures, name-ly, the bilateral prefrontal cortex (PFC), the left supplementary motorarea (SMA) and the primary motor area (M1). Fig. 6a shows the local-ization and the orientation of these cortical sources on both a 3-D re-alistic brain template (top) and on an axial plane sketched below. Toexplain the prefrontal activity, a first source was fit using a pair ofmirror dipoles in the interval between −900 and −600 ms and waslocalized in the PFC within the medial frontal gyrus in Brodmannarea 10 (Talairach coordinates ±17, 48, 6). To account for the centralBP activity, a second source was fit using a single dipole in the intervalbetween −600 and −150 ms and was localized in the medial frontalgyrus within Brodmann area 6 in the left SMA (Talairach coordinates−10,−9, 63). A third source was fit using a single dipole in the inter-val between−100 and +100 ms and was localized in the pre-centralgyrus within Brodmann area 6 in M1 (Talairach coordinates −25,−22, 60). This model accounted for the MRCPs in the interval from−900 to +100 ms, leaving a RV of 3.5%. At residual orthogonality
Table 2Group mean amplitude on AFz and Cz.
Age Groups AFz amplitudeMean (SD) [μV]
Cz amplitudeMean (SD) [μV]
SRT DRT SRT DRT
Younger −0.13 (1.2) −1.17 (2.2) −0.54 (2.2) −3.03 (1.1)Middle-aged −0.47 (1.3) −1.53 (1.5) −0.69 (0.8) −1.71 (1.3)Older −1.74 (1.2) −3.10 (1.1) −2.09 (1.1) −2.66 (1.3)
Fig. 5. Scalp topography of the grand average MRCPs across the different groups for the SRT (a) and the DRT (b). The maps are decomposed into four relevant time windows alignedfrom the top to the bottom.
1756 M. Berchicci et al. / NeuroImage 62 (2012) 1750–1760
Author's personal copy
tests, no channel pointed to a significant residual signal, which indi-cated that there was no failure in any channel associated with themodel.
Fig. 6b shows the time course of the aforementioned sourcesmodeled separately for each task and group. The rationale of this anal-ysis was to seed the source location on sites found through the generalmodel and to compare the time-course of common sources betweenAges and Tasks. For the SRT, the bilateral source in the PFC showedage differences. In older adults, this source started at about −1200 msand peaked at about −800 ms. In middle-aged adults, the onset wasabout −1100 ms and peaked at −370 ms. In younger adults, this pre-frontal activity was not present until about −300 ms and peaked at−180 ms. After these peaks, the prefrontal activity in the older adultsslowly decreased, showing a positive peak at −60 ms; afterwards, wefound amore negative peak during the response, followed by a positivepeak at 160 ms. In middle-aged and younger adults, the prefrontalpeaks were quickly followed by positive activities, which peaked atabout −40 ms. Concomitantly with the response, these activitiesinverted their polarity, and afterwards, only small activities werefound. The source in the left SMA (contralateral to the hand used)started its activity 1100, 1000 and 840 ms before the response inolder, middle-aged, and younger participants, respectively. This pre-motor activity peaked at −215, −170 and −150 ms in older, middle-aged and younger, respectively. The source in the left M1 started its ac-tivity about 100 ms before the response in all groups and peaked about60 ms after the movement onset.
For the DRT, the activity in the PFC was larger in older, smaller inyounger and intermediate in middle-aged participants. The followingage-related temporal differences were detectable: in older adults, theactivity started about −1200 and peaked at about −850 ms; inmiddle-aged adults, it started at −1100 ms and peaked at about−740 ms; in younger adults, it started at −970 ms and peaked at
about −380 ms. After these early peaks, the prefrontal activitiesinverted their polarities toward a positive peak, followed by a morenegative peak, and a positive peak again just after the response. Thesepeaks were similar in latency between hemispheres, and the formerpositive peak was earlier in older (−90 ms) adults than middle-aged(−60 ms) and younger (−45 ms) adults. The activities of all groups be-came more negative concomitant with the response, but after the re-sponse, the PFC source peaked again at 170, 150 and 115 ms in older,middle-aged, and younger adults, respectively. Overall, the amplitudeswere larger in the older group than the younger groups. The source inthe left SMA started its activity at −1200, −1040, and −1020 ms andpeaked at −410, −375, and −350 ms in the older, middle-aged andyounger groups, respectively. The M1 source started its activity about100 msbefore, and peaked about 80 ms after, the response in all groups.
Together, these models accounted for the MRCPs in the intervalfrom −900 to +100 ms, leaving a RV b4.1%. At the source wave or-thogonality test, the sources failed to reach significance over thewhole interval of the fit; this result indicates that the dipole momentsdo not show systematic cross-talk in the time courses.
Correlation analysis
Confirming the literature, RTs (see Fig. 2) were positively correlatedwith age (r=0.60, pb0.0001 and r=0.49, p=0.0110 for the SRT andthe DRT, respectively) and P3 latency (r=0.49, p=0.0030 in the SRTonly). Furthermore, for the SRT, RTs were negatively correlated withthe BP peak latencies at both AFz and Cz (r=−0.69, pb0.0001 andr=−0.65, pb0.0001 respectively), which, in turn, were negatively cor-related with the P3 latency (r=−0.59, pb0.0001 and r=−0.51,p=0.0012 at AFz and Cz, respectively). For the DRT, RTs were negative-ly correlated with the BP peak latency at AFz (r=−0.47, p=0.0030),replicating the result observed for the SRT. RTs were positively
Fig. 6. (a) Source model of the MRCP components projected on a realistic model of the brain. Cortical sources were found in the bilateral frontal gyri, left SMA, and left M1. (b) Time-course of the cortical sources modeled for the SRT (left) and the DRT (right). The traces from the groups are superimposed for each cortical source.
1757M. Berchicci et al. / NeuroImage 62 (2012) 1750–1760

Author's personal copy
correlated with the BP peak amplitude (at Cz; r=−0.32, p=0.0410),and the P3 latency was negatively correlated with the BP peak ampli-tude (at AFz; r=−0.35, p=0.0420).
Discussion
The present study evaluated the influence of age on brain activity re-lated to motor planning and stimulus processing. On the basis of theneuroimaging data (Heuninckx et al., 2008), we hypothesized that thebrains, especially frontal areas, of older people activate more resourcesthan those of younger adults to accomplish task requirements. On thewhole, the joint examination of stimulus-locked and movement-locked brain electrophysiology together with the behavioral data ofyounger, middle-aged, and older adults allowed shedding light intohow effectively the aging brain compensates dysfunctional age-related changes. The behavioral results confirmed the well-knownslowing of processing with aging (Kolev et al., 2006; Vallesi et al.,2009; Yordanova et al., 2004), associated with comparable levels of ac-curacy across age classes. More important, we identified several age-related differences in the cortical activity that underlies the generationof voluntary movements in response to external stimuli. These differ-ences were more evident in the response planning stage than thestimulus processing stage; movement-locked ERPs revealed large dif-ferences between older and younger persons, while differences forstimulus-locked ERPs were comparatively smaller. In any case, theslowing of stimulus processing by aging was correlated with long-lasting motor preparation and slow reaction times regardless of taskcomplexity.
The novel result of the present study is the presence of an appre-ciable age-related brain slowing of motor planning not only in a rela-tively complex RT task (i.e., the DRT), but also in a very easy task (i.e.,the SRT). The onset of the MRCPs in older adults was much earlierthan previously reported in aging studies (Barrett et al., 1986;Falkenstein et al., 2006; Golob et al., 2005; Ishizuka et al., 1996;Kolev et al., 2006; Naccarato et al., 2006; Singh et al., 1990;Yordanova et al., 2004). Further, we found a large prefrontal involve-ment that has not been shown by earlier MRCP studies. These differ-ences might be due to the discriminative reaction task employed inthe present study; other studies have used choice reaction tasks(Falkenstein et al., 2006; Yordanova et al., 2004), voluntary self-paced movement (Barrett et al., 1986; Singh et al., 1990) or externallytriggered response according to the paradigm of contingent negativevariation (Golob et al., 2005). Further, the present task required fastand accurate responses every 1–2 s, whereas previous studies haverequired slower response rates. More important, in the DRT bothmotor execution and inhibition were required, and the equal ratioof Go and No-Go trials produced maximal response uncertainty.These features make the present task more demanding than previ-ously used tasks and producedMRCPs that started earlier and showeddifferent involvements of the frontal lobes in younger and older sub-jects in terms of motor preparation and execution. Furthermore, somestudies did not provide evidence of prefrontal over-activity in olderadults because they either did not record from prefrontal electrodes(Barrett et al., 1986; Golob et al., 2005) or did not consider thesedata in their analyses (see Fig. 4a in Yordanova et al., 2004).
The time-course of the source analysis for the SRT clearly showsthat the beginning of bilateral activity in the PFC depends on age;PFC activity started very early in the older adults (1100 ms beforemovement), later in middle-aged adults (900 ms), and much laterin younger adults (300 ms). For the DRT, the pattern of age-related ef-fects was the same, but the differences between middle-aged andolder adults were less pronounced. The scalp topography resultsshowed an early negative activity in the PFC starting more than 1 sbefore the response; this activity was larger in older adults than inmiddle-aged adults and absent in younger adults. Before the re-sponse, a strong positive activity was found in prefrontal areas of
older adults (−60 ms and −80 ms, in the SRT and the DRT, respec-tively) that was less pronounced and delayed in middle-aged adults(−40 ms and −60 ms in the SRT and the DRT, respectively). On theother hand, in younger adults, the same activity was localized inmore posterior areas, and its peak was closer to the beginning ofthe movement (−30 ms and−45 ms in the SRT and the DRT, respec-tively). Overall, age-related effects on prefrontal activity were macro-scopic, with both onset time and amplitude increasing with age. Olderadults need to activate the PFC even to accomplish very easy tasks,whereas younger adults are able to spare cortical resources duringthe same tasks. Only when the RT task was more complex (i.e., theDRT) did younger adults show prefrontal activity involvement thatstarted about 1 s before the initiation of movement and reached thesame amplitude as that observed in the older groups; this result sug-gests that executive control processes were required in the DRT forthe younger adults. Thus, the processing selected to accomplish theDRT was qualitatively similar for younger and older subjects. In thecase of the DRT, the differences were quantitative: to reach thesame accuracy (anticipation and commission errors were compara-ble), older subjects prepared the action with larger anticipation andhigher cost, as indexed by the earlier latency onset and larger pre-frontal cortical activation. The substantial changes in the polarity ofthe PFC activity in the time window between 1 s before and 200 msafter the movement might be related to its top-down supervisionrole (Norman and Shallice, 1986), which controls response selectionduring the motor preparation. In the present study, the large PFC neg-ativity peaking between 900 and 600 ms before the response may beinterpreted as a marker of inhibitory control; it is likely that such con-trol serves to avoid response anticipations. After the peak, this activityrapidly decreased and developed into the sharp positivity that peaked170 ms after the response; this rapid change might be related to therelease of inhibitory control to facilitate the response execution.This entire pattern of prefrontal activity was more marked in olderand middle-aged adults than in young participants.
Regarding the analysis of the stimulus-locked ERP components, apartial consistency with evidence in the literature emerged (Kolev etal., 2006; Vallesi et al., 2009). From the present results, we may con-clude that only a small portion of the general slowing of RTs withaging should be attributed to slowing at the perceptual and attentionallevels: differences with respect to younger adults were small and oftennon-significant in the early phases of stimulus analysis (P1, N1, P2), anddifferences weremoremarked and significant for the later cognitive P3.Overall, we speculate that the ubiquitous involvement of the PFC andthe slow stimulus categorization (i.e., delayed P3 component) are re-sponsible for longer RTs in older individuals. Further investigationsare needed to provide additional validation to this hypothesis and toimprove our understanding of the role played by the larger involvementof the PFC in response planning that accompanies aging.
Correlation analyses support this view, confirming that the age-related slowing at the behavioral and cognitive levels in the SRTwas associated with anticipation of motor preparation (indexed byearlier BP peak latencies) over prefrontal and central electrodes,which was, in turn, associated with longer times needed to classifythe stimuli (marked by the P3 latency; Yordanova et al., 2004). Itseems likely that in very simple reaction tasks, both RT and P3 latencyincrease with age, while the BP peak latency decreases, suggestingthat the increasing effort of older adults in the preparation phasedoes not compensate for the slowing of RTs in either task.
Thus, PFC over-recruitment favors accuracy, but not speed. Pre-frontal hyperactivity likely causes the behavioral slowing by activat-ing a highly controlled top-down performance rather than a fasterstimulus-triggered behavior (Park and Reuter-Lorenz, 2009). Stimuliare classified more slowly by older subjects, and actions require lon-ger anticipation and stronger prefrontal control.
The joint consideration of brain electrical and behavioral resultsoffers even more compelling insights into the transition from young
1758 M. Berchicci et al. / NeuroImage 62 (2012) 1750–1760
Author's personal copy
to older adults. Previous studies either did not include a middle-agedgroup, or merged the data from middle-aged and older adults. Thepresent findings showed that middle-aged adults lacked a significantRT slowing, being more similar to younger than to older adults. Thismight seem surprising when considering that both P2 and P3 laten-cies showed a linear age-related increase, with latencies in middle-aged adults being significantly longer than those of younger adults.On the other side, the BP showed middle aged adults being more‘older adult-like’: the prefrontal involvement was present in theSRT, although it was not as marked as it was in the older, and in theDRT, the prefrontal cortex started its activity very early, similar toolder adults. Therefore, the prefrontal overactivation seems to be acommon characteristic of middle-aged and older adults. It can beinterpreted as a compensatory activity whose effectiveness differs inmiddle-aged and older adults. In middle-aged adults, it allows com-pensating the slowing of information processing reflected in the P2and P3 latencies and maintaining ‘younger adult-like’ reactionspeed. In older adults, the prefrontal overactivation seems no longerto offset the behavioral consequences of the age-related slowing ofinformation processing, but rather it seems to ensure the mainte-nance of response accuracy. Given that the overactivation in olderadults does not seem to be paralleled by the maintenance of task rel-evant speeded performance, it is plausible that the compensationmechanisms, which are effective for middle-aged adults, are less effi-cient in older adults possibly due to the larger dedifferentiation (Parkand Reuter-Lorenz, 2009). With reference to the task complexity ef-fect, we may note that the BP onset over Cz depended on task com-plexity (the more difficult the task, the earlier the BP onset will be).This dependency held for all age groups, indicating that flexible,task-dependent allocation of resources was also present in olderadults. In contrast, BP onset and peak latency recorded at prefrontalleads (AFz) were modulated by task difficulty only in the youngerand middle-aged groups. In older adults, the onset and peak latencyof the BP were similar in the SRT and the DRT, indicating thesustained involvement of the PFC in anticipation of a response signalregardless of task complexity. This finding is in line with the findingsof Sterr and Dean (2008) showing age-related recruitment of frontalareas in anticipation of a response signal. In accord with previousLRP findings that showed that aging affects not only motor execution(Roggeveen et al., 2007) but also motor preparation (Sterr and Dean,2008) and motor response generation (Yordanova et al., 2004), thepresent findings show that the age-related slowing of RT cannot bereliably explained by slowing at the level of stimulus processing butthat it mostly originates during the motor preparation processing. Insummary, the preparation of responses in older people had a veryhigh cost, even in the easier task. The so-called “complexity effect”(Yordanova et al., 2004) was reversed by the present data: the differ-ences between younger and older adults were more evident in theeasier rather than the more complex task. Indeed, the preparationfor the forthcoming motor response was substantially differentalong the lifespan. Older people recruited prefrontal brain regions inanticipation during pre-motor planning in both the DRT and theSRT, whereas the younger participants did so only in the DRT. Thus,the complexity effect was present in young and middle-aged adultsbut not in older participants.
Conclusions
We suggest that the long-lasting hyperactivity of the PFC before ac-tion in the elderly reflects highly controlled processing: the motor re-sponses are prepared in advance and controlled in order to executethem with the appropriate timing. This procedure is dominant inolder adults even for very simple tasks, whereas younger adults onlyadopt it when the task is more challenging and the stimulus-triggeredprocedure becomes inconvenient. Future research employing the ma-nipulation of the involvement of different executive function subsets
may improve our understanding and account for this divergence, aswell as address this topic in special aging populations affected by sec-ondary aging syndromes. The present findings based on fine-grain tem-poral analysis may contribute to fill the gap between behavioral andneuroimaging data in the literature on the elderly and to improve ourknowledge about the timing and sources of cortical motor preparationthat underpin responses to external stimuli in healthy individuals of dif-ferent ages.
Acknowledgments
This work was supported by the University of “Foro Italico” funds[grant number RIC1062010].
Appendix A. Supplementary data
Supplementary data to this article can be found online at http://dx.doi.org/10.1016/j.neuroimage.2012.06.031.
References
Anderer, P., Semlitsch, H.V., Saletu, B., 1996. Multichannel auditory event-related brainpotentials: effect of normal aging on the scalp distribution of N1, P2, N2 and P300latencies and amplitudes. Electrophysiol. Clin. Neurophysiol. 99, 458–472.
Barrett, G., Shibasaki, H., Neshige, R., 1986. Cortical potentials preceding voluntarymovement: evidence for three periods of preparation in man. Electrophysiol.Clin. Neurophysiol. 63, 327–339.
Bocker, K.B.E., Cornelis, H.M., Brunia, C.H.M., Van den Berg-Lenss, M.M.C., 1994. A spa-tiotemporal dipole model of the stimulus preceding negativity (SPN) prior to feed-back stimuli. Brain Topogr. 7, 71–88.
Burke, S.N., Barnes, C.A., 2006. Neural plasticity in the ageing brain. Nat. Rev. Neurosci.7, 30–40.
Davis, S.W., Dennis, N.A., Daselaar, S.M., Fleck, M.S., Cabeza, R., 2008. Qué PASA? Theposterior–anterior shift in aging. Cereb. Cortex 18, 1201–1209.
Di Girolamo, G.J., Kramer, A.F., Barad, V., Cepeda, N.J., Weissman, D.H., Milham, M.P., etal., 2001. General and task-specific frontal lobe recruitment in older adults duringexecutive processes: a fMRI investigation of tasks-witching. NeuroReport 12,2065–2071.
Di Russo, F., Spinelli, D., 2010. Sport is not always healthy: executive brain dysfunctionin professional boxers. Psychophysiology 47, 425–434.
Di Russo, F., Taddei, F., Aprile, T., Spinelli, D., 2006. Neural correlates of fast stimulusdiscrimination and response selection in top-level fencers. Neurosci. Lett. 408,113–118.
Di Russo, F., Bultrini, A., Brunelli, S., Delussu, A.S., Polidori, L., Taddei, F., Traballesi, M.,Spinelli, D., 2010. Sport benefits on disabled athletes' executive functions.J. Neurotrauma 27, 2309–2319.
Falkenstein, M., Yordanova, J., Kolev, V., 2006. Effects of aging on slowing of motor-response generation. Int. J. Psychophysiol. 59, 22–29.
Golob, E.J., Ovasapyan, V., Starr, A., 2005. Event-related potentials accompanying motorpreparation and stimulus expectancy in the young, young-old and oldest-old. Neu-robiol. Aging 26, 531–542.
Heuninckx, S., Wenderoth, N., Swinnen, S.P., 2008. Systems neuroplasticity in the agingbrain: recruiting additional resources for successful motor performance in elderlypersons. J. Neurosci. 28, 91–99.
Iragui, V.J., Kutas, M., Mitchiner, M.R., Hillyard, S.A., 1993. Effects of aging on event-related brain potentials and reaction times in an auditory oddball task. Psycho-physiology 30, 10–22.
Ishizuka, H., Tomi, H., Sunohara, N., 1996. Age-related changes in movement-relatedcortical potentials. Nippon Ronen Igakkai Zasshi 33, 586–591.
Kolev, V., Falkenstein, M., Yordanova, J., 2006. Motor-response generation as a source ofaging-related behavioural slowing in choice-reaction tasks. Neurobiol. Aging 27,1719–1730.
Labyt, E., Szurhaj, W., Bourriez, J., Cassim, F., Defebvre, L., Destee, A., Derambure, P.,2004. Influence of aging on cortical activity associated with a visuo-motor task.Neurobiol. Aging 25, 817–827.
Naccarato, M., Calautti, C., Jones, P.S., Day, D.J., Carpenter, T.A., Cohen, J.C., 2006. Doeshealthy aging affect the hemispheric activation balance during paced index-to-thumb opposition task? An fMRI study. NeuroImage 32, 1250–1256.
Norman, W., Shallice, T., 1986. Attention to action. In: Davidson, R.J., Schwartz, G.E.,Shapiro, D. (Eds.), Consciousness and self regulation: Advances in research andtheory, vol. 4. Plenum, New York, pp. 1–18.
Oldfield, R.C., 1971. The assessment and analysis of handedness: the Edinburgh inven-tory. Neuropsychologia 104, 199–206.
Park, D.C., Reuter-Lorenz, P.A., 2009. The adaptive brain: aging and neurocognitivescaffolding. Ann. Rev. Psychol. 60, 173–196.
Peinemann, A., Lebner, C., Conrad, B., Siebner, H.R., 2001. Age-related decrease inpaired-pulse intracortical inhibition in the human primary motor cortex. Neurosci.Lett. 313, 33–36.
Pitcher, J.B., Ogston, K.M., Miles, T.S., 2003. Age and sex differences in human motorcortex input–output characteristics. J. Physiol. 546, 605–613.
1759M. Berchicci et al. / NeuroImage 62 (2012) 1750–1760

Author's personal copy
Polich, J., 2007. Updating P300: An integrative theory of P3a and P3b. Clin.Neurophysiol. 118, 2128–2148.
Reuter-Lorenz, P.A., 2002. New vision of the aging mind and brain. Trends Cog. Sci. 6,394–400.
Roggeveen, A.B., Prime, D.J., Ward, L.M., 2007. Lateralized readiness potentials revealmotor slowing in the aging brain. J. Gerontol. 62B, P78–P84.
Rossini, P.M., Rossi, S., Babiloni, C., Polich, J., 2007. Clinical neurophysiology of agingbrain: from normal aging to neurodegeneration. Prog. Neurobiol. 83, 375–400.
Salthouse, T.A., 2000. Aging and measures of processing speed. Biol. Psychol. 54, 35–54.Seidler, R.D., Bernard, J.A., Burutolu, T.B., Fling, B.W., Gordon, M.T., Gwin, J.T., et al.,
2010. Motor control and aging: links to age-related brain structural, functional,and biochemical effects. Neurosci. Biobehav. Rev. 34, 721–733.
Shibasaki, H., Hallett, M., 2006. What is Bereitschaftspotential? Clin. Neurophysiol. 117,2341–2356.
Singh, J., Knight, R.T., Woods, D.L., Beckley, D.J., Clayworth, C., 1990. Lack of age effects onhuman brain potentials preceding voluntary movements. Neurosci. Lett. 119, 27–31.
Smith, J.L., Smith, E.A., Provost, A.L., Heathcote, A., 2010. Sequence effects support the con-flict theory of N2 and P3 in the Go/NoGo task. Int. J. Psychophysiol. 75, 217–226.
Sterr, A., Dean, P., 2008. Neural correlates of movement preparation in healthy ageing.Eur. J. Neurosci. 27, 254–260.
Vallesi, A., 2011. Targets and non-targets in the aging brain: a go/nogo event-relatedpotential study. Neurosci. Lett. 487, 313–317.
Vallesi, A., Stuss, D.T., McIntosh, A.R., Picton, T.W., 2009. Age-related differences in process-ing irrelevant information: evidence from event-related potentials. Neuropsychologia47, 577–586.
Vallesi, A., McIntosh, A.R., Stuss, D.T., 2010. Overrecruitment in the aging brain as afunction of task demands: evidence for a compensatory view. J. Cogn. Neurosci. 23,801–815.
Ward, N.S., 2006. Compensatory mechanisms in the aging motor system. Ageing Res.Rev. 5, 239–254.
Wild-Wall, N., Hohnsbein, J., Falkenstein, M., 2007. Effects of ageing on cognitivetask preparation as reflected by event-related potentials. Clin. Neurophysiol. 118,558–569.
Yordanova, J., Kolev, V., Hohnsbein, J., Falkenstein, M., 2004. Sensorimotor slowing withageing is mediated by a functional dysregulation of motor-generation processes:evidence from high-resolution event-related potentials. Brain 127, 351–362.
1760 M. Berchicci et al. / NeuroImage 62 (2012) 1750–1760
Copyright © 2022 FDOKUMEN