Preferences of interior colors of user of an innovation community
252
Delft University of Technology Automotive customization Customization Strategies of the Automotive Interior – Value Creation by involving the customer in the product development process Wagner, Alexa DOI 10.4233/uuid:f6846c68-6601-4540-b751-2ae33e7ac09c Publication date 2018 Document Version Final published version Citation (APA) Wagner, A. (2018). Automotive customization: Customization Strategies of the Automotive Interior – Value Creation by involving the customer in the product development process. https://doi.org/10.4233/uuid:f6846c68-6601-4540-b751-2ae33e7ac09c Important note To cite this publication, please use the final published version (if applicable). Please check the document version above. Copyright Other than for strictly personal use, it is not permitted to download, forward or distribute the text or part of it, without the consent of the author(s) and/or copyright holder(s), unless the work is under an open content license such as Creative Commons. Takedown policy Please contact us and provide details if you believe this document breaches copyrights. We will remove access to the work immediately and investigate your claim. This work is downloaded from Delft University of Technology. For technical reasons the number of authors shown on this cover page is limited to a maximum of 10.
-
Upload
khangminh22 -
Category
Documents
-
view
3 -
download
0
Transcript of Preferences of interior colors of user of an innovation community

Delft University of Technology
Automotive customizationCustomization Strategies of the Automotive Interior – Value Creation by involving thecustomer in the product development processWagner, Alexa
DOI10.4233/uuid:f6846c68-6601-4540-b751-2ae33e7ac09cPublication date2018Document VersionFinal published versionCitation (APA)Wagner, A. (2018). Automotive customization: Customization Strategies of the Automotive Interior – ValueCreation by involving the customer in the product development process.https://doi.org/10.4233/uuid:f6846c68-6601-4540-b751-2ae33e7ac09c
Important noteTo cite this publication, please use the final published version (if applicable).Please check the document version above.
CopyrightOther than for strictly personal use, it is not permitted to download, forward or distribute the text or part of it, without the consentof the author(s) and/or copyright holder(s), unless the work is under an open content license such as Creative Commons.
Takedown policyPlease contact us and provide details if you believe this document breaches copyrights.We will remove access to the work immediately and investigate your claim.
This work is downloaded from Delft University of Technology.For technical reasons the number of authors shown on this cover page is limited to a maximum of 10.

Fehler! Kein Text mit angegebener Formatvorlage im Dokument.
3
AUTOMOTIVE CUSTOMIZATION
Customization Strategies of the Automotive
Interior – Value Creation by involving the customer in the product development process
Alexa-Sibylla Wagner


AUTOMOTIVE CUSTOMIZATION
Customization Strategies of the Automotive Interior –
Value Creation by involving the customer in the product development process
Dissertation
for the purpose of obtaining the degree of doctor at Delft University of Technology
by the authority of the Rector Magnificus prof.dr.ir. T.H.J.J. van der Hagen, chair of the Board for Doctorates
to be defended publicly on Friday 23 November 2018 at 12:30 o’clock
by Alexa-Sibylla WAGNER
Diplom Kauffrau (univ.), Technische Universität München, Germany born in Mannheim, Germany
This dissertation has been approved by the Promoter: Prof. dr. P. Vink Composition of the doctoral committee: Rector Magnificus chairman Prof. dr. P. Vink Delft University of Technology,
promotor Independent members: Prof. ir. D.J. van Eijk Delft University of Technology Prof. mr. dr. ir. S.C. Santema Delft University of Technology Prof. dr. ir. Ralf Stetter University of Applied Science
Ravensburg-Weingarten, Germany Prof. dr. ir. N. Mansfield Nottingham Trent University, UK Dr. ir. I. Bakker Levenswerken Dr. Matthias Franz BMW AG

AUTOMOTIVE CUSTOMIZATION
Customization Strategies of the Automotive Interior –
Value Creation by involving the customer in the product development process

ISBN/EAN: 978-94-6186-980-7 © 2018 Alexa-Sibylla Wagner All rights reserved. No part of this publication may be reproduced or transmitted in any form or by any means, electronic or mechanical, including photocopying, recording or any information storage or retrieval system, without permission from the author.
TABLE OF CONTENTS
PART I INTRODUCTION 8
CHAPTER 1 TRENDS, THEORETICAL FRAMEWORK AND THE HMI MODEL OF CUSTOMIZATION 9
1.1 MOBILITY CHANGE AND CONSEQUENCES FOR AUTOMOTIVE INTERIOR CONCEPTS 9
1.2 THEORETICAL FRAMEWORK AND THE APPLICATION WITH AUTOMOTIVE INTERIORS 13
1.3 MASS CUSTOMIZATION 15 1.4 HUMAN-MACHINE INTERACTION THEORY AND IMPLICATIONS FOR
AUTOMOTIVE CUSTOMIZATION 21 1.4.1 THE CONCEPTUAL MODEL FOR CUSTOMIZATION 24 1.4.2 THE CUSTOMIZATION PROCESS - HUMAN MACHINE INTERACTION
AND FLOW 30 1.4.3 THE CUSTOMIZABLE PRODUCT 32
PART II THE NEED FOR CUSTOMIZATION AS A MEANS TO ENFORCE AUTOMOBILE INVOLVEMENT OF GENERATION Y 52
CHAPTER 2 MOTIVES FOR CAR PURCHASES, AUTOMOTIVE CUSTOMIZATION AND WELLBEING 53
PART III AESTHETIC, FUNCTIONAL AND ADAPTABLE CUSTOMIZATION 80
CHAPTER 3 VISUAL CUSTOMIZATION – DIVERSITY IN COLOR PREFERENCES IN THE AUTOMOTIVE INTERIOR AND IMPLICATIONS FOR INTERIOR DESIGN 81
CHAPTER 4 FUNCTIONAL CUSTOMIZATION - VALUE CREATION BY INDIVIDUAL STORAGE ELEMENTS IN THE CAR INTERIOR 129
CHAPTER 5 FLOW EXPERIENCE INFLUENCED BY CAR ADJUSTMENTS 159

CHAPTER 6 ADAPTIVE CUSTOMIZATION - VALUE CREATION OF ADAPTIVE ELEMENTS WITHIN THE AUTOMOTIVE INTERIOR 189
PART IV EPILOGUE 212
CHAPTER 7 VALUE CREATION BY AUTOMOTIVE CUSTOMIZATION OF CAR INTERIORS 213
CHAPTER 8 REFLECTIONS ON METHODOLOGY AND DESIGN CONCEPTS 219
CHAPTER 9 REFLECTIONS ON THE THESIS, RECOMMENDATIONS FOR FUTURE RESEARCH, AND CONCLUDING THOUGHTS 222
228
SUMMARY 229
SAMENVATTING 235
ABOUT THE AUTHOR 243
LIST OF PUBLICATIONS 244
ACKNOWLEDGEMENTS 246


Chapter 1 TRENDS, THEORETICAL FRAMEWORK AND THE HMI MODEL OF CUSTOMIZATION
8
Part I Introduction

Chapter 1 TRENDS, THEORETICAL FRAMEWORK AND THE HMI MODEL OF CUSTOMIZATION
9
Chapter 1 TRENDS, THEORETICAL FRAMEWORK
AND THE HMI MODEL OF CUSTOMIZATION
1.1 Mobility Change and consequences for Automotive Interior concepts
The mobility demands have been changing intensively in the last decades corresponding to people’s lifestyles and requests (Winterhoff, Kahner, Ulrich, Sayler, & Wenzel, 2009). Throughout history, the importance of cars has evolved from an expensive way to travel for a few wealthy owners (e.g. BMW 501 from 1951ab, BMW 502 from 1954) to small car concepts of the 50s (e.g. BMW Isetta from 1955) facilitating a broader distribution among potential customer groups due to a different price level. With the emerging middle class in society, car manufacturers answered this particular customer need by respective product solutions such as the BMW 700 (1959), or BMW 1500 (cf. Fig. 1). In those times, a car still represented values of success until a massive change in the image of mobility in the last decade. Arthur D Little (ADL, 2014) described mobility as one of the pivotal megatrends due to an intense quantitative growth in triad markets (Japan, North America and Western Europe), followed by the BRIC markets (Brazil, Russia, India, China) over the last 30 years (Winterhoff et al., 2009). It is described that the mobility radius of individuals expanded significantly at the same time leading to a demand for optimal and sustainable integration of cars and other modes of transport (Winterhoff et al., 2009). Some sources report the belief that especially the mobility trends of representatives of the Generation Y, i.e. those born between the early 1980s and mid-1990s, need a more thorough investigation (IFMO, 2013) (Institute for Mobility Research). Behavioral changes of this group might lead to a decrease in car ownership and use of cars in particular in European countries, the USA and Japan (IFMO, 2013),

Chapter 1 TRENDS, THEORETICAL FRAMEWORK AND THE HMI MODEL OF CUSTOMIZATION
10
although mobility becoming multifaceted particularly due to the impact of information and communication technology. For instance, smartphones and mobile devices enable online purchase of train tickets while waiting at the platform for the train to arrive, while, simultaneously, the users can search for the next possible mode of transport. Hence, CE (consumer electronic, such as smartphones or tablets) devices offer a new pragmatism for traveling with connected mobility solutions (ADL, 2014). Even if smartphones are prophesied to replace cars as a new status symbol (Tully, 2011), their impact on travel is only very recent, because of their comparably short lifetime (IFMO, 2013).
Fig. 1 1a) left: BMW roadster and convertible of the 50s, 1b) right: BMW 700, first movement into the market segment of the middle class by a small sedan powered by a Boxer motorcycle engine, 1c) BMW 1500, symbolic entry in the middle-class segment in 1961 (left: interior; right: exterior design). Another megatrend ADL highlights is “individualization”, defined as a disengagement of consumers from mass produced goods and services as a consequence of non-conformity and counterconformity motivation from traditional life patterns (Winterhoff et al., 2009). Further societal trends like downageing or different life forms by Family 2.0 affect the consumer behavior

Chapter 1 TRENDS, THEORETICAL FRAMEWORK AND THE HMI MODEL OF CUSTOMIZATION
11
strongly and lead to specific consumer trends such as Simplify or Deep Support describing an intuitive access to products and services in an increasingly complex high-tech world (Winterhoff et al., 2009). Furthermore, the demographics show a tendency to stay in education longer and start a family later (IFMO, 2013), which explains a certain decrease in car usage. So, possessing a car is postponed for later life stages such as when starting a family (IFMO, 2011). Additionally, consumers change to a more ambivalent behavior which complicates behavior prognosis and the competition in saturated markets. For instance, the megatrend individualization indicates a thrive for uniqueness and the abandonment of traditional life patterns to being non-conformist (Winterhoff et al., 2009). Beyond commuters, distinctive consumer groups like Silver Drivers or Sensation Seekers pose a new challenge for product design with the willingness to consume but with an active lifestyle, a variety of interests and the pleasure of driving (Winterhoff et al., 2009). ADL characterizes a car to act also as an office and living room satisfying a need for interconnectedness by CE devices and safety. Fig. 2 describes the major developmental steps of car interiors throughout history which are accompanied by an increase of functionality and safety while the spaciousness decreased.
Fig. 2 Schematic timeline of developmental steps of car interiors.

Chapter 1 TRENDS, THEORETICAL FRAMEWORK AND THE HMI MODEL OF CUSTOMIZATION
12
But the living conditions also influence interior car design. For instance, the IFMO determined a decrease in car usage among households in metropolitan areas compared to rural areas and single-person households (IFMO, 2013). Complementing the evolution in customer behavior and expectations to mobility solutions, new competitors emerge from other sectors. Shared mobility complements individual transport (car, bike) with public transport in peer-to-peer and business-to-consumer models (ADL, 2014). Other business models are also emerging with the cities’ infrastructure being the key player of shared mobility. However, general market mechanisms (i.e. achieving a natural balance of supply and demand cannot be applied for the market of shared mobility concepts (ADL, 2014). ADL distinguished three business models for urban mobility suppliers, the Amazon, the Apple and the Dell model (Audenhove, Korniichuk, Dauby, & Pourbaix, 2014). A user of the Amazon model experiences a provider bundling relevant third-party services with minimal physical infrastructure and the contact to this provider is mainly virtually such as mobility providers like Oixxit of German Railway or Daimler’s moovel (ADL, 2014). Further examples from other industries are Check 24 (platform to compare insurances) or TripAdvisor (guide for traveling). A user of the Apple model gets an all-in-one experience by deep vertical integration e.g. ZipCar, MyDriver by Sixt, DriveNow by BMW, Flinkster by German Railway (ADL, 2014). Comparable to Apple products, those mobility providers offer a closed system approach which is only extendable by further products or Apps from the same provider. ‘A single mode specialist’ offers the user one mode of transport instead of several ones e.g. transport for London, VW’s Quicar or carpooling platforms, i.e. the Dell model (ADL, 2014). In conclusion, car sharing has evolved from a student’s way of low-cost traveling via communities to an attractive business among OEMs (ADL, 2014). The ability to attract more users of Generation Y will be crucial for the future. This generation grew up with social media platforms like Facebook, Instagram or Twitter staging important events in their lives and sharing those with the community. The next step is not prophesized yet, but car sharing will be an issue and individualization of shared cars will be important. In this PhD project, several possibilities to personalize a car will be elaborated and tested.

Chapter 1 TRENDS, THEORETICAL FRAMEWORK AND THE HMI MODEL OF CUSTOMIZATION
13
1.2 Theoretical Framework and the Application with Automotive Interiors
New modes of transportation (e.g. car sharing) might require a different approach to a customer. There is more attention for the experience economy (B Joseph Pine & Gilmore, 1999). So, beyond the purpose of transport, the product experience could become more important. In a customer-focused culture, the sensory stimulation and emotional responses could determine advantage or disadvantage of shared mobility solutions (ADL, 2014). The creation of value for those services will decide upon customer preferences and competitor advantage. This PhD thesis focuses on the research question, if value creation can be achieved by involving the end user in the product development process and to translate this knowledge into more personalized or adaptable car interiors to create premium experiences of shared mobility and retail markets. Not all aspects of value creation can be studied. In this PhD thesis, a selection is made based on the outcomes of a contest in which new ideas for car interiors are collected, a field study on driving pleasure and a prototype of a customizable, adaptive car interior. Most of the 1075 participants of the contest were young in age (Generation Y). Some of the proposed new ideas were transformed into designs and tested in this PhD. Before describing the cases, a theoretical framework is presented in this PhD. Part I introduces this thesis with an analysis of various mobility trend studies and deduces strategies that car manufacturers have to obtain in order to generate value for users. In chapter 1.2 a theoretical framework for customization is presented leading to a link between a human machine interaction model and customization (chapter 1.3 & chapter 1.4). Several key aspects and perspectives of this model are described such as the customer, the customization process and the customized product. Due to the involvement of the user in the design process, the emphasis is on the visual perception and inner-human decision processes.

Chapter 1 TRENDS, THEORETICAL FRAMEWORK AND THE HMI MODEL OF CUSTOMIZATION
14
In chapter 2, a scale for the need for customization is presented as well as tests of this scale regarding interferences with wellbeing, innovativeness, automobile involvement [Product involvement is a long-term interest in a product which is based on the centrality of the product to important values, needs, or the self-concept (Bloch, 1981).] and criteria for car purchases. In this study, Generation Y served as a target group. The scale and buying motives are used later in Part III (chapter 4, 5 & 6). The term customization is distinguished in aesthetic (chapter 3), functional (chapter 4) and adaptable customization (chapter 5 & 6; cf. literature definition in chapter 1.2.1, the terminology “adaptable” customization was defined in this thesis). In all studies, customization concepts were developed and tested with end-users afterwards regarding their user value. Chapter 3 describes in a basic way a customization toolkit for automotive interiors which enables users to change the colors and patterns of various components facilitating the creation of unique interiors. In chapter 4 a car interior is developed which offers users the creation of their individual space by rearranging and adjusting flexible storage design features. In this case, rapid manufacturing technologies allow further customization by personalizing the compartments. The field study of chapter 5 provides a user-centered design of adaptive functions of the car regarding its agility and driving style. Making use of new approaches for human-machine-interaction, the car was able to anticipate the users intended driving style. This experience was supported by variable adjustments of the seat’s back rest for a sportier impression. Chapter 6 tested the adaptive customization by lighting colors that varied automatically by a camera identifying the clothes’ colors or colors that can be blended by the users’ CE devices by an App. Among all studies, an additional value was estimated. This value is created as a by-product of customization. This PhD thesis concludes with a suggestion of a possible business scenario of a customized automotive interior for continuous customization (cf. Fig. 3). So, the car adjusts to various users (car sharing, leasing or retail) or to various

Chapter 1 TRENDS, THEORETICAL FRAMEWORK AND THE HMI MODEL OF CUSTOMIZATION
15
changes during different life stages (Family 2.0, Silver Drivers, Sensation Seekers).
Fig. 3 Graphical outline of the thesis.
1.3 Mass Customization
The megatrend of individualization, as indicated earlier, has an impact on consumers’ expectations and their mobility demands. The theoretical background of customization of products and services has been studied intensively in the previous decades (Beyering, 1983, 1987; Davis, 1987; F. Piller, 2001; Frank T Piller, 2010; Buddie Joseph Pine, 1991; B Joseph Pine, 1993a; B Joseph Pine, Peppers, & Rogers, 1995; Reichwald & Piller, 2000; Zahn, 1996). Arthur D. Little described the megatrend individualization as the consumer’s disengagement from mass movements (Winterhoff et al., 2009). Furthermore, customers tend to become non-conformist. So, a car with the sole purpose of a status symbol might even cease to exist. Mobility solutions

Chapter 1 TRENDS, THEORETICAL FRAMEWORK AND THE HMI MODEL OF CUSTOMIZATION
16
are expected to be adapted to the customer’s way of life, individualizable car concepts and innovative modular or individual mobility concepts (Winterhoff et al., 2009). Beyond the traditional make-to-order-production, Joseph Pine defined the oxymoron “mass customization” as the process of developing, producing, marketing, and delivering affordable goods and services with an adequate level of variety and customization as the next evolution in production paradigms (Davis, 1987; F. Piller, 2001; B Joseph Pine, 1993a; Salvador & Rungtusanatham, 2009; Zahn, 1996). The concept of mass customization allows users to adjust a product to individual requirements or initiate its customization before buying the product (Bauer, Düll, & Jeffery; Schneider, 1998; Steck, 2003) through customer integration. This process can be characterized as aligning an organization with its customers' needs (Salvador, De Holan, & Piller, 2009) to create an improved fit between needs and product offerings (B Joseph Pine, 1993b). Zipkin (2001) indicates that customers have difficulties articulating their requirements for customization. Considering customers as utility-maximizing agents, their preferences for a finished product yield at the summed attributes (Levav, Heitmann, Herrmann, & Iyengar, 2010). In this context, product customization requires consumers to directly construct their preferred product via a sequence of attribute decisions until the option that matches best is found (Levav et al., 2010). A modular design is considered as the threshold for mass customization of goods and services enabling a customer-specific product consisting of standardized, compatible subcomponents (Schenk, Seelmann-Eggebert, & Piller, 2001). Cost efficiency can therefore be achieved due to a reduction of complexity costs and the use of economies of scale and scope (Schenk et al., 2001). The integration of the user in the design process complements the experience of owning a product with an innovative experience (Schenk et al., 2001). Regardless of online or offline product configuration in shops (Ihl, Müller, Piller, & Reichwald, 2006), stylistic/ aesthetic, and functional customization options can be distinguished (Bauer et al., 2009). Whereas stylistic customization applies optical or other sensual product attributes, functional customization enables the customer to choose, specify, or omit various

Chapter 1 TRENDS, THEORETICAL FRAMEWORK AND THE HMI MODEL OF CUSTOMIZATION
17
functions of a product (Bauer et al., 2009). Bauer et al. suggest different ways to address style and functional customization to customers. Stylistic customization is more short-term oriented, its additional value can be communicated by an event-oriented marketing based on emotions (Bauer et al., 2009). Instead, functional customization is supposed to be more long-term oriented and perceived as more valuable. Due to associations with motives such as quality and comfort, customers show decreased price sensitivity (Bauer et al., 2009). Additionally, products can be tailored to requirements of anthropometric conditions (Frank T Piller & Müller, 2004; Reichwald & Piller, 2006). For instance, seat customization can have a positive impact on comfort such as a seat fitted to the body’s anthropometrics (Franz et al., 2011; C Tuck, Campbell, Hague, & Ruffo, 2005; Christopher Tuck & Hague, 2006). Both studies apply comparable methods to create the necessary data, by capturing the geometry, scanning, and designing seats based on the human body contour for motorcycles or cars. Boer and Dulio (2007) distinguish three vectors of shoe customization: style/ aesthetics, fit/ comfort and function/ performance (Frank T Piller & Müller, 2004). Bauer et al. (2009) indicate that the extent of customization can vary from stylistic customization like covers or sleeves for smartphones to high degree customization such as a tailored, unique Rolls Royce (cf. Fig. 37). This increase in the extent of customization and uniqueness of the product leads to corresponding costs and production processes (Bauer et al., 2009). But a trade-off between uniqueness and adequate prices can be noticed as well (Bardakci & Whitelock, 2003; Bauer et al., 2009; Kaplan & Haenlein, 2006; Shen & Ball, 2006). According to Bauer et al. (2009), mass customized products are associated with the need to experiment with the individual’s appearance (e.g. clothing, footwear), the need to highlight one’s individuality, a need for optimization (Hunt, 2006), and the need for uniqueness (Kreuzer, Kühn, & Michel, 2007). During the purchasing process, products are regarded as a bundle of benefits (Lai, 1995) which are evaluated by their anticipated degree of satisfaction (Perrey, 1998; Frank T Piller, 2010). A functional value is the result of tangible or technical features i.e. the capacity of a product (Bauer et al., 2009; Vershofen, 1959). Social (Lai, 1995), prestige (Vershofen,

Chapter 1 TRENDS, THEORETICAL FRAMEWORK AND THE HMI MODEL OF CUSTOMIZATION
18
1959) or other-oriented benefit (Holbrook, 1996) is the result of emotional and cognitive elements (Bauer et al., 2009; Vershofen, 1959) addressing the user’s inner decision process. Positive affections like enjoyment are evoked by customized products (Babin, Darden, & Griffin, 1994; Lai, 1995) and innovativeness (Lai, 1995; Frank T Piller, 2010). The respective type of a product has a significant impact on the evaluated attractiveness of mass customization offerings (Bauer et al., 2009). They determined the perceived higher benefit of functional and body-fit customization compared to aesthetic customization (cf. the study of Smartphone customization in Fig. 4). Also, the willingness to pay a price premium is influenced by the attractiveness of the customized product (Bauer et al., 2009). Bauer et al. (2009) found that consumers need consultancy, transparency, exchange guarantees, and adherence to delivery time in order to reduce risks of mass customization; which is why there is a preference for offline customization in retail stores. They also identified a need for customization “for technological products and clothing followed by furniture, accessories, sportswear and means of transport” (Frank T Piller, 2010).

Chapter 1 TRENDS, THEORETICAL FRAMEWORK AND THE HMI MODEL OF CUSTOMIZATION
19
Fig. 4 Divergence in physical variants and price sensitivity of aesthetic and functional customization regarding smartphones. Coates (1995) and Piller (1998) distinguish soft and hard customization. Soft customization focuses on activities of R&D, design, and sales to create the image of an individualized product, but with almost unchanged production principles (F. Piller, 2001). Instead, hard customization literally means a tailored production for each product. Customized products can be differentiated in function-inherent, and function-variable products with either initial or repeated adjustment (F. Piller, 2001). The user is enabled to configure a product with pre-defined attributes, a base product with pre-defined interfaces for customization and smart products, that allow a

Chapter 1 TRENDS, THEORETICAL FRAMEWORK AND THE HMI MODEL OF CUSTOMIZATION
20
continuous adaption (F. Piller, 2001). Hancock distinguishes active and passive customization that differ in the focus of the adaptation of the product. Whereas the user adapts the product to his individual preferences (passive customization), a product can also adapt to the user (active customization) (Hancock, Pepe, & Murphy, 2005). Rapid Manufacturing permits a revolution in the application of mass customization, as a product can be realized by fast, flexible, and cost-effective production with a design freedom unconvertible by conventional technologies (Frank T Piller, 2010). Technologies like Rapid Manufacturing (stereolithography, laser sintering, fused deposition molding and 3-D-printing) could enhance the uniqueness of personalized compartments of flexible storage systems by standardized interfaces (chapter 4) by individualized, low volume products without cost-intensive labor, and mass production tooling like injection molding (Christopher Tuck, Ong, Wagner, & Hague, 2009). By subdividing the car interior in conventionally manufactured modules (i.e. the interfaces and adapters inside the trims for mounting diverse compartments) and individualizable ones, flexible storage systems are enabled to change with its users. This also incorporates a paradigm shift from a manufacturing-driven design to a design-driven manufacturing (Stotko & Snow, 2010). Furthermore, additive manufacturing allows a greater degree of design freedom such as undercuts and inner structures (Stotko & Snow, 2010; Christopher Tuck et al., 2009) e.g. designs of Freedom of Creation, and Head over Heels shoe (Zande, Bergmans, Kamperman, & Vorst, 2012). Despite the different forms of customization, this field has attention in the automotive interior design and is worthwhile studying in a PhD thesis. Besides pre-defined interfaces by flexible storage (chapter 4) and pre-defined interior colors and upholstery (chapter 3), smart car interiors apply active customization (Hancock et al., 2005). Smart car interiors create value to users resulting from meaningful interaction and wellbeing through personalization.

Chapter 1 TRENDS, THEORETICAL FRAMEWORK AND THE HMI MODEL OF CUSTOMIZATION
21
1.4 Human-Machine Interaction Theory and Implications for Automotive Customization
In this thesis, the user is the customer, so he [For simplification, users and customers are considered as male and female in this thesis, therefore he is used as gender-neutral pronoun.] has to be considered when designing car interiors, or mobility solutions for customization. Therefore, a conceptual model for customization could be helpful which is linked to Human-Machine interaction (HMI). Technical subsystems have to be adjusted to the capabilities and characteristics of users (Schlick, Bruder, & Luczak, 2010). An often-cited HMI model is the model of Schlick (see Fig. 5) who concentrates on the psychophysical mechanisms of humans during data processing (2010). The model concludes that a fast and unambiguous perception of information and extraction of the relevant information without excessive mental resources enable an intuitive use of the product (Schlick et al., 2010). By comparing the task to previous experiences and mental models, the efficiency can be increased, which result in less adjustment and reprogramming (Hacker & Lindemann, 2002). Additionally, the vectored data processing of the machine to the human via interfaces result in the inner processes of detecting, realizing, and deciding. Therefore, the interface or control design should consider the human perception, memory, problem solving capability, human communication and action. For instance, stimuli and response should correspond to each other (Schlick et al., 2010); this is also known as the principle of stimulus-cognition-reaction compatibility (Wickens & Hollands, 1999). To prevent the user from becoming irritated, any form of feedback to the user is essential for the human-machine-interaction. The information input of the user to the machine by the application of input devices occurs manually, verbally, by gestures, or movements, or vice versa (Schlick et al., 2010). In Schlick’s model, the user’s attention is limited and influenced by situational and environmental impact.

Chapter 1 TRENDS, THEORETICAL FRAMEWORK AND THE HMI MODEL OF CUSTOMIZATION
22
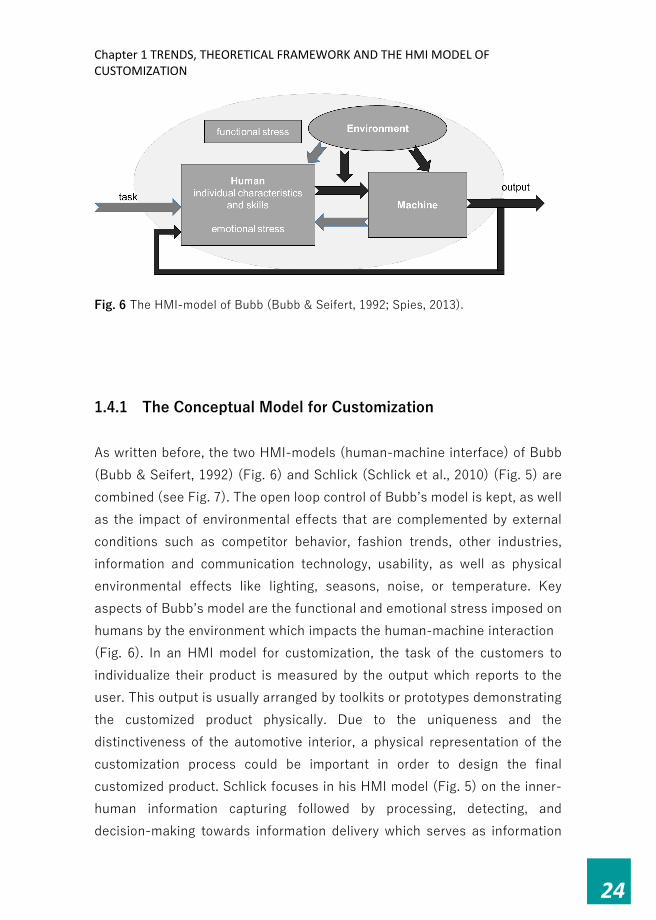
Fig. 5 The HMI-model of Schlick (Schlick et al., 2010). The HMI model of Bubb (Bubb & Seifert, 1992; Spies, 2013) (see Fig. 6) complements the model of Schlick by describing the environmental impact on either the human, machine, or the communication path of data input and data output. The resulting effect of this environmental impact evokes stress for the human while operating the machine, e.g. working on a laptop or tablet with reflecting screens in bright sunlight. The human and machine connected by the data in- and output form a closed loop that allows an information exchange between driver and machine via controls, interfaces, and displays such as the heat switches, radio or driving controls. The result of the operation of the controls is reported to the user by various senses, so the feedback to the user is either visual, haptic, auditory, kinesthetic, or olfactory. A continuous target performance comparison is thereby monitored and corrected if necessary (Bubb & Seifert, 1992; Spies, 2013). The closed loop of HMI is in balance as long as the user is able to operate the machine as expected and aligned with his capabilities. Environmental impacts could change this balance and induce further stress on the user aside from task and capabilities and can influence the comfort and discomfort of users. The

Chapter 1 TRENDS, THEORETICAL FRAMEWORK AND THE HMI MODEL OF CUSTOMIZATION
23
environmental impact by interaction of user and product have to be considered in the design stage regarding positive effects (Mynatt, Melenhorst, Fisk, & Rogers, 2004) and negative effects (K. Vicente, 2004; K. J. Vicente, Mumaw, & Roth, 2004). For instance, in car interior designs any distraction from the driver has to be prevented such as surfaces producing glare. Consequently, while designing customized car interiors and thus the direct interaction with users’ comfort, and discomfort are further aspects that have to be considered for this thesis. For instance, the model of De Looze et al. (2003) describes discomfort, comfort, and related factors while seated. The model differentiates human, product, and contextual factors and complements the aspects of expectations, emotions, and wellbeing (De Looze et al., 2003). Those theoretical models are also relevant for customization, for instance, in the customization process using toolkits or in interacting with technical systems enabling customization (cf. cases of adaptive customization of chapters 5 and 6). Tailored solutions require a certain customer profiling (ADL, 2014). In chapter 1.3, the customization process is related between the consumer and manufacturer, but also between consumer and product (cf. Fig. 7). This chapter focuses on the relationship between consumer and product which evolves from the initial purchase experience by support in order to adapt the product to one’s preferences (Boër & Dulio, 2007).
Chapter 1 TRENDS, THEORETICAL FRAMEWORK AND THE HMI MODEL OF CUSTOMIZATION
24
Fig. 6 The HMI-model of Bubb (Bubb & Seifert, 1992; Spies, 2013).
1.4.1 The Conceptual Model for Customization As written before, the two HMI-models (human-machine interface) of Bubb (Bubb & Seifert, 1992) (Fig. 6) and Schlick (Schlick et al., 2010) (Fig. 5) are combined (see Fig. 7). The open loop control of Bubb’s model is kept, as well as the impact of environmental effects that are complemented by external conditions such as competitor behavior, fashion trends, other industries, information and communication technology, usability, as well as physical environmental effects like lighting, seasons, noise, or temperature. Key aspects of Bubb’s model are the functional and emotional stress imposed on humans by the environment which impacts the human-machine interaction (Fig. 6). In an HMI model for customization, the task of the customers to individualize their product is measured by the output which reports to the user. This output is usually arranged by toolkits or prototypes demonstrating the customized product physically. Due to the uniqueness and the distinctiveness of the automotive interior, a physical representation of the customization process could be important in order to design the final customized product. Schlick focuses in his HMI model (Fig. 5) on the inner-human information capturing followed by processing, detecting, and decision-making towards information delivery which serves as information

Chapter 1 TRENDS, THEORETICAL FRAMEWORK AND THE HMI MODEL OF CUSTOMIZATION
25
input for the machine. The information output, on the other hand, gives the user feedback on his customization efforts by physical responses. The inner human decision processes are influenced by the user’s motivation for the customization task, as well as a distinct need for uniqueness and customization. For instance, by customizing a user interface, the user's relationship to the technology becomes emotional rather than cognitive (Tractinsky & Zmiri, 2006); (Eric Gould Bear quoted in Koeppel, 2000). There is also a causal relationship between the initial physical stimulus and the psychological response despite the extant physiological link (Sheppard, 1968). Also, the customer’s memory and experiences affect the interaction with customization toolkits or products enabling individualization. This HMI Model of customization will be used in this PhD thesis and in the epilogue the usefulness of the model will be evaluated.
Fig. 7 HMI Model of customization based on the models of Schlick et al. 2010 and Bubb & Seiffert, 1992

Chapter 1 TRENDS, THEORETICAL FRAMEWORK AND THE HMI MODEL OF CUSTOMIZATION
26
1.4.1.1 The Customer - Visual Perception In the model for customization, the customer is one of the key factors. His visual perception is one of the determining modes of information reception, especially concerning aesthetic customization (Norman, 1988). As in some of the experiments in this PhD thesis, research is done on color preferences as part of the customer preference; some background is presented in this chapter. In order to understand the ramifications, investigating the function of the human sensory perception can be helpful. According to Sheppard, ‘the human visual system does not behave as an inorganic instrument, but rather … as a dynamic, rapidly changing, extremely complex biological system’ (Sheppard, 1968). Visual information is also the first impression of comfort (Vink, Overbeeke, & Desmet, 2005), but can be misleading (Bronkhorst et al., 2001). Form, shape, color, and texture/ material are also relevant visual input, but regarding customization, color adaption is a typical type of stylistic or aesthetic customization (Bauer et al., 2009; F. Piller, 2001; Frank T Piller, 2010). The change of the color of an object is an opportunity to customize it. However, the user’s color vision or color classification might influence his motivation for individualization. At the same time, color is an essential element for the user to receive the information while customizing a product. It is therefore an opportunity for customization toolkits. Color is first noticed through the visual cortex as a cerebral sensation, second as a projection and third as an identification of the color image with the object (Verity, 1980). Biologically the retinal receptors are differentiated according to the field of application, i.e. the nearly achromatic rods only working in dim lighting conditions and the receptors active in bright lighting conditions with fully developed color vision (Sheppard, 1968). Aside from the biological processes, Katz assumed that color perception is influenced by personal experiences and is therefore highly individual and not easily transferable (Katz, 1979). Newton’s discoveries resulted in the color dimensions: hue (i.e. a brilliant color fully saturated), value (i.e. ranging from very pale to very dark in the monochromatic world), and intensity (i.e. the ratio of the pure color to grayness), which serve to characterize a distinct color (Newton, 1979; Verity,

Chapter 1 TRENDS, THEORETICAL FRAMEWORK AND THE HMI MODEL OF CUSTOMIZATION
27
1980). However, we know that the color we perceive is influenced by other factors as well like context (e.g. adjacent colors) and previous experiences (Bakker, 2014). In order to follow the need for organizing colors in an increasingly complex world, different classification systems emerged incorporating the three-color dimensions (Verity, 1980). Focusing on the different classifications regarding the hue, the Ostwald system distinguishes 8 colors (yellow, orange, red, purple, blue, turquoise, sea-green and leaf-green) (Ostwald, 1931). However, Munsell differentiates 10 principal hues: red, yellow-red, yellow, green-yellow, green, blue-green, blue, purple-blue, purple and red-purple (Munsell, 1926). Hering’s psycho-physical approach again differs and distinguishes 6 colors: red, yellow, green, blue, white and black (Hering, 1964). New dyes and pigments are discovered and shown in the I.E.I. Color Atlas postulating 1379 pure colors, that can be multiplied by values of gray resulting in 27,500 colors. This means that a trained human is able to distinguish 250 hues, 17,000 gray, black, or white modifications of the hues and 300 grays only between black and white (Verity, 1980). Other categories to classify colors could be: contrast of hue, light-dark contrast, cold-warm contrast, complementary contrast, simultaneous contrast, contrast of saturation, contrast of extension (Itten & Birren, 1970). However, these classification systems aim at an overlap of either the psychophysical (i.e. characteristics of light) and psychological (i.e. attributes of color sensation) domain of color vision, since the physical domain of color focuses on the spectral intensity of the radiation i.e. the spectral composition (Sheppard, 1968). Because of the complexity of color vision and therefore color preferences, the test methods for color research turn out to be very diverse. For instance, Bakker used questionnaires mentioning the respective name of the color group (Dittmar, 2001). Bakker also indicated that direct measurement techniques e.g. Galvanic Skin Response could be added for triangulation of the subjects’ responses (Bakker, van der Voordt, de Boon, & Vink, 2013). Thus, the subjective evaluation of the sample can be cross-checked by objective data (e.g. Galvanic Skin Response, Facereader) in order to validate the results and their convergence. Color-stimuli could also be used in the

Chapter 1 TRENDS, THEORETICAL FRAMEWORK AND THE HMI MODEL OF CUSTOMIZATION
28
form of 2-inch squares of paper on a neutral gray background (Guilford & Smith, 1959). Zentner used cardboard rectangles in 7 different hues, varying in saturation and brightness and facial expressions of emotions in order to establish ‘a link between emotion and brightness’ (Zentner, 2001). Observation and quantification of colors used in private homes and clothes or pacifiers can also serve as a means to collect data (Pomerleau, Bolduc, Malcuit, & Cossette, 1990). Reliable and spontaneous affective discriminations by like/ dislike can also be used for color preference research, albeit any differentiation in brightness, hue, and saturation might be too detailed to perceive a color and to make a decision about its preferences (Zajonc, 1980). Regarding the interaction of color preferences in association with objects, ‘‘contextless’’ colored squares could be used with the application of the color on imagined objects in comparison to colored depictions of these objects and to actual physical objects (Schloss, Strauss, & Palmer, 2013). Further techniques in measuring color preferences are the 7-point semantic differential scales by Cubukcu who manipulated images of colored objects e.g. (Cubukcu & Kahraman, 2008). Kwallek found differences in relation to the color, e.g. a better performance in blue and red offices than in white ones. Kwallek used a profile of six mood factors in bipolar scales to highlight gender differences caused by the saturation level and the sample’s dislike for orange and purple offices along with a definite preference for beige and white offices (Kwallek, Lewis, Lin-Hsiao, & Woodson, 1996). Crowley proved red and blue as appropriate colors for activation; green should be avoided. There has been a relationship between clothes and interiors since the early era of humankind, based on covering the body and interiors with textiles (Brown & Farrelly, 2012). People even tend to dress their environment as they dress their bodies (Ulusoy & Nilgün, 2016). So, the effects of distinct colors on users and their preferences are varying according to external factors such as the colored object (offices, buildings, walls, squares) and lighting conditions. Therefore,

Chapter 1 TRENDS, THEORETICAL FRAMEWORK AND THE HMI MODEL OF CUSTOMIZATION
29
research techniques should be chosen carefully, as interdependencies cannot be excluded. Colors are a possible element of aesthetic customization as indicated by the application of different personalized desktops of computers, or smartphones, or additional physical features such as sleeves, covers, or other accessories (cf. Fig. 4). This chapter shows that there is no ideal way of studying color preferences. However, all methods have in common that the subjective experience is measured. The effect of color preferences on value creation of customization is investigated further in chapter 3.
1.4.1.2 The Customer - Inner-Human Decision Processes Aside of the customer’s perception, his inner-human decision process influences his willingness to customize a product. The customer is driven by his motivation, memory and experience (cf. Fig. 7) aside of physical aspects in the model of customization (see HMI model of Schlick, 2010). The human’s internal state regarding predispositions, expectations, needs, motivation, and mood (Hassenzahl & Tractinsky, 2006) are an important part in the HMI-model of customization. This influences the behavior of customers ranging from the decision to personalize a product to purchasing it. Consumers discriminate by valuing differences between similar objects of the same category (Bertini, Wathieu, & Iyengar, 2012). Though the proliferation of choice slightly demotivates customers (Iyengar & Lepper), it is concluded that the density of a product portfolio is a key input for consumers in order to make a decision (Bertini et al., 2012). For instance, quality is commonly mentioned among other buying arguments (see also chapters 2, 4, and 6 of this thesis). In cases when a consumer shows higher sensitivity to quality, he is more willing to pay for high-quality options and less willing to pay for low-quality options influenced by prior expectations (Bertini et al., 2012). There is a certain motivation for internal consistency or for acting in accordance with stable, self-generated preferences, whereas people show considerable
Chapter 1 TRENDS, THEORETICAL FRAMEWORK AND THE HMI MODEL OF CUSTOMIZATION
30
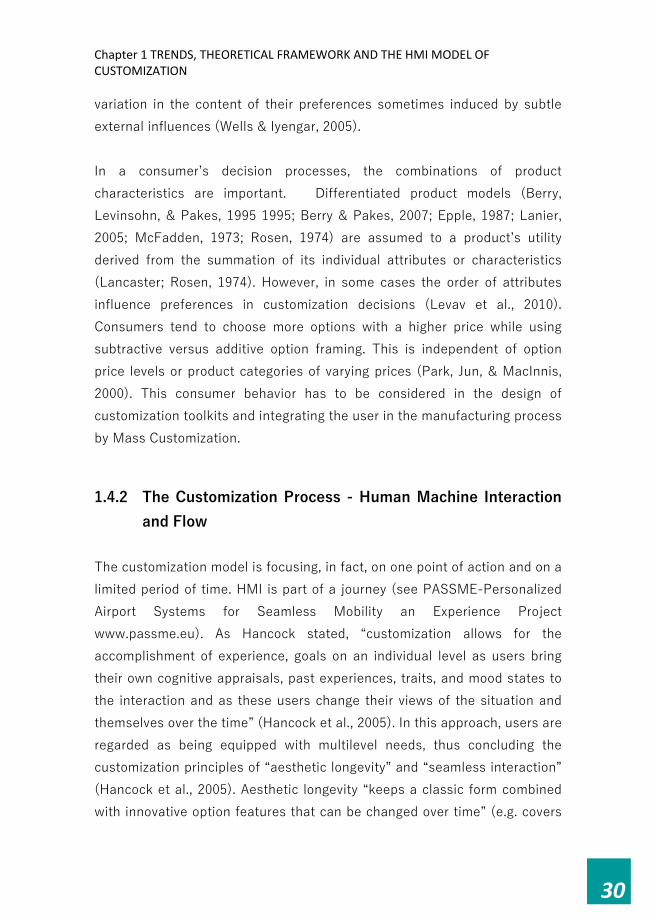
variation in the content of their preferences sometimes induced by subtle external influences (Wells & Iyengar, 2005). In a consumer’s decision processes, the combinations of product characteristics are important. Differentiated product models (Berry, Levinsohn, & Pakes, 1995 1995; Berry & Pakes, 2007; Epple, 1987; Lanier, 2005; McFadden, 1973; Rosen, 1974) are assumed to a product’s utility derived from the summation of its individual attributes or characteristics (Lancaster; Rosen, 1974). However, in some cases the order of attributes influence preferences in customization decisions (Levav et al., 2010). Consumers tend to choose more options with a higher price while using subtractive versus additive option framing. This is independent of option price levels or product categories of varying prices (Park, Jun, & MacInnis, 2000). This consumer behavior has to be considered in the design of customization toolkits and integrating the user in the manufacturing process by Mass Customization.
1.4.2 The Customization Process - Human Machine Interaction and Flow
The customization model is focusing, in fact, on one point of action and on a limited period of time. HMI is part of a journey (see PASSME-Personalized Airport Systems for Seamless Mobility an Experience Project www.passme.eu). As Hancock stated, “customization allows for the accomplishment of experience, goals on an individual level as users bring their own cognitive appraisals, past experiences, traits, and mood states to the interaction and as these users change their views of the situation and themselves over the time” (Hancock et al., 2005). In this approach, users are regarded as being equipped with multilevel needs, thus concluding the customization principles of “aesthetic longevity” and “seamless interaction” (Hancock et al., 2005). Aesthetic longevity “keeps a classic form combined with innovative option features that can be changed over time” (e.g. covers

Chapter 1 TRENDS, THEORETICAL FRAMEWORK AND THE HMI MODEL OF CUSTOMIZATION
31
of smartphones) (Hancock et al., 2005). In this context, Hancock describes this as “maintaining the balance between typicality and novelty” (2005; p. 12). Seamless interaction can be depicted as a product becoming an “unconscious extension of the user” (Hancock et al., 2005). In line with this reasoning, the theory on flow is interesting as it represents a positive experience to users. Among the motivation theories involving human product interaction, flow can be understood as a distinctive one. The concept of flow, which was introduced by Csikszentmihalyi in 1975, describes a state when a human is completely absorbed by an activity without realizing place, time (Csikszentmihalyi, Abuhamdeh, & Nakamura, 2005; Jackson & Marsh, 1996), or effort, so literally without any self-conscious reflections (Csikszentmihalyi, 1975). Simultaneously, subjects exhibit a feeling of control. So, this optimal experience with “autotelic nature” (Engeser, 2012): from the Greek “auto,” meaning self, and “telos,” meaning goal or purpose was first observed among artists and turned today to the perspective of “positive psychology” (Snyder & Fromkin, 2012) with an almost unchanged definition of flow (Engeser, 2012). Additionally, flow is referred to as a holistic sensation with multifaceted characteristics without obvious external rewards (Csikszentmihalyi, 1975; Engeser, 2012). Consequently, a measurement of flow is complex. Rheinberg argues, that Csikszentmihalyi’s Experience Sampling Method only focuses on the individually above average fit of challenge and skills for reasoning flow, but not its multifaceted components (i.e. merging of action and awareness, centering of attention, loss of self-consciousness, feeling of control, coherent, noncontradictory demands, and autotelic nature) separately (Rheinberg, Vollmeyer, & Engeser, 2003). Ellis refined the flow model to the four-channel model of high and low levels of challenge and skills in which flow is only possible to emerge beyond anxiety and boredom (Ellis, Voelkl, & Morris, 1994). In computer gaming a correlation of the flow level and high-arousal positive emotions can be identified despite gradual challenges in a competitive environment (Nacke & Lindley, 2008). However, flow should not be mistaken for happiness, but rather as an optimal experience with high activation resulting in happiness afterwards (Aellig, 2004; Csikszentmihalyi, 1997; Csikszentmihalyi & LeFevre, 1989; Rheinberg,

Chapter 1 TRENDS, THEORETICAL FRAMEWORK AND THE HMI MODEL OF CUSTOMIZATION
32
Manig, Kliegl, Engeser, & Vollmeyer, 2007; Rogatko, 2009; Schallberger & Pfister, 2001). In case of a state in which implicit and explicit motive match, intrinsic motivation is the resulting consequence followed by intrinsic motivation and enjoyment (Schattke, 2011 Schultheiss/ Brunstein, 1999, Deci/ Ryan, 2000) (Rheinberg, 2002). In further models, such as Kehr’s compensatory model of motivation and volition, intrinsic motivation is described as a fundamental condition for flow experience (Kehr, 2004b), though Kehr expects that flow experience maintains despite high skills as long as implicit motives are activated (Kehr, 2004a). These theories are especially interesting for the design of adaptable systems aiming to flow related experiences by predicting the user’s intentions and choices, and considering situational data input (adaptable driving system of chapter 5).
1.4.3 The Customizable Product The customized product, as the result of the integration of the user in the design process, is the third key factor of the HMI model of customization. Product experience was emphasized due to a shift to user-centered design research (Margolin, 1997; Redström, 2006; Sonneveld, 2006). Kamp (2011) indicated the importance of the user’s interaction with a product beyond information about physical and cognitive abilities. She reasons that “the user’s expectations, goals, standards, values” are decisive “to create pleasurable product experiences that contribute to the well-being” (Kamp, p. 15, 2011). Norman (Norman, 1988) uses the image of “a philosophy based on the needs and interests of the user, with an emphasis of making products usable and understandable”. Later he integrated emotions in his user-centered design approach (Norman, 2005) and distinguished three levels in his appraisal process, i.e. visceral (product appearance), behavioral and reflective (both human inherent processes). The focus lays upon affectional responses such as decision-making or wellbeing (Hassenzahl & Tractinsky, 2006; Loewenstein & Lerner, 2003; Suh, Diener, & Fujita, 1996). Additionally, a product’s “Affective Computing” (Picard & Picard, 1997) aims to sense the user’s affect, and adapt to it or express its own affective responses (Picard

Chapter 1 TRENDS, THEORETICAL FRAMEWORK AND THE HMI MODEL OF CUSTOMIZATION
33
& Klein, 2002), (Hudlicka, 2003). However, emotions are intense and maintain only briefly (P. Desmet, 2002; Ekman, 1994; Russo, 2010). According to Kamp (p. 26, 2011), “a pleasurable product experience is defined as an awareness of pleasurable emotions and feelings elicited by the interaction with a product and is a consequence of the user, the characteristics of the designed product, and the context”. The principle of “use-centered design” shifted products from property to contextual relationships between users and products (Flach & Dominguez, 1995). Therefore, Hancock et al. (2005) developed a hierarchical model ranking the needs products should fulfill (Fig. 8). The ergonomic needs such as safety, functionality, and usability represent basic requirements to users comparable to Maslow’s hygiene factors (1970; Maslow’s hierarchical model of optimization of human satisfaction). Pleasurable experience and individuation define the hedonomic needs in the model (Hancock et al., 2005). Comparable to Maslow’s hierarchical structure, the ergonomic needs have to be fulfilled first in order to reach the hedonomic needs (Hancock et al., 2005).

Chapter 1 TRENDS, THEORETICAL FRAMEWORK AND THE HMI MODEL OF CUSTOMIZATION
34
Fig. 8 Hancock’s hierarchy of ergonomic and hedonomic needs (Hancock et al., 2005): Ergonomics and Hedonomics are “synergistic perspectives” with an optimization of HMI (p. 8). Opposing the product experience, user experience focuses on the human side of the human product relationship. Its meanings vary (Forlizzi & Battarbee, 2004) from traditional approaches of task- and work-related usability to an experience-oriented approach (Hassenzahl & Tractinsky, 2006; Whiteside & Wixon, 1987). Therefore, Hassenzahl’s multidimensional model of HCI (human-computer-interaction) concerns the pragmatic aspects of interactive products and their hedonic aspect like stimulation, identification, and evocation; thus, product attributes are linked with human’s needs and values (Hassenzahl, 2003), which determines for a product’s design (Hassenzahl & Tractinsky, 2006). Beyond the user’s internal state, the characteristics of the system, i.e. its purpose or complexity, environmental and situational facets result in user experience (Hassenzahl & Tractinsky, 2006). The application of interfaces represents the system’s part, which is also relevant for customization toolkits. For instance, a computer skins’ usability has a strong

Chapter 1 TRENDS, THEORETICAL FRAMEWORK AND THE HMI MODEL OF CUSTOMIZATION
35
effect on overall satisfaction, followed by aesthetics and symbolism (Tractinsky & Zmiri, 2006). Both product experience and user experience have the experience-orientation in common. Hassenzahl and Tractinsky (2006) describe an experience as a unique combination of various, interrelated and modifiable aspects e.g. product and internal states of the user (i.e. mood, expectations, active goals) in a defined time frame with a concrete start and end. In the today’s post-material value-oriented society the fulfilment of personal goals such as belongingness and self-expression are more important (Desmet & Pohlmeyer, 2013). For instance, in a pilot study, the enjoyment of a game increased due to customization of the rules. This indicates, that a perceptual change could happen to a product. This observation was drawn from a student workshop and analysis of the questionnaires used in this workshop. The major aim was to investigate different levels of excitement of games and influence of the modification made by the participants (Wagner, Kilincsoy, Reitmeir, & Vink, 2014). The student workshop indicated, that the students experienced more fun and excitement of the same game, equipment, and situational factors (room, group composition, lighting, noise, etc.), when the participants were allowed to customize the rules. For this phenomenon, several theoretical explanations can be found in the literature. For example, Tian defined the consumer’s need for uniqueness as the trait of pursuing differentness relative to others by the purchase and use of consumer goods (Tian, Bearden, & Hunter, 2001). Tian sees the main purpose for customization as the development and enhancement of someone’s self-image and social identity (Tian et al., 2001). Nail (1986) differentiates two major kinds of motivational processes for uniqueness i.e. independent motivation and counterconformity motivation (Nail, 1986). The signaling effect plays an important role by displaying the differentiating objects for both. Nail attributed this to the non-conformity motivation to a need to feel different e.g. due to a threat to the identity in particular among apparently homogeneous groups. Therefore, such an individual is influenced

Chapter 1 TRENDS, THEORETICAL FRAMEWORK AND THE HMI MODEL OF CUSTOMIZATION
36
by the norm behavior of others, but behaves so as to be in non-conformity with the norm (Nail, 1986). Such products serve as recognizable symbols of uniqueness transferring self-image enhancement from the purchased product to its user (Tian et al., 2001). Despite a rather internal psychological process, the user is dependent on the product being a publicly recognized symbol to heighten the social image and consequently the self-image further (Tian et al., 2001). As a result, the individuals experience satisfaction from differentiating consumer possessions because of this threat to their identity (Snyder & Fromkin, 1977). This desire for social differentiation by products enable new product adoption and variety-seeking behavior (McAlister & Pessemier, 1982). A second explanation of the fun and excitement part of the student workshop was investigated regarding relationships with product use. Desmet’s positive design framework distinguishes three aspects as core ingredients: design for pleasure, design for personal significance, and design for virtue, which independently stimulate subjective well-being (Desmet & Pohlmeyer, 2013). Thus, Desmet and Pohlmeyer characterized their “ingredients for positive design” as personal and dependent on the context and life domain. There is a connection between activities, that enhance wellbeing, and objects, that trigger those activities (Diefenbach et al., 2017). The knowledge of the biometry, preferences, and experiences is a further value creation in the sale of customized products (Boër & Dulio, 2007) and could create pleasure, virtue- or wellbeing. This chapter shows the trend that car sharing and personalization could become more important in the future. It will be a challenge to design for shared cars and individualization at the same time. Customization could be a solution to this problem and examples of customization that are applicable in car sharing which help personalization are developed and studied in this PhD thesis. In the following chapters a theoretical background is discussed showing that customization can happen with aesthetics (i.e. style), functionality (i.e. function) and adaptability. The customization of aesthetics

Chapter 1 TRENDS, THEORETICAL FRAMEWORK AND THE HMI MODEL OF CUSTOMIZATION
37
focuses on form, color and shape. In some of the case studies color is studied as a means to personalize a car interior. Therefore, some background is given on color perception, which shows the context dependency of color perception. Within the areas of aesthetics, functionality, and adaptability, customization can be focused on hard and soft aspects of the customizable product’s manufacturing, and on its active or passive adaption. Customization is in any case related to the interaction between the human and the product. Therefore, a model is derived from the literature describing this respective link: the HMI Model of Customization, which will be evaluated using the case studies in this PhD thesis. The human side was also explored further in this part of the PhD thesis regarding the inner-human decision process, showing that the combination of characteristics of a product are important the following studies have to be done on real products. The resulting reaction of users is investigated in this thesis. Regarding the interaction between human and product, this chapter shows, that the journey of customization also is important. A positive experience could be caused by flow, which is studied in one of the cases. Additionally, the product side is explored. Several studies point to adaptability that end-users can themselves define rules, designs, and functions of games and products. The following chapters describe different experiments using various methods related to the theoretical framework of this chapter. A questionnaire is used to study the impact of customization on personality, customization of the product, or interaction of the acceptance and preference of a product (chapter 2). A crowd sourcing method was used to study user color combination preferences by conducting a web-based user contest (chapter 3). Three designs were derived from this method based on the outcomes to study the effects on users further. In the first interior design, 3D printed storage compartments were mounted by interfaces hidden in the trims for personalization to create individual and flexible storage possibilities (chapter 4). In the second design, the car was enabled to detect the intended driving mode of the user ranging from normal, comfortable to sporty and adjust drivetrain, engine, gear, and chassis settings accordingly. The user’s

Chapter 1 TRENDS, THEORETICAL FRAMEWORK AND THE HMI MODEL OF CUSTOMIZATION
38
reactions to this smart car are then investigated in the context of expectations and experiences (chapter 5). Lastly, an interior design was created in which the ambient lighting was enabled to adjust its color according to either the user’s clothes color or an App (chapter 6). The results of users’ expectations, emotional responses and experiences will be evaluated and linked to the theoretical framework of this chapter. The first activity to be mentioned here is the crowd sourcing method, which is described by von Hippel (Von Hippel, 2005) and further explained in chapter 2.1. This approach is applied by using the community of the BMW Interior Idea contest. This community, consisting of more than 1000 members, created ideas which were evaluated by peers and by a jury. The promising ideas of this contest were further developed in this PhD thesis by using this method, the customers are in some ways already involved. The next chapters will also explain the contest, the development of the ideas, and their evaluation by users.

Chapter 1 TRENDS, THEORETICAL FRAMEWORK AND THE HMI MODEL OF CUSTOMIZATION
39
REFERENCES
ADL. (2014). The Furture of Urban Mobility 2.0 – Imperatives to shape extended mobility ecosystems of tomorrow.
Aellig, S. (2004). Über den Sinn des Unsinns: Flow-Erleben und Wohlbefinden als Anreize für autotelische Tätigkeiten: Waxmann Verlag.
Audenhove, F.-J. V., Korniichuk, O., Dauby, L., & Pourbaix, J. (2014). The Future of urban mobility 2.0: Imperatives to shape extended mobility ecosystems of tomorrow. Retrieved from
Babin, B. J., Darden, W. R., & Griffin, M. (1994). Work and/or fun: measuring hedonic and utilitarian shopping value. Journal of Consumer research, 20(4), 644-656.
Bakker, I. (2014). Uncovering the secrets of a productive environment, A journey through the impact of plants and colour: TU Delft, Delft University of Technology.
Bakker, I., van der Voordt, T. J., de Boon, J., & Vink, P. (2013). Red or blue meeting rooms: does it matter? The impact of colour on perceived productivity, social cohesion and wellbeing. Facilities, 31(1/2), 68-83.
Bardakci, A., & Whitelock, J. (2003). Mass-customisation in marketing: the consumer perspective. Journal of consumer marketing, 20(5), 463-479.
Bauer, H. H., Düll, A., & Jeffery, D. W. (2009). Typology of Potential Benefits of Mass Customization Offerings for Customers: An Exploratory Study of the Customer Perspective. Research in Mass Customization and Personalization: Strategies and Concepts-Applications and Cases, 161.
Berry, S., Levinsohn, J., & Pakes, A. (1995). Automobile prices in market equilibrium. Econometrica: Journal of the Econometric Society, 841-890.
Berry, S., & Pakes, A. (2007). The pure characteristics demand model. International Economic Review, 48(4), 1193-1225.

Chapter 1 TRENDS, THEORETICAL FRAMEWORK AND THE HMI MODEL OF CUSTOMIZATION
40
Bertini, M., Wathieu, L., & Iyengar, S. S. (2012). The discriminating consumer: Product proliferation and willingness to pay for quality. Journal of Marketing Research, 49(1), 39-49.
Beyering, L. (1983). Die „Privates “kommen. Marketing Journal, 16(4), 314-317.
Beyering, L. (1987). Individual marketing: Landsberg a. Lech: Mod. Industrie.
Bloch, P. H. (1981). An exploration into the scaling of consumers' involvement with a product class. NA-Advances in Consumer Research Volume 08.
Boër, C. R., & Dulio, S. (2007). Mass Customization and Footwear. Mass Customization and Footwear: Myth, Salvation or Reality? A Comprehensive Analysis of the Adoption of the Mass Customization Paradigm in Footwear, from the Perspective of the EUROShoE (Extended User Oriented Shoe Enterprise) Research Project, 5-65.
Bronkhorst, R. E., Kuijt-Evers, L., Cremer, R., Rhijn, J. W., van Krause, F., & De Looze, M. P. (2001). Emotie en Comfort in Cabins: Rapportage TNO Basisfinaciering 2000, Team 40. TNO Arbeid Hoofddorp.
Brown, R., & Farrelly, L. (2012). Materials and interior design: Laurence King.
Bubb, H., & Seifert, R. (1992). Struktur des MMS. Menschliche Zuverlässigkeit, 18-20.
Coates, J. F. (1995). Customization promises sharp competitive edge. Research technology management, 38(6), 6.
Csikszentmihalyi, M. (1975). Beyond boredom and anxiety. San Francisco: Jossey-Bass. Csikszentmihalyi, M.(1990). Flow: The psychology of optimal experience. In: New York: Harper Perennial.
Csikszentmihalyi, M. (1997). Finding flow: The psychology of engagement with everyday life: Basic Books.
Csikszentmihalyi, M., Abuhamdeh, S., & Nakamura, J. (2005). Flow In AJ Elliot & C. Dweck. Handbook of competence and motivation, 598-608.
Chapter 1 TRENDS, THEORETICAL FRAMEWORK AND THE HMI MODEL OF CUSTOMIZATION
41
Csikszentmihalyi, M., & LeFevre, J. (1989). Optimal experience in work and leisure. Journal of personality and social psychology, 56(5), 815.
Cubukcu, E., & Kahraman, I. (2008). Hue, saturation, lightness, and building exterior preference: An empirical study in Turkey comparing architects' and nonarchitects' evaluative and cognitive judgments. Color Research & Application, 33(5), 395-405. doi:10.1002/col.20436
Davis, S. (1987). Future perfect. Reading, MA, 106. De Looze, M. P., Kuijt-Evers, L. F., & Van Dieën, J. (2003). Sitting comfort
and discomfort and the relationships with objective measures. Ergonomics, 46(10), 985-997.
Desmet, & Pohlmeyer, A. (2013). Positive design: An introduction to design for subjective well-being. International Journal of Design, 7 (3), 2013.
Desmet, P. (2002). Designing emotions: Delft University of Technology. Department of Industrial Design.
Diefenbach, S., Hassenzahl, M., Eckoldt, K., Hartung, L., Lenz, E., & Laschke, M. (2017). Designing for well-being: a case study of keeping small secrets. The Journal of Positive Psychology, 12(2), 151-158.
Dittmar, M. (2001). Changing Colour Preferences with Ageing: A Comparative Study on Younger and Older Native Germans Aged 19–90 Years. Gerontology, 47(4), 219-226.
Ekman, P. (1994). Moods Emotions and Traits. From P. Ekman, & RJ Davidson (Eds.). The Nature of Emotion: Fundamental Questions (pp. 56-58). In: New York, NY: Oxford University Press.
Ellis, G. D., Voelkl, J. E., & Morris, C. (1994). Measurement and analysis issues with explanation of variance in daily experience using the flow model. Journal of leisure research, 26(4), 337.
Engeser, S. (2012). Advances in flow research: Springer. Engeser, S., & Langens, T. (2010). Mapping explicit social motives of
achievement, power, and affiliation onto the five-factor model of personality. Scandinavian Journal of Psychology, 51(4), 309-318. doi:10.1111/j.1467-9450.2009.00773.x

Chapter 1 TRENDS, THEORETICAL FRAMEWORK AND THE HMI MODEL OF CUSTOMIZATION
42
Epple, D. (1987). Hedonic prices and implicit markets: estimating demand and supply functions for differentiated products. Journal of political economy, 95(1), 59-80.
Flach, J. M., & Dominguez, C. O. (1995). Use-centered design: Integrating the user, instrument, and goal. Ergonomics in Design, 3(3), 19-24.
Forlizzi, J., & Battarbee, K. (2004). Understanding experience in interactive systems. Paper presented at the Proceedings of the 5th conference on Designing interactive systems: processes, practices, methods, and techniques.
Franz, M., Kamp, I., Durt, A., Kilincsoy, Ü., Bubb, H., & Vink, P. (2011). A light weight car seat shaped by human body contour. International Journal of Human Factors Modelling and Simulation, 2(4), 314-326.
Guilford, J. P., & Smith, P. C. (1959). A system of color-preferences. The American Journal of Psychology, 72(4), 487-502.
Hacker, W., & Lindemann, U. (2002). Virtual-Reality-Darstellungen: Hilfe für entwicklungsdenken. Konstruktion(5), 58-61.
Hancock, P. A., Pepe, A. A., & Murphy, L. L. (2005). Hedonomics: The power of positive and pleasurable ergonomics. Ergonomics in Design, 13(1), 8-14.
Hassenzahl, M. (2003). The thing and I: understanding the relationship between user and product. In Funology (pp. 31-42): Springer.
Hassenzahl, M., & Tractinsky, N. (2006). User experience-a research agenda. Behaviour & information technology, 25(2), 91-97.
Hering, E. (1964). Outlines of a theory of the light sense: Harvard University Press.
Holbrook, M. B. (1996). Special session summary customer value C a framework for analysis and research. ACR North American Advances.
Hudlicka, E. (2003). To feel or not to feel: The role of affect in human–computer interaction. International journal of human-computer studies, 59(1), 1-32.
Hunt, D. M. (2006). A consumer perspective on mass customization. University of Missouri--Columbia,

Chapter 1 TRENDS, THEORETICAL FRAMEWORK AND THE HMI MODEL OF CUSTOMIZATION
43
IFMO. (2011). Mobilität junger Menschen im Wandel – multimodaler und weiblicher. Retrieved from
IFMO. (2013). 'Mobility Y' – The Emerging Travel Patterns of Generation Y. Retrieved from Ihl, C., Müller, M., Piller, F., & Reichwald, R. (2006). Kundenzufriedenheit bei
Mass Customization: Eine empirische Untersuchung zur Bedeutung des Co-Design-Prozesses aus Kundensicht. Die Unternehmung, 59(3), 165-184.
Itten, J., & Birren, F. (1970). The elements of color: John Wiley & Sons. Iyengar, S. S., & Lepper, M. R. (2000). When choice is demotivating: Can one
desire too much of a good thing? Journal of personality and social psychology, 79(6), 995.
Jackson, S. A., & Marsh, H. W. (1996). Development and validation of a scale to measure optimal experience: The Flow State Scale. Journal of sport and exercise psychology, 18(1), 17-35.
Kamp, I., Kilincsoy, Ü., & Vink, P. (2011). Chosen postures during specific sitting activities. Ergonomics, 54(11), 1029-1042.
Kaplan, A. M., & Haenlein, M. (2006). Toward a parsimonious definition of traditional and electronic mass customization. Journal of Product Innovation Management, 23(2), 168-182.
Katz, D. (1979). Gestalt psychology, its nature and significance: Greenwood Pub Group.
Kehr, H. M. (2004a). Implicit/explicit motive discrepancies and volitional depletion among managers. Personality and social psychology bulletin, 30(3), 315-327.
Kehr, H. M. (2004b). Integrating implicit motives, explicit motives, and perceived abilities: The compensatory model of work motivation and volition. Academy of management review, 29(3), 479-499.
Koeppel, D. (2000). GUIs just want to have fun: The faceless interface is dead. Long live skins, the hyper-personal edge of desktop computing. Wired [online]. Available at http://www. wired. com/wired/archive/8.10/skins. html. Cited August, 10.

Chapter 1 TRENDS, THEORETICAL FRAMEWORK AND THE HMI MODEL OF CUSTOMIZATION
44
Kreuzer, M., Kühn, R., & Michel, S. (2007). Die praktische Relevanz individualisierbarer Massengüter aus Sicht der Nachfrage. Die Betriebswirtschaft, 67(4), 399.
Kwallek, N., Lewis, C., Lin-Hsiao, J., & Woodson, H. (1996). Effects of nine monochromatic office interior colors on clerical tasks and worker mood. Color Research and Application, 21(6), 448-458.
Lai, A. W. (1995). Consumer values, product benefits and customer value: a consumption behavior approach. ACR North American Advances.
Lancaster, K. J. (1966). A new approach to consumer theory. Journal of political economy, 74(2), 132-157.
Lanier, P. B. a. B. (2005). Demand Estimation with Heterogeneous Consumers and Unobserved Product Characteristics: A Hedonic Approach. J.P.E., 113, 1239–1276.
Levav, J., Heitmann, M., Herrmann, A., & Iyengar, S. S. (2010). Order in product customization decisions: Evidence from field experiments. Journal of political economy, 118(2), 274-299.
Loewenstein, G., & Lerner, J. S. (2003). The role of affect in decision making. Handbook of affective science, 619(642), 3.
Margolin, V. (1997). Getting to know the user. Design studies, 18(3), 227-236.
McAlister, L., & Pessemier, E. (1982). Variety seeking behavior: An interdisciplinary review. Journal of Consumer research, 9(3), 311-322.
McFadden, D. (1973). Conditional logit analysis of qualitative choice behavior.
Munsell, A. (1926). A Color Notation. Ed. 7: 105 p., Illus. In: Bulletin. Mynatt, E. D., Melenhorst, A.-S., Fisk, A.-D., & Rogers, W. A. (2004). Aware
technologies for aging in place: understanding user needs and attitudes. IEEE Pervasive Computing, 3(2), 36-41.
Nacke, L., & Lindley, C. A. (2008). Flow and immersion in first-person shooters: measuring the player's gameplay experience. Paper presented at the Proceedings of the 2008 Conference on Future Play: Research, Play, Share.

Chapter 1 TRENDS, THEORETICAL FRAMEWORK AND THE HMI MODEL OF CUSTOMIZATION
45
Nail, P. R. (1986). Toward an integration of some models and theories of social response. Psychological bulletin, 100(2), 190.
Newton, I. (1979). Opticks, or, a treatise of the reflections, refractions, inflections & colours of light: Courier Corporation.
Norman, D. A. (1988). The psychology of everyday things: Basic books. Norman, D. A. (2005). Emotional design: Why we love (or hate) everyday
things. In: Basic books. Ostwald, W. (1931). Colour science. Park, C. W., Jun, S. Y., & MacInnis, D. J. (2000). Choosing what I want versus
rejecting what I do not want: An application of decision framing to product option choice decisions. Journal of Marketing Research, 37(2), 187-202.
Perrey, J. (1998). Nutzenorientierte Marktsegmentierung im Verkehrsdienstleistungsbereich-dargestellt am Beispiel der Deutschen Bahn AG: Diskussionsbeitrag der Forschungsstelle Bahnmarketing an der Westfälischen Wilhelms-Universität Münster: Wissenschaftliche Gesellschaft für Marketing und Unternehmungsführung.
Picard, R. W., & Klein, J. (2002). Computers that recognise and respond to user emotion: theoretical and practical implications. Interacting with computers, 14(2), 141-169.
Picard, R. W., & Picard, R. (1997). Affective computing (Vol. 252): MIT press Cambridge.
Piller, F. (2001). Mass Customization: Ein wettbewerbsstrategisches Konzept im Informationszeitalter (A competitive strategic concept in the information age). In: German University Press, Wiesbaden.
Piller, F. T. (1998). Kundenindividuelle Massenproduktion: Die Wettbewerbsstrategie der Zukunft: Hanser.
Piller, F. T. (2010). Handbook of research in mass customization and personalization (Vol. 1): World scientific.
Piller, F. T., & Müller, M. (2004). A new marketing approach to mass customisation. International Journal of Computer Integrated Manufacturing, 17(7), 583-593.

Chapter 1 TRENDS, THEORETICAL FRAMEWORK AND THE HMI MODEL OF CUSTOMIZATION
46
Pine, B. J. (1991). Paradigm shift--from mass production to mass customization. Massachusetts Institute of Technology,
Pine, B. J. (1993a). Mass customization: the new frontier in business competition: Harvard Business Press.
Pine, B. J. (1993b). Mass customizing products and services. Planning Review, 21(4), 6-55.
Pine, B. J., & Gilmore, J. H. (1999). The experience economy: work is theatre & every business a stage: Harvard Business Press.
Pine, B. J., Peppers, D., & Rogers, M. (1995). Do you want to keep your customers forever? : Harvard Business Press.
Pomerleau, A., Bolduc, D., Malcuit, G., & Cossette, L. (1990). Pink or blue: Environmental gender stereotypes in the first two years of life. Sex Roles, 22(5-6), 359-367.
Redström, J. (2006). Towards user design? On the shift from object to user as the subject of design. Design studies, 27(2), 123-139.
Reichwald, R., & Piller, F. (2006). Interaktive Wertschöpfung. Open Innovation, Individualisierung und neue Formen der Arbeitsteilung, Wiesbaden, 22009.
Reichwald, R., & Piller, F. T. (2000). Produktionsnetzwerke für die kundenindividuelle massenproduktion. Produktionsmanagement in Unternehmensnetzwerken und Virtuellen Unternehmen. Stuttgart: Springer Physica, 599-628.
Rheinberg, F. (2002). Emotionen in die Tat umsetzen Freude am Kompetenzerwerb, Flow-Erleben und motivpassende Ziele: na.
Rheinberg, F., Manig, Y., Kliegl, R., Engeser, S., & Vollmeyer, R. (2007). Flow bei der Arbeit, doch Glück in der Freizeit: Zielausrichtung, Flow und Glücksgefühle. Zeitschrift für Arbeits-und Organisationspsychologie A&O, 51(3), 105-115.
Rheinberg, F., Vollmeyer, R., & Engeser, S. (2003). Die Erfassung des Flow-Erlebens: na.
Rogatko, T. P. (2009). The influence of flow on positive affect in college students. Journal of Happiness Studies, 10(2), 133.

Chapter 1 TRENDS, THEORETICAL FRAMEWORK AND THE HMI MODEL OF CUSTOMIZATION
47
Rosen, S. (1974). Hedonic prices and implicit markets: product differentiation in pure competition. Journal of political economy, 82(1), 34-55.
Russo, B. (2010). Shoes, Cars, and Other Love Stories: Investigating The Experience of Love for Products. TU Delft, Delft University of Technology,
Salvador, F., De Holan, P. M., & Piller, F. T. (2009). Cracking the code of mass customization. MIT Sloan Management Review, 50(3), 71.
Salvador, F., & Rungtusanatham, M. J. (2009). From Mass Production to Mass Customization: Hindrance Factors, Structural Inertia and Transition Hazard. Research in Mass Customization and Personalization: Strategies and Concepts-Applications and Cases, 21.
Schallberger, U., & Pfister, R. (2001). Flow-Erleben in Arbeit und Freizeit. Eine Untersuchung zum Paradox der Arbeit mit der Experience Sampling Method. Zeitschrift für Arbeits-und Organisationspsychologie, 45(2001), 176-187.
Schattke, K. P. (2011). Flow Experience as Consequence and Self-Determination as Antecedent of Congruence between Implicit and Explicit Motives. München, Technische Universität München, Diss., 2011,
Schenk, M., Seelmann-Eggebert, R., & Piller, F. (2001). Kundenindividuelle Massenproduktion: Von Businessmodellen zu erfolgreichen Anwendungen. Fraunhofer Institut, Frankfurt/aM.
Schlick, C. M., Bruder, R., & Luczak, H. (2010). Arbeitswissenschaft: Springer-Verlag.
Schloss, K. B., Strauss, E. D., & Palmer, S. E. (2013). Object color preferences. Color Research & Application, 38(6), 393-411.
Schneider, P. (1998). Produktindividualisierung als Marketing-Ansatz: na. Shen, A., & Ball, A. D. (2006). HOW DO CUSTOMERS EVALUATE MASS
CUSTOMIZED PRODUCTS? Enhancing Knowledge Development in Marketing, 388.

Chapter 1 TRENDS, THEORETICAL FRAMEWORK AND THE HMI MODEL OF CUSTOMIZATION
48
Sheppard, J. J. (1968). Human color perception: a critical study of the experimental foundation: American Elsevier Pub. Co.
Snyder, C. R., & Fromkin, H. L. (1977). Abnormality as a positive characteristic: The development and validation of a scale measuring need for uniqueness. Journal of Abnormal Psychology, 86(5), 518.
Snyder, C. R., & Fromkin, H. L. (2012). Uniqueness: The human pursuit of difference: Springer Science & Business Media.
Sonneveld, M. H. (2006). Aesthetics of tactual experience. (Dissertation), TU Delft,
Spies, R. (2013). Entwicklung und Evaluierungen eines Touchpadbedienkonzepts mit adaptiv haptisch veränderlicher Oberfläche zur Menübedienung im Fahrzeug. München, Technische Universität München, Diss., 2013,
Steck, W. (2003). Die Individualisierung der Kundenbeziehung im Finanzdienstleistungsbereich: Analyse der Marktentwicklungen und Ansätze zur wirtschaftlichen Gestaltung: Kovač.
Stotko, C., & Snow, A. (2010). e-Manufacturing–Making Extreme Mass Customization Real by Laser-Sintering. In Handbook of Research in Mass Customization and Personalization: (In 2 Volumes) (pp. 555-567): World Scientific.
Suh, E., Diener, E., & Fujita, F. (1996). Events and subjective well-being: only recent events matter. Journal of personality and social psychology, 70(5), 1091.
Tian, K. T., Bearden, W. O., & Hunter, G. L. (2001). Consumers' need for uniqueness: Scale development and validation. Journal of Consumer research, 28(1), 50-66.
Tractinsky, N., & Zmiri, D. (2006). Exploring attributes of skins as potential antecedents of emotion in HCI. Aesthetic computing, 405-422.
Tuck, C., Campbell, R., Hague, R., & Ruffo, M. (2005). Customized aircrew seating utilizing rapid manufacturing. Paper presented at the Rapdasa 6th Annual International Conference on Rapid Product Development. Pretoria, South Africa.

Chapter 1 TRENDS, THEORETICAL FRAMEWORK AND THE HMI MODEL OF CUSTOMIZATION
49
Tuck, C., & Hague, R. (2006). The pivotal role of rapid manufacturing in the production of cost-effective customised products. International Journal of Mass Customisation, 1(2-3), 360-373.
Tuck, C., Ong, M.-H., Wagner, H., & Hague, R. (2009). Extreme Customization: Rapid Manufacturing Products that Enhance the Consumer. World Scientific Book Chapters, 537-554.
Tully, C. (2011). Mobilisierung des Mobilen Trends in der Jugendmobilitaet: Anmerkungen zur Veraenderung im Mobilitaetsverhalten/Mobilizing the mobile trends in youth mobility. NAHVERKEHR, 29(7/8).
Ulusoy, B., & Nilgün, O. (2016). Understanding responses to materials and colors in interiors. Color Research & Application.
Verity, E. (1980). Color observed: Van Nostrand Reinhold Company. Vershofen, W. (1959). Die Marktentnahme als Kernstück der
Wirtschaftsforschung: Heymann. Vicente, K. (2004). The Human Factor: Revolutionizing the way people live
with technology Routledge. New York. Vicente, K. J., Mumaw, R. J., & Roth, E. M. (2004). Operator monitoring in a
complex dynamic work environment: A qualitative cognitive model based on field observations. Theoretical Issues in Ergonomics Science, 5(5), 359-384.
Vink, P., Overbeeke, C., & Desmet, P. (2005). Comfort experience. Von Hippel, E. (2005). Democratizing innovation: The evolving phenomenon
of user innovation. Journal für Betriebswirtschaft, 55(1), 63-78. Wagner, A.-S., Kilincsoy, Ü., Reitmeir, M., & Vink, P. (2014). Adaptive
Customization –Value Creation by Adaptive Lighting in the Car Interior. In P. Vink (Ed.), Advances in Social and Organizational Factors
(pp. 40-50): AHFE Conference. Wells, R. E., & Iyengar, S. S. (2005). Positive illusions of preference
consistency: When remaining eluded by one’s preferences yields greater subjective well-being and decision outcomes. Organizational behavior and human decision processes, 98(1), 66-87.

Chapter 1 TRENDS, THEORETICAL FRAMEWORK AND THE HMI MODEL OF CUSTOMIZATION
50
Whiteside, J., & Wixon, D. (1987). The dialectic of usability engineering. Human-Computer Interac-tion—INTERACT, 87, 17-20.
Wickens, C., & Hollands, J. (1999). Engineering Psychology and Human Performance, Prentice Hall. Englewood Cliffs.
Winterhoff, M., Kahner, C., Ulrich, D. C., Sayler, P., & Wenzel, E. (2009). Future of Mobility 2020 – the Automotive Industry in Upheaval? Retrieved from www.adl.com/mobility-2020:
Zahn, E. (1996). Produktionswirtschaft: Grundlagen und operatives Produktionsmanagement: mit 42 Tabellen. 1 (Vol. 1): Lucius & Lucius DE.
Zajonc, R. B. (1980). Feeling and thinking: Preferences need no inferences. American psychologist, 35(2), 151.
Zande, M. v. d., Bergmans, S., Kamperman, N., & Vorst, B. v. d. (2012). Customization of Consumer Goods: First Steps to Fully Customizable Fashionable Ladies' Shoes. In Handbook of Research in Mass Customization and Personalization (pp. 581-589): World Scientific Publishing Company.
Zentner, M. R. (2001). Preferences for colours and colour‐‐emotion combinations in early childhood. Developmental Science, 4(4), 389-398.
Zipkin, P. (2001). The limits of mass customization. MIT Sloan Management Review, 42(3), 81.

Chapter 1 TRENDS, THEORETICAL FRAMEWORK AND THE HMI MODEL OF CUSTOMIZATION
51

Chapter 1 TRENDS, THEORETICAL FRAMEWORK AND THE HMI MODEL OF CUSTOMIZATION
52
Part II The Need for Customization as a means to enforce Automobile Involvement of Generation Y

Chapter 2 Motives for Car Purchases, Automotive Customization and Wellbeing
53
Chapter 2 Motives for Car Purchases, Automotive
Customization and Wellbeing
1 Introduction In urban areas, the mobility demand, especially of the Generation Y, changes from traditional car possession to a network of different modes of transportation of temporary usage (shared mobility concepts: car or bike sharing complemented by public transport) (IFMO, ADL, McKinsey). Customization of car interiors could influence both the traditional and emerging mobility behavior patterns. However, other factors like design, seat comfort and reputation could influence buying behavior as well. For instance, Vink et al. (Vink, Overbeeke, & Desmet, 2005) showed that seating comfort could play a role in purchasing a car. Additionally, the reputation of the product and manufacturer is important in conveying information to customers and is associated with product quality (Kay, 1993). As it is not clear which of these factors favor a purchase decision, an insight in characteristics are studied, that are influencing this decision. First, the elements in customization that are important to users are studied. For instance, quality, reputation, seat comfort, interior and exterior design could be such elements. Second, the fun and excitement element of customization is studied further to determine the importance in product purchase and use. For instance, in a pilot study on fun and excitement (Wagner, Kilincsoy, Reitmeir, & Vink, 2014) an increase in enjoyment could be determined by individualizing the rules of a game (this behavior can be regarded as a kind of customization) as is described in the previous chapter. Additionally, the expected wellbeing could influence the choice as it is mentioned in the literature as an aspect to appreciate product design (Norman, 2005). It is hypothesized, that a connection can be established between relevant buying motives and sensory impressions of car interiors to a certain need for customization. In order to develop a tool for studying customization, the three

Chapter 2 Motives for Car Purchases, Automotive Customization and Wellbeing
54
key factors of the HMI Model of Customization were considered: customers, customization process and customized product (cf. Fig. 7). Those factors are structuring the customization scale in three dimensions. The objective of this thesis is to explore how customization of car interiors is influenced by involving the end user in the design process through value creation. The idea of the PhD thesis is, that the car interiors are supposed to adapt to an individual customer or to multiple users (i.e. relevant in cases of shared mobility concepts, or retail markets). Therefore, getting insight on the hidden customization ideas and buying motivations of customers is relevant. In order to gain information on these aspects, an online survey was conducted and subjects from various backgrounds were included. As the popularity of cars among representatives the Generation Y decreases in saturated markets (IFMO, 2011), this generation Y is used in the survey regarding their car preferences to identify underlying motives. The research question if there is a user’s need for customization that enforces automobile involvement is investigated by the following four hypotheses:
1. Customizing products is positively correlated to the buying motivation of cars.
2. A scale for automotive customization is a useful technique to identify this need.
3. There are interdependencies of customization and validated scales such as innovativeness and automobile involvement.
4. Wellbeing and customization can enhance a product’s value for users. The fourth hypothesis incorporates the connection of fun and enjoyment by customization drawn from the observation of the student workshop in more detail.

Chapter 2 Motives for Car Purchases, Automotive Customization and Wellbeing
55
2 Methodology To study if there is a need for customization, automobile involvement, consumer innovativeness and wellbeing, a survey was introduced within the framework of a web-based idea contest. By using this platform, it was possible to gather a sample consisting of international participants who were invited by messaging in social networking platforms (53.3%) and banners on websites (15.0%). 2.1 Participants The community of the BMW Interior Idea Contest consisted of 1075 members from which 358 active members handed in one or more product ideas or configured designs. Aside from the contest, members could participate in this online survey on Automotive Customization. A link could be established to the contest by the user name for 88 participants out of 159 (the gathered data was anonymized); 37 left the survey immediately, 60 subjects completed it. More females (n = 53) than males (n = 7) participated in the survey. The sample’s age focused majorly on 20ies and 30ies (28.3% 20 to 24 years; 18.3% 25 to 29 years; 15.0% 30 to 34 years; 11.7% 35 to 39 years). Regarding the subjects’ cultural background, numerous nationalities could be found, for instance Bosnia and Herzegovina, Canada, Portugal, Romania, Sweden and the UK (all 3.3%). The majority were of US (21.7%), Indish (8.3%) and Turkish (5.0%) descent. None of the subjects were biased by car brand favors. 2.2 Questionnaire set-up and scale development Some of the psychological traits were measured with existing and tested scales, all on a 5-point Likert scale from strongly disagree to fully agree. For instance, seven items of the innovativeness scale of Manning et al. (Manning, Bearden, & Madden, 1995) were used, as well as the IPCA scale for automobile involvement by Bloch (Bloch, 1981).
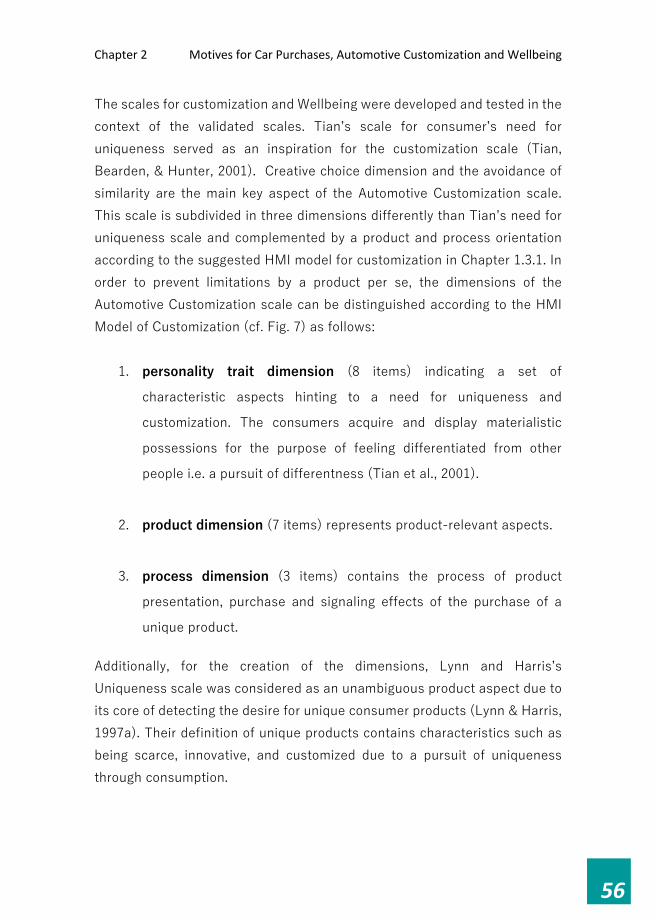
Chapter 2 Motives for Car Purchases, Automotive Customization and Wellbeing
56
The scales for customization and Wellbeing were developed and tested in the context of the validated scales. Tian’s scale for consumer’s need for uniqueness served as an inspiration for the customization scale (Tian, Bearden, & Hunter, 2001). Creative choice dimension and the avoidance of similarity are the main key aspect of the Automotive Customization scale. This scale is subdivided in three dimensions differently than Tian’s need for uniqueness scale and complemented by a product and process orientation according to the suggested HMI model for customization in Chapter 1.3.1. In order to prevent limitations by a product per se, the dimensions of the Automotive Customization scale can be distinguished according to the HMI Model of Customization (cf. Fig. 7) as follows:
1. personality trait dimension (8 items) indicating a set of
characteristic aspects hinting to a need for uniqueness and
customization. The consumers acquire and display materialistic
possessions for the purpose of feeling differentiated from other
people i.e. a pursuit of differentness (Tian et al., 2001).
2. product dimension (7 items) represents product-relevant aspects.
3. process dimension (3 items) contains the process of product
presentation, purchase and signaling effects of the purchase of a
unique product.
Additionally, for the creation of the dimensions, Lynn and Harris’s Uniqueness scale was considered as an unambiguous product aspect due to its core of detecting the desire for unique consumer products (Lynn & Harris, 1997a). Their definition of unique products contains characteristics such as being scarce, innovative, and customized due to a pursuit of uniqueness through consumption.

Chapter 2 Motives for Car Purchases, Automotive Customization and Wellbeing
57
In the design of the scale, the independent motivation and counterconformity motivation are considered, as both consumer behavior processes are relevant for the individualizing car interiors. The wellbeing construct was derived from the Oxford Happiness Questionnaire (Hills & Argyle, 2002). After relating the items explicitly to cars, this yields to the following eight dimensions:
1. self-respect dimension (2 items)
2. security dimension (2 items)
3. warm relationship with others dimension (4 items)
4. sense of accomplishment dimension (3 items)
5. self-fulfillment dimension (3 items)
6. being well respected dimension (3 items)
7. sense of accomplishment dimension (3 items)
8. fun and enjoyment (happiness) in life dimension (4 items)
The buying preferences were deduced from an expert interview on product clinics with Dr. Wiegand (BMW). A catalogue of 21 preferences of car purchase motives rated on a 5-point Likert scale from not important to highly important was applied in the study. The characteristics reached from exterior design, fuel consumption, storage capacity, convenience, ease of use, interior design, sportiness, overall quality, variability in interior, interior storage spaces, roominess, seating comfort, user friendliness, reliability, environmental friendliness, brand image, reputation of the manufacturer, safety, price-performance ratio, quality of the interior, and materials used in the interior. The sensory experiences relevant for car interiors are focusing on the haptic touch of interior components, a premium appearance of materials in use, the distinctive new car odor, and the appearance. Thus, summing up all relevant sensory perceptions of car users.

Chapter 2 Motives for Car Purchases, Automotive Customization and Wellbeing
58
2.3 Measurements An analysis of mean, frequency distribution and standard deviation for the constructs of innovativeness, automobile involvement, customization and wellbeing were conducted. The buying preferences of the subjects were investigated, followed by a deeper analysis of the Pearson correlations of the items and the catalogue of purchase reasons. By a regression analysis with the Enter method, interdependencies of the scales were examined. The ratio of agreement for the customization and wellbeing construct, and an ANOVA with Bonferroni test in relation to the midpoint scale of 3.0 (5-point Likert Scale: 1 = unimportant to 5 = highly important) were studied in order to determine the validity of the approach for the approval of personalization. 3 Results The sociodemographic data of the survey illustrates a young to middle aged group, i.e. representatives of the Generation Y. Thus, the majority of the sample seems to be in the life stage of: being a student (28.7%), working as an employee (18.3%) or being self-employed (16.7%). Also, lifestyles without children (66.7%) outweigh those with children (30.0%) (with 3.3% subjects not answering that question). These findings contribute to characteristics, that can be related to the Generation Y. As indicated in Chapter 1, this focus group questions the possession of cars in several studies (IFMO, 2011, 2013). In comparison to the population area of the sample the majority seems to live in major cities (51.7%), small towns (33.0%) or megacities (8.3%); only 6.7% live in rural areas where the car still is the main mode of transportation. Most subjects own one or two middle-class or lower middle-class cars (21.7% hatchback, 30.0% sedan, 8.7% SUV, 6.7% coupé) and are commuting 11 to 100 kilometers.
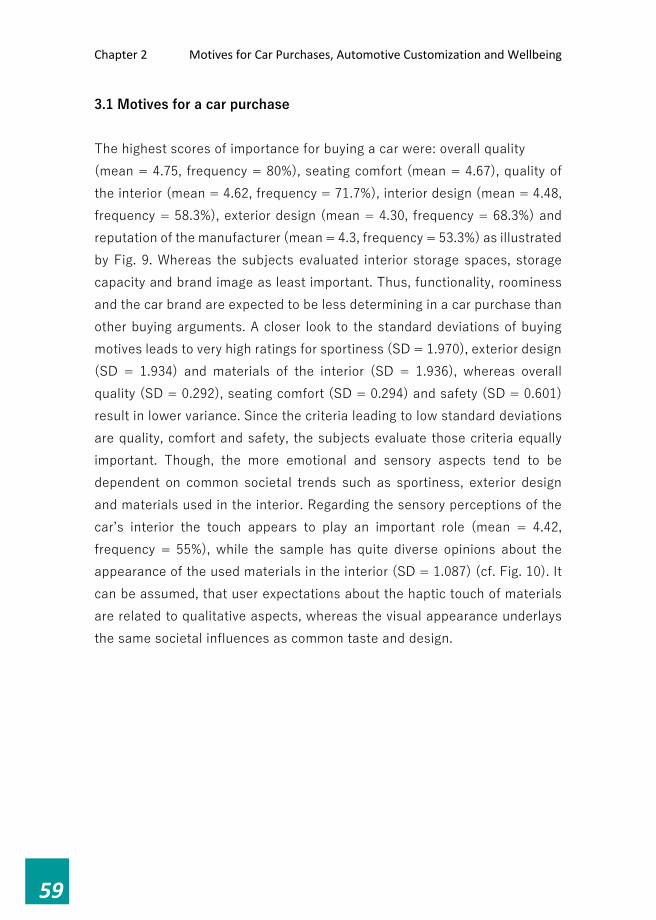
Chapter 2 Motives for Car Purchases, Automotive Customization and Wellbeing
59
3.1 Motives for a car purchase The highest scores of importance for buying a car were: overall quality (mean = 4.75, frequency = 80%), seating comfort (mean = 4.67), quality of the interior (mean = 4.62, frequency = 71.7%), interior design (mean = 4.48, frequency = 58.3%), exterior design (mean = 4.30, frequency = 68.3%) and reputation of the manufacturer (mean = 4.3, frequency = 53.3%) as illustrated by Fig. 9. Whereas the subjects evaluated interior storage spaces, storage capacity and brand image as least important. Thus, functionality, roominess and the car brand are expected to be less determining in a car purchase than other buying arguments. A closer look to the standard deviations of buying motives leads to very high ratings for sportiness (SD = 1.970), exterior design (SD = 1.934) and materials of the interior (SD = 1.936), whereas overall quality (SD = 0.292), seating comfort (SD = 0.294) and safety (SD = 0.601) result in lower variance. Since the criteria leading to low standard deviations are quality, comfort and safety, the subjects evaluate those criteria equally important. Though, the more emotional and sensory aspects tend to be dependent on common societal trends such as sportiness, exterior design and materials used in the interior. Regarding the sensory perceptions of the car’s interior the touch appears to play an important role (mean = 4.42, frequency = 55%), while the sample has quite diverse opinions about the appearance of the used materials in the interior (SD = 1.087) (cf. Fig. 10). It can be assumed, that user expectations about the haptic touch of materials are related to qualitative aspects, whereas the visual appearance underlays the same societal influences as common taste and design.

Chapter 2 Motives for Car Purchases, Automotive Customization and Wellbeing
60
Fig. 9 frequency distribution of buying motives for cars rated from not important (left hand side) to highly important (right hand side).
Fig. 10. frequency distribution of sensory impressions influencing buying motives for cars rated from not important (left hand side) to highly important (right hand side).
00,0,0,0,01,70,001,71,7,001,71,701,7,0,00
,03,3,0,08,3
5,03,3
,03,3,01,7,0
1,7,01,7,0
,0,0
,0,0,0
11,76,7
1,71,7
8,35,03,3
3,31,7
1,7,0
3,33,3
3,31,75,0
,0,0
,0,0,0
31,735,0
36,731,7
16,720,0
20,015,0
18,323,318,316,7
11,73,3
8,36,7
3,36,710,06,75,0
36,735,0
30,035,0
30,031,7
31,740,035,031,7
31,728,3
30,035,023,3
18,326,721,718,3
20,015,0
20,020,0
31,731,7
36,738,340,041,741,743,3
46,750,0
53,358,3
63,368,370,070,071,773,3
80,0
S T O R A G E C A P A C I T YI N T E R I O R S T O R A G E S P A C E S
V A R I A B I L I T Y I N I N T E R I O RR O O M I N E S S
B R A N D I M A G EE N V I R O N M E N T A L F R I E N D L I N E S S
S P O R T I N E S SC O N V E N I E N C E
E A S E O F U S EF U E L C O N S U M P T I O NU S E R F R I E N D L I N E S S
P R I C E - P E R F O R M A N C E R A T I OR E P U T A T I O N O F T H E …
I N T E R I O R D E S I G NM A T E R I A L S U S E D I N I N T E R I O R
E X T E R I O R D E S I G NS E A T I N G C O M F O R T
R E L I A B I L I T YQ U A L I T Y O F I N T E R I O R
S A F E T YO V E R A L L Q U A L I T Y
Not answered not important [1] [2] neutral [4] highly important [5]
,0
,0
,0
,0
75,0
1,7
3,3
1,7
13,3
5,0
5,0
1,7
6,7
23,3
20,0
5,0
5,0
30,0
25,0
36,7
,0
40,0
46,7
55,0
T H E A P P E A R A N C E O F T H E I N T E R I O R D E S I G N I S N O T …
A N E W C A R S H O U L D H A V E A D I S T I N C T I V E B U T P L E A S A N T …
I P R E F E R T H E A P P E A R A N C E O F T H E M A T E R I A L S U S E D I N T H E …
T H E T O U C H O F I N T E R I O R C O M P O N E N T S L I K E T H E …
Not answered not important [1] [2] neutral [4] highly important [5]

Chapter 2 Motives for Car Purchases, Automotive Customization and Wellbeing
61
3.2 Customization Scale Interdependencies As the subjects are recruited by a web-based idea contest, it is not surprising that they prove to have a mediocre to high level of innovativeness (mean = 4.00 of the 5-point Likert scale with the score 1 as disagreement to 5 as strong agreement). The subjects also show an above average level of automobile involvement (ratio of agreement of 85.0%), but have highly diversified opinions (SD = 1.902). Though, this agreement to Bloch’s automobile involvement scale in combination with the frequency distribution of age, occupation and industry background (20% working in Automotive) suggest a high percentage of car owners. In fact, only 20% of the subjects indicated to own no car by themselves. The construct to identify a distinct need for customization proves internal significance by a Kolmogorov-Smirnov test with Lilliefor’s correction, and Shapiro Wilk tests. Internal validity of the scale was proven. The range of the Cronbach’s alpha of an exploratory factor analysis proved the necessity of the customization scale. Four of the eight items of the personality trait dimension can be identified with above average mean values of 4.10 to 4.57. 39.7% to 69% of the subjects fully agreed. The ratio of agreement of the entire dimension is 81.7% considered all scores above the midscale point of 3 (5-point Likert Scale from 1 = unimportant to 5 = highly important), which indicates a strong consent to personality traits pursuing individualization and uniqueness. To remember, Tian defined that the pursuit of differentness is demonstrated by the acquisition and display of products (Tian et al., 2001) (cf. Fig. 7). Items of the scale show significant Pearson correlations with the buying criteria: reputation of the manufacturer, brand image, roominess, interior materials, convenience and the touch of interior components (cf. Table 1). Item 5 and 3 reach the highest agreement scores among this dimension. The thrive for knowledge of product information and specifications (Item 3) and a need for uniqueness (Item 1) show a genuinely strong agreement. So, they seem to contain important aspects of personality traits being inclined for customization. The pursuit of new ideas and
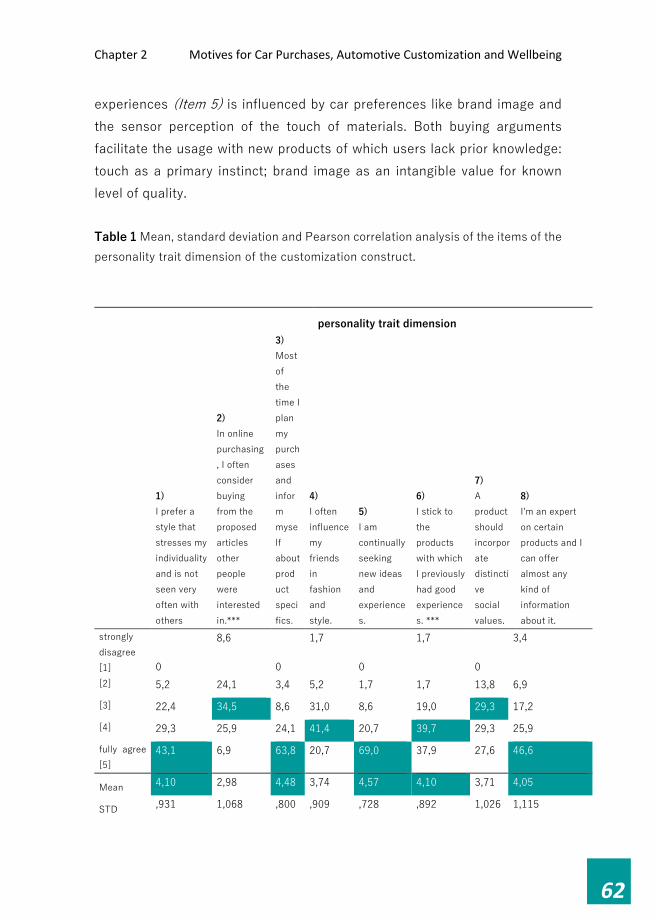
Chapter 2 Motives for Car Purchases, Automotive Customization and Wellbeing
62
experiences (Item 5) is influenced by car preferences like brand image and the sensor perception of the touch of materials. Both buying arguments facilitate the usage with new products of which users lack prior knowledge: touch as a primary instinct; brand image as an intangible value for known level of quality. Table 1 Mean, standard deviation and Pearson correlation analysis of the items of the personality trait dimension of the customization construct.
personality trait dimension
1) I prefer a style that stresses my individuality and is not seen very often with others
2) In online purchasing, I often consider buying from the proposed articles other people were interested in.***
3) Most of the time I plan my purchases and inform myself about product specifics.
4) I often influence my friends in fashion and style.
5) I am continually seeking new ideas and experiences.
6) I stick to the products with which I previously had good experiences. ***
7) A product should incorporate distinctive social values.
8) I'm an expert on certain products and I can offer almost any kind of information about it.
strongly disagree [1] 0
8,6
0
1,7
0
1,7
0
3,4
[2] 5,2 24,1 3,4 5,2 1,7 1,7 13,8 6,9
[3] 22,4 34,5 8,6 31,0 8,6 19,0 29,3 17,2
[4] 29,3 25,9 24,1 41,4 20,7 39,7 29,3 25,9
fully agree [5]
43,1 6,9 63,8 20,7 69,0 37,9 27,6 46,6
Mean 4,10 2,98 4,48 3,74 4,57 4,10 3,71 4,05
STD ,931 1,068 ,800 ,909 ,728 ,892 1,026 1,115
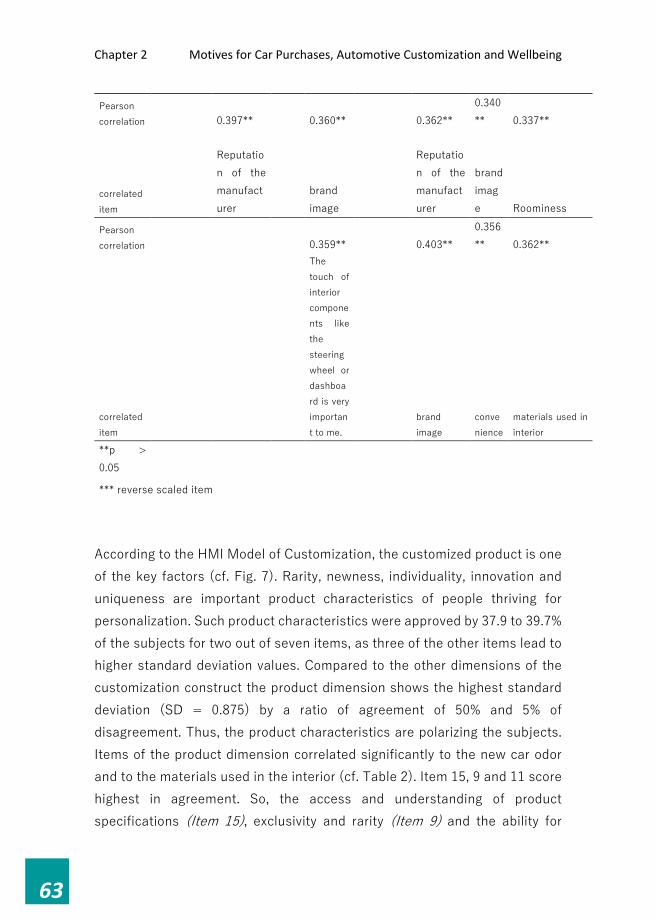
Chapter 2 Motives for Car Purchases, Automotive Customization and Wellbeing
63
Pearson correlation 0.397** 0.360** 0.362**
0.340** 0.337**
correlated item
Reputation of the manufacturer
brand image
Reputation of the manufacturer
brand image Roominess
Pearson correlation 0.359** 0.403**
0.356** 0.362**
correlated item
The touch of interior components like the steering wheel or dashboard is very important to me.
brand image
convenience
materials used in interior
**p > 0.05 *** reverse scaled item
According to the HMI Model of Customization, the customized product is one of the key factors (cf. Fig. 7). Rarity, newness, individuality, innovation and uniqueness are important product characteristics of people thriving for personalization. Such product characteristics were approved by 37.9 to 39.7% of the subjects for two out of seven items, as three of the other items lead to higher standard deviation values. Compared to the other dimensions of the customization construct the product dimension shows the highest standard deviation (SD = 0.875) by a ratio of agreement of 50% and 5% of disagreement. Thus, the product characteristics are polarizing the subjects. Items of the product dimension correlated significantly to the new car odor and to the materials used in the interior (cf. Table 2). Item 15, 9 and 11 score highest in agreement. So, the access and understanding of product specifications (Item 15), exclusivity and rarity (Item 9) and the ability for

Chapter 2 Motives for Car Purchases, Automotive Customization and Wellbeing
64
individual combinations (Item 11) are important product characteristics supporting customization. For item 15, the applied materials in the interior seem to be interrelated with a customizable product according to the model suggested in Fig. 7.
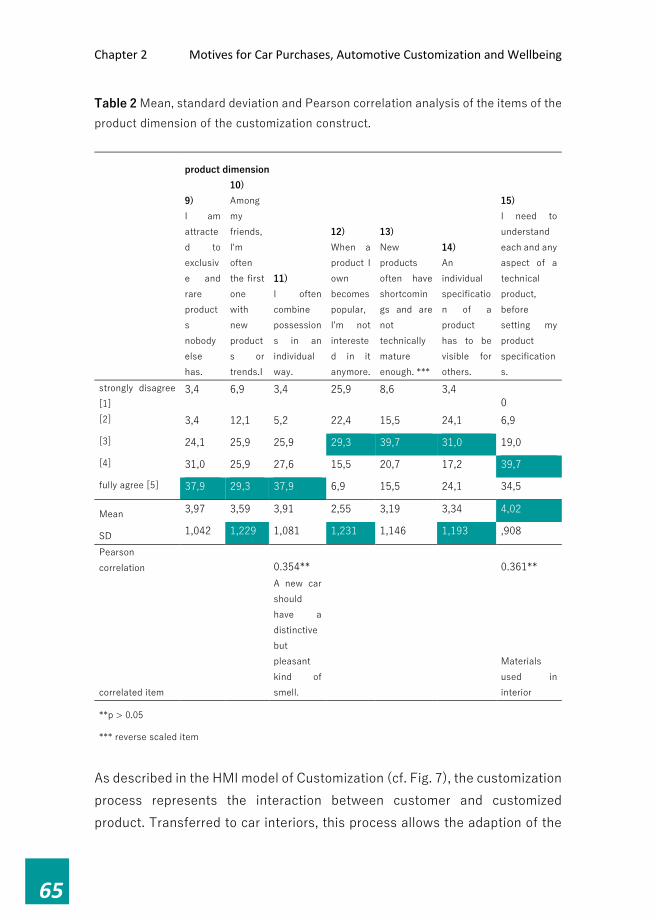
Chapter 2 Motives for Car Purchases, Automotive Customization and Wellbeing
65
Table 2 Mean, standard deviation and Pearson correlation analysis of the items of the product dimension of the customization construct. product dimension
9) I am attracted to exclusive and rare products nobody else has.
10) Among my friends, I'm often the first one with new products or trends.I
11) I often combine possessions in an individual way.
12) When a product I own becomes popular, I'm not interested in it anymore.
13) New products often have shortcomings and are not technically mature enough. ***
14) An individual specification of a product has to be visible for others.
15) I need to understand each and any aspect of a technical product, before setting my product specifications.
strongly disagree [1]
3,4 6,9 3,4 25,9 8,6 3,4 0
[2] 3,4 12,1 5,2 22,4 15,5 24,1 6,9
[3] 24,1 25,9 25,9 29,3 39,7 31,0 19,0
[4] 31,0 25,9 27,6 15,5 20,7 17,2 39,7
fully agree [5] 37,9 29,3 37,9 6,9 15,5 24,1 34,5
Mean 3,97 3,59 3,91 2,55 3,19 3,34 4,02
SD 1,042 1,229 1,081 1,231 1,146 1,193 ,908
Pearson correlation 0.354** 0.361**
correlated item
A new car should have a distinctive but pleasant kind of smell.
Materials used in interior
**p > 0.05 *** reverse scaled item
As described in the HMI model of Customization (cf. Fig. 7), the customization process represents the interaction between customer and customized product. Transferred to car interiors, this process allows the adaption of the
Chapter 2 Motives for Car Purchases, Automotive Customization and Wellbeing
66
product to the preferences of the users and succumbs to the rules of user-machine interaction surrounded by societal and mobility trends. This process dimension as last part of the Automotive Customization scale focuses on product presentation, purchase processes and signaling effects of exclusive goods (cf. Table 3). 55% of the subjects were indifferent about the items of this dimension (mean = 3.10, ratio of agreement = 25%). Though, one item of the dimension (Item 17) displays various significant Pearson correlations with buying criteria such as reputation of the manufacturer, brand image, interior design, overall quality and seating comfort. Obviously, all those criteria are attributed to products from established brands and not to no-name products. These criteria are a representation of customers’ expectations of superior quality and design and hence result in higher prices.

Chapter 2 Motives for Car Purchases, Automotive Customization and Wellbeing
67
Table 3 Mean, standard deviation and Pearson correlation analysis of the items of the process dimension of the customization construct.
process dimension
16) I often tend to buy products which have to be approved by my friends.***
17) I prefer spending more money on products from established brands than on no-name products.***
18) How a product is presented in various media influences my purchase decision.
strongly disagree [1] 24,1 3,4 10,3 [2] 32,8 6,9 15,5 [3] 36,2 29,3 34,5 [4] 5,2 25,9 29,3 fully agree [5] 1,7 34,5 10,3
Mean 2,28 3,81 3,14
SD ,951 1,100 1,131
Pearson correlation 0.582** 0.517** correlated item Brand image Brand image
Pearson correlation 0.597** 0.342**
correlated item Reputation of the manufacturer
Reputation of the manufacturer
Pearson correlation 0.439**
correlated item interior design
Pearson correlation 0.412** correlated item overall quality Pearson correlation 0.356**
correlated item seating comfort
**p > 0.05 *** reverse scaled item
The analysis of the eight wellbeing dimensions shows that the security dimension seems to be more important for the subjects (mean = 4.40, SD = 0.654). Warm relationships with others (mean = 4.12, SD = 0.905), sense of accomplishment (mean = 4.00, SD = 0.991), self-fulfillment (mean = 4.24, SD = 0.885) and fun and enjoyment (mean = 4.28, SD = 0.714) are important as well. However, those sentiments are highly diversified. In contrast, the dimensions of being well respected (mean = 3.69, SD = 1.367) and of a sense of belonging (mean = 3.38, SD = 2.042) were only rated

Chapter 2 Motives for Car Purchases, Automotive Customization and Wellbeing
68
moderately with highly varied responses, probably due to a polarization of opinions of the items used in the questionnaire. Table 4 summarizes the results of the agreement scores on the scales of Automotive Customization and wellbeing that significantly exceeded the agreement scale midpoint of 3 of the 5-point Likert scale (from 1 = total disagreement to 5 = total agreement). The ratio of agreement for both scales is calculated by summing any ratings higher than the midpoint scale for each item either agreed or strongly agreed. The difference of the ratios of agreement are significant in the two customization dimensions of the personality trait and the process. In the HMI Model for Customization (cf. Fig. 7), those key factors represent the necessary ingredients for the creation of customized products which have to be considered for designing personalized car interiors.
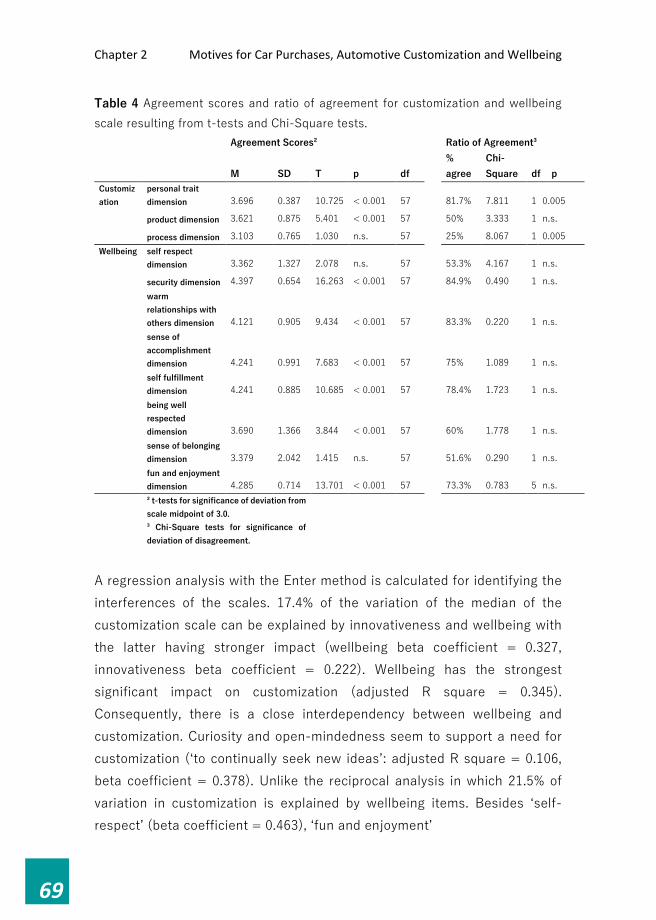
Chapter 2 Motives for Car Purchases, Automotive Customization and Wellbeing
69
Table 4 Agreement scores and ratio of agreement for customization and wellbeing scale resulting from t-tests and Chi-Square tests. Agreement Scores² Ratio of Agreement³
M SD T p df
% agree
Chi-Square df p
Customization
personal trait dimension 3.696 0.387 10.725 < 0.001 57 81.7% 7.811 1 0.005
product dimension 3.621 0.875 5.401 < 0.001 57 50% 3.333 1 n.s.
process dimension 3.103 0.765 1.030 n.s. 57 25% 8.067 1 0.005 Wellbeing self respect
dimension 3.362 1.327 2.078 n.s. 57 53.3% 4.167 1 n.s.
security dimension 4.397 0.654 16.263 < 0.001 57 84.9% 0.490 1 n.s. warm relationships with others dimension 4.121 0.905 9.434 < 0.001 57 83.3% 0.220 1 n.s. sense of accomplishment dimension 4.241 0.991 7.683 < 0.001 57 75% 1.089 1 n.s. self fulfillment dimension 4.241 0.885 10.685 < 0.001 57 78.4% 1.723 1 n.s. being well respected dimension 3.690 1.366 3.844 < 0.001 57 60% 1.778 1 n.s. sense of belonging dimension 3.379 2.042 1.415 n.s. 57 51.6% 0.290 1 n.s. fun and enjoyment dimension 4.285 0.714 13.701 < 0.001 57 73.3% 0.783 5 n.s.
² t-tests for significance of deviation from scale midpoint of 3.0.
³ Chi-Square tests for significance of deviation of disagreement.
A regression analysis with the Enter method is calculated for identifying the interferences of the scales. 17.4% of the variation of the median of the customization scale can be explained by innovativeness and wellbeing with the latter having stronger impact (wellbeing beta coefficient = 0.327, innovativeness beta coefficient = 0.222). Wellbeing has the strongest significant impact on customization (adjusted R square = 0.345). Consequently, there is a close interdependency between wellbeing and customization. Curiosity and open-mindedness seem to support a need for customization (‘to continually seek new ideas’: adjusted R square = 0.106, beta coefficient = 0.378). Unlike the reciprocal analysis in which 21.5% of variation in customization is explained by wellbeing items. Besides ‘self-respect’ (beta coefficient = 0.463), ‘fun and enjoyment’

Chapter 2 Motives for Car Purchases, Automotive Customization and Wellbeing
70
(beta coefficient = 0.241) are affecting customization. Concerning the mean values of the wellbeing dimensions, the self-respect dimension (beta coefficient = 0.397) along with the dimension for a sense of accomplishment (beta coefficient = 0.370) proved to significantly influence the variation of the need for customization (adjusted R square = 0.421). An ANOVA with Bonferroni test shows that it is the self-respect dimension that causes significant differences in the personality trait dimension. The significant intercorrelation, by calculating Pearson correlations between wellbeing and customization, underlines this finding (r = 0.597, p = 0.000). The dimensions of personality trait and product are intercorrelated (r = 0.502, p = 0.000) and have relationships to the wellbeing dimensions of self-respect (r = 0.497, r = 0.400), sense of accomplishment (r = 0.289, r = 0.344) and being well respected (r = 0.316, r = 0.355). The influence of those wellbeing dimensions on the personality trait and product dimension appear plausible as they incorporate inner-human processes of the mind, that are important to consider while creating toolkits for customization. Consequently, any device or toolkit used for customization of a product should consider those required wellbeing aspects. Any neglect would lead to negative effects on the need for customization. 4 Discussion The purpose of this study was to identify underlying motives for customization in car preferences of users. There is a close relation between wellbeing and customization, especially for the personality related aspects of wellbeing. The study serves as a first indication of the distinctive mobility behavior of the Generation Y (IFMO, 2011, 2013). The resulting mobility needs decreased in the demand for cars due an increase in urban and multimodal mobility (Audenhove, Korniichuk, Dauby, & Pourbaix, 2014), whereas the mobility needs in rural areas remained unchanged. The sample’s age, occupation, family status, and population area indicate typical characteristics of the Generation Y. An entire network of different modes of
Chapter 2 Motives for Car Purchases, Automotive Customization and Wellbeing
71
transport such as air travel, public transport or even non-motorized is requested instead. Additionally, nowadays within this group shared mobility plays an important role as well as in peer-to-peer and business-to-consumer models complementing conventional ways of transport as described in chapter 1.1 (Audenhove et al., 2014; IFMO, 2011). 4.1 Customizing products is positively correlated to the buying
motivation of cars.
The study shows that in the buying preferences of representatives of the Generation Y established values such as overall quality, seating comfort, quality of the interior, exterior design, interior design, the materials used in the interior and reputation of the manufacturer (cf. Fig. 9) are important. On the other hand, interior storage spaces, storage capacity and brand image were not considered as leading buying motives in this study. The answers to emotional motives such as sportiness, exterior design and materials of the interior varied intensively. Whereas items like overall quality, seating comfort and safety show less variance in responses. The buying criteria can be subdivided in base criteria (overall quality, seating comfort and safety) and emotional criteria (sportiness, exterior design and materials of the interior). The major difference between these factors is, that emotional factors regarding mobility are underlying common societal trends and common taste and consequently differ massively over time and cultures (Winterhoff, Kahner, Ulrich, Sayler, & Wenzel, 2009). Consistent to this difference, touch is the most important sensory perception (Lakoff & Johnson, 1999), but appearance of materials evokes the most varying responses (cf. Fig. 10). Clearly, touch is despite the aesthetic part of this perception also a qualitative aspect that has to meet certain expectations by users especially in case of premium cars. Despite any visual impression, users are able to learn about the materiality of products by its tactual properties and its physicality (Sonneveld, 2008). Correlations of the customization scale and distinct buying motivations for cars could be found (see Table 1,Table 2, and Table 3).

Chapter 2 Motives for Car Purchases, Automotive Customization and Wellbeing
72
4.2 A scale for automotive customization is a useful technique to identify this need.
A link between the personality trait dimension and product dimension was detected which can be explained by a close relationship between user and product in case of customization. The product is adapted and changed in a defined set of characteristics to the taste and individuality of its user. Despite the multidimensionality of the scale, the items showed relationships to the motives: brand image and reputation of the manufacturer. Users anticipate the performance of manufacturers and thus reduced insecurities by these motives (Schenk, Seelmann-Eggebert, & Piller, 2001). Therefore, the influence of these buying motives can facilitate the user’s expectations for reliability and quality of the product. The personality trait dimension and the product dimension interact with specific buying criteria such as materials used in the interior, sportiness, innovativeness, wellbeing, convenience, ease of use, overall quality and fun and enjoyment due to a close human-product interaction. Among the sensory perceptions of the car interior, the touch of materials is the most important perceptive buying motive in relation to customization. This is sustained by Dewey who described that humans experience their surroundings through touch (Dewey, 2007) in order to understand its materiality (Bakker, 1975), meaning (Lakoff & Johnson, 1999) and a communication channel for affection (Sonneveld, 2008). The results of the agreement scores exceeded significantly the scale midpoint of 3.0. The ratio of agreement yields the highest rating of agreement for the personality trait compared to the other customization dimensions. The corresponding difference of the ratios of agreement proved to be significant as well. 4.3 There are interdependencies of customization and validated scales
such as innovativeness and automobile involvement.
The regression analysis identified that automobile involvement has no influence on customization. So, involvement with a specific product does not

Chapter 2 Motives for Car Purchases, Automotive Customization and Wellbeing
73
necessarily lead to a need to customize this product and vice versa. Hence, customization does not strengthen product involvement per se. Instead, innovativeness with the item ‘taking advantage of the first available opportunity to find out about new and different products’, and wellbeing are related to customization. According to Lynn and Harris’s characterization of consumer products, innovativeness is mentioned among the relevant criteria for users with a high desire for uniqueness (Lynn & Harris, 1997b). Wellbeing proves to have the greatest impact on customization regarding self-respect and fun and enjoyment. Wellbeing, which is influenced by customization, shows the greatest impact by the personality trait dimension. This emphasizes the importance of personality traits such as extraversion for wellbeing and aligns with the findings in literature. Automobile involvement appears not to be influenced neither by wellbeing nor by customization. Generally, product involvement defined as a long-term interest in a product, is a function of individual differences focusing on important values and needs (Bloch, 1981). This study showed that the need for Automotive Customization and wellbeing are not relevant needs and values for automobile involvement. 4.4 Wellbeing and customization can enhance a product’s value for users.
The findings of the study assume an interrelation of wellbeing and customization. The most influencing are ‘self-respect’ and ‘fun and enjoyment’. These characteristics of wellbeing represent additional value for users. The dominating dimension of this study is the personality trait dimension, which influences the wellbeing dimension ‘self-respect’. Slight tendencies for relationships between customization and fun and enjoyment can be discovered as well. People tend to seek uniqueness through consumption (Lynn & Harris, 1997b). Argyle and Lu confirmed associations of extraversion and wellbeing due to an enjoyment of extraverts in social activities (Argyle & Lu, 1990) and in physical activities like sport (R. Emmons & E. Diener, 1986; R. A. Emmons & E. Diener, 1986; Furnham, 1981). The construct describing a need for customization reached more consistent responses in the personality trait dimension than in the product dimension or

Chapter 2 Motives for Car Purchases, Automotive Customization and Wellbeing
74
process dimension. The subjects were evaluating the product dimension very diversely. This might be explained by the fact that this dimension contains aspects like rarity and the signaling effect of products. Despite rarity, the counterconfomity motivation leads to conflicts and acts of conflict resolution for consumers (Tepper, 1996), as those subjects despise any product which is unique at first, but soon gain popularity and thus lose their status of uniqueness (Tian et al., 2001). This described behavior is common for non-conformists who intend to own products that nobody else have such as old-fashioned dial plate telephones. Besides the strive for opposing differentness and uniqueness, consumers also need to fit in society (Brewer, 1991). Because users inhabit both characteristics in varying intensity, they use both: products enhancing individuality and uniqueness as well as products fostering belonging and conformity (Lynn & Harris, 1997b). The relationship between wellbeing and the search for innovation can be explained by the user-product relationship (cf. Fig. 7). Enjoyment of innovative products encourage users to give such products a try. The adequate interaction of user and product is important, in order to deliver wellbeing in product design (Diefenbach et al., 2017). The openness to new people or positive arousal of extraverts leads to enjoyment caused by interaction (Argyle & Lu, 1990). In combination with McAlister and Pessemier’s model of variety-seeking behavior, a desire of humans is described to be distinct from others by their seeking of variety, e.g. style (McAlister & Pessemier, 1982). Though, the optimal level of stimulation is described as crucial for users regarding novelty, complexity or change (McAlister & Pessemier, 1982). Despite product replacement, modifications by users can create unique products less vulnerable to commercial duplication or popularization (Tian et al., 2001). Overall quality, seating comfort, quality of the interior, interior and exterior design aside of the reputation of the manufacturer are required in correspondence to the consumer needs of the Generation Y. The haptic touch of materials and components like the steering wheel was rated as the most important buying motive according to possible sensory perceptions of the car

Chapter 2 Motives for Car Purchases, Automotive Customization and Wellbeing
75
interior. Due to the link between wellbeing and customization, design disciplines such as positive design for subjective wellbeing (P. Desmet & Hassenzahl, 2012) may influence customization. For instance, Desmet’s list of 25 positive emotions that can be experienced in human-product interaction (P. Desmet & Hassenzahl, 2012) or Hassenzahl et al.’s narrative approach to experience design in order to form holistic user experience narrations (P. M. Desmet, 2012; Hassenzahl et al., 2013) could be interesting approaches for the investigating relationships between wellbeing and customization. Concerning the need for uniqueness, individual differences are supposed to influence product choices due to an effect on affective and cognitive responses to design (Bloch, 1995). The resulting rejection of such a product should be prevented, which leads to a demand for future research of the mediating effect of affective and cognitive responses to design in relation to a need for customization in Bloch’s conceptual model (Tian et al., 2001). The sample composition of contest members of an automotive interior idea contest results in a very homogeneous group of creative subjects with high involvement. This limitation of the study might bias the findings of the study. Future research should focus on more heterogeneous groups with a diverse background e.g. design, fashion, and CE industry. The scales indicated a first hint of the value added by customization and wellbeing. Another limitation of the study is, that it was conducted without concrete product design proposals enabling users to customize their product, and to test the scale application in different human-product interactions. Further research would be needed, if there are design solutions for customization allowing the user another approach for product interaction. 5. Conclusion This study shows the three key factors of the HMI Model of Customization: the customer, the customization process, i.e. user-product interaction, based and the customized product as the outcome of the personalization for the

Chapter 2 Motives for Car Purchases, Automotive Customization and Wellbeing
76
demands of the Generation Y. The main purpose of products like cars or mobility solutions like car sharing is the transportation from individuals. Beyond that purpose, users can contribute from the individual adaption of the product to their preferences. The study shows that the users’ need for customization is related to their wellbeing. The key factors of the customer and the customized product (cf. Fig. 7) outweigh the customization process in its importance. In further investigations, the emphasis is laid upon those key factors, because of their relevance for wellbeing to foster the user-product relationship. Customizable product designs have to consider this toolkit for customization along with a set of basic and independent product characteristics that might influence the buying behavior of customers. For instance, buying motives such as quality, safety, reputation, design, and sensory perceptions like touch are basic product characteristics that users expect and thus relevant for customized products as well.

Chapter 2 Motives for Car Purchases, Automotive Customization and Wellbeing
77
REFERENCES Argyle, M., & Lu, L. (1990). The happiness of extraverts. Personality and
individual differences, 11(10), 1011-1017. Audenhove, F.-J. V., Korniichuk, O., Dauby, L., & Pourbaix, J. (2014). The
Future of urban mobility 2.0: Imperatives to shape extended mobility ecosystems of tomorrow. Retrieved from
Bakker, R. (1975). Merleau-Ponty: filosoof van het niet-wetend weten: Wereldvenster.
Bloch, P. H. (1981). An exploration into the scaling of consumers' involvement with a product class. NA-Advances in Consumer Research Volume 08.
Bloch, P. H. (1995). Seeking the ideal form: Product design and consumer response. The Journal of Marketing, 16-29.
Brewer, M. B. (1991). The social self: On being the same and different at the same time. Personality and social psychology bulletin, 17(5), 475-482.
Desmet, P., & Hassenzahl, M. (2012). Towards happiness: Possibility-driven design. In Human-computer interaction: The agency perspective (pp. 3-27): Springer.
Desmet, P. M. (2012). Faces of product pleasure: 25 positive emotions in human-product interactions. International Journal of Design, 6(2).
Dewey, J. (2007). Experience and education: Simon and Schuster. Diefenbach, S., Hassenzahl, M., Eckoldt, K., Hartung, L., Lenz, E., & Laschke,
M. (2017). Designing for well-being: a case study of keeping small secrets. The Journal of Positive Psychology, 12(2), 151-158.
Emmons, R., & Diener, E. (1986). Influence of sociability and impulsivity on positive and negative affect. Journal of personality and social psychology, 50, A211-1215.
Emmons, R. A., & Diener, E. (1986). Situation selection as a moderator of response consistency and stability. Journal of personality and social psychology, 51(5), 1013.
Furnham, A. (1981). Personality and activity preference. British Journal of Social Psychology, 20(1), 57-68.

Chapter 2 Motives for Car Purchases, Automotive Customization and Wellbeing
78
Hassenzahl, M., Eckoldt, K., Diefenbach, S., Laschke, M., Len, E., & Kim, J. (2013). Designing moments of meaning and pleasure. Experience design and happiness. International Journal of Design, 7(3).
Hills, P., & Argyle, M. (2002). The Oxford Happiness Questionnaire: A compact scale for the measurement of psychological well-being. Personality and individual differences, 33(7), 1073-1082.
IFMO. (2011). Mobilität junger Menschen im Wandel – multimodaler und weiblicher. Retrieved from
IFMO. (2013). 'Mobility Y' – The Emerging Travel Patterns of Generation Y. Retrieved from Kay, J. (1993). The structure of strategy. Business strategy review, 4(2), 17-
37. Lakoff, G., & Johnson, M. (1999). Philosophy in the flesh: The embodied mind
and its challenge to western thought: Basic books. Lynn, M., & Harris, J. (1997a). The desire for unique consumer products: A
new individual differences scale. Lynn, M., & Harris, J. (1997b). Individual differences in the pursuit of self-
uniqueness through consumption. Manning, K. C., Bearden, W. O., & Madden, T. J. (1995). Consumer
innovativeness and the adoption process. Journal of Consumer Psychology, 4(4), 329-345.
McAlister, L., & Pessemier, E. (1982). Variety seeking behavior: An interdisciplinary review. Journal of Consumer research, 9(3), 311-322.
Norman, D. A. (2005). Emotional design: Why we love (or hate) everyday things. In: Basic books.
Schenk, M., Seelmann-Eggebert, R., & Piller, F. (2001). Kundenindividuelle Massenproduktion: Von Businessmodellen zu erfolgreichen Anwendungen. Fraunhofer Institut, Frankfurt/aM.
Sonneveld, M. H. (2008). Aesthetics of tactual experience. Tepper, K. (1996). Understanding Consumers Counterconformity Behavior: A
Critical Appraisal of Trait Measures Employed in Nonconformity Research. Paper presented at the American Marketing Association Summer Educators’ Conference Proceedings.

Chapter 2 Motives for Car Purchases, Automotive Customization and Wellbeing
79
Tian, K. T., Bearden, W. O., & Hunter, G. L. (2001). Consumers' need for uniqueness: Scale development and validation. Journal of Consumer research, 28(1), 50-66.
Vink, P., Overbeeke, C., & Desmet, P. (2005). Comfort experience. Wagner, A.-S., Kilincsoy, Ü., Reitmeir, M., & Vink, P. (2014). Adaptive
Customization –Value Creation by Adaptive Lighting in the Car Interior. In P. Vink (Ed.), Advances in Social and Organizational Factors
(pp. 40-50): AHFE Conference. Winterhoff, M., Kahner, C., Ulrich, D. C., Sayler, P., & Wenzel, E. (2009). Future
of Mobility 2020 – the Automotive Industry in Upheaval? Retrieved from www.adl.com/mobility-2020

Chapter 2 Motives for Car Purchases, Automotive Customization and Wellbeing
80
Part III AESTHETIC, FUNCTIONAL AND ADAPTABLE CUSTOMIZATION
The crowd sourcing method was used in order to get a very broad feedback on the field of customization of car interiors. As highlighted in the introduction, different attributes of customization cause different responses measurable in emotional responses to the product, and price sensitivity. Part III starts by investigating aesthetic customization of interiors, searching for patterns in color preferences of car interiors (chapter 3), followed by functional customization. In chapter 4, storage compartments were individualized in form and design and varied in their location. The offering of electronic car systems able to adapt to users got more important in car design. Driving assistance systems allow driving style modifications of various car components to a person’s intended driving style. In addition, to a general approach by using controls as a user interface, automatic adjustments of the car were investigated in this Thesis. Chapter 5 and 6 explored the effects on users of such adaptable design concepts such as the adaptable driving style (i.e. a representation of functional customization) and adaptable interior lighting (i.e. a representation of aesthetic customization).

Chapter 3 Visual Customization – Diversity in color preferences in the Automotive Interior and implications for Interior Design
81
Chapter 3 Visual Customization – Diversity in color
preferences in the Automotive Interior and implications for Interior Design
Abstract Evolving multimodal mobility needs influences established human-product relationships and requires a deeper insight into color preferences for car interiors. Hence, a study was conducted in which 204 members of a web contest created 1265 designs. After a peer-evaluation process, 53 most-appreciated and 34 least-preferred interior color compositions were identified and compared in order to identify patterns in color choices. Besides, visual lightweight design by layering of large interior components such as the seat, a modest use of color and patterns accompanied by repetition and the framing of the entire interior to create a feeling of spaciousness were found. Additionally, differences in the type of color between most and least favored color designs were found. Brown and beige occur more frequently among the top- than the worst-rated designs. Larger surfaces are favored in lighter hues and smaller components in darker hues. Keywords: color preferences, interior car design, color harmony, visual perception, materialistic appearance Wagner A‐S, Kilincsoy Ü, Vink P. Visual customization: Diversity in color preferences in the automotive interior and implications for interior design. Color Res Appl. 2018;00:1–18. https://doi.org/10.1002/col.22218
Chapter 3 Visual Customization – Diversity in color preferences in the Automotive Interior and implications for Interior Design
82
1 Introduction Mobility needs are evolving due to an increasing demand for urban and multimodal mobility(Audenhove, Korniichuk, Dauby, & Pourbaix, 2014). Simultaneously, a decrease in the use of cars is detected in studies of the IFMO institute among representatives of Generation Y (IFMO, 2011, 2013) who prefer other modes of transport e.g. air travel, public transport, non-motorized. Also, customer expectations are evolving towards individualization and sustainability, while new players from other sectors seek opportunities to play a role in the mobility market (Audenhove et al., 2014). The trend towards shared mobility both via peer-to-peer and business-to-consumer models is complementing conventional modes of transport (Audenhove et al., 2014; IFMO, 2011). Car-sharing business models with various car brand cooperation question the validity of owning a car for transportation reasons (IFMO, 2011). In order to understand these mobility trends and their effects on the car as a product per se, the interaction between product and user needs to be investigated. A product generally gets slightly modified during the human-product relationship as sort of an assimilation such as the users’ customization of smartphones by protective covers in different colors or with additional functions (Wagner, Kilincsoy, Reitmeir, & Vink, 2014). Irrespective of ownership, apartments get painted and furnished in order for the inhabitants to feel at home; even unconventional items like car components can be turned into accessories for living rooms as furniture equipped with smart media interfaces (e.g. IKEA’s Uppleva series). So, the eruption in the world of product categories leads to blurring boundaries. Even prestigious objects like tablet PCs or smartphones are only customized by their owners with personal settings, Apps or additional protective covers. Therefore, a variety, which is not fulfilled by the product itself, can be added later on by users with purchases of colorful covers made from silicone or plastic (Wagner et al., 2014).

Chapter 3 Visual Customization – Diversity in color preferences in the Automotive Interior and implications for Interior Design
83
Since studies by the authors indicated that exterior and interior design are crucial motivators for buying or leasing cars, the respective product which should be studied further is the automotive interior with a focus on customization. Any interdependencies by exterior design aspects like form (body type, i.e. convertible, coupé, SUV, or sedan), shape (exterior design language created by stylistic elements) and color (painting) are excluded from the study. Given that the interior serves as an interaction threshold for driver and passenger, the importance of the interior car design for functional and aesthetic customization is a plausible conclusion (Wagner et al., 2014). Color is considered to be an important element of environmental design which is related to psychological, physiological, and social reactions of humans, and aspects of environments both aesthetic and technical (Tofle, Schwarz, Yoon, & Max-Royale, 2004), and thus color is an element worth studying for aesthetic customization. Color Vision and Color Classification The literature about color ranges from the definition of color vision by the human visual cortex (Sheppard, 1968; Verity, 1980) influenced by individual experiences (D. Katz, 2013) to diverse color classification systems (America & Ostwald, 1958; Hering, 1964; Itten & Birren, 1970; Munsell, 1919; Newton, 1979; Ostwald, 1931; Sheppard, 1968; Verity, 1980). However, the interaction of color with a specific object seems to change the viewer’s preferences. Color Preferences The physical environment influences the performance and mood of people (Bakker, 2014). Color plays a role in the environment, but there are doubts about the exact effects on human beings and their behavior in relation to specific colors (Bakker, van der Voordt, de Boon, & Vink, 2013). Additionally, colors are related to decision processes on what customers like and dislike (L. C. Ou, Luo, Woodcock, & Wright, 2004). Human color preferences are

Chapter 3 Visual Customization – Diversity in color preferences in the Automotive Interior and implications for Interior Design
84
classifiable into three types: phenomenological (i.e. experience-based), biological (i.e. neural activity to distinct colors), and ecological (i.e. affective responses to colors) (Schloss & Palmer, 2011). In Bakker’s study of 1095 Dutch people (Bakker, van der Voordt, Vink, de Boon, & Bazley, 2015) about color preferences significant relationships were found relating to gender (Eysenck, 1941; Funk & Oly Ndubisi, 2006), education, age (Dittmar, 2001; D. Katz, 1979; Zentner, 2001), culture (Madden, Hewett, & Roth, 2000; Saito, 1996), and personality traits (Bakker, Van de Voordt, Vink, De Boon, & Bazeley, 2013; Dittmar, 2001). For instance, males preferred the color blue, while most females had no color preference. Nonetheless, there are also studies in literature with no distinct relationships between gender (S. Katz & Breed, 1922; L. C. Ou et al., 2004). This changed slightly when the respective object was considered as well, e.g. black was identified by Bakker as the overall favorite color for clothing for females and blue for males, but no preference was given for yellow in the sample (Dittmar, 2001); the preference for building interiors was white. This was also proven by Kwallek (Kwallek, Lewis, Lin-Hsiao, & Woodson, 1996). Additionally, the low chroma colors of light blue, light aqua green and off white were favored for workspace interiors (Bakker, Van de Voordt, et al., 2013; Brill, Margulis, & Konar, 1985) inclining towards a dependency on the lightness of color (Cubukcu & Kahraman, 2008; Schloss, Strauss, & Palmer, 2013). Brown is never named as a favorite color, yet it is favored as a color for carpets and sofas (C.B. Holmes, 1984), due to culturally imprinted preferences for material to have a natural, or elegant appearance (Fenko, Otten, & Schifferstein, 2010; Hekkert & Karana, 2013). Historically, wood is a common interior material (Gagg, 2012) which was also used for dashboards and trims in car interiors (cf. Fig. 11 left). Red and black as clothing colors are attributed with higher attractiveness, indicating a psychological influence on wearers and raters (Roberts, Owen, & Havlicek, 2010). The influence of hue, tone, and texture were proven to be significant in fashion fabrics with colors like yellow-red, and red hues, or light, or dark grayish tones regarded as elegant (Choo & Kim, 2003), whereas saturated reds were identified to be generally disharmonious in combination

Chapter 3 Visual Customization – Diversity in color preferences in the Automotive Interior and implications for Interior Design
85
with other colors in studies (Schloss & Palmer, 2011). But color perception per se is influenced beyond saturation, chroma, and hue by the respective viewing angle, amount and type of ambient light, and the presence of other colors or further environmental conditions (D. H. Brainard, and Radonjic, A., 2014; Elliot, 2015; Fairchild, 2015; Hunt & Pointer, 2011). Since the car interior represents an interior with large surfaces and is also a workspace with driving being the work task and the seat as furniture, the color preferences could be similar and are therefore investigated further. Test Methods for color preferences and the translation to car interiors The psychological domain of color perception offers a broad field of different research techniques. The very diverse test methods for color preferences (Bakker, Van de Voordt, et al., 2013; Cubukcu & Kahraman, 2008; Dittmar, 2001; Guilford & Smith, 1959; Kwallek et al., 1996; Pomerleau, Bolduc, Malcuit, & Cossette, 1990; Zajonc, 1980; Zentner, 2001) cannot easily be applied to car interiors (cf. Fig. 11) as it is a specific environment with specific individual demands. Additionally, as shown in the literature, the interaction between the colored object and the color itself is decisive. Bakker stated that because of the differences in applied test materials, methods and models and different contexts in color research studies, a comparison of the results is not easy. Also, experiments in artificial settings and a sample consisting of students might neglect the situational context of color and therefore bias the results (Bakker, 2014; Sears, 1986). Bakker found no preferences for yellow in her studies of workspace interiors, whereas Cubukcu’s results showed a strong inclination to yellow exterior facades of buildings explained by the frequency of yellow buildings of the sample’s home country (Cubukcu’s description of buildings in Turkey, 2008) (Cubukcu & Kahraman, 2008). The contextual influence on the color preference of humans regarding their affective responses is assumed to play an important role in car interiors (cf. building exterior study of Cubukcu) (Cubukcu & Kahraman, 2008). Preferences also can vary as a function of

Chapter 3 Visual Customization – Diversity in color preferences in the Automotive Interior and implications for Interior Design
86
lightness, e.g. color preferences for most objects increased as the colors became darker, as opposed to the color preferences for walls and trims, which showed an inclination for being lighter (Schloss et al., 2013). There is also an ‘‘appropriate’’ color for objects varying from object to object or even types among objects (e.g. different types of automobiles) accompanied by other dimensions such as wall colors giving the impression of space or luxuriousness of cars (Schloss et al., 2013). The interaction of color and spaciousness of large surfaces such as walls is interesting. Considering the large surfaces of the car interior such as seats, floor carpet, roof lining, etc. versus trims, the color could evoke a specific feeling like spaciousness or crampedness. Thus, the components are visually segmented. By a first overview of major differences between the best-, and worst-rated interior designs, the authors established the following hypotheses:
1. According to Poldma (Poldma, 2009), interior environments along with their designs are profoundly influenced by a combination of color and light with form and space (2009). The human perception is a result of the interaction with light and its color effects on the surrounding environment (Merleau-Ponty & Smith, 1996). In case of an adequately lit environment, a mediation of the use of space can be reached (Winchip, 2005). Aside from spaces modulated by light and color (Shulman, 2001) in a dynamic way (e.g. by projections or lighting), a simple color change is a rather static approach. The term a “visual lightweight design” by the authors describes a design of a more lightweight appearance by subdividing interior components by color coordination (Hypothesis 1). For instance, interior components like the seat, door trims or dashboard can be mostly characterized as large surfaces. By using different hues, saturation, or patterns, subcomponents of those parts can be clustered and therefore appear visually more lightweight (cf. Fig. 11 ). Harmonious impressions are reached by the layering of colors due to the constant underlying color which influences the entire composition (Feisner & Reed, 2006).

Chapter 3 Visual Customization – Diversity in color preferences in the Automotive Interior and implications for Interior Design
87
2. Modest use of color and pattern variety (Hypothesis 2): in accordance with the literature on color preferences (Bakker, Van de Voordt, et al., 2013; Brill et al., 1985; C.B. Holmes, 1984; Choo & Kim, 2003; Cubukcu & Kahraman, 2008; L.-C. Ou, Chong, Luo, & Minchew, 2011; L. C. Ou et al., 2004; Schloss & Palmer, 2011) and common fashion trends of car interiors the researchers did not expect a wide variety of colors and patterns among the most-appreciated designs. Brown, black, or beige are estimated to be typical colors of car seats comparable to furniture or sofas (C.B. Holmes, 1984). Tofle stated that harmony principles could help to create a pleasing ambience of interiors, but individual taste varies among people and changes over time (Tofle et al., 2004). However, the question arises whether this particular color choice results from having future resale in mind rather than actual preference, and whether representatives of Generation Y would favor the same colorings.
3. Repetition as a design discipline in order to achieve harmony is applied by color as the most common and important means for repetition (Feisner & Reed, 2006). So, the researchers expect a certain repetition of colors and grouping of elements (Hypothesis 3). The interior design is expected to be categorized by repeating colors. Parts of the seats, door trims and dashboard can be grouped by the same or very similar colors. Considering car interior colors in consumer choices, Figure 11 shows similar choices of interior colors compared to the exterior color of the car. For instance, the Z8 interior repeats the blue color in the dashboard, parts of the center console, door trims, and seat back panel.
4. Framing of the interior (Hypothesis 4): The automotive interior is framed by either floor carpet or roof lining, therefore the researchers assumed a distinct pattern in the use of colors and the resulting evaluation of the community members comparable to the color preferences of building interiors (Bakker, Van de Voordt, et al., 2013;

Chapter 3 Visual Customization – Diversity in color preferences in the Automotive Interior and implications for Interior Design
88
Brill et al., 1985; Cubukcu & Kahraman, 2008; Dittmar, 2001; Schloss et al., 2013).
Fig. 11 car interior colors of the last century: BMW 502 convertible with green leather seats and light green exterior, wooden dashboard and trims, and ivory-colored steering wheel (left); BMW Z8 roadster with black leather seats, blue dashboard and trims, the number of interior colors is limited to black and blue (Ou, Luo, Woodcock, & Wright, 2004). Crowd sourcing by communities An interesting way to innovate is described by von Hippel (Von Hippel, 2005). His approach suggested individual users as additional sources of innovation beyond producers and managers from within the car manufacturing company (Von Hippel, 1986, 2005). Crowdsourcing represents a part of this open innovation paradigm in which customers, suppliers, or universities are actively integrated in the value-added process (Gassmann, 2012). User involvement in product innovation and design by toolkits can create value in the business-to-consumer relationship by heterogeneous customer preferences (Franke & Piller, 2004). Both authors describe toolkits as a design interface which enables trial-and-error experimentation and gives simulated feedback on the respective outcome to users. In the case of clothing, user involvement addresses individual needs and preferences caused either by fashion or business niches (Kamali & Loker, 2002). As a

Chapter 3 Visual Customization – Diversity in color preferences in the Automotive Interior and implications for Interior Design
89
result, the users’ willingness to purchase increases (Kamali & Loker, 2002) due to the attribution of greater value of unique products compared to common ones (Brock, 1968; Fournier, 1991). Crowdsourcing can be a promising method to gather user ideas which can complement the idea generation of professionals (Gassmann, 2012; Poetz & Schreier, 2012). In addition to lead user research, knowledge sharing and co-development in communities (Franke & Piller, 2004; Füller, Matzler, & Hoppe, 2008 2008) follow a similar paradigm e.g. to solve an own need (Von Hippel, 1986). Users can also provide solution-based information in the idea generation of the new product development process (Poetz & Schreier, 2012) and, in case of brand communities, they have extensive product knowledge and are enthusiastic in product-related discussions (Füller et al., 2008). Poetz’s study (Poetz & Schreier, 2012) also highlights that user ideas score higher in terms of novelty and customer benefit. However, the users’ capabilities and motivation in combination with the design of the crowdsourcing process tend to be determining factors for the successful application (Poetz & Schreier, 2012). The PhD thesis of Wiegandt (Harhoff & Wiegandt, 2009) shows the value creation potential of firmly-established brand communities as a long-term competitive advantage through fostered relationships and increasing involvement. Consequently, crowd sourcing seems a valuable approach to identify specific preferences of colors for automotive interiors. 2 Methodology To verify the four hypotheses a web 2.0 community was used as a sample. Additionally, international participants were invited via blogs, social networks (e.g. Facebook), advertisements in automotive portals and women’s blogs, design platforms and universities (e.g. in the Netherlands and Romania) active in design with a special focus on recruiting Chinese participants in their native language. Upon entering the web community, the participants had to register first, while answering sociodemographic questions as well as

Chapter 3 Visual Customization – Diversity in color preferences in the Automotive Interior and implications for Interior Design
90
questions regarding creativity, and about the gateway for the contest. The aim of the contest was mainly to create product ideas for customization of the automotive interior, and the winners were decided after a peer-review process and a jury meeting. In order to motivate the participants and enhance their creativity (Füller, Bartl, Ernst, & Muehlbacher, 2006) a gray automotive interior of a BMW 7 Series was illustrated (Fig. 12). For customizing the whole interior, the subjects could select the automotive interior elements (e.g. seats, back panels, dashboard, roof lining, floor carpet, door trims etc.), define the structure (e.g. granulite, tiger print etc.), and select the color. No incentives were awarded for the resulting designs specifically, so, this survey was a by-product of the contest. For each element, the researchers recorded how they were colored, the number of different colors and textures used per element, and the combination of colors and textures along with the peer evaluation of the resulting interior design. The hypotheses about the color preferences of car interiors are studied in relation to the evaluation of the sample. Visual Lightweight Design of dominant elements such as the seats can be realized by different colors of cushion and back panel (cf. BMW Z8 interior in Fig. 11). For instance, the black leather seats combined with a blue back panel, the same blue hue which is repeated in parts of the dashboard, door trims, center console and steering wheel (Hypothesis 1). A way to reach this impression is to repeat and group parts of these dominant interior components by applying the same or similar colors changing in hue or saturation (Hypothesis 3). Consequently, aside from repetition as a design principle to achieve harmony, the technique of variety is applied which results from a use of pure hues combined with shades of a hue related to the parent hue (Feisner & Reed, 2006). Furthermore, the interior is framed by the large surfaces i.e. roof lining and floor carpet by a unique use of color or pattern (Hypothesis 4). Simultaneously, most-appreciated interior designs would follow common trends of colors for interiors and furniture Hypothesis 2). In order to identify these differences in color designs of car interiors, the most-appreciated ones are compared to the least-appreciated ones.
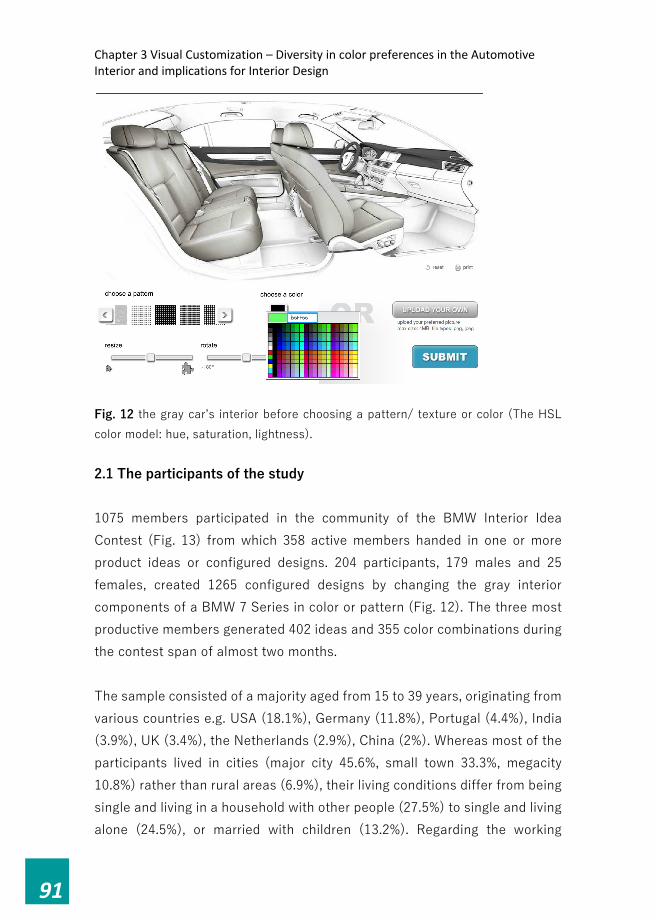
Chapter 3 Visual Customization – Diversity in color preferences in the Automotive Interior and implications for Interior Design
91
Fig. 12 the gray car’s interior before choosing a pattern/ texture or color (The HSL color model: hue, saturation, lightness). 2.1 The participants of the study 1075 members participated in the community of the BMW Interior Idea Contest (Fig. 13) from which 358 active members handed in one or more product ideas or configured designs. 204 participants, 179 males and 25 females, created 1265 configured designs by changing the gray interior components of a BMW 7 Series in color or pattern (Fig. 12). The three most productive members generated 402 ideas and 355 color combinations during the contest span of almost two months. The sample consisted of a majority aged from 15 to 39 years, originating from various countries e.g. USA (18.1%), Germany (11.8%), Portugal (4.4%), India (3.9%), UK (3.4%), the Netherlands (2.9%), China (2%). Whereas most of the participants lived in cities (major city 45.6%, small town 33.3%, megacity 10.8%) rather than rural areas (6.9%), their living conditions differ from being single and living in a household with other people (27.5%) to single and living alone (24.5%), or married with children (13.2%). Regarding the working

Chapter 3 Visual Customization – Diversity in color preferences in the Automotive Interior and implications for Interior Design
92
background of the members only 10.3% showed a connection with the Automotive Industry. The participants own one or two cars (39.7%, 32.4%), driving one to two hours per day by facing urban traffic (47.1%), or highways (32.6%). There is no inclination to particular car brands, which could facilitate an open-minded judgment of the colored interiors. 2.2 Online crowd sourcing set-up The focus of the contest (Fig. 13) was the crowd sourcing of ideas for customization of the automotive interior in three categories: function & convenience, style & design, and personal experiences. The participants were motivated by incentives for winning the contest, and features for interaction were installed, e.g. comments, messaging and a tag cloud. Compared to the main part of the contest, this part was only evaluated by the community according to the two criteria “I like this design” and “I would use this design” (Fig. 13), therefore focusing on the affective states of approach and avoidance (Zajonc, 1980).

Chapter 3 Visual Customization – Diversity in color preferences in the Automotive Interior and implications for Interior Design
93
Fig. 13 the web based idea contest for automotive interior customomziation (left); the evaluation based upon the emotional responses of approach and avoidance for the criteria “I like this idea” and “I would use this idea” (Ou et al., 2004). 2.3 Color Configuration To get an impression of the focus of the contest, i.e. the customization of the automotive interior, an illustration of a typical BMW interior was used as a configurator in order to start the creative process. 17 components within the interior could be individualized by 12 basic colors: black, dark gray, gray, light gray, very light gray, white, red, green, blue, yellow, cyan and magenta. Additionally, the colors could be blended by three numbers in a HSL model color space (Cubukcu & Kahraman, 2008) (cf. Fig. 12). Like in Cubukcu’s study of manipulated facades, the interior components could be changed in hue and in saturation from white to a fully
Chapter 3 Visual Customization – Diversity in color preferences in the Automotive Interior and implications for Interior Design
94
saturated color as well as in lightness from dark to light resulting in diverging chroma. Considering the patterns, each component could be individualized by 30 patterns with the possibility to rotate from -180° to +180° (as shown in Fig. 12) and resize the pattern from small to big. Also, members were able to upload their own pictures as types of pattern, e.g. logos of luxurious brands (e.g. Fig. 19). The 17 components of the interior (1. seat back panel, 2.seat cushion, 3. center console back, 4. headrest, 5. seat frame and trims, 6. floor carpet, 7.door trims bottom, 8. door trims middle, 9. door trims top, 10. roof lining, 11. A-pillar, 12. glove box, 13. dashboard trims, 14. center console/ radio, 15. center stack, 16. steering wheel, 17. center console) can be categorized into seats (back panel, cushion, headrest, seat frame and trims, middle part of rear seating), floor carpet, door (door trims at the bottom, middle and upper part), roof lining (roof lining, A-pillars), and dashboard (glove box, dashboard trims, dashboard center stack, steering wheel, center console/ radio, center console) (Fig. 14).

Chapter 3 Visual Customization – Diversity in color preferences in the Automotive Interior and implications for Interior Design
95
Fig. 14 the 17 interior components (1. seat back panel, 2. seat cushion, 3. center console’s back, 4. headrest, 5. seat frame and trims, 6. floor carpets, 7. door trims bottom, 8. door trims middle, 9. door trims top, 10. roof lining, 11. A-pillar, 12. glove box, 13. dashboard trims, 14. center console/ radio, 15. center stack, 16. steering wheel, 17. center console) that could be adapted in hue, saturation and lightness (HSL Model) or even combined with 30 different patterns (as shown in Fig. 12). 2.4 Rating Process and Color Analysis
By choosing “I like this design”, the users evaluate their appreciated designs, i.e. 264 designs which happen to be 21% of all designs. The second criteria “I would use this design” results in 53 top designs i.e. 4% of all designs (Fig. 15). The sample favored 29 designs, but without any intent to use it. Opposing to the top designs, the researchers identified 34 designs that were neither appreciated by the peer reviewers nor considered to use in a car interior. In this context, the rating of “I would use this design” resembles a potential purchase decision and hence is the strongest selection criterion. The three clusters, i.e. top designs, worst designs and designs liked but not used are analyzed further regarding peculiarities of color choices applied in

Chapter 3 Visual Customization – Diversity in color preferences in the Automotive Interior and implications for Interior Design
96
the interior and regarding characteristics such as layering, repetition, and the level of variety. Therefore, the composition of top designs and worst designs are compared thoroughly. Additionally, it is tested whether specific regions, ages, or car drivers prefer a particular type of color or pattern combination. The researchers excluded haptics, environmental lighting conditions, and the exterior colors of the car from this study. Regarding color science, the focus is laid upon PC-colors. By a comparison of the top and worst designs, the most frequent hues are analyzed for each interior component to identify a pattern in color usage and a potential willingness to buy such an interior. Also, the color choices of more obtruding components like seats, dashboard, and door trims are compared in the top and worst designs in order to investigate the potential characteristics of a harmonic appearance (i.e. hypotheses). By conducting a Pearson correlation analysis, each component is searched for relationships to prove the hypotheses of Visual Lightweight Construction (Hypothesis 1), an adequate level of variety (Hypothesis 2), repetition of colors and clustering of elements (Hypothesis 3), and the framing of the interior by the applied color (Hypothesis 4). All the tests are used equally for the top- and worst-rated designs. To prove the validity of the hypotheses for well appreciated and harmonious designs, the authors expect that the distinctive peculiarities for those designs cannot be found among the 34 worst-rated designs. This leads to guidelines for harmonious car interiors.

Chapter 3 Visual Customization – Diversity in color preferences in the Automotive Interior and implications for Interior Design
97
Fig. 15 the peer-review of the interior designs of the community members among each other. 3 Results The community changed the gray car’s interior by colors and patterns and evaluated the designs without an external jury’s interaction. The colors can be created by a scale blending 6 x 36 colors (Fig. 12). The researchers categorized all colored designs in 13 colors by clustering according to the findings in literature, such as black, brown, beige, gray, white, red, green, blue, orange, yellow, cyan, magenta, and purple. Furthermore, the designs are clustered corresponding to their evaluation in top designs (n = 53), worst designs (n = 34) and designs appreciated; but no intent to use them (n = 29). The resulting demographics represent similar distributions of family status, population area, and gender among the designers of top designs, worst
Possibility to evaluate each design

Chapter 3 Visual Customization – Diversity in color preferences in the Automotive Interior and implications for Interior Design
98
designs, and designs liked but not used. However, other criteria show different distributions among the contest participants. For instance, Import/ Export Business (31.9%) is rated first, followed by the Automotive Industry (22.4%), then Architecture (17.6%). Among the sample’s age, the groups of 20 to 24 years (20.7%) and 40 to 44 years (22.4%) are more frequent than others but with a tendency for younger and middle-aged people (total age span: 15 to 44 years). Regarding the mobility behavior, the majority of participants have no car (48.3%), or hatchbacks (46.6%). This specific sample shows a rather strong to very strong inclination for innovativeness (54.3%, 26.7%), rated by a 5-point Likert-Scale. Table 5 illustrates the most frequent colors of the top interior designs, worst interior designs, and the interior designs that were appreciated but would not lead to a positive purchasing decision. Black is the most frequent color in all the designs regardless of the rating of the interior design. Whereas the top designs contain brownish hues (brown: 15.2%, beige: 13.0%), the worst designs contain gray (14.6%), followed by green (10.9%).
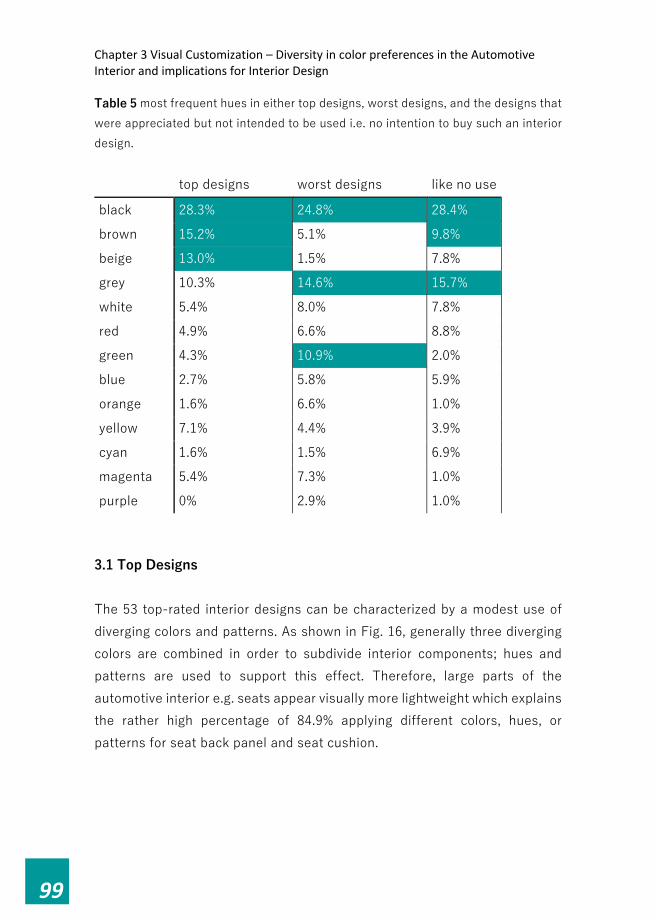
Chapter 3 Visual Customization – Diversity in color preferences in the Automotive Interior and implications for Interior Design
99
Table 5 most frequent hues in either top designs, worst designs, and the designs that were appreciated but not intended to be used i.e. no intention to buy such an interior design.
top designs worst designs like no use
black 28.3% 24.8% 28.4% brown 15.2% 5.1% 9.8% beige 13.0% 1.5% 7.8% grey 10.3% 14.6% 15.7% white 5.4% 8.0% 7.8% red 4.9% 6.6% 8.8% green 4.3% 10.9% 2.0% blue 2.7% 5.8% 5.9% orange 1.6% 6.6% 1.0% yellow 7.1% 4.4% 3.9% cyan 1.6% 1.5% 6.9% magenta 5.4% 7.3% 1.0% purple 0% 2.9% 1.0%
3.1 Top Designs The 53 top-rated interior designs can be characterized by a modest use of diverging colors and patterns. As shown in Fig. 16, generally three diverging colors are combined in order to subdivide interior components; hues and patterns are used to support this effect. Therefore, large parts of the automotive interior e.g. seats appear visually more lightweight which explains the rather high percentage of 84.9% applying different colors, hues, or patterns for seat back panel and seat cushion.

Chapter 3 Visual Customization – Diversity in color preferences in the Automotive Interior and implications for Interior Design
100
Fig. 16 two examples of the most-appreciated designs, succeeding in both evaluation criteria: use and like. By a subjective visual analysis of the top interior designs, the interiors tend to be more uniform and harmonious. A closer look at each component might explain this impression. The tables 6 to 10 illustrate the color distribution of components within the car’s interior that are most appreciated accompanied by a willingness to buy such an interior. The seat is one of the most dominant parts in the interior consisting of seat cushion, seat belts, seat back panel, headrests, middle part rear seating and seat frame and trims. The most predominant colors are brown and beige ranging from 15 to more than 25%, except the seat belts which are most frequently colored black (> 20%; followed by beige and gray). Although colors like red, green, blue, or yellow exceeded the 5% range for some seat components, the overall distribution remains below 5% in the entire interior (cf. Table 6) which indicates that the need for uncommon colors in car seat design exists but is a niche market.

Chapter 3 Visual Customization – Diversity in color preferences in the Automotive Interior and implications for Interior Design
101
Table 6 the most-appreciated designs’ color distribution of the seat components: cushion, belts, back panel, headrests, middle part rear seating, and seat frame and trims above and below 5% (unity: frequency [%]).
seat cushion
seat belts
seat back panel
middle part rear seating
head rests
seat frame
black 9.4 20.8 9.4 7.5 13.2 13.2 brown 17.0 9.4 15.1 28.3 17.0 15.1 beige 26.4 18.9 26.4 20.8 28.3 22.6 grey 11.3 17.0 11.3 11.3 13.2 11.3 white 1.9 3.8 5.7 1.9 1.9 5.7 red 7.5 3.8 11.3 9.4 3.8 7.5 green 5.7 5.7 7.5 3.8 3.8 7.5 blue 7.5 1.9 1.9 1.9 5.7 3.8 orange 3.8 3.8 0 0 1.9 0 yellow 3.8 7.5 5.7 5.7 3.8 7.5 cyan 1.9 0 1.9 5.7 3.8 1.9 magenta 3.8 7.5 3.8 3.8 3.8 3.8
The color variation of the doors (Table 7) within the top-rated designs seem to correspond to the findings of the seat. In either door trims at bottom, middle and top, beige and brown are used frequently from 10 to 30%, but complemented by gray, black, and red (> 10%). Less common colors such as green, white, blue, yellow, orange, and magenta are seldom requested (slightly above and below 5%).

Chapter 3 Visual Customization – Diversity in color preferences in the Automotive Interior and implications for Interior Design
102
Table 7 the most-appreciated designs’ color distribution of the door trims components: bottom, middle and top (unity: frequency [%]).
door trims bottom
door trims middle door trims top
black 5.7 17.0 1.9 brown 15.1 11.3 30.2 beige 24.5 28.3 20.8 grey 15.1 15.1 11.3 white 7.5 3.8 5.7 red 13.2 5.7 11.3 green 7.5 3.8 5.7 blue 3.8 5.7 3.8 orange 1.9 1.9 0 yellow 3.8 3.8 3.8 cyan 0 0 1.9 magenta 1.9 3.8 3.8
The large-scaled components like floor carpet or roof lining added by the A-pillars show a strong inclination for beige and gray from 15 to more than 35% of the designs i.e. lighter hues of the color variety, but also black and brown above and below 10%. There is a decisive difference according to the sizes of the surfaces, e.g. the A-pillar as much smaller parts are favored comparably more in black than floor carpet and roof lining (cf. Table 8).

Chapter 3 Visual Customization – Diversity in color preferences in the Automotive Interior and implications for Interior Design
103
Table 8 the most-appreciated designs’ color distribution of floor carpet, roof lining and A-pillars (unity: frequency [%]).
floor carpet front_back roof lining A-pillar
black 9.4 11.3 18.9 brown 13.2 7.5 11.3 beige 35.8 37.7 28.3 grey 17.0 20.8 18.9 white 5.7 5.7 3.8 red 5.7 3.8 5.7 green 0 1.9 3.8 blue 3.8 1.9 3.8 orange 1.9 0 0 yellow 3.8 7.5 3.8 cyan 0 0 0 magenta 3.8 1.9 1.9
Table 9 displays the color distribution of a conglomerate of dashboard parts, steering wheel, and center console. Whereas the use of brown, black, and beige define the coloring of those parts, there is a slight difference between larger and smaller parts. The larger parts are more frequently colored in beige or sometimes brown. Simultaneously, the smaller parts tend to be colored in darker colors like black comparable to the findings of the A-pillars, roof lining, and floor carpet.

Chapter 3 Visual Customization – Diversity in color preferences in the Automotive Interior and implications for Interior Design
104
Table 9 the most-appreciated designs’ color distribution of the cockpit components including steering wheel (unity: frequency [%]).
glove box dashboard trims
center stack
steering wheel
center console front
center console
black 15.1 1.9 15.1 24.5 1.9 13.2 brown 13.2 37.7 13.2 11.3 18.9 24.5 beige 24.5 17.0 22.6 17.0 32.1 17.0 grey 13.2 9.4 15.1 11.3 9.4 17.0 white 5.7 3.8 3.8 5.7 5.7 0 red 9.4 9.4 7.5 9.4 9.4 9.4 green 7.5 5.7 7.5 3.8 7.5 3.8 blue 0 5.7 1.9 3.8 1.9 5.7 orange 1.9 0 1.9 1.9 1.9 1.9 yellow 3.8 3.8 3.8 5.7 5.7 1.9 cyan 0 1.9 1.9 0 0 1.9 magenta 5.7 3.8 5.7 5.7 5.7 3.8
An analysis of the differences in usage of patterns shows that mostly no pattern was applied to the components. Furthermore, the 2nd most frequently used pattern differed among each component with an occasional use of extra patterns i.e. an individual creation and uploads of patterns (cf. Fig. 17: the use of two most frequently used patterns).

Chapter 3 Visual Customization – Diversity in color preferences in the Automotive Interior and implications for Interior Design
105
Fig. 17 examples of pattern changes in the configurator (left: wooden appearance of the seat; right: brushed aluminum look). No paradigm can be identified among the different patterns and particular colors in the remaining components of car interiors. An intense relationship between hue, saturation, and lightness or chroma in agreement with the principles of variety for harmonious design could be found (Feisner & Reed, 2006). A Pearson correlation analysis of the interior components resulted in significant findings except in the pairings of seat back panel/ floor carpet, floor carpet/ middle part rear seating and floor carpet/ dashboard trims which indicates no dependencies on their colorings for those respective parts (cf. Table 10). The strongest significant correlations of seating components were found between seat back panel and seat frame and trims (ρ = 0.751), seat cushion and headrests (ρ = 0.886), and middle part rear seating and headrests (ρ = 0.751). Therefore, the material of the different seat parts can be differentiated into plastic parts and cushion parts with similar upholsteries (cloth, artificial leather, leather). The doors have strong correlations corresponding to the various positions: door trims bottom and steering wheel (ρ = 0.649), door trims middle and center/ radio console (ρ = 0.674), door trims top and dashboard trims (ρ = 0.779). Consequently, in those parts the various locations of the parts influence the colors of the parts close by. The surrounding parts floor carpet and roof lining also show correlations (floor carpet & steering wheel ρ = 0.673, roof lining & dashboard trims ρ = 0.640,

Chapter 3 Visual Customization – Diversity in color preferences in the Automotive Interior and implications for Interior Design
106
A-pillar & door trims top ρ = 0.736). Comparable to the seat components, the dashboard components show strong correlations with each other (dashboard & glove box ρ = 0.857, steering wheel & center/ radio console ρ = 0.703, steering wheel & glove box ρ = 0.730, center console & center stack ρ = 0.642). Again, the common materials of car interiors seem to influence the color choices of interior components as those parts mostly display a similar appearance. For instance, the steering wheel and glove box are commonly covered in leather or plastic covered with foam or foils with the same grain in order to create a harmonious interior through repetition and variety. Between colored components and patterns, few, and weak significant correlations could be found. A paradigm cannot be identified among the different patterns and particular colors in the remaining components of car interiors in both tests. The patterns of interior parts show strong correlations to other component’s patterns. In the case of seating parts, there are not only correlations to seating parts (seat cushion & headrests ρ = 0.803, middle part rear seating & seat back panel ρ = 0.738), but also other components (seat back panel & floor carpet ρ = 0.911, headrests & roof lining ρ = 0.828, seat frame and trims & center console ρ = 0.537, glove box & seat cushion ρ = 0.562, steering wheel & seating back panel ρ = 0.770). Consequently, the use of patterns in the top-rated designs complies with common materials of car interiors, although, a harmonious interior requires a repetition of materials in adjacent parts, and parts with the assumed similar consistency.

Chapter 3 Visual Customization – Diversity in color preferences in the Automotive Interior and implications for Interior Design
107
Table 10 summary of the Pearson Correlation analysis of top designs. Pearson
Correlation colors of seating seat back panel & seat frame and trims 0.751* seat cushion & headrests 0.886* middle part rear seating & headrests 0.751* colors of door trims door trims bottom & steering wheel 0.649* door trims middle & center/ radio console 0.674* door trims top & dashboard trims 0.779* colors of surrounding parts floor carpet & steering wheel 0.673* roof lining & dashboard trims 0.640* A-pillar & door trims top 0.736* colors of surrounding dashboard parts dashboard & glove box 0.857* steering wheel & center/ radio console 0.703* steering wheel & glove box 0.730* center console & center stack 0.642* color & pattern of seating seat cushion & headrests 0.803* middle part rear seating & seat back panel 0.738* seat back panel & floor carpet 0.911* headrests & roof lining 0.828* seat frame & seat back panel 0.770*
*Note: The significance level (i.e. the probability the correlation equals zero) is less than 0.0005 for all correlations in the table
3.2 Worst Designs The 34 worst-rated interior designs can be characterized by a broad use of diverging colors and patterns. In Figure 18, generally three diverging colors

Chapter 3 Visual Customization – Diversity in color preferences in the Automotive Interior and implications for Interior Design
108
are combined in order to cluster interior components with the help of hues and patterns. Despite the top designs, large parts of the least-preferred and used designs are less frequently subdivided by color, saturation, or pattern. For instance, this visual segmentation of seat cushion and back panel shows a lower percentage of 73.5% compared to the top designs.
Fig. 18 two examples of the least-appreciated designs, failing in both evaluation criteria either use and like. The interiors of the worst-rated designs seem to be more diverse and less uniform, therefore a more thorough analysis is needed. In addition to the use of black (24.8%), gray (14.6%) and green (10.9%) are the most common colorings of these interiors. The brownish colors are chosen in less than 5%. Tables 11 to 15 illustrate the least-appreciated color distribution of components within the car’s interior, accompanied by an unwillingness to buy such an interior. The most noticeable colors of seat components are green, gray and red despite the seat belts which are most frequently colored white. Green is more frequent in cushion, middle part rear seating and headrests than in the rest of the parts. For seat belts, back panel and seat frame and trims, gray outweighs the rest of the colors. Additionally, various colors like magenta, yellow, purple, white, or blue exceeds the 5% range for seat components and the overall frequency of these colors among all the interiors of the worst designs is also above 5% (cf. Table 11).

Chapter 3 Visual Customization – Diversity in color preferences in the Automotive Interior and implications for Interior Design
109
Table 11 the least-appreciated designs’ color distribution of the seat components: cushion, belts, back panel, headrests, middle part rear seating, and seat frame and trims (unity: frequency [%]).
seat cushion seat belts
seat back panel
middle part rear seating
head rests
seat frame
black 2.9 5.9 0 0 0 2.9 yellow 2.9 5.9 2.9 5.9 11.8 5.9 cyan 2.9 2.9 2.9 0 2.9 0 magenta 5.9 5.9 8.8 11.8 5.9 11.8 purple 8.8 0 2.9 5.9 8.8 0 brown 2.9 0 2.9 5.9 2.9 5.9 beige 5.9 0 5.9 2.9 2.9 5.9 grey 14.7 29.4 29.4 14.7 17.6 26.5 white 8.8 20.6 8.8 5.9 5.9 14.7 red 8.8 11.8 2.9 17.6 8.8 2.9 green 20.6 8.8 17.6 17.6 20.6 5.9 blue 2.9 2.9 8.8 5.9 5.9 5.9 orange 8.8 5.9 5.9 5.9 5.9 11.8 extra color
2.9 0
0 0 0 0
The doors show a similar color distribution to the seats with an intense use of green, gray, red, and yellow (Table 12). Compared to the top designs, the color choices of the doors of the less-appreciated designs resemble the findings of the seat. However, the door trims at the middle height level shows no use of green, like the rest of the door trims which indicates a framing effect or the design principle of variety even among the least-appreciated designs.
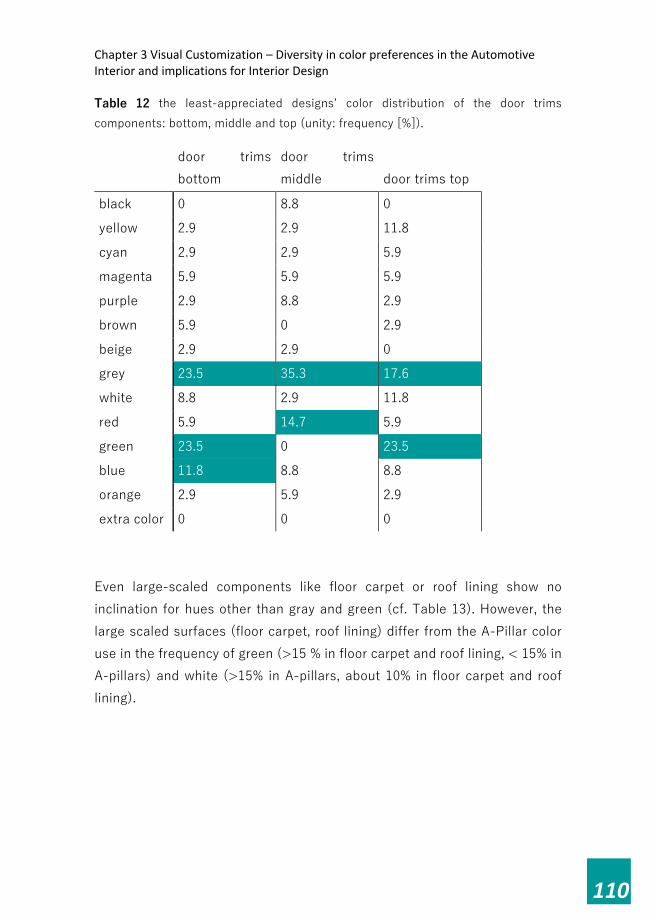
Chapter 3 Visual Customization – Diversity in color preferences in the Automotive Interior and implications for Interior Design
110
Table 12 the least-appreciated designs’ color distribution of the door trims components: bottom, middle and top (unity: frequency [%]).
door trims bottom
door trims middle door trims top
black 0 8.8 0 yellow 2.9 2.9 11.8 cyan 2.9 2.9 5.9 magenta 5.9 5.9 5.9 purple 2.9 8.8 2.9 brown 5.9 0 2.9 beige 2.9 2.9 0 grey 23.5 35.3 17.6 white 8.8 2.9 11.8 red 5.9 14.7 5.9 green 23.5 0 23.5 blue 11.8 8.8 8.8 orange 2.9 5.9 2.9 extra color 0 0 0
Even large-scaled components like floor carpet or roof lining show no inclination for hues other than gray and green (cf. Table 13). However, the large scaled surfaces (floor carpet, roof lining) differ from the A-Pillar color use in the frequency of green (>15 % in floor carpet and roof lining, < 15% in A-pillars) and white (>15% in A-pillars, about 10% in floor carpet and roof lining).

Chapter 3 Visual Customization – Diversity in color preferences in the Automotive Interior and implications for Interior Design
111
Table 13 the least-appreciated designs’ color distribution of floor carpet, roof lining and A-pillars (unity: frequency [%]).
floor carpet front_back roof lining A-pillar black 0 0 0 yellow 0 11.8 5.9 cyan 2.9 2.9 2.9 magenta 11.8 2.9 2.9 purple 2.9 5.9 2.9 brown 11.8 5.9 2.9 beige 0 0 2.9 grey 20.6 26.5 32.4 white 8.8 11.8 17.6 red 8.8 11.8 0 green 17.6 17.6 14.7 blue 8.8 2.9 8.8 orange 2.9 0 5.9 extra color 2.9 0 0
In Table 14 the color usage of dashboard parts, steering wheel, and center console of the least-preferred designs is illustrated. Whereas the use of gray, green, blue, magenta, and red defines the coloring of those parts, there is no difference between larger and smaller parts like with the top designs. Hence, the missing variety and equal colorings of adjacent parts result in the negative evaluation of the subjects.

Chapter 3 Visual Customization – Diversity in color preferences in the Automotive Interior and implications for Interior Design
112
Table 14 the least-appreciated designs’ color distribution of the cockpit components including steering wheel (unity: frequency [%]).
glove box dashboard trims
center stack
steering wheel
center console front
center console
black 2.9 5.9 5.9 8,8 0 2.9 yellow 2.9 11.8 2.9 2,9 8.8 5.9 cyan 0 2.9 0 2,9 0 5.9 magenta 2.9 11.8 2.9 5,9 5.9 11.8 purple 5.9 5.9 5.9 2,9 0 5.9 brown 5.9 5.9 11.8 5,9 2.9 0 beige 2.9 0 2.9 2,9 2.9 5.9 grey 23.5 20.6 17.6 20,6 26.5 23.5 white 5.9 8.8 8.8 5,9 14.7 2.9 red 5.9 8.8 2.9 8,8 11.8 5.9 green 14.7 14.7 14.7 14,7 14.7 14.7 blue 11.8 2.9 11.8 8,8 2.9 11.8 orange 11.8 0 11.8 5,9 8.8 2.9 extra color
2.9 0 0 2,9 0 0
The usage of patterns indicates that like among the top designs no pattern was chosen to individualize the components. However, the 2nd most frequently used ones were the extra patterns created and uploaded by the users (cf. Fig. 19).
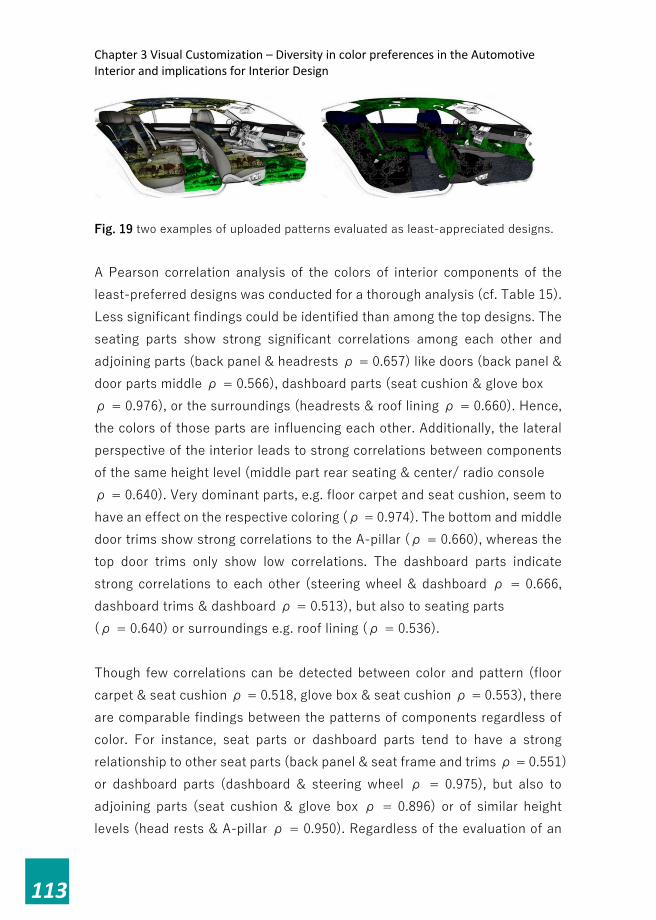
Chapter 3 Visual Customization – Diversity in color preferences in the Automotive Interior and implications for Interior Design
113
Fig. 19 two examples of uploaded patterns evaluated as least-appreciated designs. A Pearson correlation analysis of the colors of interior components of the least-preferred designs was conducted for a thorough analysis (cf. Table 15). Less significant findings could be identified than among the top designs. The seating parts show strong significant correlations among each other and adjoining parts (back panel & headrests ρ = 0.657) like doors (back panel & door parts middle ρ = 0.566), dashboard parts (seat cushion & glove box ρ = 0.976), or the surroundings (headrests & roof lining ρ = 0.660). Hence, the colors of those parts are influencing each other. Additionally, the lateral perspective of the interior leads to strong correlations between components of the same height level (middle part rear seating & center/ radio console ρ = 0.640). Very dominant parts, e.g. floor carpet and seat cushion, seem to have an effect on the respective coloring (ρ = 0.974). The bottom and middle door trims show strong correlations to the A-pillar (ρ = 0.660), whereas the top door trims only show low correlations. The dashboard parts indicate strong correlations to each other (steering wheel & dashboard ρ = 0.666, dashboard trims & dashboard ρ = 0.513), but also to seating parts (ρ = 0.640) or surroundings e.g. roof lining (ρ = 0.536). Though few correlations can be detected between color and pattern (floor carpet & seat cushion ρ = 0.518, glove box & seat cushion ρ = 0.553), there are comparable findings between the patterns of components regardless of color. For instance, seat parts or dashboard parts tend to have a strong relationship to other seat parts (back panel & seat frame and trims ρ = 0.551) or dashboard parts (dashboard & steering wheel ρ = 0.975), but also to adjoining parts (seat cushion & glove box ρ = 0.896) or of similar height levels (head rests & A-pillar ρ = 0.950). Regardless of the evaluation of an

Chapter 3 Visual Customization – Diversity in color preferences in the Automotive Interior and implications for Interior Design
114
interior design, comparable dependencies exist among the colorings or color and patterns of the components. In comparison to the analysis of the top designs, significant relationships between color and pattern could be found. Hence, in the case of a not favorable design, color and pattern are both supporting this. Comparable to the top-rated designs, here the pairings of a component’s color and hue also proves to be significant. Thus, the intense relationship between hue and saturation due to the principles of variety for harmonious design (Feisner & Reed, 2006) cannot be the only reason for an evaluation of a car interior. Other significant findings regarding gender or other sociodemographic data such as education or occupation could not be determined.
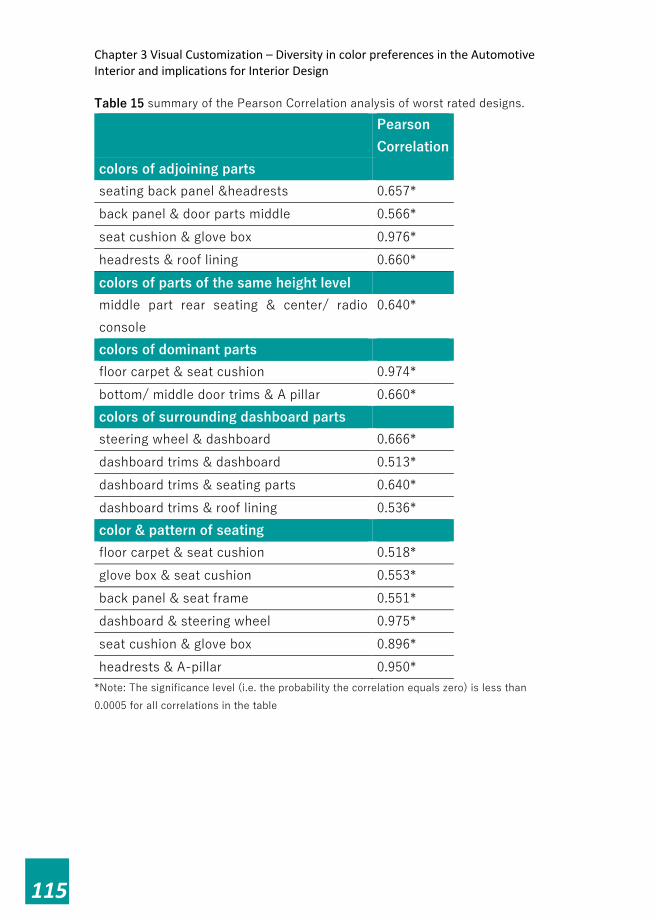
Chapter 3 Visual Customization – Diversity in color preferences in the Automotive Interior and implications for Interior Design
115
Table 15 summary of the Pearson Correlation analysis of worst rated designs. Pearson
Correlation colors of adjoining parts seating back panel &headrests 0.657* back panel & door parts middle 0.566* seat cushion & glove box 0.976* headrests & roof lining 0.660* colors of parts of the same height level middle part rear seating & center/ radio console
0.640*
colors of dominant parts floor carpet & seat cushion 0.974* bottom/ middle door trims & A pillar 0.660* colors of surrounding dashboard parts steering wheel & dashboard 0.666* dashboard trims & dashboard 0.513* dashboard trims & seating parts 0.640* dashboard trims & roof lining 0.536* color & pattern of seating floor carpet & seat cushion 0.518* glove box & seat cushion 0.553* back panel & seat frame 0.551* dashboard & steering wheel 0.975* seat cushion & glove box 0.896* headrests & A-pillar 0.950*
*Note: The significance level (i.e. the probability the correlation equals zero) is less than 0.0005 for all correlations in the table

Chapter 3 Visual Customization – Diversity in color preferences in the Automotive Interior and implications for Interior Design
116
4 Discussion The comparison of the findings of the top-rated to the worst-rated interior designs verifies all of the hypotheses of the study leading to stronger customer appreciation and as a next step to a positive buying decision for a specific car interior. The hypotheses of Visual Lightweight Construction (Hypothesis 1), a modest use of color and pattern variety in order to achieve a harmonic interior design (Hypothesis 2), the repetition and grouping of interiors by a systematic use of color or pattern (Hypothesis 3) and the framing of the interior by roof lining and floor carpet colorings (Hypothesis 4) are evaluated in relation to the peculiarities of the top-rated designs. Where the worst-rated designs proved the exact opposite, the hypotheses can be sustained. Concerning the color choices of both opposing interiors, black is the most frequently used color, although the major difference is the rest of the most frequent colors. Brownish hues, such as brown, cognac, or beige were commonly favored colors among the top-rated designs, whereas the worst evaluated designs showed a tendency for gray and green. Despite the diverging hues, the number of colors used simultaneously in an interior is identical. Generally, three colors were combined with the purpose of structuring the interior. While the number of diverging colors is an important evaluation criterion of the sample, the color composition, and kind of colors of the components add up to an overall positive impression that harmonious designs are more decisive. 4.1 Visual Lightweight Construction Dominant parts of the interior like the seats, doors, or dashboard can be visually subdivided by applying different colors or patterns. For instance, the seat back panel and seat cushion use different colors, hues, or patterns by an above average percentage of the top-rated designs. However, differences between the top and worst designs can be detected (cf. Table 6, Table 10 and Fig. 16) in the frequency analysis. So, there is a less frequent use of distinct colors among the worst-rated designs than the top-rated designs,

Chapter 3 Visual Customization – Diversity in color preferences in the Automotive Interior and implications for Interior Design
117
indicating that an application of appearing more lightweight designs can lead to an increase in customer appreciation. This difference, however, is not unambiguous. Significant findings in both design categories, appreciated and not appreciated were identified which were caused by the materials of the seating parts. The interior trim and upholstery seem to follow common expectations of materials such as fabric or leather for cushions and plastic for back panels. Although the layering of colors happens in both designs (most and least-preferred ones), the underlying color differs. In case of the most preferred designs, the brownish hues can be summarized to parent colors, whereas the type of color of the worst-rated designs are opposing or entirely different colors. As this influences the entire composition, the harmony principle can be validated (Feisner & Reed, 2006). 4.2 Modest use of color and pattern variety Further characteristics are expected to result in the color preferences of car interiors. In this study, a general modest use of color was found among all designs. Both the top-rated interiors and the worst-rated ones show three diverging colors. But there is a difference in the kind of hues which is used in both design categories. Whereas the top interiors were mostly colored in brown and beige, the worst ones had a strong inclination for gray and green. The use of the color black is independent from user preferences in this study. A visual subjective analysis conducted by the researchers indicates that an interior being more uniform than diverse results in increased appreciation. This finding follows the design principles for harmony (Feisner & Reed, 2006; L.-C. Ou et al., 2011; L. C. Ou et al., 2004). The composition of a top design consists of brown or beige for the seats and door trims, black seat belts, lighter hues for roof lining and floor carpet which are framing the interior (cf. hypothesis 4). The dashboard, center console, and all adjacent parts can be subdivided according to their size and the respective color. So, larger parts tend to be beige or brown, whereas smaller parts are black. Mostly no pattern is used. The most common patterns show a wooden appearance or an appearance like brushed aluminum.

Chapter 3 Visual Customization – Diversity in color preferences in the Automotive Interior and implications for Interior Design
118
On the other hand, a typical composition of a bad evaluated design uses green, gray and red for the seats and doors with white seat belts. The roof lining and floor carpet, regardless of their framing character, are colored gray and green like the rest of the interior. The dashboard parts and center console show no difference between large or small parts and use the colors gray, green or more noticeable hues such as blue, magenta, and red. No pattern is used unless in some designs the user created and uploaded individual patterns (cf. Fig. 19), although, both design categories differentiate into the materials of parts of interior trims and upholstery e.g. seat cushion and back panel. 4.3 Repetition of colors and grouping of elements
No significant findings could be detected for colors and patterns of components, only between colors and saturation among the top designs. However, the colors and patterns of the worst designs showed significant findings between colors and saturation. No distinct inclination can be found. The repetition of colors can lead to a better understanding of successful interior designs. The strongest correlations of the seats of the top designs can be subdivided according to their materials in framing parts (seat back panel, seat frame and trims), seating surface (seat cushion, headrests), and smaller seat parts (middle part rear seating, headrests). However, the seats of the worst evaluated designs cannot be subdivided in these categories, as further correlations are found for the seat parts e.g. seat cushion and floor carpet. This finding supports the subjective visual analysis of the more uniform interior of the top-rated designs, whereas the doors of the top designs seem to show significant correlations in relation to the height of components due to the sideways perspective of the evaluating subjects. No such result can be found among the worst designs, as those are more focused on adjacent parts. Additionally, the top design’s dashboard parts and center console indicate correlations with each other, whereas in the worst designs the perspective of

Chapter 3 Visual Customization – Diversity in color preferences in the Automotive Interior and implications for Interior Design
119
the viewer is more decisive e.g. glove box and floor carpet. This indicates that the subjective observation that the worst designs are more diverse is valid. A closer look at the correlations of the component’s patterns show different correlations of top and worst designs, but similar ones in its characteristics. The correlations found were either among adjoining parts or parts at the same height level according to the viewer’s perspective. 4.4 Framing of the interior by dominant elements of the interior
The findings of roof lining, A-pillars, and floor carpet as main parts framing the interior correspond to the hypothesis of Tofle et. al. (Tofle et al., 2004) about the sense of spaciousness influenced by contrast effects, especially regarding the distinction of lightness or chroma. Even though both the best- and worst-rated designs show a rather high percentage of gray hues, the major difference is the rest of the color choices. The framing surfaces of interior design show a strong inclination for beige among the top-rated designs which corresponds to Kwallek’s findings (Kwallek et al., 1996) for office walls. Additionally, the discovery of a dislike for greenish hues aligns with the color scheme of large framing surfaces. The use of bright colors can be attributed to the importance of spaciousness even in automotive interiors. However, the color preferences are not that uncommon in comparison to the options offered by car manufacturers today, as all color extremes were evaluated accordingly (c.f. 3.2 Worst Designs). This might be caused by how objects are portrayed in advertisements, especially considering certain stereotypes. Nevertheless, customers are unconsciously aiming to be mature and sophisticated and therefore favor beige or brownish interiors (Schloss & Palmer, 2011).

Chapter 3 Visual Customization – Diversity in color preferences in the Automotive Interior and implications for Interior Design
120
5 Conclusion
The study serves as a first indication of customer choices for the concrete environmental context of car interiors. Notwithstanding, the patterns of preferences in order to develop distinct design guidelines for harmonious interiors are difficult to find. Consumer preferences are not completely heterogeneous but seem to follow weak patterns beyond pure chance (Franke & Piller, 2004), although the color preferences follow the customization guidelines. But an increase in the number of design feature options may not make a difference in customer satisfaction with the mass customization process (Kamali & Loker, 2002). Therefore, the portfolio has to consist of an adequate number of design features, but in a sort of balance to create additional value for customers. Beyond a certain level of choice options, consumers tend to become irritated by too many options. The limitation to spontaneous affective states of approach and avoidance by ignoring other emotions can bias the study. For instance, Cubuku measured color preferences along with arousal, naturalness, and relaxation (Cubukcu & Kahraman, 2008). Thus, the combination of presenting colored interiors and rating those by like or dislike, enables a spontaneous affective response (Zajonc, 1980). In addition, the study considered multiple colors of various interior components. So, the spontaneous emotional judgment of liking or disliking an interior design represents the preference for a combination of colors. Cubukcu assumed the settings to be more realistic, if a study is not limited to investigate the effects of single colors (Cubukcu & Kahraman, 2008). No significant differences in gender could be identified (D. Katz, 1979, 2013; S. Katz & Breed, 1922; L. C. Ou et al., 2004). Even though sociodemographic data like education or occupation was gathered, those could not be used as the data focused on the creators of the interior design but not the evaluators. Consequently, missing significant relations to color preferences only imply that a conclusion for the creators’ sociodemographic data can be made.

Chapter 3 Visual Customization – Diversity in color preferences in the Automotive Interior and implications for Interior Design
121
In order to prevent interdependencies by the use of color names, the HSL color model was applied for color classification of the interior components giving a rather broad range of choices. Consequently, the subjects were able to choose the colors directly while designing the interiors. Afterwards, the same colors of the HSL model were evaluated in combination with interior components. This approach is not uncommon as today’s cars are personalized by using configurators and toolkits. The colored interior is then displayed to the potential buyer. The resemblance of the car seats to furniture leads to the stereotypical color preferences of brown and beige. Buyers expect harmonious car interiors and have a very precise idea of how car interiors should look. But color perception per se is influenced beyond saturation, lightness/ chroma and hue by the respective viewing angle, amount and type of ambient light, and presence of other colors or further environmental conditions (D. H. Brainard & Radonjić, 2014; Elliot, 2015; Fairchild, 2015; Hunt & Pointer, 2011). For instance, the exterior color of a car might have an influence on the color preferences of the car interior, a fact which is excluded from the study so as to focus on the interior. The interdependency of exterior and interior design might need further research. Another limitation of the study is the static approach of the color evaluation. Because human color vision changes according to the various lighting conditions, the coloring of interior components should be tested in a mock-up under real-life situations as well as both extremes in bright sunlight as well as dusk, where color vision tends to be unreliable (Verity, 1980). A standardization of illumination is required as it can be difficult to discriminate between colors which might corrupt the results (Verity, 1980). This is why in car development and design mock-ups and clay models are used for complementing virtual engineering methods. Sunlight simulation and field tests enable engineers to identify the suitability for daily usage. In order to identify the environmental impacts on colored surfaces, further research with actual mock-ups or cars might be useful to exclude dazzling or possible interaction with exterior color or the physical shape of interior components.

Chapter 3 Visual Customization – Diversity in color preferences in the Automotive Interior and implications for Interior Design
122
Common taste or cultural factors can also have an impact which are not necessarily static over time. Additionally, customization principles are related to general human-product interaction principles, assuming the possession of the product. During times, in which owning a car becomes less attractive in cities and car-sharing solutions increase in popularity, the human-product relationship changes intensively. Since a continuous change of interior trim and upholstery for each customer of a car sharing business is seldom a competitive and cost-effective way to reach customer satisfaction, further individualization techniques should be investigated such as customization by interior lighting and changing colors (Wagner et al., 2014) or flexible individualizable storage solutions by standardized interfaces (Wagner, Kilincsoy, Reitmeir, & Vink, 2016). Nevertheless, the findings of the color preferences for car interiors should be considered for car sharing interiors.

Chapter 3 Visual Customization – Diversity in color preferences in the Automotive Interior and implications for Interior Design
123
REFERENCES America, C. C. o., & Ostwald, W. (1958). Color Harmony Manual. Audenhove, F.-J. V., Korniichuk, O., Dauby, L., & Pourbaix, J. (2014). The Future of urban mobility 2.0: Imperatives to shape extended mobility ecosystems of tomorrow. Retrieved from Bakker, I. (2014). Uncovering the secrets of a productive environment, A journey through the impact of plants and colour: TU Delft, Delft University of Technology. Bakker, I., Van de Voordt, D. J. M., Vink, P., De Boon, J., & Bazeley, C. (2013). Color Preferances for Different Topics in Connection to Personal Characteristics. Color Research & Application, DOI: 10.1002/col.21845. Bakker, I., van der Voordt, T., Vink, P., de Boon, J., & Bazley, C. (2015). Color preferences for different topics in connection to personal characteristics. Color Research & Application, 40(1), 62-71. doi:10.1002/col.21845 Bakker, I., van der Voordt, T. J., de Boon, J., & Vink, P. (2013). Red or blue meeting rooms: does it matter? The impact of colour on perceived productivity, social cohesion and wellbeing. Facilities, 31(1/2), 68-83. Brainard, D. H., and Radonjic, A. (2014). Color constancy. In J. S. Werner & L. M. Chalupa (Eds.), The new visual neurosciences (pp. 545–556): Mit Press. Brainard, D. H., & Radonjić, A. (2014). Color constancy. In The New Visual Neurosciences (pp. 545-556): MIT Press. Brill, M., Margulis, S. T., & Konar, E. (1985). Using office design to increase productivity (Vol. 2): Workplace Design and Productivity, Inc. Brock, T. C. (1968). Implications of Commodity Theory for Value Change. In T. C. B. a. T. M. O. A.G. Greewald (Ed.), Psychological foundations of attitudes (pp. 243–275). New York: Academic Press. C.B. Holmes, J. A. B. (1984). Color preference as a function of the object described. In P. Society (Ed.), Bulletin (Vol. 22, pp. 423-425). Choo, S., & Kim, Y. (2003). Effect of color on fashion fabric image. Color Research & Application, 28(3), 221-226. Cubukcu, E., & Kahraman, I. (2008). Hue, saturation, lightness, and building exterior preference: An empirical study in Turkey comparing architects' and

Chapter 3 Visual Customization – Diversity in color preferences in the Automotive Interior and implications for Interior Design
124
nonarchitects' evaluative and cognitive judgments. Color Research & Application, 33(5), 395-405. doi:10.1002/col.20436 Dittmar, M. (2001). Changing Colour Preferences with Ageing: A Comparative Study on Younger and Older Native Germans Aged 19–90 Years. Gerontology, 47(4), 219-226. Elliot, A. J. (2015). Color and psychological functioning: a review of theoretical and empirical work. Frontiers in Psychology, 6, 368. doi:10.3389/fpsyg.2015.00368 Eysenck, H. J. (1941). A Critical and Experimental Study of Colour Preferences. The American Journal of Psychology, 54(3), 385-394. doi:10.2307/1417683 Fairchild, M. D. (2015). Seeing, adapting to, and reproducing the appearance of nature. Applied Optics, 54(4), B107-B116. doi:10.1364/AO.54.00B107 Feisner, E. A., & Reed, R. (2006). Color Studies (Vol. 2). New York: Fairchild Books. Fenko, A., Otten, J. J., & Schifferstein, H. N. (2010). Describing product experience in different languages: The role of sensory modalities. Journal of Pragmatics, 42(12), 3314-3327. Fournier, S. (1991). Meaning-based framework for the study of consumer-object relations. NA-Advances in Consumer Research Volume 18. Franke, N., & Piller, F. (2004). Value Creation by Toolkits for User Innovation and Design: The Case of the Watch Market. Journal of Product Innovation Management, 21(6), 401-415. doi:10.1111/j.0737-6782.2004.00094.x Füller, J., Bartl, M., Ernst, H., & Muehlbacher, H. (2006). Community based innovation: How to integrate members of virtual communities into new product development. 6(1), 57-73. doi:10.1007/s10660-006-5988-7 Füller, J., Matzler, K., & Hoppe, M. (2008). Brand Community Members as a Source of Innovation. Journal of Product Innovation Management, 25(6), 608-619. doi:10.1111/j.1540-5885.2008.00325.x Funk, D., & Oly Ndubisi, N. (2006). Colour and product choice: a study of gender roles. Management Research News, 29(1/2), 41-52. doi:doi:10.1108/01409170610645439 Gagg, R. (2012). Basics Interior Architecture 05: Texture+ Materials. Muttenz, Switzerland: Ava Publishing.

Chapter 3 Visual Customization – Diversity in color preferences in the Automotive Interior and implications for Interior Design
125
Gassmann, O. (2012). Crowdsourcing : [Innovationsmanagement mit Schwarmintelligenz ; interaktiv Ideen finden ; kollektives Wissen effektiv nutzen ; mit Fallbeispielen und Checklisten]: Hanser. Guilford, J. P., & Smith, P. C. (1959). A system of color-preferences. The American Journal of Psychology, 72(4), 487-502. Harhoff, P. D., & Wiegandt, P. (2009). Value Creation of Firm-Established Brand Communities: Gabler Verlag. Hekkert, P., & Karana, E. (2013). Designing Material Experience. Materials Experience: fundamentals of materials and design, 1. Hering, E. (1964). Outlines of a theory of the light sense: Harvard University Press. Hunt, R. W. G., & Pointer, M. R. (2011). Spectral Weighting Functions. In Measuring Colour (pp. 19-40): John Wiley & Sons, Ltd. IFMO. (2011). Mobilität junger Menschen im Wandel – multimodaler und weiblicher. Retrieved from IFMO. (2013). 'Mobility Y' – The Emerging Travel Patterns of Generation Y. Retrieved from Itten, J., & Birren, F. (1970). The elements of color: John Wiley & Sons. Kamali, N., & Loker, S. (2002). Mass Customization: On-line Consumer Involvement in Product Design. Journal of Computer-Mediated Communication, 7(4), 0-0. doi:10.1111/j.1083-6101.2002.tb00155.x Katz, D. (1979). Gestalt psychology, its nature and significance: Greenwood Pub Group. Katz, D. (2013). The world of colour (Vol. 44): Routledge. Katz, S., & Breed, F. (1922). The Color Preferences of Children. Journal of Applied Psychology, 6(3), 255. Kwallek, N., Lewis, C., Lin-Hsiao, J., & Woodson, H. (1996). Effects of nine monochromatic office interior colors on clerical tasks and worker mood. Color Research and Application, 21(6), 448-458. Madden, T. J., Hewett, K., & Roth, M. S. (2000). Managing images in different cultures: A cross-national study of color meanings and preferences. Journal of international marketing, 8(4), 90-107.

Chapter 3 Visual Customization – Diversity in color preferences in the Automotive Interior and implications for Interior Design
126
Merleau-Ponty, M., & Smith, C. (1996). Phenomenology of perception: Motilal Banarsidass Publishe. Munsell, A. H. (1919). A color notation: Munsell color company. Newton, I. (1979). Opticks, or, a treatise of the reflections, refractions, inflections & colours of light: Courier Corporation. Ostwald, W. (1931). Colour science. Ou, L.-C., Chong, P., Luo, M. R., & Minchew, C. (2011). Additivity of colour harmony. Color Research & Application, 36(5), 355-372. doi:10.1002/col.20624 Ou, L. C., Luo, M. R., Woodcock, A., & Wright, A. (2004). A study of colour emotion and colour preference. Part I: Colour emotions for single colours. Color Research & Application, 29(3), 232-240. Poetz, M. K., & Schreier, M. (2012). The value of crowdsourcing: can users really compete with professionals in generating new product ideas? Journal of Product Innovation Management, 29(2), 245-256. Poldma, T. (2009). Learning the dynamic processes of color and light in interior design. Journal of Interior Design, 34(2), 19-33. Pomerleau, A., Bolduc, D., Malcuit, G., & Cossette, L. (1990). Pink or blue: Environmental gender stereotypes in the first two years of life. Sex Roles, 22(5-6), 359-367. Roberts, S. C., Owen, R. C., & Havlicek, J. (2010). Distinguishing between perceiver and wearer effects in clothing color-associated attributions. Evolutionary Psychology, 8(3), 147470491000800304. Saito, M. (1996). Comparative studies on color preference in Japan and other Asian regions, with special emphasis on the preference for white. Color Research & Application, 21(1), 35-49. Schloss, K. B., & Palmer, S. E. (2011). Aesthetic response to color combinations: preference, harmony, and similarity. Attention, Perception, & Psychophysics, 73(2), 551-571. Schloss, K. B., Strauss, E. D., & Palmer, S. E. (2013). Object color preferences. Color Research & Application, 38(6), 393-411.

Chapter 3 Visual Customization – Diversity in color preferences in the Automotive Interior and implications for Interior Design
127
Sears, D. O. (1986). College sophomores in the laboratory: Influences of a narrow data base on social psychology's view of human nature. Journal of personality and social psychology, 51(3), 515. Sheppard, J. J. (1968). Human color perception: a critical study of the experimental foundation: American Elsevier Pub. Co. Shulman, K. (2001). The color of money. In: Metropolis. Tofle, R., Schwarz, B., Yoon, S., & Max-Royale, A. (2004). Color in healthcare environments. Bonita, CA: The Coalition for Health Environments Research. Verity, E. (1980). Color observed: Van Nostrand Reinhold Company. Von Hippel, E. (1986). Lead users: a source of novel product concepts. Management science, 32(7), 791-805. Von Hippel, E. (2005). Democratizing innovation: The evolving phenomenon of user innovation. Journal für Betriebswirtschaft, 55(1), 63-78. Wagner, A.-S., Kilincsoy, Ü., Reitmeir, M., & Vink, P. (2014). Adaptive Customization –Value Creation by Adaptive Lighting in the Car Interior. In P. Vink (Ed.), Advances in Social and Organizational Factors (pp. 40-50): AHFE Conference. Wagner, A.-S., Kilincsoy, Ü., Reitmeir, M., & Vink, P. (2016). Functional customization: Value creation by individual storage elements in the car interior. Work, 54(4), 873-885. Winchip, S. M. (2005). Designing a quality lighting environment: Fairchild. Zajonc, R. B. (1980). Feeling and thinking: Preferences need no inferences. American psychologist, 35(2), 151. Zentner, M. R. (2001). Preferences for colours and colour‐‐emotion combinations in early childhood. Developmental Science, 4(4), 389-398.

Chapter 3 Visual Customization – Diversity in color preferences in the Automotive Interior and implications for Interior Design
128

Chapter 4 Functional Customization - Value Creation by individual storage elements in the Car Interior
129
Chapter 4 Functional Customization - Value Creation
by individual storage elements in the Car Interior
Abstract Mobility demands change due to differing life stages of car owners. Car sharing and retail markets seldom offer a possibility for customization by the user in contrast to the freedom of choice of an initial owner of a car. The value creation of functional customization is investigated. Prior to a test with a concept design, different use case scenarios of car drivers are identified regarding the preferred storage location of their personal belongings in different situations. A study with 70 subjects was conducted in order to evaluate the value added by functional customization. Storage habits of users were investigated in general and in relation to a concept design offering the possibility for flexible storage. Smartphones, supplies, beverages, and wallets were the most relevant belongings in all driving situations (commuting, leisure, vacation and special occasions) complemented by sports equipment. Smartphones and other valuables are stored within reach and sight of the user. The emotional responses, recorded before and after the test, subdivided in attraction, hope and joy indicated positive feedback. The ease of use and the design proved to be crucial product characteristics of individually adaptable storage solutions. Positive emotions are contributing factors for a user’s purchasing decision. Keywords: Functional customization, flexible storage, smart interior design, usability Wagner, A.-S., Kilincsoy, Ü., Reitmeir, M., & Vink, P. (2016). Functional customization: Value creation by individual storage elements in the car interior. Work, 54(4), 873-885.
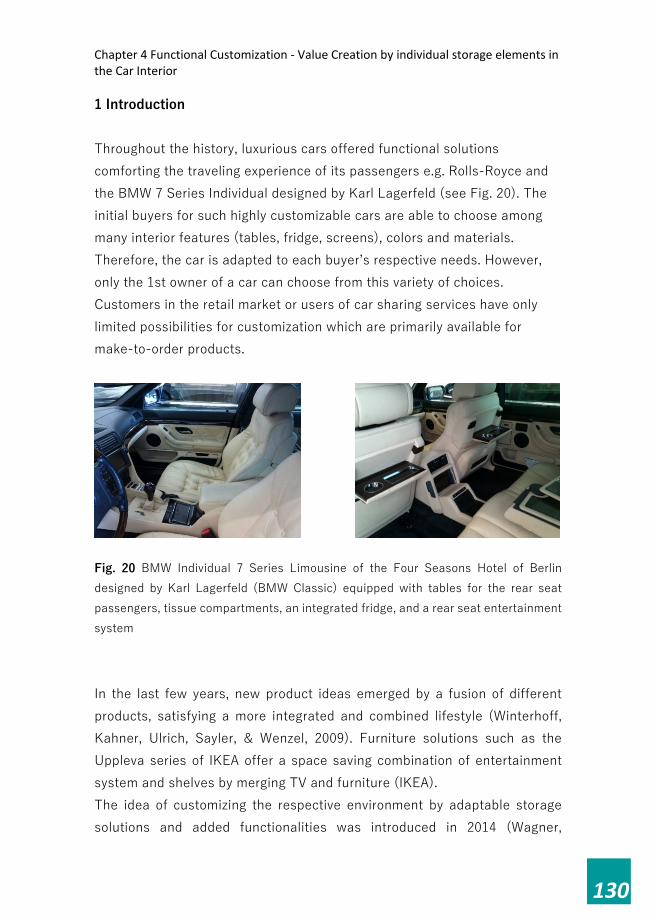
Chapter 4 Functional Customization - Value Creation by individual storage elements in the Car Interior
130
1 Introduction Throughout the history, luxurious cars offered functional solutions comforting the traveling experience of its passengers e.g. Rolls-Royce and the BMW 7 Series Individual designed by Karl Lagerfeld (see Fig. 20). The initial buyers for such highly customizable cars are able to choose among many interior features (tables, fridge, screens), colors and materials. Therefore, the car is adapted to each buyer’s respective needs. However, only the 1st owner of a car can choose from this variety of choices. Customers in the retail market or users of car sharing services have only limited possibilities for customization which are primarily available for make-to-order products.
Fig. 20 BMW Individual 7 Series Limousine of the Four Seasons Hotel of Berlin designed by Karl Lagerfeld (BMW Classic) equipped with tables for the rear seat passengers, tissue compartments, an integrated fridge, and a rear seat entertainment system In the last few years, new product ideas emerged by a fusion of different products, satisfying a more integrated and combined lifestyle (Winterhoff, Kahner, Ulrich, Sayler, & Wenzel, 2009). Furniture solutions such as the Uppleva series of IKEA offer a space saving combination of entertainment system and shelves by merging TV and furniture (IKEA). The idea of customizing the respective environment by adaptable storage solutions and added functionalities was introduced in 2014 (Wagner,

Chapter 4 Functional Customization - Value Creation by individual storage elements in the Car Interior
131
Kilincsoy, Reitmeir, & Vink, 2014) as functional customization (Boër & Dulio, 2007). This functional customization in product design is a user centered approach that can be transferred to the car’s interior. Other products like smartphones can be bought with a standardized design and customized afterwards by colored covers or additional functionalities like charging, protection or antenna amplification. The willingness to spend money on functional customization (16–80 Euros) was identified as higher than on aesthetic customization (8–20 Euros). Functional customization also has to consider the changing behavior of car users. Megatrends describe that consumer trends like Sensation Seekers search for a sensory experience with the car being an extension of office and leisure (Winterhoff et al., 2009). Whereas High-Frequency commuters tend to prefer car-sharing or short-term rental offers (Winterhoff et al., 2009). Therefore, the car’s interior is exposed to changing mobility behaviors resulting from car sharing and the trend of interconnectedness. Consequently, the users expect to find storage solutions for their most valuable CE devices e.g. smartphones or tablet PCs in their cars. In this project, a concept design with integrated standardized interfaces was applied to offer the possibility of rearranging the compartments and storage solutions of the interior continuously. Therefore, the car’s interior is able to cope with the changing needs during its lifetime caused by altering passengers or changing life stages of the users. A traffic observation study conducted previously by the authors showed a majority of compacts, station wagons, sedans and functional cars used for commuting as well as vacation traffic (Kilincsoy, Wagner, Bengler, Bubb, & Vink, 2014). The popularity of SUVs increases. Commuters tend to drive alone in their cars (cf. Fig. 21: green bar; the colors of the bars indicate the number of passengers). At least one passenger accompanies the driver during vacation. Depending on the car’s size, up to 5 passengers were observed in one car (cf. Fig. 21: blue bar). Consequently, the car’s interior should fulfill different needs by drivers and passengers alike in different situations which might lead to various use cases.

Chapter 4 Functional Customization - Value Creation by individual storage elements in the Car Interior
132
As space for storage is limited in cars and safety regulations influence the design of interiors, comparable to other types of transportation i.e. Aircraft or trains can indicate important use cases for storage (Alberda et al., 2015; Kamp, Kilincsoy, & Vink, 2011).
Fig. 21 Comparison of commuting traffic and vacation traffic on German and Dutch roads differentiating the type of car and number of passengers. Methods like crowd sourcing allow researchers to generate a pool of customization ideas almost instantly especially when conducted by a web-based contest (Bartl, Ernst, & Füller, 2004; Ernst, 2003; Fueller & Hienerth, 2004; Fuller, Hodkinson, Hodkinson, & Unwin, 2005; Füller, Matzler, & Hoppe, 2008; Harhoff & Wiegandt, 2009; McAlexander, Schouten, & Koenig, 2002; Sawhney, Verona, & Prandelli, 2005; Terwiesch & Ulrich, 2009). As products become more and more similar regarding technical characteristics and

Chapter 4 Functional Customization - Value Creation by individual storage elements in the Car Interior
133
quality, the emotional value of products seems to be a promising approach in order to differentiate against competing products (Vink, Overbeeke, & Desmet, 2005). In this study a user-centered approach was preferred based upon Desmet’s and Hekkert’s types of product experience during the user-product interaction with a focus on the user’s aesthetic and emotional experience of functional customization (P. Desmet, K. Overbeeke, & S. Tax, 2001). A thorough understanding of the user is essential to identify the emotional fit of products which influences the purchase decision as well as the pleasure of owning and using a product (P. Desmet et al., 2001; Holbrook, 1986). However, the emotions caused by a product’s meaning and its intangible attributes (e.g. the joy of using a product) attract users with an added emotional value (Desmet, Overbeeke, & Tax, 2001; Desmet, 2003). Distinct emotions like satisfaction can have an influence upon a product’s usability (van Kuijk, Christiaans, Kanis, & Eijk, 2006). But there is no distinct indication by Desmet if there is a relationship between emotion and purchase behavior (P. Desmet et al., 2001). However, studies indicated emotions have an impact on the purchase intention (Erevelles, 1998) and serve as the primary motivation for consumption (Hirschman & Holbrook, 1982). In order to identify whether customization of a product provide added emotional value, this research project was initiated. Starting with a general approach, an investigation was conducted about where objects were commonly stored within a car in different situations. As a result, this general knowledge should enable designers to focus on user-oriented storage solutions. Afterwards, two concrete designs were tested: an existing product design and a concept design. The analysis focused on the acceptance and appreciation of users. The research question asks if functional customization can provide additional value for users and was subdivided into two questions: What are customer’s use cases about storing personal objects in cars? What contributing and motivational factors influence users to buy flexible storage concept solutions and achieve functional customization?
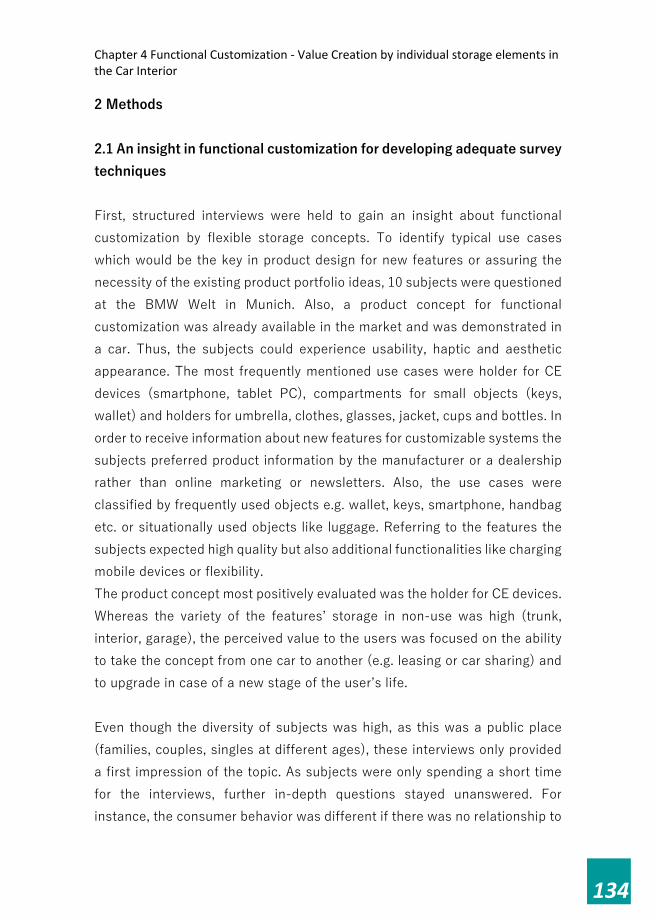
Chapter 4 Functional Customization - Value Creation by individual storage elements in the Car Interior
134
2 Methods 2.1 An insight in functional customization for developing adequate survey techniques First, structured interviews were held to gain an insight about functional customization by flexible storage concepts. To identify typical use cases which would be the key in product design for new features or assuring the necessity of the existing product portfolio ideas, 10 subjects were questioned at the BMW Welt in Munich. Also, a product concept for functional customization was already available in the market and was demonstrated in a car. Thus, the subjects could experience usability, haptic and aesthetic appearance. The most frequently mentioned use cases were holder for CE devices (smartphone, tablet PC), compartments for small objects (keys, wallet) and holders for umbrella, clothes, glasses, jacket, cups and bottles. In order to receive information about new features for customizable systems the subjects preferred product information by the manufacturer or a dealership rather than online marketing or newsletters. Also, the use cases were classified by frequently used objects e.g. wallet, keys, smartphone, handbag etc. or situationally used objects like luggage. Referring to the features the subjects expected high quality but also additional functionalities like charging mobile devices or flexibility. The product concept most positively evaluated was the holder for CE devices. Whereas the variety of the features’ storage in non-use was high (trunk, interior, garage), the perceived value to the users was focused on the ability to take the concept from one car to another (e.g. leasing or car sharing) and to upgrade in case of a new stage of the user’s life. Even though the diversity of subjects was high, as this was a public place (families, couples, singles at different ages), these interviews only provided a first impression of the topic. As subjects were only spending a short time for the interviews, further in-depth questions stayed unanswered. For instance, the consumer behavior was different if there was no relationship to

Chapter 4 Functional Customization - Value Creation by individual storage elements in the Car Interior
135
the initial purchase of the car. This was indicated by Recaro at the Innovative Seating Conference 2012 as one of the buying criteria for the upgrade possibilities at the Check-in before flights (Friehmelt, 2012). If consumers had a different price sensitivity for functional customization concepts further investigation is needed concerning the emotional responses. 2.2 Experimental set-up for functional customization A concept design was developed allowing the full range of flexibility with the most unobtrusive design. The standardized interface was hidden behind trim elements of dashboard, door trims, middle console, seating back-panel and trunk. A pre-selection feature portfolio was created by experts of R&D, Marketing, and Aftersales of BMW e.g. glasses compartment, hooks, and holders for smartphones, cups, keys, bags, or tickets. The features were made by applying Selective Laser Sintering reinforced with glass fiber (see Fig. 22). The major selection criteria were derived from existing product designs of flexible storage solutions from Aftersales, the series concept of the MINI Countryman and the results from the use case study in the BMW Welt. The resulting concept design was built into a test car and used for this study in a lab environment in order to guarantee controllable conditions. With a special emphasis on the consumer trend “simplify”, the customer’s expectation of a simple and intuitive access to a technological system (Lemmer, 2005; Winterhoff et al., 2009) must be considered when designing flexible storage solutions. The subjects were observed by the researcher handling and using the prototypes and their interfaces regarding the empirical usability of the concept design. Their behavior was logged (cf. Fig. 22) and clustered in a 5-pointed Likert-Scale from unusable to intuitively usable; the validity of this approach was tested by a cross-tab analysis to the item “ease of use”. To gather an additional heuristic evaluation of the concept design expert interviews were conducted as well.
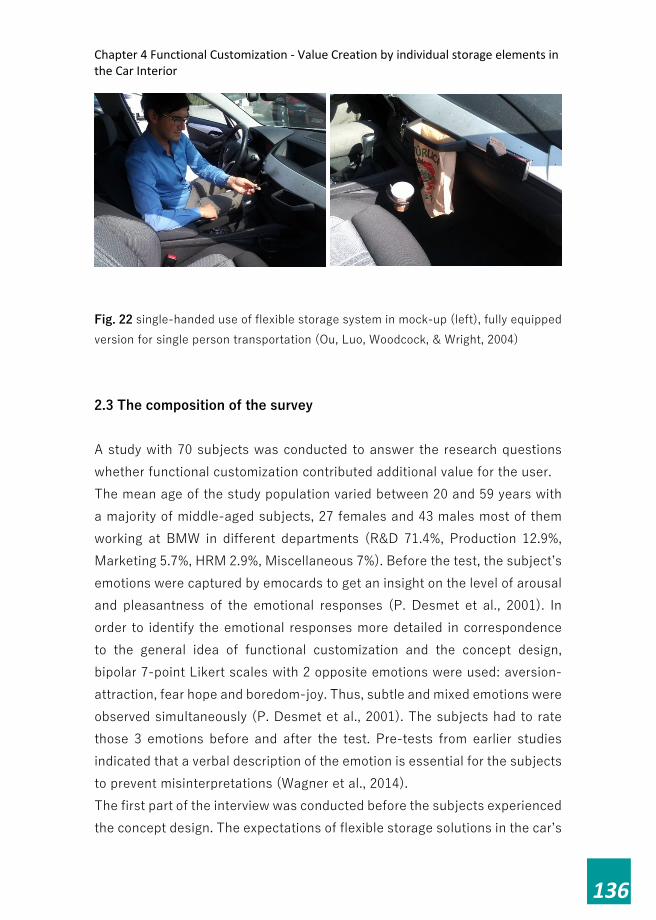
Chapter 4 Functional Customization - Value Creation by individual storage elements in the Car Interior
136
Fig. 22 single-handed use of flexible storage system in mock-up (left), fully equipped version for single person transportation (Ou, Luo, Woodcock, & Wright, 2004) 2.3 The composition of the survey A study with 70 subjects was conducted to answer the research questions whether functional customization contributed additional value for the user. The mean age of the study population varied between 20 and 59 years with a majority of middle-aged subjects, 27 females and 43 males most of them working at BMW in different departments (R&D 71.4%, Production 12.9%, Marketing 5.7%, HRM 2.9%, Miscellaneous 7%). Before the test, the subject’s emotions were captured by emocards to get an insight on the level of arousal and pleasantness of the emotional responses (P. Desmet et al., 2001). In order to identify the emotional responses more detailed in correspondence to the general idea of functional customization and the concept design, bipolar 7-point Likert scales with 2 opposite emotions were used: aversion-attraction, fear hope and boredom-joy. Thus, subtle and mixed emotions were observed simultaneously (P. Desmet et al., 2001). The subjects had to rate those 3 emotions before and after the test. Pre-tests from earlier studies indicated that a verbal description of the emotion is essential for the subjects to prevent misinterpretations (Wagner et al., 2014). The first part of the interview was conducted before the subjects experienced the concept design. The expectations of flexible storage solutions in the car’s

Chapter 4 Functional Customization - Value Creation by individual storage elements in the Car Interior
137
interior were noted and the frequency of switching compartments if possible (never 14.3%; once 10%; more than once 22.9%). Secondly, as this study intended to identify where belongings were stored in for different situations and the subjects were interviewed while sitting in the driver’s seat. Thus, the researchers aimed for continuation and similarities in the setting combined with the anticipation of being the actual driver in the car. Consequently, a deeper insight into the authentic user-product interaction should be reached. Photographs of typical examples of personal belongings and the top view of an entire interior (including trunk) were tools supporting the imagination of the test persons. In the third part of study a concept design was introduced to the subjects. The user product interaction was observed, followed by a questionnaire about emotional arousal, frequency of switching the compartment prototypes, preferences for the features, and additional functionalities. Also, the storage for non-usage was asked. In addition to the favored methods of receiving product information about new features, the distribution channel, price sensitivity, concept design, and features. The findings of the pretest could be substantiated and complemented by items such as ease of use ratings by a 5-point Likert scale from not important to important. In order to close this part of the survey the subjects evaluated the fit to the BMW brands. General and socio-demographic data was gathered by the last part of the study including scales of innovativeness, automobile involvement and automotive customization and 21 buying criteria for cars rated from low to high importance with a 5-point Likert scale. For instance, exterior design, overall quality, reliability, quality of the interior, price-performance ratio and safety were evaluated as most important, whereas variability of the interior, brand image, reputation of the manufacturer showed to have no influence upon the buying decision (cf. Fig. 23).

Chapter 4 Functional Customization - Value Creation by individual storage elements in the Car Interior
138
Fig. 23 Importance of buying criteria for car purchases The sample showed a high level of consumer innovativeness and automobile involvement while maintaining a below average level of need for customization (>50% high scores in innovativeness, >70% high scores in automobile involvement, >20% mediocre to moderate high scores in automotive customization). According to the mobility behavior the sample reflected a consistent image of the traffic analysis: hatchbacks (34.7%), sedans (21.8%) and station wagons (15.8%) of medium-class (46%), lower medium-class (22%) to small class cars (17%). Pre- and post-evaluation of the emotional feedback were tested with t-tests for paired comparisons (p < 0.05). The positive scores were compared to the
1,41,42,91,4 ,0 1,4 ,0 4,3 ,0 1,4 ,0 1,41,41,42,94,31,4 ,0 ,0 1,42,9
31,4
40,0
41,432,9
45,740,0
31,4
31,442,9
48,6
12,9
44,3
41,450,0
40,022,9
35,7
47,1
35,7
40,0
31,4
57,1
38,6
15,725,731,427,1
62,9
12,914,315,7
87,1
18,6
35,724,318,6
25,741,444,3
15,7
34,3
54,3
,0
10,0
20,0
30,0
40,0
50,0
60,0
70,0
80,0
90,0
100,0
Exte
rior D
esig
nFu
el C
onsu
mpt
ion
Stor
age
Capa
city
Conv
enie
nce
Ease
of u
seSp
ortin
ess
Ove
rall
Qua
lity
Varia
bilit
yIn
terio
r Sto
rage
Room
ines
sRe
liabi
lity
Engi
ne P
erfo
rman
ceDr
ivin
g Dy
nam
ics
Envi
ronm
enta
l Frie
ndlin
ess
Repu
tatio
n of
the
man
ufac
ture
rBr
and
Imag
ePr
ice-
Perf
orm
ance
Rat
ioM
ater
ials
& Q
ualit
y of
Inte
rior
Cust
omiza
tion
Inte
rior D
esig
nSa
fety
very important
neutral
not important

Chapter 4 Functional Customization - Value Creation by individual storage elements in the Car Interior
139
negative scores using Wilcoxon (p < 0.05). A cross-tab analysis was conducted in order to identify relationships. 3 Results The pretest indicated a preference for holders of CE devices (smartphone, tablet PC), compartment for small objects (keys, wallet) and holders for various objects. To investigate such use cases further in order to identify an interesting product portfolio of features for flexible storage solutions 70 subjects mentioned 226 different objects classified in 130 clusters. Those objects were stored in 19 storage areas of the interior (seating back panel, front seats, rear seats, under the seats, floor front driver, floor front passenger, floor rear driver, floor rear passenger, hook, door compartments, roof lining, windshield, glove box, dashboard, center console, center console middle, center console sideways, cup holders, and trunk). Simultaneously, situations (commuting, leisure, vacation and special occasion) were considered which also lead to different kind of belongings that driver and passengers need to store in a car. Various sports equipment, smartphones, beverages, umbrellas, jackets and sun glasses are taken along by driver and passengers. Depending on the situation the preference of the belongings or the object itself changes. As typical belongings for commuters, the subjects mentioned smartphones, keys, sunglasses, umbrellas (dry), wallets, and handbags in decreasing importance. Sometimes those objects can be supplemented by laptops, bags, or documents for work. In leisure driving situations sports equipment, beverages, smartphones, handbags, and sun glasses are specified to be general belongings. Whereas luggage, bottles, supplies, sports equipment, and smartphones need to be stored during vacation rides. Concerning special occasions, meaning visiting an opera, restaurant, or a trip, the subjects intend to bring jackets, shoes, suits, or luggage. Table 16 shows how intense the objects vary depending on the situation because of their relevance to the user.

Chapter 4 Functional Customization - Value Creation by individual storage elements in the Car Interior
140
Table 16 An extract of the most frequent objects in different driving situations: commuting, leisure, vacation, special occasion to give an overview on different use case scenarios; frequencies > 5% are highlighted.

Chapter 4 Functional Customization - Value Creation by individual storage elements in the Car Interior
141
Furthermore, all these objects need to be stored within a car. 19 storage places could be deduced from the study. However, the usage differed massively. For instance, the seating back panel was named less as storage space for personal belongings. Also, the windshield, dashboard, center console sideways, beneath the seats, floor in front of driver, and floor in front rear passenger were indicated as being seldom areas used for storage. Surprisingly, the glove box was not used often for the personal belongings (only CDs, navigation in non-use, notepad, pen, tissues), as well as the center console middle although both are closable compartments. Aside from beverages, the cup holders were used for other objects e.g. smartphones, keys, tickets, candy, sun glasses, supplies, wallet, gum, navigation, MP3 player, and ID. The seat representing the most dominant part of the interior allows the user to interact with the car’s interior on a visual and haptic perception level (Schlick, Bruder, & Luczak, 2010). The subjects indicated that they would use the seating back panel primarily for storing maps and clothes. In case of family transportation often the back panel is used for entertainment by installing a holder for tablet PCs or equivalent features. For the typical commuting scenario, i.e. only one person driving, the front passenger seat is misused for storing bottles, supplies, handbags, work bags, laptops, and smartphones. The front floor of the passenger is used comparably for the driver’s belongings like bottles, handbags, supplies, shoes, umbrellas, or work bags. More bulky objects (e.g. sports equipment) are mainly stored on the back seats along with jackets or coats, laptops, suits, or bottles. But also, the floor behind the driver’s seat is used for storing work bags, shoes etc. Table 17 summarizes the findings for the seat and its surrounding areas.

Chapter 4 Functional Customization - Value Creation by individual storage elements in the Car Interior
142
Table 17 Frequency distribution of personal objects stored on or close to seats.

Chapter 4 Functional Customization - Value Creation by individual storage elements in the Car Interior
143
Other areas of the interior like the door compartments serve as storage space for tissues, sun glasses, wallets, bottles, keys, umbrellas, and even smart phones (cf. Table 18). The center console offered many possibilities and also specialized compartments at the front or beneath the armrest. As Table 19 shows smartphones, keys, wallets, glasses, tissues, sun glasses, gum, or supplies were stored in the center console. While dashboards were used to keep sun glasses, smartphones or wallets if possible (depending on the gradient of the surfaces), the trunk usually holds luggage, groceries, or sports equipment. Table 18 Storage use cases of the door compartment.
tissues sun glasses wallet bottle keys umbrella (dry) smartphone
door compartment 10.1% 9.2% 8.3% 8.3% 7.3% 5.5% 5.5%
Table 19 Personal belongings stored in various spaces close to the middle console.
centerconsole smartphone keys wallet sun glasses tissues glasses gum/ mints supplies bottle
centerconsole front 23.1% 13.1% 12.3% 9.2% 6.9% 4.6% 2.3% .0% .8%
centerconsole middle 14.8% 9.3% 13.0% 5.6% 5.6% 9.3% 7.4% 5.6% .0%
centerconsole sideways .0% .0% 11.1% .0% .0% .0% .0% .0% 44.4%
The concept design considered the use cases of the pre-test and the selection by experts, but also allowed new ideas. However, the main focus of features for flexible storage solutions was for smartphone holders, cup holders, compartments for glasses, and utility boxes in descending order of frequency. Interesting ideas like a flower holder, flash drive compartment, or snow googles compartment were only mentioned once and were therefore not statistically valid. The subjects preferred additional functionalities of the features as the ability to charge CE devices, flexibility (multiuse, size adjustability), and connection to CE devices or lighting for effect. Regarding the storage of the items while not in use, the sample mostly preferred storage possibilities inside the car such as the trunk, glove box, or the interior. A box for storing the items in a garage was considered an option.

Chapter 4 Functional Customization - Value Creation by individual storage elements in the Car Interior
144
The cross-tab analysis of the features discloses a rather strong relationship between subjects preferring the additional functionality of multiplex usage and subjects preferring a laptop holder (p = 0.000, Cramer’s V= 0.569). Furthermore, relationships could be identified between no preference for toy boxes (p = 0.000, Cramer’s V= 0.737) or cool boxes (p = 0.000, Cramer’s V= 0.489), while driving without any passengers. The subjects, disapproving a hanger as a feature, tend to switch the features of flexible storage systems more often (p = 0.000, Cramer’s V= 0.569). The preference for smartphone holders was influenced by an intuitive usability of the system (p = 0.003, Cramer’s V= 0.478). Regarding the purchase of new features, the sample possesses a strong inclination to use established distribution channels (car manufacturer 22.7%, licensed dealership 13.5%, third party provider 12.4%). Online sales channels (19.5%) were preferred to offline ones (16.30%). Other subjects preferred recent product information channels such as Facebook, events, or showrooms. The percentages of the preferences of independent versus provided product information were distributed almost equally. According to the brand attribution the concept design was evaluated with a fit to MINI, BMW and BMW I (cf. Fig. 24), this design was an example for functional customization.

Chapter 4 Functional Customization - Value Creation by individual storage elements in the Car Interior
145
Fig. 24 Brand attribution for functional customization As indicated in the pre-test, the price sensitivity for flexible storage solutions could differ according to the purchase date. Consequently, this could be applied to the willingness for customization. The cross-tab analysis proved a rather strong relationship between the price sensitivity for the interfaces i.e. the enabler to use flexible storage and the price sensitivity for the features (p = 0.000, Cramer’s V= 0.563). The more the subjects intend to spend for the interfaces, the more they intend to spend for the features. According to the entire price range of the interfaces starting from 1 euro to 2000 euros for an overall solution, only few subjects prefer to spend less than 50 euros or close to 2000 euros. Simultaneously, the majority of the sample intended to pay less than 60 euros for a feature. Therefore, the resulting core price sensitivity of the features reached from 31 to 60 euros. For the corresponding interfaces subjects were willing to spend between 100 to 300 euros. Also, relationships were found between the price sensitivity for the interfaces and features combined with the design of the offer. These relationships could be differentiated by a closed system’s view (i.e. a purchase of the entire system of interfaces and all relevant features at the initial purchase) and an open system’s view (i.e. the purchase of the interfaces and 3 features with the option to complement the system any time). The subjects who were willing
0,00%5,00%
10,00%15,00%20,00%25,00%30,00%35,00%

Chapter 4 Functional Customization - Value Creation by individual storage elements in the Car Interior
146
to spend 100 to 200 euros for the interfaces opted for an open system’s approach (p = 0.000, Cramer’s V= 0.891). While subjects expecting to pay 11 to 30 euros or 40 to 50 euros, preferred to buy the entire system at once (p = 0.000, Cramer’s V= 0.81). The emotional responses recorded with emocards (P. Desmet et al., 2001) and Likert scales showed significant correlations for the scales ‘aversion-attraction’,’ fear-hope’ and ‘boredom-joy’ both before and after the test with the concept design. The correlations of the emocards with the Likert scale ratings are negative. The emocards were recorded before and after the test compared to the emocards which are represented by the item ‘mood’ and differentiated in before and after the test, with the latter subdivided into an emotional response to the idea of functional customization per se and to the concept idea. As the emocard ratings are inverse to the ratings of the Likert scales measuring the level of attraction, hope and joy, this is the reason for the negative correlations. The highest scores could be recorded for the emotional arousal caused by the concept design which was higher than the one caused rather by the idea of functional customization itself. The items ‘attraction’ and ‘hope’ show significant correlations to almost all emotional responses except for the ‘mood’ asked before the test by emocard. This might be a result of the forward orientation of the item. The level of joy before the test also correlates intensively with other emotions, after the test joy is not only correlating with the emocard, but also strongly with the level of attraction (0.818) and hope (0.874). Table 20 recapitulates all correlations; significant ones are highlighted.

Chapter 4 Functional Customization - Value Creation by individual storage elements in the Car Interior
147
Table 20 Pearson correlations of emotional responses, significant correlations are highlighted.
Emocard Mood before
Emocard Mood by functional customization
Emocard Mood by concept
Attraction before
Hope before
Joy before
Attraction by concept
Hope by concept
Joy by concept
Emocard Mood before
Pearson correlation
1 .083 .247* .049 .023 -.017 -.089 -.097 -.093
Sig.(2-tailed)
.495 .040 .685 .848 .889 .463 .426 .446
N 70 70 70 70 70 70 70 70 70
Emocard Mood by functional customization
Pearson correlation
.083 1 .567** -.432** -.336*
* -.306* -.390** -.487** -.485**
Sig.(2-tailed)
.495
.000 .000 .004 .010 .001 .000 .000
N 70 70 70 70 70 70 70 70 70
Emocard Mood by concept
Pearson correlation
.247* .567** 1 -.372** -.339*
* -.441*
* -.619** -.642** -.670**
Sig.(2-tailed)
.040 .000
.002 .004 .000 .000 .000 .000
N 70 70 70 70 70 70 70 70 70
Attraction before
Pearson correlation
.049 -.432** -.372** 1 .748** .712** .424** .445** .354**
Sig.(2-tailed)
.685 .000 .002
.000 .000 .000 .000 .003
N 70 70 70 70 70 70 70 70 70
Hope before Pearson correlation
.023 -.336** -.339** .748** 1 .799** .326** .490** .380**
Sig.(2-tailed)
.848 .004 .004 .000
.000 .006 .000 .001
N 70 70 70 70 70 70 70 70 70
Joy before Pearson correlation
-.017 -.306* -.441** .712** .799** 1 .357** .513** .388**
Sig.(2-tailed)
.889 .010 .000 .000 .000
.002 .000 .001
N 70 70 70 70 70 70 70 70 70
Attraction by concept
Pearson correlation
-.089 -.390** -.619** .424** .326** .357** 1 .857** .818**
Sig.(2-tailed)
.463 .001 .000 .000 .006 .002
.000 .000

Chapter 4 Functional Customization - Value Creation by individual storage elements in the Car Interior
148
N 70 70 70 70 70 70 70 70 70
Hope by concept
Pearson correlation
-.097 -.487** -.642** .445** .490** .513** .857** 1 .874**
Sig.(2-tailed)
.426 .000 .000 .000 .000 .000 .000
.000
N 70 70 70 70 70 70 70 70 70
Joy by concept
Pearson correlation
-.093 -.485** -.670** .354** .380** .388** .818** .874** 1
Sig.(2-tailed)
.446 .000 .000 .003 .001 .001 .000 .000
N 70 70 70 70 70 70 70 70 70
*. Correlation is significant at the 0.05 level (2-tailed) **. Correlation is significant at the 0.01 level (2-tailed)
Table 21 shows the results of the emocards before and after experiencing the concept design compared to the emotional responses aroused by the general idea of functional customization. The majority of the subjects indicated average pleasantness. All emotional responses recorded by emocards showed little variance (‘mood’ before: mean = 3.30, std. deviation = 1.301; ‘mood’ by functional customization idea: mean = 3.07, std. deviation = 1.278; ‘mood’ by concept idea: mean = 3.07, std. deviation = 1.333). Additionally, an increase of percentages of the “excited pleasant” state and of the “calm pleasant” state can be detected along with a decrease in negative responses (e.g. “average unpleasant). A comparison of the general idea to the concept design emphasizes this observation. Those responses correlate significantly by 0.567 (p = 0.000). Table 21 The frequency distribution of the EMOCARD recordings before (a) and after (b) experiencing the concept design; highest scores are highlighted.
excited neutral
excited pleasant
average pleasant
calm pleasant
calm neutral
calm unpleasant
average unpleasant
excited unpleasant
Before Functional Customization
5.7 11.4 57.1 10 10 0 5.7 0
After 7.1 18.6 54.3** 10 5.7 0 2.9 1.4
Before Concept Design
5.7 11.4 57.1 10 10 0 5.7 0
After 5.7 28.6 40** 14.3 7.1 0 2.9 1.4
** significant

Chapter 4 Functional Customization - Value Creation by individual storage elements in the Car Interior
149
The Wilcoxon test of the two samples of emotional states before and after regarding attraction, hope and joy indicated weak asymptotic significances within the items hope (p = 0.093 > 0.05) and joy (p = 0.076 > 0.05); attraction showed no significance (p = 0.611). Therefore, a Monte Carlo Simulation with a 95% confidence interval resulted in significant findings with the items hope (minimum level: p = 0.045; maximum level: p = 0.053 < = 0.05) and joy (minimum level: p = 0.033; maximum level: p = 0.040 < 0.05). The positive emotional aspects of the bipolar scale i.e. attraction, hope and joy, prove to have the highest scores. Whereas the level of attraction and joy in the before-after analysis remained unchanged, the level of hope indicates an increase. The item attraction could be biased by the subjects’ expectations being higher than the actual experience itself. As the Wilcoxon test proved a rather strong significance of the emotions fear and boredom to the corresponding counterparts hope and joy, this change in opinion seems to be an important observation (cf. Table 22). Consequently, the subject’s price sensitivity, preferences and the perceived importance of usability of flexible storage solutions and the resulting implications upon the subjects’ emotions should be investigated further. Table 22 The frequency distribution of the different emotions elicited before (a) and after (b) experiencing the concept design.
negative emotional response
-3 -2 -1 0 1 2 3 positive emotional response
Before aversion 2.90 0.00 2.90 7.10 17.10 38.80 31.40 attraction
After aversion 1.40 4.30 2.90 0.00 20.00 32.90 38.60 attraction
Before fear 2.90 1.40 1.40 14.30 34.40 24.30 21.40 hope**
After fear 1.40 2.90 2.90 5.70 28.60 32.90 25.70 hope**
Before boredom 2.90 0.00 2.90 14.30 30.00 35.70 14.30 joy**
After boredom 1.40 2.90 4.30 8.60 17.10 35.70 30.00 joy **
** significant
Significant relationships between the emotional responses and preferences of the subjects could be discovered. Subjects with an inclination to the

Chapter 4 Functional Customization - Value Creation by individual storage elements in the Car Interior
150
positive aspects of the item ‘hope’, also viewed the importance of ‘ease of use’ very high (p = 0.001, Cramer’s V= 0.451). A cross-tab analysis showed a strong significant relationship between the importance of exterior design to the users and the item joy (p = 0.000, Cramer’s V= 0.528). Also, the importance of interior design representing a buying argument in a car purchase can be affected by the flexible storage solutions. Subjects with an inclination to see interior design as a valuable buying criterion, enjoyed the concept design much more (p = 0.000, Cramer’s V= 0.613). If there was a tendency to estimate a middle to high importance for variability of the interior, the subjects were also affected positively by the concept design (p = 0.000, Cramer’s V= 0.468). With this study, further insight in the requirements of flexible storage solutions should be gathered. The pre-test indicated only slight tendencies by users to switch the features more than once. 1.4% of the 70 subjects tended to switch the compartments all the time, only 16.9% would change their interiors more than once. The majority intends to maintain the feature configuration (23.9% once, 50.8% less, 5.6% never). The extremes of the 7-point Likert scale (always to never) represented only a minority of the sample’s opinion, it was noted but excluded from the observation of the chi-square test. Subjects who enjoyed the concept design or feeling of positive emotional arousal of hope tended to switch the features more frequently than others (joy: p = 0.000, Cramer’s V= 0.431; hope: p = 0.001, Cramer’s V= 0.405). According to the features of the concept design no significant relationships could be identified. Surprisingly the subjects experiencing enjoyment and hope were neither favoring a cool box (hope: p = 0.000, Cramer’s V= 0.702; joy: p = 0.000, Cramer’s V= 0.702) nor rubberized features (hope: p = 0.000, Cramer’s V= 0.702; joy: p = 0.000, Cramer’s V= 0.702). The brand illustrated by Fig. 24, interfered with the subject’s emotional feedback. A strong inclination to the brand BMW and MINI by subjects with high scores in attraction, hope and enjoyment for the concept design was found. Whereas the relationship between positive emotional arousal and the brand attribute of BMW proved to be slightly more intense (MINI: p = 0.001, Cramer’s V= 0.539; BMW: p = 0.000, Cramer’s V= 0.750).

Chapter 4 Functional Customization - Value Creation by individual storage elements in the Car Interior
151
The emotional feedback and the price sensitivity of the subjects regarding the interfaces and the feedback, were compared using chi-square tests. The target group was identified as influenced by the positive emotional arousal of either the interfaces (p = 0.000, Cramer’s V= 0.588), and the features (p = 0.000, Cramer’s V= 0.521). The researchers observed, the more positive the emotional response, the more money the subjects are willing to spend for functional customization. 4 Discussion and Conclusion The generic question whether functional customization concepts can provide additional value for users in cars’ interiors was answered in two steps. First the use cases of personal objects were identified as well as their location of storage within the interior. Smartphones were not only stored within the primary reach of users like other valuables e.g. wallets or other CE devices, but also within the primary field of vision. This personal object was stored exclusively upon the passenger front seat, the middle console and cup holders, but never on the floor or rear seats. The study showed only a limited use of closed compartments such as the glove box or the closable compartment of the middle console. A reason could be that any objects stored in a closed compartment can be forgotten in the car. Also, the floor behind the passenger seat was used seldom used compared with the floor behind the driver’s seat. This is caused by the use cases of single persons; the driver stored the most essential objects either on the front passenger seat or behind the driver’s seat. Regarding clothes e.g. suits or jackets, the floors were not seen as an adequate storage space. The front floor of the driver was excluded by the subjects indicating a safety issue. Objects stored in this particular space could hinder the driver performance. Using the seating back panel, windshield, dashboard or ceiling as storage spaces for personal objects, requires additional equipment like hooks to be installed.

Chapter 4 Functional Customization - Value Creation by individual storage elements in the Car Interior
152
However, there is a trade-off between the user’s freedom of storage and safety as indicated by the expert interviews. Functional customization within a car’s interior is evaluated critically by experts as the user must not be harmed by the features. In crash situations, the expansion of airbags automatically limits the possibilities for flexible storage solutions. According to the concept design, the experts identified a further challenge for the design i.e. an obtrusive interface which results in an almost blind mounting which contradicts the ease of use. Additionally, the user centered approach of the study allowed further insights to the possibility of customizable interiors by rearranging storage solutions appropriate for the belongings and driving situations. This also answered the second question about the contributing factors for the user’s buying motivation. The study showed that if a product design evokes positive emotional arousal this additional perceived value lead to a user’s willingness to purchase such a product. As proven by the emocards the concept design simultaneously met the subjects’ expectations for functional customization. Other results of the study such as the importance of usability, i.e. an intuitive access for mounting the features, and low frequency of switching the features, may influence design guidelines for functional customizable systems. Because of the relationships between emotional arousal and design, the implementation of flexible storage solutions will be determined by its design, variability, and usability. Although, the mock-up reached a high level of integration, the BMW brand attribution biased the attribution to other brands and therefore limited the openness of the brainstorming part of the survey. Because of the homogeneity of the sample (mostly engineers, male, aged 20 to 59), further studies with actual buyers would be necessary. Also, a lead user study with subjects having an extraordinary need for customization would be interesting. This can be a focus group of customers regarding the car as an expression of themselves and as an extension of office and living room like the so-called Sensation Seekers (Winterhoff et al., 2009). Other direct measurement techniques for emotional feedback should be considered as well for future

Chapter 4 Functional Customization - Value Creation by individual storage elements in the Car Interior
153
research like Facereader (Benta et al., 2009; Melder et al., 2007; Van Kuilenburg, Wiering, & Den Uyl, 2005), or by monitoring changes in the autonomic nervous system measurable by EEG (Bos, 2006; Vink et al., 2005), brain waves and heart rate by ECG measures (Appelhans & Luecken, 2006). These techniques may expand the findings as the change of the autonomic nervous system is not necessarily filtered through the subject’s perception, cognitive processes, and interpretation of emotional illustrations and scales (P. Desmet et al., 2001). A combination with methods detecting subtle and mixed emotion can therefore provide a thorough understanding of users. Derived from the findings of the study, the researchers suggest a functional customization for car interiors. There are users favoring an open system i.e. the interface including three features with a price expectation of 100 to 200 euros and users favoring to purchase of the entire system all at once. The availability of a combination of both approaches would be useful. The most common features like smartphone holders, cup holders, compartments for glasses and utility boxes should be offered in a standard product portfolio. Rapid Technologies offer the possibility for highly individualized products which could be useful for customized features or unique needs. According to the results, the researchers advise the use of established sales channels e.g. car manufacturer or licensed dealership and inform customers of new features by newsletters, but also introducing those in showrooms, homepages or dealerships. Such an integrated approach of functional customization could especially enhance the emotional value added of mobility solutions like car sharing, rental cars or retail markets.
Chapter 4 Functional Customization - Value Creation by individual storage elements in the Car Interior
154
REFERENCES Alberda, W., Kampinga, O., Kassels, R., van Kester, R., Noriega, J., & Vink, P. (2015). Access improvement to aircraft passengers' hand luggage. Work, 50(4), 659-667. Appelhans, B. M., & Luecken, L. J. (2006). Heart rate variability as an index of regulated emotional responding. Review of general psychology, 10(3), 229. Bartl, M., Ernst, H., & Füller, J. (2004). Community Based Innovation—eine Methode zur Einbindung von Online Communities in den Innovationsprozess. In Produktentwicklung mit virtuellen Communities (pp. 141-167): Springer. Benta, K., Van Kuilenburg, H., Eligio, U., Den Uyl, M., Cremene, M., Hoszu, A., & Cret, O. (2009). Evaluation of a system for real time valence assessment of spontaneous facial expressions. Distributed Environments Adaptability, Semantics and Security Issues. Paper presented at the International Romanian--French Workshop. Boër, C. R., & Dulio, S. (2007). Mass Customization and Footwear. Mass Customization and Footwear: Myth, Salvation or Reality? A Comprehensive Analysis of the Adoption of the Mass Customization Paradigm in Footwear, from the Perspective of the EUROShoE (Extended User Oriented Shoe Enterprise) Research Project, 5-65. Bos, D. O. (2006). EEG-based emotion recognition. The Influence of Visual and Auditory Stimuli, 56(3), 1-17. Desmet, Overbeeke, & Tax. (2001). Designing products with added emotional value: Development and appllcation of an approach for research through design. The design journal, 4(1), 32-47. Desmet, P. (2003). Measuring emotion: Development and application of an instrument to measure emotional responses to products. In Funology (pp. 111-123): Springer. Desmet, P., Overbeeke, K., & Tax, S. (2001). Designing products with added emotional value: Development and appllcation of an approach for research through design. The design journal, 4(1), 32-47. Erevelles, S. (1998). The role of affect in marketing. Journal of Business Research, 42(3), 199-215.

Chapter 4 Functional Customization - Value Creation by individual storage elements in the Car Interior
155
Ernst, H. G., R. . (2003). Virtual Customer Integration– Bringing the Customer back into the Organisation. Evaston, Working Paper. Friehmelt, H. (2012). Major trends, developments and challenges in aircraft seating. Paper presented at the 7th International Conference Innovative Seating, Darmstadt, Germany. Fueller, J., & Hienerth, C. (2004). Online Consumer Groups as Co-Innovators–Virtual Integration of Community Members into New Product Development. Paper presented at the European Business Forum. Fuller, A., Hodkinson, H., Hodkinson, P., & Unwin, L. (2005). Learning as peripheral participation in communities of practice: a reassessment of key concepts in workplace learning. British Educational Research Journal, 31(1), 49-68. Füller, J., Matzler, K., & Hoppe, M. (2008). Brand Community Members as a Source of Innovation. Journal of Product Innovation Management, 25(6), 608-619. doi:10.1111/j.1540-5885.2008.00325.x Harhoff, P. D., & Wiegandt, P. (2009). Value Creation of Firm-Established Brand Communities: Gabler Verlag. Hirschman, E. C., & Holbrook, M. B. (1982). Hedonic consumption: emerging concepts, methods and propositions. The Journal of Marketing, 92-101. Holbrook, M. B. (1986). Emotion in the consumption experience: Toward a new model of the human consumer. The role of affect in consumer behavior: Emerging theories and applications, 6(23), 17-52. IKEA. Uppleva series. Retrieved from http://www.golem.de/news/moebelhaus-fernseher-soundsysteme-und-blu-ray-player-von-ikea-1204-91221.html. Kamp, I., Kilincsoy, Ü., & Vink, P. (2011). Chosen postures during specific sitting activities. Ergonomics, 54(11), 1029-1042. Kilincsoy, Ü., Wagner, A., Bengler, C., Bubb, H., & Vink, P. (2014). Comfortable Rear Seat Postures Preferred by Car Passengers. Paper presented at the 5 th International Conference on Applied Human Factors and Ergonomics. Lemmer, K. (2005). Mensch-Maschine-Interaktion. Vieweg Handbuch Kraftfahrzeugtechnik, 656-661.

Chapter 4 Functional Customization - Value Creation by individual storage elements in the Car Interior
156
Madden, T. J., Hewett, K., & Roth, M. S. (2000). Managing images in different cultures: A cross-national study of color meanings and preferences. Journal of international marketing, 8(4), 90-107. McAlexander, J. H., Schouten, J. W., & Koenig, H. F. (2002). Building brand community. Journal of marketing, 66(1), 38-54. Melder, W. A., Truong, K. P., Uyl, M. D., Van Leeuwen, D. A., Neerincx, M. A., Loos, L. R., & Plum, B. (2007). Affective multimodal mirror: sensing and eliciting laughter. Paper presented at the Proceedings of the international workshop on Human-centered multimedia. Ou, L. C., Luo, M. R., Woodcock, A., & Wright, A. (2004). A study of colour emotion and colour preference. Part I: Colour emotions for single colours. Color Research & Application, 29(3), 232-240. Sawhney, M., Verona, G., & Prandelli, E. (2005). Collaborating to create: The Internet as a platform for customer engagement in product innovation. Journal of interactive marketing, 19(4), 4-17. Schlick, C. M., Bruder, R., & Luczak, H. (2010). Arbeitswissenschaft: Springer-Verlag. Terwiesch, C., & Ulrich, K. T. (2009). Innovation tournaments: Creating and selecting exceptional opportunities: Harvard Business Press. van Kuijk, J., Christiaans, H., Kanis, H., & Eijk, D. v. (2006). Usability in the development of consumer electronics: issues and actors. Paper presented at the Proceedings. Van Kuilenburg, H., Wiering, M., & Den Uyl, M. (2005). A model based method for automatic facial expression recognition. Paper presented at the Proceedings of the 16th European Conference on Machine Learning (ECML'05). Vink, P., Overbeeke, C., & Desmet, P. (2005). Comfort experience. Wagner, A.-S., Kilincsoy, Ü., Reitmeir, M., & Vink, P. (2014). Adaptive Customization –Value Creation by Adaptive Lighting in the Car Interior. In P. Vink (Ed.), Advances in Social and Organizational Factors (pp. 40-50): AHFE Conference.

Chapter 4 Functional Customization - Value Creation by individual storage elements in the Car Interior
157
Winterhoff, M., Kahner, C., Ulrich, D. C., Sayler, P., & Wenzel, E. (2009). Future of Mobility 2020 – the Automotive Industry in Upheaval? Retrieved from www.adl.com/mobility-2020:

Chapter 4 Functional Customization - Value Creation by individual storage elements in the Car Interior
158
The offering of systems in cars to adapt to users individually is very broad. Driving assistance systems allow adjustments to a person’s driving style. In addition to the general approach to use controls as an interface to the driver, automatic adjustments of the car are investigated. Furthermore, the automation contains the detection of how the driver intends to drive, either sportively or comfortably, and situational factors such as road and traffic characteristics. Opposing to traditional product customization, this approach is more comparable to human machine interaction (cf. chapter 1.4) as it allows adaption and subconscious communication between users and cars in diverse situations.

Chapter 5 Flow experience influenced by car adjustments
159
Chapter 5 Flow experience influenced by car
adjustments
Abstract Today’s cars offer a variety of possible setting options which have to be chosen by the driver. In order to examine the psychological effect of automatic adjustments in comparison to manual adjustments of the chassis and drive train while driving, a test vehicle was built up and tested in a naturalistic field operation test (nFOT) through various development stages. 216 BMW employees participated in the study focusing on emotional feedback and flow experience. The results were used to improve the function and to start the test scenario again. The automatic adjustment of the car’s setting (driving mode) due to the detection of the intended driving style of the subjects was preferred to the manual adjustments. Additionally, the feeling of safety increased while the level of distraction decreased. Our findings show that in addition to the positive technical aspects of an automatic adjustment, there is also an increase in driving experience, measured by the flow experience and the feeling of safety. Keywords: flow experience, driving experience, automation, development process
Russ, A., Wagner, A. S., Liesner, L., Küçükay, F., & Vink, P. (2016). Flow experience influenced by car adjustments. Transportation research part F: traffic psychology and behaviour, 36, 46-56.

Chapter 5 Flow experience influenced by car adjustments
160
1 Introduction During the entire product development process engineers ask themselves if the resulting product has an added value to the customer to prevent him from switching to an alternative product instead (Walsh et al., 2009). Among other theories products are developed in order to satisfy human needs which could have a hierarchical ranking with the pursuit of the next higher order need, after the lower need was satisfied beforehand (A. H. Maslow, 1943). If mobility can be associated with a basic need as a simple transport from one point to another, joy and driving pleasure could represent the higher order need of transportation. A study of 4300 German drivers proves that design, performance, and road handling to be the most important criteria influencing their decision to buy a car (Christian Krause, 2011). To allow an individual configuration of chassis, drivetrain and gear for creating different driving characteristics, today’s premium cars offer customers the possibility to change the driving mode between sportive, comfortable, and efficient settings by using control elements. The increasing number of controls within a car could overstrain the driver. Consumers expect a simple and intuitive access in a world of increasing technology and complexity. Also, the automotive industry has also to face an increase in complexity on a functional level as well as in regulations. At the same time, the fact that customer needs and value change in society contradicts this urge for simplicity. So, a technological innovation leading to driving pleasure with an optimal level of ease in access and use would be a compromise. The driving experience is theoretically described as the flow of information and human-machine communication (Schlick, 2010) or is described as a task-orientated systems approach (Schmidtke and Bernotat, 1993) including the environmental influence with a continuous nominal-actual value comparison. Especially tertiary tasks might influence the driver (Bubb, 2000). Another approach, which is used in this paper, is to focus on achieving flow as the ultimate driving experience i.e. driving pleasure. The psychological model of flow theory can be of support in this case. Flow described as the
Chapter 5 Flow experience influenced by car adjustments
161
ultimate moment a human is carried away by his task (Csikszentmihalyi, 1975; Kehr, 2004) Using the compensatory model for motivation and volition by Kehr (2004), a basis was established to analyze implicit motives, explicit motives, and subjective capabilities (McClelland and Rumelhart, 1989; Schultheiss and Brunstein, 2010) by combining different theories of motivational psychology. Implicit motives happen subconsciously to subjects only realizable by “affective preferences and implicit behavioral impulses” (Kehr, 2004; McClelland and Rumelhart, 1989) and are “conceptualized as associative networks connecting situational cues with basic affective reactions and implicit behavioral tendencies” (Kehr, 2004). If those implicit motives are overlaid by the explicit motives i.e. values (Atkinson, 1964; McClelland, 1985), or self-attributed determinant of goals (Kehr, 2004; McClelland and Rumelhart, 1989), along with the perceived abilities (Ajzen and Driver, 1991; Bandura, 1977; Vroom, 1964) of the very same person, flow can be a result. The concurrence of abilities and tasks while driving is a perpetual interplay. As a result, an experience of flow is possible with those tasks. This premise is endorsed by Csikszentmihalyi and LeFevre (1989) who proved in a study that driving a car is one of the most important sources of flow experience in leisure situations independent of the respective occupation. Csikszentmihalyi (1997) summed up that the driving task provides neutral results concerning joy and motivation, heightened concentration and abilities are requested, so that some people experience flow while driving much more often than any time else in their life. Falko Rheinberg (1996) studied driving and confirmed proofs to offer appeals in driving dynamics, which can be transferred to car driving. Csikszentmihalyi (1997) was astonished, that driving could have a positive side in life. However, driving requires a certain degree of knowledge (handling of a vehicle, traffic rules, etc.). If the activity is deeply internalized, the operation of the vehicle works almost automatically. This is an important
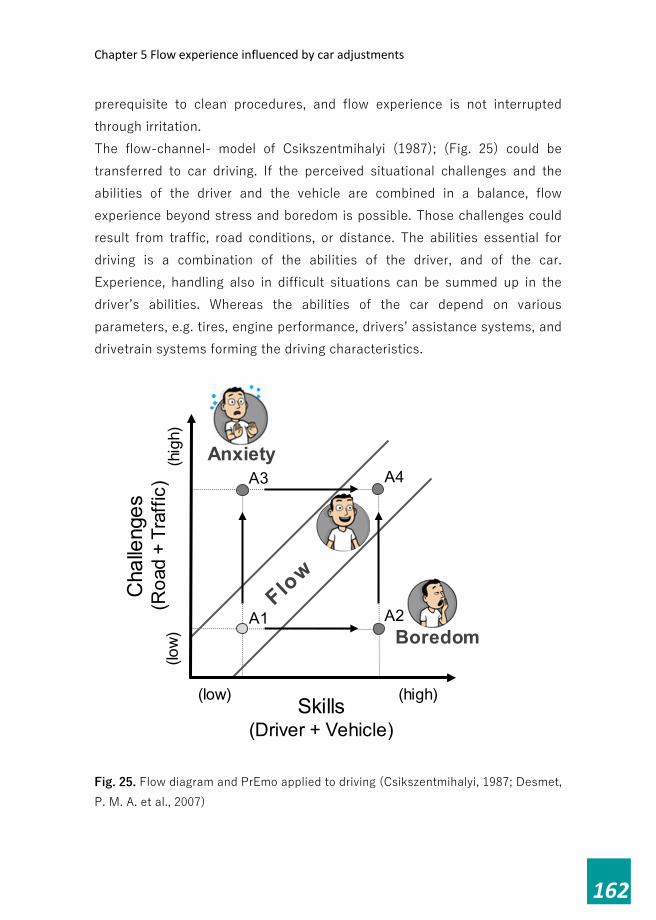
Chapter 5 Flow experience influenced by car adjustments
162
prerequisite to clean procedures, and flow experience is not interrupted through irritation. The flow-channel- model of Csikszentmihalyi (1987); (Fig. 25) could be transferred to car driving. If the perceived situational challenges and the abilities of the driver and the vehicle are combined in a balance, flow experience beyond stress and boredom is possible. Those challenges could result from traffic, road conditions, or distance. The abilities essential for driving is a combination of the abilities of the driver, and of the car. Experience, handling also in difficult situations can be summed up in the driver’s abilities. Whereas the abilities of the car depend on various parameters, e.g. tires, engine performance, drivers’ assistance systems, and drivetrain systems forming the driving characteristics.
Fig. 25. Flow diagram and PrEmo applied to driving (Csikszentmihalyi, 1987; Desmet, P. M. A. et al., 2007)
Boredom
Cha
lleng
es(R
oad
+ Tr
affic
)
Skills(Driver + Vehicle)
Anxiety
A1 A2
A4A3
(high)(low)
(hig
h)(lo
w)

Chapter 5 Flow experience influenced by car adjustments
163
An experience is perceived as either joyful or exhausting relative to the driver’s evaluation of external situations, the driver’s abilities, and the characteristics of the car. In situation A1 (Fig. 25) in which challenges of road and traffic combined are balanced with an adequate level of skills, an improvement of skills would cause an imbalance A2 through increasing capabilities of the driver or the car. Boredom would be a negative result which is often compensated by secondary tasks e. g. operation of radio or Smartphone. A rising level of challenges could cause stress. The driver could lower challenges by reducing speed (Røysamb, 1997), or by using additional Advanced Driver Assistance Systems. Those processes proceed during a drive permanently and unconsciously. A balanced level between challenges and skills is ideal for experiencing flow and ensuring driving safety. Is it possible to influence flow experience by the car itself? To examine this question, a controller was developed to change settings of chassis and automatic transmission. This function contains a driving style detection for sport and comfort driving. The result is a setup change of the chassis and the drive train in the same way, the driver can also manipulate both by using the control elements. By adjustment of the driving dynamic ability of the car, also challenging situations are perceived as being more controllable. The driver gets the feeling of competence, if he masters potentially dangerous situations with those heightened abilities. In this paper the technological innovation focuses on increasing flow and effects are studied on implicit motives, explicit motives, and abilities. First, of course drivers have to notice the effects, but secondly the researchers are examining whether the innovation has any effect on flow. The aim of the new automatic setup function is to influence the driving dynamics in the same way a driver would do by changing settings.

Chapter 5 Flow experience influenced by car adjustments
164
The four important research questions are: 1. Do drivers notice automatic adjustments of functions of the chassis
and drive train from sport to comfort mode and vice versa? 2. What are the interactions between the feeling of safety and irritation? 3. Is automatic adjustment evaluated as well as manual adjustment and
can it be linked to flow? 4. Is a continuous feedback by a specifically designed questionnaire a
way to improve technical innovations and could this help to design a customer-oriented development process?
2 Method To study the effect of a change of chassis and drive train characteristics on experience, a car (BMW 535i, a middle upper-class car) was adapted several times. This car had new technical functions, which adjust automatically the driving characteristics depending upon the situation. This encompasses functions of the chassis and drive train. The test vehicle is able to adjust depending on the driving style and external boundary conditions. This adjustment was visible to the driver through the general display of the respective driving mode as a direct feedback The basis of the underlying logical processes is a detection of situations working in the 3F parameter space (Janine Bossdorf-Zimmer et al., 2011). Driving situations can be described by three parameters: driver (F=Fahrer in German), car (F=Fahrzeug) and situational conditions (F=Fahrumgebung). According to the driver, a characterization of his momentary driving style is analyzed and his driving desire is anticipated by interpreting vehicle dynamics like longitudinal and lateral acceleration as well as the setting of the gas pedal. The car is reacting to the driver’s actions and driving conditions are recorded by navigation data in our case. Tischler (M. A. Tischler, 2007) came to the conclusion that driving situation is a complex of driver, car and environment.
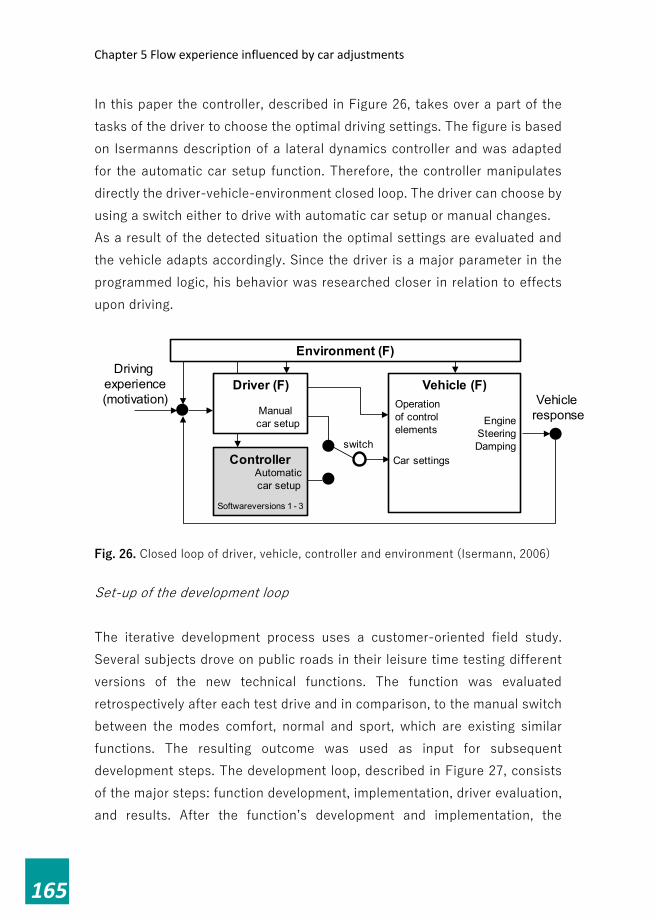
Chapter 5 Flow experience influenced by car adjustments
165
In this paper the controller, described in Figure 26, takes over a part of the tasks of the driver to choose the optimal driving settings. The figure is based on Isermanns description of a lateral dynamics controller and was adapted for the automatic car setup function. Therefore, the controller manipulates directly the driver-vehicle-environment closed loop. The driver can choose by using a switch either to drive with automatic car setup or manual changes. As a result of the detected situation the optimal settings are evaluated and the vehicle adapts accordingly. Since the driver is a major parameter in the programmed logic, his behavior was researched closer in relation to effects upon driving.
Fig. 26. Closed loop of driver, vehicle, controller and environment (Isermann, 2006)
Set-up of the development loop The iterative development process uses a customer-oriented field study. Several subjects drove on public roads in their leisure time testing different versions of the new technical functions. The function was evaluated retrospectively after each test drive and in comparison, to the manual switch between the modes comfort, normal and sport, which are existing similar functions. The resulting outcome was used as input for subsequent development steps. The development loop, described in Figure 27, consists of the major steps: function development, implementation, driver evaluation, and results. After the function’s development and implementation, the
Vehicle (F)Driving
experience(motivation)
Controller Car settingsAutomaticcar setup
Operation of controlelements
EngineSteeringDamping
Softwareversions 1 - 3
Environment (F)
Driver (F)
Manual car setup
switch
Vehicleresponse

Chapter 5 Flow experience influenced by car adjustments
166
function could be evaluated by the subjects of the test pool through test drives. To minimize repeating effects the sequence of driving in manual and automatic mode was permuted.
Fig. 27. Development Loop Because of safety reasons only BMW employees with a special driver license to test cars were used for the test during weekends and in free time. At the start of each test a manual instructing how to operate the car was permanently visible in the car with manual settings for the half of their drive. Thereby the driver could experience the current status quo of car handling and driving characteristics. The other half of the ride was changed to automatic adjustment by the subjects. To be independent of the sequence the instructions for the driver were permuted if they had to drive first manual or automatic setup. In Table 23 the different software versions of the automatic adjustment are described. During the field test the number of events influenced by sensorics’ data was increased and the navigation-based foresight was implemented in the last software version (3). For validation reasons a placebo version with standard functions of chassis and drivetrain was reviewed as well, while subjects were told that this car has also an automatic adjustment.
function development
implementationinto testvehicle
evaluation byBMW employees results / reports
development trends
Test drive
½ way ½ way
before driving
manual/ automatic
setup
automatic/manualsetup

Chapter 5 Flow experience influenced by car adjustments
167
Table 23 Observed software versions Tested software versions
Changes in car setup
Amount of car sensor data
Intenseness of visual feedback
1 ++ + ++
2 ++ ++ +
3 ++ +++ -
Placebo + - -
Description of the technical function A car has to sustain adequate driving characteristics in diverging situations. Those trade-offs are resolved by compensation, applied for chassis, drive train and other systems alike. The new technical function adjusts automatically with the respective situational response by variable systems characteristics. Therefore, the test vehicle is able to adapt the driving characteristic depending upon the situation. This encompasses functions of the chassis like damping and active roll stabilization and of the drive train like engine response. Depending on the driving style as well as external boundary conditions, the test vehicle is able to adjust accordingly. This adjustment was visible to the driver through a display of the respective driving mode as a direct feedback. The basis of the underlying logical processes is a detection of situations working in the 3F parameter space (Janine Bossdorf-Zimmer et al., 2011). Driving situations described by three parameters: driver, car and environmental conditions which are used to describe the whole driving conditions. According to the driver, a characterization of his momentary driving style is analyzed and his driving desire anticipated by interpreting vehicle dynamics like longitudinal and lateral acceleration as well as the setting of the gas pedal. Driving conditions are recorded by navigation data. The controller, described in Figure 26, adopts the former tasks of the driver to choose the optimal driving settings. Therefore, the controller manipulates directly the driver-vehicle-environment closed loop.
Chapter 5 Flow experience influenced by car adjustments
168
As a result of the detected situation, the optimal settings are evaluated and the vehicle adapts accordingly. Since the driver is a major parameter in the programmed logic, his behavior was researched closer in relation to effects upon driving. Pre-test and classification The tested car function has been developed by BMW. As this is no public study the subjects were BMW employees from various departments not necessarily being related to drivetrain engineering. For testing drivetrain functions the subjects can sense changes in driving characteristics very accurately and therefore represent general customers who hardly have a professional drivers’ training (Neukum et al., 2001). Prior to the field study, a questionnaire-based pre-test was conducted in order to identify a homogenous test group according to specific and pre-defined criteria. Only drivers of this respective test group were able to participate in the study while the main goal was to represent the target customers with various backgrounds (R&D, Marketing, Sales). An equal gender distribution, anthropometric data and the comparable level of well experienced driving knowledge to perform driving as an autotelic operation (e.g. driver’s license for at least 6 years) served as classification criteria for selecting subjects. As average customers do not always have a deeper understanding of every detail of automotive technology, there was no technical knowledge given necessary and needed for participation. However, to exclude the effects of stress due to low driving experience, subjects should have their driver’s license for at least 6 years with an average mileage of 10,000 km per year. The evaluation comprised chassis and drive train, therefore anthropometric data for weight and size was decided to be set for the 50th percentile for comparability reasons. Those criteria served for defining the pool of subjects participating in the field study in their leisure time with preferably longer distances e.g. 200 kilometers per day. A pre-test questionnaire was sent to 500 BMW employees, which had a drivers’ test car license. 384 responded with 207 subjects, 29 females (21,3%)

Chapter 5 Flow experience influenced by car adjustments
169
and 107 males. The subjects’ age ranged from the early 20s to late 50s, 31,4% age 20 to 20, 32,9% 30 to 39, 30.7% 40 to 49, 4,3% 50 to 59. 52 participated in the software version one experiment, 29 in software version two and 25 in three and 30 in Placebo. In all test situations (1, 2, 3 and placebo) the same questionnaire was used. Questions concerned general characteristics of the subjects like age, gender, drivers experience and anthropometrics and effects on the experienced changes in functions of the chassis and drive train. Questions on implicit and explicit motives and abilities of the drivers were asked. Figure 28 gives an overview of the evaluated elements of the flow experience in this study.
Fig. 28: questionnaire to measure feeling of flow Implicit motives: to grasp spontaneous emotional responses, which is related according to Kehr to unconscious needs (A. H. Maslow, 1943), and basic and organismic needs (Deci and Ryan, 2000), the PrEmos (Desmet, P. M. A. et al., 2007) are used with an own bipolar 7-point Likert Scale of 2 opposite
PretestClassifi-cation
Mood
Personal load
Flow value
Notice-ability of changes
Concen-tration
Irritation
Flow
Chapter 5 Flow experience influenced by car adjustments
170
emotions. Subtitles are added to the emotions to clearly identify the emotions as in Russell’s Circumplex Model of affections. Explicit motives: To measure the explicit motives questions are asked like: were you concentrated while driving, did you perceive automatic changes in the chassis and drive train on a 7-point Likert-Scale between never and all the time, and which changes are important to you for driving characteristics on a 7-point Likert-Scale between not important and very important regarding: driving mode display, steering, driving comfort, and engine/ gear characteristics. Abilities: to detect abilities question on whether drivers rate themselves as sporty or comfort oriented as well as the individual and optimal level of the challenge-ability relationship, also reflected by the intensity of being either overwhelmed, or unchallenged by the driving task. Like the Experience Sampling Method (Csikszentmihalyi and Larson, 2014) the questionnaire focuses on the momentary mood of the subjects, noticeability of the system changes, level of challenge etc. complemented by items for the level of challenge. The claimed differentiation of challenge and demands of the activity was included by selecting subjects with comparable driving experience in the pretest and focusing on challenges in the field study (Rheinberg, 2003). In addition, the feeling of how challenging an activity is being experienced, refers directly to the flow diagram (Fig. 25). Statistical analysis consisted of calculating the mean and standard deviation per software version (four conditions) and testing the difference with ANOVA and Kolmogorov-Smirnov-Test (p<.05). A correlation was calculated between sensing the mode changes and other items, and a one-sided Pearson test was used to test significance (p<.05).

Chapter 5 Flow experience influenced by car adjustments
171
3 Results The two test cycles testing version 1 and 2 were valuable as these gave input for further development. After the first test, participants indicated that more events were needed to change between the comfort and sport mode and vice versa. The second test showed that sometimes changes between modes were not appreciated. This could be solved by using additional sensor data to adapt the software. Consequently, the 3rd software version included sensor data for anticipatory driving, improving the human-machine relationship impressively (see Table 23). A statistical, but negative trend (r=-.37; p>.05) was found between version 3 and the placebo regarding the question “did you sense the mode changes from sports to comfort” (mean for 3 was 5.01 and for placebo 4.44 on a 7-point Likert scale from “not at all” to “all the time”) and regarding the question “did you sense the mode changes from comfort to sports” (mean for 3 was 4.74 and for placebo 1.93 on a 7-point Likert scale from “not at all” to “all the time”) . So, an increase in perceptibility of the automatic mode change leads to a decrease in concentration of the driver. However, this trend is not statistically significant. A statistical significant difference (r=.71; p<.05) was found between version 3 and the placebo regarding the question “did you feel irritated by the mode change from sports to comfort” (mean for 3 was 3.0 and for placebo 1.7 on a 7-point Likert scale from “not at all” to “very strongly”) and regarding the question “did you feel irritated by the mode change from comfort to sports” (mean for 3 was 2.65 and for placebo 1.53 on a 7-point Likert scale from “not at all” to “all the time”). The highest correlations found with the sensing of the mode change were found with improved concentration while driving and irritation by mode changes (see Table 27). A comparison of the means of the emotional arousal shows lower means for manual and automatic mode in combination with the use of software version 1 and 2 than the means of 4.74 to 5.68 before the test (see Table 24). The placebo version even results in decreasing means, whereas only software

Chapter 5 Flow experience influenced by car adjustments
172
version 3 shows a higher emotional arousal for the automatically operated mode change than before the test. For further analysis with an ANOVA, first the Shapiro-Wilk test was conducted which shows a normal distribution for all values except the mood resulted by manual drive with software version 1 (p=.000), 2 (p=.011) and the placebo version (p=.005) so this can be neglected (Bühner and Ziegler, 2008). Automatic drive leads to a higher standard deviation compared to manual drive and the mood just before the test ride. The broad spectrum of responses leads to the assumption of very different individual emotional reactions to the automatic mode changes in all three software versions. Table 24 Mean rank for mood for 3 software versions and default setup for 3 dates
Mood Before Test Drive (STD)
Mood Manual Drive (STD)
Mood Automatic Drive (STD)
Condition
Software version 1 N=52
5.68 (0.70)
5.26 (1.17)
4.57 (1.47)
Software version 2 N=29
5.47 (0.88)
4.75 (1.20)
4.82 (1.23)
Software version 3 N=26
4.74 (0.96)
4.53 (1.00)
5.01 (1.31)
Placebo N=30
5.32 (0.86)
4.93 (1.08)
4.44 (1.53)
N=Sample As means are only marginally diverging, an ANOVA was calculated to search for significant differences. The emotional arousal before the test shows statistically significant differences (F(3.135)=7.21; p=.000), but no statistical difference for the test part with manual switch or automatic switch (F(3.133)=.97; p=.410)), indicating that regardless of software version no changes in driving characteristics happen within the manual mode change, but subjects were enthusiastic right before the test (corresponding with the fact that the tests were conducted in their leisure time).

Chapter 5 Flow experience influenced by car adjustments
173
Automation aims generally to reduce stress and, in this case, to improve human machine interaction while driving. Therefore, the two border areas of flow, stress and boredom, are analyzed by descriptive statistics (see Fig. 29). The means of the automatic mode change show marginally lower values than the manual mode change in all three software versions as well as a lower stress level. This sustains the fact that an increase in secondary or tertiary tasks distract drivers from the primary task intensively (Schlick, 2010). As the standard deviation spreads widely, the task and challenge were perceived differently between stress and boredom. The placebo version with no changes in the setup at all, shows comparable means and standard deviations to the automatic mode change (2.60; STD= 1.63). An analysis with the Shapiro Wilk test resolved not in a normal distribution for the exposure (p<.05), so the skewness was tested according to Miles & Shevlin (Miles and Shevlin, 2001) in relation to the doubled standards error which happens with the feedback if subjects were stressed during manual or automatic setup. The results for stress are skewed to the right in all software versions for the automatic and manual mode change. An assumption of a low level of stress during the test situation can be explained because of the individual test roads, personal capabilities or the traffic/ weather conditions, so main drivers are merely external or internal conditions. One of the necessary conditions of flow experience is the balance between skills and challenges (Csikszentmihalyi, 2007). This balance can be achieved if a person is neither overchallenged nor underchallenged. In this study, it was examined using two 7-point Likert scales. The test persons were questioned about their feelings in automatic and manual mode. Table 25 shows the average results of this questioning. The feeling of underchallenging was more intensive that the felling of overchallenging. In the automatic mode, the values were lower than in case of manual operation (e. g. software version 3, overstrain is 2.20 in manual mode and 1.76 in automatic mode). Consequently, it became clear that the conditions for flow experience were better in automatic mode. The reason lies in the fact that the driver was able

Chapter 5 Flow experience influenced by car adjustments
174
to concentrate more on the driving situation instead of choosing the appropriate mode manually. Table 25 Mean rank of personal load for 3 software versions and default setup for 3 dates based on complete journey time
Personal load Manual setup (standard deviation)
Personal load Automatic setup (standard deviation)
condition unchallenged overstrain unchallenged overstrain Software version 1 N=52
2.71 (1.58)
1.79 (1.23)
2.52 (1.80)
1.62 (1.01)
Software version 2 N=29
3.07 (1.67)
1.93 (1.33)
2.69 (1.42)
1.66 (1.01)
Software version 3 N=25
2.84 (1.34)
2.20 (1.38)
2.56 (1.47)
1.76 (1.16)
Placebo N=30
2.93 (1.46)
1.87 (1.31)
2.60 (1.77)
1.63 (1.03)
N=random sample
The flow experience was tested with a bipolar 7-point Likert Scale leaning upon the PrEmos of Desmet with the maximum i.e. fun or joy (value 4) in the middle and boredom (values 1-3) and frustration/ stress (values 5-7) at both poles. Those emotions are represented by a special adaption of the PrEmos with a particular representation of stress; as with the emotional arousal scale the emotion is indicated below the image to prevent misinterpretation. Because not every test person knew the description of the flow experience, the wording Joy in addition to flow was used (compare to Fig. 29). The descriptive analysis of Table 26 shows the differences of software versions applied in both automatic as well as manual setup. The smaller the

Chapter 5 Flow experience influenced by car adjustments
175
value of the difference is, the closer the evaluated experience can be to the feeling of fun or joy (value 4). An overall tendency towards joy or flow in all conditions and software versions leading to the assumption that the test ride was generally a joyous activity for the subjects. The smallest difference in flow value of the automatic setup (0.20) was achieved with software version 3. Only the placebo version (3.77) and software version 1 (3.78) slightly tend to boredom. This result is not surprising as both versions had no or only marginal functional characteristics (see Fig. 29).
Fig. 29. Flow value measured by using PrEmo To prove the statistical significance of the differences of flow values, an ANOVA was calculated. Additionally, with a Kolmogorov-Smirnov-Test p<.05, the values proved to be normally distributed. The ANOVA showed flow values with manual mode change of F(3.134)=2.65 with p=.052 and automatic mode change of F(3.134)=2.65 with p=.5, so the difference is not statistically significant.
3,00
4,00
5,00
Manualcar setup
automaticcar setup
Softwareversion 1
Softwareversion 2
Softwareversion 3
Placebo
Boredom
Anxiety
Joy (Flow)
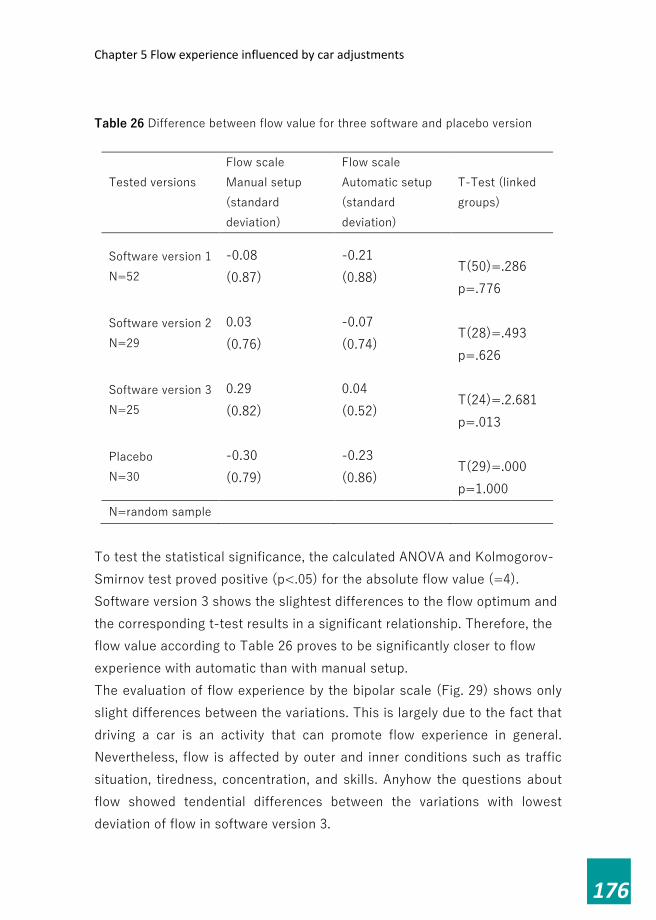
Chapter 5 Flow experience influenced by car adjustments
176
Table 26 Difference between flow value for three software and placebo version
Flow scale Manual setup (standard deviation)
Flow scale Automatic setup (standard deviation)
Tested versions T-Test (linked
groups)
Software version 1 N=52
-0.08 (0.87)
-0.21 (0.88)
T(50)=.286 p=.776
Software version 2 N=29
0.03 (0.76)
-0.07 (0.74)
T(28)=.493 p=.626
Software version 3 N=25
0.29 (0.82)
0.04 (0.52)
T(24)=.2.681 p=.013
Placebo N=30
-0.30 (0.79)
-0.23 (0.86)
T(29)=.000 p=1.000
N=random sample To test the statistical significance, the calculated ANOVA and Kolmogorov-Smirnov test proved positive (p<.05) for the absolute flow value (=4). Software version 3 shows the slightest differences to the flow optimum and the corresponding t-test results in a significant relationship. Therefore, the flow value according to Table 26 proves to be significantly closer to flow experience with automatic than with manual setup. The evaluation of flow experience by the bipolar scale (Fig. 29) shows only slight differences between the variations. This is largely due to the fact that driving a car is an activity that can promote flow experience in general. Nevertheless, flow is affected by outer and inner conditions such as traffic situation, tiredness, concentration, and skills. Anyhow the questions about flow showed tendential differences between the variations with lowest deviation of flow in software version 3.

Chapter 5 Flow experience influenced by car adjustments
177
During the development of the automatic setup the noticeability of changes within the car and the impression upon the subjects were interesting research fields, as the driver for once had the chance to willingly change the modes and secondly the modes were changed without his intervening. Fig. 30 sums up all results of the survey concerning noticeability. In all software versions, the subjects perceived drivetrain characteristics more than chassis characteristics independent from causality. Also, in software version 3 no visual feedback was integrated anymore. The slight difference between manual and automatic mode change indicates a congruent understanding within the car’s changes in the automatic setup. To prove this assumption, a placebo version was used within the field test study with no changes of car’s driving characteristic at all. The reaction of the subjects shows lower values for noticeability.
Fig. 30: noticeability of automatic setup and Placebo Furthermore, an ANOVA was calculated to prove the statistical significance, however the Kolmogorov-Smirnov test showed values for p<.05, only within software version 3 values are not normally distributed regarding the question of perceptibility of the chassis. For the manual mode change, no statistically significant differences were found neither regarding the drivetrain (F(2, 82)=1.78, p=.175) nor the chassis ( F(2, 82)=.73, p=.486). As the changes in the software versions are only
1
2
3
4
5
6
7
Softwareversion 1
Softwareversion 2
Softwareversion 3
Placebo(auto. setup)
low
high
Drivetrain (man.setup)Chassis (man.setup)Drivetrain (auto.setup)Chassis (auto.setup)
not a
sked

Chapter 5 Flow experience influenced by car adjustments
178
applied in the automatic mode change, differences hardly occur. For the automatic mode change, there are significant differences between the software versions with both variables the noticeability of the chassis (F(2,82)=9.85; p=.000) and drivetrain (F2,82)=19.64; p=.000). This analysis stresses that changes within the drivetrain are observed more intensely than within the chassis. Only the placebo version shows low perceptibility of the changes within the drivetrain and chassis (Fig. 30). Correlation Analysis was used to identify relationships between different emotions of the drivers within software version 3. Table 27 shows a strong relationship between the feeling of driving safety, the emotional arousal of the automatic mode change, irritation, and an increase of attention. The values correlate negatively with irritation i.e. the feeling of safety increases the lesser irritating changes happen within the maneuvering of a car. Table 27 Correlation of noticeability with other sensing (Software version 3)
Mood after drive with automatic setup
Increase of concentration with automatic setup
Feeling of irritation because of automatic setup
Noticeability of automatic setup
Correlations (Pearson) -.310 -.370 .305
significance .062 .062 .065
(1-sided) 26 26 26
N
Feeling of Safety
Correlations (Pearson) .736 .644** -.730**
significance .000* .000* .000*
(1-sided) 26 26 26
N * marked p-values are less than .5 with significant correlation
** marked r-values are greater than ± .5 (strong coherence)

Chapter 5 Flow experience influenced by car adjustments
179
4 Discussion In the field study conducted in the subjects’ leisure time, actual traffic situations proved to deliver important insights in human-machine interaction and the effect of automation upon the driving task. The immediate feedback and respective quantitative analysis served as input to improve the technical function continuously. Only the emotional arousal before the test ride proved to be significant whereas the rest of the scenarios with software version 1, 2, and 3 showed a slight trend, but were merely inconclusive. The significance could be explained by the pleasure of a test ride with a well-equipped upper middle-class car in someone’s leisure time. Research Question 1: Do drivers notice automatic adjustments of functions of the chassis and drive train from sport to comfort mode and vice versa? As described by Fig. 30, subjects evaluated the changes within the car significantly lower while driving the placebo version. The study illustrates the correlations of noticeability of the function with irritation and concentration of the subjects (see Table 24). Obviously, drivers noticed automatic adjustment of functions of the chassis and drive train from sports to comfort mode and vice versa. The fact that there was a difference in sensing between the latest version and the placebo is the most convincing argument. But there has to be a defined balance between noticeability of the automatic mode change regarding its negative relation with concentration and the positive relation with irritation. So, adjustments should happen intuitively to prevent irritation because of errors. Additionally, changes within the drivetrain are noticed more intensely than within the chassis because the drivetrain delivers with the engine an acoustic and with the revmeter an optical feedback.

Chapter 5 Flow experience influenced by car adjustments
180
Research Question 2: What are the interactions between the feeling of safety and irritation? Strong statistically significant correlations could be proven between the feeling of driving safety and the emotional arousal of the automatic setup, irritation, and attention. Thus information access costs could be lower as there is no need for a long search of gauges with intense movement of head and eyes (Schlick, 2010). The improvement in feeling of safety is achieved by reducing of stress level, because in automatic mode the drivers were not required to push the mode change button but could concentrate on their driving task. In addition, the automatic modus provides an optimal car setup that helps in difficult situations like overtaking, driving a curve with fast speed or accessing a motorway. But if the automatic mode does not ensure the expected changes in car handling, this could cause irritation, and as a consequence a lack in feeling of safety. That is why a precise driving situation detection is necessary. Experience confirms that drivers notice malfunctions more exactly than when the car operation is accurate. Research Question 3: Is automatic adjustment evaluated as well as manual adjustment and can it be linked to flow? The automatic adjustment of the driving modes leads to less distraction by the operation of a switch (see Table 25). In combination with the common trend “simplifying”, an intuitive access to complex systems and technology allows the driver to interact with the car on a different level. Therefore, overstrain, complexity, and stress can be reduced which all hinder drivers from experiencing flow. As illustrated by Table 24, the mood deteriorates with the first software version, the second proves to show no difference in emotional arousal, but software version 3 shows a slight increase. Those results are congruent when looking at the placebo version that was evaluated even worse than software 1. Complex and nonintuitive algorithms could lead to a concept generally known from aviation “automation induced surprises” (Salvendy, 1997). In this field

Chapter 5 Flow experience influenced by car adjustments
181
study, the first software versions and the placebo version aroused emotions of the function’s failure, hence subjects might have tried to provoke the mode change. The flow test with the bipolar flow scale also indicates a non-conclusive mean, in spite of the good spreading of standard deviation. Those results are supported by Csikszentmihalyi’s assumption of driving having a neutral effect on joy. The striking influence of external conditions like traffic, weather, usage, and chosen roads upon the results could not be prospected by the researchers. Thus, those individual conditions clearly manipulated the subjects’ evaluations. For the effects on flow, further research is needed. This study showed effects on explicit motives and abilities, but not on implicit motives. On the other hand, changes were felt by the drivers and these were correlated with a higher driving concentration and a decreased irritation in the latest developed version. A reason for the development of the function was to relieve the driver from additional secondary tasks. As a result, the means of overchallenge tend to be lower than with manual mode change. However, also the level of unchallenged decreased which can be explained by the sample of consisting of merely trained drivers working in the automotive industry. The level of training of drivers can be very volatile so that over- and unchallenged can be at balance. The lower level of overstrain is coherent to the correlation of driving safety, mood, and increase in concentration; an intended aim of the function proven by significant relationships. Irritation by the function proved to have a negative influence on the feeling of safety. In summary, it can be said therefore that drivers evaluated automatic modus changes to be equally good as changes made manually or even better. Whenever an automation is being implemented it has to serve expectations of the user by e. g. work simplification or technical advantage. The technical function of automatic modus change will be improved in stability, detection, and user interface during the next development steps.

Chapter 5 Flow experience influenced by car adjustments
182
Research Question 4: Is a continuous feedback by a specifically designed questionnaire a way to improve technical innovations in situations close to those of customers and could this help to design a customer-oriented development process? Throughout the iterative development process analogical to figure 27 the direct feedback of the subjects served as input for developing and refining the software version 1, 2, and 3 resulting in a configuration appreciated by the subjects (see Table 24). Side-effects are the reduction of error, the increase in achievement, safety and in comfort while interacting with the car i.e. a basic principle of human factors engineering (Wickens et al., 1998). As indicated the characteristic has to hold an adequate balance. Table 23 displays the different steps in software development of the function. The number of sensors and algorithms according to the 3F model was increased to aim at a better detection of the driving and traffic situation by distinguishing the intention of a sportive driving style from a comfort oriented one. The systems ergonomics approach focuses not only on haptic, sensory, and visual feedback, but also on human information processing (Rasmussen et al., 1994). Therefore, field tests with subjects in lifelike traffic situations contribute to an important insight for the acceptance of automation systems in a car. The visualization of the current mode was used in the beginning of the test loops to increase the awareness, but was excluded because of no additional value for processing the information of driving modes in the test (Schlick, 2010). The “abstract data” of the sports or comfort mode did not amplify cognition as expected (Card et al., 1993). So, visual feedback was decreased along the software versions and the development of the function, as subjects’ awareness of the current driving mode resulted in uncommon behavior and driving styles to force a mode change. For instance, the driver was not distracted by mode changes anymore. Resulting from the multi-channel characteristic of human information processing, various gauges and input need to be considered (Gärtner, 2000; Harris, 2007). However, with all other senses the drivers’ willingness to drive sporty or comfortable needed to have feedback by the car instantly. So, additional sensors and navigation data were added to achieve a coherent human-machine communication meeting

Chapter 5 Flow experience influenced by car adjustments
183
the subjects’ expectations and the demands of the task (Schlick, 2010). Therefore, transinformation will be at maximum, if the amount of recoded information is lowest (Williges, 1987) and mental resources are utilized marginally to work more efficiently according to Hacker. As a result, the driver will not get distracted from the main task of driving. if human perception and the machines reaction are compatible und understandable and the car reacts proactively to the driver’s anticipated driving style and road conditions. 5 Conclusion The automatic mode change allowed the drivers of the field test an intuitive operation of the change of driving characteristics from sports mode to comfort mode with feedback from drivetrain and chassis. Those changes were felt by the drivers. The driver’s decision to switch to a sportier driving style or more comfort oriented one should happen intuitively and adequately to his behavior or resulting from it (Schlick, 2010). The integration of automation in relation to driving characteristics resulted in higher subjective driving safety alongside a positively heightened emotional arousal, decreased irritation and an increased level of attention. This sensing of auditive and haptic feedback correlated with higher concentration and decreased irritation in the latest developed Software version 3. There is a distinct trend that the emotional evaluations of the automatic mode change are more positive, but not statistically different. By including positive or negative emotional arousal, an optimal fit of subjective capabilities and demands on a high level leads to positive and negative arousal within the same sample, as individual differences of the subjects occur in characteristics like hope for success or anxiety for failure (Moneta and Csikszentmihalyi, 1996). The emotional arousal with bipolar PrEmo Scales (Desmet, P. M. A. et al., 2007) served as a first insight of intrinsic motives occurring while driving, but should be validated by projective tests like the Thematic Apperception Test (Murray, 1943), Multi Motive Grid (Sokolowski et al., 2000). The idea to use the direct facial expression and

Chapter 5 Flow experience influenced by car adjustments
184
emotional feedback by means like the Noldus’ Facereader (van Kuilenburg et al., 2005) was rejected by the researchers after first brief tests with the tool because of the continuous light changes in the car. Additionally this method proves to have disadvantages because of movement of the head, and the subjects do not focus the camera (Tischler, Martin A. et al., 2007). Tischler also noticed that the drivers showed only little facial expressions due to their concentration. Therefore, camera-based tools for the detection of emotional arousal were relinquished by the authors for this field study. The impact of technical functions on chassis and drivetrain should also be investigated further. New studies are conducted with a defined timeline of 1.5-hour rides on a defined track to guarantee comparability. The track itself consists of curvy, city and country roads, highways without speed limit with less traffic, but still on public roads. As the survey is conducted using a touchscreen, an immediate response after each test phase is possible instead of the retrospective approach of the field study of this paper. The authors estimate much more spontaneous emotional feedback to grasp with this method comparable to the Experience Sampling Method (Csikszentmihalyi and Larson, 2014) or the Flow Scale by Rheinberg (Rheinberg, 2003). Additionally, data logging is integrated to monitor track deviations and sportiveness aside of individual ratings. Also, the focus is laid upon less information before the study and considerably decreased technical questions. Those further studies should clarify, if differences between emotional arousal and cognitive demands exist depending on level of automation within a car.

Chapter 5 Flow experience influenced by car adjustments
185
REFERENCES A. H. Maslow, 1943. A Theory of Human Motivation. Psychological Review (50), 370–396. Ajzen, I., Driver, B.L., 1991. Prediction of leisure participation from behavioral, normative, and control beliefs: An application of the theory of planned behavior. [s.n.], [S.l.], p. 185-204 ; Atkinson, J.W., 1964. An introduction to motivation. Van Nostrand, Princeton, N.J., xiii, 335. Bandura, A., 1977. Self-efficacy: Toward a unifying theory of behavioral change. Psychological Review 84 (2), 191–215. 10.1037/0033-295X.84.2.191. Bubb, H. (Ed.), 2000. Ergonomie und Verkehrssicherheit: GfA Konferenzbeiträge der Herbstkonferenz 2000, 12. - 13. Oktober 2000 an der Technischen Universität München. Utz, München, 226 pp. Bühner, M., Ziegler, M., 2008. Statistik für Psychologen und Sozialwissenschaftler. Pearson, München [u.a.], ca. 752 S. Card, S.K., Mackinlay, J.D., Shneiderman, B., 1993. Readings in information visualization: Using Vising to think. Morgan Kaufmann, San Mateo, Calif., xvii, 686. Christian Krause, 2011. Trendforschung im PKW-Markt 1993 - 2011: eine ADAC Verlag-Studie. http://media.adac.de/mediaservice/studien.html. Csikszentmihalyi, M., 1975. Beyond boredom and anxiety, 1st ed. Jossey-Bass Publishers, San Francisco, xviii, 231. Csikszentmihalyi, M., 1987. Das Flow-Erlebnis: Jenseits von Angst und Langeweile: im Tun aufgehen, 2nd ed. Klett-Cotta, Stuttgart, 254 pp. Csikszentmihalyi, M., 1997. Finding flow: The psychology of engagement with everyday life, 1st ed. BasicBooks, New York, ix, 181. Csikszentmihalyi, M., Larson, R., 2014. Validity and Reliability of the Experience-Sampling Method. In: Csikszentmihalyi, M. (Ed.), Flow and the Foundations of Positive Psychology. Springer Netherlands, Dordrecht, pp. 35–54. Csikszentmihalyi, M., LeFevre, J., 1989. Optimal experience in work and leisure. Journal of Personality and Social Psychology 56 (5), 815–822.

Chapter 5 Flow experience influenced by car adjustments
186
Csikszentmihalyi, M.A.S.&.N.J., 2007. Flow. In: Elliot, A.J., Dweck, C.S. (Eds.), Handbook of competence and motivation. Guilford Press, New York, pp. 598–608. Deci, E.L., Ryan, R.M., 2000. The \"What\" and \"Why\" of Goal Pursuits: Human Needs and the Self-Determination of Behavior. Psychological Inquiry 11 (4), 227–268. 10.1207/S15327965PLI1104_01. Desmet, P. M. A., Porcelijn, R., van Dijk, M. B., 2007. Emotional Design; Application of a Research-Based Design Approach. Know Techn Pol 20 (3), 141–155. 10.1007/s12130-007-9018-4. Falko Rheinberg, 1996. Flow-Erleben, Freude an riskantem Sport und andere "unvernünftige" Motivationen. In: Kuhl, J. (Ed.), Enzyklopädie der Psychologie / C / 4. Hogrefe, Göttingen [u.a.]. Gärtner, K.-P. (Ed.), 2000. Multimodale Interaktion im Bereich der Fahrzeug- und Prozessführung: 42. Fachausschusssitzung Anthropotechnik der Deutschen Gesellschaft für Luft- und Raumfahrt e.V., 24. und 25. Oktober 2000, München. DGLR, Bonn, 332 pp. Harris, D., 2007. Engineering psychology and cognitive ergonomics: 7th International Conference, EPCE 2007, held as part of HCI International 2007, Beijing, China, July 22-27, 2007 ; proceedings. Springer, Berlin [u.a.], XXIII, 879 S. Isermann, R., 2006. Fahrdynamik-Regelung: Modellbildung, Fahrerassistenzsysteme, Mechatronik, 1st ed. Vieweg, F, Wiesbaden, 450 S ; Janine Bossdorf-Zimmer, Hermann Kollmer, Roman Henze, Ferit Kücükay, 2011. Fingerprint des Fahrers zur Adaption von Assistenzsystemen. ATZ - Automobiltechnische Zeitschrift (2011-03), 226–231. Kehr, H.M., 2004. INTEGRATING IMPLICIT MOTIVES, EXPLICIT MOTIVES, AND PERCEIVED ABILITIES: THE COMPENSATORY MODEL OF WORK MOTIVATION AND VOLITION. Academy of Management Review 29 (3), 479–499. 10.5465/AMR.2004.13670963. M. A. Tischler, G.R., 2007. Ansatz zur Messung von positivem Fahrerleben: Die Messung von Fahrspaß und Ableitungen für die Fahrzeuggestaltung. In: VDI-Gesellschaft Fahrzeug- und Verkehrstechnik (Ed.), Der Fahrer im 21.
Chapter 5 Flow experience influenced by car adjustments
187
Jahrhundert. Human Machine Interface, Braunschweig. 14.-15.11.2007. VDI Verlag GmbH, Düsseldorf, pp. 105–117. McClelland, D.C., 1985. Human motivation. Scott Foresman, Glenview, Ill., 663 pp. McClelland, J.L., Rumelhart, D.E., 1989. Psychological and biological models, 9th ed. MIT Pr, Cambridge, Mass., 611 pp. Miles, J., Shevlin, M., 2001. Applying Regression & Correlation: A Guide for Students and Researchers. SAGE Publications, London, 244 S. Moneta, G.B., Csikszentmihalyi, M., 1996. The Effect of Perceived Challenges and Skills on the Quality of Subjective Experience. J Personality 64 (2), 275–310. 10.1111/j.1467-6494.1996.tb00512.x. Murray, H.A., 1943. Thematic apperception test. Harvard University Pr., Cambridge, Mass., 31 pp. Neukum, A., Krüger, H.-P., Schuller, J., 2001. Der Fahrer als Messinstrument für fahrdynamische Eigenschaften? In: VDI-Gesellschaft Fahrzeug- und Verkehrstechnik (Ed.), VDI-Berichte. VDI Verlag, Düsseldorf. Rasmussen, J., Pejtersen, A.M., Goodstein, L.P., ©1994. Cognitive systems engineering. Wiley, New York, xviii, 378. Rheinberg, F.V.R.&.E.S., 2003. Die Erfassung des Flow-Erlebens. In: Stiensmeier-Pelster, J., Rheinberg, F. (Eds.), Diagnostik von Motivation und Selbstkonzept. Hogrefe, Göttingen [u.a.], pp. 261–279. Røysamb, E., 1997. Risk behaviour: Towards a model of affectively construed action. Personality and Individual Differences 22 (1), 33–46. 10.1016/S0191-8869(96)00164-X. Salvendy, G. (Ed.), 1997. Handbook of human factors and ergonomics, 2nd ed. Wiley, New York, 2137 pp. Schlick, C., 2010. Arbeitswissenschaft, 3rd ed. Springer, Berlin, Heidelberg, XXII, 1192 S. Schmidtke, H., Bernotat, R., 1993. Ergonomie, 3rd ed. Hanser, München [u.a.], 643 S. Schultheiss, O.C., Brunstein, J.C. (Eds.), 2010. Implicit motives. Oxford Univ. Press, Oxford, 563 pp.
Chapter 5 Flow experience influenced by car adjustments
188
Sokolowski, K., Schmalt, H.D., Langens, T.A., Puca, R.M., 2000. Assessing achievement, affiliation, and power motives all at once: the Multi-Motive Grid (MMG). Journal of personality assessment 74 (1), 126–145. 10.1207/S15327752JPA740109. Tischler, Martin A., Peter, C., Wimmer, M., Voskamp, J., 2007. Application of emotion recognition methods in automotive research. In: Fraunhofer IGD (Ed.). 2nd Workshop Emotion and Computing - Current Research and Future Impact 2007, Osnabrück, Germany. 10.9.-13.9.2007. van Kuilenburg, H., Wiering, M., den Uyl, M., 2005. A Model Based Method for Automatic Facial Expression Recognition. In: Hutchison, D., Kanade, T., Kittler, J., Kleinberg, J.M., Mattern, F., Mitchell, J.C., Naor, M., Nierstrasz, O., Pandu Rangan, C., Steffen, B., Sudan, M., Terzopoulos, D., Tygar, D., Vardi, M.Y., Weikum, G., Gama, J., Camacho, R., Brazdil, P.B., Jorge, A.M., Torgo, L. (Eds.), Machine Learning: ECML 2005, vol. 3720. Springer Berlin Heidelberg, Berlin, Heidelberg, pp. 194–205. Vroom, V.H., 1964. Work and motivation. Wiley, New York, ix, 331. Walsh, G., Klee, A., Kilian, T., 2009. Marketing: Eine Einführung auf der Grundlage von Case Studies. Springer, Berlin [u.a.], XVII, 538 S. Wickens, C.D., Gordon, S.E., Liu, Y., 1998. An introduction to human factors engineering. Longman, New York, 636 pp. Williges, R.C., 1987. The Society's Lecture 1987 The Use of Models in Human-Computer Interface Design. Ergonomics 30 (3), 491–502. 10.1080/00140138708969739.

Chapter 6 Adaptive Customization - Value creation of adaptive elements within the Automotive Interior
189
Chapter 6 Adaptive Customization - Value creation of
adaptive elements within the Automotive Interior
Abstract In this paper, adaptive customization by color changing LEDs is investigated. Two forms of customization are studied: one system reacts on the color of subjects’ clothes and one system was influenced by a color blending App. Both are built up in a real car. The emotional responses were recorded before and after the test with 70 subjects. Emotions as attraction, hope and joy were found as reactions and 58.6% preferred this approach of steering the interior lighting. Half of the sample preferred the color mixing and half the automatic color detection system showing that there are two clear interaction preferences. The expectations recorded prior to the test influenced the level of experience massively and also interfered with the subjects’ emotions. Keywords: crowd sourcing, customization, HMI, emotional value added. Wagner, A.-S., Kilincsoy, Ü., Reitmeir, M., & Vink, P. (2014). Adaptive Customization –Value Creation by Adaptive Lighting in the Car Interior. In P. Vink (Ed.), Advances in Social and Organizational Factors (pp. 40-50): AHFE Conference.

Chapter 6 Adaptive Customization - Value creation of adaptive elements within the Automotive Interior
190
1 Introduction In the BMW museum, it is shown that high class customization of luxurious cars in the 60s and 90s was offered for only one person e.g. the BMW 507 and the BMW Z8 (see Fig. 31). The initial buyer could choose among a lot of interior features, colors and materials and therefore the car was customized to the buyer’s needs. However, this is only an advantage for the 1st owner of a car and can seldom be applied to the retail market or car sharing. In the past, customization was only available for make-to-order products. Nowadays, customization is realized by colors and materials aside of technical features in form of packaging or sub-brands in order to satisfy an increasing demand for individualization (Futschik, 2011). Another possibility for customization is to change the appearance of the interior continuously.
Fig. 31 The interior of the Z8, which is made custom specific and the color repeats itself in different parts of the interior. In the last years, the application of LEDs increased in our homes, decorations and in cars itself either as safety features like head and tail lamps (Lachmayer, 2011) as well as interior design elements (So & Chan, 2009) e.g. as programmable and application steered LED lightstrips (Donath, 2013) or photonic textiles (Klaß, 2005). For the second owner and car sharing users, which could be a change in the mobility behavior of customers especially in bigger cities, customizable lighting elements in the interior can be an

Chapter 6 Adaptive Customization - Value creation of adaptive elements within the Automotive Interior
191
interesting approach. Therefore, in this project RGB LEDs are used that can be adapted continuously during the lifetime of the car. To test whether this is possible and appreciated by customers this project is initiated. Several design stages (ideation, user innovation contest, benchmark on customization with smart phones, integration into the car) were applied for generating a prototype followed by a qualitative and quantitative study. The overall research question is: ‘can adaptable customizable functions create a value for customers?’ and more specific: ‘is color connected to the user being influenced on experienced emotions?’. 1.1 The ideation stage The first design stage consisted of a student workshop identifying a relationship between excitement or positive experiences and customization (n=18 subjects). The purpose was to lead to the core question of customization to be a buying motivation in a time in which mobility solutions tend to change massively e.g. flexible ownership models of cars, individualization and decreasing significance of owning a car as status symbol (Horx, 2011; Winterhoff, Kahner, Ulrich, Sayler, & Wenzel, 2009). The students of various backgrounds doing their internship at BMW were subdivided in teams of 3 to 4 in order to play different games in randomized order. The excitement of games in which the participants needed to be on their own were rated low, whereas the individualizing of an easy brick game like Make ‘n Break by setting own rules proved to be as intense as group experiences like performing a stand-up play with puppets. It seems that customization of the game where users can make their own rules increased excitement. This was a motivation to continue and the question is what can be customized by users themselves within the car. 1.2 User innovation by crowd sourcing As a next step crowd sourcing applied in the form of a web-based contest (Terwiesch & Ulrich, 2009) was used to generate a user-oriented pool of
Chapter 6 Adaptive Customization - Value creation of adaptive elements within the Automotive Interior
192
ideas for customization of the automotive interior (Bartl, Ernst, & Füller, 2004; Ernst & Gulati, 2003; J. Fueller & Hienerth, 2004; J. e. a. Fueller, 2005; Füller, Matzler, & Hoppe, 2008; McAlexander, Schouten, & Koenig, 2002; Sawhney, Verona, & Prandelli, 2005; Wiegandt, 2009). Via platforms, posters, advertising, and social media (e.g. Facebook) participants were invited to submit functions or designs allowing an enhanced degree of customization compared to current cars. With the incentives of prizes (first prize was a visit to BMW, combining extrinsic with intrinsic motivation (Walter & Back, 2011)) the competition resulted in a broad variety of 740 ideas for customization of the automotive interior. The contest members were 1075 participants who evaluated the ideas by choosing “I like this idea” or “I would use this idea” (illustrated by thumbs up/down). Simultaneously, an evaluation group of experts within BMW selected ideas (Riedl, Blohm, Leimeister, & Krcmar, 2010). The best ideas out of both pre-selections were sent to a jury of external and BMW experts. They evaluated the ideas and selected the winners. The winning idea “color matching camera and lighting” was intended to sense the color of the clothing of the driver and adapt the interior color of lighted panels to the clothing color. This idea was taken as an inspiration for the mock-up and transferred to a design of adaptable lighting elements. 1.3 Benchmark on customization with smart phones To check if this idea has a change of acceptance, the need for customization was also investigated among other products like the iPhone. Qualitative interviews with seven iPhone users on applying different mobile covers or sleeves in bright colors, materials and equipped with different functions were studied. Two main characteristics of customization could be identified in how the product is affected in order to adapt it to a person: aesthetic customization and functional customization. Aesthetic customization is represented by material (silk bag, leather sleeve and silicone cover), texture (croc, form of a chocolate bar, a cassette player) and color (gold, green, brown etc.), functional customization by added functions like charging,

Chapter 6 Adaptive Customization - Value creation of adaptive elements within the Automotive Interior
193
protection cover and antenna amplification. The consumers were willing to pay for this aesthetic customization from 8-20 Euros and 16-80 Euros for the functional customization. This means customization related to color is already used among other products supporting the vision that the new idea of adaptive interior lighting has potential. 1.4 Integration in the car: building the mock-up The experience of the adaptive interior lighting was created by mounting a camera in the car in the inside mirror serving as the color sensor. The camera was programmed to detect the colors of the clothing in the area of the right shoulder. According to this data input the color of the LEDs were manipulated. Openings (dot shape) were made in the dashboard and door trims. Behind these openings RGB LEDS were mounted able to change color (see Fig. 32). Additionally, the LEDs could receive the signal from an App via WLAN to change or blend colors by the usage of an iPad (see Fig. 33).
Fig. 32 Adaptive interior lighting mounted in the dashboard (left picture), red lighting of dashboard and door trims adapted to red shirt of driver detected by camera. It is interesting to position this interaction of the driver with the adaptive interior lighting into a broader scientific perspective to add to the understanding of human preferences. This is done by using Human-Machine- Interaction models (Bubb, 2008; Schlick, Bruder, & Luczak, 2010). Lessons could be learned on the adaption of subsystems to the driver’s skills,

Chapter 6 Adaptive Customization - Value creation of adaptive elements within the Automotive Interior
194
psychological and physical restrictions of information processes e.g. through Cognitive Engineering (Rasmussen, Pejtersen, & Goodstein, 1994). As both models consist of valuable information, but neither one serves as the right approach for this study, a combination might be useful. Schlick’s model represents the inner information processing of humans in relation to the respective stimulus, whereas Bubb’s model describes the effect of environmental impact on human, machine and the information flow between. Both aspects were used and transferred into an adequate model for studying customization systems for the automotive interior (cf. Fig. 34) analogous to Bubb’s model in a closed loop with a special focus on the consumer trend “simplify” i.e. the customer’s expectation of a simple and intuitive access to a technological system (Lemmer, 2005; Winterhoff et al., 2009). The model in Fig. 34 has a machine and a human side. In case of using the App, the system information is taken (information output on the App) and there is a reception in the human, then the human detects and decodes and an action follows.
Fig. 33 The color choice by Appsteering. For the design of an adaptable interior lighting the resulting research questions regarding their character of customization are: Do users prefer an automatic adjustment or a conscious choice by an App? What effect can be identified of the subject’s expectations on their emotional arousal before and after the test?

Chapter 6 Adaptive Customization - Value creation of adaptive elements within the Automotive Interior
195
2 Method A study with 70 subjects was performed to answer the research questions whether the conscious color choice or the automatic color adaption were preferred, and to identify differences between those two interaction processes between human and machine (cf. Fig. 34). Regarding the inner processes happening within a human, the camera-based adaption is representing an interaction with no detection or decision. So, the system automatically detects the color of the subject’s clothes and decides which color should be displayed by the LEDs. The App allows the subjects to decide on the interior lighting color.
Fig. 34 Conceptual Model of Human-Machine-Interaction based on the model of Schlick et al. (Schlick et al.) and the lecture notes of Prof. Bubb. According to the Human-Machine model (cf. Fig. 34), the lighting adaptation can be subdivided in an information input part and an information output part. To identify the expectations of the subjects and the resulting interference the researcher questioned these aspects prior to the presentation. First a pretest was conducted with 11 participants (5 females, 6 males) receiving a product presentation, and who afterwards filled out a

Chapter 6 Adaptive Customization - Value creation of adaptive elements within the Automotive Interior
196
questionnaire with a special focus on the emotional added value of customization. The pretest showed it was difficult to catch the subjects’ emotions, also that a lab situation would be more convenient, as lighting conditions outside could vary massively. So, the mock-up was positioned inside with constant lighting conditions. Before and after experiencing the interiors, a guided interview was held with 70 participants. The mean age of the study population varied between 20 and 59 years with a majority of middle-aged subjects, 27 females and 43 male most of them working at BMW (R&D 71.4%, Production 12.9%, Marketing 5.7%). In order to identify the emotional responses of subjects, the emocards (Desmet, Overbeeke, & Tax, 2001) were used along with a bipolar 7-point Likert scale of 2 opposite emotions: aversion-attraction, fear-hope and boredom-joy. The subjects had to rate those 3 emotions before and after the test. All pre-tests indicated that a verbal description of the emotion is necessary in order to prevent misinterpretations. Other items like satisfaction were excluded as subjects lacked understanding of the reason why an interior feature should lead to dissatisfaction, this will be more important associated with comfort ratings or usability than emotional responses. Even in the pretest the subjects prove to have an above average level of consumer innovativeness as well as a high automobile involvement. However, they showed only an average level of a need for customization. This issue was also found in the 70 subjects involved in the complete test (>50% high scores in innovativeness, >70% high scores in automobile involvement, > 20% mediocre to moderate high scores in automotive customization). Established marketing scales were combined with an automotive customization scale which was developed by the researcher through prior experiments to this study. T-tests of the questionnaire items prove to be significant, serving as a profound tool for the study. The marketing scales along with a typical catalogue of buying criteria for a car were tested in a 5-point Likert scale with 1 as lowest score and 5 has highest. For instance, overall quality, reliability and quality of the interior were valued as most important by the sample, whereas variability of the interior, brand image, reputation of the manufacturer, customization and storage capacity were regarded as not important. The first interview part was

Chapter 6 Adaptive Customization - Value creation of adaptive elements within the Automotive Interior
197
questioned before the subjects experienced the feature. It was done to identify their expectations of the word “adaptive lighting”, the frequency of color switching of interior lighting (never 14.3%; once 10%; more than once 22.9%), the most favorite colors and most favorite clothes colors. As the majority of subjects mentioned that they would only change the lighting color of the interior seldom to never, a new approach to operate this color change is a plausible way to lead users to a new customizable and adaptive experience. A comparison of the new steering possibilities with current ones e.g. a switch to change a pre-defined set of colors has to be drawn and rated by the subjects as well as qualitative interview parts regarding the reason for their choice (automatic adaption by camera-input, or blending colors with an iPad App). Other questions were focused on whether this steering option should go further in form of a brainstorming technique. This particular interview part was conducted sitting in the driver’s seat, as the researcher aimed for continuation and similarities in the setting combined with the anticipation of being an actual driver in the car. This scenery should lead to a deeper insight in the authentic user-product interaction. Pre- and post-ratings of emotions were tested with t-tests for paired comparisons (p<.05). The positive scores of the preferences were also tested against the negative scores using Wilcoxon (p<.05) along with a cross-tab analysis to discover relationships with subjects preferring the camera-based adaption of the lighting color and with subjects preferring the App on a CE device e.g. iPad. The impact of expectations was tested with cross-tabs and ANOVA. Additionally, the validity of the Likert scales was checked with correlations and ANOVA with the established emocards. 3 Results The pretest showed that the subjects preferred an adaption of the lighting’s color according to their mood. Even if the most favorite color in general and regarding clothes’ color is blue, the majority preferred the conscious color choice via interfaces like an App on a CE device to the camera-based one.

Chapter 6 Adaptive Customization - Value creation of adaptive elements within the Automotive Interior
198
This trend was investigated further in a guided study with 70 subjects. Again, the color blue proved to be the most favorite color (33.3%) followed by green (14.4%), red (12.6%), black (8.1%) and no preference at all (9.9%); other colors like white, orange, yellow, magenta, purple, cyan and grey were chosen as well, but played only a minor role in the sample. However, the most favorite clothes colors are decisively different with blue (21.4%), black (18.8%), no preference (17.0%), red (13.4%) and white (7.1%) compared to the pretest sample. Here the downwards order of preference changed, as colors like gray and brown are preferred as clothes colors, opposite to their general favorability, followed by orange, green, cyan, magenta and purple. The test with emocards (Desmet et al., 2001) alongside Likert scales showed significant correlations for the scales of aversion-attraction (before=-.514, after =-.440), fear-hope (before=-.565, after =-.438) and boredom-joy (before=-.453, after =-.497) both before and after the test. As the scales are inverse, the correlations are negative. Attraction and hope show significant correlations to almost all emotional responses except for the mood asked before the test by emocard, this might be a result of the forward orientation of the item. The level of joy before the test also correlates intensively with other emotions, after the test joy is not only correlating with the emocard, but also strongly with the level of attraction (.813) and hope (.807). Table 28 The frequency distribution of the EMOCARDs before (a) and after (b) experiencing the feature.
excited neutral
excited pleasant
average pleasant
calm pleasant
calm neutral
calm unpleasant
average unpleasant
excited unpleasant
Before 5.7 11.4 57.1 10 10 0 5.7 0 After 14.3 22.9 45.7 10 1.4 1.4 1.4 2.9
Table 28 shows the results of the emocards before and after experiencing the adaptive lighting system, revealing a general feeling of average pleasantness. According to the Wilcoxon test the 2 samples of emotional responses before and after differ significantly from each other (p = .023 < .05). So, the change in emotional feedback especially the rise of

Chapter 6 Adaptive Customization - Value creation of adaptive elements within the Automotive Interior
199
percentages of the “excited neutral” state and “excited pleasant” state, along with a decrease in negative responses from before the test to after, is significant. Table 29 The frequency distribution of the different emotions elicited before (a) and after (b) experiencing the feature.
negative emotional response
-3 -2 -1 0 1 2 3 positive emotional response
Before aversion 2.9 0 2.9 7.1 17.1 38.8 31.4 attraction After aversion 5.7 5.7 4.3 11.4 35.7 15.7 21.4 attraction
Before fear 2.9
1.4
1.4
14.3
34.3
24.3
21.4
hope
After fear 5.7 2.9 5.7 12.9 25.7 27.1 20 hope
Before boredom 2.9
0 2.9
14.3
30 35.7
14.3 joy
After boredom 5.7 2.9 5.7 12.9 25.7 27.1 20 joy
The positive emotions of attraction, hope and joy have the highest scores (see Table 29). Whereas the level of attraction in the before-after analysis shows a small decrease, the level of hope indicates a small increase. Simultaneously, the rating of joy remained unchanged. The item attraction could be affected by the subjects’ expectations being higher than the actual experience itself. As the Wilcoxon test proved a rather strong significance of p = .001 with the emotion aversion and its counterpart attraction, this change in opinion seems to be an important observation. Consequently, the effects of expectations and the resulting implications upon the subjects’ emotions should be investigated further. Regarding the preferred steering possibility offered by the lighting, the preference was equally divided, 50% preferred the camera and 50% preferred the color blending by an iPad App. Figure 35 shows the results regarding the

Chapter 6 Adaptive Customization - Value creation of adaptive elements within the Automotive Interior
200
question if the chosen operation by camera or App would be worse or better than the common one, i.e. a switch for lighting color changes. Figure 35 shows the frequency distribution of the sample along a 7-point Likert-scale, indicating a preference for the new approaches of operations of the interior lighting. As main reasons for this evaluation the individual choice and independence through an App was mentioned by 35.1% representing the half of the sample preferring the App. The other half favoring the cam-based system indicated the adaptive reaction without the intervention of the driver (17%) or the direct changing with automatic adjustment (16%) as cause for the choice.
Fig. 35 Comparing the new control of light with the current one. The question was, if the new one is worse or better on a 7-point Likert scale. On the question whether the steering of the color should be changed further than App or CAM, the majority of subjects wished a combination of various steering possibilities of the lighting color within the automotive interior, e.g. integration of App in the car as hardware (18.6%), combination of cam and switch (13.3%), combination of cam and App (8.8%), combination of cam and iDrive (4.4%), combination of cam/switch/music (0.9%) and combination of App and voice control (0.9%). But also, new ideas like biometric recognition (15%), camera-based hues changing according to the driving mode (5.3%)
0
5
10
15
20
25
muchworse
2 3 neutral 5 6 muchbetter
Freq
uenc
y [%
]
evaluation of preferred sterring possibility to current switches

Chapter 6 Adaptive Customization - Value creation of adaptive elements within the Automotive Interior
201
and identification of the driver by the key (1.8%) were considered. Interestingly, the CE device applications also influence some subjects to come up with ideas like shooting a picture of today’s clothes and sending it to the car (2.7%). Thus, most subjects are inclined to have functionalities beyond the camera-based system or App. Given the fact that the sample can be equally divided in subjects preferring the camera-based lighting color adaption and those preferring a conscious choice and color blending with an App interface, the differences between those two clusters would be interesting. Therefore, a cross-tab analysis lead to the results summed up by Table 30.

Chapter 6 Adaptive Customization - Value creation of adaptive elements within the Automotive Interior
202
Table 30 Comparison of characteristics between subjects preferring a camera-based adaption of the lighting or a CE-device App.

Chapter 6 Adaptive Customization - Value creation of adaptive elements within the Automotive Interior
203
The camera favoring cluster discloses a strong relationship to the item questioning the level of influence of a human upon a machine or mechanism responsible for the color change (p = .000, Cramer’s V = .605). The increase in automation is appreciated by this particular cluster as various combinations of camera-based lighting and additional functionalities e.g. combination of camera, switch and music choice etc. (p = .000, Cramer’s V =.789). Consequently, also the reasons for favoring the camera as source for the color reflect the automation idea with no intervention of the driver or the inference to clothes representing the mood of its wearer. In contrast, the App cluster favors all App related combinations with additional steering possibilities (p = .000, Cramer’s V = .802) and constitutes the conscious choice and independence from other systems as major reasons (p = .000, Cramer’s V = .837). The influence of expectations on the emotional arousal of the subjects was analyzed by clustering the answers of subjects regarding expected information input forms for the color adaption and potential data output forms. In Figure 36 the data input can be subdivided in environmental causes, human causes and automotive causes with a major emphasis on the first two (cf. Table 30), whereas, the most subjects expect a change in the lighting in form of color and intensity or have no expectations at all.

Chapter 6 Adaptive Customization - Value creation of adaptive elements within the Automotive Interior
204
Fig. 36 Clusters of expectations of adaptive lighting regarding various forms of information input and information output.

Chapter 6 Adaptive Customization - Value creation of adaptive elements within the Automotive Interior
205
Table 31 Frequency distribution of expectations of data input and data output (downwards order).
A cross-tab analysis showed a rather strong significant relationship between the expectations and the item “joy” (p = .000, Cramer’s V= .606). Boredom, representing the negative counterpart of enjoyment in this study, was the emotion that the subjects felt regarding motion, situation, temperature, and the driver’s attention as data input. On the other hand, subjects with no expectation at all, or expecting an adaptation following the daytime, external lighting conditions, the interior, season, the driver’s wishes, music, or the driving mode showed enjoyment of such an adaptive lighting concept. The emotional arousal of attraction and hope, questioned after the test, also proved to be significant in relation to various forms of data input (attraction: p = .002, Cramer’s V = .517, hope: p = .001, Cramer’s V = .527). The negative
data inputexternal lighting conditions (i.e. weather, bright, dusk, dark)
22.2% data output intensity 22.1%
driver's mood e.g. anger 18.8% color 21.1%
driver's wishes 11.1% no expectation 20.0%no expectation 7.7% flexible locations 8.4%situation (i.e. driver operates, focuses on driving, dangerous situations)
6.8% added value (wellbeing) 7.4%
driving style/ car condition (i.e. acceleration, driving)
6.8% defined set of chosen colors
6.3%
driving mode (sports, comfort, eco) 5.1% no need 5.3%
music 3.4% controls 3.2%driver's attention e.g. fatigue 3.4% welcome-scenario 2.1%
no need 3.4% lighting orchestration 1.1%interior 2.6% surprise 1.1%
motion 2.6%information/ communication 1.1%
daytime (i.e. worktime, morning, leisure, evening)
2.6% pulsating 1.1%
season 1.7%temperature 1.7%

Chapter 6 Adaptive Customization - Value creation of adaptive elements within the Automotive Interior
206
counterpart of attraction i.e. aversion tends to be felt by subjects expecting no need for such an adaptive lighting, or the driving mode, external lighting conditions, seasonal changes, or the daytime as optional data input sources. Subjects with a neutral emotional state have possible expectations as external lighting conditions, or motion. Interestingly a change of the lighting according to the season evokes both aversion and attraction by the subjects. The driver’s wishes, daytime, and season are also not distinctive in relation to the subjects’ emotions from fear to hope. Fear is implied by subjects expecting no need for having this system and having no expectation at all. Hopeful subjects tend to expect an adjustment according to the driver’s attention, situation, temperature, interior, music, driving style, or season. If the lighting adapts according to the driving mode, the driver’s attention, the mood, or the daytime, the same subjects valued the exterior design as an important car buying criterion (p = .003, Cramer’s V = .533). Also, the purchase argument of having a comfortable car (p = .003, Cramer’s V = .531) is very important, especially when there are no prior expectations. Analogously, the data output indicating average strong significant relationships with the buying criteria roominess (p = .000, Cramer’s V = .595), and interior design (p = .004, Cramer’s V = .508) rated very important, again having no expectations is interfering with the subjects’ evaluation of ideas of potential ways the lighting should change. 4 Discussion and Conclusion Regarding the research question ‘Do users prefer an automatic adjustment or a conscious choice by an App? What effect can be identified of the subject’s expectations on their emotional arousal before and after the test?’ it is clear that half of the study population prefers the App and half prefers the automatic adjustment. If color is connected to the user experiencing emotional arousal, the study could verify a general feeling of average pleasantness as well as an increase in positive, and decrease in negative emotional responses (emocards) compared with the pretest. The Likert

Chapter 6 Adaptive Customization - Value creation of adaptive elements within the Automotive Interior
207
scales offered a deeper insight in this general emotional feedback. Whereas the level of joy remained unchanged, there was a little increase in the level of hope and a little decrease in attraction after the feature presentation indicating that expectations could have a biasing effect on the emotional experience of the subjects. This effect was investigated further by an analysis and clustering of the answers to the qualitative question concerning expectations of the word “adaptive lighting” prior to the feature presentation. According to the HMI model (cf. Fig. 34) the information input for the color adaption could be subdivided in environmental, human, and automotive causes, whereas the information output is concentrated upon the function itself; in this case the general characteristics of RGB LEDs like changing color or intensity, but also flexible locations and even an added value like wellbeing were expected. The subjects expecting no need for any adaptive lighting, tended to show aversion and fear of the feature. Surprisingly, having no prior expectations of the systems proved to be a crucial reason for enjoyment as emotional response along with other expectations (adaption to daytime or external lighting conditions, adaption to the interior, season, the driver’s wishes or music). But convenient input forms as motion, temperature, attention or the situation known from other features or systems were regarded as boring. The appreciation of either a steering of the lighting color by an App or a camera of 58.6% compared to 24.4% preferring the common steering by a switch, proved a general trend to new ways of interaction. The main difference is the location of decision making which is internalized in the user by the conscious color choice by an App and externalized by the camera. In this study 50% preferred the App and 50% preferred the camera-based solution. Even if both steering possibilities offer advantages as the conscious choice and control over the color (Appelhans & Luecken) to the automation of color changing without the intervention of the driver (camera), functionalities beyond these were pursued. As a result, users are searching for new and surprising interactions with a machine especially in terms of emotional features like lighting.

Chapter 6 Adaptive Customization - Value creation of adaptive elements within the Automotive Interior
208
The general pursues of added value, expected by 7.4% of the subjects, is proven by relationships between characteristic App and camera reasons, as well as a strong tendency for color changes happening once (28.6%), or more frequent (57.2%). For those subjects expecting an added value at the same time valued roominess and interior design as very important. Even in the iPhone study the aesthetic (material, texture, color), and functional customization (charging, protection and antenna amplification) provided additional value. Although the mock-up of the color changing system reached a high level of integration, the brand attribution was hindering associations to other brands and therefore limited the openness of the brainstorming part of the survey. The homogeneity of the sample (mostly engineers, male, aged 20 to 59) would need to be compared to actual buyers with an extraordinary need for customization to draw conclusions, especially a focus group of customers regarding the car as an expression of themselves and as an extension of office and living room, so-called Sensation Seeker (Winterhoff et al., 2009). Other direct measurement techniques for emotional feedback would be important to consider as well in future research like, Facereader (Benta et al., 2009; Melder et al., 2007; Van Kuilenburg, Wiering, & Den Uyl), EEG (Oude Bos, 2006) and heart rate by ECG measures (Appelhans & Luecken, 2006) in order to get data which is not filtered through perception, cognitive processes and interpretation of emotional illustrations and scales. To conclude neither automobile involvement nor consumer innovativeness were low in this study, the need for customization however was only average, indicating that the marketing scales show no relations to customization per se.

Chapter 6 Adaptive Customization - Value creation of adaptive elements within the Automotive Interior
209
REFERENCES Appelhans, B. M., & Luecken, L. J. (2006). Heart rate variability as an index
of regulated emotional responding. Review of general psychology, 10(3), 229.
Bartl, M., Ernst, H., & Füller, J. (2004). Community Based Innovation—eine Methode zur Einbindung von Online Communities in den Innovationsprozess. In Produktentwicklung mit virtuellen Communities (pp. 141-167): Springer.
Benta, K., Van Kuilenburg, H., Eligio, U., Den Uyl, M., Cremene, M., Hoszu, A., & Cret, O. (2009). Evaluation of a system for real time valence assessment of spontaneous facial expressions. Distributed Environments Adaptability, Semantics and Security Issues. Paper presented at the International Romanian--French Workshop.
Bubb, H. (2008). Produktergonomie. Retrieved from München: Desmet, P., Overbeeke, K., & Tax, S. (2001). Designing products with added
emotional value: Development and appllcation of an approach for research through design. The design journal, 4(1), 32-47.
Donath, A. (2013). Hue-Leuchtschlangen von Philips. Retrieved from the golem.de website: http://www.golem.de/news/smartphone-steuerung-hue-leuchtschlangen-von-philips-1308-100822.html
Ernst, H., & Gulati, R. (2003). Virtual Customer Integration–Bringing the Customer back into the Organisation. Paper presented at the Working Paper.
Fueller, J., & Hienerth, C. (2004). Online Consumer Groups as Co-Innovators–Virtual Integration of Community Members into New Product Development. Paper presented at the European Business Forum.
Fueller, J. e. a. (2005). How to Integrate Members of Virtual Communities into New Product Development. Electronic Commerce Research Journal, 6(1), 57-73.
Füller, J., Matzler, K., & Hoppe, M. (2008). Brand Community Members as a Source of Innovation. Journal of Product Innovation Management, 25(6), 608-619. doi:10.1111/j.1540-5885.2008.00325.x
Chapter 6 Adaptive Customization - Value creation of adaptive elements within the Automotive Interior
210
Futschik, H. D. (2011). Design. In H. Braess & U. Seiffert (Eds.), Handbuch Kraftfahrzeugtechnik. Springer Wiesbaden: Vieweg + Teubner publishing.
Horx, M. (2011). Das Megatrend-Prinzip: wie die Welt von morgen entsteht: DVA.
Klaß, C. (2005). Photonische Textilien - Sofa als Display. Retrieved from the golem.de website: http://www.golem.de/0509/40192.html
Lachmayer, R. (2011). Beleuchtung. In H. Braess & U. Seiffert (Eds.), Handbuch Kraftfahrzeugtechnik. Springer Wiesbaden: Vieweg + Teubner publishing.
Lemmer, K. (2005). Mensch-Maschine-Interaktion. Vieweg Handbuch Kraftfahrzeugtechnik, 656-661.
McAlexander, J. H., Schouten, J. W., & Koenig, H. F. (2002). Building brand community. Journal of marketing, 66(1), 38-54.
Melder, W. A., Truong, K. P., Uyl, M. D., Van Leeuwen, D. A., Neerincx, M. A., Loos, L. R., & Plum, B. (2007). Affective multimodal mirror: sensing and eliciting laughter. Paper presented at the Proceedings of the international workshop on Human-centered multimedia.
Oude Bos, D. (2006). EEG-based emotion recognition-The Influence of Visual and Auditory Stimuli. Capita Selecta (MSc course).
Rasmussen, J., Pejtersen, A. M., & Goodstein, L. P. (1994). Cognitive systems engineering.
Riedl, C., Blohm, I., Leimeister, J. M., & Krcmar, H. (2010). Rating scales for collective intelligence in innovation communities: Why quick and easy decision making does not get it right.
Sawhney, M., Verona, G., & Prandelli, E. (2005). Collaborating to create: The Internet as a platform for customer engagement in product innovation. Journal of interactive marketing, 19(4), 4-17.
Schlick, C. M., Bruder, R., & Luczak, H. (2010). Arbeitswissenschaft: Springer-Verlag.
So, J. C., & Chan, A. H. (2009). Design Factors of LED Display for Improving Message Comprehension. Paper presented at the Proceedings of 17th World Congress on Ergonomics.

Chapter 6 Adaptive Customization - Value creation of adaptive elements within the Automotive Interior
211
Terwiesch, C., & Ulrich, K. T. (2009). Innovation tournaments: Creating and selecting exceptional opportunities: Harvard Business Press.
Van Kuilenburg, H., Wiering, M., & Den Uyl, M. (2005). A model based method for automatic facial expression recognition. Paper presented at the Proceedings of the 16th European Conference on Machine Learning (ECML'05).
Wiegandt, P. (2009). Value Creation of Firm-Established Brand Communities. In: Springer.
Winterhoff, M., Kahner, C., Ulrich, D. C., Sayler, P., & Wenzel, E. (2009). Future of Mobility 2020 – the Automotive Industry in Upheaval? Retrieved from

212
Part IV Epilogue

Chapter 7 Value Creation by Automotive Customization of Car Interiors
213
Chapter 7 Value Creation by Automotive
Customization of Car Interiors
Previous chapters show that it is possible to customize mobility solutions. Aside from the main purpose of a product or a mobility solution (i.e. transport), users are able to benefit from customization due to a connection with wellbeing (chapter 2). The objective of this PhD thesis was to investigate, if value creation can be achieved by user involvement in the product design process of more personalized and adaptable interiors. By translating the knowledge about customization into more personalized and adaptable car interiors, a premium experience of shared mobility could be created. Additionally, it could contribute to design a car that adjusts to life changes or to various owners. In Fig. 37, a summary of the findings is described. Three types of owners are distinguished: the 1st owner who has the entire influence on particular characteristics of a car, the 2nd owner who has to accept the car as it is and car sharing customers (i.e. multiple owners) who also have to accept the current conditions and characteristics of the car (hard customization). For the last two groups of users and customers, innovations that allow some form of customization (soft customization) are studied in this PhD thesis. Chapter 3 describes a customization toolkit for automotive interiors, which enables users to change the colors and patterns of the interior. It is applicable with today’s technologies and a rather static approach. For 2nd owners or car sharing customers, this is less applicable. Chapter 4-6, which study the application of 3-D printing, flow and adaptive colors for customization, identify a distinct use for 2nd owners and car sharing customers. The pictures on the left-hand side of Fig. 37 show two interiors of a Rolls Royce as an example of high-class customization for the first customer (i.e. an example of hard customization). The other two pictures below are examples of colored interiors of chapter 3, which can be chosen before buying a car (hard customization). On the right-hand side of Fig. 37, the adaptable customization approaches are shown that are focused on 2nd

Chapter 7 Value Creation by Automotive Customization of Car Interiors
214
owners or car sharing customers. After the initial purchase or during rental periods, customization of car interiors is possible: (1) by 3D-printing in order to personalize the setting of the interior (chapter 4), (2) by having the engine adapted to the driving style (sporty or comfort oriented) to personalize the driving characteristics of a car (chapter 5), and (3) by adapting color of interior lighting during use (chapter 6). With these findings, the level of customization can be defined by the customer’s individuality. It is possible only choose adaptive lighting, or add only 3D printed compartments, or only enjoy the adaptive driving modes, or have various combinations. This PhD contributes to the discussion, whether customization is possible for 2nd owners or car sharing customers. There are clear indications of this possibility and of user acceptance, and appreciation. For instance, indirect measurement techniques such as PrEmo and emocards (Desmet, Overbeeke, & Tax, 2001) showed positive emotional feedback.
Fig. 37 The idea of Automotive Customization: The degree of customization (Y-axis) varies pre-defined attributes of aesthetics and function from low-level to high-level customized products, such as unique tailored products (e.g. Rolls-Royce interiors) or creating an interior design by a pre-set color palette (chapter 3) to a mediocre level for design ideas, such as flexible storage compartments (chapter 4), or smart customization (chapter 5 and 6) for multiple users.

Chapter 7 Value Creation by Automotive Customization of Car Interiors
215
In the next paragraph the main findings are described according to their novelty value. A selection of aspects of value creation through personalization is made as a result of a web-based interior idea contest of 1075 participants. Due to the majority of young participants, representatives of the Generation Y, the specific designs and concepts of customization were tested later on with a more heterogenous group in order to identify underlying guidelines for personalized interior car designs. Chapter 3 investigated color preferences of car interiors for initial buyers. By customizing an interior by colors or patterns, this interior becomes unique. The literature shows that black is determined as the most favorite clothes’ color (Bakker, van der Voordt, de Boon, & Vink, 2013). In the study of chapter 3, black is mentioned frequently among the top, but also among the worst designs (see Table 5 in chapter 3). After black, gray is appreciated most as interior color, but when it comes to an intention to buy an interior, brown and beige are commonly mentioned as buying arguments for interior car designs. There is a difference in just liking a design, to uttering a potential purchase (Pöyry, Parvinen, & Malmivaara, 2013). This shows, that there is a large difference in taste, and it also shows that customization (i.e. having the possibility to choose) is needed. An optimal emotional fit of products influences the willingness to purchase customizable features, which represents an important threshold for pleasure of owning and using a product (Desmet et al., 2001; Holbrook, 1986), and hence the market success of automotive customization in car interiors. Though, the product portfolio for personalized cars has to consider an adequate number of characteristics, such as color, texture, and patterns. The value creation of visual customization is developed by the creation of unique products by this set of characteristics. Chapter 4 studied, whether customers would use 3D printed storage compartments. The car interior is influenced by the storage habits of its users, i.e. the driver and passengers in various situations. Therefore, user and context (commuting, leisure, vacation, and special occasions), decide upon

Chapter 7 Value Creation by Automotive Customization of Car Interiors
216
generic belongings and their storage location in the car, which are both important elements of the subsequent design for functional customization. Users store all valuables (such as CE devices, wallets, handbags) within their primary reach and sight. Users also tend to use any possible storage possibility (such as floors, cupholders for Smartphones or vacant seats). There are however limitations in storage spaces in case the objects could hinder the driver performance or collide with airbag expansion areas. Users also expect storage compartments to offer functionalities beyond storing, for instance, the ability to charge, or a data connection for CE devices. Those characteristics need to be considered in designing flexible storage solutions for car interiors. Emerging manufacturing techniques like Rapid Manufacturing offer the possibility for highly customized, and unique products, and are useful for this type of customization (i.e. passive customization). Positive emotional feedback of users supports the willingness to purchase functional customization. Chapter 5 provides a user-centered design of adaptive functions of the car regarding its agility and driving style. The automatic adjustment of the car’s setting (driving mode) due to the detection of the intended driving style of the subjects was preferred to the manual adjustments (i.e. a representation of active customization). Additionally, the feeling of safety increased, while the level of distraction decreased. The findings show that there is also an increase in driving fun measured by the flow experience and the feeling of safety. For 2nd owners or car sharing customers, this means another form of smart and continuous customization is possible during a car’s use. In chapter 6, the adaptive customization is tested by lighting colors that vary automatically either by a camera measuring the clothes’ colors, or by blending the colors with an App of a CE device (i.e. active customization). Half of the 70 participants in the test preferred the color mixing by the App, and half the automatic color adaptation. This indicates, that there is a large difference in taste, and that customization (i.e. having the possibility to choose) is needed.

Chapter 7 Value Creation by Automotive Customization of Car Interiors
217
In chapter 1 the HMI model of customization was introduced. After the case studies (chapters 3-6), the usefulness of this model can be reflected based on the four chapters in which aspects are to be found. The suggested HMI Model for customization allowed further analysis of motivational processes influencing decisions such as the color preferences of car interiors (chapter 3), or the involvement of users in the design process (chapter 4, 5 and 6). An intuitive access to either a toolkit for customization (chapter 3 and 4), or a system detecting the intended driving style (chapter 5) or adapting interior lighting (chapter 6) could be of importance for the pleasure of using it. This intuitive access is also a relevant aspect of the value creation of personalized cars. In chapter 3, the user’s visual perception of the HMI model describes the information reception and first impression of a product (Vink, Overbeeke, & Desmet, 2005). Functional customization, on the other hand, enables the user to choose, specify, or omit functions of a product (Bauer, Düll, & Jeffery, 2009), and hence is more long-term oriented. Functional customization of car interiors is more long-term focused but has to fulfill the user’s expectation of quality and comfort. The survey on Smartphone users (cf. Fig. 4) indicated a different price sensitivity of functional and aesthetic customization. The subjects were willing to spend more on functional than aesthetic customization (Bauer et al., 2009). In case of adaptable customization, the design ideas focus on the interaction between human and machine, i.e. user and adaptable system. In the HMI model, the main emphasis is laid upon continuous adaption. The control design can differ. Thus, either the adaptation happens by internalization, e.g. in case of interior lighting a color blending App (i.e. passive customization), or by externalization of a choice process such as the automatic adjustment of the lighting color by camera detection of the users’ clothes (i.e. active customization). Regarding designs of adaptive customization (chapter 5 and 6), the HMI model describes the continuous individualization of the product. Whereas there are various ways for users to interact with individualizable systems via switches or Apps by a conscious choice of the user, autonomous interaction systems externalize relevant inner-human decision processes of the HMI model for customization. Hence, information reception, and detection by sensor data (e.g. camera or
Chapter 7 Value Creation by Automotive Customization of Car Interiors
218
position of gas pedal complemented by navigation data) lead the decision system to set the characteristics (such as color or driving style) accordingly. By reducing these secondary tasks to a more autonomous and adaptive approach, the driver is able to concentrate better and feeling safer. Environmental factors like traffic, lighting, seasons, or weather influence the driver, any less distraction relieves stress for drivers and improves the user-product interaction which creates value for users beyond the personalization itself. An important outcome of the studies of chapter 5 and 6 is the support of autonomous designs for the performance of drivers. Furthermore, the users’ wishes for adjustment should be considered like the car input such as the driving style, interior design, motion, or music. Users with positive emotional responses, and a design interest are important due to their interest, and motivation for innovative products to provide designers with an insight in the HMI model for customization. In conclusion, the HMI model for customization is a useful technique to measure the user’s motivation for personalizing a car, whereas an intuitive access during individualization is a determining design aspect for customized mobility solutions.

Chapter 8 Reflections on methodology and design concepts
219
Chapter 8 Reflections on methodology and design
concepts
In this PhD thesis, different methods were applied, such as user studies and questionnaires. The use of this methodology and using mock-ups has advantages and disadvantages, which is reflected upon in this paragraph. Established marketing scales such as innovativeness and automobile customization were used. Those were supplemented by a customization scale that was developed for this thesis in order to identify underlying motivations for customization. A relationship between wellbeing and customization is found (chapter 2), design disciplines like positive design are assumed to influence customization (Desmet & Pohlmeyer, 2013). So, emotional responses were recorded for functional and adaptive customization in lab situations (chapter 4 and 6), and a field study (chapter 5), that provided a useful insight in automotive customization. Although, the customization scale tested for traits encouraging customization, product enthusiasm, and process interest, the emotional feedback showed another reason. For instance, positive emotional arousal was identified among the case studies, which is considered crucial for a buying decision (chapter 4 and 6). Other further investigations of the relationship between wellbeing and customization by research techniques like Hassenzahl’s user experience narrations could be useful (Hassenzahl et al., 2013). Instead, the mediating effect of affective and cognitive responses to design (Bloch, 1995; Tian, Bearden, & Hunter, 2001) were studied by indirect measurement techniques such as PrEmo and emocards. Direct measurement of affections such as monitoring changes in the autonomic nervous system by EEG (Oude Bos, 2006), brain wave, and heart rate by ECG (Appelhans & Luecken, 2006) could be an important complement to the indirect measurement techniques used in this PhD (PrEmo and emocards). A major advantage of those methods is, that emotional responses are not filtered through the subject’s perception, cognitive processes, and interpretations. Any illustration of an emotion might bias the results by the subjects’ own interpretation. Rather new technologies
Chapter 8 Reflections on methodology and design concepts
220
such as Facereader (Benta et al., 2009; Melder et al., 2007; Van Kuilenburg, Wiering, & Den Uyl) could be also a method for recording emotional feedback by facial expressions without having to verbalize emotions. An application of this technique was considered and assumed to be appropriate for lab test environments. However, a required amount of lighting, stabile light conditions, and a steady posture of the subjects are necessary for the system in order to correctly detect the facial expressions, which was neither suitable for the interrogation inside the car interiors, nor the field study. An approach for future studies would be the integration of direct measurement supplementing indirect measurement in order to detect subtle and diverse emotions. All studies investigated different product designs for either aesthetic (chapter 3), functional (chapter 4) and adaptive automotive customization (chapter 5 and 6). Interferences with the designs needed to be excluded from the studies. However, even if customization toolkits and product configurators are applied for color customization of car interiors (chapter 3), external conditions are neglected such as lighting, seasons, or influences by the object’s shape, or upholstery. Despite advanced visualization and simulation techniques, showrooms of dealerships, or color palettes facilitate users in their decision-making process. The designs for flexible storage (chapter 4), and the changing interior lighting (chapter 6) were mounted in an actual car interior with a high level of integration and investigated in lab situations. Therefore, subjects were enabled to anticipate actual use case scenarios with both function and aesthetic/ adaptive automotive customization. However, a brand attribution could not be excluded, as well as the homogeneity of the sample (mostly engineers, male, aging 20 to 59). For further research, a comparison of the findings of the case studies to car buyers or lead users like Sensation Seekers might be useful. The quality of the prototypes might also interfere with the results. For instance, the flexible storage compartments had pre-defined design, appearance, and touch (glass-fiber reinforced black plastic complemented by selective laser sintering prototype parts) to indicate the

Chapter 8 Reflections on methodology and design concepts
221
variety of possibilities through Rapid Manufacturing and functional customization. Also, the RGB LEDs were mounted behind the trims in dashboard and doors, but with a very provocative design for a BMW interior (dots instead of light guides or indirect lighting). As human vision can be biased by lighting conditions, a field test might be useful despite the rather uncontrollable conditions. The drawbacks of the product design for the driving style adjustments were excluded incrementally during the development of this function. The noticeability of changes of the car (rev count, lighting, display information) should be balanced and not interfere with the driver’s attention and concentration. In the study, any further visibility of the driving mode changes would provoke unintended user behavior such as aggressive driving styles to induce mode changes comparable to gaming situations. Therefore, engineers or designers need to consider the purpose of aesthetic, functional and adaptive automotive customization due to their possible impact upon human behavior. The choice of the research methods, techniques and prototypes was conclusive with the selection of value creation through customization.

Chapter 9 Reflections on the thesis, recommendations for Future Research, and concluding thoughts
222
Chapter 9 Reflections on the thesis,
recommendations for Future Research, and concluding thoughts
This PhD thesis investigates one example of customization using the internet for the 1st buyer and three examples of customization valuable for 2nd buyers or shared owners. Additionally, the need for customization is identified by this thesis. For instance, half of the population appreciated the App interior color adaptation and half the automatic color adaptation influenced by clothing color. Hence, the interior color black is regarded as nice as well as ugly. Designers need to consider user groups of opposing consumer behavior, i.e. those favoring to make a conscious decision and intending to be independent from any electronic system, and those expecting an adaptation to their preferences instantly without any intervention. In the design of autonomous systems, the involvement of the user allows to eliminate irritating reactions of the car’s interior color or driving style in order to meet the user’s expectations and demands. The subsequent action should not interfere negatively with the driver’s concentration or enforce negative behavior in general. Beyond established ways of human-machine interaction, smart combinations are expected by users such as a combination of different sensory perceptions, or biorecognition. Whereas, the output information of adaptive customizable systems can be created by previously set changes in characteristics, the input information can be clustered according to the HMI model for customization in environmental, user and car input data. Environmental input (daytime, external lighting conditions and seasons) are expected to be the most promising for adaptive customizable designs. Further input data the color adaption of the interior lighting, as suggested by the survey participants, might create further wellbeing such as music (Kruithof, Visch, Vink, & Pedgley, 2014), temperature (Veen, 2016), season, and mood (Kruithof et al., 2014).

Chapter 9 Reflections on the thesis, recommendations for Future Research, and concluding thoughts
223
The HMI model of customization discusses four different case studies of aesthetic, functional, and adaptive customization. Though, this model should be investigated further about the differing effects of the longevity of the user-product relationship with actual tests in real-life situations. For instance, the emotional involvement and love of products (Russo, 2010), as well as social and cultural influences might affect automotive customization. And Kamp describes that all excitement of a new product might fade away over time (Kamp, 2012). Further research is needed in how soft and active customization can be improved as it looks as a promising field. Automotive customization should focus on those aspects along with technological advances in emotional diagnostics, interaction, and production principles. Rapid manufacturing (chapter 1) can be considered as a key technology for functional and aesthetic customization. Needless to say, that mobility demands face determining changes through electrification, shared mobility, and autonomous driving (Hannon, McKerracher, Orlandi, & Ramkumar, 2016). The impact of these trends on the future car design cannot be anticipated yet, but personalization can be considered as an important competitive advantage among manufacturers (ADL; Audenhove, Korniichuk, Dauby, & Pourbaix, 2014; Hannon et al., 2016; Winterhoff, Kahner, Ulrich, Sayler, & Wenzel, 2009). Car sharing, in particular, questions the necessity of private ownership of cars; a trend that already started in our daily lives (e.g. consumer electronics market). Chapter 3 shows color preferences, which is applicable now, but has valuable information for the future, as new adaptable textiles are in development. In answering the research question “Is soft and active customization possible in the car interior with today’s technologies for shared mobility and retail markets?”, the answer is yes. Only one working example is needed to answer this question positively. In this PhD, three examples prove, that soft customization could work: functional customization by flexible storage, aesthetic customization by adaptive lighting, and adaptive customization by changing the engine, drivetrain and suspension properties.

Chapter 9 Reflections on the thesis, recommendations for Future Research, and concluding thoughts
224
This PhD shows, that soft customization could be turned into hard customization such as a form of tailored production by using Rapid Manufacturing in combination with standardized interfaces. Besides the examples of passive customization such as flexible storage or the App steering of adaptive lighting which is more common, active customization also represents a promising field of research for shared mobility (i.e. adaptive customization in combination with automation). For instance, new color adaptable textiles or materials might enable the entire interior to change the colors of seat, dashboard, door trims, floor, or roof lining. The experience of automotive customization is represented by the prototype of this PhD project: by the integration of RGB LEDs in car interiors, the user is enabled to adjust the lighting color (chapter 6) and thus to create a customized experience by existing technologies. Smart interaction principles like a camera detecting the clothes’ color of a driver or a car anticipating the intended driving style can increase this experience. This can be realized by algorithms using data input which is also already existing in automotive technology (chapter 5 and 6). Both interaction concepts are functionally variable with repeated adjustments instead of the onetime set customization for the initial owner (Piller, 2001). External influences on that decision such as societal and mobility changes have an impact on the user-product relationship as well. Changing life stages of car owners, retail markets, and car sharing require interiors that offer the possibility to adapt the car to the user continuously comparable to the adaptive driving styles. This PhD also shows that there is a large difference in customer preferences (e.g. black is evaluated as nice and ugly; the half of the subjects prefer the automatic color adaptation, at the same time the other half prefers a manual change), and taste. Due to these diverse ambitions, customization as the possibility to choose is needed in car design.
Chapter 9 Reflections on the thesis, recommendations for Future Research, and concluding thoughts
225
REFERENCES ADL. (2014). The Furture of Urban Mobility 2.0 – Imperatives to shape extended mobility ecosystems of tomorrow. Appelhans, B. M., & Luecken, L. J. (2006). Heart rate variability as an index of regulated emotional responding. Review of general psychology, 10(3), 229. Audenhove, F.-J. V., Korniichuk, O., Dauby, L., & Pourbaix, J. (2014). The Future of urban mobility 2.0: Imperatives to shape extended mobility ecosystems of tomorrow. Retrieved from Bakker, I., van der Voordt, T. J., de Boon, J., & Vink, P. (2013). Red or blue meeting rooms: does it matter? The impact of colour on perceived productivity, social cohesion and wellbeing. Facilities, 31(1/2), 68-83. Bauer, H. H., Düll, A., & Jeffery, D. W. (2009). Typology of Potential Benefits of Mass Customization Offerings for Customers: An Exploratory Study of the Customer Perspective. Research in Mass Customization and Personalization: Strategies and Concepts-Applications and Cases, 161. Benta, K., Van Kuilenburg, H., Eligio, U., Den Uyl, M., Cremene, M., Hoszu, A., & Cret, O. (2009). Evaluation of a system for real time valence assessment of spontaneous facial expressions. Distributed Environments Adaptability, Semantics and Security Issues. Paper presented at the International Romanian--French Workshop. Bloch, P. H. (1995). Seeking the ideal form: Product design and consumer response. The Journal of Marketing, 16-29. Desmet, Overbeeke, & Tax. (2001). Designing products with added emotional value: Development and appllcation of an approach for research through design. The design journal, 4(1), 32-47. Desmet, & Pohlmeyer, A. (2013). Positive design: An introduction to design for subjective well-being. International Journal of Design, 7 (3), 2013. Hannon, E., McKerracher, C., Orlandi, I., & Ramkumar, S. (2016). An integrated perspective on the future of mobility Retrieved from

Chapter 9 Reflections on the thesis, recommendations for Future Research, and concluding thoughts
226
Hassenzahl, M., Eckoldt, K., Diefenbach, S., Laschke, M., Len, E., & Kim, J. (2013). Designing moments of meaning and pleasure. Experience design and happiness. International Journal of Design, 7(3). Holbrook, M. B. (1986). Emotion in the consumption experience: Toward a new model of the human consumer. The role of affect in consumer behavior: Emerging theories and applications, 6(23), 17-52. Kamp, I. (2012). Comfortable car interiors [Dissertation]. Delft University of Technology, The Netherlands. Kruithof, A., Visch, V. T., Vink, P., & Pedgley, O. (2014). Comfort design through music and emotion: Effects of passengers' activities on comfort. In W. K. T. Ahram, & T. Marek (Eds.) (Ed.), Advances in social and organizational factors 2014 proceedings of the 5th international conference on applied human factors and ergonomics (pp. pp. 7603-7611): AHFE. Melder, W. A., Truong, K. P., Uyl, M. D., Van Leeuwen, D. A., Neerincx, M. A., Loos, L. R., & Plum, B. (2007). Affective multimodal mirror: sensing and eliciting laughter. Paper presented at the Proceedings of the international workshop on Human-centered multimedia. Oude Bos, D. (2006). EEG-based emotion recognition-The Influence of Visual and Auditory Stimuli. Capita Selecta (MSc course). Piller, F. (2001). Mass Customization: Ein wettbewerbsstrategisches Konzept im Informationszeitalter (A competitive strategic concept in the information age). In: German University Press, Wiesbaden. Pöyry, E., Parvinen, P., & Malmivaara, T. (2013). Can we get from liking to buying? Behavioral differences in hedonic and utilitarian Facebook usage. Electronic Commerce Research and Applications, 12(4), 224-235. Russo, B. (2010). Shoes, Cars, and Other Love Stories: Investigating The Experience of Love for Products. TU Delft, Delft University of Technology, Tian, K. T., Bearden, W. O., & Hunter, G. L. (2001). Consumers' need for uniqueness: Scale development and validation. Journal of Consumer research, 28(1), 50-66. Van Kuilenburg, H., Wiering, M., & Den Uyl, M. (2005). A model based method for automatic facial expression recognition. Paper presented at the

Chapter 9 Reflections on the thesis, recommendations for Future Research, and concluding thoughts
227
Proceedings of the 16th European Conference on Machine Learning (ECML'05). Veen, S. v. (2016). Driver Vitalization - Investigating Sensory Stimulation to Achieve a Positive Driving Experience. (Doctorate), TU Delft, Vink, P., Overbeeke, C., & Desmet, P. (2005). Comfort experience. Winterhoff, M., Kahner, C., Ulrich, D. C., Sayler, P., & Wenzel, E. (2009). Future of Mobility 2020 – the Automotive Industry in Upheaval? Retrieved from www.adl.com/mobility-2020

Chapter 9 Reflections on the thesis, recommendations for Future Research, and concluding thoughts
228

Summary
229
Summary Designing a car means considering the wishes of buyers and users. However, much is changing among users and buyers asking for another way of looking at customization in car design, which is the topic of this PhD thesis. Societal developments such as Downageing and Family 2.0, information and communication technology, and car sharing influence the future customer demands. Also, buyers change as we see now for instance Silver Drivers and Sensation Seekers. Also, mobility demands are changing caused by changing lifestyles and requests of users. For instance, users search for an integrated mobility offer especially in combination with shared mobility concepts consisting of various modes of transport (bike, car, public transport, airplanes, etc.) which are supported by CE devices. For instance, users can order tickets for public transport or airplanes, and locate, and reserve the closest shared bike or car by smartphone. A new way of user involvement is needed in car design, and this PhD thesis studies, if value can be created by user involvement in the product development process, and if this knowledge can be translated into more personalized, and adaptable cars to create a premium experience for shared mobility and retail markets. In four case studies (chapters 3, 4, 5, and 6), tailored designs enable the car to adapt to different users (of use for car sharing, 2nd owners) or life stages (like Family 2.0, Silver Drivers, and Sensation Seekers). This automotive customization is distinguished in aesthetic, i.e. visual (chapter 3), functional (chapter 4), and adaptable customization (chapter 5 and 6), which enables a continuous customization. Emerging technologies like Rapid Manufacturing offer new opportunities for customization such as turning soft (customization of R&D, design, and sales) to hard customization (tailored production). Chapter 4 investigates this field by standardized interfaces and individualizable storage features. Chapter 3 and chapter 4 describe cases of passive customization, in which the user adapts the product. Chapter 5 and 6 illustrate examples of active customization, so the car adjusts to the user’s

Summary
230
preferences either focused on the driving characteristics (sporty, comfort, or normal) or on the interior lighting. A model is developed for this thesis to have a supportive framework. The human-machine interaction (HMI) Model of Customization (cf. Fig. 7) which is developed is based on Schlick’s and Bubb’s models. The model contains three core elements: the customer, the customization process, i.e. based on the user-product interaction which is fundamental for customization toolkits, and the customized product as the outcome of the personalization. Chapter 2 introduces a scale for automotive customization, that incorporates those three aspects. The scales are based on available methods in the literature. An online survey with a crowd sourcing platform, focusing on representatives of the Generation Y, investigates the need for customization as a possibility to enforce automobile involvement. However, a relationship between wellbeing and customization could be found. In this way, the result of a prior study, that indicated a connection between wellbeing and customization, could be affirmed. It appeared, that the customer and the customized product (cf. Fig. 7) were of interest for customization because of their relevance for wellbeing. Customizable product designs preferably have a toolkit for customization along with a set of basic and emotional product characteristics that might influence the buying behavior of customers. For instance, buying motives for cars such as quality, safety, reputation, design, and sensory perceptions like touch are basic product characteristics that users expect, and thus are relevant (cf. chapter 2). However, the focus in this PhD thesis is wellbeing by using a toolkit for customization. Color as a typical product characteristic among form and shape for customization toolkits is studied in chapter 3. In this PhD thesis a study was conducted on car interior designs that were evaluated by a crowdsourcing platform in which 204 participants could color different parts of the interior, which resulted in 1265 configured designs. These designs were analyzed and again sent to the group to evaluate these. The preferred patterns of color in car interiors were: visual lightweight design (i.e. shown by subdividing large components like the seat by using different hues, saturation, or pattern), modest use of colors and pattern variety, repetition, and framing of the

Summary
231
interior (i.e. shown by large-scaled components like floor carpet or roof lining, which are colored in lighter hues than smaller components) to create a feeling of spaciousness. While black is independent from user preference, the most appreciated designs used brown and beige. The need for uncommon colors exists, but is a niche market (e.g. seats colored either red, green, blue, or yellow). Culturally imprinted favors influence color preferences as well. For instance, the materials of different seat parts can be distinguished into plastic and cushion parts with corresponding upholsteries (cloth, artificial leather, leather). In the context of color preferences, a car seat is an analogy for a sofa. Adjoining parts, parts with similar height level or parts with a similar assumed consistency share the same colors (i.e. the principle of repetition). Yet, the car interior cannot be regarded separately, further research is requested to examine the influence of exterior car colors or other external conditions on color, such as bright sunlight or dusk. The outcome of this study is relevant, for instance, for designing web pages where customers can select their car interior colors. Besides customization for the 1st owner of a car like choosing the interior color, retail markets and car sharing pose further challenges to automotive customization, i.e. a continuous change to different users and life stages. The storage habits of users differ according to the situation (commuting, leisure, vacation, and special occasion) and according to the value of personal belongings to the user (chapter 4). For instance, valuables (e.g. smartphones, keys, and wallets) are stored within the user’s primary reach and sight. Even if this leads to “mis”-use floors, cupholders or vacant seats as compartments. An integrated design of standardized interfaces with individualizable features (e.g. smartphone holders) and additional functionalities (e.g. charging, adjustability) creates value to car users. Rapid Manufacturing allows unlimited options in the unique design of those highly customizable features. Yet, the trade-off between the user’s freedom of storage and safety has to be considered, as well as the system’s ease of use and functionalities beyond storing such as charging, data connection, or flexibility. This PhD shows this possibility of 3D printing elements of the car interior like smartphone holder or umbrella holder at home to customize the interior.
Summary
232
Aside of these examples for passive customization, active customization enables the product to adapt to the user which seems a promising research field for car sharing. User-centered research of adaptive customization shows the positive side effects of the automatic, individual adjustments of driving mode characteristics such as the chassis, engine and drive train (chapter 5). The research of this PhD shows that the feeling of safety increased, while the level of distraction decreased, if the designers kept a distinct balance of noticeability of the changed settings. In the design of adaptive systems, the car anticipates the driving style by navigation-based prediction, and subconscious reactions of the user such as his driving style (either sportive or comfortable). The resulting reduction of secondary or tertiary tasks prevent the user from distraction. In chapter 6, adaptive customization was arranged by automated detection (i.e. interior lighting color changes by clothes’ color detection by camera) or by conscious user input (i.e. interior lighting color changes by App) (chapter 6). 35 out of 70 participants preferred the automated adaptation, and 35 preferred the App. This, and a combination of various controls could integrate both opposing user groups while using data input forms corresponding to the HMI model of customization i.e. either human, machine or interaction process. Thus, it is possible to design a car that can adjust to different life stages or multiple users (retail markets, car sharing) to create value for users. The adaptive automotive customization is possible on a functional, and aesthetic level for 1st and 2nd owners, as well as car sharing users. The levels of customization could also vary (low-level customization to high-level customization e.g. make-to-order production for Rolls-Royce interiors). As aesthetic customization focuses on the first appeal and is hence more short-term oriented; functional customization is more long-term oriented. By continuous adaption value can be created beyond personalization for the 1st buyer at the time of buying, but also during use and for other future users. This results from personalization which is possible during the whole lifespan of the car. In this PhD thesis, user studies, questionnaires, lab studies, and a field study delivered the relevant input. Ideally, indirect measurement of emotional

Summary
233
responses should be added, as well as directly measuring the emotion, which is a possibility for further research. The application of the HMI model for customization indicates to be a useful method but should be validated in the longevity of user-product relationships for further research. The research in the PhD thesis shows, that soft customization (when buying a car) can be turned into hard customization with emerging production technologies like Rapid Manufacturing (during the lifespan of a car). And in combining passive customization with active customization, a promising field for design and research in relation to car sharing could be highlighted.

Summary
234
Samenvatting
235
Samenvatting Bij het ontwerpen van een auto moet je rekening houden met de koper en de gebruiker. Maar er verandert veel bij de gebruiker en koper van de auto. Veranderingen in de samenleving zoals ‘family 2.0’ en vergrijzing, delen van auto’s (car sharing) en toename van de invloed van ICT hebben invloed op het autogebruik. Rekening houden met de diversiteit in type gebruiker is hier ook van belang. Zo zijn er bijvoorbeeld de ‘silver drivers’ en de sensatie zoekers. Ook de behoefte in mobiliteit verandert. Er zijn bijvoorbeeld gebruikers die nu zoeken welk transportmiddel het beste is en kiezen uit fiets, auto, openbaar vervoer en vliegtuig en combineren dat. Het is met de huidige ICT al goed mogelijk het beste transportsysteem te bepalen. Eigenlijk vraagt het auto-ontwerpen om een nieuwe manier van het betrekken van eindgebruikers bij het ontwerp om hier op in te spelen en maatwerk te leveren. Iets wat in dit proefschrift wordt bestudeerd. De vraag is of het waarde toevoegt als gebruikers betrokken worden zoals beschreven in dit proefschrift en of het vertaald kan worden in meer gepersonifieerde en maatwerk auto’s. Dit met het doel om een voor de toekomstige gebruiker een prettige ervaring te creëren, die ook geldt voor gedeelde auto’s en tweede hands auto’s.

Samenvatting
236
In dit proefschrift zijn in vier hoofdstukken (hoofdstuk 3,4 5 en 6) maatwerk innovaties in de auto aangebracht, die het mogelijk maken het interieur of de motor tijdens gebruik aan te passen aan de behoefte van de gebruiker. Dit klantspecifiek ontwerpen is opgedeeld in esthetisch (vooral visueel; hoofdstuk 3), functioneel (hoofdstuk 4) en flexibel maatwerk. Dit flexibele maatwerk betekent dat de auto continu aanpasbaar blijft. Nieuwe technologieën zoals 3d printen en motor ontwerp maken het mogelijk om niet alleen maatwerk te leveren in R&D, ontwerpen en verkoop (passief maatwerk), maar ook later kan het interieur of de motor worden aangepast (actief maatwerk). Hoofdstuk 4 behandelt een rails in de auto waaraan 3d geprinten objecten kunnen worden geklikt. Dat kunnen smart phone houders zijn, sleutelbakjes of parapluhouders. In hoofdstuk 3 en 4 worden voorbeelden van passief maatwerk genoemd. In hoofdstuk 5 en 6 staan voorbeelden van actief maatwerk, waarbij de auto zich actief aanpast aan de gebruikerswensen. De motor past zich aan aan het rijgedrag (sportief, comfortable of normaal) of de kleur van het interieur past zich aan aan de kleding van de gebruiker.
Om een ondersteunend kader te hebben is een model gebruikt uit de literatuur en aangepast. Het mensmachineinteractie model (MMI) voor gebruiksgericht ontwerpen is opgezet op basis van de modellen van Schlick en Bubb. Het model bestaat uit drie basiselementen: (1) de gebruiker, (2) het ontwerp proces gebaseerd op de mens-machine interactie en het maatwerk (3) product.

Samenvatting
237
Met behulp van in de literatuur beschikbare schalen zijn deze drie aspecten (gebruiker, proces en product) bestudeerd via een vragenlijstonderzoek onder de generatie Y (mensen die tussen 1980 en 2001 geboren zijn). Hierdoor kon onderzocht worden of er een verband is met de wijze waarop een persoon zich verbonden voelt met een auto. Uit dit onderzoek bleek dat er geen verband was tussen het zich verbonden voelen met een auto en maatwerk. Maar er werd wel een relatie gevonden tussen welbevinden en maatwerk. Er waren al aanwijzingen hiervoor in een voorgaande studie en de studie in dit prefschrift bevestigd dit. Uit de studie onder de generatie Y bleek dat voor het op maat maken van de auto er middelen bijgeleverd moeten worden die maatwerk mogelijk maken en er zijn elementen nodig in de auto die appelleren aan de emotionele waarde, die het koopgedrag beïnvloeden. Daarnaast zijn er basiseisen nodig zoals bijvoorbeeld kwaliteit, veiligheid, reputatie van het merk, ontwerp en sensorische perceptie, zoals aanvoelen van de materialen. Maar de focus in dit proefschrift is het appelleren aan de emotionele waarde via middelen, die maatwerk mogelijk maken.

Samenvatting
238
Hoofdstuk 3 behandelt voorkeuren voor de kleuren van het interieur. Via een internetplatform van meer dan 1000 die meededen aan een wedstrijd om ideeën voor nieuwe interieuren te maken zijn 204 deelnemers gevonden die interieuren konden inkleuren, een typisch voorbeeld van een middel om maatwerk te leveren. Dit leidde tot 1265 interieur ontwerpen. Die zijn weer opnieuw aan de groep voorgelegd om ze te beoordelen. De voorkeur ging uit naar: visueel licht gewicht (dat kan bijvoorbeeld door een groot object, zoals de stoel, op te delen en verschillende kleuren aan de delen te geven), bescheiden gebruik te maken van kleur en patroon variatie, herhaling, versterken van het interieur om ruimte te benadrukken (bv door vloer en daklijn lichtere kleuren te geven dan kleine objecten). De voorkeur voor zwart kwam bij alle gebruiksgroepen voor, maar de meest gewaardeerde kleuren waren bruin en beige. Er bleek ook interesse in ongewone kleuren te zijn, maar dat werd aangegeven door specifieke groepen in de test (een niche markt). Denk hierbij aan stoelen, die of rood, of groen, of blauw or geel waren gekleurd. Wat we gewend zijn van een interieur blijkt ook een invloed op kleurvoorkeur te hebben. Bijvoorbeeld, de achterkant van de stoel is vaak plastic en het zitting deel wordt net als bij een sofa vaak als textiel, leer of kunstleer aangegeven en naast elkaar liggende delen in de stoel krijgen vaak dezelfde kleur. Deze studie heeft toch ook zijn beperking. Alleen het interieur werd getoond en kon ingekleurd worden. Toekomstig onderzoek zou ook de kleur van het exterieur moeten tonen, omdat dat invloed heeft over hoed het interieur wordt ervaren. Ook externe invloed zoals fel zonlicht of schemer zal effect hebben en verdient nader onderzoek. Desalniettemin is de uitkomst van dit onderzoek relevant voor bijvoorbeeld het bouwen van websites waar mensen zelf de kleur kunnen bepalen van het interieur.
Samenvatting
239
Het onderzoek uit hoofdstuk 3 is vooral relevant voor de eerste eigenaar van een auto. Bij ‘car sharing’, overgang naar een andere levensfase of 2e hands auto’s is maatwerk lastiger. In hoofdstuk 4 is hier een oplossing voor onderzocht. Opbergmogelijkheden in de auto zijn afhankelijk van de activiteit. Woonwerk verkeer, vrije tijd en vakantie vragen om andere interieuren en andere opbergmogelijkheden. Maar het hangt ook af van wat een gebruiker heeft aan spullen en waar de gebruiker deze wil hebben. Dit onderzoek toont aan dat mensen de mobiele telefoon, sleutels en portemonnee graag binnen handbereik en in het zicht willen hebben. Zelfs de vloer, bekerhouder of lege stoelen worden hiervoor gebruikt. Voor autoontwerpers is dit een kans omdat deze elementen geindividualiseerd kunnen worden, denk hierbij aan de juiste mobiele telefoon houder en oplaadsystemen. 3d printen biedt hiertoe haast onbeperkte mogelijkheden. Natuurlijk moet nog onderzocht worden of deze vrijheid van opbergsystemen veilig is. Het onderzoek in dit proefschrift laat in ieder geval zien dat het mogelijk is met een speciale rails, waaraan 3d geprinte opbergsystemen geklikt kunnen worden voor de mobiele telefoon, sleutels of paraplu gedurende het hele leven van de auto maatwerk mogelijk is.
Naast het beschreven passieve maatwerk is ook actief maatwerk onderzocht, wat veelbelovend lijkt voor ‘car sharing’. In hoofdstuk 5 is een test gedaan van een auto die zo is ontworpen dat het chassis, de motor en de aandrijflijn zich aanpassen aan het rijgedrag. Hieruit bleek dat het gevoel van veiligheid toenam en de afleiding van het autorijden afnam. Eis was daarbij wel dat de effecten duidelijk merkbaar moeten zijn. De auto paste zich aan op basis van navigatie data (te verwachten wegomstandigheden) en op basis van rijstijl (sportief of comfortabel). De gebruiker moest daardoor ook minder vaak de auto anders instellen wat de concentratie op de rijactiviteiten bevorderde.

Samenvatting
240
In hoofdstuk 6 is passief en actief maatwerk getest, die ook na de eerste koop kan worden aangepast. Hierbij werd de kleur van het interieur aangepast op basis van de kleur van de kleding (actief maatwerk) en de kleur van het interieur kon worden aangepast met een app (passief maatwerk). 35 van de 70 proefpersonen gaven de voorkeur aan handmatig instellen met de app en de andere prefereerden de automatische instelling. Dit toont aan dat een interieur een integratie van beide mogelijkheden moet bieden conform het MMI model, waarin maatwerk ontstaat door combinatie van mens, machine en interactie. Als er verschillende wensen aangaande de interactie zijn, zal het systeem die ruimte moeten bieden.
Dit prefschrift toont aan dat het mogelijk is een auto zo te ontwerpen dat in latere stadia van het gebruik (2e hands of car sharing) er nog steeds een auto op maat gemaakt kan worden. Ontwerpen van een auto op maat is mogelijk op zowel functioneel als esthetisch niveau voor de 1e en 2e eigenaar en ‘car sharing’ deelnemers. Het niveau van maatwerk verschilt natuurlijk (van een laag niveau maatwerk tot een ultiem niveau zoals bijvoorbeeld bij een Rolls Royce). Esthetisch maatwerk richt zich op eerste indruk en is meer korte termijn gericht, functioneel maatwerk merk je pas bij rijden en is meer lange termijn gericht en flexibel maatwerk zorgt ervoor dat tijdens gebruik de auto steeds aangepast kan worden. Door het mogelijk te maken de auto continu te kunnen aanpassen kan meer waarde gecreëerd dan alleen bij eerste aanschaf. Ook na gebruik en door de volgende eigenaars van de auto kan de auto gepersonaliseerd worden.
In dit proefschrift zijn zowel gebruiksonderzoek, vragenlijsten, lab studies en een veld studie gebruikt om tot de resultaten te komen. Idealiter, worden ook metingen van emoties aan het lichaam of gezicht toegevoegd, wat een aanbeveling is voor vervolg onderzoek. Het MMI model lijkt handig te zijn als kader om te gebruiken, maar ook hier is verder onderzoek nodig om te kijken of het in meerdere situaties bruikbaar is.

Samenvatting
241
Het onderzoek in dit proefschrift toont aan dat zacht maatwerk (bij aanschaf van de auto) en hard maatwerk mogelijk is door nieuwe technieken zoals 3d printen (na aanschaf van de auto). Tevens toont dit prefschrift aan dat zowel passieve als actieve aanpassing van het interieur veelbelovend zijn in het ontwerpen van een auto. Vooral flexibel maatwerk is interessant, omdat de auto steeds kan worden aangepast, wat van belang is in bijvoorbeeld ‘car sharing’.

Samenvatting
242

About the author
243
About the authorAlexa Wagner (born in Mannheim 1981) was working for the BMW Group in different departments of Purchasing and Controlling. After studying Economics as a Major and Mechanical Engineering as a Minor at the Munich University of Technology, a project thesis at BMW (“The Application of More Sustainable i.e. Renewable and Recycled Materials in the Automotive Interior”), and her diploma thesis at BMW (“Evaluation of gear
alternatives considering product and process complexity based on costs”), she got a profound insight into the automobile development, design, and production. She started her PhD project at BMW in Munich at the Department of Concepts for Body and Interior Trims after graduation. The core aim of the thesis is to create an adaptive and customizable interior by involving end-users in the product development and customization process to achieve a new level of human-car interaction and a new human-car experience.
List of publications
244
List of publicationsPublications part of this thesis
Wagner, A.-S., Kilincsoy, Ü., Reitmeir, M., & Vink, P. (2014). Adaptive Customization –Value Creation by Adaptive Lighting in the Car Interior. In P. Vink (Ed.), Advances in Social and Organizational Factors (pp. 40-50): AHFE Conference
Russ, A., Wagner, A. S., Liesner, L., Küçükay, F., & Vink, P. (2016). Flow experience influenced by car adjustments. Transportation research part F: traffic psychology and behaviour, 36, 46-56.
Wagner, A.-S., Kilincsoy, Ü., Reitmeir, M., & Vink, P. (2016). Functional customization: Value creation by individual storage elements in the car interior. Work, 54(4), 873-885.
Wagner A‐S, Kilincsoy Ü, Vink P. Visual customization: Diversity in color preferences in the automotive interior and implications for interior design. Color Res Appl. 2018;00:1–18. https://doi.org/10.1002/col.22218
Other publications Kilincsoy, Ü., Wagner, A., Bengler, C., Bubb, H., & Vink, P. (2014). Comfortable Rear Seat Postures Preferred by Car Passengers. Paper presented at the 5th International Conference on Applied Human Factors and Ergonomics. Kilincsoy, U., Wagner, A., Vink, P., & Bubb, H. (2016). Application of ideal pressure distribution in development process of automobile seats. Work, 54(4), 895-904. The ideal pressure distribution for SUV and sedan rear seats (submitted in Applied Ergnonomics).

List of publications
245
Presentations Wagner, Alexa-Sibylla, 2014. Adaptive customization – Value creation by adaptive lighting in the Car Interior. Comfort in Transit Symposium. Delft University of Technology, June 4, 2014. (invited speaker).
Wagner, Alexa-Sibylla, 2014. Adaptive customization – Value creation by adaptive lighting in the Car Interior. 5th International conference of Advances in Human Factors and Ergonomics (AHFE) 2014. Jagiellonian University Kraków, Poland, July 19th-23rd, 2014.

Acknowledgements
246
AcknowledgementsI still remember the first time, I thought, when I finish this PhD, I will exactly know how to thank all the people involved in this project. Well, the idea was easier than to find suitable words. My journey started at BMW in department for Concepts for Body and Interior Trims. There are several people who supported me finishing this thesis like a puzzle through this entire journey.
First of all, I especially thank Prof. Peter Vink, my promotor, who helped me to get the book done in a way that readers will hopefully enjoy it. I still remember meeting you via Irene and Ümit at the Defense of Matthias. And I was astonished, that you would guide me, even if my topic was quite uncommon. You were always enthusiastic about my research, the mock-up, the design, the experiments, and my findings. But your most essential input, was to structure my manifold thoughts to this book. I enjoyed all the fruitful discussions we had, and the little restaurant tour we did in Munich with all the PhDs. We succeeded in never visiting the same restaurant twice.
During the BMW PROMOTION program, I also had the unique chance of being guided by Dr. Stefan Floeck as a mentor. I thank you for your guidance, the interesting discussions despite your very busy schedule, and your support for product ideas getting reality.

Acknowledgements
247
I also thank Max Reitmeir, Dr. Volker Levering, and Stefan Könsgen for the chance of starting my PhD at BMW in the first place and being advised through my PhD journey. Thanks to Reinhard Konhaeuser, who always found a place for my mock-up in a lab, even if place sometimes is hard to find in a large company. I thank all participant of my studies, or those who checked my writing and improved the style to almost an Oxford English level, thank you Fiona and Matt Cutmore. I especially thank Irene for our coffee, brainstorming, sports, evening activities, and research sessions. Regarding my study of color preferences, a wonderful discussion with Iris, and her knowledge served as a major input for the development of the research set-up, I hope you will enjoy this part of my thesis and not ask too nasty questions about color research.
At last, I thank both my paranymphs, who helped and believed in me the whole time: Roman and Ümit. Ümit, our battle who will finish first was the most fun, but also the intense writing sessions with immense amounts of tea and Indish delivery food, doing research together even if sometimes these studies fit better in your articles than in mine. Roman, you supported me with the best advice during this journey, and endured the endless times of writing, and rewriting. Your patience, trust and time you put in reading my thesis, calming me down and criticizing my work in the cutest way, enabled the final finish. You are my anchor!
Thank you!
I dedicate this book to both my paranymphs: Roman and Ümit.

Acknowledgements
248

Changing mobility demands like the increase of car sharing especially in cities and among the Generation Y accompanied by blurring boundaries of product capabilities pose new challenges for the automotive industry. Automotive customization can be a possibility to even consider opposing needs, in either aesthetic or functional customization and thus create wellbeing. Adaptive customization enables cars to adapt to user preferences continuously. Hence, value can be created beyond product-evoked wellbeing such as an increase of feeling of safety due to a reduction of secondary, or tertiary tasks.