Predictors of PTSD symptoms in adults admitted to a Level I trauma center: A prospective analysis
10
This article appeared in a journal published by Elsevier. The attached copy is furnished to the author for internal non-commercial research and education use, including for instruction at the authors institution and sharing with colleagues. Other uses, including reproduction and distribution, or selling or licensing copies, or posting to personal, institutional or third party websites are prohibited. In most cases authors are permitted to post their version of the article (e.g. in Word or Tex form) to their personal website or institutional repository. Authors requiring further information regarding Elsevier’s archiving and manuscript policies are encouraged to visit: http://www.elsevier.com/authorsrights
Transcript of Predictors of PTSD symptoms in adults admitted to a Level I trauma center: A prospective analysis

This article appeared in a journal published by Elsevier. The attachedcopy is furnished to the author for internal non-commercial researchand education use, including for instruction at the authors institution
and sharing with colleagues.
Other uses, including reproduction and distribution, or selling orlicensing copies, or posting to personal, institutional or third party
websites are prohibited.
In most cases authors are permitted to post their version of thearticle (e.g. in Word or Tex form) to their personal website orinstitutional repository. Authors requiring further information
regarding Elsevier’s archiving and manuscript policies areencouraged to visit:
http://www.elsevier.com/authorsrights

Author's personal copy
Journal of Anxiety Disorders 28 (2014) 301–309
Contents lists available at ScienceDirect
Journal of Anxiety Disorders
Predictors of PTSD symptoms in adults admitted to a Level I traumacenter: A prospective analysis�
Mark B. Powersa,∗, Ann Marie Warrenb, David Rosenfieldc, Kenleigh Roden-Foremand,Monica Bennette, Megan C. Reynoldsb, Michelle L. Davisa, Michael L. Foremanb,Laura B. Petreyb, Jasper A.J. Smitsa
a University of Texas at Austin, United Statesb Baylor University Medical Center, United Statesc Southern Methodist University, United Statesd UT Southwestern Medican Center, United Statese Baylor Scott & White Health, United States
a r t i c l e i n f o
Article history:Received 10 June 2013Received in revised form 10 January 2014Accepted 25 January 2014Available online 15 February 2014
Keywords:PTSDTraumaPredictorsInjuryLogistic regression
a b s t r a c t
Trauma centers are an ideal point of intervention in efforts to prevent posttraumatic stress disorder(PTSD). In order to assist in the development of prevention efforts, this study sought to identify earlypredictors of PTSD symptoms among adults admitted to a Level I trauma center using a novel analyticstrategy (Fournier et al., 2009). Upon admission, participants (N = 327) were screened for PTSD symptomsand provided information on potential predictor variables. Their PTSD symptoms were assessed again3 months later (N = 227). Participants were classified as symptomatic (positive PTSD screen) or asymp-tomatic (negative PTSD screen) at the follow-up assessment. Multinomial logistic regression showed thatage, depression, number of premorbid psychiatric disorders, gunshot wound, auto vs. pedestrian injury,and alcohol use predicted who had PTSD symptoms at FU with 76.3% accuracy. However, when con-trolling for PTSD severity at baseline, only age, number of premorbid psychiatric disorders, and gunshotwounds predicted PTSD symptoms at FU but with 78.5% accuracy. These findings suggest that psycho-logical prevention efforts in trauma centers may be best directed toward adults who are young, havepremorbid psychiatric disorders, and those admitted with gunshot wounds.
© 2014 Elsevier Ltd. All rights reserved.
It is estimated that most Americans (81%) will experience atrauma at some point in their lives (Breslau et al., 1998; Kessleret al., 2005; Sledjeski, Speisman, & Dierker, 2008) and a commonpoint of first contact with these individuals is a Level I Trauma Cen-ter (Conrad, Hansel, Pejic, & Constans, 2013; Zatzick et al., 2004).Level I Trauma Centers are designated by the American College ofSurgeons (American College of Surgeons, 2012) and must meet spe-cific criteria including at least 1200 trauma patients yearly, 24-havailability of surgeons in multiple specialties, excellence in edu-cation, and an active research program.
Trauma is the leading cause of death for people ages 1–44 in theUnited States (National Center for Injury Prevention and Control(NCIPC), 2011), and among those who survive, at least 2.8 millionare hospitalized each year with varying levels of disability (Hall,
� Portions of this research were funded by the Stanley Seeger Foundation and agrant from the National Institute on Drug Addiction K01 DA035930.
∗ Corresponding author. Tel.: +1 9033610865.E-mail address: [email protected] (M.B. Powers).
DeFrances, Williams, Golosinskiy, & Schwatzman, 2010). Mostindividuals who experience a trauma (71–94%) will report post-traumatic stress disorder (PTSD) symptoms immediately followingthe event (Riggs, Rothbaum, & Foa, 1995; Rothbaum, Foa, Riggs,Murdock, & Walsh, 1992). Although many experience steady emo-tional recovery, a sizable percentage of these individuals (15–25%)will continue to report symptoms and eventually meet formal diag-nostic criteria for PTSD (Riggs et al., 1995; Rothbaum et al., 1992).
Fortunately, treatment for PTSD is highly effective for most (85%)patients (Powers, Halpern, Ferenschak, Gillihan, & Foa, 2010) andthere are now pilot data showing that acute intervention may alsoprevent chronic PTSD (PTSD for ≥3 months) (Rothbaum et al., 2012).However, delivering interventions to all trauma survivors is notcost-effective, considering that many individuals recover withoutintervention (Kessler, Sonnega, Bromet, Hughes, & Nelson, 1995;Riggs et al., 1995; Rothbaum et al., 1992), and for some, early inter-vention interferes with natural recovery (van Emmerik, Kamphuis,Hulsbosch, & Emmelkamp, 2002). Accordingly, identifying vari-ables that predict who will develop chronic PTSD symptoms after atrauma may aid the more efficient use of resources for treating, or
0887-6185/$ – see front matter © 2014 Elsevier Ltd. All rights reserved.http://dx.doi.org/10.1016/j.janxdis.2014.01.003

Author's personal copy
302 M.B. Powers et al. / Journal of Anxiety Disorders 28 (2014) 301–309
preventing, possible chronic PTSD, and may aid the developmentof targeted intervention efforts in Level I Trauma Centers.
To date, studies examining potential PTSD risk factors haveyielded inconsistent findings, likely because of various limitationsin their methodological approaches (e.g., retrospective vs. prospec-tive designs, adequate vs. inadequate control features in analyses).Despite this, PTSD risk factors have been identified by severalmeta-analyses (Creamer, Bell, & Failla, 2003; Kessler et al., 1995;Ozer, Best, Lipsey, & Weiss, 2003). Importantly, however, there isa lack of research on PTSD symptom predictors conducted in LevelI Trauma Centers (Conrad et al., 2013). Further research is neededto determine which factors are associated with PTSD symptoma-tology onset, maintenance, or recovery in this setting while usingmore advanced analytic strategies. As such, we used an empiricalfour-stage analysis (Fournier et al., 2009) that balances the needto identify as many predictors as possible of PTSD symptomato-logy while minimizing identifying predictors that only emerge bychance.
To this end, we screened adults for symptoms of PTSD and fora number of potential predictor variables upon hospital admission(baseline) to a Level I Trauma Center, and assessed them for thepresence or absence of these symptoms 3 months later. Recogniz-ing that a formal PTSD diagnosis requires persistence of symptomsfor at least 1 month following a trauma, we categorized patientsaccording to whether or not they screened positive for symptoms ofPTSD at a 3-month follow-up. Given the volume of patients admit-ted to our Trauma Center, these assessments were not intendedto be fully diagnostic. However, examining the level of symp-toms of PTSD before a formal diagnosis can be made (at baseline)allowed us to control for baseline symptoms levels and examinean understudied time interval which may be very relevant to laterdevelopment of a PTSD diagnosis. We identified specific predictorvariables from the literature (e.g. Brewin, Andrews, & Valentine,2000; Chiu, deRoon-Cassini, & Brasel, 2011; Ozer et al., 2003) thatmay be associated with PTSD development and examined whetherany of these variables were related to symptomatology at the 3-month follow-up.
1. Method
1.1. Design and procedures
The Baylor University Medical Center Dallas InstitutionalReview Board approved the study protocol. Trained clinicalresearch assistants approached eligible patients once theywere medically stable. The participants completed standardizedquestionnaires while hospitalized (baseline), and completedan assessment of PTSD symptomatology 3 months post-injury(follow-up) by phone.
1.2. Participants
Participants (N = 327) were patients meeting study eligibilitycriteria, admitted to the Level I Trauma Center between March 26,2012, and June 10, 2013, who had sustained a traumatic injury(e.g., fall, motor vehicle collision, violent crime). The sample wasprimarily male (64%), white (68%), non-Hispanic (81%), with amean age of 46 (SD = 18). Presence of traumatic injury was verifiedby cross-referencing the trauma and orthopedic trauma admissionlists with Trauma Registry database criteria. Inclusion criteriaincluded (1) admission to the trauma service with total hospitaladmission at least 24 h, (2) 18 years of age and older, and (3)ability to provide at least one contact phone number for follow-up.Exclusion criteria included (1) traumatic brain injury (TBI) and/orpremorbid cognitive deficits (e.g., dementia, Alzheimer’s) that
would interfere with the ability to respond to the measures,and (2) inability to understand spoken English or Spanish. Allparticipants provided informed consent.
1.3. Measures
1.3.1. PTSD screeningThe Primary Care Post-Traumatic Stress Disorder Screen (PC-PTSD)
is a four-item PTSD screen designed for use in medical settings(Reese et al., 2012) and is the current screening instrument usedin Veterans Affairs (VA) centers (Prins et al., 2003). The itemsassess the presence or absence of the three PTSD clusters includ-ing re-experiencing, avoidance, and hyperarousal. The PC-PTSD isconsidered a psychometrically sound screen for determining thepresence of PTSD in the VA setting and has also been used in thecivilian primary care population. With a cut-off score of 3, the PC-PTSD screener has shown 85% diagnostic efficiency, 78% sensitivity,and 87% specificity (Prins et al., 2003). A score of 3 or higher onthe PC-PTSD was considered a positive screen for clinical levelsof PTSD symptoms. Individuals were categorized as: symptomatic(positive PTSD screen) or asymptomatic (negative PTSD screen) atthe follow-up assessment.
1.3.2. Predictor VariablesStudy measures collected at baseline were organized into the
following domains: demographic variables, psychological vari-ables, cause of injury, hospitalization characteristics, substance use,and injury related variables.
Demographic variables. Demographic information was takenfrom the hospital trauma registry including age, gender, ethnicity,marital status, educational level, and income level.
Psychological variables. The Patient Health Questionnaire (PHQ-8) is a psychometrically sound measure of depression forpopulation-based studies and clinical populations (Kroenke,Spitzer, & Williams, 2001).
The Connor-Davidson Resilience Scale 10 Item (CD-RISC 10) is ameasure of resilience with sound psychometric properties (Connor& Davidson, 2003) and has been used in populations who havesustained traumatic injuries (White, Driver, & Warren, 2010). TheSocial Provisions Scale (SPS) assesses social support received withinthe context of interpersonal relationships and has adequate psy-chometric properties (Cutrona & Russell, 1987).
The patient’s history of psychiatric illness was assessed by self-report, with patients answering Yes, No, or Unknown to havingever been diagnosed with or treated for psychological conditionsincluding depression, bipolar disorder, PTSD, generalized anxietydisorder, and/or schizophrenia.
Hospitalization characteristics. Hospitalization characteristicswere obtained from the hospital Trauma Registry, (TraumaBase– Clinical Data Management, Colorado Springs, CO) and includednumber of complications, days spent on a ventilator, length of stayin Intensive Care Unit (ICU), total length of hospital stay, and num-ber of comorbidities.
Injury related variables. Injury-related information obtainedfrom the Trauma Registry included mechanism of injury, pain level(Numeric Rating Scale) at baseline, pulse at time of admission, pen-etrating trauma (or not), the Glasgow Coma Scale (GCS), and theInjury Severity Score (ISS).
The Numeric Rating Scale (NRS) is one of the most commonlyused measures in assessing pain and has been validated as a mea-sure of pain intensity (Fraenkel et al., 2012; Lund et al., 2005). Forthe purposes of the study, participants were asked at baseline torate pain on average since their injury.
The Glasgow Coma Scale (GCS) was designed to assess thelevel of consciousness following injury (Rowley & Fielding, 1991;

Author's personal copy
M.B. Powers et al. / Journal of Anxiety Disorders 28 (2014) 301–309 303
Teasdale & Jennett, 1974, 1976; Teasdale, Kril-Jones, & van derSande, 1978).
The Injury Severity Score (ISS) is an anatomical scoring systemthat provides an overall score for patients with multiple injuries(Baker, O’Neill, Haddon, & Long, 1974). Each injury is assignedan Abbreviated Injury Score (AIS) and is allocated to one of sixbody regions (Head, Face, Chest, Abdomen, Extremities, and Exter-nal). The highest AIS score in each region is used and the threemost severely injured regions have their scores squared and addedtogether to produce the ISS score (Baker et al., 1974).
Substance use variables. The Alcohol Use Disorder Identifica-tion Test-Consumption (AUDIT-C) has been extensively validatedto detect problem drinking and has been a recommended screeningtool for alcohol screening (Bush, Kivlahan, & McDonell, 1998). Othersubstance use variables were obtained from the trauma registry andincluded blood alcohol level at admission and positive drug screenat admission.
1.4. Data analysis
Logistic regression was used to analyze the data. We identifiedsignificant predictors of PTSD level symptoms using an approachdeveloped by Fournier and colleagues (Amir, Taylor, & Donohue,2011; Fournier et al., 2009). The goal of this stepwise procedure isto extract significant predictors of the PTSD symptoms from eachof the domains of predictors that we had identified above (e.g.,demographics, substance use, psychological variables, hospitaliza-tion variables, injury-related variables, and cause of injury), andthen to use these significant predictors in a final model predictingPTSD. The Fournier approach represents a balance between exam-ining multiple predictor variables separately, in which case theremight be third-variables that could alternatively explain the rela-tions, and including all variables simultaneously in the predictionequation, which could violate guidelines for the ratio of predic-tors to subjects, and would likely result in high Type II error (lowpower). Following the Fournier algorithm, we conducted a step-wise procedure within each domain of predictors. The first phase,Step 1, identifies significant predictors within each domain (group)of predictors (demographics, substance use, psychological vari-ables, hospitalization variables, injury-related variables, and causeof injury). For each domain, Step 1 involved testing a model includ-ing all variables in that domain. Step 2 retained the terms from Step1 that were significant at p < .20. Thus, we performed a second logis-tic regression for each domain that included those predictors fromStep 1 with p < .20. Step 3 (for each domain of predictors) retainedthe terms from Step 2 that were significant at p < .10. Step 4 retainedthe terms from Step 3 that were significant at p < .05. Finally, eachterm that was significant at p < .05 in Step 4 within each domainwas included in our final model across domains, allowing the test-ing of the effects of each variable while controlling for the effectsof other important variables.
We performed this Fournier analysis two times, first identifyingpredictors of PTSD level symptoms at the 3-month follow-up with-out controlling for PC-PTSD score at baseline and second includingbaseline scores on the PC-PTSD screen as a covariate in all the analy-ses. This second analysis yields predictors of a positive PTSD screen(yes/no) at 3 months that are significant predictors over and abovePTSD screen scores (0–4) at baseline.
2. Results
Eligible patients (N = 390) were approached between March 26,2012, and June 10, 2013. Of these, 327 participants were enrolledinto the study, 227 of which completed their 3-month follow upat the time of analysis. No statistically significant differences were
Table 1Baseline data (N = 327).
Domain/predictor Mean ± SD Count (%)
DemographicAge 46 ± 18Gender (male) 145 (64%)Non-White 72 (32%)Non-Hispanic Origin 183 (81%)Married 80 (35%)Educational levela
1 – 8th grade or less 7 (3%)2 – 9–12th grade 41 (18%)3 – High school diploma 79 (35%)4 – Associate’s degree 36 (16%)5 – Bachelor’s degree 44 (19%)6 – Master’s degree 13 (6%)7 – Doctoral degree 5 (2%)8 – Professional degree 2 (1%)
Employment 129 (57%)Incomea
1 – <$25k 58 (33%)2 – $25–49k 28 (16%)3 – $50–74k 41 (24%)4 – ≥75k 47 (27%)
PsychologicalPatient Health Questionnaire – 8 7.7 ± 6.2Social Provisions Scale 60.6 ± 3.7Connor-Davidson Resilience Scale 10 31.4 ± 6.7Premorbid diagnosis 64 (55%)
Cause of injuryGunshot 23 (11%)Motor vehicle 52 (24%)Aggravated assault 14 (6%)Motorcycle 27 (12%)Pedestrian/bike 21 (10%)Fall 63 (29%)Other 19 (10%)
Hospitalization & complicationsVentilation days 0.9 ± 3.2Intensive care unit length of stay 1.6 ± 4.7Total length of stay 8.5 ± 11.6Total complications 1.0 ± 1.3Comorbidities 191 (85%)
Injury characteristicsInjury Severity Score 11.6 ± 8.2Glasgow Coma Scale 14.4 ± 2.1Pulse 91.2 ± 20.5Pain 6.9 ± 2.4Penetrating trauma 30 (14%)
Substance useETOH tested 90 (40%)ETOH amount 64.6 ± 104.0Drug tested 59 (26%)Drugs found 26 (12%)Positive audit C 89 (39%)
a Although educational level and income are listed as categories, they were treatedas continuous variables in the data analysis.
found between the group that agreed to participate versus thosethat declined, nor between those that only completed the baselineassessment and those that also completed the follow-up assess-ment (including ETOH level, vent days, ISS, GCS, LOS, pulse, gender,race, injury type, ETOH tested or drug tested). Baseline informationof these 327 participants is presented in Table 1. The most commoncause of injury was a fall (29%), followed by a motor vehicle colli-sion (24%). The mean time from injury to first assessment was 6.42days.
2.1. Step-wise analyses within each domain
In the text, we report only the significant results of Step 4 foreach domain. Each step of each analysis is fully reported in Table 2.
Author's personal copy
304 M.B. Powers et al. / Journal of Anxiety Disorders 28 (2014) 301–309
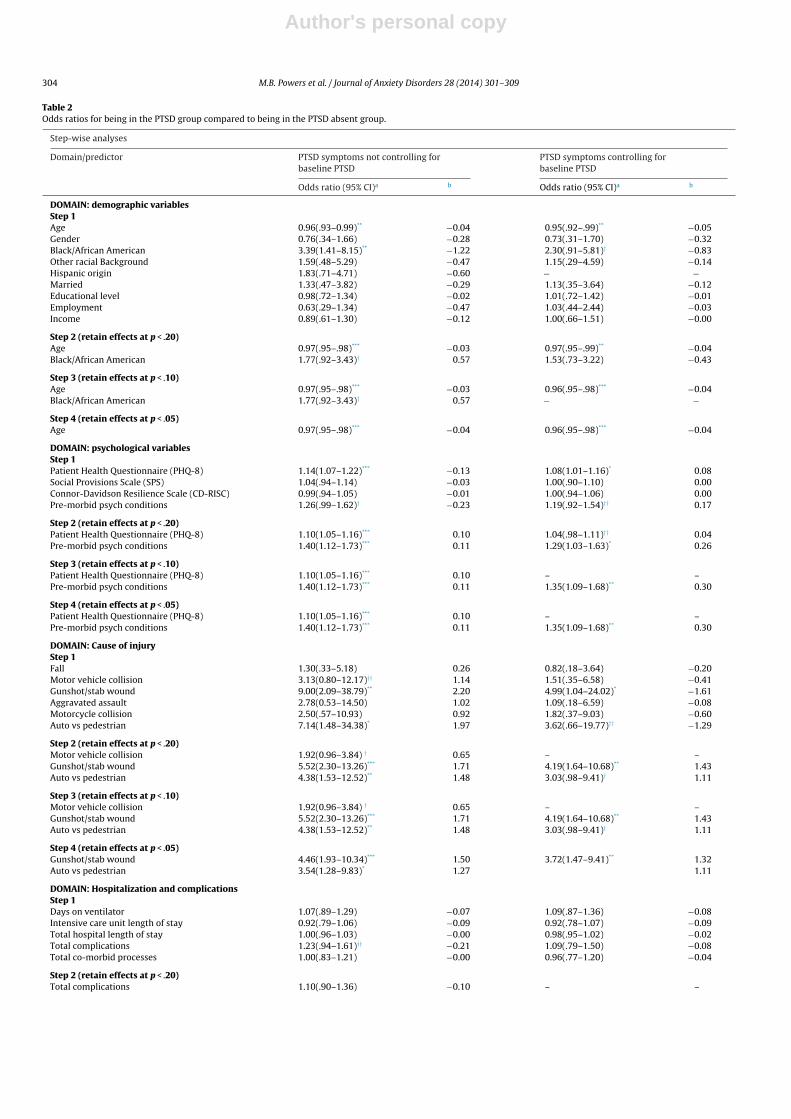
Table 2Odds ratios for being in the PTSD group compared to being in the PTSD absent group.
Step-wise analyses
Domain/predictor PTSD symptoms not controlling forbaseline PTSD
PTSD symptoms controlling forbaseline PTSD
Odds ratio (95% CI)a b Odds ratio (95% CI)a b
DOMAIN: demographic variablesStep 1Age 0.96(.93–0.99)** −0.04 0.95(.92–.99)** −0.05Gender 0.76(.34–1.66) −0.28 0.73(.31–1.70) −0.32Black/African American 3.39(1.41–8.15)** −1.22 2.30(.91–5.81)† −0.83Other racial Background 1.59(.48–5.29) −0.47 1.15(.29–4.59) −0.14Hispanic origin 1.83(.71–4.71) −0.60 − −Married 1.33(.47–3.82) −0.29 1.13(.35–3.64) −0.12Educational level 0.98(.72–1.34) −0.02 1.01(.72–1.42) −0.01Employment 0.63(.29–1.34) −0.47 1.03(.44–2.44) −0.03Income 0.89(.61–1.30) −0.12 1.00(.66–1.51) −0.00
Step 2 (retain effects at p < .20)Age 0.97(.95–.98)*** −0.03 0.97(.95–.99)** −0.04Black/African American 1.77(.92–3.43)† 0.57 1.53(.73–3.22) −0.43
Step 3 (retain effects at p < .10)Age 0.97(.95–.98)*** −0.03 0.96(.95–.98)*** −0.04Black/African American 1.77(.92–3.43)† 0.57 − −Step 4 (retain effects at p < .05)Age 0.97(.95–.98)*** −0.04 0.96(.95–.98)*** −0.04
DOMAIN: psychological variablesStep 1Patient Health Questionnaire (PHQ-8) 1.14(1.07–1.22)*** −0.13 1.08(1.01–1.16)* 0.08Social Provisions Scale (SPS) 1.04(.94–1.14) −0.03 1.00(.90–1.10) 0.00Connor-Davidson Resilience Scale (CD-RISC) 0.99(.94–1.05) −0.01 1.00(.94–1.06) 0.00Pre-morbid psych conditions 1.26(.99–1.62)† −0.23 1.19(.92–1.54)†† 0.17
Step 2 (retain effects at p < .20)Patient Health Questionnaire (PHQ-8) 1.10(1.05–1.16)*** 0.10 1.04(.98–1.11)†† 0.04Pre-morbid psych conditions 1.40(1.12–1.73)*** 0.11 1.29(1.03–1.63)* 0.26
Step 3 (retain effects at p < .10)Patient Health Questionnaire (PHQ-8) 1.10(1.05–1.16)*** 0.10 – –Pre-morbid psych conditions 1.40(1.12–1.73)*** 0.11 1.35(1.09–1.68)** 0.30
Step 4 (retain effects at p < .05)Patient Health Questionnaire (PHQ-8) 1.10(1.05–1.16)*** 0.10 – –Pre-morbid psych conditions 1.40(1.12–1.73)*** 0.11 1.35(1.09–1.68)** 0.30
DOMAIN: Cause of injuryStep 1Fall 1.30(.33–5.18) 0.26 0.82(.18–3.64) −0.20Motor vehicle collision 3.13(0.80–12.17)†† 1.14 1.51(.35–6.58) −0.41Gunshot/stab wound 9.00(2.09–38.79)** 2.20 4.99(1.04–24.02)* −1.61Aggravated assault 2.78(0.53–14.50) 1.02 1.09(.18–6.59) −0.08Motorcycle collision 2.50(.57–10.93) 0.92 1.82(.37–9.03) −0.60Auto vs pedestrian 7.14(1.48–34.38)* 1.97 3.62(.66–19.77)†† −1.29
Step 2 (retain effects at p < .20)Motor vehicle collision 1.92(0.96–3.84) † 0.65 – –Gunshot/stab wound 5.52(2.30–13.26)*** 1.71 4.19(1.64–10.68)** 1.43Auto vs pedestrian 4.38(1.53–12.52)** 1.48 3.03(.98–9.41)† 1.11
Step 3 (retain effects at p < .10)Motor vehicle collision 1.92(0.96–3.84) † 0.65 – –Gunshot/stab wound 5.52(2.30–13.26)*** 1.71 4.19(1.64–10.68)** 1.43Auto vs pedestrian 4.38(1.53–12.52)** 1.48 3.03(.98–9.41)† 1.11
Step 4 (retain effects at p < .05)Gunshot/stab wound 4.46(1.93–10.34)*** 1.50 3.72(1.47–9.41)** 1.32Auto vs pedestrian 3.54(1.28–9.83)* 1.27 1.11
DOMAIN: Hospitalization and complicationsStep 1Days on ventilator 1.07(.89–1.29) −0.07 1.09(.87–1.36) −0.08Intensive care unit length of stay 0.92(.79–1.06) −0.09 0.92(.78–1.07) −0.09Total hospital length of stay 1.00(.96–1.03) −0.00 0.98(.95–1.02) −0.02Total complications 1.23(.94–1.61)†† −0.21 1.09(.79–1.50) −0.08Total co-morbid processes 1.00(.83–1.21) −0.00 0.96(.77–1.20) −0.04
Step 2 (retain effects at p < .20)Total complications 1.10(.90–1.36) −0.10 – –

Author's personal copy
M.B. Powers et al. / Journal of Anxiety Disorders 28 (2014) 301–309 305
Table 2 (Continued )
Step-wise analyses
Domain/predictor PTSD symptoms not controlling forbaseline PTSD
PTSD symptoms controlling forbaseline PTSD
Odds ratio (95% CI)a b Odds ratio (95% CI)a b
DOMAIN: Injury – related variablesStep 1Injury Severity Score (ISS) 1.00(.97–1.04) 0.00 0.98(.94–1.03) −0.02Glascow Coma Scale (GCS) 1.08(.92–1.27) 0.08 1.08(.90–1.31) −0.08Pulse 1.03(1.01–1.04)** 0.03 1.02(1.00–1.04)* −0.02Pain at baseline 1.16(1.01–1.32)* 0.15 1.09(.94–1.26) −0.08
Step 2 (retain effects at p < .20)Pulse 1.02(1.01–1.04)** 0.02 1.02(1.00–1.03)* −0.02Pain at baseline 1.16(1.02–1.32)* 0.15 – –
Step 3 (retain effects at p < .10)Pulse 1.02(1.01–1.04)** 0.02 1.02(1.00–1.03)* −0.02Pain at baseline 1.16(1.02–1.32)* 0.15 – –
Step 4 (retain effects at p < .05)Pulse 1.02(1.01–1.04)** 0.02 1.02(1.00–1.03)* −0.02Pain at baseline 1.16(1.02–1.32)* 0.15 – –
DOMAIN: Substance useStep 1Positive AUDIT-C 2.03(1.02–4.03)* 0.71 1.65(.77–3.57) −0.50Positive alcohol screen 1.11(0.23–5.37) 0.11 0.65(.11–3.97) −0.43Alcohol level 1.00(.99–1.01) 0.00 1.00(.99–1.01) −0.00
Step 2 (retain effects at p < .20)Positive AUDIT-C 2.10(1.07–4.13)* 0.74 – –
Step 3 (retain effects at p < .10)Positive AUDIT-C 2.10(1.07–4.13)* 0.74 – –
Step 4 (retain effects at p < .05)Positive AUDIT-C 2.10(1.07–4.13)* 0.74 – –
DOMAIN: final combined analysisStep 1Age at injury 0.98(.95–1.00)* −0.03 0.97(.95–.99)** −0.03PHQ 1.12(1.05–1.19)*** −0.11 – –Pre-morbid Psych conditions 1.44(1.13–1.84)** −0.37 1.40(1.11–1.76)** −0.33Gunshot/stab wound 3.66(1.32–10.19)* −1.30 2.38(0,88–6.41)† −0.87Auto vs pedestrian 2.90(.90–9.35)† −1.06 – –Pain level at baseline 1.06(.90–1.24) −0.05 – –Pulse 1.01(1.00–1.03)†† −0.01 1.01(.99–1.03) −0.01Positive AUDIT-C 2.27(.93–5.51)† −0.82 – –
Step 2 (retain effects at p < .20)Age at injury 0.98(.95–1.00)* −0.02 0.97(.94–.99)** −0.03PHQ 1.12(1.06–1.19)*** −0.12 – –Pre-morbid psych conditions 1.41(1.11–1.78)** −0.34 1.39(1.10–1.79)** −0.33Gunshot/stab wound 3.87(1.41–10.62)** −1.35 2.39(0.89–6.40)* −0.87Auto vs pedestrian 3.01(.94–9.69)† −1.10 – –Pulse 1.01(1.00–1.03)†† −0.01 – –Positive AUDIT-C 2.20(.92–5.30)† −0.79 – –
Step 3 (retain effects at p < .10)Age at injury 0.97(.95–.99)* −0.03 0.97(.95–.99)** −0.03PHQ 1.12(1.06–1.19)*** −0.11 – –Pre-morbid Psych conditions 1.41(1.12–1.79)** −0.34 1.42(1.13–1.80)** −0.35Gunshot/stab wound 4.03(1.48–10.96)** −1.39 2.77(1.02–7.54)* −1.02Auto vs pedestrian 3.42(1.11–10.59)* −1.23 – –Positive AUDIT-C 2.38(1.00–5.67)† −0.87 – –
Step 4 (retain effects at p < .05)Age at Injury 0.97(.95–.99)* −0.03 0.96(.94–.9)*** −0.03PHQ 1.12(1.06–1.19)*** −0.11 – –Pre-morbid Psych conditions 1.41(1.12–1.79)** −0.34 1.37(1.10–1.72)** 0.32Gunshot/stab wound 4.03(1.48–10.96)** −1.39 – –Auto vs pedestrian 3.42(1.11–10.59)* −1.23 – –Positive AUDIT-C 2.38(1.00–5.67)* −0.87 – –
a Odds ratio is for the odds of being in this PTSD group compared to the odds of being in the “No PTSD” group.b All cases in the Recovery group had only “blunt” trauma. Thus, the SD was 0 and the p value was not calculable.†† p < .20.† p < .10.* p < .05.
** p < .01.*** p < .001.

Author's personal copy
306 M.B. Powers et al. / Journal of Anxiety Disorders 28 (2014) 301–309
Demographic characteristics. Age was the only demographic vari-able that was significantly related to PTSD symptom status in Step4 for demographic characteristics. The odds of being symptomaticwere higher for younger, compared to older, patients (OR = .97,p < .001).
Psychological variables. Step 4 for the psychological variablesshowed that the odds of being symptomatic were higher for thosewith higher levels of depressive symptoms (OR = 1.12, p < .001)and for those reporting more premorbid psychiatric diagnoses(OR = 1.40, p = .003).
Cause of injury. The analyses of the cause of injury were differentfrom the analyses of the other domains of predictors since, unlikethe other domains, these causes were mutually exclusive (if thecause was a gunshot wound, it was not caused by a motor vehiclecollision). We dummy coded each cause. Analyses indicated thatthe odds of being symptomatic were greater for gunshot/stabbingvictims than for other victims (OR = 4.46, p < .001). Similarly, theodds of being symptomatic were also higher for pedestrian victimshit by a motor vehicle than other victims (OR = 3.54, p = .015).
Hospitalization and complications. Step 4 of the analysis of thehospitalization characteristics showed that the odds of being symp-tomatic were not significantly related to any of our hospitalizationor complications measures.
Injury-related variables. Higher levels of pain were related tohigher odds of being symptomatic at 3 months (OR = 1.16, p = .027),and higher pulse rate at admission was similarly related to higherodds of being symptomatic at the 3-month follow-up (OR = 1.02,p = .002).
Substance use. Step 4 for the substance use variables indicatedthat the odds of being symptomatic were higher for those whomet criteria for alcohol use disorders on the AUDIT-C (OR = 2.10,p = .031).
2.2. Final model with all significant variables
The final model included the simultaneous entry of all the vari-ables found to be significant in Step 4 of the analyses of eachdomain. The four Steps for the final model are presented in Table 2.
We discuss only the results for the final step (Step 4) of thefinal model. In this model, younger patients had greater odds ofbeing symptomatic (OR = 0.97, p = .011) than older patients. Also,higher levels of depressive symptoms were related to higher oddsof being symptomatic (OR = 1.12, p < .001). In addition, a greaternumber of premorbid psychiatric diagnoses was related to higherodds of being symptomatic (OR = 1.41, p = .004), as was meetingcriteria for alcohol use disorder on the Audit-C (OR = 2.38, p = .050).Finally, type of injury was also related to being symptomatic onthe PC-PTSD. Those who were shot/stabbed and those who werepedestrians hit by a motor vehicle had higher odds of being symp-tomatic at the 3-month follow-up (OR = 4.03, p = .006, and OR = 3.42,p = .033, respectively).
2.3. Predictors of PC-PTSD criterion at 3 months controlling forPC-PTSD symptoms at baseline
Demographic characteristics. Age was the only demographic vari-able that was significantly related to PTSD symptom status in Step
4 for demographic characteristics when controlling for baselinePC-PTSD scores. The odds of being symptomatic were higher foryounger compared to older patients (OR = .96, p < .001).
Psychological variables. Step 4 for the psychological variablesshowed that the odds of being symptomatic were higher forthose reporting more premorbid psychiatric diagnoses (OR = 1.35,p = .007), after controlling for baseline PC-PTSD scores.
Cause of injury. After controlling for baseline PC-PTSD score, theodds of being symptomatic were greater for gunshot/stabbing vic-tims than for other victims (OR = 3.72, p = .005).
Hospitalization and complications. Step 4 of the analysis ofthe hospitalization characteristics showed that the odds of beingsymptomatic were unrelated to any of our hospitalization or com-plications measures.
Injury-related variables. Only a higher pulse was related to higherodds of being symptomatic (OR = 1.02, p = .045), while controllingfor baseline PC-PTSD scores.
Substance use. Step 4 for the substance use variables indicatedthat the odds of being symptomatic were unrelated to any of thesubstance abuse predictors, after controlling for baseline PC-PTSDscores.
2.4. Final model with all significant variables, controlling forbaseline PC-PTSD
The final model included the simultaneous entry of all the vari-ables found to be significant in Step 4 of the analyses of eachdomain. The four Steps for the final model are presented in Table 2.
We discuss only the results for the final step (Step 4) of the finalmodel. After controlling for baseline PC-PTSD (which was signif-icantly related to the odds of being symptomatic at the 3-monthfollow-up [OR = 1.94, p < .001], only two predictors remained sig-nificant. Younger patients had greater odds of being symptomatic(OR = 0.96, p = .001) than older patients. And a greater number ofpremorbid psychiatric diagnoses was related to higher odds ofbeing symptomatic (OR = 1.37, p = .006.
2.5. Accuracy of predicting PTSD symptomology 3 months later
Our logistic regression models can be used to calculate the prob-ability of being symptomatic at the 3-month follow-up. Table 3presents the classification tables, which show the model-based pre-dictions of being symptomatic at 3 months (those with a probabilityof .5 or higher are predicted to be symptomatic) and the actualreport of them being symptomatic 3 months later. Both models (themodel including baseline PC-PTSD as a covariate and the modelnot including baseline PC-PTSD) are very similar in their predic-tions and in the accuracy of their predictions, with the accuracy ofpredicting being symptomatic or not at follow-up in both modelsbeing slightly greater than 76%. As is typical in logistic regressionmodels, the models more accurately predicted the outcome that ismore frequent (not being symptomatic), with both models accu-rately predicting about 85% of those cases. Prediction of the lessfrequent outcome (being symptomatic) is not quite as good (60%),but still relatively high. One can more accurately predict those whowill be symptomatic by using a lower cutoff than .50 probability
Table 3Predicted and actual PTSD level symptomatology on the PC-PTSD (PC-PTSD≥3).
Predicted PTSD level of symptoms
Model not controlling for baseline symptoms Model controlling for baseline symptoms
Actual PTSD level of symptomsNO YES NO YES
NO 84.9% 15.1% 85.1% 14.9%YES 40.0% 60.0% 39.7% 60.3%

Author's personal copy
M.B. Powers et al. / Journal of Anxiety Disorders 28 (2014) 301–309 307
0
0.2
0.4
0.6
0.8
1
0.50.40.30.20.10
Tru
e P
osit
ives
False Positives
Fig. 1. ROC curve.
to predict classification, but the tradeoff is a greater likelihood offalse positives (predicting being symptomatic for those who don’tturn out to be symptomatic). Fig. 1 shows the ROC curve plottingthe tradeoff between correct positives and false positives for thesemodels. This figure shows that one can identify 90% of those whowill be symptomatic at 3 months and perhaps proactively inter-vene to decrease that likelihood, but at the cost of intervening in44.5% of the cases would otherwise not become symptomatic.
3. Discussion
The aim of the present study was to identify predictors of PTSDlevel symptoms 3 months after admission to a Level I Trauma Cen-ter. Multinomial logistic regression showed that, age, depression,number of premorbid psychiatric disorders, gunshot wound, autovs. pedestrian injury, and alcohol use predicted who had PTSDsymptoms at 3-month follow-up with 76.3% accuracy. However,when controlling for PTSD severity at baseline, only age, numberof premorbid psychiatric disorders, and gunshot wounds predictedPTSD symptoms at 3-month follow-up, but with 78.5% accuracy.
Our findings are consistent with the existing literature on PTSDpredictors suggesting younger age (Alarcon et al., 2012; Chiu et al.,2011), depression (O’Donnell, Creamer, & Pattison, 2004; Shalevet al., 1998), number of premorbid psychiatric disorders (Nickel &Egle, 2006), gunshot wounds/penetrating injuries (Alarcon et al.,2012), auto vs. pedestrian injuries (Alarcon et al., 2012), and alco-hol use (McFarlane et al., 2009) are all risk factors for PTSD.However, after controlling for PTSD symptoms at the time ofadmission, only age, number of premorbid psychiatric disorders,and gunshot wounds remained as significant predictors of laterPTSD. Gunshot wounds may be a proxy for trauma severity andtype (interpersonal). However, a study with combat traumas sug-gested that gunshot wounds predicted having some type of mentalhealth diagnosis but not PTSD specifically (MacGregor et al., 2009).Future studies with civilians could include a diagnostic interview todetermine if these findings translate from the military population.Consistent with our findings, psychiatric history has also been iden-tified as a potential predisposing factor for development of PTSD(Kessler et al., 1999). Why this is the case is less clear. For example,it could be that psychiatric severity is associated with several otherrisk factors such as lower social support, income, and living in envi-ronments more prone to trauma. However, our study controlledfor many of these alternative explanations and at least one otherstudy showed that it may be more likely that a similar risk factormay predict both PTSD and psychiatric history (McMillen, North,Mosley, & Smith, 2002). Finally, younger age has also been consis-tently found as a predictor of PTSD (Brewin et al., 2000; Ozer et al.,2003). However, one study suggested younger age may simply be aproxy for assaultive trauma and low SES (Chiu et al., 2011). This iscontrary to what we found as trauma type and SES was controlledfor and age still came out as a significant independent predictor. Itis not clear on the surface what is responsible for the discrepancy.It could be due to differences in data analysis strategy, populations,
or assessment instruments. Hopefully replication and extension ofthe present research will help further determine the reason for therelationship between age and PTSD.
Several variables did not significantly predict PTSD in our study(i.e. gender, ethnicity, education, income, work status, injury sever-ity score, Glasgow coma scale, social support, resilience, maritalstatus, and ICU length of stay). However, these variables wereidentified as risk factors in previous reports (Alarcon et al., 2012;Chiu et al., 2011; Clapp & Gayle Beck, 2009; Daniels et al., 2012;Harris, Young, Rae, Jalaludin, & Solomon, 2008; O’Donnell, Creamer,Holmes, et al., 2010; O’Donnell, Creamer, McFarlane, Silove, &Bryant, 2010; Peris et al., 2011; Richter, Waydhas, & Pajonk, 2006).Among the possible explanations for the discrepancy in thesefindings are differences in patient samples, settings, and controlfeatures including the novel analysis strategies (i.e. Fournier et al.,2009) in our study. Indeed, one strength of the present study is thesimultaneous examination of potential predictors of PTSD symp-toms, which allowed us to control for many possible third-variableexplanations. Thus, our analyses eliminated many proxy risk fac-tors. Power analyses show that our sample was large enough todetect medium effect sizes with a power of .80 or greater, therebybeing able to detect important predictors of PTSD symptoms cat-egories. Accordingly, we did not have sufficient power to detectsmall (perhaps meaningful) effects. Thus, our analytical approachwas conservative: powerful enough to identify substantial pre-dictors, but with strong controls to avoid erroneously identifyingproxy risk factors.
Identifying early predictors of PTSD following traumatic injuryprovides useful information for clinical care. The results of thisstudy suggest that screening for PTSD symptoms in a trauma cen-ter for all patients would be a clinically useful endeavor given thata little under half of the sample had substantial PTSD symptomsat either baseline, at 3 months or at both time points. However,given the limited resources in many trauma centers, our findingsprovide some direction on intervening to reduce the risk for PTSD.Specifically, if replicated, our findings suggest that effective pre-ventative interventions for PTSD may be best targeted to thosewho are admitted with gunshot wounds, are younger, and have sig-nificant psychiatric history. Our findings also suggest that traumaprograms should have some type of routine follow-up visit fortrauma patients after discharge so they can be assessed for PTSDsymptoms given that over one-third of our sample either developedPTSD symptoms at 3 months or continued to have PTSD symptomsat 3 months. It is unclear how many trauma programs provideroutine follow up visits for their patients, or what percentage ofpatients attend follow-up visits if they are available. Additionally,by identifying those patients at risk, trauma centers could see apotential cost savings (Greenberg et al., 1999).
Several limitations deserve mention. First, ours was a con-venience sample of trauma patients who were prospectivelyenrolled upon hospital admission. However, the subjects who wereapproached and agreed to be in the study were similar to the sub-jects who approached and declined to be in the study. Additionally,the fact that most of our data came from self-report measures,including our measure of PTSD symptoms, is a limiting factor.Although the measure used to determine PTSD is widely-used, validand reliable screening tool for PTSD in hospital settings, an addi-tional clinical diagnosis confirming potential diagnosis of PTSD orother symptom assessment measures would have made the resultsmore compelling. Further, relying on self-report of comorbid men-tal disorders may also be problematic, though this methodology isreflective of real-world assessments in a hospital setting. Addition-ally, the study was also limited in terms of the assessment interval.Specifically, we did not include an assessment of PTSD symptomsat 1-month following injury, which coincides with the requiredtime for a formal diagnosis of acute PTSD. Also, rather than choose

Author's personal copy
308 M.B. Powers et al. / Journal of Anxiety Disorders 28 (2014) 301–309
only certain predictors based on previous (inconsistent) findings,we opted to conduct the Fournier analysis entering all availablepredictors. Thus, future studies should shed more light on theoret-ical underpinnings of the findings that are replicated. Finally, it isunclear if the predictors of later PTSD symptomatology or recovery,respectively, would be different at later follow-ups (i.e., 6 months,12 months). Further research should examine the stability of thesePTSD symptom predictors. By better identifying which patientsare at risk for continued PTSD, as well as individuals who maydevelop PTSD at a later time period, education and resources canbe provided at the time of admission to the trauma center and thusultimately reduce the rates of PTSD in this potentially vulnerablepopulation.
References
Alarcon, L. H., Germain, A., Clontz, A. S., Roach, E., Nicholas, D. H., Zenati, M.S., et al. (2012). Predictors of acute posttraumatic stress disorder symp-toms following civilian trauma: highest incidence and severity of symptomsafter assault. Journal of Trauma and Acute Care Surgery, 72(3), 629–635.http://dx.doi.org/10.1097/TA.0b013e31824416aa (discussion 635–627)
American College of Surgeons. (2012). Verified trauma centers.http://www.facs.org/trauma/verified.html
Amir, N., Taylor, C. T., & Donohue, M. C. (2011). Predictors of response to an atten-tion modification program in generalized social phobia. Journal of Consulting andClinical Psychology, 79(4), 533–541. http://dx.doi.org/10.1037/a0023808
Baker, S. P., O’Neill, B., Haddon, W. J., & Long, W. B. (1974). The Injury Severity Score: amethod for describing patients with multiple injuries and evaluating emergencycare. Journal of Trauma, 14, 187–196.
Breslau, N., Kessler, R. C., Chilcoat, H. D., Schultz, L. R., Davis, G. C., & Andreski, P.(1998). Trauma and posttraumatic stress disorder in the community: the 1996Detroit area survey of trauma. Archives of General Psychiatry, 55(7), 626–632.
Brewin, C. R., Andrews, B., & Valentine, J. D. (2000). Meta-analysis of risk factors forposttraumatic stress disorder in trauma-exposed adults. Journal of Consultingand Clinical Psychology, 68, 748–766.
Bush, K., Kivlahan, D. R., & McDonell, M. B. (1998). The AUDIT Alcohol Consump-tion Questions (AUDIT-C): an effective brief screening test for problem drinking.Archives of Internal Medicine, 3, 1789–1795.
Chiu, K. B., deRoon-Cassini, T. A., & Brasel, K. J. (2011). Factors identi-fying risk for psychological distress in the civilian trauma population.Academic Emergency Medicine, 18(11), 1156–1160. http://dx.doi.org/10.1111/j.1553-2712.2011.01206.x
Clapp, J. D., & Gayle Beck, J. (2009). Understanding the relationship between PTSDand social support: the role of negative network orientation. Behaviour Researchand Therapy, 47(3), 237–244. http://dx.doi.org/10.1016/j.brat.2008.12.006
Connor, K. M., & Davidson, J. R. (2003). Development of a new resilience scale:the Connor-Davidson Resilience Scale (CD-RISC). Depression and Anxiety, 18,76–82.
Conrad, E. J., Hansel, T. C., Pejic, N. G., & Constans, J. (2013). Assessment of psychiatricsymptoms at a Level I trauma center surgery follow-up clinic: a preliminaryreport. American Journal of Surgery, 79(5), 492–494.
Creamer, M., Bell, R., & Failla, S. (2003). Psychometric properties of the impact ofevent scale – Revised. Behaviour Research and Therapy, 41, 1489–1496.
Cutrona, C. E., & Russell, D. (1987). The provision of social relationships and adap-tation to stress. In: W. H. Jones, & D. Perlman (Eds.), Advances in personalrelationships (pp. 37–67). Greenwich, CT: JAI Press.
Daniels, J. K., Hegadoren, K. M., Coupland, N. J., Rowe, B. H., Densmore, M., Neufeld, R.W., et al. (2012). Neural correlates and predictive power of trait resilience in anacutely traumatized sample: a pilot investigation. Journal of Clinical Psychiatry,73(3), 327–332. http://dx.doi.org/10.4088/JCP.10m06293
Fournier, J. C., DeRubeis, R. J., Shelton, R. C., Hollon, S. D., Amsterdam, J. D., & Gallop,R. (2009). Prediction of response to medication and cognitive therapy in thetreatment of moderate to severe depression. Journal of Consulting and ClinicalPsychology, 77(4), 775–787. http://dx.doi.org/10.1037/a0015401
Fraenkel, L., Falzer, P., Fried, T., Kohler, M., Peters, E., Kerns, R., et al. (2012). Measuringpain impact versus pain severity using a numberic rating scale. Journal of GeneralInternal Medecine, 27, 555–560.
Greenberg, P. E., Sisitsky, T., Kessler, R. C., Finkelstein, S. N., Berndt, E. R., Davidson,J. R. T., et al. (1999). The economic burden of anxiety disorders in the 1990s.Journal of Clinical Psychiatry, 60(7), 427–435.
Hall, M. J., DeFrances, C. J., Williams, S. N., Golosinskiy, A., & Schwatzman, A. (2010).National hospital discharge survey: 2007 summary. National Health StatisticsReports, 29, 1–20.
Harris, I. A., Young, J. M., Rae, H., Jalaludin, B. B., & Solomon, M. J. (2008). Predictors ofpost-traumatic stress disorder following major trauma. ANZ Journal of Surgery,78(7), 583–587. http://dx.doi.org/10.1111/j.1445-2197.2008.04578.x
Kessler, R. C., Berglund, P., Demler, O., Jin, R., Merikangas, K. R., & Walters, E. E. (2005).Lifetime prevalence and age-of-onset distributions of DSM-IV disorders in theNational Comorbidity Survey Replication. Archives of General Psychiatry, 62(6),593–602.
Kessler, R. C., Sonnega, A., Bromet, E., Hughes, M., & Nelson, C. B. (1995). Posttrau-matic stress disorder in the National Comorbidity Survey. Archives of GeneralPsychiatry, 52(12), 1048–1060.
Kessler, R. C., Sonnega, A., Bromet, E., Hughes, M., Nelson, C. B., & Breslau, N. N. (1999).Epidemiological risk factors for trauma and PTSD. In: R. Yehuda (Ed.), Risk factorsfor PTSD. Washington, DC: American Psychiatric Press.
Kroenke, K., Spitzer, R., & Williams, J. B. (2001). The PHQ-9: validity of abrief depression severity measure. Journal of General Internal Medecine, 16,606–613.
Lund, I., Lundberg, T., Sandberg, L., Budh, C. N., Kowalski, J., & Svensson, E. (2005).Lack of interchangeability between visual analogue and verbal rating pain scales:a cross sectional description of pain etiology groups. BMC Medical ResearchMethodology, 5, 31.
MacGregor, A. J., Corson, K. S., Larson, G. E., Shaffer, R. A., Dougherty, A. L., Galarneau,M. R., et al. (2009). Injury-specific predictors of posttraumatic stress disorder.Injury, 40, 1004–1010.
McFarlane, A. C., Browne, D., Bryant, R. A., O’Donnell, M., Silove, D., Creamer,M., et al. (2009). A longitudinal analysis of alcohol consumption andthe risk of posttraumatic symptoms. Journal of Affective Disorders, 118,166–172.
McMillen, C., North, C., Mosley, M., & Smith, E. (2002). Untangling the psychiatriccomorbidity of posttraumatic stress disorder in a sample of flood survivors.Comprehensive Psychiatry, 43, 478–485.
National Center for Injury Prevention and Control (NCIPC). (2011). Web-based injurystatistics query and reporting system (WIQARS). Retrieved November 5, 2012, fromhttp://www.cdc.gov/injury/wisqars
Nickel, R., & Egle, U. T. (2006). Psychological defense styles, childhood adversitiesand psychopathology in adulthood. Child Abuse and Neglect, 30(2), 157–170.http://dx.doi.org/10.1016/j.chiabu.2005.08.016
O’Donnell, M. L., Creamer, M., Holmes, A. C., Ellen, S., McFarlane, A. C., Judson,R., et al. (2010). Posttraumatic stress disorder after injury: does admis-sion to intensive care unit increase risk? Journal of Trauma, 69(3), 627–632.http://dx.doi.org/10.1097/TA.0b013e3181bc0923
O’Donnell, M. L., Creamer, M., & Pattison, P. (2004). Posttraumatic stress disorder anddepression following trauma: understanding comorbidity. American Journal ofPsychiatry, 161(8), 1390–1396. http://dx.doi.org/10.1176/appi.ajp.161.8.1390
O’Donnell, M. L., Creamer, M. C., McFarlane, A. C., Silove, D., & Bryant, R. A. (2010).Does access to compensation have an impact on recovery outcomes after injury?Medical Journal of Australia, 192(6), 328–333.
Ozer, E. J., Best, S. R., Lipsey, T. L., & Weiss, D. S. (2003). Predictors of posttraumaticstress disorder and symptoms in adults: a meta-analysis. Psychological Bulletin,129(1), 52–73.
Peris, A., Bonizzoli, M., Iozzelli, D., Migliaccio, M. L., Zagli, G., Bacchereti,A., et al. (2011). Early intra-intensive care unit psychological interven-tion promotes recovery from post traumatic stress disorders, anxiety anddepression symptoms in critically ill patients. Critical Care, 15(1), R41.http://dx.doi.org/10.1186/cc10003
Powers, M. B., Halpern, J. M., Ferenschak, M. P., Gillihan, S. J., & Foa, E.B. (2010). A meta-analytic review of prolonged exposure for post-traumatic stress disorder. Clinical Psychology Review, 30(6), 635–641.http://dx.doi.org/10.1016/J.Cpr.2010.04.007
Prins, A., Ouimette, P., Kimerling, R., Cameron, R. P., Hugelshofer, D. S., Shaw-Hegwer,J., et al. (2003). The primary care PTSD screen (PC-PTSD): development andoperating characteristics. Primary Care Psychiatry, 9, 9–14.
Reese, C., Pederson, T., Avila, S., Koseph, K., Nagy, K., Dennis, A., et al. (2012). Screeningfor traumatic stress among survivors of urban trauma. Journal of Trauma andAcute Care Surgery, 73, 462–467.
Richter, J. C., Waydhas, C., & Pajonk, F. G. (2006). Incidence of posttraumatic stressdisorder after prolonged surgical intensive care unit treatment. Psychosomatics,47(3), 223–230. http://dx.doi.org/10.1176/appi.psy.47.3.223
Riggs, D. S., Rothbaum, B. O., & Foa, E. B. (1995). A prospective exam-ination of symptoms of posttraumatic stress disorder in victims ofnonsexual assault. Journal of Interpersonal Violence, 10(2), 201–214.http://dx.doi.org/10.1177/0886260595010002005
Rothbaum, B. O., Foa, E. B., Riggs, D. S., Murdock, T., & Walsh, W. (1992). A prospec-tive examination of post-traumatic stress disorder in rape victims. Journal ofTraumatic Stress, 5(3), 455–475.
Rothbaum, B. O., Kearns, M. C., Price, M., Malcoun, E., Davis, M., Ressler,K. J., et al. (2012). Early intervention may prevent the development ofposttraumatic stress disorder: a randomized pilot civilian study withmodified prolonged exposure. Biological Psychiatry, 72(11), 957–963.http://dx.doi.org/10.1016/j.biopsych.2012.06.002
Rowley, G., & Fielding, K. (1991). Reliability and accuracy of the Glasgow Coma Scalewith experiences and inexperienced users. Lancet, 337, 535–538.
Shalev, A. Y., Freedman, S., Peri, T., Brandes, D., Sahar, T., Orr, S. P., et al. (1998).Prospective study of posttraumatic stress disorder and depression followingtrauma. American Journal of Psychiatry, 155(5), 630–637.
Sledjeski, E. M., Speisman, B., & Dierker, L. C. (2008). Does number of lifetimetraumas explain the relationship between PTSD and chronic medical conditions?Answers from the National Comorbidity Survey-Replication (NCS-R). Journal ofBehavioral Medicine, 31, 341–349.
Teasdale, G., & Jennett, B. (1974). Assessment of coma and impaired consciousness.Lancet, 81–84.
Teasdale, G., & Jennett, B. (1976). Assessment and prognosis of coma after headinjury. Acta Neurochirurgica, 34, 45–55.

Author's personal copy
M.B. Powers et al. / Journal of Anxiety Disorders 28 (2014) 301–309 309
Teasdale, G., Kril-Jones, R., & van der Sande, J. (1978). Observer variability in assessingimpaired consciousness and coma. Journal of Neurology, Neurosurgery & Psychi-atry, 41, 603–610.
van Emmerik, A. A., Kamphuis, J. H., Hulsbosch, A. M., & Emmelkamp, P. M. G. (2002).Single session debriefing after psychological trauma: a meta-analysis. Lancet,360(9335), 766–771.
White, B., Driver, S., & Warren, A. M. (2010). Resilience and indicators of adjustmentduring rehabilitation from a spinal cord injury. Rehabilitation Psychology, 55(1),23–32. http://dx.doi.org/10.1037/a0018451
Zatzick, D., Jurkovich, G., Russo, J., Roy-Byrne, P., Katon, W., Wagner, A., et al. (2004).Posttraumatic distress, alcohol disorders, and recurrent trauma across level 1trauma centers. Journal of Trauma, 57(2), 360–366.