Predicting water allocations and trading prices to assist water markets
16
PREDICTING WATER ALLOCATIONS AND TRADING PRICES TO ASSIST WATER MARKETS y SHAHBAZ KHAN 1,2 * , DHARMA DASSANAYAKE 2 , SHAHBAZ MUSHTAQ 3 AND MUNIR A HANJRA 2,4 1 UNESCO Division of Water Sciences, Paris, France 2 CSIRO Land and Water, Griffith and Canberra, Australia 3 Australian Centre for Sustainable Catchments, University of Southern Queensland, Toowoomba, Australia 4 Charles Sturt University, Wagga Wagga, Australia ABSTRACT Uncertain water allocations and water trading prices are a key constraint to efficient irrigated cropping and water trading decisions. This study shows that neural network models can reasonably forecast seasonal allocations and trading prices in water markets. These models can complement other forecasting techniques such as regression analysis and time series models as the former can better capture the non-linearities in the water trading system. Using a 50% probability risk factor for water variability, the water allocation model showed minor estimation error; however, in one instance the model underestimated the water allocation by 21%. This may be due to exceptionally low initial water allocations and borrowing of water from future years which was outside the training data sets. Similarly, the water trading price forecast model showed modest estimation error of about 11% during 2004/05 probably due to drought. Overall the models have good water allocation and price forecasting accuracy, and the determinants of water trading prices identified by the neural network models are those expected of the econometric models/economic theory. Copyright # 2009 John Wiley & Sons, Ltd. key words: irrigation; water allocation; temporary water trade; quarterly water prices; artificial neural networks; water markets; economic forecast Received 13 August 2007; Revised 10 May 2009; Accepted 11 May 2009 RE ´ SUME ´ Les incertitudes sur les allocations d’eau et les valeurs d’e ´change de l’eau sont une contrainte majeure pour l’efficacite ´ des cultures irrigue ´es et les de ´cisions d’e ´change d’eau. Cette e ´tude montre que les mode `les de re ´seaux de neurones peuvent raisonnablement pre ´voir les allocations saisonnie `res et les valeurs d’e ´change dans les marche ´s de l’eau. Ces mode `les peuvent comple ´ter d’autres techniques de pre ´vision telles que l’analyse de re ´gression et les mode `les de se ´ries chronologiques qui peuvent mieux saisir les non-line ´arite ´s dans le syste `me d’e ´change de l’eau. Utilisant une probabilite ´ de 50% pour le facteur de risque de variabilite ´, le mode `le d’allocation de l’eau a montre ´ une faible erreur d’estimation; mais, dans un cas, le mode `le a sous-estime ´ l’allocation de 21%. Ce peut e ˆtre du ˆa ` une allocation initiale exceptionnellement basse et des emprunts d’eau sur l’anne ´e future, hors du champ des jeux de donne ´es utilise ´s en formation. De me ˆme le mode `le de pre ´vision de la valeur d’e ´change a montre ´ une faible erreur d’estimation d’environ 11% en 2004/05, probablement due a ` la se ´cheresse. Dans l’ensemble les mode `les donnent une bonne allocation et une exactitude des pre ´visions des valeurs d’e ´change, et les de ´terminants des valeurs e ´changes identifie ´s par les mode `les de re ´seaux de neurones sont ceux qui sont attendus des mode `les e ´conome ´triques et de la the ´orie e ´conomique. Copyright # 2009 John Wiley & Sons, Ltd. IRRIGATION AND DRAINAGE Irrig. and Drain. 59: 388–403 (2010) Published online 13 November 2009 in Wiley Online Library (wileyonlinelibrary.com) DOI: 10.1002/ird.535 *Correspondence to: Dr Shahbaz Khan, Division of Water Sciences, UNESCO, 1, Rue Miollis, 75 732 Paris Cedex 15, SP France. E-mail: [email protected] y La pre ´vision des allocations d’eau et des valeurs d’e ´change pour accompagner les marche ´s de l’eau. Copyright # 2009 John Wiley & Sons, Ltd.
-
Upload
independent -
Category
Documents
-
view
0 -
download
0
Transcript of Predicting water allocations and trading prices to assist water markets

IRRIGATION AND DRAINAGE
Irrig. and Drain. 59: 388–403 (2010)
Published online 13 November 2009 in Wiley Online Library (wileyonlinelibrary.com) DOI: 10.1002/ird.535
PREDICTING WATER ALLOCATIONS AND TRADING PRICESTO ASSIST WATER MARKETSy
SHAHBAZ KHAN1,2*, DHARMA DASSANAYAKE2, SHAHBAZ MUSHTAQ3 AND MUNIR A HANJRA2,4
1UNESCO Division of Water Sciences, Paris, France2CSIRO Land and Water, Griffith and Canberra, Australia
3Australian Centre for Sustainable Catchments, University of Southern Queensland, Toowoomba, Australia4Charles Sturt University, Wagga Wagga, Australia
ABSTRACT
Uncertain water allocations and water trading prices are a key constraint to efficient irrigated cropping and water
trading decisions. This study shows that neural network models can reasonably forecast seasonal allocations and
trading prices in water markets. These models can complement other forecasting techniques such as regression
analysis and time series models as the former can better capture the non-linearities in the water trading system.
Using a 50% probability risk factor for water variability, the water allocation model showed minor estimation error;
however, in one instance the model underestimated the water allocation by 21%. This may be due to exceptionally
low initial water allocations and borrowing of water from future years which was outside the training data sets.
Similarly, the water trading price forecast model showed modest estimation error of about 11% during 2004/05
probably due to drought. Overall the models have good water allocation and price forecasting accuracy, and the
determinants of water trading prices identified by the neural network models are those expected of the econometric
models/economic theory. Copyright # 2009 John Wiley & Sons, Ltd.
key words: irrigation; water allocation; temporary water trade; quarterly water prices; artificial neural networks; water markets; economicforecast
Received 13 August 2007; Revised 10 May 2009; Accepted 11 May 2009
RESUME
Les incertitudes sur les allocations d’eau et les valeurs d’echange de l’eau sont une contrainte majeure pour
l’efficacite des cultures irriguees et les decisions d’echange d’eau. Cette etude montre que les modeles de reseaux
de neurones peuvent raisonnablement prevoir les allocations saisonnieres et les valeurs d’echange dans les marches
de l’eau. Ces modeles peuvent completer d’autres techniques de prevision telles que l’analyse de regression et les
modeles de series chronologiques qui peuvent mieux saisir les non-linearites dans le systeme d’echange de l’eau.
Utilisant une probabilite de 50% pour le facteur de risque de variabilite, le modele d’allocation de l’eau a montre
une faible erreur d’estimation; mais, dans un cas, le modele a sous-estime l’allocation de 21%. Ce peut etre du a
une allocation initiale exceptionnellement basse et des emprunts d’eau sur l’annee future, hors du champ des jeux
de donnees utilises en formation. Dememe le modele de prevision de la valeur d’echange a montre une faible erreur
d’estimation d’environ 11% en 2004/05, probablement due a la secheresse. Dans l’ensemble les modeles donnent
une bonne allocation et une exactitude des previsions des valeurs d’echange, et les determinants des valeurs
echanges identifies par les modeles de reseaux de neurones sont ceux qui sont attendus des modeles econometriques
et de la theorie economique. Copyright # 2009 John Wiley & Sons, Ltd.
*Correspondence to: Dr Shahbaz Khan, Division of Water Sciences, UNESCO, 1, Rue Miollis, 75 732 Paris Cedex 15, SP France.E-mail: [email protected] prevision des allocations d’eau et des valeurs d’echange pour accompagner les marches de l’eau.
Copyright # 2009 John Wiley & Sons, Ltd.

PREDICTING WATER ALLOCATIONS TO ASSIST WATER MARKETS 389
mots cles: irrigation; allocation; echange temporaire d’eau; prix de l’eau trimestriels; reseaux de neurones artificiels; marches de l’eau;previsions economiques
INTRODUCTION
Economic risk is pervasive in agriculture due to climatic variability and irrigated agriculture is no exception. Often
irrigators have to make key decisions on production levels and input investments in the absence of reliable
information on water availability and likely water prices. Water availability is a major determinant of cropping
decisions, underwriting the economic efficiency and financial viability of irrigated agriculture (Zilberman et al.,
1997; Hussain and Hanjra, 2004; Hussain et al., 2004; Gardner, 2005; Khan et al., 2006, 2008). Even in Australia
where water entitlements are legally defined, the actual water supply/allocations depend on total water available in
the river system and are generally a proportion of the full entitlements, based on the reservoir storage and recent
inflows. This coupled with extreme climatic variability accentuates uncertainty for the irrigators on actual water
allocation. Although irrigators can augment their water volumes by buying or selling water in the water markets
(Bjornlund, 2006) but neither the prior information on water allocations nor future water trading prices are
available, deterring irrigators from entering into seasonal trading contracts or hedging against uncertain future
water deliveries (Dwyer et al., 2006; Simmons, 2002).
Irrigators risk forgoing their investments in inputs should actual water availability fall short of the expected
volumes (Babcock and Shogren, 1995; Becker, 1995, 1999; Isik et al., 2003). Under uncertain water allocations, a
crucial decision that irrigators must make at the start of the cropping season is the volume of water to buy or sell in
the water market. The decision further depends on how much water would be available at the start of the irrigation
season; how much water would be available at the end of the irrigation season; and what would be the price of
traded water in the future – all three unknowns but essential elements of the water supply and demand equation. For
instance, in the Murray Darling Basin initial water allocations are announced during July/August and are based on
storage levels and historic minimum inflows to dams during the irrigation months; but these are quite conservative
and often insufficient to ensure a return for a significantly reduced cropping area. Then onwards the allocations are
revised upwards periodically, making available almost always more water as the season proceeds, but uncertainty
impedes effective water management decisions. Seasonal or temporary water trading can assist irrigators to
augment their water supply by buying or selling water for a reasonable summer cropping programme and to
enhance returns to their farming enterprise.
In water-scarce arid environments such as Australia, irrigation water demand well exceeds the water supply thus
creating potential for water trade, but agricultural water markets are thin and characterized by price and supply
uncertainty (Howe et al., 1986; Scheierling et al., 2006). Asymmetric information remains the main obstacle to
water trading decisions for efficient land and water management (Brill et al., 1997; Khanna et al., 2000). For
instance, the water trading prices, also called pool prices, are set by the buyer and seller bids but neither the volume
offers nor the bid prices are available beforehand. The water trading prices are strongly affected by seasonal water
allocations and vary significantly throughout the growing season (Bjornlund and McKay, 2002). The price
variations create uncertainty and discourage irrigators from participating in future water markets. With
imperfect information on water prices, transaction costs could be higher and opportunities for trade may be forgone
(Iglesias et al., 2003; Peterson et al., 2005). The Australian water industry uses its own models for seasonal water
allocation forecasts (Long and McMahon, 1996), but there are no interlinked models for predicting water trading
prices.
The classic supply and demand model suggests that when water allocations are higher, volumes traded are likely
to be higher and water trading prices lower. Alternatively, when water supply/allocations are lower, water trading
prices would be higher. This textbookmodel on water markets is tested using the artificial neural network approach.
Specifically this study uses a neural network model to forecast seasonal water allocations and water trading prices,
to help farmers to make better land and water management decisions. The neural network models can accurately
predict and forecast both seasonal water allocations as well as water trading prices. The model can also identify the
key determinants of water allocation and water trading prices. Data management and institutional platforms are
required to deploy the model to empower irrigators through better water allocations and price forecasts.
Copyright # 2009 John Wiley & Sons, Ltd. Irrig. and Drain. 59: 388–403 (2010)
DOI: 10.1002/ird

390 S. KHAN ET AL.
STUDY SETTINGS
The data pertain to the study settings located in the Murray River Basin of Australia, where the Murray Irrigation
Limited (MIL) supplies a bulk water entitlement of 1479GLyr�1 to irrigators in the Berriquin, Denimein,
Deniboota and Wakool Irrigation Districts, and Tullakool Irrigation Area (Map 1). This includes some 2416
landholdings with a total area of 748 000 ha, as well as water supplies for eight towns. Murray Irrigation’s average
annual water business stands at about 7.7% of the irrigation water used in Australia (Murray Irrigation Limited
(MIL), 2006). The land use pattern covers broadacre crops, including cereal and oilseeds, rice, and annual pasture
for grazing and dairy stock. Water allocation and trading are subject to regulations as explained below.
Seasonal water allocations
In the Murray Darling Basin, a rigorous regulatory framework is used for water allocations. Available water
supplies are allocated on a priority basis first to the high security water uses such as the urban sector and permanent
crops. The general security water allocations are determined by the volume of water held in storage at the start of
the agricultural year (July–August), the minimum likely tributary inflows and the amount of water contributed from
the Darling River in the Lower Murray Darling Basin. The amount of water required for environmental flows,
essential requirements, losses in conveyance, and net carryover into the next year is estimated. Then the provisions
for high security entitlements are made and the remaining volume of water determines the general security
allocations. This water can be traded in the market on a temporary or permanent basis, subject to certain regulatory
restrictions, and is the subject of this study.
The high security licences are fewer; the town water supplies have the highest security of all consumptive water
licences followed by horticultural crops. Irrigators with high security water usually receive close to full entitlement.
The general security makes up the bulk ofMurray Irrigation’s business. General security allocations build gradually
Map 1. of Murray Irrigation Limited in NSW, Australia
Copyright # 2009 John Wiley & Sons, Ltd. Irrig. and Drain. 59: 388–403 (2010)
DOI: 10.1002/ird

PREDICTING WATER ALLOCATIONS TO ASSIST WATER MARKETS 391
over the irrigation season as inflows into storages and rivers surge. For instance, a general security irrigation
allocation of 55% would yield 0.55ML (megalitres) per share initially, instead of 1.0ML per share. This paper
deals with the forecasting of the general security water allocation and prices of temporary traded water. The general
security water allocations are highly variable and uncertain. In 1995 the Murray Darling Basin Commission
imposed a cap on water diversions, effectively limiting the volume of diversions in each year. The cap was set at the
volume of water that would have been used with 1993/94 levels of irrigation development, assuming similar
climatic conditions for the year in question. Further restrictions on water diversions for irrigators occurred in 1999–
2000 when environmental flow rules were enacted, which effectively reduced the supply to irrigators by a further 4–
5% of entitlement (Quiggin, 2006).
The water cap and environmental flow regulations have meant lower water allocations for agriculture, especially
for the general security users. For instance, the average pre-cap long-term general security water allocation was
about 124% while it fell to 68% post-cap. The end of the year general security water allocations over the
past three years were well below average, from the record low of 55% in the 2003/04 drought, followed by 42% in
2004/05 and 33% in 2005/06 (Table I). Recently the general security allocations have been as low as 20%. Over
time contraction in water supply/allocations has meant higher uncertainty for the irrigators.
Water markets
Australia has a long history of water markets (Bjornlund and McKay, 2002). Temporary water trading
commenced in the late 1980s in South Australia. Today markets for trade in seasonal irrigation water allocations,
also referred to as temporary water trading, are well established in the states of New South Wales, South Australia
and Victoria. Irrigators can use or sell a part of their entitlement any time during the season. For instance, when
the announced allocation is 50%, an irrigator with 100ML of general security licence can use or sell up to 50ML
during that season. Alternatively the irrigator can increase the available volume by buying water from a willing
seller’s allocated volume. Water transfer fees are levied for facilitating water trading transactions. Watermove
(www.watermove.com.au), a company that facilitates water trading, collects the transfer fee and forwards it to the
irrigation company. The seller’s fees are about AU$75 per trader while the buyer pays 3% duty plus 10% general
Table I. Murray River Valley general security water allocation as a percentage of entitlements for 1990/91 to 2005/06
Year August October February
1990–91 100 120 1351991–92 100 130 1351992–93 90 130 1301993–94 130 130 1301994–95 95 95 951995–96 90 92 100a
1996–97 100 100 1001997–98 57 76 841998–99 11 79 931999–00 6 17 30a
2000–01 30 65 952001–02 19 65 1052002–03 10 10 102003–04 15 37 552004–05 0 28 422005–06 15 33 33Average pre-cap 92 114 124Average post-cap 32 55 68
aIntroduction of cap/limit on maximum water withdrawals from the river system.bIntroduction of environmental flow regulations.Data source: MIL (2006).
Copyright # 2009 John Wiley & Sons, Ltd. Irrig. and Drain. 59: 388–403 (2010)
DOI: 10.1002/ird
392 S. KHAN ET AL.
sales tax of the total sale value (Australian dollars: 1 AU$¼ 0.80 US$). The bids can be submitted online or by
phone or via water traders or brokers.
Various exchange rates are imposed to account for delivery losses and any third-party impacts such as changes in
return flows and in-stream salinity. Water transfer exchange rates account for the spatial impacts of trading, moving
water between locations, and the conversion of entitlements from one form (and reliability) to another. All
temporary water trade is subjected to a deduction for losses prior to the water transaction being completed. For
example, if a shareholder in the MIL buys 100ML from another irrigation area at AU$100ML�1, the buyer would
receive 85ML; the MIL will retain 15ML for conveyance losses in their system. The successful seller in the other
irrigation area would have their annual allocation reduced by 100ML and will earn AU$10 000 less the Watermove
fees. Water trading reallocates water to the higher-value use but must account for the transaction costs (see Hearne
and Easter, 1997; Smith and Roumasset, 2000, Gomez-Limon, 2004).
Water trading is subject to a set of regulations. These involve placing limits on where water can be traded and the
mechanisms for setting the prices. The trading zones are designed to minimize adverse impacts of large trades on
other water users and the environment (Heaney et al., 2006). Ideally water markets are envisioned to enhance
allocative efficiency without impacting on the environment or social equity and regional distribution of the benefits
of public/private investments in irrigation.
Water trading prices
The water trading has gradually increased after the Murray Darling Basin Commission’s cap on water diversion,
since physical movement of water from one area to another is the only way to expand irrigated agriculture. Since the
start of the water exchange in 1998, the volume of water traded throughout the area has risen steadily; for instance
about 95 000 ML of temporary water with a market value of about AU$4.3 million were traded between August
2005 and May 2006 in the MIL (2006).
The water trading prices are determined by the market forces of supply and demand. The market clearing price is
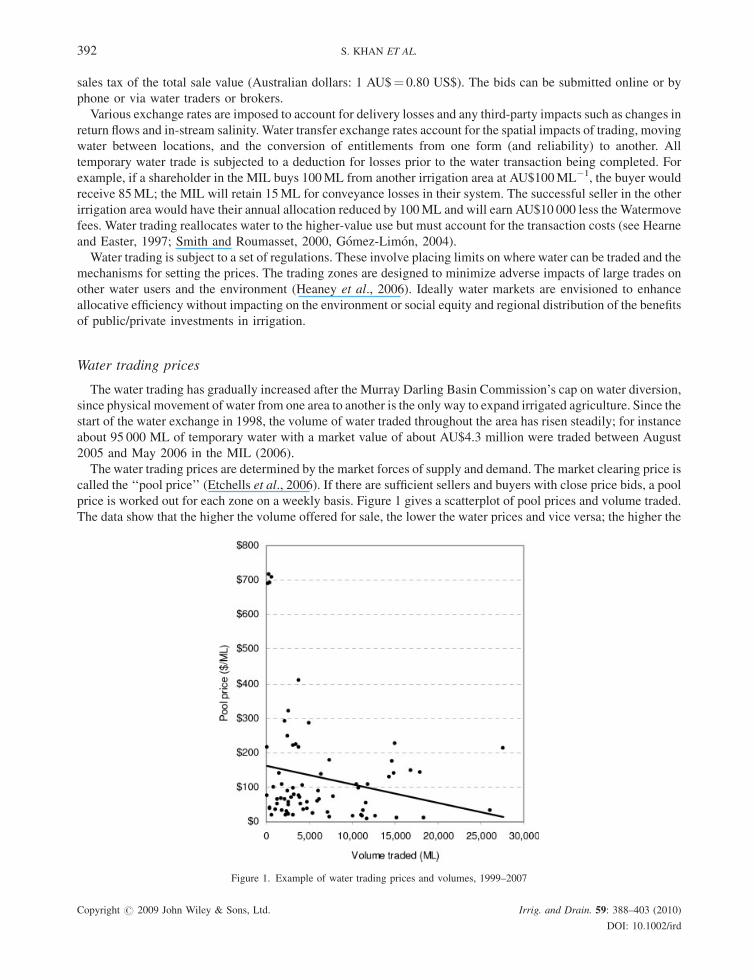
called the ‘‘pool price’’ (Etchells et al., 2006). If there are sufficient sellers and buyers with close price bids, a pool
price is worked out for each zone on a weekly basis. Figure 1 gives a scatterplot of pool prices and volume traded.
The data show that the higher the volume offered for sale, the lower the water prices and vice versa; the higher the
Figure 1. Example of water trading prices and volumes, 1999–2007
Copyright # 2009 John Wiley & Sons, Ltd. Irrig. and Drain. 59: 388–403 (2010)
DOI: 10.1002/ird

Figure 2. Temporary water trading price dispersion and water sale. Data source: Murray Irrigation Limited (MIL) (2006)
PREDICTING WATER ALLOCATIONS TO ASSIST WATER MARKETS 393
water allocation, the more water can be traded but trading prices are lower (Figures 2 and 3). Thus water trading
volumes and prices are generally reflective of water scarcity. This supports the view in the economic literature that
prices are negatively correlatedwith supply; prices surgewith an increase inwater scarcity or decrease inwater allocation.
The data support the above argument. For example in 2002/03, water trading prices were high compared to other
years because of water scarcity due to drought; during this year seasonal water allocations were just 10% of the total
water entitlements (Table I). Water scarcity drove up the market clearing pool prices. Overall this suggests that the
water market behaves as if water were an economic good (on this point see Gomez-Limon and Riesgo, 2004); and
water trading behaviour seems to follow the conventional water supply and demand model. This fuels the hope that
rational neural network models which act like humans could be used as tools to forecast water allocation and
trading prices. The neural network approach has not been applied to date for water allocation and trading issues.
THE MODEL
A brief review
Mostly the conventional modelling techniques such as regression analysis and time series analysis,
autoregressive moving average or a combination of these have been used by water managers for supply and demand
analysis (Kastens et al., 1995; Anselin, 2002). Due to inherent complexity, non-linearity of the allocation
environments and impossibility of building a linear relationship between water allocations of winter and summer
periods, an artificial neural network method was selected. For forecasting, the neural network approach appears to
be the best modelling method currently available as it can capture non-linearities in the system without human
intervention. This was the main motivation for using the neural network approach for this study.
Neural networks, a simplified model of biological neuron systems, can emulate some of the observed properties
of human nervous systems such as adaptive learning from historic data to seek data patterns and predict outcomes.
Copyright # 2009 John Wiley & Sons, Ltd. Irrig. and Drain. 59: 388–403 (2010)
DOI: 10.1002/ird

Figure 3. Average monthly water trading, pool prices and water allocation in the study settings (1999/00– 2005/06) Data source: MurrayIrrigation Limited (MIL) (2006)
394 S. KHAN ET AL.
These are capable of storing data weights to recall and recognize them at a later stage, like the human brain does
(Cancelliere et al., 2002). During training the unknown weights of the artificial neural network (ANN) are
determined. At a later stage the ANN computes the output using the stored weights (irrespective of the fact whether
the data are available or not). The network learns by mistakes, iteratively taking care to minimize mistakes through
practice (Nowlan and Hinton, 1992). Once it completes its learning, it can be assigned to forecast for unseen inputs
to predict unavailable outputs. Non-linearity issues within input and output data sets are solved by introducing
hidden layers into the network.
The neural network models have been widely used in the water sector, however as such the ANN has not been
applied to the two-pronged problem addressed by this study: seasonal water allocation and water prices. Some
examples include:
� R
Copyr
esource pricing applications. These include forecasting financial and economic time series (Kaastra and
Boyd, 1996); stock price predictions (Tsang et al., 2007); mutual fund asset value forecasting (Chiang et al.,
1996); and a comparison of artificial neural network and time series models for forecasting commodity prices
(Kohzadi et al., 1996; Shahwan and Odening, 2007); electronic commerce systems for selling agricultural
products (Wen, 2007); short-term food price forecasting (Haofei et al., 2007); forecasting hog prices (Hamm
and Brorsen, 1997); forecasting residential property prices (Wilson et al., 2002); cost functions predictions
(Fleissig et al., 2000); business cycle asymmetries and GDP growth rates (Kiani, 2005); and a review of neural
network applications in finance (Wong et al., 1997; Wong and Selvi, 1998).
� W
ater economics. These include modelling cost flow forecasting for water pipelines (Boussabaine et al.,1999); forecasting of electricity prices (Gareta et al., 2006); predicting real-time peak price in the newly
introduced hydropower market (Arciniegas Rueda and Marathe, 2005) and forecasting day-ahead electricity
prices (Garcıa-Gonzalez et al., 2007); and prediction of water pipe asset life (Achim et al., 2007). The ANN
ight # 2009 John Wiley & Sons, Ltd. Irrig. and Drain. 59: 388–403 (2010)
DOI: 10.1002/ird

Pw2ðJ
f ðPw
Copyr
PREDICTING WATER ALLOCATIONS TO ASSIST WATER MARKETS 395
models have also been used for water allocations (Aqil et al., 2007; Elgaali and Garcia, 2007; Pulido-Calvo
and Portela, 2007).
Neural networks are being used in agricultural research at an increasing rate, but uses published in economics or
agricultural economics journals are few; they are mainly from agricultural engineering, hydrology, agronomy, or
food sciences. More recently, in agricultural economics related areas, neural networks have been applied in arenas
such as crop yield prediction, price prediction, futures trading, credit scoring, and production function estimation
(Kastens et al., 1995).
This brief review suggests that the combined water allocation and pricing forecast models using neural network
models are non-existent. This gap provides another motive and justification for applying neural network models to
water trading.
To forecast the end of the season water allocation and temporary water trading prices, two separate models were
developed. The month of August was chosen to represent the initial general security allocation month and January
was selected to represent the end of the major water demand period. It has been found that there is a high level of
correlation between sea surface temperature and inflows to the dams in theMurrayDarlingBasin (Khan et al., 2004),
through which water is supplied to the study settings. In the aforementioned study, correlations between the sea
surface temperature and inflows to damswere calculated for each grid point of a global sea surface temperaturemesh
of (28� 28) on a monthly, three-monthly and seasonal basis, with lag time of up to two years. To forecast seasonal
water allocation, commonly used forecast parameters such as Southern Oscillation Index (SOI) and sea surface
temperature (SST) and other climate variability indicators were therefore used. The empirical model for forecasting
water allocation was:
0
i
Water AllocationJan ¼f ðAllocationAug; SST1; SST2; SOI; RiskJanÞ
(1)
where
Water AllocationJan
ght # 2009 John Wil
¼
ey & Sons,
Predicted water allocation in January (%)
AllocationAug ¼ Initial water allocation announcement in August (%) SST1 ¼ Highly correlated sea surface temperature location in the Indian Ocean (8C) SST2 ¼ Highly correlated sea surface temperature location in the Tasman Sea (8C) SOI ¼ Southern Oscillation Index (a climate factor without any unit) RiskJan ¼ January allocation risk factor (probability of water allocation for the prediction month)The input variables were selected based on the empirical literature on water markets (Young, 2005; Bjornlund
and Rossini, 2005; Etchells et al., 2006;Ward, 2007).Water trading prices are influenced by a number of supply and
demand factors, including: seasonal water allocations; relativewater scarcity; current output and commodity prices
(Etchells et al., 2006); and an increase in the marginal value product of water towards its potential maximum value
(Young, 2005). The empirical model used for forecasting water trading prices was:
07anÞ ¼2006ðSepÞ;Pw
2006ðAugÞ;Pc
2006ðSepÞ;Pg
2006ðSepÞ; Pm
2006ðSepÞ; SPI
2006ðSepÞ;A
2006ðSepÞÞ
(2)
where
Pw(Jan)
¼Ltd.
Predicted water trading prices in January
Pw(Sep) ¼ Temporary traded water prices (AU$ ML�1) in September Pw(Aug) ¼ Temporary traded water prices (AU$ ML�1) in August SPI ¼ Standard Precipitation Index in September (see McKee et al., 1993) Pc ¼ Average cereal (wheat, maize, oat, rice) price (AU$ t�1) in September Pg ¼ Grape prices (AU$ t�1) in September Pm ¼ Average meat (beef, lamb, and pork) prices (cent kg�1) in September A(Sep) ¼ General security water allocation (%) in SeptemberIrrig. and Drain. 59: 388–403 (2010)
DOI: 10.1002/ird

396 S. KHAN ET AL.
The data
The data on global sea surface temperature (SST1, SST2) and the Southern Oscillation Index for the past
100 years were obtained from the National Climatic Data Centre, Asheville, North Carolina. A monthly extended
reconstruction of global sea surface temperature was produced, based on Comprehensive Ocean–Atmosphere
Dataset (COADS) Release 2 containing observations from the 1854–1997 period. The average monthly standard
precipitation index, a normalized continuous rainfall variability function, from January 1998 to August 2006, for
four major regions in the study area was computed from rainfall data. The index is based on statistical techniques,
which can quantify the degree of wetness by comparing 3-, 6-, 12- or 24-monthly rainfall totals with the historical
rainfall data from the same periods. The rainfall data were obtained from the Bureau of Meteorology, Australia
(http://www.bom.gov.au/silo/).
The historical data on average monthly water trading volumes and prices from January 1998 toMarch 2007 were
obtained from the Watermove (2007), Water Exchange (2007), and Murray Irrigation Limited (MIL, 2007)
websites, and various environmental reports of the latter. The data on general and high security water allocation
came from the website and various annual and environmental reports of Murray Irrigation Limited (MIL, 2006,
2007). The historical monthly price data were extracted from various publications of the Australian Bureau of
Statistics and Australian Bureau of Agricultural and Resource Economics (2007). It must be mentioned that these
data sources are highly credible; therefore no analysis was essential to check the presence of any spurious data.
Causality tests were performed to ensure that selected input variables do not have a causality link with the output
variable. For instance, the Durbin–Watson statistic was 1.66 for the water prices model, showing very weak
causality between current and next period prices.
RESULTS
The model training
For model development, a processing element in the ANN was arranged as a simple model of a biological
neuron. A feed forward neural network model that has a single hidden layer and with water trading data as
inputs was first used to predict water prices. Non-linear relationships can only be modelled by neural
networks with a minimum of a single hidden layer. The number of nodes in the hidden layers was determined
by trial and error until a neural network giving the best prediction was identified. This number should not be
too large as it may result in overtraining of the model. The ANN model was developed based on the
phenomenon of error minimization. Training of the network involved adjusting weights linking nodes in the input
layer to the hidden layer, and in the hidden layer to the output layer so that the root mean square error was
minimized.
The data set was split randomly into three sub-samples, with the first sub-sample being used for training, the
second for validation, and the third for testing. Out of the total 92 rows of data – each row representing one month –
18 rows were selected for cross validation and 11 rows were selected for the test data set. The model training
continues as long as the mean square error decreases in both the first and second sub-samples. When the mean
square error decreases in the first sub-sample but starts to increase in the second, this indicates that the neural
network model is being overtrained and therefore training was stopped to prevent overfitting. The third sub-sample
was then used to validate the neural network.
A set of ANN model topologies were tried and finally a radial basis function network was selected, due to its
superior performance in terms of coefficient of determination and standard error of the estimate, and was
progressively trained for 60 000 iterations (an illustrative network is given in Figure 4). Lower mean square
error values of the normalized training data set mean that the network has learnt well, conforming to ANN’s
primary principle of error minimization (Table II). The best network results for the water allocation model were
found after 5781 iterations. Similarly the best network results for the water trading model were found after 59 899
iterations.
Copyright # 2009 John Wiley & Sons, Ltd. Irrig. and Drain. 59: 388–403 (2010)
DOI: 10.1002/ird

Figure 4. Generic illustrative network – input, two hidden layers and output layer are displayed (details of final network used in study are givenin the text). This figure is available in colour online at wileyonlinelibrary.com
PREDICTING WATER ALLOCATIONS TO ASSIST WATER MARKETS 397
The model validation
The above models were evaluated using a part of the historic data, which were not used during training, to
generate test outputs. The performance measures for water allocation and water trading models are given in
Table III and Figure 5. To make these measures comprehensible, the range of input data is reported in Table IV. The
results obtained from the models have low mean absolute errors, both for the water allocation model (0.7789) as
well as the water trading model (0.0121). The water allocation model indicates a high correlation coefficient
(r¼ 0.994) between the actual and predicted model water allocation. Similarly, the water trading model showed a
high correlation (r¼ 0.993) between the actual and predicted model water prices.
Water allocation and water trading price forecasts
The overall performance of the model would be judged by its ability to accurately predict water allocation and
prices. Despite significant variation in water allocation and prices during 2002–03 and later in 2006–07, the model
predicted values appeared to fit the actual data curves closely (Figure 6).
As expected, the contribution of different parameters to water allocation and price forecasts varies (Table V). In
the water allocation forecast model the main factors determining the January water allocation were: the start of the
season water allocation (40%), January risk factor (37%); and sea surface temperature related to the Blowering dam
(15%). In the water trading price forecast model, the main determinants of prices were: the start of the season water
trading prices (38%); water allocation (15%); cereal prices (20%); meat prices (14%); and grape prices (12%). The
Table II. A comparative overview of model performance
Best network Water allocation model Water pricing model
Training data set Cross validation data set Training data set Cross validation data set
Run number 4 1 3 4Iterations 5 781 5 781 59 899 59 899Minimum MSE 0.0020 0.0014 0.0003 0.0008Final MSE 0.0002 0.0014 0.0003 0.0008
MSE¼Mean square error.
Copyright # 2009 John Wiley & Sons, Ltd. Irrig. and Drain. 59: 388–403 (2010)
DOI: 10.1002/ird

Table III. Performance measures of forecast from the best model found for test data
Performance type Water allocation model Water pricing modelAverage of minimum MSEs Average of minimum MSEs
MSE 0.02911 0.00020NMSE 0.40143 0.0190Mean abs. error 0.77890 0.0121Min abs. error 0.00464 0.0022Max abs. error 3.20618 0.0232Correlation coefficient 0.994 0.993
MSE¼Mean square error.NMSE¼Network normalized values of normalization.Abs¼Absolute error.
Figure 5. Comparison of actual and model forecast from the test data set which has never been seen by the trained model
Copyright # 2009 John Wiley & Sons, Ltd. Irrig. and Drain. 59: 388–403 (2010)
DOI: 10.1002/ird
398 S. KHAN ET AL.

Table IV. Summary of modelled inputs
Item Unit Mean Minimum Maximum
Temporary water trading price AU$/ML 111 9 716General security water allocation % 86 10 135Standard Precipitation Index Index 0.003 �2.57 2.52Cereal priceWheat AU$ t�1 207 143 361Maize AU$ t�1 227 150 433Oat AU$ t�1 182 130 353Barley AU$ t�1 182 92 364Rice AU$ t�1 257 184 407
Meat priceBeef c kg�1 281 191 363Lamb c kg�1 302 141 453Poultry c kg�1
Pork c kg�1 244 183 312Grape prices AU$ t�1 583 356 828
Notes: All values are reported in AU$ (AU$1.0¼US$0.80).
Figure 6. Comparison between actual and model predicted outputs for the entire data set
Copyright # 2009 John Wiley & Sons, Ltd. Irrig. and Drain. 59: 388–403 (2010)
DOI: 10.1002/ird
PREDICTING WATER ALLOCATIONS TO ASSIST WATER MARKETS 399

Table V. Summary of parameter contribution for water allocation and water trading model for the Murray Irrigation Area
Performance type Water allocation model (%) Water pricing model (%)
January risk factor 37SST cluster 1 (Indian Ocean) 15SST cluster 2 (Tasman Sea) 3Southern Oscillation Index (SOI) 5General security water allocation (Sep) 40 15Temporary water trading price (Pw(Sep)) 20Temporary water trading price (Pw(Aug)) 18Standard Participation Index (Sep) 1Cereal price (Sep)
a 20Grape prices (Sep) 12Meat price (Sep)
b 14Total 100 100
aCereal includes wheat, maize, oat, barley and rice.bMeat includes beef, lamb, and pork.
400 S. KHAN ET AL.
standard precipitation index made very little contribution to temporary water trading price forecasts, probably
because its impact was mediated by the seasonal water allocation regulations.
The empirical estimation
The models were used for predicting water allocation and temporary water trading prices for August 1999 to
January 2006. The two models show high accuracy in predicting water allocation and water trading prices
(Table VI). The models show good predictive capabilities, as the model predicted water allocation and temporary
water trading prices were close to the actual water allocation and prices. Using a 50% probability risk factor for
water variability, the water allocation model showed a minor estimation error; however, in one instance the model
underestimated the water allocation by 21%. This may be due to exceptionally low starting water allocations and
borrowing of water from future years which was outside the training data sets. Similarly, the water trading forecast
Table VI. Application of artificial neural network models for forecasting percentage general security water allocation andtemporary water trading prices
Year Water allocation model Water trading model
Actual waterallocation
Model predictedallocationa
Actual price Model predictedpricea
August January January % error September January January % error
1999 50 73 65 �11 46 33 35 62000 59 90 90 0 49 37 34 �82001 47 72 57 �21 22 44 44 02002 38 38 45 18 176 286 290 12003 17 41 39 �5 125 82 80 �22004 20 39 40 3 107 64 63 �22005 21 45 40 �5 50 93 83 �112006 — — — — 181 602 652 8
aAt 50% risk factor.
Copyright # 2009 John Wiley & Sons, Ltd. Irrig. and Drain. 59: 388–403 (2010)
DOI: 10.1002/ird

PREDICTING WATER ALLOCATIONS TO ASSIST WATER MARKETS 401
model showed a modest estimation error of about 11% during 2004/05 probably due to drought. Overall the models
have good water allocation and price forecasting accuracy.
CONCLUSIONS AND IMPLICATIONS
Economic risk is pervasive in agriculture and irrigated agriculture is no exception. Irrigators often make uncertain
land and water management investment decisions due to the lack of knowledge. Limited and uncertain water
supplies are the main factor impacting on an irrigator’s productivity and profitability. Irrigators can adjust their
water supplies by water trading, but neither future water allocations nor water trading prices are known in advance.
This paper shows that artificial neural network (ANN) models can accurately predict water allocations and
temporary water trading prices, given their adaptive learning ability to simulate complex and non-linear processes
often not addressed by the average behaviour represented by conventional regression or time series analysis. The
model can predict and forecast water allocations and trading prices with an error margin of less than 5%. Significant
determinants of future temporary water trading prices include current water trading prices, general water security
allocation, and the price of cereals, grapes and meat. Significant determinants of water allocation include the initial
general security water allocation to irrigators, water availability in the dam, and climatic factors impacting on the
variability in rainfall. Overall the models have good water allocation and price prediction accuracy, and the
determinants of water allocation and water trading prices identified by the models are those expected of the
econometric models/economic theory.
Apart from predicting actual prices very closely, the models can accurately forecast water trading prices into
the future – beyond their training range. This can be useful; the models could be integrated into commercial
software such as spreadsheets and automatic real-time data management systems to provide water price forecasts
for irrigators. These results have an applied value for addressing price risk volatility, contingency planning,
irrigation infrastructure investments and asset management decisions, and regional development planning.
Furthermore, the modelling framework can be used to forecast future water allocations or water trading prices in
other settings to generate valuable information for farmers, irrigation companies and environmental users.
ACKNOWLEDGEMENTS
The authors carried out these studies while working at CSIRO Land and Water and Charles Sturt University,
Australia. Funding support by the Cooperation Research Centre for Sustainable Rice Production, Land and Water
Australia and the Murray Irrigation Limited, for different aspects of this work is appreciated.
REFERENCES
AchimD, Ghotb F, Mcmanus KJ. 2007. Prediction of water pipe asset life using neural networks. Journal of Infrastructure Systems 13(1): 26–30.
Anselin L. 2002. Under the hood: issues in the specification and interpretation of spatial regression models. Agricultural Economics 27(3): 247–
267.
Aqil M, Kita I, Yano A, Nishiyama S. 2007. Neural networks for real time catchment flow modeling and prediction. Water Resources
Management 21(10): 1781–1796.
Arciniegas Rueda IE, Marathe A. 2005. Important variables in explaining real-time peak price in the independent power market of Ontario.
Utilities Policy 13(1): 27–39.
Australian Bureau of Agricultural and Resource Economics. 2007. Monthly price level data. http://www.abareconomics.com/. Last accessed on
June 2007.
Babcock BA, Shogren JF. 1995. The cost of agricultural production risk. Agricultural Economics 12(2): 141–150.
Becker N. 1995. Value of moving from central planning to a market system: lessons from the Israeli water sector. Agricultural Economics 12(1):
11–21.
Becker N. 1999. A comparative analysis of water price support versus drought compensation scheme. Agricultural Economics 21(1): 81–92.
Bjornlund H. 2006. Can water markets assist irrigators managing increased supply risk? Some Australian experiences. Water International
31(2): 221–232.
Bjornlund H, McKay J. 2002. Aspects of water markets for developing countries: experiences from Australia, Chile, and the US. Environment
and Development Economics 7(4): 769–795.
Copyright # 2009 John Wiley & Sons, Ltd. Irrig. and Drain. 59: 388–403 (2010)
DOI: 10.1002/ird

402 S. KHAN ET AL.
Bjornlund H, Rossini P. 2005. Fundamentals determining prices and activities in the market for water allocations. International Journal of Water
Resources Development 21(2): 355–369.
Boussabaine AH, Thomas R, Elhag TMS. 1999. Modelling cost-flow forecasting for water pipeline projects using neural networks. Engineering
Construction and Architectural Management 6(3): 213–224.
Brill E, Hochman E, Zilberman D. 1997. Allocation and pricing at the water district level. American Journal of Agricultural Economics 79(3):
952–963.
Cancelliere A, Giuliano G, Ancarani A, Rossi G. 2002. A neural networks approcah for deriving irrigation reservior operating rules. Water
Resources Management 16(1): 71–88.
Chiang WC, Urban T, Baldridge G. 1996. A neural network approach to mutual fund net asset value forecasting. Omega 24(2): 205–215.
Dwyer G, Douglas R, Peterson D, Chong J, Maddern K. 2006. Irrigation externalities: pricing and charges. Productivity Commission Staff
Working Paper, Melbourne, Australia.
Elgaali E, Garcia LA. 2007. Using neural networks to model the impacts of climate change on water supplies. Journal of Water Resources
Planning and Management 133(3): 230–243.
Etchells T, Malano HM,Mcmahon TA. 2006. Overcoming third party effects fromwater trading in the Murray-Darling Basin.Water Policy 8(1):
69–80.
Fleissig AR, Kastens T, Terrell D. 2000. Evaluating the semi-nonparametric Fourier, aim, and neural networks cost functions. Economics Letters
68(3): 235–244.
Garcıa-Gonzalez J, Parrilla E, Mateo A. 2007. Risk-averse profit-based optimal scheduling of a hydro-chain in the day-ahead electricity market.
European Journal of Operational Research 181(3): 1354–1369.
Gardner BL. 2005. Causes of rural economic development. Agricultural Economics 32(s1): 21–41.
Gareta R, Romeo LM, Gil A. 2006. Forecasting of electricity prices with neural networks. Energy Conversion and Management 47(13–14):
1770–1778.
Gomez-Limon JA, Riesgo L 2004. Irrigation water pricing: differential impacts on irrigated farms. Agricultural Economics 31: 47–66.
Hamm L, Brorsen BW. 1997. Forecasting hog prices with a neural network. Journal of Agribusiness 15(1): 37–54.
Haofei Z, Guoping X, Fangting Y, Han Y. 2007. A neural network model based on the multi-stage optimization approach for short-term food
price forecasting in China. Expert Systems with Applications 33(2): 347– 356.
Heaney A, Dwyer G, Beare S, Peterson D, Pechey L. 2006. Third-party effects of water trading and potential policy responses. The Australian
Journal of Agricultural and Resource Economics 50(3): 277–293.
Hearne RR, Easter WK. 1997. The economic and financial gains from water markets in Chile. Agricultural Economics 15(3): 187–199.
Howe CW, Schurmeier DR, Shaw WDJ. 1986. Innovative approaches to water allocation: the potential for water markets. Water Resources
Research 22(4): 439–445.
Hussain I, Hanjra MA. 2004. Irrigation and poverty alleviation: review of the empirical evidence. Irrigation and Drainage 53(1): 1–15.
Hussain I, Mudasser M, Hanjra MA, Amrasinghe U, Molden D. 2004. Improving wheat productivity in Pakistan: econometric analysis using
panel data from Chaj in the upper Indus Basin. Water International 29(2): 189–200.
Iglesias E, Garrido A, Gomez-Ramos A. 2003. Evaluation of drought management in irrigated areas. Agricultural Economics 29: 211–
229.
Isik M, Coble KH, Hudson D, House LO. 2003. A model of entry–exit decisions and capacity choice under demand uncertainty. Agricultural
Economics 28(3): 215–224.
Kaastra I, Boyd M. 1996. Designing a neural network for forecasting financial and economic time series. Neurocomputing 10(3): 215–
236.
Kastens T, Featherstone A, Biere W. 1995. A neural network premier for agricultural economists. Agricultural Finance Review 55: 54–73.
Khan S, Dassanayake D, Abbas A. 2004. Ocean based water allocation forecasts using an artifical intelligence approcah. http://www.mssan-
z.org.au/modsim05/papers/khan_1.pdf, ModSim Conference, Melbourne, Australia; 1667–1673.
Khan S, Triaq R, Yuanlai C, Blackwell J. 2006. Can irrigation be sustainable? Agricultural Water Management 80(1–3): 87–99.
Khan S, Rana T, HanjraMA. 2008. A cross disciplinary framework for linking farms with regional groundwater and salinity management targets.
Agricultural Water Management 95: 35–47.
Khanna M, Isik M, Winter-Nelson A. 2000. Investment in site-specific crop management under uncertainty: implications for nitrogen pollution
control and environmental policy. Agricultural Economics 24: 9–21.
Kiani KM. 2005. Detecting business cycle asymmetries using artificial neural networks and time series models.Computational Economics 26(1):
65–89.
Kohzadi N, Boyd MS, Kermanshahi B, Kaastra I. 1996. A comparison of artificial neural network and time series models for forecasting
commodity prices. Neurocomputing 10(2): 169–181.
Long BA, McMahon TB. 1996. Review of research and development opportunities for using seasonal climate forecasts in the Australian water
industry. Occasional Paper CV02/96. Land and Water Resources Research and Development Corporation Canberra; Australia.
McKee TB, Doesken NJ, Kleist J. 1993. The relation of drought frequency and duration to time scales. Proceedings of the Eighth Conference
on Applied Climatology; American Meteorological Society, Boston, USA; pp. 179–84. http://ccc.atmos.colostate.edu/relationshipofdrought-
frequency.pdf.
Murray Irrigation Limited (MIL). 2006. Murray Irrigation sustainability report. Murray Irrigation Limited, Australia. http://www.murrayirri-
gation.com.au/download/3258576.pdf.
Murray Irrigation Limited (MIL). 2007. Murray Irrigation Limited Water Trading Data. http://www.murrayirrigation.com.au/ http://www.mur-
rayirrigation.com.au/watexch/, last accessed on June 2007.
Copyright # 2009 John Wiley & Sons, Ltd. Irrig. and Drain. 59: 388–403 (2010)
DOI: 10.1002/ird

PREDICTING WATER ALLOCATIONS TO ASSIST WATER MARKETS 403
Nowlan SJ, Hinton GE 1992. Simplifying neural networks by soft weight sharing. In Advances in Neural Information Processing Systems (Vol 4)
Moody J, Hanson S, Lippmann R (eds). Morgan Kaufamann: San Mateo, CA.
Peterson D, Dwyer G, Appels DC, Fry J. 2005. Water trade in the southern Murray-Darling Basin. The Economic Record 81(S1): S115–S127.
Pulido-Calvo I, Portela MM. 2007. Application of neural approaches to one-step daily flow forecasting in Portuguese watersheds. Journal of
Hydrology 332(1–2): 1–15.
Quiggin J. 2006. Repurchase of renewal rights: a policy option for the National Water Initiative. The Australian Journal of Agricultural and
Resource Economics 50(3): 425–435.
Scheierling SM, Loomis JB, Young RA. 2006. Irrigation water demand: a meta-analysis of price elasticities. Water Resources Research 42(1).
Shahwan T, Odening M. 2007. Forecasting agricultural commodity prices using hybrid neural networks. In Computational Intelligence in
Economics and Finance. Springer: Berlin, Heidelberg; 63–74.
Simmons PR. 2002. Why do farmers have so little interest in futures markets? Agricultural Economics 27(1): 1–6.
Smith RBW, Roumasset J. 2000. Constrained conjunctive-use of engogenously separabale water markets: managing the Wiahole-Waikane
aqueduct. Agricultural Economics 24(61–71).
Tsang PM, Kwok P, Choy SO, Kwan R, Ng SC, Mak J, Tsang J, Koong K, Wong TL. 2007. Design and implementation of NN5 for Hong Kong
stock price forecasting. Engineering Applications of Artificial Intelligence 20(4): 453–461.
Ward FA. 2007. Decision support for water policy: a review of economic concepts and tools. Water Policy 9(1): 1–31.
Water Exchange, 2007. Water Trading Data. http://www.waterexchange.com.au/ Last accessed on June 2007.
Watermove, 2007. Water Trading Data. http://www.watermove.com.au/default.asp?jump¼home/ Last accessed on June 2007.
Wen W. 2007. A knowledge-based intelligent electronic commerce system for selling agricultural products. Computers and Electronics in
Agriculture 57(1): 33–46.
Wilson ID, Paris SD, Ware JA, Jenkins DH. 2002. Residential property price time series forecasting with neural networks. Knowledge-Based
Systems 15(5–6): 335–341.
Wong BK, Bodnovich TA, Selvi Y. 1997. Neural network applications in business: a review and analysis of the literature (1988–95). Decision
Support Systems 19(4): 301–320.
Wong BK, Selvi Y. 1998. Neural network applications in finance: a review and analysis of literature (1990–1996). Information & Management
34(3): 129–139.
Young RA. 2005. Determining the Economic Value of Water: Concepts and Methods. Resources for the Future Press: USA.
ZilbermanD, KhannaM, Lipper L. 1997. Economics of new technologies for sustainable agriculture. The Australian Journal of Agricultural and
Resource Economics 41(1): 63–80.
Copyright # 2009 John Wiley & Sons, Ltd. Irrig. and Drain. 59: 388–403 (2010)
DOI: 10.1002/ird