Predicting outbreaks: a spatial risk assessment of West Nile virus in British Columbia
21
BioMed Central Page 1 of 21 (page number not for citation purposes) International Journal of Health Geographics Open Access Research Predicting outbreaks: a spatial risk assessment of West Nile virus in British Columbia Kaoru Tachiiri 1 , Brian Klinkenberg* 1 , Sunny Mak 1,2 and Jamil Kazmi 1,3 Address: 1 Department of Geography, University of British Columbia, Vancouver, BC, Canada, 2 Epidemiology Services, British Columbia Centre for Disease Control, Vancouver, BC, Canada and 3 Madrone Environmental Services Ltd., Duncan, BC, Canada Email: Kaoru Tachiiri - [email protected]; Brian Klinkenberg* - [email protected]; Sunny Mak - [email protected]; Jamil Kazmi - [email protected] * Corresponding author Abstract Background: West Nile virus (WNv) has recently emerged as a health threat to the North American population. After the initial disease outbreak in New York City in 1999, WNv has spread widely and quickly across North America to every contiguous American state and Canadian province, with the exceptions of British Columbia (BC), Prince Edward Island and Newfoundland. In this study we develop models of mosquito population dynamics for Culex tarsalis and C. pipiens, and create a spatial risk assessment of WNv prior to its arrival in BC by creating a raster-based mosquito abundance model using basic geographic and temperature data. Among the parameters included in the model are spatial factors determined from the locations of BC Centre for Disease Control mosquito traps (e.g., distance of the trap from the closest wetland or lake), while other parameters were obtained from the literature. Factors not considered in the current assessment but which could influence the results are also discussed. Results: Since the model performs much better for C. tarsalis than for C. pipiens, the risk assessment is carried out using the output of C. tarsalis model. The result of the spatially-explicit mosquito abundance model indicates that the Okanagan Valley, the Thompson Region, Greater Vancouver, the Fraser Valley and southeastern Vancouver Island have the highest potential abundance of the mosquitoes. After including human population data, Greater Vancouver, due to its high population density, increases in significance relative to the other areas. Conclusion: Creating a raster-based mosquito abundance map enabled us to quantitatively evaluate WNv risk throughout BC and to identify the areas of greatest potential risk, prior to WNv introduction. In producing the map important gaps in our knowledge related to mosquito ecology in BC were identified, as well, it became evident that increased efforts in bird and mosquito surveillance are required if more accurate models and maps are to be produced. Access to real time climatic data is the key for developing a real time early warning system for forecasting vector borne disease outbreaks, while including social factors is important when producing a detailed assessment in urban areas. Published: 16 May 2006 International Journal of Health Geographics 2006, 5:21 doi:10.1186/1476-072X-5-21 Received: 03 February 2006 Accepted: 16 May 2006 This article is available from: http://www.ij-healthgeographics.com/content/5/1/21 © 2006 Tachiiri et al; licensee BioMed Central Ltd. This is an Open Access article distributed under the terms of the Creative Commons Attribution License (http://creativecommons.org/licenses/by/2.0 ), which permits unrestricted use, distribution, and reproduction in any medium, provided the original work is properly cited.
-
Upload
independent -
Category
Documents
-
view
0 -
download
0
Transcript of Predicting outbreaks: a spatial risk assessment of West Nile virus in British Columbia
BioMed Central
International Journal of Health Geographics
ss
Open AcceResearchPredicting outbreaks: a spatial risk assessment of West Nile virus in British ColumbiaKaoru Tachiiri1, Brian Klinkenberg*1, Sunny Mak1,2 and Jamil Kazmi1,3Address: 1Department of Geography, University of British Columbia, Vancouver, BC, Canada, 2Epidemiology Services, British Columbia Centre for Disease Control, Vancouver, BC, Canada and 3Madrone Environmental Services Ltd., Duncan, BC, Canada
Email: Kaoru Tachiiri - [email protected]; Brian Klinkenberg* - [email protected]; Sunny Mak - [email protected]; Jamil Kazmi - [email protected]
* Corresponding author
AbstractBackground: West Nile virus (WNv) has recently emerged as a health threat to the NorthAmerican population. After the initial disease outbreak in New York City in 1999, WNv has spreadwidely and quickly across North America to every contiguous American state and Canadianprovince, with the exceptions of British Columbia (BC), Prince Edward Island and Newfoundland.In this study we develop models of mosquito population dynamics for Culex tarsalis and C. pipiens,and create a spatial risk assessment of WNv prior to its arrival in BC by creating a raster-basedmosquito abundance model using basic geographic and temperature data. Among the parametersincluded in the model are spatial factors determined from the locations of BC Centre for DiseaseControl mosquito traps (e.g., distance of the trap from the closest wetland or lake), while otherparameters were obtained from the literature. Factors not considered in the current assessmentbut which could influence the results are also discussed.
Results: Since the model performs much better for C. tarsalis than for C. pipiens, the riskassessment is carried out using the output of C. tarsalis model. The result of the spatially-explicitmosquito abundance model indicates that the Okanagan Valley, the Thompson Region, GreaterVancouver, the Fraser Valley and southeastern Vancouver Island have the highest potentialabundance of the mosquitoes. After including human population data, Greater Vancouver, due toits high population density, increases in significance relative to the other areas.
Conclusion: Creating a raster-based mosquito abundance map enabled us to quantitativelyevaluate WNv risk throughout BC and to identify the areas of greatest potential risk, prior to WNvintroduction. In producing the map important gaps in our knowledge related to mosquito ecologyin BC were identified, as well, it became evident that increased efforts in bird and mosquitosurveillance are required if more accurate models and maps are to be produced. Access to realtime climatic data is the key for developing a real time early warning system for forecasting vectorborne disease outbreaks, while including social factors is important when producing a detailedassessment in urban areas.
Published: 16 May 2006
International Journal of Health Geographics 2006, 5:21 doi:10.1186/1476-072X-5-21
Received: 03 February 2006Accepted: 16 May 2006
This article is available from: http://www.ij-healthgeographics.com/content/5/1/21
© 2006 Tachiiri et al; licensee BioMed Central Ltd.This is an Open Access article distributed under the terms of the Creative Commons Attribution License (http://creativecommons.org/licenses/by/2.0), which permits unrestricted use, distribution, and reproduction in any medium, provided the original work is properly cited.
Page 1 of 21(page number not for citation purposes)
International Journal of Health Geographics 2006, 5:21 http://www.ij-healthgeographics.com/content/5/1/21
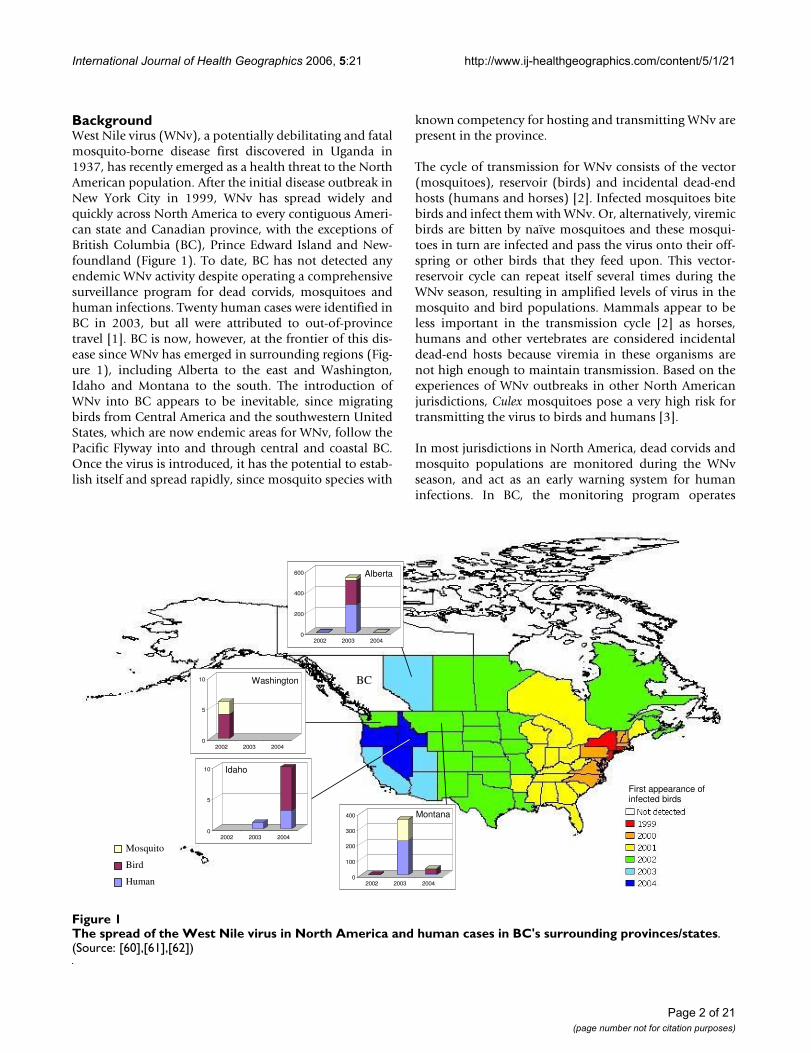
BackgroundWest Nile virus (WNv), a potentially debilitating and fatalmosquito-borne disease first discovered in Uganda in1937, has recently emerged as a health threat to the NorthAmerican population. After the initial disease outbreak inNew York City in 1999, WNv has spread widely andquickly across North America to every contiguous Ameri-can state and Canadian province, with the exceptions ofBritish Columbia (BC), Prince Edward Island and New-foundland (Figure 1). To date, BC has not detected anyendemic WNv activity despite operating a comprehensivesurveillance program for dead corvids, mosquitoes andhuman infections. Twenty human cases were identified inBC in 2003, but all were attributed to out-of-provincetravel [1]. BC is now, however, at the frontier of this dis-ease since WNv has emerged in surrounding regions (Fig-ure 1), including Alberta to the east and Washington,Idaho and Montana to the south. The introduction ofWNv into BC appears to be inevitable, since migratingbirds from Central America and the southwestern UnitedStates, which are now endemic areas for WNv, follow thePacific Flyway into and through central and coastal BC.Once the virus is introduced, it has the potential to estab-lish itself and spread rapidly, since mosquito species with
known competency for hosting and transmitting WNv arepresent in the province.
The cycle of transmission for WNv consists of the vector(mosquitoes), reservoir (birds) and incidental dead-endhosts (humans and horses) [2]. Infected mosquitoes bitebirds and infect them with WNv. Or, alternatively, viremicbirds are bitten by naïve mosquitoes and these mosqui-toes in turn are infected and pass the virus onto their off-spring or other birds that they feed upon. This vector-reservoir cycle can repeat itself several times during theWNv season, resulting in amplified levels of virus in themosquito and bird populations. Mammals appear to beless important in the transmission cycle [2] as horses,humans and other vertebrates are considered incidentaldead-end hosts because viremia in these organisms arenot high enough to maintain transmission. Based on theexperiences of WNv outbreaks in other North Americanjurisdictions, Culex mosquitoes pose a very high risk fortransmitting the virus to birds and humans [3].
In most jurisdictions in North America, dead corvids andmosquito populations are monitored during the WNvseason, and act as an early warning system for humaninfections. In BC, the monitoring program operates
The spread of the West Nile virus in North America and human cases in BC's surrounding provinces/statesFigure 1The spread of the West Nile virus in North America and human cases in BC's surrounding provinces/states. (Source: [60],[61],[62])
First appearance of infected birds
BC
Mosquito
Bird
Human
0
5
10
2002 2003 2004
Washington
0
5
10
2002 2003 2004
0
100
200
300
400
2002 2003 2004
Idaho
Montana
0
200
400
600
2002 2003 2004
Alberta
Page 2 of 21(page number not for citation purposes)
International Journal of Health Geographics 2006, 5:21 http://www.ij-healthgeographics.com/content/5/1/21
between the months of May and October and is coordi-nated by the BC Centre for Disease Control (BCCDC).Dead corvids and adult mosquitoes from across the prov-ince are collected and tested for WNv. The geographiclocation from where the specimens were submitted ismapped in a Geographic Information System (GIS). Sur-veillance data in the form of tables, maps and reports areavailable on the BCCDC website [4].
Spatial risk assessment of WNv, based on mosquito andbird distributions, can help identify areas in the provincethat are at greatest risk for humans. These high risk areascould, for example, receive higher allocation of govern-ment funding to prepare for and respond to the arrival ofWNv and associated human illness. This collection of sur-veillance data, however, only provides point location datathat is usually clustered around highly populated humansettlements and does not provide risk assessment for areasthat lack observations. Fortunately, GIS and geostatisticalanalysis provide an effective solution to this problem byenabling interpolation of mosquito and bird populationsin areas with no observations, based on measured datafrom existing studies. In particular, spatially and tempo-rally continuous datasets such as vegetation cover, tem-perature and rainfall, all of which are important elementsof mosquito population dynamics, are commonly mod-elled in this matter [5,6].
In order to assess the seasonal risk of the disease, healthagencies in some provinces in Canada are now producingtemporal or seasonal maps using temperature data [7,8]to predict mosquito abundance. The current models onlyconsider a simple degree-day model having a single basetemperature value (over which a mosquito growthprogresses) and a simple degree-day accumulation algo-rithm (using the condition under which one generation ofadult mosquitoes emerge, defined as the product of excesstemperature above the base and the number of such days,or heat units) for the entire life of the mosquito. However,it is obvious that such simple model is insufficient to rep-licate the complex biology of mosquitoes [9], in particularin areas such as BC that have a complex topography. Thus,development of a more sophisticated model, with finerspatial resolution, is necessary if we hope to establish aneffective, spatially extensive, early warning system ofpotential WNv outbreak.
In this article we develop a model of mosquito populationdynamics and use this model to produce spatial riskassessment maps of WNv prior to its arrival in BC. This isachieved by combining our mosquito population dynam-ics model with ancillary data within a GIS. In the maps,forecasted high risk areas for WNv in BC are identified bycombining mosquito abundance data with high risk birdabundance data and human population data, which will
provide information that can be used to improve the cur-rent WNv early warning system. Factors not considered inthe current assessment but which can influence the resultsare also discussed.
Our model is one component of an integrated approachthat aims to develop an understanding of the distributionand spread of WNv. Shuai et al.'s recent work [10] on thedevelopment of a real-time WNv monitoring system fordead corvids in Canada represents another important ele-ment of this integrated approach. It is obvious that bothtechnical (e.g., web GIS technology) and scientific (viro-logical and ecological) advances are necessary in order todevelop a more reliable monitoring system for emerginginfectious diseases.
ResultsUsing published data on the relation between tempera-ture and mosquito biology (presented in Table 1), wedeveloped a population dynamics model. This model isthen incorporated into a spatially-explicit risk assessmentmodel that enables us to map the potential WNv risk.
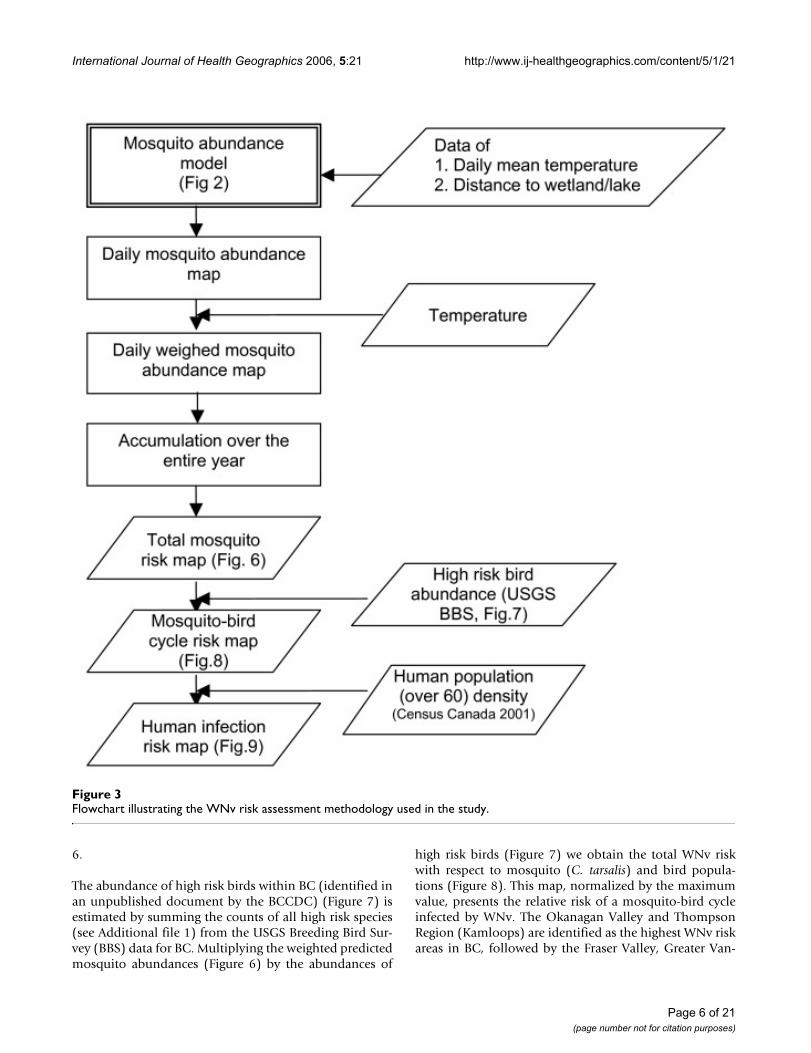
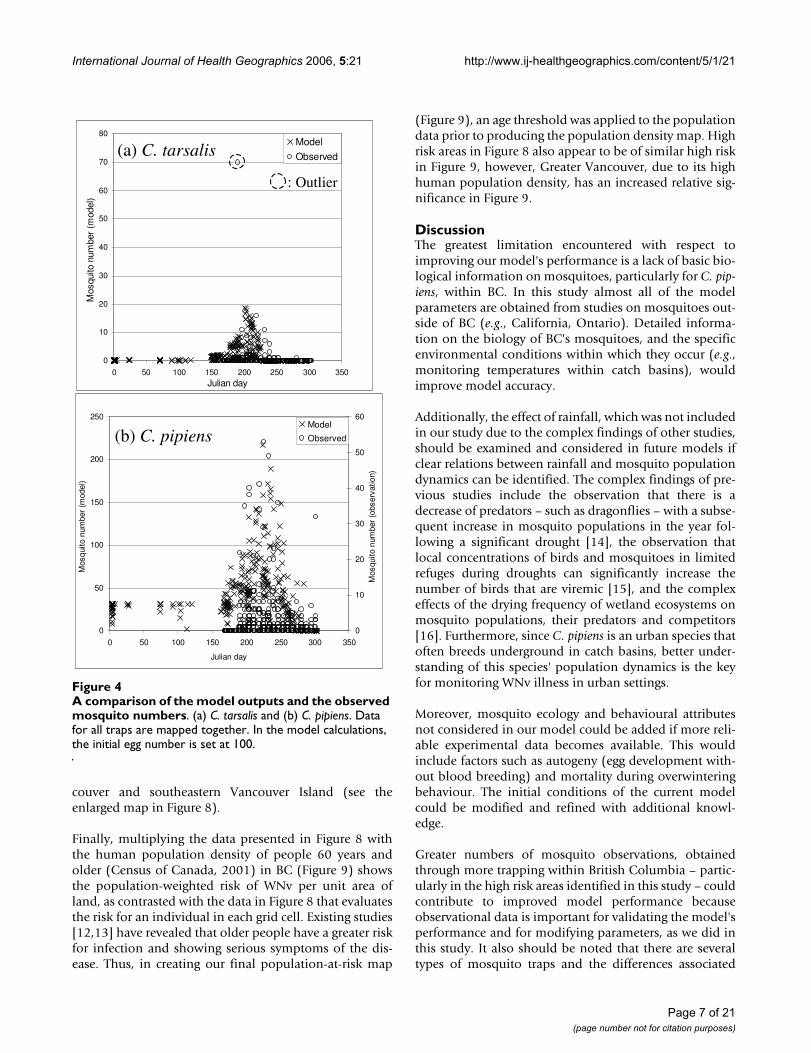
Risk assessment maps of WNv in BC using the mosquitoabundance model described below (Figure 2) were pro-duced (Figure 3). In order to examine the validity of themodel results, the mosquito population dynamics modeloutput that corresponds to the locations of the BCCDCmosquito traps, with the observation data overlain, is pre-sented in Figure 4. By displaying all of the trap data in asingle figure the performance of the model, particularlywith respect to the seasonal change in mosquito abun-dance, can be evaluated. For C. tarsalis (Figure 4a), ourmodel produces a good fit to the observation data, withthe exception of one data outlier. For C. pipiens, on theother hand, our model over-predicts the mosquito num-bers in comparison to observed numbers (note that differ-ent axes are used for the model and observation numbersin Figure 4b).
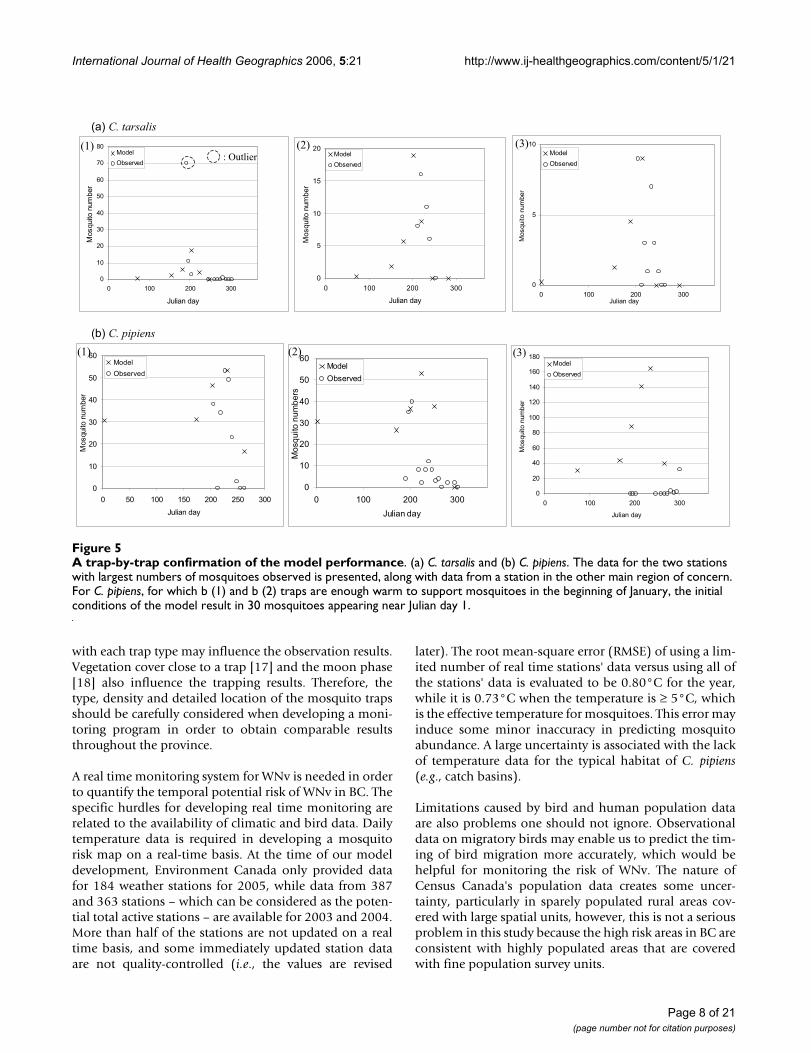
A trap-by-trap check of the model performance (Figure 5)highlights the spatial validity of our model. For each spe-cies, data from the two traps that recorded the greatestnumber of mosquitoes caught in 2003, and another trapfrom a different region of BC, was used for comparison.The outlier was excluded from our determination of spe-cific model parameters (i.e., determining the coefficientvalue for the distance to wetland/lake). Because the trapswith the greatest number of mosquitoes are spatially con-centrated (for C. tarsalis both are from the Okanagan Val-ley, and for C. pipiens both are from Greater Vancouver),another trap's data is included from the other main regionof concern in order to evaluate the model results in a dif-ferent geographic region (i.e., Figure 5a (3), for C. tarsalisdata from a trap in Greater Vancouver is presented, and 5b
Page 3 of 21(page number not for citation purposes)
International Journal of Health Geographics 2006, 5:21 http://www.ij-healthgeographics.com/content/5/1/21
Page 4 of 21(page number not for citation purposes)
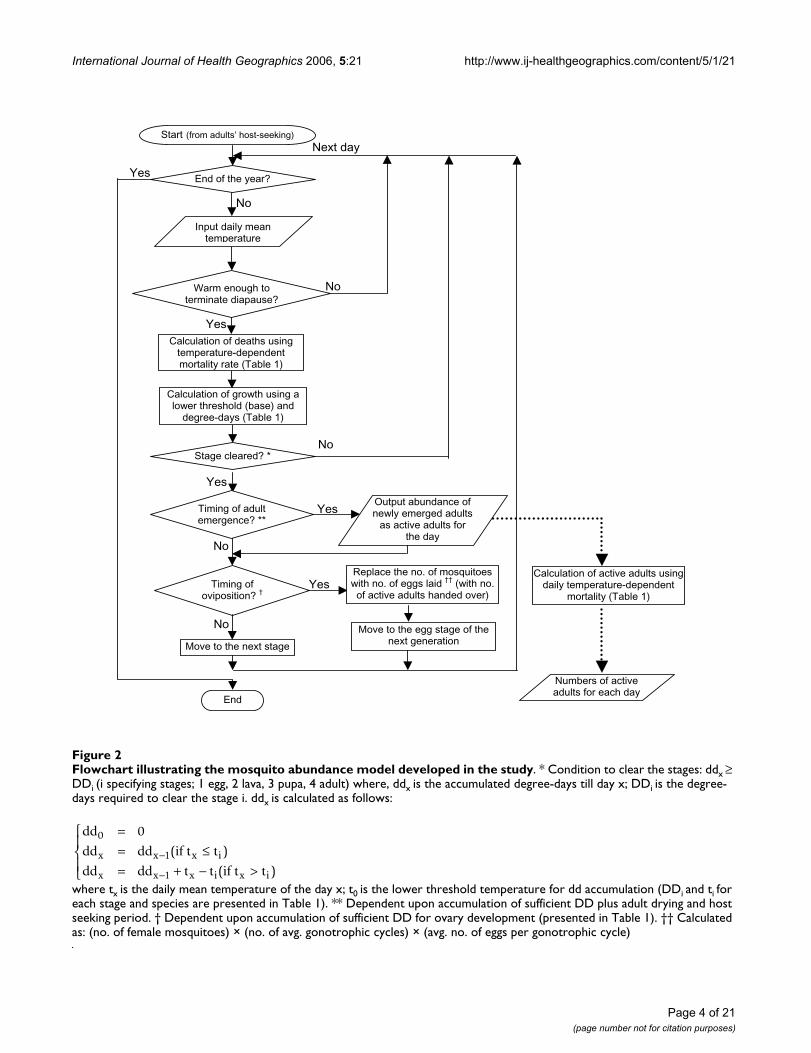
Flowchart illustrating the mosquito abundance model developed in the studyFigure 2Flowchart illustrating the mosquito abundance model developed in the study. * Condition to clear the stages: ddx ≥ DDi (i specifying stages; 1 egg, 2 lava, 3 pupa, 4 adult) where, ddx is the accumulated degree-days till day x; DDi is the degree-days required to clear the stage i. ddx is calculated as follows:
where tx is the daily mean temperature of the day x; t0 is the lower threshold temperature for dd accumulation (DDi and ti for each stage and species are presented in Table 1). ** Dependent upon accumulation of sufficient DD plus adult drying and host seeking period. † Dependent upon accumulation of sufficient DD for ovary development (presented in Table 1). †† Calculated as: (no. of female mosquitoes) × (no. of avg. gonotrophic cycles) × (avg. no. of eggs per gonotrophic cycle)
Calculation of deaths usingtemperature-dependentmortality rate (Table 1)
Next day
No
Timing of adultemergence? **
Yes
Yes
End
No
Yes
No
Timing of oviposition? †
YesReplace the no. of mosquitoeswith no. of eggs laid †† (with no.of active adults handed over)
Move to the next stage
Yes End of the year?
No
Input daily meantemperature
Warm enough toterminate diapause?
Calculation of growth using alower threshold (base) and
degree-days (Table 1)
Stage cleared? *
No Move to the egg stage of the next generation
Output abundance of newly emerged adults
as active adults for the day
Calculation of active adults usingdaily temperature-dependent
mortality (Table 1)
Numbers of active adults for each day
Start (from adults’ host-seeking)
dd
dd dd if t t
dd dd t t if t tx x x i
x x x i x i
0
1
1
0== ≤= + − >
⎧⎨⎪
⎩⎪−
−
( )
( )
International Journal of Health Geographics 2006, 5:21 http://www.ij-healthgeographics.com/content/5/1/21
(3), for C. pipiens data from a trap in the Okanagan Valleyis presented). The C. pipiens model works well in GreaterVancouver (Figure 5b (1) and (2)) but seriously overesti-mates population abundances in the Okanagan Valley(Figure 5b (3)), while the C. tarsalis model fits both theGreater Vancouver and Okanagan Valley trap abundancedata (Figure 5a). These differing model results for the twospecies highlight the difficulty in predicting the abun-dance of C. pipiens. Some of this difficulty is due to thelack of specific ecological knowledge of C. pipiens and theneed to use some parameters derived from C. tarsaliswhen modelling C. pipiens. However, since C. pipiens aretypically described as urban mosquitoes commonlyfound in catch basins and other man-made habitats withstagnant, nutrient rich waters, this decrease in the per-formance of the model which uses environmental factorsis not unexpected. In particular, forecasting C. pipiens
populations based on ambient air temperature is prob-lematic since the sub-terrain catch basin habitats of C.pipiens are considerably cooler than the above-groundtemperatures recorded during the WNv season (and there-fore overprediction by our model is anticipated).
Since our model significantly overestimates the popula-tion abundances for C. pipiens in the Okanagan Valley, thefollowing analysis is restricted to considering C. tarsalispopulation dynamics only.
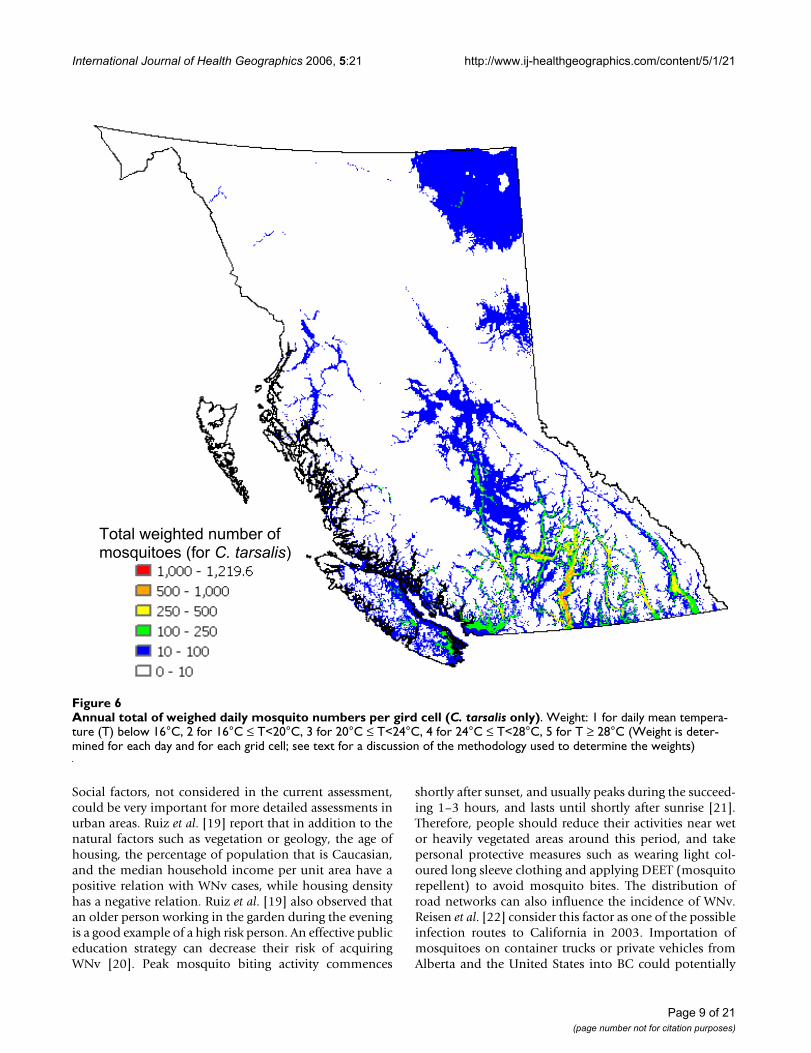
The total predicted annual abundance of C. tarsalis acrossthe province of BC (Figure 6), derived from the modeloutput, clearly shows the regional nature of their distribu-tion. Since the ability of a vector to transmit WNv isdependent on temperature, as identified by Dohm et al.[11], we take that factor into account when creating Figure
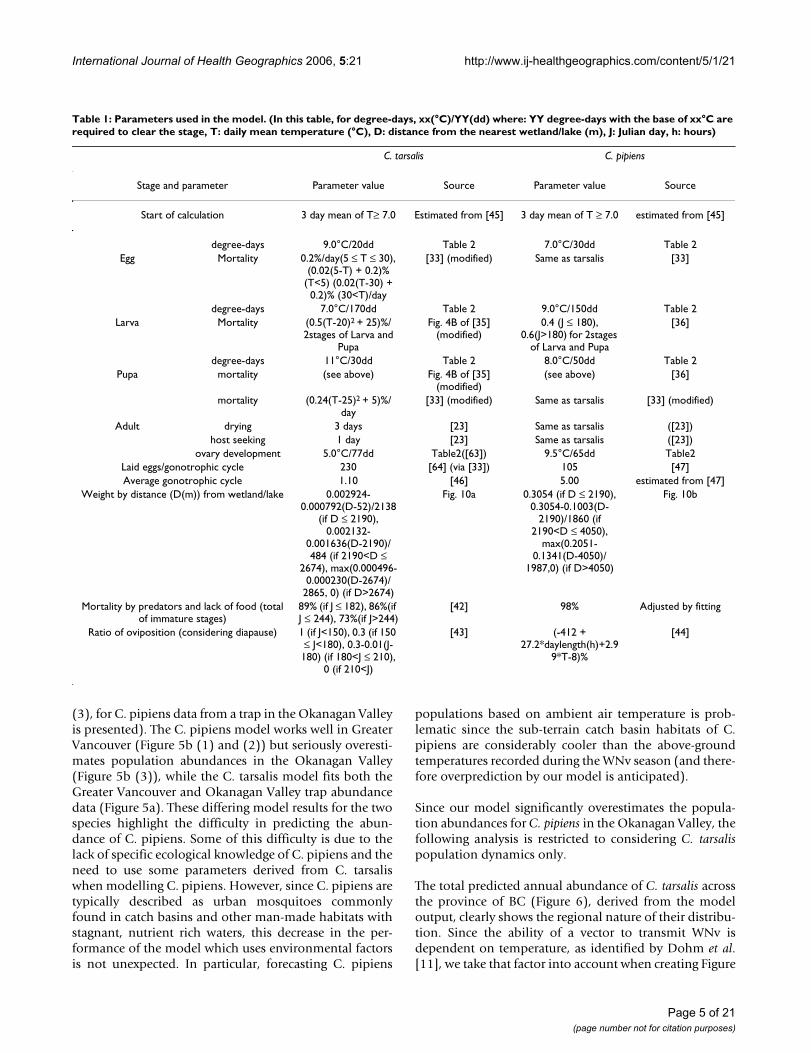
Table 1: Parameters used in the model. (In this table, for degree-days, xx(°C)/YY(dd) where: YY degree-days with the base of xx°C are required to clear the stage, T: daily mean temperature (°C), D: distance from the nearest wetland/lake (m), J: Julian day, h: hours)
C. tarsalis C. pipiens
Stage and parameter Parameter value Source Parameter value Source
Start of calculation 3 day mean of T≥ 7.0 Estimated from [45] 3 day mean of T ≥ 7.0 estimated from [45]
degree-days 9.0°C/20dd Table 2 7.0°C/30dd Table 2Egg Mortality 0.2%/day(5 ≤ T ≤ 30),
(0.02(5-T) + 0.2)% (T<5) (0.02(T-30) + 0.2)% (30<T)/day
[33] (modified) Same as tarsalis [33]
degree-days 7.0°C/170dd Table 2 9.0°C/150dd Table 2Larva Mortality (0.5(T-20)2 + 25)%/
2stages of Larva and Pupa
Fig. 4B of [35] (modified)
0.4 (J ≤ 180), 0.6(J>180) for 2stages
of Larva and Pupa
[36]
degree-days 11°C/30dd Table 2 8.0°C/50dd Table 2Pupa mortality (see above) Fig. 4B of [35]
(modified)(see above) [36]
mortality (0.24(T-25)2 + 5)%/day
[33] (modified) Same as tarsalis [33] (modified)
Adult drying 3 days [23] Same as tarsalis ([23])host seeking 1 day [23] Same as tarsalis ([23])
ovary development 5.0°C/77dd Table2([63]) 9.5°C/65dd Table2Laid eggs/gonotrophic cycle 230 [64] (via [33]) 105 [47]Average gonotrophic cycle 1.10 [46] 5.00 estimated from [47]
Weight by distance (D(m)) from wetland/lake 0.002924-0.000792(D-52)/2138
(if D ≤ 2190), 0.002132-
0.001636(D-2190)/484 (if 2190<D ≤
2674), max(0.000496-0.000230(D-2674)/
2865, 0) (if D>2674)
Fig. 10a 0.3054 (if D ≤ 2190), 0.3054-0.1003(D-
2190)/1860 (if 2190<D ≤ 4050),
max(0.2051-0.1341(D-4050)/
1987,0) (if D>4050)
Fig. 10b
Mortality by predators and lack of food (total of immature stages)
89% (if J ≤ 182), 86%(if J ≤ 244), 73%(if J>244)
[42] 98% Adjusted by fitting
Ratio of oviposition (considering diapause) 1 (if J<150), 0.3 (if 150 ≤ J<180), 0.3-0.01(J-180) (if 180<J ≤ 210),
0 (if 210<J)
[43] (-412 + 27.2*daylength(h)+2.9
9*T-8)%
[44]
Page 5 of 21(page number not for citation purposes)
International Journal of Health Geographics 2006, 5:21 http://www.ij-healthgeographics.com/content/5/1/21
6.
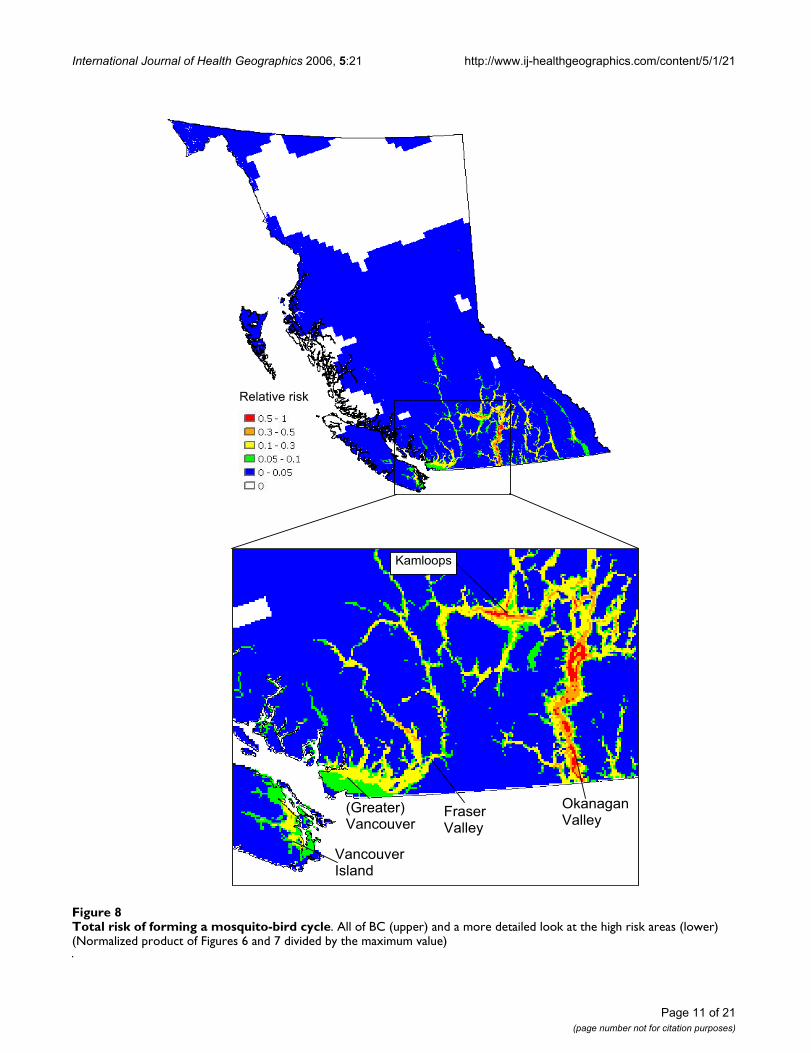
The abundance of high risk birds within BC (identified inan unpublished document by the BCCDC) (Figure 7) isestimated by summing the counts of all high risk species(see Additional file 1) from the USGS Breeding Bird Sur-vey (BBS) data for BC. Multiplying the weighted predictedmosquito abundances (Figure 6) by the abundances of
high risk birds (Figure 7) we obtain the total WNv riskwith respect to mosquito (C. tarsalis) and bird popula-tions (Figure 8). This map, normalized by the maximumvalue, presents the relative risk of a mosquito-bird cycleinfected by WNv. The Okanagan Valley and ThompsonRegion (Kamloops) are identified as the highest WNv riskareas in BC, followed by the Fraser Valley, Greater Van-
Flowchart illustrating the WNv risk assessment methodology used in the studyFigure 3Flowchart illustrating the WNv risk assessment methodology used in the study.
Page 6 of 21(page number not for citation purposes)
International Journal of Health Geographics 2006, 5:21 http://www.ij-healthgeographics.com/content/5/1/21
couver and southeastern Vancouver Island (see theenlarged map in Figure 8).
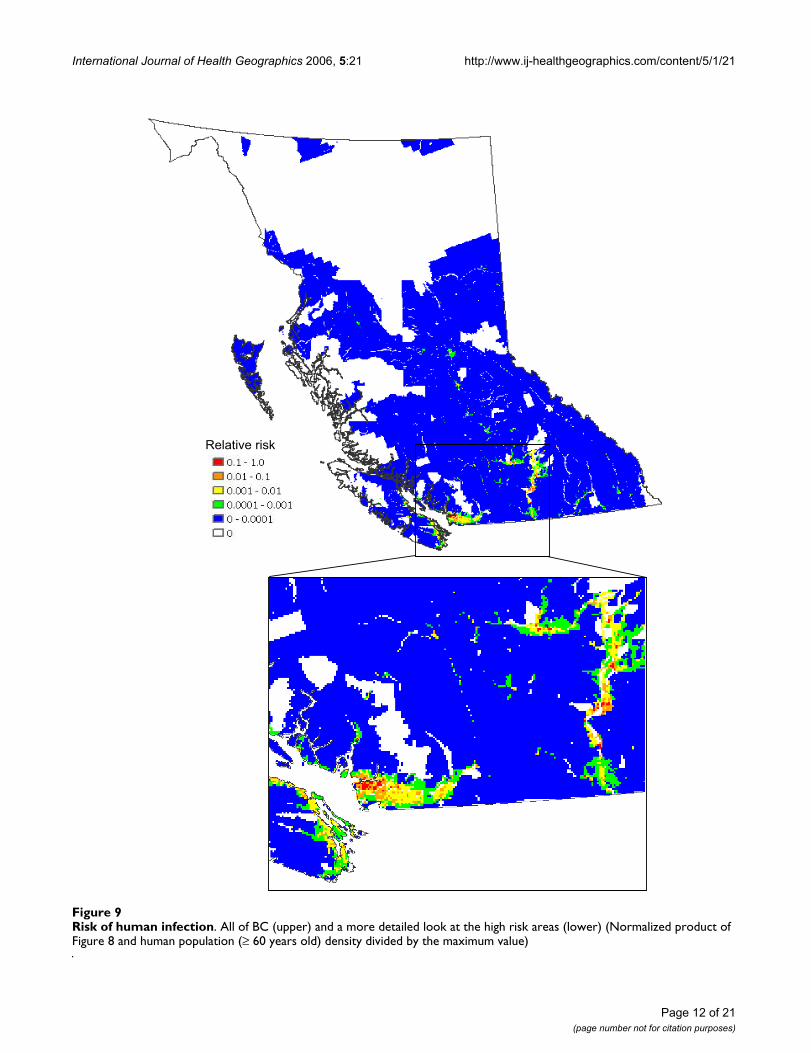
Finally, multiplying the data presented in Figure 8 withthe human population density of people 60 years andolder (Census of Canada, 2001) in BC (Figure 9) showsthe population-weighted risk of WNv per unit area ofland, as contrasted with the data in Figure 8 that evaluatesthe risk for an individual in each grid cell. Existing studies[12,13] have revealed that older people have a greater riskfor infection and showing serious symptoms of the dis-ease. Thus, in creating our final population-at-risk map
(Figure 9), an age threshold was applied to the populationdata prior to producing the population density map. Highrisk areas in Figure 8 also appear to be of similar high riskin Figure 9, however, Greater Vancouver, due to its highhuman population density, has an increased relative sig-nificance in Figure 9.
DiscussionThe greatest limitation encountered with respect toimproving our model's performance is a lack of basic bio-logical information on mosquitoes, particularly for C. pip-iens, within BC. In this study almost all of the modelparameters are obtained from studies on mosquitoes out-side of BC (e.g., California, Ontario). Detailed informa-tion on the biology of BC's mosquitoes, and the specificenvironmental conditions within which they occur (e.g.,monitoring temperatures within catch basins), wouldimprove model accuracy.
Additionally, the effect of rainfall, which was not includedin our study due to the complex findings of other studies,should be examined and considered in future models ifclear relations between rainfall and mosquito populationdynamics can be identified. The complex findings of pre-vious studies include the observation that there is adecrease of predators – such as dragonflies – with a subse-quent increase in mosquito populations in the year fol-lowing a significant drought [14], the observation thatlocal concentrations of birds and mosquitoes in limitedrefuges during droughts can significantly increase thenumber of birds that are viremic [15], and the complexeffects of the drying frequency of wetland ecosystems onmosquito populations, their predators and competitors[16]. Furthermore, since C. pipiens is an urban species thatoften breeds underground in catch basins, better under-standing of this species' population dynamics is the keyfor monitoring WNv illness in urban settings.
Moreover, mosquito ecology and behavioural attributesnot considered in our model could be added if more reli-able experimental data becomes available. This wouldinclude factors such as autogeny (egg development with-out blood breeding) and mortality during overwinteringbehaviour. The initial conditions of the current modelcould be modified and refined with additional knowl-edge.
Greater numbers of mosquito observations, obtainedthrough more trapping within British Columbia – partic-ularly in the high risk areas identified in this study – couldcontribute to improved model performance becauseobservational data is important for validating the model'sperformance and for modifying parameters, as we did inthis study. It also should be noted that there are severaltypes of mosquito traps and the differences associated
A comparison of the model outputs and the observed mos-quito numbersFigure 4A comparison of the model outputs and the observed mosquito numbers. (a) C. tarsalis and (b) C. pipiens. Data for all traps are mapped together. In the model calculations, the initial egg number is set at 100.
0
10
20
30
40
50
60
70
80
0 50 100 150 200 250 300 350Julian day
Mos
quito
num
ber
(mod
el)
Model
Observed(a) C. tarsalis
0
50
100
150
200
250
0 50 100 150 200 250 300 350
Julian day
Mos
quito
num
ber
(mod
el)
0
10
20
30
40
50
60
Mos
quito
num
ber
(obs
erva
tion)
Model
Observed(b) C. pipiens
: Outlier
Page 7 of 21(page number not for citation purposes)
International Journal of Health Geographics 2006, 5:21 http://www.ij-healthgeographics.com/content/5/1/21
with each trap type may influence the observation results.Vegetation cover close to a trap [17] and the moon phase[18] also influence the trapping results. Therefore, thetype, density and detailed location of the mosquito trapsshould be carefully considered when developing a moni-toring program in order to obtain comparable resultsthroughout the province.
A real time monitoring system for WNv is needed in orderto quantify the temporal potential risk of WNv in BC. Thespecific hurdles for developing real time monitoring arerelated to the availability of climatic and bird data. Dailytemperature data is required in developing a mosquitorisk map on a real-time basis. At the time of our modeldevelopment, Environment Canada only provided datafor 184 weather stations for 2005, while data from 387and 363 stations – which can be considered as the poten-tial total active stations – are available for 2003 and 2004.More than half of the stations are not updated on a realtime basis, and some immediately updated station dataare not quality-controlled (i.e., the values are revised
later). The root mean-square error (RMSE) of using a lim-ited number of real time stations' data versus using all ofthe stations' data is evaluated to be 0.80°C for the year,while it is 0.73°C when the temperature is ≥ 5°C, whichis the effective temperature for mosquitoes. This error mayinduce some minor inaccuracy in predicting mosquitoabundance. A large uncertainty is associated with the lackof temperature data for the typical habitat of C. pipiens(e.g., catch basins).
Limitations caused by bird and human population dataare also problems one should not ignore. Observationaldata on migratory birds may enable us to predict the tim-ing of bird migration more accurately, which would behelpful for monitoring the risk of WNv. The nature ofCensus Canada's population data creates some uncer-tainty, particularly in sparely populated rural areas cov-ered with large spatial units, however, this is not a seriousproblem in this study because the high risk areas in BC areconsistent with highly populated areas that are coveredwith fine population survey units.
A trap-by-trap confirmation of the model performanceFigure 5A trap-by-trap confirmation of the model performance. (a) C. tarsalis and (b) C. pipiens. The data for the two stations with largest numbers of mosquitoes observed is presented, along with data from a station in the other main region of concern. For C. pipiens, for which b (1) and b (2) traps are enough warm to support mosquitoes in the beginning of January, the initial conditions of the model result in 30 mosquitoes appearing near Julian day 1.
(a) C. tarsalis
0
5
0
0
Mosquito n
um
ber
Mode
Obser
0
10
20
30
40
50
60
70
80
0 100 200 300
Julian day
Mosquito
num
ber
Model
Observed
0
5
10
15
20
0 100 200 300
Julian dayM
osquito n
um
ber
Model
Observed
20
30
40
50
0
Mosquito n
um
ber
Model
Observed
20
30
40
50
0
osq
uito
nu
mb
ers
Model
Observed
60
80
100
120
140
160
180
Mosquito n
um
ber
Model
Obse
: Outlier
(3)
(2)(1)
0
20
40
0 100 200 300
Julian day
rved
6(2)
0
10
0 100 200 300
Julian day
M
6(1)
0
10
0 50 100 150 200 250 300
Julian day
(b) C. pipiens
ved
l
100 200 300Julian day
1(3)
Page 8 of 21(page number not for citation purposes)
International Journal of Health Geographics 2006, 5:21 http://www.ij-healthgeographics.com/content/5/1/21
Social factors, not considered in the current assessment,could be very important for more detailed assessments inurban areas. Ruiz et al. [19] report that in addition to thenatural factors such as vegetation or geology, the age ofhousing, the percentage of population that is Caucasian,and the median household income per unit area have apositive relation with WNv cases, while housing densityhas a negative relation. Ruiz et al. [19] also observed thatan older person working in the garden during the eveningis a good example of a high risk person. An effective publiceducation strategy can decrease their risk of acquiringWNv [20]. Peak mosquito biting activity commences
shortly after sunset, and usually peaks during the succeed-ing 1–3 hours, and lasts until shortly after sunrise [21].Therefore, people should reduce their activities near wetor heavily vegetated areas around this period, and takepersonal protective measures such as wearing light col-oured long sleeve clothing and applying DEET (mosquitorepellent) to avoid mosquito bites. The distribution ofroad networks can also influence the incidence of WNv.Reisen et al. [22] consider this factor as one of the possibleinfection routes to California in 2003. Importation ofmosquitoes on container trucks or private vehicles fromAlberta and the United States into BC could potentially
Annual total of weighed daily mosquito numbers per gird cell (C. tarsalis only)Figure 6Annual total of weighed daily mosquito numbers per gird cell (C. tarsalis only). Weight: 1 for daily mean tempera-ture (T) below 16°C, 2 for 16°C ≤ T<20°C, 3 for 20°C ≤ T<24°C, 4 for 24°C ≤ T<28°C, 5 for T ≥ 28°C (Weight is deter-mined for each day and for each grid cell; see text for a discussion of the methodology used to determine the weights)
Total weighted number of mosquitoes (for C. tarsalis)
Page 9 of 21(page number not for citation purposes)

International Journal of Health Geographics 2006, 5:21 http://www.ij-healthgeographics.com/content/5/1/21
occur. Social factors could be easily included in a moredetailed GIS-based model.
Finally, the implementation of an integrated pest manage-ment plan, which should be targeted to high risk areas,can greatly reduce mosquito numbers and reduce the riskof WNv. While some studies (e.g., [23]) attempt to esti-mate the effect of these activities, developing a sophisti-cated model enables us to estimate the potentialeffectiveness of those activities before they are carried out.
The broad areas identified in our study as the highest riskareas are not obviously different from the results pro-
duced using simpler models (e.g., combination of thepresence of the mosquito species capable of WNV trans-mission, habitat and population). However, population-dynamics based models can provide not only biologicalrationale to the spatio-temporal change in mosquitoabundance, but can also provide more substantive bene-fits. For example, such a model can present relative risk,with fine spatial resolution, in areas with no mosquitotraps or with no dead corvid observations, where simplermodels do not work as well. Identifying areas of greatestrisk using biologically-relevant methods will assist theconcerned agencies in establishing new observationpoints. Moreover, we can predict changes in WNv risk
Total abundance of high risk bird species in breeding seasonFigure 7Total abundance of high risk bird species in breeding season. The map shows the average number of individual birds considered to be high risk species by the BCCDC (see the additional file for species considered in the map).
Number of highrisk birds per grid cell
Page 10 of 21(page number not for citation purposes)
International Journal of Health Geographics 2006, 5:21 http://www.ij-healthgeographics.com/content/5/1/21
Page 11 of 21(page number not for citation purposes)
Total risk of forming a mosquito-bird cycleFigure 8Total risk of forming a mosquito-bird cycle. All of BC (upper) and a more detailed look at the high risk areas (lower) (Normalized product of Figures 6 and 7 divided by the maximum value)
Relative risk
(Greater)Vancouver
Kamloops
OkanaganValley
FraserValley
VancouverIsland
International Journal of Health Geographics 2006, 5:21 http://www.ij-healthgeographics.com/content/5/1/21
Page 12 of 21(page number not for citation purposes)
Risk of human infectionFigure 9Risk of human infection. All of BC (upper) and a more detailed look at the high risk areas (lower) (Normalized product of Figure 8 and human population (≥ 60 years old) density divided by the maximum value)
Relative risk
International Journal of Health Geographics 2006, 5:21 http://www.ij-healthgeographics.com/content/5/1/21
under different conditions, such as an abnormally hot orcool year, the effect of global warming, the effect of damconstruction or reclamation of wetlands, and the differingeffects of insecticides (e.g., larvacides versus adulticides)on potential outbreaks. While all models start with uncer-tainty in many parameters, as we collect more data we canvalidate and reduce the uncertainty associated with themodel's parameters. Such improvements will be carriedout in the future.
ConclusionSpatial risk assessment of the potential for WNv in BC wascarried out by developing a sophisticated mosquito abun-dance model and by combining its output with ancillarydata through the use of GIS and geostatistics. First wemodeled C. tarsalis and C. pipiens, but due to the large dis-crepancy between our model's results and the observed C.pipiens numbers, C. pipiens was removed from risk assess-ment. The results show that in terms of mosquito, birdand human populations, the geographic areas at highestrisk for WNv in BC are the Okanagan Valley and theThompson Region (Kamloops), Greater Vancouver, theFraser Valley, and southeastern Vancouver Island. Theresources associated with a WNv early warning systemsuch as mosquito traps and specialist in detecting the virusand in collecting dead corvids, should be concentrated inthese areas. Collecting additional information such as thatobtained through basic studies on mosquito ecology inBC, as well as continuing efforts in bird and mosquito sur-veillance, are required for the early detection of WNv andfor improving the model, particularly for C. pipiens. Accessto real time climatic data is also the key for developing areal time early warning system for vector borne diseases,while social factors are important when developing adetailed assessment in urban areas.
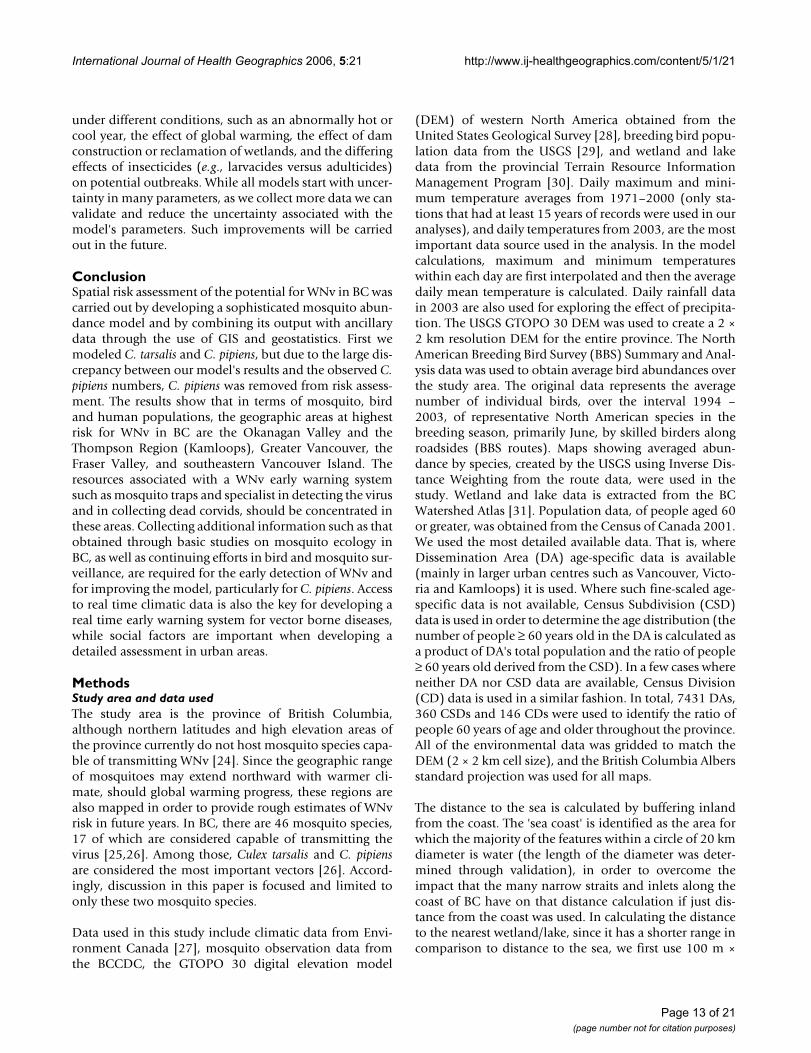
MethodsStudy area and data usedThe study area is the province of British Columbia,although northern latitudes and high elevation areas ofthe province currently do not host mosquito species capa-ble of transmitting WNv [24]. Since the geographic rangeof mosquitoes may extend northward with warmer cli-mate, should global warming progress, these regions arealso mapped in order to provide rough estimates of WNvrisk in future years. In BC, there are 46 mosquito species,17 of which are considered capable of transmitting thevirus [25,26]. Among those, Culex tarsalis and C. pipiensare considered the most important vectors [26]. Accord-ingly, discussion in this paper is focused and limited toonly these two mosquito species.
Data used in this study include climatic data from Envi-ronment Canada [27], mosquito observation data fromthe BCCDC, the GTOPO 30 digital elevation model
(DEM) of western North America obtained from theUnited States Geological Survey [28], breeding bird popu-lation data from the USGS [29], and wetland and lakedata from the provincial Terrain Resource InformationManagement Program [30]. Daily maximum and mini-mum temperature averages from 1971–2000 (only sta-tions that had at least 15 years of records were used in ouranalyses), and daily temperatures from 2003, are the mostimportant data source used in the analysis. In the modelcalculations, maximum and minimum temperatureswithin each day are first interpolated and then the averagedaily mean temperature is calculated. Daily rainfall datain 2003 are also used for exploring the effect of precipita-tion. The USGS GTOPO 30 DEM was used to create a 2 ×2 km resolution DEM for the entire province. The NorthAmerican Breeding Bird Survey (BBS) Summary and Anal-ysis data was used to obtain average bird abundances overthe study area. The original data represents the averagenumber of individual birds, over the interval 1994 –2003, of representative North American species in thebreeding season, primarily June, by skilled birders alongroadsides (BBS routes). Maps showing averaged abun-dance by species, created by the USGS using Inverse Dis-tance Weighting from the route data, were used in thestudy. Wetland and lake data is extracted from the BCWatershed Atlas [31]. Population data, of people aged 60or greater, was obtained from the Census of Canada 2001.We used the most detailed available data. That is, whereDissemination Area (DA) age-specific data is available(mainly in larger urban centres such as Vancouver, Victo-ria and Kamloops) it is used. Where such fine-scaled age-specific data is not available, Census Subdivision (CSD)data is used in order to determine the age distribution (thenumber of people ≥ 60 years old in the DA is calculated asa product of DA's total population and the ratio of people≥ 60 years old derived from the CSD). In a few cases whereneither DA nor CSD data are available, Census Division(CD) data is used in a similar fashion. In total, 7431 DAs,360 CSDs and 146 CDs were used to identify the ratio ofpeople 60 years of age and older throughout the province.All of the environmental data was gridded to match theDEM (2 × 2 km cell size), and the British Columbia Albersstandard projection was used for all maps.
The distance to the sea is calculated by buffering inlandfrom the coast. The 'sea coast' is identified as the area forwhich the majority of the features within a circle of 20 kmdiameter is water (the length of the diameter was deter-mined through validation), in order to overcome theimpact that the many narrow straits and inlets along thecoast of BC have on that distance calculation if just dis-tance from the coast was used. In calculating the distanceto the nearest wetland/lake, since it has a shorter range incomparison to distance to the sea, we first use 100 m ×
Page 13 of 21(page number not for citation purposes)
International Journal of Health Geographics 2006, 5:21 http://www.ij-healthgeographics.com/content/5/1/21
100 m grid cells when calculating the coefficients andthen convert them, by averaging, to 2 km × 2 km grids.
Model developmentOverviewWe developed a population dynamics model of mosquitoabundance, linked to environmental factors, whose out-put is used to produce a risk assessment of WNv. Thisapproach is preferred over a statistical model (e.g., aregression model using human cases and possibleexplaining factors), since, in the case of WNv, the vector-reservoir infection cycle is clear, and to assign too muchattention to actual human cases may be misleading sincehigh risk areas may be under-estimated if the human pop-ulation is low or transient (e.g., vacation areas). Further-more, BC's variable topography and resultant complextemperature variability would ensure that any simpleexperimental model would not adequately model mos-quito distribution and subsequent viral amplification.Finally, since BC has had no human cases that can beattributed to exposure within the province so far, basing amodel on human cases is not possible.
The history of mosquito population dynamics modelsdates back to the 1970s [9,23,32-35]. Most of these mod-els incorporate temperature-dependent growth rates andmortality taken from existing experimental studies as pop-ulation control factors. Although many studies considerthe effect of mosquito density as a controlling factor ofmortality, particularly in the egg stage, our proposedmodel does not include a density-dependent factor as thisis difficult to parameterize in the natural environment.Instead, since various conditions can influence the result-ing values, and after careful consideration, a number ofexperimental parameters related to mosquito ecology,obtained from other studies and discussed in the follow-ing sections, were utilized in this study. For example,Madder et al. [36] mentioned that the difference betweentheir results and Tekle [37] could be due to the differencein the quality and quantity of food, different rearing den-sities, fluctuations and inaccuracy of temperature controlsin the incubators, or an actual difference in genotypes.Also, the vertical transmission (transmission of virus frommother to egg) rate of WNv in C. tarsalis and C. pipiens, asexamined by Dohm et al. [38] and Goddard et al. [39],ranges between 0 ‰ and 6.9 ‰, and averages around 2–3 ‰. Consequently, we inferred that vertical transmissionis not a major route of virus transmission. Instead, webelieved that the abundance of adult mosquitoes, espe-cially those which have had multiple gonotrophic (repro-ductive) cycles, is the primary determinant of the risk ofillness through viral amplification in the bird-mosquitocycle.
A flowchart of our model is presented in Figure 2. Con-trary to other mosquito population models, which gener-ally provide estimates for one or two isolated populations,our model generates a spatially continuous map-basedoutput for the entire study area. As an initial condition,100 adult mosquitoes are set for each grid cell (a 2 × 2 kmsquare). The calculation begins with a host-seeking stagedadult at the time when the ambient temperature becomeswarm enough to terminate mosquito hibernation (dia-pause). Daily mean temperatures from January 1 areinput, and daily growth and death rates of mosquitoes arecalculated for each cell.
Developing and verifying the mosquito abundance modelparameters, using the trap data, was carried out withinMicrosoft Excel using Visual Basic for Application (VBA),while the subsequent raster-based GIS calculations for themodel were conducted using VBA for ArcGIS. Pre-process-ing of all the GIS data, including resampling and interpo-lation, and map-based calculations, including creatingrisk assessment map using model output, was executedusing ArcGIS 9.0. All VBA programs were developed by theauthors with the exception of a script, downloaded fromthe ESRI Support Center [40], to read the value of rasterdata at the locations of point data.
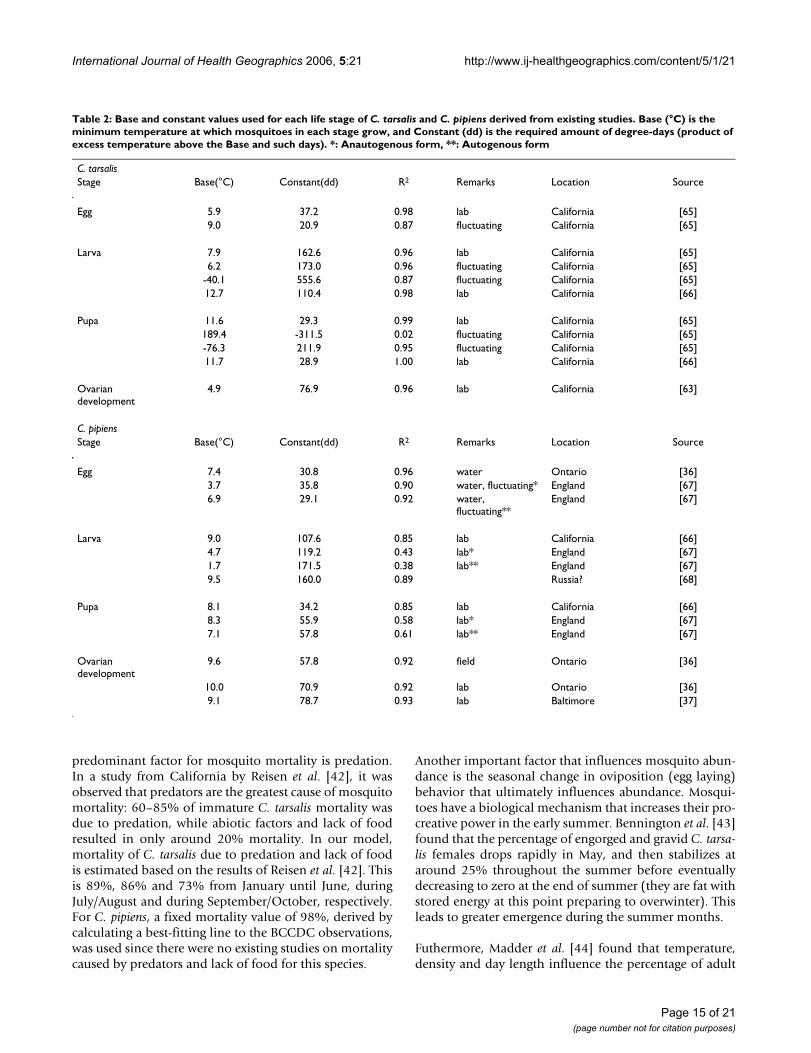
Controlling factors of population dynamicsMosquitoes have four life stages: egg, larva, pupa andadult. With the exception of extreme conditions, all stagesof mosquito maturation occur more rapidly with warmertemperatures. Mosquitoes are unable to regulate theirbody temperature and, thus, are dependent on the tem-perature of their surroundings for warmth and growth.The concept of growing degree-days for mosquito popula-tion forecasting involves the amount of accumulated heatrequired for mosquitoes to complete their developmentfrom one stage in their life cycle to another. This measureof accumulated heat for development is known as physio-logical time [41]. Growing degree-days are essentially heatunits based on the product of excess temperature (indegrees) beyond the base value and its length (in days).The conditions that are required to complete each lifestage of C. tarsalis and C. pipiens, obtained from existingstudies, are summarized in Table 2.
Studies on mortality show that larva, pupa and adult mor-tality is similarly temperature-dependent. For example,the estimated mortality curve provided by Eisenberg et al.[35], a summary of existing studies, gives a minimummortality rate of 0.35 at 20°C. Generally, each life stagehas an optimal temperature at which mortality is mini-mized, and mortality increases as the ambient tempera-ture departs from the optimal temperature. One exceptionis the egg stage, wherein mortality is influenced more bydensity than by temperature [35]. In nature, however, the
Page 14 of 21(page number not for citation purposes)
International Journal of Health Geographics 2006, 5:21 http://www.ij-healthgeographics.com/content/5/1/21
predominant factor for mosquito mortality is predation.In a study from California by Reisen et al. [42], it wasobserved that predators are the greatest cause of mosquitomortality: 60–85% of immature C. tarsalis mortality wasdue to predation, while abiotic factors and lack of foodresulted in only around 20% mortality. In our model,mortality of C. tarsalis due to predation and lack of foodis estimated based on the results of Reisen et al. [42]. Thisis 89%, 86% and 73% from January until June, duringJuly/August and during September/October, respectively.For C. pipiens, a fixed mortality value of 98%, derived bycalculating a best-fitting line to the BCCDC observations,was used since there were no existing studies on mortalitycaused by predators and lack of food for this species.
Another important factor that influences mosquito abun-dance is the seasonal change in oviposition (egg laying)behavior that ultimately influences abundance. Mosqui-toes have a biological mechanism that increases their pro-creative power in the early summer. Bennington et al. [43]found that the percentage of engorged and gravid C. tarsa-lis females drops rapidly in May, and then stabilizes ataround 25% throughout the summer before eventuallydecreasing to zero at the end of summer (they are fat withstored energy at this point preparing to overwinter). Thisleads to greater emergence during the summer months.
Futhermore, Madder et al. [44] found that temperature,density and day length influence the percentage of adult
Table 2: Base and constant values used for each life stage of C. tarsalis and C. pipiens derived from existing studies. Base (°C) is the minimum temperature at which mosquitoes in each stage grow, and Constant (dd) is the required amount of degree-days (product of excess temperature above the Base and such days). *: Anautogenous form, **: Autogenous form
C. tarsalisStage Base(°C) Constant(dd) R2 Remarks Location Source
Egg 5.9 37.2 0.98 lab California [65]9.0 20.9 0.87 fluctuating California [65]
Larva 7.9 162.6 0.96 lab California [65]6.2 173.0 0.96 fluctuating California [65]
-40.1 555.6 0.87 fluctuating California [65]12.7 110.4 0.98 lab California [66]
Pupa 11.6 29.3 0.99 lab California [65]189.4 -311.5 0.02 fluctuating California [65]-76.3 211.9 0.95 fluctuating California [65]11.7 28.9 1.00 lab California [66]
Ovarian development
4.9 76.9 0.96 lab California [63]
C. pipiensStage Base(°C) Constant(dd) R2 Remarks Location Source
Egg 7.4 30.8 0.96 water Ontario [36]3.7 35.8 0.90 water, fluctuating* England [67]6.9 29.1 0.92 water,
fluctuating**England [67]
Larva 9.0 107.6 0.85 lab California [66]4.7 119.2 0.43 lab* England [67]1.7 171.5 0.38 lab** England [67]9.5 160.0 0.89 Russia? [68]
Pupa 8.1 34.2 0.85 lab California [66]8.3 55.9 0.58 lab* England [67]7.1 57.8 0.61 lab** England [67]
Ovarian development
9.6 57.8 0.92 field Ontario [36]
10.0 70.9 0.92 lab Ontario [36]9.1 78.7 0.93 lab Baltimore [37]
Page 15 of 21(page number not for citation purposes)
International Journal of Health Geographics 2006, 5:21 http://www.ij-healthgeographics.com/content/5/1/21
C. pipiens females in diapause (a period of suspended ordormant development, characterized by inactivity anddecreased metabolism). Thus, temperature, density andday length also influence mosquito activity.
The date at which the growing degree-days calculationsstart is also important for the model. Bennington et al.[45] reported that the first female C. tarsalis in 1954 wasobserved on Apr. 6 after emerging from hibernation whenthe soil temperature at a depth of 1–2 m was around 7°C.Due to the absence of soil temperature data, we assumedthat a three day average of average daily temperatureabove 7.0°C is sufficient to break hibernation and initiatethe calculation.
An adult female can have multiple gonotrophic cycles.Burdick and Kardos [46] observed the numbers of femaleC. tarsalis, after overwintering, that experienced oviposi-tion. At most four cycles were observed-no mosquitoessurvived for a fifth oviposition, and the average number ofgonotrophic cycles was 1.10, which is the value used inour model. Tamarina [47] observed an average of 4.08gonotrophic cycles with 105 eggs per raft for C. pipiens(observed until one-half of the sample population died).In our model, which considers the oviposition of survi-vors, 5.00 is used as a reasonable number of gonotrophiccycles for C. pipiens. Also, all eggs (calculated as a productof the average number of gonotrophic cycles and averageeggs per raft) from a female adult are laid as soon as thecondition for the first oviposition is fulfilled. Daily mor-tality is not used in the model explicitly since the conceptof gonotrophic cycle numbers includes the mortality ofadults. However, in determining the total number ofactive adult mosquitoes, a temperature-dependent dailymortality variable for adults is applied.
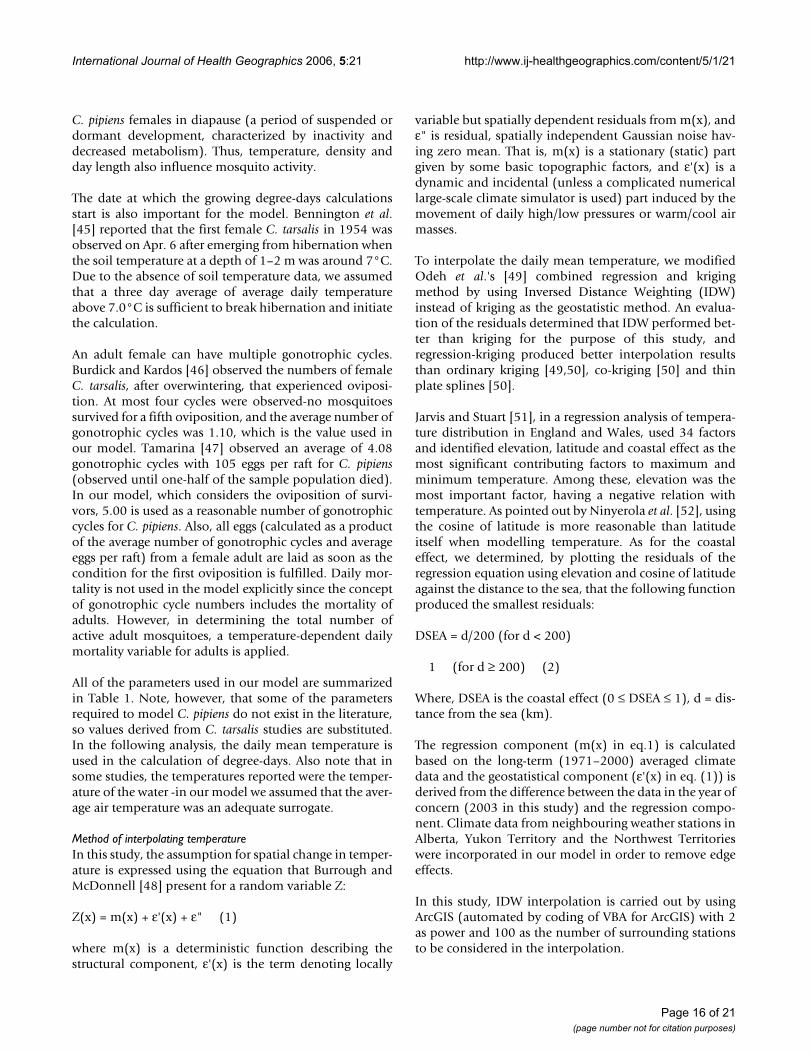
All of the parameters used in our model are summarizedin Table 1. Note, however, that some of the parametersrequired to model C. pipiens do not exist in the literature,so values derived from C. tarsalis studies are substituted.In the following analysis, the daily mean temperature isused in the calculation of degree-days. Also note that insome studies, the temperatures reported were the temper-ature of the water -in our model we assumed that the aver-age air temperature was an adequate surrogate.
Method of interpolating temperatureIn this study, the assumption for spatial change in temper-ature is expressed using the equation that Burrough andMcDonnell [48] present for a random variable Z:
Z(x) = m(x) + ε'(x) + ε" (1)
where m(x) is a deterministic function describing thestructural component, ε'(x) is the term denoting locally
variable but spatially dependent residuals from m(x), andε" is residual, spatially independent Gaussian noise hav-ing zero mean. That is, m(x) is a stationary (static) partgiven by some basic topographic factors, and ε'(x) is adynamic and incidental (unless a complicated numericallarge-scale climate simulator is used) part induced by themovement of daily high/low pressures or warm/cool airmasses.
To interpolate the daily mean temperature, we modifiedOdeh et al.'s [49] combined regression and krigingmethod by using Inversed Distance Weighting (IDW)instead of kriging as the geostatistic method. An evalua-tion of the residuals determined that IDW performed bet-ter than kriging for the purpose of this study, andregression-kriging produced better interpolation resultsthan ordinary kriging [49,50], co-kriging [50] and thinplate splines [50].
Jarvis and Stuart [51], in a regression analysis of tempera-ture distribution in England and Wales, used 34 factorsand identified elevation, latitude and coastal effect as themost significant contributing factors to maximum andminimum temperature. Among these, elevation was themost important factor, having a negative relation withtemperature. As pointed out by Ninyerola et al. [52], usingthe cosine of latitude is more reasonable than latitudeitself when modelling temperature. As for the coastaleffect, we determined, by plotting the residuals of theregression equation using elevation and cosine of latitudeagainst the distance to the sea, that the following functionproduced the smallest residuals:
DSEA = d/200 (for d < 200)
1 (for d ≥ 200) (2)
Where, DSEA is the coastal effect (0 ≤ DSEA ≤ 1), d = dis-tance from the sea (km).
The regression component (m(x) in eq.1) is calculatedbased on the long-term (1971–2000) averaged climatedata and the geostatistical component (ε'(x) in eq. (1)) isderived from the difference between the data in the year ofconcern (2003 in this study) and the regression compo-nent. Climate data from neighbouring weather stations inAlberta, Yukon Territory and the Northwest Territorieswere incorporated in our model in order to remove edgeeffects.
In this study, IDW interpolation is carried out by usingArcGIS (automated by coding of VBA for ArcGIS) with 2as power and 100 as the number of surrounding stationsto be considered in the interpolation.
Page 16 of 21(page number not for citation purposes)
International Journal of Health Geographics 2006, 5:21 http://www.ij-healthgeographics.com/content/5/1/21
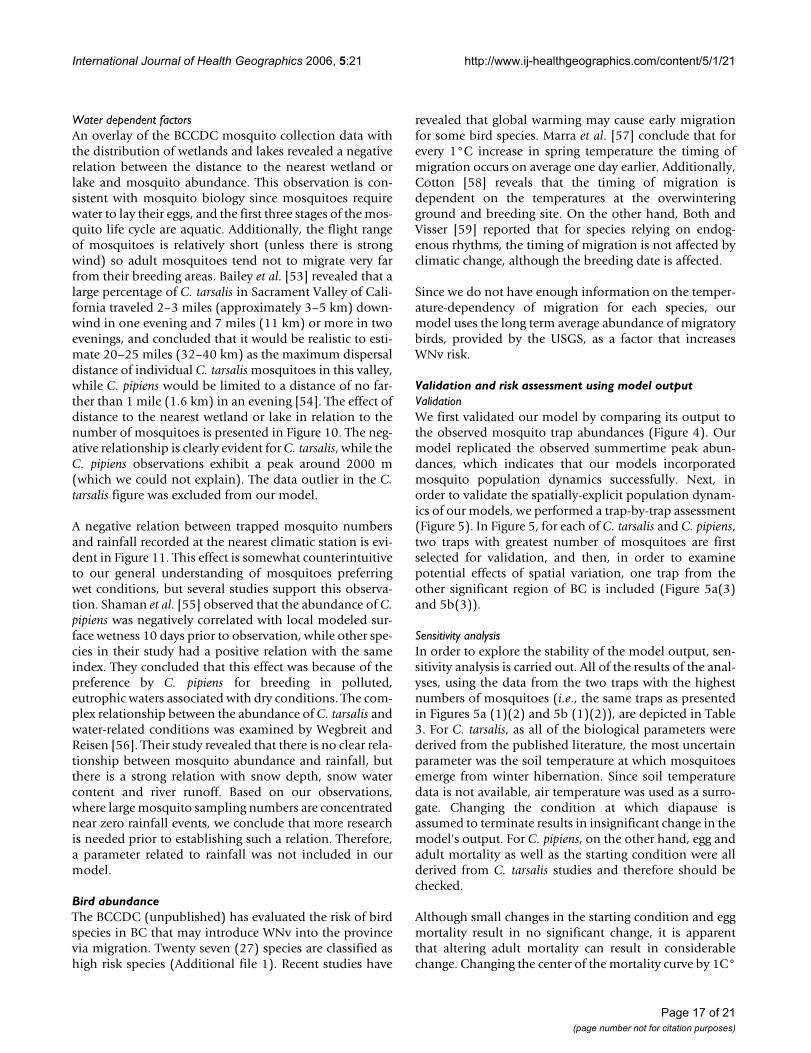
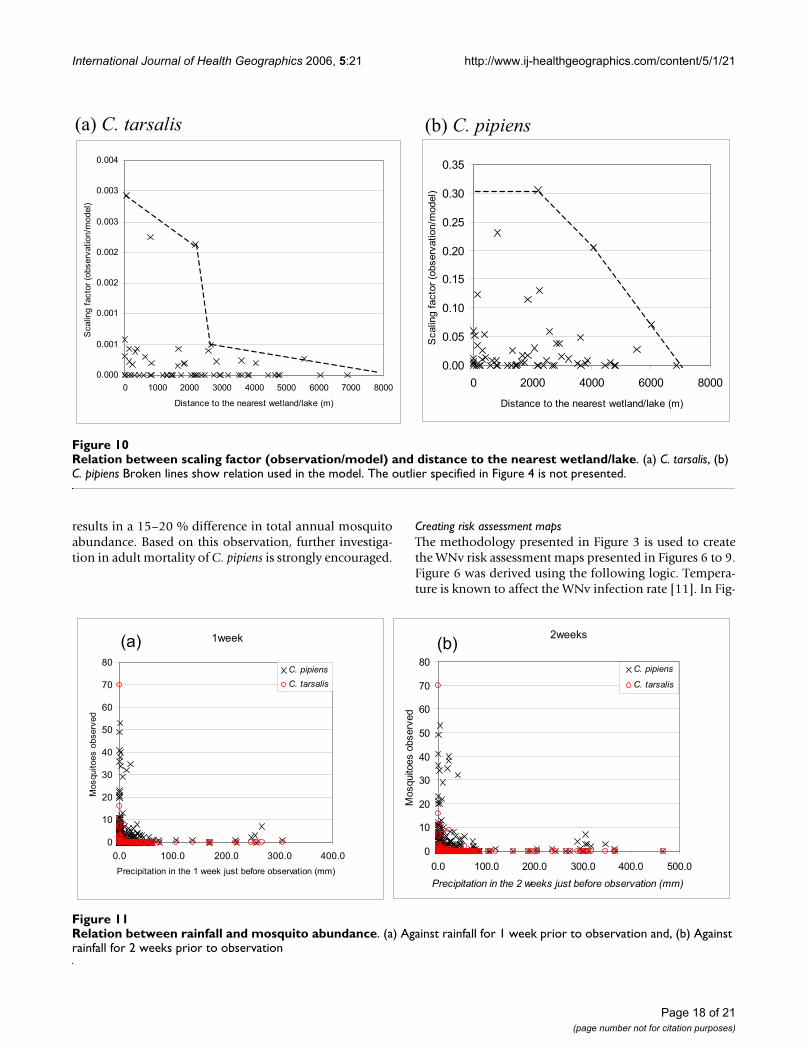
Water dependent factorsAn overlay of the BCCDC mosquito collection data withthe distribution of wetlands and lakes revealed a negativerelation between the distance to the nearest wetland orlake and mosquito abundance. This observation is con-sistent with mosquito biology since mosquitoes requirewater to lay their eggs, and the first three stages of the mos-quito life cycle are aquatic. Additionally, the flight rangeof mosquitoes is relatively short (unless there is strongwind) so adult mosquitoes tend not to migrate very farfrom their breeding areas. Bailey et al. [53] revealed that alarge percentage of C. tarsalis in Sacrament Valley of Cali-fornia traveled 2–3 miles (approximately 3–5 km) down-wind in one evening and 7 miles (11 km) or more in twoevenings, and concluded that it would be realistic to esti-mate 20–25 miles (32–40 km) as the maximum dispersaldistance of individual C. tarsalis mosquitoes in this valley,while C. pipiens would be limited to a distance of no far-ther than 1 mile (1.6 km) in an evening [54]. The effect ofdistance to the nearest wetland or lake in relation to thenumber of mosquitoes is presented in Figure 10. The neg-ative relationship is clearly evident for C. tarsalis, while theC. pipiens observations exhibit a peak around 2000 m(which we could not explain). The data outlier in the C.tarsalis figure was excluded from our model.
A negative relation between trapped mosquito numbersand rainfall recorded at the nearest climatic station is evi-dent in Figure 11. This effect is somewhat counterintuitiveto our general understanding of mosquitoes preferringwet conditions, but several studies support this observa-tion. Shaman et al. [55] observed that the abundance of C.pipiens was negatively correlated with local modeled sur-face wetness 10 days prior to observation, while other spe-cies in their study had a positive relation with the sameindex. They concluded that this effect was because of thepreference by C. pipiens for breeding in polluted,eutrophic waters associated with dry conditions. The com-plex relationship between the abundance of C. tarsalis andwater-related conditions was examined by Wegbreit andReisen [56]. Their study revealed that there is no clear rela-tionship between mosquito abundance and rainfall, butthere is a strong relation with snow depth, snow watercontent and river runoff. Based on our observations,where large mosquito sampling numbers are concentratednear zero rainfall events, we conclude that more researchis needed prior to establishing such a relation. Therefore,a parameter related to rainfall was not included in ourmodel.
Bird abundanceThe BCCDC (unpublished) has evaluated the risk of birdspecies in BC that may introduce WNv into the provincevia migration. Twenty seven (27) species are classified ashigh risk species (Additional file 1). Recent studies have
revealed that global warming may cause early migrationfor some bird species. Marra et al. [57] conclude that forevery 1°C increase in spring temperature the timing ofmigration occurs on average one day earlier. Additionally,Cotton [58] reveals that the timing of migration isdependent on the temperatures at the overwinteringground and breeding site. On the other hand, Both andVisser [59] reported that for species relying on endog-enous rhythms, the timing of migration is not affected byclimatic change, although the breeding date is affected.
Since we do not have enough information on the temper-ature-dependency of migration for each species, ourmodel uses the long term average abundance of migratorybirds, provided by the USGS, as a factor that increasesWNv risk.
Validation and risk assessment using model outputValidationWe first validated our model by comparing its output tothe observed mosquito trap abundances (Figure 4). Ourmodel replicated the observed summertime peak abun-dances, which indicates that our models incorporatedmosquito population dynamics successfully. Next, inorder to validate the spatially-explicit population dynam-ics of our models, we performed a trap-by-trap assessment(Figure 5). In Figure 5, for each of C. tarsalis and C. pipiens,two traps with greatest number of mosquitoes are firstselected for validation, and then, in order to examinepotential effects of spatial variation, one trap from theother significant region of BC is included (Figure 5a(3)and 5b(3)).
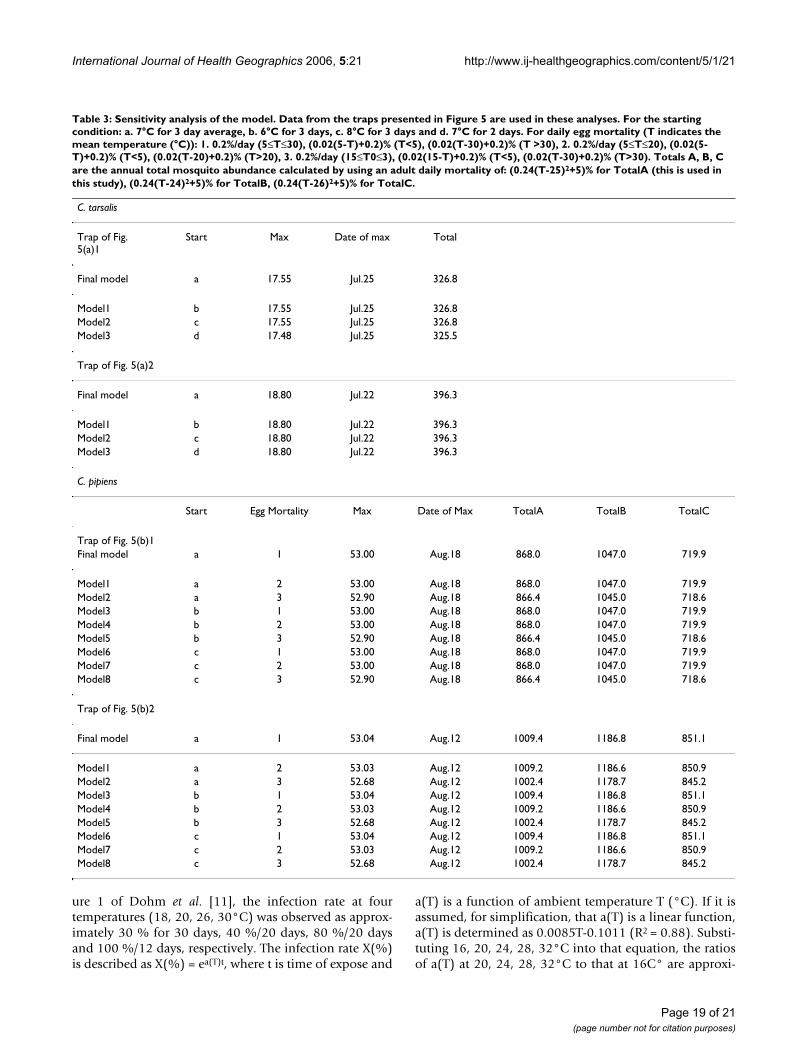
Sensitivity analysisIn order to explore the stability of the model output, sen-sitivity analysis is carried out. All of the results of the anal-yses, using the data from the two traps with the highestnumbers of mosquitoes (i.e., the same traps as presentedin Figures 5a (1)(2) and 5b (1)(2)), are depicted in Table3. For C. tarsalis, as all of the biological parameters werederived from the published literature, the most uncertainparameter was the soil temperature at which mosquitoesemerge from winter hibernation. Since soil temperaturedata is not available, air temperature was used as a surro-gate. Changing the condition at which diapause isassumed to terminate results in insignificant change in themodel's output. For C. pipiens, on the other hand, egg andadult mortality as well as the starting condition were allderived from C. tarsalis studies and therefore should bechecked.
Although small changes in the starting condition and eggmortality result in no significant change, it is apparentthat altering adult mortality can result in considerablechange. Changing the center of the mortality curve by 1C°
Page 17 of 21(page number not for citation purposes)
International Journal of Health Geographics 2006, 5:21 http://www.ij-healthgeographics.com/content/5/1/21
results in a 15–20 % difference in total annual mosquitoabundance. Based on this observation, further investiga-tion in adult mortality of C. pipiens is strongly encouraged.
Creating risk assessment mapsThe methodology presented in Figure 3 is used to createthe WNv risk assessment maps presented in Figures 6 to 9.Figure 6 was derived using the following logic. Tempera-ture is known to affect the WNv infection rate [11]. In Fig-
Relation between scaling factor (observation/model) and distance to the nearest wetland/lakeFigure 10Relation between scaling factor (observation/model) and distance to the nearest wetland/lake. (a) C. tarsalis, (b) C. pipiens Broken lines show relation used in the model. The outlier specified in Figure 4 is not presented.
(a) C. tarsalis (b) C. pipiens
0.000
0.001
0.001
0.002
0.002
0.003
0.003
0.004
0 1000 2000 3000 4000 5000 6000 7000 8000
Distance to the nearest wetland/lake (m)
Scalin
g f
acto
r (o
bserv
ation/m
odel)
0.00
0.05
0.10
0.15
0.20
0.25
0.30
0.35
0 2000 4000 6000 8000
Distance to the nearest wetland/lake (m)
Scalin
g f
acto
r(o
bserv
ation/m
odel)
Relation between rainfall and mosquito abundanceFigure 11Relation between rainfall and mosquito abundance. (a) Against rainfall for 1 week prior to observation and, (b) Against rainfall for 2 weeks prior to observation
2weeks
0
10
20
30
40
50
60
70
80
0.0 100.0 200.0 300.0 400.0 500.0
Precipitation in the 2 weeks just before observation (mm)
Mosquitoes o
bserv
ed
C. pipiens
C. tarsalis
1week
0
10
20
30
40
50
60
70
80
0.0 100.0 200.0 300.0 400.0
Precipitation in the 1 week just before observation (mm)
Mosquitoes o
bserv
ed
C. pipiens
C. tarsalis
(b)(a)
Page 18 of 21(page number not for citation purposes)
International Journal of Health Geographics 2006, 5:21 http://www.ij-healthgeographics.com/content/5/1/21
ure 1 of Dohm et al. [11], the infection rate at fourtemperatures (18, 20, 26, 30°C) was observed as approx-imately 30 % for 30 days, 40 %/20 days, 80 %/20 daysand 100 %/12 days, respectively. The infection rate X(%)is described as X(%) = ea(T)t, where t is time of expose and
a(T) is a function of ambient temperature T (°C). If it isassumed, for simplification, that a(T) is a linear function,a(T) is determined as 0.0085T-0.1011 (R2 = 0.88). Substi-tuting 16, 20, 24, 28, 32°C into that equation, the ratiosof a(T) at 20, 24, 28, 32°C to that at 16C° are approxi-
Table 3: Sensitivity analysis of the model. Data from the traps presented in Figure 5 are used in these analyses. For the starting condition: a. 7°C for 3 day average, b. 6°C for 3 days, c. 8°C for 3 days and d. 7°C for 2 days. For daily egg mortality (T indicates the mean temperature (°C)): 1. 0.2%/day (5≤T≤30), (0.02(5-T)+0.2)% (T<5), (0.02(T-30)+0.2)% (T >30), 2. 0.2%/day (5≤T≤20), (0.02(5-T)+0.2)% (T<5), (0.02(T-20)+0.2)% (T>20), 3. 0.2%/day (15≤T0≤3), (0.02(15-T)+0.2)% (T<5), (0.02(T-30)+0.2)% (T>30). Totals A, B, C are the annual total mosquito abundance calculated by using an adult daily mortality of: (0.24(T-25)2+5)% for TotalA (this is used in this study), (0.24(T-24)2+5)% for TotalB, (0.24(T-26)2+5)% for TotalC.
C. tarsalis
Trap of Fig. 5(a)1
Start Max Date of max Total
Final model a 17.55 Jul.25 326.8
Model1 b 17.55 Jul.25 326.8Model2 c 17.55 Jul.25 326.8Model3 d 17.48 Jul.25 325.5
Trap of Fig. 5(a)2
Final model a 18.80 Jul.22 396.3
Model1 b 18.80 Jul.22 396.3Model2 c 18.80 Jul.22 396.3Model3 d 18.80 Jul.22 396.3
C. pipiens
Start Egg Mortality Max Date of Max TotalA TotalB TotalC
Trap of Fig. 5(b)1Final model a 1 53.00 Aug.18 868.0 1047.0 719.9
Model1 a 2 53.00 Aug.18 868.0 1047.0 719.9Model2 a 3 52.90 Aug.18 866.4 1045.0 718.6Model3 b 1 53.00 Aug.18 868.0 1047.0 719.9Model4 b 2 53.00 Aug.18 868.0 1047.0 719.9Model5 b 3 52.90 Aug.18 866.4 1045.0 718.6Model6 c 1 53.00 Aug.18 868.0 1047.0 719.9Model7 c 2 53.00 Aug.18 868.0 1047.0 719.9Model8 c 3 52.90 Aug.18 866.4 1045.0 718.6
Trap of Fig. 5(b)2
Final model a 1 53.04 Aug.12 1009.4 1186.8 851.1
Model1 a 2 53.03 Aug.12 1009.2 1186.6 850.9Model2 a 3 52.68 Aug.12 1002.4 1178.7 845.2Model3 b 1 53.04 Aug.12 1009.4 1186.8 851.1Model4 b 2 53.03 Aug.12 1009.2 1186.6 850.9Model5 b 3 52.68 Aug.12 1002.4 1178.7 845.2Model6 c 1 53.04 Aug.12 1009.4 1186.8 851.1Model7 c 2 53.03 Aug.12 1009.2 1186.6 850.9Model8 c 3 52.68 Aug.12 1002.4 1178.7 845.2
Page 19 of 21(page number not for citation purposes)
International Journal of Health Geographics 2006, 5:21 http://www.ij-healthgeographics.com/content/5/1/21
mately estimated as 2, 3, 4, 5, which are used as theweights in deriving Figure 6 (e.g., if the average daily tem-perature changes from 16°C to 20°C, the rate of increasein the infection rate is doubled).
Figure 7 shows the total abundance of high risk birds.
By multiplying Figure 6 with Figure 7, the risk of forminga mosquito-bird cycle is determined (Figure 8). By divid-ing the product by the maximum value contained withinthe map, the relative risk in comparison to the most riskygrid cell is evaluated.
The relative risk of human infection is calculated as theproduct of Figure 8 and the population density of people≥ 60 years old. This risk is also expressed as a relative oneby dividing all the values by the maximum value.
Competing interestsThe authors declare that they have no competing interests.
Authors' contributionsKT created the model, carried out the analyses and draftedthe manuscript. BK conceived, designed and coordinatedthe study. SM checked the model from the standpoint ofmosquito biology and summarized the background of thestudy. JK participated in conceiving the study and helpedto draft the manuscript. All authors read and approved thefinal manuscript.
Additional material
AcknowledgementsThe authors wish to thank Environment Canada (Pacific and Yukon Region) for providing the climatic data used in this study. The comments of the anonymous reviewers are gratefully appreciated. While SM works for the BCCDC, the publication does not represent on affect an official BCCDC publication.
References1. Public Health Agency of Canada: Human Results – 2003 Pro-
gram: West Nile Virus Neurological Syndromes, West NileVirus Fever and West Nile Virus Asymptomatic Infection.[http://dsol-smed.phac-aspc.gc.ca/wnv3/map_e.phtml?appname=human&season=2003].
2. Komar N: West Nile virus: epidemiology and ecology inNorth America. Adv Virus Res 2003, 61:185-234.
3. Turell MJ, Sardelis MR, O'Guinn ML, Dohm DJ: Potential vectorsof West Nile virus in North America. Curr Top Microbiol Immunol2002, 267:241-252.
4. British Columbia Centre for Disease Control [http://www.bccdc.org]
5. Wagner VE, Hill-Rowley R, Narlock SA, Mewson HD: Remote sens-ing; a rapid and accurate method of data acquisition for anewly formed mosquito control district. Mosq News 1979,39(2):283-287.
6. Rogers DJ, Randolph SE: Studying the global distribution ofinfectious diseases using GIS and RS. Nat Rev Microbiol 2003,1(3):231-237.
7. Curry P: West Nile Virus in Saskatchewan – the 2004 Season.Minutes, Western committee on crop pests 44th annual meeting :72-73[http://www.westernforum.org/WCCP_documents/2004WCCPMinutes.doc].
8. BCCDC: Growing degree-days mapping for British Colum-bia. [http://maps.bccdc.org/pdf/Growing%20Degree%20Days%202005.pdf].
9. Ahumada JA, Lapointe D, Samuel MD: Modeling the populationdynamics of Culex quinquefasciatus (Diptera: Culicidae),along an elevational gradient in Hawaii. J Med Entomol 2004,41(6):1157-70.
10. Shuai J, Buck P, Sockett P, Aramini J, Pollari F: A GIS-driven inte-grated real-time surveillance pilot system for national WestNile virus dead bird surveillance in Canada. Int J Health Geogr2006, 5(1):17.
11. Dohm DJ, O'Guinn ML, Turell MJ: Effect of environmental tem-perature on the ability of Culex pipiens (Diptera:Culicidae) totransmit West Nile virus. J Med Entomol 2002, 39(1):221-225.
12. Weiss D, Carr D, Kellachan J, Tan C, Phillips M, Bresnitz E, Layton M,West Nile Virus Outbreak Response Working Group: Clinical find-ings of West Nile virus infection in hospitalized patients,New York and New Jersey, 2000. Emerg Infect Dis 2001,7(4):654-658.
13. Huhn GD, Sejvar JJ, Montgomery SP, Dworkin MS: West Nlile virusin the United States: an update on an emerging infectiousdisease. Am Fam Physician 2003, 68(4):653-660.
14. Fitzpatrick T: Forget rainy springs – Previous year's droughtmight predict following year's mosquito population. [http://news-info.wustl.edu/tips/page/normal/426.html].
15. Shaman J, Day JF, Stieglitz M: Drought-induced amplification andepidemic transmission of West Nile virus in southern Flor-ida. J Med Entomol 2005, 42(2):134-141.
16. Chase JM, Knight TM: Drought-induced mosquito outbreaks inwetlands. Ecol Lett 2003, 6:1017-1024.
17. Meyer RP, Reisen WK, Milby MM: Influence of vegetation on car-bon dioxide trap effectiveness for sampling mosquitoes inthe Sierra Nevada foothills of Kern County, California. J AmMosq Control Assoc 1991, 7(3):471-475.
18. Barr AR, Smith TA, Boreham MM, White KE: Evaluation of somefactors affecting the efficiency of light traps in collectingmosquitoes. J Econ Entomol 1963, 56:123-127.
19. Ruiz MO, Tedesco C, McTighe TJ, Austin C, Kitron U: Environmen-tal and social determinants of human risk during a West Nilevirus outbreak in the greater Chicago area, 2002. Int J HealthGeogr 2004, 3(1):8.
20. Aquino M, Fyfe M, MacDougall L, Remple V: West Nile virus inBritish Columbia. Emerg Infect Dis 2004, 10(8):1499-1501.
21. Reisen WK, Lothrop HD, Meyer RP: Time of host-seeking byCulex tarsalis (Diptera: Culicidae) in California. J Med Entomol1997, 34(4):430-437.
22. Reisen W, Lothrop H, Chiles R, Madon M, Cossen C, Woods L, Hus-ted S, Kramer V, Edman J: West Nile virus in California. EmergInfect Dis 2004, 10(8):1369-1378.
23. Greever J, Georghiou GP: Computer simulation of controlstrategies for Culex tarsalis (Diptera: Culicidae). J Med Entomol1979, 16(3):180-188.
24. Belton P: Mosquito species distributions in British Columbia.[http://www.sfu.ca/~belton/Top14map.pdf].
25. Belton P: British Columbia mosquitoes as vectors of WestNile virus. [http://www.sfu.ca/~belton/summary.pdf].
26. BCCDC: Mosquito control. [http://www.bccdc.org/content.php?item=207].
27. Environment Canada: Climatic data online. [http://www.climate.weatheroffice.ec.gc.ca/climateData/canada_e.html].
28. USGS: Earth Resources Observation and Science. [http://edc.usgs.gov/products/elevation/gtopo30/gtopo30.html].
Additional File 1High risk bird species identified by the BCCDC as potential West Nile virus vectors (Alphabetically ordered)Click here for file[http://www.biomedcentral.com/content/supplementary/1476-072X-5-21-S1.xls]
Page 20 of 21(page number not for citation purposes)
http://www.ncbi.nlm.nih.gov/entrez/query.fcgi?cmd=Retrieve&db=PubMed&dopt=Abstract&list_uids=1791459
http://www.ncbi.nlm.nih.gov/entrez/query.fcgi?cmd=Retrieve&db=PubMed&dopt=Abstract&list_uids=1791459
http://www.ncbi.nlm.nih.gov/entrez/query.fcgi?cmd=Retrieve&db=PubMed&dopt=Abstract&list_uids=1791459
International Journal of Health Geographics 2006, 5:21 http://www.ij-healthgeographics.com/content/5/1/21
Publish with BioMed Central and every scientist can read your work free of charge
"BioMed Central will be the most significant development for disseminating the results of biomedical research in our lifetime."
Sir Paul Nurse, Cancer Research UK
Your research papers will be:
available free of charge to the entire biomedical community
peer reviewed and published immediately upon acceptance
cited in PubMed and archived on PubMed Central
yours — you keep the copyright
Submit your manuscript here:http://www.biomedcentral.com/info/publishing_adv.asp
BioMedcentral
29. USGS: Patuxent-Bird population studies. [http://www.mbr-pwrc.usgs.gov/].
30. Terrain Resource Information Management Program [http://ilmbwww.gov.bc.ca/bmgs/trim/index.html]
31. British Columbia Ministry of Sustainable Resource Manage-ment [ftp://ftp.env.gov.bc.ca/dist/arcwhse/watershed_atlas/]
32. Hacker CS, Scott DW, Thompson JR: A forecasting model formosquito population densities. J Med Entomol 1973,10(6):544-551.
33. Juricic D, Eno BE, Parikh G: Mathematical modeling of a virusvector: Culex tarsalis. Biomed Sci Instrum 1974, 10:23-28.
34. Moon TE: A statistical model of the dynamics of a mosquitovector (Culex tarsalis) population. Biometrics 1976,32(2):355-368.
35. Eisenberg JN, Reisen WK, Spear RC: Dynamic model comparingthe bionomics of two isolated Culex tarsalis (Diptera: Culici-dae) populations: model development. J Med Entomol 1995,32(2):83-97.
36. Madder DJ, Surgeoner GA, Helson BV: Number of generations,egg production, and developmental time of Culex pipiens andCulex restauns (Diptera: Culicidae) in southern Ontario. JMed Entomol 1983, 20(3):275-287.
37. Tekle A: The physiology of hibernation and its role in the geo-graphical distribution of population of the Culex pipienscomplex. Am J Trop Med Hyg 1960, 9:321-330.
38. Dohm DJ, Sardelis MR, Turell MJ: Experimental vertical trans-mission of West Nile virus by Culex pipiens (Diptera: Culici-dae). J Med Entomol 2002, 39(4):640-644.
39. Goddard LB, Roth AE, Reisen WK, Scott TW: Vertical transmis-sion of West Nile virus by three California Culex (Diptera:Culicidae) species. J Med Entomol 2003, 40(6):743-746.
40. ESRI Support Center [http://support.esri.com/]41. University of California and California State Department of Agricul-
ture and Natural Resources: Integrated Pest Management Pro-gram. 2003. How to manage pests -Degree days. [http://www.ipm.ucdavis.edu/WEATHER/ddconcepts.html].
42. Reisen WK, Meyer RP, Shields J, Arbolante C: Population ecologyof preimaginal Culex tarsalis (Diptera: Culicidae) in KernCounty, California. J Med Entomol 1989, 26(1):10-22.
43. Bennington EE, Sooter CA, Baer H: The diapause in adult femaleCulex tarsalis coquillett (Diptera: culicidae). Mosq News 1958,18(4):299-304.
44. Madder DJ, Surgeoner GA, Helson BV: Induction of diapauseinCulex pipiens and Culex restauns (Diptera:Culicidae) in south-ern Ontario. Can Entom 1983, 115(8):877-883.
45. Bennington EE, Blackmore JS, Sooter CA: Soil temperature andthe emergence of Culex tarsalis from hibermation. Mosq News1958, 18(4):297-298.
46. Burdick DJ, Kardos EH: The age structure and fall, winter andspring populations of Culex tarsalis in Kern County, Califor-nia. Ann Entomol Soc Am 1963, 56:527-535.
47. Tamaria NA: The adult biology of Culex pipiens molestus Forsk.In Vestnik MGU (biol.) (in Russian), Cited via Vinogradova EB: Culex pipienspipiens mosquitoes: taxonomy, distribution, ecology, physiology, genetics,applied importance and control Volume 3. Sofia, Bulgaria: PENSOFT Pub-lishers; 2000; 1966:65-75.
48. Burrough PA, McDonnell RA: Principles of Geographical Information Sys-tems New York: Oxford University Press; 1998.
49. Odeh IOA, McBratney AB, Chittleborough DJ: Further results onprediction of soil properties from terrain attributes: hetero-topic cokriging and regression-kriging. Geoderma 1995,67:215-226.
50. Boer EPJ, de Beurs KM, Hartkamp AD: Kriging and thin platesplines for mapping climate variables. Int J Appl Earth Observa-tion and Geoinformation 2001, 3(2):146-154.
51. Jarvis CH, Stuart N: A comparison among strategies for inter-polating maximum and minimum daily air temperatures.Part1: The selection of "guiding" topographic and land covervariables. J Appl Meteorol 2001, 40:1060-1074.
52. Ninyerola M, Pons X, Roure JM: A methodological approach ofclimatological modeling of air temperature and precipita-tion through GIS techniques. Int J Climatol 2000, 20:1823-1841.
53. Bailey SF, Eliason DA, Hoffmann BL: Flight and dispersal of themosquito Culex tarsalis Coquillett in the Sacramento Valleyof California. Hilgardia 1965, 37(3):73-111.
54. Lakewood West Nile Task Force: Response plans and guidelines forWest Nile virus Lakewood, Ohio 2003 [http://www.ci.lakewood.oh.us/pdf/WNVfinal.pdf].
55. Shaman J, Stieglitz M, Stark C, Le Blancq S, Cane M: Using adynamic hydrology model to predict mosquito abundance inflood and swamp water. Emerg Infect Dis 2002, 8(1):6-13.
56. Wegbreit J, Reisen WK: Relationships among weather, mos-quito abundance, and encephalitis virus activity in California:Kern County 1990–98. J Am Mosq Control Assoc 2000, 16(1):22-27.
57. Marra PP, Francis CM, Mulvihill RS, Moore FR: The influence of cli-mate on the timing and rate of spring bird migration. Oeco-logia 2005, 142(2):307-315.
58. Cotton PA: Avian migration phenology and global climatechange. Proc Natl Acad Sci USA 2003, 100(21):12219-12222.
59. Both C, Visser ME: Adjustment to climate change is con-strained by arrival date in a long-distance migrant bird.Nature 2001, 411(6835):296-298.
60. Canadian Cooperative Wild Life Health Centre, West NileVirus Surveillance Program 2005 [http://wildlife1.usask.ca/en/west_nile_virus/wnv_home.php].
61. USGS West Nile Virus Map [http://westnilemaps.usgs.gov/index.html]
62. Public Health Agency of Canada, West Nile Virus Surveil-lance Information [http://www.phac-aspc.gc.ca/wnv-vwn/index.html]
63. Reisen WK, Milby MM, Presser SB, Hardy JL: Ecology of mosqui-toes and St. Louis encephalitis virus in the Los Angeles Basinof California, 1987–1990. J Med Entomol 1992, 29(4):582-598.
64. Gerberg EJ: Manual for mosquito rearing and experimentaltechniques. Am Mosq Control Assoc Bulletin 1970, 5:.
65. Miura T, Takahashi RM: Development and survival rates ofimmature stages of Culex tarsalis (Diptera: Culicidae) in cen-tral California rice fields. In Proc 56th Annu Conf Calif Mosq VectorControl Assoc: 28–31 Edited by: Yoshimura GM, Eiffert AJ. San Mateo;1988:168-179.
66. Mead SS, Conner GE: Temperature-related growth and mor-tality rates of four mosquito species. Proc 55th Annu Conf CalifMosq Vector Control Assoc: 25–28 January 1987; Sacramento :133-137.
67. Jobling B: On two subspecies of Culex pipiens L. (Diptera).Transactions of the Royal Entomological Society of London 1938,87:193-216.
68. Tamaria NA: The developmental cycle of Culex pipiens moles-tus Forsk. Vestnik MGU (biol.)(in Russian) Cited via Vinogradova EB2000 (see 47th citation) 1966, 2:48-56.
Page 21 of 21(page number not for citation purposes)
http://www.ncbi.nlm.nih.gov/entrez/query.fcgi?cmd=Retrieve&db=PubMed&dopt=Abstract&list_uids=4149902
http://www.ncbi.nlm.nih.gov/entrez/query.fcgi?cmd=Retrieve&db=PubMed&dopt=Abstract&list_uids=4149902
http://www.ncbi.nlm.nih.gov/entrez/query.fcgi?cmd=Retrieve&db=PubMed&dopt=Abstract&list_uids=4824238
http://www.ncbi.nlm.nih.gov/entrez/query.fcgi?cmd=Retrieve&db=PubMed&dopt=Abstract&list_uids=4824238
http://www.ncbi.nlm.nih.gov/entrez/query.fcgi?cmd=Retrieve&db=PubMed&dopt=Abstract&list_uids=7608931
http://www.ncbi.nlm.nih.gov/entrez/query.fcgi?cmd=Retrieve&db=PubMed&dopt=Abstract&list_uids=7608931
http://www.ncbi.nlm.nih.gov/entrez/query.fcgi?cmd=Retrieve&db=PubMed&dopt=Abstract&list_uids=6876091
http://www.ncbi.nlm.nih.gov/entrez/query.fcgi?cmd=Retrieve&db=PubMed&dopt=Abstract&list_uids=2926773
http://www.ncbi.nlm.nih.gov/entrez/query.fcgi?cmd=Retrieve&db=PubMed&dopt=Abstract&list_uids=2926773
http://www.ncbi.nlm.nih.gov/entrez/query.fcgi?cmd=Retrieve&db=PubMed&dopt=Abstract&list_uids=1495066
http://www.ncbi.nlm.nih.gov/entrez/query.fcgi?cmd=Retrieve&db=PubMed&dopt=Abstract&list_uids=1495066