
Predicting Community Behaviour in Relation to Wastewater Reuse What Drives Decisions to Accept or...
128
Water for a Healthy Country Predicting Community Behaviour in Relation to Wastewater Reuse What Drives Decisions to Accept or Reject? Murni Po, Blair E. Nancarrow, Zoe Leviston, Natasha B. Porter, Geoffrey J. Syme and Juliane D. Kaercher
-
Upload
edithcowan -
Category
Documents
-
view
4 -
download
0
Transcript of Predicting Community Behaviour in Relation to Wastewater Reuse What Drives Decisions to Accept or...

Water for a Healthy Country
Predicting Community Behaviour in Relation to
Wastewater Reuse
What Drives Decisions to Accept or Reject?
Murni Po, Blair E. Nancarrow, Zoe Leviston, Natasha B. Porter, Geoffrey J. Syme and Juliane D. Kaercher


Predicting Community Behaviour in Relation to
Wastewater Reuse
What Drives Decisions to Accept or Reject?
Murni Po, Blair E. Nancarrow, Zoe Leviston, Natasha B. Porter, Geoffrey J. Syme and Juliane D. Kaercher

ISBN: 0 643 09238 2 The Water for a Healthy Country National Research Flagship is a research partnership between CSIRO, state and federal governments, private and public industry and other research providers. The Flagship was established in 2003 as part of the CSIRO National Research Flagship Initiative. The National Program for Sustainable Irrigation (NPSI) and the Natural Heritage Trust (NHT) funded the case study on horticultural irrigation in Melbourne (Chapter 5). The National Program for Sustainable Irrigation focuses irrigation research on critical emerging environmental issues while also aiming to improve the productivity of irrigated agriculture and maximise community benefits. The Federal Government's $2.7 billion Natural Heritage Trust is Australia's largest ever environmental rescue package The work contained in this report is collaboration between: The Flagship Water Reuse Technologies Project, CSIRO Land and Water Department of Primary Industries, Victoria Department of Sustainability and Environment, Victoria © Commonwealth of Australia 2005 All rights reserved. This work is copyright. Apart from any use as permitted under the Copyright Act 1968, no part may be reproduced by any process without prior written permission from the Commonwealth. Citation: Po, M., Nancarrow, B.E., Leviston, Z., Porter, N.B., Syme, G.J. and Kaercher, J.D. (2005). Predicting Community Behaviour in Relation to Wastewater Reuse : What drives decisions to accept or reject ? Water for a Healthy Country National Research Flagship. CSIRO Land and Water : Perth. DISCLAIMER You accept all risks and responsibility for losses, damages, costs and other consequences resulting directly or indirectly from using this site and any information or material available from it. To the maximum permitted by law, CSIRO excludes all liability to any person arising directly or indirectly from using this site and any information or material available from it. For further information contact: Ph: 02 6246 4565 Fax: 02 6246 4564 www.csiro.au Printed May 2005

i
CONTENTS
SUMMARY iv 1.0 INTRODUCTION 1 2.0 RESEARCH PROGRAM METHODOLOGY 3 2.1 Ajzen’s Theory of Planned Behaviour 3 2.2 Developing the Measures 4 2.3 Testing the Model 4 2.3.1 Perth Indirect Potable Reuse 4 2.3.2 Melbourne Horticultural Irrigation 4 3.0 THE SOCIAL EXPERIMENT 5 3.1 Methodology 5 3.1.1 Study Design and Sample 5 3.1.2 Participants 6 3.1.3 Procedure 7 3.2 Results 8 3.2.1 Survey 1 8 3.2.2 Survey 2 9 3.2.3 Surveys 1 & 2 10 3.2.4 Taste Tests Experiment 19 3.3 Follow-up Surveys 45 3.3.1 Results 45 3.4 Summary and Conclusions 48 4.0 TESTING THE MODEL: INDIRECT POTABLE IN PERTH 50 4.1 Methodology 50 4.1.1 Study Locations 50 4.1.2 Respondents 51 4.1.3 Refusal Rate 51 4.1.4 The Questionnaire 51 4.1.5 Briefing Information 52

ii
4.2 Results 52 4.2.1 Drinking Water from the MAR Scheme 52 4.2.2 Knowledge of the Scheme 54 4.2.3 Information about the Scheme 54 4.2.4 Perceived Benefits 56 4.2.5 Perceived Risks 57 4.2.6 Risks versus Benefits of the MAR Scheme 60 4.2.7 Trust in the Authorities 61 4.2.8 Trust in Authorities to Provide Information 62 4.2.9 Emotive Feelings about Water from the MAR Scheme 62 4.2.10 Drinking Recycled Wastewater other than through a MAR
Scheme 63 4.2.11 Price of Recycled Wastewater 64 4.2.12 Proportions of Recycled Water 65 4.2.13 Years the recycled wastewater was underground 67 4.2.14 Attitudes 69 4.2.15 Demographics 71 4.2.16 Modelling factors that influence the decision to drink water
from the MAR scheme 73 4.2.17 Demographic Comparisons 78 4.3 Summary and Conclusions 79 5.0 TESTING THE MODEL: HORTICULTURAL IRRIGATION
IN MELBOURNE 80 5.1 Methodology 80 5.1.1 Study Locations 80 5.1.2 Respondents 81 5.1.3 Refusal Rate 81 5.1.4 The Questionnaire 81 5.1.5 Briefing Information 82 5.2 Results 82 5.2.1 Awareness of the Scheme 82 5.2.2 Buying Produce Grown through the Werribee Scheme 83 5.2.3 Knowledge of the Scheme 84 5.2.4 Information about the Scheme 85 5.2.5 Perceived Benefits 86 5.2.6 Perceived Risks 87 5.2.7 Risks versus Benefits of the Werribee Scheme 90 5.2.8 Trust in the Authorities 90 5.2.9 Trust in Authorities to Provide Information 91 5.2.10 Emotive Feelings about eating the Vegetables 92 5.2.11 Price of Vegetables Grown with Recycled Wastewater 92 5.2.12 Place where vegetables are grown 93 5.2.13 Attitudes 94 5.2.14 Demographics 96 5.2.15 Modelling factors that influence the decision to buy vegetables
grown with recycled wastewater 98 5.2.16 Demographic Comparisons 103
5.3 Summary and Conclusions 104

iii
6.0 DISCUSSION 105 7.0 REFERENCES 107 APPENDIX 1 : ADDITIONAL INFORMATION AVAILABLE TO THE SURVEY INTERVIEWERS FOR THE PERTH CASE STUDY 109
APPENDIX 2 : ADDITIONAL INFORMATION AVAILABLE TO THE SURVEY INTERVIEWERS FOR THE MELBOURNE CASE STUDY 113

iv
SUMMARY This reports the results of a three year investigation which aimed to develop a measurement of prediction of community intended behaviour in relation to the reuse of different wastewaters for different uses. It has been apparent that communities support the concept of water reuse as a means of responsible water resources management. However, many technically sound schemes internationally have failed because communities have rejected them. Little has been known of how people make their decisions to accept or reject schemes. Public acceptance, therefore, has been viewed as an “obstacle” to implementing reuse schemes and so the emphasis has been principally on persuasion. However, it is now generally accepted that social marketing and persuasion are ineffective. Until now, it has been difficult to know what to replace them with as there have been no systematic programs of social investigation to identify the different factors that might influence public perceptions or mediate their decision making. International literature reviews found little that specifically related to the recycling of water, however, a number of parallel literatures (eg. food technology) provided some insights.
Therefore, a research program was designed to systematically investigate, identify, measure and test the major factors that govern people’s decisions about whether to use recycled water for different uses or whether to reject the schemes. It was decided to use Ajzen’s Theory of Planned Behaviour (1985) as a basis on which to build the theory and methodology. This would allow an holistic analysis of prediction of actual behaviour rather than just individual attitudes and perceptions at particular points in time. Knowing what predicts behaviour would then allow water planners and utilities to systematically target these variables and address the actual concerns held by particular communities.
Using Ajzen’s behavioural model as a basis, a hypothesised model was developed which incorporated the additional factors from comparable literatures. These needed to be tested for validity in circumstances that were as realistic as possible for community participants. Therefore, a social experiment was conducted with a random sample of community members where they were asked to drink “recycled water” and eat the horticultural products grown with “recycled water”. Through a series of questionnaires (before, during and after the experiment), the measurement scales were tested.
The outcomes of the experiment confirmed both the choice of the additional variables and the validity and reliability of the measures. The findings confirmed previous work in water recycling research in that the closer the personal contact, the less acceptable the use. However, it also appeared that being exposed to the experiment also reduced acceptance. Both trust and emotions were shown to be involved in people’s decisions to accept or reject the reuse situations, but surprisingly health risks were not significant in these decisions.
Having developed the measures, two case studies in two Australian cities were used to test the hypothesised model through a survey methodology. It was important that the case studies be immediate and applicable to the relevant communities so that they could clearly visualise their intended behaviours. Therefore an indirect potable scheme that was being considered for Perth and a horticultural irrigation scheme which had been launched in Melbourne (Werribee) were chosen.
Similar survey questionnaires were developed for each of the case studies and differed only in the details of the reuse schemes. A sample of 400 stratified random community were surveyed in each city. The results were remarkably similar in each city and provided confidence in both the selection and the measurement of the principal variables involved in people’s behavioural decisions in relation to recycling schemes.
The final models showed the relationship of the variables and their strength of contribution to the decision making to either buy the horticultural produce or drink water from the aquifer replenished with treated wastewater. Most of the hypothesised variables emerged in the final analysis.

v
The two case studies provided a quantitative understanding of the role of emotions in people’s behavioural decisions, both in the ability to measure them and also in terms of the degree of influence on the decisions. While these emotions are often discounted as “irrational” they constantly prove to be difficult to deal with and frequently constitute the major reasons for the failure of past schemes to gain public acceptance. However, the results of the statistical analyses show how other variables could be used to temper them, such as by increasing trust in the authorities and increasing the influence of “others”.
Of considerable interest was that knowledge did not emerge as a factor in people’s decisions to buy the produce. Anyone considering using communication and education as the main feature of a program to obtain community acceptance of a recycling scheme should take note of this finding. However, the provision of comprehensive and open information is a factor in engendering trust, so the role of knowledge should not be totally discounted.
As in the social experiment, the surprising finding that risk perceptions were not more dominant in influencing behavioural intentions occurred in both case studies. While risk was quite strongly influenced by trust, it had only a weak contribution to behavioural intention. Given that it is assumed that technological and health risks are important to address with the community, this is a significant finding. The model also suggests that by increasing trust in the authorities, people’s concerns about risk will also reduce.
One finding that emerged in the Melbourne horticultural model that was different from the Perth case study, was the greater contribution to the decision making of environmental obligation. That is, the more people felt an obligation to protect the environment, the more positive were their attitudes to buying vegetables grown with recycled wastewater.
There were a number of outcomes of comparisons between the major variables in the models and the participants’ demographic details that were of interest. It was evident that, in both case studies, people with lower levels of education were less trusting of the authorities than those with higher levels of education. Also females were more inclined to hold more negative emotions about the schemes than were men. There were also a number of other useful comparisons pertinent to the particular schemes that would be of great assistance for planning authorities.
Perhaps one of the most interesting findings here was that the indirect potable and the horticultural irrigation schemes were apparently seen by the communities to be similar. That is, “nature” acted as a filter for both schemes: the aquifer in the case of the indirect potable scheme and the plants in the case of the Werribee scheme. This may explain why the resulting models were so similar, except in the case of environmental obligation. It is expected that the contribution to the model of the different variables would be different for different recycling schemes. It therefore should be tested on a very different case study from these.
This research has provided an extremely promising start and the replication of the model provides considerable confidence in the variables and their measures. However, as with any new work, there remain a number of issues that have been identified by the researchers that need further refinement. This will occur over the next year or so, with opportunities for the further testing on different case studies being sought. The final product will be a tool that will allow planners and water utilities to predict potential behaviour in relation to their proposed reuse schemes and understand their local communities.

vi
1
1.0 INTRODUCTION In recent years, different States in Australia have established targets to increase their use of treated wastewater. For example, in Perth the State government aims to reuse 20% of its wastewater by 2012. In Melbourne, the target is set at 20% by 2010. Reusing wastewater that would otherwise be discharged to an outfall has now become an integral part of policy for Australia’s water resource management.
Recycled water can be used for different water services ranging from landscape and agricultural irrigation to industrial and domestic household uses. The possible implementation of any reuse scheme, however, hinges on public acceptance of the scheme.
As a concept for responsible water resource management, water reuse is widely promoted by the Australian community. Focus groups held separately in different States have generally found people to be accepting of water reuse (Melbourne Water, 1998; Sydney Water, 1999; Water Corporation of WA, 2003; Kaercher, Po and Nancarrow, 2003). However, reactions from people when it comes to actually using the water are frequently quite different. Water recycling is seen to be a logical and necessary inclusion in the range of water resource management options, but communities frequently feel a reluctance to personally use the water. Little is known of how people make their decisions to accept different water recycling schemes for a range of different uses. What is apparent is that many technically sound reuse schemes around the world have failed because communities have rejected them, often at the eleventh hour.
In the past, public acceptance has been viewed as an “obstacle” to implementing reuse schemes and so the emphasis has been principally on persuasion. However, it is now generally accepted that social marketing and persuasion are ineffective. But it is difficult to know what to replace them with as there have been no systematic programs of social investigation to identify the different factors that might influence public perceptions or mediate their decision making. There have been only limited studies to date and these have mostly been conducted by water utilities.
International literature reviews (Po, Kaercher and Nancarrow, 2004; Po and Nancarrow, 2004) were recently conducted to try to identify factors that might have significant influence on people’s acceptance of recycling schemes for a variety of uses. Little was found specifically relating to recycling of water, however, a number of parallel literatures (eg. the food technology literature) provided some insights. These factors included:
• perceived risks and benefits of the schemes • perceived control over the quality of water • trust in authorities, experts and technology • knowledge about the schemes • personal feelings & emotions associated with the schemes • nature of the scheme
Therefore, a research program was designed to systematically investigate, identify, measure and test the major factors that govern people’s decisions about whether to use recycled water for different uses or whether to reject the schemes. It was decided to use Ajzen’s Theory of Planned Behaviour (1985) as a basis on which to build the theory and methodology. This would allow an holistic analysis of prediction of actual behaviour rather than just individual attitudes and perceptions at particular points in time. Knowing what predicts behaviour would then allow water planners and utilities to systematically target these variables and address the actual concerns held by particular communities.

2
Ajzen’s Theory of Planned Behaviour has been used successfully to predict a range of human behaviours (eg. East, 1997) as well as providing empirical predictive evidence specifically in relation to pro-environmental behaviours (eg. Lynn et al., 1995; Harland et al., 1999). It has also been the subject of many positive reviews (eg. Manstead and Parker, 1995; Armitage and Connor, 2000). The theory itself develops on the seminal work in attitudinal theory by Fishbein and Ajzen (1975), and Ajzen and Fishbein (1980). It thus provides a highly reliable theoretical basis on which to build.
This report describes the various stages in that research program: the development of the model; the preliminary testing of the hypothesised variables and the validity of the measures through a social experiment; and the testing of the model through surveys about two reuse schemes in Australia. The schemes chosen were the newly established use of recycled wastewater for horticultural production at Werribee in Melbourne, and the proposed indirect potable reuse scheme through managed aquifer recharge in Perth.
3
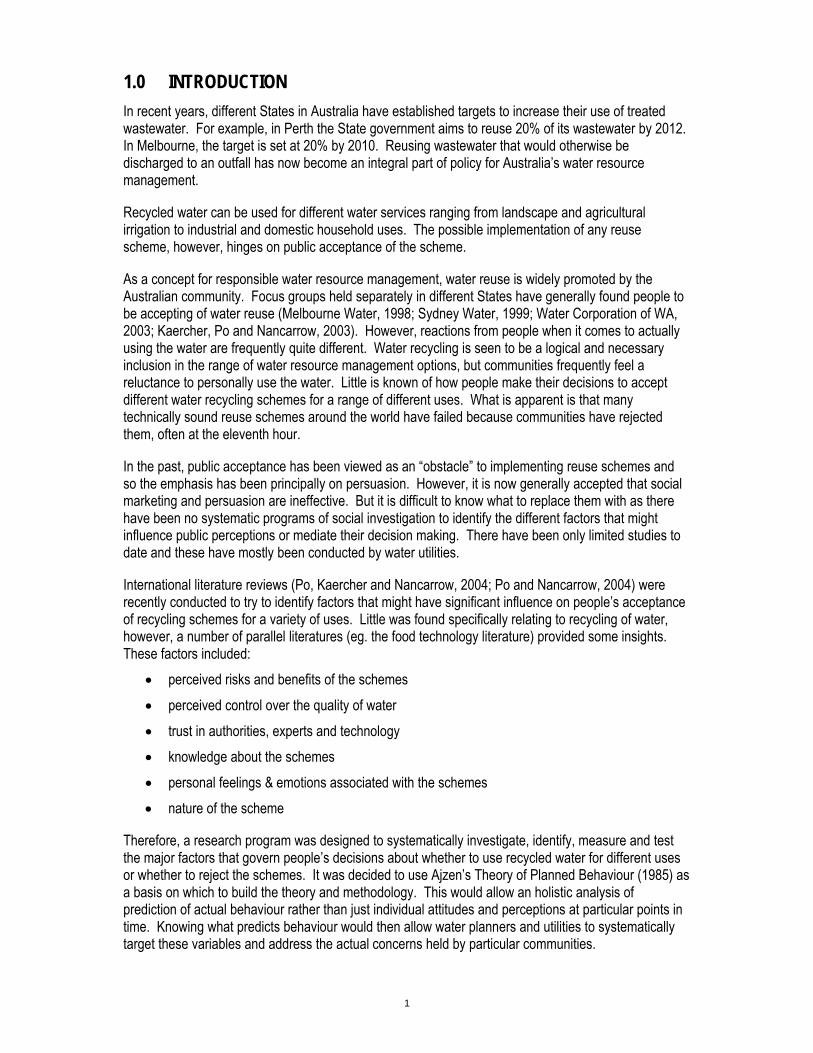
2.0 RESEARCH PROGRAM METHODOLOGY 2.1 Ajzen’s Theory of Planned Behaviour Ajzen’s (1985) Theory of Planned Behaviour (see Figure 1 below) proposes that a person’s behaviour can be predicted from their behavioural intention. This intention is in turn determined by attitudes (towards the particular behaviour), subjective norm (what others think and personal motivation to comply), and perceived behavioural control (ease or difficulty of performing an action).
Figure 1. Ajzen’s Theory of Planned Behaviour
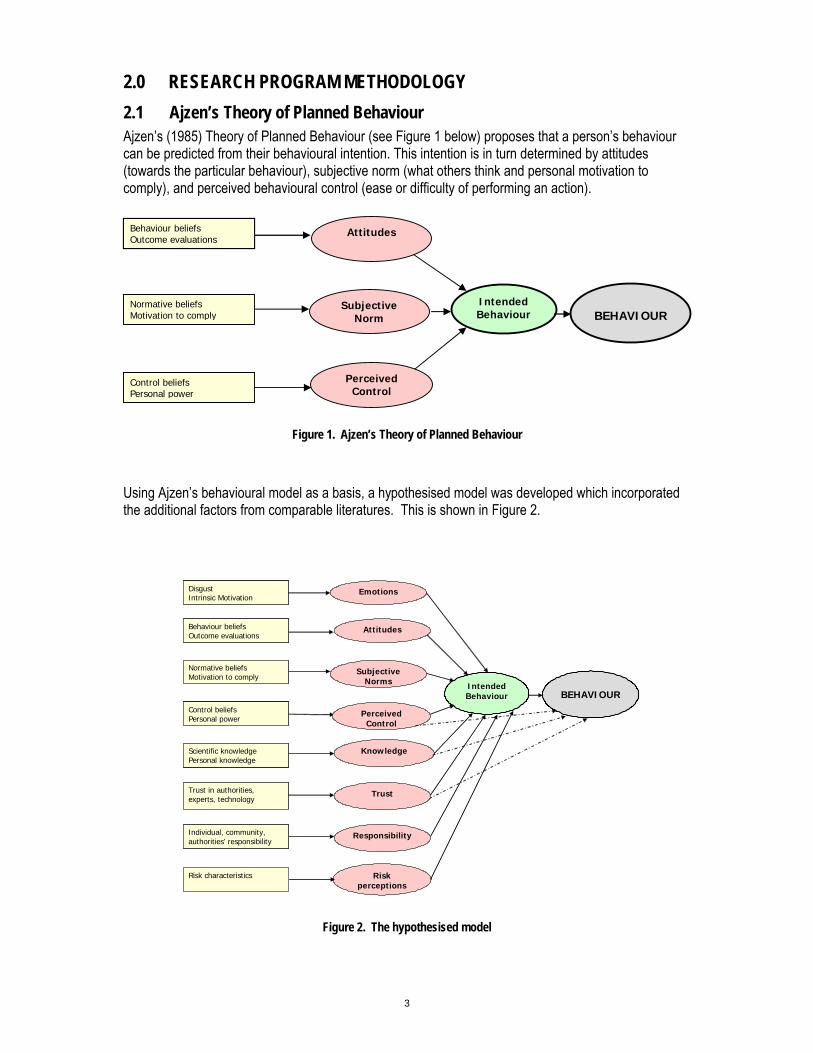
Using Ajzen’s behavioural model as a basis, a hypothesised model was developed which incorporated the additional factors from comparable literatures. This is shown in Figure 2.
DisgustIntrinsic Motivation
Emotions
Attitudes
SubjectiveNorms
PerceivedControl
Knowledge
Trust
Responsibility
IntendedBehaviour BEHAVIOUR
Trust in authorities, experts, technology
Control beliefsPersonal power
Normative beliefsMotivation to comply
Scientific knowledgePersonal knowledge
Behaviour beliefsOutcome evaluations
Individual, community,authorities’ responsibility
Risk perceptions
Risk characteristics
Figure 2. The hypothesised model
Attitudes
PerceivedControl
IntendedBehaviour
BEHAVIOUR
Control beliefs Personal power
Normative beliefs Motivation to comply
Behaviour beliefs Outcome evaluations
SubjectiveNorm

4
2.2 Developing the Measures A range of measures were developed for each of the variables in the hypothesised model. These needed to be tested for validity in circumstances that were as realistic as possible for community participants. It was therefore decided to conduct a social experiment with a random sample of community members whereby they would be asked to drink “recycled water” and eat the horticultural products grown with “recycled water”. Through a series of questionnaires, the measurement scales could be tested. The details of this stage are reported in Section 3. 2.3 Testing the Model Having developed the variable measures, two case studies in two Australian cities were used to test the hypothesised model. It was important that the case studies be immediate and applicable to the relevant communities so that they could clearly visualise their intended behaviours. Therefore an indirect potable scheme that was being considered for Perth and a horticultural irrigation scheme which had been launched in Melbourne were chosen. Similar survey questionnaires were developed for each of the case studies and differed only in the details of the reuse schemes. It was planned to survey a sample of 400 stratified random community in each city. 2.3.1 Perth Indirect Potable Reuse Perth, the capital of Western Australia, is facing the results of a long term water shortage which is believed to be the result of climate change. A stepped change in rainfall occurred in the mid 1970s and again in the mid 1990s. This has resulted in a need to quickly develop more water sources. However, an added management issue has been the overuse of the major drinking water aquifer to unsustainable levels. Managed Aquifer Recharge (MAR) has been suggested as a means of addressing both the requirement for a new source of water and the restoration of the stressed aquifer. Treated wastewater could be injected into the aquifer, mixed with the natural groundwater and later retrieved as the drinking water source. Water source issues are constantly discussed by the community and were the focus of the recent State election campaign. The need for a range of new and unconventional water sources is understood by the community as well as water reuse being a community priority in responsible water resources management. The MAR case study was therefore highly relevant. The results of this survey can be found in Section 4. 2.3.2 Melbourne Horticultural Irrigation Melbourne, the capital of Victoria, has recently launched a scheme whereby treated wastewater from the Werribee Wastewater Treatment Plant was piped to nearby irrigators of horticulture. This scheme assisted in the restoration of the stressed groundwater aquifer and the meeting of Victoria’s water reuse target of 20% by 2010. Water shortages have been a feature of Melbourne’s planning over the past few years with the community experiencing quite severe restrictions for garden irrigation. The Werribee scheme was publicly launched and the horticultural produce was being sold throughout Melbourne as well as being exported. This reuse scheme was therefore immediate and applicable to all Melbourne residents. The results of this survey can be found in Section 5.

5
3.0 THE SOCIAL EXPERIMENT Our knowledge of factors that affect people’s decisions to accept or reject a particular reuse scheme is limited at this stage. One concern with introducing a reuse scheme is the “yuck factor” or disgust. The role of this emotion in people’s decision-making processes is poorly understood. In psychological terms, the disgust emotion is defined as the emotional discomfort generated from close contact with certain unpleasant stimuli (Angyal, 1941). A disgust emotion in using recycled water is likely to be generated from people’s perceived ‘dirtiness’ of the water and their fear of contagions or personal contamination from using the water. The emotion quotient in reusing water is therefore likely to be important in gaining an understanding of how people make decisions about using the water.
This study has been conducted as part of the CSIRO flagship program, Water for a Healthy Country. The role of the “yuck factor” in people’s decision making was of particular interest. In addition, the study aimed to determine ways of measuring other factors that have been hypothesised to influence people’s decision to accept or reject a particular use of recycled water.
As a summary, the study aimed to test measures and influences of:
the feelings people associate with using recycled water for different purposes, specifically the “yuck factor”;
the range of factors that may influence public perceptions of using recycled water for different purposes.
3.1 Methodology
3.1.1 Study Design and Sample In order to examine participants’ behavioural responses to recycled water directly, an experimental study involving taste tests was adopted. Participants in the study were asked to taste test three samples of water that were labelled treated greywater, stormwater or wastewater and twelve samples of fruit and vegetables labelled as being irrigated with these recycled water sources.
Although recycled water and produce irrigated with recycled water has been shown to be safe to consume, the study decided to use placebos to avoid any unnecessary risks to the participants. The samples of water consisted of filtered scheme water and the fruit and vegetables were purchased from local supermarkets. Concealment of the samples’ origins was essential to the methodological design so that participants’ responses to recycled water could be directly measured. When designing the study, consideration was given to all ethical principles required by the National Health and Medical Research Council regarding research that involves concealment. In addition, all the food preparation and services in the study were guided by the Australia New Zealand Food Standards code to ensure the safety of food presented to the participants.
As a summary, the fifteen samples that the participants were asked to taste were as shown in Table 1.

6
Table 1. Samples of water and produce
Sample No Label
1. Treated greywater 2. Treated wastewater 3. Treated stormwater 4. Oranges irrigated with treated greywater 5. Oranges irrigated with treated wastewater 6. Oranges irrigated with treated stormwater 7. Lettuce irrigated with treated greywater 8. Lettuce irrigated with treated wastewater 9. Lettuce irrigated with treated stormwater 10. Grapes irrigated with treated greywater 11. Grapes irrigated with treated wastewater 12. Grapes irrigated with treated stormwater 13. Carrots irrigated with treated greywater 14. Carrots irrigated with treated wastewater 15. Carrots irrigated with treated stormwater
3.1.2 Participants Participants were randomly selected from a number of Perth suburbs. The selection of the suburbs was based on weekly family income figures obtained from the Australian Bureau of Statistics (2001) and the proximity of the suburbs to the study location, as the participants were not paid for their involvement.
Eight suburbs close to the study location were chosen: two from the lower income groups (Hilton & Osborne Park); four from medium income groups (Innaloo, Woodlands, Doubleview & Jolimont) and two from higher income groups (Churchlands & Shenton Park).
A minimum of eighty participants was required for the experiment. Taking into account the usual drop-out rate, a total of 161 people were recruited to ensure the required number attended. An attempt was made to ensure there was an equal number of males and females agreeing to participate in each suburb.
The following table shows the number of people who attended the experiment, those who agreed but did not participate, and those who refused. The details of those who refused to participate were divided into two categories: people who were simply not interested in the study (Absolute) and those who could not attend due to other commitments (Conditional).

7
Table 2. Study sample design
Refused Socio-Economic
Group Suburb Attended
Agreed but did not
participate Absolute Conditional Total
Called
Lower Hilton 14 7 51 155 235
Osborne Park 11 9 102 180 306
Medium Doubleview 11 9 25 60 106 Innaloo 9 11 52 73 148 Jolimont 11 9 36 36 93 Woodlands 14 6 53 96 170
Higher Churchlands 11 9 36 67 133 Shenton Park 12 9 42 74 139 Total 93 69* 397 741 1330
*15 people sent apologies prior to and during the experiment 3.1.3 Procedure Telephone recruitment of participants was conducted during the second week of April 2004. Only one person was required to participate from each household. Before they attended the experiment, respondents who agreed to participate were asked to answer a preliminary telephone questionnaire. This preliminary survey questionnaire contained a number of attitudinal statements and socio-demographic information.
The experiment took place on 1st May 2004 at the CSIRO Centre for Environment and Life Sciences. It was estimated that each participant would take no more than two hours to complete the experiment. The first 20 participants were scheduled to arrive at 9.00am, followed by another group of 20 at each half hour until 12.30pm.
The following shows a schedule of the experiment and its estimated time.
1. Induction 15 mins
2. Taste tests 1 hr 15 mins
3. Questionnaire 15 mins
4. Debriefing 15 mins
3.1.3.1 Induction Participants were first introduced to the physical layout of the experiment. They were then given a brief explanation of the study and the terms used in the experiment (e.g. treated wastewater; greywater and stormwater), followed by instructions on how to proceed. They were advised that tasting and swallowing the samples were not compulsory.

8
3.1.3.2 Taste tests Participants were requested to complete taste tests of a total of fifteen samples of water, fruit and vegetables irrigated with treated wastewater, greywater, and stormwater. Each sample was presented on a separate table. The fifteen tables were arranged so that the similar food and drink types were not consecutive. This aimed to reduce potential experimental bias.
Each table was labelled from 1 to 15 with a description of the sample (e.g. oranges irrigated with treated wastewater). For tables with fruit and vegetable samples, an A4 sized picture of the relevant sample was also presented which illustrated the contact with the water in the irrigation process. Participants were also reminded that tasting was not compulsory.
Each participant was provided with a booklet containing questions for each table. The pages in each booklet had been organised in random order to decrease potential order bias. Efforts were also made to ensure that no participants began the experiment with any drink samples.
Upon tasting, participants were required to complete all questions for that table before moving to the next.
3.1.3.3 Questionnaire After the taste tests, participants were asked to complete a separate survey questionnaire. Some of the items in this questionnaire were repeated from the pre-experiment telephone survey to examine any apparent attitudinal changes to recycled water after being exposed to the experiment.
3.1.3.4 Debriefing Participants were debriefed in an isolated office before leaving the experiment. This included personally addressed written information which explained that the samples were not associated with recycled water and the scientific reasons for the deception. A staff member was also available to the participants at all times to ensure that all their queries and concerns were addressed.
3.2 Results For practical reasons, the study results are reported in four main sections. Section 3.2.1 comprises the results of only the preliminary survey conducted on the phone before the participants attended the experiment (Survey 1). Section 3.2.2 details the results of additional questions asked of participants after they completed their taste tests (Survey 2). The same questions asked to participants in Surveys 1 and 2 are reported in Section 3.2.3. Section 3.2.4 presents the results from the taste test experiment.
3.2.1 Survey 1 3.2.1.1 Awareness of Perth’s water issues Participants were asked the extent to which they were aware of Perth’s water issues on a five-point scale. The majority of participants (85.8%) considered they were aware or very aware of Perth’s water issues. No respondents reported being not at all aware. 3.2.1.2 Experience with recycling water Participants were asked whether they had visited or lived in a place where greywater, stormwater or wastewater has been reused. A similar percentage of participants reported they had (50.0%) as had not (46.7%). Those who had or might have experienced recycled water were asked to indicate the type of water. Up to three responses were allowed.

9
Table 3. The type of water experienced
Water reused Frequency (N=49) Percentage
Greywater 46 95.8
Stormwater 17 35.4
Treated wastewater 4 8.3
Desalinated water 2 4.2
Greywater was the most common source of water reused. This included water from a washing machine/laundry (54.2%), shower/bathroom (20.8%) and dishwasher/kitchen (8.3%). Stormwater was the second most common source of water reused and this included rainwater tanks (33.3%) and bore water (2.1%). Other sources of water used were treated wastewater and desalinated water. The recycled water was mainly used for garden irrigation only (79.6%), followed by drinking (14.3%) and everything around the house (12.2%). Participants were also asked to rate their experience with using recycled water. The majority of respondents (85.7%) rated their reuse experience as positive or extremely positive. Very few participants rated the experience to be negative (4.1%) and no participants rated it to be extremely negative. About ten percent of participants rated the experience to be no different. Participants who rated the experience to be either positive or negative were asked to indicate why. The main positive responses were making good use of water (72.7%), water is scarce (27.3%), and no issues with reuse (11.4%). Very few negative responses were mentioned. Examples of the negative responses were chemicals in the water affected plants (4.5%), got sick (2.3%), don’t like the taste (2.3%). 3.2.2 Survey 2 3.2.2.1 Preferred terms to use Participants in Survey 2 were given eight alternative terms that could be used to describe treated wastewater. They were then asked to rank their top three preferences from the eight terms. They were also asked to rank one term that they like the least.
0
10
20
30
40
50
60
70
80
Recycledwater
Repurifiedwater
Recycledwastewater
Reclaimedwastewater
Repurifiedwastewater
Reclaimedwater
Reusedwastewater
Reusedwater
Alternative terms to describe treated wastewater
% o
f par
ticip
ants
Top 3 most preferred term Least preferred term
Figure 3. Preference ranking of alternative terms used to describe treated wastewater

10
Recycled water and repurified water were ranked by over half of the participants to be in their top three most preferred terms. The term repurified water was also ranked by nearly one fifth of participants (16.9%) as their least preferred term. Reused wastewater and reused water were also not favoured by participants with the term reused wastewater ranked the least preferred term by 44.3% of participants.
3.2.2.2 Cost of treated wastewater Participants in Survey 2 were also asked about the potential influence of cost in their decisions to accept or reject reusing the water. The responses to this question are recorded in the table below.
Table 4. Would the cost of treated wastewater affect your decision to use the water?
Frequency (N=93) Percentage
Yes 38 40.9
Not sure 28 30.1
No 27 29.0
About forty percent of participants indicated that the cost of treated wastewater would affect their decision to use the water. Under one third (29.0%) said it would not affect their decision and 30% were unsure. Participants were further asked why they responded that way. Up to three answers were allowed for this question.
The main reasons for cost being an issue were cost should not be too high, it should be cheaper, cost is always a factor and other sources may be cheaper.
Participants who thought the cost would not affect their decisions said that cost should not be the main consideration, if the water situation is critical and water is precious. The main reason given by participants who were unsure about the possible effects of cost on their decision was that the cost should not be too high.
3.2.2.3 Cost of produce irrigated with treated wastewater Participants were also asked whether the cost of fruit and vegetables irrigated with treated wastewater would be a consideration in their acceptance or rejection of buying the products. A little more than one-third of participants (38.7%) said it would, with a similar percentage of participants (35.5%) saying it would not. The main responses for cost affecting their decisions to buy included cost is important to me, would buy it if it was cheaper, cost should not be too high and more information needed on treatment process. For participants who thought cost would not affect their decisions, the main reasons given were quality of produce is more important, cost should not be the major consideration, do not like the idea of using treated wastewater, and not concerned with quality of irrigation water. Those who were unsure if cost would be a factor, the most frequent comment was that the cost should not be too high. 3.2.3 Surveys 1 & 2 3.2.3.1 Acceptability of different uses of treated wastewater In both Surveys 1 and 2, participants were asked to rate on a five point scale how acceptable it would be to them if the government introduced the reuse of treated wastewater for a range of purposes. The question was repeated in Survey 2 to examine whether participating in the experiment could influence people’s acceptance of reuse for any purposes.

11
The acceptability percentages and mean ratings of different uses of treated wastewater for Surveys 1 and 2 are shown in the table below.
Table 5. Acceptability of different uses of treated wastewater
Survey 1 Survey 2
Uses of treated wastewater Acceptable
or highly acceptable
%
Unacceptable or highly
unacceptable
%
Mean
Acceptable or highly
acceptable
%
Unacceptable or highly
unacceptable
%
Mean
Watering public parks** 97.8 1.1 4.80 95.7 4.3 4.60
Home toilet flushing 98.9 1.1 4.80 93.5 3.3 4.71
Watering public playgrounds* 95.7 1.1 4.72 87.0 8.7 4.36
Watering home lawns/gardens* 95.6 2.2 4.70 89.2 6.5 4.41
Watering golf courses 96.7 2.2 4.77 95.6 4.3 4.71
Irrigating dairy pastures* 84.8 6.5 4.42 82.7 13.0 4.07
Irrigating fruit and vegetables* 88.0 8.7 4.34 67.4 26.1 3.63
Washing your clothes 78.5 12.0 4.02 72.8 19.6 3.95
Showering and bathing at home 57.6 27.2 3.45 53.3 33.7 3.28
Filling public swimming pools 52.1 27.2 3.34 47.8 35.9 3.20
Cooking at home* 43.5 30.4 3.09 33.0 46.2 2.69
Drinking** 31.5 45.7 2.68 23.1 57.1 2.36 *significantly different at p <.01 **significantly different at p < .05 Consistent with the previous research findings (eg. ARCWIS, 2002), the percentages of participants who found a specific use of treated wastewater acceptable or highly acceptable decreased as the use moved closer to human contact. About a third of participants in Survey 1 (31.5%) and a quarter of participants in Survey 2 (23.1%) found the reuse of treated wastewater for drinking purposes to be acceptable or highly acceptable. Using the treated wastewater for watering public parks, golf courses, public playgrounds, dairy pastures, home lawns and gardens, and home toilet flushing was generally seen to be acceptable or highly acceptable to most participants. Overall, the mean acceptability ratings of the different uses in Survey 1 tended to be higher than those in Survey 2. In particular, the mean acceptability ratings of using treated wastewater to irrigate public playgrounds, home lawns or gardens, dairy pastures and fruits and vegetables were significantly higher in Survey 1 than Survey 2. Participants found these uses of treated wastewater to be more acceptable when they were asked in Survey 1 than Survey 2. This finding therefore suggested that exposure to the experiment may have influenced participants’ perceptions of using recycled water. Participants seemed to have lowered acceptance of reuse after being faced with recycled water.

12
Participants in Survey 2 were further asked, on a 5-point scale, how fair it would be to ask people to use treated wastewater for the purposes described above.
Table 6. Fairness judgement of different uses of treated wastewater
Uses of treated wastewater N Unfair or
extremely unfair
%
Neither
%
Fair or extremely fair
%
Mean
Watering golf courses 90 3.3 3.3 93.4 4.63
Home toilet flushing 90 4.4 5.6 90.0 4.59
Watering public parks 90 2.2 4.4 93.4 4.54
Watering home lawns/gardens 90 6.6 7.8 85.5 4.38
Watering public playgrounds 90 10.0 5.6 84.4 4.22
Irrigating dairy pastures 90 16.7 8.9 74.5 3.97
Washing your clothes 90 22.2 13.3 64.4 3.63
Irrigating fruit and vegetables 90 24.4 14.4 61.1 3.50
Filling public swimming pools 90 37.8 15.6 46.7 3.08
Showering and bathing at home 90 42.2 16.7 41.1 2.93
Cooking at home 90 48.4 23.1 28.6 2.53
Drinking 91 62.7 16.5 20.9 2.20
The majority of participants (>80.0%) considered that asking people to use treated wastewater for watering golf courses, public parks, home lawns and gardens and public playgrounds to be fair or extremely fair. Almost two thirds of participants (62.7%) thought it was unfair or extremely unfair to ask people to use treated wastewater for drinking. Nearly half of the participants (48.4%) also felt this way about using treated wastewater for cooking. Overall, the results indicated that it becomes less fair to ask people to use treated wastewater as the use moves closer to human contact. This was similar to decisions of acceptance of the different uses of treated wastewater. Correlation analyses were therefore conducted to examine the relationships between ratings of acceptance and fairness in relation to the uses of treated wastewater. Strong positive relationships were found between the ratings of acceptance and perceived fairness across all uses of treated wastewater (r> .64, p < .01). This suggested that people might make their fairness judgements based on how acceptable a particular use of treated wastewater was to them. 3.2.3.2 Managing treated wastewater programs in WA Participants in Surveys 1 and 2 were asked to rate on a five-point scale the extent to which they would trust five nominated agencies to manage treated wastewater reuse programs in Western Australia.

13
1
2
3
4
5
Health Department Water Corporation Department ofEnvironment
Local councils Private companies
Agencies
Mean
trus
t rat
ing
Survey 1 Survey 2
No trustat all
Completetrust
Figure 4. Mean trust rating of different agencies across Surveys 1 and 2
In Surveys 1 and 2, the Health Department was most trusted by participants to manage wastewater reuse programs in WA, followed by Water Corporation of WA and the Department of Environment. The mean trust rating for the Health Department was significantly higher in comparison to other agencies across the two surveys. The difference in the mean trust rating for Water Corporation and Department of Environment was found to be statistically not significant, indicating that participants trusted both agencies similarly to manage treated wastewater programs. The mean trust ratings for both private companies and local councils were significantly lower across the two surveys. Participants consistently felt less trusting of the private companies and local councils to manage treated wastewater programs in WA.
Participants were given a chance to nominate any other agencies that they would trust to manage reuse programs. In Survey 1, only thirteen responses were obtained and of these, CSIRO was the main agency being nominated (n=4) with a mean rating of 4.25. In Survey 2, thirty-four responses were recorded and again, the main agency nominated was CSIRO (n=15) with a mean rating of 4.07.
No statistically significant differences were found in the mean trust ratings across the five agencies between Surveys 1 and 2, indicating that participants’ trust in agencies to manage reuse programs was stable across the two surveys.
3.2.3.3 Information provision on reuse issues Participants were also asked to rate on a five-point scale how much they trusted the nine nominated agencies below to provide full information in a timely manner about any issues on the use of treated wastewater.

14
1
2
3
4
5
CSIRO scientist
s
Universi
ty scientist
s
Health Departm
ent
Medical docto
rs
Environmental groups
Consumer groups*
Department of en
vironment
Water Corporat
ion
Private
companies
Agencies
Mean
trus
t rati
ng
No trustat all
Completetrust
* significantly different between Surveys 1 and 2 at p < .01
Figure 5. Mean trust ratings of different agencies across Surveys 1 and 2 CSIRO scientists were consistently rated highly in terms of trust to provide full information in regards to any issues with the use of treated wastewater in both surveys. The mean trust rating for CSIRO was significantly higher than other agencies in Survey 1. In Survey 2, both CSIRO and the consumer groups were rated higher than other agencies. Private companies were rated significantly lower than the other groups across both surveys. Participants generally trusted agencies such as the Health Department, medical doctors, environmental groups, the Department of Environment and the Water Corporation to provide information.
As previously, participants were also given the opportunity to nominate any other agencies and rate it on the scale. However, no prominent group was nominated by participants in either survey.
No statistical differences were found in the mean trust ratings across different agencies between Surveys 1 and 2 except for Consumer groups, which were rated more favourably in Survey 2 than Survey 1.
3.2.3.4 Attitudes to reuse A series of attitudinal statements were created to measure people’s attitudes towards the environment and water reuse in general. The statements were asked first in Survey 1 and later repeated in Survey 2. Participants were required to rate how much they agreed or disagreed with each statement on a five-point scale.
The following table shows the mean agreement/disagreement for each statement. Results for Survey 1 are shown separately for the whole sample who accepted the invitation to participate and those who actually did attend and participated. This is to allow a direct comparison of attitudes before and after the experiment of those who attended.

15
Table 7. Mean agreement/disagreement with each statement across different respondent groups (1=strongly disagree to 5=strongly agree) Survey 1
All respondents
(N=161)
Survey 1 Attending
participants only (N=93)
Survey 2 Attending
participants (N=93)
I think it is too hard to get most people to use recycled water 2.81 2.66 2.56
Water experts should have control over the kind of water the community is supplied with 3.55 3.43 3.41
I would rather “go without” than do something that wastes water 3.55 3.50 3.24
All water should cost the same, even if it comes from different sources 3.08 3.20 3.24
I believe water recycling is essential to help manage future water shortages 4.50 4.52 4.67
I have the responsibility to help with Perth’s water future** 4.47 4.42 4.69
I would never use recycled water even in times of water shortages 1.58 1.61 1.45
It would be too difficult for me to use recycled water at home 1.89 1.85 1.85
I contribute to any water shortages in Perth 3.40 3.27 3.14
Water recycling is not appropriate for managing Perth’s water future 1.71 1.71 1.55
I feel personally obligated to do whatever I can to save water 4.38 4.40 4.42
The Government is partly responsible for any water shortages in Perth 4.02 4.11 4.01
I feel good when I do things to help the environment 4.39 4.42 4.38
Water is a valuable resource that should be re-used 4.63 4.62 4.68
It is my right to have fresh water supplied to my home 3.94 3.97 4.01
It would be very easy for me to use recycled water in my home 3.78 3.76 3.84
People have a right to unlimited use of water* 1.81 1.63 1.61
I intend to use recycled water in the future 4.10 4.20 4.12
People should take responsibility for the environment around them** 4.50 4.51 4.73
Consumers have the right to know fruits and vegetables they are buying have been irrigated with treated wastewater** 3.41 3.41 3.91
The community as a whole has the responsibility to help with Perth’s water future** 4.52 4.53 4.84
I could never use recycled water 1.55 1.51 1.32
I feel a moral obligation to protect the natural environment 4.42 4.45 4.63
I would only be prepared to use recycled water in times of water shortages 2.01 1.86 1.91
Every household should be free to choose their source of water supply (e.g. groundwater, surface water, recycled water) 2.75 2.71 2.77
The Government as a whole has the responsibility to help with Perth’s water future 4.53 4.60 4.67
I believe the protection of the natural environment is vital for future generations** 4.65 4.68 4.87
Fruits and vegetables irrigated with recycled water should be labelled in the supermarket
3.17 3.15 3.45
Technology will always find a way to provide the water we need 2.82 2.74 2.53
Most people who are close to me support the use of recycled water 3.70 3.74 3.82
* Significantly different between those who did and did not attend the experiment ** Significantly different in the way attending participants responded to the statement in Surveys 1 and 2

16
T-test analyses were conducted for each statement to examine whether there were any significant differences in the agreement/disagreement ratings between participants who did and did not attend the experiment. Only one significant difference was found at p < .01. Participants who attended the experiment disagreed more with the statement people have a right to unlimited use of water (mean=1.63) than people who did not attend (mean=2.04). It is important to note that this difference is merely in terms of degree of agreement rather than being opposing views.
Paired t-test analyses were also conducted to examine whether participants who attended the experiment changed the way they responded to each statement from Surveys 1 to 2. The findings suggested that attending the experiment might have magnified the sense of responsibility participants felt towards Perth’s future water supply and the environment in general. Participants expressed stronger agreement with the following statements when asked in Survey 2 than in Survey 1.
I have the responsibility to help with Perth’s water future People should take responsibility for the environment around them The community as a whole has a responsibility to help with Perth’s water future I believe the protection of the natural environment is vital for future generations
Participants also expressed significantly higher agreement with the statement consumers have the right to know fruits and vegetables they are buying have been irrigated with treated wastewater after the experiment.
3.2.3.5 Factor structures To examine the validity of the statements, analyses were conducted, firstly for Survey 1 results using all respondents who were invited to the experiment and secondly for Survey 2 with participants who actually attended the experiment. The underlying structures of people’s responses to the attitudinal statements in Survey 1 would then be used to compare with those in Survey 2 results.
Survey 1
Four factors were extracted in Survey 1 and explained 45% of the variance. When tested for reliability, three factors emerged as being suitable for use as scales in later analyses.
• Factor 1. Environmental obligation (α= .84) • Factor 2. Reuse intention (α = .70) • Factor 3. Perceived control over the use of recycled water (α = .52)
Survey 2
An exploratory factor analysis was again performed on the 23 statements in Survey 2. Five factors were extracted and explained 50.4% of the variance. When the reliability analyses were formed, four factors were considered to be reliable to form a scale.
• Factor 1. Environmental obligation (α = .76) • Factor 2. Reuse intention (α = .67) • Factor 3. Perceived control over the use of recycled water (α = .68) • Factor 4. Reuse beliefs (α = .69)

17
To validate the resultant scales, a confirmatory factor analysis using structural equation modelling (SEM) was used to determine the unidimensionality of scales across Surveys 1 and 2. A unidimensionality test was conducted to ensure that items of a particular scale are only measuring one dimension or concept at a time. The results are presented in the sections below.
• Environmental obligation scale Through the SEM analysis, the items in the environmental obligation scales were refined and were found to be a good fit to the data across Surveys 1 and 2, measuring only one dimension of environmental obligation. The fit indexes across Surveys 1 and 2 are shown in the table below.
Table 8. Fit measures for environmental obligation scale across Surveys 1 and 2
Fit Statistics Survey 1 Survey 2
Degrees of Freedom 2 2
Chi-square 6.76 0.46
Probability level 0.034 0.78
CFI .98 1.00
NFI .97 1.00
RMSEA .12 0.00
The mean scores on this scale were compared across Surveys 1 and 2. They indicated that participants on average displayed a strong obligation to environmental protection. For participants who attended the experiment, their responses to the scale did not differ significantly between Surveys 1 and 2. Also, no significant difference was found in the mean scores between respondents who did and did not attend the experiment.
• Reuse intention scale This reuse intention scale was found to be a good fit of data obtained in Surveys 1 and 2, indicating the scale’s unidimensionality. The fit indexes for the scale across Surveys 1 and 2 are shown in the table below.
Table 9. Fit measures for reuse intention scale across Surveys 1 and 2
Fit Statistics Survey 1 Survey 2
Degrees of Freedom 1 1
Chi-square 0.04 0.33
Probability level 0.84 0.56
CFI 1.00 1.00
NFI 0.99 0.99
RMSEA 0.00 0.00

18
Mean scores on the reuse intention scale was compared across Surveys 1 and 2. Participants on average indicated a fairly strong intention to use recycled water. For participants who attended the experiment, their intention to use recycled water did not significantly differ across Surveys 1 and 2. No significant difference was found in the intention to use recycled water between participants who did and did not come to the experiment. • Perceived control scale The perceived control scale was found to be a good fit of data across Surveys 1 and 2, supporting the unidimensionality of the scale. The fit indexes for the scale across Surveys 1 and 2 are shown in the table below.
Table 10. Fit measures for perceived control scale across Surveys 1 and 2
Fit Statistics Survey 1 Survey 2
Degree of Freedom 4 4
Chi-square 8.75 3.73
Probability level 0.07 0.44
CFI 0.95 0.95
NFI 0.92 1.00
RMSEA 0.08 0.00
Again the mean scores for the scale were compared across Surveys 1 and 2. On average, participants reported a relatively strong perceived control over the use of recycled water. For participants who attended the experiment, their perceived control did not significantly differ across Surveys 1 and 2. No significant difference was found between respondents who did and did not attend the experiment.
3.2.3.6 Responsibility to help with Perth’s water future In the attitudinal statements, participants in Surveys 1 and 2 were asked to rate the extent to which they agreed or disagreed with three statements regarding personal, community and government responsibility for Perth’s water future.
In Surveys 1 and 2, respondents on average agreed that the government, the community and they themselves all had the responsibility to help with Perth’s water future. In each survey, there was no statistically significant difference between attitudes to the three responsibilities. However, findings indicated that participating in the experiment may have promoted greater feelings of personal and community responsibilities to help with Perth’s water future, there being statistically significant differences between the surveys. No such differences occurred for government responsibility.
3.2.3.7 Responsible for Perth’s water shortage issues Participants were also asked to rate how much they agreed or disagreed with two statements regarding Perth’s water shortages. In both Surveys 1 and 2, respondents on average agreed that the government was partly responsible for any water shortages in Perth, while they neither agreed nor disagreed that they themselves had partly contributed. Statistical results showed that the government was generally seen as being more responsible for the water shortage in Perth. Responses to both statements seemed to be stable across the two surveys.

19
3.2.3.8 Consumer right to know and Labelling of produce Participants were also asked their agreement or disagreement with two statements regarding the consumer right to know about produce irrigated with recycled water and labelling of such produce.
In both surveys, participants indicated a high level of agreement with the right of consumers to know if the fruit and vegetables they were buying had been irrigated with recycled water. In particular, their agreement rating with that statement was significantly higher in Survey 2, indicating that attendance at the experiment may have caused participants to feel more strongly towards this right.
On average, they neither agreed nor disagreed with the need to label fruit and vegetables in supermarkets if they had been irrigated with recycled water. Their responses towards the statement were not significantly different in Surveys 1 and 2.
3.2.4 Taste tests experiment The presentation of results in the taste tests experiment does not necessarily follow the order of samples tried by participants in the experiment. For ease of interpretation, samples relating to a specific recycled water source are discussed simultaneously. As a summary, samples tested in the experiment were as follows.
1. Five different samples of treated stormwater: treated stormwater for drinking; lettuce, carrots, grapes and oranges all irrigated with treated stormwater;
2. Five different samples of treated greywater: treated greywater for drinking; lettuce, carrots, grapes and oranges all irrigated with treated greywater;
3. Five different samples of treated wastewater: treated wastewater for drinking; lettuce, carrots, grapes and oranges all irrigated with treated wastewater.
For any open-ended questions, the participants were allowed to provide up to three responses.
3.2.4.1 Samples of treated stormwater and produce irrigated with treated stormwater Tasting and Swallowing
For each sample of stormwater, participants were asked whether they had either tasted or swallowed it. The percentages of participants who tasted and swallowed the five treated stormwater samples are shown in the figure below.
The majority of participants (>80%) had tasted and swallowed the five samples of treated stormwater. Of all samples, the percentages of participants who tasted and swallowed grapes and oranges irrigated with treated stormwater were slightly higher (97.8% and 95.6% respectively) than for the other samples.
Participants were asked to state their reasons for deciding whether to taste or not taste each of the samples. The same question was also asked regarding their decision to swallow or not swallow. Three responses were allowed for each question. The main responses are shown in the tables below.

20
0
20
40
60
80
100
Water Lettuce Carrots Grapes Oranges
Treated stormwater samples
% o
f par
ticip
ants
Tasted Swallowed
Figure 6. Percentages of participants who had either tasted or swallowed the five treated stormwater samples Table 11. Reasons for tasting the treated stormwater samples
Water N=69
Lettuce N=66
Carrots N=65
Grapes N=66
Oranges N=66 Response
n % n % n % n % n %
Felt safe with stormwater 34 49.2 31 47 35 53.8 41 62.1 27 40.9
Curiosity 20 29 25 37.9 25 38.4 16 24.2 17 25.8
Tasted/looked/smelled okay 8 11.6 12 18 10 15.4 9 13.5 5 7.6
Trusted the treatment 6 8.7 - - - - - - - -
Only two thirds of participants who tasted the five samples provided reasons. The most common reason given for swallowing samples of treated stormwater or produce irrigated with treated stormwater was felt safe with stormwater followed by curiosity and tasted/looked/smelled okay. For participants who chose not to taste the treated stormwater or produce irrigated with treated stormwater, the main reasons given were unsure what is in the water and more information about the treatment process needed. The table below presents the responses given by people who did not taste a particular stormwater sample. Table 12. Reasons for not tasting the treated stormwater sample
Water N=5
Lettuce N=5
Carrots N=6
Grapes N=2
Oranges N=4 Response
n n n n n
Unsure what is in the water 2 1 2 2 2
More information about the treatment process needed 2 - 2 1 2
Don’t like the idea of using treated stormwater - 4 1 - -

21
Similar responses were obtained from participants who chose to either swallow or not swallow the samples. The most frequent reasons stated for swallowing treated stormwater or produce irrigated with treated stormwater were not concerned with stormwater, felt it was safe and looked/tasted/smelled okay. Other common reasons were curiosity and trusted the treatment process. Table 13. Reasons for swallowing the treated stormwater sample
Water N=67
Lettuce N=66
Carrots N=65
Grapes N=61
Oranges N=65 Response
n % n % n % n % n %
Not concerned with stormwater 5 7.5 22 33.3 - - 46 75.4 36 55.4
Felt it was safe 13 19.4 - - 48 73.8 8 13.1 24 36.9
Looked/tasted/smelled okay 29 43.3 27 40.9 - - 6 9.8 18 27.7
Curiosity 16 23.9 8 12.1 10 15.4 5 8.2 7 10.8
Trusted the treatment 11 16.4 12 18.2 6 9.2 - - - -
The most common responses given by participants for not swallowing treated stormwater or produce irrigated with treated stormwater were concerned with the quality of the stormwater and more information about the treatment process needed. Table 14. Reasons for not swallowing the treated stormwater sample
Water N=5
Lettuce N=7
Carrots N=5
Grapes N=2
Oranges N=4 Response
n n n n n
Concerned with quality of the stormwater 1 4 1 2 2
More information about the treatment process needed 4 - 1 1 1
Don’t like orange/carrots/lettuce/grapes - 2 - - 1
Perceived health risks
Participants were also asked whether they considered the possible health risks to them when they consumed the treated stormwater samples. Their responses to this question are denoted in the figure below.
For treated stormwater and lettuce irrigated with treated stormwater, more than half of participants reported that they considered the possible health risks to them before consuming the samples (57.6% and 53.8% respectively). In contrast, the percentages of participants who considered the possible risks before consuming carrots and oranges irrigated with treated stormwater were lower (42.4% and 37.8% respectively). The percentages of participants who either had (48.9%) or had not (51.1%) considered the possible health risk of consuming grapes irrigated with treated stormwater were similar.

22
0
20
40
60
80
100
Water Lettuce Carrots Grapes Oranges
Treated stormwater samples
% o
f par
ticip
ants
Yes No
Figure 7. Percentages of participants who considered possible health risks in consuming the treated stormwater samples
Participants who considered the possible health risk were further asked to rate the risk on a five-point scale. Figure 8 shows the average mean ratings given by participants for the different samples of treated stormwater.
1
2
3
4
5
Water Lettuce Carrots Grapes Oranges
Treated stormwater samples
Mea
n He
alth
Risk
Rat
ing
No risk at all
Extremely risky
N=51 N=45 N=39 N=44 N=34
Figure 8. Mean health risk rating for different samples of treated stormwater
The mean risk rating for the treated stormwater sample for drinking was slightly higher (2.29) than the other samples. The difference in the mean rating was however not significantly different.

23
Feelings of disgust
Participants were also asked whether they felt disgusted when consuming the treated stormwater samples.
0
20
40
60
80
100
Water Lettuce Carrots Grapes Oranges
Treated stormwater samples
% o
f par
ticip
ants
Yes No
Figure 9. Feelings of disgust with the five samples of treated stormwater
The majority of participants did not feel disgusted with consuming the five samples. The percentages of participants who stated feeling disgusted were slightly higher for treated stormwater (5.5%) and lettuce irrigated with treated stormwater (5.7%).
Participants were asked to provide details about their feelings of disgust in relation to each of the treated stormwater samples. The main responses are shown in the tables below. Table 15. Reasons for feeling disgusted with the treated stormwater samples
Water N=4
Lettuce N=4
Carrots N=3
Grapes N=2
Oranges N=2 Response
n n n n n
Unknown content in stormwater a concern (eg petrol, oil, grease) 1 5 2 2 -
Depends who is treating the water - - 1 - -
More information about treatment process/health impacts needed
- - - - 1
The most common response recorded for those who felt disgusted was unknown content in stormwater a concern.

24
Table 16. Reasons for not feeling disgusted with the treated stormwater samples Water N=46
Lettuce N=40
Carrots N=44
Grapes N=42
Oranges N=47 Response
n % n % n % n % n %
Not concerned with treated stormwater 25 54.3 22 55.0 21 47.7 27 64.3 29 51.7
Tasted/looked/smelled okay 4 8.7 8 20.0 10 22.7 5 11.9 7 14.9
Trust the treatment process 5 10.9 - - 4 9.1 - - 3 6.4
Water is filtered naturally by the plants - - - - - - 3 7.1 - -
Some concerns 3 6.5 - - - - - - - -
The most common responses recorded for those who did not feel disgusted were not concerned with treated stormwater, tasted/looked/smelled okay and trust in the treatment process. Other responses included water is filtered naturally by the plants and some concerns.
Trust in the treatment process
Participants were also asked whether they trusted the treatment process when they chose to consume the five samples of treated stormwater.
0
20
40
60
80
100
Water Lettuce Carrots Grapes Oranges
Treated stormwater samples
% o
f par
ticip
ants
Yes No
Figure 10. Percentages of participants who trusted or did not trust the treatment process
The majority of participants (>80.0 %) trusted the treatment process when they decided to consume samples of treated stormwater. The percentages of participants who said they trusted the treatment

25
process were slightly higher for treated stormwater for drinking (87.5%), carrots (88.9%) and grapes (87.8%) irrigated with treated stormwater.
Participants who trusted the treatment process as well as those that did not were further asked to provide details. Their responses are captured in the tables below.
Table 17. Reasons for trusting the treatment process Water N=53
Lettuce N=48
Carrots N=47
Grapes N=49
Oranges N=49 Response
n % n % n % n % n % Not concerned with reusing stormwater 22 41.5 17 35.4 21 44.7 18 36.7 15 30.6
Trust the treatment standards 14 26.4 19 39.6 14 29.8 14 28.6 31 63.2
Would like more information on the treatment process 8 15.1 6 12.5 6 12.8 9 18.4 11 22.4
Trust the system but felt reluctant 8 15.1 5 10.4 - - 3 6.1 - -
Standards and regulations have to be high 5 9.4 6 12.5 - - - - - -
Depends on who treats the water - - 5 10.4 3 6.3 - - - -
Plants act as biological filter - - - - 5 10.6 4 8.2 3 6.1
Look/taste good - - - - - - 3 6.1 - -
The main comments given by participants who trusted the treatment process was not concerned with reusing stormwater followed by trust the treatment standards. Table 18 below outlines reasons given by participants who did not trust the treatment process.
Table 18. Reasons for not trusting the treatment process
Water N=10
Lettuce N=13
Carrots N=9
Grapes N=10
Oranges N=10 Response
n n n n n
More information needed about the treatment process 6 9 5 6 9
Concern with treatment system (unknown risks, possible failure in mechanical process and human errors)
3 3 5 4 4
3.2.4.2 Samples of treated greywater and produce irrigated with treated greywater Tasting and swallowing
For each sample of treated greywater, participants were asked whether they had either tasted or swallowed it.

26
0
20
40
60
80
100
Water Lettuce Carrots Grapes Oranges
Treated Greywater Samples
% o
f par
ticip
ants
Tasted Swallowed
Figure 11. Percentages of participants who had either tasted or swallowed the five treated greywater samples
Most participants (>85%) had tasted and swallowed the five samples of treated greywater. The number of participants who had either tasted (85.9%) or swallowed (85.9%) treated greywater was slightly lower than the remaining samples.
Participants were further asked to state their reasons for deciding whether to taste or not taste each of the samples. The same question was also asked regarding their decision to swallow or not swallow. Responses are listed in the tables below.
Table 19. Reasons for tasting treated greywater and produce irrigated with treated greywater
Water N=60
Lettuce N=62
Carrots N=62
Grapes N=63
Oranges N=62 Response
n % n % n % n % n %
Felt safe with greywater 12 20.0 26 40.4 40 64.5 22 34.9 13 21.0
Curiosity 31 51.7 18 25.7 18 29.0 20 31.7 24 38.7
Tasted/looked/smelled okay 15 25.0 14 20.0 4 6.5 14 22.3 11 17.7
Trust the treatment process 8 13.3 - - - - 5 7.9 22 35.5
The most common reasons stated for tasting treated greywater or produce irrigated with treated greywater were felt safe with greywater and curiosity. Other common responses were tasted/looked/smelled okay and trust the treatment process.

27
Table 20. Reasons for not tasting treated greywater and produce irrigated with treated greywater Water N=12
Lettuce N=8
Carrots N=9
Grapes N=7
Oranges N=10 Response
n n n n n
Don’t like the idea of using treated greywater 8 1 5 4 7
More information needed about treatment process/health impacts
2 5 2 2 2
Don’t like/allergic to oranges/carrots/lettuce/grapes - 1 - - 2
Common responses for not tasting treated greywater or produce irrigated with treated greywater included don’t like the idea of using treated greywater and more information needed about the treatment process/health impacts.
Table 21. Reasons for swallowing treated greywater and produce irrigated with treated greywater
Water N=60
Lettuce N=56
Carrots N=55
Grapes N=56
Oranges N=58 Response
n % n % n % n % n %
Looked/tasted/smelled okay 20 33.3 23 41.1 20 36.4 9 26.8 9 15.5
Curiosity 19 31.7 7 12.5 13 23.6 6 10.7 24 41.4
Not concerned with using greywater 14 21.2 21 37.5 10 18.2 19 33.9 13 22.4
Felt it was safe - - - - 13 23.6 10 17.9 11 19.0
Trust the treatment process 9 15.0 3 5.4 1 1.8 9 16.1 1 1.7
The most frequent reasons stated for swallowing treated greywater or produce irrigated with treated greywater were looked/tasted/smelled okay, curiosity and not concerned with greywater. Other common responses included felt it was safe and trust the treatment process.
Table 22. Reasons for not swallowing treated greywater and produce irrigated with treated greywater Water
N=9 Lettuce
N=6 Carrots
N=8 Grapes
N=6 Oranges
N=7 Response n n n n n
Don’t like the idea of using greywater 3 - 5 3 4
More information needed about the treatment process 2 3 2 2 2
Harmful substances in water 1 2 - - -

28
The most common reasons given for not swallowing treated greywater or produce irrigated with treated greywater were don’t like the idea of using greywater, and more information needed about the treatment process.
Perceived health risks
Participants were asked whether they thought about the health risks when they consumed the treated greywater samples.
0
20
40
60
80
100
Water Lettuce Carrots Grapes Oranges
Treated Greywater Samples
% o
f par
ticip
ants
Yes No
Figure 12. Percentages of participants who considered possible health risks in consuming the treated greywater samples
Over two-thirds of participants (67.4%) considered the possible health risks when they drank the treated greywater. About 60% of participants considered health risks when consuming lettuce and carrots irrigated with treated greywater. Less than half of the participants (44.6%) considered health risks when consuming oranges irrigated with treated greywater.
The mean health risk ratings indicated that participants perceived health risks in consuming all five samples of treated greywater to be very similar. Statistical analyses revealed no significant differences in the mean health risk ratings across the five samples.
1
2
3
4
5
Water Lettuce Carrots Grapes Oranges
Treated Greywater Samples
Mea
n He
alth
Risk
Rat
ing
No risk at all
Extremely risky
N=61 N=55 N=54 N=46 N=41
Figure 13. Mean health risk rating for the five samples of treated greywater

29
Feelings of disgust
Similarly, participants were asked whether they felt disgusted when they consumed the five samples of treated greywater. The following figure shows participants’ responses to the question.
0
20
40
60
80
100
Water Lettuce Carrots Grapes Oranges
Treated Greywater Samples
% o
f par
ticip
ants
Yes No
.
Figure 14: Feelings of disgust with the five samples of treated stormwater
The majority of participants did not feel disgusted when they consumed the five treated greywater samples. The percentages of participants who stated they felt disgusted were slightly higher for drinking treated greywater (10.9%) and consuming grapes irrigated with treated greywater (7.7%).
Participants were asked to provide details about their feelings of disgust in relation to each of the treated greywater samples. The main responses are shown in the tables below. Table 23. Reasons for feeling disgusted with the treated greywater samples
Water N=9
Lettuce N=5
Carrots N=4
Grapes N=7
Oranges N=3 Response
n n n n n
Don’t like the idea / not comfortable 6 - - 3 -
More information needed about treatment process/health impacts - 4 3 - -
Greywater not for drinking 3 - - - -
Thought of wastewater in greywater - - - - 2
Did not taste right - - - - 1
The most common responses for those who reported feeling disgusted were don’t like the idea / not comfortable and I want more information. Other responses included greywater not for drinking, thought of wastewater in greywater and did not taste right.

30
Table 24. Reasons for not feeling disgusted with the treated greywater sample Water N=39
Lettuce N=43
Carrots N=43
Grapes N=39
Oranges N=40 Response
n % n % n % n % n %
Tasted/looked/smelled okay 12 30.8 13 30.2 16 37.2 15 38.5 5 12.5
No problem with treated greywater 4 10.3 11 25.6 15 34.9 9 23.1 12 32.5
Trust the treatment process 12 30.8 9 20.9 5 6.0 11 28.2 6 15.0
Okay for irrigation only 8 20.5 - - - - - - 4 10.0
Some concerns - - 4 9.3 - - - - 3 7.5
Fewer problems with greywater than with wastewater - - 4 9.3 - - - - - -
Produce did not taste nice - - - - 4 9.3 - - - -
Provided treatment regulations are followed 3 7.7 - - - - - - - -
Not at this stage - - - - - - - - 3 7.5 The most frequent responses given by respondents who did not feel disgusted were tasted/looked/smelled okay, no problem with treated greywater, trust the treatment process, okay for irrigation only and some concerns. Other common responses were fewer problems with greywater than with wastewater, produce did not taste nice, provided treatment regulations are followed and not at this stage.
Trust in the treatment process The percentages of participants who trusted the treatment process were similar across the different samples of treated greywater. Most participants trusted the treatment process for the different samples of treated greywater.
0
20
40
60
80
100
Water Lettuce Carrots Grapes Oranges
Treated Greywater Samples
% o
f par
ticip
ants
Yes No
Figure 145. Percentages of participants who trusted or did not trust the treatment process

31
Participants were further asked to provide details about their trust in the treatment process. The tables below present the main responses given by the participants.
Table 25. Reasons for trusting the treatment process
Water N=48
Lettuce N=45
Carrots N=46
Grapes N=46
Oranges N=47 Response
n % n % n % n % n %
Trust the treatment standards 26 54.1 18 40.0 15 32.6 15 32.6 22 46.8
More information about the treatment process and the potential health impacts
8 16.7 6 13.4 6 13.0 5 10.9 5 10.6
Not concerned with reusing greywater 5 10.4 15 33.4 7 15.2 12 26.1 10 21.3
Depends on who operates/monitors the system - - - - 9 19.6 - - 5 10.6
Concern that treatment unable to remove all 8 16.7 5 11.1 4 8.7 5 10.9 3 6.4
Plants act as additional filter - - 4 8.8 - - 6 13.0 - -
A variety of comments were recorded from participants who trusted the treatment process. The main responses were trust the treatment standards, more information about the treatment process and the potential health impacts, and not concerned with reusing greywater. Some participants qualified their responses by stating that they were still concerned that the treatment might not be able to remove all possible harmful aspects of the water.
Table 26. Reasons for not trusting the treatment process Water N=11
Lettuce N=13
Carrots N=15
Grapes N=11
Oranges N=10 Response
n n n n n
More information needed about the treatment process and the long-term health impacts
10 11 11 7 7
Concern with treatment system: unknown risks and possible failure in mechanical process or human errors
- 5 - 3 -
Participants who did not trust the treatment process generally felt they needed more information about the treatment process and the long-term health impacts of using treated greywater.

32
3.2.4.3 Samples of treated wastewater and produce irrigated with treated wastewater Tasting and swallowing
Participants were asked whether they had tasted or swallowed the five different samples of treated wastewater.
0
20
40
60
80
100
Water Lettuce Carrots Grapes Oranges
Treated Wastewater Samples
% o
f par
ticip
ants
Tasted Swallowed
Figure 16. Percentages of participants who either tasted or swallowed the five samples of treated wastewater The majority of participants (>80.0%) had tasted and swallowed carrots, grapes and oranges irrigated with treated wastewater. In comparison, the number of participants who tasted and swallowed the treated wastewater (77.2%) and lettuce (77.2%) irrigated with treated wastewater was lower.
Participants were also asked to state their reasons for deciding whether to taste or not taste each of the samples. The same question was also asked regarding their decision to swallow or not swallow. Responses are listed in the tables below.
Table 27. Reasons for tasting treated wastewater and produce irrigated with treated wastewater
Water N=52
Lettuce N=51
Carrots N=57
Grapes N=61
Oranges N=58 Response
n % n % n % n % n %
Curiosity 28 53.8 23 45.1 22 38.6 27 44.3 22 37.9
Trust the treatment process 10 19.2 5 9.8 12 21.1 16 26.2 23 39.7
Tasted/looked/smelled okay 7 13.5 10 19.6 12 21.1 18 29.5 5 8.6
Not concerned with the water 8 15.4 14 27.4 8 14.1 - - - - Don’t like the idea of using
wastewater 3 5.8 - - - - - - - -
Would like more information about the treatment process - - 4 7.8 - - - - - -
The most frequent reasons cited for participants who tasted treated wastewater or produce irrigated with treated wastewater were curiosity, trust the treatment process and tasted/looked/smelled okay. Other reasons identified were not concerned with the water, don’t like the idea of using wastewater and would like more information about the treatment process..

33
Table 28. Reasons for not tasting treated wastewater and produce irrigated with treated wastewater
Water N=20
Lettuce N=14
Carrots N=13
Grapes N=11
Oranges N=12 Response
n n n n n
Don’t like the idea of using wastewater 10 5 9 8 9
More information needed about the treatment process 8 4 2 3 2
The most common reasons given for not tasting treated wastewater or produce irrigated with treated wastewater were don’t like the idea of using wastewater and more information needed about the treatment process.
Table 29. Reasons for swallowing treated wastewater and produce irrigated with treated wastewater
Water N=49
Lettuce N=49
Carrots N=54
Grapes N=55
Oranges N=56 Response
n % n % n % n % n %
Looked/tasted/smelled okay 14 28.6 17 34.7 20 37.0 31 56.4 31 55.4
Felt it was safe 9 18.4 7 14.3 22 40.7 11 20.0 24 42.9
Curiosity 13 26.5 11 22.4 10 18.5 7 12.7 4 7.1
Trust the treatment process 13 26.5 6 12.2 6 11.1 2 3.6 1 1.8
Don’t like the idea of using wastewater 4 8.2 2 4.1 - - - - - -
The most common reasons given for swallowing treated wastewater or produce irrigated with treated wastewater were looked/tasted/smelled okay and felt it was safe. Other common reasons included curiosity and trust the treatment process.
The most frequent reasons cited for not swallowing treated wastewater or produce irrigated with treated wastewater were don’t like the idea of using wastewater and more information needed about the treatment process.

34
Table 30. Reasons for not swallowing treated wastewater and produce irrigated with treated wastewater
Water N=15
Lettuce N=10
Carrots N=11
Grapes N=10
Oranges N=9 Response
n % n % n % n % n %
Don’t like the idea of using wastewater - - 5 50.0 7 63.6 7 70.0 6 66.7
More information needed about the treatment process 5 33.3 - - 3 27.3 2 20.0 2 22.2
Not convinced it was adequately treated 6 40.0 6 60.0 - - 1 10.0 - -
Perceived health risks
Most participants thought about the possible health risks when drinking the treated wastewater sample (80.4%). About two thirds of participants thought about health risks when consuming lettuce (67.0%), carrots (68.5%) and grapes (66.3%) irrigated with treated wastewater.
0
20
40
60
80
100
Water Lettuce Carrots Grapes Oranges
Treated Wastewater Samples
% o
f par
ticip
ants
Yes No
Figure 17. Percentages of participants who either thought about health risks or did not think about health risks when deciding to consume the five samples of treated wastewater
Participants who perceived health risks in consuming the treated wastewater samples were further asked to rate the risk on a five-point scale.

35
1
2
3
4
5
Water Lettuce Carrots Grapes Oranges
Treated Wastewater Samples
Mea
n Hea
lth R
isk R
atin
g
No risk at all
Extremely risky
N=73 N=59 N=63 N=61 N=47
Figure 18. Mean health risk rating for the five samples of treated wastewater
Figure 18 shows the mean risk rating across the five samples of treated wastewater. Participants perceived statistically higher risk to their health in drinking treated wastewater rather than eating carrots, grapes and oranges irrigated with treated wastewater (p<.05)1. Participants did not seem to be different in their perceived health risks in drinking treated wastewater and eating lettuce irrigated with treated wastewater.
Feelings of disgust
About a fifth of participants reported feeling disgusted when drinking treated wastewater and eating lettuce and grapes irrigated with treated wastewater (22.8%, 21.6%, and 19.8% respectively). Fewer participants reported feeling disgusted when eating carrots (14.4%) and oranges (14.8%).
0
20
40
60
80
100
Water Lettuce Carrots Grapes Oranges
Treated Wastewater Samples
% o
f par
ticip
ants
Yes No
Figure 19. Percentages of participants who reported feeling disgusted with the five samples of treated wastewater Participants were asked to provide details about their feelings of disgust in relation to each of the treated wastewater samples. The main responses are shown in the tables below.
1 A significance level of .05 was used to increase the power of this study as the number of participants who responded across five samples were low (N=35).

36
Table 31. Reasons for feeling disgusted with the treated wastewater samples
Water N=20
Lettuce N=16
Carrots N=11
Grapes N=15
Oranges N=10 Response
n n n n n
Uncomfortable with using wastewater 9 12 8.0 3 5
Thought of others’ waste in water off-putting 6 - - 5 -
Unknown health effects - - - 6 -
The most frequent responses from participants who felt disgusted were uncomfortable with using wastewater, thought of others waste in water off-putting, and unknown health effects. Table 32. Reasons for not feeling disgusted with the treated wastewater samples
Water N=38
Lettuce N=33
Carrots N=39
Grapes N=33
Oranges N=36 Response
n % n % n % n % n %
Trust the treatment process 8 21.1 6 18.2 16 41.0 8 24.2 6 16.7
No problems with treated wastewater 4 10.5 9 27.4 8 20.6 12 36.4 8 27.8
Looked/smelled/tasted okay 9 23.7 10 30.3 - - 7 21.2 5 13.9
Uncomfortable with using wastewater 9 23.7 - - 5 12.8 - - 5 13.9
Water is filtered naturally by the plants - - - - - - 3 9.1 5 13.9
Concentrated on end product only - - - - - - - - 4 11.1
Only a small amount of risk 3 7.9 - - - - - - - - The most frequent responses for those who did not feel disgusted were trust the treatment process, no problems with treated wastewater, looked/smelled/tasted okay and uncomfortable with using wastewater. Other common responses were water is filtered naturally by the plants, concentrated on end product only and only a small amount of risk.
Trust in the treatment process
The percentages of participants who trusted the treatment process for wastewater were similar across the five samples of wastewater: treated wastewater (74.2%), lettuce (74.4%), carrots (73.9%), grapes (73.9%) and oranges (76.7%) irrigated with treated wastewater.

37
0
20
40
60
80
100
Water Lettuce Carrots Grapes Oranges
% o
f par
ticip
ants
Yes No
Treated wastewater
Figure 20. Percentages of participants who trusted or did not trust the treatment process
Participants who trusted the treatment system provided various comments about their trust. Their main responses included trust the treatment standards, tried it but felt reluctant and more information needed about the treatment process and potential health impacts.
Table 33. Reasons for trusting the treatment process Water N=48
Lettuce N=45
Carrots N=36
Grapes N=42
Oranges N=40 Response
n % n % n % n % n %
Trust the treatment standards 20 41.7 22 48.8 14 38.9 21 50.0 19 47.5
Tried it but felt reluctant 13 27.1 9 20.0 7 19.4 10 23.8 - -
More information needed about the treatment process and potential health impacts
6 12.5 7 15.6 8 22.2 7 16.7 5 12.5
Strict standards and regulations must be maintained 6 12.5 - - 5 13.9 - - - -
Plants act as additional filter - - 5 11.1 4 11.1 6 14.3 5 12.5
Not concern with using treated wastewater for irrigation of trees - - - - - - - - 7 17.5
For participants who said they did not trust the treatment process, the main responses given by them included more information needed about the treatment process and concern with potential contaminants in water/food.

38
Table 34. Reasons for not trusting the treatment process
Water N=22
Lettuce N=19
Carrots N=20
Grapes N=21
Oranges N=20 Response
n % n % n % n % n %
More information needed about the treatment process 12 54.5 10 52.6 10 50.0 12 57.1 14 70.0
Concern with potential contaminants in water/food 6 27.3 3 15.8 4 20.0 10 47.6 - -
Do not like the idea of using wastewater 4 18.1 - - - - - - - -
Concern with treatment system: unknown risks and possible failure in mechanical process or human errors
- - 3 15.8 3 15.0 - - 4 20.0
3.2.4.4 An overview of all 15 samples Tasting and swallowing of the 15 samples The percentages of participants who tasted the fifteen samples are shown in the figure below.
0
20
40
60
80
100
Treated stormwater Treated greywater Treated wastewater
Taste Samples
% o
f par
ticip
ants
Water Lettuce Carrots Grapes Oranges
Figure 21. Percentages of participants who tasted the 15 samples
All fifteen samples were tasted by the majority of participants. The percentages of participants who had tasted the samples of treated wastewater and produce irrigated with wastewater were generally lower than treated greywater. In turn, treated greywater samples were generally lower than treated stormwater. While responses to fruit and vegetables irrigated with recycled water varied from one source of recycled water to another, oranges and grapes tended to be tasted the most by participants. Overall, as would have been expected, lettuce, having the greatest direct contact with the water, was tasted by a lower percentage of participants compared with other samples. This was particularly so when it was irrigated with treated wastewater.
Most participants who tasted the fifteen samples also swallowed them as well. The percentages of participants who swallowed the samples are shown in the figure below.

39
0
20
40
60
80
100
Treated stormwater Treated greywater Treated wastewater
Taste Samples
% o
f par
ticip
ants
Water Lettuce Carrots Grapes Oranges
Figure 22. The percentages of participants who consumed the 15 samples
Again, the numbers of participants who swallowed the samples of treated wastewater and produce irrigated with treated wastewater were lower than those for treated greywater and stormwater. Of all the samples, the numbers of participants who swallowed the samples of treated wastewater and lettuce irrigated with wastewater were the lowest. Again, responses to different fruit and vegetables irrigated by recycled water varied from one source to another. Overall, the differences between the fruit and vegetables were generally consistent with the degree of personal contact with the recycled water.
Perceived health risks
For each sample, participants were also asked whether they considered any possible health risks when they chose to consume them. The percentages of participants who considered the possible health risks for the 15 samples are depicted in the figure below.
0
20
40
60
80
100
Treated stormwater Treated greywater Treated wastewater
Taste Samples
% o
f par
ticip
ants
Water Lettuce Carrots Grapes Oranges
Figure 23. Percentages of participants who perceived health risks in consuming the samples

40
The percentages of participants who considered the possible health risks when faced with treated wastewater and produce irrigated with treated wastewater were higher than their greywater and stormwater counterparts. The percentages of participants who considered health risks associated with treated stormwater and produce irrigated with treated stormwater were lowest.
Relative ratings of the perceived risk are shown in the following figure.
1
2
3
4
5
Treated stormwater Treated greywater Treated wastewater
Taste Samples
Mean
Risk
Rat
ing
Water Lettuce Carrots Grapes OrangesExtremely
risky
No risk at all
Figure 24. Mean health risk ratings associated with each sample
Figure 24 indicates that participants on average rated the treated wastewater for drinking and produce irrigated with treated wastewater samples to be more risky than either treated stormwater or greywater.
Statistical analyses showed that the differences in the mean risk ratings for samples within a recycled water source were not statistically significant. Specifically, the mean risk ratings for treated stormwater and different produce irrigated with treated stormwater were not significantly different. The same results were found for the mean ratings of treated wastewater and greywater samples.
For particular produce, the source of recycled water used for irrigation was found to influence its perceived risk rating significantly. Lettuce, carrots, grapes, and oranges irrigated with treated wastewater were perceived significantly more risky than those irrigated with either treated stormwater or greywater. The samples of treated wastewater for drinking were also rated significantly more risky than those of treated greywater or stormwater.
Feelings of Disgust
Participants were also asked about their feeling of disgust when they made their decision to consume the samples. The percentages of participants who felt the emotion of disgust for each water source are shown in the figure below.

41
0
20
40
60
80
100
Treated stormwater Treated greywater Treated wastewater
Taste Samples
% o
f par
ticip
ants
Water Lettuce Carrots Grapes Oranges
Figure 25. Percentages of participants who felt disgusted when consuming the samples
The majority of participants indicated that they did not feel disgusted when they considered consuming the samples. However, the percentage of participants who indicated feeling disgusted was higher when they were faced with treated wastewater and produce irrigated with treated wastewater. This though would indicate that people did not associate their “yuck” feelings with the term “disgust”.
Trust in the treatment process
Participants were also asked about their trust in the treatment process when they made their decision to consume the samples. The following figure shows the percentages of participants who trusted in the treatment process for the range of samples.
0
20
40
60
80
100
Treated stormwater Treated greywater Treated wastewater
Taste Samples
% o
f par
ticip
ants
Water Lettuce Carrots Grapes Oranges
Figure 26. Percentages of participants who trusted in the treatment process

42
The percentages of participants who trusted in the treatment process were lower when they were faced with samples of treated wastewater and produce irrigated with treated wastewater. The percentages of participants who trusted the samples of treated stormwater and greywater and produce irrigated with treated stormwater and greywater were similar.
3.2.4.5 The way people make judgements about each sample Participants were asked to rate each sample on ten semantic differential scales. Multi-dimensional scaling with individual differences was selected to examine how participants used the scales to make judgements about the fifteen samples.
Two through five-dimensional solutions were produced from the fifteen samples. Figure 27 below shows the plotting of stress value for the different dimensional solutions.
0
0.1
0.2
0.3
0.4
2 3 4 5Dimension
Stre
ss v
alue
Figure 27. Plotting of stress value for each dimension solution An elbow, the point where the slope of the line declined slowly was detected over the third dimension. Examination of the dimension stimulus coordinates further suggested that the four- and five- dimensional solution did not add meaningful structure to the data. Consequently, three dimensions with a stress level of .21 and R2 of .70 were retained for interpretation.
The three dimensions were interpreted by examining the scales that had high positive or negative scores and provided with the following descriptive names.
• Dimension I: Appeal-Vs-Repulse
• Dimension II: Trust-Vs-Distrust
• Dimension III: Safe-Vs-Contaminated
The multi-dimensional scaling also examined how participants varied in the way they rated the fifteen samples. The results are reported in the table below. When reading the table, a weight of 0.0 for a sample on a dimension indicates that the dimension was not seen as relevant to that particular sample. A score of 1.0 indicates that the dimension was important in evaluating the sample.

43
Table 35. Results produced from the multi-dimensional analysis
Samples Dimension I (Appeal-Vs-Repulse)
Dimension II (Trust-Vs-Distrust)
Dimension III (Safe-Vs-Contaminated)
Treated Stormwater .63 .46 .38
Lettuce irrigated with stormwater .50 .45 .38
Carrots irrigated with stormwater .57 .47 .46
Grapes irrigated with stormwater .46 .49 .44
Oranges irrigated with stormwater .49 .45 .40
Treated Greywater .51 .53 .31
Lettuce irrigated with greywater .61 .42 .41
Carrots irrigated with greywater .56 .47 .41
Grapes irrigated with greywater .72 .40 .31
Oranges irrigated with greywater .62 .43 .40
Treated Wastewater .52 .52 .41
Lettuce irrigated with wastewater .55 .51 .43
Carrots irrigated with wastewater .41 .51 .49
Grapes irrigated with wastewater .55 .58 .35
Oranges irrigated with wastewater .54 .51 .45
Overall importance of each dimension .31 .23 .16
The overall importance weights indicate that the Appeal-Vs-Repulse dimension was more relevant to participants in their evaluation of samples compared with Trust-Vs-Distrust and Safe-Vs-Contaminated dimensions.
For samples related to treated wastewater except for carrots, participants generally used two predominant dimensions. Participants used Appeal-Vs-Repulse and Trust-Vs-Distrust dimensions in their evaluation. For carrots irrigated with treated wastewater, participants tended to use Trust-Vs-Distrust and Safe-Vs-Contaminated dimensions.
For samples related to treated greywater and stormwater, participants used only the Appeal-Vs-Repulse dimension to evaluate the samples with some exceptions. For treated greywater, participants used both Appeal-Vs-Repulse and Trust-Vs-Distrust dimensions. Participants used all three dimensions to evaluate samples of grapes and oranges irrigated with treated stormwater.

44
3.2.4.6 Predicting consumption To maintain sampling adequacy, samples which had a small number of participants (<15%) who did not consume the samples were excluded from this sample. Consequently, only two samples – treated wastewater and lettuce irrigated with treated wastewater were retained for binary logistic regression analyses.
Statistical analyses by means of t-tests and cross tabs were initially conducted to omit variables that were not significant in their contribution to the consumption of the two samples. The variables examined were:
1. responsibility to help with Perth’s water issues; 2 2. responsibility for Perth’s water shortage problems; 2 3. prior experience with recycled water; 4. conservation attitudes; 2 5. reuse behavioural intention; 2 6. awareness of Perth’s water issues; 7. age; 8. levels of education; 9. gross annual household income; 10. perception of health risks; 11. trust in the treatment system; and 12. feeling of disgust.
Results showed that the first 10 variables did not contribute significantly to the consumption of the two samples. They were therefore omitted from the modelling of sample consumption.
Forward stepwise (Ward) logistic regression analyses were conducted for each sample to examine factors that would increase the odds of consuming the sample.
Table 36. Logistic regression models of samples consumption
Samples Trust
Odds ratio
Disgust
Odds ratio Nagelkerke R
Square
Wastewater 18.23 0.08 .52
Lettuce irrigated with wastewater 11.43 ns .29
ns = not significant at p < .05
The odds ratio above represents the strength and direction of the relationship between two variables. The odds ratio for each of trust and disgust represents the strength and direction of relationships between both trust in the treatment process of a particular sample and feeling of disgust with the consumption of the sample.
2 From Surveys 1 and 2

45
Looking at the odds ratio for trust and disgust, it appears that trust in the treatment process and feelings of disgust were two important factors predicting consumption of the treated wastewater sample. In particular, participants who consumed the sample were 18.23 times more likely to trust the treatment process and were .08 times less likely to feel disgusted than participants who had not consumed the sample.
For the consumption of lettuce irrigated with treated wastewater, only trust in the treatment process was the main predictor. Participants who consumed the lettuce irrigated with treated wastewater were 11.43 times more likely to trust the treatment process that those who did not consume the sample.
3.3 Follow-up Surveys After the preliminary reporting of experiment results in May 2004, it was deemed necessary to conduct follow-up surveys with participants of the experiment and a random selection of Perth residents. Two follow-up studies were subsequently carried out about two months after the experiment. The first follow-up survey was carried out with participants who attended the experiment. It aimed to further investigate the attitudes of the participants to the acceptability of using treated wastewater for different purposes. Results from Surveys 1 and 2 suggested that participants significantly lowered their acceptance of using treated wastewater for some purposes after being exposed to the experimental conditions. This survey examined the attending participants’ attitudes two months after the experiment. The second follow-up survey was conducted with a random selection of people living in the Perth metropolitan area. Participants who attended the experiment displayed strong obligations to environmental protection and intention to reuse water. This survey aimed to determine whether the same attitudes were shared by the general Perth community. 3.3.1 Results 3.3.3.1 Follow-up Survey 1 The mean acceptability ratings by the experiment participants for different uses of treated wastewater across three surveys are presented in the figure below. This format has been adopted for clarity.
1
2
3
4
5
Public park
s
Home t
oilet
Public play
groun
d
Home la
wns/gard
ens
Golf co
urses
Dairy p
astures
Fruits and V
egetab
les
Washing C
lothes
Shower &
Bath
Public sw
imming pools
Cookin
g at h
ome
Drinkin
g
Uses of Treated Wastewater Samples
Mea
n A
ccep
tabi
lity
Rat
ing
Survey 1 Survey 2 Follow-up Survey 1
Highly unacceptable
Highly acceptable
Figure 28. The mean acceptability ratings of uses of treated wastewater across different surveys

46
Figure 28 shows the consistent trend in general reuse findings, indicating that the acceptance of reuse decreases as the use moves closer to human contact. The figure also shows that participants lowered their acceptance of different uses of treated wastewater after their participation in the experiment. When asked the same question two months after the experiment (i.e. Follow-up Survey 1), participants’ acceptance increased to levels similar to those found prior to attending the experiment. Participants perceived the uses of treated wastewater for cooking, irrigating home lawns/gardens, fruits and vegetables, and pastures to be significantly less acceptable in Survey 2 than in either Survey 1 or Follow-up Survey 1. The use of treated wastewater to fill up public swimming pools was perceived more favourably in Follow-up Survey 1 than Surveys 1 or 2.
3.3.3.2 Follow-up Survey 2 Awareness of Perth’s water issues Participants in the Follow-up Survey 2 were asked to rate their awareness of Perth’s water issues on a five-point scale. Participants on average thought they were fairly aware of Perth’s water issues. There were no significant differences in the mean awareness rating given by participants who attended the experiment and those in the Follow-up Survey 2. In other words, participants who attended the experiment did not consider themselves to be more aware of Perth’s water issues than a random selection of Perth community. Attitudes to reuse
A series of attitudinal statements as in Surveys 1 and 2 were asked to the general Perth community sample. Again they were required to rate the statements on a five-point scale. The responses to the statements were compared with those obtained in Survey 1 from participants who attended the experiment. The results are shown in Table 37.
In comparison with the participants who attended the experiment, the general Perth sample agreed more with the following statements:
I think it is too hard to get most people to use recycled water It would be too difficult for me to use recycled water at home I would only be prepared to use recycled water in times of water shortages I could never use recycled water Water recycling is not appropriate for managing Perth’s water future Water experts should have control over the kind of water the community is supplied with People have a right to unlimited use of water Every household should be free to choose their source of water supply
(e.g. groundwater, surface water, recycled water) The general Perth sample also indicated lower agreement with the following statements than did the attending participants.
I believe water recycling is essential to help manage future water shortages I feel personally obligated to do whatever I can to save water I feel good when I do things to help the environment Water is a valuable resource that should be re-used It would be very easy for me to use recycled water in my home I intend to use recycled water in the future I believe the protection of the natural environment is vital for future generations.

47
It is important to note the difference expressed by the general Perth sample and the attending participants is only a matter of degree rather than opposing views. However, it does seem that the participants were more pro-reuse of water than Perth residents in general.
Table 37. Mean agreement/disagreement ratings for different attitudinal statements
Attending participants General Perth residents
Survey 1 (N=93)
Follow-up Survey 2 (N=149)
I think it is too hard to get most people to use recycled water* 2.66 3.32
Water experts should have control over the kind of water the community is supplied with* 3.43 3.77
I would rather “go without” than do something that wastes water 3.50 3.39
I believe water recycling is essential to help manage future water shortages* 4.52 4.15
I would never use recycled water even in times of water shortages 1.61 1.82
It would be too difficult for me to use recycled water at home* 1.85 2.47
Water recycling is not appropriate for managing Perth’s water future* 1.71 2.15
I feel personally obligated to do whatever I can to save water* 4.40 4.11
I feel good when I do things to help the environment** 4.42 4.27
Water is a valuable resource that should be re-used* 4.62 4.31
It is my right to have fresh water supplied to my home 3.97 3.85
It would be very easy for me to use recycled water in my home* 3.76 3.39
People have a right to unlimited use of water* 1.63 2.07
I intend to use recycled water in the future* 4.20 3.66
People should take responsibility for the environment around them- 4.51 4.42
I could never use recycled water* 1.51 1.91
I feel a moral obligation to protect the natural environment 4.45 4.23
I would only be prepared to use recycled water in times of water shortages** 1.86 2.58
Every household should be free to choose their source of water supply (e.g. groundwater, surface water, recycled water)* 2.71 3.27
I believe the protection of the natural environment is vital for future generations** 4.68 4.53
*Statistical significant different at P< .01 **Statistical significant different at P < .05
Environmental obligation scale
An exploratory factor analysis was conducted with the items which measured the participants’ attitudes towards environmental protection and again formed a highly reliable scale with standardised item alpha of 0.78. An environmental obligation score was therefore calculated for the general Perth community sample. An independent t-test analysis revealed that participants who attended the experiment displayed significantly stronger attitudes towards environmental protection than did the general Perth sample. Again, the difference was merely in terms of degree rather than opposing views.

48
Reuse intention scale
An exploratory factor analysis was also conducted on the items which measured participants’ intention to use recycled water. However, the items were found to have a low standardised item alpha of .44. An SEM analysis was conducted and indicated that the three-items were a good fit to the data. The scale was therefore retained. T-test analysis indicated that participants who attended the experiment displayed significantly stronger intention to reuse in comparison with general Perth residents. Perceived control scale
An exploratory factor analysis was conducted on the items measuring the participants’ perceived control and formed a scale with a standardised alpha of 0.47. Again, the SEM analysis found that the model fit well to the data and therefore the scale was retained. Perth residents in general felt a significantly lower personal control in the use of recycled water than did participants who attended the experiment. 3.4 Summary and Conclusions The findings here in relation to recycled water for different uses were in line with past reuse studies which suggested that acceptability decreases as the use moves closer to human contact. The present study also found that perceptions of fairness of a reuse scheme was closely related to the participants’ acceptance of the scheme. Participants did not think it was fair to ask people to use recycled water for purposes that they themselves found difficult to accept.
Being exposed to the experiment seemed to reduce participants’ acceptance of treated wastewater. Participants were more willing to accept different uses of treated wastewater prior to attending the experiment than they were when asked immediately after the taste experiment. However, their acceptance of treated wastewater reverted back to original levels when they were again asked two months later. It is difficult to draw any firm conclusions however, without a control group.
The acceptability of water reuse was also found in the study to be dependent upon the type of water being reused. Participants were often more accepting of reusing the treated stormwater and greywater than they were wastewater. Also, the nature of the sample influenced acceptability, with treated water samples being less acceptable than those consisting of produce simply irrigated by treated water. Of the produce, the order of acceptability was generally, from lowest to highest, lettuce, carrots, grapes and oranges. This is again consistent with the acceptability of treated water tending to wane with greater personal contact.
Public agencies such as the Health Department and Water Corporation were trusted by the participants to manage recycled water programs in WA. CSIRO and university scientists were most trusted to provide information on recycled water. Private companies were generally not trusted by people to manage or provide information about reuse.
The importance of trust and emotions associated with reuse in people’s decisions to accept or reject a particular reuse scheme was shown in the results of multi-dimensional scaling and logistic regression. Surprisingly, perceived health risks did not seem to affect people’s decisions significantly. However, health risks may be involved in people’s trust decisions.
It was considered possible that participants who attended the experiment may have represented the more pro-reuse and pro-environmental sector of the Perth population. This proved to be the case. The follow-up study with a random selection of Perth residents indicated that the general Perth residents did not display the same strength attitudes in environmental protection, reuse intention, and perceived

49
control as the participants who attended the experiment. Therefore, the results achieved here in this experiment will represent a ‘best case scenario’ in terms of ingestion of the samples. It could also be assumed that the emotions and principle aspects of decision-making would be further amplified in the wider Perth community.
In general, the experiment provided confidence in the applicability of the variables in the hypothesised model in relation to behavioural decisions. It provided confidence in both the validity and reliability of the measurements of most of the variables, especially in the case of the repeated measures. It would also seem that the term “disgust” may not be an appropriate way to measure the “yuck” emotion that is evident, but rather the use of the semantic scales that produced the Appeal-Vs-Repulse dimension.

50
4.0 TESTING THE MODEL: INDIRECT POTABLE IN PERTH This research marked the second stage of Water for a Healthy Country flagship – Water Futures project. It was designed to explore factors that influence people’s decisions to use recycled water for different household purposes. For the purpose of this study, a reuse scheme which involves infiltrating highly treated wastewater into a Perth drinking water aquifer was presented as a case study. This reuse method, commonly known as Managed Aquifer Recharge (MAR), was chosen as it is considered by the Water Corporation of Western Australia to have major potential to provide water supplies for the future of Perth. Additionally, it could assist in maintaining the environmental sustainability of the aquifer. The technical viability of using MAR in Perth is still currently being explored and discussed with the community. A variety of trials of MAR reuse are expected to commence in Perth in the next few years for both non-potable and indirect potable uses.
4.1 Methodology A survey questionnaire suitable for a telephone interview was developed as a result of the outcomes of the social experiment reported in the previous section. It was administered during November 2004. The survey aimed to interview a minimum sample number of 400 people in the Perth metropolitan area. Respondents were provided with a brief explanation of the reuse scheme that covered all the pertinent points (see Section 4.1.5). Interviewers were provided with additional detailed information to assist with any questions. They were also advised to forward the call to a more knowledgeable research team member should questions venture into more specialised areas.
4.1.1 Study Locations All suburbs in the Perth metropolitan area were stratified into 3 groups (higher, medium and lower) based on their weekly family income figures obtained from the Australian Bureau of Statistics (2001). Ten suburbs were then selected from each of lower and higher socio-economic groups and twenty suburbs were chosen for the medium group. These ensured a good spread across the metropolitan area.
The following table lists the suburbs used in the study under their corresponding socio-economic groups.
Table 38. Suburbs under each socio-economic group
Lower Medium Higher
Balcatta Alexander Heights Kenwick Canningvale
Coolbellup Bateman Kewdale East Fremantle
Langford Beckenham Kinross Gwelup
Midland Bibra Lake Middle Swan Highgate
Mirrabooka Bullcreek Myaree Menora
Nollamara Como Noranda Mindarie
O'Connor Craigie Redcliffe Mt Pleasant
Rivervale Edgewater South Lake Salter Point
Tuart Hill Hamersley Wanneroo Shelley
White Gum Valley Karrinyup Waterman Swanbourne

51
4.1.2 Respondents Respondents for the study were randomly selected from the suburbs above. Ten respondents from separate households aged eighteen years or over were required from each suburb. An effort was also made to recruit an equal number of males and females.
Lists of randomly selected households were provided to interviewers with instructions to call each household a minimum number of three times at different times of the day and on different days before it could be dismissed as “no contact”. A final total of 400 respondents were recruited including 193 (48.2%) males and 207 (51.8%) females.
4.1.3 Refusal Rate The refusal rate for the questionnaire was 62%. The following table shows the reasons for refusing.
Table 39. Refusal reasons
Reason N
(654)
Not interested 315
Too busy 193
Little/No English 76
Too old 45
Sick 25
4.1.4 The Questionnaire As a summary, the survey questionnaire consisted of the following items. • intention to drink the recycled water3 • knowledge about the scheme • need for more information about the scheme • importance of having information about the scheme • perceived risks and benefits of the scheme • feelings and emotions associated with the scheme • trust in different authorities to manage the scheme • trust in different authorities to provide information about the scheme • a series of attitudinal statements • an indication of the importance of pricing of recycled wastewater • specific questions about relationships with the natural aquifer • socio-demographic information
3 The term “indirect potable” was not used with survey respondents. At all times the questionnaire referred to using recycled wastewater to add to our underground water supply for household uses including drinking.

52
4.1.5 Briefing Information Before answering the questions, respondents were read the following information. Greater detail was available to respondents if they required it as explained above in Section 4.1.1. Appendix 1 provides the additional information provided to the interviewers.
Western Australia has experienced a significant reduction in rainfall since the mid 1970s and this is likely to continue
with the onset of climate change. With the increasing population, there is a need to plan for our future water
supplies. At the moment, more than half of Perth’s water comes from groundwater supplies. It is possible that fresh
water supplies that are available for Perth could start to run out in less than 30 years unless we do things differently.
By 2031, Perth will need an extra 150 Gigalitres of water which is the same as four full Serpentine dams, or 150
billion litres.
Therefore, a variety of new water supply options are being considered, including reusing our wastewater, which
includes water from the toilet. One method of doing this could involve treating the wastewater from households and
industry to a high standard (tertiary treatment) and then storing it in the groundwater aquifers. There it would mix with
normal groundwater and some years later be taken out for household use, including for drinking.
It has been shown scientifically that natural underground processes continue to treat the wastewater to higher health
standards. Even so, the mixed water would be further treated to current drinking water standards after pumping from
the aquifer and before being piped to households.
The Water Corporation would be responsible for all treatment processes, the storage in the aquifers and the
pumping and piping to households. The Department of Health would ensure the standards of treatment are suitable
for drinking, and the Department of Environment would monitor the aquifers and oversee any environmental issues.
We would now like to know what your thoughts would be if the government was to introduce this reuse scheme for all
your household uses, including for drinking. Currently, there are no definite plans to do so, but it is an option for
future consideration.
4.2 Results The following provides the general results of the analysis of the responses to the questionnaire. A statistical significance level of 0.01 was used throughout the analysis. For most of the open-ended questions, respondents were allowed to provide up to three responses.
4.2.1 Drinking Water from the MAR Scheme After they were briefed on the MAR reuse scheme, respondents were asked if they would drink water from the scheme. Less than one third of respondents (31.3%) stated an unconditional intention to drink the water, 51.0% had reservations about drinking the water, and 17.8% stated they would not drink the water at all.
Respondents were further asked to provide reasons why they would or would not drink the water.
Of the respondents who would drink the water, the main reasons given were as shown in the following table.

53
Table 40. Reasons for intention to drink water from the scheme
Reasons Percentage
(N=125)
Perth needs other water supply options 30.1
Trust the authorities to do the right thing 24.4
Trust the treatment standard is high enough 20.3
Know other countries which use recycled water 11.4
Trust the water is safe 9.8
Have drunk recycled water before 9.8
It is just another source of water 8.1
Respondents who were willing to drink water from the MAR scheme generally felt that Perth needed to have alternative water supply options. They also trusted the authorities to do the right thing, and trusted that the treatment standards would be high enough.
Respondents who were unsure about drinking the water provided the following reasons.
Table 41. Reasons provided for feeling unsure about drinking water from the scheme
Reasons Percentage
(N=205)
If it is treated properly 45.1
Do not like the idea of using recycled water 17.6
As long as it is safe to use 10.8
Need assurance that it is safe to use (e.g. scientific evidence) 16.2
Only as a last resort 9.3
Prefer using other water sources 5.9
Trust the authorities to do the right thing 5.4
Trust the treatment standard is high enough 5.4
Many respondents who were feeling unsure about drinking the water thought about the safety of using water. Reasons relating to safety included if it is treated properly, as long as it is safe to use, and need assurance that it is safe.
Respondents who said they would not drink the water gave the following reasons.

54
Table 42. Reasons provided for no intention to drink water from the scheme
Reasons Percentage
(N=71)
Do not like the idea of using recycled water 76.1
Other water sources would be preferred 16.9
The majority of respondents who were unwilling to drink the water did not like the idea of using recycled wastewater. They preferred other water sources.
4.2.2 Knowledge of the Scheme Respondents were asked to rate how much knowledge they had about using recycled wastewater for uses including indirect potable on a five-point scale. The percentage of responses is shown in the table below.
Table 43. The level of knowledge respondents had about the scheme
Percentage (%)
1
No knowledge at all
2 3
Some knowledge
4 5
High level of knowledge
Mean (N=400)
35.8 19.8 31.5 7.3 5.8 2.27
More than half of respondents reported having little or no knowledge of using recycled wastewater for uses including indirect potable. Only 5.8% of respondents said they had a high level of knowledge and the mean score indicated that respondents generally had little knowledge.
Males were found to have a significantly higher level of knowledge than females. Significant differences were also found for different income and educational groups:
• Respondents who had university or partial university qualifications tended to report higher levels of knowledge than those who just completed either primary or secondary school.
• Respondents who had an annual household gross income of more than $82,000 a year reported a higher level of knowledge than those households with less than $22,000 per year.
No significant differences were detected for different age groups.
4.2.3 Information about the Scheme Respondents were also asked whether they would like to obtain further information about using recycled wastewater for uses including indirect potable. The majority of respondents said yes (71.5%), 23.5% said no and only 5.0% were unsure.
Respondents who wanted further information were asked what information they would like, and how they would like to obtain it.

55
Table 44. The type of information required by respondents
Information wanted Percentage
(N=306)
Recycled water treatment processes 63.6
Criteria for good quality drinking water 21.0
As much information as possible 19.0
Safeguards in place to prevent contamination 11.1
Cost of recycling 6.6
Appropriate uses for the water 6.7
Monitoring of the water quality 6.2
Potential risks in reusing industrial wastewater 4.3
Quality of the water compared with normal scheme water 3.6
Long term effects to environment 3.6
How the scheme compares with other schemes 3.6
General information on the scheme (including technical and scientific info) 3.3
Quality and quantity of water in the aquifer 3.3
As is frequently the case, respondents more often preferred personally directed methods of receiving information as shown in the following table.
Table 45. Preferred ways of obtaining the information
How Percentage
(N=306)
Mail out 61.8
Internet 26.8
TV 20.6
Newspaper 14.1
Media 11.8
Radio 6.2
Information distributed by government authorities 3.6

56
Respondents were also asked to rate on a five-point scale the importance of receiving information about the MAR scheme.
Table 46. The importance of information about the MAR scheme
Percentage (%)
1
Not at all important
2
Hardly important
3
Important
4
Very important
5
Extremely important
Mean (N=399)
6.3 10.5 20.3 32.3 30.5 3.70
As the mean importance rating shows, respondents generally thought having information about the scheme was very important. Few respondents (16.8%) thought having the information was hardly important or not at all important
The importance of having information was not statistically significantly different between respondents who said they would and would not drink the water. Females were found to place a significantly higher level of importance in having information about the scheme than males. No significant differences were found in the mean importance rating across different income, age and educational groups.
4.2.4 Perceived Benefits Respondents were asked to rate the possible benefits they thought the MAR scheme would provide to themselves, their family and the environment in general.
Table 47. The possible benefits of the scheme
Benefits to N Mean*
… them personally 399 3.53
… their family 393 3.69
… the environment 396 4.21
*higher scores indicate greater perceived benefit
Respondents generally thought the reuse scheme was beneficial to themselves, their family and the environment. The differences in the mean benefit ratings were found to be statistically significant. That is, respondents perceived the reuse scheme as having more benefits to their family and the environment rather than themselves. Note that the difference mentioned here is only a matter of degree, rather than opposing views.
Also, respondents who would drink water from the scheme saw it as having significantly more benefits to themselves, their family and the environment than those who were not sure or would not drink water from the scheme. All respondents from the study were asked to rate how much they thought Perth would benefit from the MAR scheme on a five-point scale.

57
Table 48. Benefit of the scheme to Perth
Percentage (%)
1
No benefit at all
2
3
Some benefit
4
5
Great benefit
Mean (N=399)
3.8 6.5 17.5 11.0 61.3 4.19
More than half of the respondents (61.3%) thought the scheme would provide great benefit to Perth. Very few respondents thought the scheme would provide little or no benefit (10.3%).
Respondents who thought the scheme was beneficial to Perth were further asked unprompted what they thought the benefits would be. Table 49. Perceived benefits to Perth
Benefits Percentage
(N=384)
More water to use 37.5
Save water 20.1
Reduce demand on groundwater/dam water 18.8
Provides Perth with sustainable water supply 16.7
Keeps Perth green 13.5
Helps the environment 10.4
More economical than other water sources 6.3
The main response given by respondents was that Perth would have more water to use as a result of the scheme. Respondents also thought that the scheme offered Perth the benefit of saving scheme water, helping to reduce demand on our groundwater and dam water and provides Perth with sustainable water supply. 4.2.5 Perceived Risks Similar to the benefits question, respondents were also asked to rate on a five-point scale the possible risks or problems that might be associated with the scheme to themselves, their family and the environment.
Respondents generally considered the scheme to be risky to themselves, their family and the environment. They also rated the risk posed by the scheme to be significantly greater for themselves and their family than for the environment. The difference was however, not great.

58
Table 50. Possible risks from the scheme
Risks to N Mean*
… them personally 391 2.69
… their family 385 2.66
… the environment 388 2.36
*higher scores indicate higher perceived risk
Respondents who would drink water from the scheme perceived significantly less risk to themselves, their family and the environment than those who were not sure or would not drink from the scheme. 4.2.5.1 Possibility of something going wrong Respondents were then asked whether they thought there was a possibility that something might go wrong with the MAR scheme. Just under two-thirds of respondents said yes (63.3%), 17.3% were unsure and 19.5% said no.
Respondents who thought there was a possibility that something might go wrong were asked to state what.
Table 51. Perceptions of things that might go wrong with the scheme
Responses Percentage
(N=321)
Contamination of groundwater (e.g. chemical leaks) 39.3
Human errors 19.9
Wastewater not treated properly 17.4
Potential health risks from drinking the water 17.4
Accidents happen 15.9
Mechanical failures 14.0
Poor management (e.g. lack of quality control & maintenance; monitoring of the scheme) 13.7
Damage to the aquifers 6.9
Don’t know 5.3
The possibility of the scheme contaminating the groundwater was most frequently nominated by the respondents. Possible human errors leading to the contamination of drinking water supply and groundwater were also mentioned, along with other comments such as wastewater not treated properly and potential health risks from drinking the water.

59
4.2.5.2 Perceived likelihood Respondents who thought there was a possibility that something might go wrong were further asked to rate on a five-point scale how likely they thought it was that something would happen.
Table 52. The likelihood that it might happen
Percentage (%)
1
Highly likely
2
3
Neither
4
5
Highly unlikely
Mean (N=321)
15.9 27.5 24.6 17.4 14.6 2.88
The percentage of respondents who thought it was likely or highly likely that something might go wrong (43.4%) was somewhat higher than those who thought otherwise (32.0%). On average though, respondents thought that it was neither likely nor unlikely that something might go wrong, as shown by the mean. 4.2.5.3 Perceived seriousness Respondents who thought there was a possibility of something going wrong were also asked to rate how serious they thought it would be on a five-point scale.
Table 53. Perceived seriousness of the problem
Percentage (%)
1
Extremely serious
2
3
Serious
4
5
Not at all serious
Mean (N=320)
50.3 11.6 29.7 5.9 2.5 1.99
If something went wrong, half the respondents considered it would be extremely serious. As indicated in the table above, the majority of respondents (91.6%) thought the consequences of something going wrong were serious through to extremely serious. 4.2.5.4 Perceived level of control Respondents who thought there was a possibility of something going wrong were also asked about the level of control they believed the authorities would have to stop this from happening.
Table 54. Authorities’ level of control
Percentage (%)
1
No control at all
2
3
Some control
4
5
High level of control
Mean (N=321)
8.4 7.2 28.3 12.5 43.6 3.76
Respondents generally thought that the authorities would have a level of control to stop it from happening. However, less than half the sample thought the level of control would be high.

60
4.2.5.5 Expert knowledge about the safety of the scheme Respondents were asked what they thought the experts knew about the safety of the scheme.
Table 55. Expert knowledge about the safety of the scheme
Percentage (%)
1
No knowledge at all
2
3
Some knowledge
4
5
High level of knowledge
Mean (N=397)
3.5 7.3 32.0 18.9 38.3 3.81
Just over half of respondents (57.2%) thought that the experts had a good or high level of knowledge about the safety of the scheme.
4.2.5.6 Unknown effects from the scheme All respondents were asked to rate the likelihood that there could be unknown effects from the scheme.
Table 56. The likelihood that there could be unknown effects from the scheme
Percentage (%)
1
Highly likely
2
3
Neither
4
5
Highly unlikely
Mean (N=395)
18.5 25.1 27.1 13.9 15.4 2.83
As the table above shows, opinion was generally divided on this issue. Almost 44% thought it was likely or highly likely, whereas 39% thought it was unlikely or highly unlikely.
4.2.6 Risks versus Benefits of the MAR Scheme After thinking of all the possible benefits and risks associated the MAR reuse scheme, respondents were asked to choose one statement from the following five with which they most agreed.
About one fifth of respondents felt the benefits and risks of the scheme were equal. Almost 65% of respondents thought the benefits of the scheme outweighed the risks, and only 16% of respondents felt the risks actually outweighed the benefits.

61
Table 57. Risks versus benefits of the scheme
Risks Versus Benefits Percentage
(N=397)
The benefits obviously outweigh the risks 40.1
The benefits slightly outweigh the risks 24.7
The benefits and risks are equal 19.4
The risks slightly outweigh the benefits 7.8
the risks obviously outweigh the benefits 8.1
4.2.7 Trust in the Authorities Respondents were asked to rate their trust in three government agencies specifically, and in science and technology generally, to perform their respective roles in the operation and management of the scheme. Results of these questions are shown in the following figure.
• How much do you trust– Science and
technology to produce safe recycled water
– Health Dept to ensure health and safety
– Dept of Environment to ensure safety of environment
– Water Corporation to responsibly manage & monitor
1
2
3
4
5
Science & Tech
nolog
y
Health
Dept
Dept Envi
ronment
Water C
orp
No trust at all
Complete trust
Figure 29. Trust in organisations to perform their respective roles Respondents generally had some trust in the three government agencies to perform their respective roles. However, respondents’ trust in Water Corporation to perform its role was significantly lower in comparison with the departments responsible for health and the environment to perform their respective roles. On the other hand, respondents rated a significantly higher level of trust in science and technology to produce safe drinking water from the scheme.

62
4.2.8 Trust in Authorities to Provide Information Respondents were also asked about their level of trust in different agencies and organisations to provide reliable information on any issues about the scheme. The order in which agencies were presented to respondents was varied from one interview to another to avoid any order bias.
1
2
3
4
5
CSIRO
Universit
ies
Medical Doctors
Health Dept
Consumer G
ps
Environment Gps
Dept Environment
Water C
orp
Private C
ompanies
No trust at all
Complete trust
Figure 30: Trust in different authorities to provide reliable information CSIRO was trusted significantly more than were the other authorities to provide reliable information on any issues about the scheme. Private companies were least trusted by respondents. There was no significant difference in trust between any of the other authorities.
Respondents were also asked to nominate other agencies that they would trust to provide reliable information. Following were the three agencies most commonly nominated by respondents and their respective mean rating.
Table 58. Other agencies nominated by respondents
Agency N
(37) Mean
Government ministers 6 2.40
International bodies with experience in reuse 5 3.80
Local government 5 4.00
4.2.9 Emotive Feelings about Water from the MAR Scheme Respondents’ feelings of emotion associated with drinking treated water from the MAR scheme were also explored in the survey through a series of scales that had been developed and tested in the social experiment described in Section 3 of this report. Individual reporting of the scales serves no purpose as they were designed to provide a single latent variable for the confirmatory analysis of the hypothesised model.

63
4.2.10 Drinking Recycled Wastewater other than through a MAR Scheme Respondents were asked whether they would consider drinking treated recycled wastewater in a scheme that did not involve pumping into the underground aquifer first. Few respondents said they would consider drinking the water (13.3%). The remaining respondents felt unsure (43.3%) or would not (43.5%) consider drinking water from this type of scheme.
Respondents who said they would consider drinking water from a reuse scheme that did not involve pumping the water into aquifer (n=53) provided the following reasons for their responses. Table 59. Reasons for why respondents would drink recycled water other than through a MAR scheme
Reasons N (53)
The water is safe to drink after treatment 18
Have faith in the recycled wastewater treatment process and standard 17
Prefer schemes that did not involve the aquifer 9
Most respondents commented that they would consider drinking water from the reuse scheme as they were confident in the treatment safety.
Respondents who were unsure whether they would drink recycled water other than through a MAR scheme provided the following reasons.
Table 60. Reasons for why respondents were unsure about drinking the recycled water other than through a MAR scheme
Reasons Percentage (N=173)
Only if the water is treated properly 39.9
Don’t know enough to answer 23.7
More information is needed 23.7
Underground environment neutralise water 11.0
Depends on treatment standards 5.2
Respondents who were unsure about drinking the water principally either had concerns about the treatment or thought they needed more information.
Respondents who said they would not drink water from a reuse scheme that did not involve pumping the water into aquifer first (n=174) provided the following reasons.

64
Table 61. Reasons as to why respondents would not drink recycled water other than through a MAR scheme
Reasons Percentage (N=174)
Underground environment neutralises the water 51.7
Do not like the idea of using recycled wastewater 30.5
Do not trust treated recycled wastewater quality 9.8
More information is needed 5.7
Don’t know enough to answer 5.7
About half of the respondents who would not drink water from a reuse scheme that did not involve pumping the water into the aquifer mentioned that the underground environment neutralises the water
4.2.11 Price of Recycled Wastewater Respondents were asked whether the price of the water would change their decision to drink or not to drink the treated recycled wastewater. The majority of respondents (73.0%) said it would make no difference, 16.8% said it would and 10.3% were unsure. For respondents who said that the price of water would make a difference to whether they would drink it or not, the following reasons were given. Table 62. Reasons as to why the price of recycled wastewater matters
Reasons N (67)
Would not drink it if the cost increased 29
Would not drink it if too expensive 12
Would use other sources if cost too high 11 The most frequent comments regarding price making a difference was if the cost increased they would not drink the water. For respondents who said that the price would make no difference to whether they would drink the water, the most frequent reasons given were as follows.

65
Table 63. Reasons as to why the price of recycled wastewater did not matter
Reasons Percentage (N=292)
Water would be needed regardless 35.9
Cost doesn’t influence my decision 33.4
Type of water used is more important 15.2
Don’t have control over pricing of water 11.0 The most common responses were that water would be needed regardless and that cost doesn’t influence my decision. For respondents who were unsure whether price would influence whether they would drink the water or not, the most common responses were as follows. Table 64. Reasons at to why respondents were unsure about the price of wastewater
Reasons N (41)
Don’t have control over pricing of water 11
Cost doesn’t influence my decision 10
I wont drink it if cost increased 8
4.2.12 Proportions of Recycled Water Respondents were asked whether different proportions of groundwater and recycled wastewater mixed to provide their drinking water supply would make a difference to their decisions to drink the water. Most respondents (64.0%) said it would not change their decision. About one quarter of respondents (24.3%) said it would change their decision and 11.8% of respondents were unsure. Respondents were then asked to provide reasons for their responses. For the majority of respondents who said the proportions of groundwater and recycled wastewater would change their decision to drink the water, their preference was to only have a small amount of recycled wastewater (74.2%).
Table 65. Reasons why proportions of recycled wastewater and groundwater matter
Reasons Percentage
(N=97)
Prefer a small amount of recycled wastewater only 74.2
Only if the water is treated properly 8.3
Prefer recycled wastewater to be evenly distributed 5.2

66
Respondents who said the different proportions of groundwater and recycled wastewater would not make a difference to their decision provided the reasons that are shown in the following table. Many of these respondents qualified their decisions by stating if the recycled wastewater was treated properly (34.8%). Some respondents suggested that the different proportions would not change their mind as it was still recycled wastewater and they did not want to drink any recycled wastewater. Others felt that the authorities knew better regarding the potential effects of having different proportions of the waters. Table 66. Reasons why proportions of recycled wastewater and groundwater did not matter
Reasons Percentage
(N=256)
If recycled wastewater was treated properly 34.8
Doesn’t make a difference 34.3
It is still recycled wastewater regardless 15.7
Don’t want to use any recycled wastewater 11.7
Authorities know better 3.9 Respondents who were unsure whether the different proportions would make a difference to their decisions provided the following comments. Table 67. Reasons as to why respondents were unsure about the proportions of recycled wastewater and groundwater
Reasons N (47)
More information is needed 15
Would prefer a low percentage of recycled wastewater 13
Only if the water is treated properly 8
4.2.12.1 Highest percentage of recycled wastewater acceptable Respondents who said that proportions of recycled water would make a difference to their decisions to drink the water, or were unsure if it would make a difference, were further asked to nominate the highest percentage of recycled wastewater they would accept.
Almost one-third of these respondents (30.1%) would accept proportions of recycled wastewater only up to 10%. About one-fifth would accept up to 25% and a further one-quarter of the respondents would find up to 50% to be acceptable. Very few respondents (2.1%) said they would accept more than 75% of recycled wastewater in the mix.
The following table provides an outline of all the responses.

67
Table 68. Highest percentage of recycled wastewater acceptable to respondents
Percentages of recycled wastewater Percentage (N=144)
Less than 5% 13.3
Between 5 to 10% 16.8
Between 10 to 25% 20.3
Between 25 to 50% 27.3
Between 52 to 75% 8.4
More than 75% 2.1
Other 11.9
Details:
Don’t know 41.2
As little as possible 35.3
Depends on water quality 11.8
4.2.13 Years the recycled wastewater was underground Respondents were also asked whether there would be a time when they would consider the infiltrated recycled wastewater to be the same as groundwater.
Just over half the respondents answered yes to the question (52.0%). One-fifth of respondents said no (19.3%) and 28.8% were unsure. Respondents who thought there would be a time when the infiltrated recycled wastewater and groundwater became the same, provided the following reasons. Table 69. Reasons why infiltrated recycled wastewater and groundwater would become the same
Reasons Percentage
(N=208)
Underground environment purifies water 62.1
Both waters will be the same eventually 31.9
Both waters will immediately be the same if recycled wastewater was treated properly 6.8
The longer it stays the better 5.9

68
Main reasons provided by respondents included that the underground aquifer would purify the recycled wastewater and both waters would eventually be the same. Some respondents thought both waters would immediately be the same given that the recycled wastewater had been treated. The following table shows the responses provided by respondents who did not think there would be a time when the infiltrated recycled wastewater and groundwater became the same. Table 70. Reasons why the infiltrated recycled wastewater and groundwater would remain different
Reasons Percentage
(N=77)
It is still recycled wastewater 42.3
The recycled water would remain contaminated 19.7
Unsure but scientists will know 14.1
the water will always be different because you know it is recycled wastewater 9.9
The main reasons offered were that it is still recycled wastewater and it would remain contaminated.
Respondents who were unsure whether there would be a time when the infiltrated recycled wastewater and groundwater became the same provided the following reasons for their responses (n=115).
Table 71. Reasons why respondents were unsure about whether the infiltrated recycled wastewater and groundwater would ever be the same
Reasons Percentage
(N=115)
Don’t know enough to answer but scientists will know 78.9
Don’t know about underground processes 16.7
The longer it stays the better 7.9
The majority of respondents who were unsure did not feel they knew enough to answer the questions and trusted the scientists to provide information.
Respondents who thought there would come a time, or there might come a time, when both waters became the same were also asked how long the water had to be underground before they would consider them to be the same.
Their responses are shown in the table below. Almost 40% of respondents thought the waters would be the same in 5 years or less. About one-fifth thought it would take 6 to 10 years. Few respondents thought it would take up to 20 years for both waters to be the same. However, almost one-third could not answer the question.

69
Table 72. Number of years the infiltrated recycled water would need to be left underground before it became the same as groundwater
Years underground Percentage
(N= 323 )
Immediately 7.47
1 to 5 years 31.5
6 to 10 years 20.6
11 to 20 years 8.72
More than 20 years 8.10
Don’t know 30.2
4.2.14 Attitudes Respondents were asked to rate their agreement with a series of twenty attitudinal statements associated with the variables in the hypothesised model. An exploratory factory analysis was performed on the statements and five factors were extracted and explained 62.09% of the variance. When tested for reliability, four factors emerged as being suitable for use as scales in later analyses.
On further examination, the first factor was seen to be made up of the items that were hypothesised to form two attitudinal scales, the subjective norm scale and the attitudes towards intended behaviour scale. Therefore, further tests using structural equation modelling with AMOS 5.0 were performed to test the uni-dimensionality of both potential scales.
As shown in the table below, the fit indexes for both scales were found to be adequate as recommended by Kline (1998). This indicated that items in both scales measured only one concept. It was therefore decided to retain the scales as separate items.
Table 73. Model fit indexes for the attitudes scale and subjective norm scale
Fit statistics Attitudes towards intended behaviour scale Subjective norm scale Recommended value
Chi-square 4.46, df=1, p > .01 4.04, df=2, p > .01 -
CFI .99 .99 ≥.90
TLI .99 .99 ≥.90
RMSEA .09 .05 ≤.10

70
Scale 1: Attitudes towards the intended behaviour This scale had a Cronbach alpha of .91 and consisted of three items. The scores for attitudes towards the intended behaviour scale were calculated for each respondent by summing their responses to the three items. The scores obtained for the scale are shown in the table below. The mean score indicated that respondents had positive attitudes towards drinking water from the MAR scheme.
Table 74. Attitudes towards the intended behaviour scale
Description Mean
Minimum 3
Maximum 15
Mean 10.59
Scale 2: Subjective norm The subjective norm scale consisted of four items and had a Cronbach alpha of .78. The mean of 13.44 indicated that respondents felt fairly strong pressure and influence from others to drink the water from the scheme.
Table 75. Subjective norm scale
Description Mean
Minimum 4
Maximum 20
Mean 13.44
Scale 3: Environmental obligation This scale had a Cronbach alpha of .79 and consisted of four items. The scores for the scale were again calculated for each respondent by adding responses to all four items and are shown in the table below. The mean of 18.21 indicated that respondents felt a strong obligation to protect the environment.
Table 76. Environmental obligation scale
Description Mean
Minimum 12
Maximum 20
Mean 18.21

71
Scale 4: Reuse intrinsic motivation This scale had a Cronbach alpha of .68 and consisted of three items. The mean indicated respondents were intrinsically motivated to reuse water.
Table 77. Reuse intrinsic motivation scale.
Description Mean
Minimum 6
Maximum 15
Mean 12.37
Scale 5: Perceived control This scale consisted of two items with a Cronbach alpha of .66. The mean score indicated that respondents did not feel they had much personal control over the source of their water supply.
Table 78. Perceived control scale
Description Mean
Minimum 2
Maximum 10
Mean 5.57
4.2.15 Demographics 4.2.15.1 Awareness of Perth water issues Respondents were asked to rate their awareness of water issues in Perth. Their responses to the question are shown in the table below.
Percentage (%)
1
Not at all aware
2 3
Somewhat aware
4 5
Very aware
Mean (N=399)
1.3 9.0 23.8 28.3 37.6 3.92
Respondents were generally aware of water issues in Perth

72
4.2.15.2 Age
Age distribution Percentage (N= 400)
Less than 24 years 6.0
24 to 39 years 26.8
40 to 55 years 33.0
56 to 65 years 17.3
66 to 75 years 11.3
More than 75 years 5.8
4.2.15.3 Gross household income
Income distribution Percentage
(N=400)
Less than $22,000 18.8
$22,001 to $42,000 15.8
$42,001 to $62,000 20.3
$62,001 to $82,000 14.5
More than $82,000 21.0
Don’t know 4.8
Refused 5.0
4.2.15.4 Levels of Education
Educational level Percentage
(N=400)
All or some of primary school 1.8
All of some of secondary school 31.3
Partial trade or technical qualification 3.5
Trade or technical qualification 21.0
Partial university qualification 9.0
University qualification 33.5

73
4.2.15.5 Household unit
Household unit Percentage
(N=400)
Adults with youngest child less than 5 years old 15.0
Adults with youngest child between 5 and 12 years old 11.0
Adults with youngest child between 13 and 18 years old 6.3
All adults (includes children > 18 years) 67.8
It is evident that the sample lacked household units with children less than eighteen years of age. This is likely to be due to the busier lifestyles of young families. However, no significant differences emerged in any of the major variables between the different household units. Therefore, it is not expected that this lack of young families in the sample will have affected the overall results. It is, though, a point for further investigation in the future.
4.2.16 Modelling factors that influence the decision to drink water from the MAR scheme
Structural equation modelling with latent variables was used for this analysis to model factors that influenced people’s decisions to drink water from the MAR scheme. This methodology was chosen as it caters for variables that are not observed directly (i.e. latent).
Using variables that were proposed by Ajzen’s Theory of Planned Behaviour (1985, see Section 2.1) as well as additional factors identified in past literature, the following hypothesised model was used as the starting point for the investigation.
Emotion
VAR1e19
attitudesATT1
ATT16
ATT23
e18
e17
e16
1
1
1
1
Perceived Control
Subjective Norm
ATT7
ATT18
ATT20
e1
e2
e3
1
1
1
1
ATT8 ATT3
e6 e5
ATT2
e4
ATT11
e8
ATT10
ATT141e11
e10 1
att6e32
Envt Obligation
perknow
TrustTRUST3
TRUST2
TRUST1
TRUST4
1
e371
e341
e351
e361
RISK2
RRDRINK1 e251
VAR2
VAR3
VAR4VAR5 VAR6
VAR7
VAR8e20
e21 1e22 1
e23 1 e241
271
e28 intrinsic motivation
ATT5
e90
1
1
ATT21
e911
ATT12
e921
e93
e94
1
11
1
1
1
1
1
1
111
ATT15e881
POUTCOMEe91
ATT17
ATT4
ATT22 1
e12 1
e131
e141
Figure 31. The hypothesised model as depicted in the Amos program

74
The figure above shows the hypothesised model as appeared in the AMOS 5.0 program (SmallWater Co., 2004). It also shows relationships between the latent and observed variables. Latent variables are those that cannot be measured directly and are represented by ellipses. The scores for these latent variables are often inferred by a number of indicators. For example, respondents’ sense of obligation to protect the natural environment is not directly measurable. Therefore, a number of observable measurements were used to infer their sense of personal obligation to protect the environment. Where possible, exploratory factor analyses along with reliability tests were conducted to ensure these indicators of latent variables were reliable.
Also in Figure 31, variables that are measured directly (observed variables) are represented by boxes.
The following table summarises the latent and observed variables used in the hypothesised model.
Table 79. Descriptions of the variables in the hypothesised model
Variables From the Model
Latent or observed Descriptions
Responsibility (Att6)
Observed Higher scores indicated respondents perceived a higher level of responsibility for making sure the State has enough water for the future
Knowledge (Perknow)
Observed The higher the score the greater knowledge respondents felt they had about recycled wastewater in aquifers for household uses including indirect potable
Risk Perceptions (Risk2)
Observed Higher scores indicated a higher level of perceived risk associated with recycled wastewater in aquifers for household uses including indirect potable
Intended Behaviour (RRDRINK1)
Observed The higher the score, the greater the intention to drink water from the MAR scheme
Trust
Latent
Higher scores indicated higher levels of trust in the authorities
Attitudes Latent The higher the score the more positive respondents were about drinking water from the scheme and perceptions of the likely outcomes
Emotion Latent The higher the score the more negative respondents felt about drinking water from the scheme
Intrinsic Motivation Latent The higher the score, the more intrinsically motivated the respondents were to reuse water
Perceived Control Latent Higher scores indicated respondents preferred a higher level of control over the source of the water they used
Subjective Norm Latent Higher scores indicated respondents felt more pressure and influence from others to drink water from the scheme
Fit measures recommended by Kline (1998) were used to determine the model fit. The Bayesian Information Criterion (BIC) was also used as one of the criteria for model selection. A smaller BIC value reflects a better model fit.
The results for these fit measures were shown in the table below.

75
Table 80. Model fit indexes for the hypothesised model
Fit statistics Obtained value Recommended
value
Chi-square 2439.08,df=585, p < .01 -
BIC 2924.39 -
CFI .78 ≥.90
TLI .76 ≥.90
RMSEA .09 ≤.10
The values of the fit measures indicate that the overall fit of the data to the hypothesised model is inadequate. Other models were therefore investigated. The model, shown in Figure 32, with adequate model fix indexes, was chosen as the final model.
Emotion
VAR1e19
.68
attitudes
ATT1 ATT16 ATT23
e18 e17 e16
-.82Perceived Control
Subjective Norm
ATT18
ATT20
e2
e3
ATT8
ATT3
e6
e5
ATT2e4
ATT11e8
ATT10
ATT14
.72.68
e11
e10
Envt Obligation
.78.76
.63
Trust
TRUST3TRUST2TRUST1 TRUST4
.86.75.79.72
e37e34e35e36
RRDRINK1
e26
VAR2
VAR3
VAR4
VAR5 VAR6 VAR7
VAR8-.83
-.85-.69-.90 -.75 -.81
-.85
e20
e21
e22
e23
e2427
e28
att15e12
.90.82
.20
RISK2
e89
-.37 e99
.74.78
.67
.64
-.04
.56
-.09 -.03
-.58
.65
.04
-.14
.20
-.71
-.40
Poutcome
e9
-.75
ATT7
.57
e7
Figure 32. The final model as computed from AMOS (shown in standardised format)

76
Table 81. Model fit indexes for the final model
Fit statistics Obtained value Recommended value
Chi-square 1025.52; df = 339; p < .014 -
BIC 1426.95 -
CFI .91 ≥.90
TLI .90 ≥.90
RMSEA .07 ≤.10
For easier interpretation, the final model has been simplified in Figure 33 below.
Perceived Control
Emotion Trust
SubjectiveNorm
EnvironmentalObligation
AttitudesIntended
Behaviour (ie. stated intention to drink water
from the MAR scheme)
Risk
Strong ContributionModerate ContributionWeak Contribution
.04
.56*
-.04
-.40*
.20*-.03
.65*
-.37*
-.58*
-.71*
-.14**
.20*
-.08
* significant path/correlations at p < .01
Figure 33. Simplified version of the final model (shown in standardised weights)
4 Although a significant chi-square test may indicate a lack of satisfactory model fit, the researchers decided to retain the final model as the chi-square test is very much sensitive to the sample size and the central chi-distribution. Other fit indices are often recommended to determine the model fit and these fit indices indicated an acceptable model fit (Byrne, 2001)

77
As can be seen from the figure above, most of the components of the hypothesised model appear in the final model, with the exception of responsibility, knowledge, and intrinsic motivation. These three components were omitted from the final model as they either did not contribute significantly to the overall model fit or they detracted from the overall model fit. Another significant difference between the hypothesised and final models was the relationship between the components. The final model indicates relationships between environmental obligation, subjective norm, perceived control, emotion, trust, risk and attitudes, instead of the behavioural intention variable as originally hypothesised. The figure above shows that respondents’ stated intention to drink water from the MAR scheme can be predicted from their attitudes. The more positive respondents’ attitudes towards the intended behaviour and their outcome evaluations, the greater their intention to drink the water. Their attitudes were, in turn, significantly influenced by:
• subjective norm Respondents who perceived greater pressure and influence from their significant others to drink water from the scheme were more likely to adopt positive attitudes towards indirect potable reuse. This then increased their intention to drink water from the scheme.
• emotions
Respondents who displayed negative emotions about drinking water from the scheme were likely to adopt negative attitudes towards indirect potable reuse which then negatively affected their intention to drink water from the scheme.
• trust in the authorities Respondents who displayed a high level of trust in the authorities associated with the scheme had more positive attitudes towards indirect potable reuse. This also increased their intention to drink water from the scheme.
• risk perceptions
Respondents who perceived a higher level of risk associated with the reuse scheme had negative attitudes towards indirect potable reuse. This led to respondents being less likely to drink water from the scheme.
• sense of obligation to protect the environment
Respondents who felt a strong obligation to protect the environment had more positive attitudes towards indirect potable reuse. This then led to their intention to drink water from the scheme.
• perceived control over the source of their drinking water
Respondents who perceived greater personal control over the source of their drinking water had more negative attitudes towards indirect potable reuse. As a result, they were less likely to drink water from the reuse scheme.
Other findings that are of interest from the figure above include:
• Respondents’ emotive feelings associated with drinking water from the MAR scheme correlated negatively with their subjective norm. This indicated that respondents’ feelings of negative emotions decreased as they felt more pressure from their significant others to drink the water.
• Respondents’ emotive feelings associated with drinking water from the reuse scheme also correlated negatively with their level of trust in the authorities associated with the scheme. That is, respondents’ negative emotions lessened as their levels of trust in the authorities increased.
• Respondents’ trust in the authorities associated with the scheme had a strong influence on their risk perceptions. Specifically, a higher level of trust reduced the perceived levels of risk.

78
4.2.17 Demographic Comparisons Analytical comparisons were conducted with the key predictor variables (attitudes, emotions, risk perceptions, trust and subjective norm) and the demographic variables. The following statistically significant differences5 were found, providing an indication of the demographic groups that should be targeted to increase community intention to drink water from the MAR scheme. Gender No significant differences were found between gender and subjective norm, trust, risk perceptions, or attitudes towards drinking water from the scheme. Significant gender differences were found for the emotion variable. Women (mean=29.52) reported significantly higher levels of negative emotions towards drinking water from the MAR scheme than did men (mean=25.61). Household units No significant differences were found between different types of household units and the five key variables (subjective norm, trust, emotion, risks and attitudes towards drinking water from the scheme). Age No significant differences were found between age and the five key variables. Education Significant differences were found in levels of education and each of subjective norm, trust, emotions, and attitudes towards drinking water from the scheme. No significant differences were found in the way people perceived risk across different educational levels.
Subjective Norm • Respondents who had either partial (mean=14.03) or full university qualifications (mean=14.16)
perceived greater pressure to drink water from the MAR scheme than those whose highest level of education was primary school (mean=9.57).
• Respondents who had university qualifications (mean = 14.16) also perceived greater pressure than those who had a technical or trade qualification (mean=12.66)
Trust • Respondents who completed secondary school (mean=13.58) had a significantly lower level of
trust in the authorities than those who had a university degree (mean=15.19. Emotion
• Respondents whose highest level of education was primary school (mean=41.43) had significantly more negative feelings towards drinking water from the scheme than those who had partial university qualifications (mean=24.03) or university qualifications (mean=23.00).
• Respondents whose highest level of education was secondary school (mean=29.71) had significantly more negative feelings towards drinking water from the scheme than those who had a university degree (mean=23.00).
• Respondents who had a trade or technical qualification as their highest level of education (mean=31.31) perceived more negative feelings towards drinking water from the scheme than those who had either partial university qualification (mean=24.03) or a full university qualification (mean=23.00).
Attitudes towards drinking water from the scheme
• Respondents who had a university degree (mean=16.08) held more positive attitude towards drinking water from the MAR scheme than those who had either completed primary school
5 p<.01

79
(mean=10.14), secondary school (mean=13.72) or had a trade qualification (mean=12.89) as their highest level of education.
Income groups No significant differences were found between income groups and subjective norm, trust in the authorities, and risk perceptions. Significant differences were found between income groups for emotion. Respondents whose household income was less than $22,000 had more negative feelings about drinking water from the scheme (mean=30.45) than those whose gross household income was more than $82,000 (mean=24.13). 4.3 Summary and Conclusions The results of this case study have provided further confidence in both the selection and the measurement of the principal variables involved in people’s behavioural decisions in relation to a recycling scheme. The final model shows the relationship of the variables and their strength of contribution to the decision making. It should be noted that all the variables shown are important to the model even though some have weaker contributions and some are not statistically significant. None can be discounted.
For the first time, this research provides some quantitative understanding of the role of emotions (eg. the “yuck factor”) in people’s behavioural decisions, both in the ability to measure them and also in terms of the degree of influence on the decisions. While these emotions can often be seen as “irrational” and difficult to deal with, the results of the latent variable modelling shows how other variables could be used to temper them, such as increasing trust in the authorities and increasing the positive influence of the subjective norm.
Of considerable interest was that knowledge did not emerge in the latent variable modelling as a factor in people’s decisions to drink the recycled water. This is an important finding for anyone considering communication and education as the main feature of obtaining community acceptance of a recycling scheme.
Again, as is consistent with past research, there were indications that peoples’ acceptance of using recycled wastewater reduces as it comes closer to human contact. In this case study, the percentage of people who would unconditionally drink the recycled water was reasonably high for potable uses compared with past findings (eg. ARCWIS, 2002). When examined closely, it appeared that this could be attributed to people’s perceptions of having a medium to filter the treated wastewater. Unconditional support for the scheme dropped by 18% to be similar to past findings, and opposition to drinking the water increased by 26% when asked about drinking recycled water if not pumped to the aquifer first. This perception of the aquifer as a medium is heartening given the considerable potential for MAR in Perth.
Perhaps another surprising finding was that risk perceptions were not more dominant in influencing behavioural intentions. While risk was quite strongly influenced by trust, it had only a weak contribution to attitudes and hence to intended behaviour. Again, this is interesting given that it is assumed that technological and health risks are important to address with the community. While this may be the case, this model also suggests that by increasing trust in the authorities, people’s concerns about risk will reduce.
Testing the model on a second case study is, however, important to confirm the findings here.

80
5.0 TESTING THE MODEL: HORTICULTURAL IRRIGATION IN MELBOURNE This study was conducted as a second case study to test the model that hypothesised the different factors that influence people’s behavioural decisions in relation to recycled water schemes (see Section 2). It forms part of a study that is a part of Land and Water Australia’s National Program for Sustainable Irrigation. It is being led by the Department of Primary Industries in Victoria and is investigating the potential for the use of reclaimed effluent for horticultural irrigation in Australia. This particular case study was funded by the Natural Heritage Trust on condition it be linked with the Water for a Healthy Country research described in Sections 3 and 4.
This second case study investigated the factors that governed the Melbourne community’s decisions to buy vegetables grown with recycled wastewater at Werribee. This scheme had commenced operating a short time before the survey was carried out.
5.1 Methodology The survey questionnaire suitable for a telephone interview used in the first case study (Section 4) was amended to include the particulars of this second case study. It was administered during February 2005. The survey aimed to interview a minimum of 400 people in the Melbourne metropolitan area. Respondents were provided with a brief explanation of the reuse scheme that covered all the pertinent points (see Section 5.1.5). Interviewers were provided with additional detailed information to assist with any questions. They were also advised to forward the call to a more knowledgeable research team member should questions venture into more specialised areas.
5.1.1 Study Locations All suburbs in the Melbourne metropolitan area were stratified into 3 groups (higher, medium and lower) based on their weekly family income figures obtained from the Australian Bureau of Statistics (2001). Ten suburbs were then selected from each of lower and higher socio-economic groups and twenty suburbs were chosen for the medium group. These ensured a good spread across the metropolitan area.
The following table lists the suburbs selected for the study under their corresponding socio-economic group. Table 82. Suburbs under each socio-economic group
Lower Medium Higher
Cranbourne Alphington Narre Warren Beaumaris
Fawkner Aspendale Garden Richmond Burnley
Footscray Balaclava Ringwood North Clifton Hill
Heidelberg West Caroline Springs Scoresby Eaglemont
Keysborough Chirnside Park St Kilda Hawthorn
Kingsville Donvale Tecoma Kew
Noble Park Gardenvale Vermont South Kooyong
Seaholme Heidelberg Wantirna South Lysterfield
Thomastown Kensington West Melbourne Park Orchards
Watsonia Mitcham Yarraville South Yarra

81
5.1.2 Respondents Respondents for the study were randomly selected from the suburbs above. Ten respondents from separate households aged eighteen years or over were required from each suburb. An effort was also made to recruit an equal number of males and females.
Lists of randomly selected households were provided to interviewers with instructions to call each household a minimum number of three times at different times of the day and on different days before it could be dismissed as “no contact”.
A final total of 400 respondents were recruited including 191 (47.8%) males and 209 (52.3%) females.
5.1.3 Refusal Rate The refusal rate for the questionnaire was 72%. The following table shows the reasons for refusing.
Table 83. Refusal reasons
Reason N (1005)
Too Busy 374
Not interested 314
Little/No English 182
Hung up 64
Too old 52
Sick 19
5.1.4 The Questionnaire As a summary, the survey questionnaire consisted of the following items.
• intention to buy vegetables grown with recycled wastewater
• knowledge about the scheme
• need to find out more information about the scheme
• importance of having information about the scheme
• perceived risks and benefits of the scheme
• feelings and emotions associated with the scheme
• trust in different authorities to manage the scheme
• trust in different authorities to provide information about the scheme
• a series of attitudinal statements
• an indication of the importance of cost on their decisions to buy the vegetables

82
• an indication of any influence of the physical location of the scheme on their decisions to buy the vegetables
• socio-demographic information
5.1.5 Briefing Information Before answering the questions, respondents were read the following information. Greater detail was available to respondents if they required it as explained above in Section 5.1.1. Appendix 2 provides the additional information provided to the interviewers.
The Victorian government is introducing water reuse schemes to better manage the State’s water. One reuse scheme being introduced uses recycled wastewater to grow vegetables in the Werribee district. The recycled wastewater is coming from the Western Treatment Plant in Werribee. The water is treated by Melbourne Water to Class A standard. Class A water is treated according to guidelines set by health authorities and the EPA to ensure it is safe for growing vegetables and safe for the environment. The quality of the recycled wastewater is monitored to ensure it is always of a Class A standard. The recycled wastewater is used to irrigate vegetables such as celery, lettuce, onions, cabbages, broccoli, and cauliflower. Vegetables from the Werribee district are mostly sold in Melbourne and are also distributed Australia-wide.
5.2 Results The following provides the general results of the analysis of the responses to the questionnaire. A statistical significance level of 0.01 was used throughout the analysis. For most of the open-ended questions, respondents were allowed to provide up to three responses.
5.2.1 Awareness of the Scheme Respondents were asked whether they had heard about the scheme before the survey. Forty-three percent of respondents answered yes, about half of them said no (50.8%) and 6.3% were unsure. Most of the respondents who had heard of the scheme 6 were then asked when they had first heard of it. Over half said that they’d heard about the scheme up to six months prior to the study (56.6%). Few respondents had heard of the scheme more than 2 years ago (15.5%). Responses are shown in the table below.
6 Only 129 of a possible 172 respondents were asked the question as it was decided after the start of the survey to include it. This was done as it became apparent that some respondents may have been confusing the recently introduced scheme with an old agricultural scheme that had been operation in Werribee many years previously.

83
Table 84. When respondents first heard about the Werribee scheme
Reasons Percentage
(N=129)
1 to 3 months ago 13.2
4 to 6 months ago 43.4
7 months to 1 year ago 24.0
2 to 4 years ago 10.9
5 to 10 years ago 3.1
More than 10 years ago 1.5
5.2.2 Buying Produce Grown through the Werribee Scheme Respondents were then asked whether they would buy vegetables that had been grown in Werribee with recycled wastewater. About one-third of respondents (35%) would buy the vegetables without hesitation. More than half of respondents (55.5%) were unsure and very few respondents (9.5%) said that they would definitely not buy the vegetables. For the respondents who said they would buy the vegetables, the main reasons for their decisions were as follows.
Table 85. Reasons for intention to buy vegetables from Werribee
Reasons Percentage
(N=139)
Don’t see any problems with it 48.2
Support the use of recycled wastewater 32.1
Would not know the difference anyway 10.2
Has been used overseas for years 6.6
Have seen the good quality 5.8
Many respondents (48.2%) stated that they did not see any problems with buying the vegetables. They also mentioned that they supported the use of recycled wastewater (32.1%)
For respondents who said they were not sure whether they would by the vegetables, the main reasons follow in the table below.

84
Table 86. Reasons for being unsure about intention to buy vegetables from Werribee
Reasons Percentage
(N=223)
Would only buy if the water is treated properly 71.3
If the safety of such use is guaranteed 22.9
Support the use of recycled wastewater 9.0
Need more information 5.8
Concerned about the use of wastewater 4.5
Respondents who were unsure about buying vegetables from Werribee were principally concerned about the safety and water treatment.
The following table shows the reasons given by respondents who said they would not buy the vegetables.
Table 87. Reasons for no intention to buy vegetables from Werribee
Reasons N
(35) Percentage
Concerned about the use of wastewater (e.g. chemicals used, health concerns) 23 60.5
Need more information 6 16.2
Not from Werribee 3 8.1
It’s a disgusting thought 3 8.1
Respondents who would not buy the vegetables were generally concerned about the use of wastewater, specifically about the chemicals and possible health impacts.
5.2.3 Knowledge of the Scheme Respondents were asked to rate their knowledge of using recycled wastewater to grow vegetables on a five-point scale.
Table 88. Knowledge about using recycled wastewater to grow vegetables
Percentage (%) 1
No knowledge at all 2 3
Some knowledge 4 5
High level of knowledge
Mean (N=400)
35.4 28.8 25.0 6.8 4.0 2.15
Respondents reported having little knowledge about using recycled wastewater to grow vegetables.

85
Males reported a significantly higher level of knowledge about the Werribee scheme than females. No significant differences were found in the mean knowledge rating across different income and educational groups.
5.2.4 Information about the Scheme Respondents were asked whether they would like more information about the use of recycled wastewater to grow vegetables. Similar percentages were found for the number of respondents who said they would (47.5%) and would not want more information (46.3%). About 6% of respondents were unsure. Respondents who wanted more information were asked what information they would like and how they would like to receive it.
Table 89. Type of information required by respondents
Information required Percentage
(N=215) Recycled water treatment process 53.0
All aspects of the scheme – general information 25.1
Possible effects of human bacteria on produce 17.2
Quality of recycled wastewater used 11.6
Quality control in place for the scheme 6.5
What’s left in the recycled wastewater 5.6
Quality of recycled water in comparison to tap water 4.7
Respondents were mainly interested in finding out about the recycled wastewater treatment process and aspects of quality and health.
Table 90. Preferred ways of receiving the information
How Percentage (N=215)
Mail outs (e.g. pamphlets) 59.6
Newspaper 22.3
TV 21.4
Website 17.7
Radio 14.0
Email 10.2
Magazines 2.8
Media 2.8

86
As noted previously, people prefer more personalised ways of receiving information. This is a consistent finding.
Respondents were asked to rate, on a five-point scale, how important it was to them to have information about the Werribee scheme.
Table 91. Importance of information about the Werribee scheme
Percentage (%) 1
Not at all important 2
Hardly important 3
Important 4
Very important 5
Extremely important
Mean (N=396)
15.9 24.0 29.5 20.2 10.4 2.85
Respondents generally thought that having information about the scheme was important to them. However, perhaps surprisingly, approximately 40% of respondents considered having information about the scheme to be hardly or not at all important to them.
The importance of the personal need for information was not significantly different between males and females. Respondents who were unsure or would not buy vegetables grown in Werribee placed a significantly higher importance on having information than those who intended to buy the vegetables.
No significant differences were found in the mean importance rating across income and educational groups.
5.2.5 Perceived Benefits Respondents were asked to rate on a five-point scale the possible benefits of using recycled wastewater to grow vegetables for themselves, their families and the environment.
Table 92. The possible benefits of the scheme
Benefits to N Mean*
… them personally 396 3.55
… their family 395 3.55
… the environment 397 4.32
*higher scores indicate greater benefit perceived
Respondents generally considered there to be benefits for themselves, their families and the environment. However, benefits of the scheme were perceived to be significantly greater for the environment than for themselves or their families.
Respondents who would buy vegetables grown with recycled wastewater thought there would be a higher level of benefits for themselves, their families and the environment than those who were unsure or did not intend to buy the vegetables.

87
All respondents were asked to rate the extent to which they thought Melbourne would benefit from the Werribee scheme.
Table 93. Benefit of the scheme to Melbourne
Percentage (%) 1
No benefit at all 2
3 Some benefit
4
5 Great benefit
Mean (N=399)
2.8 2.3 26.3 12.1 56.5 4.17
Respondents generally thought Melbourne would benefit from the scheme and those who thought the scheme would be of benefit were asked unprompted to specify these benefits.
Table 94. Perceived benefits to Melbourne
Reasons Percentage
(N=384)
Saving precious water source 81.4
Help to cope with water shortage 14.2
Benefit the environment 13.1
Using recycled water 5.4
Financial rewards 5.2
Cheaper vegetables 2.3
The majority of respondents thought that the scheme would help Melbourne to save precious water resources and help to cope with water shortage.
5.2.6 Perceived Risks Similar to the benefits question, respondents were also asked to rate on a five point any possible problems or risks associated with using recycled wastewater to grow vegetables to themselves, their families and the environment.
Table 95. Perceived risks of the Werribee scheme
Risks to N Mean*
… them personally 391 2.18
… their family 391 2.18
… the environment 390 1.92
*higher scores indicate higher perceived risk

88
On average, respondents considered the scheme to pose little risk to themselves, their families and the environment with significantly lower levels of risk to environment. However, the difference is only a matter of degree rather than opposing views.
Respondents who would buy vegetables grown with recycled wastewater perceived significantly lower risks associated with using the water than those who were not sure or would not buy the vegetables. Respondents who did not intend to buy vegetables perceived a significantly higher risk than those who were unsure.
5.2.6.1 Possibility of something going wrong Respondents were asked whether they thought there would be any possibility of something going wrong in using recycled wastewater to grow vegetables. About half of the respondents (52.0%) said yes, 21.0% were unsure and 27% said no.
Respondents who thought there was or might be a possibility of something going wrong were asked what they thought might happen.
Table 96. Perceptions of things that might go wrong with the Werribee scheme
Reasons Percentage
(N=290)
Health issues/illness 49.3
Human error 27.2
Treatment plant breakdown 23.4
Accidents happen 16.6
Testings and research not done properly 6.9
Respondents mainly thought there could be health issues related to using recycled wastewater to grow vegetables, as well as human error and treatment plant breakdown.
5.2.6.2 Perceived likelihood Respondents who thought there was a possibility of something going wrong were also asked to rate the likelihood it would happen on a five-point scale.
Table 97. The likelihood that it might happen
Percentage (%) 1
Highly likely 2
3 Neither
4
5 Highly unlikely
Mean (N=287)
6.3 15.3 28.6 23.0 26.8 3.49

89
About half of the respondents (49.8%) thought it was unlikely or highly unlikely that something would go wrong. 5.2.6.3 Perceived seriousness Respondents who thought there was a possibility of something going wrong were asked to rate how serious they thought it would be.
Table 98. Perceived seriousness of the problem
Percentage (%) 1
Extremely serious 2
3 Serious
4
5 Not at all serious
Mean (N=320)
32.3 15.4 40.3 8.8 3.2 2.35
Nearly a third of respondents (32.3%) thought the consequences of something going wrong would be extremely serious. Eighty-eight percent of respondents thought the consequences would be either serious and extremely serious. 5.2.6.4 Perceived level of control Respondents who thought there was a possibility of something going wrong were asked to rate on a five-point scale the level of control they thought the authorities would have to stop it from happening.
Table 99. Authorities’ level of control
Percentage (%) 1
No control at all 2
3 Some control
4
5 High level of control
Mean (N=285)
3.9 4.6 24.9 14.7 51.9 4.06
If something was to go wrong, respondents on average thought the authorities had a moderate degree of control to stop it from happening.
5.2.6.5 Expert knowledge about the safety of the scheme Respondents were asked to rate on a five-point scale how much they thought the experts knew about the safety of using recycled wastewater to grow vegetables.
Table 100. Expert knowledge about the safety of the scheme
Percentage (%) 1
No knowledge at all 2
3 Some knowledge
4
5 High level of knowledge
Mean (N=392)
2.0 3.6 22.2 17.6 54.6 4.19

90
Very few respondents thought the experts had little or no knowledge about the safety of the scheme. As indicated by the high mean of 4.19, respondents generally considered the experts to have a good level of knowledge.
5.2.6.6 Unknown effects from the scheme Respondents were asked to rate on a five-point scale the likelihood that there could be unknown future effects from growing vegetables with recycled wastewater. Table 101. The likelihood that there could be unknown effects from the scheme
Percentage (%) 1
Highly unlikely 2
3 Neither
4
5 Highly likely
Mean (N=390)
28.9 22.1 23.6 13.6 11.8 3.43
Just over half of respondents (51%) felt it was unlikely or highly unlikely that there could be unknown effects from the scheme in the future.
5.2.7 Risks versus Benefits of the Werribee Scheme After considering all the benefits and risks of using recycled wastewater to grow vegetables, respondents were asked to choose one statement from the following five with which they most strongly agreed.
Table 102. Perceived risks versus benefits of the Werribee scheme
Statement Percentage
(N=398)
The benefits obviously outweigh the risks 52.3
The benefits slightly outweigh the risks 21.6
The benefits and risks are equal 16.8
The risks slightly outweigh the benefits 5.5
The risks obviously outweigh the benefits 3.8
The majority of respondents (73.9%) indicated that they thought the benefits of the scheme outweighed the risks. Less than 10% thought the risks outweighed the benefits.
5.2.8 Trust in the Authorities Respondents were asked to rate their trust in three government agencies specifically, and in science and technology generally, to perform their respective roles in the operation and management of the scheme. Results of these questions are shown in the following figure.

91
How much do you trust– Science and
technology to produce safe recycled water
– EPA to ensure safety of environment
– Dept Human Services to ensure health and safety
– Melbourne Water to responsibly manage & monitor 1
2
3
4
5
Science
& Tech.
EPA
Melb. W
ater DHS
No trust at all
Complete trust
Figure 34. Trust in organisations to perform their respective roles Respondents placed a significantly high amount of trust in science and technology to produce safe recycled wastewater to grow vegetables. They also trusted the three agencies in dealing with different aspects of the scheme. When further analyses were conducted, respondents trusted the EPA significantly more than they did Melbourne Water and the DHS. No significant differences were found in the rating of trust for Melbourne Water and the DHS. 5.2.9 Trust in Authorities to Provide Information Respondents were asked to rate how much they trusted a number of agencies to provide reliable information on issues related to using recycled wastewater for growing vegetables.
1
2
3
4
5
CSIRO
Universit
ies
Medical Docto
rs EPA
Melbourne
water
Env Groups
Consumer G
roups DHS
Private Companies
No trust at all
Complete trust
Figure 35. Trust in different authorities to provide reliable information

92
Private companies were significantly least trusted by respondents to provide reliable information on issues related to using recycled wastewater to grow vegetables. CSIRO was rated significantly higher than all other authorities to provide reliable information about horticultural reuse.
5.2.10 Emotive Feelings about eating the Vegetables Respondents’ feelings of emotion associated with eating vegetables grown with recycled wastewater were also explored in the survey through a series of scales that had been developed and tested in the social experiment described in Section 3 of this report. As previously noted in Section 4, the scales serve no purpose to be reported individually as they were designed to provide a latent variable for the confirmatory analysis of the hypothesised model.
5.2.11 Price of Vegetables Grown with Recycled Wastewater Respondents were asked whether the price of vegetables grown with recycled wastewater would make a difference to their decisions to buy them. Just under half of the respondents (46.1%) reported that it would not make a difference to their decisions. A similar but lower percentage of respondents stated that the price of vegetables would make a difference (40.6%). Just over one-tenth of respondents (13.3%) were unsure. They were all asked to provide reasons for their responses. Those who stated that the price would make a difference mostly said that they can’t afford to buy if it is too expensive. The following table provides the main reasons.
Table 103. Reasons why the price would make a difference to buying decisions
Reasons Percentage
(N=189)
Can’t afford to buy if it is too expensive 46.3
Would be better if cheaper 11.7
If the same quality, would buy the cheapest 8.6
Quality is important but would not pay more 5.6
Respondents who thought the price of vegetables would not make a difference to their decisions provided the following reasons. Almost half of them stated that price was not an issue.
Table 104. Reasons why the price would not make a difference
Reasons Percentage
(N=216)
Price is not an issue 48.6
Quality of produce is more important 19.4
As long as it is not much more expensive 14.8
Do not trust the process 7.4
Would pay more for better quality 8.6
Concern about health implications 5.1

93
The following table shows the reasons provided by those who were not sure whether the price would make a difference to their decisions to buy the vegetables
Table 105. Reasons why respondents were unsure if the price would make a difference
Reasons Percentage
(N=61)
As long as it is not more expensive 56.9
Quality of produce is more important 15.7
Can’t afford to buy if too expensive 11.8
Price is not an issue 9.8
5.2.12 Place where vegetables are grown Respondents were also asked whether they would buy vegetables grown with recycled wastewater if they were grown in places other than Werribee. A similar number of respondents said yes (45.1%) and not sure (44.4%). One tenth of respondents said no (10.5%).
Respondents who would buy the vegetables if they were grown in places other than Werribee provided the following comments.
Table 106. Reasons why respondents would buy vegetables grown with recycled wastewater in places other than Werribee
Reasons Percentage
(N=180)
Doesn’t matter where they are grown 77.4
No problem at all 10.2
The scheme helps to save water 9.6
It is better for the environment 5.1
Respondent who would buy vegetables grown with recycled wastewater if grown in other places mainly commented that the physical locations where the vegetables were grown were not important. This was similar to the reasons provided by those who said they would not buy vegetables grown in places other than Werribee. Most of these respondents (87%) stated that it didn’t matter where they were grown, they wouldn’t buy them. It was evident therefore that the location was not an issue in decisions to buy or not to buy the vegetables. The following table shows responses obtained from respondents who said they were unsure about buying vegetables grown with recycled wastewater if they were grown in places other than Werribee. The main reasons provided were that they would only consider buying if the water was treated properly. Some though stated that they’d only buy the vegetables if they knew they were grown within Australia.

94
Table 107. Reasons why respondents were unsure about buying vegetables grown with recycled wastewater in places other than Werribee
Reasons Percentage
(N=177)
Only if the water is treated properly 74.6
Only if I know they were from Australia 9.0
5.2.13 Attitudes Respondents were asked to rate their agreement with a series of twenty attitudinal statements associated with the variables in the hypothesised model. An exploratory factory analysis was performed on the statements and five factors were extracted and explained 62.12% of the variance. When tested for reliability, four factors emerged as being suitable for use as scales in later analyses.
As in the first case study (see Section 6.2.14), on further examination, the first factor was seen to be made up of the items that were hypothesised to form two attitudinal scales, the subjective norm scale and the attitudes towards intended behaviour scale. Therefore, further tests using structural equation modelling with AMOS 5.0 (SmallWaters Co., 2004) were performed to test the uni-dimensionality of both potential scales.
As shown in the table below, the fit indexes for both scales were found to be adequate as recommended by Kline (1998). This indicated that items in both scales measured only one concept. It was therefore decided to retain the scales as separate items. Table 108. Model fit indexes for the attitudes scale and subjective norm scale
Fit statistics Attitudes towards reuse scale Subjective norm scale Recommended
value
Chi-square 1.31, df=1, p > .01 3.67, df=2, p > .01 -
CFI 1.0 .99 ≥.90
TLI 1.0 .97 ≥.90
RMSEA .03 .05 ≤.10
Scale 1: Attitudes towards the intended behaviour This scale had a Cronbach alpha of .92 and consisted of three items. The scores for the attitudes towards intended behaviour scale were calculated for each respondent by summing their responses for the three items. The mean score indicated that respondents had moderately strong attitudes towards reuse for growing vegetables. The scores of the scale are summarised in the table below.

95
Table 109. Attitudes towards the intended behaviour
Description Mean
Minimum 3
Maximum 15
Mean 11.91
Scale 2: Subjective norm
The subjective norm scale was formed with a Cronbach alpha of .71 and consisted of four items. The scores for the scale were then calculated by summing responses to the four items. The mean of 13.20 indicated that respondents perceived reasonable pressure from others to conform to buying vegetables grown with recycled wastewater.
Table 110. Subjective norm scale
Description Mean
Minimum 4
Maximum 20
Mean 13.20
Scale 3: Environmental obligation This scale had a Cronbach alpha of .84 and consisted of four items. Again the rating responses to the items were summed and the mean score of 17.76 indicated that respondents generally felt a strong obligation to protect the environment.
Table 111. Environmental obligation scale
Description Mean
Minimum 11
Maximum 20
Mean 17.76
Scale 4: Reuse intrinsic motivation This scale was formed with a Cronbach alpha of .74 and consisted of three items. The mean score was 12.31 indicating respondents were intrinsically motivated to use recycled wastewater.
Table 112. Reuse intrinsic motivation scale
Description Mean
Minimum 6
Maximum 15
Mean 12.31

96
Scale 5: Perceived control The perceived control scale was formed with two items with a correlation of .70. The mean score of 4.21 indicated respondents only felt moderately in control of knowing how and where the vegetables they bought were grown.
Table 113. Perceived control scale
Description Mean
Minimum 2
Maximum 10
Mean 4.21
5.2.14 Demographics 5.2.14.1 Awareness of Melbourne water issues Respondents were asked to rate their awareness of water issues in Melbourne. Their responses to the question are shown in the table below.
Percentage (%)
1
Not at all aware
2 3
Somewhat aware
4 5
Very aware
Mean (N=399)
1.0 6.8 29.8 30.1 32.3 3.86
Respondents generally felt they were aware of water issues in Melbourne. 5.2.14.2 Age
Age distribution Percentage
(N=400)
Less than 24 years 5.8
24 to 39 years 26.5
40 to 55 years 35.3
56 to 65 years 16.5
66 to 75 years 9.8
More than 75 years 6.3

97
5.2.14.3 Gross household income
Income distribution Percentage
(N=400)
Less than $22,000 10.0
$22,001 to $42,000 16.8
$42,001 to $62,000 19.5
$62,001 to $82,000 12.0
More than $82,000 30.0
Don’t know 4.8
Refused 7.0
5.2.14.4 Levels of Education
Educational level Percentage
(N=400)
All or some of primary school 2.3
All of some of secondary school 25.3
Partial trade or technical qualification 4.0
Trade or technical qualification 14.8
Partial university qualification 8.8
University qualification 45.0 5.2.14.5 Household unit
Household unit Percentage
(N=400)
Adults with youngest child less than 5 years old 13.8
Adults with youngest child between 5 and 12 years old 10.0
Adults with youngest child between 13 and 18 years old 6.5
All adults (includes children > 18 years) 69.8
As in the previous case study, it is again evident that the sample lacked household units with children less than eighteen years of age. This is likely to be due to the busier lifestyles of young families and the time available for surveys. However, no significant differences emerged in any of the major variables between the different household units. Therefore, it is not expected that this lack of young families in

98
the sample will have affected the overall results. It is, though, a point for further investigation in the future.
5.2.15 Modelling factors that influence the decision to buy vegetables grown with recycled wastewater
Structural equation modelling with latent variables using AMOS 5.0 program (SmallWater Co., 2004) was conducted to model factors that influenced people’s decisions to buy vegetables grown with recycled wastewater. Using Ajzen’s theory of planned behaviour (1985, see section 2.1) and incorporating additional factors identified in past literature, the study hypothesised the following model as the first input to the AMOS 5.0 program.
Emotion
VAR1e19
attitudesATT5
ATT6
ATT7
e18
e17
e16
1
1
1
1
Perceived Control
ATT16
ATT17
e14
e12
1
11
Subjective Norm
ATT10
ATT11
ATT15
e1
e2
e3
1
1
1
1
ATT1 ATT2
e6 e5
ATT3
e4
ATT4
e8
ATT22e32
Envt Obligation
KNOW
TrustTRUST2
TRUST3
TRUST4
TRUST1
1
e371
e341
e351
e361
RISK2
RRBUY1 e251
VAR2
VAR3
VAR4
VAR5 VAR6VAR7
VAR8
e20
e21
e22 1
e23 1 e241
27
e28
intrinsic motivation
ATT19
e90
1
1
ATT20
e911
ATT21
e921
e93
e94
1
11
1
1
1
1
1
1
111
ATT8e101
1
1
POUTCOMEe9 1
ATT13
ATT18
e301
e311
Figure 36. The hypothesised model as depicted in the AMOS program
The model shows the hypothesised relationships between latent and observed variables. Latent variables are those that cannot be measured directly and are represented by ellipses in the figure. Variables that are measured directly, known as observed variables, are represented by boxes.

99
The scores for the latent variables are often inferred by a number of observed indicators. For example, it is not possible to observe people’s sense of personal obligation to environmental protection. Therefore, the study utilised a number of observable measurements to infer people’s sense of obligation to environmental obligation. Where possible, exploratory factor analyses were also conducted for each latent variable to ensure its reliability before being included in the model. The following table shows the latent and observed variables included in the hypothesised model. Table 114. Descriptions of the variables in the hypothesised model Variable Latent or observed
variable Descriptions
Attitudes Latent The higher the score the more positive respondents were about buying vegetables grown with recycled wastewater and their evaluation of a more positive outcome for Melbourne
Emotion Latent The higher the score the more negative respondents felt about eating vegetables grown with recycled wastewater
Intrinsic motivation Latent The higher the score, the more intrinsically motivated the respondents were to reusing water
Perceived control Latent Higher scores indicated respondents preferred a higher level of control over how and where the vegetables they buy are grown
Subjective norm Latent Higher scores indicated respondents felt more pressure and influence from others to buy vegetables grown with recycled wastewater
Trust Latent Higher scores indicated higher levels of trust in the authorities
Responsibility (Att22)
Observed Higher scores indicated respondents perceived a higher level of responsibility for making sure the State has enough water for the future
Knowledge (Know)
Observed The higher the score the greater knowledge respondents felt they had about using recycled wastewater to grow vegetables
Risk Perceptions (Risk2)
Observed Higher scores indicated higher levels of perceived risk associated with using recycled wastewater to grow vegetables
Intended Behaviour (Rrbuy1)
Observed The higher the score the greater the intention to buy vegetables grown with recycled wastewater from Werribee
Factor based maximum likelihood estimation was selected to assess the model fit. The Bayesian Information Criterion (BIC) as well those fit measures recommended by Kline (1998) were used as the model fit indicators. Note that a smaller BIC value reflects a better model fit. The following table shows the values of fit measures when the hypothesised model was analysed.

100
Table 115. Model fit indexes for the hypothesised model
Fit statistics Obtained value Recommended
value
Chi-square 2212.46, df=551, p < .01 -
BIC 2685.78 -
CFI .81 ≥.90
TLI .79 ≥.90
RMSEA .09 ≤.10
The values of the fit measures indicated the overall fit of the hypothesised model to the data collected was inadequate. Other models were therefore investigated. The model, shown below with adequate model fit measures, was chosen as the final model.
Emotion
VAR1e19
.66
attitudes
ATT5 ATT6 ATT7
e18 e17 e16Perceived Control
Subjective Norm
ATT10
ATT11
ATT15
e1
e2
e3
.85.53.51
ATT3
ATT2
e6
e5
ATT1e4
ATT4e8
ATT16
ATT18
.36.84
e11
e10
Envt Obligation
.71.87
.75
.74
Trust
TRUST2TRUST3TRUST4 TRUST1
.81.84.85.72
e37e34e35e36
RRBUY1
e26
VAR2
VAR3
VAR4
VAR5 VAR6 VAR7
VAR8-.84
-.88-.69-.86 -.70 -.88
-.89
e20
e21
e22
e23
e2427
e28
ATT8e12
.59
-.82
.47
.87
.17
-.44
.13
RISK2
e83
-.06
.20
-.69
-.38
-.06
-.50
-.04
e60
-.10
.55
POUTCOME
.90 -.73
e9
Figure 37. The final model computed with AMOS (shown in standardised weights)

101
Table 116. Model fit indexes for the final model
Fit statistics Obtained value Recommended
value
Chi-square 980.50,df=339, p < .01 -
BIC 1381.93 -
CFI .92 ≥.90
TLI .91 ≥.90
RMSEA .07 ≤.10
For easier interpretation, the final model has been simplified in Figure 38.
Perceived Control
Emotion Trust
SubjectiveNorm
EnvironmentalObligation
AttitudesIntended
Behaviour(ie. willingness to buy vegetables grown
with recycled wastewater)
Risk
Strong ContributionModerate ContributionWeak Contribution
.17*
.47*
-.04
-.44*
.13*-.10*
.55*
-.38*
-.50*
-.69*
-.06
.20
-.06
* significant path/correlations at p < .01
Figure 38. Simplified version of the final model (shown in standardised weights) Most components of the hypothesised model remained in the final model with the exception of personal responsibility, individual knowledge of horticultural reuse scheme in general and intrinsic motivation. These three components were left out of the final model as they either did not contribute significantly to the overall model fit, or they detracted from the overall model fit.

102
It is also important to note here that the hypothesised and final models differed on the relationships between the components. In the final model, components such as environmental obligation, subjective norm, perceived control, emotion, trust, and risk did not have a direct impact on the respondents’ stated intention to buy vegetables grown with recycled wastewater. Instead, the impacts of these components on stated intention were mediated by their attitudes. The more positive respondents’ attitudes were to the intended behaviour and their outcome evaluations of the scheme, the greater the intention to buy vegetables from the Werribee scheme. This finding is a replication of the model that emerged in the first case study for indirect potable reuse (see Section 4.2.16). Respondents’ attitudes towards buying vegetables grown with recycled wastewater were significantly influenced by:
• subjective norm Respondents who perceived greater pressure and influence from others to buy vegetables grown with recycled wastewater were more likely to adopt more positive attitudes towards buying the vegetables. This then increased their intention to buy vegetables from the Werribee scheme.
• emotions Respondents who felt negative emotions about eating vegetables grown with recycled wastewater were likely to adopt negative attitudes to buying them. This would then adversely impact on their intention to buy the vegetables from the Werribee scheme.
• trust in authorities Respondents who displayed a high level of trust in the authorities displayed more positive attitudes towards buying vegetables grown with recycled wastewater and thus a greater intention to buy the vegetables from the Werribee scheme.
• risk perceptions Respondents who perceived a higher level of risk associated with using recycled wastewater to grow vegetables had more negative attitudes towards buying the vegetables and therefore a lesser intention to buy the vegetables from the Werribee scheme.
• sense of obligation to protect the environment
Respondents who felt a strong obligation to protect the environment had more positive attitudes towards buying vegetables grown with recycled wastewater. This then increased their intention to buy the vegetables from the Werribee scheme.
• perceived control over the vegetables they buy
Respondents who perceived a greater personal control over where and how their vegetables are grown were more negative towards buying vegetables grown with recycled wastewater. As a result, they were less inclined to buy the vegetables from the Werribee scheme.
Other findings that are also of interest from the figure above include:
• Respondents’ emotive feelings associated with eating vegetables grown with recycled water correlated strongly with their subjective norm. This indicated that respondents’ feelings of negative emotions decreased as they felt more pressure from others to buy vegetables grown with recycled wastewater.
• Respondents’ trust in the authorities had a significant impact on their risk perceptions.
Specifically, a higher level of trust would reduce the level of risks perceived by the respondents to be associated with growing vegetables grown with recycled wastewater.

103
5.2.16 Demographic Comparisons Analytical comparisons were conducted with the key predictor variables (attitudes, emotions, risk perceptions, trust, environmental obligations and subjective norm) and the demographic variables. The following statistically significant differences7 were found, providing an indication of the demographic groups that should be targeted to increase community intention to buy vegetables from the Werribee scheme. Gender No significant differences were found between gender and environmental obligation, subjective norm or risk perceptions. Significant gender differences were found for trust, emotion and attitudes towards buying vegetables grown with recycled wastewater.
Trust • Males (mean=15.67) reported significantly higher levels of trust in the authorities than did
females (mean=14.72).
Emotion • Females (mean=24.93) reported significantly higher negative feelings towards eating
vegetables grown with recycled wastewater than males (mean=20.44).
Attitudes towards buying produce grown with recycled wastewater • Males (mean=16.73) had a significantly more positive attitude to buying vegetables grown with
recycled wastewater than did females (mean=15.43). Household units No significant differences were found between different types of household units and all the six variables (subjective norm, trust, emotion, risk perceptions, environmental obligation and attitudes towards buying vegetables grown with recycled wastewater). Age No significant differences were found between age and the six variables (subjective norm, trust, emotion, risks, environmental obligation and attitudes towards eating vegetables grown with recycled wastewater). Education No significant differences were found in the different levels of education and emotion, environmental obligation, subjective norm, risk perceptions or attitudes towards eating vegetables grown with recycled wastewater. However, significant differences were found in the levels of education and trust.
• Respondents whose highest level of education was primary school (mean=12.67) reported a significantly lower level of trust than those whose highest level of education was partial university (mean=16.46).
• Respondents who had a partial trade qualification (mean=12.87) had a significantly lower level of trust in the authorities compared with those whose highest level of education was partial university (mean=16.46) or university (mean=15.50).
7 p<.01

104
Income groups No significant differences were found between the income groups and all the six variables (subjective norm, trust, risk perceptions, emotion, environmental obligation and attitudes towards buying vegetables grown with recycled wastewater). 5.3 Summary and Conclusions The results of this case study which virtually replicate the findings of the first case study for indirect potable reuse in Perth continues to provide confidence in both the selection and the measurement of the principal variables involved in people’s behavioural decisions in relation to a recycling scheme. The final model shows the relationship of the variables and their strength of contribution to the decision making. It should be noted that all the variables shown are important to the model even though some have weaker contributions and some are not statistically significant. None can be discounted.
As in the first case study, this research provides some quantitative understanding of the role of emotions (eg. the “yuck factor”) in people’s behavioural decisions, both in the ability to measure them and also in terms of the degree of influence on the decisions. While these emotions are often discounted as “irrational” they constantly prove to be difficult to deal with and frequently constitute the major reasons for the failure of past schemes to gain public acceptance. However, the results of the latent variable modelling shows how other variables could be used to temper them, such as by increasing trust in the authorities and increasing the influence of the subjective norm.
Of considerable interest was that knowledge, again, did not emerge in the latent variable modelling as a factor in people’s decisions to buy the produce. Anyone considering using communication and education as the main feature of a program to obtain community acceptance of a recycling scheme should take note of this finding.
Again the surprising finding that risk perceptions were not more dominant in influencing behavioural intentions occurred in this case study as with the first. While risk was quite strongly influenced by trust, it had only a weak contribution to attitudes and hence to intended behaviour. Given that it is assumed that technological and health risks are important to address with the community, this is a significant finding. The model also suggests that by increasing trust in the authorities, people’s concerns about risk will also reduce.
One finding that emerged in the model here that was different from the Perth case study, was the greater contribution to the model of environmental obligation. That is, the more people felt an obligation to protect the environment, the more positive were their attitudes to buying vegetables grown with recycled wastewater. Presumably this is because people perceive greater environmental damage associated with the use of scarce freshwater supplies for irrigation than they do through the use of water for household use.

105
6.0 DISCUSSION This systematic program of social research over the past few years has gone a long way to providing an understanding of how people make their decisions about the “doing it” side of wastewater recycling schemes. Communities consistently promote the concept of water reuse, but frequently reject schemes when their behavioural support is required. Until now, sponsors of recycling schemes worldwide have been instituting public acceptance programs with little understanding of what will govern people’s actual behaviour. This research has developed a behavioural predictive model which has been replicated in two Australian cities, on opposite sides of the country, and on two different but immediate recycling schemes. The model shows the important variables in people’s behavioural decision making, the relative contribution of the variables to the decision, and the relationships between them.
It has been known that emotions (ie. the “yuck factor”) play a large part in people’s acceptance or rejection of schemes, but exactly how this “yuck” was defined, what part it played in behavioural decisions, and how it could be addressed has, until now, been unknown. The replicated model developed here showed that emotions played an important part in people’s behavioural decisions and the difficulty of dealing with these should not be underestimated. The model goes a long way to explaining why past schemes internationally have failed to gain public support, and why such campaigns as “toilet to tap” can be so successful.
The opinions and influence of “others” (ie. the subjective norm) are significant in addressing these emotions. The greater the pressure that is felt from others to drink or eat products associated with recycled water, the lesser the negative emotions. However, the converse is also true. If there is pressure from others to reject the behaviour, the negative emotions will increase. It is also evident from the model that if the effect of such campaigns is to be minimised, trust in the authorities will need to be strong.
Of considerable interest was that knowledge did not emerge in the latent variable modelling as a factor in people’s decisions to drink the recycled water. This is perhaps not surprising given the frequent rejection of recycling schemes in the world despite comprehensive communication and education programs. However, the provision of comprehensive and open information is a factor in engendering trust, so the role of knowledge should not be underestimated. It should not, though, be seen as an end in itself. It should form an integral part of a community partnership in the development of acceptable recycling schemes.
Past international experience and the results of this research support the need for authorities to start talking with communities early in the planning phases of recycling schemes. It is essential for trust to be developed and this will only occur through a genuine partnership with the community where their concerns are listened to and addressed to their satisfaction. There will be no short cuts available given the influence of emotions and “others”. However, it would seem sensible to take advantage of the trust held by the community in science, technology, CSIRO and Universities to assist in the public debate.
A number of outcomes of comparisons between the major variables in the model and demographic variables will also be useful in the development of community partnerships. It was evident that, in both case studies, people with lower levels of education were less trusting of the authorities than those with higher levels of education. Also females were more inclined to hold more negative emotions about the schemes than were men. There were also a number of other useful comparisons pertinent to the particular schemes that would assist in the design of participation programs.
Perhaps one of the most interesting findings here is that the MAR and the horticultural irrigation schemes were apparently seen by the communities to be similar. That is, “nature” acted as a filter for both schemes: the aquifer in the case of the MAR scheme and the plants in the case of the Werribee

106
scheme. This may explain why the resulting models were so similar, except in the case of environmental obligation. It is expected that the contribution to the model of the different variables would be different for different recycling schemes. It would therefore, be interesting to test it on a very different case study from these.
This research has provided an extremely promising start and the replication of the model provides considerable confidence in the variables and their measures. However, as with any new work, there remain a number of issues that have been identified by the researchers that need further refinement. This will occur over the next year or so, with opportunities for the further testing on different case studies being sought. The final product will be a tool that will allow planners and water utilities to predict potential behaviour in relation to their proposed reuse schemes and understand their local communities.

107
7.0 REFERENCES ARCWIS (2002). Perth Domestic Water-Use Study: Household Appliance Ownership and Community
Attitudinal Analysis 1999-2000. CSIRO Land and Water, CSIRO Urban Water Program, December 2002.
Ajzen, I and Fishbein (1980). Understanding Attitudes and Predicitng Social Behaviour. Prentice-Hall: NJ.
Ajzen, I. (1985). From intentions to actions: A theory of planned behaviour. In Kuhl, J., and Beckmann, J., (eds.) Action control : from cognition to behaviour. Springer, Berlin, 11-39.
Armitage, C.J. and Connor, M. (2000). The efficacy of the Theory of Planned Behaviour: A meta-analytic review. British Journal of Social Psychology, 40, 471-499.
Angyal, A. (1941). Disgust and related aversions. Journal of Abnormal and Social Psychology, 36, 393-412.
Byrne, B. M. (2001). Structural Equation Modeling with AMOS: Basic Concepts, Applications and Programming. New Jersey: Lawrence Erlbaum Associates.
East, R. (1997), Consumer Behaviour: Advances and Applications in Marketing, Prentice-Hall: Hemel Hampstead.
Fishbein, M. and Ajzen, I. (1975). Belief, Attitudinal Intentions and Behaviour: An Introduction to Theory and Research. Addison-Worsley: MA.
Harland, P., Staats, H. and Wilke, A. (1999). Explaining Pro-Environmental Behaviour by Personal Norms and the Theory of Planned Behaviour. Journal of Applied Psychology, 29, 2505-2528.
Kaercher, J. D., Po., M., & Nancarrow, B. E. (2003). Water Recycling Community Discussion Meeting I (Unpublished Manuscript). Perth: Australian Research Centre for Water in Society (ARCWIS).
Kline, R. B. (1998). Principles and Practice of Structural Equation Modeling. New York: Guiford Press.
Lynne, G., Casey, C., Hodges, A. and Rahmani, M. (1995). Conservation Technology Adoption Decisions and the Theory of Planned Behaviour. Journal of Economic Psychology. 16, 581-598.
Manstead, A. and Parker, D. (1995). Evaluating and Extending the Theory of Planned Behaviour. In W. Stroebe & M. Hewstone (eds). European Review of Social Psychology, 6, 69-95. Chichester, Uk. John Wiley and Sons.
Melbourne Water (1998). Exploring Community Attitudes to Water Conservation and Effluent Reuse. A consultancy report prepared by Open Mind Group. St Kilda, Victoria.
Po, M. & Nancarrow, B.E. (2004). Consumer Perceptions of the Use of Reclaimed Water for Horticultural Irrigation. A Literature Review for Land and Water Australia. CSIRO Land and Water Consultancy Report, February 2004.
Po, M., Kaercher, J.D. & Nancarrow, B.E. (2004). Literature Review of Factors Influencing Public Perceptions of Water Reuse. Australian Water Conservation and Reuse Research Program, CSIRO Land and Water, April 2004.
SmallWaters Corporation. (2004). Amos 5.0. Chicago: Author. Sydney Water (1999). Community Views on Re-cycled Water. Sydney: Author. Water Corporation of Western Australia (2003). Community Attitudes and Public Perceptions. Paper
presented at the Water Recycling Workshop 25-26 June 2003, Perth, Australia.

108

109
APPENDIX 1 Additional information available to the survey
interviewers for the Perth Case Study

110

111
GENERAL INFORMATION Glossary of Terms Aquifers: Underground soil or rock below the land surface which is
saturated with groundwater. Alternatively, they could be described as underground water reservoirs.
Wastewater: All the wastewater from households and industries
(including toilet water)
Aquifer Storage and Recovery (ASR)
ASR is the technique of injecting or infiltrating treated recycled wastewater into an aquifer and pumping it out some years later. When the water is taken out, it is further treated to current drinking water standards before being piped to households.
This underground storage has an added benefit of killing any disease-causing organisms that may be present in the water.
Our Water Supply
In Perth, the main part of scheme water is pumped out of the Gnangara Mound, a shallow aquifer north of Perth (covers an area of about 2140 km2). We are also now using water from the deeper Yarragadee aquifer.

112
How is wastewater treated?
There are 3 different levels of wastewater treatment: primary, secondary, and tertiary treatment levels.
1. Primary treatment is the initial stage of sewage
treatment and involves removing solid particles from the sewage.
Sewage is filtered through fine screens to take out solid matter such as paper, cotton tips and plastic. Heavy particles like sand sink to the bottom and are removed.
2. Secondary treatment is where
the primary effluent flows into tanks and good bacteria grows and naturally treats the wastewater. The liquid flows into sedimentation tanks where more particles settle on the bottom for collection. This treatment level helps to remove dissolved and suspended organic and inorganic solids.
3. Tertiary treatment further
removes inorganic compounds, and substances such as the plant nutrients nitrogen (N) and phosphorus (P).
An additional treatment with membrane systems may also be used.
The level of treatment required will depend on the intended use of the water. Any uses of recycled wastewater that involves human consumption have to go through the highest level of treatment. Likewise, recycled wastewater used in the ASR scheme has to be treated to the highest standard.

113
APPENDIX 2 Additional information available to the survey
interviewers for the Melbourne Case Study

114

115
GENERAL INFORMATION Werribee Reuse
Glossary of Terms The DHS (The Department of Human Services): The DHS is the Victorian State Government department in charge of public health The EPA (The Environmental Protection Authority): The EPA is the State body responsible for protecting the environment. It’s main focus is on stopping the release of harmful pollutants into the natural environment. Recycled wastewater: Sewerage from households and industries (including toilet water) that has been treated to appropriate health standards. WTP (Western Treatment Plant): The WTP in Werribee is where waste-water from northern, western and central Melbourne is treated.
Treatment plants in Melbourne Melbourne has two main treatment plants:
1. The Western Treatment Plant in Werribee: o This treats about 54% of Melbourne’s sewage – which comes from about 1.6 million people o About 80% of the sewage is from domestic households and about 20% of it is from industries o It serves the northern and western suburbs as well as the central districts and city centre of Melbourne o The wastewater is normally treated, then discharged into Port Phillip Bay
2. The Eastern Treatment Plant near Dandenong:
o Treats about 42% of Melbourne’s sewage o Mainly residential waste
Map of Werribee
Werribee is about 30KM south-west of Melbourne. It is about half way between Melbourne and Geelong.
Why use recycled water in Werribee? Farmers are currently using river water to irrigate their crops, but the Werribee region is currently in its eighth year of drought, and so different solutions to water shortages need to be found. Also, the Victorian Government has committed itself to:
- developing the Werribee region into a green and sustainable place to ensure healthy environments for current and future generations;
- reusing 20% of treated wastewater by 2010

116
Guidelines for the treatment and use of recycled wastewater The guidelines for Environmental Management: Use of Reclaimed Water has been developed by the EPA and the Department of Human Services to make sure that recycled wastewater is used appropriately according to its treatment level. When developing the guidelines, health staff reviewed similar systems and guidelines overseas and interstate, as well as medical literature. Workshops with reuse experts and other stakeholders were also held. The Victorian guidelines comply with the stringent national conditions for the use of recycled water set by the National Health and Medical Research Council (NHMRC) and the Agricultural and Resource Management Council of Australia and New Zealand (ARMCANZ). They are also consistent with the US standards and in many cases exceed the international requirements for the use of recycled water set by the World Health Organisation (WHO). The guidelines outline four classes of recycled water that represent the minimum standards of biological treatment and pathogen reduction for defined categories of use. Class A recycled water is the highest level of treatment recommended by the guidelines. This water is acceptable for growing agricultural and horticultural produce, including fruit and vegetables that are eaten raw. The treatment systems at the Western Treatment Plant involve activated sludge technology, combined with traditional lagoon treatment with additional chlorination to ensure that the recycled water meets Class A requirements.
Current recycling About 5% of treated wastewater from the Western and Eastern treatment plants is currently used on-site at the plants or off-site by businesses such as nurseries, market gardens, vineyards, golf courses and sports grounds. The Eastern Treatment Plant in Melbourne is about to begin its own recycled wastewater scheme. This will be similar to Werribee’s in that recycled wastewater will be used to irrigate vegetables in the surrounding area. Like Werribee, these vegetables will then be distributed Australia-wide. Another large horticultural reuse scheme operating in Australia can be found in the Northern Adelaide Plains, Virginia. The Virginia region accounts for about 35% of South Australia’s horticultural production. Water is supplied to about 250 vegetable growers.
Labelling of produce grown with recycled water The law does not require the labelling of produce grown with recycled water as the authorities consider it safe to consume by humans.
Further requests for information If the interviewee requests information that is not available on this sheet, or other information that you are unable to answer, take their details and pass on to the study team.

117

118