Predicting blood lead levels from current and past environmental data in Europe
10
Predicting blood lead levels from current and past environmental data in Europe J. Bierkens ⁎, R. Smolders, M. Van Holderbeke, C. Cornelis Exposure and Risk Assessment Modeling, Flemish Institute for Technological Research – VITO, Vlasmeer 7, B-2400 Mol, Belgium abstract article info Article history: Received 31 May 2011 Accepted 17 August 2011 Available online 13 September 2011 Keywords: Blood-lead levels Lead environmental concentrations Environmental health impact assessment Human biomonitoring European comparison Regression analysis The present case study on lead in Europe illustrates the use of the Integrated Monitoring Framework Strategy to assess the health outcome of environmental pollution by evaluating the associations between lead in var- ious environmental compartments (air, soil, dust, drinking water and diet) and lead concentrations in blood (B-Pb) for various age-related sub-populations. The case study was aimed to investigate whether environ- mental, exposure and biomonitoring data at general population level, covering all EU member states, could be integrated. Although blood lead has been monitored extensively in Europe, consistent datasets are not yet available. Data diverge with regard to objectives, regional scale, sampling years, gender, age groups and sample size. Significant correlations were found between B-Pb and the concentrations of Pb in air and diet. The significant decrease of the Pb in air over time from 0.31 μg/m 3 (P95: 0.94; n = 98) prior to 1990 to 0.045 μg/m 3 (P95: 0.11; n = 256) in 2007 (latest observations included) (Δ =−85%) corresponds to a decline in B-Pb by 48% and 57% in adult women and adult men, respectively. For pre-school children a more shallow decline in B- Pb of 16% was calculated over the same period. Similarly, the reduction in Pb-dietary intake from on average 68.7 μg/d (P95: 161.6; n = 19) in 1978 to 35.7 μg/d (P95: 82.3; n = 33) in the years post 2000 (Δ =−48%) is paralleled by a decline in B-Pb of 32, 33 and 19% in adult women, primary- and pre-school children, respec- tively. Insufficient data exist for other age groups to calculate statistically significant correlations. Although regression models have been derived to predict B-Pb for different sub-populations in Europe based on Pb concentrations in air and soil as well as dietary intake, it is concluded that the available data are insuf- ficient to accurately predict actual and future simultaneous exposure to Pb from various environmental com- partments, and as a consequence the health impact of Pb for various target populations at EU scale. At least due to data availability, air Pb remains the best predictor of B-Pb in the population. However, lead emission sources have largely been reduced and inhalation of lead in air is not causal to B-Pb levels. Therefore, there is a need of adequate data for Pb in soil and house dust, and in diet and drinking water as these are causal ex- posure sources with a longer Pb half-life than air. An extended and more harmonized surveillance system monitoring B-Pb, especially in children, is urgently required in order to identify, quantify and reduce still remaining sources of Pb exposure. © 2011 Elsevier B.V. All rights reserved. 1. Introduction A critical component of risk assessment and regulatory decision- making is the need for reliable exposure metrics (Bonnefoi et al., 2010). Human biomonitoring provides a reliable methodology for assessing internal exposure, bridging the gap between the presence of pollutants in the environment (and consequently external exposure) and potentially adverse health effects. Internal dosimetry is required for the identification of substances of great concern (persistency, accu- mulation potential, toxicity, etc.), and also helps to identify target popu- lations (age/gender, vulnerable groups, etc). However, exposure biomarker data require interpretation with regard to exposure sources to support decision-makers in taking exposure reduction measures, when required. One of the possibilities to interpret exposure bio- markers is to try to relate them to external exposures like air concentra- tions or dietary intake. Although this approach provides only statistical Science of the Total Environment 409 (2011) 5101–5110 Abbreviations: 2-FUN, Full-chain and UNcertainty Approaches for Assessing Health Risks in FUture ENvironmental Scenarios, see www.2-fun.org/; B-Pb, concentration of lead in blood; EEA, European Environment Agency: see http://www.eea.europa.eu/; ESBIO, Expert team to Support BIOmonitoring in Europe, an FP6-project: see http://www.eu-humanbiomo- nitoring.org/; INSPIRE, Infrastructure for Spatial Information in the European Community: see http://inspire.jrc.ec.europa.eu/; INTARESE, Integrated Assessment of Health Risks of Environ- mental Stressors in Europe, see www.intarese.org; FOREGS, Forum of the European Geolog- ical Surveys: see http://eusoils.jrc.ec.europa.eu/foregshmc/; GEMAS, Geochemical mapping of agricultural and grazing land soil of Europe: see http://www.edocfind.com/en/ebook/ gemas-1.html; GerES, German Environmental Survey: see http://www.umweltbundesamt. de/gesundheit-e/survey/index.htm. ⁎ Corresponding author. Tel.: +32 14 33 51 15; fax: +32 14 58 05 23. E-mail addresses: [email protected] (J. Bierkens), [email protected] (R. Smolders), [email protected] (M. Van Holderbeke), [email protected] (C. Cornelis). 0048-9697/$ – see front matter © 2011 Elsevier B.V. All rights reserved. doi:10.1016/j.scitotenv.2011.08.034 Contents lists available at SciVerse ScienceDirect Science of the Total Environment journal homepage: www.elsevier.com/locate/scitotenv
Transcript of Predicting blood lead levels from current and past environmental data in Europe

Science of the Total Environment 409 (2011) 5101–5110
Contents lists available at SciVerse ScienceDirect
Science of the Total Environment
j ourna l homepage: www.e lsev ie r .com/ locate /sc i totenv
Predicting blood lead levels from current and past environmental data in Europe
J. Bierkens ⁎, R. Smolders, M. Van Holderbeke, C. CornelisExposure and Risk Assessment Modeling, Flemish Institute for Technological Research – VITO, Vlasmeer 7, B-2400 Mol, Belgium
Abbreviations: 2-FUN, Full-chain andUNcertaintyApprin FUture ENvironmental Scenarios, see www.2-fun.org/;blood; EEA, European Environment Agency: see http://wwteamto Support BIOmonitoring in Europe, an FP6-project: senitoring.org/; INSPIRE, Infrastructure for Spatial Informationhttp://inspire.jrc.ec.europa.eu/; INTARESE, Integrated Assessmental Stressors in Europe, see www.intarese.org; FOREGSical Surveys: see http://eusoils.jrc.ec.europa.eu/foregshmc/;of agricultural and grazing land soil of Europe: see http:gemas-1.html; GerES, German Environmental Survey: seede/gesundheit-e/survey/index.htm.⁎ Corresponding author. Tel.: +32 14 33 51 15; fax: +
E-mail addresses: [email protected] (J. Bierken(R. Smolders), [email protected] (M. Van [email protected] (C. Cornelis).
0048-9697/$ – see front matter © 2011 Elsevier B.V. Alldoi:10.1016/j.scitotenv.2011.08.034
a b s t r a c t
a r t i c l e i n f oArticle history:Received 31 May 2011Accepted 17 August 2011Available online 13 September 2011
Keywords:Blood-lead levelsLead environmental concentrationsEnvironmental health impact assessmentHuman biomonitoringEuropean comparisonRegression analysis
The present case study on lead in Europe illustrates the use of the Integrated Monitoring Framework Strategyto assess the health outcome of environmental pollution by evaluating the associations between lead in var-ious environmental compartments (air, soil, dust, drinking water and diet) and lead concentrations in blood(B-Pb) for various age-related sub-populations. The case study was aimed to investigate whether environ-mental, exposure and biomonitoring data at general population level, covering all EU member states, couldbe integrated. Although blood lead has been monitored extensively in Europe, consistent datasets are notyet available. Data diverge with regard to objectives, regional scale, sampling years, gender, age groups andsample size.Significant correlations were found between B-Pb and the concentrations of Pb in air and diet. The significantdecrease of the Pb in air over time from 0.31 μg/m3 (P95: 0.94; n=98) prior to 1990 to 0.045 μg/m3 (P95:0.11; n=256) in 2007 (latest observations included) (Δ=−85%) corresponds to a decline in B-Pb by 48%and 57% in adult women and adult men, respectively. For pre-school children a more shallow decline in B-Pb of 16% was calculated over the same period. Similarly, the reduction in Pb-dietary intake from on average68.7 μg/d (P95: 161.6; n=19) in 1978 to 35.7 μg/d (P95: 82.3; n=33) in the years post 2000 (Δ=−48%) isparalleled by a decline in B-Pb of 32, 33 and 19% in adult women, primary- and pre-school children, respec-tively. Insufficient data exist for other age groups to calculate statistically significant correlations.Although regression models have been derived to predict B-Pb for different sub-populations in Europe basedon Pb concentrations in air and soil as well as dietary intake, it is concluded that the available data are insuf-ficient to accurately predict actual and future simultaneous exposure to Pb from various environmental com-partments, and as a consequence the health impact of Pb for various target populations at EU scale. At leastdue to data availability, air Pb remains the best predictor of B-Pb in the population. However, lead emissionsources have largely been reduced and inhalation of lead in air is not causal to B-Pb levels. Therefore, there isa need of adequate data for Pb in soil and house dust, and in diet and drinking water as these are causal ex-posure sources with a longer Pb half-life than air. An extended and more harmonized surveillance systemmonitoring B-Pb, especially in children, is urgently required in order to identify, quantify and reduce stillremaining sources of Pb exposure.
oaches for AssessingHealth RisksB-Pb, concentration of lead inw.eea.europa.eu/; ESBIO, Experte http://www.eu-humanbiomo-in the EuropeanCommunity: seement of Health Risks of Environ-, Forum of the European Geolog-GEMAS, Geochemical mapping//www.edocfind.com/en/ebook/http://www.umweltbundesamt.
32 14 58 05 23.s), [email protected]),
rights reserved.
© 2011 Elsevier B.V. All rights reserved.
1. Introduction
A critical component of risk assessment and regulatory decision-making is the need for reliable exposure metrics (Bonnefoi et al.,2010). Human biomonitoring provides a reliable methodology forassessing internal exposure, bridging the gap between the presence ofpollutants in the environment (and consequently external exposure)and potentially adverse health effects. Internal dosimetry is requiredfor the identification of substances of great concern (persistency, accu-mulation potential, toxicity, etc.), and also helps to identify target popu-lations (age/gender, vulnerable groups, etc). However, exposurebiomarker data require interpretation with regard to exposure sourcesto support decision-makers in taking exposure reduction measures,when required. One of the possibilities to interpret exposure bio-markers is to try to relate them to external exposures like air concentra-tions or dietary intake. Although this approach provides only statistical
5102 J. Bierkens et al. / Science of the Total Environment 409 (2011) 5101–5110
correlations and thus not necessarily reveals causal relationships, it canbe a first step, requiring relatively limited effort, to enhance the use ofbiomarker data. Aswell, significant correlations between external expo-sures and biomarker levels could be used to assess potential body burdenunder different exposure conditions, while respecting the applicationdomain of the relationships derived. To enable this statistical interpre-tation, not only reliable and consistent biomarker data are required, re-liable and consistent environmental exposures should as well beavailable. European databases with environmental information becomemore and more available and harmonization of national datasets de-velops (e.g. INSPIRE). To explore the potential of correlating exposurebiomarker data with external exposure data at European levels as ameans to predict temporal or spatial differences in body burdens, weused the heavy metal lead (Pb) as an example.
Lead (Pb) is probably the most intensively biomonitored chemicalwith continued concern about its potential health impact (Smoldersand Schoeters, 2007). Pb is an ubiquitous environmental pollutantwith a long history in human biomonitoring (HBM) programs. Proba-bly, it was and continuous to be one of the first pollutants to receivewidespread attention as a causative agent for health-related effects(Apostoli et al., 2002; Landrigan et al., 2006; Jones et al., 2009).Human biomonitoring has historically focused on determining Pbconcentrations in blood (which will be referred to as B-Pb throughoutthe remainder of the document) as B-Pb has played an important rolein the elucidation of the link between Pb in the environment andhealth effects such as loss of IQ or neurological disorders (Goyer,1996; Lanphear et al., 2006; Jones et al., 2009).
Lead is a naturally occurring heavy metal. However, industrialemissions (like around lead smelters) and – the mainly historical –use of lead in various applications (e.g. in paint, in gasoline, as plumb-ing material) have lead to local and more diffuse enrichments in theoutdoor and indoor environment. Diffuse lead emissions into airhave dropped dramatically after the ban of alkyl lead in petrol sincethe beginning of the 1980s in most European countries, while otherexposure sources were reduced drastically by imposed environmentaland product regulations (Van denHazel and Zuurbier, 2005). Howeverthese historical emissions have resulted in lead accumulation in soils,with potential transfer to the food chain (Glorennec et al., 2007). Actu-al levels of lead found in air, food, water and soil/dust vary widelythroughout theworld and depend upon the degree of industrial devel-opment, urbanization and lifestyle factors (WHO, 1985).
Exposure to lead occurs via several pathways, with the relativeimportance of each pathway depending on the lead concentration inthe different exposure media and the contact rate. Since lead wasphased out from petrol in most countries, other sources of exposurethat had previously been ignored, have become increasingly signifi-cant (ENHIS, 2009). Because of the established link between exposureto lead and cognitive development, children are considered an impor-tant and vulnerable target population. It is still necessary to furtherreduce the levels of lead in blood because there is no known safelevel in children (Landrigan et al., 2006; ENHIS, 2009).
In general, in contaminated areas lead contaminated house dust andsoil is themajor source for blood lead levels in children (Lanphear et al.,2002; Van denHazel and Zuurbier, 2005). Lead levels in dust depend onfactors such as the age and condition of housing, the use of lead-basedpaints, lead in petrol and urban density (Nielsen et al., 2001) and the(historical) presence of lead-emitting industry. For non-contaminatedareas, intake through diet and/or drinking-water will becomemore sig-nificant. Differences in exposure patterns between rural and urban re-gions are caused by differences in activity patterns, such as time spentoutdoors playing or gardening, higher contact intensity with outdoorsoil in rural areas compared to higher contact with dust in the indoorenvironment and on paved areas in urban regions, higher intake of lo-cally grown food in rural areas.
Other primary sources of lead are food and tapwater (Van denHazeland Zuurbier, 2005). Lead in tap water is largely from household
plumbing systems. Non-compliance of lead with drinking water limitsstill occurs in EU countries and intake through drinking-water thuscan constitute a significant exposure source. In non-polluted areasfood consumption may become a dominant route of exposure for lead(Van den Hazel and Zuurbier, 2005). Deposition of atmospheric lead,and to a lesser extent root uptake, may contribute to lead levels infood. Lead enters food also during some storage andmanufacturing pro-cesses (e.g., canned food). Finally, indoors childrenmay also be exposedto Pb through passive smoke (Van den Hazel and Zuurbier, 2005).
The case study reported here is a part of the effort under theINTARESE Project (Integrated Assessment of Health Risks of Environ-mental Stressors in Europe), which is a Sixth Framework Program re-search project aimed at developing and testing methods forintegrated assessment of health risks from environmental stressors.The project is in support of policy development on environment andhealth in the European Union. INTARESE develops a “full chain”meth-odological framework and a set of tools and indicators for integratedassessments that can be applied across different environmentalstressors (including pollutants and physical hazards), exposure path-ways (air, water, soil, food) and policy areas. Its aim is to review,bring together and enhance the monitoring systems needed to sup-port such analyses, including routine environmental monitoring(ground-based and Earth observation), biomonitoring and health sur-veillance. The framework, tools and data are tested and demonstratedthrough integrated assessments of exposures and health risks in anumber of specific policy areas, including transport, housing, agricul-ture, water, waste, household chemicals and climate. The major ob-jective of this case study is to find correlations between B-Pb and Pbconcentrations in various exposure media, i.e. air, soil, indoor dust,drinking water and diet and whether predictions of B-Pb levels in Eu-ropean human subpopulations can be made based on available EU-wide Pb data. For this purpose we expanded the data base on B-Pblevels previously compiled by Smolders et al. (2010) by performingan additional literature search and we collected data on Pb levels inthe various exposure media. Whereas the focus of Smolders et al.(2010) has been on individual B-Pb levels, this paper focuses on sum-mary statistics in scientific papers, reports and data bases. B-Pb dataand Pb environmental data were collected, organized and incorporatedin separate data bases and consequently matched with respect to thecountry and the year of sampling. Then a statistical analysis was per-formed to reveal trends and relationships.
2. Materials and methods
2.1. Data collection, storage and processing
Data have been collected on Pb in blood, in air, soil, house dust,drinking-water and on Pb dietary exposure with the aim to constructchronological records at country level for Europe. In general, only en-vironmental data that might affect the general population at large areincorporated in the data base with the exception of data on contami-nated areas from publications that report coupled data, i.e. data bothon B-Pb and one or more Pb concentrations in the environment. Forthis, publicly available national and international data bases and pa-pers or reports in the open or gray literature were accessed anddepending on the statistics reported, entries on mean, geometricmean, P5, P50, P90, P95, P97.5, minimum and maximumwere includ-ed for each variable. All data were stored in an Access database. De-tails on consulted sources per data type are given in paragraphs 2.2and 2.3.
Apart from information on the country/region and year of samplingwhich is included for all variables, additional information on age, gen-der and the type of study were added to the biomonitoring data when-ever available. Information on the type of diet study (duplicate meal,market basket and total diet studies) and on the type of land use(rural, urban, industrial) was registered for the dietary exposure data
5103J. Bierkens et al. / Science of the Total Environment 409 (2011) 5101–5110
and environmentalmonitoring data, respectively. Subsequently, the en-vironmental monitoring and dietary exposure data were matched withthe database-Pb data with regard to country/region and the year ofsampling.
2.2. Biomonitoring data
Blood lead biomonitoring data (B-Pb) are published in the scien-tific literature, but are as well available in reports with public or lim-ited access and in unpublished databases. We started our inventoryfrom the data collection of Smolders et al. (2010). Briefly, relevantprojects that had measured B-Pb levels in Europe were identifiedusing ESBIOs HBM Inventory database on human biomonitoring ac-tivities in Europe. Furthermore, a literature search in ISI Web ofKnowledge was performed using different combinations of the key-words “blood,” “lead,” “Pb” and “biomonitoring”. Only studies provid-ing data for European countries were withheld. Research articles,focusing on the mechanisms of B-Pb and associated health effectsand on occupational exposures were excluded. Finally, the Nationalexperts involved in the ESBIO project were contacted and asked forB-Pb data.
The data compiled by Smolders et al. (2010) were completed byperforming an additional literature and internet search and by con-tacts with partners in the EU projects INTARESE and 2-FUN. Whereasthe focus of Smolders et al. (2010) had been on raw data on individualB-Pb levels, the emphasis of this additional literature search was onsummary statistics in scientific papers, reports and data bases.
Blood lead levels were categorized according to age, country andyear of sampling. Four age groups were distinguished: adults (+18 y),secondary school children (between 13 and 18 y), primary school chil-dren(between 6 and 12 y) and preschool children (b6 years of age). Thedata were further subdivided based on gender.
2.3. Environmental data
2.3.1. AirFor the purpose of collecting Pb concentrations in air the Airbase vs3
database from the European Environment Agency (EEA) was extracted.Airbase is a public air quality database containing air quality monitoringdata formore than 35 countries throughout Europe. The air quality data-base consists of multi-annual time series of measurement data and theirstatistics for a representative selection of stations and for a number ofpollutants. It also containsmeta-information on the involvedmonitoringnetworks, their stations and their measurements. The database coversgeographically all countries from the European Union, the EEA membercountries and some EEA potential candidate countries. Airbase version 3data products are available through the EEA data service at: http://dataservice.eea.europe.eu/dataservice/metadetails.asp?id=1079. Addi-tional data for Pb concentrations in air for urban regions in North-land-Westphalia (Germany) and typical concentrations for rural, urban andsuburban regions for a number of EUmember states have been retrievedfromRanft et al. (2008) and the Voluntary Risk Assessment Report on Pb(VRAR, 2007), respectively.
2.3.2. SoilPb soil data were obtained from references cited in the VRAR (2007)
and peer reviewed publications retrieved from Science direct (http://www.sciencedirect.com) and Web of Science (http://apps.isiknowledge.com). Additionally, also the data from the FOREGS data basewere includ-ed (http://www.gsf.fi/publ/foregsatlas/). The FOREGS Geochemical Base-line Mapping Programme's main aim was to provide environmentalgeochemical baseline soil data for Europe. The data for soil, but also onsamples of stream water, stream sediment, floodplain sediment, andhumus were collected all over Europe using a for this purpose standard-ized sampling and analytical methods (Salminen et al., 1998).
2.3.3. Settled dustPb settled dust data were obtained from references cited in the
VRAR (2007) and peer reviewed publications retrieved from Sciencedirect and Web of Science. For the Flanders region of Belgium dataon Pb in were obtained from risk analyses performed at the FlemishInstitute for Technological Research – VITO itself (OVAM, 2009).
2.3.4. Drinking-waterConcentrations of Pb in drinking water were obtained from VRAR
(2007), a literature search on Science direct and Web of Science aswell as from soliciting data from drinking water companies (Belgium).Whereas some Pb dietary intake studies include drinking water as aseparate food item most of the studies collected during this survey ex-cluded the consumption of drinking water.
2.3.5. Dietary intakeDietary intake studies are based on Pb levels in food and consump-
tion patterns (VRAR, 2007). Several methods are used to estimate thedaily intake of lead in food. In individual food product studies, indi-vidual food items are sampled from retail outlets and are analyzed.Based on these Pb levels and on estimated consumption, total Pb in-take is calculated. In total diet (market basket) studies, food itemsare prepared for table consumption either individually or combinedin groups and analyzed. Lead intake is calculated as the product ofthe Pb level in the food and the amount consumed. In duplicatemeal studies, an exact duplicate of food being consumed is obtainedand analyzed (Gheorghiev, 1991).
Compilation of literature was initiated with collection of data fromsurveys of dietary intake in Europe (VRAR, 2007; SCOOP, 2004; Bierkenset al. 2007; Schönberger, 2003; deWinter-Sorkina et al., 2003). This liter-ature list was then supplemented with results from peer reviewed pub-lications retrieved from Science direct and Web of Science.
2.4. Correlation and regression analysis
Basic statistical analyses, correlation analysis, univariate regres-sion analysis were performed using the statistical package Statisticaversion 8. Statistical significance was assigned at a p-value≤0.05. Afirst step in the analysis of the data consisted of a full statistical de-scription of the separate data sets on B-Pb levels and Pb concentra-tions in air, soil and diet. Data sets were tested for normality usingKolmogorov-Smirnov statistics. Environmental data and dietary in-take data were matched with B-Pb data with respect to country andyear of sampling. Subsequently, univariate analysis for Pb-B with cov-ariates (air, soil, diet) by age group (defined under 2.1) and by genderwere performed on the matched data set.
3. Results
3.1. Data collection, storage and processing
As both the biomonitoring data and environmental data wereobtained from numerous unrelated studies many inconsistencies existwith regard to differences in sampling periods, differences in country/location, differences in age categorisation of test populations, etc. Inorder to be able to construct a dataset with matching data, assumptionswere made to fill out missing data. In case environmental or dietarydata were missing for certain sampling years for which B-Pb dataexist, theywere substitutedwith data from the year nearest to themiss-ing year. In few instances when no data for a particular matrix in a cer-tain country were available they were substituted with data from anadjacent (or nearby) country, e.g missing Pb dietary intake data forthe Czech Republic were replaced with data from its neighboring coun-try Germany on two occasions.
Soil data pose a particular challenge to match as they are oftenobtained from different regions and/or locations with different degrees
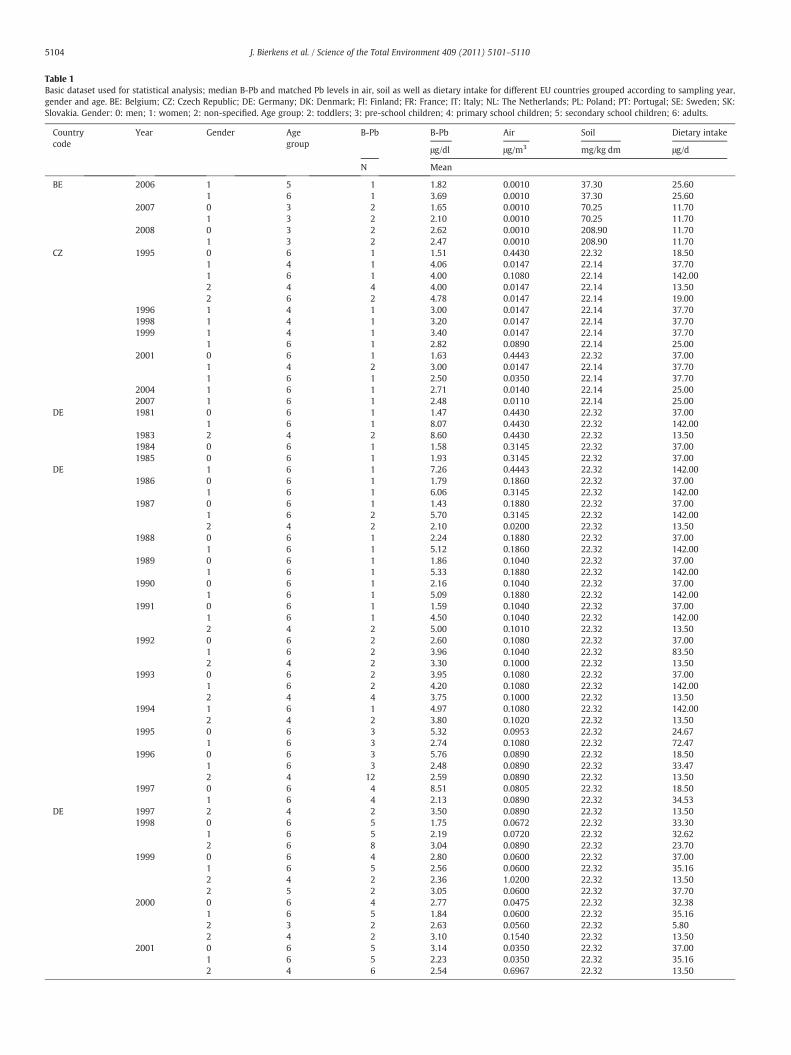
Table 1Basic dataset used for statistical analysis; median B-Pb and matched Pb levels in air, soil as well as dietary intake for different EU countries grouped according to sampling year,gender and age. BE: Belgium; CZ: Czech Republic; DE: Germany; DK: Denmark; FI: Finland; FR: France; IT: Italy; NL: The Netherlands; PL: Poland; PT: Portugal; SE: Sweden; SK:Slovakia. Gender: 0: men; 1: women; 2: non-specified. Age group: 2: toddlers; 3: pre-school children; 4: primary school children; 5: secondary school children; 6: adults.
Countrycode
Year Gender Agegroup
B-Pb B-Pb Air Soil Dietary intake
μg/dl μg/m3 mg/kg dm μg/d
N Mean
BE 2006 1 5 1 1.82 0.0010 37.30 25.601 6 1 3.69 0.0010 37.30 25.60
2007 0 3 2 1.65 0.0010 70.25 11.701 3 2 2.10 0.0010 70.25 11.70
2008 0 3 2 2.62 0.0010 208.90 11.701 3 2 2.47 0.0010 208.90 11.70
CZ 1995 0 6 1 1.51 0.4430 22.32 18.501 4 1 4.06 0.0147 22.14 37.701 6 1 4.00 0.1080 22.14 142.002 4 4 4.00 0.0147 22.14 13.502 6 2 4.78 0.0147 22.14 19.00
1996 1 4 1 3.00 0.0147 22.14 37.701998 1 4 1 3.20 0.0147 22.14 37.701999 1 4 1 3.40 0.0147 22.14 37.70
1 6 1 2.82 0.0890 22.14 25.002001 0 6 1 1.63 0.4443 22.32 37.00
1 4 2 3.00 0.0147 22.14 37.701 6 1 2.50 0.0350 22.14 37.70
2004 1 6 1 2.71 0.0140 22.14 25.002007 1 6 1 2.48 0.0110 22.14 25.00
DE 1981 0 6 1 1.47 0.4430 22.32 37.001 6 1 8.07 0.4430 22.32 142.00
1983 2 4 2 8.60 0.4430 22.32 13.501984 0 6 1 1.58 0.3145 22.32 37.001985 0 6 1 1.93 0.3145 22.32 37.00
DE 1 6 1 7.26 0.4443 22.32 142.001986 0 6 1 1.79 0.1860 22.32 37.00
1 6 1 6.06 0.3145 22.32 142.001987 0 6 1 1.43 0.1880 22.32 37.00
1 6 2 5.70 0.3145 22.32 142.002 4 2 2.10 0.0200 22.32 13.50
1988 0 6 1 2.24 0.1880 22.32 37.001 6 1 5.12 0.1860 22.32 142.00
1989 0 6 1 1.86 0.1040 22.32 37.001 6 1 5.33 0.1880 22.32 142.00
1990 0 6 1 2.16 0.1040 22.32 37.001 6 1 5.09 0.1880 22.32 142.00
1991 0 6 1 1.59 0.1040 22.32 37.001 6 1 4.50 0.1040 22.32 142.002 4 2 5.00 0.1010 22.32 13.50
1992 0 6 2 2.60 0.1080 22.32 37.001 6 2 3.96 0.1040 22.32 83.502 4 2 3.30 0.1000 22.32 13.50
1993 0 6 2 3.95 0.1080 22.32 37.001 6 2 4.20 0.1080 22.32 142.002 4 4 3.75 0.1000 22.32 13.50
1994 1 6 1 4.97 0.1080 22.32 142.002 4 2 3.80 0.1020 22.32 13.50
1995 0 6 3 5.32 0.0953 22.32 24.671 6 3 2.74 0.1080 22.32 72.47
1996 0 6 3 5.76 0.0890 22.32 18.501 6 3 2.48 0.0890 22.32 33.472 4 12 2.59 0.0890 22.32 13.50
1997 0 6 4 8.51 0.0805 22.32 18.501 6 4 2.13 0.0890 22.32 34.53
DE 1997 2 4 2 3.50 0.0890 22.32 13.501998 0 6 5 1.75 0.0672 22.32 33.30
1 6 5 2.19 0.0720 22.32 32.622 6 8 3.04 0.0890 22.32 23.70
1999 0 6 4 2.80 0.0600 22.32 37.001 6 5 2.56 0.0600 22.32 35.162 4 2 2.36 1.0200 22.32 13.502 5 2 3.05 0.0600 22.32 37.70
2000 0 6 4 2.77 0.0475 22.32 32.381 6 5 1.84 0.0600 22.32 35.162 3 2 2.63 0.0560 22.32 5.802 4 2 3.10 0.1540 22.32 13.50
2001 0 6 5 3.14 0.0350 22.32 37.001 6 5 2.23 0.0350 22.32 35.162 4 6 2.54 0.6967 22.32 13.50
5104 J. Bierkens et al. / Science of the Total Environment 409 (2011) 5101–5110
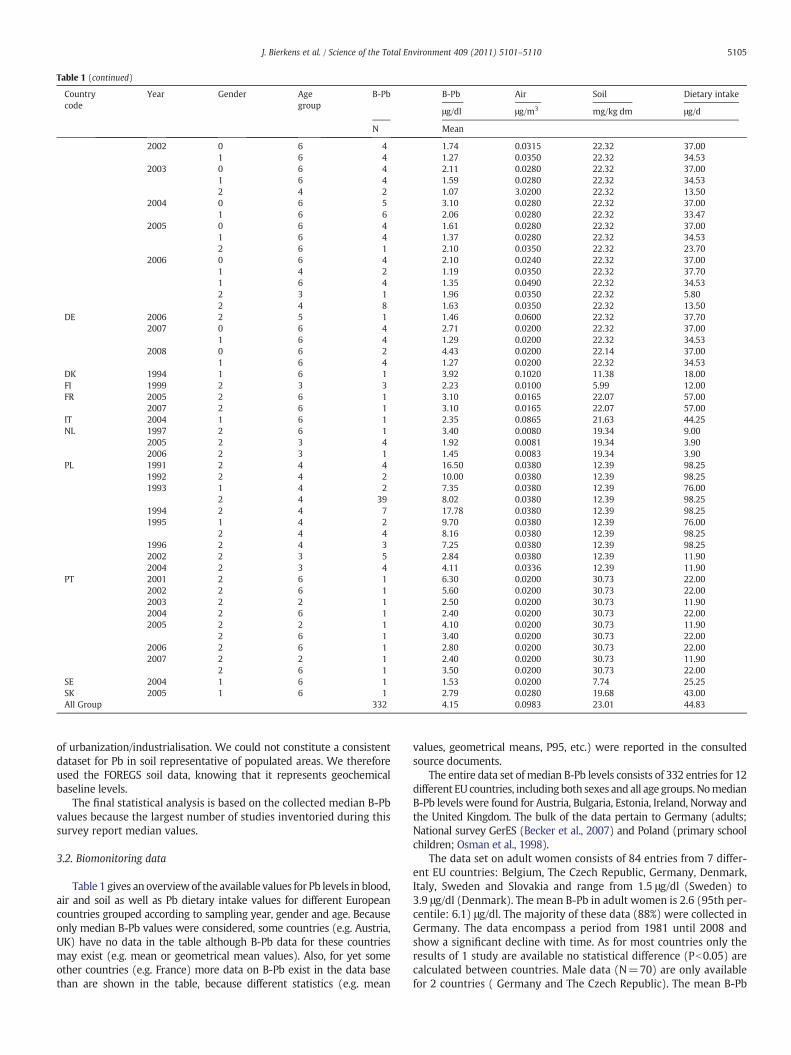
Table 1 (continued)
Countrycode
Year Gender Agegroup
B-Pb B-Pb Air Soil Dietary intake
μg/dl μg/m3 mg/kg dm μg/d
N Mean
2002 0 6 4 1.74 0.0315 22.32 37.001 6 4 1.27 0.0350 22.32 34.53
2003 0 6 4 2.11 0.0280 22.32 37.001 6 4 1.59 0.0280 22.32 34.532 4 2 1.07 3.0200 22.32 13.50
2004 0 6 5 3.10 0.0280 22.32 37.001 6 6 2.06 0.0280 22.32 33.47
2005 0 6 4 1.61 0.0280 22.32 37.001 6 4 1.37 0.0280 22.32 34.532 6 1 2.10 0.0350 22.32 23.70
2006 0 6 4 2.10 0.0240 22.32 37.001 4 2 1.19 0.0350 22.32 37.701 6 4 1.35 0.0490 22.32 34.532 3 1 1.96 0.0350 22.32 5.802 4 8 1.63 0.0350 22.32 13.50
DE 2006 2 5 1 1.46 0.0600 22.32 37.702007 0 6 4 2.71 0.0200 22.32 37.00
1 6 4 1.29 0.0200 22.32 34.532008 0 6 2 4.43 0.0200 22.14 37.00
1 6 4 1.27 0.0200 22.32 34.53DK 1994 1 6 1 3.92 0.1020 11.38 18.00FI 1999 2 3 3 2.23 0.0100 5.99 12.00FR 2005 2 6 1 3.10 0.0165 22.07 57.00
2007 2 6 1 3.10 0.0165 22.07 57.00IT 2004 1 6 1 2.35 0.0865 21.63 44.25NL 1997 2 6 1 3.40 0.0080 19.34 9.00
2005 2 3 4 1.92 0.0081 19.34 3.902006 2 3 1 1.45 0.0083 19.34 3.90
PL 1991 2 4 4 16.50 0.0380 12.39 98.251992 2 4 2 10.00 0.0380 12.39 98.251993 1 4 2 7.35 0.0380 12.39 76.00
2 4 39 8.02 0.0380 12.39 98.251994 2 4 7 17.78 0.0380 12.39 98.251995 1 4 2 9.70 0.0380 12.39 76.00
2 4 4 8.16 0.0380 12.39 98.251996 2 4 3 7.25 0.0380 12.39 98.252002 2 3 5 2.84 0.0380 12.39 11.902004 2 3 4 4.11 0.0336 12.39 11.90
PT 2001 2 6 1 6.30 0.0200 30.73 22.002002 2 6 1 5.60 0.0200 30.73 22.002003 2 2 1 2.50 0.0200 30.73 11.902004 2 6 1 2.40 0.0200 30.73 22.002005 2 2 1 4.10 0.0200 30.73 11.90
2 6 1 3.40 0.0200 30.73 22.002006 2 6 1 2.80 0.0200 30.73 22.002007 2 2 1 2.40 0.0200 30.73 11.90
2 6 1 3.50 0.0200 30.73 22.00SE 2004 1 6 1 1.53 0.0200 7.74 25.25SK 2005 1 6 1 2.79 0.0280 19.68 43.00All Group 332 4.15 0.0983 23.01 44.83
5105J. Bierkens et al. / Science of the Total Environment 409 (2011) 5101–5110
of urbanization/industrialisation. We could not constitute a consistentdataset for Pb in soil representative of populated areas. We thereforeused the FOREGS soil data, knowing that it represents geochemicalbaseline levels.
The final statistical analysis is based on the collected median B-Pbvalues because the largest number of studies inventoried during thissurvey report median values.
3.2. Biomonitoring data
Table 1 gives an overviewof the available values for Pb levels in blood,air and soil as well as Pb dietary intake values for different Europeancountries grouped according to sampling year, gender and age. Becauseonly median B-Pb values were considered, some countries (e.g. Austria,UK) have no data in the table although B-Pb data for these countriesmay exist (e.g. mean or geometrical mean values). Also, for yet someother countries (e.g. France) more data on B-Pb exist in the data basethan are shown in the table, because different statistics (e.g. mean
values, geometrical means, P95, etc.) were reported in the consultedsource documents.
The entire data set of median B-Pb levels consists of 332 entries for 12different EU countries, includingboth sexes and all age groups. NomedianB-Pb levels were found for Austria, Bulgaria, Estonia, Ireland, Norway andthe United Kingdom. The bulk of the data pertain to Germany (adults;National survey GerES (Becker et al., 2007) and Poland (primary schoolchildren; Osman et al., 1998).
The data set on adult women consists of 84 entries from 7 differ-ent EU countries: Belgium, The Czech Republic, Germany, Denmark,Italy, Sweden and Slovakia and range from 1.5 μg/dl (Sweden) to3.9 μg/dl (Denmark). The mean B-Pb in adult women is 2.6 (95th per-centile: 6.1) μg/dl. The majority of these data (88%) were collected inGermany. The data encompass a period from 1981 until 2008 andshow a significant decline with time. As for most countries only theresults of 1 study are available no statistical difference (Pb0.05) arecalculated between countries. Male data (N=70) are only availablefor 2 countries ( Germany and The Czech Republic). The mean B-Pb
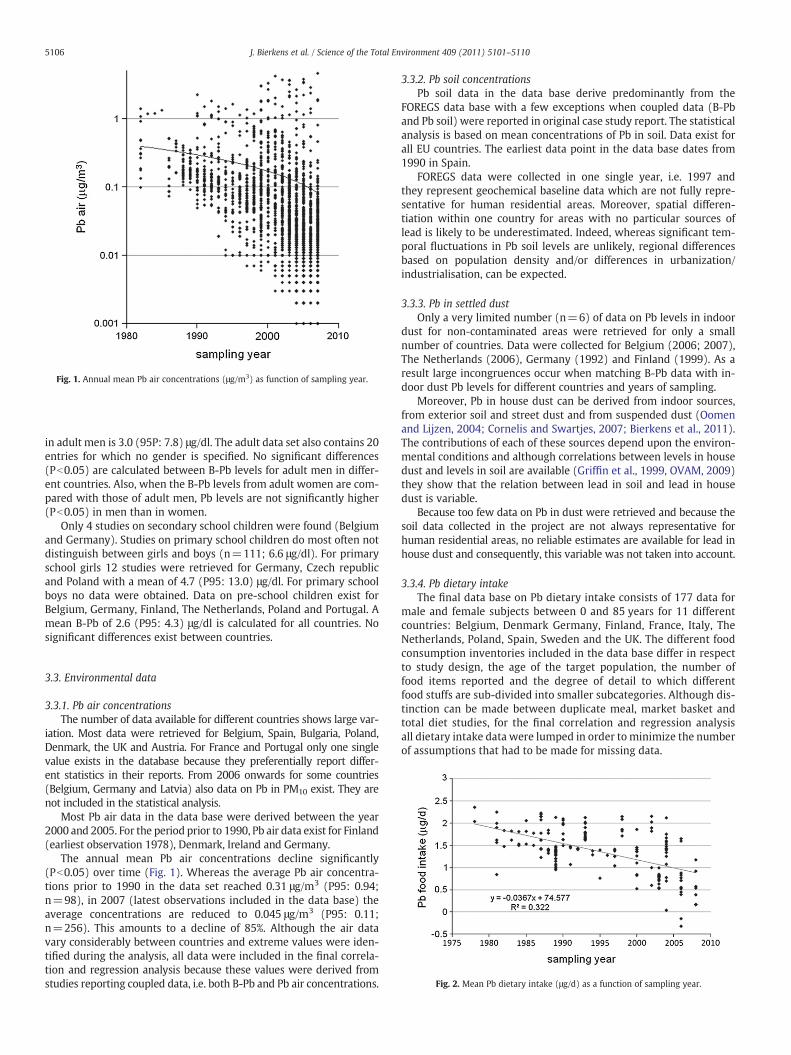
Fig. 1. Annual mean Pb air concentrations (μg/m3) as function of sampling year.
5106 J. Bierkens et al. / Science of the Total Environment 409 (2011) 5101–5110
in adult men is 3.0 (95P: 7.8) μg/dl. The adult data set also contains 20entries for which no gender is specified. No significant differences(Pb0.05) are calculated between B-Pb levels for adult men in differ-ent countries. Also, when the B-Pb levels from adult women are com-pared with those of adult men, Pb levels are not significantly higher(Pb0.05) in men than in women.
Only 4 studies on secondary school children were found (Belgiumand Germany). Studies on primary school children do most often notdistinguish between girls and boys (n=111; 6.6 μg/dl). For primaryschool girls 12 studies were retrieved for Germany, Czech republicand Poland with a mean of 4.7 (P95: 13.0) μg/dl. For primary schoolboys no data were obtained. Data on pre-school children exist forBelgium, Germany, Finland, The Netherlands, Poland and Portugal. Amean B-Pb of 2.6 (P95: 4.3) μg/dl is calculated for all countries. Nosignificant differences exist between countries.
Fig. 2. Mean Pb dietary intake (μg/d) as a function of sampling year.
3.3. Environmental data
3.3.1. Pb air concentrationsThe number of data available for different countries shows large var-
iation. Most data were retrieved for Belgium, Spain, Bulgaria, Poland,Denmark, the UK and Austria. For France and Portugal only one singlevalue exists in the database because they preferentially report differ-ent statistics in their reports. From 2006 onwards for some countries(Belgium, Germany and Latvia) also data on Pb in PM10 exist. They arenot included in the statistical analysis.
Most Pb air data in the data base were derived between the year2000 and 2005. For the period prior to 1990, Pb air data exist for Finland(earliest observation 1978), Denmark, Ireland and Germany.
The annual mean Pb air concentrations decline significantly(Pb0.05) over time (Fig. 1). Whereas the average Pb air concentra-tions prior to 1990 in the data set reached 0.31 μg/m3 (P95: 0.94;n=98), in 2007 (latest observations included in the data base) theaverage concentrations are reduced to 0.045 μg/m3 (P95: 0.11;n=256). This amounts to a decline of 85%. Although the air datavary considerably between countries and extreme values were iden-tified during the analysis, all data were included in the final correla-tion and regression analysis because these values were derived fromstudies reporting coupled data, i.e. both B-Pb and Pb air concentrations.
3.3.2. Pb soil concentrationsPb soil data in the data base derive predominantly from the
FOREGS data base with a few exceptions when coupled data (B-Pband Pb soil) were reported in original case study report. The statisticalanalysis is based on mean concentrations of Pb in soil. Data exist forall EU countries. The earliest data point in the data base dates from1990 in Spain.
FOREGS data were collected in one single year, i.e. 1997 andthey represent geochemical baseline data which are not fully repre-sentative for human residential areas. Moreover, spatial differen-tiation within one country for areas with no particular sources oflead is likely to be underestimated. Indeed, whereas significant tem-poral fluctuations in Pb soil levels are unlikely, regional differencesbased on population density and/or differences in urbanization/industrialisation, can be expected.
3.3.3. Pb in settled dustOnly a very limited number (n=6) of data on Pb levels in indoor
dust for non-contaminated areas were retrieved for only a smallnumber of countries. Data were collected for Belgium (2006; 2007),The Netherlands (2006), Germany (1992) and Finland (1999). As aresult large incongruences occur when matching B-Pb data with in-door dust Pb levels for different countries and years of sampling.
Moreover, Pb in house dust can be derived from indoor sources,from exterior soil and street dust and from suspended dust (Oomenand Lijzen, 2004; Cornelis and Swartjes, 2007; Bierkens et al., 2011).The contributions of each of these sources depend upon the environ-mental conditions and although correlations between levels in housedust and levels in soil are available (Griffin et al., 1999, OVAM, 2009)they show that the relation between lead in soil and lead in housedust is variable.
Because too few data on Pb in dust were retrieved and because thesoil data collected in the project are not always representative forhuman residential areas, no reliable estimates are available for lead inhouse dust and consequently, this variable was not taken into account.
3.3.4. Pb dietary intakeThe final data base on Pb dietary intake consists of 177 data for
male and female subjects between 0 and 85 years for 11 differentcountries: Belgium, Denmark Germany, Finland, France, Italy, TheNetherlands, Poland, Spain, Sweden and the UK. The different foodconsumption inventories included in the data base differ in respectto study design, the age of the target population, the number offood items reported and the degree of detail to which differentfood stuffs are sub-divided into smaller subcategories. Although dis-tinction can be made between duplicate meal, market basket andtotal diet studies, for the final correlation and regression analysisall dietary intake data were lumped in order to minimize the numberof assumptions that had to be made for missing data.
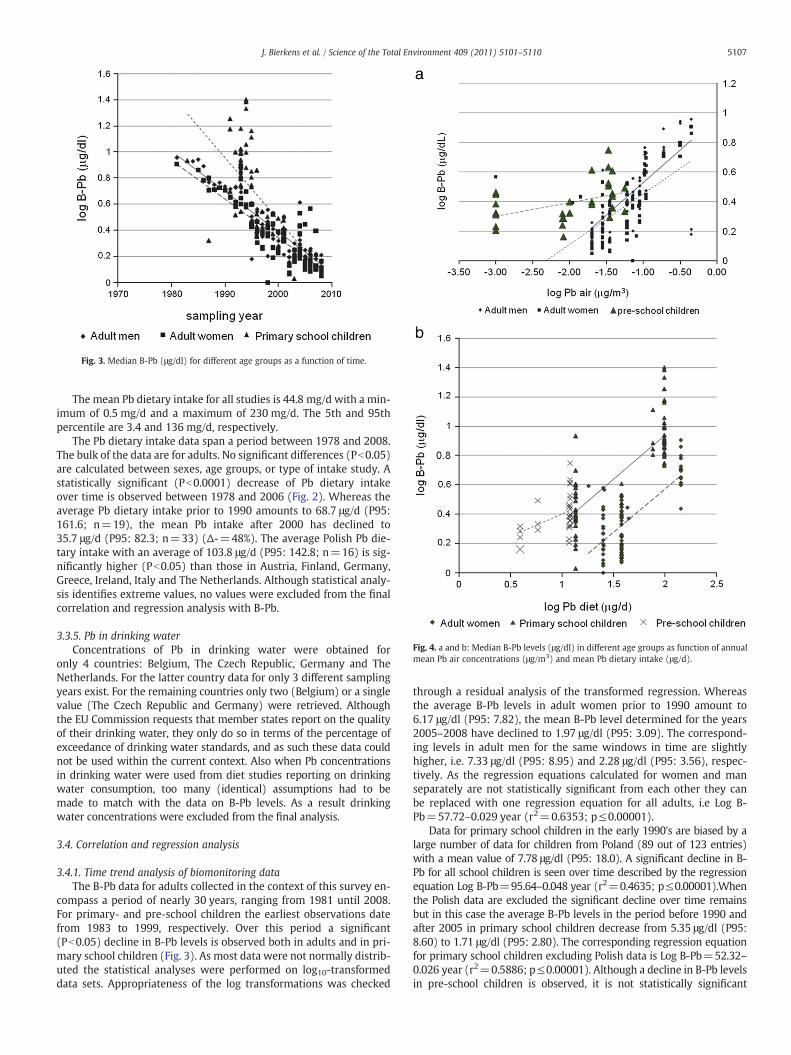
Fig. 4. a and b: Median B-Pb levels (μg/dl) in different age groups as function of annualmean Pb air concentrations (μg/m3) and mean Pb dietary intake (μg/d).
Fig. 3. Median B-Pb (μg/dl) for different age groups as a function of time.
5107J. Bierkens et al. / Science of the Total Environment 409 (2011) 5101–5110
The mean Pb dietary intake for all studies is 44.8 mg/d with a min-imum of 0.5 mg/d and a maximum of 230 mg/d. The 5th and 95thpercentile are 3.4 and 136 mg/d, respectively.
The Pb dietary intake data span a period between 1978 and 2008.The bulk of the data are for adults. No significant differences (Pb0.05)are calculated between sexes, age groups, or type of intake study. Astatistically significant (Pb0.0001) decrease of Pb dietary intakeover time is observed between 1978 and 2006 (Fig. 2). Whereas theaverage Pb dietary intake prior to 1990 amounts to 68.7 μg/d (P95:161.6; n=19), the mean Pb intake after 2000 has declined to35.7 μg/d (P95: 82.3; n=33) (Δ-=48%). The average Polish Pb die-tary intake with an average of 103.8 μg/d (P95: 142.8; n=16) is sig-nificantly higher (Pb0.05) than those in Austria, Finland, Germany,Greece, Ireland, Italy and The Netherlands. Although statistical analy-sis identifies extreme values, no values were excluded from the finalcorrelation and regression analysis with B-Pb.
3.3.5. Pb in drinking waterConcentrations of Pb in drinking water were obtained for
only 4 countries: Belgium, The Czech Republic, Germany and TheNetherlands. For the latter country data for only 3 different samplingyears exist. For the remaining countries only two (Belgium) or a singlevalue (The Czech Republic and Germany) were retrieved. Althoughthe EU Commission requests that member states report on the qualityof their drinking water, they only do so in terms of the percentage ofexceedance of drinking water standards, and as such these data couldnot be used within the current context. Also when Pb concentrationsin drinking water were used from diet studies reporting on drinkingwater consumption, too many (identical) assumptions had to bemade to match with the data on B-Pb levels. As a result drinkingwater concentrations were excluded from the final analysis.
3.4. Correlation and regression analysis
3.4.1. Time trend analysis of biomonitoring dataThe B-Pb data for adults collected in the context of this survey en-
compass a period of nearly 30 years, ranging from 1981 until 2008.For primary- and pre-school children the earliest observations datefrom 1983 to 1999, respectively. Over this period a significant(Pb0.05) decline in B-Pb levels is observed both in adults and in pri-mary school children (Fig. 3). As most data were not normally distrib-uted the statistical analyses were performed on log10-transformeddata sets. Appropriateness of the log transformations was checked
through a residual analysis of the transformed regression. Whereasthe average B-Pb levels in adult women prior to 1990 amount to6.17 μg/dl (P95: 7.82), the mean B-Pb level determined for the years2005–2008 have declined to 1.97 μg/dl (P95: 3.09). The correspond-ing levels in adult men for the same windows in time are slightlyhigher, i.e. 7.33 μg/dl (P95: 8.95) and 2.28 μg/dl (P95: 3.56), respec-tively. As the regression equations calculated for women and manseparately are not statistically significant from each other they canbe replaced with one regression equation for all adults, i.e Log B-Pb=57.72–0.029 year (r2=0.6353; p≤0.00001).
Data for primary school children in the early 1990's are biased by alarge number of data for children from Poland (89 out of 123 entries)with a mean value of 7.78 μg/dl (P95: 18.0). A significant decline in B-Pb for all school children is seen over time described by the regressionequation Log B-Pb=95.64–0.048 year (r2=0.4635; p≤0.00001).Whenthe Polish data are excluded the significant decline over time remainsbut in this case the average B-Pb levels in the period before 1990 andafter 2005 in primary school children decrease from 5.35 μg/dl (P95:8.60) to 1.71 μg/dl (P95: 2.80). The corresponding regression equationfor primary school children excluding Polish data is Log B-Pb=52.32–0.026 year (r2=0.5886; p≤0.00001). Although a decline in B-Pb levelsin pre-school children is observed, it is not statistically significant
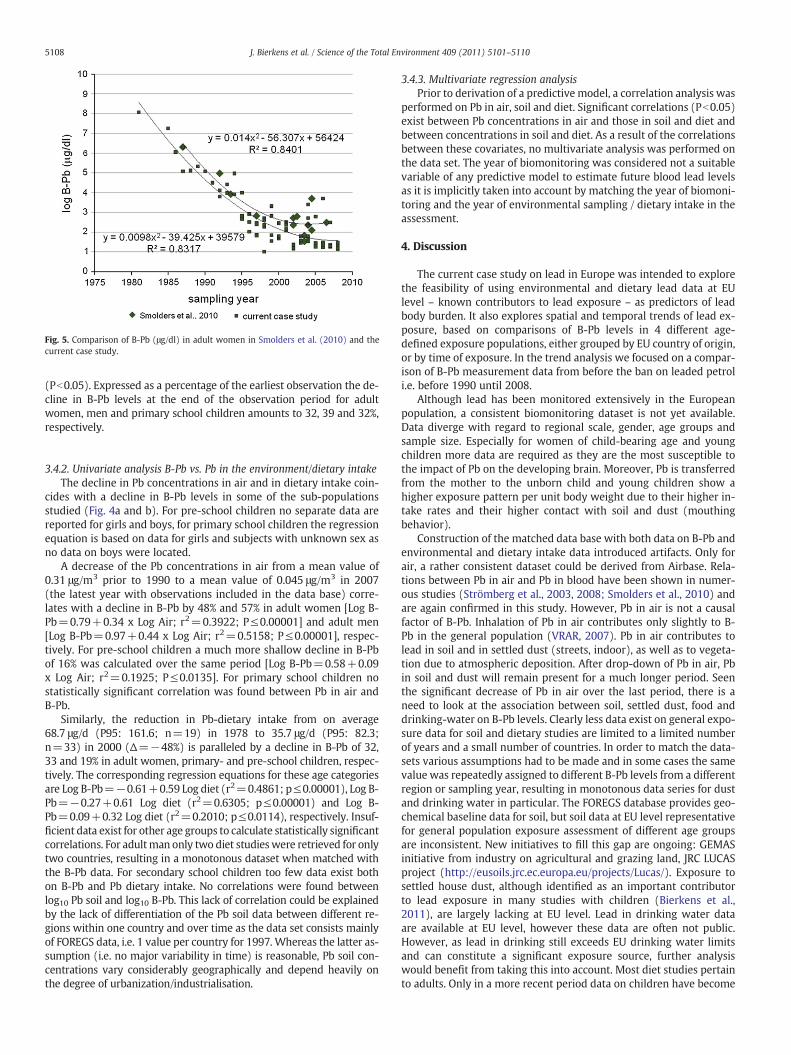
Fig. 5. Comparison of B-Pb (μg/dl) in adult women in Smolders et al. (2010) and thecurrent case study.
5108 J. Bierkens et al. / Science of the Total Environment 409 (2011) 5101–5110
(Pb0.05). Expressed as a percentage of the earliest observation the de-cline in B-Pb levels at the end of the observation period for adultwomen, men and primary school children amounts to 32, 39 and 32%,respectively.
3.4.2. Univariate analysis B-Pb vs. Pb in the environment/dietary intakeThe decline in Pb concentrations in air and in dietary intake coin-
cides with a decline in B-Pb levels in some of the sub-populationsstudied (Fig. 4a and b). For pre-school children no separate data arereported for girls and boys, for primary school children the regressionequation is based on data for girls and subjects with unknown sex asno data on boys were located.
A decrease of the Pb concentrations in air from a mean value of0.31 μg/m3 prior to 1990 to a mean value of 0.045 μg/m3 in 2007(the latest year with observations included in the data base) corre-lates with a decline in B-Pb by 48% and 57% in adult women [Log B-Pb=0.79+0.34 x Log Air; r2=0.3922; P≤0.00001] and adult men[Log B-Pb=0.97+0.44 x Log Air; r2=0.5158; P≤0.00001], respec-tively. For pre-school children a much more shallow decline in B-Pbof 16% was calculated over the same period [Log B-Pb=0.58+0.09x Log Air; r2=0.1925; P≤0.0135]. For primary school children nostatistically significant correlation was found between Pb in air andB-Pb.
Similarly, the reduction in Pb-dietary intake from on average68.7 μg/d (P95: 161.6; n=19) in 1978 to 35.7 μg/d (P95: 82.3;n=33) in 2000 (Δ=−48%) is paralleled by a decline in B-Pb of 32,33 and 19% in adult women, primary- and pre-school children, respec-tively. The corresponding regression equations for these age categoriesare Log B-Pb=−0.61+0.59 Log diet (r2=0.4861; p≤0.00001), Log B-Pb=−0.27+0.61 Log diet (r2=0.6305; p≤0.00001) and Log B-Pb=0.09+0.32 Log diet (r2=0.2010; p≤0.0114), respectively. Insuf-ficient data exist for other age groups to calculate statistically significantcorrelations. For adultman only two diet studieswere retrieved for onlytwo countries, resulting in a monotonous dataset when matched withthe B-Pb data. For secondary school children too few data exist bothon B-Pb and Pb dietary intake. No correlations were found betweenlog10 Pb soil and log10 B-Pb. This lack of correlation could be explainedby the lack of differentiation of the Pb soil data between different re-gions within one country and over time as the data set consists mainlyof FOREGS data, i.e. 1 value per country for 1997. Whereas the latter as-sumption (i.e. no major variability in time) is reasonable, Pb soil con-centrations vary considerably geographically and depend heavily onthe degree of urbanization/industrialisation.
3.4.3. Multivariate regression analysisPrior to derivation of a predictive model, a correlation analysis was
performed on Pb in air, soil and diet. Significant correlations (Pb0.05)exist between Pb concentrations in air and those in soil and diet andbetween concentrations in soil and diet. As a result of the correlationsbetween these covariates, no multivariate analysis was performed onthe data set. The year of biomonitoring was considered not a suitablevariable of any predictive model to estimate future blood lead levelsas it is implicitly taken into account by matching the year of biomoni-toring and the year of environmental sampling / dietary intake in theassessment.
4. Discussion
The current case study on lead in Europe was intended to explorethe feasibility of using environmental and dietary lead data at EUlevel – known contributors to lead exposure – as predictors of leadbody burden. It also explores spatial and temporal trends of lead ex-posure, based on comparisons of B-Pb levels in 4 different age-defined exposure populations, either grouped by EU country of origin,or by time of exposure. In the trend analysis we focused on a compar-ison of B-Pb measurement data from before the ban on leaded petroli.e. before 1990 until 2008.
Although lead has been monitored extensively in the Europeanpopulation, a consistent biomonitoring dataset is not yet available.Data diverge with regard to regional scale, gender, age groups andsample size. Especially for women of child-bearing age and youngchildren more data are required as they are the most susceptible tothe impact of Pb on the developing brain. Moreover, Pb is transferredfrom the mother to the unborn child and young children show ahigher exposure pattern per unit body weight due to their higher in-take rates and their higher contact with soil and dust (mouthingbehavior).
Construction of the matched data base with both data on B-Pb andenvironmental and dietary intake data introduced artifacts. Only forair, a rather consistent dataset could be derived from Airbase. Rela-tions between Pb in air and Pb in blood have been shown in numer-ous studies (Strömberg et al., 2003, 2008; Smolders et al., 2010) andare again confirmed in this study. However, Pb in air is not a causalfactor of B-Pb. Inhalation of Pb in air contributes only slightly to B-Pb in the general population (VRAR, 2007). Pb in air contributes tolead in soil and in settled dust (streets, indoor), as well as to vegeta-tion due to atmospheric deposition. After drop-down of Pb in air, Pbin soil and dust will remain present for a much longer period. Seenthe significant decrease of Pb in air over the last period, there is aneed to look at the association between soil, settled dust, food anddrinking-water on B-Pb levels. Clearly less data exist on general expo-sure data for soil and dietary studies are limited to a limited numberof years and a small number of countries. In order to match the data-sets various assumptions had to be made and in some cases the samevalue was repeatedly assigned to different B-Pb levels from a differentregion or sampling year, resulting in monotonous data series for dustand drinking water in particular. The FOREGS database provides geo-chemical baseline data for soil, but soil data at EU level representativefor general population exposure assessment of different age groupsare inconsistent. New initiatives to fill this gap are ongoing: GEMASinitiative from industry on agricultural and grazing land, JRC LUCASproject (http://eusoils.jrc.ec.europa.eu/projects/Lucas/). Exposure tosettled house dust, although identified as an important contributorto lead exposure in many studies with children (Bierkens et al.,2011), are largely lacking at EU level. Lead in drinking water dataare available at EU level, however these data are often not public.However, as lead in drinking still exceeds EU drinking water limitsand can constitute a significant exposure source, further analysiswould benefit from taking this into account. Most diet studies pertainto adults. Only in a more recent period data on children have become
5109J. Bierkens et al. / Science of the Total Environment 409 (2011) 5101–5110
available. Also, different dietary consumption inventories show large dif-ferences in respect to study design, the age categorisation that appliesand the total life span that is covered. Also the number of food itemsreported and the degree of detail to which different food stuffs are sub-divided into smaller subcategories varies between studies. The EuropeanFood Safety Agency (EFSA) initiated a harmonization initiative for foodconsumption data and requires EU countries to submit levels of chemi-cals in food. Concise food consumption data for children and adultswere published on the EFSA's website (http://www.efsa.europa.eu/en/datexfoodcdb/datexfooddb.htm; last accessed on 24/05/2011). Newlypublished EFSA dietary intake studies will provide better data for inte-gration with biomarker data. However, these studies seem to revealonly differences in consumption patterns between countries, but not dif-ferences in levels as often a EU concentration data set is constructed fromnationally reported data (e.g. PFOS, cadmium).
The B-Pbdata collected in the context of this survey encompass a pe-riod of nearly 30 years from 1981 until 2008 for 12 different EU coun-tries, including both sexes and all age groups with the exception ofnewborns. NomedianB-Pb levelswere found for Austria, Bulgaria, Esto-nia, Ireland, Norway and the United Kingdom. The observed decrease ofB-Pb levels over time is a consequence of legal prohibition and restric-tion of leaded petrol. As Pb levels in ambient air have decreased duringthe last decades, the relative contribution of other exposure routes suchas soil and dust ingestion, drinking water consumption and dietary ex-posure to ambient Pb exposure have increased. This cannot be inferredfrom this study as only a limitednumber of coupled blood/environmentaldata sets exist and too many assumptions have been made resulting inmonotonous data series for some input variables such as soil, dust anddrinkingwater. Insufficient data ondust and drinkingwaterwere collect-ed, and so far no extrapolationsweremade to extrapolate fromone com-partment to the other. Moreover, because significant correlations existbetween the various covariates only univariate regression models werederivedwhich allow to predict B-Pb based on Pb concentrations in eitherair soil or dietary intake.
The time-dependent decrease in concentrations of B-Pb observedin the current case study agrees with results of the previous surveypublished by Smolders et al. (2010) (Fig. 5). Smolders et al. (2010)observed that the relative decrease in B-Pb levels across the eight na-tional B-Pb datasets collected in their case study is fast in the late1980s, while it appears to slow down in the first decade of the 21thcentury. They conclude that the decreasing environmental Pb concen-trations are reflected in B-Pb levels that seem to reach a steady statewhich is set around a B-Pb value of 2.0–2.5 μg/dl. Strömberg et al.(2003) also proposed a convergence level close to 2.0 μg/dl, but re-cent sampling campaigns by these authors have shown that the B-Pb levels have continued to decrease during recent years (Strömberget al., 2008). A mean value of 1.97 μg/dl from our survey cannot con-firm this latter finding.
The median adult male B-Pb levels in our dataset are slightly butnot significantly higher than the female values (3.0 vs. 2.6 μg/dl). Incontrast Smolders et al. (2010) compiled significant gender-relateddifferences in B-Pb levels, with women having B-Pb levels about20–30% lower than men (Christensen, 1995; Kristiansen et al., 1997;Clark et al., 2007). Finally, although the age of the participant is gen-erally found to be an important determinant, with B-Pb levels in-creasing with age (Apostoli et al., 2002; Clark et al., 2007), no suchage-related increase is evident from the current dataset.
5. Conclusions
The case study on lead in Europe illustrates the Integrated Monitor-ing Framework by evaluating the associations between environmentalmonitoring data – including dietary intake – and biomonitoring dataon lead. The case study was aimed at integrating data at populationlevel, covering all EU member states. Although various trends and cor-relations have been revealed it becomes clear that, although quite
some data are available, they lack consistency. Data are still too oftencollected at an ad hoc basis, i.e. when potential exposure linked tolocal calamities or emerging or neglected sources of exposure. Especial-ly data on two very important exposure pathways for children (vulner-able group for Pb exposure), i.e. dust and drinking water are largelylacking. There is a clear need for more detailed monitoring networksto cover the whole of Europe. Only concentrations of Pb in air are suffi-ciently covered, and even refinements aremade be it for a limited num-ber of countries, e.g. from 2006 onwards data on Pb in PM10 areincluded in the Airbase data base for a few countries because of the di-rect link between the size of particles and the extent of exposure. Fur-thermore, apart from the availability of data there exists also a clearlack in comparability of the collected B-Pb data across Europe. All toooften different statistics are reported in different case studies for differ-ently defined test populations, food items, etc. so that there is a clearlack of coherence. As a general conclusion, there is a need for EU harmo-nized and accessible data collection in environmental and other exposuremedia (food, drinking water), designed to enable exposure assessmentsand integration with exposure and health data. This would allow to re-veal associations and patterns at EU level and use these data for exposureand risk management.
Acknowledgments
This research has been performed within the context of the EUfunded Integrated Research Project INTARESE (Integrated Assessmentof Health Risks of Environmental Stressors in Europe, see www.intarese.org).
References
Apostoli P, Baj A, Bavazzano P, Ganzi A, Neri G, Ronchi A, et al. Blood lead referencevalues: the results of an Italian polycentric study. Sci Total Environ 2002;287:1-11.
Becker K, Müssig-ZufikaM, Lüdecke A, Schulz C, Seiwert M, Kolossa-Gehring M. Kinder-Umwelt Survey 2003-06-KUS-Human-Biomonitoring-Stoffgehalte in Blut und Urinder Kinder in Deutschland. WaBuoLu-Heft 07. Berlin: UBA; 2007.
Bierkens J, De Raeymaecker B, Cornelis C, Hooghe R, Verbeiren S. Voorstel voor herzien-ing bodemsaneringsnormen voor lood. (Proposal for revised soil standards forlead)Mol: Vito; 2007.. (In Dutch).
Bierkens J, Van Holderbeke M, Cornelis C, Torfs R. Exposure through soil and dust in-gestion. In: Swartjens F, editor. Book on contaminated sites — from theory to prac-tice. Berlin: Springer; 2011. p. 261–86.
Bonnefoi MS, Devlin DJ, Doerrer NG, Embry MR, Fukushima S, Harpur ES, et al. Humanand environmental health challenges for the next decade (2010–2020). Crit RevToxicol 2010;40:893–911.
Christensen JM. Human exposure to toxic metals— factors influencing interpretation ofbiomonitoring results. Sci Total Environ 1995;166:89-135.
Clark NA, Teschke K, Rideout K, Copes R. Trace element levels in adults from the westcoast of Canada and associations with age, gender, diet, activities, and levels ofother trace elements. Chemosphere 2007;70:155–64.
Cornelis C, Swartjes FA. Ontwikkeling van een geharmoniseerde methodiek voorbeoordeling van gezondheidsrisico's door bodemverontreiniging in de Kempenre-gio. Development of a harmonised method for the assessment of soil contamina-tion in the Campine region. Mol/Bilthoven: VITO/RIVM; 2007.. (in Dutch).
deWinter-SorkinaR, BakkerMI, vanDonkersgoedG, vanKlaveren JD.Dietary intake of heavymetals (cadmium, lead and mercury) by the Dutch population. Bilthoven: RIVM;2003http://rivm.openrepository.com/rivm/bitstream/10029/8887/1/320103001.pdf.last accessed 1 April 2011.
ENHIS – Environment and Health Information System Blood levels in children. GerES IIGerman environmental survey 1990/92. Geneva: World Health Organisation;2009http://www.umweltbundesamt.de/gesundheit-e/survey/us9092/blut.htm.last accessed 1 April 2011.
Gheorghiev GK. Monitoring systems for the assessment of dietary intakes of contami-nants. In: Tardiff RG, Goldstein B, editors. Methods for assessing exposure ofhuman and non-human biota. Chichester: John Wiley & Sons; 1991. p. 233–48.
Glorennec P, Bemrah N, Tard A, Robin A, Le Bot B, Bard D. Probabilistic modelling ofyoung children's overall lead exposure in France: integrated approach for variousexposure media. Environ Int 2007;33:937–45.
Goyer RA. Results of lead research: prenatal exposure and neurological consequences.Environ Health Perspect 1996;104:1050–4.
Griffin S, Goodrum PE, Diamond GL, Meylan W, Brattin WJ, Hassett JM. Application of aprobabilistic risk assessment methodology to a lead smelter site. Hum Ecol Risk As-sess 1999;5:845–68.
Jones RL, Horna DM, Meyer PA, Brody DJ, Caldwell KL, Pirkle JL, et al. Trends in bloodlead levels and blood lead testing among US children aged 1 to 5 years, 1988–2004. Pediatrics 2009;123:e376–85.
5110 J. Bierkens et al. / Science of the Total Environment 409 (2011) 5101–5110
Kristiansen J, Christensen JM, Iversen BS, Sabbioni E. Toxic trace elements referencelevels in blood and urine: influence of gender and lifestyle factors. Sci Total Environ1997;204:147–60.
Landrigan P, Nordberg M, Lucchini R, Nordberg G, Grandjean P, Iregren A, et al. Thedeclaration of Brescia on prevention of the neurotoxicity of metals. Am J Ind Med2006;50:709–11.
Lanphear BP, Hornung R, Ho M, Howard CR, Eberly S, Knauf K. Environmental lead ex-posure during early childhood. J Pediatr 2002;140:40–7.
Lanphear BP, Hornung R, Khoury J, Yolton K, Baghurst P, Bellinger DC, et al. Low-levelenvironmental lead exposure and children's intellectual function: an internationalpooled analysis. Environ Health Perspect 2006;113:894–9.
Nielsen E, Thorup I, Schnipper A, Hass U, Meyer O, Ladefoged O, et al. Children and theunborn child (project no. 589). Kopenhagen: Danish EPA Environmental; 2001.
Oomen AG, Lijzen JPA. RIVM report 711701037/2004. Relevancy of human exposurevia house dust to the contaminants lead and asbestos. Bilthoven: RIVM; 2004.
Osman K, Schütz A, Akesson B, Maciag A, Vahter M. Interactions between essential and toxicelements in lead exposed children in Katowice, Poland. Clin Biochem 1998;31:657–65.
OVAM (Openbare Vlaamse Afvalstoffenmaatschappij). Bloodstellingsonderzoek naarlood in Hoboken (Exposure assessment for lead in Hohoken). Mechelen: OVAM;2009.. (In Dutch).
Ranft U, Delschen T, Machtolf M, Sugiri D, WilhelmM. Lead concentrations in the bloodof children and its association with lead in soil and ambient air — trends between1983 and 2000 in Duisburg. J Toxicol Environ Health A 2008;71:710–5.
Salminen R, Tarvainen T, Demetriades A, Duris M, Fordyce FM, Gregorauskiene V, et al.FOREGS geochemical mapping. Field manual, 47. Geologian tutkimuskeskus, Opas -Geological Survey of Finland, Guide; 1998.
Schönberger G. Zusammenhang zwischen Ernährungsweise undGehalt an Schadstoffen imBlut. (Correlation between feeding habits and the concentrations of toxic substances in
blood)Gießen: Justus-Liebig-Universität Gießen; 2003http://deposit.ddb.de/cgi-bin/dokserv?idn=967865891&dok_var=d1&dok_ext=pdf&filename=967865891.pdf..last accessed 1 April 2011 5 (In German).
SCOOP. Assessment of the dietary exposure to arsenic, cadmium, lead and mercury of thepopulation of the EUmember states. Reports on tasks for scientific cooperation. Brus-sels: DGHealth and consumer protection; 2004http://ec.europa.eu/food/food/chemi-calsafety/contaminants/scoop_3-2-11_heavy_metals_report_en.pdf. Last accessed 1April 2011.
Smolders R, Schoeters G. Identifying opportunities and gaps for establishing an inte-grated EDR-triad at a European level. Int J Hyg Environ Health 2007;210:253–7.
Smolders R, Alimonti A, Cerna M, Den Hond E, Kristiansen J, Palkovicova L, et al. Avail-ability and comparability of human biomonitoring data across Europe: a case-study on blood-lead levels. Sci Total Environ 2010;408:1437–45.
Strömberg U, Lundh T, Schutz A, Skerfving S. Yearly measurements of blood lead inSwedish children since 1978: an update focusing on the petrol lead free period1995–2001. Occup Environ Med 2003;60:370–2.
Strömberg U, Lundh T, Skerfving S. Yearly measurements of blood lead in Swedish chil-dren since 1978: the declining trend continues in the petrol-lead-free period1995–2007. Environ Res 2008;107:332–5.
Van den Hazel P, Zuurbier M, editors. PINCHE project: final report WP1 exposure as-sessment. Arnhem: Public Health Services Gelderland Midden; 2005.
VRAR. Voluntary risk assessment report on lead and some lead compounds, humanhealth section, interim revised draft status. . 05/07/07http://www.chem.unep.ch/Pb_and_Cd/SR/GOV/VRAR_Pb_0707_hh.pdf. Last accessed 1 April 2011.
WHO. Environmental health criteria, no. 165: Lead. Genève: World Health Organization;1985.