Pre-Certified Local Housing Data - CA.gov
22
AUGUST 2020 PRE-CERTIFIED LOCAL HOUSING DATA FOR THE CITY OF TUSTIN
-
Upload
khangminh22 -
Category
Documents
-
view
3 -
download
0
Transcript of Pre-Certified Local Housing Data - CA.gov

AUGUST 2020
PRE-CERTIFIED
LOCAL HOUSING DATA
FOR THE CITY OF TUSTIN
TABLE OF CONTENTS
I. POPULATION, EMPLOYMENT, AND HOUSEHOLDS
II. SPECIALIZED HOUSEHOLD NEEDS: LARGE FAMILIES, SENIORS, AND FEMALE-HEADED HOUSEHOLDS
III. PEOPLE EXPERIENCING HOMELESSNESS
IV. PEOPLE WITH DISABILITIES, INCLUDING DEVELOPMENTAL DISABILITIES
V. HOUSING STOCK CHARACTERISTICS
VI. OVERPAYMENT AND OVERCROWDING
VII. ASSISTED UNITS AT RISK OF CONVERSION
VIII. REGIONAL HOUSING NEEDS ALLOCATION
Pre-Certified Local Housing Data for Tustin
Population Trend, 2000-2020
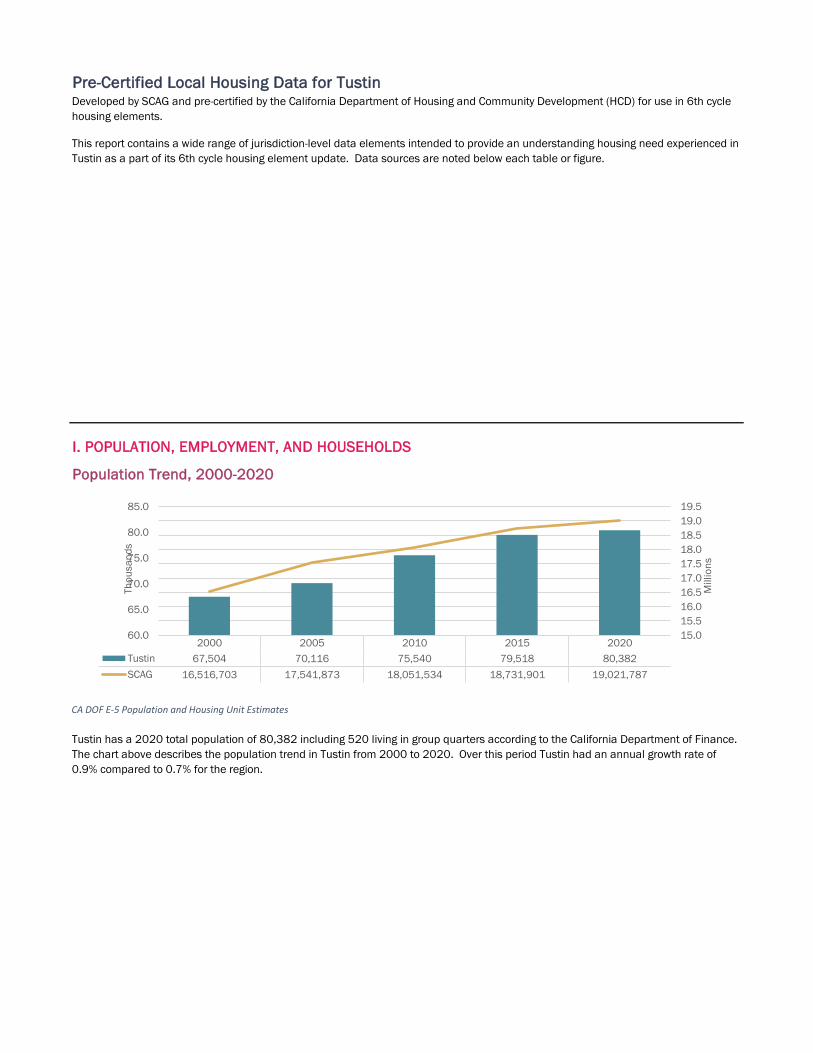
I. POPULATION, EMPLOYMENT, AND HOUSEHOLDS
CA DOF E-5 Population and Housing Unit Estimates
Tustin has a 2020 total population of 80,382 including 520 living in group quarters according to the California Department of Finance.
The chart above describes the population trend in Tustin from 2000 to 2020. Over this period Tustin had an annual growth rate of
0.9% compared to 0.7% for the region.
Developed by SCAG and pre-certified by the California Department of Housing and Community Development (HCD) for use in 6th cycle
housing elements.
This report contains a wide range of jurisdiction-level data elements intended to provide an understanding housing need experienced in
Tustin as a part of its 6th cycle housing element update. Data sources are noted below each table or figure.
60.0
65.0
70.0
75.0
80.0
85.0
2000 2005 2010 2015 2020
Tustin 67,504 70,116 75,540 79,518 80,382
SCAG 16,516,703 17,541,873 18,051,534 18,731,901 19,021,787
15.0
15.5
16.0
16.5
17.0
17.5
18.0
18.5
19.0
19.5
Th
ou
sa
nd
s
Millio
ns
LOCAL HOUSING DATA, 2020
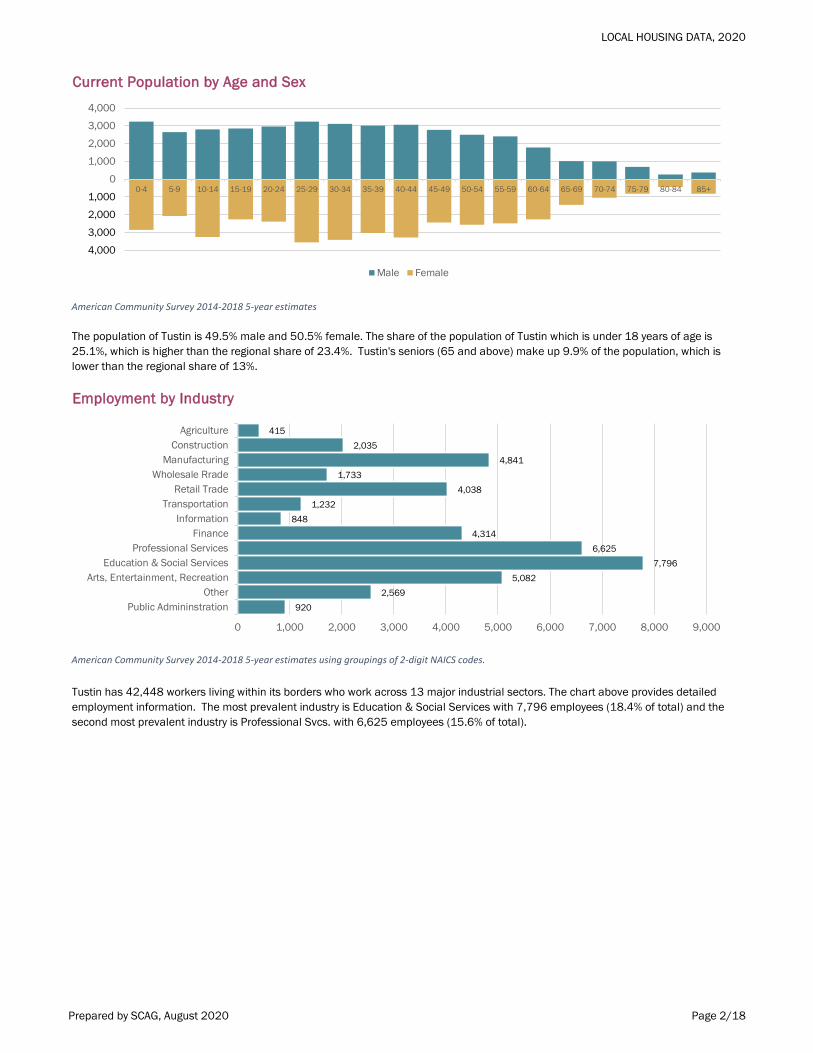
Current Population by Age and Sex
Employment by Industry
The population of Tustin is 49.5% male and 50.5% female. The share of the population of Tustin which is under 18 years of age is
25.1%, which is higher than the regional share of 23.4%. Tustin's seniors (65 and above) make up 9.9% of the population, which is
lower than the regional share of 13%.
American Community Survey 2014-2018 5-year estimates using groupings of 2-digit NAICS codes.
Tustin has 42,448 workers living within its borders who work across 13 major industrial sectors. The chart above provides detailed
employment information. The most prevalent industry is Education & Social Services with 7,796 employees (18.4% of total) and the
second most prevalent industry is Professional Svcs. with 6,625 employees (15.6% of total).
American Community Survey 2014-2018 5-year estimates
4,000
3,000
2,000
1,000
0
1,000
2,000
3,000
4,000
0-4 5-9 10-14 15-19 20-24 25-29 30-34 35-39 40-44 45-49 50-54 55-59 60-64 65-69 70-74 75-79 80-84 85+
Male Female
415
2,035
4,841
1,733
4,038
1,232
848
4,314
6,625
7,796
5,082
2,569
920
0 1,000 2,000 3,000 4,000 5,000 6,000 7,000 8,000 9,000
Agriculture
Construction
Manufacturing
Wholesale Rrade
Retail Trade
Transportation
Information
Finance
Professional Services
Education & Social Services
Arts, Entertainment, Recreation
Other
Public Admininstration
Prepared by SCAG, August 2020 Page 2/18

LOCAL HOUSING DATA, 2020
Employment by Occupation
Farmworkers
Farmworkers by Occupation:
Tustin
Percent of
total Tustin
workers: SCAG Total
319 0.75% 57,741 Total jobs: Farming, fishing, and forestry occupations
225 0.75% 31,521 Full-time, year-round jobs: Farming, fishing, and forestry occupations
Employment in the Agricultural Industry:
Tustin
Percent of
total Tustin
workers: SCAG Total
415 0.98% 73,778 Total in agriculture, forestry, fishing, and hunting
258 0.86% 44,979 Full-time, year-round in agriculture, forestry, fishing, and hunting
Statewide, farmworker housing is of unique concern and of unique importance. While only a small share of SCAG region jurisdictions
have farmworkers living in them, they are essential to the region's economy and food supply.
American Community Survey 2014-2018 5-year estimates using groupings of SOC codes.
In addition to understanding the industries in which the residents of Tustin work, it is also possible to analyze the types of jobs they
hold. The most prevalent occupational category in Tustin is Management, in which 18,328 (43.2% of total) employees work. The
second-most prevalent type of work is in Sales, which employs 9,585 (22.6% of total) in Tustin.
American Community Survey 2014-2018 5-year estimates using groupings of NAICS and SOC codes.
18,328
7,383
9,585
2,581
4,571
2,616,827
1,500,551 1,743,617
675,894
1,118,977
0.0%
5.0%
10.0%
15.0%
20.0%
25.0%
30.0%
35.0%
40.0%
45.0%
50.0%
Management Services Sales Natural Resources Production
Tustin 43.2% 17.4% 22.6% 6.1% 10.8%
SCAG 34.2% 19.6% 22.8% 8.8% 14.6%
Tustin SCAG
Prepared by SCAG, August 2020 Page 3/18

LOCAL HOUSING DATA, 2020
Housing Tenure
Housing Tenure By Age
American Community Survey 2014-2018 5-year estimates.
Housing security can depend heavily on housing tenure, i.e. whether homes are owned or rented. Tustin's housing stock consists of
26,132 total units, 12,532 of which are owner-occupied and 13,600 of which are renter-occupied. The share of renters in Tustin is
higher than in the SCAG region overall.
American Community Survey 2014-2018 5-year estimates.
In many places, housing tenure varies substantially based on the age of the householder. In Tustin, the age group where renters
outnumber owners the most is 15-24 (by 73.9%). The age group where owners outnumber renters the most is 75-84 (by 31.9%).
48.0%
52.5%52.0%
47.5%
45.0%
46.0%
47.0%
48.0%
49.0%
50.0%
51.0%
52.0%
53.0%
Tustin SCAG
Pe
rce
nt o
f To
tal H
ou
se
ho
lds
Owner (%) Renter (%)
0
500
1,000
1,500
2,000
2,500
3,000
3,500
4,000
15-24 25-34 35-44 45-54 55-59 60-64 65-74 75-84 85+
Owner 108 1,253 2,534 2,924 1,430 1,370 1,763 813 337
Renter 721 3,352 3,359 2,616 1,227 729 925 420 251
Ho
use
ho
lds
Prepared by SCAG, August 2020 Page 4/18

LOCAL HOUSING DATA, 2020
Housing Tenure by Year Moved to Current Residence
Households by Household Size
Across the SCAG region, the most common move-in period was 2010-2014 (31.9%) followed by 2000-2009 (26.1%). In Tustin, the
period during which most people started living in their current residence was 2010-2014 (33.9%) followed by 2000-2009 (25.8%).
II. SPECIALIZED HOUSEHOLD NEEDS: LARGE FAMILIES, SENIORS, AND FEMALE-HEADED
American Community Survey 2014-2018 5-year estimates.
This chart illustrates the range of household sizes in Tustin for owners, renters, and overall. The most commonly occuring household
size is of two people (28.4%) and the second-most commonly occuring household is of one person (22.3%). Tustin has a lower share of
single-person households than the SCAG region overall (22.3% vs. 23.4%) and a lower share of 7+ person households than the SCAG
region overall (2.7% vs. 3.1%).
American Community Survey 2014-2018 5-year estimates.
21.9%
33.9%
25.8%
11.3%7.0%
01,0002,0003,0004,0005,0006,0007,0008,0009,000
10,000
2015 or later 2010-2014 2000-2009 1990-1999 1989 or earlier
Renter 4,485 5,920 2,502 560 133
Owner 1,225 2,951 4,249 2,399 1,708
Ho
use
ho
lds (%
of
tota
l)
Owner Renter
33
20
36
47
25
13
21
98
90
4
51
7
50
1
25
13
37
77
20
63 2
53
9
94
2
49
5
20
3
5,8
33
7,4
24
4,5
76
4,7
37
1,8
46
1,0
12
70
4
0.0%
5.0%
10.0%
15.0%
20.0%
25.0%
30.0%
35.0%
1 2 3 4 5 6 7+
Ho
use
ho
lds (%
by
siz
e c
ate
go
ry)
Number of People per Household
Renter Owner Total
Prepared by SCAG, August 2020 Page 5/18

LOCAL HOUSING DATA, 2020
Female Headed Households (FHH)
Households by Poverty Status
American Community Survey 2014-2018 5-year estimates.
5.7 percent of Tustin's households are experiencing poverty, compared to 7.9 percent of households in the SCAG region. Poverty
thresholds, as defined by the ACS, vary by household type. More information can be found at M256. In 2018, a single individual under
65 was considered in poverty with a money income below $13,064/year while the threshold for a family consisting of 2 adults and 2
children was $25,465/year.
American Community Survey 2014-2018 5-year estimates.
Statute requires analysis of specialized housing needs, including female-headed households in an effort to ensure adequate childcare
or job training services. Of Tustin's 26,132 total households, 13.9% are female-headed (compared to 14.3% in the SCAG region), 6.8%
are female-headed and with children (compared to 6.6% in the SCAG region), and 0.8% are female-headed and with children under 6
(compared to 1.0% in the SCAG region).
26132
13.9%; 3627
6.8%; 1790
0.8%; 217
0 5000 10000 15000 20000 25000 30000
Total Households
Total FHH
FHH w/children
FHH w/children under 6
Percent of total househods; Number of households
5.7%; 1,497
2.9%; 763
2.3%; 609
0.5%; 130
0 200 400 600 800 1,000 1,200 1,400 1,600
Total households in poverty
Female-headed
Female-headed with children
Female-headed with 3 or more children
Percent of total households; Number of households
Prepared by SCAG, August 2020 Page 6/18

LOCAL HOUSING DATA, 2020
Elderly Households by Income and Tenure
Owner Renter Total
< 30% HAMFI 485 510 995
30-50% HAMFI 550 550 1,100
50-80% HAMFI 585 315 900
80-100% HAMFI 275 90 365
> 100% HAMFI 1,160 330 1,490
TOTAL 3,055 1,795 4,850
HUD CHAS, 2012-2016. HAMFI refers to Housing Urban Development Area Median Family Income.
Statute requires analysis of specialized housing needs, including housing needs for seniors. Federal housing data define a household
type as 'elderly family' if it consists of two persons with either or both age 62 or over. Of Tustin's 4,850 such households, 20.5% earn
less than 30% of the surrounding area income, (comared to 24.2% in the SCAG region), 43.2% earn less than 50% of the surrounding
area income (compared to 30.9% in the SCAG region).
III. PEOPLE EXPERIENCING HOMELESSNESS
2019 city and county homelessness point-in-time counts processed by SCAG. Jurisdiction-level counts were not avialable in Imperial County and
sheltered population (and thus total) counts were not available in Riverside County. As a result, SCAG region totals from this compilation of data
sources likely undercount true totals.
#N/A
Percent of Total Elderly
Households:
Income category, relative to
surrounding area:20.5%
22.7%
18.6%
7.5%
30.7%
264
95
359
Sheltered Unsheltered Total
Tustin
Prepared by SCAG, August 2020 Page 7/18
LOCAL HOUSING DATA, 2020
Disability by Type
Disability by Type - Seniors (65 and over)
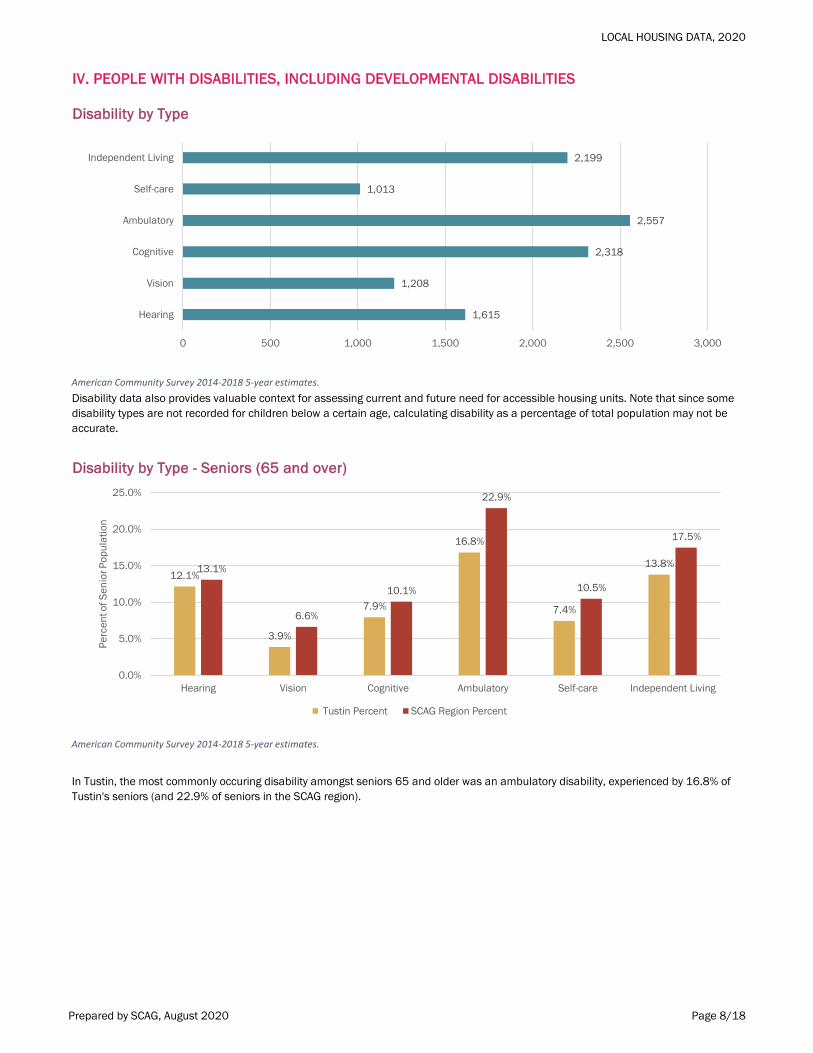
IV. PEOPLE WITH DISABILITIES, INCLUDING DEVELOPMENTAL DISABILITIES
American Community Survey 2014-2018 5-year estimates.
Disability data also provides valuable context for assessing current and future need for accessible housing units. Note that since some
disability types are not recorded for children below a certain age, calculating disability as a percentage of total population may not be
accurate.
American Community Survey 2014-2018 5-year estimates.
In Tustin, the most commonly occuring disability amongst seniors 65 and older was an ambulatory disability, experienced by 16.8% of
Tustin's seniors (and 22.9% of seniors in the SCAG region).
1,615
1,208
2,318
2,557
1,013
2,199
0 500 1,000 1,500 2,000 2,500 3,000
Hearing
Vision
Cognitive
Ambulatory
Self-care
Independent Living
12.1%
3.9%
7.9%
16.8%
7.4%
13.8%13.1%
6.6%
10.1%
22.9%
10.5%
17.5%
0.0%
5.0%
10.0%
15.0%
20.0%
25.0%
Hearing Vision Cognitive Ambulatory Self-care Independent Living
Pe
rce
nt o
f S
en
ior P
op
ula
tio
n
Tustin Percent SCAG Region Percent
Prepared by SCAG, August 2020 Page 8/18

LOCAL HOUSING DATA, 2020
Disability by Employment Status
With a
Disability
Percent of
Total No Disability
Percent of
Total
Employed 1,666 49% 38,600 79%
Unemployed 241 7% 2,027 4%
Not in Labor Force 1,480 44% 8,018 16%
TOTAL 3,387 48,645
Developmental Disabilities
Tustin
By Residence: Home of Parent/Family/Guardian 691
Independent/Supported Living 57
Community Care Facility 5
Intermediate Care Facility 0
Foster/Family Home 15
Other 22
By Age: 0 - 17 Years 790
18+ Years 458
TOTAL 2038
American Community Survey 2014-2018 5-year estimates.
Understanding the employment status of people with disabilities may also be an important component in evaluating specialized
housing needs. In Tustin, 49.2% of the population with a disability is employed, compared to 79.4% of the non-disabled population.
CA DDS consumer count by CA ZIP, age group and residence type for the end of June 2019. Data available in 161/197 SCAG jurisdictions.
The California Department of Developmental Services also provides data on developmental disabilities by age and type of residence.
These data are collected at the ZIP-code level and were joined to the jurisdiction-level by SCAG. Totals may not match as counts below
11 individuals are unavailable and some entries were not matched to a ZIP code necessitating approximation.
Prepared by SCAG, August 2020 Page 9/18

LOCAL HOUSING DATA, 2020
Housing Type
Housing Type Trend
The chart above provides detailed information on the housing stock in Tustin, which has a total of 28,257 housing units. The most
prevalent housing type in Tustin is single-family detached with 9,882 units. The share of all single-family units in Tustin is 48%, which is
lower than the 61.7% share in the SCAG region. Out of the total housing units in Tustin, there are 26,863 occupied-units, which
equates to a 4.9% total vacancy rate. The average household size (as expressed by the population to housing unit ratio) is 2.973.
CA DOF E-5 Population and Housing Unit Estimates
Over the past two decades (2000-2020), there has been more construction of single-family residential units than multi-family
residential units in Tustin. When comparing 2000 to 2020, SFR units increased by 2,017, MFR units increased by 738, and mobile
units increased by 1.
V. HOUSING STOCK CHARACTERISTICS
CA DOF E-5 Population and Housing Unit Estimates
9,882
3,669 4,056
9,741
909
0%
10%
20%
30%
40%
50%
60%
70%
80%
90%
100%
Single-Family
Detached
Single-Family
AttachedMultifamily, 2-4 Units Multifamily, 5+ Units Mobile Homes
Tustin (%) 35.0% 13.0% 14.4% 34.5% 3.2%
SCAG (%) 54.4% 7.2% 7.5% 27.3% 3.5%
Pe
rce
nt o
f To
tal U
nit
s
11,534
13,059
908
11,583
13,455
908
12,752 12,815
909
13,017 13,408
909
13,551 13,797
909
0
2,000
4,000
6,000
8,000
10,000
12,000
14,000
16,000
Single-Family Residential (SFR) Multifamily Residential (MFR) Mobile Homes
Ho
usin
g U
nit
s
2000 2005 2010 2015 2020
Prepared by SCAG, August 2020 Page 10/18

LOCAL HOUSING DATA, 2020
Vacant Units by Type
Housing Units by Year Structure Built
Examining the age of the current housing stock is one way to understand how historical development patterns have contributed to a
city's form. The time period where the highest share of Tustin's housing units were built is 1960-1969, while in the SCAG region more
units were built during 1970-1979 than any other period.
American Community Survey 2014-2018 5-year estimates.
The ACS provides additional detail on vacant housing units by category.
American Community Survey 2014-2018 5-year estimates.
45.2%
8.7% 8.5%10.8% 10.3%
1.6%
14.8%
20.7%
5.4%7.9%
4.5%
33.5%
0.3%
27.7%
0%
5%
10%
15%
20%
25%
30%
35%
40%
45%
50%
For Rent Rented For Sale Sold Seasonal Migrant Other
Pe
rce
nt o
f To
tal V
aca
nt
Un
its
Tustin SCAG
0%
5%
10%
15%
20%
25%
30%
2014 &
Later
2010-
2013
2000-
2009
1990-
1999
1980-
1989
1970-
1979
1960-
1969
1950-
1959
1940-
1949
1939 &
Earlier
Tustin (%) 2.5% 2.1% 8.5% 22.1% 13.1% 21.2% 24.5% 3.7% 0.7% 1.5%
SCAG (%) 1.0% 1.5% 10.1% 9.5% 15.0% 16.3% 14.5% 15.9% 6.9% 9.3%
Pe
rce
nt o
f To
tal U
nit
s
Tustin (%) SCAG (%)
Prepared by SCAG, August 2020 Page 11/18
LOCAL HOUSING DATA, 2020
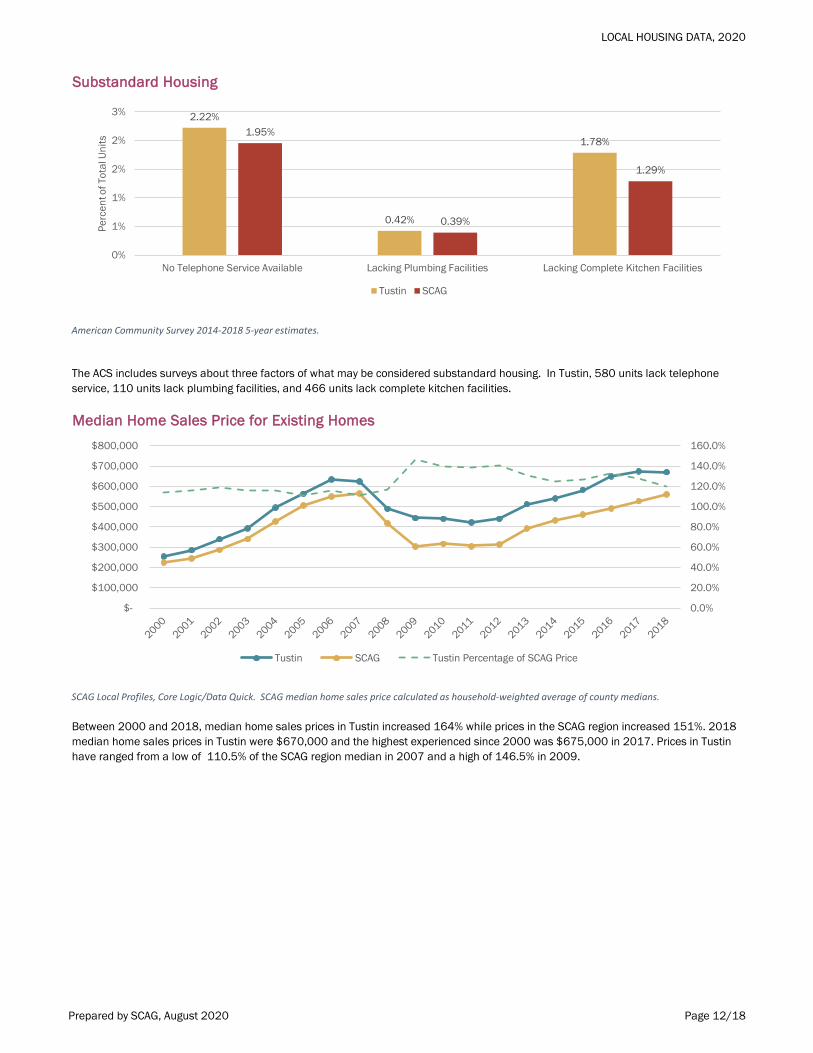
Substandard Housing
Median Home Sales Price for Existing Homes
American Community Survey 2014-2018 5-year estimates.
The ACS includes surveys about three factors of what may be considered substandard housing. In Tustin, 580 units lack telephone
service, 110 units lack plumbing facilities, and 466 units lack complete kitchen facilities.
SCAG Local Profiles, Core Logic/Data Quick. SCAG median home sales price calculated as household-weighted average of county medians.
Between 2000 and 2018, median home sales prices in Tustin increased 164% while prices in the SCAG region increased 151%. 2018
median home sales prices in Tustin were $670,000 and the highest experienced since 2000 was $675,000 in 2017. Prices in Tustin
have ranged from a low of 110.5% of the SCAG region median in 2007 and a high of 146.5% in 2009.
2.22%
0.42%
1.78%1.95%
0.39%
1.29%
0%
1%
1%
2%
2%
3%
No Telephone Service Available Lacking Plumbing Facilities Lacking Complete Kitchen Facilities
Pe
rce
nt o
f To
tal U
nit
s
Tustin SCAG
0.0%
20.0%
40.0%
60.0%
80.0%
100.0%
120.0%
140.0%
160.0%
$-
$100,000
$200,000
$300,000
$400,000
$500,000
$600,000
$700,000
$800,000
Tustin SCAG Tustin Percentage of SCAG Price
Prepared by SCAG, August 2020 Page 12/18

LOCAL HOUSING DATA, 2020
Housing Units Permitted
Crowding by Extent and Tenure
VI. OVERPAYMENT AND OVERCROWDING
American Community Survey 2014-2018 5-year estimates.
In Tustin, 482 owner-occupied and 2,299 renter-occupied households had more than 1.0 occupants per room, which meets the ACS
definition for overcrowding. 131 owner-occupied households and 760 renter-occupied households had more than 1.5 occupants per
room, which meets the ACS definition for severe overcrowding.
Core Logic/Data Quick. Additional detail available in SCAG 2019 Local Profiles. SCAG median home sales price calculated as household-weighted average of
county medians.
3.8%
1.0%
16.9%
5.6%4.9%
1.3%
15.6%
6.4%
0.0%
2.0%
4.0%
6.0%
8.0%
10.0%
12.0%
14.0%
16.0%
18.0%
1.0+/room 1.5+/room 1.0+/room 1.5+/room
Owner Owner Renter Renter
Pe
rce
nt o
f To
tal H
ou
se
ho
lds
Tustin SCAG
0.0
2.0
4.0
6.0
8.0
10.0
12.0
14.0
16.0
18.0
0
100
200
300
400
500
600
700
800
2000 2002 2004 2006 2008 2010 2012 2014 2016 2018
Un
its p
erm
itte
d p
er
10
00
po
pu
lati
on
Un
its P
erm
itte
d in
Ju
risd
icti
on
All Units Single-Family Units Multifamily Units
Tustin, all units per 1000 Pop. SCAG, Units per 1000 Pop.
Prepared by SCAG, August 2020 Page 13/18

LOCAL HOUSING DATA, 2020
Cost Burden by Income
Income < 30% 30-50% > 50%
< 30% HAMFI 550 430 2,565
30-50% HAMFI 705 1,750 1,580
50-80% HAMFI 2,380 2,350 629
80-100% HAMFI 1,795 765 75
> 100% HAMFI 8,695 1,099 194
Total Households 14,125 6,394 5,043
Spending on Rent
Housing cost burden is most commonly measured as the percentage of gross income spent on housing, with 30% a usual threshold for
'cost burden' and 50% the threshold for 'severe cost burden.' However, a lower-income household spending the same percent of
income on housing as a higher-income household will likely experience more true 'cost burden.' These data indicate the number of
households in Tustin by their income relative to the surrounding area and their share of income spent on housing.
Across Tustin's 13,600 renter households, 7,170 (52.7%) spend thirty percent or more of gross income on housing cost, compared to
55.3% in the SCAG region. Additionally, 3,194 renter households in Tustin (23.5%) spend fifty percent or more of gross income on
housing cost, compared to 28.9% in the SCAG region.
Households by Share of Income
Spent on Housing Cost:
HUD CHAS, 2012-2016. HAMFI refers to Housing Urban Development Area Median Family Income.
145
992 972
1,653
2,087
1,2461,081
1,649
3,194
581
0
500
1,000
1,500
2,000
2,500
3,000
3,500
<10% 10-15% 15-20% 20-25% 25-30% 30-35% 35-40% 40-49% >50% Not
Computed
Nu
mb
er
of
Ho
use
ho
lds
Percent of Income Spent on Rent
Prepared by SCAG, August 2020 Page 14/18

LOCAL HOUSING DATA, 2020
Spending on Rent by Income
Household Income by (Cash) Rent
American Community Survey 2014-2018 5-year estimates.
While the previous table breaks down cost burden by area-relative income, the ACS also allows for the analysis of Tustin's 13,019
renter households (for which income data are available) by spending on rent by income bracket (dollar amounts). As one might expect,
the general trend is that low-income households spend a higher share of income on housing (e.g. over 50%) while high-income
households are more likely to spend under 20% of income on housing.
American Community Survey 2014-2018 5-year estimates.
Tustin renter households' cash rent paid can be broken down by household incomes. As one might expect, the general trend is that
lower-income households spend less on rent while higher-income households spend more on rent, though this may not be universally
true. Rent categories range from <$500/month (3.7% of Tustin renters) to >$2000/month (32.1% of Tustin renters). The most
common rent category in Tustin is $1500-2000/month with 38.1% of renters.
0%
10%
20%
30%
40%
50%
60%
70%
80%
90%
100%
Less than
$20,000
$20,000 to
$34,999
$35,000 to
$49,999
$50,000 to
$74,999
$75,000 to
$99,999
$100,000 or
more
>50% 1,003 1,341 616 234 0 0
30-49% 232 224 903 1,816 602 199
20-29% 68 189 44 1,278 1,038 1,123
<20% 11 5 0 51 116 1,926
Nu
mb
er
of
Re
nte
r H
ou
se
ho
lds
Income Category
>50%
30-49%
20-29%
<20%
0%10%20%30%40%50%60%70%80%90%
100%
Less than
$20,000
$20,000 to
$34,999
$35,000 to
$49,999
$50,000 to
$74,999
$75,000 to
$99,999
$100,000
or more
>$2000/mo. 271 274 257 822 712 1909
$1500-2000/mo. 376 552 706 1636 847 913
$1000-1500/mo. 364 636 581 874 197 389
$500-1000/mo. 147 161 19 47 0 37
<$500/mo. 352 136 0 0 0 0
Re
nte
r H
ou
se
ho
lds
Income
>$2000/mo.
$1500-2000/mo.
$1000-1500/mo.
$500-1000/mo.
<$500/mo.
Prepared by SCAG, August 2020 Page 15/18

LOCAL HOUSING DATA, 2020
Monthly Owner Costs for Mortgage Holders
Costs for Mortgage Holders by Income
American Community Survey 2014-2018 5-year estimates.
While renter households receive much of the focus when it comes to housing cost analysis, owner households make up 48% of Tustin
and 52.5% of the SCAG region. The most commonly occurring mortgage payment in Tustin is $2000-$3000/month and the most
commonly occuring mortgage payment in the SCAG region is $2000-$3000/mo.
Mortgage-holding households in Tustin can be broken down by income and the percentage of income spent on mortgage costs. As one
might expect, the general trend is that lower-income households spend a higher share of income on housing costs, while high-income
households may spend a lower share of income on housing.The income category most prevalent amongst Tustin mortgage-holding
households is $75,000 or more (7,169 households) and the most prevalent share of income spent on mortgage costs is over 30%
(3,821 households).
0.2%3.0%
8.5%
16.0%
34.4%
19.0% 18.9%
0.5%
5.1%
13.7%
19.6%
33.4%
15.4%12.3%
0%
5%
10%
15%
20%
25%
30%
35%
40%
<$500 $500-$1000 $1000-$1500 $1500-$2000 $2000-$3000 $3000-$4000 >$4000
Pct.
of
mo
rtga
ge
-ho
lde
rs
Mortgage - Monthly Payment
Tustin SCAG
0%
10%
20%
30%
40%
50%
60%
70%
80%
90%
100%
Less than $20,000 $20,000 to $34,999 $35,000 to $49,999 $50,000 to $74,999 $75,000 or more
Over 30% 195 437 557 903 1729
20-29% 0 8 17 227 2523
Under 20% 0 0 16 42 2917
Mo
rtga
ge
-ho
ldin
g h
ou
se
ho
lds
Household Income; Percent of income spent on mortgage costs
Prepared by SCAG, August 2020 Page 16/18
LOCAL HOUSING DATA, 2020
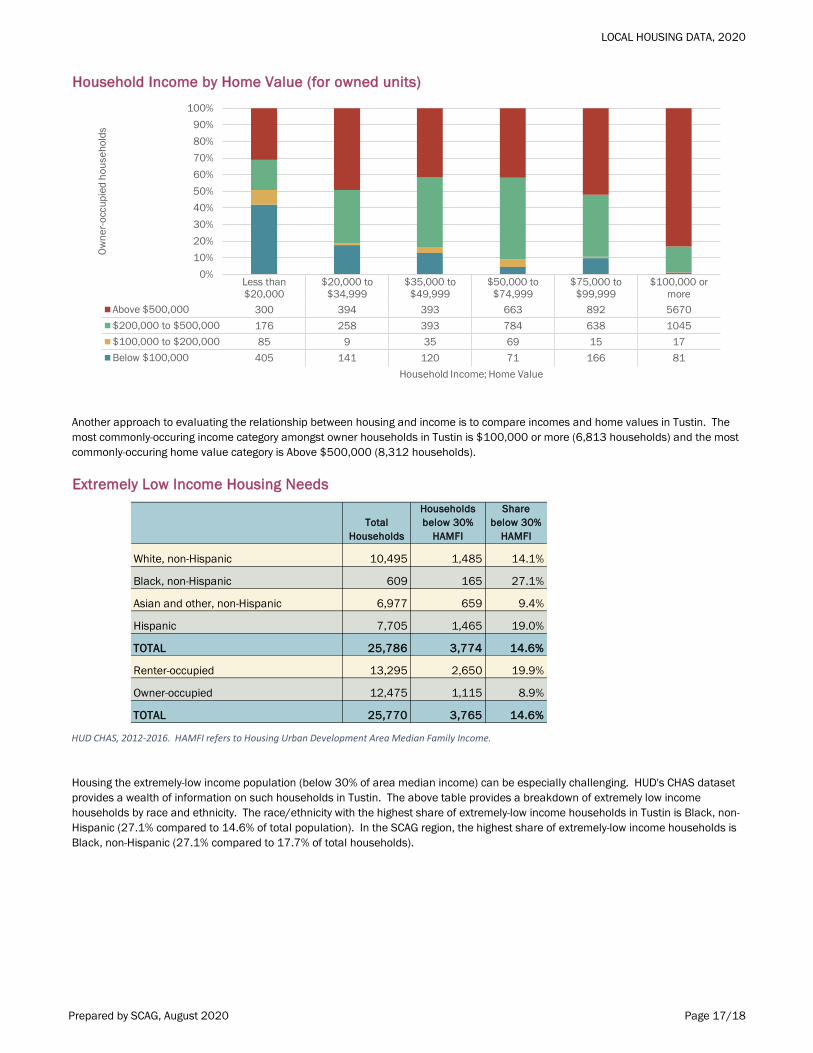
Household Income by Home Value (for owned units)
Extremely Low Income Housing Needs
Total
Households
Households
below 30%
HAMFI
Share
below 30%
HAMFI
White, non-Hispanic 10,495 1,485 14.1%
Black, non-Hispanic 609 165 27.1%
Asian and other, non-Hispanic 6,977 659 9.4%
Hispanic 7,705 1,465 19.0%
TOTAL 25,786 3,774 14.6%
Renter-occupied 13,295 2,650 19.9%
Owner-occupied 12,475 1,115 8.9%
TOTAL 25,770 3,765 14.6%
Another approach to evaluating the relationship between housing and income is to compare incomes and home values in Tustin. The
most commonly-occuring income category amongst owner households in Tustin is $100,000 or more (6,813 households) and the most
commonly-occuring home value category is Above $500,000 (8,312 households).
HUD CHAS, 2012-2016. HAMFI refers to Housing Urban Development Area Median Family Income.
Housing the extremely-low income population (below 30% of area median income) can be especially challenging. HUD's CHAS dataset
provides a wealth of information on such households in Tustin. The above table provides a breakdown of extremely low income
households by race and ethnicity. The race/ethnicity with the highest share of extremely-low income households in Tustin is Black, non-
Hispanic (27.1% compared to 14.6% of total population). In the SCAG region, the highest share of extremely-low income households is
Black, non-Hispanic (27.1% compared to 17.7% of total households).
0%
10%
20%
30%
40%
50%
60%
70%
80%
90%
100%
Less than
$20,000
$20,000 to
$34,999
$35,000 to
$49,999
$50,000 to
$74,999
$75,000 to
$99,999
$100,000 or
more
Above $500,000 300 394 393 663 892 5670
$200,000 to $500,000 176 258 393 784 638 1045
$100,000 to $200,000 85 9 35 69 15 17
Below $100,000 405 141 120 71 166 81
Ow
ne
r-o
ccu
pie
d h
ou
se
ho
lds
Household Income; Home Value
Prepared by SCAG, August 2020 Page 17/18
LOCAL HOUSING DATA, 2020
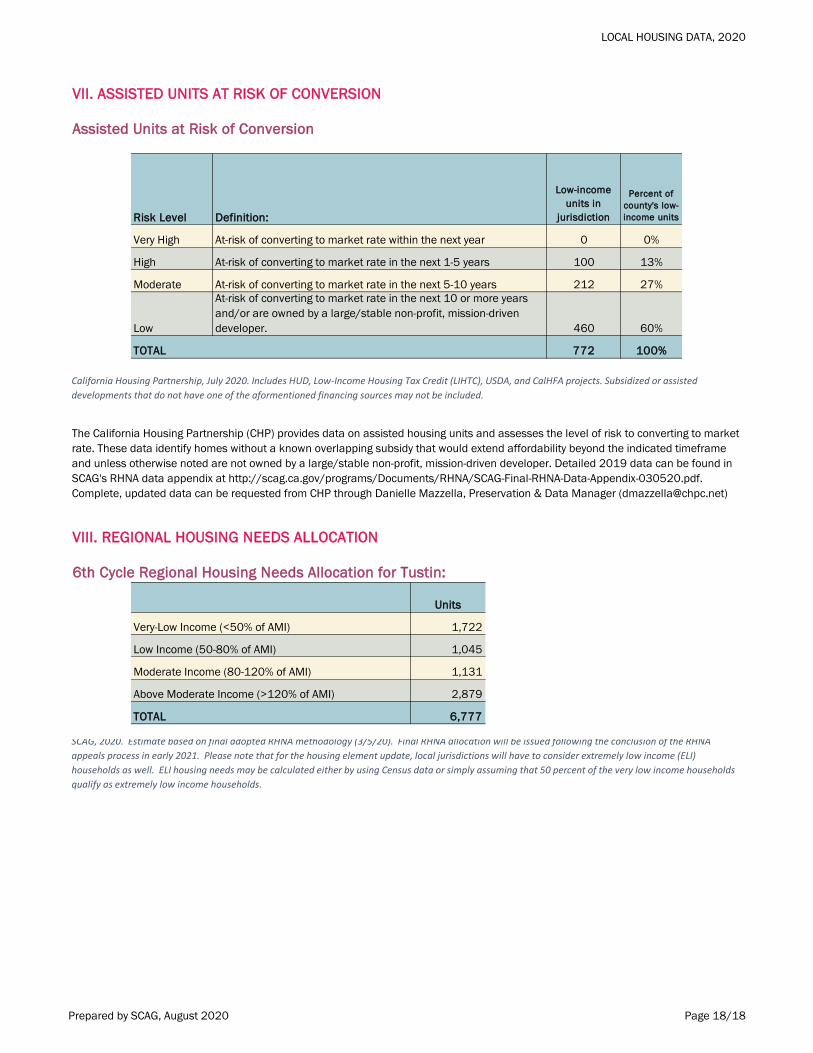
Assisted Units at Risk of Conversion
Risk Level Definition:
Low-income
units in
jurisdiction
Percent of
county's low-
income units
Very High At-risk of converting to market rate within the next year 0 0%
High At-risk of converting to market rate in the next 1-5 years 100 13%
Moderate At-risk of converting to market rate in the next 5-10 years 212 27%
Low 460 60%
TOTAL 772 100%
6th Cycle Regional Housing Needs Allocation for Tustin:
Units
Very-Low Income (<50% of AMI) 1,722
Low Income (50-80% of AMI) 1,045
Moderate Income (80-120% of AMI) 1,131
Above Moderate Income (>120% of AMI) 2,879
TOTAL 6,777
VII. ASSISTED UNITS AT RISK OF CONVERSION
At-risk of converting to market rate in the next 10 or more years
and/or are owned by a large/stable non-profit, mission-driven
developer.
California Housing Partnership, July 2020. Includes HUD, Low-Income Housing Tax Credit (LIHTC), USDA, and CalHFA projects. Subsidized or assisted
developments that do not have one of the aformentioned financing sources may not be included.
The California Housing Partnership (CHP) provides data on assisted housing units and assesses the level of risk to converting to market
rate. These data identify homes without a known overlapping subsidy that would extend affordability beyond the indicated timeframe
and unless otherwise noted are not owned by a large/stable non-profit, mission-driven developer. Detailed 2019 data can be found in
SCAG's RHNA data appendix at http://scag.ca.gov/programs/Documents/RHNA/SCAG-Final-RHNA-Data-Appendix-030520.pdf.
Complete, updated data can be requested from CHP through Danielle Mazzella, Preservation & Data Manager ([email protected])
VIII. REGIONAL HOUSING NEEDS ALLOCATION
SCAG, 2020. Estimate based on final adopted RHNA methodology (3/5/20). Final RHNA allocation will be issued following the conclusion of the RHNA
appeals process in early 2021. Please note that for the housing element update, local jurisdictions will have to consider extremely low income (ELI)
households as well. ELI housing needs may be calculated either by using Census data or simply assuming that 50 percent of the very low income households
qualify as extremely low income households.
Prepared by SCAG, August 2020 Page 18/18

MAJOR DATA SOURCES USED
DESCRIPTION FOR MORE INFORMATION, PLEASE SEE
ACS American Community Survey 2014-2018 5-year estimates
www.data.census.gov
DOF CA DOF E-5 Population and Housing Unit Estimates
www.dof.ca.gov/forecasting/demographics/
CHAS HUD CHAS, 2012-2016 www.huduser.gov/portal/datasets/cp.html
CA DDS California Department of Developmental Services
www.dds.ca.gov/transparency/
SCAG LOCAL PROFILES
Including Construction Industry Research Board (CIRB) and Core Logic/DataQuick
www.scag.ca.gov/DataAndTools/Pages/LocalProfiles.aspx

REGIONAL OFFICES
IMPERIAL COUNTY1503 North Imperial Ave., Ste. 104 El Centro, CA 92243 Tel: (213) 236-1967
ORANGE COUNTY OCTA Building 600 South Main St., Ste. 741 Orange, CA 92868 Tel: (213) 236-1997
RIVERSIDE COUNTY3403 10th St., Ste. 805 Riverside, CA 92501 Tel: (951) 784-1513
SAN BERNARDINO COUNTY1170 West 3rd St., Ste. 140 San Bernardino, CA 92410 Tel: (213) 236-1925
VENTURA COUNTY4001 Mission Oaks Blvd., Ste. L Camarillo, CA 93012 Tel: (213) 236-1960
MAIN OFFICE900 Wilshire Blvd., Suite 1700Los Angeles, CA 90017 Tel: (213) 236-1800 www.scag.ca.gov
plea
se re
cycl
e AJ
295
2