Pre-admission Predictors of Student Success ... - SelectedWorks
26
Western Kentucky University From the SelectedWorks of Mary P Benne PhD, ARNP Fall October, 2016 Pre-admission Predictors of Student Success in a Baccalaureate of Science in Nursing Program Mary P Benne Available at: hps://works.bepress.com/mary_benne/21/
-
Upload
khangminh22 -
Category
Documents
-
view
1 -
download
0
Transcript of Pre-admission Predictors of Student Success ... - SelectedWorks

Western Kentucky University
From the SelectedWorks of Mary P Bennett PhD, ARNP
Fall October, 2016
Pre-admission Predictors of Student Success in aBaccalaureate of Science in Nursing ProgramMary P Bennett
Available at: https://works.bepress.com/mary_bennett/21/

1
Pre-admission Predictors of Student Success in a Baccalaureate of Science in Nursing Program
Pre-Publication version of article to be published in Journal of Nursing Regulation, Oct 2016
Mary Bennett, Lorraine Bormann, Sherry Lovan, Robert Cobb
Western Kentucky University, School of Nursing
Abstract
Attrition can be a serious problem for nursing programs and students. Loss of students during a
nursing program or through NCLEX failure is a waste of resources and results in inefficiency in
the production of nurses for the workforce. Using data from 341 students admitted over a three-
year period, the goal of this study was to determine which factors best predicted student success
in a Baccalaureate of Science in Nursing (BSN) Program. These factors were then used to
develop an admission formula which was tested retroactively to determine its ability to
differentiate between successful and non-successful students. Authors defined student success as
passing all nursing courses on the first attempt with a grade of C or above, on time program
completion, and passing the NCLEX on the first attempt. Logistic regression for prediction of the
probability of success found the following three variables accounted for 76% of the variance:
Preprogram grade point average (GPA), Science GPA, and scores on the HESI A2 Anatomy and
Physiology subscale. The formula derived was validated by retrospective analysis to determine
what the effect of using this model would have been if it had been used to select students for
admission. Results demonstrated that use of this model would have eliminated 40.1% of the
unsuccessful students, while retaining 84% of the successful students.
Keywords: Nursing Student Retention; Admission Formula; Predictors of Student
Success

2
Pre-admission Predictors of Student Success in a Baccalaureate of Science in Nursing Program
Attrition is a concern for many nursing programs in the United States (U.S.), with some
programs reporting graduation rates as low as 50% (Newton & Moore, 2009). Attrition results in
waste of critical resources, thus much effort is spent by admission committees in an attempt to
select the students who will be most likely to complete the program. There are limited studies
which examine the use of grade point average (GPA) and entrance exam scores to predict
success in the first semester of a nursing program, and several studies have looked at the
relationships between nursing course grades, standardized exit tests and NCLEX success (Chen
& Voyles, 2013; Newton, Smith, Moore, & Magnan, 2007; Underwood, Williams, Lee, &
Brunnert, 2013; Yoho, Young, Adamson, & Britt, 2007). But fewer studies have examined the
best use of admission data to differentiate between successful and non-successful students within
a nursing program.
Using data from 341 students admitted over a three-year period, the goal of this study
was to determine which factors best predicted student success in a Baccalaureate of Science in
Nursing (BSN) Program. These factors were then used to develop an admission formula which
was tested retroactively to determine its ability to differentiate between successful and non-
successful students. For this study, student success was defined as graduating within four
semesters of entering the nursing program, no nursing course grades below a grade of “C”, and
passing the NCLEX on the first attempt. The variables tested were those available at the time of
application to the BSN nursing program which also had support from the literature. The
Geometric Model of Student Persistence and Achievement was used as the theoretical
framework for this study (Swail, 2004).

3
Obtaining national level data on graduation rates for U.S. nursing programs is difficult. A
review of the websites and contact with the respective research departments revealed that the
American Association of Colleges of Nursing (AACN), the Commission on Collegiate Nursing
Education (CCNE), and the National League for Nursing (NLN) do not compile or report this
information, nor does the National Council of State Boards of Nursing. The only organization
which reports this data is the Accreditation Commission for Education in Nursing (ACEN). See
Table 1 for graduation data from ACEN accredited programs (ACEN, 2014).
However, according to AACN information, 85% of Baccalaureate of Science in Nursing
(BSN) programs in the U. S. are accredited through AACN-CCNE. The other programs are
either accredited by ACEN, or in some cases not accredited. In an attempt to approximate
graduation rates for AACN BSN programs, the last three AACN annual reports were reviewed.
While AACN does not report actual graduation rates, they do report data on how many students
are admitted overall to AACN schools and how many are graduated each year. If the number of
seats and programs can be assumed to be relatively constant over the time it takes students to
graduate, comparing the number of students admitted in any given year with the number
graduated should give an approximation of the graduation rate for these programs. See Table 2
for this data (Fang, Li & Bednash, 2014; Fang, Li, Arietti & Trautman, 2015; Fang, Li, Stauffer
& Trautman, 2016).
One problem with this data is that more programs reported graduation numbers than
reported admission numbers, which makes it difficult to infer retention numbers from this data.
In addition, both the numbers of students admitted and the numbers of BSN programs reporting
to AACN have changed during the past three years. BSN programs increased by 25 from 2013 to
2014, by 22 programs the next year, and CCNE reports show that 31 initial BSN program
4
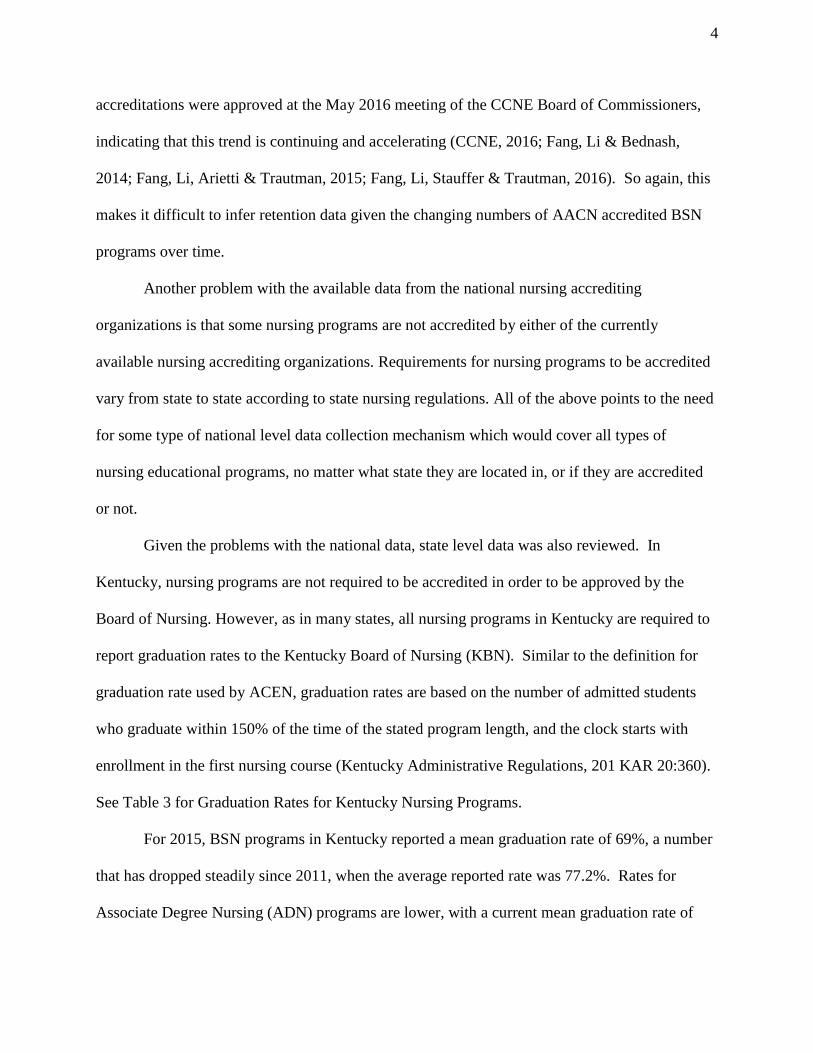
accreditations were approved at the May 2016 meeting of the CCNE Board of Commissioners,
indicating that this trend is continuing and accelerating (CCNE, 2016; Fang, Li & Bednash,
2014; Fang, Li, Arietti & Trautman, 2015; Fang, Li, Stauffer & Trautman, 2016). So again, this
makes it difficult to infer retention data given the changing numbers of AACN accredited BSN
programs over time.
Another problem with the available data from the national nursing accrediting
organizations is that some nursing programs are not accredited by either of the currently
available nursing accrediting organizations. Requirements for nursing programs to be accredited
vary from state to state according to state nursing regulations. All of the above points to the need
for some type of national level data collection mechanism which would cover all types of
nursing educational programs, no matter what state they are located in, or if they are accredited
or not.
Given the problems with the national data, state level data was also reviewed. In
Kentucky, nursing programs are not required to be accredited in order to be approved by the
Board of Nursing. However, as in many states, all nursing programs in Kentucky are required to
report graduation rates to the Kentucky Board of Nursing (KBN). Similar to the definition for
graduation rate used by ACEN, graduation rates are based on the number of admitted students
who graduate within 150% of the time of the stated program length, and the clock starts with
enrollment in the first nursing course (Kentucky Administrative Regulations, 201 KAR 20:360).
See Table 3 for Graduation Rates for Kentucky Nursing Programs.
For 2015, BSN programs in Kentucky reported a mean graduation rate of 69%, a number
that has dropped steadily since 2011, when the average reported rate was 77.2%. Rates for
Associate Degree Nursing (ADN) programs are lower, with a current mean graduation rate of

5
51%, down from 61.1% in 2011. The data indicate that the completion rates for nursing
programs in Kentucky was significantly lower than that reported at the national level by
accredited nursing programs. The most common reason given for non-completion of prelicensure
programs was academic dismissal, which is often accompanied by difficult student life situations
and inadequate social/family support to overcome the situation or situations. At present, all of
the BSN programs in Kentucky are accredited by one of the national nursing organizations, but
several ASN programs are not. The lower ADN graduation rates may be partly due to including
data from 16 non-accredited programs, which made up 41% of the total number of ADN
programs in Kentucky (KBN Annual Report, 2015).
In order to improve student retention rates, admission committees are challenged to
determine best practice in the selection of students. Two basic methods are commonly used, the
rational selection model and the statistical selection model (Cunningham, Manier, Anderson, &
Sarnosky, 2014). The rational selection model makes use of quantitative data from GPA and
other measures, plus expert faculty judgment on student’s capabilities based on interviews,
essays, reference letters, work history or other means. The rational admission process is often
most time consuming for committee members, due to the subjective nature of this more holistic
process. The statistical model uses quantitative data from GPA and standardized testing. But
while quantitative data is relatively easy to obtain and analyze, it can also be problematic due to
possible grade inflation in prerequisite courses and differing grading systems. This can be a
particular problem for programs that attract a high number of transfer students (Chen & Voyles,
2013). It has also been argued that use of the statistical model might lead to decreased diversity
within the nursing workforce. However, at least one large study demonstrated that use of a
statistical selection model resulted in improved graduation rates for both non-minority and

6
minority students, with greater increases in retention seen in the minority students (Phillips,
2002).
Theoretical Framework
The Geometric Model of Student Persistence and Achievement (Swail, 2004) was the
theoretical framework for this study. This triangular framework is composed of three major
supports, the cognitive abilities of the student, the social and behavioral attributes the student
brings to the table, and the institutional supports available (see Figure 1). This model differs
from others by placing the student at the center of the model. In addition, the model is fluid, in
that the sides of the triangle can vary, based on the areas of relative strength or weakness.
According to the theory, strength in one area, such as cognitive ability, can help overcome
relative weakness in another area, such as social and behavioral attributes or institutional
support.
According to Swail’s theory, cognitive factors are those which indicate the intelligence,
knowledge, and academic ability a student brings with him or her to the college environment.
These factors may be measured by high school or college GPA, performance in selected college
level courses, and performance on standardized exams. Cognitive factors are important because
they directly relate to the student’s ability to comprehend and complete the academic portion of
the college curriculum (Swail, 2014). These cognitive factors are frequently available to the
admission committees and are used by most nursing programs as part of the admission process,
but how to best use these factors and which ones are the most predictive of success is still
unknown. Thus for this study we focused on maximizing the cognitive side of the triangular
model by determining which cognitive factors available at the time of nursing program
admission would best predict program completion and NCLEX success.

7
Literature Review
A search of CINAHL, Medline and Google Scholar was conducted to identify relevant
studies to review. As this current study was conducted with the ultimate goal of helping nursing
admission committees with student selection, this review does not cover studies which used data
that would not be available at the time of nursing admission, such as nursing course grades. This
review also does not include studies which used performance in early nursing courses as the
primary outcome, and did not follow the students through to graduation and NCLEX
performance. However, as the remaining studies were few and mostly limited in size, this
review does include studies from both Associate Degree Nursing (ADN) and BSN programs.
Given that both types of nursing programs have similar problems with retention, this broader
review may help educators from both types of programs see which quantitative admission factors
have been found to be related to student retention in pre-licensure nursing programs.
The first study reviewed is one of the oldest, but also the largest conducted thus far.
Phillips, Spurling, and Armstrong (2002) identified a need to develop a statistical selection
model that would improve the program completion rates for students enrolled in California
Community College System ADN programs. This large state-funded study evaluated nursing
student performance using longitudinal data from admission through program completion. One-
third of the community colleges within the California System participated in this study. Data
from twenty consortium colleges consisting of 5,007 students during the academic years of 1994-
95 through 1998-99 were used. The study tested almost 50 variables to determine their
relationship with the dependent variable of program completion. Four factors were determined to
be the best predictors: Preprogram College GPA, English GPA, Core Biology GPA (Anatomy,
Physiology and Microbiology) and repeating Core Biology courses. Statistical analysis included

8
a logistic regression to form a composite admission score. Phillips et al. found that students
selected using the admission score were more successful than students selected by means of the
prior rational method of student selection. Implementation of the new admission score increased
graduation rates from 73% to 82%. The effects of the model on performance by various ethnic
groups were also examined. While the model increased retention of White students by only 3%,
it increased retention of African American students by 15% (Phillips et al., 2002). Limitations of
this study included problems inherent with use of a large system wide database, such as missing
data from students who transferred courses into the system, and possible variation in the quality
of pre-requisite courses offered across the system.
Billows (2007) conducted a retrospective, correlational study to determine if the rational
admission process using selective admission tools (personal statement, resume, and interviews)
added value over use of grade point average alone. Data from the records of 1,343 baccalaureate
students admitted from January 2003 to January 2006 were used in this study. Billows performed
multiple, logistic, and ordinal regression analyses on the data. She found no correlations between
the supplemental application and interview scores and the grades earned in the program,
indicating that the selective admission tools used did not add value to the selection process over
the use of GPA alone. One limitation of this study included some low correlations in the
regression analysis due to a lack of variability in the sample.
Newton and Moore (2009) examined the relationships among scholastic aptitude, nursing
aptitude, and BSN student readiness for the NCLEX-RN. Scholastic Aptitude was defined as
prenursing GPA. Nursing aptitude was operationalized as the ATI TEAS (standardized exam that
measures basic nursing academic readiness) exam composite score, which was taken after
admission to the nursing program. Only students who progressed to the final semester of the

9
program (N = 94) were included in this study. Stepwise entry regression found that scholastic
aptitude was predictive of scores on the ATI RN Comprehensive Predictor exam (P = .015), but
nursing aptitude was not (P = .329). This study is limited by a small one-time convenience
sample from a single nursing program. Also, excluding data from students who failed or dropped
out of the program precludes determining the ability of the entrance exams to predict program
completion.
Cunningham, Manier, Anderson, and Sarnosky (2014) employed retrospective techniques
to explore the idea that a statistical model could explain a greater proportion of variance in
student outcomes than the rationally derived admission points used in their BSN selection
process. The rational process included using weighted points for both quantitative data and
qualitative data. They sampled the archival records of 283 BSN students enrolled in a program
between fall 2005 and spring 2013. Cunningham et al. found that college GPA, science GPA,
ATI TEAS scores and number of prerequisite courses completed were all significantly related to
nursing program GPA. Science GPA, and ATI TEAS composite scores were most highly
correlated with nursing program GPA. Overall the use of an admission formula based on the
quantitative data yielded better results than the former rational selection methods. The authors
emphasize the use of the statistical selection model was more predictive of student success than
the rational points-based method in their sample. Limitations of this study include a sample from
a single BSN program and a wide range of sample sizes across the study variables due to missing
data.
Hinderer, Dibartolo, and Walsh (2014) used a retrospective descriptive design to explore
the ability of the HESI A2, college GPA, and science GPA to predict timely progression in the
program and NCLEX-RN success. The sample for this exploratory pilot study included 89 BSN

10
students. Logistic regression was used to determine if HESI A2 composite scores and preprogram
GPA were predictive of timely progression within the nursing program. Results indicated
preadmission college GPA and science GPA were significant predictors of timely progression,
but A2 composite scores were not. However, the A2 composite scores were correlated with
nursing GPA (r = .31, p = .007) and NCLEX-RN success (r = .301, p = .010). Limitations of this
study include a small sample of homogeneous students from one school.
Elkins (2015) investigated whether preprogram GPA, American College Testing (ACT)
scores, and anatomy and physiology course grades could predict program completion and
NCLEX-RN success. The sample included the records of 187 BSN students admitted to the
program in 2007-2008. Admission GPA and ACT scores were found to be the best preprogram
predictors of completion of the nursing program and passing the NCLEX. In this study, 50% or
more of the students who failed the NCLEX had a preprogram GPA of 2.99 or less. This study is
limited due to a single BSN program which lacked ethnic diversity, with 96% Caucasian
students.
Manieri, De Lima, and Ghosal (2015) sought to determine which admission entrance
examination best predicted program completion for students in an ADN program. They
compared the PAX-RN (nursing admission exam from the NLN), HESI Admission Assessment
(A2), and the ATI TEAS using a logistic regression analysis of data from two cohorts of ADN
students (339) who were followed over 5 years. The HESI A2 (p = .000) and TEAS (p = .004)
were both statistically significant in predicting program completion, but not the PAX-RN. A
major limitation of this study is that it included only one school of nursing and the three exams
were not taken by the same students.
Summary of Literature Review

11
The studies reviewed above indicate use of a statistical selection model can be more
predictive of student success in nursing programs than use of rational models of selection.
However, the variables included in the studies differed; with most using preprogram GPA, some
including GPA in science courses, and some including various standardized exam scores. With
the exception of the Phillips et al. (2002) study, none of the studies determined what the effect of
using the derived models would have on graduation rates, and most of the studies had relatively
small and non-diverse samples.
Methods
Institutional Review Board (IRB) approval was obtained in order to allow the findings to
be presented and published. As this study involved secondary analysis of data available to the
researchers from program databases, individual signed student consent was not required by IRB
and the study met the criteria for expedited review. The BSN nursing program at Western
Kentucky University (WKU) is an upper-division program which consists of four semesters of
nursing class and clinical courses. Students are required to complete all non-nursing courses
prior to entry, and the program is designed for full-time attendance. Most students are ready to
apply for admission to the nursing program during the last semester of their sophomore year or
the first semester of their junior year. For this study, the dependent variable, “Student Status”
was coded as a dichotomous variable of either success or non-success. Success was defined as
graduating within 4 semesters of entering the nursing program, no nursing course grades below a
grade of “C” and passing the NCLEX on the first attempt. Students who needed to repeat a
nursing course, who were unable to graduate or were unable to graduate on time (usually due to
repeating a nursing course), or those who were unable to pass the NCLEX on the first attempt
were coded as “non-successful” for the purposes of this study.

12
Sampling
Data from 586 nursing student applications to the BSN program were reviewed as part of
this process. This includes data from students who applied to the nursing program and were not
admitted. The data from one admission cohort (Spring 2013) was incomplete concerning one of
the variables in the study, so this admission cohort was omitted from the final study.
Results
Demographics
With the exception of the Spring 2013 cohort, data from students admitted to the BSN
program from Fall 2010 through Fall of 2013 were used for this analysis, which resulted in a
total study N of 341 students. Females were 87.52% of this group, males were 12.48%.
Caucasians were 91.71% of the admitted students, 3.09% were African American, and 5.2%
were listed as other. Only six students (1.8%) were classified as English as a Second Language
(ESL). Of the students admitted during this timeframe, ultimately 229 would meet the criteria
for “success” as outlined earlier. Students who did not meet these criteria were classed as “non-
successful” (n = 112) for the purposes of this study, but that does not mean they did not
eventually graduate and pass NCLEX, just that they failed to meet one or more of the defined
criteria for “success” in this study. Of those students who were classified as “non-successful”,
52 were ultimately able to graduate and pass NCLEX, for an overall program completion rate of
82% during this timeframe.
Data Analysis
The independent variables investigated were: (1) Nursing Admission GPA (mean GPA of
all classes taken prior to entering the nursing program); (2) Science GPA (mean GPA of nursing
required science classes taken prior to entry, including grades from repeated courses); (3) HESI

13
A2 Entrance Exam Cumulative Score; (4) Anatomy and Physiology Subscale score; (5) Math
Subscale Score; and (6) Reading Subscale Score. The subscale scores were from the HESI A2
Entrance Exam, completed by all students as part of the nursing program application process.
The primary statistical method used for this study was logistic regression. Logistic regression is
akin to multiple regression, but with an outcome variable that is a categorical variable (binary).
In its most elementary form, logistic regression predicts which of two categories a case is likely
to belong given the values of the independent variables. For this study, logistic regression was
used to predict which category a student was likely to fall within (successful or non-successful)
given their performance on the predictor variables outlined above.
Assumptions and limitations for this analysis include:
1. Each observation within the dataset is independent (occurs only once).
2. The sample for this project was screened for admittance to the WKU Nursing program.
As a result of the screening process the data do not represent the general student
population. These data are likely be skewed as a result of students being selected for
admission into the nursing program due to their academic performance.
3. Variables that exhibited a significantly high correlation with any of the other variables
were identified for removal prior to entry in the logistic regression model. One variable,
admission score, was removed due to high correlations with other variables.
Results of Logistical Regression Model
The SAS (9.4) procedure, LOGISTIC, was the analysis tool for this study. Results of the
logistic regression found that three variables were significant (Admission GPA, Science GPA
and HESI A&P scores). To test for predictor multicollinearity the LOGISTIC procedure was
repeated with the inclusion of original predictors and new variables which were computed as the
log values of each (Hosmer & Lemeshow, 1989). The interaction between each predictor and its

14
log value was examined for significant contributions to the regression equation. WALD Chi
Square statistics revealed that that no significant estimates were found for the interaction terms.
As such, the assumption of linearity in the logit had been satisfied for the Admission GPA,
Science GPA and HESI A&P variables.
The following three variables, admission GPA, science GPA and HESI A&P scores taken
together gave the best predictive model, accounting for 76% of the variance (c= 0.762). The
overall predicted probabilities and grouping was relatively strong suggesting that the three
variables found by this model may discriminate membership in the success or non-success
groups. See Table 4 for point values and examples of how increases in variables identified could
increase the odds of student success.
Test of the Model
1. Use of HESI A2 Reading Subscale Score. Despite the data from the logistic analysis,
some faculty on the admission committee strongly felt that reading was very important to
student success and wanted to see if use of data from the HESI reading subscale would
improve the outcomes. The reading score was the least effective at discriminating
between successful and non-successful students. It would have eliminated only 13% the
non-successful students, and 8% of the successful students. This may be because nearly
all students who met the minimum GPA requirements for nursing (currently 2.75 GPA)
also had a high reading score, and there were only six ESL students in the dataset.
2. Use of HESI A2 A&P score as a cut score of 80. Using the HESI Anatomy and
Physiology score to remove anyone from the applicant pool who obtained an A & P
subscale score below 80 would have eliminated 37.6% of unsuccessful students, but it
would also have eliminated 22% of the successful students.

15
3. Using a combination of the HESI A&P subscale sore divided by 10 and then adding this
to the student admission GPA to produce a combined admission score. As the raw
unweighted HESI score would have much more weight than GPA if used unchanged, the
HESI score was divided by 10 to help decrease the weight of this variable compared with
GPA. Use of this formula would have eliminated 38.75% of the non-successful students,
but also would have eliminated 19% of the successful students.
4. Using all three of the significant predictors determined by the logistic regression analysis
was the most effective method to discriminate between successful and non-successful
students. A formula comprised of preprogram GPA, plus science GPA, plus (HESI A&P
score divided by 10) produced the best results. As above, the raw HESI score was
divided by 10 to help decrease the weight of this variable compared with GPA. This
admission formula would have eliminated 40.9% of the non-successful students and
would only have eliminated 16% of the successful students.
Discussion
Similar to most of the other studies reviewed and as supported by the Geometric Model
of Student Persistence and Achievement (Swail, 2004), this study supports that the cognitive
factors of college GPA and grades in the nursing specific science courses are highly significant
when attempting to determine student potential for success in a nursing program. In addition, this
study found that the prediction was improved by using scores from the HESI A2 Anatomy and
Physiology subscale. However, the other two other major factors from the model,
social/behavioral factors and institutional support, were not measured in this study. How much
these factors contribute to a student’s success and how these factors might modify the effects of
the purely cognitive factors on student success cannot be determined from this dataset.
16
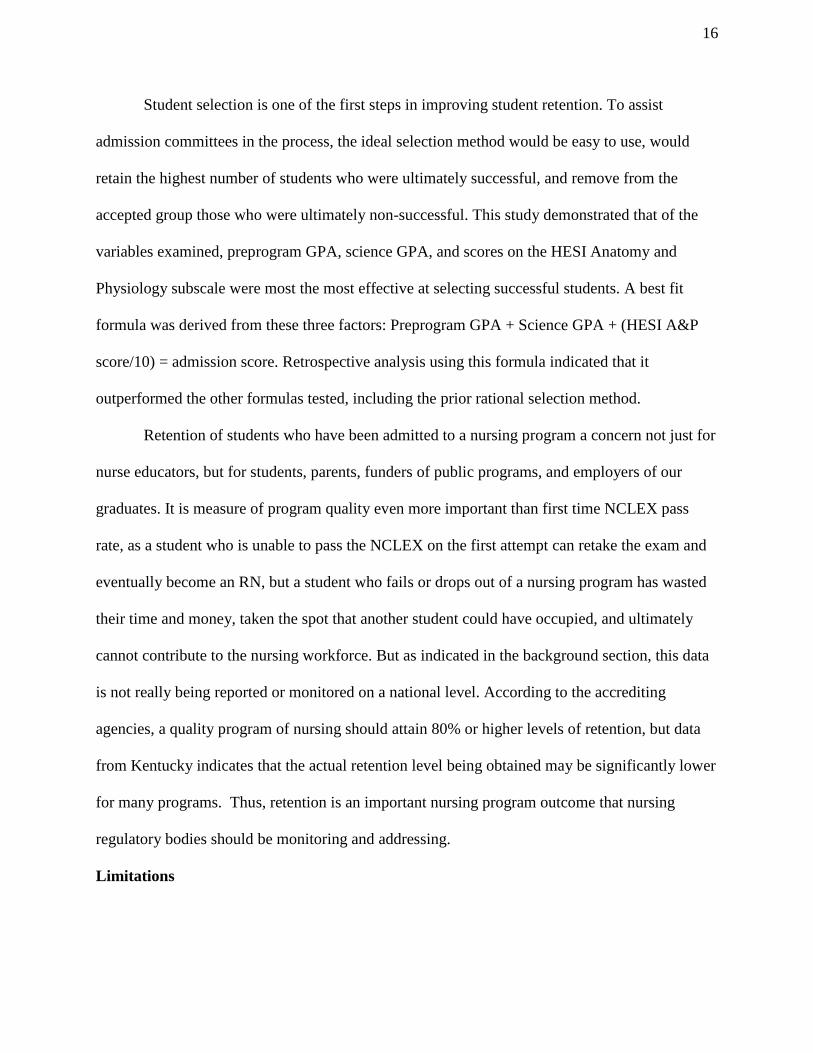
Student selection is one of the first steps in improving student retention. To assist
admission committees in the process, the ideal selection method would be easy to use, would
retain the highest number of students who were ultimately successful, and remove from the
accepted group those who were ultimately non-successful. This study demonstrated that of the
variables examined, preprogram GPA, science GPA, and scores on the HESI Anatomy and
Physiology subscale were most the most effective at selecting successful students. A best fit
formula was derived from these three factors: Preprogram GPA + Science GPA + (HESI A&P
score/10) = admission score. Retrospective analysis using this formula indicated that it
outperformed the other formulas tested, including the prior rational selection method.
Retention of students who have been admitted to a nursing program a concern not just for
nurse educators, but for students, parents, funders of public programs, and employers of our
graduates. It is measure of program quality even more important than first time NCLEX pass
rate, as a student who is unable to pass the NCLEX on the first attempt can retake the exam and
eventually become an RN, but a student who fails or drops out of a nursing program has wasted
their time and money, taken the spot that another student could have occupied, and ultimately
cannot contribute to the nursing workforce. But as indicated in the background section, this data
is not really being reported or monitored on a national level. According to the accrediting
agencies, a quality program of nursing should attain 80% or higher levels of retention, but data
from Kentucky indicates that the actual retention level being obtained may be significantly lower
for many programs. Thus, retention is an important nursing program outcome that nursing
regulatory bodies should be monitoring and addressing.
Limitations

17
1. All student data from were from one BSN program, with limited ethnic and language
diversity.
2. The regression model was somewhat skewed with more students in the “Success” group
than the “Non-success” group. Although not a small sample, the groups being
unbalanced should be noted. Studies with small sample sizes and unbalanced groups tend
to overestimate the effect measures.
3. The retrospective analysis told the authors which students would have been eliminated
using the various formals. In their place other students would have been admitted, but
while the logistic regression indicates these other students would have been more likely
to be successful, this cannot be validated using retrospective data.
4. This study focused on enhancing the cognitive side of the geometrical model of student
persistence, so factors related to the other two sides of the triangle (social/behavioral and
institutional support) were not able to be accounted for (Swail, 2004).
5. While all students in this study had taken the HESI A2 exam, at that time the scores were
not used to rank students for admission. Some students may have been aware of this and
may not have performed to the best of their ability, thinking the exam was not important.
Recommendations
1. Perform a longitudinal study of the outcomes of the new admission formula over time.
2. Include measures of the social/behavioral side of the geometric model for future studies.
3. Repeat this type of analysis using data from other nursing programs.
Conclusion
In this study, use of a statistical selection model based on preprogram GPA, science GPA
and HESI A2 Anatomy and Physiology subscale scores predicted 76% of the variance in student

18
success in an BSN program. Use of this model would have eliminated 40.9% of the unsuccessful
students who had been selected by the previous admission method, while retaining 84% of the
students who were ultimately successful in the nursing program. The formula derived from this
study is now being used to select students for the WKU BSN program. The graduation rates
obtained by using this formula will be compared in the future with the graduation rates obtained
by the prior rational admission process, which included GPA, plus points given for qualitative
factors such as reference letters, student goal statements, work experience, and interviews.

19
References
1. Accreditation Commission for Education in Nursing [ACEN]. (2014) Report to
constituents. Atlanta, GA. Accreditation Commission for Education in Nursing.
2. Billows, J. E. (2007). Predictive validity of an innovative selective admission process for
baccalaureate nursing students (Doctoral dissertation, The University of British
Columbia).
3. Chen, S, & Voyles, D. (2013). HESI admission assessment scores: Predicting student
success. Journal of Professional Nursing, 29(2S), S32-S37.
4. Commission on Collegiate Nursing Education [CCNE]. (2016). Actions for spring 2016.
CCNE Board of Commissioners. Accessed June 2, 2016 from
http://www.aacn.nche.edu/ccne-accreditation/ActionsForS16.pdf
5. Cunningham, C. J. L., Manier, A., Anderson, A., & Sarnosky, K. (2014). Rational versus
empirical prediction of nursing student success. Journal of Professional Nursing, 30(6),
486-492.
6. Elkins, N. (2015). Predictors of retention and passing the National Council Licensure
Examination for registered nurses. Open Journal of Nursing, 5, 218-225.
7. Fang, D., Li, Y., Stauffer, D. C., Trautman, D. E. (2016) 2015-2016 Enrollment and
graduations in Baccalaureate and Graduate Programs in Nursing. Washington, DC:
American Association of Colleges of Nursing.
8. Fang, D., Li, Y., Arietti, R., Trautman, D. E. (2015) 2014-2015 Enrollment and
graduations in Baccalaureate and Graduate Programs in Nursing. Washington, DC:
American Association of Colleges of Nursing.

20
9. Fang, D., Li, Y., Arietti, R., Bednash, G. D. (2014) 2013-2014 Enrollment and
graduations in Baccalaureate and Graduate Programs in Nursing. Washington, DC:
American Association of Colleges of Nursing.
10. Hinderer, K. A., Dibartolo, M. C., & Walsh, C. M. (2014). HESI admission assessment
(A2) examination scores, program progression, and NCLEX-RN success in baccalaureate
nursing: An exploratory study of dependable academic indicators of success. Journal of
Professional Nursing, 30(5), 436-442.
11. Hosmer, D. W., & Lameshow, S. (1989), Applied Logistic Regression. New York:
Wiley.
12. Kentucky Administrative Regulations (2016). 201 KAR 20:360. Kentucky Nursing
Regulations. Continuing approval and periodic evaluation of prelicensure registered
nursing and licensed practical nursing programs. Accessed June 12, 2106 from
http://www.lrc.state.ky.us/kar/201/020/360.htm
13. Kentucky Board of Nursing (2015). Kentucky programs of nursing annual report results,
summary FY 2015. Louisville, KY: Kentucky Board of Nursing.
14. Manieri, E., De Lima, M., & Ghosal, N. (2015). Testing for success: A logistic regression
analysis to determine which pre-admission exam best predicts success in an
Associate Degree in Nursing program. Teaching and Learning in Nursing, 2, 25-29.
15. Newton, S. E., & Moore, G. (2009). Use of aptitude to understand Bachelor of Science in
Nursing student attrition and readiness for the National Council Licensure Examination-
Registered Nurse. Journal of Professional Nursing, 25(5), 273-278.
16. Newton, S. E., Smith, L. H., Moore, G., & Magnan, M. (2007). Predicting early academic

21
achievement in a baccalaureate nursing program. Journal of Professional Nursing, 23(3),
144-149.
17. Phillips, B. C., Spurling, S., & Armstrong, W. A. (2002). Associate Degree Nursing:
Model Prerequisites Validation Study. California Community College Associate Degree
Programs by The Center for Student Success, A Health Care Initiative Sponsored Project.
18. Swail, W. S. (2004). The art of student retention: A handbook for practitioners and
administrators. Austin, TX: Educational Policy Institute.
19. Yoho, M. J., Young, A., Adamson, C., & Britt, R. (2007). The predictive accuracy of
Health Education Systems, Inc., examinations for associate degree nursing students.
Teaching and Learning in Nursing, 2, 80-84.

22
Tables
Table 1: ACEN Graduation Rate* Data 2009-2014
Program Type 2009-2010 2010-2011 2011-2012 2012-2013 2013-2014
Generic BSN 79.5% 78.3% 78.29% 79.15% 79.77%
ADN 73.6% 73.4% 74.61% 74.52% 74.75%
*ACEN defined graduation rate: the number of students who complete the program within 150%
of the time of the stated program length, beginning with the first nursing course.
Table 2: Admission and Graduation Numbers for AACN Generic Baccalaureate Nursing
Programs 2013-2016
Report
Year
Number BSN
Programs
Reporting
Applicants
accepted and
enrolled
Number
BSN
Programs
Reporting
Number
Graduated
Approximate
Graduation
Rate
2013-2014 652 76,168 654 60,188 79.09%
2014-2015 677 78,395 679 63,857 81.46%
2015-2016 699 83,694 700 65,958 78.81%
Table 3: KBN Graduation Rate Data 2011-2015 (From all pre-licensure programs in
Kentucky)
Program Type 2011 2012 2013 2014 2015
Generic BSN
(N = 15)
77.2% 70% 75% 75% 69%
*ADN (N = 39) 61.1% 73.8% 60% 68% 51%
*Includes data from 16 non-accredited nursing programs.

23
Data from above table displayed as a Graph.
KBN Graduation Rate Data 2011-2015 Graph – includes data from 16 non-accredited ADN
programs.
Table 4: Odds Ratio Estimates For Significant Predictor Variables
Predictor Variable Point
Estimate
Change in variable
Change in Student Odds
of Success
95% Wald Confidence Limits
Admissions GPA 4.579 Increase of 1
point Increased by
375% 1.575 13.319
Science GPA 2.377 Increase of 1
point Increased by
137% 1.238 4.564
HESI A&P Score 0.901 Increase of 10
points Increased by
70% 0.754 1.075
Note: When Point Estimate values increase, the odds for student success within the program also increase. Thus, for these data, the odds for student success are 4.57 times higher for each point change in a student’s Admission GPA, 2.37 times higher for each change in Science GPA, and 0.90 times higher for a 10 point increase in HESI A&P scores.

24
Sidebar Information
Standardized Nursing Entrance Exams
HESI A2: Standardized nursing entrance exam by Elsevier. Subscales: Basic Math; Reading
Comprehension; Grammar; Vocabulary & General Knowledge; Anatomy & Physiology. Available at
https://evolve.elsevier.com/studentlife/hesi.html
ATI TEAS: Test of Essential Academic Skills (TEAS). Standardized nursing entrance exam by ATI.
Subscales: Reading; Math; Science; English and Language Usage. Available at
https://www.atitesting.com/solutions/pre-program/TEAS-Discover.aspx
PAX-RN: Standardized nursing entrance exam by NLN. Subscales: Verbal Skills; Math; Science. Available
at https://ondemand.questionmark.com/400030/ext/nlntesting/node/387

25
Summary Table for Review of Literature
Study Sample Key Admission Variables Key Outcome Variables Results
Phillips, Spurling, and Armstrong 2002
5,007 ADN students
College GPA; English GPA; Science GPA; Repeated science Courses
Program Completion Use of admission score developed using key variables increased graduation rates from 73% to 83%.
Billows, 2007 1,343 BSN students
College GPA; personal statements; resumes; interview scores
Nursing course grades; program completion
Use of personal statements, resumes and interview scores did not improve prediction of outcome variables compared to college GPA alone.
Newton and Moore, 2009
94 BSN students
College GPA ATI TEAS composite score
Scores on the ATI RN Predictor (NCLEX readiness exam)
College GPA was related to scores on the NCLEX readiness exam, but TEAS scores were not.
Cunningham et al., 2014
283 BSN students
College GPA Science GPA ATI TEAS Number of Pre-Requisites completed Interview scores Supplemental application data
Nursing Program GPA Use of an admission formula developed using College GPA; science GPA; number of pre-requisite courses completed and ATI TEAS scores was more predictive of Nursing GPA than the rational process which included use of interview scores and other qualitative data.
Hinderer, Dibartolo, and Walsh, 2014
89 BSN students
College GPA Science GPA HESI A2
On Time Graduation Nursing Course Grades NCLEX Success
College GPA and Science GPA were significant predictors of on time graduation from nursing. HESI A2 scores correlated with nursing grades and NCLEX success but were not a significant predictor of on time graduation.
Elkins, 2015 187 BSN students
College GPA; ACT scores; Anatomy and Physiology course grades
Program Completion NCLEX success
College GPA and ACT scores were the best predictors of program completion and NCLEX success.
Manieri, De Lima and Ghosal, 2015
339 ADN students
PAX-RN HESI A2
ATI TEAS
Program Completion HESI A2 and ATI TEAS were both statistically significant in prediction of program completion, but not the PAX-RN.