Practical experiences with chronics discovery in large telecommunications systems
8
Practical Experiences with Chronics Discovery in Large Telecommunications Systems * Soila P. Kavulya † , Kaustubh Joshi § , Matti Hiltunen § , Scott Daniels § , Rajeev Gandhi † ,Priya Narasimhan † Carnegie Mellon University † {spertet,rgandhi,priyan}@ece.cmu.edu AT&T Labs - Research {kaustubh,hiltunen,daniels}@research.att.com § ABSTRACT Chronics are recurrent problems that fly under the radar of operations teams because they do not perturb the system enough to set off alarms or violate service-level objectives. The discovery and diagnosis of never-before seen chronics poses new challenges as they are not detected by traditional threshold-based techniques, and many chronics can be present in a system at once, all starting and ending at different times. In this paper, we describe our experiences diagnosing chron- ics using server logs on a large telecommunications service. Our technique uses a scalable Bayesian distribution learner coupled with an information-theoretic measure of distance (KL divergence), to identify the attributes that best distin- guish failed calls from successful calls. Our preliminary re- sults demonstrate the usefulness of our technique by provid- ing examples of actual instances where we helped operators discover and diagnose chronics. 1. INTRODUCTION Chronics are the low-grade fevers of large distributed services that support millions of users. These problems fly under the radar of operations teams because they are not big enough to set off alarm thresholds, yet they result in significant degradation in user satisfaction if left unresolved over long periods of time. Chronics can be recurrent, occurring repeatedly but unpredictably for short durations of time, or they may persist, affecting small subsets of users all the time. The discovery and diagnosis of never-before seen chron- ics is a task that poses new challenges compared to the diagnosis of sudden system outages. Threshold-based * Reprinted from the proceedings of SLAML’11 with permis- sion. Permission to make digital or hard copies of all or part of this work for personal or classroom use is granted with- out fee provided that copies are not made or distributed for profit or commercial advantage and that copies bear this no- tice and the full citation on the first page. To copy otherwise, or republish, to post on servers or to redistribute to lists, re- quires prior specific permission and/or a fee. SLAML 2011, October 23, 2011, Cascais, Portugal. Copyright c 2011 ACM 978-1-4503-0978-3/11/10...$10.00 detection techniques [4, 6, 13] do not work well because lowering the thresholds to detect chronics would in- crease the number of false positives. In addition, they pose challenges to other techniques too. Chronics that occur over short periods of time often go away before diagnosis can be performed, while those that persist for long periods of time can get absorbed into a sys- tem’s definition of“normal”, thus creating problems for change-point detection methods [1] or those that rely on historical models [9]. Unlike major outages which are rare and often have a single cause, lots of chron- ics can be present in a system at once, all starting and ending at different times. Furthermore, they may also be hidden by larger, more pressing problems. These characteristics make it difficult to isolate and diagnose individual chronic problems or isolate periods of bad system behavior to narrow regions of time that can be analyzed in more detail [17]. In addition to these unique challenges, the traditional problems of large systems diagnosis remain for chronics as well. Service platforms often consist of hundreds (or more) of network and server elements of different types, from different vendors, often producing high volumes of partially-structured logs with different formats. Detect- ing problems based on low-level events such as resource utilization indicators or network packet loss does not translate directly to user-visible symptoms resulting in false positives, while waiting for customer complaints to identify user-problems is often too late. Finally, a variety of different underlying problems may cause user requests to fail—failures may be caused by the service elements (e.g., due to upgrades or misconfiguration), the underlying network, customer issues (e.g., miscon- figuration or misuse), or combinations of the above. In this paper, we report on our experiences address- ing these issues to detect chronics using server logs on a large production telecommunications service that han- dles tens of millions of calls per day. Specifically, we analyze call detail record (CDR) logs collected from a part of a major US ISP’s Voice over IP telephone net-
-
Upload
independent -
Category
Documents
-
view
5 -
download
0
Transcript of Practical experiences with chronics discovery in large telecommunications systems
Practical Experiences with Chronics Discovery in LargeTelecommunications Systems ∗
Soila P. Kavulya†, Kaustubh Joshi§, Matti Hiltunen§, Scott Daniels§,Rajeev Gandhi†,Priya Narasimhan†
Carnegie Mellon University†
{spertet,rgandhi,priyan}@ece.cmu.eduAT&T Labs - Research
{kaustubh,hiltunen,daniels}@research.att.com§
ABSTRACTChronics are recurrent problems that fly under the radar ofoperations teams because they do not perturb the systemenough to set off alarms or violate service-level objectives.The discovery and diagnosis of never-before seen chronicsposes new challenges as they are not detected by traditionalthreshold-based techniques, and many chronics can be presentin a system at once, all starting and ending at different times.In this paper, we describe our experiences diagnosing chron-ics using server logs on a large telecommunications service.Our technique uses a scalable Bayesian distribution learnercoupled with an information-theoretic measure of distance(KL divergence), to identify the attributes that best distin-guish failed calls from successful calls. Our preliminary re-sults demonstrate the usefulness of our technique by provid-ing examples of actual instances where we helped operatorsdiscover and diagnose chronics.
1. INTRODUCTIONChronics are the low-grade fevers of large distributed
services that support millions of users. These problemsfly under the radar of operations teams because theyare not big enough to set off alarm thresholds, yet theyresult in significant degradation in user satisfaction ifleft unresolved over long periods of time. Chronics canbe recurrent, occurring repeatedly but unpredictably forshort durations of time, or they may persist, affectingsmall subsets of users all the time.
The discovery and diagnosis of never-before seen chron-ics is a task that poses new challenges compared to thediagnosis of sudden system outages. Threshold-based∗Reprinted from the proceedings of SLAML’11 with permis-sion. Permission to make digital or hard copies of all or partof this work for personal or classroom use is granted with-out fee provided that copies are not made or distributed forprofit or commercial advantage and that copies bear this no-tice and the full citation on the first page. To copy otherwise,or republish, to post on servers or to redistribute to lists, re-quires prior specific permission and/or a fee. SLAML 2011,October 23, 2011, Cascais, Portugal. Copyright c©2011ACM 978-1-4503-0978-3/11/10...$10.00
detection techniques [4, 6, 13] do not work well becauselowering the thresholds to detect chronics would in-crease the number of false positives. In addition, theypose challenges to other techniques too. Chronics thatoccur over short periods of time often go away beforediagnosis can be performed, while those that persistfor long periods of time can get absorbed into a sys-tem’s definition of “normal”, thus creating problems forchange-point detection methods [1] or those that relyon historical models [9]. Unlike major outages whichare rare and often have a single cause, lots of chron-ics can be present in a system at once, all starting andending at different times. Furthermore, they may alsobe hidden by larger, more pressing problems. Thesecharacteristics make it difficult to isolate and diagnoseindividual chronic problems or isolate periods of badsystem behavior to narrow regions of time that can beanalyzed in more detail [17].
In addition to these unique challenges, the traditionalproblems of large systems diagnosis remain for chronicsas well. Service platforms often consist of hundreds (ormore) of network and server elements of different types,from different vendors, often producing high volumes ofpartially-structured logs with different formats. Detect-ing problems based on low-level events such as resourceutilization indicators or network packet loss does nottranslate directly to user-visible symptoms resulting infalse positives, while waiting for customer complaintsto identify user-problems is often too late. Finally, avariety of different underlying problems may cause userrequests to fail—failures may be caused by the serviceelements (e.g., due to upgrades or misconfiguration),the underlying network, customer issues (e.g., miscon-figuration or misuse), or combinations of the above.
In this paper, we report on our experiences address-ing these issues to detect chronics using server logs on alarge production telecommunications service that han-dles tens of millions of calls per day. Specifically, weanalyze call detail record (CDR) logs collected from apart of a major US ISP’s Voice over IP telephone net-
work over a period of several months. VoIP is an ap-plication with rapidly increasing importance. The userbase of VoIP will increase to hundreds of millions ofusers [18] by replacing traditional telephony in the of-ferings of many wireline ISPs (e.g., [7, 15]), and in up-coming 4G cellular standards such as LTE that requirethe use of VoIP for all cellular telephony [18]. However,we will argue that the problems we address, and oursolutions, are not limited to VoIP; they are likely to beapplicable to many other large systems such as Internetservices that are used by millions of users as well.
After discussing the suitability and limitations of ex-isting diagnosis literature to address the above chal-lenges, we propose the outline of a new statistical ap-proach for chronic discovery and diagnosis that is scal-able, yet does not use historical data for learning the“normal” behavior of the system. Therefore, it is idealfor discovering unexpected problems that have neverbeen seen before, and it can also identify problems thathave persisted in the background for a long time. It isdesigned to isolate independent problems that may beongoing at the same time, and even on common networkelements. Finally, with a little domain-specific effort, itcan work with semi-structured system logs from differ-ent vendors with different structures and semantics.
The methodology we propose is simple: a) we startfrom the top and label every user-interaction with thesystem as normal or anomalous using simple applicationheuristics, b) using application-specific keys, we thencorrelate as much system log data to each labeled in-teraction as is possible, and c) we finally run a scalableBayesian distribution learner coupled with an information-theoretic measure of distance (KL divergence [11]), toidentify groups of call attributes in the correlated datasetthat best distinguish failed user interactions from suc-cessful ones. Finally, we show that the technique ispowerful—preliminary applications of the technique toour target VoIP service have helped discover a numberof actual chronics.
2. THE DATASET AND CHALLENGESWe investigate chronics discovery for a part of the
VoIP operations of a major US-based ISP. However, ourfindings may also apply to other large distributed sys-tems, (e.g., e-commerce, web-search, social networks)that serve users via independent interactions such asweb requests. The portion of the ISP’s VoIP networkthat we analyzed handles tens of millions of calls eachday, contains several hundred network elements, andis layered on a large IP backbone. The network of-fers a portfolio of voice services including individual ac-counts, teleconferencing, self-managed solutions wherecustomers manage their own premise equipment (PBXs),and wholesale customers who buy network minutes inbulk and resell them. Each service has different call
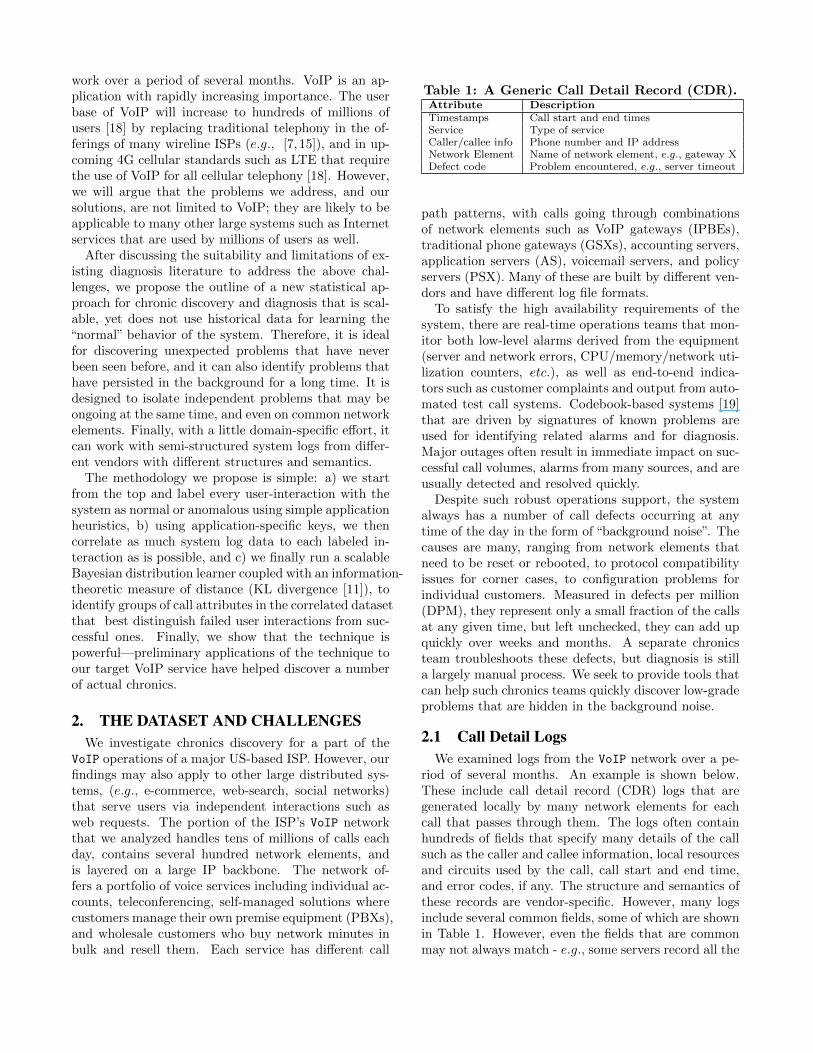
Table 1: A Generic Call Detail Record (CDR).Attribute DescriptionTimestamps Call start and end timesService Type of serviceCaller/callee info Phone number and IP addressNetwork Element Name of network element, e.g., gateway XDefect code Problem encountered, e.g., server timeout
path patterns, with calls going through combinationsof network elements such as VoIP gateways (IPBEs),traditional phone gateways (GSXs), accounting servers,application servers (AS), voicemail servers, and policyservers (PSX). Many of these are built by different ven-dors and have different log file formats.
To satisfy the high availability requirements of thesystem, there are real-time operations teams that mon-itor both low-level alarms derived from the equipment(server and network errors, CPU/memory/network uti-lization counters, etc.), as well as end-to-end indica-tors such as customer complaints and output from auto-mated test call systems. Codebook-based systems [19]that are driven by signatures of known problems areused for identifying related alarms and for diagnosis.Major outages often result in immediate impact on suc-cessful call volumes, alarms from many sources, and areusually detected and resolved quickly.
Despite such robust operations support, the systemalways has a number of call defects occurring at anytime of the day in the form of “background noise”. Thecauses are many, ranging from network elements thatneed to be reset or rebooted, to protocol compatibilityissues for corner cases, to configuration problems forindividual customers. Measured in defects per million(DPM), they represent only a small fraction of the callsat any given time, but left unchecked, they can add upquickly over weeks and months. A separate chronicsteam troubleshoots these defects, but diagnosis is stilla largely manual process. We seek to provide tools thatcan help such chronics teams quickly discover low-gradeproblems that are hidden in the background noise.
2.1 Call Detail LogsWe examined logs from the VoIP network over a pe-
riod of several months. An example is shown below.These include call detail record (CDR) logs that aregenerated locally by many network elements for eachcall that passes through them. The logs often containhundreds of fields that specify many details of the callsuch as the caller and callee information, local resourcesand circuits used by the call, call start and end time,and error codes, if any. The structure and semantics ofthese records are vendor-specific. However, many logsinclude several common fields, some of which are shownin Table 1. However, even the fields that are commonmay not always match - e.g., some servers record all the

Average number of calls
Time in GMT
0:00 4:00 8:00 12:00 16:00 20:00
Figure 1: System usage follows cyclical patterns.Call counts were obscured to preserve privacy.
digits in the calling and called phone numbers, whileothers omit the last four digits. These logs tend to belarge—the average size of the raw CDR logs is 30GB/-day. Even after significant consolidation to eliminateirrelevant data fields, the average size is 2.4GB/day,and each log contains between 1500-3000 unique callattributes pertinent to diagnosis.
# CDR Log sn ippet20100901064914 ,STOP, at4ga01gh , phnum1 , phnum2 ,PSTN−TO−IP , ipaddr1 :32620/ ipaddr2 :25378 ,CCE PHILAPASLCA3 TG,otg=0001ATLNGANW05T−T0012 ,VENDOR X CCE, Answered , Success , ph4pa0102sce
2.2 Challenges in Diagnosing ChronicsChronics occur for a variety of reasons. For example,
customer misconfiguration affecting some, but not all,calls made by the customer. These failures persist untilthe customer fixes their configuration. Increases in sys-tem workload can also cause regularly occurring chron-ics (e.g., peak business hours). Such problems may bedue to under-provisioning or customer exceeding theirresource caps (e.g., number of concurrent calls). Equip-ment failures such as a bad row of memory can alsocause random call failures, but at a rate lower thanwould trigger an alarm. Operators could ignore theseproblems if they were one-off incidents. However, therecurrent nature of these problems negatively impactscustomer satisfaction over time. Diagnosing chronicsposes the following challenges.
Chronics fly under the radar.Chronics typically occur sporadically, or affect a small
subset customers, and thus do not trigger any threshold-based alarms. This is because setting threshold con-ditions is notoriously difficult. As shown in Figure 1,large systems often have cyclical fluctuations in volumeover the course of a day, days of the week, and evenmonth of the year. This makes it difficult to set staticthresholds for what is normal. Techniques to learn his-torical trends and thus change thresholds dynamicallyexist, but chronics often live in the small gaps betweenpredicted trends and actual values.
Multiple independent problems.
Total Failures
Fa
ilure
s
log
( y
)
Fa
ilure
s
log
( y
)
Fa
ilure
s
log
( y
)
Fa
ilure
s
log
( y
)
Fa
ilure
s
log
( y
)
1. Problem with network element
2. Problem with single customer
3. Failures on specific trunk route
4. Problem with a different customer
Total Failures
Figure 2: Defects associated with a network el-ement may be due to many different causes.
Because chronics often persist for long periods of timebefore they are discovered, there are usually many ofthem ongoing at the same time. For example, Figure 2shows an actual example where the total number ofdefective calls passing through a network element (topgraph) over a period of 3 days were in fact due to at-least four unique problems - one related to a networkelement, two related to two different customers (prob-lems 2 and 4), and one a capacity problem with a trunkroute (problem 3). The y-axis shows the number offailed calls due to each problem on a log scale as a func-tion of time. The most dominant problem (problem 1)drives the shape of the overall failure graph, and hidesthe other problems.
Persistent Problems.Some problems, such as problem 4 from Figure 2
occur only for short durations of time, and could bediscovered by change detection algorithms. However,problems such as problem 1 persisted for long peri-ods of time, thus making it difficult to detect them viachange points.
Complex triggers.Chronics often involve only a small subset of user
interactions because they are triggered by some unfore-seen corner case requiring atypical conditions. An inci-dent from the VoIP network illustrates this issue. Cus-tomers of a given service experienced difficulties makingand receiving calls following a planned maintenance in-volving a configuration change to a server. The issueprevented customers whose phones used IP addresses

Table 2: Summary of Diagnosis TechniquesTechnique (Canonical Example) End-to-end tracing
(Pinpoint [10])Signature-based(Cohen2005 [6])
Graph theoretic(NetMedic [9])
Event correlation(Giza [13])
Complex problems diagnosedPropagating problems 3 3 3 3Chronics 7 7 7 (partial)Multiple independent problems 3 7 3 3Complex triggers (partial) 3 7 3
instead of fully qualified domain names from registeringwith the network. To effectively debug this problem,operators needed to identify that the problem occurredonly for customers of the specific service when certaintypes of phones were used with the misconfigured server.Identifying the combination of factors necessary to trig-ger the problem is challenging.
3. STATE-OF-THE-ART DIAGNOSISOver the past decade there have been significant ad-
vances in tools that exploit statistics and machine learn-ing to diagnose problems in distributed systems. Table2 highlights some influential diagnosis techniques. Thislist is by no means exhaustive but we believe it capturesthe trends in diagnosis for distributed systems. Thissection discusses the contributions of these techniques,and their shortcomings at diagnosing chronics.
3.1 End-to-end TracingSome diagnostic tools [3,5,10,17] analyze end-to-end
request traces and localize components highly corre-lated with failed requests using data clustering [3, 17]or decision trees [5, 10]. They detect problems that re-sult in changes in the causal flow of requests [10, 17],changes in request durations [17], or error codes [5].These techniques have typically been used to diagnoseinfrastructural problems, such as database faults andsoftware bugs (e.g infinite loops and exceptions) whichlead to a marked perturbation of a subset of requests.In principle, techniques such as decision trees shouldfare well at diagnosing both major outages and chron-ics. However, decision trees did not fare well at diagnos-ing chronics when we applied them to our dataset. Wehypothesize that the decision tree’s bias towards build-ing short trees led to the pruning of relevant featureswhen diagnosing problems due to complex triggers. Inaddition, the small number of calls affected by chron-ics coupled with the presence of multiple independentchronics might have been mistaken for noise.
3.2 Signature-basedSignature-based diagnosis tools [4, 6, 8] allow system
administrators to identify recurrent problems from adatabase of known problems. Research has centeredon how to represent and retrieve signatures from theproblem database. These techniques use Service-Level
Objective (SLO) to identify periods of time where thesystem was behaving abnormally, and apply machinelearning algorithms (e.g., tree-augmented naive bayes,logistic regression) to determine which resource-usagemetrics are most correlated with the anomalous periods.They generate signatures using centroids obtained byclustering feature vectors based on the resource-usagemetrics correlated with the problems. These techniquescan diagnose problems due to complex triggers by lo-calizing the problem to a small set of metrics. However,they do not address multiple independent problems asthey assume that a single problem occurs at a given in-stance of time. Chronic conditions might also go unde-tected by the SLOs because they are not severe enoughto violate the thresholds.
3.3 Graph-theoreticGraph-theoretic techiques analyze communication pat-
terns across processes to track the probability that er-rors, or successes (e.g., probes) propagate through thesystem. The models may also monitor violations in ex-pected communication patterns. Graph-theoretic tech-niques are useful for diagnosing problems whose mani-festation propagates across distributed systems.
Rish et al. [16] propose an active probing approachthat drills down on the root-cause of the problem bydynamically selecting the next probe to run based ontheir current belief about the system state. Sherlock [2]exploits models of node behavior, such as failover mech-anisms, to infer the root-cause by computing the prob-ability that errors propagate from a set of possible root-cause nodes. NetMedic [9] uses a statistical approachthat does not require extensive domain knowledge todiagnose propagating problems in enterprise systems.NetMedic diagnoses problems by capturing dependen-cies between components, and analyzing the joint be-havior of these components in the past to estimate thelikelihood of them impacting one another in the present.
These techniques can be used to detect multiple in-dependent problems—ranking them by likelihood of oc-currence. However, these techniques do not addressproblems due to complex triggers as they assume thatthe root-cause of the problem stems from a single com-ponenent. In addition, since chronics do not severelyperturb system performance they can be included inthe profiles of normal behavior learned from historicaldata—causing chronics to go undetected.

3.4 Event correlationCorrelation can be used to automatically discover
causal relationships between events in distributed sys-tems. Oliner et al. [14] uses cross correlation to discovercausal relationships between anomaly signals across com-ponents. The anomaly signals represent the changes inthe behavior of components over time in terms of re-source usage, message timing or semantics over time.Giza [13] exploits knowledge of the system’s topologyto identify spatial correlations between events, e.g, cus-tomers in Texas are experiencing poor video quality.Next, Giza uses cross correlation to discover causal re-lationships between symptoms (e.g, poor video qual-ity) and diagnostic events (e.g, a network link is down).Cross correlation facilitates automatic rule discovery,and diagnosis of problems due to complex triggers. Thesetechniques also support diagnosis of multiple indepen-dent problems. Giza’s spatial aggregation of events canhelp detect chronics. However, their technique relies oncorrelating these chronic symptoms to diagnostic eventswithin the service provider’s network, e.g., alarms—thus they can fail to localize the root-cause of the de-tected chronics.
4. PROPOSED APPROACHOur overall approach consists of labeling user inter-
actions such as phone call attempts as successful oranomalous, associating additional system-level informa-tion with these interactions using system logs, and thenusing a scalable ranking function to identify a groupof attributes that best discriminates between the suc-cess and failure labels as our first chronic diagnosis. Wethen remove the interactions matching this diagnosisfrom the dataset and repeat the process to identify otherchronic problems until a bulk of the anomalous inter-actions have been explained. The approach requireslittle domain knowledge, and does not rely on modelsof system behavior or historical data to localize prob-lems. Furthermore, it is capable of localizing unantici-pated problems that have never been seen before, e.g.,misconfiguration, failed upgrades, system overload, andunanticipated interactions due to incompatible softwareversions. We describe each step of the approach in moredetail as follows.
4.1 Extract Call Labels and AttributesWe start from user-visible indications of failure in eachindividual user’s interactions with the system, i.e., at-tempts to make a phone call. Labeling of user interac-tions into success and failure interactions may or maynot be easy depending on what information is available.For example, if logs at the user end device are avail-able, identifying failed phone calls is easy. However, ifonly logs from network elements are available as in ourcase, domain-specific heuristics will often be required.
For phone calls, a user redialing the same number im-mediately after disconnection, zero talk time, or serverreported error code can be used as the failure indica-tor. In other systems, similar heuristics could work too- e.g., a user repeatedly refreshing a web page, or get-ting a HTTP error in some part of the page. Sincethese labels are used for subsequent statistical analysis,occasional mislabeling can be tolerated.
We then correlate the lower-level system log data ex-tracted from the raw CDRs with these user-level events(phone calls) to construct a “master record”. The logdata must have some common keys such as time, phonenumbers, and IP addresses that can be used to corre-late the data with the user-level event. However, thematches need not be exact, and domain-specific match-ing rules can be used. E.g., entries may belong tothe same call if the sender and receiver phone numbersmatch in all available digits and timestamps are withina small window of each other. Besides these keys, theremainder of each log entry is not required to have anyspecial semantic meaning. We can treat it simply asa bag of words. For our VoIP dataset, the end resultis a list of “master CDRs”, one for each phone call orcall attempt, and each labeled as a success or failure asshown in Figure 3.
Each master CDR consists of number of attributes in-cluding the calling and called phone numbers, call timeand duration, a number of element names and IP ad-dresses for elements that process the call, any defectand success codes generated by the element, the trunklines used, and other fields present in the CDRs. Do-main knowledge can be used to choose which attributesto include from the original raw logs.
4.2 Ranking Groups of AttributesGiven the set of master records, we then rank groups
of attributes using a scoring function that quantifiesthe ability of the group to discriminate between suc-cessful calls and failed calls. To do so, we use an itera-tive Bayesian approach to learn a simple Bernoulli (i.e.,“coin toss”) model of successes and failures. The ideais to model an attribute a as occurring in a call witha fixed, but unknown probability pa. This attributeoccurrence probability is paf for failed calls, and pas forsuccessful calls. The model estimates these unknownprobabilities using the master CDRs. However, ratherthan learning a single value, we can estimate the en-tire probability distribution of these unknown attributeoccurrence probabilities, i.e., F a
f (x) = P [paf ≤ x], andF as (x) = P [pas ≤ x]. We start with an initial estimate
for F af and F a
s , and Bayes rule is used to update thisestimate as each new call in the dataset is processed, de-pending on whether it is a successful and failed call, andwhether it contains the attribute a or not. Once thesedistributions are learned, the score is simply the KL di-

0 0.5 1
Probability(SRV3)
Failed calls Successful calls
SVR1 PHONE1 OUTCOME
1 1 0 SUCCESS
FAIL
1. Represent call attributes as truth table 2. Model distribution of each attribute
SRV3 more likely to occur in failed calls
SVR2 SVR3
0
0 0 1 1
PHONE2
0
0
FAIL0 0 1 0 1
Figure 3: An overview of steps used by our top-down, statistical diagnosis algorithm.
vergence [11], a standard information-theoretic metricof the “difference” between two distributions, computedbetween these success and failure attribute occurrenceprobability distributions.
Figure 3 shows how the scoring works in terms ofthe density functions for the success and failure at-tribute occurrence probability distributions. Intuitively,it scores higher those attribute groups that are morelikely to occur in failed calls than in successful calls,but it does so while taking into account the volume ofdata observed. This allows us to increase confidence aswe observe more calls. For example, the score is higherafter observing an attribute in 50 out of 100 failed callsas compared to observing it in 1 out of 2 failed calls,even though both scenarios have the same underlyingprobability pf of 0.5.
We can scalably compute the score for large numbersof attribute groups and over large CDR volumes becausethe KL divergence can be reduced to a closed form equa-tion due to two textbook results. The first result is thatBeta distributions are conjugate priors for Bernoullimodels, i.e., if a Beta distribution Beta(x, y) is usedas an initial estimate for distribution F a
f (or F as ), and
the forward probability P [a appears in a failed call|F af ]
(and similarly for successful calls) is given by a Bernoullidistribution, then the new estimate for F a
f after apply-ing Bayes rule is also a Beta distribution Beta(x+a, y+b), where a and b are the number of calls with and with-out attribute a, respectively. The second result is thatthe KL divergence between two Beta distributed ran-dom variables, X ∼ Beta(a, b) and Y ∼ Beta(c, d) isgiven by the Equation
KL(Y ||X) = lnB(a, b)
B(c, d)− (a− c)ψ(c)− (b− d)ψ(d)
+(a− c+ b− d)ψ(c+ d) (1)
where B is the Beta function and ψ is the digammafunction. Therefore, if one starts with the initial as-sumption that the failure and successful call attributeoccurrence probabilities pf and ps are uniformly dis-tributed (which is a special case of the Beta distri-bution), then setting a/b = 1+#successful calls with-/without attribute a, and c/d = 1+#failed calls with-/without attribute a in Equation 1 yields the desired
score in Equation 2. A similar observation is used tocompute KL divergences between two Bernoulli modelsin [12].
score = KL(p(Attribute/Failure) ||p(Attribute/Success)) (2)
We diagnose problems involving multiple attributesby computing the score for groups of attributes. At-tribute groups can be produced systematically, by usingan inverted index to search for attribute groups having alarge number of successes and failures, they can be pro-duced by random sampling, or they can be producedby using domain-specific heuristics. Currently, we usea inverted index to produce attribute combinations sys-tematically.
After picking the group with the highest score as thefirst problem to be discovered, we then remove all calls(both success and failures) that match this attributecombination from the dataset, and then repeat the pro-cess. Doing so removes the impact of the first diagnosedproblem and allows us to ask what explains the remain-ing failures. In this manner, we can identify separateindependent failure causes.
4.3 Preliminary SuccessesApplication of our approach to VoIP data logs has
led to very promising results. We analyze 25 millionrecords in 15 minutes (i.e, 7 minutes to load the data+ 8 minutes of diagnosis time) on a 8-core Xeon HT(@2.4GHz) with 24GB of memory. We have been ableto help the chronics team quickly identify several newproblems. We list a few such instances below.
Incident 1. A repeating increase in the number of de-fects during night hours was observed associated witha given defect code illustrated in Figure 4. Our anal-ysis identified two different (business) customers as be-ing associated with the bulk of the defects. While thesecustomers accounted for large share of total defects, thedefect rate observed by the customers were a fractionof one percent. The operations team determined thatthese two customers were attempting to send faxes over-seas using unsupported codecs during US night time.

Incident 1: Persistent problem, complex triggerF
aile
d c
alls
fo
rtw
o c
ust
om
ers
Day1 Day2 Day3 Day4 Day5 Day6
Chronic nightly problem due to unsupported fax codec
Customers stop usingunsupported fax codec
Incident 2: Multiple problems exist
Fa
iled
ca
lls f
or
ne
two
rk e
lem
en
t
Day1 Day2 Day3 Day4 Day5 Day6
An unrelated chronic serverproblem emerges
Problematic serverreset
Figure 4: Multiple chronic problems exist at aproduction system.
Shortly after the date the customers were notified ofthe problem, the daily defect count associated with thisdefect code decreased by 56%.
Incident 2. Our analysis identified an independent prob-lem with a specific network element that occurred con-currently with incident 1 (see Figure 4), and accountedfor over 50% of the remaining defects when failures dueto Incident 1 were excluded. Again, overall only a frac-tion of one percent of the calls passing through this ele-ment were failing making the problem harder to identify.After the operations team reset the element, the totalnumber of daily defects associated with this defect codewas reduced by 76%, and this element was no longerimplicated by our analysis.
Incident 3. An increase in failure rate during businesshours was observed for a single defect code (see Figure5). Our analysis identified a trunk group as being asso-ciated with up to 80% of these defects. At peak, 2-3%of the calls passing this trunk group would fail. Anal-ysis by the operations team revealed two blocked CICs(Circuit Identification Codes) on the trunk group andas a result the problem would only affect calls assignedto these blocked CICs (in a round robin manner). Afterthose CICs were unblocked, the total defects associatedwith this code were reduced by 80%.
4.4 Why does it work?A number of the characteristics of our approach al-
lows it to deal well with the challenges introduced bychronic defects.
Incident 3: Persistent problem at trunk group
Fa
iled
ca
lls f
or
tru
nk g
rou
p
Day1 Day5 Day10 Day15 Day20 Day25
Chronic problem accounts for2-3% of failures at trunk group
Problem resolved
Figure 5: Chronic problem affects 2-3% of callsat trunk group in production system.
1. Separation of concurrent root causes. Our iterativeanalysis allows us to separate and localize the differ-ent causes of many concurrent chronics that persist atany given time, even if they share attributes (e.g., passthrough the same network element). By repeatedly fil-tering out calls that match dominant problems as theyare detected, we expose increasingly smaller problemsthat may earlier have been hidden in the noise.
2. Identification of novel problems. An undiagnosedchronic problem is often novel, i.e., something that op-erators have not seen before. For example, it may in-volve a new network element, or a new customer (withpotentially novel configuration issues). Since we do notrely on models learned from “normal” operation or sig-natures of known defects, our approach can be used forproblems that have never been seen before.
3. Identification of low-grade problems. Threshold-based approaches often miss chronics because of theirlow numbers. We forego thresholds by using compar-isons between successful and failed calls to identify at-tributes discriminative of failures. The Bayesian infer-ence we use can update the success and failure distribu-tions with very few calls. Therefore, our approach candetect problems with very small numbers of failures.
4. Identification of persistent problems. In some cases,chronic problems cause failed user requests consistentlyover time or consistently with the workload in the sys-tem. Any approach that attempts to identify differencesfrom “normal” behavior to identify sudden changes orspikes will fail to detect them (today is no different fromyesterday), but since our approach does not restrict usto time as the only discriminative element, it is able todiagnose such problems.
5. Identification of complex triggers. Because our ap-proach evaluates many groups of attributes against thescoring function, it can identify problems that occuronly when multiple conditions (encoded by attributes)are satisfied at once.
4.5 Next StepsOur approach requires traces that label every user-
interaction with the system as successful or anomalous.The focus of our approach is not anomaly-detectionbut rather localizing the root-cause of problems onceanomalies are identified. At present, our approach as-sumes the call attributes are binary, and does not caterfor real-valued attributes such as CPU and memory-usage. We have observed false-positives when the un-derlying root-cause is not in the call logs, e.g., routerfailures. In these instances, we implicate network el-ements adjacent to the faulty router. We are extend-ing our approach to incorporate additional data sourcessuch as router logs, and to cope with real-valued data.
5. CONCLUSIONThis paper discusses the challenges associated with dis-covering and diagnosing chronics, i.e., recurrent prob-lems that fly under the radar and do not trigger alarmthresholds. We present a new statistical approach forthe diagnosis of never-before seen chronics that doesnot rely on models of system behavior, or historicaldata to localize problems. Our approach uses a scalableBayesian distribution learner coupled with an information-theoretic measure of distance, to identify the sets of at-tributes that best distinguish failed requests from suc-cessful requests. We present preliminary results whichdemonstrate the usefulness of our approach for diagnos-ing actual chronics in a large VoIP system. Despite ourfocus on VoIP systems, we believe that our findings canbe applied to other large-scale distributed systems thatlog the outcomes of individual user transactions.
6. REFERENCES[1] M. K. Agarwal, M. Gupta, V. Mann,
N. Sachindran, N. Anerousis, and L. B.Mummert. Problem determination in enterprisemiddleware systems using change pointcorrelation of time series data. In NOMS, pages471–482, Vancouver, Canada, April 2006.
[2] P. Bahl, R. Chandra, A. G. Greenberg,S. Kandula, D. A. Maltz, and M. Zhang. Towardshighly reliable enterprise network services viainference of multi-level dependencies. InSIGCOMM, pages 13–24, Kyoto, Japan, August2007.
[3] P. Barham, A. Donnelly, R. Isaacs, andR. Mortier. Using Magpie for request extractionand workload modelling. In OSDI, pages 259–272,San Francisco, CA, December 2004.
[4] P. Bodik, M. Goldszmidt, A. Fox, D. B. Woodard,and H. Andersen. Fingerprinting the datacenter:automated classification of performance crises. InEuroSys, pages 111–124, Paris, France, April 2010.
[5] M. Chen, A. X. Zheng, J. Lloyd, M. I. Jordan, andE. Brewer. Failure diagnosis using decision trees.In ICAC, pages 36–43, New York, NY, May 2004.
[6] I. Cohen, S. Zhang, M. Goldszmidt, J. Symons,T. Kelly, and A. Fox. Capturing, indexing,clustering, and retrieving system history. InSOSP, pages 105–118, Brighton, United Kingdom,October 2005.
[7] Comcast. The Comcast Corporation, 2011.http://www.comcast.com.
[8] S. Duan and S. Babu. Guided problem diagnosisthrough active learning. In ICAC, pages 45–54,Chicago, IL, June 2008.
[9] S. Kandula, R. Mahajan, P. Verkaik, S. Agarwal,J. Padhye, and P. Bahl. Detailed diagnosis inenterprise networks. In SIGCOMM, pages243–254, Barcelona, Spain, August 2009.
[10] E. Kiciman and A. Fox. Detectingapplication-level failures in component-basedinternet services. IEEE Trans. on NeuralNetworks: Special Issue on Adaptive LearningSystems in Communication Networks, 16(5):1027–1041, September 2005.
[11] S. Kullback and R. A. Leibler. On informationand sufficiency. The Annals of MathematicalStatistics, 22:79–86, March 1951.
[12] C. Liu, Z. Lian, and J. Han. How Bayesiansdebug. In ICDM, pages 382–393, Hong Kong,China, December 2006.
[13] A. A. Mahimkar, Z. Ge, A. Shaikh, J. Wang,J. Yates, Y. Zhang, and Q. Zhao. Towardsautomated performance diagnosis in a large IPTVnetwork. In SIGCOMM, pages 231–242,Barcelona, Spain, August 2009.
[14] A. J. Oliner, A. V. Kulkarni, and A. Aiken. Usingcorrelated surprise to infer shared influence. InDSN, pages 191–200, Chicago, IL, July 2010.
[15] Qwest. Qwest Communications International,Inc., 2011. http://www.qwest.com.
[16] I. Rish, M. Brodie, N. Odintsova, S. Ma, andG. Grabarnik. Real-time problem determinationin distributed systems using active probing. InNOMS, pages 133–146, Seoul, South Korea, April2004.
[17] R. R. Sambasivan, A. X. Zheng, M. D. Rosa,E. Krevat, S. Whitman, M. Stroucken, W. Wang,L. Xu, and G. R. Ganger. Diagnosingperformance changes by comparing request flows.In NSDI, pages 43–56, Boston, MA, March 2011.
[18] M. Sauter. Beyond 3G - Bringing Networks,Terminals and the Web Together: LTE, WiMAX,IMS, 4G Devices and the Mobile Web 2.0. WileyPublishing, 2009.
[19] S. A. Yemini, S. Kliger, E. Mozes, Y. Yemini, andD. Ohsie. High speed and robust eventcorrelation. Communications Magazine, IEEE,34(5):82–90, May 1996.