POVERTY TRENDS AND VARIABILITY IN DELTA STATE, NIGERIA.
17
IJPSS Volume 3, Issue 5 ISSN: 2249-5894 _________________________________________________________ A Monthly Double-Blind Peer Reviewed Refereed Open Access International e-Journal - Included in the International Serial Directories Indexed & Listed at: Ulrich's Periodicals Directory ©, U.S.A., Open J-Gage, India as well as in Cabell’s Directories of Publishing Opportunities, U.S.A. International Journal of Physical and Social Sciences http://www.ijmra.us 58 May 2013 Spatial Trends and Variability of Poverty in Delta State, Nigeria Clement Ebizimor Stephen Enyinnaya Eluwa Abstract Using a household national sample survey of 2,500 households by the National Bureau of Statistics (NBS), this study examines the spatial trends and variability of poverty among households in the three senatorial districts of Delta State, Nigeria. Findings showed that only 2 % of the respondents had access to personal computers while 40% owned mobile phones. In terms of access to basic infrastructure (clean water, waste disposal, electricity), the central and north senatorial districts were better off compared to the south district. This study suggests more investment by government in information and communication technology and improved sanitation especially in the south senatorial district. Keywords: Poverty, Delta State, Spatial trends, household infrastructure Department of Geography, University of Ibadan, Nigeria Faculty of Built Environment, Universiti Teknologi, Malaysia
Transcript of POVERTY TRENDS AND VARIABILITY IN DELTA STATE, NIGERIA.
IJPSS Volume 3, Issue 5 ISSN: 2249-5894 _________________________________________________________
A Monthly Double-Blind Peer Reviewed Refereed Open Access International e-Journal - Included in the International Serial Directories Indexed & Listed at: Ulrich's Periodicals Directory ©, U.S.A., Open J-Gage, India as well as in Cabell’s Directories of Publishing Opportunities, U.S.A.
International Journal of Physical and Social Sciences
http://www.ijmra.us
58
May
2013
Spatial Trends and Variability of Poverty in
Delta State, Nigeria
Clement Ebizimor
Stephen Enyinnaya Eluwa
Abstract
Using a household national sample survey of 2,500 households by the National Bureau of
Statistics (NBS), this study examines the spatial trends and variability of poverty among
households in the three senatorial districts of Delta State, Nigeria. Findings showed that only 2 %
of the respondents had access to personal computers while 40% owned mobile phones. In terms
of access to basic infrastructure (clean water, waste disposal, electricity), the central and north
senatorial districts were better off compared to the south district. This study suggests more
investment by government in information and communication technology and improved
sanitation especially in the south senatorial district.
Keywords: Poverty, Delta State, Spatial trends, household infrastructure
Department of Geography, University of Ibadan, Nigeria
Faculty of Built Environment, Universiti Teknologi, Malaysia
IJPSS Volume 3, Issue 5 ISSN: 2249-5894 _________________________________________________________
A Monthly Double-Blind Peer Reviewed Refereed Open Access International e-Journal - Included in the International Serial Directories Indexed & Listed at: Ulrich's Periodicals Directory ©, U.S.A., Open J-Gage, India as well as in Cabell’s Directories of Publishing Opportunities, U.S.A.
International Journal of Physical and Social Sciences
http://www.ijmra.us
59
May
2013
Introduction
Poverty is a multidimensional, dynamic, complex, gender and location specific
phenomenon(World Bank 2000a).Abumere (1998) defines the poor as those with income below
the poverty line, lack access to basic services, practical contacts and other forms of support,
people in isolated rural areas and the marginal urban zones where essential infrastructures are
lacking. According to Ravallion (1994, p. 3), “Poverty can be said to exist in a given society
when one or more persons do not attain a level of economic well-being deemed to constitute a
reasonable minimum by the standards of that society”. The definition provided by Ravallion
suggests that the concept of poverty is very much determined by the norms, values and
circumstances of the society. The NBS (2011) report indicates that about 112.52 million
Nigerians are living below the poverty line, this represents about 68.7 percent of the Nigerian
population, despite the fact that the Nigerian economy is growing at 7 percent per annum, the
proportion of Nigerians living in poverty is increasing every year and more severely aggravated,
the sum of $2.00 per day or its local equivalent of about N300.00 is not enough to provide an
escape route out of the poverty circle for a person living in Nigeria. Despite various
governments‟ effort to reduce poverty incidence through poverty alleviation programmes and
strategies and the quest to be one of the 20 largest economies by the year 2020, Nigeria continues
to be one of the poorest countries in the world. The Nigerian poverty rate stood at 69 percent in
2010, while 93.9 percent Nigerians considered themselves to be poor in 2010 as against 75.5
percent recorded in 2004, NBS (2011).Between 1990 and 2011, according to the latest United
Nations Reports, food prices are back on the rise, causing an increase in global poverty for the
first time in nearly two decades.
One of the major challenges for targeting the poor lies in the spatial complexity of the
problem, (the space effect on poverty transition and variation). Poverty variations are influenced
by living in a place (geographical location, accessibility, availability of resources, and so on) and
socio-cultural factors (changes in household composition, employment status, educational status,
ownership of assets, human capability, remittances, health and disability status). Each of these
parameters has a spatial dimension which can be explained; building our understanding of
possible moderators of improving livelihoods and exit from poverty, have a better understanding
of the spatial dynamics, effect, pattern, trend and duration of poverty transition experienced in
both rural and urban areas. Investigating poverty dynamics necessarily begins with the
IJPSS Volume 3, Issue 5 ISSN: 2249-5894 _________________________________________________________
A Monthly Double-Blind Peer Reviewed Refereed Open Access International e-Journal - Included in the International Serial Directories Indexed & Listed at: Ulrich's Periodicals Directory ©, U.S.A., Open J-Gage, India as well as in Cabell’s Directories of Publishing Opportunities, U.S.A.
International Journal of Physical and Social Sciences
http://www.ijmra.us
60
May
2013
questions: How is poverty defined and what are the dynamics of poverty transition? The dynamic
nature of poverty adds an important aspect to the analysis of poverty as some households
experience poverty for long periods of time, while others only experience it on a temporary
basis, there are considerable flows into and out of poverty pool (Baulch&Hoddinott, 2000).
There is a popular perception that poverty in both developing and industrialized countries is a
structural, long-term phenomenon (Baulch, 1998), but the literature indicates that poverty is a
temporary phenomenon with a high percentage of households shown to have moved into poverty
due to temporary shocks (such as illness, loss of job, loss of household head, and so on) which
could be reversed. The “trigger events” or spatial and socio-cultural dynamics include
geographic location, space effect on poverty transition, accessibility and availability of resources,
changes in household composition, employment status, educational status, ownership of assets,
human capability, remittances, health and disability status. Poverty dynamics enables a better
understanding of the extent of poverty transition over space and time, and a knowledge of the
factors associated with movements in and out of poverty among the vulnerable groups.
Over the years, different national poverty profiles have been constructed for example (World
Bank 1996, NHDR 1996 and 1998, FOS 1999) telling who the poor are, how they are, where
they live, why they are poor, what socioeconomic groups they belong and their characteristics,
transition dynamics experienced, and the participation of the poor themselves in activities that
would “push” or “pull” them out of poverty is the key to poverty transition particularly, exit from
poverty.
Literature review
Spatial Distribution and Variability
The poverty mapping studies conducted in Kenya, Uganda, Vietnam, Sri Lanka and several
other developing countries reported spatial variability of poverty across geographic domains (
Baulch, 2002a, ). The variability in spatial distribution of poverty is related to its geographic
determinants such as differences in geographic and agro-climatic conditions, infrastructure, good
road networks, access to market and public facilities, information technology, the presence or
absence of natural resources such as forests, crude oil, natural gas, solid minerals or water bodies
IJPSS Volume 3, Issue 5 ISSN: 2249-5894 _________________________________________________________
A Monthly Double-Blind Peer Reviewed Refereed Open Access International e-Journal - Included in the International Serial Directories Indexed & Listed at: Ulrich's Periodicals Directory ©, U.S.A., Open J-Gage, India as well as in Cabell’s Directories of Publishing Opportunities, U.S.A.
International Journal of Physical and Social Sciences
http://www.ijmra.us
61
May
2013
and socio-cultural and historical factors.The World Bank reports focused mainly on national and
regional levels with less attention on local level poverty dynamics (community, household,
individual). There is lack of analysis at the micro level to fill the gap in knowledge on why and
how spatial disparities exist and why people in certain places remain poor for periods of time
(i.e. time and space).
Poverty Transition and Vulnerability
There is limited but growing literature on poverty transitions, most studies used longitudinal
panel data and apply various methods of logit and probit regression (Dercon& Shapiro,2007;
Baulch& McCulloch, 2002), multivariate analysis (Woolard& Klasen,2005),and multinomial
logit model (Cappellari& Jenkins, 2004; Adepoju, 2012).Bhide and Mehta (2003) suggest that
multinomial model is a good substitute for the logit and probitmodels, multinomial model
permits multi-level analysis and identifies more than two categories when studying poverty
dynamics. The dynamic nature of poverty adds an important aspect to the analysis of poverty as
some households experience poverty for long periods of time, while others experience it on
temporary basis due to the negative shocks that results into a sudden loss of welfare.
Bane and Ellwood (1986) and Stevens (1994; 1999) examined poverty exit rates. In general,
their results suggest that the longer a person has been poor, the less likely it is that he or she will
escape poverty. Poverty exit rates have been found to be quite different across population sub-
groups and races. Analyses carried out separately by both authors show that poverty exit rates are
higher for whites than for blacks and female headed households and children are groups most
likely to enter poverty, (Eller 1996; Naifeh 1998; Stevens 1999).
Transitions from a female-headed household to a male-headed household were experienced
by 10.1 percent of individuals who exited poverty. Moving from a one-parent to a two-parent
family is also associated with transitions out of poverty, although gaining a parent is more
important for transitions out of poverty for blacks than non-blacks (Duncan and Rodgers,1991).
Determinants of Transient Poverty
Iceland (1997b) uses a multivariate framework to examine “the effect of four structural
characteristics on individual poverty exits: (1) economic restructuring, (2) skills mismatches, (3)
IJPSS Volume 3, Issue 5 ISSN: 2249-5894 _________________________________________________________
A Monthly Double-Blind Peer Reviewed Refereed Open Access International e-Journal - Included in the International Serial Directories Indexed & Listed at: Ulrich's Periodicals Directory ©, U.S.A., Open J-Gage, India as well as in Cabell’s Directories of Publishing Opportunities, U.S.A.
International Journal of Physical and Social Sciences
http://www.ijmra.us
62
May
2013
racial residential segregation, and (4) welfare benefit levels. Results showed that these factors
play a role in explaining African-Americans‟ economic disadvantages, but they have a weaker
and often contrary impact on whites‟ poverty exit (p. 429). Jalan and Ravallion (1998)
investigated the determinants of chronic and transient poverty using the censored conditional
quintile regression method, result of their analysis showed that while physical assets were more
important determinants of transient poverty, chronic poverty was highly influenced by
demographic characteristics of the household.
Adepoju (2012) investigated dynamics of poverty in rural southwest Nigeria using
regional panel data, results revealed an overlap between the determinants of chronic poverty and
transient poverty while 6.8 percent exited poverty a larger proportion 15.5 percent moved into
poverty and the level of education of household heads had a strong positive influence on the
likelihood of exiting poverty, and the findings of the 2006 Core Welfare Indicator Questionnaire
(CWIQ) survey conducted by National Bureau of Statistics revealed that 67 percent or 2/3 of
Nigeria‟s rural population were poor compared to 57.9 percent in urban areas. Haddad and
Ahmed (2002) investigated poverty transition in Egypt using panel data and both poverty
transition matrix and component approach, findings showed that poverty was largely chronic
while those who moved into poverty were twice over those who exited poverty. Baulch and
McCulloch (1998) in an attempt to study poverty status and its transitions in rural Pakistan used
panel survey data of around 800 households on 52 villages conducted by International Food
Policy Research Institute (IFPRI) between July 1986 and October 1991. The analysis shows that
while the incidence of income poverty was high (between 21 and 29 percent), turnover among
the poor were also rapid as in each year of the survey. Between 46 and 51 percent of the poor
households exited poverty from one year to another.
Conceptual and Theoretical Framework
This section discusses a review of relevant conceptual and theoretical formulations about
poverty dynamics and poverty transitions in a population. The theories could be broadly
classified into spatial and non–spatial theories, which include: The Theory of Fractal Poverty
Traps, Life Course Transition Model, Sustainable Livelihood Approach, Poverty Transition
Matrix, Culture of Poverty Theory and Model of Poverty.
IJPSS Volume 3, Issue 5 ISSN: 2249-5894 _________________________________________________________
A Monthly Double-Blind Peer Reviewed Refereed Open Access International e-Journal - Included in the International Serial Directories Indexed & Listed at: Ulrich's Periodicals Directory ©, U.S.A., Open J-Gage, India as well as in Cabell’s Directories of Publishing Opportunities, U.S.A.
International Journal of Physical and Social Sciences
http://www.ijmra.us
63
May
2013
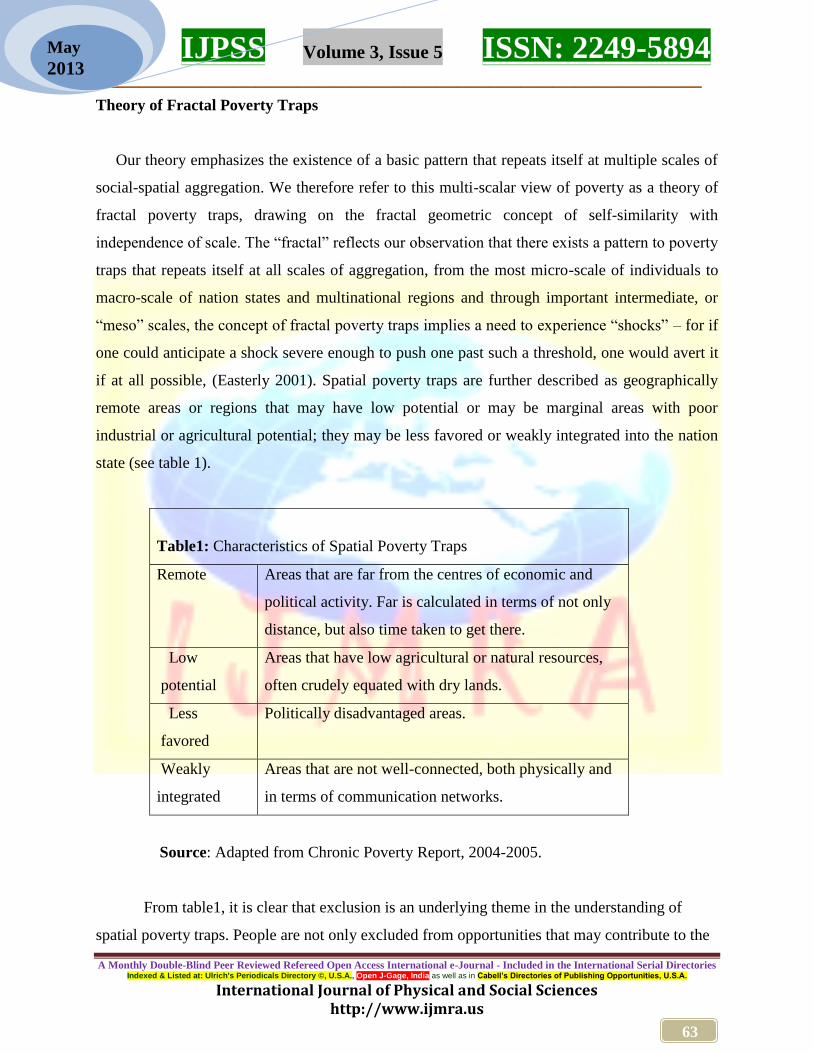
Theory of Fractal Poverty Traps
Our theory emphasizes the existence of a basic pattern that repeats itself at multiple scales of
social-spatial aggregation. We therefore refer to this multi-scalar view of poverty as a theory of
fractal poverty traps, drawing on the fractal geometric concept of self-similarity with
independence of scale. The “fractal” reflects our observation that there exists a pattern to poverty
traps that repeats itself at all scales of aggregation, from the most micro-scale of individuals to
macro-scale of nation states and multinational regions and through important intermediate, or
“meso” scales, the concept of fractal poverty traps implies a need to experience “shocks” – for if
one could anticipate a shock severe enough to push one past such a threshold, one would avert it
if at all possible, (Easterly 2001). Spatial poverty traps are further described as geographically
remote areas or regions that may have low potential or may be marginal areas with poor
industrial or agricultural potential; they may be less favored or weakly integrated into the nation
state (see table 1).
Table1: Characteristics of Spatial Poverty Traps
Remote Areas that are far from the centres of economic and
political activity. Far is calculated in terms of not only
distance, but also time taken to get there.
Low
potential
Areas that have low agricultural or natural resources,
often crudely equated with dry lands.
Less
favored
Politically disadvantaged areas.
Weakly
integrated
Areas that are not well-connected, both physically and
in terms of communication networks.
Source: Adapted from Chronic Poverty Report, 2004-2005.
From table1, it is clear that exclusion is an underlying theme in the understanding of
spatial poverty traps. People are not only excluded from opportunities that may contribute to the
IJPSS Volume 3, Issue 5 ISSN: 2249-5894 _________________________________________________________
A Monthly Double-Blind Peer Reviewed Refereed Open Access International e-Journal - Included in the International Serial Directories Indexed & Listed at: Ulrich's Periodicals Directory ©, U.S.A., Open J-Gage, India as well as in Cabell’s Directories of Publishing Opportunities, U.S.A.
International Journal of Physical and Social Sciences
http://www.ijmra.us
64
May
2013
enhancement of various aspects of their lives, they are actively ignored and less favored. This
social exclusion is strongly linked to both state and societal failures. Sources of exclusion
include: physical isolation, ethnicity and religious discrimination, bureaucratic barriers and the
nature of local politics.
The Life Course Transition Model
Several fundamental principles characterize the life course approach, they include: socio-
historical and geographical location; timing of lives; heterogeneity or variability; "linked lives"
and social ties to others; human agency and personal control; and how one‟s past shapes the
future. In the life course perspective, space, time and transition have dominant influences on
individuals‟ life. In the past, poverty was conceptualized and empirically investigated in absolute
or static terms. However, life course theory challenges this approach and introduced the concepts
of individual life histories, life cycle as well as life transitions. The turning point is a change in
direction in one‟s life course with respect to previously established condition or situation
(Clausen 1995), the cited turning points were not dramatic or major events but instead subtly
evolving changes in the roles or organization of life that have greater effect with time and over
space (McDonough &Berglund 2003).
Concept of Sustainable Livelihood Approach
According to Chambers and Conway (1992:9) “a livelihood comprises the capabilities,
assets and activities required for a means of living”. The approach serves as an instrument for the
investigation of poor people‟s livelihoods, whilst visualizing the main factors of influence which
can be understood by qualitative and participatory analysis at the local or communal level,
regardless of where (i.e. which sector or geographical space) these occur. (See figure2)
IJPSS Volume 3, Issue 5 ISSN: 2249-5894 _________________________________________________________
A Monthly Double-Blind Peer Reviewed Refereed Open Access International e-Journal - Included in the International Serial Directories Indexed & Listed at: Ulrich's Periodicals Directory ©, U.S.A., Open J-Gage, India as well as in Cabell’s Directories of Publishing Opportunities, U.S.A.
International Journal of Physical and Social Sciences
http://www.ijmra.us
65
May
2013
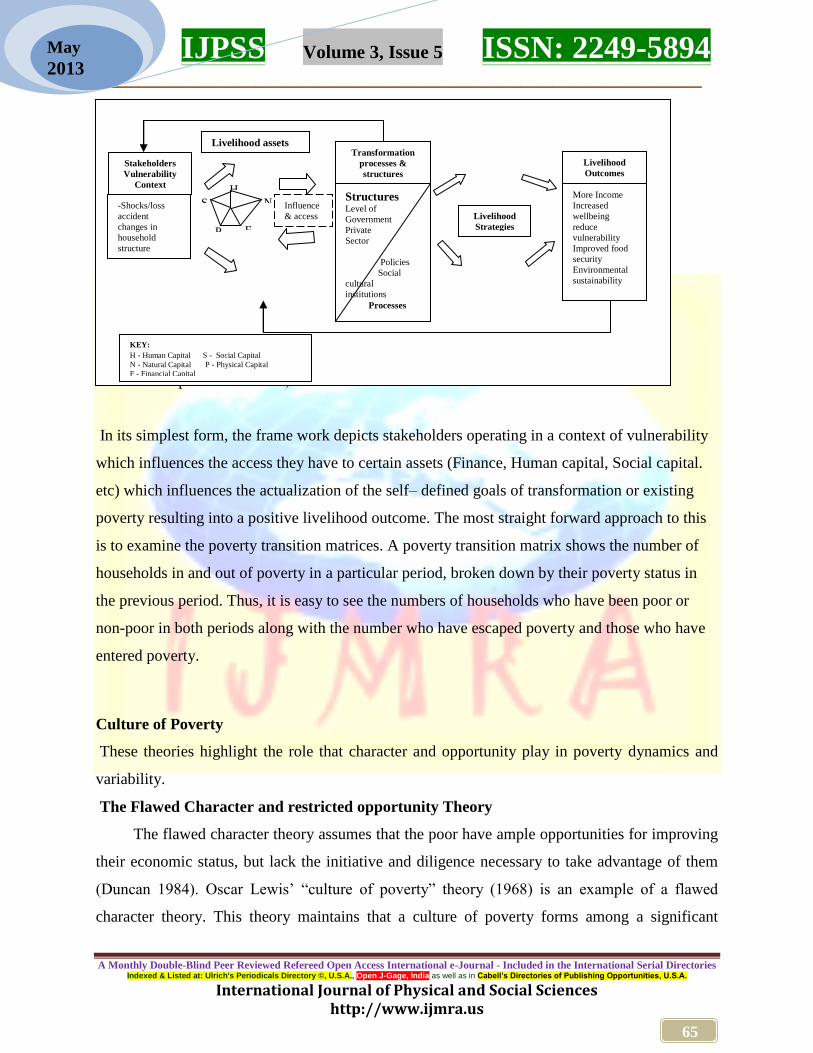
Figure 1: Sustainable Livelihoods Framework (SLF)
Source: Adapted From DFID, 2000.
In its simplest form, the frame work depicts stakeholders operating in a context of vulnerability
which influences the access they have to certain assets (Finance, Human capital, Social capital.
etc) which influences the actualization of the self– defined goals of transformation or existing
poverty resulting into a positive livelihood outcome. The most straight forward approach to this
is to examine the poverty transition matrices. A poverty transition matrix shows the number of
households in and out of poverty in a particular period, broken down by their poverty status in
the previous period. Thus, it is easy to see the numbers of households who have been poor or
non-poor in both periods along with the number who have escaped poverty and those who have
entered poverty.
Culture of Poverty
These theories highlight the role that character and opportunity play in poverty dynamics and
variability.
The Flawed Character and restricted opportunity Theory
The flawed character theory assumes that the poor have ample opportunities for improving
their economic status, but lack the initiative and diligence necessary to take advantage of them
(Duncan 1984). Oscar Lewis‟ “culture of poverty” theory (1968) is an example of a flawed
character theory. This theory maintains that a culture of poverty forms among a significant
Stakeholders
Vulnerability
Context
Livelihood assets Transformation
processes &
structures
-Shocks/loss
accident
changes in
household
structure
Structures Level of
Government
Private
Sector
Policies
Social
cultural
institutions
Processes
Livelihood
Strategies
More Income
Increased
wellbeing
reduce
vulnerability
Improved food
security
Environmental
sustainability
Livelihood
Outcomes
Influence
& access
N
F P
H S
KEY:
H - Human Capital S - Social Capital
N - Natural Capital P - Physical Capital
F - Financial Capital
IJPSS Volume 3, Issue 5 ISSN: 2249-5894 _________________________________________________________
A Monthly Double-Blind Peer Reviewed Refereed Open Access International e-Journal - Included in the International Serial Directories Indexed & Listed at: Ulrich's Periodicals Directory ©, U.S.A., Open J-Gage, India as well as in Cabell’s Directories of Publishing Opportunities, U.S.A.
International Journal of Physical and Social Sciences
http://www.ijmra.us
66
May
2013
minority of the poor such that people are not psychologically geared to take advantage of
opportunities that may come their way. The restricted opportunity theory on the order hand
contend that the poor lack sufficient access to economic opportunities and cannot avoid poverty
unless their economic opportunities improve (Duncan 1984).
Methodology and Materials
This study examines the spatial trends of poverty and variability among households in
Delta State, Nigeria. The research design employed was based on the 2006 National Sample
Survey for monitoring poverty in the country, a total of 2,500 households were sampled, and
1,900households lived in rural areas, while 600 lived in urban areas. Some of the key indicators
used in the questionnaire (information and communication technology, clean water, sanitation,
education, medical facilities, employment status, electricity) were used in assessing the spatial
variation of poverty in the study. The analysis was cross sectional and descriptive. Although, the
household was used as the unit of measurement, poverty dynamics experienced by individuals‟
specifically household heads was examined and analyzed.
Geography of Delta State
Delta state is one of the major oil producing states in Nigeria named after the delta of the
river Niger and is situated in the region known as the Niger-Delta. It is generally low-lying and
has three seaports namely, Warri, Sapele and Koko. The state lies approximately between
Longitude 5000 and 6
0 45
1 East and Latitude 5
000 and 6
0 30
1 North, it is bounded in the North by
Edo State, the East by Anambra State, South East by Bayelsa State and on the Southern flank is
the Bight of Benin which covers about 160 kilometers of the State‟s coastline. The State has
wide coastal belt inter – lace with rivulets and streams and the state is grouped into three
senatorial districts namely Delta North, Delta South and Delta Central for easy administrative
purposes. The state has a total land area of 16,842 km2. Why Delta State? Delta State is
ethnically diverse and heterogeneous, a replica of Nigeria with high cost of living and high
incidence of poverty, environmental degradation, and deprivation. Based on self-classified
poverty situation, 74.8 percent of households in the south are classified poor, 64.3 percent of
IJPSS Volume 3, Issue 5 ISSN: 2249-5894 _________________________________________________________
A Monthly Double-Blind Peer Reviewed Refereed Open Access International e-Journal - Included in the International Serial Directories Indexed & Listed at: Ulrich's Periodicals Directory ©, U.S.A., Open J-Gage, India as well as in Cabell’s Directories of Publishing Opportunities, U.S.A.
International Journal of Physical and Social Sciences
http://www.ijmra.us
67
May
2013
households in the north and 51.4 percent of households in the central district were also classified
poor, NBS (2006), with a population of 4,098,291 (Males: 2,674,306 Females: 2,024,085 (see
Federal Republic of Nigeria, Official Gazette, No. 24, vol. 94, 2009) .
Discussion of Findings and Results
Poverty indicators
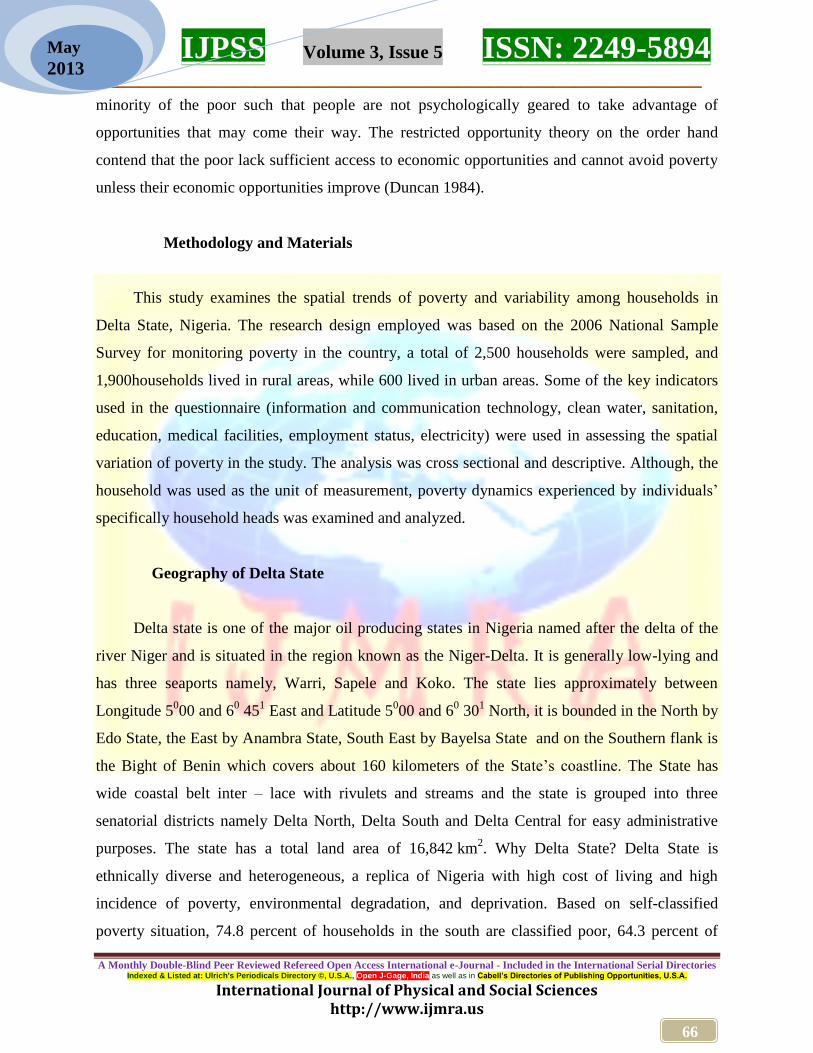
I. Information technology and telecommunication
Some core indicators adopted in the NBS questionnaire survey were used in assessing the
spatial variation of poverty across the three senatorial districts of the study area. The breakdown
of the results in fig. 2 shows that the level of access to information technology and
telecommunication is still below average. As could be seen from the results, less than 40% of all
the respondents owned a handset phone while only 2 % or less had access to personal computer.
However, there are variations across the senatorial districts. In terms of ownership of handset
phone,central senatorial district has more respondents (38.4 %) as compared to north (34.2 %)
and south (27.2 %). Similarly, more respondents from central have access to personal computer
as compared to south (0.9 %) and north (0.8 %) respectively.
Fig 2:Access to information technology and telecommunication
Source: CWIQ Survey 2006
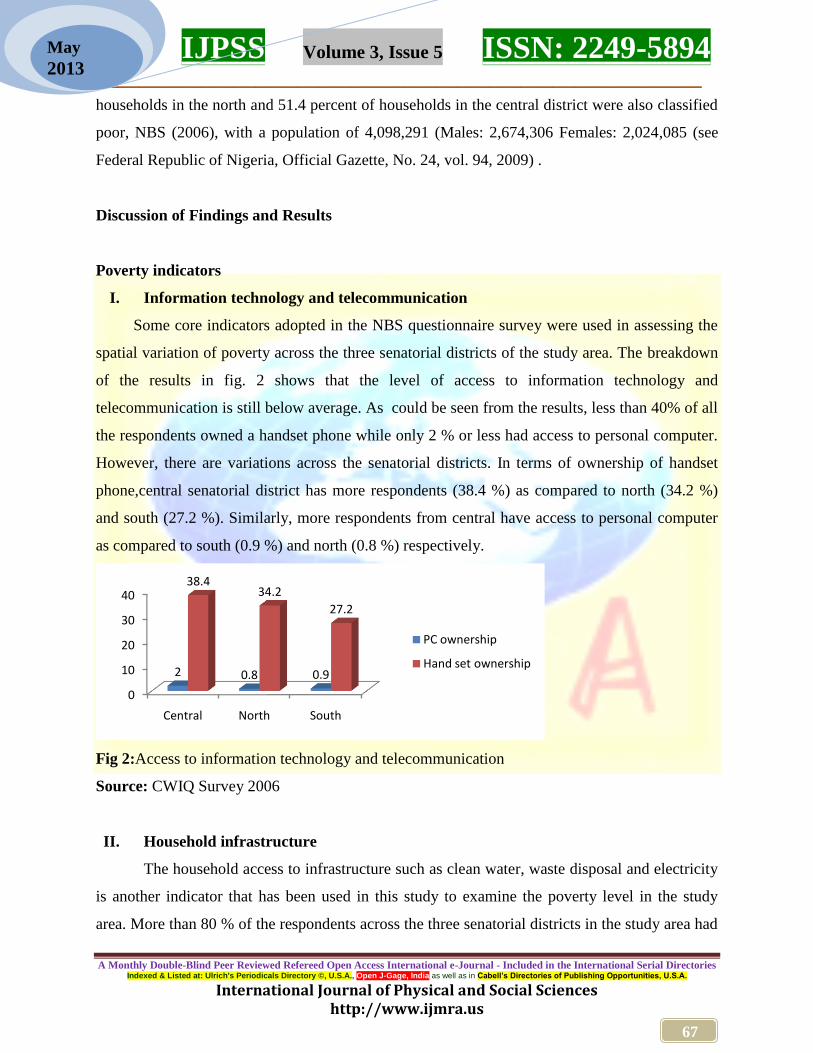
II. Household infrastructure
The household access to infrastructure such as clean water, waste disposal and electricity
is another indicator that has been used in this study to examine the poverty level in the study
area. More than 80 % of the respondents across the three senatorial districts in the study area had
0
10
20
30
40
Central North South
2 0.8 0.9
38.434.2
27.2
PC ownership
Hand set ownership
IJPSS Volume 3, Issue 5 ISSN: 2249-5894 _________________________________________________________
A Monthly Double-Blind Peer Reviewed Refereed Open Access International e-Journal - Included in the International Serial Directories Indexed & Listed at: Ulrich's Periodicals Directory ©, U.S.A., Open J-Gage, India as well as in Cabell’s Directories of Publishing Opportunities, U.S.A.
International Journal of Physical and Social Sciences
http://www.ijmra.us
68
May
2013
access to water. However, the situation is different when looking at access to clean and safe
water, less than 60 % had access to safe water in central and north senatorial districts as
compared to 32.1% from south senatorial district. The level of sanitation is far below average in
north and south senatorial districts. As could be seen from the breakdown of the results in fig 3,
21.4 % and 25.5% respondents sampled during the survey in north and south senatorial districts
respectively had access to safe sanitation as compared to 52.4 % from the central district .The
situation became worse when looking at improved waste disposal in the study area. Less than
20 % of respondents across the three districts had access to improved waste disposal system
.Even at that, variations existed across the districts, as 7.3 % from north had access to improved
waste disposal compared to central and south districts with above 16 %. More than 60 % of
respondents sampled in the survey had access to electricity. Majority of respondents (88%) from
the central district had access to electricity as compared to 69.1 % and 60 % respectively from
north and south districts.
Fig 3: Households‟ head access to infrastructure
Source: CWIQ Survey 2006
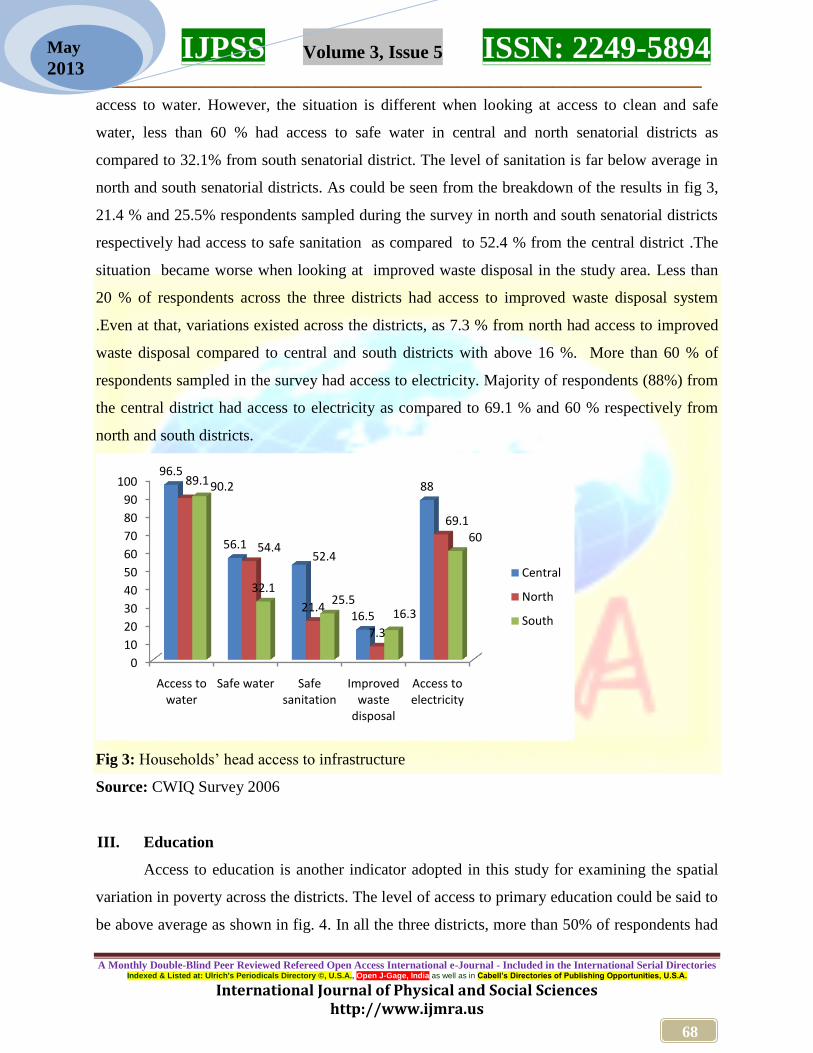
III. Education
Access to education is another indicator adopted in this study for examining the spatial
variation in poverty across the districts. The level of access to primary education could be said to
be above average as shown in fig. 4. In all the three districts, more than 50% of respondents had
0
10
20
30
40
50
60
70
80
90
100
Access to water
Safe water Safe sanitation
Improved waste
disposal
Access to electricity
96.5
56.152.4
16.5
8889.1
54.4
21.4
7.3
69.1
90.2
32.125.5
16.3
60
Central
North
South
IJPSS Volume 3, Issue 5 ISSN: 2249-5894 _________________________________________________________
A Monthly Double-Blind Peer Reviewed Refereed Open Access International e-Journal - Included in the International Serial Directories Indexed & Listed at: Ulrich's Periodicals Directory ©, U.S.A., Open J-Gage, India as well as in Cabell’s Directories of Publishing Opportunities, U.S.A.
International Journal of Physical and Social Sciences
http://www.ijmra.us
69
May
2013
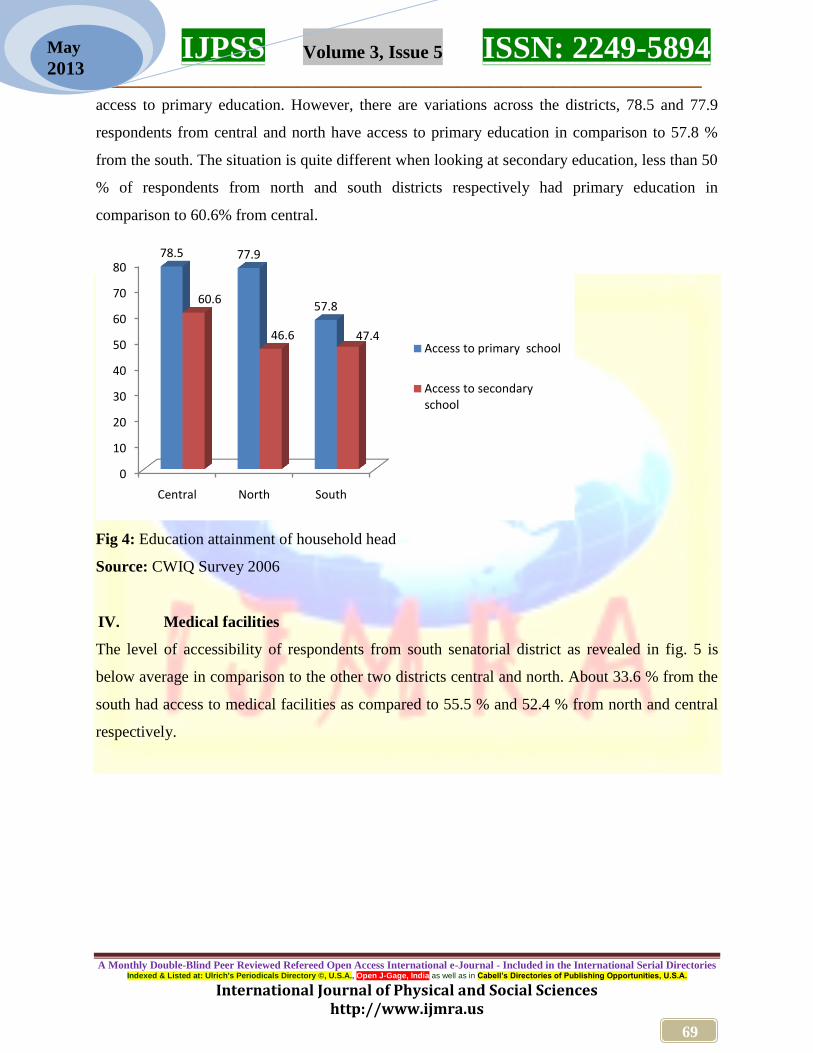
access to primary education. However, there are variations across the districts, 78.5 and 77.9
respondents from central and north have access to primary education in comparison to 57.8 %
from the south. The situation is quite different when looking at secondary education, less than 50
% of respondents from north and south districts respectively had primary education in
comparison to 60.6% from central.
Fig 4: Education attainment of household head
Source: CWIQ Survey 2006
IV. Medical facilities
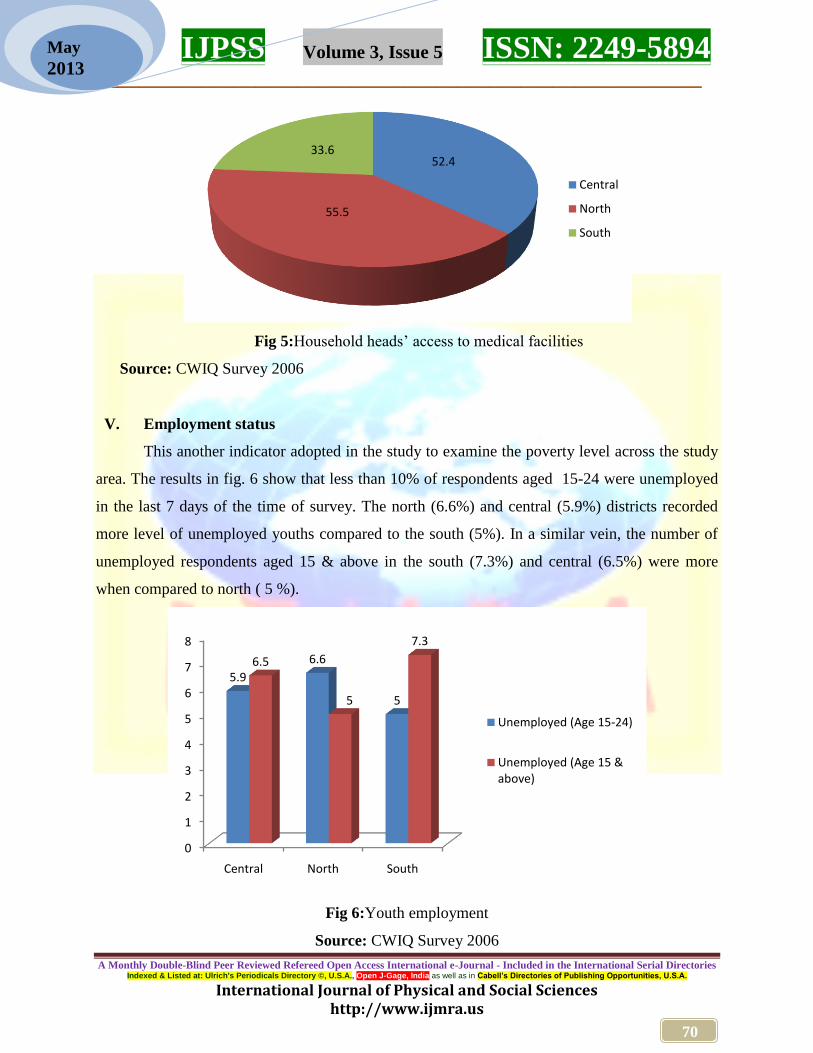
The level of accessibility of respondents from south senatorial district as revealed in fig. 5 is
below average in comparison to the other two districts central and north. About 33.6 % from the
south had access to medical facilities as compared to 55.5 % and 52.4 % from north and central
respectively.
0
10
20
30
40
50
60
70
80
Central North South
78.5 77.9
57.860.6
46.6 47.4Access to primary school
Access to secondary school
IJPSS Volume 3, Issue 5 ISSN: 2249-5894 _________________________________________________________
A Monthly Double-Blind Peer Reviewed Refereed Open Access International e-Journal - Included in the International Serial Directories Indexed & Listed at: Ulrich's Periodicals Directory ©, U.S.A., Open J-Gage, India as well as in Cabell’s Directories of Publishing Opportunities, U.S.A.
International Journal of Physical and Social Sciences
http://www.ijmra.us
70
May
2013
Fig 5:Household heads‟ access to medical facilities
Source: CWIQ Survey 2006
V. Employment status
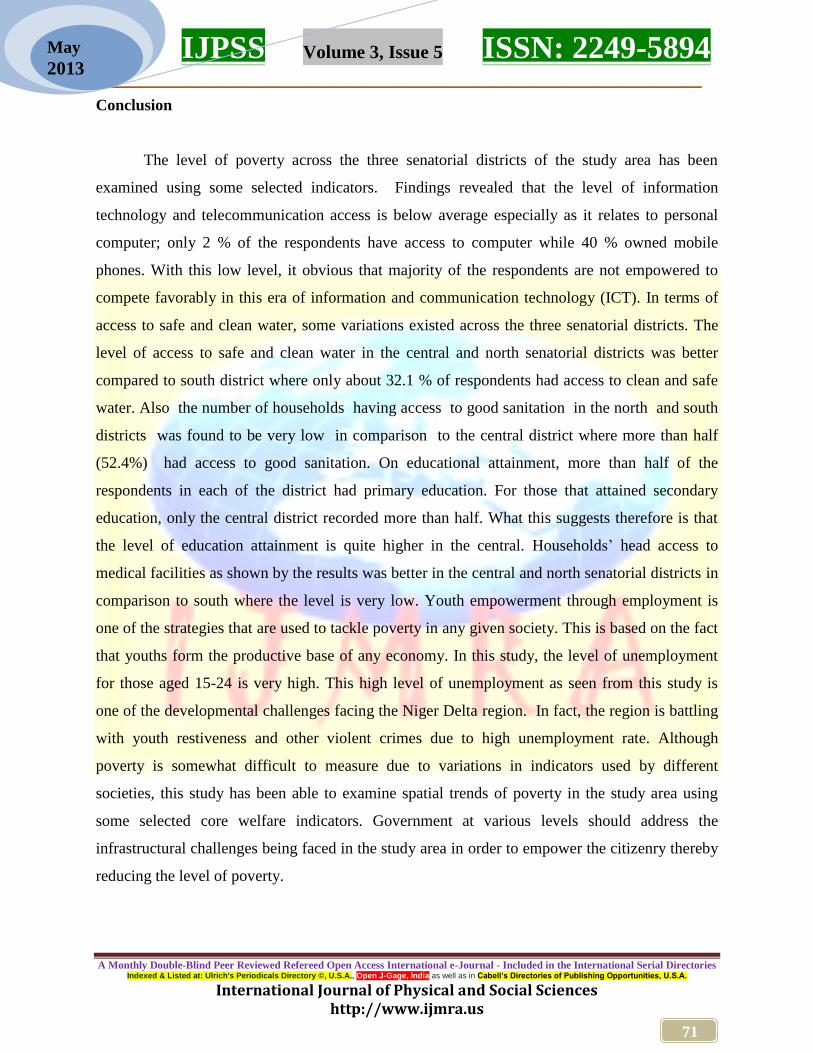
This another indicator adopted in the study to examine the poverty level across the study
area. The results in fig. 6 show that less than 10% of respondents aged 15-24 were unemployed
in the last 7 days of the time of survey. The north (6.6%) and central (5.9%) districts recorded
more level of unemployed youths compared to the south (5%). In a similar vein, the number of
unemployed respondents aged 15 & above in the south (7.3%) and central (6.5%) were more
when compared to north ( 5 %).
Fig 6:Youth employment
Source: CWIQ Survey 2006
52.4
55.5
33.6
Central
North
South
0
1
2
3
4
5
6
7
8
Central North South
5.9
6.6
5
6.5
5
7.3
Unemployed (Age 15-24)
Unemployed (Age 15 & above)
IJPSS Volume 3, Issue 5 ISSN: 2249-5894 _________________________________________________________
A Monthly Double-Blind Peer Reviewed Refereed Open Access International e-Journal - Included in the International Serial Directories Indexed & Listed at: Ulrich's Periodicals Directory ©, U.S.A., Open J-Gage, India as well as in Cabell’s Directories of Publishing Opportunities, U.S.A.
International Journal of Physical and Social Sciences
http://www.ijmra.us
71
May
2013
Conclusion
The level of poverty across the three senatorial districts of the study area has been
examined using some selected indicators. Findings revealed that the level of information
technology and telecommunication access is below average especially as it relates to personal
computer; only 2 % of the respondents have access to computer while 40 % owned mobile
phones. With this low level, it obvious that majority of the respondents are not empowered to
compete favorably in this era of information and communication technology (ICT). In terms of
access to safe and clean water, some variations existed across the three senatorial districts. The
level of access to safe and clean water in the central and north senatorial districts was better
compared to south district where only about 32.1 % of respondents had access to clean and safe
water. Also the number of households having access to good sanitation in the north and south
districts was found to be very low in comparison to the central district where more than half
(52.4%) had access to good sanitation. On educational attainment, more than half of the
respondents in each of the district had primary education. For those that attained secondary
education, only the central district recorded more than half. What this suggests therefore is that
the level of education attainment is quite higher in the central. Households‟ head access to
medical facilities as shown by the results was better in the central and north senatorial districts in
comparison to south where the level is very low. Youth empowerment through employment is
one of the strategies that are used to tackle poverty in any given society. This is based on the fact
that youths form the productive base of any economy. In this study, the level of unemployment
for those aged 15-24 is very high. This high level of unemployment as seen from this study is
one of the developmental challenges facing the Niger Delta region. In fact, the region is battling
with youth restiveness and other violent crimes due to high unemployment rate. Although
poverty is somewhat difficult to measure due to variations in indicators used by different
societies, this study has been able to examine spatial trends of poverty in the study area using
some selected core welfare indicators. Government at various levels should address the
infrastructural challenges being faced in the study area in order to empower the citizenry thereby
reducing the level of poverty.
IJPSS Volume 3, Issue 5 ISSN: 2249-5894 _________________________________________________________
A Monthly Double-Blind Peer Reviewed Refereed Open Access International e-Journal - Included in the International Serial Directories Indexed & Listed at: Ulrich's Periodicals Directory ©, U.S.A., Open J-Gage, India as well as in Cabell’s Directories of Publishing Opportunities, U.S.A.
International Journal of Physical and Social Sciences
http://www.ijmra.us
72
May
2013
REFERENCES
Abdullahi M.U. (1993). “The Design and Management of Poverty Alleviation Projects in
Africa.” Economic Development Institute (EDI) of the World Bank, Washington, D.C.
Abler, R, Adams, J.U.S. Gould, P. (1972) “Spatial Organization: The Geographer‟s view of
theWorld.” New York: Prentice – Hall International Incorporated.
Abumere S.I. (1998b) “Jurisdictional Partitioning and the poverty gap in Nigeria: Ibadan
Working Paper” Development Policy Centre.
Adepoju A.O.(2012) “ Poverty Transition in Rural SouthWest Nigeria” Global Journal of
Science Frontier Research USA, Volume 2.
AdepojuA.O.,Yusuf S.A.,OmononaB.T.andOkunmadewa F.Y.(2011) “Vulnerability Profile of
RuralHouseholds in South West Nigeria”. Journal of Agricultural Science
Vol.3,No1:pp 128-139.
Appleton, S. (1998) “Changes in Poverty in Uganda 1992 – 1996” Centre for the Study of
AfricanEconomics Working Paper Series 98-150.
Areola .O. &Okafor .S.(1998) “50 years of Geography in Nigeria”, Ibadan University Press.
Bane, Mary Jo and David Ellwood, (1986) “Slipping Into and Out of Poverty: The Dynamics of
Spells,” Journal of Human Resources, Volume 21, No.1, inter, 1-23.
Baulch .B. and Hoddinott .J (2000,2002) “Economic Mobility and Poverty Dynamics in
Developing Countries,” Journal of Development Studies 36-6:p.1-24.
Baulch B and McCulloch, N. (1998) “Being Poor and Becoming Poor: Poverty Status and
PovertyTransitions in Rural Pakistan” IDS Working Paper 79.
Canto .O. (2002) „Climbing out of Poverty and Falling In, Low income stability in Spain‟
Applied Economics, 34: 1903-1916.
Carter M.R. and May. J. (2001) “One kind of freedom: The Dynamics of Poverty in Post –
Apartheid South Africa,” World Development 29:1987-2006.
Clausen, John. A.(1995) “Gender, Context and Turning Points in the Ecology of Human
Development”,edited by Glen. H., Elder Phyliss Moen, Jr. and Kurt Luscher,
AmericanPsychology Association, Washington, D.C.
Coulombe, H. and Mckay, A. (1996) “Modeling Determinants of Poverty in Mauritania” World
Development Vol. 24,No.5, Pp. 1015 – 1031.
Duncan, Greg J.(1984) “Years of Poverty, Years of Plenty”. (Ann Arbor: Institute for Social
IJPSS Volume 3, Issue 5 ISSN: 2249-5894 _________________________________________________________
A Monthly Double-Blind Peer Reviewed Refereed Open Access International e-Journal - Included in the International Serial Directories Indexed & Listed at: Ulrich's Periodicals Directory ©, U.S.A., Open J-Gage, India as well as in Cabell’s Directories of Publishing Opportunities, U.S.A.
International Journal of Physical and Social Sciences
http://www.ijmra.us
73
May
2013
Research, The University of Michigan) .
Duncan, Greg J. and Willard Rodgers (1991) “Has Children‟s Poverty Become More
Persistent?”American Sociological Review. Vol. 56, No. 4, 538-550.
Federal Republic of Nigeria (2009). Official Gazette, No. 24, vol. 94,
FOS (1999a). “Poverty Profile for Nigeria 1980 – 1996.” Federal Office of Statistics, Abuja,
Nigeria.
Grooteart, C. and Kanbur, R. (1995) “The Lucky Few Amidst Economic Decline: Distributional
change in Cote d Ivoire As seen through panel data sets (1985-1988)” Journal of
Development Studies Vol. 31, pp. 603 - 619.
Haddad.L and Ahmed .A. (2003) “Chronic and Transitory Poverty Evidence From Egypt(1997-
1999)”.
Iceland, John (2003) “Dynamics of Economic Wellbeing 1996-1999”In current Population
Reports Washington D.C.:U.S. Census Bureau.
I.L.O. (1976b) “Meeting Basic Needs: Strategy for Eradicating Mass Poverty and
Unemployment” Conclusion of the World Employment Conference, Geneva.
Jalan, J. and Ravallion, M.(1998) “Transient Poverty in Postreform Rural China.” Journal of
Comparative Economics, Vol.26,No.2, pp.338-357.
Lewis, Oscar, La Vida (1968) London: Panther Books.
McKernan, Signe-Mary, Caroline Ratcliffe, and Stephanie Riegg. (2001). “Transition Events in
the Dynamics of Poverty: A Review of Issues and Results,” The Urban Institute.
Washington, D.C.
McKernan, Signe-Mary,and Caroline Ratcliffe, (2002) “Transition Events in the Dynamics
ofPoverty” The Urban Institute. Washington, D.C.
Nigeria Bureau of Statistics (2011) “Poverty Profile for Nigeria” NBS Office, Abuja, Nigeria.
Phipps, Shelley (2003) The impact of poverty on Health, scan of Research Literature” In Poverty
and Health, CPHI Collected Papers. Ottawa, Canada: Canadian Institute for Health
Information.
Rank, Mark and Thomas Hirschl, (1999a) “Estimating the Proportion of Americans Ever
Experiencing Poverty During their Elderly Years” The Journals of Gerontology,
Vol. 54B, Issue 4, S184-194 .
Rank, Mark and Thomas Hirschl, (1999b) “The Likelihood of Poverty across the American
IJPSS Volume 3, Issue 5 ISSN: 2249-5894 _________________________________________________________
A Monthly Double-Blind Peer Reviewed Refereed Open Access International e-Journal - Included in the International Serial Directories Indexed & Listed at: Ulrich's Periodicals Directory ©, U.S.A., Open J-Gage, India as well as in Cabell’s Directories of Publishing Opportunities, U.S.A.
International Journal of Physical and Social Sciences
http://www.ijmra.us
74
May
2013
Adult Life Span.” Social Work, Vol. 44, No. 3, 201-216 .
Rank. M. R. (2001) “The effect of Poverty on American Families Assessing our research
knowledge” Journal of family issues 22: 882-903.
Stevens and Ann Huff (1994) “The Dynamics of Poverty Spells:” Updating Bane and Ellwood‟s
AEA Papers and Proceedings, Volume 84, No. 2, May 1994,34-37.
Tunde .O. (2006) “Poverty: Causes and Solutions in the Nigerian context.”
UNDP, (1998). Human Development Report – New York: Oxford University Press.
U.S. Census Bureau, Historical Poverty Tables, (2000). http://www.census.gov/.
Woolard,I. and Klasen,S.(2005) “Determinants of Income Mobility and household poverty
Dynamics inSouth Africa” Journal of Development Studies. Vol.41,N0.5, pp.865-
897.