Employment Effectiveness of China's Economic Stimulus Package
Poverty Concentration and Determinants inChina’s Urban Low-income Neighbourhoodsand Social Groups
SHENJING HE, FULONG WU, CHRIS WEBSTER andYUTING LIU
Abstractijur_907 328..349
Based on a large-scale household survey conducted in 2007, this article reports onpoverty concentration and determinants in China’s low-income neighbourhoods andsocial groups. Three types of neighbourhood are recognized: dilapidated inner-cityneighbourhoods, declining workers’ villages and urban villages. Respondents aregrouped into four categories: working, laid-off/unemployed and retired urban residents,together with rural migrants. We first measure poverty concentration across differenttypes of neighbourhood and different groups. The highest concentrations are found indilapidated inner-city neighbourhoods and among the laid-off/unemployed. Mismatchesare found between actual hardships, sense of deprivation and distribution of socialwelfare provision. Second, we examine poverty determinants. Variations in institutionalprotection and market remuneration are becoming equally important in predictingpoverty generation, but are differently associated with it in the different neighbourhoodsand groups. As China’s urban economy is increasingly shaped by markets, themechanism of market remuneration is becoming a more important determinant ofpoverty patterns, especially for people who are excluded from state institutions, notablylaid-off workers and rural migrants.
IntroductionRural poverty in China is on the decrease but the number of urban poor is rising.Large-scale industrial restructuring and enterprise reforms have led to millions of laid-offworkers swelling the ranks of the urban poor (Solinger, 2002). Between 1993 and 1997,about 18.5 million workers were made redundant (Wang, 2004). Since 1997, a furtherstep has been taken, allowing small state-owned enterprises (SOEs) to be privatized, andmedium-sized and some large SOEs to be structured as shareholding corporations. Thenumber of redundancies from SOEs has subsequently grown. Laid-off workers areviewed as the new ‘urban underclass’ in China (Solinger, 2006). The reasons forretrenched workers being trapped in poverty lie not only in the obstacles of age and skilland education deficits, but also in the mismatch of skill and location and in the fiercecompetition among the laid-off workers themselves and between laid-off workers and
We would like to thank the IJURR reviewers for their useful and constructive comments. The researchfor this article is supported by the ESRC/DFID Grant ‘Urban Poverty and Property Rights Changes inChina’ (RES-167-25-0005) and the National Natural Science Foundation of China (40801061 and50808082). The usual disclaimers apply.
Volume 34.2 June 2010 328–49 International Journal of Urban and Regional ResearchDOI:10.1111/j.1468-2427.2010.00907.x
© 2010 The Authors. Journal Compilation © 2010 Joint Editors and Blackwell Publishing Ltd. Published by BlackwellPublishing. 9600 Garsington Road, Oxford OX4 2DQ, UK and 350 Main St, Malden, MA 02148, USA
rural migrants that drives down wages (Wang, 2004). Adding to the problem are thethronging rural migrants with low skills who are apparently willing to live in marginalconditions in the city. They have formed a substantial informal sector that depresses thejob opportunities and earnings of former state-sector employees (Zhang, 2001).According to the 2000 census data, 144.39 million rural residents in China, or 11.6% ofthe total population, had moved into cities and towns by 2000. Constrained by theurban–rural dichotomy and their comparatively low skills and educational attainments, aconsiderable proportion of rural migrants have become the new working urban poor.Laid-off workers and rural migrants have thus become two major groups experiencingurban poverty in China (Wu, 2004; Liu and Wu, 2006a; 2006b).
Intensified economic reforms in the public sector since the 1990s and large-scalerural-urban migration have broken the social and spatial patterns established in citiesduring the planned economy period (Wu, 2004; Wang, 2005a; 2005b; Liu and Wu,2006a). Adding to the spatial differentiation associated with the different ranks andscales of SOEs and COEs (collectively owned enterprises) under the planned economy,residential differentiation is further intensified in the post-reform era, as people withsimilar income or socio-economic status have started to concentrate in certainneighbourhoods (Wang, 2005a). Consequently, low-income neighbourhoods where alarge proportion of urban poor are concentrated have appeared. Evidence suggests thatthere are three main types of low-income neighbourhood — inner-city dilapidatedneighbourhoods, degraded workers’ villages (danwei compounds developed byemployers), and rural migrant enclaves formed in the so-called ‘urban villages’, i.e. areasof collectively owned village territory engulfed by an expanding city (Liu and Wu,2006b). Run-down workers’ villages became enclaves for hundreds of thousands oflaid-off workers after the SOE reforms; urban villages attracted numerous rural migrantsby offering affordable rents in unregulated housing; while the underinvested fabric of theold inner-city neighbourhoods has become home to a mixture of laid-off/unemployedinhabitants and migrants (Liu and Wu, 2006b; Liu et al., 2008). The emergence ofpoverty concentration, i.e. low-income neighbourhoods, symbolizes the rise of a newurban socio-spatial order in Chinese cities and calls for further in-depth research. If thisalarming issue is not addressed, Chinese cities are in great danger of moving in thedirection of the highly segregated cities of Latin America (Gilbert, 1997), with a largeinformal sector of people living in slums and ghettoes.
There is a well established literature on poverty concentration in Western cities,especially American cities. As Walks (2001) argues, the social ecology of the post-Fordist global city is characterized by increasing social complexity and differentiationamong, between and within neighbourhoods. In spatial terms, the ghetto as an extremeform of residential segregation emerged and dispersed like a plague in highlyindustrialized countries, particularly in large American cities after the 1970s (Orfield,1998; McCulloch, 2001; Small and Newman, 2001; Friedrichsl and Blasius, 2003).Marcuse (1996) pointed out that increasing ghettoization was one of the particular spatialcharacteristics of the post-Fordist city. The spatial concentration of poverty has come tothreaten the health of the entire metropolis, and exacerbates a wide variety of socialpathologies (Wilson, 1987; 1996). The concentration of poverty is unhealthy and thepersistence and expansion of poverty concentration is even more dangerous. Apparently,the spatial concentration of poverty has an important role in shaping the ‘modernpoverty’ problem.
There are also plenty of studies of the profound social and political processes behindthe spatial concentration of poverty, i.e. the causation and determinants of poverty. Theprevailing interpretation of new urban poverty considers it an outcome of globaleconomic restructuring, changes in the welfare state and changes in social structure(Wilson, 1987; Sassen, 1991; Neef, 1992; Morris, 1993; Wacquant, 1993; Wessel, 2000;Walks, 2001). The post-Fordist economy and an employment regime characterized by aprecarious labour market and the curtailment of employment for life have caused verylarge numbers of uneducated or unskilled workers to be excluded in Western cities (Gans,
Poverty concentration in China’s low-income neighbourhoods 329
International Journal of Urban and Regional Research 34.2© 2010 The Authors. Journal Compilation © 2010 Joint Editors and Blackwell Publishing Ltd.
1993). Adding to these disadvantages, the new urban poor have limited welfare security(Silver, 1993; White, 1995) and weakened social support networks (Mingione, 1996;Musterd and Ostendorf, 1998). In general, the new urban poverty is regarded as acomplex phenomenon caused by economic disadvantages and social exclusion(Mingione, 1993). Exclusion from the world of regular employment and frommainstream society is the main feature of the new urban poor in post-Fordist Westernsociety. In other words, the spatial concentration of poverty is both an outcome and a partof the restricted life chances of the urban poor (van Kempen, 1994).
In China, the emergence of new urban poverty in the post-reform era took placeagainst the background of economic restructuring and institutional reforms. By now,there are extensive studies on poverty measurement and the causes of urban poverty.However, official national statistics and survey data from individual cities/neighbourhoods seem to suggest different conclusions. Chinese Academy of SocialSciences (CASS) data and the Urban Household Survey (UHS) data from the NationalStatistics Bureau (NSB) are two major data sources for poverty studies in China.Studies based on these official data suggest a very optimistic trend of declining povertyrates during China’s market reforms from the late 1980s until very recently(Gustafsson and Zhong, 2000; Gustafsson and Li, 2001; 2004; Fang et al., 2002; Liand Sato, 2006; Appleton and Song, 2007). On the other hand, studies of individualcities and neighbourhoods suggest a serious and deteriorating situation of poverty inChinese cities (Solinger, 2002; 2006; Yao, 2004; Chen et al., 2006; Liu and Wu,2006a; 2006b; Wang, 2005a; 2005b; Wu, 2007; Wu and Huang, 2007; Liu et al.,2008). For instance, in selected poverty neighbourhoods in Chongqing and Shenyang,over half of households were reported to be living under the $1 a day poverty measurein 2000 (Wang, 2005a). In Tianjin and Guangzhou in 1998, the poverty rate amongunemployed households was as high as 35.9% and 31.9% measured by a poverty lineof 2,329 yuan per head and 3,175 yuan per head respectively, while the poverty ratefrom official data is only from 0.9% to 3.7% respectively (Yao, 2004). Apparently,there are huge differences between national urban poverty rates and the poverty ratesin individual neighbourhoods and social groups. This is partly because vulnerableneighbourhoods and social groups, i.e. urban villages and rural migrants, are missingfrom national statistics. It is, therefore, necessary and important to study the unevendistribution of urban poverty in individual neighbourhoods and groups, especially low-income neighbourhoods and disadvantaged social groups.
The proliferation of studies on poverty measurement and causation improves ourunderstanding of China’s new urban poor. As with the prevailing explanation in the West,the emerging new poverty in China is believed to be the result of economic restructuring,the retrenchment of redundant labour and social exclusion, e.g. institutionaldiscrimination against rural migrants (Solinger, 1999; 2006; Shen, 2002; Wang, 2004;Wu, 2004; 2007; Lu and Song, 2006; Liu et al., 2008). Nevertheless, until now, what weknow about China’s poverty-stricken neighbourhoods and social groups is still verylimited, especially the variations in the patterns and causes of poverty within theseneighbourhoods and groups. Moreover, studies combining or contrasting these twopoverty groups are still lacking. Studies on the spatial concentration of poverty, i.e.low-income neighbourhoods, and the social concentration of poverty, i.e. poverty groups,are often separated. It is not clear how poverty rates vary within and between groups andwhat contributes to such variation.
Based on a large-scale household survey conducted in 25 low-income neighbourhoodsin six major Chinese cities in 2007, this study therefore sets out to examine povertyconcentration in different low-income neighbourhoods and social groups, and to delveinto its determinants. By poverty concentration, we do not mean spatial concentration,but social concentration, i.e. the proportion (poverty rate), the intensity (poverty gap) andthe inequality (weighted poverty gap) of poverty in different neighbourhoods and socialgroups. The rest of the article is organized as follows: the next section introduces thedata; the third section compares poverty concentration in different low-income
330 Shenjing He, Fulong Wu, Chris Webster and Yuting Liu
International Journal of Urban and Regional Research 34.2© 2010 The Authors. Journal Compilation © 2010 Joint Editors and Blackwell Publishing Ltd.
neighbourhoods and social groups; the fourth section examines poverty determinants forthese neighbourhoods and groups; the fifth section concludes.
The dataGiven the complexity of the issue and the size of the Chinese urban population, weconducted a large-scale household survey in six cities, Xi’an, Guangzhou, Nanjing,Wuhan, Harbin and Kunming, from December 2006 to June 2007. The survey wasconducted with the help of collaborators from local universities. The six cities aredistributed in the coastal, central and western regions. Xi’an is an industrial city in thenorthwestern region and the capital city of a comparatively underdeveloped hinterland.Guangzhou represents the south coast cities that have experienced a high level ofmarketization and openness. It is one of most developed cities in China and has attracteda large number of migrants both from rural areas and other cities. Nanjing is an exampleof a developed east coast city; it is also a provincial capital with a strong industrial base.Fed by a comparatively developed hinterland, Nanjing enjoys a high level of economicprosperity. Wuhan is a city in the central region with heavy industries. It suffers fromeconomic restructuring but has become relatively better positioned in the process. Partlydue to its strategic location, Wuhan has developed a vibrant market economy, attractinga lot of migrants. Harbin is a city with severe de-industrialization problems. It is atypical post-industrial city located in a less developed region and struggling to survivethe collapse of SOEs/COEs and high unemployment rates. Kunming is in theunderdeveloped southwestern region and lacks industrialization. It suffers less from theeconomic restructuring, but also has a smaller share of the economic dividends. In thisarticle we do not attempt to compare differences between these six cities, but makecomparisons between different low-income neighbourhoods and social groups located indifferent geographic areas against a general background of de-industrialization andmarketization.
Our sampling approach first identified low-income neighbourhoods in each city. Thestudy covers not only central, but also urban periphery districts and includes bothpermanent urban residents and rural migrants. The latter were often omitted in previoushousehold surveys due to their lack of urban hukou (a household registration systemwhich relates to a package of privileges and welfare provisions, e.g. access to publichousing, education, healthcare and employment) and their spatial concentration in theurban periphery. We used different approaches to identify low-income neighbourhoodswith different population compositions. For neighbourhoods where permanent urbanresidents predominated, we referred to official statistical data. The Civil Affairs Bureau,which is responsible for identifying Minimum Living Standard Scheme (MLSS)recipients, maintains yearly statistics at street office level. Although the MLSS does notcapture all the poor urban permanent residents (Wang, 2007; He et al., 2008a; 2008b),the rate of MLSS is very useful in assessing the poverty situation of permanent socialgroups. Therefore, low-income neighbourhoods are defined as those exceeding a certainstatistical threshold of MLSS recipients. For neighbourhoods with predominantly non-permanent residents (migrants), there are no official statistics about poverty levels. Weused the fifth population census (2000) to identify migrant distributions. Throughconsulting local officials from the Civil Affairs Bureau and key informers, e.g. urbanexperts who have a good knowledge of the city and local residents who have lived therefor generations, we selected low-income neighbourhoods among the areas of highmigrant concentration. The selection of low-income neighbourhoods populated bypermanent residents was also validated through consultation with key informants. Theresult is, therefore, a cross-regional collection of low-income neighbourhoods withvarious population compositions, such as workers’ villages, inner-city old urbanneighbourhoods and urban villages in both inner-city and peri-urban areas. Four to five
Poverty concentration in China’s low-income neighbourhoods 331
International Journal of Urban and Regional Research 34.2© 2010 The Authors. Journal Compilation © 2010 Joint Editors and Blackwell Publishing Ltd.
sites were selected in each city to represent the major types of low-incomeneighbourhood. Our selection strategy gives us a degree of confidence that we haveselected households from four of the poorest neighbourhoods in each of the six cities.This is, therefore, a survey of a purposive sample of the poorest neighbourhoods in sixrepresentative cities.
In each neighbourhood, households were selected based on their address, using a fixedinterval approach. In this way, we not only collected information about poor households,but also information about non-poor households, which made possible an analysis ofpoverty incidence in different types of low-income neighbourhood. Questionnaires weredistributed to heads of household (HHs). Questions were intended to elicit socio-economic information pertaining to the heads and their households, including theirhukou status, income and expenditure, education, employment history, housing status,neighbourhood interactions, commuting and relocation experiences and so on. Onaverage, 75 questionnaires were distributed in each neighbourhood, yielding 300questionnaires in each city. In total, we collected 1,809 completed questionnaires in 25neighbourhoods.
Poverty concentration in different neighbourhoods and groupsSince the second half of the 1990s, a number of Chinese organizations, including theNational Statistics Bureau (NSB), the Ministry of Civil Affairs (MOCA), and theInstitute of Forecasting of the Chinese Academy of Sciences, have calculated an urbanpoverty line. However, since a standard framework for calculation is lacking, there is nostandardized and widely accepted poverty line for the whole country (Hussain, 2003).The national poverty lines are only used for estimating the number of the urban poor bythose organizations respectively. In fact, each city sets its own poverty line for MLSS toprovide social relief or assistance to poor urban households. The MLSS line is based ona ‘cost of basic needs’, which is essentially a calories-based food basket measure (about2,100 calories per person per day). Since the pattern of consumption and average incomeper capita vary substantially across localities, each city has a different MLSS line. Wetherefore applied a different poverty line for each city, using local MLSS thresholdsrather than a uniform standard. Guangzhou has the highest poverty line, while Xi’an andKunming have the lowest. The other three cities have similar poverty lines. This studyapplied the FGT (Foster, Greer, Thorbeck) index, one of the most popular povertymeasures introduced by Foster et al. (1984), to measure poverty. The formula is given by:
P n Z I Zii
q
αα= −( )( )
=∑1
1
where n = total population, q = the number of poor, Z is the poverty line, and Ii is theaverage income of the ith household (i = 1, 2, . . . , q ). When a = 0, the index is thestandard headcount ratio, defined as the fraction of the population below the poverty lineZ. One limitation of the headcount ratio is that it does not take into account the degreeof poverty for those falling below the poverty line. When a = 1, the index becomes thepoverty gap measure, which takes into consideration the total shortfall of individualincome below the poverty line. However, for the poverty gap index, transfers among thepoor will not change the value of the measure. To overcome this problem, we can seta > 1. By so doing, we get an index of weighted poverty gap, which is sensitive totransfers among the poor. Among the distribution-sensitive FGT measures, the mostfrequently used is a = 2 (Foster et al., 1984).
To understand people’s sense of deprivation/perception of poverty, we asked whetheror not respondents considered their families poor. This gives us a measure of relativepoverty as well as a measure of absolute poverty. Based on the results, we calculated the
332 Shenjing He, Fulong Wu, Chris Webster and Yuting Liu
International Journal of Urban and Regional Research 34.2© 2010 The Authors. Journal Compilation © 2010 Joint Editors and Blackwell Publishing Ltd.
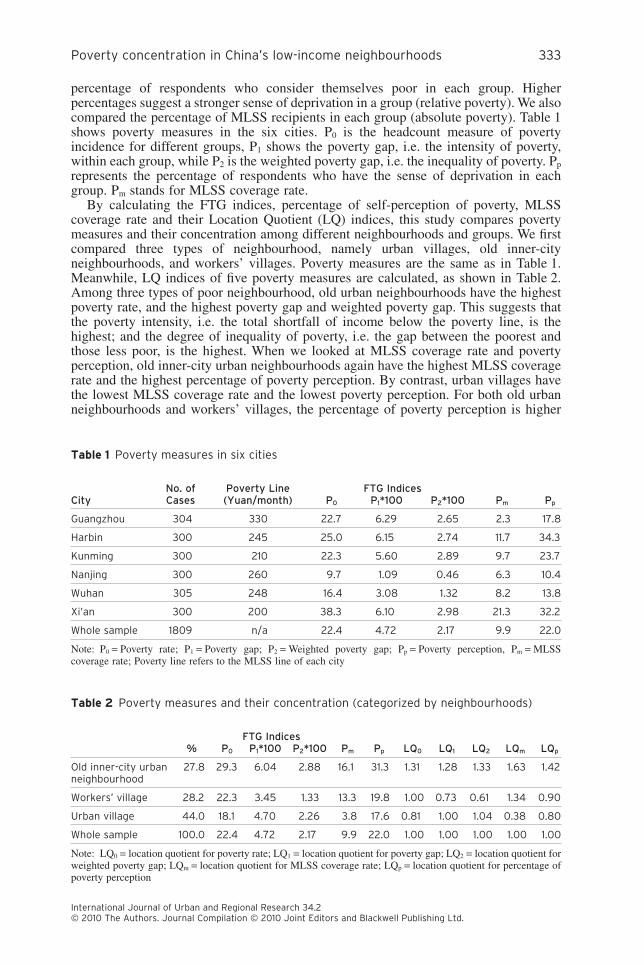
percentage of respondents who consider themselves poor in each group. Higherpercentages suggest a stronger sense of deprivation in a group (relative poverty). We alsocompared the percentage of MLSS recipients in each group (absolute poverty). Table 1shows poverty measures in the six cities. P0 is the headcount measure of povertyincidence for different groups, P1 shows the poverty gap, i.e. the intensity of poverty,within each group, while P2 is the weighted poverty gap, i.e. the inequality of poverty. Pp
represents the percentage of respondents who have the sense of deprivation in eachgroup. Pm stands for MLSS coverage rate.
By calculating the FTG indices, percentage of self-perception of poverty, MLSScoverage rate and their Location Quotient (LQ) indices, this study compares povertymeasures and their concentration among different neighbourhoods and groups. We firstcompared three types of neighbourhood, namely urban villages, old inner-cityneighbourhoods, and workers’ villages. Poverty measures are the same as in Table 1.Meanwhile, LQ indices of five poverty measures are calculated, as shown in Table 2.Among three types of poor neighbourhood, old urban neighbourhoods have the highestpoverty rate, and the highest poverty gap and weighted poverty gap. This suggests thatthe poverty intensity, i.e. the total shortfall of income below the poverty line, is thehighest; and the degree of inequality of poverty, i.e. the gap between the poorest andthose less poor, is the highest. When we looked at MLSS coverage rate and povertyperception, old inner-city urban neighbourhoods again have the highest MLSS coveragerate and the highest percentage of poverty perception. By contrast, urban villages havethe lowest MLSS coverage rate and the lowest poverty perception. For both old urbanneighbourhoods and workers’ villages, the percentage of poverty perception is higher
Table 1 Poverty measures in six cities
CityNo. ofCases
Poverty Line(Yuan/month)
FTG IndicesPm PpP0 P1*100 P2*100
Guangzhou 304 330 22.7 6.29 2.65 2.3 17.8
Harbin 300 245 25.0 6.15 2.74 11.7 34.3
Kunming 300 210 22.3 5.60 2.89 9.7 23.7
Nanjing 300 260 9.7 1.09 0.46 6.3 10.4
Wuhan 305 248 16.4 3.08 1.32 8.2 13.8
Xi’an 300 200 38.3 6.10 2.98 21.3 32.2
Whole sample 1809 n/a 22.4 4.72 2.17 9.9 22.0
Note: P0 = Poverty rate; P1 = Poverty gap; P2 = Weighted poverty gap; Pp = Poverty perception, Pm = MLSScoverage rate; Poverty line refers to the MLSS line of each city
Table 2 Poverty measures and their concentration (categorized by neighbourhoods)
%FTG Indices
Pm Pp LQ0 LQ1 LQ2 LQm LQpP0 P1*100 P2*100
Old inner-city urbanneighbourhood
27.8 29.3 6.04 2.88 16.1 31.3 1.31 1.28 1.33 1.63 1.42
Workers’ village 28.2 22.3 3.45 1.33 13.3 19.8 1.00 0.73 0.61 1.34 0.90
Urban village 44.0 18.1 4.70 2.26 3.8 17.6 0.81 1.00 1.04 0.38 0.80
Whole sample 100.0 22.4 4.72 2.17 9.9 22.0 1.00 1.00 1.00 1.00 1.00
Note: LQ0 = location quotient for poverty rate; LQ1 = location quotient for poverty gap; LQ2 = location quotient forweighted poverty gap; LQm = location quotient for MLSS coverage rate; LQp = location quotient for percentage ofpoverty perception
Poverty concentration in China’s low-income neighbourhoods 333
International Journal of Urban and Regional Research 34.2© 2010 The Authors. Journal Compilation © 2010 Joint Editors and Blackwell Publishing Ltd.
than their actual poverty rate, while for urban villages, the percentage of povertyperception is comparatively lower than the actual poverty rate. The LQ indices suggestthat poverty concentration is overrepresented in old inner-city neighbourhoods, where allthe five poverty measures are the highest. The poverty rate in urban villages is slightlyhigher than the average level, while the poverty gap and weighted poverty gap are veryclose to the average level. As mentioned, poverty perception and MLSS coverage rate isextremely low in this type of neighbourhood, suggesting that while people in urbanvillages have fewer entitlements to state welfare provision, they are more positive abouttheir lives. Overall, compared to the other two neighbourhood types, workers’ villageshave a lower level of poverty concentration, while their MLSS coverage rate iscomparatively high. This indicates unequal access to welfare entitlements.
Our subjects are also categorized into different groups by hukou status, housingtenure, and the age, educational attainment and occupation of the head of household.We analysed each of these attributes in turn. We first looked at the variation of povertyconcentration between working urban residents, laid-off/unemployed urban residents,retirees and rural migrants. In the laid-off/unemployed group, we included people whoare currently laid-off/unemployed and people who used to be laid-off and have nowmanaged to find a formal or informal job. It is quite obvious that laid-off /unemployedurban residents are the poorest, in terms of poverty rate, poverty gap, weighted povertygap and poverty perception. This group also has the highest MLSS coverage rate,which means that they have more access to state welfare. Working urban residentshave the lowest poverty incidence. Retirees are also better off in comparison.Interestingly, rural migrants are not the poorest when compared with laid-off/unemployed urban residents, and their MLSS coverage rate is very low. Although theurban laid-off/unemployed and rural migrants have been recognized as two majorpoverty groups in Chinese cities, which group is the poorer has hitherto beenunknown. Conventionally, rural migrants are considered poorer than urban residents,as they are widely understood to be disadvantaged by the institutionally defined urban–rural dichotomy (Shen, 2002; Wang, 2005a; Lu and Song, 2006). However, our studyreveals that rural migrants are not necessarily the poorest group in the city. On thecontrary, laid-off/unemployed urban residents have the highest level of povertyconcentration, while migrants have below-average poverty concentration, althoughlevels of poverty intensity and inequality in this group are slightly higher than theaverage. The reason mainly lies in the fact that most migrants are economically active,while laid-off/unemployed urban residents are not. Rural migrants also have a muchlower level of deprivation perception when compared with laid-off/unemployed urbanresidents. This may be explained by people’s different expectations of life and theirattitudes towards their present living conditions. Rural migrants tend to makecomparisons with their former (or intermittent) rural situation and with theiranticipated future in a way that more established urban groups do not. So they do notidentify themselves as poor as frequently as members of the urban class who havefallen into misfortune. By contrast, established urban residents who have lost their jobsas a result of mass unemployment have three comparators to make them feelmiserable: their previous position of greater well-being; their lack of hope in thefuture; and the threat of migrants who generally work harder even under worseconditions and thus are more competitive in securing jobs.
We next compared poverty measures and concentration in different age groups.Household heads between 40 and 60 years old have the highest level of povertyconcentration. This finding further confirms that the so-called ‘40s and 50s’ are themost vulnerable population group in the post-reform era, suffering the most from state-owned-enterprise reform and retrenchment (Solinger, 2002; Wang, 2004). Householdheads who are over 60 and those under 40 have a lower level of poverty concentrationthan the average. Household heads over 60 are mostly pensioners and therefore have alower poverty incidence. Household heads under 40 years are comparatively better off,since this group tends to be more economically active.
334 Shenjing He, Fulong Wu, Chris Webster and Yuting Liu
International Journal of Urban and Regional Research 34.2© 2010 The Authors. Journal Compilation © 2010 Joint Editors and Blackwell Publishing Ltd.
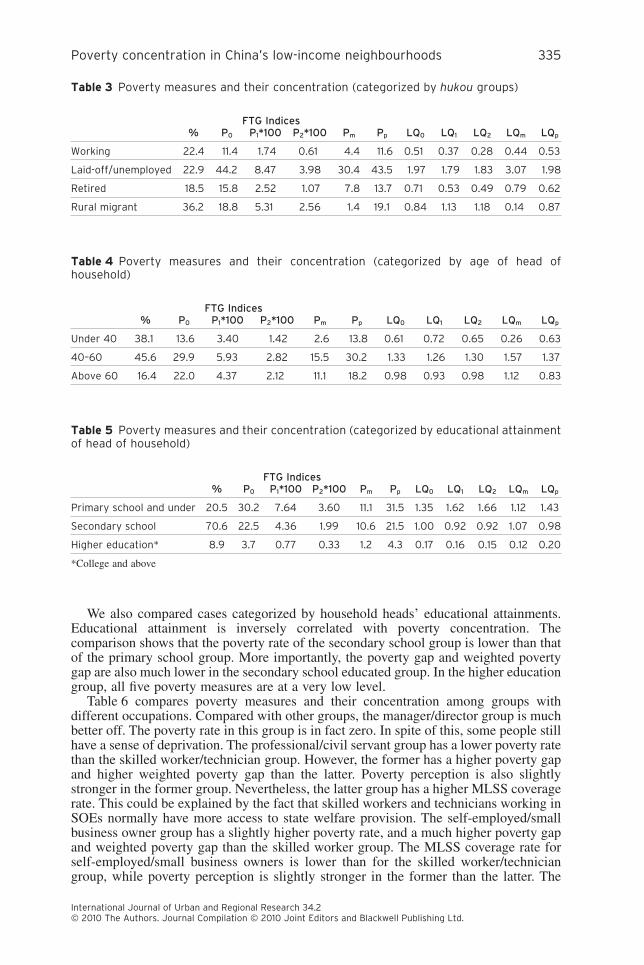
We also compared cases categorized by household heads’ educational attainments.Educational attainment is inversely correlated with poverty concentration. Thecomparison shows that the poverty rate of the secondary school group is lower than thatof the primary school group. More importantly, the poverty gap and weighted povertygap are also much lower in the secondary school educated group. In the higher educationgroup, all five poverty measures are at a very low level.
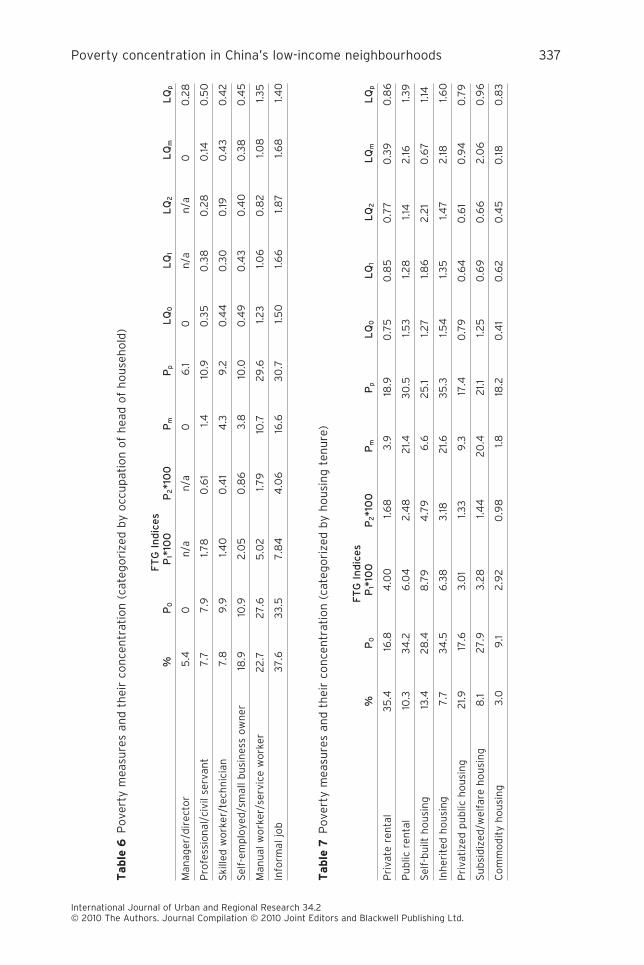
Table 6 compares poverty measures and their concentration among groups withdifferent occupations. Compared with other groups, the manager/director group is muchbetter off. The poverty rate in this group is in fact zero. In spite of this, some people stillhave a sense of deprivation. The professional/civil servant group has a lower poverty ratethan the skilled worker/technician group. However, the former has a higher poverty gapand higher weighted poverty gap than the latter. Poverty perception is also slightlystronger in the former group. Nevertheless, the latter group has a higher MLSS coveragerate. This could be explained by the fact that skilled workers and technicians working inSOEs normally have more access to state welfare provision. The self-employed/smallbusiness owner group has a slightly higher poverty rate, and a much higher poverty gapand weighted poverty gap than the skilled worker group. The MLSS coverage rate forself-employed/small business owners is lower than for the skilled worker/techniciangroup, while poverty perception is slightly stronger in the former than the latter. The
Table 3 Poverty measures and their concentration (categorized by hukou groups)
%FTG Indices
Pm Pp LQ0 LQ1 LQ2 LQm LQpP0 P1*100 P2*100
Working 22.4 11.4 1.74 0.61 4.4 11.6 0.51 0.37 0.28 0.44 0.53
Laid-off/unemployed 22.9 44.2 8.47 3.98 30.4 43.5 1.97 1.79 1.83 3.07 1.98
Retired 18.5 15.8 2.52 1.07 7.8 13.7 0.71 0.53 0.49 0.79 0.62
Rural migrant 36.2 18.8 5.31 2.56 1.4 19.1 0.84 1.13 1.18 0.14 0.87
Table 4 Poverty measures and their concentration (categorized by age of head ofhousehold)
%FTG Indices
Pm Pp LQ0 LQ1 LQ2 LQm LQpP0 P1*100 P2*100
Under 40 38.1 13.6 3.40 1.42 2.6 13.8 0.61 0.72 0.65 0.26 0.63
40–60 45.6 29.9 5.93 2.82 15.5 30.2 1.33 1.26 1.30 1.57 1.37
Above 60 16.4 22.0 4.37 2.12 11.1 18.2 0.98 0.93 0.98 1.12 0.83
Table 5 Poverty measures and their concentration (categorized by educational attainmentof head of household)
%FTG Indices
Pm Pp LQ0 LQ1 LQ2 LQm LQpP0 P1*100 P2*100
Primary school and under 20.5 30.2 7.64 3.60 11.1 31.5 1.35 1.62 1.66 1.12 1.43
Secondary school 70.6 22.5 4.36 1.99 10.6 21.5 1.00 0.92 0.92 1.07 0.98
Higher education* 8.9 3.7 0.77 0.33 1.2 4.3 0.17 0.16 0.15 0.12 0.20
*College and above
Poverty concentration in China’s low-income neighbourhoods 335
International Journal of Urban and Regional Research 34.2© 2010 The Authors. Journal Compilation © 2010 Joint Editors and Blackwell Publishing Ltd.
contrast between skilled workers and manual workers is quite striking. The poverty rateamong the latter is nearly three times that of the former, while the poverty gap andweighted poverty gap are likewise much higher. Accordingly, the MLSS coverage rateand poverty perception for the latter group are also nearly three times that of the formergroup. These results show a deep division between manual workers and skilled workers.The informal job group is the poorest. Not only is the poverty rate much higher than forother groups, but poverty intensity and inequality are extremely high. This group also hasa higher percentage of MLSS recipients and stronger poverty perception than othergroups. Overall, poverty concentration is overrepresented in the manual worker/serviceworker group and in the informal job group.
Finally, cases were compared across different housing groups. Each type of housingaccommodates different groups of people. Private rental housing is available to anyonewho can afford the rent, and therefore has a comprehensive population composition.Public rental housing is only available to urban hukou holders who do not own privatehousing. Self-built housing is usually located in urban villages and owned by indigenousvillagers, though in some old inner-city neighbourhoods it is owned by urban residentswho have lived there for a long time. Inherited housing mainly refers to private housingleft by the older generation and is mostly located in inner-city neighbourhoods.Privatized public housing is owned by former or current SOE employees after thehousing reform in the 1990s. Subsidized/welfare housing was usually built by theemployers (SOEs and other public sector employers) and sold to their employees atdeeply discounted prices before the housing reform. Commodity housing is onlyavailable to a limited number of people in this survey due to its comparatively high price.Residents in inherited housing and public rental housing are two groups with the highestpoverty concentration, followed by those in self-built housing and subsidized/welfarehousing, and then by people in privatized public housing and private rental groups.Finally, the commodity housing group has, not surprisingly, the lowest level of povertyconcentration. Although the self-built housing group does not have the highest povertyrate, the poverty gap and weighted poverty gap within this group are the highest. Theinherited housing group and public rental group have very similar poverty measures. Thissuggests that these two housing groups have a very similar population composition.Public rental housing, inherited housing and subsidized/welfare housing are three groupswith the highest MLSS coverage rate, which means that people living in these houseshave more access to state welfare. Conversely, private rental housing and self-builthousing groups have least access to state-welfare, despite their high povertyconcentrations. Although the commodity housing group is comparatively better off interms of absolute poverty measures, interestingly, the percentage of poverty perceptionin this group is comparable to that in the private rental housing group and privatizedpublic housing group. This may suggest that commodity housing owners have a heavyburden of housing mortgage and other debts, creating a sense of deprivation.
Poverty determinants for different neighbourhoods and groupsAlthough Tables 2–7 show some connections between socio-economic variables andpoverty generation, we used multivariate analysis to exclude the contribution ofconfounding factors. We ran logistic regression models to analyse the associationbetween poverty generation and various explanatory variables, first looking at the wholesample.
The dependent variable is poverty status: 1 represents poor, while 0 represents non-poor. Thirteen explanatory variables are included in the regression model, of whichsix, i.e. city, neighbourhood, group, housing tenure, occupation and employer type, areset as dummy variables. We therefore created a composite reference: rural migrantliving in private rental housing in an urban village in Kumming, and having an
336 Shenjing He, Fulong Wu, Chris Webster and Yuting Liu
International Journal of Urban and Regional Research 34.2© 2010 The Authors. Journal Compilation © 2010 Joint Editors and Blackwell Publishing Ltd.
Table
6P
ove
rty
mea
sure
san
dth
eir
con
cen
trat
ion
(cat
ego
rize
db
yo
ccu
pat
ion
of
hea
do
fh
ou
seh
old
)
%F
TG
Ind
ice
sP
mP
pL
Q0
LQ
1L
Q2
LQ
mL
Qp
P0
P1*
100
P2*1
00
Man
ager
/dir
ecto
r5
.40
n/a
n/a
06
.10
n/a
n/a
00
.28
Pro
fess
ion
al/c
ivil
serv
ant
7.7
7.9
1.78
0.6
11.4
10.9
0.3
50
.38
0.2
80
.140
.50
Ski
lled
wo
rker
/tec
hn
icia
n7
.89
.91.4
00
.41
4.3
9.2
0.4
40
.30
0.19
0.4
30
.42
Sel
f-em
plo
yed
/sm
all
bu
sin
ess
ow
ner
18.9
10.9
2.0
50
.86
3.8
10.0
0.4
90
.43
0.4
00
.38
0.4
5
Man
ual
wo
rker
/ser
vice
wo
rker
22
.72
7.6
5.0
21.7
910
.72
9.6
1.23
1.06
0.8
21.0
81.3
5
Info
rmal
job
37
.63
3.5
7.8
44
.06
16.6
30
.71.5
01.6
61.8
71.6
81.4
0
Table
7P
ove
rty
mea
sure
san
dth
eir
con
cen
trat
ion
(cat
ego
rize
db
yh
ou
sin
gte
nu
re)
%F
TG
Ind
ice
sP
mP
pL
Q0
LQ
1L
Q2
LQ
mL
Qp
P0
P1*
100
P2*1
00
Pri
vate
ren
tal
35
.416
.84
.00
1.68
3.9
18.9
0.7
50
.85
0.7
70
.39
0.8
6
Pu
blic
ren
tal
10.3
34
.26
.04
2.4
82
1.43
0.5
1.53
1.28
1.14
2.16
1.39
Sel
f-b
uilt
ho
usi
ng
13.4
28
.48
.79
4.7
96
.62
5.1
1.27
1.86
2.2
10
.67
1.14
Inh
erit
edh
ou
sin
g7
.73
4.5
6.3
83
.182
1.63
5.3
1.54
1.35
1.47
2.18
1.60
Pri
vati
zed
pu
blic
ho
usi
ng
21.9
17.6
3.0
11.3
39
.317
.40
.79
0.6
40
.61
0.9
40
.79
Su
bsi
diz
ed/w
elfa
reh
ou
sin
g8
.12
7.9
3.2
81.4
42
0.4
21.1
1.25
0.6
90
.66
2.0
60
.96
Co
mm
od
ity
ho
usi
ng
3.0
9.1
2.9
20
.98
1.818
.20
.41
0.6
20
.45
0.18
0.8
3
Poverty concentration in China’s low-income neighbourhoods 337
International Journal of Urban and Regional Research 34.2© 2010 The Authors. Journal Compilation © 2010 Joint Editors and Blackwell Publishing Ltd.
informal job (in short: informal rural migrant worker in private rental urban villagehousing in Kunming). The results are shown in Table 8. With reference to the syntheticcomparator, similar respondents from Xi’an have a higher probability of being poor,while respondents from Nanjing and Wuhan are less likely to be poor. Guangzhou andHarbin do not show statistical significance. As for the neighbourhood variable, with allother important measurable attributes held constant, living in either a dilapidated oldneighbourhood or a workers’ village gives a household a higher probability of beingpoor. For the group variable, the regression model shows that the laid-off/unemployedgroup is significantly associated with poor status, while the retired group is connectedwith non-poor status.
We next examined the association between demographic characteristics and povertystatus. Household size, household head’s school years, and household head’s partymembership are three variables significantly related to poverty generation. Largerhousehold size indicates a higher probability of being poor, fewer schooling years givesa higher poverty incidence, while being a member of the Chinese Communist Party(CCP) gives a lower probability of being poor. This suggests that being a party memberstill means a better income and/or better access to welfare provision. Head ofhousehold’s age does not show significant connection with poverty status. With otherpredictors controlled for, the explanatory power of age is weakened.
We also examined the association between different types of housing tenure andpoverty status. With reference to informal rural migrant workers in private rental urbanvillage housing in Kunming, only those living in public rental housing and privatizedpublic housing are significantly associated with non-poor status. This suggests that forthe rural migrant comparator, public housing benefits have significantly decreased theprobability of being poor.
For the variable ‘occupation of head of household’, apart from manual worker orservice worker, all other occupations are significantly associated with non-poor status,when compared with the synthetic comparator. This is mainly because being a manual orservice worker usually means working long hours and getting low pay. Some of theseworkers have become the working poor. Among all of these occupations, being amanager or director has the strongest effect in decreasing the probability of being poor,followed by being self-employed or a small business owner, professional/civil servant, orskilled worker/technician. When we look at the variable ‘employer type’, all employertypes are associated with less probability of being poor compared with the samereference. Of all these employer types, ‘joint venture/foreign enterprise’ has the strongesteffect in decreasing the probability of being poor.
We also examined the association between poverty status and three indicators of thehead of household’s work experience: weekly working hours, experience of working inSOE/COE and the number of job changes. Only the number of job changes shows asignificant connection with non-poor status. The other two variables are not statisticallysignificant. For the rural migrant comparator, changing jobs actually decreases theprobability of being poor. This suggests that the chance of getting reasonable pay or astable job increases after several attempts. Overall, our model identifies a number ofdeterminants of poverty incidence. Most hypothesized explanatory variables arestatistically significant.
To compare poverty determinants between different neighbourhoods, we ran a logisticregression model for each type of neighbourhood. Dependent and independent variablesremain the same, except that the ‘neighbourhood’ variable and the ‘city’ variable areremoved, since the number of cases in each subgroup is too small to compare thevariation between cities. Now the composite reference is informal rural migrant workerin private rental housing. Results are shown in Table 9. In urban villages, retirees showsignificant connection with non-poor status, with reference to the synthetic comparator.However, in both old neighbourhoods and workers’ villages, the laid-off/unemployedgroup is significantly related to poor status. This suggests that in urban villages, retireesare relatively better off, while in both old neighbourhoods and workers’ villages, the
338 Shenjing He, Fulong Wu, Chris Webster and Yuting Liu
International Journal of Urban and Regional Research 34.2© 2010 The Authors. Journal Compilation © 2010 Joint Editors and Blackwell Publishing Ltd.
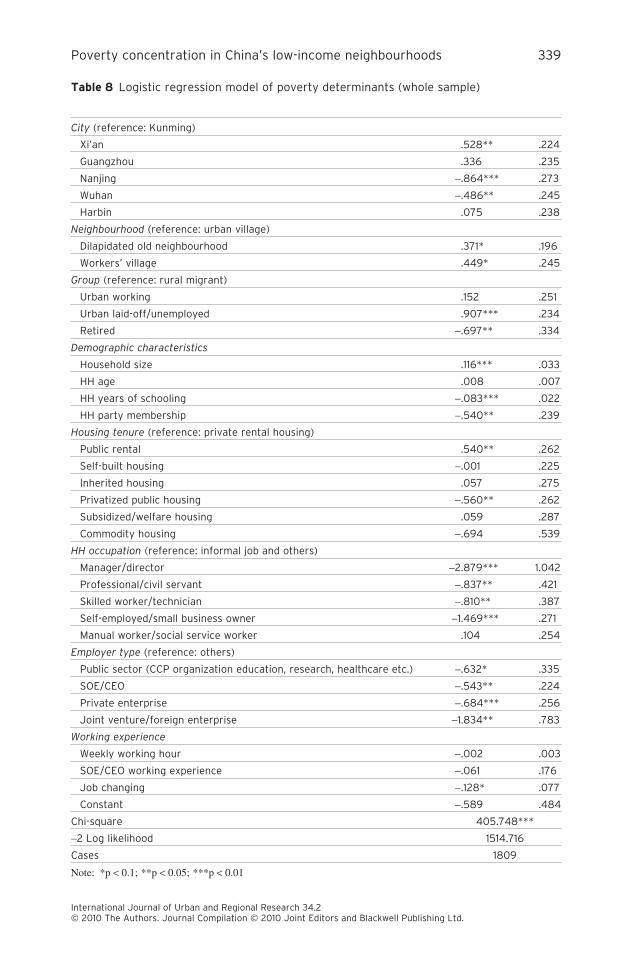
Table 8 Logistic regression model of poverty determinants (whole sample)
City (reference: Kunming)
Xi’an .528** .224
Guangzhou .336 .235
Nanjing -.864*** .273
Wuhan -.486** .245
Harbin .075 .238
Neighbourhood (reference: urban village)
Dilapidated old neighbourhood .371* .196
Workers’ village .449* .245
Group (reference: rural migrant)
Urban working .152 .251
Urban laid-off/unemployed .907*** .234
Retired -.697** .334
Demographic characteristics
Household size .116*** .033
HH age .008 .007
HH years of schooling -.083*** .022
HH party membership -.540** .239
Housing tenure (reference: private rental housing)
Public rental .540** .262
Self-built housing -.001 .225
Inherited housing .057 .275
Privatized public housing -.560** .262
Subsidized/welfare housing .059 .287
Commodity housing -.694 .539
HH occupation (reference: informal job and others)
Manager/director -2.879*** 1.042
Professional/civil servant -.837** .421
Skilled worker/technician -.810** .387
Self-employed/small business owner -1.469*** .271
Manual worker/social service worker .104 .254
Employer type (reference: others)
Public sector (CCP organization education, research, healthcare etc.) -.632* .335
SOE/CEO -.543** .224
Private enterprise -.684*** .256
Joint venture/foreign enterprise -1.834** .783
Working experience
Weekly working hour -.002 .003
SOE/CEO working experience -.061 .176
Job changing -.128* .077
Constant -.589 .484
Chi-square 405.748***
-2 Log likelihood 1514.716
Cases 1809
Note: *p < 0.1; **p < 0.05; ***p < 0.01
Poverty concentration in China’s low-income neighbourhoods 339
International Journal of Urban and Regional Research 34.2© 2010 The Authors. Journal Compilation © 2010 Joint Editors and Blackwell Publishing Ltd.
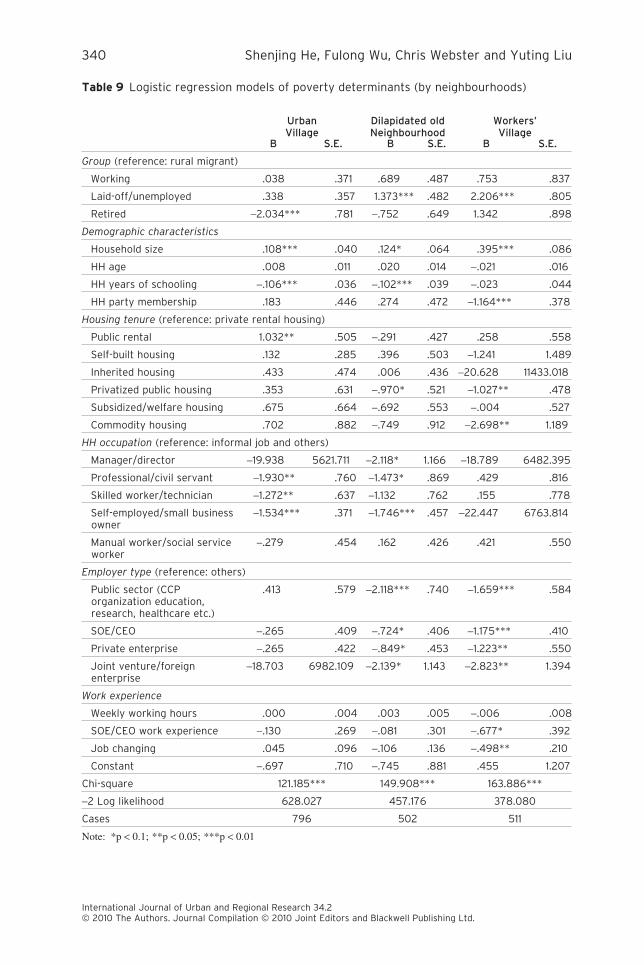
Table 9 Logistic regression models of poverty determinants (by neighbourhoods)
UrbanVillage
Dilapidated oldNeighbourhood
Workers’Village
B S.E. B S.E. B S.E.
Group (reference: rural migrant)
Working .038 .371 .689 .487 .753 .837
Laid-off/unemployed .338 .357 1.373*** .482 2.206*** .805
Retired -2.034*** .781 -.752 .649 1.342 .898
Demographic characteristics
Household size .108*** .040 .124* .064 .395*** .086
HH age .008 .011 .020 .014 -.021 .016
HH years of schooling -.106*** .036 -.102*** .039 -.023 .044
HH party membership .183 .446 .274 .472 -1.164*** .378
Housing tenure (reference: private rental housing)
Public rental 1.032** .505 -.291 .427 .258 .558
Self-built housing .132 .285 .396 .503 -1.241 1.489
Inherited housing .433 .474 .006 .436 -20.628 11433.018
Privatized public housing .353 .631 -.970* .521 -1.027** .478
Subsidized/welfare housing .675 .664 -.692 .553 -.004 .527
Commodity housing .702 .882 -.749 .912 -2.698** 1.189
HH occupation (reference: informal job and others)
Manager/director -19.938 5621.711 -2.118* 1.166 -18.789 6482.395
Professional/civil servant -1.930** .760 -1.473* .869 .429 .816
Skilled worker/technician -1.272** .637 -1.132 .762 .155 .778
Self-employed/small businessowner
-1.534*** .371 -1.746*** .457 -22.447 6763.814
Manual worker/social serviceworker
-.279 .454 .162 .426 .421 .550
Employer type (reference: others)
Public sector (CCPorganization education,research, healthcare etc.)
.413 .579 -2.118*** .740 -1.659*** .584
SOE/CEO -.265 .409 -.724* .406 -1.175*** .410
Private enterprise -.265 .422 -.849* .453 -1.223** .550
Joint venture/foreignenterprise
-18.703 6982.109 -2.139* 1.143 -2.823** 1.394
Work experience
Weekly working hours .000 .004 .003 .005 -.006 .008
SOE/CEO work experience -.130 .269 -.081 .301 -.677* .392
Job changing .045 .096 -.106 .136 -.498** .210
Constant -.697 .710 -.745 .881 .455 1.207
Chi-square 121.185*** 149.908*** 163.886***
-2 Log likelihood 628.027 457.176 378.080
Cases 796 502 511
Note: *p < 0.1; **p < 0.05; ***p < 0.01
340 Shenjing He, Fulong Wu, Chris Webster and Yuting Liu
International Journal of Urban and Regional Research 34.2© 2010 The Authors. Journal Compilation © 2010 Joint Editors and Blackwell Publishing Ltd.

laid-off/unemployed are worse off, when compared to informal rural migrant workers inprivate rental housing.
The association between poverty incidence and demographic characteristics alsovaries in different neighbourhoods. In urban villages and old neighbourhoods, householdsize and household head’s years of schooling are two variables significantly associatedwith poverty status. A large household size is associated with a higher probability ofbeing poor, while more schooling years lead to a lower probability of poverty. Inworkers’ villages, on the other hand, household size and household head’s partymembership are more prominent indicators of poverty. In contrast to the other two typesof neighbourhood, being a party member significantly decreases your chance of beingpoor if you live in a workers’ village.
We then looked at housing tenure. In urban villages, when compared with informalrural migrant workers in private rental housing, only those living in public rental housingare significantly associated with poor status. Private rental is the dominant form ofhousing tenure in urban villages; public rental housing only exists in cases wheresmall-scale SOEs/COEs bought housing from the village collective and allocated it totheir employees. These employees are comparatively disadvantaged, especially afterbeing laid-off during the SOE/COE reforms. In old neighbourhoods, only living inprivatized public housing reduces the probability of being poor, while in workers’villages, privatized public housing and commodity housing are both significantlyconnected with non-poor status. Unsurprisingly, people who can afford privatized publichousing and commodity housing tend to be better off.
We next examined the predictive ability of the head of household’s occupation. In urbanvillages, professional/civil servants, skilled worker/technicians and self-employed/smallbusiness owners are three types of occupation significantly associated with non-poorstatus, when compared with informal rural migrant workers in private rental housing.Being a manager/director or a manual worker/service worker is not significantlyassociated with poverty status. This is mainly because only a very small proportion ofrespondents in urban village were managers/directors. Also, as mentioned earlier, manualworkers/service workers are not necessarily better off when compared with informal ruralmigrant workers. In old neighbourhoods, the fact that a head of household is a manager/director, professional/civil servant, skilled worker/technician, or self-employed/smallbusiness owner significantly reduces the probability of being poor. Among theseoccupations, being self-employed or a small business owner has the strongest effect indecreasing the probability of being poor. In workers’ villages, none of these occupationalcategories shows significant association with poverty status. This is for two reasons: first,a great proportion of respondents in workers’ village are economically inactive; second,those who are economically active mainly work in the informal sector.
For respondents in urban villages, employer type and work experience show nosignificant association with poverty status. For respondents in old urban neighbourhoods,all employer types give a lower probability of being poor compared with informal ruralmigrant workers in private rental housing. Nevertheless, the work experience variableshave no statistical significance in determining respondents’ poverty status. Forrespondents in workers’ villages, again, all employer types are associated with lessprobability of being poor, when referred to the same comparator profile. This confirmsthe previous finding that being economically active is of great significance in avoidingpoverty in workers’ villages. In terms of work experience, those who had SOE/COEworking experience and those who changed their jobs more frequently were less likelyto be poor in workers’ villages. This suggests that people who used to work for anSOE/COE had better access to work unit and state welfare provision, and are thereforeless likely to be poor. It also proves that actively looking for job opportunities can helplaid-off workers in workers’ villages survive poverty.
Overall, as enclaves of former SOE employees, workers’ villages still have countlessties with the central planning system. For instance, having a head of household with partymembership, living in subsidized/welfare housing and having SOE/COE work
Poverty concentration in China’s low-income neighbourhoods 341
International Journal of Urban and Regional Research 34.2© 2010 The Authors. Journal Compilation © 2010 Joint Editors and Blackwell Publishing Ltd.
experience are all associated with less probability of being poor. In comparison, urbanvillages and dilapidated old neighbourhoods show a greater connection with the marketeconomy, since respondents in these two types of neighbourhood have been exposed tothe mechanism of market remuneration to a greater extent. For instance, having moreyears of schooling (on the part of the head of household) is a safeguard against poverty,since it could be deemed to be an indicator of human capital, which is important in themarket remuneration system.
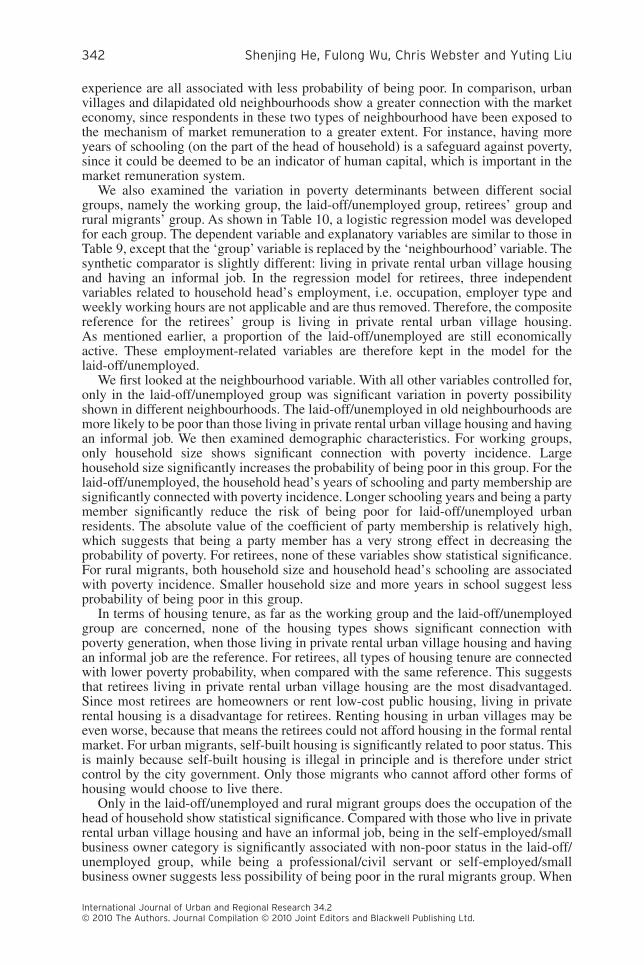
We also examined the variation in poverty determinants between different socialgroups, namely the working group, the laid-off/unemployed group, retirees’ group andrural migrants’ group. As shown in Table 10, a logistic regression model was developedfor each group. The dependent variable and explanatory variables are similar to those inTable 9, except that the ‘group’ variable is replaced by the ‘neighbourhood’ variable. Thesynthetic comparator is slightly different: living in private rental urban village housingand having an informal job. In the regression model for retirees, three independentvariables related to household head’s employment, i.e. occupation, employer type andweekly working hours are not applicable and are thus removed. Therefore, the compositereference for the retirees’ group is living in private rental urban village housing.As mentioned earlier, a proportion of the laid-off/unemployed are still economicallyactive. These employment-related variables are therefore kept in the model for thelaid-off/unemployed.
We first looked at the neighbourhood variable. With all other variables controlled for,only in the laid-off/unemployed group was significant variation in poverty possibilityshown in different neighbourhoods. The laid-off/unemployed in old neighbourhoods aremore likely to be poor than those living in private rental urban village housing and havingan informal job. We then examined demographic characteristics. For working groups,only household size shows significant connection with poverty incidence. Largehousehold size significantly increases the probability of being poor in this group. For thelaid-off/unemployed, the household head’s years of schooling and party membership aresignificantly connected with poverty incidence. Longer schooling years and being a partymember significantly reduce the risk of being poor for laid-off/unemployed urbanresidents. The absolute value of the coefficient of party membership is relatively high,which suggests that being a party member has a very strong effect in decreasing theprobability of poverty. For retirees, none of these variables show statistical significance.For rural migrants, both household size and household head’s schooling are associatedwith poverty incidence. Smaller household size and more years in school suggest lessprobability of being poor in this group.
In terms of housing tenure, as far as the working group and the laid-off/unemployedgroup are concerned, none of the housing types shows significant connection withpoverty generation, when those living in private rental urban village housing and havingan informal job are the reference. For retirees, all types of housing tenure are connectedwith lower poverty probability, when compared with the same reference. This suggeststhat retirees living in private rental urban village housing are the most disadvantaged.Since most retirees are homeowners or rent low-cost public housing, living in privaterental housing is a disadvantage for retirees. Renting housing in urban villages may beeven worse, because that means the retirees could not afford housing in the formal rentalmarket. For urban migrants, self-built housing is significantly related to poor status. Thisis mainly because self-built housing is illegal in principle and is therefore under strictcontrol by the city government. Only those migrants who cannot afford other forms ofhousing would choose to live there.
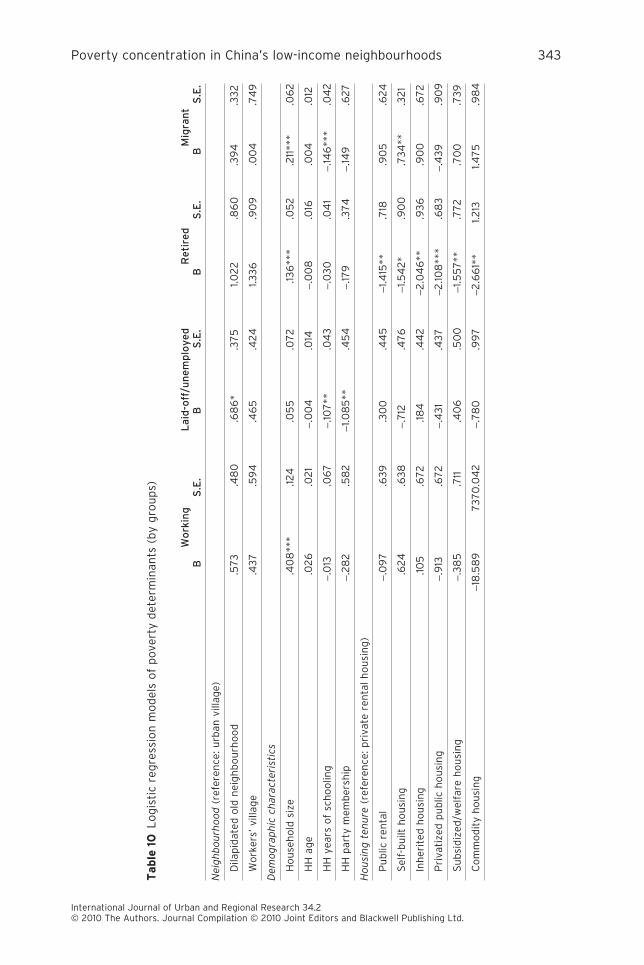
Only in the laid-off/unemployed and rural migrant groups does the occupation of thehead of household show statistical significance. Compared with those who live in privaterental urban village housing and have an informal job, being in the self-employed/smallbusiness owner category is significantly associated with non-poor status in the laid-off/unemployed group, while being a professional/civil servant or self-employed/smallbusiness owner suggests less possibility of being poor in the rural migrants group. When
342 Shenjing He, Fulong Wu, Chris Webster and Yuting Liu
International Journal of Urban and Regional Research 34.2© 2010 The Authors. Journal Compilation © 2010 Joint Editors and Blackwell Publishing Ltd.
Table
10L
og
isti
cre
gre
ssio
nm
od
els
of
po
vert
yd
eter
min
ants
(by
gro
up
s)
Wo
rkin
gL
aid
-off
/un
em
plo
ye
dR
eti
red
Mig
ran
tB
S.E
.B
S.E
.B
S.E
.B
S.E
.
Nei
gh
bo
urh
oo
d(r
efer
ence
:urb
anvi
llag
e)
Dila
pid
ated
old
nei
gh
bo
urh
oo
d.5
73
.48
0.6
86
*.3
75
1.02
2.8
60
.39
4.3
32
Wo
rker
s’vi
llag
e.4
37
.59
4.4
65
.42
41.3
36
.90
9.0
04
.74
9
Dem
og
rap
hic
char
acte
rist
ics
Ho
use
ho
ldsi
ze.4
08
***
.124
.05
5.0
72
.136
***
.05
2.2
11**
*.0
62
HH
age
.02
6.0
21
-.0
04
.014
-.0
08
.016
.00
4.0
12
HH
year
so
fsc
ho
olin
g-.
013
.06
7-.
107
**.0
43
-.0
30
.04
1-.
146
***
.04
2
HH
par
tym
emb
ersh
ip-.
28
2.5
82
-1.0
85
**.4
54
-.17
9.3
74
-.14
9.6
27
Ho
usi
ng
ten
ure
(ref
eren
ce:p
riva
tere
nta
lh
ou
sin
g)
Pu
blic
ren
tal
-.0
97
.63
9.3
00
.44
5-1
.415
**.7
18.9
05
.62
4
Sel
f-b
uilt
ho
usi
ng
.62
4.6
38
-.7
12.4
76
-1.5
42
*.9
00
.73
4**
.32
1
Inh
erit
edh
ou
sin
g.10
5.6
72
.184
.44
2-2
.04
6**
.93
6.9
00
.67
2
Pri
vati
zed
pu
blic
ho
usi
ng
-.9
13.6
72
-.4
31
.43
7-2
.108
***
.68
3-.
43
9.9
09
Su
bsi
diz
ed/w
elfa
reh
ou
sin
g-.
38
5.7
11.4
06
.50
0-1
.55
7**
.77
2.7
00
.73
9
Co
mm
od
ity
ho
usi
ng
-18
.58
97
37
0.0
42
-.7
80
.99
7-2
.66
1**
1.213
1.47
5.9
84
Poverty concentration in China’s low-income neighbourhoods 343
International Journal of Urban and Regional Research 34.2© 2010 The Authors. Journal Compilation © 2010 Joint Editors and Blackwell Publishing Ltd.
Table
10C
on
tin
ued
Wo
rkin
gL
aid
-off
/un
em
plo
ye
dR
eti
red
Mig
ran
tB
S.E
.B
S.E
.B
S.E
.B
S.E
.
HH
occ
up
atio
n(r
efer
ence
:in
form
aljo
ban
do
ther
s)
Man
ager
/dir
ecto
r-.
89
21.8
74
-20
.33
215
514
.75
0n
/an
/a-1
9.7
68
70
74
.46
8
Pro
fess
ion
al/c
ivil
serv
ant
.38
51.5
97
-1.6
29
1.13
2n
/an
/a-1
.67
2**
.78
6
Ski
lled
wo
rker
/tec
hn
icia
n.3
34
1.60
7-.
96
7.7
61
n/a
n/a
-.9
61
.715
Sel
f-em
plo
yed
/sm
all
bu
sin
ess
ow
ner
-1.9
70
1.29
3-1
.916
***
.54
7n
/an
/a-1
.58
6**
*.3
69
Man
ual
wo
rker
/so
cial
serv
ice
wo
rker
1.50
31.5
11.2
21
.42
9n
/an
/a-.
107
.45
6
Em
plo
yer
typ
e(r
efer
ence
:oth
ers)
Pu
blic
sect
or
(CC
Po
rgan
izat
ion
edu
cati
on
,res
earc
h,
hea
lth
care
etc.
)-1
.95
4*
1.15
5-1
.184
*.6
21
n/a
n/a
-.15
3.6
87
SO
E/C
EO
-2.2
98
**1.0
24
-.8
31*
**.3
13n
/an
/a-.
44
6.5
39
Pri
vate
ente
rpri
se-1
.88
1*.9
91
-1.13
2**
.47
2n
/an
/a-.
126
.43
4
Jo
int
ven
ture
/fo
reig
nen
terp
rise
-2.8
56
*1.4
85
-1.2
36
1.33
3n
/an
/a-1
9.5
51
90
69
.510
Wo
rkex
per
ien
ce
Wee
kly
wo
rkin
gh
ou
rs.0
17*
.010
-.0
09
.00
5n
/an
/a.0
02
.00
4
SO
E/C
EO
wo
rkex
per
ien
ce.0
21
.43
0.19
3.2
98
-.2
41
.50
9-.
43
5.3
38
Jo
bch
ang
ing
-.16
5.2
20
-.2
52
**.12
7-.
50
1.4
35
.103
.103
Co
nst
ant
-3.8
21*
*1.9
09
1.619
1.03
4-.
00
91.7
21
-1.11
2.7
96
Ch
i-sq
uar
e5
7.0
03
***
112
.00
4**
*2
5.7
25
***
106
.07
9**
*
-2L
og
likel
iho
od
22
5.3
154
55
.175
26
6.8
56
52
6.6
47
Cas
es4
05
414
33
56
55
Not
e:*p
<0.
1;**
p<
0.05
;**
*p<
0.01
344 Shenjing He, Fulong Wu, Chris Webster and Yuting Liu
International Journal of Urban and Regional Research 34.2© 2010 The Authors. Journal Compilation © 2010 Joint Editors and Blackwell Publishing Ltd.
we look at household head’s employer type, for the working group, all employer typesshow significant association with non-poor status, with reference to the same comparatorprofile. Joint venture/foreign enterprise has the strongest effect in decreasing theprobability of being poor. For the laid-off/unemployed group, working in the publicsector, SOEs/COEs and private enterprises, gives a lower probability of being poor.Among these employer types, private enterprise has the strongest effect in reducing thepoverty risk. Joint venture/foreign enterprise does not show statistical significance,because its percentages in this group are comparatively low. For migrants, employertypes do not significantly affect poverty generation. This is mainly because mostmigrants can only get low-profile jobs. It therefore does not seem to matter which typeof employer they are working for.
For both retirees and migrants, working experience variables show no significantinfluence on poverty incidence. For the working group, interestingly, longer workinghours indicate a higher probability of being poor. This suggests that people who worklong hours are most likely to have a low-profile job and suffer from low wages and lowbenefit packages, thus becoming the working poor. For the laid-off/unemployed group,more job change suggests less chance of being poor. Again, this suggests that it is quitelikely that the laid-off/unemployed find ways of surviving after changing their jobs a fewtimes.
Due to the unavailability of data, we are not able to analyse all indicators affectingpoverty incidence. For instance, the health condition of household members and the typeof school that dependent children attend are two important predictors for povertyincidence. Nevertheless, in this study we have included a number of important social anddemographic predictors to provide a comprehensive understanding of poverty incidenceand concentration.
ConclusionsDrawn from first-hand household survey data in low-income neighbourhoods in sixmajor Chinese cities, this study reveals a poverty incidence of 22.4% in these selectedneighbourhoods, which is much higher than the official national statistics would suggest.This signifies that, despite a general decrease in absolute urban poverty since the late1990s (see Gustafsson and Zhong, 2000; Gustafsson and Li, 2001; Li and Sato, 2006;Appleton and Song, 2007; World Bank, 2007), the spatial and social concentration ofpoverty has become an issue. The study fills a gap in existing poverty studies incontemporary China by revealing in considerable detail the morphology of poverty — itsconcentration and determinants in the different types of poor neighbourhoods and in thedifferent social groups who live in those neighbourhoods.
Our study finds that urban poverty is highly concentrated in several neighbourhoodsand social groups that endure multiple disadvantages. Some of the findings are consistentwith conventional wisdom. For instance, urban poverty is overrepresented in the mid-agegroup, i.e. the 40s and 50s. The number of years of schooling that the head of householdhas is a useful predictor for poverty incidence too. More schooling years greatly reducethe risk of being poor. In terms of occupation, manual workers/service workers andpeople with informal jobs are two very disadvantaged groups with the highest povertyconcentrations. On the other hand, some of the findings are not consistent withconventional wisdom. Among three types of poverty neighbourhood, old inner-cityneighbourhoods have the highest poverty concentration. Compared with urban residents,rural migrants are not necessarily the poorest group. This study reveals that laid-off/unemployed workers have the highest poverty concentration. In this group, not onlythe poverty rate, but also poverty intensity and inequality are the highest. Admittedly,this result could have been affected by the poverty measurements we chose.More complicated methods of poverty measurement — e.g. asset-based analysis,
Poverty concentration in China’s low-income neighbourhoods 345
International Journal of Urban and Regional Research 34.2© 2010 The Authors. Journal Compilation © 2010 Joint Editors and Blackwell Publishing Ltd.
expenditure-based analysis — might have produced a different result. But it isundeniable that, judged by income alone, laid-off/unemployed workers are the poorest.Among groups with different housing tenure, poverty is highly concentrated in publicrental housing, inherited housing and self-built housing, while private rental housing isnot necessarily associated with a poorer population.
This study reveals a mismatch between actual hardship and deprivation perception.Groups who used to have close ties with state institutions, such as occupants of workers’villages, the laid-off/unemployed, the public rental housing group, and the subsidized/welfare housing group, tend to overstate their hardships, i.e. have a strong sense ofdeprivation. Rural migrants, on the other hand, tend to understate their hardships, i.e.have a lighter sense of deprivation. Having been retrenched or eliminated from the SOEs,the former groups are no longer protected by state institutions despite the remainingconnections with their former employers. It is quite natural for them to be morepessimistic about their lives. By contrast, rural migrants make positive comparisons withtheir former rural situation and with their anticipated future. They are, therefore, lesslikely to consider themselves as urban poor. Meanwhile, the study also discovered amismatch between actual poverty rates and the distribution of state welfare provision. Asone of the most important means of state welfare provision, the distribution of MLSSsubsidies are disproportionate to actual poverty concentration (Wang, 2007; He et al.,2008a; 2008b), especially in disadvantaged groups — e.g. urban villagers, ruralmigrants, the private rental housing group and the self-built housing group. Underinstitutional discrimination, these groups are not recognized as official urban citizens andare consequently excluded from the formal institutions, remaining unprotected by anysocial safety net.
In examining the association between poverty generation and various predictors indifferent neighbourhoods and social groups, we generalize two major determinants forpoverty generation. One determinant is social welfare entitlements, e.g. entitlement toMLSS subsidy, to housing, education and healthcare benefits. This determinant isrelated to a number of variables, e.g. hukou, party membership, housing tenure,employer type, SOE/COE work experience. More social welfare entitlements suggestless possibility of being poor. The other determinant is market remuneration results,which roughly include three subcategories: selling one’s own labour/skills at a goodprice (in relative terms) by getting into regular and stable employment; selling one’sown labour/skills at a depressed price by getting into informal and unstableemployment; failure to sell one’s own labour/skills. This determinant is related tovariables such as hukou, age, years of schooling, occupation, weekly working hours,job change. Selling one’s own labour/skills at a good price suggests less possibility ofbeing poor. On the contrary, selling them at a depressed price or being unsuccessful inselling them is related to higher probability of being poor, i.e. being among theworking poor or unemployed poor.
Poverty generation is decided by the combination of these two determinants. Ingeneral, these two determinants affect the possibility of poverty generation equally,despite the fact that one determinant might have stronger effects in some neighbourhoodsand groups than the other. Conventionally, being excluded from institutional protection/social welfare provision is believed to be one of the most important causes for urbanpoverty. Nevertheless, as China’s urban economy is increasingly shaped by markets, wemust recognize that market remuneration mechanisms are becoming a more and moreimportant determinant for poverty generation, especially for people who have beeneliminated or excluded from the state institutions, notably laid-off workers and ruralmigrants. This study shows the rising importance of market remuneration mechanisms.For instance, for the laid-off/unemployed, changing jobs, i.e. attempting to sell one’sown labour/skills in the market for a good price, is significantly connected with theprobability of being poor. Also, this study reveals that laid-off/unemployed workersrather than rural migrants are the poorest. This is mainly because, under the redundancypolicy, laid-off workers not only become jobless but are also state-less. The limited
346 Shenjing He, Fulong Wu, Chris Webster and Yuting Liu
International Journal of Urban and Regional Research 34.2© 2010 The Authors. Journal Compilation © 2010 Joint Editors and Blackwell Publishing Ltd.
amount of subsidies for the laid-off and MLSS subsidies are far from sufficient to savethem from the trap of poverty. In this sense, this group suffers dual difficulties of beingdeprived of social welfare entitlements formerly supplied by the SOEs and either failingto sell their labour/skills or selling them for a depressed price. They have, therefore,become the poorest in the city. On the other hand, despite their disadvantaged status,rural migrants are more active in selling their labour/skills, even for a lower price thantheir urban counterparts would accept, and are thus better able to survive urban poverty.They are willing to take low-profile work such as manual and social service jobs, whichtemporarily but effectively help them get through hardships and avoid the trap of poverty.Nevertheless, rural migrants’ wages have been deliberately depressed to create a cheaplabour force for urban-centred wealth accumulation. With the fierce competition amongthemselves and between themselves and laid-off workers, they have to sell their labour/skills for an even more depressed price. This makes them much more vulnerable thantheir urban counterparts who get into regular and stable employment and sell theirlabour/skills at a good price.
In a sense, emerging urban poverty in China is not that different from other countries.It shares some common features with the new urban poverty in the Western world. Theconcentration of urban poverty is found in certain groups and neighbourhoods, in whichthe incidence and intensity of poverty are far too high to be ignored. In examining thedeterminants of poverty, different groups and neighbourhoods are associated withdifferent demographic and socio-economic predictors. Nevertheless, a general finding isthat the withdrawal of social welfare provision and exclusion from regular employmentare two important factors leading to poverty. In other words, an inferior position in theurban institutions (e.g. hukou status) and an inferior position in the market remunerationsystem, fundamentally result in the high incidence of urban poverty in urbanneighbourhoods populated by vulnerable groups.
Shenjing He ([email protected]), Department of Urban and Regional Planning,Sun Yat-Sen University, Guangzhou, 510275, China, Fulong Wu ([email protected]) andChris Webster ([email protected]), School of City and Regional Planning, CardiffUniversity, Cardiff, CF10 3WA, UK, and Yuting Liu ([email protected]), Department ofUrban Planning, School of Architecture, South China University of Technology,Guangzhou 510641, China.
ReferencesAppleton, S. and L. Song (2007) The myth of
the ‘new urban poverty’? Trends in urbanpoverty in China, 1988–2002. In J.R.Logan (ed.), Urban China in transition,Blackwell, Oxford.
Chen, G., C.L. Gu and F. Wu (2006) Urbanpoverty in the transitional economy: a caseof Nanjing, China. Habitat International30, 1–26.
Fang, C., X. Zhang and S. Fan (2002)Emergence of urban poverty and inequalityin China: evidence from household survey.China Economic Review 13.4, 430–43.
Foster, J., J. Greer and E. Thorbecke (1984)A class of decomposable povertymeasures. Econometrica 52, 761–65.
Friedrichsl, J.R. and J.R. Blasius (2003)Social norms in distressed neighborhoods:
testing the Wilson hypothesis. HousingStudies 18.6, 807–26.
Gans, H.J. (1993) From ‘underclass’ to‘undercaste’: some observations about thefuture of the post-industrial economy andits major victims. International Journalof Urban and Region Research 17,327–35.
Gilbert, A. (1997) Employment and povertyduring economic restructuring: the case ofBogota, Colombia. Urban Studies 34.7,1047–70.
Gustafsson, B. and S. Li (2001) The anatomyof rising earnings inequality in urbanChina. Journal of Comparative Economics29, 118–35.
Gustafsson, B. and S. Li (2004) Expenditureson education and health care and poverty
Poverty concentration in China’s low-income neighbourhoods 347
International Journal of Urban and Regional Research 34.2© 2010 The Authors. Journal Compilation © 2010 Joint Editors and Blackwell Publishing Ltd.
in rural China. China Economic Review15.3, 292–301.
Gustafsson, B. and W. Zhong (2000) Howand why has poverty in China changed? Astudy based on microdata for 1988 and1995. The China Quarterly 164,983–1006.
He, S.J., Y.T. Liu, F. Wu and C. Webster(2008a) Poverty incidence andconcentration in different social groups inurban China, a case study of Nanjing.Cities 25.3, 121–32.
He, S.J., C. Webster, F. Wu and Y.T. Liu(2008b) Profiling the poor in a Chinesecity: a case study of Nanjing. AppliedSpatial Analysis and Policy 1.1, 193–214.
Hussain, A. (2003) Urban poverty in China:measurement, patterns and policies.International Labour Office, Geneva.
Li, S. and H. Sato (eds.) (2006)Unemployment, inequality and poverty inurban China. Routledge, Abingdon.
Liu Y.T. and F. Wu (2006a) The state,institutional transition and the creation ofnew urban poverty in China. Social Policy& Administration 40.2, 121–37.
Liu, Y.T. and F. Wu (2006b) Urbanlow-income neighbourhoods: typology andspatial concentration under China’s markettransition, a case study of Nanjing.Geoforum 37.4, 610–26.
Liu, Y.T., S.J. He and F. Wu (2008) Urbanpauperization under China’s socialexclusion: a case study of Nanjing.Journal of Urban Affairs 30.1, 21–36
Lu, Z. and S. Song (2006) Rural–urbanmigration and wage determination: Thecase of Tianjin, China. China EconomicReview 17.3, 337–45.
Marcuse, P. (1996) Space and race in thepost-Fordist city. In E. Mingione (ed.),Urban poverty and the underclass,Blackwell, Oxford.
McCulloch, A. (2001) Ward-level deprivationand individual social and economicoutcomes in the British Household PanelStudy. Environment and Planning A 33,667–84.
Mingione, E. (1993) The new urban povertyand the underclass: introduction.International Journal of Urban andRegion Research 17, 324–26.
Mingione, E. (ed.) (1996) Urban poverty andthe underclass: a reader. Blackwell,Oxford.
Morris, L.D. (1993) Is there a Britishunderclass? International Journal of
Urban and Region Research 17, 404–12.
Musterd, S. and W. Ostendorf (1998) Urbansegregation and the welfare state:inequality and exclusion in Western cities.Routledge, London.
Neef, N. (1992) The new poverty and localgovernment social policies: a WestGerman perspective. International Journalof Urban and Region Research 16,202–21.
Orfield, M. (1998) Metropolitics: a regionalagenda for community and stability. TheBrookings Institution and the LincolnInstitute of Land Policy, Washington, DC.
Sassen, S. (1991) The global city: New York,London, Tokyo. Princeton University Press,Princeton, NJ.
Shen J.F. (2002) A study of the temporarypopulation in Chinese cities. HabitatInternational 26.3, 363–77
Silver, H. (1993) National concept of thenew urban poverty: social structurechange in Britain, France and theUnited States. International Journalof Urban and Region Research 17,336–54.
Small, M.L. and K. Newman (2001) Urbanpoverty after the truly disadvantaged: therediscovery of the family, theneighborhood, and culture. Annual Reviewof Sociology 27, 23–45.
Solinger, D.J. (1999) Contesting citizenship inurban China: peasant migrants, the state,and the logic of the market. University ofCalifornia Press, Berkeley, CA.
Solinger, D.J. (2002) Labour market reformand the plight of the laid-off proletariat.The China Quarterly 158, 304–26.
Solinger, D.J. (2006) The creation of a newunderclass in China and its implications.Environment and Urbanization 18.1,177–93
Van Kempen, E.T. (1994) The dual city andthe poor: social polarisation, socialsegregation and life chances. UrbanStudies 31.7, 995–1015.
Wacquant, L.J.D. (1993) Urban outcasts:stigma and division in the black Americanghetto and the French urban periphery.International Journal of Urban andRegion Research 17, 365–83.
Walks, R.A. (2001) The social ecology of thepost-Fordist/global city? Economicrestructuring and socio-spatial polarisationin the Toronto urban region. Urban Studies38.3, 407–77.
348 Shenjing He, Fulong Wu, Chris Webster and Yuting Liu
International Journal of Urban and Regional Research 34.2© 2010 The Authors. Journal Compilation © 2010 Joint Editors and Blackwell Publishing Ltd.
Wang, M. (2004) New urban poverty inChina — disadvantaged retrenchedworkers. International DevelopmentPlanning Review 26.2, 117–39.
Wang, M.Y. (2007) Emerging urban povertyand effects of the Dibao program onalleviating poverty in China. China &World Economy 15.2, 74–88.
Wang, Y.P. (2005a) Low-income communitiesand urban poverty in China. UrbanGeography 26.3, 222–42
Wang, Y.P. (2005b) Urban poverty, housing,and social change in China. Routledge,London.
Wessel, T. (2000) Social polarization andsocioeconomic segregation in a welfarestate: the case of Oslo. Urban Studies37.11, 1947–67.
Wilson, W.J. (1987) The truly disadvantaged:the inner city, the underclass, and publicpolicy. University of Chicago Press,Chicago.
Wilson, W.J. (1996) When work disappears:the world of the new urban poor. RandomHouse, New York.
White, P. (1995) Ideologies, social exclusionand spatial segregation in Paris. In S.Musterd and W. Ostendorf (eds.), Urbansegregation and the welfare state:
inequality and exclusion in Western cities,Routledge, London.
World Bank (2007) PovcalNet [WWWdocument]. URL http://iresearch.worldbank.org/PovcalNet (accessed12 December 2007).
Wu, F. (2004) Urban poverty andmarginalization under market transition:the case of Chinese cities. InternationalJournal of Urban and Regional Research28.2, 401–23.
Wu, F. (2007) The poverty of transition: fromindustrial district to poor neighbourhood inthe city of Nanjing, China. Urban Studies44.13, 2673–94.
Wu, F. and N.Y. Huang (2007) New urbanpoverty in China: economic restructuringand transformation of welfare provision.Asia Pacific Viewpoint 48.2, 168–85.
Yao, S.J. (2004) Unemployment and urbanpoverty in China: a case study ofGuangzhou and Tianjin. Journal ofInternational Development 16, 171–88.
Zhang, L. (2001) Strangers in the city:reconfiguration of space, power, and socialnetworks within China’s floatingpopulation. Stanford University Press,Stanford.
RésuméEn s’appuyant sur une vaste enquête menée en 2007 auprès de ménages chinois, cetarticle décrit la concentration de la pauvreté et ses déterminants dans les groupessociaux et les quartiers à faible revenu. Il identifie trois types de quartier: quartiersvétustes des centres-villes, villages ouvriers en déclin et villages urbains. Les personnesinterrogées sont regroupées en quatre catégories: résidents urbains actifs, chômeurs ousans-emplois, et retraités, ainsi que migrants ruraux. D’abord, la concentration de lapauvreté est mesurée dans différents types de quartier et différents groupes. Les niveauxles plus élevés se trouvent dans les quartiers vétustes des centres-villes et chez leschômeurs ou sans-emplois. Il apparaît des inadéquations entre la réalité des difficultésvécues, la perception des privations, et la répartition des prestations d’aide sociale.Ensuite, les déterminants de la pauvreté sont étudiés. Les variations dans la protectioninstitutionnelle et les rémunérations issues du marché deviennent tout aussi importantespour prévoir la génération de la pauvreté, mais elles s’y associent de façon différenteselon les quartiers et les groupes. Comme l’économie urbaine chinoise est de plus enplus façonnée par les marchés, le mécanisme de rémunération en fonction du marchéprend davantage d’importance parmi les déterminants des modèles de pauvreté,notamment pour les exclus des institutions de l’État, en particulier les ouvriers licenciéset les migrants ruraux.
Poverty concentration in China’s low-income neighbourhoods 349
International Journal of Urban and Regional Research 34.2© 2010 The Authors. Journal Compilation © 2010 Joint Editors and Blackwell Publishing Ltd.
Copyright © 2022 FDOKUMEN