Potential role of atomic force microscopy in systems biology.
15
Advanced Review Potential role of atomic force microscopy in systems biology Srinivasan Ramachandran, 1,2∗ Fernando Teran Arce 1,2 and Ratnesh Lal 1,2 Systems biology is a quantitative approach for understanding a biological system at its global level through systematic perturbation and integrated analysis of all its components. Simultaneous acquisition of information data sets pertaining to the system components (e.g., genome, proteome) is essential to implement this approach. There are limitations to such an approach in measuring gene expression levels and accounting for all proteins in the system. The success of genomic studies is critically dependent on polymerase chain reaction (PCR) for its amplification, but PCR is very uneven in amplifying the samples, ineffective in scarce samples and unreliable in low copy number transcripts. On the other hand, lack of amplifying techniques for proteins critically limits their identification to only a small fraction of high concentration proteins. Atomic force microscopy (AFM), AFM cantilever sensors, and AFM force spectroscopy in particular, could address these issues directly. In this article, we reviewed and assessed their potential role in systems biology. 2011 John Wiley & Sons, Inc. WIREs Syst Biol Med 2011 3 702–716 DOI: 10.1002/wsbm.154 INTRODUCTION T he ultimate goal of systems biology is to build analytical models of biological systems for a quan- titative and comprehensive understanding of their functioning in normal and abnormal conditions. Sys- tems biology takes a holistic (systematic, integrated, and quantitative) approach to understand the causal relationship of a biological system’s dynamic behav- ior and organization at its global scale, in response to a stimulus. Dynamic behavior of a biological system is determined by its individual components, their level of organization (physical topology), their interaction and differential flow of signals through their physical organization (logical topology). It is essential to have quantitative understanding of the causal relationship of a biological system’s (emergent) behavior so ∗ Correspondence to: [email protected] 1 Department of Bioengineering, University of California San Diego, La Jolla, CA, USA 2 Department of Mechanical and Aerospace Engineering, University of California San Diego, La Jolla, CA, USA Based on a presentation to the 8th Interna- tional Conference on Pathways, Networks and Systems Medicine. www.aegeanconferences.org DOI: 10.1002/wsbm.154 that analytical models could be built for predicting outcomes for a stimulus. Such an approach would provide better perspective of human physiology and pathology that would ultimately help in the delivery of better health care. A basic framework toward systems approach includes 1 : 1. Defining a system by breaking it down into its fundamental components—to make an initial analytical model; 2. Systematic perturbation and simultaneous monitoring of the system, accounting for all the components of the system; 3. Reconstructing the initial model based on the agreements between experimental observations (step 2) and model prediction (step 1); and 4. Verifying the reconstructed model (step 3) by carrying out new perturbations (step 2). These steps are iterated until the goodness of fit between the predicted model and the experimental observations are statistically significant and biologically relevant (Figure 1). Structurally, biological systems are hierarchi- cally arranged in complex layers of systems or sub- systems. Thus, one system could be part of another 702 2011 John Wiley & Sons, Inc. Volume 3, November/December 2011
Transcript of Potential role of atomic force microscopy in systems biology.

Advanced Review
Potential role of atomic forcemicroscopy in systems biologySrinivasan Ramachandran,1,2∗ Fernando Teran Arce1,2
and Ratnesh Lal1,2
Systems biology is a quantitative approach for understanding a biological systemat its global level through systematic perturbation and integrated analysis of allits components. Simultaneous acquisition of information data sets pertaining tothe system components (e.g., genome, proteome) is essential to implement thisapproach. There are limitations to such an approach in measuring gene expressionlevels and accounting for all proteins in the system. The success of genomic studiesis critically dependent on polymerase chain reaction (PCR) for its amplification, butPCR is very uneven in amplifying the samples, ineffective in scarce samples andunreliable in low copy number transcripts. On the other hand, lack of amplifyingtechniques for proteins critically limits their identification to only a small fractionof high concentration proteins. Atomic force microscopy (AFM), AFM cantileversensors, and AFM force spectroscopy in particular, could address these issuesdirectly. In this article, we reviewed and assessed their potential role in systemsbiology. 2011 John Wiley & Sons, Inc. WIREs Syst Biol Med 2011 3 702–716 DOI: 10.1002/wsbm.154
INTRODUCTION
The ultimate goal of systems biology is to buildanalytical models of biological systems for a quan-
titative and comprehensive understanding of theirfunctioning in normal and abnormal conditions. Sys-tems biology takes a holistic (systematic, integrated,and quantitative) approach to understand the causalrelationship of a biological system’s dynamic behav-ior and organization at its global scale, in response toa stimulus.
Dynamic behavior of a biological system isdetermined by its individual components, their levelof organization (physical topology), their interactionand differential flow of signals through their physicalorganization (logical topology). It is essential to havequantitative understanding of the causal relationshipof a biological system’s (emergent) behavior so
∗Correspondence to: [email protected] of Bioengineering, University of California San Diego,La Jolla, CA, USA2Department of Mechanical and Aerospace Engineering, Universityof California San Diego, La Jolla, CA, USA
Based on a presentation to the 8th Interna-tional Conference on Pathways, Networks andSystems Medicine. www.aegeanconferences.org
DOI: 10.1002/wsbm.154
that analytical models could be built for predictingoutcomes for a stimulus. Such an approach wouldprovide better perspective of human physiology andpathology that would ultimately help in the delivery ofbetter health care. A basic framework toward systemsapproach includes1:
1. Defining a system by breaking it down into itsfundamental components—to make an initialanalytical model;
2. Systematic perturbation and simultaneousmonitoring of the system, accounting for allthe components of the system;
3. Reconstructing the initial model based on theagreements between experimental observations(step 2) and model prediction (step 1); and
4. Verifying the reconstructed model (step 3) bycarrying out new perturbations (step 2).
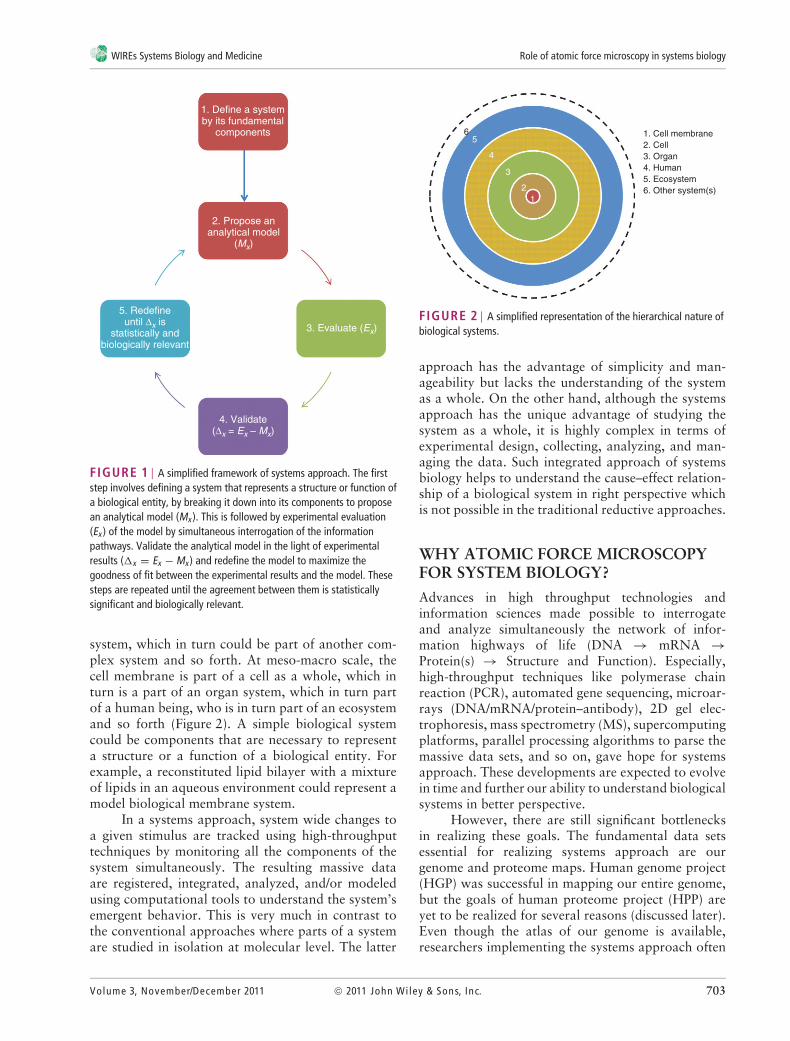
These steps are iterated until the goodnessof fit between the predicted model and theexperimental observations are statistically significantand biologically relevant (Figure 1).
Structurally, biological systems are hierarchi-cally arranged in complex layers of systems or sub-systems. Thus, one system could be part of another
702 2011 John Wi ley & Sons, Inc. Volume 3, November/December 2011
WIREs Systems Biology and Medicine Role of atomic force microscopy in systems biology
1. Define a systemby its fundamental
components
2. Propose ananalytical model
(Mx)
5. Redefineuntil ∆x is
statistically andbiologically relevant
3. Evaluate (Ex)
4. Validate(∆x = Ex – Mx)
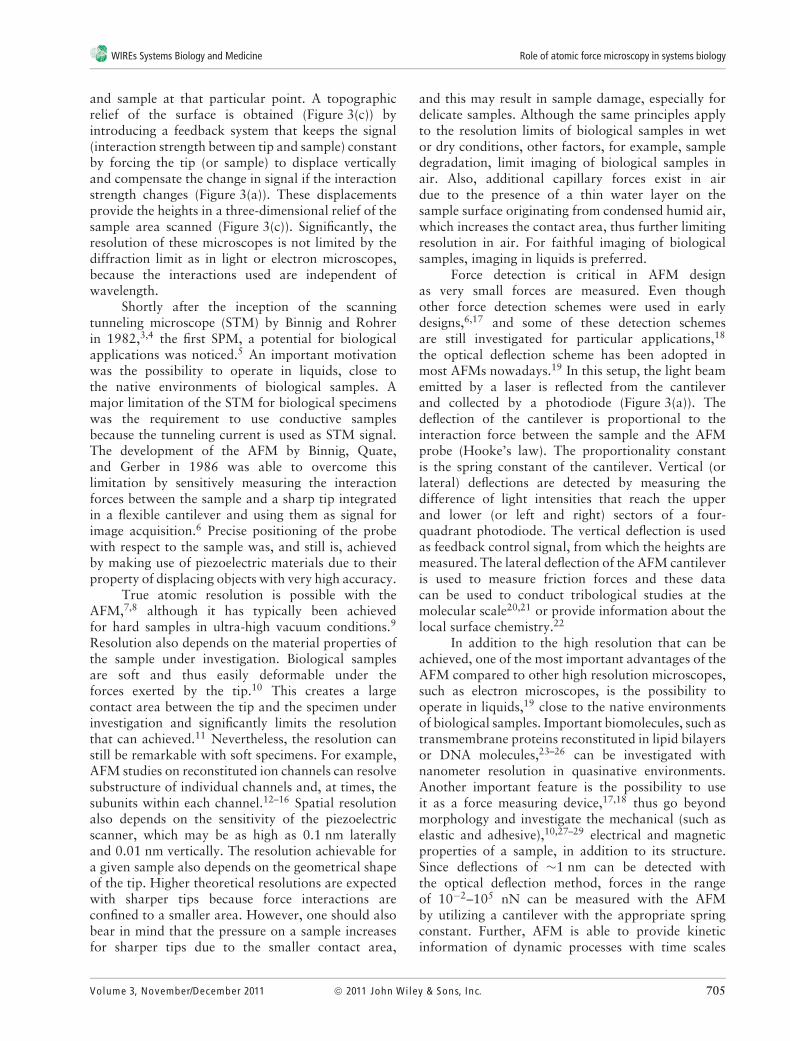
FIGURE 1 | A simplified framework of systems approach. The firststep involves defining a system that represents a structure or function ofa biological entity, by breaking it down into its components to proposean analytical model (Mx ). This is followed by experimental evaluation(Ex ) of the model by simultaneous interrogation of the informationpathways. Validate the analytical model in the light of experimentalresults (�x = Ex − Mx ) and redefine the model to maximize thegoodness of fit between the experimental results and the model. Thesesteps are repeated until the agreement between them is statisticallysignificant and biologically relevant.
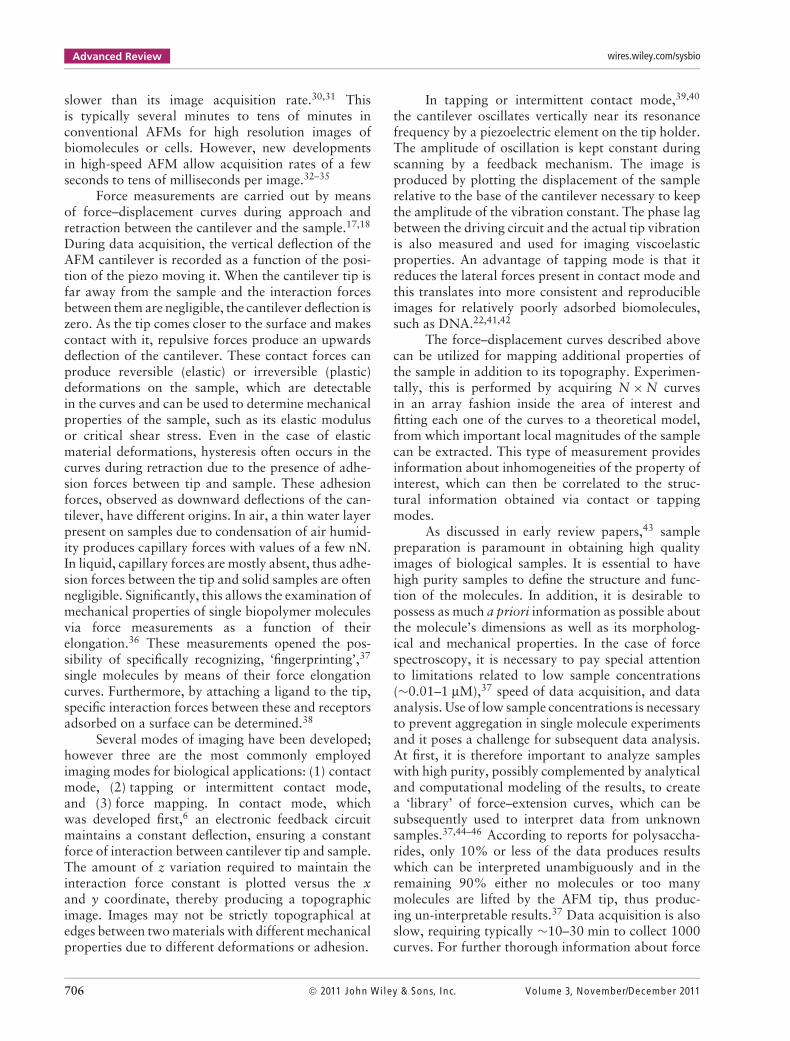
system, which in turn could be part of another com-plex system and so forth. At meso-macro scale, thecell membrane is part of a cell as a whole, which inturn is a part of an organ system, which in turn partof a human being, who is in turn part of an ecosystemand so forth (Figure 2). A simple biological systemcould be components that are necessary to representa structure or a function of a biological entity. Forexample, a reconstituted lipid bilayer with a mixtureof lipids in an aqueous environment could represent amodel biological membrane system.
In a systems approach, system wide changes toa given stimulus are tracked using high-throughputtechniques by monitoring all the components of thesystem simultaneously. The resulting massive dataare registered, integrated, analyzed, and/or modeledusing computational tools to understand the system’semergent behavior. This is very much in contrast tothe conventional approaches where parts of a systemare studied in isolation at molecular level. The latter
1. Cell membrane2. Cell3. Organ4. Human 5. Ecosystem 6. Other system(s)
12
3
4
56
FIGURE 2 | A simplified representation of the hierarchical nature ofbiological systems.
approach has the advantage of simplicity and man-ageability but lacks the understanding of the systemas a whole. On the other hand, although the systemsapproach has the unique advantage of studying thesystem as a whole, it is highly complex in terms ofexperimental design, collecting, analyzing, and man-aging the data. Such integrated approach of systemsbiology helps to understand the cause–effect relation-ship of a biological system in right perspective whichis not possible in the traditional reductive approaches.
WHY ATOMIC FORCE MICROSCOPYFOR SYSTEM BIOLOGY?
Advances in high throughput technologies andinformation sciences made possible to interrogateand analyze simultaneously the network of infor-mation highways of life (DNA → mRNA →Protein(s) → Structure and Function). Especially,high-throughput techniques like polymerase chainreaction (PCR), automated gene sequencing, microar-rays (DNA/mRNA/protein–antibody), 2D gel elec-trophoresis, mass spectrometry (MS), supercomputingplatforms, parallel processing algorithms to parse themassive data sets, and so on, gave hope for systemsapproach. These developments are expected to evolvein time and further our ability to understand biologicalsystems in better perspective.
However, there are still significant bottlenecksin realizing these goals. The fundamental data setsessential for realizing systems approach are ourgenome and proteome maps. Human genome project(HGP) was successful in mapping our entire genome,but the goals of human proteome project (HPP) areyet to be realized for several reasons (discussed later).Even though the atlas of our genome is available,researchers implementing the systems approach often
Volume 3, November/December 2011 2011 John Wi ley & Sons, Inc. 703

Advanced Review wires.wiley.com/sysbio
encounter low abundant samples (typical of clinicalsamples, DNA extracted from fossils, etc.). Insuch scenarios, PCR amplification is ineffective andunreliable thus impeding genomic studies and systemsapproach. In addition, even in abundant samples,PCR fails or is ineffective in amplifying low copynumber species like gene regulatory proteins. Underthese circumstances, the scope and requirement fordirect sequencing techniques become relevant andessential. Lack of amplifying techniques like PCRfor proteomics resulted in proteomics to be at themercy of the concentration sensitivity limits (CSL)of detection techniques. The current proteomicstechnologies allow detection of only 20% of proteinspecies in the blood plasma,2 a large majority (about80%) of the proteome is still at large. In thiscontext, atomic force microscopy (AFM) in all itsdifferent modalities of imaging (contact, noncontact,tapping, lateral force, force volume, magnetic force,chemical force, surface potential, electrochemical,conductive-AFM, recognition force, etc.), as wellas force spectroscopy, cantilever based sensing, andother Scanning Probe Microscopy (SPM) techniques,for example, scanning near-field optical microscopy(SNOM), with their exquisite sensitivity to detector discriminate single molecules, could play anindispensable role in achieving direct sequencing ofgenome on scarce materials as well as herald a newway to identify a large plethora of proteins belowCSL, down to orders of magnitude comparable to theinverse of the Avogadro number. Above all, AFM perse as an imaging or as a spectroscopy tool, and AFM-based techniques like cantilever sensors or multimodalAFM platform (see below) could be used to studysimple model systems as well as verifying some of therefined hypothesis (step 4, of the systems framework;see above) through single molecule studies whenevernecessary.
The Atomic Force MicroscopeThe AFM (Figure 3(a)) is a key member of a series ofscanning probe microscopes (SPMs) that make useof a local measurable interaction between a verysmall probe and the sample as signal for imageformation (Figure 3(b)). In principle, any interactionthat is spatially resolved in (x, y) and is a functionof distance (z) from the sample can be used as SPMsignal. Examples of interactions used as signals are:electric currents, forces, magnetic field, and so on. Asthe probe scans over an area of the sample, data ofthe interaction strength is collected at a rectangulararray of points, in which each data point is associatedwith the strength of the interaction between tip
SetpointFeedback
Amp
MirrorLaser source
Lighttrajectory
Photodiode
Attractive
Zero
Repulsive
Sample
Scanner
Cantilever
Tip
Tip
Tip trajectory
Sample
30 nm
0
(a)
(b)
(c)
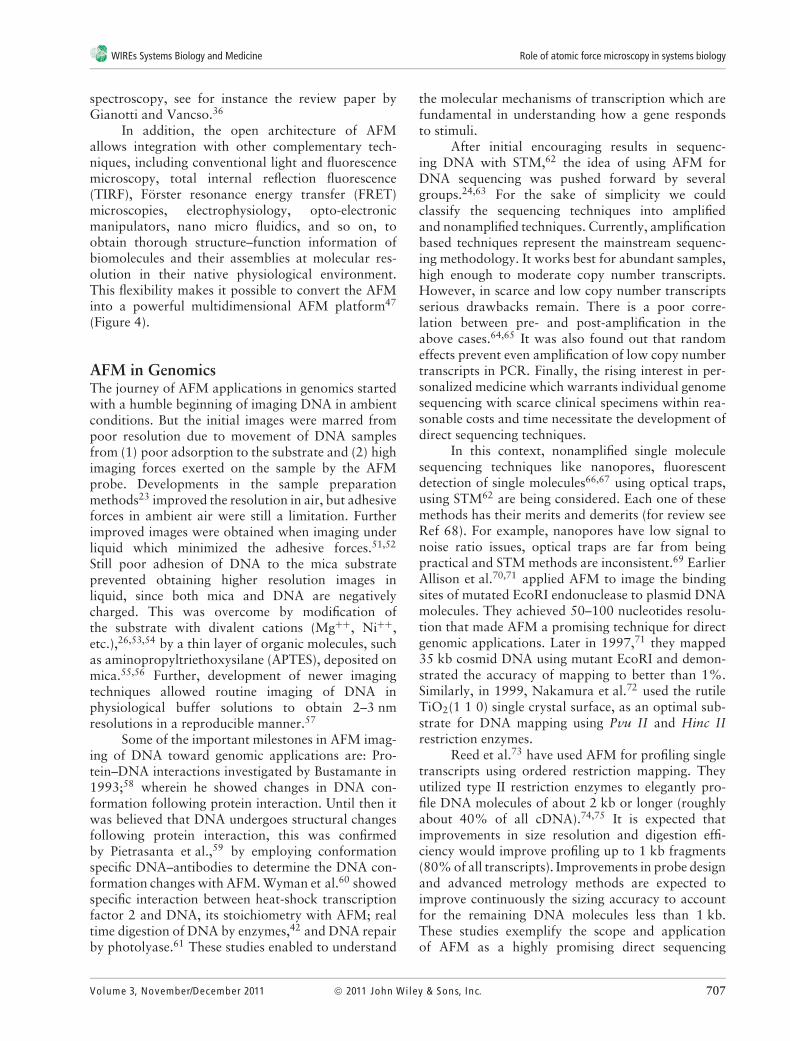
FIGURE 3 | (a) Schematic diagram of an AFM with optical detectionsystem of cantilever deflection. Only two quadrants of thephotodetector are shown. A feedback system compares the amplifiedoutput of the photodetector with a setpoint value chosen by the user.When the difference between both values is different to zero, a voltageis sent to the piezoelectric scanner, which moves the sample to bringthe difference value back to zero. The inset shows cantilever deflectionsas a result of attractive and repulsive forces. (b) The probe plays afundamental role in the image formation mechanism of scanning probemicroscopies. The resulting image is a convolution of the topography ofthe sample and the geometrical features of the probe being scanned. Ifthe probe has multiple protrusions close to one another, the resultingimage will be distorted, displaying multiple features of the same object.The measured width of an object is also broadened because of the sizeof probe radius (c). However, the measured height is independent of it.The figure shows images of gold nanoparticles with 30 nm diameter.The measured height is close to 30 nm, but the width is larger.
704 2011 John Wi ley & Sons, Inc. Volume 3, November/December 2011
WIREs Systems Biology and Medicine Role of atomic force microscopy in systems biology
and sample at that particular point. A topographicrelief of the surface is obtained (Figure 3(c)) byintroducing a feedback system that keeps the signal(interaction strength between tip and sample) constantby forcing the tip (or sample) to displace verticallyand compensate the change in signal if the interactionstrength changes (Figure 3(a)). These displacementsprovide the heights in a three-dimensional relief of thesample area scanned (Figure 3(c)). Significantly, theresolution of these microscopes is not limited by thediffraction limit as in light or electron microscopes,because the interactions used are independent ofwavelength.
Shortly after the inception of the scanningtunneling microscope (STM) by Binnig and Rohrerin 1982,3,4 the first SPM, a potential for biologicalapplications was noticed.5 An important motivationwas the possibility to operate in liquids, close tothe native environments of biological samples. Amajor limitation of the STM for biological specimenswas the requirement to use conductive samplesbecause the tunneling current is used as STM signal.The development of the AFM by Binnig, Quate,and Gerber in 1986 was able to overcome thislimitation by sensitively measuring the interactionforces between the sample and a sharp tip integratedin a flexible cantilever and using them as signal forimage acquisition.6 Precise positioning of the probewith respect to the sample was, and still is, achievedby making use of piezoelectric materials due to theirproperty of displacing objects with very high accuracy.
True atomic resolution is possible with theAFM,7,8 although it has typically been achievedfor hard samples in ultra-high vacuum conditions.9
Resolution also depends on the material properties ofthe sample under investigation. Biological samplesare soft and thus easily deformable under theforces exerted by the tip.10 This creates a largecontact area between the tip and the specimen underinvestigation and significantly limits the resolutionthat can achieved.11 Nevertheless, the resolution canstill be remarkable with soft specimens. For example,AFM studies on reconstituted ion channels can resolvesubstructure of individual channels and, at times, thesubunits within each channel.12–16 Spatial resolutionalso depends on the sensitivity of the piezoelectricscanner, which may be as high as 0.1 nm laterallyand 0.01 nm vertically. The resolution achievable fora given sample also depends on the geometrical shapeof the tip. Higher theoretical resolutions are expectedwith sharper tips because force interactions areconfined to a smaller area. However, one should alsobear in mind that the pressure on a sample increasesfor sharper tips due to the smaller contact area,
and this may result in sample damage, especially fordelicate samples. Although the same principles applyto the resolution limits of biological samples in wetor dry conditions, other factors, for example, sampledegradation, limit imaging of biological samples inair. Also, additional capillary forces exist in airdue to the presence of a thin water layer on thesample surface originating from condensed humid air,which increases the contact area, thus further limitingresolution in air. For faithful imaging of biologicalsamples, imaging in liquids is preferred.
Force detection is critical in AFM designas very small forces are measured. Even thoughother force detection schemes were used in earlydesigns,6,17 and some of these detection schemesare still investigated for particular applications,18
the optical deflection scheme has been adopted inmost AFMs nowadays.19 In this setup, the light beamemitted by a laser is reflected from the cantileverand collected by a photodiode (Figure 3(a)). Thedeflection of the cantilever is proportional to theinteraction force between the sample and the AFMprobe (Hooke’s law). The proportionality constantis the spring constant of the cantilever. Vertical (orlateral) deflections are detected by measuring thedifference of light intensities that reach the upperand lower (or left and right) sectors of a four-quadrant photodiode. The vertical deflection is usedas feedback control signal, from which the heights aremeasured. The lateral deflection of the AFM cantileveris used to measure friction forces and these datacan be used to conduct tribological studies at themolecular scale20,21 or provide information about thelocal surface chemistry.22
In addition to the high resolution that can beachieved, one of the most important advantages of theAFM compared to other high resolution microscopes,such as electron microscopes, is the possibility tooperate in liquids,19 close to the native environmentsof biological samples. Important biomolecules, such astransmembrane proteins reconstituted in lipid bilayersor DNA molecules,23–26 can be investigated withnanometer resolution in quasinative environments.Another important feature is the possibility to useit as a force measuring device,17,18 thus go beyondmorphology and investigate the mechanical (such aselastic and adhesive),10,27–29 electrical and magneticproperties of a sample, in addition to its structure.Since deflections of ∼1 nm can be detected withthe optical deflection method, forces in the rangeof 10−2–105 nN can be measured with the AFMby utilizing a cantilever with the appropriate springconstant. Further, AFM is able to provide kineticinformation of dynamic processes with time scales
Volume 3, November/December 2011 2011 John Wi ley & Sons, Inc. 705
Advanced Review wires.wiley.com/sysbio
slower than its image acquisition rate.30,31 Thisis typically several minutes to tens of minutes inconventional AFMs for high resolution images ofbiomolecules or cells. However, new developmentsin high-speed AFM allow acquisition rates of a fewseconds to tens of milliseconds per image.32–35
Force measurements are carried out by meansof force–displacement curves during approach andretraction between the cantilever and the sample.17,18
During data acquisition, the vertical deflection of theAFM cantilever is recorded as a function of the posi-tion of the piezo moving it. When the cantilever tip isfar away from the sample and the interaction forcesbetween them are negligible, the cantilever deflection iszero. As the tip comes closer to the surface and makescontact with it, repulsive forces produce an upwardsdeflection of the cantilever. These contact forces canproduce reversible (elastic) or irreversible (plastic)deformations on the sample, which are detectablein the curves and can be used to determine mechanicalproperties of the sample, such as its elastic modulusor critical shear stress. Even in the case of elasticmaterial deformations, hysteresis often occurs in thecurves during retraction due to the presence of adhe-sion forces between tip and sample. These adhesionforces, observed as downward deflections of the can-tilever, have different origins. In air, a thin water layerpresent on samples due to condensation of air humid-ity produces capillary forces with values of a few nN.In liquid, capillary forces are mostly absent, thus adhe-sion forces between the tip and solid samples are oftennegligible. Significantly, this allows the examination ofmechanical properties of single biopolymer moleculesvia force measurements as a function of theirelongation.36 These measurements opened the pos-sibility of specifically recognizing, ‘fingerprinting’,37
single molecules by means of their force elongationcurves. Furthermore, by attaching a ligand to the tip,specific interaction forces between these and receptorsadsorbed on a surface can be determined.38
Several modes of imaging have been developed;however three are the most commonly employedimaging modes for biological applications: (1) contactmode, (2) tapping or intermittent contact mode,and (3) force mapping. In contact mode, whichwas developed first,6 an electronic feedback circuitmaintains a constant deflection, ensuring a constantforce of interaction between cantilever tip and sample.The amount of z variation required to maintain theinteraction force constant is plotted versus the xand y coordinate, thereby producing a topographicimage. Images may not be strictly topographical atedges between two materials with different mechanicalproperties due to different deformations or adhesion.
In tapping or intermittent contact mode,39,40
the cantilever oscillates vertically near its resonancefrequency by a piezoelectric element on the tip holder.The amplitude of oscillation is kept constant duringscanning by a feedback mechanism. The image isproduced by plotting the displacement of the samplerelative to the base of the cantilever necessary to keepthe amplitude of the vibration constant. The phase lagbetween the driving circuit and the actual tip vibrationis also measured and used for imaging viscoelasticproperties. An advantage of tapping mode is that itreduces the lateral forces present in contact mode andthis translates into more consistent and reproducibleimages for relatively poorly adsorbed biomolecules,such as DNA.22,41,42
The force–displacement curves described abovecan be utilized for mapping additional properties ofthe sample in addition to its topography. Experimen-tally, this is performed by acquiring N × N curvesin an array fashion inside the area of interest andfitting each one of the curves to a theoretical model,from which important local magnitudes of the samplecan be extracted. This type of measurement providesinformation about inhomogeneities of the property ofinterest, which can then be correlated to the struc-tural information obtained via contact or tappingmodes.
As discussed in early review papers,43 samplepreparation is paramount in obtaining high qualityimages of biological samples. It is essential to havehigh purity samples to define the structure and func-tion of the molecules. In addition, it is desirable topossess as much a priori information as possible aboutthe molecule’s dimensions as well as its morpholog-ical and mechanical properties. In the case of forcespectroscopy, it is necessary to pay special attentionto limitations related to low sample concentrations(∼0.01–1 µM),37 speed of data acquisition, and dataanalysis. Use of low sample concentrations is necessaryto prevent aggregation in single molecule experimentsand it poses a challenge for subsequent data analysis.At first, it is therefore important to analyze sampleswith high purity, possibly complemented by analyticaland computational modeling of the results, to createa ‘library’ of force–extension curves, which can besubsequently used to interpret data from unknownsamples.37,44–46 According to reports for polysaccha-rides, only 10% or less of the data produces resultswhich can be interpreted unambiguously and in theremaining 90% either no molecules or too manymolecules are lifted by the AFM tip, thus produc-ing un-interpretable results.37 Data acquisition is alsoslow, requiring typically ∼10–30 min to collect 1000curves. For further thorough information about force
706 2011 John Wi ley & Sons, Inc. Volume 3, November/December 2011
WIREs Systems Biology and Medicine Role of atomic force microscopy in systems biology
spectroscopy, see for instance the review paper byGianotti and Vancso.36
In addition, the open architecture of AFMallows integration with other complementary tech-niques, including conventional light and fluorescencemicroscopy, total internal reflection fluorescence(TIRF), Forster resonance energy transfer (FRET)microscopies, electrophysiology, opto-electronicmanipulators, nano micro fluidics, and so on, toobtain thorough structure–function information ofbiomolecules and their assemblies at molecular res-olution in their native physiological environment.This flexibility makes it possible to convert the AFMinto a powerful multidimensional AFM platform47
(Figure 4).
AFM in GenomicsThe journey of AFM applications in genomics startedwith a humble beginning of imaging DNA in ambientconditions. But the initial images were marred frompoor resolution due to movement of DNA samplesfrom (1) poor adsorption to the substrate and (2) highimaging forces exerted on the sample by the AFMprobe. Developments in the sample preparationmethods23 improved the resolution in air, but adhesiveforces in ambient air were still a limitation. Furtherimproved images were obtained when imaging underliquid which minimized the adhesive forces.51,52
Still poor adhesion of DNA to the mica substrateprevented obtaining higher resolution images inliquid, since both mica and DNA are negativelycharged. This was overcome by modification ofthe substrate with divalent cations (Mg++, Ni++,etc.),26,53,54 by a thin layer of organic molecules, suchas aminopropyltriethoxysilane (APTES), deposited onmica.55,56 Further, development of newer imagingtechniques allowed routine imaging of DNA inphysiological buffer solutions to obtain 2–3 nmresolutions in a reproducible manner.57
Some of the important milestones in AFM imag-ing of DNA toward genomic applications are: Pro-tein–DNA interactions investigated by Bustamante in1993;58 wherein he showed changes in DNA con-formation following protein interaction. Until then itwas believed that DNA undergoes structural changesfollowing protein interaction, this was confirmedby Pietrasanta et al.,59 by employing conformationspecific DNA–antibodies to determine the DNA con-formation changes with AFM. Wyman et al.60 showedspecific interaction between heat-shock transcriptionfactor 2 and DNA, its stoichiometry with AFM; realtime digestion of DNA by enzymes,42 and DNA repairby photolyase.61 These studies enabled to understand
the molecular mechanisms of transcription which arefundamental in understanding how a gene respondsto stimuli.
After initial encouraging results in sequenc-ing DNA with STM,62 the idea of using AFM forDNA sequencing was pushed forward by severalgroups.24,63 For the sake of simplicity we couldclassify the sequencing techniques into amplifiedand nonamplified techniques. Currently, amplificationbased techniques represent the mainstream sequenc-ing methodology. It works best for abundant samples,high enough to moderate copy number transcripts.However, in scarce and low copy number transcriptsserious drawbacks remain. There is a poor corre-lation between pre- and post-amplification in theabove cases.64,65 It was also found out that randomeffects prevent even amplification of low copy numbertranscripts in PCR. Finally, the rising interest in per-sonalized medicine which warrants individual genomesequencing with scarce clinical specimens within rea-sonable costs and time necessitate the development ofdirect sequencing techniques.
In this context, nonamplified single moleculesequencing techniques like nanopores, fluorescentdetection of single molecules66,67 using optical traps,using STM62 are being considered. Each one of thesemethods has their merits and demerits (for review seeRef 68). For example, nanopores have low signal tonoise ratio issues, optical traps are far from beingpractical and STM methods are inconsistent.69 EarlierAllison et al.70,71 applied AFM to image the bindingsites of mutated EcoRI endonuclease to plasmid DNAmolecules. They achieved 50–100 nucleotides resolu-tion that made AFM a promising technique for directgenomic applications. Later in 1997,71 they mapped35 kb cosmid DNA using mutant EcoRI and demon-strated the accuracy of mapping to better than 1%.Similarly, in 1999, Nakamura et al.72 used the rutileTiO2(1 1 0) single crystal surface, as an optimal sub-strate for DNA mapping using Pvu II and Hinc IIrestriction enzymes.
Reed et al.73 have used AFM for profiling singletranscripts using ordered restriction mapping. Theyutilized type II restriction enzymes to elegantly pro-file DNA molecules of about 2 kb or longer (roughlyabout 40% of all cDNA).74,75 It is expected thatimprovements in size resolution and digestion effi-ciency would improve profiling up to 1 kb fragments(80% of all transcripts). Improvements in probe designand advanced metrology methods are expected toimprove continuously the sizing accuracy to accountfor the remaining DNA molecules less than 1 kb.These studies exemplify the scope and applicationof AFM as a highly promising direct sequencing
Volume 3, November/December 2011 2011 John Wi ley & Sons, Inc. 707
Advanced Review wires.wiley.com/sysbio
(b)
(a)
(d)
(c)
(e)
(g)
(f)
65pA
Laser diode
First focus lens
Piezoelectricscanner
First focal point
Scanning lens
Dichroic mirror
Top viewOptical access
Cantilever & tip
Petri dishw/sample
Optical accessfor fluorescent &
Microelectrode µ-perfusionsystem
Collimatinglens
4-segmentphotodiode
I
Specimen
Laser beam
Glass pipette
Split photodiode
Mirror
Electrolyte
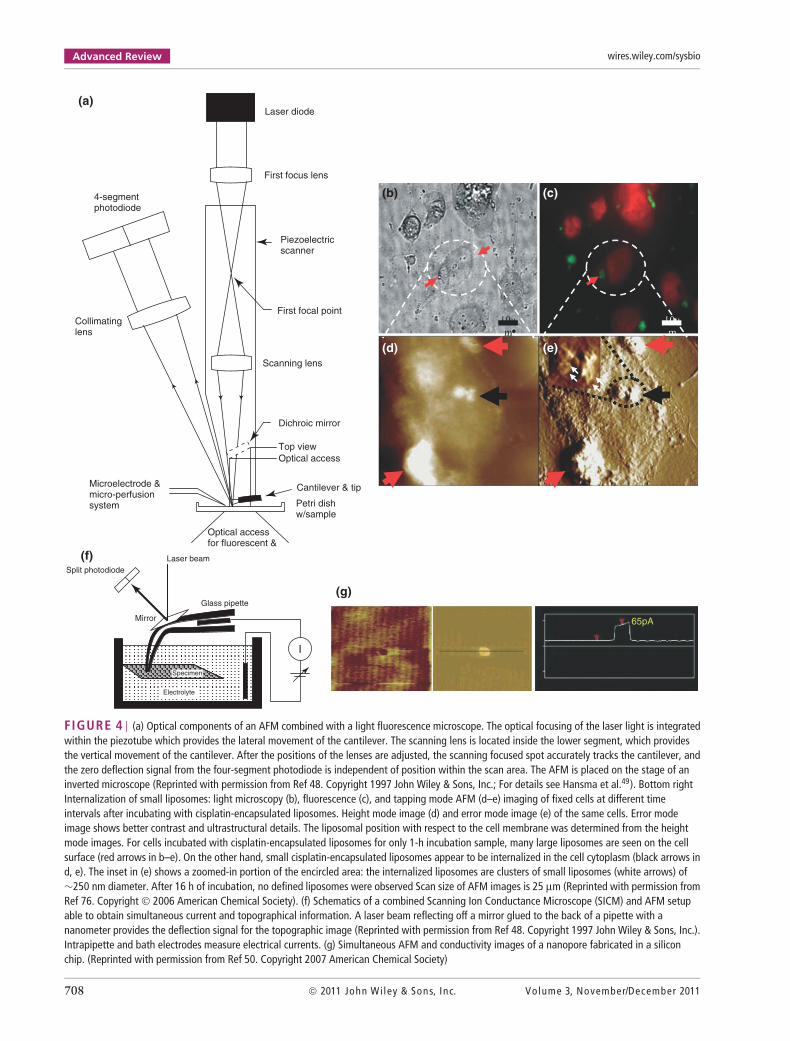
FIGURE 4 | (a) Optical components of an AFM combined with a light fluorescence microscope. The optical focusing of the laser light is integratedwithin the piezotube which provides the lateral movement of the cantilever. The scanning lens is located inside the lower segment, which providesthe vertical movement of the cantilever. After the positions of the lenses are adjusted, the scanning focused spot accurately tracks the cantilever, andthe zero deflection signal from the four-segment photodiode is independent of position within the scan area. The AFM is placed on the stage of aninverted microscope (Reprinted with permission from Ref 48. Copyright 1997 John Wiley & Sons, Inc.; For details see Hansma et al.49). Bottom rightInternalization of small liposomes: light microscopy (b), fluorescence (c), and tapping mode AFM (d–e) imaging of fixed cells at different timeintervals after incubating with cisplatin-encapsulated liposomes. Height mode image (d) and error mode image (e) of the same cells. Error modeimage shows better contrast and ultrastructural details. The liposomal position with respect to the cell membrane was determined from the heightmode images. For cells incubated with cisplatin-encapsulated liposomes for only 1-h incubation sample, many large liposomes are seen on the cellsurface (red arrows in b–e). On the other hand, small cisplatin-encapsulated liposomes appear to be internalized in the cell cytoplasm (black arrows ind, e). The inset in (e) shows a zoomed-in portion of the encircled area: the internalized liposomes are clusters of small liposomes (white arrows) of∼250 nm diameter. After 16 h of incubation, no defined liposomes were observed Scan size of AFM images is 25 µm (Reprinted with permission fromRef 76. Copyright 2006 American Chemical Society). (f) Schematics of a combined Scanning Ion Conductance Microscope (SICM) and AFM setupable to obtain simultaneous current and topographical information. A laser beam reflecting off a mirror glued to the back of a pipette with ananometer provides the deflection signal for the topographic image (Reprinted with permission from Ref 48. Copyright 1997 John Wiley & Sons, Inc.).Intrapipette and bath electrodes measure electrical currents. (g) Simultaneous AFM and conductivity images of a nanopore fabricated in a siliconchip. (Reprinted with permission from Ref 50. Copyright 2007 American Chemical Society)
708 2011 John Wi ley & Sons, Inc. Volume 3, November/December 2011

WIREs Systems Biology and Medicine Role of atomic force microscopy in systems biology
technique where amplified sequencing techniques likePCR have no scope.
Recently, Bailo et al.77 have applied AFM tipenhanced Raman spectroscopy (TERS) for sequenc-ing single strand RNA at high lateral resolution withexcellent contrast and sensitivity. They successfullysequenced a single stranded RNA cytosine homopoly-mer and demonstrated that single base resolution isnot required as long as the tip is moved at singlebase-to-base distances and collecting the Raman spec-tra. The variations in spectra could then be ascribedto the variations in the sequence. This techniqueholds potential for direct sequencing of biopolymers(RNA/DNA/protein) at single base/amino acid resolu-tion without any labeling procedures.
Another very important area of application ingenomics is AFM force spectroscopy for the detectionof single nucleotide polymorphisms (SNP). SNPsaccount for about 90% of human genetic variationswhich determine an individual’s unique responseto various physical/chemical/biological insults. Inother words, they determine someone’s likelihood ofdeveloping a disease following exposure to a pathogenor their response to a drug treatment. Thereforemapping SNP database of the human genomehas enormous implications in health care delivery(diagnosis, drug treatment, and biomedical research)toward realizing the goals of personalized medicine.
There are several scanning techniques availablefor detecting DNA polymorphisms, but the needfor direct measurements independent of PCR tech-nologies is essential, as PCR based techniques resultin uneven amplification leading to underscoring ofSNPs. Direct measurements based on DNA’s physi-cal characteristics like mass is a preferred choice.78
Intermolecular forces resulting from adsorption offew biomolecules on the surface of AFM cantileverinduce mechanical stress resulting in its deflectionwhich is detected by an efficient optical lever system.They are capable of sensing ultralow intermolecularforces in the regime of piconewtons and they alreadyhave been used to understand the energy landscape ofreceptor–ligand or interaction between complemen-tary molecules at single molecular level (see reviewsby Clausen-Schaumann79 and Hinterdorfer80).
Using similar principles, AFM force spec-troscopy was used to detect SNP’s in high throughputformat.81,82 Fritz et al. successfully demonstrated sin-gle base pair mismatches by designing a simple dualcantilever system functionalized with oligonucleotidesand detected their complements by analyzing thedifferential signals from the cantilevers. The advan-tages of cantilever based detection are that theyare direct, no labeling required and they can be
implemented in high throughput schemes (massiveparallel sequencing) under both at static and dynamicconditions. Force resolution of cantilever detection islimited by its thermal vibrations (noise); by a care-ful design of experimental conditions like ultralowtemperatures and noise free environs, one couldimprove the sensitivity of detection. Stowe et al.,83
achieved a force resolution of ∼6 aN using ultrathincantilevers at 4.8 K in vacuum. This level of sensitivitywould certainly lower the detection limits to just a fewmolecules in a sample.
AFM in ProteomicsAfter the successful completion of HGP, in thepost genomic era proteomics has become the newgenomics,84 but an organism’s proteome is muchmore complex than its genome, even though it is theproduct of the genome (DNA → RNA → Protein(s)).To apprise this better, let us consider these facts:there are about 30,000 genes and about two millionproteins in the human body. Therefore there is morethan one protein per gene and this is due to severalreasons including: (1) differential splicing of the gene(2) post translational modifications, (3) interactionwith the message itself (Protein–DNA/Protein–RNA)and altering its states, (4) ability to interact with itselfor with others and evolve into new functional units, allthese events lead to production of different functionalentities (protein products) from a single gene.
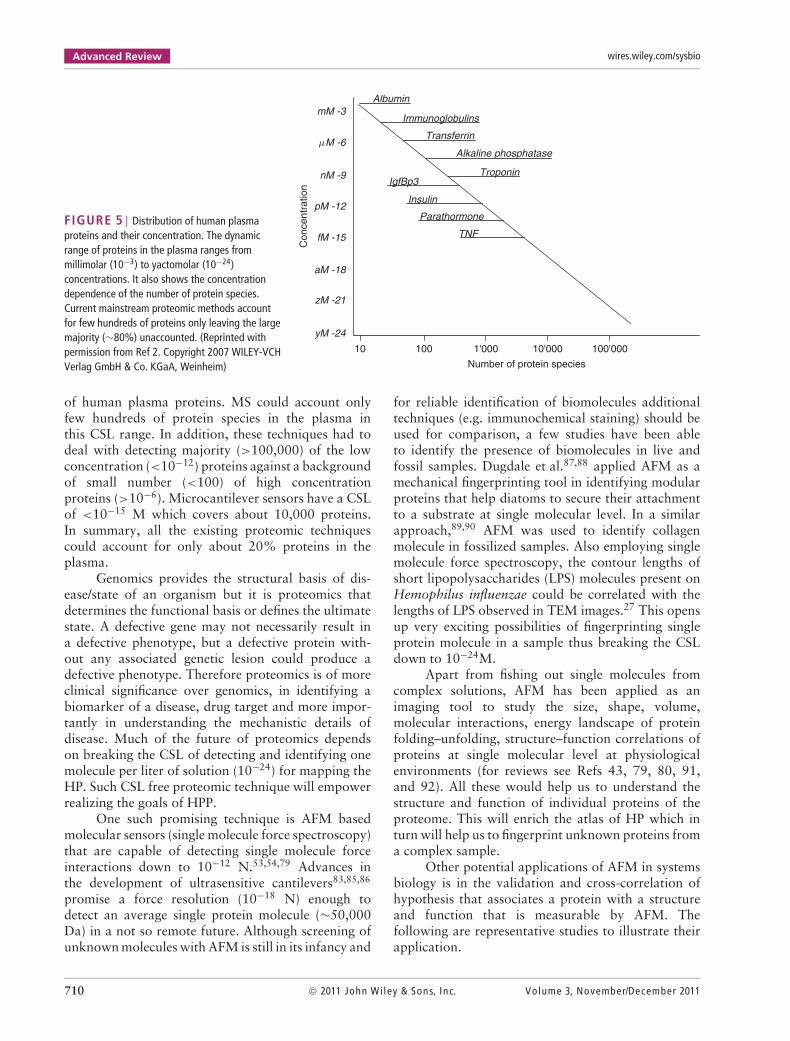
It is evident that mapping human proteome (HP)is a natural extension of the HGP, but mappingHP is more complex and challenging because of theaforementioned reasons. HGP was possible becauseof (1) structural simplicity and static nature of ourgenome. In contrast, proteome is highly variable bothspatially (varies from one cell type to the other,varies from one organ to the other) and temporally(depending on the state of the organism). (2) Geneticmaterial is easily soluble in physiological buffersand relatively stable thus amenable for biochemicalprocessing and automated sequencing. On the otherhand, proteins are highly variable in solubility andstability. (3) Most important of all is the availability ofamplification techniques like PCR made HGP possibleand lack of such amplification methods for proteins isthe single most important hurdle in mapping HP. As adirect consequence of this, mapping HP is limited bythe concentration sensitivity limits (CSL) of the currenttechnologies (see Ref 2 for an excellent treatment onthis subject). For example, the widely used mainstreamprotein sequencing tool, including all variants of massspectrometry (MS), have CSL of >10−8 M. Figure 5shows the concentration dependence of the number
Volume 3, November/December 2011 2011 John Wi ley & Sons, Inc. 709
Advanced Review wires.wiley.com/sysbio
FIGURE 5 | Distribution of human plasmaproteins and their concentration. The dynamicrange of proteins in the plasma ranges frommillimolar (10−3) to yactomolar (10−24)concentrations. It also shows the concentrationdependence of the number of protein species.Current mainstream proteomic methods accountfor few hundreds of proteins only leaving the largemajority (∼80%) unaccounted. (Reprinted withpermission from Ref 2. Copyright 2007 WILEY-VCHVerlag GmbH & Co. KGaA, Weinheim)
Albumin
Immunoglobulins
Transferrin
Alkaline phosphatase
TroponinIgfBp3
Insulin
Parathormone
TNF
mM -3
mM -6
nM -9
pM -12
fM -15
aM -18
zM -21
yM -24
Con
cent
ratio
n
10 100 1'000 10'000 100'000
Number of protein species
of human plasma proteins. MS could account onlyfew hundreds of protein species in the plasma inthis CSL range. In addition, these techniques had todeal with detecting majority (>100,000) of the lowconcentration (<10−12) proteins against a backgroundof small number (<100) of high concentrationproteins (>10−6). Microcantilever sensors have a CSLof <10−15 M which covers about 10,000 proteins.In summary, all the existing proteomic techniquescould account for only about 20% proteins in theplasma.
Genomics provides the structural basis of dis-ease/state of an organism but it is proteomics thatdetermines the functional basis or defines the ultimatestate. A defective gene may not necessarily result ina defective phenotype, but a defective protein with-out any associated genetic lesion could produce adefective phenotype. Therefore proteomics is of moreclinical significance over genomics, in identifying abiomarker of a disease, drug target and more impor-tantly in understanding the mechanistic details ofdisease. Much of the future of proteomics dependson breaking the CSL of detecting and identifying onemolecule per liter of solution (10−24) for mapping theHP. Such CSL free proteomic technique will empowerrealizing the goals of HPP.
One such promising technique is AFM basedmolecular sensors (single molecule force spectroscopy)that are capable of detecting single molecule forceinteractions down to 10−12 N.53,54,79 Advances inthe development of ultrasensitive cantilevers83,85,86
promise a force resolution (10−18 N) enough todetect an average single protein molecule (∼50,000Da) in a not so remote future. Although screening ofunknown molecules with AFM is still in its infancy and
for reliable identification of biomolecules additionaltechniques (e.g. immunochemical staining) should beused for comparison, a few studies have been ableto identify the presence of biomolecules in live andfossil samples. Dugdale et al.87,88 applied AFM as amechanical fingerprinting tool in identifying modularproteins that help diatoms to secure their attachmentto a substrate at single molecular level. In a similarapproach,89,90 AFM was used to identify collagenmolecule in fossilized samples. Also employing singlemolecule force spectroscopy, the contour lengths ofshort lipopolysaccharides (LPS) molecules present onHemophilus influenzae could be correlated with thelengths of LPS observed in TEM images.27 This opensup very exciting possibilities of fingerprinting singleprotein molecule in a sample thus breaking the CSLdown to 10−24M.
Apart from fishing out single molecules fromcomplex solutions, AFM has been applied as animaging tool to study the size, shape, volume,molecular interactions, energy landscape of proteinfolding–unfolding, structure–function correlations ofproteins at single molecular level at physiologicalenvironments (for reviews see Refs 43, 79, 80, 91,and 92). All these would help us to understand thestructure and function of individual proteins of theproteome. This will enrich the atlas of HP which inturn will help us to fingerprint unknown proteins froma complex sample.
Other potential applications of AFM in systemsbiology is in the validation and cross-correlation ofhypothesis that associates a protein with a structureand function that is measurable by AFM. Thefollowing are representative studies to illustrate theirapplication.
710 2011 John Wi ley & Sons, Inc. Volume 3, November/December 2011

WIREs Systems Biology and Medicine Role of atomic force microscopy in systems biology
Single Molecule ArchitectureThe structure of connexin hemichannels wereunknown until AFM studies12,13,16,93 delineated theirmolecular structure for the first time. It revealed theirmolecular organization, size, shape and response toexternal stimuli such as extracellular calcium levels(Figure 6(a) and (b)). These studies heralded a newparadigm for studying native membrane proteins,94
(for review see Ref 95). It helped to understandgap junctional coupling and their role in electricalconduction in the heart. Similarly, the ion channelhypothesis of amyloid disorders were originallyderived from electrophysiological studies but therewere no structural correlates available to supportthis hypothesis. High resolution AFM in modellipid bilayers provided the structural evidence forvariety of amyloid peptides including amyloid-β(1-42)(Figure 6(c)), α-synuclein, ABri, ADan, serum amyloidA, amylin, K3, truncated amyloid peptides (p3,Figure 6(d)) for the first time.15,96,97 This provided acommon structural link to protein mis-folding diseasesand identified a potential target in amyloid disorders.
Single Molecule InteractionsLin et al.98,100 have demonstrated molecular interac-tions in real time by imaging proteolysis of collagenI by high resolution AFM (Figure 6(e) and (f)). Itshowed the association of collagenase molecules tosingle triple-helical collagen, its site of action and itssubsequent proteolysis in real time. The proteolysiswas inhibited by reduced calcium and acidificationvalidating collagenase action. It was the first report ofreal-time proteolysis and its inhibition at single molec-ular level. Such real-time studies of single moleculeinteraction would serve as a valuable tool in drugresearch and development.
Protein interactions with other biomolecules(protein–protein/protein–DNA, etc.) are studiedby either direct imaging or by applying forcespectroscopy. In one such study, force volumeimaging was used to understand the distribution andclustering of surface receptors following its specificligand interaction and the resultant change in themembrane biophysical properties.29 The effect ofvascular endothelial growth factor (VEGF) receptorclustering on local cell mechanics was obtained frommaps of interaction forces between VEGF antibodyconjugated tips and its receptor on cell membrane.The technique allowed simultaneous measurement ofthe real-time lateral diffusion of receptors and theireffect on local rheological properties like elasticity.VEGF receptors are found to concentrate toward thecell boundaries and cluster rapidly upon addition ofits ligand (Figure 6(g) and (h)). The local stiffness
(a) (b)
(c) (d)
(e) (f)
(g) (h)
(i) (j)
FIGURE 6 | High resolution AFM images of pores formed byamyloid β1-42 (a)47 and amyloid β17-42 (b)96 oligomers in lipidbilayers. Open (c) and close (d) conformations of connexin-43hemichannels in the absence and presence of 1.8 mM Ca++,respectively.16 Real time aggregation of VEGF receptors on the surfaceof a endothelial cell before (e) and after (f) the addition ofVEGF-antibody.29 Real time proteolysis of collagen molecules before(g) and after (h) the addition of collagenase.98 Shear stress inducedreorganization of cytoskeleton in living endothelial cells imaged byAFM.99 Under static conditions (i), the cells topography is smooth andunder unidirectional shear stress the topography is reorganized (j) tominimize the shear stress gradient to reduce resistance to flow.
reductions are proportional to receptor density and,being concentrated near the cell edges, this studyprovided the insights into the mechanism of cellgrowth and angiogenesis occurring at the edges.
Protein–DNA interaction was studied betweenPhotolyase,8 a DNA repair protein and DNA.DNA–photolyase interactions and the annealing of
Volume 3, November/December 2011 2011 John Wi ley & Sons, Inc. 711
Advanced Review wires.wiley.com/sysbio
restriction fragment ends and movement of photolyaseover the DNA were directly visualized. For the firsttime, AFM revealed that a sliding mechanism by whichphotolyase can scan DNA for damaged sites.
Structure–Function RelationshipsAnother classical study that correlated a macro-molecule’s structure to its function was polysaccharideelasticity by the chair-boat transitions of glucopyra-nose ring structure.46 It was found that the elasticity ofthe three polysaccharides results from a force-inducedelongation of the ring structure and a final transitionfrom a chair-like to a boat-like conformation. Tillthen, it was assumed that pyranose ring is inelasticand locked structure. In another example, Liu et al.44
used AFM force spectroscopy to unravel the con-nexin channels gating mechanism. They attached anantibody specific to the C-terminus of a connexin andapproached hemichannels immobilized on a substrate.Specific binding and unbinding events were observedupon approaching and retracting the tip. The forcespectroscopy revealed the mechanism of hemichannelsgating supporting the particle and receptor model.Until then there was no evidence to support thishypothesis for connexin hemichannels.
Correlative StudiesA classic representative study that linked the effectof altered proteome on the biomechanical propertiesof a cell was carried out by Vergara et al.,101 usingAFM and proteomics to analyze and correlate themodifications induced in the mechanical properties ofastrocytes to the changes induced in protein expressionafter interferon-β treatment (IFN-β). The resultsindicated that IFN-β treatment reduced Young’smodulus, a measure of cell elasticity. The molecularmechanisms that underlie these changes were foundto be involved in cytoskeleton organization throughcofilin-1 and profilin-1.
Multidimensional AFMThe open architecture of AFM allows easy integra-tion of other complementary modalities like lightmicroscopy, electrical measurement system, microflu-idics, optical/magnetic tweezers, and so on. This flex-ibility transforms it into a powerful multidimensionalplatform (m-AFM) for studying molecules structure–function relationships (for reviews see Refs 102 and103).
Microcantilever arrays are utilized to identifyspecific biomarkers using defined ligands/antibodies,resolving intermolecular affinity, as high throughputsensors. Also, AFM tips were employed as fluid forcesensors to study microrheology of body fluids. In
one such study, Barbee et al.,99,104,105 used AFMto image topography of vascular endothelial cellsunder different flow conditions. For the first time,flow induced alterations in surface topography in realtime were visualized and correlated with cytoskeletalrearrangements (Figure 6(i) and (j)). Such studiesprovided powerful insights into understanding themechanism of atherosclerosis.
CONCLUSIONS
For successful implementation of systems approach,genome and proteome are the two fundamental datasets essential. Even though entire human genome atlasis available, large majority of HP is still unaccountedbecause of inherent complexities in their biosynthesisand regulation as well as due to technical limitations(discussed above). Lack of amplification methods likePCR for proteins is a major handicap for proteomics.As a result, the number of proteins that could bedetected is severely restricted by the CSL of proteinmeasurement techniques. At present, only 20% ofhuman plasma proteome is accounted and it is evenless in cellular proteomes. PCR, on the other handis unreliable and ineffective in faithfully amplifyingscarce samples (typical of clinical specimens, forensic,and fossil DNA) and low copy number transcripts.
Therefore, there is a potential for directsequencing (nonamplifying) techniques in implement-ing genomics and huge scope for techniques thatcould achieve yactomolar (10−24) sensitivity therebyaccounting for almost every protein in the proteome.Under these circumstances, AFM and AFM-basedtechniques have huge potential to meet the abovedemands. Recent breakthroughs in AFM-based singlemolecule transcript profiling, TERS based sequencing,SNP discrimination had shown promise to meet theabove demands in genomics. Similarly, micro/nano-mechanical cantilever sensors have successfullydemonstrated breaking the current CSL limits fromnanomolar to attomolar concentrations. AFM forcespectroscopy based protein fingerprinting in particularhas the potential to break away proteomics from CSLlimits all the way to the inverse Avagadro’s number.
AFM is the only imaging technique that iscurrently available that can provide unprecedentedmolecular resolution at physiological environments.AFM per se or as an m-AFM platform, contributeda wealth of information in characterizing singlemolecules in terms of their size, shape, volume,molecular organization, energy landscape, theirinteractions, and so on, enriching the proteomeatlas. Such an atlas would further acceleratefingerprinting of single molecules by just comparing an
712 2011 John Wi ley & Sons, Inc. Volume 3, November/December 2011
WIREs Systems Biology and Medicine Role of atomic force microscopy in systems biology
unknown molecules’ fingerprint from the atlas. Also,information about single molecules would acceleratedevelopment of newer bioassays which in turn wouldaid in pushing the CSL barrier down. Continued
developments in AFM research would make bothgenomics and proteomics a total reality in near futurewhich in turn would accelerate realization of systemsapproach to biological systems.
ACKNOWLEDGMENTS
This work is supported by grants from NIH (DA024871 and DA025296) to R.L.
REFERENCES1. Ideker T, Galitski T, Hood L. A new approach to
decoding life: systems biology. Ann Rev Genom HumGenet 2001, 2:343–372.
2. Archakov AI, Ivanov YD, Lisitsa AV, Zgoda VG.AFM fishing nanotechnology is the way to reverse theAvogadro number in proteomics. Proteomics 2007,7:4–9.
3. Binnig G, Rohrer H. Scanning tunneling microscopy.Helvet Phys Acta 1982, 55:726–735.
4. Binnig G, Rohrer H. Scanning tunneling microscopy—from birth to adolescence (Nobel Lecture). Availableat: http://nobelprize.org/nobel_prizes/physics/laureates/1986/. (Accessed June 13, 2011).
5. Binnig G, Rohrer H. The scanning tunneling micro-scope. Sci Am 1985, 253:50.
6. Binnig G, Quate CF, Gerber C. Atomic force micro-scope. Phys Rev Lett 1986, 56:930–933.
7. Giessibl FJ. Atomic-resolution of the silicon (1 1 1)-(7 × 7) surface by atomic-force microscopy. Science1995, 267:68–71.
8. Giessibl FJ, Hembacher S, Bielefeldt H, Mannhart J.Subatomic features on the silicon (1 1 1)-(7 × 7) sur-face observed by atomic force microscopy. Science2000, 289:422–425.
9. Giessibl FJ. Advances in atomic force microscopy. RevMod Phys 2003, 75:949–983.
10. Kasas S, Dietler G. Probing nanomechanical prop-erties from biomolecules to living cells. PflugersArch—Eur J Physiol 2008, 456:13–27.
11. Weihs TP, Nawaz Z, Jarvis SP, Pethica JB. Limits ofimaging resolution for atomic force microscopy ofmolecules. Appl Phys Lett 1991, 59:3536–3538.
12. Hoh JH, Lal R, John SA, Revel JP, Arnsdorf MF.Atomic force microscopy and dissection of gap-junctions. Science 1991, 253:1405–1408.
13. Hoh JH, Sosinsky GE, Revel JP, Hansma PK. Struc-ture of the extracellular surface of the gap junc-tion by atomic-force microscopy. Biophys J 1993,65:149–163.
14. Muller DJ, Fotiadis D, Scheuring S, Muller SA,Engel A. Electrostatically balanced subnanometer
imaging of biological specimens by atomic force micro-scope. Biophys J 1999, 76:1101–1111.
15. Quist A, Doudevski L, Lin H, Azimova R, Ng D,Frangione B, Kagan B, Ghiso J, Lal R. Amyloid ionchannels: a common structural link for protein-misfolding disease. Proc Natl Acad Sci U S A 2005,102:10427–10432.
16. Thimm J, Mechler A, Lin H, Rhee S, Lal R. Calcium-dependent open/closed conformations and interfacialenergy maps of reconstituted hemichannels. J BiolChem 2005, 280:10646–10654.
17. Cappella B, Dietler G. Force-distance curves by atomicforce microscopy. Surf Sci Rep 1999, 34:1.
18. Butt HJ, Cappella B, Kappl M. Force measurementswith the atomic force microscope: technique, interpre-tation and applications. Surf Sci Rep 2005, 59:1–152.
19. Drake B, Prater CB, Weisenhorn AL, Gould SAC,Albrecht TR, Quate CF, Cannell DS, Hansma HG,Hansma PK. Imaging crystals, polymers, and processesin water with the atomic force microscope. Science1989, 243:1586–1589.
20. Barrena E, Kopta S, Ogletree DF, Charych DH,Salmeron M. Relationship between friction and molec-ular structure: alkylsilane lubricant films under pres-sure. Phys Rev Lett 1999, 82:2880–2883.
21. Carpick RW, Salmeron M. Scratching the surface: fun-damental investigations of tribology with atomic forcemicroscopy. Chem Rev 1997, 97:1163–1194.
22. Hansma PK, Cleveland JP, Radmacher M, WaltersDA, Hillner PE, Bezanilla M, Fritz M, Vie D, HansmaHG, Prater CB, et al. Tapping mode atomic-forcemicroscopy in liquids. Appl Phys Lett 1994,64:1738–1740.
23. Bustamante C, Vesenka J, Tang CL, Rees W,Guthold M, Keller R. Circular DNA-moleculesimaged in air by scanning force microscopy. Biochem1992, 31:22–26.
24. Lindsay SM, Nagahara LA, Thundat T, Knip-ping U, Rill RL, Drake B, Prater CB, Weisenhorn AL,Gould SAC, Hansma PK. Stm and Afm images ofnucleosome DNA under water. J Biomol Struct Dyn1989, 7:279–287.
Volume 3, November/December 2011 2011 John Wi ley & Sons, Inc. 713
Advanced Review wires.wiley.com/sysbio
25. Lyubchenko YL, Jacobs BL, Lindsay SM. Atomic forcemicroscopy of reovirus Dsrna—a routine techniquefor length measurements. Nucleic Acids Res 1992,20:3983–3986.
26. Vesenka J, Guthold M, Tang CL, Keller D, Delaine E,Bustamante C. Substrate preparation for reliable imag-ing of DNA-molecules with the scanning force micro-scope. Ultramicroscopy 1992, 42:1243–1249.
27. Arce FT, Carlson R, Monds J, Veeh R, Hu FZ, Stew-art PS, Lal R, Ehrlich GD, Avci R. Nanoscale struc-tural and mechanical properties of nontypeablehaemophilus influenzae biofilms. J Bacteriol 2009,191:2512–2520.
28. Arce FT, Whitlock JL, Birukova AA, Birukov KG,Arnsdorf MF, Lal R, Garcia JGN, Dudek SM. Regula-tion of the micromechanical properties of pulmonaryendothelium by S1P and thrombin: role of cortactin.Biophys J 2008, 95:886–894.
29. Almqvist N, Bhatia R, Primbs G, Desai N, Banerjee S,Lal R. Elasticity and adhesion force mapping revealsreal-time clustering of growth factor receptors andassociated changes in local cellular rheological prop-erties. Biophys J 2004, 86:1753–1762.
30. Jang H, Arce FT, Mustata M, Ramachandran S,Capone R, Nussinov R, Lal R. AntimicrobialProtegrin-1 forms amyloid-like fibrils with rapid kinet-ics suggesting a functional link. Biophys J 2011,100:1775–1783.
31. Kellermayer MSZ, Karsai A, Benke M, Soos K,Penke B. Stepwise dynamics of epitaxially growingsingle amyloid fibrils. Proc Natl Acad Sci U S A 2008,105:141–144.
32. Fantner GE, BR J, GD S, Belcher AM. Kinetics ofantimicrobial peptide activity measured on individ-ual bacterial cells using high-speed atomic forcemicroscopy. Nat Nanotechnol 2010, 5:280–285.
33. Hansma PK, Schitter G, Fantner GE, Prater C. High-speed atomic force microscopy. Science 2006,314:601–602.
34. Ando T, Kodera N, Takai E, Maruyama D, Saito K,Toda A. A high-speed atomic force microscope forstudying biological macromolecules. Proc Natl AcadSci U S A 2001, 98:12468–12472.
35. Humphris ADL, Miles MJ, Hobbs JK. A mechanicalmicroscope: high-speed atomic force microscopy. ApplPhy Lett 2005, 86:034106-1–034106-3.
36. Giannotti MI, Vancso GJ. Interrogation of singlesynthetic polymer chains and polysaccharides byAFM-based force spectroscopy. Chemphyschem 2007,8:2290–2307.
37. Marszalek PE, Li HB, Fernandez JM. Fingerprintingpolysaccharides with single-molecule atomic forcemicroscopy. Nat Biotechnol 2001, 19:258–262.
38. Hinterdorfer P, Baumgartner W, Gruber HJ, Schil-cher K, Schindler H. Detection and localization ofindividual antibody-antigen recognition events by
atomic force microscopy. Proc Natl Acad Sci U SA 1996, 93:3477–3481.
39. Zhong Q, Inniss D, Kjoller K, Elings VB. Fracturedpolymer silica fiber surface studied by tappingmode atomic-force microscopy. Surf Sci 1993,290:L688–L692.
40. Stark M, Bercu BN, Marchi F, Chevrier J, Huant S.Marking the difference: interferometric detection vsoptical beam deflection in AFM. AIP ConferenceProceedings, Eindhoven, The Netherlands: AmericanInstitute of Physics; 2003.
41. Putman CAJ, Vanderwerf KO, Degrooth BG, Van-hulst NF, Greve J. Tapping mode atomic-forcemicroscopy in liquid. Appl Phys Lett 1994, 64:2454–2456.
42. Bezanilla M, Drake B, Nudler E, Kashlev M, HansmaPK, Hansma HG. Motion and enzymatic degradationof DNA in the atomic-force microscope. Biophys J1994, 67:2454–2459.
43. Lal R, John SA. Biological applications of atomic-force microscopy. Am J Physiol 1994, 266:C1.
44. Liu F, Arce FT, Ramachandran S, Lal R. Nanome-chanics of hemichannel conformations—connexinflexibility underlying channel opening and closing.J Biol Chem 2006, 281:23207–23217.
45. Marszalek PE, Lu H, Li HB, Carrion-Vazquez M,Oberhauser AF, Schulten K, Fernandez JM. Mechan-ical unfolding intermediates in titin modules. Nature1999, 402:100–103.
46. Marszalek PE, Oberhauser AF, Pang YP, Fernan-dez JM. Polysaccharide elasticity governed by chair-boat transitions of the glucopyranose ring. Nature1998, 396:661–664.
47. Lin H, Bhatia R, Lal R. Amyloid ß protein forms ionchannels: implications for Alzheimer’s disease patho-physiology. The FASEB J 2001, 15:2433–2444.
48. Lal R, Proksch R. Multimodal atomic forcemicroscopy: biological imaging using atomic forcemicroscopy combined with light fluorescence and con-focal microscopies and electrophysiologic recording.Int J Imag Syst Tech 1997, 8:293–300.
49. Hansma PK, Drake B, Grigg D, Prater CB, Yashar F,Gurley G, Eling SV, Feinstein S, Lal R. A new, optical-lever based atomic-force microscope. J Appl Phys1994, 76:796–799.
50. Quist AP, Chand A, Ramachandran S, Daraio C,Jin S, Lal R. Atomic force microscopy imaging andelectrical recording of lipid bilayers supported overmicrofabricated silicon chip nanopores: lab-on-a-chipsystem for lipid membranes and ion channels. Lang-muir 2007, 23:1375–1380.
51. Hansma HG, Vesenka J, Siegerist C, Kelderman G,Morrett H, Sinsheimer RL, Elings V, Bustamante C,Hansma PK. Reproducible imaging and dissection ofplasmid DNA under liquid with the atomic forcemicroscope. Science 1992, 256:1180–1184.
714 2011 John Wi ley & Sons, Inc. Volume 3, November/December 2011
WIREs Systems Biology and Medicine Role of atomic force microscopy in systems biology
52. Weisenhorn AL, Maivald P, Butt HJ, Hansma PK.Measuring adhesion, attraction, and repulsionbetween surfaces in liquids with an atomic-forcemicroscope. Phys Rev B 1992, 45:11226–11232.
53. Allison DP, Bottomley LA, Thundat T, Brown GM,Woychik RP, Schrick JJ, Jacobson KB, Warmack RJ.Immobilization of DNA for scanning probemicroscopy. Proc Natl Acad Sci U S A 1992, 89:10129–10133.
54. Hansma HG, Bezanilla M, Zenhausern F, Adrian M,Sinsheimer RL. Atomic force microscopy of DNAin aqueous-solutions. Nucleic Acids Res 1993,21:505–512.
55. Lyubchenko YL, Gall AA, Shlyakhtenko LS, Harring-ton RE, Jacobs BL, Oden PI, Lindsay SM. Atomicforce microscopy imaging of double-stranded DNAand RNA. J Biomol Struct Dyn 1992, 10:589–606.
56. Hegner M, Wagner P, Semenza G. Immobilizing DNAon gold via thiol modification for atomic-forcemicroscopy imaging in buffer solutions. FEBS Lett1993, 336:452–456.
57. Hansma HG, Laney DE, Bezanilla M, Sinsheimer RL,Hansma PK. Applications for atomic-forcemicroscopy of DNA. Biophys J 1995, 68:1672–1677.
58. Rees WA, Keller RW, Vesenka JP, Yang GL, Busta-mante C. Evidence of DNA bending in transcriptioncomplexes imaged by scanning force microscopy. Sci-ence 1993, 260:1646–1649.
59. Pietrasanta LI, Schaper A, Jovin TM. Probing spe-cific molecular-conformations with the scanningforce microscope—complexes of plasmid DNA andAnti-Z-DNA antibodies. Nucleic Acids Res 1994,22:3288–3292.
60. Wyman C, Grotkopp E, Bustamante C, Nelson HCM.Determination of heat-shock transcription factor-2stoichiometry at looped DNA complexes using scan-ning force microscopy. Embo J 1995, 14:117–123.
61. van Noort SJT, van der Werf KO, Eker APM,Wyman C, de Grooth BG, van Hulst NF, Greve J.Direct visualization of dynamic protein-DNA inter-actions with a dedicated atomic force microscope.Biophys J 1998, 74:2840–2849.
62. Lindsay SM, Philipp M. Can the scanning tunnelingmicroscope sequence DNA. Genet Anal—Biomol Eng1991, 8:8–13.
63. Hansma HG, Weisenhorn AL, Gould SAC, Sin-sheimer RL, Gaub HE, Stucky GD, Zaremba CM,Hansma PK. Progress in sequencing deoxyribonucleic-acid with an atomic force microscope. J Vac SciTechnol B 1991, 9:1282–1284.
64. Nygaard V, Holden M, Loland A, Langaas M, Mykle-bost O, Hovig E. Limitations of mRNA amplificationfrom small-size cell samples. BMC Genom 2005,6:147. doi:10.1186/1471-2164-6-147.
65. Nygaard V, Loland A, Holden M, Langaas M, Rue H,Liu F, Myklebost O, Fodstad O, Hovig E, Smith-Sorensen B. Effects of mRNA amplification on geneexpression ratios in cDNA experiments estimatedby analysis of variance. BMC Genom 2003, 4:11.doi:10.1186/1471-2164-4-11.
66. Nguyen DC, Keller RA, Jett JH, Martin JC. Detectionof single molecules of phycoerythrin in hydrodynami-cally focused flows by laser-induced fluorescence. AnalChem 1987, 59:2158–2161.
67. Jett JH, Keller RA, Martin JC, Marrone BL,Moyzis RK, Ratliff RL, Seitzinger NK, Shera EB,Stewart CC. High-speed DNA sequencing—anapproach based upon fluorescence detection of singlemolecules. J Biomol Struct Dyn 1989, 7:301–309.
68. Treffer R, Deckert V. Recent advances in single-molecule sequencing. Curr Opin Biotechnol 2010,21:4–11.
69. Rosenthal A, Brenner S. DNA Sequencing Method.2000; 4.
70. Allison DP, Kerper PS, Doktycz MJ, Spain JA, Mod-rich P, Larimer FW, Thundat T, Warmack RJ. Directatomic force microscope imaging of EcoRI endonucle-ase site specifically bound to plasmid DNA molecules.Proc Natl Acad Sci U S A 1996, 93:8826–8829.
71. Allison DP, Kerper PS, Doktycz MJ, Thundat T, Mod-rich P, Larimer FW, Johnson DK, Hoyt PR, Mucen-ski ML, Warmack RJ. Mapping individual cosmidDNAs by direct AFM imaging. Genomics 1997,41:379–384.
72. Nakamura T, Maeda Y, Oka T, Tabata H, Futai M,Kawai T. Atomic force microscope observation ofplasmid deoxyribose nucleic acid with restrictionenzyme. J Vac Sci Technol B 1999, 17:288–293.
73. Reed J, Mishra B, Pittenger B, Magonov S, Troke J,Teitell MA, Gimzewski JK. Single molecule transcrip-tion profiling with AFM. Nanotechnology 2007, 18:044032.
74. Sommer SS, Cohen JE. The size distributions of pro-teins, messenger-RNA and nuclear-RNA. J Mol Evol1980, 15:37–57.
75. Hames BD. In: Lewin B, ed. Gene Expression 2,Eukaryotic Chromosomes, 2nd ed. Chichester: JohnWiley & Sons; 1980, 1160. ISBN:0-471-01977-1;Biochem Ed 1982, 10:158.
76. Ramachandran S, Quist AP, Kumar S, Lal R. Cis-platin nanoliposomes for cancer therapy: AFM andfluorescence Imaging of cisplatin encapsulation, sta-bility, cellular uptake, and toxicity. Langmuir 2006,22:8156–8162.
77. Bailo E, Deckert V. Tip-enhanced Raman spec-troscopy of single RNA strands: towards a noveldirect-sequencing method. Angew Chem Int Ed 2008,47:1658–1661.
Volume 3, November/December 2011 2011 John Wi ley & Sons, Inc. 715
Advanced Review wires.wiley.com/sysbio
78. Schafer AJ, Hawkins JR. DNA variation and thefuture of human genetics. Nat Biotechnol 1998,16:33–39.
79. Clausen-Schaumann H, Seitz M, Krautbauer R, GaubHE. Force spectroscopy with single bio-molecules.Curr Opin Chem Biol 2000, 4:524–530.
80. Hinterdorfer P, Dufrene YF. Detection and localiza-tion of single molecular recognition events usingatomic force microscopy. Nat Methods 2006,3:347–355.
81. Fritz J, Baller MK, Lang HP, Rothuizen H, Vettiger P,Meyer E, Guntherodt HJ, Gerber C, Gimzewski JK.Translating biomolecular recognition into nanome-chanics. Science 2000, 288:316–318.
82. Hansen KM, Ji HF, Wu GH, Datar R, Cote R,Majumdar A, Thundat T. Cantilever-based opticaldeflection assay for discrimination of DNA single-nucleotide mismatches. Anal Chem 2001, 73:1567–1571.
83. Stowe TD, Yasumura K, Kenny TW, Botkin D,Wago K, Rugar D. Attonewton force detection usingultrathin silicon cantilevers. Appl Phys Lett 1997,71:288–290.
84. Cox J, Mann M. Is proteomics the new genomics? Cell2007, 130:395–398.
85. Abadal G, Davis ZJ, Helbo B, Borrise X, Ruiz R,Boisen A, Campabadal F, Esteve J, Figueras E, Perez-Murano F, et al. Electromechanical model of aresonating nano-cantilever-based sensor for high-resolution and high-sensitivity mass detection. Nan-otechnology 2001, 12:100–104.
86. Davis ZJ, Abadal G, Kuhn O, Hansen O, Grey F,Boisen A. Fabrication and characterization of nanores-onating devices for mass detection. J Vac Sci TechnolB 2000, 18:612–616.
87. Dugdale TM, Dagastine R, Chiovitti A, Mulvaney P,Wetherbee R. Single adhesive nanofibers from a livediatom have the signature fingerprint of modular pro-teins. Biophys J 2005, 89:4252–4260.
88. Fernandez JM. Fingerprinting single molecules in vivo.Biophys J 2005, 89:3676–3677.
89. Avci R, Schweitzer MH, Boyd RD, Wittmeyer JL,Arce FT, Calvo JO. Preservation of bone collagen fromthe late cretaceous period studied by immunologicaltechniques and atomic force microscopy. Langmuir2005, 21:3584–3590.
90. Schweitzer MH, Suo Z, Avci R, Asara JM, Allen MA,Arce FT, Horner JR. Analyses of soft tissue fromTyrannosaurus rex suggest the presence of protein.Science 2007, 316:277–280.
91. Kasas S, Thomson NH, Smith BL, Hansma PK, Mik-lossy J, Hansma HG. Biological applications of theAFM: from single molecules to organs. Int J ImagingSyst Technol 1997, 8:151–161.
92. Parot P, Dufrene YF, Hinterdorfer P, Le Grimellee C,Navajas D, Pellequer JL, Scheuring S. Past, present
and future of atomic force microscopy in life sciencesand medicine. J Mol Recognit 2007, 20:418–431.
93. Muller DJ, Hand GM, Engel A, Sosinsky GE. Confor-mational changes in surface structures of isolated con-nexin 26 gap junctions. Embo J 2002, 21:3598–3607.
94. Bahatyrova S, Frese RN, Siebert CA, Olsen JD, vander Werf KO, van Grondelle R, Niederman RA, Bul-lough PA, Otto C, Hunter CN. The native architec-ture of a photosynthetic membrane. Nature 2004,430:1058–1062.
95. Frederix PLTM, Bosshart PD, Engel A. Atomic forcemicroscopy of biological membranes. Biophys J 2009,96:329–338.
96. Jang H, Arce FT, Ramachandran S, Capone R, Azi-mova R, Kagan BL, Nussinov R, Lal R. Truncated β-amyloid peptide channels provide an alternative mech-anism for Alzheimer’s Disease and Down syndrome.Proc Natl Acad Sci U S A 2010, 107:6538–6543.
97. Mustata M, Capone R, Jang H, Arce FT, Ramachan-dran S, Lal R, Nussinov R. K3 fragment of amyloido-genic β(2)-microglobulin forms ion channels: implica-tion for dialysis related amyloidosis. J Am Chem Soc2009, 131:14938–14945.
98. Lin H, Clegg DO, Lal R. Imaging real-time proteoly-sis of single collagen I molecules with an atomic forcemicroscope. Biochem 1999, 38:9956–9963.
99. Barbee KA, Davies PF, Lal R. Shear stress-inducedreorganization of the surface-topography of livingendothelial-cells imaged by atomic-force microscopy.Circ Res 1994, 74:163–171.
100. Lin H, Lal R, Clegg DO. Imaging and mappingheparin-binding sites on single fibronectin moleculeswith atomic force microscopy. Biochem 2000,39:3192–3196.
101. Vergara D, Martignago R, Leporatti S, Bonsegna S,Maruccio G, De Nuccio F, Santino A, Cingolani R,Nicolardi G, Maffia M, et al. Biomechanical and pro-teomic analysis of INF-β-treated astrocytes. Nanotech-nology 2009, 20.
102. Ramachandran S, Lal R. Scope of atomic forcemicroscopy in the advancement of nanomedicine. IndJ Exp Biol 2010, 48:1020–1036.
103. Lal R, Ramachandran S, Arnsdorf M. Multidimen-sional atomic force microscopy: a versatile noveltechnology for nanopharmacology research. AAPS J2010, 12:716–728.
104. Davies PF, Barbee KA, Lal R, Robotewskyj A, GriemML. Hemodynamics and atherogenesis—endothelialsurface dynamics in flow signal-transduction.Atherosclerosis Iii: Recent Adv Atherosclerosis Res1995, 748:86–103.
105. Barbee KA, Mundel T, Lal R, Davies PF. Alteredsubcellular shear-stress distribution by the flow-realignment response of endothelial-cells. Faseb J1995, 9:A588.
716 2011 John Wi ley & Sons, Inc. Volume 3, November/December 2011