
Positive 1H21results but the best is yet to come - eVISO
17
1 EVISO Company report BUY (maintained) 08 April 2021 – 5:30 PM MARKET PRICE: 2.24 TARGET PRICE: EUR3.33 (from EUR2.96) Services Data Shares Outstanding (m): 24,57 Market Cap. (EURm): 55.04 Enterprise Value (EURm): 50.35 Free Float (%): 20,9% Av. Daily Trad. Vol. (m): 147.2 Main Shareholder: O Caminho 52,9% Reuters/Bloomberg: EVS.MI EVS.MI 52-Week Range (EUR) 1.92 1.92 Source: Factset, UBI Banca estimates Performance 1m 3m 12m Absolute -3.0% 3.7% Rel. to FTSE IT -11.1% -5.2% Source: Factset Graph area Absolute/Relative 12 M Source: Factset Marco Cristofori Senior Analyst [email protected] Tel. +39 02 62753015 Dario Fasani Analyst [email protected] Tel. +39 02 62753014 www.ubibanca.com/equity-research Positive 1H21results but the best is yet to come Even if eVISO was impacted by the COVID-19 outbreak in 1H21 (June to December 2020), the company reported an attractive top line growth rate (+15.7%) thanks to the stunning trend of Resellers division which more than double its revenues while Direct clients were down 1.2%. More important, the gross margin of its main divisions (Direct clients and Resellers which represented around 89% of sales in 1H21) increased confirming a further improvement of eVISO’s AI platform efficiency. EBITDA (EUR1.1 million reported) increased by 7.1% with a margin below last year (3.6% vs. 3.9%) due to the average contraction of volumes per POD, growing operating costs and the higher weight of resellers which present a lower profitability compared to Direct clients. The bottom line (EUR0.23 million) has been impacted by EUR0.19 million capital loss for the sale of the Revoluce participation, higher D&A costs for the amortization of listing costs and a higher tax rate. Net cash reached EUR6.9 million after capex for EUR2 million (of which EUR0.6 million for the AI platform development) thanks to the cash in stemming from the listing at the end of December (EUR8 million). Even if the return to the traditional energy consumption of SME is expected only in September, when the vaccination campaign should be completed, the new contracts signed since the beginning of the year, which doubled the number of PODs, provide a huge visibility for the coming month and we are confident that eVISO will be able to reach our estimates for this year (sales +45%, EBITDA margin at 4.7%). We confirm our positive stance of the share with a new target price of EUR3.33 (from EUR2.96) which offers nearly 50% upside. > eVISO is rapidly growing (PODs were up 38% in the first half) and the AI platform is further improving its capabilities (gross profit margin were up in every divisions) while administration department was able to face the client increase without any problem. We confirm our estimates at both sales and EBITDA level but slightly reduce our bottom line forecast to factor in higher D&A costs and the capital loss on Revoluce. > Our target price of EUR3.33 per share (from EUR2.96) is obtained as the average of a DCF valuation (WACC 6.2%, g 1%), an EVA valuation and a multiple valuation based on a sample of AI and energy companies. > The company is exposed to some risks; these are mostly related to the low visibility on the entrance into new commodity markets, the strong dependence from few key people, potential negative impact from the COVID-19 outbreak and the company’s limited commercial network. Financials Closing at 30 June 2020 2021E 2022E 2023E Revenues (EURm) 48,4 70,6 98,5 136,9 EBITDA (EURm) 2,4 3,4 5,5 7,9 EBITDA margin (%) 4,9% 4,8% 5,6% 5,8% EBIT (EURm) 1,7 2,4 4,2 6,1 EPS (EUR) 0,06 0,06 0,13 0,19 CFPS (EUR) 0,03 0,05 0,20 0,26 DPS (EUR) 0,01 0,02 0,03 0,05 Source: Company Data, UBI Banca estimates Ratios priced on 7 April 2021 Closing at 30 June 2020A* 2021E 2022E 2023E P/E(x) 30,2 36,1 17,7 11,6 P/CF(x) 50,8 47,1 11,0 8,8 P/BV(x) 11,9 4,5 3,7 2,9 Dividend Yield 0,9% 0,7% 1,4% 2,2% EV/EBITDA(x) 14,9 14,9 9,0 5,9 Debt/Equity (x) 0,0 -0,4 -0,4 -0,4 Debt/EBITDA (x) 0,0 -1,5 -1,1 -1,1 Source: Company data, UBI Banca est. *based on listing price (EUR1,75) 1,85 1,95 2,05 2,15 2,25 2,35 2,45 2,55 30-Dec 7-Jan 15-Jan 23-Jan 31-Jan 8-Feb 16-Feb 24-Feb 4-Mar 12-Mar 20-Mar 28-Mar 5-Apr eVISO SpA FTSE Italia All-Share
-
Upload
khangminh22 -
Category
Documents
-
view
2 -
download
0
Transcript of Positive 1H21results but the best is yet to come - eVISO
1
EVISO
Company report BUY (maintained)
08 April 2021 – 5:30 PM MARKET PRICE: 2.24 TARGET PRICE: EUR3.33 (from EUR2.96)
Services
Data
Shares Outstanding (m): 24,57
Market Cap. (EURm): 55.04
Enterprise Value (EURm): 50.35
Free Float (%): 20,9%
Av. Daily Trad. Vol. (m): 147.2
Main Shareholder: O Caminho 52,9%
Reuters/Bloomberg: EVS.MI EVS.MI
52-Week Range (EUR) 1.92 1.92 Source: Factset, UBI Banca estimates
Performance
1m 3m 12m
Absolute -3.0% 3.7%
Rel. to FTSE IT -11.1% -5.2% Source: Factset
Graph area Absolute/Relative 12 M
Source: Factset
Marco Cristofori Senior Analyst [email protected]
Tel. +39 02 62753015
Dario Fasani
Analyst [email protected] Tel. +39 02 62753014
www.ubibanca.com/equity-research
Positive 1H21results but the best
is yet to come
Even if eVISO was impacted by the COVID-19 outbreak in 1H21 (June to December 2020), the company reported an attractive top line growth rate (+15.7%) thanks to the stunning trend of Resellers division which more than double its revenues while Direct clients were down 1.2%. More important, the gross margin of its main divisions (Direct clients and Resellers which represented around 89% of sales in 1H21) increased confirming a further improvement of eVISO’s AI platform efficiency. EBITDA (EUR1.1 million reported) increased by 7.1% with a margin below last year (3.6% vs. 3.9%) due to the average contraction of volumes per POD, growing operating costs and the higher weight of resellers which present a lower profitability compared to Direct clients. The bottom line (EUR0.23 million) has been impacted by EUR0.19 million capital loss for the sale of the Revoluce participation, higher D&A costs for the amortization of listing costs and a higher tax rate. Net cash reached EUR6.9 million after capex for EUR2 million (of which EUR0.6 million for the AI platform development) thanks to the cash in stemming from the listing at the end of December (EUR8 million). Even if the return to the traditional energy consumption of SME is expected only in September, when the vaccination campaign should be completed, the new contracts signed since the beginning of the year, which doubled the number of PODs, provide a huge visibility for the coming month and we are confident that eVISO will be able to reach our estimates for this year (sales +45%, EBITDA margin at 4.7%). We confirm our positive stance of the share with a new target price of EUR3.33 (from EUR2.96) which offers nearly 50% upside.
> eVISO is rapidly growing (PODs were up 38% in the first half) and the AI
platform is further improving its capabilities (gross profit margin were up in
every divisions) while administration department was able to face the client
increase without any problem. We confirm our estimates at both sales and
EBITDA level but slightly reduce our bottom line forecast to factor in
higher D&A costs and the capital loss on Revoluce.
> Our target price of EUR3.33 per share (from EUR2.96) is obtained as the
average of a DCF valuation (WACC 6.2%, g 1%), an EVA valuation and a
multiple valuation based on a sample of AI and energy companies.
> The company is exposed to some risks; these are mostly related to the low
visibility on the entrance into new commodity markets, the strong
dependence from few key people, potential negative impact from the
COVID-19 outbreak and the company’s limited commercial network.
Financials
Closing at 30 June 2020 2021E 2022E 2023E
Revenues (EURm) 48,4 70,6 98,5 136,9
EBITDA (EURm) 2,4 3,4 5,5 7,9
EBITDA margin (%) 4,9% 4,8% 5,6% 5,8%
EBIT (EURm) 1,7 2,4 4,2 6,1
EPS (EUR) 0,06 0,06 0,13 0,19
CFPS (EUR) 0,03 0,05 0,20 0,26
DPS (EUR) 0,01 0,02 0,03 0,05
Source: Company Data, UBI Banca estimates
Ratios priced on 7 April 2021
Closing at 30 June 2020A* 2021E 2022E 2023E
P/E(x) 30,2 36,1 17,7 11,6
P/CF(x) 50,8 47,1 11,0 8,8
P/BV(x) 11,9 4,5 3,7 2,9
Dividend Yield 0,9% 0,7% 1,4% 2,2%
EV/EBITDA(x) 14,9 14,9 9,0 5,9
Debt/Equity (x) 0,0 -0,4 -0,4 -0,4
Debt/EBITDA (x) 0,0 -1,5 -1,1 -1,1
Source: Company data, UBI Banca est. *based on listing price (EUR1,75)
1,85
1,95
2,05
2,15
2,25
2,35
2,45
2,55
30-
Dec
7-J
an
15-
Jan
23-
Jan
31-
Jan
8-F
eb
16-
Feb
24-
Feb
4-M
ar
12-
Mar
20-
Mar
28-
Mar
5-A
pr
eVISO SpA FTSE Italia All-Share

eVISO
08 April 2021
2
Key Financials
(EURm) 2020A 2021E 2022E 2023E
Revenues 48,38 70,64 98,46 136,85
EBITDA 2,35 3,37 5,53 7,91
EBIT 1,66 2,35 4,18 6,07
NOPAT 1,11 1,58 2,80 4,06
Free Cash Flow -1,10 -2,83 1,32 3,27
Net Capital Employed 2,90 7,25 9,05 10,51
Shareholders' Equity 2,94 12,17 14,90 18,86
Net debt/(Net cash) -0,05 -4,92 -5,85 -8,35
Source: Company data, UBI Banca estimates
Key Profitability Drivers
2020A 2021E 2022E 2023E
Net Debt/EBITDA (x) 0,0 -1,5 -1,1 -1,1
Net Debt/Equity (x) 0,0 -0,4 -0,4 -0,4
Interest coverage 14,8 16,8 83,7 0,0
Free Cash Flow Yield (%) -3,1% -5,2% 2,4% 5,9%
ROE (%) 45,6% 20,2% 23,0% 28,1%
ROI pre-tax (%) 101,0% 42,9% 47,9% 57,5%
ROCE (%) 79,1% 31,1% 34,4% 41,6%
Source: Company data, UBI Banca estimates
Key Valuation Ratios
2020A * 2021E 2022E 2023E
P/E (x) 30,2 36,1 17,7 11,6
P/BV (x) 11,9 4,5 3,7 2,9
P/CF (x) 50,8 47,1 11,0 8,8
Dividend Yield (%) 0,9% 0,7% 1,4% 2,2%
EV/Sales (x) 0,73 0,71 0,50 0,34
EV/EBITDA (x) 14,9 14,9 9,0 5,9
EV/EBIT (x) 21,2 21,4 11,8 7,8
EV/CE (x) 12,1 6,9 5,5 4,5
Source: Company data, UBI Banca estimates * based on listing price (EUR1,75)
Key Value Drivers
(%) 2020A 2021E 2022E 2023E
Payout 25,7% 25,0% 25,0% 25,0%
NWC/Sales -1,5% 0,8% -0,1% 0,0%
Capex/Sales 4,4% 5,0% 3,8% 2,2%
Source: Company data, UBI Banca estimates

eVISO
08 April 2021
3
Recent Developments
> The tough pandemic scenario which determined a drop in energy price (PUN) did not
prevent eVISO from reporting a positive top line growth, fostered by the strong
performance of the reseller division, and a solid gross profit, however it negatively
affected EBITDA, whose margin was below 1H20 (3.6% vs. 3.9%). The bottom line
(EUR0.2 million) was instead penalized by the capital loss for the sale of the Revoluce
participation and by higher D&A costs. The company anticipated the return to the
traditional energy consumption of SME only in September, when the vaccination
campaign should be well on track. Stripping out the impact of the COVID-19 outbreak
revenues would have increased by 27.4% and EBITDA margin would have reached 4.1%
beating 1H20.
> Starting from the P&L, revenues and VoP were up double-digit compared to 1H20
(+15.7% and +16.3% respectively) thanks to the clients mix focused on small and
medium-sized industrial and agrifood companies whose activities were resilient to the
lockdown measures and to the efficiency of the Company’s proprietary AI platform
which enabled to “take advantage” of the hike registered in price volatility. In detail, the
business units shown different trends: 1) The Direct Clients division experienced a
substantial increase in number of POD (14.1k vs. 11.2k at Dec-19, or +25.3%) but a
moderate rise in energy delivered (+3.1%), meaning that the energy delivered per POD
declined by nearly 18% due to the partial lockdowns. COVID-19 impact on PUN
(which moved from an average of 49.6 EUR/MWh during July-Dec. 2019 to an average
of 45.6 during July-Dec. 2020) penalized revenues (-1.2% YoY); 2) The Reseller division
rose by 56% its POD and more than doubled the energy delivered (implying an higher
energy-demanding portfolio), achieving a >100% revenues growth despite the PUN
decrease; 3) Electricity trading grew high single digit from EUR2.6 million to EUR2.9
million; 4) Ancillary services jumped by 40% to EUR0.4 million, benefitting from the
higher number of POD served; 5) While the retail channel was still immaterial from a
financial standpoint, it is noteworthy to mention that in the period there was the
signing of 63 Clara contracts, 6 collaboration agreements with 23 “ClaraPoints” for the
sale of products at their outlets and 7 agreements with locally-based Social Promotion
Associations. 6) As for the natural GAS commodity, commercial activity was launched
in Oct-20, for a total number of 261 contractually agreed-upon redelivery points in
Dec-20. According to the Company’s estimates, the average drop in consumption
caused by the COVID-19 on eVISO customer base led to a reduction in delivered
volumes for almost 20 GWh, with a subsequent loss of revenues from the sale of
energy of almost EUR3 million.
> Thanks to the technology platform and the major experience gained, eVISO was able
to display a boost in terms of gross margin in both the electricity direct clients division
(9.6% vs. 9.1% in 1H20) and the electricity reseller channel (2.8% vs. 2.3% in 1H20),
confirming the trend of the past few years while the commodity gas business unit
reported a round 27.5% margin. As underlined by the management, the gross
profitability achieved in the commodity gas division should not be taken for granted in
the long term, as the low number of PDR is not statistically significant yet.
> EBITDA reached EUR1.1 million (up 7.1% YoY) with a 3.6% margin (vs. 3.9% in 1H20)
being affected by the following: 1) Higher operating costs, which rose by +16.6% for
the increase in the cost of energy and related services and for major personnel costs
(the workforce was reinforced from 31 employees at Dec-19 to 38 at Dec-20); 2) The
higher weight of resellers brought to a margin dilution; 3) The pandemic had an
estimated impact of EUR0.3 million, according to the management. Stripping out the
coronavirus impact, the EBITDA margin would have been 4.1%, not too distant from
our previous 4.7% full year 2021 forecast, despite the seasonality of the business
(second half of the year occurring between January and June way stronger compared to
eVISO
08 April 2021
4
the first half).
> Despite a D&A which was lifted by the amortization of listing capitalized costs (around
EUR1 million subject to a 20% depreciation rate or EUR0.2 million on a yearly basis),
EBIT was higher compared to 1H20 in absolute value (EUR0.64 million vs. EUR0.49
million in 1H20) and margin (2.1% at Dec-20 vs. 1.8% at Dec-19) as result of the
positive EBITDA dynamic.
> Lastly, the net profit landed at EUR0.22 million, slightly below the EUR0.31 million
reported in 1H20 due to a higher effective tax rate (38% vs. 28% at Dec-19) and the
EUR0.2 million capital loss deriving from the sale of the Revoluce participation, no
longer deemed strategic for eVISO’s development goals. Despite the bottom line
negative impact, the management stressed that this transaction was unquestionably
beneficial, allowing the Company to acquire visibility in the resellers’ segment,
understand their needs and develop dedicated solutions.
> Net cash reached EUR6.9 million at Dec-20, improving significantly compared to the
breakeven of Jun-20 due to an EUR1.6 million CFO impacted by EUR2.3 million capex
but positively affected by the EUR8 million capital increase following the listing.
According to the new regulation in place from Jan-21, the credit rating can still replace
the guarantees to distributors, however the incremental component of the previous 6
months (on a rolling basis) is now excluded from this rule. In other words, operators
which suffer liquidity needs are indirectly prevented from expansion, opening further
room for growth for financially healthy companies like eVISO. On this regard, the
Cerved Rating Agency had reserved the right to further improve the credit worthiness
of eVISO (currently B1.1 corresponding to BBB+/BBB of S&P’s and Fitch) at the end of
Apr-21 in the event of successful listing process, therefore we might expect an even
better assessment (and thus positioning) for eVISO by the end of the current month.
> In March 2021, eVISO launched its proprietary platform dedicated to the apples
market. In detail, the site allows to view the updated prices and quantities traded at
national, European and American level and to check the stock capacity of apples, as
well as the parameters that influence the industry, such as temperature and exchange
rates. Finally, the volumes of supply and demand and the trends in purchase and sale
prices can be consulted. To date, the eVISO platform is able to produce forecasts on
the prices of Gala quality apples, but in the future the offer may be extended to other
types to ensure more choice options. The marketplace section of the platform will be
released in the coming months.
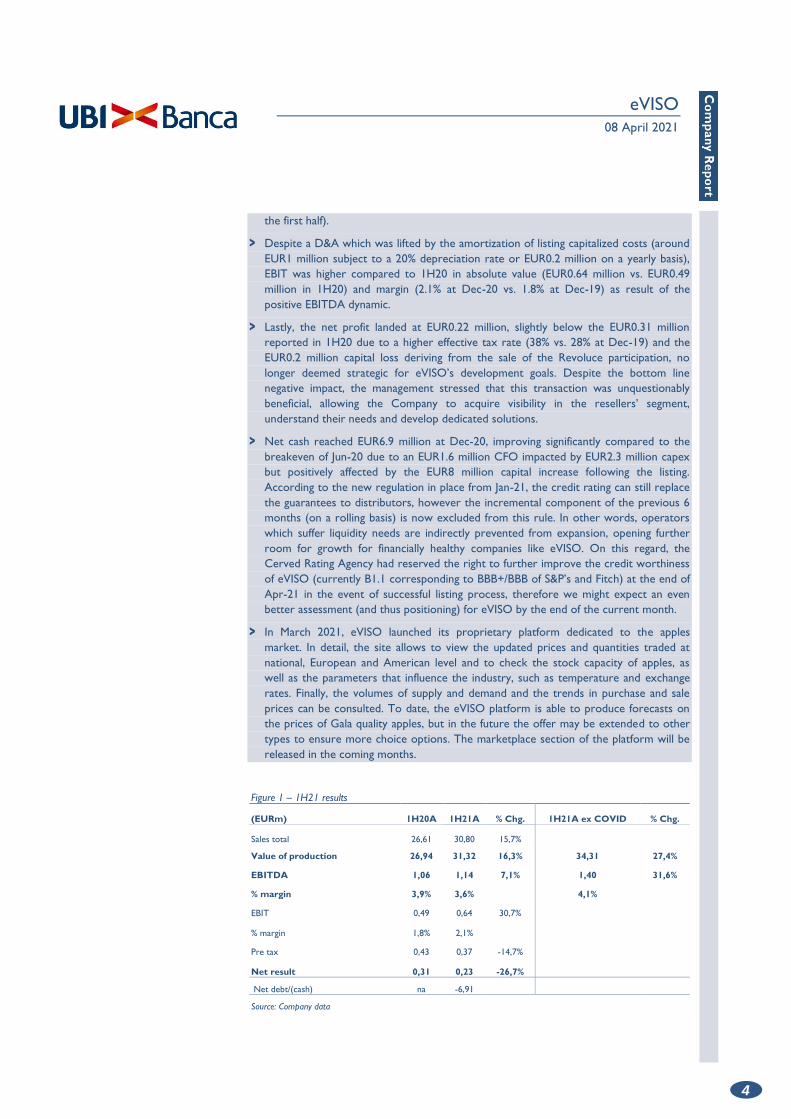
Figure 1 – 1H21 results
(EURm) 1H20A 1H21A % Chg. 1H21A ex COVID % Chg.
Sales total 26,61 30,80 15,7%
Value of production 26,94 31,32 16,3% 34,31 27,4%
EBITDA 1,06 1,14 7,1% 1,40 31,6%
% margin 3,9% 3,6% 4,1%
EBIT 0,49 0,64 30,7%
% margin 1,8% 2,1%
Pre tax 0,43 0,37 -14,7%
Net result 0,31 0,23 -26,7%
Net debt/(cash) na -6,91
Source: Company data
eVISO
08 April 2021
5
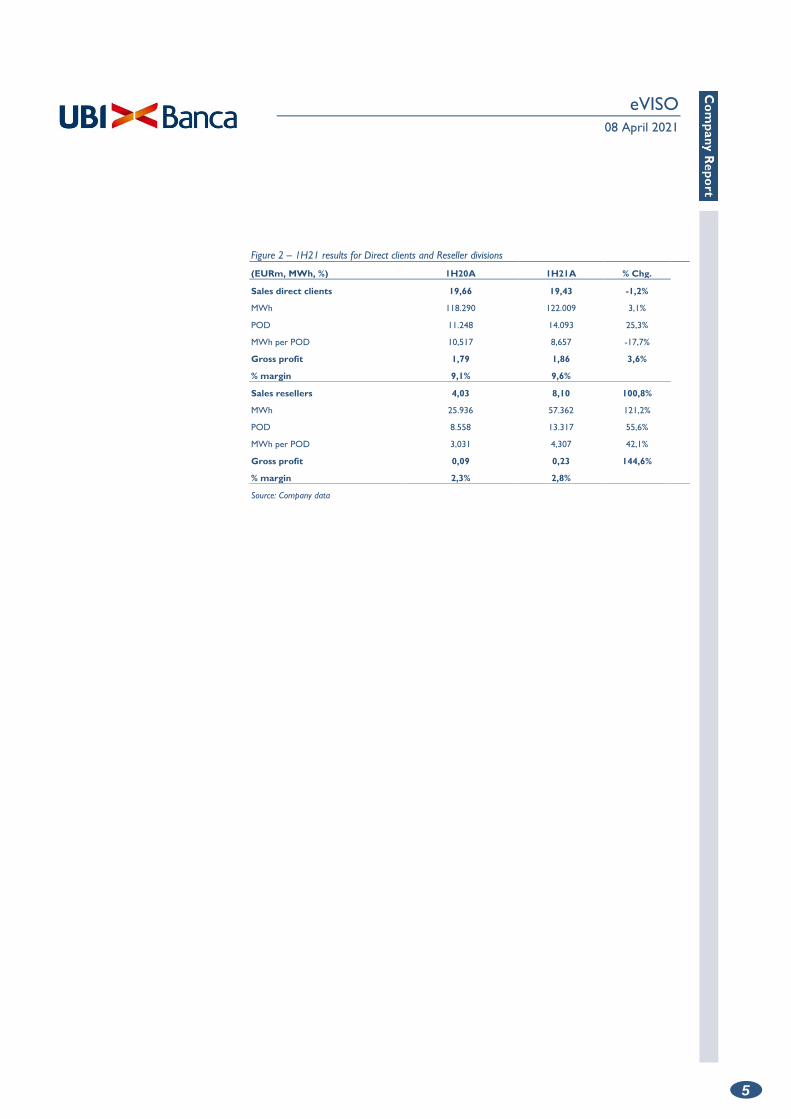
Figure 2 – 1H21 results for Direct clients and Reseller divisions
(EURm, MWh, %) 1H20A 1H21A % Chg.
Sales direct clients 19,66 19,43 -1,2%
MWh 118.290 122.009 3,1%
POD 11.248 14.093 25,3%
MWh per POD 10,517 8,657 -17,7%
Gross profit 1,79 1,86 3,6%
% margin 9,1% 9,6%
Sales resellers 4,03 8,10 100,8%
MWh 25.936 57.362 121,2%
POD 8.558 13.317 55,6%
MWh per POD 3,031 4,307 42,1%
Gross profit 0,09 0,23 144,6%
% margin 2,3% 2,8%
Source: Company data
eVISO
08 April 2021
6
Financial Projections
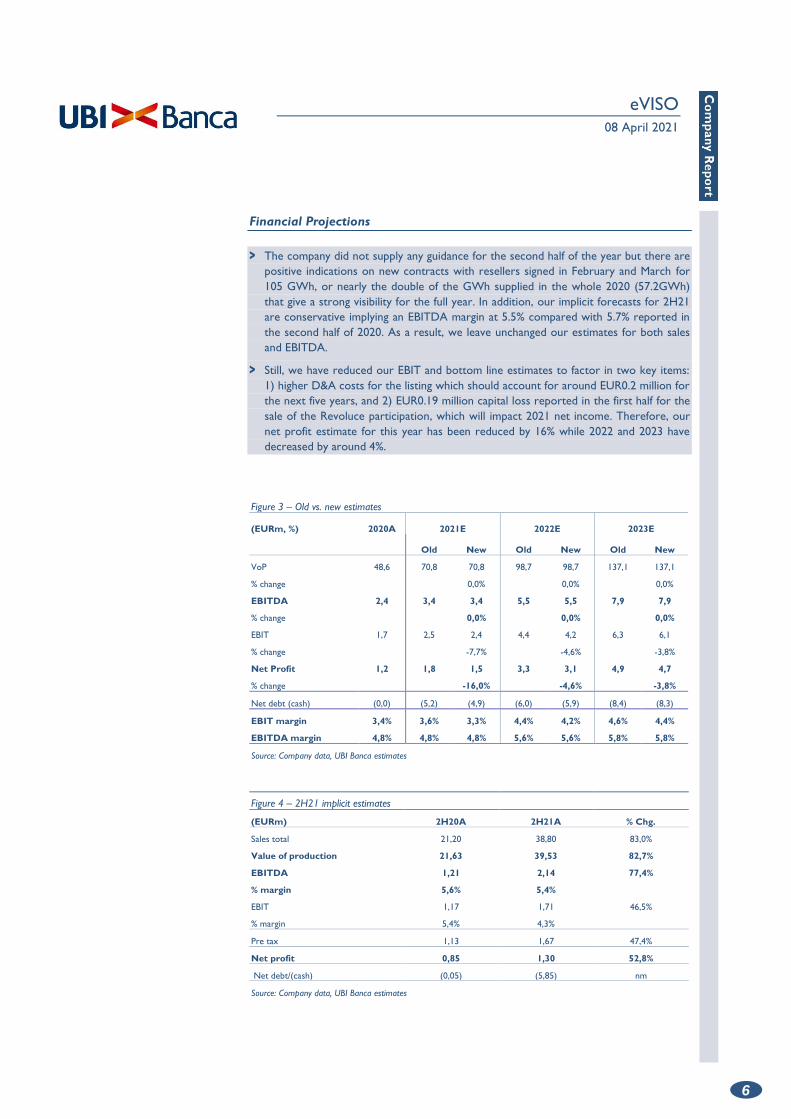
> The company did not supply any guidance for the second half of the year but there are
positive indications on new contracts with resellers signed in February and March for
105 GWh, or nearly the double of the GWh supplied in the whole 2020 (57.2GWh)
that give a strong visibility for the full year. In addition, our implicit forecasts for 2H21
are conservative implying an EBITDA margin at 5.5% compared with 5.7% reported in
the second half of 2020. As a result, we leave unchanged our estimates for both sales
and EBITDA.
> Still, we have reduced our EBIT and bottom line estimates to factor in two key items:
1) higher D&A costs for the listing which should account for around EUR0.2 million for
the next five years, and 2) EUR0.19 million capital loss reported in the first half for the
sale of the Revoluce participation, which will impact 2021 net income. Therefore, our
net profit estimate for this year has been reduced by 16% while 2022 and 2023 have
decreased by around 4%.
Figure 3 – Old vs. new estimates
(EURm, %) 2020A 2021E 2022E 2023E
Old New Old New Old New
VoP 48,6 70,8 70,8 98,7 98,7 137,1 137,1
% change 0,0% 0,0% 0,0%
EBITDA 2,4 3,4 3,4 5,5 5,5 7,9 7,9
% change 0,0% 0,0% 0,0%
EBIT 1,7 2,5 2,4 4,4 4,2 6,3 6,1
% change -7,7% -4,6% -3,8%
Net Profit 1,2 1,8 1,5 3,3 3,1 4,9 4,7
% change -16,0% -4,6% -3,8%
Net debt (cash) (0,0) (5,2) (4,9) (6,0) (5,9) (8,4) (8,3)
EBIT margin 3,4% 3,6% 3,3% 4,4% 4,2% 4,6% 4,4%
EBITDA margin 4,8% 4,8% 4,8% 5,6% 5,6% 5,8% 5,8%
Source: Company data, UBI Banca estimates
Figure 4 – 2H21 implicit estimates
(EURm) 2H20A 2H21A % Chg.
Sales total 21,20 38,80 83,0%
Value of production 21,63 39,53 82,7%
EBITDA 1,21 2,14 77,4%
% margin 5,6% 5,4%
EBIT 1,17 1,71 46,5%
% margin 5,4% 4,3%
Pre tax 1,13 1,67 47,4%
Net profit 0,85 1,30 52,8%
Net debt/(cash) (0,05) (5,85) nm
Source: Company data, UBI Banca estimates

eVISO
08 April 2021
7
Valuation
> Since the listing at EUR1.75 per share at the end of December 2020 eVISO’s share
price has grown by 28% overperforming the market. Still, we believe there is further
room for outperforming in the coming months thanks to the positive momentum of
the Reseller division, growing gross margins across all the businesses and the entrance
into new commodity markets exploiting its IT platform capabilities. For all these
reasons, we confirm a Buy rating with a new target price of EUR3.33 (from EUR2.96)
which benefits from the relative valuation now applied to 2021-23 multiples.
> Our target price of EUR3.33 per share is based on a DCF valuation, an EVA valuation
and a relative valuation based on the average of the multiples of Italian AI players and a
sample of mid-size energy players. We highlight that eVISO does not have any direct
peer listed as AI players are generally adopting a SaaS (software as a service) business
model, while energy players normally produce electricity acting as Esco companies. In
addition, eVISO closes the financial year on 30 June and this can make a multiple
comparison misleading. Our target price implies an upside of nearly 50% to the current
market price.
> eVISO is trading at discount to both Italian AI players (15% discount) and a sample of
mid-size energy players (27% discount).
Figure 5 – Valuation summary
(EUR) 7 Apr-21 Weight 15 Feb-21 Delta
DCF Valuation 2,94 25% 2,88 2,2%
EVA Valuation 2,40 25% 2,51 -4,6%
Relative Valuation AI 3,69 25% 3,17 16,3%
Relative Valuation Energy 4,30 25% 3,27 31,4%
Target Price 3,33 2,96 12,6%
Current price 2,24 2,13 5,2%
Potential upside 48,7% 38,8%
Source: UBI Banca estimates
Figure 6 – DCF Valuation
Our DCF valuation implies an EV/EBITDA of 4.6x at terminal value and of 10.2x in 2022
Valuation (EURm) % Weight Per share (EUR)
Sum of PV 2021-29 FCF 13,2 21% 0,54
Terminal value 51,2 79% 2,08
Total Enterprise value 64,4 100% 2,62
- Pension provision (0,2) (0,01)
- Net cash (debt) post IPO 8,0 0,33
Total Equity value 72,3 2,94
Number of shares outstanding (m) 24,6
Fair value per share (EUR) 2,94
Source: UBI Banca estimates
eVISO
08 April 2021
8
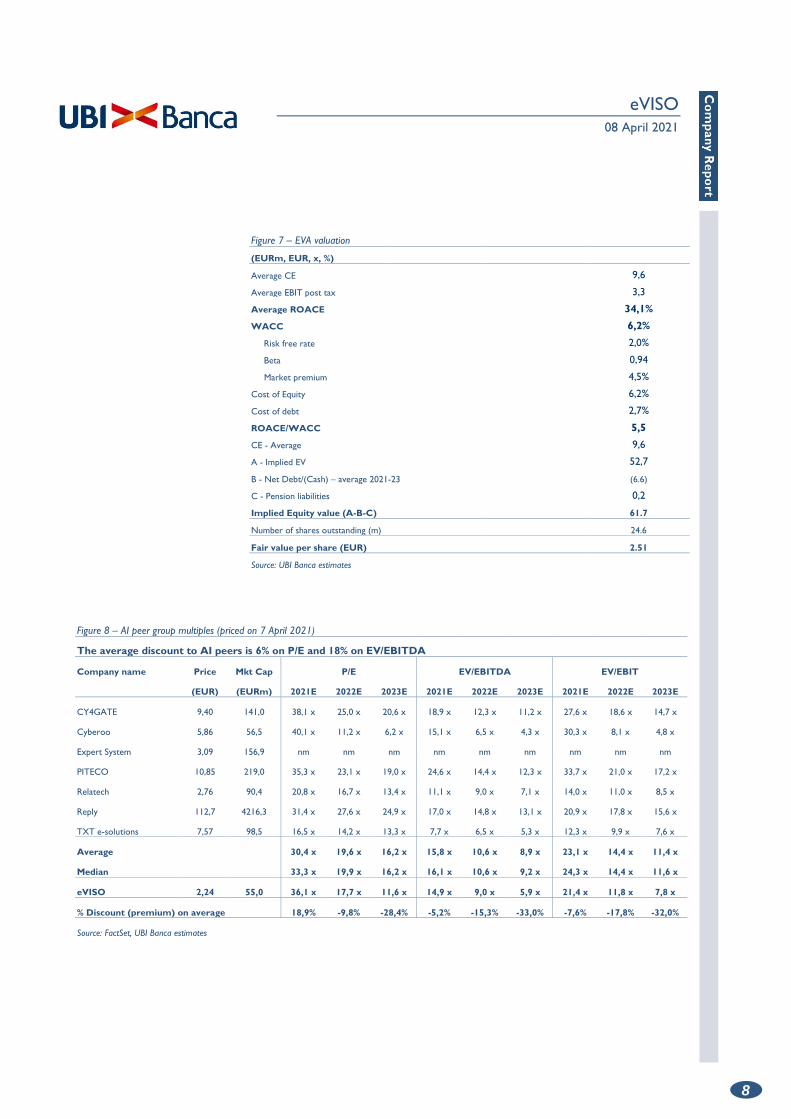
Figure 7 – EVA valuation
(EURm, EUR, x, %)
Average CE 9,6
Average EBIT post tax 3,3
Average ROACE 34,1%
WACC 6,2%
Risk free rate 2,0%
Beta 0,94
Market premium 4,5%
Cost of Equity 6,2%
Cost of debt 2,7%
ROACE/WACC 5,5
CE - Average 9,6
A - Implied EV 52,7
B - Net Debt/(Cash) – average 2021-23 (6.6)
C - Pension liabilities 0,2
Implied Equity value (A-B-C) 61.7
Number of shares outstanding (m) 24.6
Fair value per share (EUR) 2.51
Source: UBI Banca estimates
Figure 8 – AI peer group multiples (priced on 7 April 2021)
The average discount to AI peers is 6% on P/E and 18% on EV/EBITDA
Company name Price Mkt Cap P/E EV/EBITDA EV/EBIT
(EUR) (EURm) 2021E 2022E 2023E 2021E 2022E 2023E 2021E 2022E 2023E
CY4GATE 9,40 141,0 38,1 x 25,0 x 20,6 x 18,9 x 12,3 x 11,2 x 27,6 x 18,6 x 14,7 x
Cyberoo 5,86 56,5 40,1 x 11,2 x 6,2 x 15,1 x 6,5 x 4,3 x 30,3 x 8,1 x 4,8 x
Expert System 3,09 156,9 nm nm nm nm nm nm nm nm nm
PITECO 10,85 219,0 35,3 x 23,1 x 19,0 x 24,6 x 14,4 x 12,3 x 33,7 x 21,0 x 17,2 x
Relatech 2,76 90,4 20,8 x 16,7 x 13,4 x 11,1 x 9,0 x 7,1 x 14,0 x 11,0 x 8,5 x
Reply 112,7 4216,3 31,4 x 27,6 x 24,9 x 17,0 x 14,8 x 13,1 x 20,9 x 17,8 x 15,6 x
TXT e-solutions 7,57 98,5 16,5 x 14,2 x 13,3 x 7,7 x 6,5 x 5,3 x 12,3 x 9,9 x 7,6 x
Average 30,4 x 19,6 x 16,2 x 15,8 x 10,6 x 8,9 x 23,1 x 14,4 x 11,4 x
Median 33,3 x 19,9 x 16,2 x 16,1 x 10,6 x 9,2 x 24,3 x 14,4 x 11,6 x
eVISO 2,24 55,0 36,1 x 17,7 x 11,6 x 14,9 x 9,0 x 5,9 x 21,4 x 11,8 x 7,8 x
% Discount (premium) on average 18,9% -9,8% -28,4% -5,2% -15,3% -33,0% -7,6% -17,8% -32,0%
Source: FactSet, UBI Banca estimates

eVISO
08 April 2021
9
Figure 9 – Energy peer group multiples (priced on 7 April 2021)
Company name Price Mkt Cap P/E EV/EBITDA EV/EBIT
(EUR) (EURm) 2021E 2022E 2023E 2021E 2022E 2023E 2021E 2022E 2023E
Ascopiave 3,85 902 23,9 x 23,1 x 21,8 x 18,5 x 18,1 x 17,3 x 29,3 x 29,6 x 29,1 x
Elettra Investimenti 10,50 40 43,8 x 20,6 x 16,7 x 8,1 x 8,2 x 8,3 x 20,9 x 17,6 x 17,1 x
ERG 25,24 3794 32,9 x 28,6 x 28,7 x 10,4 x 9,5 x 9,2 x 26,6 x 22,8 x 21,9 x
Falk Renewables 6,04 1760 49,0 x 36,9 x 31,1 x 12,6 x 11,8 x 11,4 x 23,2 x 21,1 x 19,9 x
Albioma 43,34 1371 24,1 x 21,4 x 18,5 x 10,5 x 10,0 x 9,4 x 17,8 x 16,9 x 15,8 x
Average 34,7 x 26,1 x 23,4 x 12,0 x 11,5 x 11,1 x 23,6 x 21,6 x 20,7 x
Median 32,9 x 23,1 x 21,8 x 10,5 x 10,0 x 9,4 x 23,2 x 21,1 x 19,9 x
eVISO 2,24 55,0 36,1 x 17,7 x 11,6 x 14,9 x 9,0 x 5,9 x 21,4 x 11,8 x 7,8 x
% Discount (premium) on average 4,0% -32,3% -50,2% 24,3% -22,1% -46,5% -9,3% -45,2% -62,6%
Source: FactSet, UBI Banca estimates
Figure 10 – Implicit multiples based on our EUR3.33 target price
2021E 2022E 2023E
P/E 53,7 x 26,3 x 17,3 x
EV/EBITDA 22,8 x 13,8 x 9,3 x
EV/EBIT 32,7 x 18,2 x 12,1 x
EV/Sales 1,11 x 0,78 x 0,55 x
P/BV 6,72 x 5,49 x 4,34 x
P/CF 2,9 x 0,7 x 0,5 x
EV/CE 10,6 x 8,4 x 7,0 x
Source: UBI Banca estimates
eVISO
08 April 2021
10
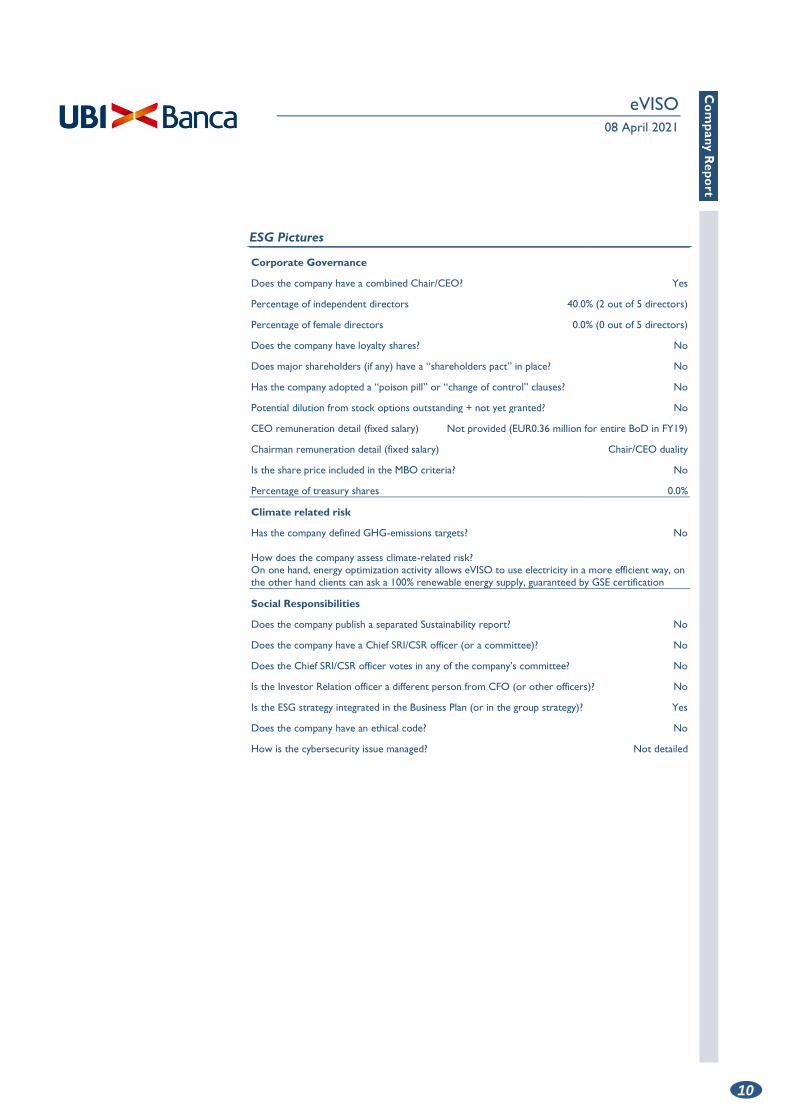
ESG Pictures
Corporate Governance
Does the company have a combined Chair/CEO? Yes
Percentage of independent directors 40.0% (2 out of 5 directors)
Percentage of female directors 0.0% (0 out of 5 directors)
Does the company have loyalty shares? No
Does major shareholders (if any) have a “shareholders pact” in place? No
Has the company adopted a “poison pill” or “change of control” clauses? No
Potential dilution from stock options outstanding + not yet granted? No
CEO remuneration detail (fixed salary) Not provided (EUR0.36 million for entire BoD in FY19)
Chairman remuneration detail (fixed salary) Chair/CEO duality
Is the share price included in the MBO criteria? No
Percentage of treasury shares 0.0%
Climate related risk
Has the company defined GHG-emissions targets? No
How does the company assess climate-related risk? On one hand, energy optimization activity allows eVISO to use electricity in a more efficient way, on the other hand clients can ask a 100% renewable energy supply, guaranteed by GSE certification
Social Responsibilities
Does the company publish a separated Sustainability report? No
Does the company have a Chief SRI/CSR officer (or a committee)? No
Does the Chief SRI/CSR officer votes in any of the company’s committee? No
Is the Investor Relation officer a different person from CFO (or other officers)? No
Is the ESG strategy integrated in the Business Plan (or in the group strategy)? Yes
Does the company have an ethical code? No
How is the cybersecurity issue managed? Not detailed
eVISO
08 April 2021
11
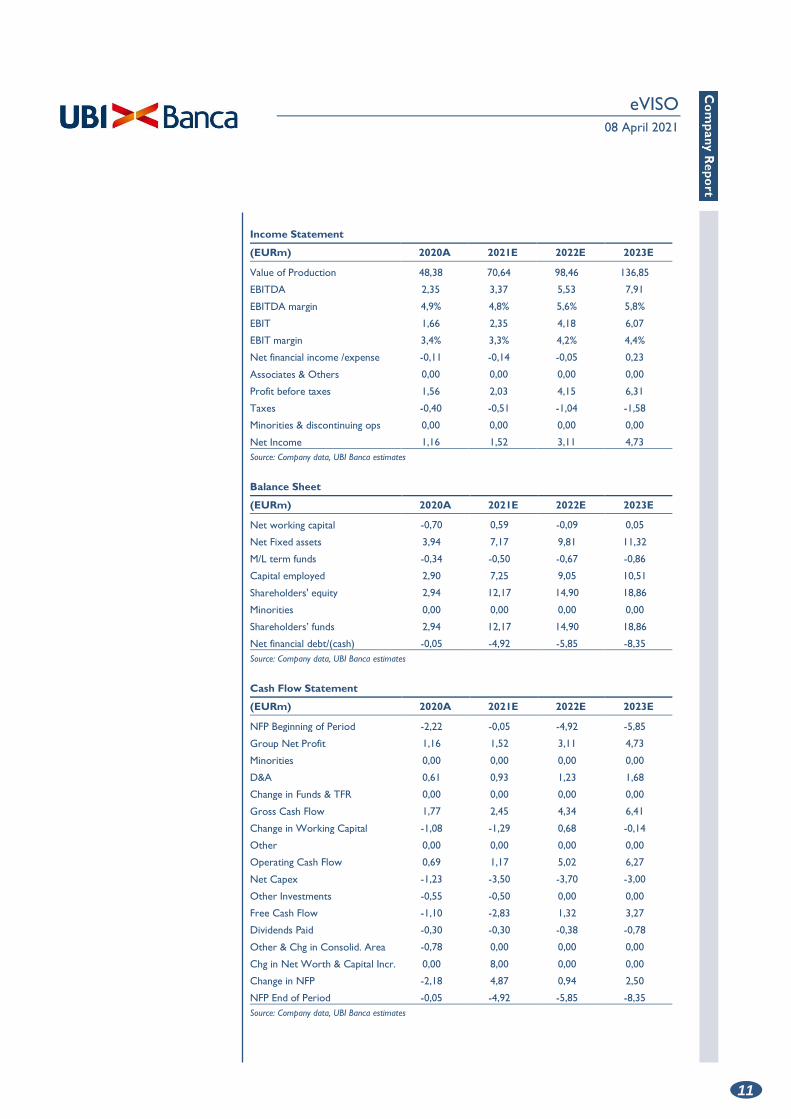
Income Statement
(EURm) 2020A 2021E 2022E 2023E
Value of Production 48,38 70,64 98,46 136,85
EBITDA 2,35 3,37 5,53 7,91
EBITDA margin 4,9% 4,8% 5,6% 5,8%
EBIT 1,66 2,35 4,18 6,07
EBIT margin 3,4% 3,3% 4,2% 4,4%
Net financial income /expense -0,11 -0,14 -0,05 0,23
Associates & Others 0,00 0,00 0,00 0,00
Profit before taxes 1,56 2,03 4,15 6,31
Taxes -0,40 -0,51 -1,04 -1,58
Minorities & discontinuing ops 0,00 0,00 0,00 0,00
Net Income 1,16 1,52 3,11 4,73
Source: Company data, UBI Banca estimates
Balance Sheet
(EURm) 2020A 2021E 2022E 2023E
Net working capital -0,70 0,59 -0,09 0,05
Net Fixed assets 3,94 7,17 9,81 11,32
M/L term funds -0,34 -0,50 -0,67 -0,86
Capital employed 2,90 7,25 9,05 10,51
Shareholders' equity 2,94 12,17 14,90 18,86
Minorities 0,00 0,00 0,00 0,00
Shareholders’ funds 2,94 12,17 14,90 18,86
Net financial debt/(cash) -0,05 -4,92 -5,85 -8,35
Source: Company data, UBI Banca estimates
Cash Flow Statement
(EURm) 2020A 2021E 2022E 2023E
NFP Beginning of Period -2,22 -0,05 -4,92 -5,85
Group Net Profit 1,16 1,52 3,11 4,73
Minorities 0,00 0,00 0,00 0,00
D&A 0,61 0,93 1,23 1,68
Change in Funds & TFR 0,00 0,00 0,00 0,00
Gross Cash Flow 1,77 2,45 4,34 6,41
Change in Working Capital -1,08 -1,29 0,68 -0,14
Other 0,00 0,00 0,00 0,00
Operating Cash Flow 0,69 1,17 5,02 6,27
Net Capex -1,23 -3,50 -3,70 -3,00
Other Investments -0,55 -0,50 0,00 0,00
Free Cash Flow -1,10 -2,83 1,32 3,27
Dividends Paid -0,30 -0,30 -0,38 -0,78
Other & Chg in Consolid. Area -0,78 0,00 0,00 0,00
Chg in Net Worth & Capital Incr. 0,00 8,00 0,00 0,00
Change in NFP -2,18 4,87 0,94 2,50
NFP End of Period -0,05 -4,92 -5,85 -8,35
Source: Company data, UBI Banca estimates
eVISO
08 April 2021
12
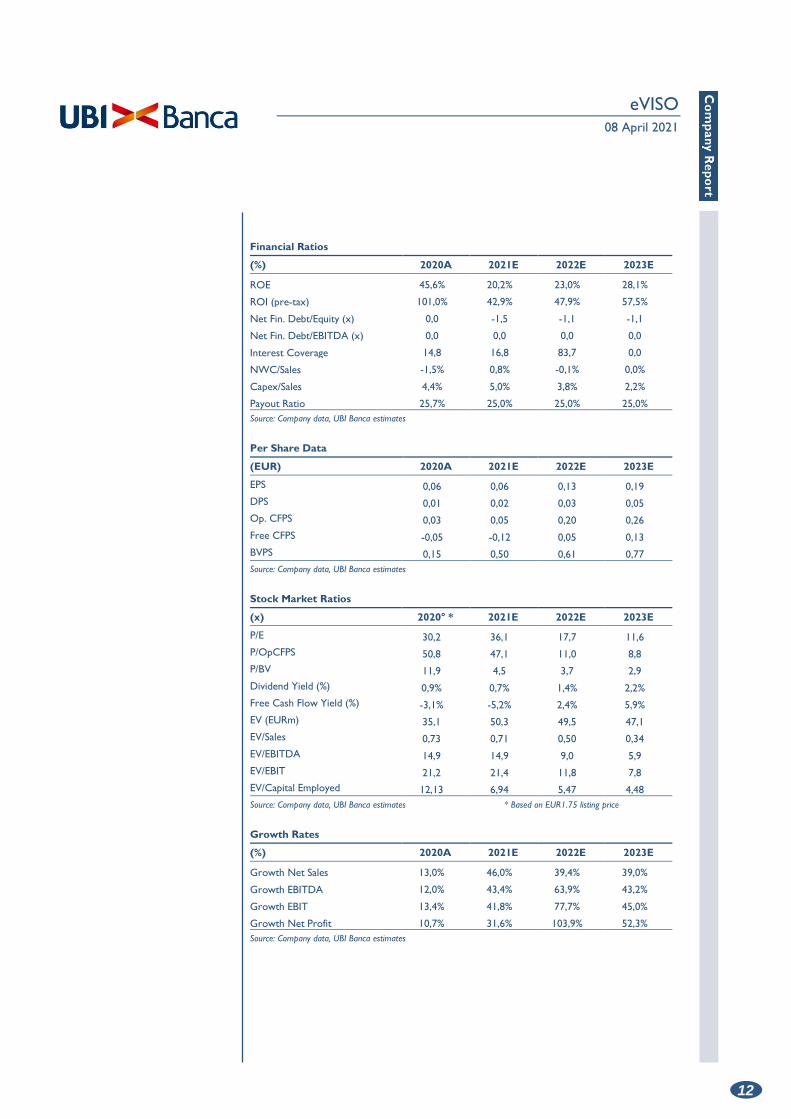
Financial Ratios
(%) 2020A 2021E 2022E 2023E
ROE 45,6% 20,2% 23,0% 28,1%
ROI (pre-tax) 101,0% 42,9% 47,9% 57,5%
Net Fin. Debt/Equity (x) 0,0 -1,5 -1,1 -1,1
Net Fin. Debt/EBITDA (x) 0,0 0,0 0,0 0,0
Interest Coverage 14,8 16,8 83,7 0,0
NWC/Sales -1,5% 0,8% -0,1% 0,0%
Capex/Sales 4,4% 5,0% 3,8% 2,2%
Payout Ratio 25,7% 25,0% 25,0% 25,0%
Source: Company data, UBI Banca estimates
Per Share Data
(EUR) 2020A 2021E 2022E 2023E
EPS 0,06 0,06 0,13 0,19
DPS 0,01 0,02 0,03 0,05
Op. CFPS 0,03 0,05 0,20 0,26
Free CFPS -0,05 -0,12 0,05 0,13
BVPS 0,15 0,50 0,61 0,77
Source: Company data, UBI Banca estimates
Stock Market Ratios
(x) 2020° * 2021E 2022E 2023E
P/E 30,2 36,1 17,7 11,6
P/OpCFPS 50,8 47,1 11,0 8,8
P/BV 11,9 4,5 3,7 2,9
Dividend Yield (%) 0,9% 0,7% 1,4% 2,2%
Free Cash Flow Yield (%) -3,1% -5,2% 2,4% 5,9%
EV (EURm) 35,1 50,3 49,5 47,1
EV/Sales 0,73 0,71 0,50 0,34
EV/EBITDA 14,9 14,9 9,0 5,9
EV/EBIT 21,2 21,4 11,8 7,8
EV/Capital Employed 12,13 6,94 5,47 4,48
Source: Company data, UBI Banca estimates * Based on EUR1.75 listing price
Growth Rates
(%) 2020A 2021E 2022E 2023E
Growth Net Sales 13,0% 46,0% 39,4% 39,0%
Growth EBITDA 12,0% 43,4% 63,9% 43,2%
Growth EBIT 13,4% 41,8% 77,7% 45,0%
Growth Net Profit 10,7% 31,6% 103,9% 52,3%
Source: Company data, UBI Banca estimates
eVISO
08 April 2021
13
Disclaimer
Analyst Declaration
This research report (the “Report”) has been prepared by Marco Cristofori and Dario Fasani (the “Analysts”) on behalf of UBI Banca S.p.A. (“UBI Banca”) in the context of the ancillary service provided by UBI Banca named “Investment research and financial analysis or other forms of recommendation relating to transactions in financial instruments” under Paragraph 5), Section B, Annex I of the Directive 2014/65/EU (“MiFID II”). UBI Banca is an Italian bank under art. 4 (1)(27) of MiFID II, it is part of Intesa Sanpaolo group (“Intesa Group”), under the direction and control of Intesa Sanpaolo and it is supervised by the European Central Bank and duly authorised to provide investment services pursuant to Article 1, Paragraph 5, letter a), b), c), c-bis), e) and f) of the Legislative Decree 24 February 1998, n° 58 under the supervision of the Italian Authority for the financial markets (Consob). UBI Banca has its head office at Piazza Vittorio Veneto 8, 24122 Bergamo.
The Analyst who prepared the Report, and whose name and role appear on the front page, certifies that:
> The views expressed on the company, mentioned herein (the “Company”)
accurately reflect his personal views, but does not represent the views or
opinions of UBI Banca, its management or any other company which is part of
or affiliated with Intesa Group. It may be possible that some Intesa Group
officers may disagree with the views expressed in this Report;
> He has not received, and will not receive any direct or indirect compensation
in exchange for any views expressed in this Report;
> The Analyst does not own any securities and/or any other financial
instruments issued by the Company or any financial instrument which the
price depends on, or is linked to any securities and/or any financial
instruments issued by the Company.
> Neither the Analyst nor any member of the Analyst’s household serves as an
officer, director or advisory board member of the Company.
> The remuneration of the Analyst is not directly tied to transactions for services
for investment firms or other types of transactions it or any legal person, part
of the same group performs, or to trading fees it or any legal person that is
part of the same group receives.
> Marco Cristofori is a member of AIAF.
General disclosure
This Report is for information purposes only. This Report (i) is not, nor may it be construed, to constitute, an offer for sale or subscription or of a solicitation of any offer to buy or subscribe for any securities issued or to be issued by the Company, (ii) should not be regarded as a substitute for the exercise of the recipient’s own judgement. In addition, the information included in this Report may not be suitable for all recipients. Therefore the recipient should conduct their own investigations and analysis of the Company and securities referred to in this document, and make their own investment decisions without undue reliance on its contents. Neither UBI Banca, nor any other company belonging to the Intesa Group, nor any of its directors, managers, officers or employees, accepts any direct or indirect liability whatsoever (in negligence or otherwise), and accordingly no direct or indirect liability whatsoever shall be assumed by, or shall be placed on, UBI Banca, or any other company belonging to the Intesa Group, or any of its directors, managers, officers or employees, for any loss, damage, cost, expense, lower earnings howsoever arising from any use of this Report or its contents or otherwise arising in connection with this Report.
The information provided and the opinions expressed in this Report are based upon
eVISO
08 April 2021
14
information and data provided to the public by the Company or news otherwise public, and refers to the date of publication of the Report. The sources (press publications, financial statements, current and periodic releases, as well as meetings and telephone conversations with the Company’s representatives) are believed to be reliable and in good faith, but no representation or warranty, express or implied, is made by UBI Banca as to their accuracy, completeness or correctness. Past performance is not a guarantee of future results. Any opinions, forecasts or estimates contained herein constitute a judgement as of the date of this Report, and there can be no assurance that the future results of the Company and/or any future events involving directly or indirectly the Company will be consistent with any such opinions, forecasts or estimates. Any information herein is subject to change, update or amendment without notice by UBI Banca subsequent to the date of this Report, with no undertaking by UBI Banca to notify the recipient of this Report of such change, update or amendment.
Organizational and administrative arrangements to prevent conflicts of interests
UBI Banca maintains procedures and organizational mechanism (physical and non-physical barriers designed to restrict the flow of information between the unit which performs investment research activity, and other units of UBI Banca) to prevent and professionally manage conflicts of interest in relation to investment research in accordance with art. 23 of Directive 2014/65/EU and under art. 34 (3) and art. 37 of the Regulation 2017/565/EU. UBI Banca is organized in such a way as to minimize conflicts of interest and has within the meaning of art. 20 (1) of the Regulation (EU) No 596/2014/EU and has adequate control procedures in place to counter infringements of the obligations laid down in Article 20 (1) of the Regulation (EU) No 596/2014. More specifically, UBI Banca has established, implements and maintains an effective conflicts of interests policy aimed at preventing and managing the potential conflicts of interest that could occur during the performance of the investment research services.
Insofar as the above mentioned organizational and administrative arrangements established by UBI Banca to prevent or manage potential conflicts of interests are not sufficient to ensure, with reasonable confidence, that risks of damage to the interests of the client will be prevented, UBI Banca engages to provide a clear disclosure of the specific conflicts of interests arising from the performance of investment research services, including a description of the sources of those conflicts and the steps undertaken to mitigate them, taking into account the nature of the client to whom the disclosure is being made. For further information please see UBI Banca’s website (www.ubibanca.com/equity-research - “Informativa sintetica sull’attività di ricerca”) and (www.ubibanca.com/Mifid - “Policy sintetica conflitti di interessi”). More details about the conflicts of interests policy will be provided by UBI Banca upon request.
Disclosure of interests and conflicts of interests pursuant to Delegated Regulation 2016/958/EU
In relation to the Company the following interest/conflict of interest have been found:
> UBI Banca acts as Corporate Broker for EVISO S.P.A.
> One or more of the companies of the Intesa Sanpaolo Banking Group have a
long position larger than the 0.5% of the issued share capital of EVISO S.P.A.
> One or more of the companies of the Intesa Sanpaolo Banking Group are one
of the main financial lenders to EVISO S.P.A. and its parent and group
companies
> One or more of the companies of the Intesa Sanpaolo Banking Group have
been lead manager or co-lead manager over the previous 12 months of any
publicly disclosed offer of financial instruments of EVISO S.P.A.
On the basis of the checks carried out no other interest/conflict of interest arose.
eVISO
08 April 2021
15
Frequency of updates
UBI Banca aims to provide continuous coverage of the companies in conjunction with the timing of periodical accounting reports and any exceptional event that occurs affecting the issuer’s sphere of operations and in any case at least twice per year. The companies for which UBI Banca acts as Sponsor or Specialist are covered in compliance with regulations of the market authorities.
For further information please refer to www.ubibanca.com/equity-research
Valuation methodology
UBI Banca’s analysts value the Company subject to their recommendations using several methods among which the most prevalent are: the Discounted Cash Flow method (DCF), the Economic Value Added method (EVA), the Multiple comparison method, the SOP method and the NAV method.
The analysts use the above valuation methods alternatively and/or jointly at their discretion. The assigned target price may differ from their fair value, as it also takes into account overall market/sector conditions, corporate/market events, and corporate specifics (i.e. holding discounts) reasonably considered to be possible drivers of the company’s share price performance. These factors may also be assessed using the methodologies indicated above.
For further information please refer to www.ubibanca.com/equity-research.
Ranking system
UBI Banca’s analysts use an “absolute” rating system, not related to market performance. The explanation of the rating system is listed below:
Buy: if the target price is 15% higher than the market price, over the next 12 months.
Hold: if the target price is 15% below or 15% above the market price, over the next 12 months.
Sell: if the target price is 15% lower than the market price, over the next 12 months.
No Rating: the investment rating and target price have been suspended as there is not sufficient fundamental basis for determining an investment rating or target. The previous investment rating and target price, if any, are no longer in effect. Alternatively, No Rating is assigned in certain circumstances when UBI Banca is acting in any advisory capacity in a strategic transaction involving the Company.
Target price: the market price that the analyst believes that the share may reach within a one-year time horizon.
Market price: closing price on the day before the issue date of the report, appearing on the first page.
Distribution
Italy: This document is intended for distribution in electronic form to “Professional Clients” and “Qualified Counterparties” as defined by Legislative Decree 24 February 1998, n. 58 and by Consob Regulation n. 16190 dated 29.10.2007, as further amended and supplemented.
This Report has been released within 30 minutes from the timing reported on the front page.
IN THE UNITED KINGDOM, THIS DOCUMENT IS BEING DISTRIBUTED ONLY TO, AND IS DIRECTED ONLY AT PERSONS WHO (A) ARE (I) PERSONS FALLING WITHIN ARTICLE 19 OR ARTICLE 49 OF THE FINANCIAL SERVICES AND MARKETS ACT 2000 (FINANCIAL PROMOTION) ORDER 2005 (AND ONLY WHERE THE CONDITIONS CONTAINED IN THOSE ARTICLES HAVE BEEN, OR WILL AT THE RELEVANT TIME BE, SATISFIED) OR (II) ANY OTHER
eVISO
08 April 2021
16
PERSONS TO WHOM IT MAY BE LAWFULLY COMMUNICATED; AND (B) ARE QUALIFIED INVESTORS WITHIN THE MEANING OF ARTICLE 2(1)(E) OF THE PROSPECTUS DIRECTIVE (DIRECTIVE 2003/71/EC), (ALL SUCH PERSONS BEING REFERRED TO AS "RELEVANT PERSONS"). THIS DOCUMENT MUST NOT BE ACTED ON OR RELIED ON BY PERSONS WHO ARE NOT RELEVANT PERSONS.
THIS REPORT DOES NOT CONSTITUTE A PROSPECTUS WITHIN THE MEANING OF ARTICLE 652A OR ART. 1156 OF THE SWISS CODE OF OBLIGATIONS OR A LISTING PROSPECTUS WITHIN THE MEANING OF THE LISTING RULES OF THE SIX SWISS EXCHANGE OR ANY OTHER TRADING VENUE IN SWITZERLAND, OR A SIMILAR COMMUNICATION WITHIN THE MEANING OF ART. 752 THE SWISS CODE OF OBLIGATIONS, AND HAS BEEN PREPARED WITHOUT REGARD TO SWISS LAWS AND REGULATIONS, AND DOES NOT CONSTITUTE AN OFFER TO SUBSCRIBE FOR, BUY OR OTHERWISE ACQUIRE ANY SECURITIES OF THE COMPANY.
IN FRANCE, THIS DOCUMENT IS BEING DISTRIBUTED ONLY TO, AND IS DIRECTED ONLY AT PERSONS WHO ARE CONSIDERED AS PROFESSIONAL CLIENTS WITHIN THE MEANING OF ARTICLES L. 533-16 AND D. 533-11 ET SEQ. OF THE FRENCH CODE MONETAIRE ET FINANCIER (THE FRENCH FINANCIAL CODE) OR AS ELIGIBLE COUNTERPARTIES, AS DEFINED IN ARTICLES L. 533-20 AND D. 533-13 ET SEQ. OF THE FRENCH FINANCIAL CODE.
IN IRELAND, THIS DOCUMENT IS BEING DISTRIBUTED ONLY TO, AND IS DIRECTED ONLY AT, PERSONS WHO ARE QUALIFIED INVESTORS WITHIN THE MEANING OF ARTICLE 2(1)(E) OF THE PROSPECTUS DIRECTIVE (DIRECTIVE 2003/71/EC, AS AMENDED FROM TIME TO TIME, INCLUDING BY DIRECTIVE 2010/73/EC) ("QUALIFIED PERSONS"). THIS DOCUMENT MUST NOT BE ACTED ON OR RELIED ON BY PERSONS WHO ARE NOT QUALIFIED PERSONS.
THIS REPORT DOES NOT CONSTITUTE A PROSPECTUS WITHIN THE MEANING OF ARTICLE 652A OR ART. 1156 OF THE SWISS CODE OF OBLIGATIONS OR A LISTING PROSPECTUS WITHIN THE MEANING OF THE LISTING RULES OF THE SIX SWISS EXCHANGE OR ANY OTHER TRADING VENUE IN SWITZERLAND, OR A SIMILAR COMMUNICATION WITHIN THE MEANING OF ART. 752 THE SWISS CODE OF OBLIGATIONS, AND HAS BEEN PREPARED WITHOUT REGARD TO SWISS LAWS AND REGULATIONS, AND DOES NOT CONSTITUTE AN OFFER TO SUBSCRIBE FOR, BUY OR OTHERWISE ACQUIRE ANY SECURITIES OF THE COMPANY.
Copyright
This Report is being supplied solely for the recipient’s information and may not be reproduced, redistributed or passed on, directly or indirectly to any other person or published, in whole or in part, for any purpose without prior written consent of UBI Banca.
The copyright and intellectual property rights on the data are owned by UBI Banca Group, unless otherwise indicated. The data, information, opinions and valuations contained in this Report may not be subject to further distribution or reproduction, in any form or via any means, even in part, unless expressly consented by UBI Banca.
By accepting this Report the recipient agrees to be bound by all of the forgoing provisions.
eVISO
08 April 2021
17
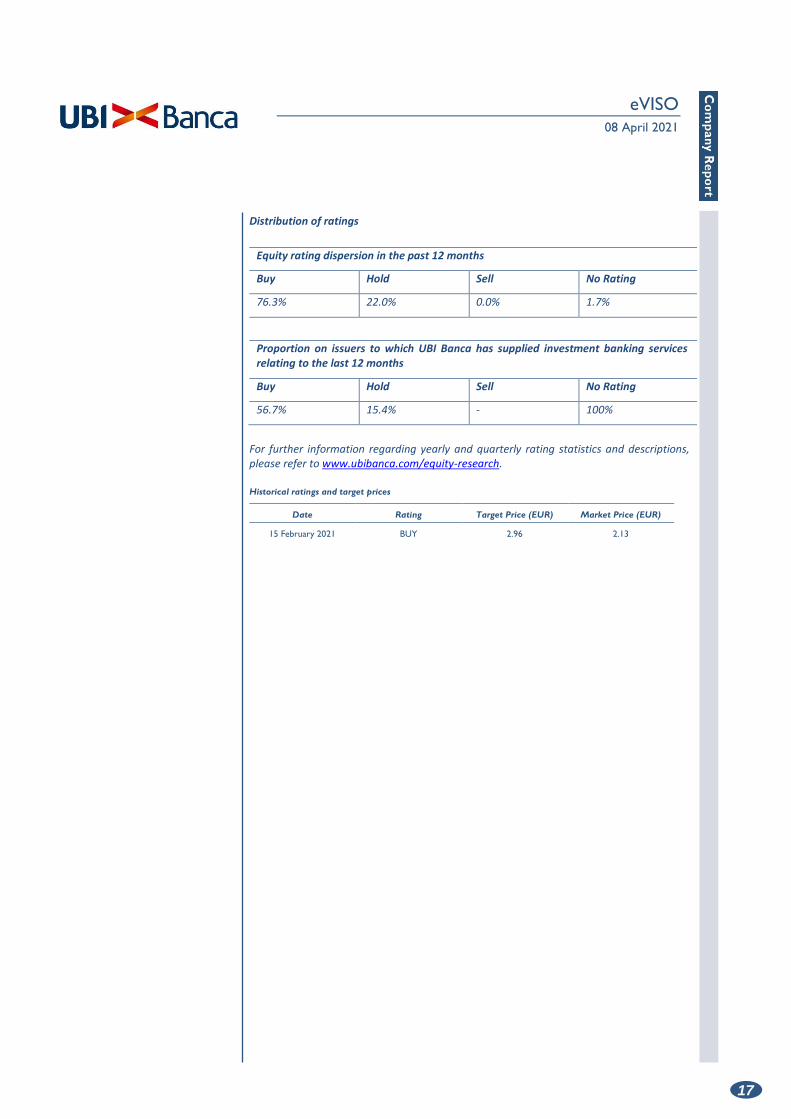
Distribution of ratings
Equity rating dispersion in the past 12 months
Buy Hold Sell No Rating
76.3% 22.0% 0.0% 1.7%
Proportion on issuers to which UBI Banca has supplied investment banking services relating to the last 12 months
Buy Hold Sell No Rating
56.7% 15.4% - 100%
For further information regarding yearly and quarterly rating statistics and descriptions, please refer to www.ubibanca.com/equity-research.
Historical ratings and target prices
Date Rating Target Price (EUR) Market Price (EUR)
15 February 2021 BUY 2.96 2.13