Notch signaling drives stemness and tumorigenicity of esophageal adenocarcinoma
Upload
independentCategory
view
3download
0
Porcine Skin-Derived Progenitor (SKP) Spheresand Neurospheres: Distinct ‘‘Stemness’’ Identified
by Microarray Analysis
Ming-Tao Zhao,1,2 Kristin M. Whitworth,1 Hui Lin,2 Xia Zhang,1 S. Clay Isom,1 Kyle B. Dobbs,1
Bethany Bauer,1 Yong Zhang,2 and Randall S Prather1
Abstract
Skin-derived progenitors (SKP) are neural crest derived and can generate neural and mesodermal progenyin vitro, corresponding to the multipotency of neural crest stem cells. Likewise, neural stem=progenitor cells(displaying as neurospheres) have the capacity of self-renewing, and can produce most phenotypes in thenervous system. Both form spheres when cultured with epidermal growth factor (EGF) and basic fibroblastgrowth factor (bFGF). Although the ‘‘stemness’’ of neural stem=progenitor cells has been extensively investi-gated, the molecular comparison of SKP spheres and neurospheres has not been elucidated. Here, SKP spheresand neurospheres from the same individual porcine fetuses were isolated with the same culture medium, andthe multipotency was tested by in vitro differentiation assays. Microarray analysis was used to illustrate the‘‘stemness’’ of SKP spheres and neurospheres. The upregulated genes that were in common in the SKP spheresand neurospheres are involved in ribosome, tight junction, gap junction, cell communication, calcium signaling,ErbB signaling, JAK–STAT signaling, MAPK signaling, etc. The differentially expressed genes between SKPspheres and neurospheres are mainly involved in ECM–receptor interaction and the transforming growth factor-beta (TGF-b) signaling pathway. Finally, treatment with leukemia inhibitory factor (LIF) or MEK inhibitor resultsin a distinctive impact on the ‘‘stemness’’ and differentiation genes of SKP spheres and neurospheres. Thus, thecell-intrinsic genetic program may contribute to the innate ‘‘stemness’’ of SKP spheres and neurospheres in asimilar local microenvironment.
Introduction
Stem cells, which can self-renew and generate differen-tiated progeny, play an essential role in both lineage
commitment during embryonic development and balancingthe homeostasis within their microenvironment throughouttheir lifetime (Blanpain and Fuchs, 2009; Jaenisch andYoung, 2008; Morrison and Spradling, 2008). Recently, asubset of sphere-forming stem cells has been emerging:skin-derived progenitor (SKP). SKP spheres are neural crest-derived progenitors that can be isolated both during em-bryonic development and adulthood (Fernandes et al., 2004,2008). SKP cells are capable of producing both neural andmesodermal progeny in humans (Toma et al., 2005), rodents(Fernandes et al., 2004; Toma et al., 2001), and pigs (Zhaoet al., 2009), corresponding to the multipotency of embryonic
neural crest stem cells (Crane and Trainor, 2006). Likewise,neurospheres were initially derived from adult mammalianbrain when exposed to a high concentration of mitogenssuch as EGF and bFGF in vitro (Gage, 2000; Reynolds andRietze, 2005; Reynolds and Weiss, 1992). Neurospheres canbe induced to differentiate into neurons and glias in theembryonic, neonatal, and adult brain (Merkle and Alvarez-Buylla, 2006). This procedure was later employed to culturedermal skin tissue, which also developed into spheres(Toma et al., 2001). Multipotent neural crest-derived stemcells (NCSCs) that can form neurosphere-like structuresin vitro have been identified in various rodent tissues besidesskin: dorsal root ganglia (Li et al., 2007a), bone marrow,whisker pad (Nagoshi et al., 2008), cornea (Yoshida et al.,2006), and carotid body (Pardal et al., 2007); although theearly studies on NCSCs did not test their sphere-forming
1Division of Animal Sciences, University of Missouri–Columbia, Columbia, Missouri.2Institute of Biotechnology, Northwest A&F University, Yangling, Shaanxi, 712100, People’s Republic of China.
CELLULAR REPROGRAMMINGVolume 12, Number 3, 2010ª Mary Ann Liebert, Inc.DOI: 10.1089=cell.2009.0116
329
ability (Morrison et al., 1999; Stemple and Anderson, 1992).Therefore, it is hypothesized that these two types of sphere-forming stem cells, neurospheres in the central nervoussystem (CNS) and neural crest-derived SKP spheres, mayshare similar molecular machinery for their common‘‘stemness’’ (Kagalwala et al., 2009; Ramalho-Santos et al.,2002) as they both have the potency to generate neuralprogeny.
The genetic and epigenetic regulation of the ‘‘stemness’’in multipotent=pluripotent stem cells has been elucidatedduring the past decades (Cole and Young, 2008; Jaenischand Young, 2008; Surani et al., 2007). Recent studies showthat transcriptional regulatory circuitry is fundamental tounderstand the molecular machinery of pluripotency, whichis exemplified by the core transcriptional regulatory cir-cuitry centered on OCT4, SOX2, and NANOG and the in-tegration of external signaling pathways with the coretranscriptional network in embryonic stem (ES) cells (Boyeret al., 2005; Chen et al., 2008). The key features of tran-scriptional regulatory circuitry have been further demon-strated by the reprogramming of fibroblast (Takahashi andYamanaka, 2006) or terminally differentiated B lymphocytes(Hanna et al., 2008) into pluripotent stem cells by definedfactors. However, the transcriptional regulation of multi-potency and self-renewal of adult stem cells has still beenelusive, although a series of transcriptional profiling ex-periments have been carried out to identify the ‘‘stemness’’gene or stem-cell molecular signatures on ES cells (Ivanovaet al., 2002; Ramalho-Santos et al., 2002), hematopoieticstem cells (Georgantas et al., 2004; Terskikh et al., 2003),mesenchymal stem cells (Ng et al., 2008), neural stem cells(Maisel et al., 2007; Shin et al., 2007), NCSCs (Hu et al.,2006; Thomas et al., 2008), and epithelial stem cells (Doh-erty et al., 2008; Tumbar et al., 2004). The variation oftranscriptional regulation may be caused by the noise ofvarious genetic backgrounds or different extrinsic stimuli,which may trigger stem cells to display differential tran-scriptional profiling because transformation or reprogram-ming is likely to happen during long-term culture (Changet al., 2008; Hochedlinger and Jaenisch, 2006). Additionally,the heterogeneity of ES cells and adult stem cells causethem to oscillate between one or more metastable states,making it more difficult to define a certain transcriptionalstate (Chou et al., 2008; Graf and Stadtfeld, 2008). It hasbeen argued that pluripotency of stem cells in culture couldrepresent a ground state independent of extrinsic instruc-tions (Silva and Smith, 2008; Ying et al., 2008). Thus, arelatively stable ‘‘niche’’ will be indispensable to uncoverthe transcriptional regulation of multipotency and self-renewal of adult stem cells in vitro.
Previously we isolated porcine SKP spheres and dissectedthe mesodermal potency of SKP spheres by microarrayanalysis (Zhao et al., 2009, 2010). Here we aimed to decipherthe neural potency of SKP spheres by comparing their tran-scriptional profiling with that of neurospheres. SKP spheresand neurospheres were isolated from the same individualfetuses to remove genetic background variation and culturedin the same medium so that the sphere ‘‘niche’’ can be keptin a relatively stable state. It appears that SKP spheresand neurospheres share common pathways but employdifferent signaling pathways for their individual ‘‘stemness’’properties.
Materials and Methods
Animal use and care have been reviewed and approvedby the Animal Care and Use Committee (ACUC) at theUniversity of Missouri.
Cell isolation and cultures: SKP spheresand neurospheres
Unless indicated otherwise, media and components usedin this study were purchased from Sigma (St. Louis, MO,USA).
Porcine SKP spheres ware isolated as described (Zhaoet al., 2009). Then neurospheres isolation was modified ac-cordingly (Deleyrolle and Reynolds, 2009). Briefly, embry-onic brain tissue was collected from day 40–50 pCAG-EGFPtransgenic porcine fetuses in a sterile laminar flow hood(Whitworth et al., 2009). The EGFP transgenic cells wereused so that a marker is available for future studies where itwill be necessary to track the SKP spheres and neurospheresin vivo. The brain tissues were washed with D-PBS (Invitro-gen, Carlsbad, CA, USA) three times and chopped up intosmall pieces. The dissected tissue was then dissociated with a200-mL pipette and then triturated approximately 10 timesuntil a milky single cell suspension was achieved. The dis-sociated cells were washed three times with DMEM=F12medium (1:1, Invitrogen) and then poured through a 40-mmstrainer (BD Biosciences, Franklin Lakes, NJ, USA). The sin-gle cells were collected by centrifugation and were countedon a hemocytometer. The cells were then suspended withbasic medium containing DMEM=F12 (1:1), B27 (50�, In-vitrogen), N2 (100�, Invitrogen), 20 ng=mL EGF, 40 ng=mLbFGF, and Glutamine (100�, Invitrogen) and cultured insuspension dishes (Sarstedt, Newton, NC, USA) for 3 days.Afterward, an appropriate volume of culture medium with2�growth factors and supplements were added to comple-ment the depletion. The neurospheres appeared in 5–7 daysand were harvested for RNA isolation or stored in liquidnitrogen. The SKP spheres and neurospheres were collectedfrom six individual fetuses across three litters.
Immunocytochemistry
Cell cultures were washed with PBS to remove the resid-ual medium and fixed with 4% paraformaldehyde for20 min. The cells were then permeabilized with 0.1% TritonX-100 for 20 min at room temperature (RT). The fixed cellswere washed and blocked with PBS=10% fetal bovine srum(FBS) (Hyclone, Logan, UT, USA) for 2 h at RT and thenincubated with primary antibody diluted in PBS=FBS over-night at 48C. Following the wash they were incubated withsecondary antibody for 1 h at RT. Finally, they were incu-bated with Hoechst 33342 for 15 min. A parallel culture wasstained only with secondary antibody as negative controland the culture without any antibody was used as a blankcontrol. Primary antibodies were monoclonal anti-nestin(Santa Cruz Biotechnology, Santa Cruz, CA, USA; 1:200),monoclonal anti-GFAP (Sigma, 1:250), monoclonal antitu-bulin b-III (Sigma, 1:250), monoclonal anti-GFAP (Sigma,1:250), monoclonal anti-NFM (Abcam, Cambridge, MA,1:100), monoclonal anti-p75NTR (Abcam, 1:100) monoclonalanti-SMA (Abcam, 1:200), and monoclonal anti-tubulin b-III(Sigma, 1:250). Secondary antibodies were Alexa Fluor� 594
330 ZHAO ET AL.
goat anti-mouse IgG (HþL) (Invitrogen, 1:500). The imageswere captured by a DS Camera Control Unit DS-U2 (Nikon,Melville, NY, USA) and processed by the NIS-Elements im-aging software (Nikon).
Differentiation assay
The differentiation of SKP spheres was described before(Zhao et al., 2009). Intact neurospheres were introduced intopoly-D-lysine (0.1 mg=mL)=laminin (0.02 mg=mL)-coatedfour-well chamber slides (Nunc, Rochester, NY, USA) andincubated with basic medium plus 1–2% FBS overnight tofacilitate cell attachment. On the next day the medium wasreplaced by differentiation medium (DMEM=F12þB27þN2þGlutamine). The medium was changed every 3 days byremoving half of the old medium and adding the samevolume of fresh medium with 2� growth factors and sup-plements. The cultures were kept for 1–2 weeks and thensubject to immunocytochemistry.
RNA isolation and amplification
Total RNA was extracted by using an AllPrep DNA=RNA mini kit (Qiagen, Valencia, CA, USA) following themanufacturer’s instructions. The quality and quantity of totalRNA were measured by NanoDrop Spectrophotometer(Thermo Fisher Scientific Inc., Wilmington, DE, USA). Thetotal high-quality RNA was applied to WT-Ovation PicoRNA amplification system (NuGEN, San Carlos, CA, USA)for reverse transcription and cDNA amplification. The inputamount of RNA was 5 ng and produced several microgramsof amplified cDNA (acDNA). The acDNA was purified byMicro Bio-Spin 30 Columns in RNase-Free Tris (Bio-RadLaboratories, Hercules, CA, USA). The purified acDNA wasaliquoted into 1 mg per vial and stored at �808C.
Reference RNA (Ref RNA) preparation
The reference RNA sample was created by isolating totalRNA from a large representation of nonreproductive andreproductive tissues across different developmental stages(Whitworth et al., 2004, 2005). The tissue RNA was extractedby using RNA Stat 60 protocol (Tel-Test, Friendswood, TX,USA) from a wide range of tissues. The total RNA of non-reproductive and reproductive tissues was mixed to a finalratio of 1:1. Then Ref RNA was reverse transcribed bySuperScript III First-Strand Synthesis System for RT-PCR(Invitrogen). After terminating reactions, the synthesizedcDNA was purified by Micro Bio-Spin 30 Columns in RNase-Free Tris. The purified cDNA was divided into 1mg per vialand stored at �808C.
cDNA microarray preparation
The EST-based cDNA microarray platform was estab-lished at University of Missouri–Columbia (Whitworth et al.,2005). The general information of EST clones can be browsedat the Website: http:==genome.rnet.missouri.edu=Swine=.
Labeling and hybridization
The starting amount of purified Ref cDNA or acDNAsample to be labeled and hybridized was 1mg. To determinethe effect of both amplification and dye-to-dye labeling an
initial dye-swap experiment was performed on amplified andunamplified Ref cDNA. Initially, unamplified Ref cDNA waslabeled Cy3 and the amplified Ref cDNA was labeled withCy5. This labeling pattern was then reversed (swapped) for atotal of four replicates. The dye-swap experiment showed nodifference between amplified or unamplified Ref cDNA andno effect of labeling with Cy3 or Cy5. Once this was deter-mined the sample RNA was always amplified and labeledwith Cy5 and the Ref cDNA was always labeled with Cy3 forthe following experiments.
The labeling kits used for this experiment include ULYSISAlexa Fluor 647 Nucleic Acid Labeling (Cy5) and ULYSISAlexa Fluor 546 Nucleic Acid Labeling (Cy3) (Invitrogen).Briefly, Ref cDNA and acDNA were fragmented by incuba-tion with DNase I at 378C for 15 min. Fragmented cDNA waslabeled with Cy3 or Cy5 and purified using KREA pure dyeremoval purification columns (Kreatech Biotechnology,Amsterdam, The Netherlands). Absorbance was then cap-tured at 260, 280, 550, and 650 nm to determine cDNA anddye concentration and also to calculate the degree of labeling(DoL) for Cy3 and Cy5. These measurements were all per-formed using a NanoDrop Spectrophotometer, and calcula-tions were performed on the following Website (http:==www.kreatech.com=Default.aspx?tabid¼ 411). All DoLcalculations fell within the recommended range of 1–3.6%.Cy5-labeled acDNA from the experimental samples andCy3-labeled Ref cDNA were then combined into one tube,dried using the Centrivap concentrator system, and re-suspended in hybridization buffer (50% formamide, 0.1%SDS, 5�SSC). Poly A (20-mers, Integrated DNA Technolo-gies, Coralville, IA, USA) was also added to the hybridiza-tion buffer to prevent binding of the poly A region to the 30
cDNAs on the microarray. Samples were denatured at 958Cfor 3 min, cooled to RT, and subsequently applied from oneend of the microarray slide under a Lifter Slip (Erie ScientificCompany, Portsmouth, NH, USA). Microarrays were incu-bated in a shake-and-bake hybridization oven at 428C for16 h with gentle shaking.
Microarray replicates
Each biological replicate consisted of RNA from 1�105
cells of SKP spheres or neurospheres. Each biological repli-cate was analyzed on two microarrays for technicalreplication, resulting in three biological replicates and twotechnical replicates, that is, six microarrays measurements=treatments.
Wash and scan arrays
After hybridization, the arrays were sequentially washedby washing solution I (2�SSC=0.1% SDS) twice, washingsolution II (0.1�SSC=0.1% SDS) once and washing solutionIII (0.1�SSC). Each wash was performed on a shaker for4 min and covered with foil to avoid light. The slides werethen transferred into 95% ethanol immediately and dried bycentrifugation at 1500 rpm for 5 min. The arrays were scan-ned by GenePix 4000B (Molecular Devices, Sunnyvale, CA,USA). The PMTs for wave lengths 532 and 653 were ap-propriately adjusted to ensure that the count ratio of Cy3 andCy5 is 1.0. For every slide, the image was processed byGenePix Pro 4.1 (Molecular Devices) to assess the spot quality.The gene list was loaded onto the images and poor-quality
DISTINCT ‘‘STEMNESS’’ OF PORCINE SKP SPHERES AND NEUROSPHERES 331
spots (smeared or saturated) were removed manually. Thenthe raw results files were generated as input data for furtheranalysis.
Data analysis by GeneSpring GX 7.3.1
The raw result files were loaded into GeneSpring GX 7.3.1(Agilent Technologies, Santa Clara, CA, USA). The measure-ments were filtered to remove genes whose raw intensitieswere very close to background and prone to producing er-roneous results. All slides were Lowess normalized per spotand per chip. One-way analysis of variance (ANOVA) wasperformed by using a parametric test with variances notassumed equal (Welch t-test) and false discovery rate cutoffof 0.05 with Benjamini and Hochberg multiple correctiontest. The condition tree was created based on global geneexpression of SKP spheres and neurospheres. The gene on-tology (GO) terms can be generated by GeneSpring GX 7.3.1when connecting to a local annotation database. In addition,molecular signatures of SKP spheres and neurospheres wereenriched by filtering out the genes of expression levels withand equal to or greater than twofold change compared withRef cDNA.
Database for annotation, visualization and integrateddiscovery (DAVID) analysis
The online DAVID version 2008 was employed to performfunctional annotation analysis (Huang da et al., 2009). Theenriched gene lists and differentially expressed gene listswere submitted and converted into DAVID Gene IDs. Sub-sequently, the uploaded DAVID lists were subjected tofunctional annotation clustering, which uses fuzzy clusteringby measuring the relationships among the annotation termson the basis of the degree of their coassociation with geneswithin the user’s list to cluster somewhat heterogeneous, yethighly similar annotation into functional annotation groups.A higher enriched score indicates that the gene members inthe groups are involved in more important roles, which canbe visualized by a 2D view tool. In addition, the identifiedKEGG pathway (http:==www.genome.jp=kegg=pathway.html) can be found in functional annotation tables.
Unigene annotation of microarray
Sequences passing initial quality assessment were clus-tered based on a 0.95 sequence homology criteria to producea project unigene set. The longest member of each clusterwas chosen to represent the cluster. The annotation associ-ated with each cluster is based on a multilevel strategy thatinvolves multiple searches of several reference databases.The databases were searched in the order Human ReferenceSequences (HumRefSeq), Vertebrate Reference Sequences(VertRefSeq), Unigene, and GenBank EST (GBEST), and thenonredundant nucleotide (NR) database from GenBank. Theresulting BLASTN score from each database search, in turn,was compared with a threshold score. If the score wasgreater than the threshold, the corresponding annotationfrom the best hit was used as the annotation, and if not, thenthe next database was searched. A threshold value (score) of100 was used when searching HumRefSeq and VertRefSeqwhile a threshold value of 100 (200 for Sus Scrofa hits) wasused when searching the Unigene sequences. The threshold
for searching the GBEST database was 100, whereas that ofNR was 200. If none of these criteria were met, the sequencewas considered to be unique. The resulting annotations wereplaced into a table listing the sequence name, database,BLAST score, E-value, and annotation of each member of theunigene set.
Real-time qPCR validation
Microarray results were verified by real-time qPCR. Eightgenes were selected, which have significantly different ex-pression levels between SKP spheres and neurospheres. Theprimers were synthesized by Integrated DNA Technologiesand shown in Table 7. Real-time qPCR was performed byusing Power SYBR Master Mix in ABI Prism 7500 real-timePCR system following manufacturer’s instructions (AppliedBiosystems, Carlsbad, CA, USA). The expression levels wereanalyzed by the relative standard curve method. Gradientdilutions (1=10�) of Ref cDNA were used to create standardcurves. The housekeeping gene GAPDH was used as a cali-brator gene.
LIF and MEK inhibitor treatments
Passage 2 SKP spheres and neurospheres were treatedwith either 10 ng=mL LIF (Millipore, Billerica, MA, USA) or50 mM MEK inhibitor PD98059 (Cell Signaling Technology,Danvers, MA, USA) in basic medium (see above, Cell isolationand cultures) for 3 days. Thus, in total, there were six differenttreatments: SKP, SKP–LIF, SKP–MEK, NSC, NSC–LIF, andNSC–MEK. Then the treated cells were harvested and totalRNA was extracted by using RNeasy Plus Mini Kit (Qiagen).The first-strand cDNA was synthesized by QuantiTect Re-verse Transcription Kit (Qiagen). Real-time qPCR was per-formed by using iQTM SYBR Green Supermix (Bio-Rad) inMy iQ Single-Color Real-time PCR Detection System (Bio-Rad). The strategy for data analysis was the same as de-scribed above. The target genes were focused on ‘‘stemness’’genes (NANOG, SOX2, STAT3, and SOX9) and lineagespecific marker genes (NESTIN, GFAP, p75NTR, and Tubulinb-III). The primers of these genes can be referred to ourprevious data (Zhao et al., 2009). Real-time qPCR data wereobtained from three independent biological replicates andanalyzed by one-way ANOVA.
Results
Characterization of SKP spheres and neurospheres
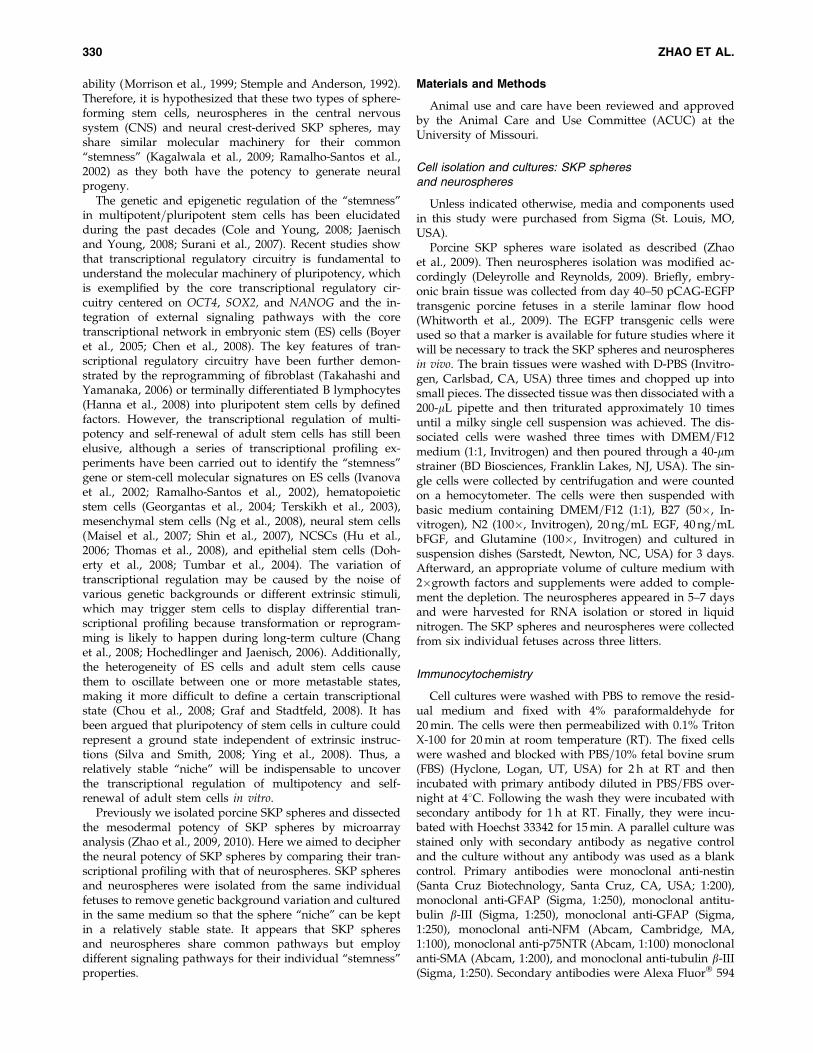
The SKP spheres and neurospheres appeared after 5–7days of serum-free selection. They shared similar morphol-ogy and kept floating in early passages (Fig. 1A–C). Afterattachment of neurospheres caused by withdrawal of growthfactors, neural progeny appeared in a few days (Fig. 1D).Furthermore, GFAP-positive (glial marker) and tubulin b-III-positive (neuron specific marker) cells were observed after 1week’s differentiation (Fig. 1E–F), indicating that porcineneurospheres have the characteristics similar to rodent neu-ral stem cells. For SKP spheres, we observed tubulin b-IIIþ,GFAPþ, neurofilament F (NFM)þ and p75NTRþ cells upondifferentiation (Fig. 1G–J), showing the neural potency ofSKP spheres. In addition, smooth muscle actin (SMA)þ
progeny also appeared in differentiation cultures (Fig. 1K),implying that porcine SKP sphere can differentiate into both
332 ZHAO ET AL.

neural and mesodermal progeny in vitro (Zhao et al., 2009).Thus we demonstrate that both SKP spheres and neuro-spheres can produce multiple-lineage progeny and aremultipotent in vitro.
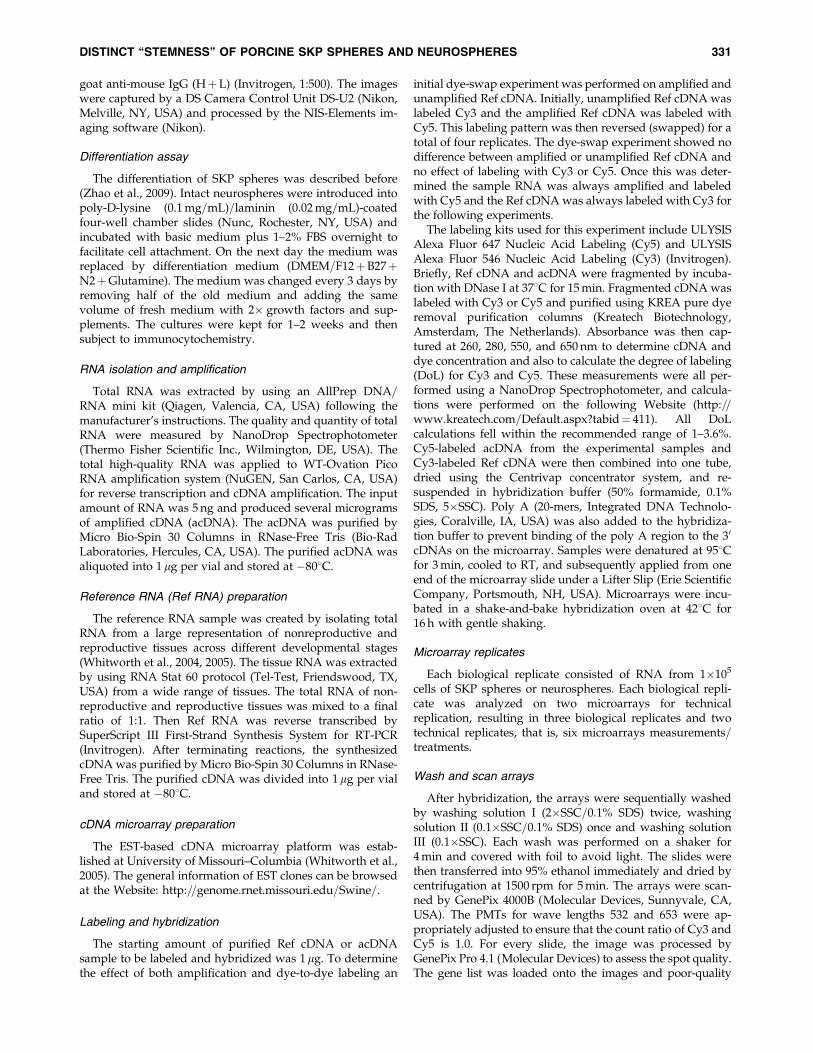
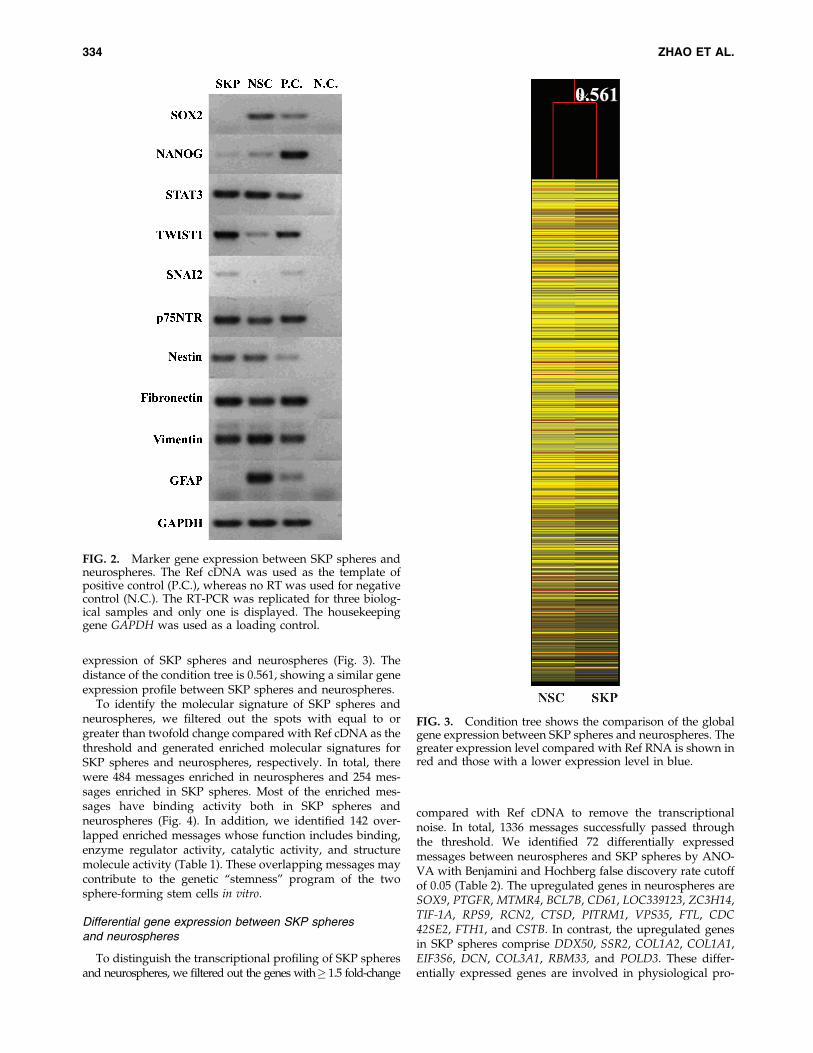
We further compared the expression of specific markergenes in these sphere-forming stem cells. Both SKP spheresand neurospheres expressed transcripts for NANOG, STAT3,TWIST1, p75NTR, nestin, fibronectin, and vimentin (Fig. 2).However, neurospheres expressed high levels of SOX2 (aspecific marker for neural stem cells (Suh et al., 2007)). TheGFAP was exclusively expressed in neurospheres (Doetschet al., 1999), whereas SNAI2 was specific for SKP spheres.These data show SKP spheres and neurospheres share a
similar marker gene expression profile but possess theirspecific transcriptional states.
Molecular signatures of SKP spheresand neurospheres
First, we normalized and filtered the scanned arrays usingGeneSpring GX 7.3.1. We then chose the spots with intensitybetween 1500 and 60,000 in the raw and control data as thereliable data. As we used Cy3 to label the Ref cDNA and Cy5to label samples, the normalized data should be the relativegene expression levels compared with those of Ref cDNA.Thus we generated a condition tree based on global gene
FIG. 1. Characterization of SKP spheres and neurospheres in vitro. Typical SKP spheres (A) and neurospheres (B) under aphase contrast microscope, and GFP neurospheres under a fluorescence microscope (C) are shown. After the induction ofdifferentiation, neuron-like and glia-like progeny (D) appeared. (E) The overlay of anti-GFAP, GFP, and Hoechst 33342 stainof a typical colony from neurosphere differentiated progeny. The yellow cells show the GFAP-positive glial progeny. (F) Themerged image of anit-tubulin b-III, GFP, and Hoechst 33342 stain of neurosphere-derived progeny. The light yellow indicatesthe tubulin b-III-positive cells. In addition, the multipotency of SKP spheres is displayed (G–K). SKP sphere-derived progenywere immunostained with monoclonal antibodies specific for tubulin b-III (G), GFAP (H), NFM (I), p75NTR (J), and SMA(K), whereas the nuclei were stained by Hoechst 33342. Scale bars, 10 mm (G); 50mm (A, E, H–K); 200mm (B–D, F).
DISTINCT ‘‘STEMNESS’’ OF PORCINE SKP SPHERES AND NEUROSPHERES 333
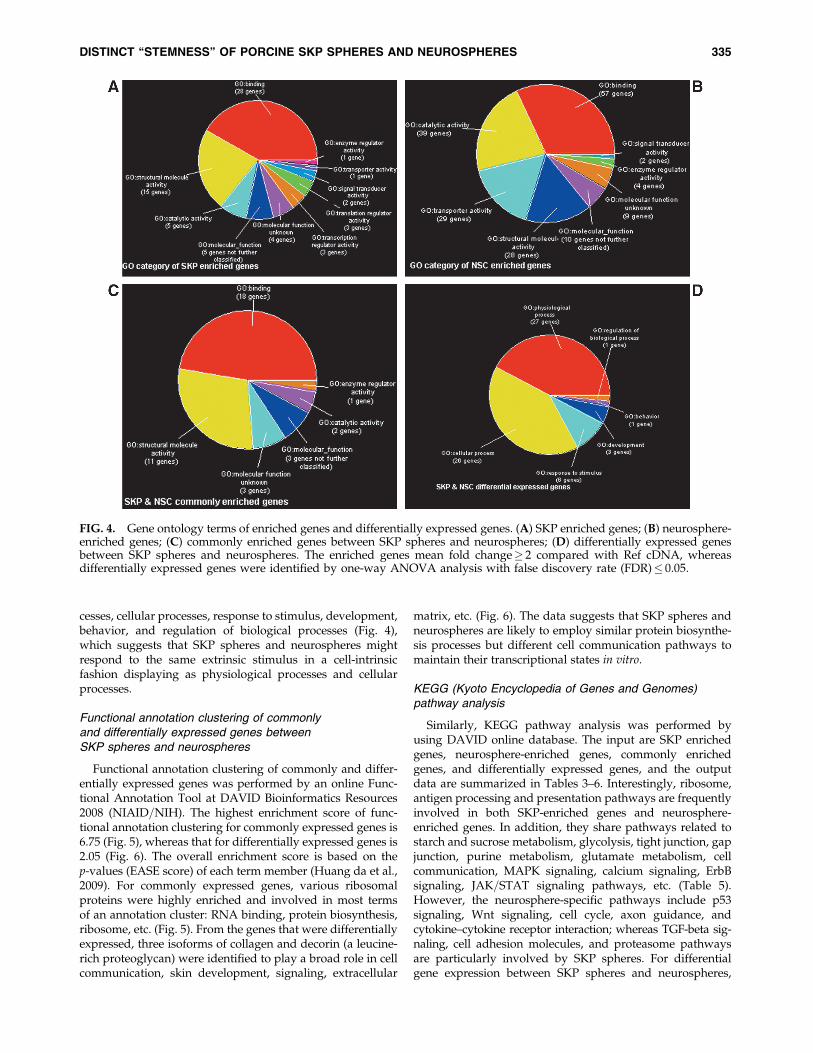
expression of SKP spheres and neurospheres (Fig. 3). Thedistance of the condition tree is 0.561, showing a similar geneexpression profile between SKP spheres and neurospheres.
To identify the molecular signature of SKP spheres andneurospheres, we filtered out the spots with equal to orgreater than twofold change compared with Ref cDNA as thethreshold and generated enriched molecular signatures forSKP spheres and neurospheres, respectively. In total, therewere 484 messages enriched in neurospheres and 254 mes-sages enriched in SKP spheres. Most of the enriched mes-sages have binding activity both in SKP spheres andneurospheres (Fig. 4). In addition, we identified 142 over-lapped enriched messages whose function includes binding,enzyme regulator activity, catalytic activity, and structuremolecule activity (Table 1). These overlapping messages maycontribute to the genetic ‘‘stemness’’ program of the twosphere-forming stem cells in vitro.
Differential gene expression between SKP spheresand neurospheres
To distinguish the transcriptional profiling of SKP spheresand neurospheres, we filtered out the genes with� 1.5 fold-change
compared with Ref cDNA to remove the transcriptionalnoise. In total, 1336 messages successfully passed throughthe threshold. We identified 72 differentially expressedmessages between neurospheres and SKP spheres by ANO-VA with Benjamini and Hochberg false discovery rate cutoffof 0.05 (Table 2). The upregulated genes in neurospheres areSOX9, PTGFR, MTMR4, BCL7B, CD61, LOC339123, ZC3H14,TIF-1A, RPS9, RCN2, CTSD, PITRM1, VPS35, FTL, CDC42SE2, FTH1, and CSTB. In contrast, the upregulated genesin SKP spheres comprise DDX50, SSR2, COL1A2, COL1A1,EIF3S6, DCN, COL3A1, RBM33, and POLD3. These differ-entially expressed genes are involved in physiological pro-
FIG. 2. Marker gene expression between SKP spheres andneurospheres. The Ref cDNA was used as the template ofpositive control (P.C.), whereas no RT was used for negativecontrol (N.C.). The RT-PCR was replicated for three biolog-ical samples and only one is displayed. The housekeepinggene GAPDH was used as a loading control.
FIG. 3. Condition tree shows the comparison of the globalgene expression between SKP spheres and neurospheres. Thegreater expression level compared with Ref RNA is shown inred and those with a lower expression level in blue.
334 ZHAO ET AL.
cesses, cellular processes, response to stimulus, development,behavior, and regulation of biological processes (Fig. 4),which suggests that SKP spheres and neurospheres mightrespond to the same extrinsic stimulus in a cell-intrinsicfashion displaying as physiological processes and cellularprocesses.
Functional annotation clustering of commonlyand differentially expressed genes betweenSKP spheres and neurospheres
Functional annotation clustering of commonly and differ-entially expressed genes was performed by an online Func-tional Annotation Tool at DAVID Bioinformatics Resources2008 (NIAID=NIH). The highest enrichment score of func-tional annotation clustering for commonly expressed genes is6.75 (Fig. 5), whereas that for differentially expressed genes is2.05 (Fig. 6). The overall enrichment score is based on thep-values (EASE score) of each term member (Huang da et al.,2009). For commonly expressed genes, various ribosomalproteins were highly enriched and involved in most termsof an annotation cluster: RNA binding, protein biosynthesis,ribosome, etc. (Fig. 5). From the genes that were differentiallyexpressed, three isoforms of collagen and decorin (a leucine-rich proteoglycan) were identified to play a broad role in cellcommunication, skin development, signaling, extracellular
matrix, etc. (Fig. 6). The data suggests that SKP spheres andneurospheres are likely to employ similar protein biosynthe-sis processes but different cell communication pathways tomaintain their transcriptional states in vitro.
KEGG (Kyoto Encyclopedia of Genes and Genomes)pathway analysis
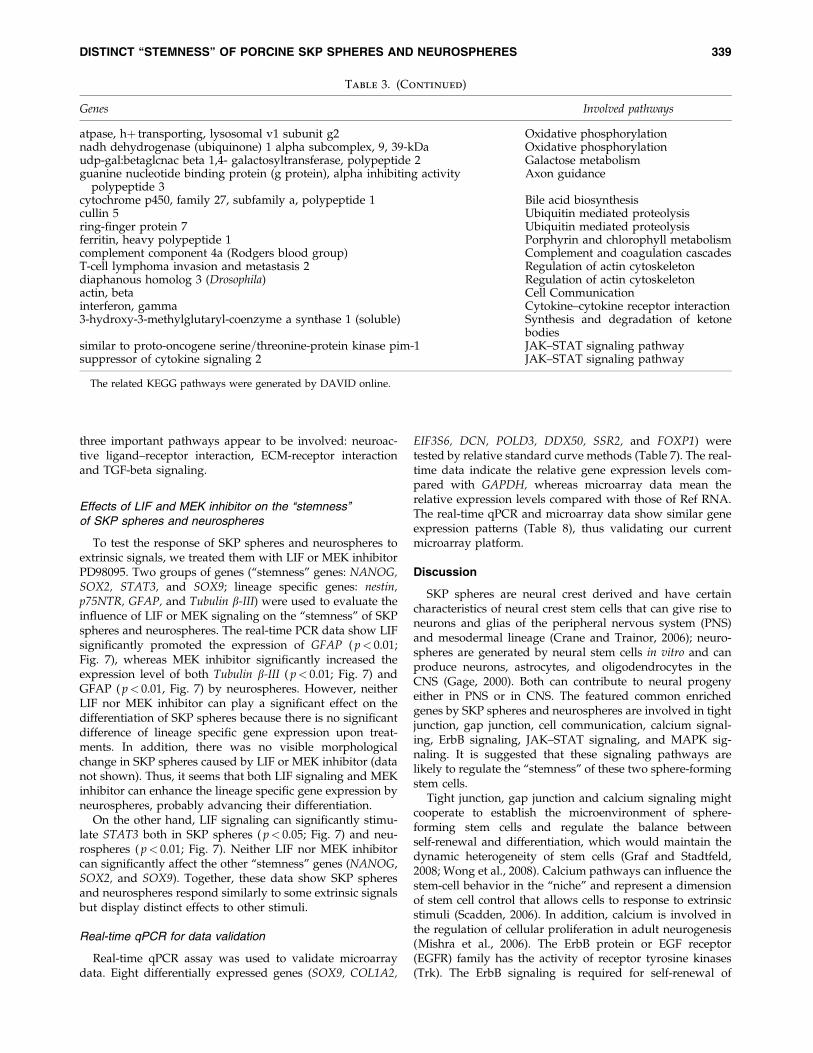
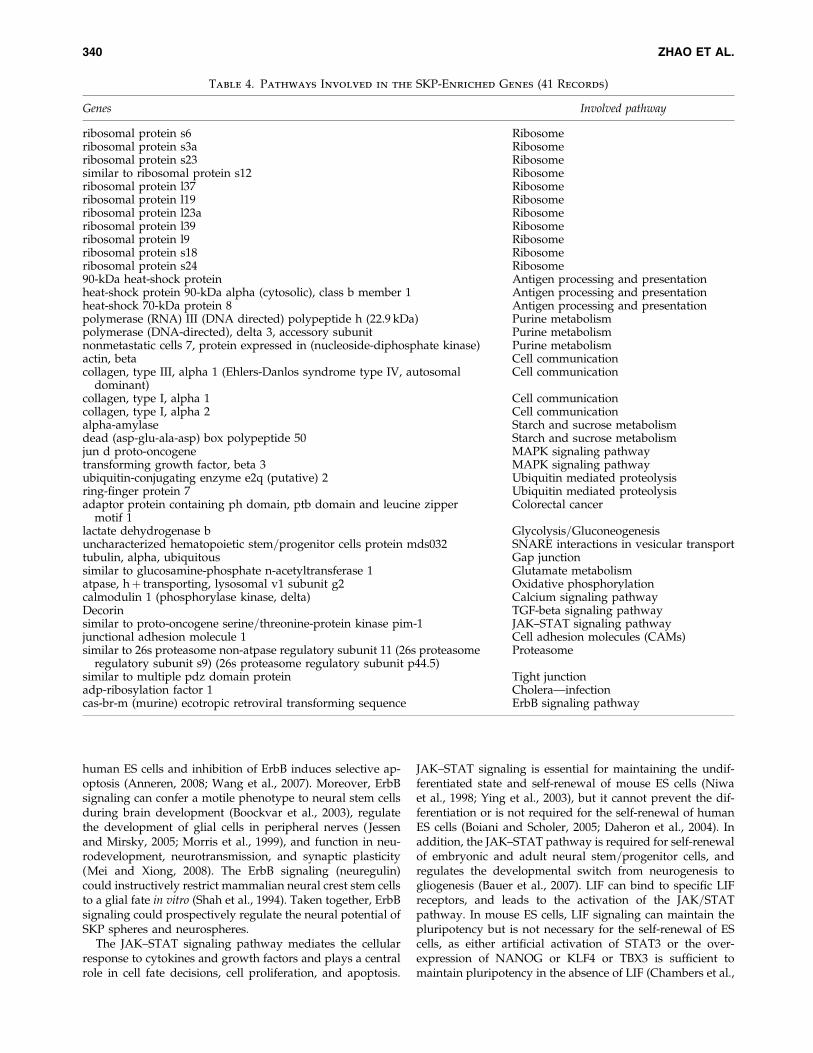
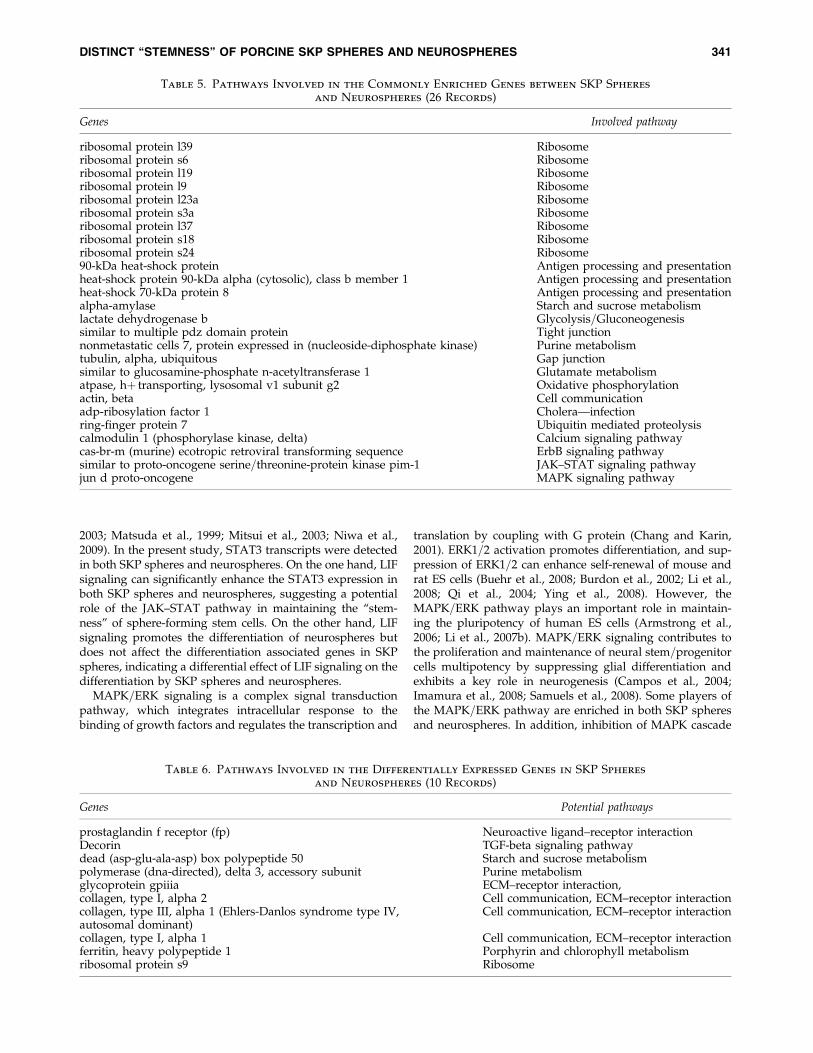
Similarly, KEGG pathway analysis was performed byusing DAVID online database. The input are SKP enrichedgenes, neurosphere-enriched genes, commonly enrichedgenes, and differentially expressed genes, and the outputdata are summarized in Tables 3–6. Interestingly, ribosome,antigen processing and presentation pathways are frequentlyinvolved in both SKP-enriched genes and neurosphere-enriched genes. In addition, they share pathways related tostarch and sucrose metabolism, glycolysis, tight junction, gapjunction, purine metabolism, glutamate metabolism, cellcommunication, MAPK signaling, calcium signaling, ErbBsignaling, JAK=STAT signaling pathways, etc. (Table 5).However, the neurosphere-specific pathways include p53signaling, Wnt signaling, cell cycle, axon guidance, andcytokine–cytokine receptor interaction; whereas TGF-beta sig-naling, cell adhesion molecules, and proteasome pathwaysare particularly involved by SKP spheres. For differentialgene expression between SKP spheres and neurospheres,
FIG. 4. Gene ontology terms of enriched genes and differentially expressed genes. (A) SKP enriched genes; (B) neurosphere-enriched genes; (C) commonly enriched genes between SKP spheres and neurospheres; (D) differentially expressed genesbetween SKP spheres and neurospheres. The enriched genes mean fold change� 2 compared with Ref cDNA, whereasdifferentially expressed genes were identified by one-way ANOVA analysis with false discovery rate (FDR)� 0.05.
DISTINCT ‘‘STEMNESS’’ OF PORCINE SKP SPHERES AND NEUROSPHERES 335
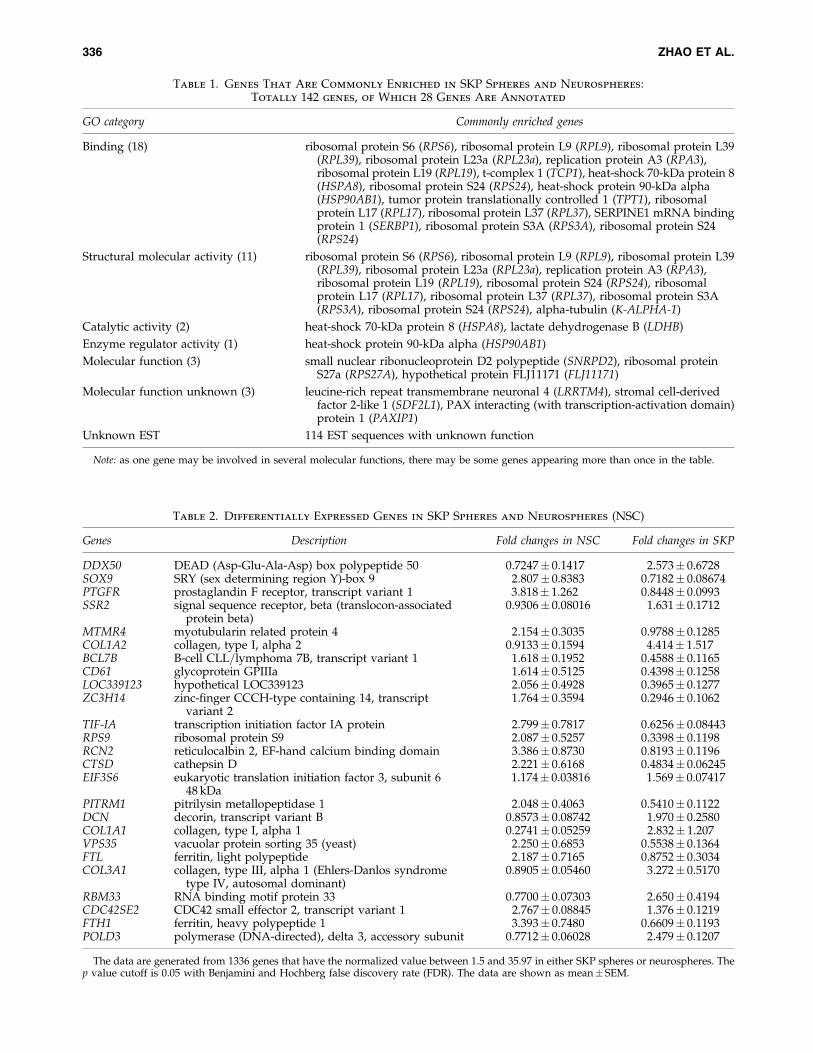
Table 1. Genes That Are Commonly Enriched in SKP Spheres and Neurospheres:
Totally 142 genes, of Which 28 Genes Are Annotated
GO category Commonly enriched genes
Binding (18) ribosomal protein S6 (RPS6), ribosomal protein L9 (RPL9), ribosomal protein L39(RPL39), ribosomal protein L23a (RPL23a), replication protein A3 (RPA3),ribosomal protein L19 (RPL19), t-complex 1 (TCP1), heat-shock 70-kDa protein 8(HSPA8), ribosomal protein S24 (RPS24), heat-shock protein 90-kDa alpha(HSP90AB1), tumor protein translationally controlled 1 (TPT1), ribosomalprotein L17 (RPL17), ribosomal protein L37 (RPL37), SERPINE1 mRNA bindingprotein 1 (SERBP1), ribosomal protein S3A (RPS3A), ribosomal protein S24(RPS24)
Structural molecular activity (11) ribosomal protein S6 (RPS6), ribosomal protein L9 (RPL9), ribosomal protein L39(RPL39), ribosomal protein L23a (RPL23a), replication protein A3 (RPA3),ribosomal protein L19 (RPL19), ribosomal protein S24 (RPS24), ribosomalprotein L17 (RPL17), ribosomal protein L37 (RPL37), ribosomal protein S3A(RPS3A), ribosomal protein S24 (RPS24), alpha-tubulin (K-ALPHA-1)
Catalytic activity (2) heat-shock 70-kDa protein 8 (HSPA8), lactate dehydrogenase B (LDHB)
Enzyme regulator activity (1) heat-shock protein 90-kDa alpha (HSP90AB1)
Molecular function (3) small nuclear ribonucleoprotein D2 polypeptide (SNRPD2), ribosomal proteinS27a (RPS27A), hypothetical protein FLJ11171 (FLJ11171)
Molecular function unknown (3) leucine-rich repeat transmembrane neuronal 4 (LRRTM4), stromal cell-derivedfactor 2-like 1 (SDF2L1), PAX interacting (with transcription-activation domain)protein 1 (PAXIP1)
Unknown EST 114 EST sequences with unknown function
Note: as one gene may be involved in several molecular functions, there may be some genes appearing more than once in the table.
Table 2. Differentially Expressed Genes in SKP Spheres and Neurospheres (NSC)
Genes Description Fold changes in NSC Fold changes in SKP
DDX50 DEAD (Asp-Glu-Ala-Asp) box polypeptide 50 0.7247� 0.1417 2.573� 0.6728SOX9 SRY (sex determining region Y)-box 9 2.807� 0.8383 0.7182� 0.08674PTGFR prostaglandin F receptor, transcript variant 1 3.818� 1.262 0.8448� 0.0993SSR2 signal sequence receptor, beta (translocon-associated
protein beta)0.9306� 0.08016 1.631� 0.1712
MTMR4 myotubularin related protein 4 2.154� 0.3035 0.9788� 0.1285COL1A2 collagen, type I, alpha 2 0.9133� 0.1594 4.414� 1.517BCL7B B-cell CLL=lymphoma 7B, transcript variant 1 1.618� 0.1952 0.4588� 0.1165CD61 glycoprotein GPIIIa 1.614� 0.5125 0.4398� 0.1258LOC339123 hypothetical LOC339123 2.056� 0.4928 0.3965� 0.1277ZC3H14 zinc-finger CCCH-type containing 14, transcript
variant 21.764� 0.3594 0.2946� 0.1062
TIF-IA transcription initiation factor IA protein 2.799� 0.7817 0.6256� 0.08443RPS9 ribosomal protein S9 2.087� 0.5257 0.3398� 0.1198RCN2 reticulocalbin 2, EF-hand calcium binding domain 3.386� 0.8730 0.8193� 0.1196CTSD cathepsin D 2.221� 0.6168 0.4834� 0.06245EIF3S6 eukaryotic translation initiation factor 3, subunit 6
48 kDa1.174� 0.03816 1.569� 0.07417
PITRM1 pitrilysin metallopeptidase 1 2.048� 0.4063 0.5410� 0.1122DCN decorin, transcript variant B 0.8573� 0.08742 1.970� 0.2580COL1A1 collagen, type I, alpha 1 0.2741� 0.05259 2.832� 1.207VPS35 vacuolar protein sorting 35 (yeast) 2.250� 0.6853 0.5538� 0.1364FTL ferritin, light polypeptide 2.187� 0.7165 0.8752� 0.3034COL3A1 collagen, type III, alpha 1 (Ehlers-Danlos syndrome
type IV, autosomal dominant)0.8905� 0.05460 3.272� 0.5170
RBM33 RNA binding motif protein 33 0.7700� 0.07303 2.650� 0.4194CDC42SE2 CDC42 small effector 2, transcript variant 1 2.767� 0.08845 1.376� 0.1219FTH1 ferritin, heavy polypeptide 1 3.393� 0.7480 0.6609� 0.1193POLD3 polymerase (DNA-directed), delta 3, accessory subunit 0.7712� 0.06028 2.479� 0.1207
The data are generated from 1336 genes that have the normalized value between 1.5 and 35.97 in either SKP spheres or neurospheres. Thep value cutoff is 0.05 with Benjamini and Hochberg false discovery rate (FDR). The data are shown as mean� SEM.
336 ZHAO ET AL.
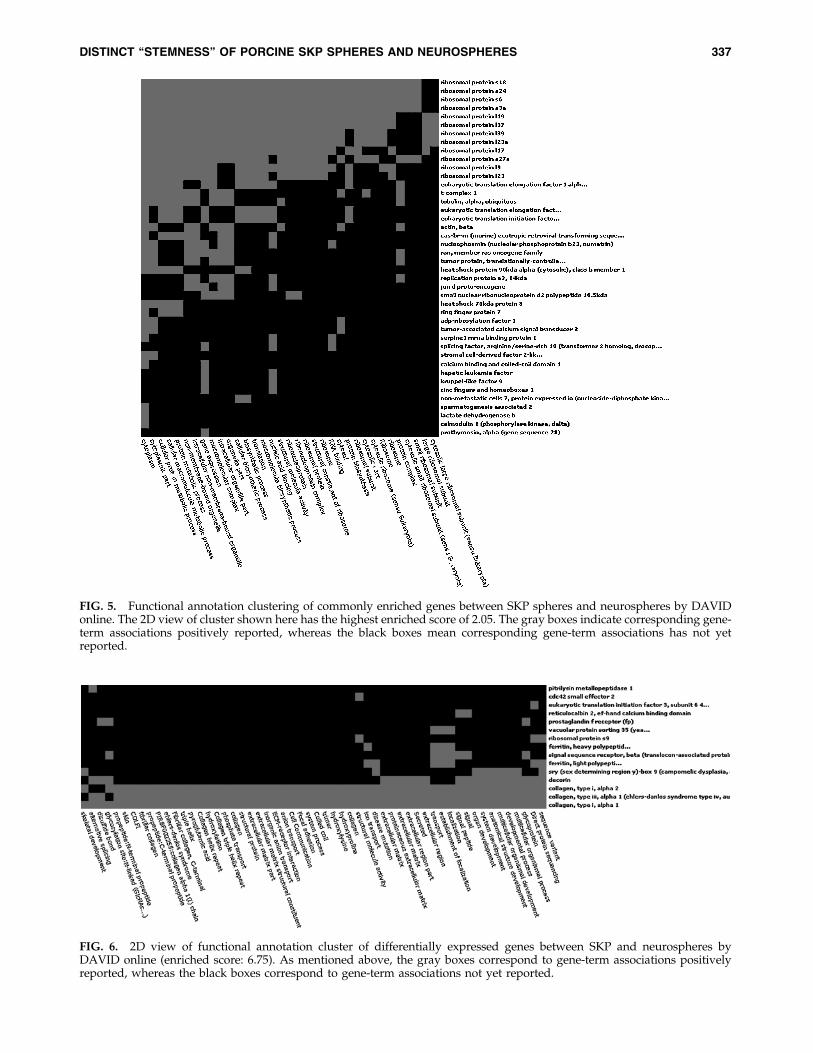
FIG. 5. Functional annotation clustering of commonly enriched genes between SKP spheres and neurospheres by DAVIDonline. The 2D view of cluster shown here has the highest enriched score of 2.05. The gray boxes indicate corresponding gene-term associations positively reported, whereas the black boxes mean corresponding gene-term associations has not yetreported.
FIG. 6. 2D view of functional annotation cluster of differentially expressed genes between SKP and neurospheres byDAVID online (enriched score: 6.75). As mentioned above, the gray boxes correspond to gene-term associations positivelyreported, whereas the black boxes correspond to gene-term associations not yet reported.
DISTINCT ‘‘STEMNESS’’ OF PORCINE SKP SPHERES AND NEUROSPHERES 337
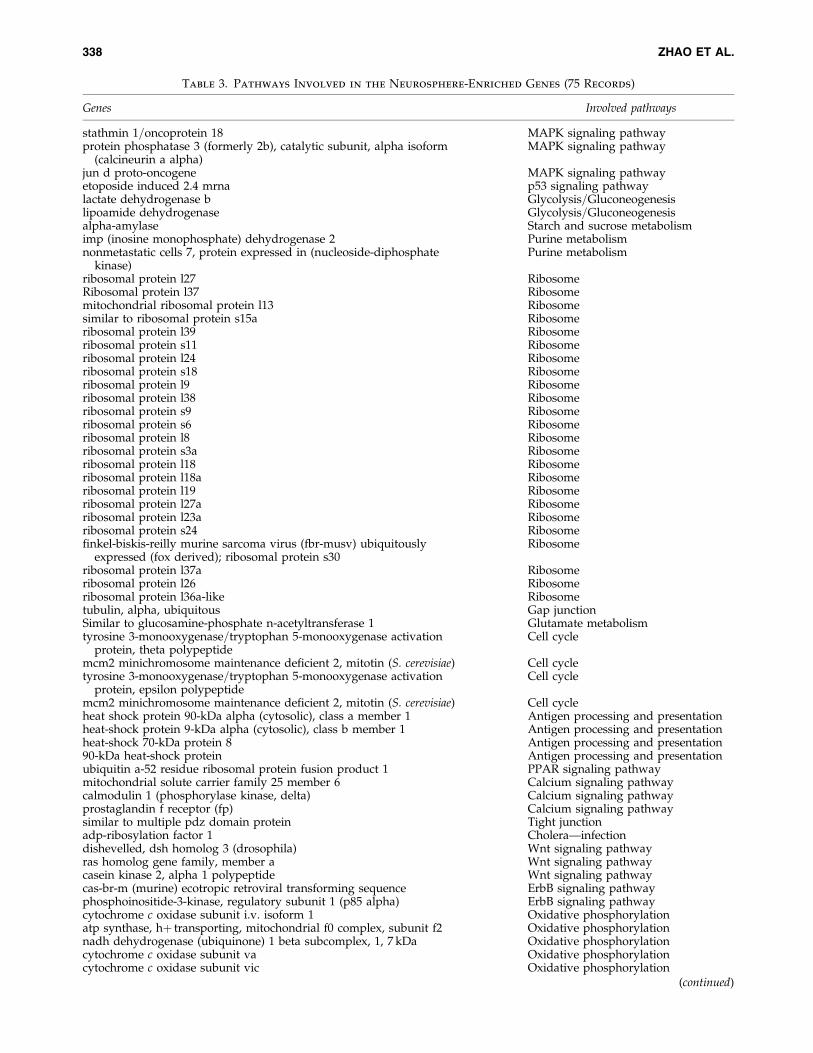
Table 3. Pathways Involved in the Neurosphere-Enriched Genes (75 Records)
Genes Involved pathways
stathmin 1=oncoprotein 18 MAPK signaling pathwayprotein phosphatase 3 (formerly 2b), catalytic subunit, alpha isoform
(calcineurin a alpha)MAPK signaling pathway
jun d proto-oncogene MAPK signaling pathwayetoposide induced 2.4 mrna p53 signaling pathwaylactate dehydrogenase b Glycolysis=Gluconeogenesislipoamide dehydrogenase Glycolysis=Gluconeogenesisalpha-amylase Starch and sucrose metabolismimp (inosine monophosphate) dehydrogenase 2 Purine metabolismnonmetastatic cells 7, protein expressed in (nucleoside-diphosphate
kinase)Purine metabolism
ribosomal protein l27 RibosomeRibosomal protein l37 Ribosomemitochondrial ribosomal protein l13 Ribosomesimilar to ribosomal protein s15a Ribosomeribosomal protein l39 Ribosomeribosomal protein s11 Ribosomeribosomal protein l24 Ribosomeribosomal protein s18 Ribosomeribosomal protein l9 Ribosomeribosomal protein l38 Ribosomeribosomal protein s9 Ribosomeribosomal protein s6 Ribosomeribosomal protein l8 Ribosomeribosomal protein s3a Ribosomeribosomal protein l18 Ribosomeribosomal protein l18a Ribosomeribosomal protein l19 Ribosomeribosomal protein l27a Ribosomeribosomal protein l23a Ribosomeribosomal protein s24 Ribosomefinkel-biskis-reilly murine sarcoma virus (fbr-musv) ubiquitously
expressed (fox derived); ribosomal protein s30Ribosome
ribosomal protein l37a Ribosomeribosomal protein l26 Ribosomeribosomal protein l36a-like Ribosometubulin, alpha, ubiquitous Gap junctionSimilar to glucosamine-phosphate n-acetyltransferase 1 Glutamate metabolismtyrosine 3-monooxygenase=tryptophan 5-monooxygenase activation
protein, theta polypeptideCell cycle
mcm2 minichromosome maintenance deficient 2, mitotin (S. cerevisiae) Cell cycletyrosine 3-monooxygenase=tryptophan 5-monooxygenase activation
protein, epsilon polypeptideCell cycle
mcm2 minichromosome maintenance deficient 2, mitotin (S. cerevisiae) Cell cycleheat shock protein 90-kDa alpha (cytosolic), class a member 1 Antigen processing and presentationheat-shock protein 9-kDa alpha (cytosolic), class b member 1 Antigen processing and presentationheat-shock 70-kDa protein 8 Antigen processing and presentation90-kDa heat-shock protein Antigen processing and presentationubiquitin a-52 residue ribosomal protein fusion product 1 PPAR signaling pathwaymitochondrial solute carrier family 25 member 6 Calcium signaling pathwaycalmodulin 1 (phosphorylase kinase, delta) Calcium signaling pathwayprostaglandin f receptor (fp) Calcium signaling pathwaysimilar to multiple pdz domain protein Tight junctionadp-ribosylation factor 1 Cholera—infectiondishevelled, dsh homolog 3 (drosophila) Wnt signaling pathwayras homolog gene family, member a Wnt signaling pathwaycasein kinase 2, alpha 1 polypeptide Wnt signaling pathwaycas-br-m (murine) ecotropic retroviral transforming sequence ErbB signaling pathwayphosphoinositide-3-kinase, regulatory subunit 1 (p85 alpha) ErbB signaling pathwaycytochrome c oxidase subunit i.v. isoform 1 Oxidative phosphorylationatp synthase, hþ transporting, mitochondrial f0 complex, subunit f2 Oxidative phosphorylationnadh dehydrogenase (ubiquinone) 1 beta subcomplex, 1, 7 kDa Oxidative phosphorylationcytochrome c oxidase subunit va Oxidative phosphorylationcytochrome c oxidase subunit vic Oxidative phosphorylation
(continued)
338 ZHAO ET AL.
three important pathways appear to be involved: neuroac-tive ligand–receptor interaction, ECM-receptor interactionand TGF-beta signaling.
Effects of LIF and MEK inhibitor on the ‘‘stemness’’of SKP spheres and neurospheres
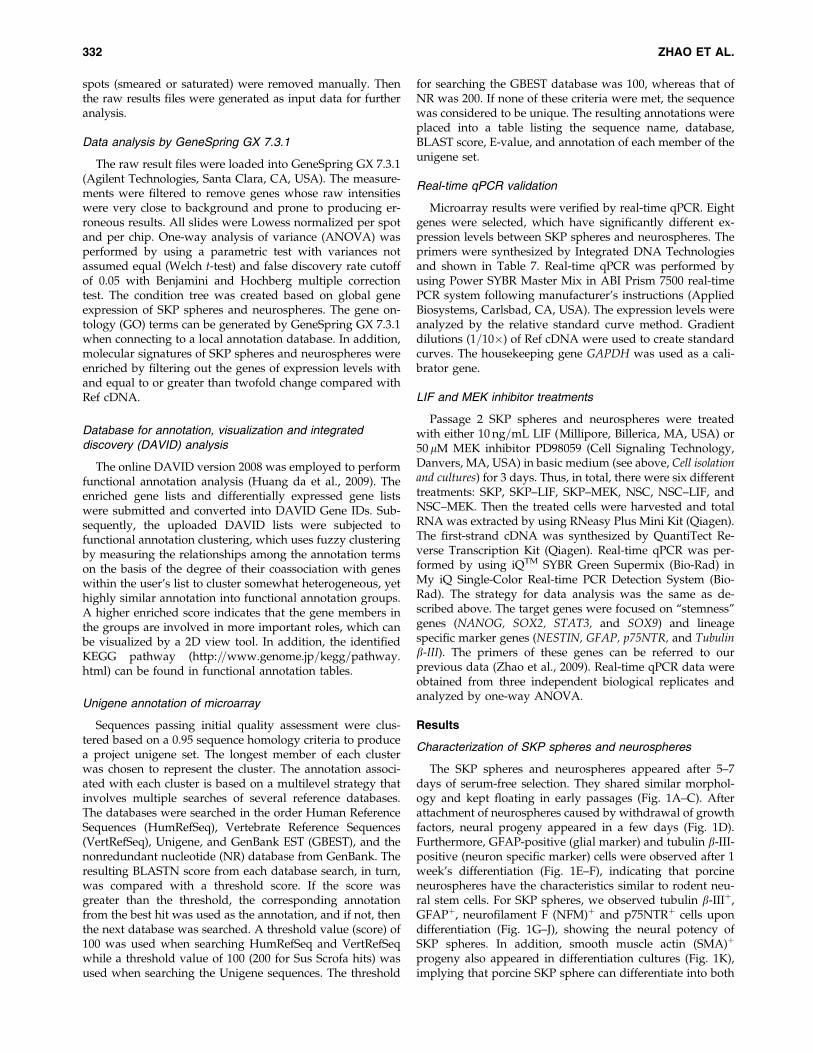
To test the response of SKP spheres and neurospheres toextrinsic signals, we treated them with LIF or MEK inhibitorPD98095. Two groups of genes (‘‘stemness’’ genes: NANOG,SOX2, STAT3, and SOX9; lineage specific genes: nestin,p75NTR, GFAP, and Tubulin b-III) were used to evaluate theinfluence of LIF or MEK signaling on the ‘‘stemness’’ of SKPspheres and neurospheres. The real-time PCR data show LIFsignificantly promoted the expression of GFAP ( p< 0.01;Fig. 7), whereas MEK inhibitor significantly increased theexpression level of both Tubulin b-III ( p< 0.01; Fig. 7) andGFAP ( p< 0.01, Fig. 7) by neurospheres. However, neitherLIF nor MEK inhibitor can play a significant effect on thedifferentiation of SKP spheres because there is no significantdifference of lineage specific gene expression upon treat-ments. In addition, there was no visible morphologicalchange in SKP spheres caused by LIF or MEK inhibitor (datanot shown). Thus, it seems that both LIF signaling and MEKinhibitor can enhance the lineage specific gene expression byneurospheres, probably advancing their differentiation.
On the other hand, LIF signaling can significantly stimu-late STAT3 both in SKP spheres ( p< 0.05; Fig. 7) and neu-rospheres ( p< 0.01; Fig. 7). Neither LIF nor MEK inhibitorcan significantly affect the other ‘‘stemness’’ genes (NANOG,SOX2, and SOX9). Together, these data show SKP spheresand neurospheres respond similarly to some extrinsic signalsbut display distinct effects to other stimuli.
Real-time qPCR for data validation
Real-time qPCR assay was used to validate microarraydata. Eight differentially expressed genes (SOX9, COL1A2,
EIF3S6, DCN, POLD3, DDX50, SSR2, and FOXP1) weretested by relative standard curve methods (Table 7). The real-time data indicate the relative gene expression levels com-pared with GAPDH, whereas microarray data mean therelative expression levels compared with those of Ref RNA.The real-time qPCR and microarray data show similar geneexpression patterns (Table 8), thus validating our currentmicroarray platform.
Discussion
SKP spheres are neural crest derived and have certaincharacteristics of neural crest stem cells that can give rise toneurons and glias of the peripheral nervous system (PNS)and mesodermal lineage (Crane and Trainor, 2006); neuro-spheres are generated by neural stem cells in vitro and canproduce neurons, astrocytes, and oligodendrocytes in theCNS (Gage, 2000). Both can contribute to neural progenyeither in PNS or in CNS. The featured common enrichedgenes by SKP spheres and neurospheres are involved in tightjunction, gap junction, cell communication, calcium signal-ing, ErbB signaling, JAK–STAT signaling, and MAPK sig-naling. It is suggested that these signaling pathways arelikely to regulate the ‘‘stemness’’ of these two sphere-formingstem cells.
Tight junction, gap junction and calcium signaling mightcooperate to establish the microenvironment of sphere-forming stem cells and regulate the balance betweenself-renewal and differentiation, which would maintain thedynamic heterogeneity of stem cells (Graf and Stadtfeld,2008; Wong et al., 2008). Calcium pathways can influence thestem-cell behavior in the ‘‘niche’’ and represent a dimensionof stem cell control that allows cells to response to extrinsicstimuli (Scadden, 2006). In addition, calcium is involved inthe regulation of cellular proliferation in adult neurogenesis(Mishra et al., 2006). The ErbB protein or EGF receptor(EGFR) family has the activity of receptor tyrosine kinases(Trk). The ErbB signaling is required for self-renewal of
Table 3. (Continued)
Genes Involved pathways
atpase, hþ transporting, lysosomal v1 subunit g2 Oxidative phosphorylationnadh dehydrogenase (ubiquinone) 1 alpha subcomplex, 9, 39-kDa Oxidative phosphorylationudp-gal:betaglcnac beta 1,4- galactosyltransferase, polypeptide 2 Galactose metabolismguanine nucleotide binding protein (g protein), alpha inhibiting activity
polypeptide 3Axon guidance
cytochrome p450, family 27, subfamily a, polypeptide 1 Bile acid biosynthesiscullin 5 Ubiquitin mediated proteolysisring-finger protein 7 Ubiquitin mediated proteolysisferritin, heavy polypeptide 1 Porphyrin and chlorophyll metabolismcomplement component 4a (Rodgers blood group) Complement and coagulation cascadesT-cell lymphoma invasion and metastasis 2 Regulation of actin cytoskeletondiaphanous homolog 3 (Drosophila) Regulation of actin cytoskeletonactin, beta Cell Communicationinterferon, gamma Cytokine–cytokine receptor interaction3-hydroxy-3-methylglutaryl-coenzyme a synthase 1 (soluble) Synthesis and degradation of ketone
bodiessimilar to proto-oncogene serine=threonine-protein kinase pim-1 JAK–STAT signaling pathwaysuppressor of cytokine signaling 2 JAK–STAT signaling pathway
The related KEGG pathways were generated by DAVID online.
DISTINCT ‘‘STEMNESS’’ OF PORCINE SKP SPHERES AND NEUROSPHERES 339
human ES cells and inhibition of ErbB induces selective ap-optosis (Anneren, 2008; Wang et al., 2007). Moreover, ErbBsignaling can confer a motile phenotype to neural stem cellsduring brain development (Boockvar et al., 2003), regulatethe development of glial cells in peripheral nerves ( Jessenand Mirsky, 2005; Morris et al., 1999), and function in neu-rodevelopment, neurotransmission, and synaptic plasticity(Mei and Xiong, 2008). The ErbB signaling (neuregulin)could instructively restrict mammalian neural crest stem cellsto a glial fate in vitro (Shah et al., 1994). Taken together, ErbBsignaling could prospectively regulate the neural potential ofSKP spheres and neurospheres.
The JAK–STAT signaling pathway mediates the cellularresponse to cytokines and growth factors and plays a centralrole in cell fate decisions, cell proliferation, and apoptosis.
JAK–STAT signaling is essential for maintaining the undif-ferentiated state and self-renewal of mouse ES cells (Niwaet al., 1998; Ying et al., 2003), but it cannot prevent the dif-ferentiation or is not required for the self-renewal of humanES cells (Boiani and Scholer, 2005; Daheron et al., 2004). Inaddition, the JAK–STAT pathway is required for self-renewalof embryonic and adult neural stem=progenitor cells, andregulates the developmental switch from neurogenesis togliogenesis (Bauer et al., 2007). LIF can bind to specific LIFreceptors, and leads to the activation of the JAK=STATpathway. In mouse ES cells, LIF signaling can maintain thepluripotency but is not necessary for the self-renewal of EScells, as either artificial activation of STAT3 or the over-expression of NANOG or KLF4 or TBX3 is sufficient tomaintain pluripotency in the absence of LIF (Chambers et al.,
Table 4. Pathways Involved in the SKP-Enriched Genes (41 Records)
Genes Involved pathway
ribosomal protein s6 Ribosomeribosomal protein s3a Ribosomeribosomal protein s23 Ribosomesimilar to ribosomal protein s12 Ribosomeribosomal protein l37 Ribosomeribosomal protein l19 Ribosomeribosomal protein l23a Ribosomeribosomal protein l39 Ribosomeribosomal protein l9 Ribosomeribosomal protein s18 Ribosomeribosomal protein s24 Ribosome90-kDa heat-shock protein Antigen processing and presentationheat-shock protein 90-kDa alpha (cytosolic), class b member 1 Antigen processing and presentationheat-shock 70-kDa protein 8 Antigen processing and presentationpolymerase (RNA) III (DNA directed) polypeptide h (22.9 kDa) Purine metabolismpolymerase (DNA-directed), delta 3, accessory subunit Purine metabolismnonmetastatic cells 7, protein expressed in (nucleoside-diphosphate kinase) Purine metabolismactin, beta Cell communicationcollagen, type III, alpha 1 (Ehlers-Danlos syndrome type IV, autosomal
dominant)Cell communication
collagen, type I, alpha 1 Cell communicationcollagen, type I, alpha 2 Cell communicationalpha-amylase Starch and sucrose metabolismdead (asp-glu-ala-asp) box polypeptide 50 Starch and sucrose metabolismjun d proto-oncogene MAPK signaling pathwaytransforming growth factor, beta 3 MAPK signaling pathwayubiquitin-conjugating enzyme e2q (putative) 2 Ubiquitin mediated proteolysisring-finger protein 7 Ubiquitin mediated proteolysisadaptor protein containing ph domain, ptb domain and leucine zipper
motif 1Colorectal cancer
lactate dehydrogenase b Glycolysis=Gluconeogenesisuncharacterized hematopoietic stem=progenitor cells protein mds032 SNARE interactions in vesicular transporttubulin, alpha, ubiquitous Gap junctionsimilar to glucosamine-phosphate n-acetyltransferase 1 Glutamate metabolismatpase, hþ transporting, lysosomal v1 subunit g2 Oxidative phosphorylationcalmodulin 1 (phosphorylase kinase, delta) Calcium signaling pathwayDecorin TGF-beta signaling pathwaysimilar to proto-oncogene serine=threonine-protein kinase pim-1 JAK–STAT signaling pathwayjunctional adhesion molecule 1 Cell adhesion molecules (CAMs)similar to 26s proteasome non-atpase regulatory subunit 11 (26s proteasome
regulatory subunit s9) (26s proteasome regulatory subunit p44.5)Proteasome
similar to multiple pdz domain protein Tight junctionadp-ribosylation factor 1 Cholera—infectioncas-br-m (murine) ecotropic retroviral transforming sequence ErbB signaling pathway
340 ZHAO ET AL.
2003; Matsuda et al., 1999; Mitsui et al., 2003; Niwa et al.,2009). In the present study, STAT3 transcripts were detectedin both SKP spheres and neurospheres. On the one hand, LIFsignaling can significantly enhance the STAT3 expression inboth SKP spheres and neurospheres, suggesting a potentialrole of the JAK–STAT pathway in maintaining the ‘‘stem-ness’’ of sphere-forming stem cells. On the other hand, LIFsignaling promotes the differentiation of neurospheres butdoes not affect the differentiation associated genes in SKPspheres, indicating a differential effect of LIF signaling on thedifferentiation by SKP spheres and neurospheres.
MAPK=ERK signaling is a complex signal transductionpathway, which integrates intracellular response to thebinding of growth factors and regulates the transcription and
translation by coupling with G protein (Chang and Karin,2001). ERK1=2 activation promotes differentiation, and sup-pression of ERK1=2 can enhance self-renewal of mouse andrat ES cells (Buehr et al., 2008; Burdon et al., 2002; Li et al.,2008; Qi et al., 2004; Ying et al., 2008). However, theMAPK=ERK pathway plays an important role in maintain-ing the pluripotency of human ES cells (Armstrong et al.,2006; Li et al., 2007b). MAPK=ERK signaling contributes tothe proliferation and maintenance of neural stem=progenitorcells multipotency by suppressing glial differentiation andexhibits a key role in neurogenesis (Campos et al., 2004;Imamura et al., 2008; Samuels et al., 2008). Some players ofthe MAPK=ERK pathway are enriched in both SKP spheresand neurospheres. In addition, inhibition of MAPK cascade
Table 5. Pathways Involved in the Commonly Enriched Genes between SKP Spheres
and Neurospheres (26 Records)
Genes Involved pathway
ribosomal protein l39 Ribosomeribosomal protein s6 Ribosomeribosomal protein l19 Ribosomeribosomal protein l9 Ribosomeribosomal protein l23a Ribosomeribosomal protein s3a Ribosomeribosomal protein l37 Ribosomeribosomal protein s18 Ribosomeribosomal protein s24 Ribosome90-kDa heat-shock protein Antigen processing and presentationheat-shock protein 90-kDa alpha (cytosolic), class b member 1 Antigen processing and presentationheat-shock 70-kDa protein 8 Antigen processing and presentationalpha-amylase Starch and sucrose metabolismlactate dehydrogenase b Glycolysis=Gluconeogenesissimilar to multiple pdz domain protein Tight junctionnonmetastatic cells 7, protein expressed in (nucleoside-diphosphate kinase) Purine metabolismtubulin, alpha, ubiquitous Gap junctionsimilar to glucosamine-phosphate n-acetyltransferase 1 Glutamate metabolismatpase, hþ transporting, lysosomal v1 subunit g2 Oxidative phosphorylationactin, beta Cell communicationadp-ribosylation factor 1 Cholera—infectionring-finger protein 7 Ubiquitin mediated proteolysiscalmodulin 1 (phosphorylase kinase, delta) Calcium signaling pathwaycas-br-m (murine) ecotropic retroviral transforming sequence ErbB signaling pathwaysimilar to proto-oncogene serine=threonine-protein kinase pim-1 JAK–STAT signaling pathwayjun d proto-oncogene MAPK signaling pathway
Table 6. Pathways Involved in the Differentially Expressed Genes in SKP Spheres
and Neurospheres (10 Records)
Genes Potential pathways
prostaglandin f receptor (fp) Neuroactive ligand–receptor interactionDecorin TGF-beta signaling pathwaydead (asp-glu-ala-asp) box polypeptide 50 Starch and sucrose metabolismpolymerase (dna-directed), delta 3, accessory subunit Purine metabolismglycoprotein gpiiia ECM–receptor interaction,collagen, type I, alpha 2 Cell communication, ECM–receptor interactioncollagen, type III, alpha 1 (Ehlers-Danlos syndrome type IV,autosomal dominant)
Cell communication, ECM–receptor interaction
collagen, type I, alpha 1 Cell communication, ECM–receptor interactionferritin, heavy polypeptide 1 Porphyrin and chlorophyll metabolismribosomal protein s9 Ribosome
DISTINCT ‘‘STEMNESS’’ OF PORCINE SKP SPHERES AND NEUROSPHERES 341
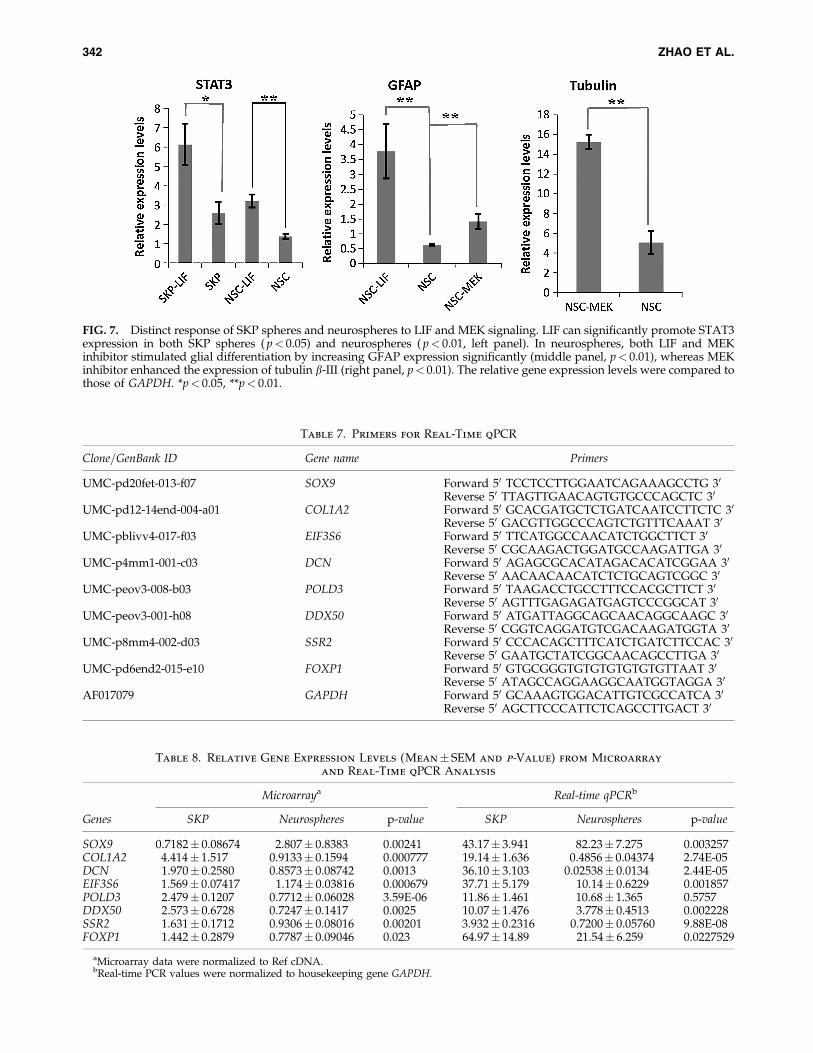
Table 7. Primers for Real-Time qPCR
Clone=GenBank ID Gene name Primers
UMC-pd20fet-013-f07 SOX9 Forward 50 TCCTCCTTGGAATCAGAAAGCCTG 30
Reverse 50 TTAGTTGAACAGTGTGCCCAGCTC 30
UMC-pd12-14end-004-a01 COL1A2 Forward 50 GCACGATGCTCTGATCAATCCTTCTC 30
Reverse 50 GACGTTGGCCCAGTCTGTTTCAAAT 30
UMC-pblivv4-017-f03 EIF3S6 Forward 50 TTCATGGCCAACATCTGGCTTCT 30
Reverse 50 CGCAAGACTGGATGCCAAGATTGA 30
UMC-p4mm1-001-c03 DCN Forward 50 AGAGCGCACATAGACACATCGGAA 30
Reverse 50 AACAACAACATCTCTGCAGTCGGC 30
UMC-peov3-008-b03 POLD3 Forward 50 TAAGACCTGCCTTTCCACGCTTCT 30
Reverse 50 AGTTTGAGAGATGAGTCCCGGCAT 30
UMC-peov3-001-h08 DDX50 Forward 50 ATGATTAGGCAGCAACAGGCAAGC 30
Reverse 50 CGGTCAGGATGTCGACAAGATGGTA 30
UMC-p8mm4-002-d03 SSR2 Forward 50 CCCACAGCTTTCATCTGATCTTCCAC 30
Reverse 50 GAATGCTATCGGCAACAGCCTTGA 30
UMC-pd6end2-015-e10 FOXP1 Forward 50 GTGCGGGTGTGTGTGTGTGTTAAT 30
Reverse 50 ATAGCCAGGAAGGCAATGGTAGGA 30
AF017079 GAPDH Forward 50 GCAAAGTGGACATTGTCGCCATCA 30
Reverse 50 AGCTTCCCATTCTCAGCCTTGACT 30
FIG. 7. Distinct response of SKP spheres and neurospheres to LIF and MEK signaling. LIF can significantly promote STAT3expression in both SKP spheres ( p< 0.05) and neurospheres ( p< 0.01, left panel). In neurospheres, both LIF and MEKinhibitor stimulated glial differentiation by increasing GFAP expression significantly (middle panel, p< 0.01), whereas MEKinhibitor enhanced the expression of tubulin b-III (right panel, p< 0.01). The relative gene expression levels were compared tothose of GAPDH. *p< 0.05, **p< 0.01.
Table 8. Relative Gene Expression Levels (Mean� SEM and p-Value) from Microarray
and Real-Time qPCR Analysis
Microarraya Real-time qPCRb
Genes SKP Neurospheres p-value SKP Neurospheres p-value
SOX9 0.7182� 0.08674 2.807� 0.8383 0.00241 43.17� 3.941 82.23� 7.275 0.003257COL1A2 4.414� 1.517 0.9133� 0.1594 0.000777 19.14� 1.636 0.4856� 0.04374 2.74E-05DCN 1.970� 0.2580 0.8573� 0.08742 0.0013 36.10� 3.103 0.02538� 0.0134 2.44E-05EIF3S6 1.569� 0.07417 1.174� 0.03816 0.000679 37.71� 5.179 10.14� 0.6229 0.001857POLD3 2.479� 0.1207 0.7712� 0.06028 3.59E-06 11.86� 1.461 10.68� 1.365 0.5757DDX50 2.573� 0.6728 0.7247� 0.1417 0.0025 10.07� 1.476 3.778� 0.4513 0.002228SSR2 1.631� 0.1712 0.9306� 0.08016 0.00201 3.932� 0.2316 0.7200� 0.05760 9.88E-08FOXP1 1.442� 0.2879 0.7787� 0.09046 0.023 64.97� 14.89 21.54� 6.259 0.0227529
aMicroarray data were normalized to Ref cDNA.bReal-time PCR values were normalized to housekeeping gene GAPDH.
342 ZHAO ET AL.
by MEK inhibitor promotes the differentiation in neuro-spheres, whereas the MEK inhibitor does not affect the‘‘stemness’’ or differentiation in SKP spheres, implying adistinct role in modulating the multipotency and differenti-ation of SKP spheres and neurospheres.
Most of the differentially expressed genes are mainly in-volved in ECM–receptor interaction and the TGF-b signalingpathway. TGF-b signaling is required for maintaining plur-ipotency, and is involved in the differentiation of ES cells( James et al., 2005; Vallier et al., 2009; Watabe and Miyazono,2009). Similarly, TGF-b signaling is crucial for multiple as-pects of neural development: ectodermal specialization,neural crest formation, spinal cord patterning, and embry-onic and adult brain development (Liu and Niswander,2005). In neural crest stem cells, TGF-b signaling couldinstructively induce neurogenesis or nonneural lineagecommitment depending on cellular context (Crane andTrainor, 2006; Shah et al., 1996). In addition, the equilibriumamong bone morphogenetic proteins and their soluble in-hibitors in the TGF-b signaling pathway has an importantrole not only in hair follicle morphogenesis but also in hairfollicle stem cell activation during adult homeostasis (Blan-pain and Fuchs, 2009). Because SKP spheres are neural crestderived and share some characteristics with neural crest stemcells, it is inferred that TGF-b signaling may regulate the‘‘stemness’’ properties of SKP spheres and neurospheres.
Our data show that LIF signaling can promote STAT3expression in both SKP spheres and neurospheres, whereasthe MEK inhibitor can only enhance the expression ofdifferentiation-associated genes in neurospheres. The MEKinhibitor does not exert any significant effect on either the‘‘stemness’’ property or differentiation in SKP spheres. To-gether with the microarray data, it indicates that SKP spheresand neurospheres show distinct responses to external stim-uli, and may employ divergent signaling pathways to regulatetheir individual stem cell states. We speculate that cell-intrinsic genetic and=or epigenetic programs may maintainthe innate ‘‘stemness’’ of these two sphere-forming stem cellswhen they reside in a similar microenvironment. This studymay help illustrate the fundamental mechanisms modulatingthe behaviors of neural stem cells and neural crest stem cellsin vitro.
Acknowledgments
We thank Dr. Jianguo Zhao for helpful discussion,Dr. Yi-Liang Miao for illustration work, Dr. GordonK. Springer and Dr. William G. Spollen at the Departmentof Computer Science, University of Missouri, for cDNAlibrary annotation. This work was supported by NIH grantNo. R01RR013438 and Food for the 21st Century at theUniversity of Missouri.
Author Disclosure Statement
The authors declare that no conflicting financial interestsexist.
References
Anneren, C. (2008). Tyrosine kinase signalling in embryonicstem cells. Clin. Sci. (Lond.) 115, 43–55.
Armstrong, L., Hughes, O., Yung, S., et al. (2006). The role ofPI3K=AKT, MAPK=ERK and NFkappabeta signalling in themaintenance of human embryonic stem cell pluripotency andviability highlighted by transcriptional profiling and func-tional analysis. Hum. Mol. Genet. 15, 1894–1913.
Bauer, S., Kerr, B.J., and Patterson, P.H. (2007). The neuropoieticcytokine family in development, plasticity, disease and injury.Nat. Rev. Neurosci. 8, 221–232.
Blanpain, C., and Fuchs, E. (2009). Epidermal homeostasis: abalancing act of stem cells in the skin. Nat. Rev. Mol. Cell Biol.10, 207–217.
Boiani, M., and Scholer, H.R. (2005). Regulatory networks inembryo-derived pluripotent stem cells. Nat. Rev. Mol. CellBiol. 6, 872–884.
Boockvar, J.A., Kapitonov, D., Kapoor, G., et al. (2003). Con-stitutive EGFR signaling confers a motile phenotype to neuralstem cells. Mol. Cell Neurosci. 24, 1116–1130.
Boyer, L.A., Lee, T.I., Cole, M.F., et al. (2005). Core transcrip-tional regulatory circuitry in human embryonic stem cells. Cell122, 947–956.
Buehr, M., Meek, S., Blair, K., et al. (2008). Capture of authenticembryonic stem cells from rat blastocysts. Cell 135, 1287–1298.
Burdon, T., Smith, A., and Savatier, P. (2002). Signalling, cellcycle and pluripotency in embryonic stem cells. Trends CellBiol. 12, 432–438.
Campos, L.S., Leone, D.P., Relvas, J.B., et al. (2004). Beta1 in-tegrins activate a MAPK signalling pathway in neural stemcells that contributes to their maintenance. Development 131,3433–3444.
Chambers, I., Colby, D., Robertson, M., et al. (2003). Functionalexpression cloning of Nanog, a pluripotency sustaining factorin embryonic stem cells. Cell 113, 643–655.
Chang, H.H., Hemberg, M., Barahona, M., et al. (2008). Tran-scriptome-wide noise controls lineage choice in mammalianprogenitor cells. Nature 453, 544–547.
Chang, L., and Karin, M. (2001). Mammalian MAP kinase sig-nalling cascades. Nature 410, 37–40.
Chen, X., Xu, H., Yuan, P., et al. (2008). Integration of externalsignaling pathways with the core transcriptional network inembryonic stem cells. Cell 133, 1106–1117.
Chou, Y.F., Chen, H.H., Eijpe, M., et al. (2008). The growth factorenvironment defines distinct pluripotent ground states in no-vel blastocyst-derived stem cells. Cell 135, 449–461.
Cole, M.F., and Young, R.A. (2008). Mapping key features oftranscriptional regulatory circuitry in embryonic stem cells.Cold Spring Harb. Symp. Quant. Biol. 73, 183–193.
Crane, J.F., and Trainor, P.A. (2006). Neural crest stem andprogenitor cells. Annu. Rev. Cell Dev. Biol. 22, 267–286.
Daheron, L., Opitz, S.L., Zaehres, H., et al. (2004). LIF=STAT3signaling fails to maintain self-renewal of human embryonicstem cells. Stem Cells 22, 770–778.
Deleyrolle, L.P., and Reynolds, B.A. (2009). Isolation, expansion,and differentiation of adult mammalian neural stem andprogenitor cells using the neurosphere assay. Methods Mol.Biol. 549, 91–101.
Doetsch, F., Caille, I., Lim, D.A., et al. (1999). Subventricularzone astrocytes are neural stem cells in the adult mammalianbrain. Cell 97, 703–716.
Doherty, J.M., Geske, M.J., Stappenbeck, T.S., et al. (2008). Di-verse adult stem cells share specific higher-order patterns ofgene expression. Stem Cells 26, 2124–2130.
Fernandes, K.J., McKenzie, I.A., Mill, P., et al. (2004). A dermalniche for multipotent adult skin-derived precursor cells. Nat.Cell Biol. 6, 1082–1093.
DISTINCT ‘‘STEMNESS’’ OF PORCINE SKP SPHERES AND NEUROSPHERES 343

Fernandes, K.J., Toma, J.G., and Miller, F.D. (2008). Multipotentskin-derived precursors: adult neural crest-related precursorswith therapeutic potential. Philos. Trans. R. Soc. Lond. B Biol.Sci. 363, 185–198.
Gage, F.H. (2000). Mammalian neural stem cells. Science 287,1433–1438.
Georgantas, R.W., 3rd, Tanadve, V., Malehorn, M., et al. (2004).Microarray and serial analysis of gene expression analysesidentify known and novel transcripts overexpressed in he-matopoietic stem cells. Cancer Res. 64, 4434–4441.
Graf, T., and Stadtfeld, M. (2008). Heterogeneity of embryonicand adult stem cells. Cell Stem Cell 3, 480–483.
Hanna, J., Markoulaki, S., Schorderet, P., et al. (2008). Directreprogramming of terminally differentiated mature B lym-phocytes to pluripotency. Cell 133, 250–264.
Hochedlinger, K., and Jaenisch, R. (2006). Nuclear reprogram-ming and pluripotency. Nature 441, 1061–1067.
Hu, Y.F., Zhang, Z.J., and Sieber-Blum, M. (2006). An epidermalneural crest stem cell (EPI-NCSC) molecular signature. StemCells 24, 2692–2702.
Huang da, W., Sherman, B.T., and Lempicki, R.A. (2009). Sys-tematic and integrative analysis of large gene lists using DA-VID bioinformatics resources. Nat. Protoc. 4, 44–57.
Imamura, O., Satoh, Y., Endo, S., et al. (2008). Analysis of ex-tracellular signal-regulated kinase 2 function in neuralstem=progenitor cells via nervous system-specific gene dis-ruption. Stem Cells 26, 3247–3256.
Ivanova, N.B., Dimos, J.T., Schaniel, C., et al. (2002). A stem cellmolecular signature. Science 298, 601–604.
Jaenisch, R., and Young, R. (2008). Stem cells, the molecularcircuitry of pluripotency and nuclear reprogramming. Cell132, 567–582.
James, D., Levine, A.J., Besser, D., et al. (2005). TGFbeta=activin=nodal signaling is necessary for the maintenance ofpluripotency in human embryonic stem cells. Development132, 1273–1282.
Jessen, K.R., and Mirsky, R. (2005). The origin and developmentof glial cells in peripheral nerves. Nat. Rev. Neurosci. 6,671–682.
Kagalwala, M.N., Singh, S.K., and Majumder, S. (2009). Stem-ness is only a state of the cell. Cold Spring Harb. Symp. Quant.Biol. [Epub ahead of print].
Li, H.Y., Say, E.H., and Zhou, X.F. (2007a). Isolation and char-acterization of neural crest progenitors from adult dorsal rootganglia. Stem Cells 25, 2053–2065.
Li, J., Wang, G., Wang, C., et al. (2007b). MEK=ERK signalingcontributes to the maintenance of human embryonic stem cellself-renewal. Differentiation 75, 299–307.
Li, P., Tong, C., Mehrian-Shai, et al. (2008). Germline competentembryonic stem cells derived from rat blastocysts. Cell 135,1299–1310.
Liu, A., and Niswander, L.A. (2005). Bone morphogenetic pro-tein signalling and vertebrate nervous system development.Nat. Rev. Neurosci. 6, 945–954.
Maisel, M., Herr, A., Milosevic, J., et al. (2007). Transcriptionprofiling of adult and fetal human neuroprogenitors identifiesdivergent paths to maintain the neuroprogenitor cell state.Stem Cells 25, 1231–1240.
Matsuda, T., Nakamura, T., Nakao, K., et al. (1999). STAT3 ac-tivation is sufficient to maintain an undifferentiated state ofmouse embryonic stem cells. EMBO J. 18, 4261–4269.
Mei, L., and Xiong, W.C. (2008). Neuregulin 1 in neural devel-opment, synaptic plasticity and schizophrenia. Nat. Rev.Neurosci. 9, 437–452.
Merkle, F.T., and Alvarez-Buylla, A. (2006). Neural stem cells inmammalian development. Curr. Opin. Cell Biol. 18, 704–709.
Mishra, S.K., Braun, N., Shukla, V., et al. (2006). Extracellularnucleotide signaling in adult neural stem cells: synergism withgrowth factor-mediated cellular proliferation. Development133, 675–684.
Mitsui, K., Tokuzawa, Y., Itoh, H., et al. (2003). The homeo-protein Nanog is required for maintenance of pluripotency inmouse epiblast and ES cells. Cell 113, 631–642.
Morris, J.K., Lin, W., Hauser, C., et al. (1999). Rescue of thecardiac defect in ErbB2 mutant mice reveals essential roles ofErbB2 in peripheral nervous system development. Neuron 23,273–283.
Morrison, S.J., and Spradling, A.C. (2008). Stem cells and niches:mechanisms that promote stem cell maintenance throughoutlife. Cell 132, 598–611.
Morrison, S.J., White, P.M., Zock, C., et al. (1999). Prospectiveidentification, isolation by flow cytometry, and in vivo self-renewal of multipotent mammalian neural crest stem cells.Cell 96, 737–749.
Nagoshi, N., Shibata, S., Kubota, Y., et al. (2008). Ontogeny andmultipotency of neural crest-derived stem cells in mouse bonemarrow, dorsal root ganglia, and whisker pad. Cell Stem Cell2, 392–403.
Ng, F., Boucher, S., Koh, S., et al. (2008). PDGF, TGF-beta, andFGF signaling is important for differentiation and growth ofmesenchymal stem cells (MSCs): transcriptional profiling canidentify markers and signaling pathways important in differ-entiation of MSCs into adipogenic, chondrogenic, and osteo-genic lineages. Blood 112, 295–307.
Niwa, H., Burdon, T., Chambers, I., et al. (1998). Self-renewal ofpluripotent embryonic stem cells is mediated via activation ofSTAT3. Genes Dev. 12, 2048–2060.
Niwa, H., Ogawa, K., Shimosato, D., et al. (2009). A parallelcircuit of LIF signalling pathways maintains pluripotency ofmouse ES cells. Nature 460, 118–122.
Pardal, R., Ortega-Saenz, P., Duran, R., et al. (2007). Glia-likestem cells sustain physiologic neurogenesis in the adultmammalian carotid body. Cell 131, 364–377.
Qi, X., Li, T.G., Hao, J., et al. (2004). BMP4 supports self-renewalof embryonic stem cells by inhibiting mitogen-activated pro-tein kinase pathways. Proc. Natl. Acad. Sci. USA 101, 6027–6032.
Ramalho-Santos, M., Yoon, S., Matsuzaki, Y., et al. (2002).‘‘Stemness’’: transcriptional profiling of embryonic and adultstem cells. Science 298, 597–600.
Reynolds, B.A., and Rietze, R.L. (2005). Neural stem cells andneurospheres—re-evaluating the relationship. Nat. Methods2, 333–336.
Reynolds, B.A., and Weiss, S. (1992). Generation of neurons andastrocytes from isolated cells of the adult mammalian centralnervous system. Science 255, 1707–1710.
Samuels, I.S., Karlo, J.C., Faruzzi, A.N., et al. (2008). Deletion ofERK2 mitogen-activated protein kinase identifies its key rolesin cortical neurogenesis and cognitive function. J. Neurosci. 28,6983–6995.
Scadden, D.T. (2006). The stem-cell niche as an entity of action.Nature 441, 1075–1079.
Shah, N.M., Marchionni, M.A., Isaacs, I., et al. (1994). Glialgrowth factor restricts mammalian neural crest stem cells to aglial fate. Cell 77, 349–360.
Shah, N.M., Groves, A.K., and Anderson, D.J. (1996). Alternativeneural crest cell fates are instructively promoted by TGFbetasuperfamily members. Cell 85, 331–343.
344 ZHAO ET AL.
Shin, S., Sun, Y., Liu, Y., et al. (2007). Whole genome analysis ofhuman neural stem cells derived from embryonic stem cellsand stem and progenitor cells isolated from fetal tissue. StemCells 25, 1298–1306.
Silva, J., and Smith, A. (2008). Capturing pluripotency. Cell 132,532–536.
Stemple, D.L., and Anderson, D.J. (1992). Isolation of a stem cellfor neurons and glia from the mammalian neural crest. Cell 71,973–985.
Suh, H., Consiglio, A., Ray, J., et al. (2007). In vivo fate analysis revealsthe multipotent and self-renewal capacities of Sox2þneuralstem cells in the adult hippocampus. Cell Stem Cell 1, 515–528.
Surani, M.A., Hayashi, K., and Hajkova, P. (2007). Genetic andepigenetic regulators of pluripotency. Cell 128, 747–762.
Takahashi, K., and Yamanaka, S. (2006). Induction of pluripotentstem cells from mouse embryonic and adult fibroblast culturesby defined factors. Cell 126, 663–676.
Terskikh, A.V., Miyamoto, T., Chang, C., et al. (2003). Gene ex-pression analysis of purified hematopoietic stem cells andcommitted progenitors. Blood 102, 94–101.
Thomas, S., Thomas, M., Wincker, P., et al. (2008). Humanneural crest cells display molecular and phenotypic hallmarksof stem cells. Hum. Mol. Genet. 17, 3411–3425.
Toma, J.G., Akhavan, M., Fernandes, K.J., et al. (2001). Isolationof multipotent adult stem cells from the dermis of mammalianskin. Nat. Cell Biol. 3, 778–784.
Toma, J.G., McKenzie, I.A., Bagli, D., et al. (2005). Isolation andcharacterization of multipotent skin-derived precursors fromhuman skin. Stem Cells 23, 727–737.
Tumbar, T., Guasch, G., Greco, V., et al. (2004). Defining theepithelial stem cell niche in skin. Science 303, 359–363.
Vallier, L., Mendjan, S., Brown, S., et al. (2009). Activin=Nodalsignalling maintains pluripotency by controlling Nanog ex-pression. Development 136, 1339–1349.
Wang, L., Schulz, T.C., Sherrer, E.S., et al. (2007). Self-renewal ofhuman embryonic stem cells requires insulin-like growth factor-1 receptor and ERBB2 receptor signaling. Blood 110, 4111–4119.
Watabe, T., and Miyazono, K. (2009). Roles of TGF-beta familysignaling in stem cell renewal and differentiation. Cell Res. 19,103–115.
Whitworth, K., Springer, G.K., Forrester, L.J., et al. (2004). De-velopmental expression of 2489 gene clusters during pig em-bryogenesis: an expressed sequence tag project. Biol. Reprod.71, 1230–1243.
Whitworth, K.M., Agca, C., Kim, J.G., et al. (2005). Transcrip-tional profiling of pig embryogenesis by using a 15-K memberunigene set specific for pig reproductive tissues and embryos.Biol. Reprod. 72, 1437–1451.
Whitworth, K.M., Li, R., Spate, L.D., et al. (2009). Method ofoocyte activation affects cloning efficiency in pigs. Mol. Re-prod. Dev. 76, 490–500.
Wong, R.C., Pera, M.F., and Pebay, A. (2008). Role of gapjunctions in embryonic and somatic stem cells. Stem Cell Rev.4, 283–292.
Ying, Q.L., Nichols, J., Chambers, I., et al. (2003). BMP inductionof Id proteins suppresses differentiation and sustains embry-onic stem cell self-renewal in collaboration with STAT3. Cell115, 281–292.
Ying, Q.L., Wray, J., Nichols, J., et al. (2008). The ground state ofembryonic stem cell self-renewal. Nature 453, 519–523.
Yoshida, S., Shimmura, S., Nagoshi, N., et al. (2006). Isolation ofmultipotent neural crest-derived stem cells from the adultmouse cornea. Stem Cells 24, 2714–2722.
Zhao, M., Isom, S.C., Lin, H., et al. (2009). Tracing the stem-ness of porcine skin-derived progenitors (pSKP) back tospecific marker gene expression. Cloning Stem Cells 11, 111–122.
Zhao, M.T., Whitworth, K.M., Zhang, X., et al (2010). Deci-phering the mesodermal potency of porcine skin-derivedprogenitors (SKP) by microarray analysis. Cloning Stem Cells(in press).
Address correspondence to:Randall S. Prather, Ph.D.
Division of Animal SciencesUniversity of Missouri–Columbia
920 East Campus DriveColumbia, MO 65211
E-mail: [email protected]
DISTINCT ‘‘STEMNESS’’ OF PORCINE SKP SPHERES AND NEUROSPHERES 345

Copyright © 2022 FDOKUMEN