POR QUE MUDAR O MODELO DO SETOR ELÉTRICO NO BRASIL?
43
BRAZIL BIOFUELS EXPERIENCE Ministry of Science and Technology José Miguez Ministry of Science and Technoloy May - 2007
-
Upload
khangminh22 -
Category
Documents
-
view
0 -
download
0
Transcript of POR QUE MUDAR O MODELO DO SETOR ELÉTRICO NO BRASIL?

BRAZIL BIOFUELS EXPERIENCE
Ministry of Science and Technology
José MiguezMinistry of Science and Technoloy
May - 2007

Brazil Biofuels Experience: Summary
1. A Brief World Energy Outlook
2. Brazil and Biofuels
3. Ethanol
4. Biodiesel
5. H-Bio: a New Brazilian Technology

A BRIEF ENERGY OUTLOOK

WORLD ENERGY CONSUMPTION
Source: BP Statistical Review (June/2006)
Energy consumption - Per capita Tones oil equivalent (toe)

WORLD ENERGY CONSUMPTION
Equator
Cancer Tropic
Consumo de energia per capita(em toneladas de óleo equivalente)
Capricorn Tropic
Tropical Area Biofuels
The greater consumption per capita is outside the tropics!
Source: BP Statistical Review (June/2006)

WORLD ENERGY CONTEXT
World economy growth
Demand growth
Climate change reality
High prices for energy
Refining capacity in the limit
Geopolitical instability and conflict at important energy supplier countries
Strong dependency on non-renewable energy sources

0
10
20
30
40
50
60
70
80
1970
1971
1972
1973
1974
1975
1976
1977
1978
1979
1980
1981
1982
1983
1984
1985
1986
1987
1988
1989
1990
1991
1992
1993
1994
1995
1996
1997
1998
1999
2000
2001
2002
2003
2004
2005
JAN
-JU
L 20
06JU
L 20
06
US$
/ ba
rrel
Oil - Brent Dated
CRUDE OIL PRICES
Source: BP Statistical Review (June/2006) e Petrobras (August/2006)
1998 a Jul-2006
+ 475%

THE CHALLENGE FOR ENERGY POLICY
Long term energy supply security
Cheaper prices for energy sources
Keeping the local energy competitiveness
Dealing with climate change and environment
BIOFUELSBIOFUELS

BRAZIL AND BIOFUELS

RENEWABLESOURCES
44.7 %
218.6 MILLIONS
TOE
Hydroelectricity15.0%
Uranium1.2%
Natural Gas9.3%
Petroleum and Derivatives
38.4%
Other Renewables
Sources2.7%
Sugarcane13.9%Wood and other
Biomass13.1%
Coal6.4%
BRAZILIAN ENERGY MATRIX - 2005
RENEWABLENON-RENEWABLE
Brazil0
20406080
100
World
14
86
45 55
%
Source: Brazilian Energy Balance (2006)
Ministry of Mines and Energy

Gasoline A25.6%
Anhydrous Ethanol8.5% Hydrated Ethanol
8.4%
VNG2.9%
Diesel 54.5%
CURRENT MATRIX OF VEHICLE FUELS - 2005
Gasoline C 25.6 + 8.5 = 34.1%
35.3% (2004)
Total Ethanol8.5 + 8.4 = 16.9%
15.4% (2004)
55.7% (2004)
2.4% (2004)
6.6% (2004)
8.8% (2004)
26.5% (2004)

Fuel Production and Dependency on Imports - 2005
Source: National Petroleum Agency, Ministry of Agriculture, Livestock and Food SupplyMinistry of Development, Industry and Foreign Trade(elaborated by Ministry of Mines and Energy (MME)
Production Net Imports
% of demand
% of production
PURE GASOLINE 19.978 - 2.760 14%
DIESEL 38.396 2.070 - 5%
ETHANOL 16.030 - 2.592 16%
NATURAL GAS(million m³/day) 48,5 24,4 - 33%
Fuel
Dependency
Self-sufficiency
thousand m³ thousand m³ thousand m³
Net Exports
Net Imports
Net Exports

Brazilian Energy PolicyLaw nº 9.478/1997
ObjectivesTo promote energy security with
lesser external dependency.
To protect the consumer best interests through regulation mechanisms and surveillance at the Regulatory Agencies
To increase the share of biofuels in the national energy matrix
To promote free competition
To protect the environment
Biofuels ConcernsGuarantee of internal supply
Specific taxation model in order to stimulate its usage
Expansion of production in order to supply the growing internal and external demand for ethanol and biodiesel
Private investments
Free prices in the whole chain production

ETHANOL

Ethanol in Brazil: 81 Years of Experience
1925: First tests using ethanol blends with gasoline

1979: Manufacturers begin to sell 100% Ethanol Vehicle
First Results for a 100% Ethanol Vehicle: 1979
April, 1979: Publication in a
technical magazine of the first test-drive of a 100% ethanol vehicle
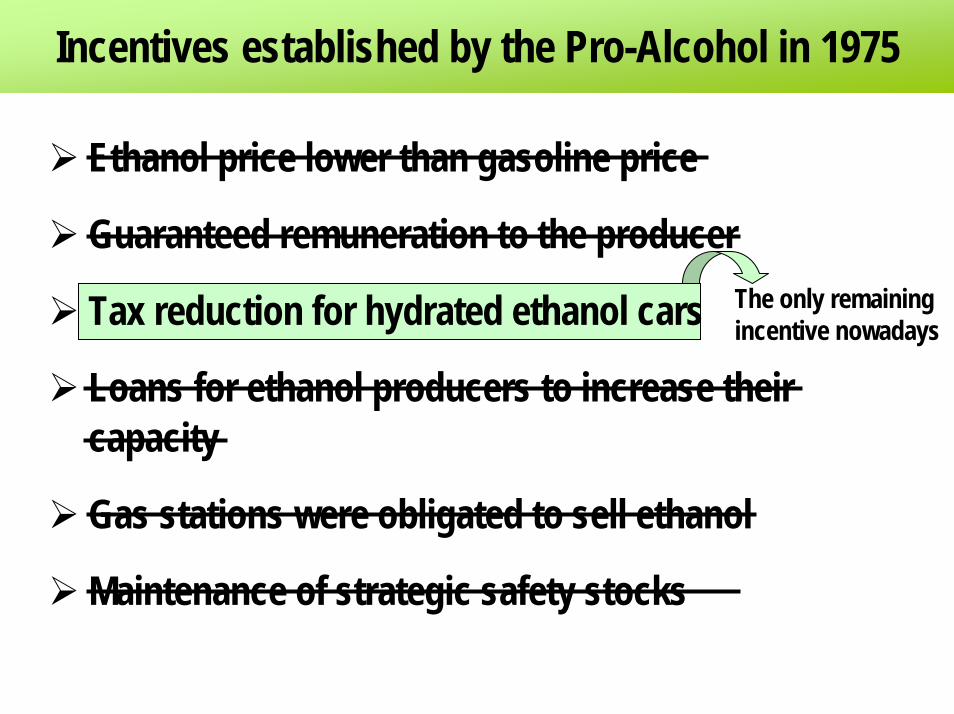
The only remaining incentive nowadays
Incentives established by the Pro-Alcohol in 1975
Ethanol price lower than gasoline price
Guaranteed remuneration to the producer
Tax reduction for hydrated ethanol cars
Loans for ethanol producers to increase their capacity
Gas stations were obligated to sell ethanol
Maintenance of strategic safety stocks


Ethanol World ProductionEthanol World Production
45,9 milhões Kl (2005)
China8%
Others13%
Brasil35%
India4%
USA35%
UE5%
Source: FO Licht
45,9 billion liters (2005)

2005 to 2020: Ethanol World Production Forecast
0
20000
40000
60000
80000
100000
120000
1975 1980 1985 1990 1995 2000 2005 2010 2015 2020
mln
lit
res
Brazil USA Canada Central AmericaPeru Colombia Venezuela ChinaIndia Philippines Thailand AustraliaEU
2010: 4%
Today: 1.5%
2020: 6%
Fonte: Berg, C. – Amsterdam, Novembro/05

Fonte: Berg, Cristoph, Ethanol World Market; F.O.Licht 2nd Sugar and Ethanol Brazil, SP 21- 23/03/06

Brasil: Produção de Álcool Hidratado e Anidro
-
2.000.000
4.000.000
6.000.000
8.000.000
10.000.000
12.000.000
14.000.000
16.000.000
18.000.000
75/7677/7879/8081/8283/8485/8687/8889/9091/9293/9494/9595/9696/9797/9898/9999/00
2000/01
2001/02
2002/03
2003/04
2004/05
2005/06
(Em
m³)
Álcool Hidratado Álcool Anidro Álcool TotalHydrated Ethanol Anhydrous Et. Total Ethanol
Brazil: Hydrated and Anhydrous Ethanol Productionm
3

Share of Flex Fuel and Gasoline Vehicles in the Light Vehicles Brazilian Market..
Source: ANFAVEA
82
19,0
68,3
21,9
66
35,7
72,8
76,6
58,9
26,924,4
11,8
0
20
40
60
80
100
jan/04 Jul jan/05 Jul jan/06 Jul
Gasolina Flex FuelGasoline Flex-Fuel
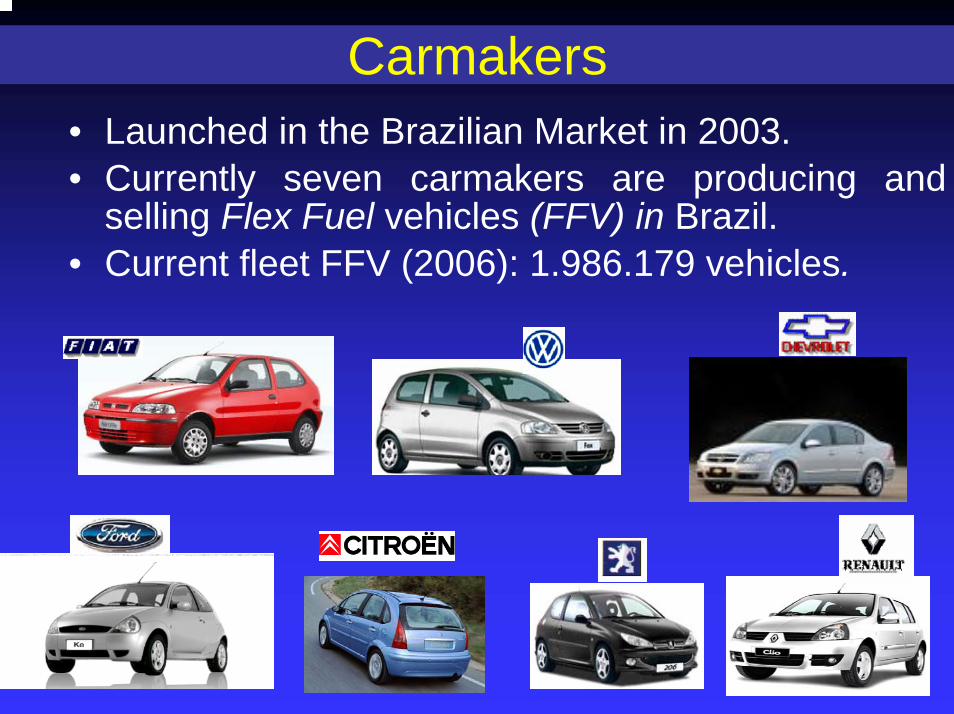
Carmakers• Launched in the Brazilian Market in 2003.• Currently seven carmakers are producing and
selling Flex Fuel vehicles (FFV) in Brazil.• Current fleet FFV (2006): 1.986.179 vehicles.

Benefits for the Consumers• Vehicles can be fueled with a mix
gasoline/hydrated ethanol in any proportion at any point in time.
• Possibility to choose the fuel in each refueling in accordance with the price at that particular pump station, availability, performance and consumption.

Competitividade do álcool hidratado vis a vis com a gasolina (%) – junho 2006
Hydrated ethanol competitiveness vis a visgasoline (%) – June 2006
≤ 70% – competitive> 70% – non competitive
87 75
56
71
72
65
59
78
76
69
51
79
81
77
54
75
88
60
72
77
57
72
Gasoline means gasohol with 25% anhydrous ethanol

Ethanol Competitiveness R$ 2,20/US$
20212426272527283029
2630
333633
2828313132
2830313234353737 38
4546 4943
4748
545350
5659
6562
5859
656263
70
40 41
53
65
0,0
0,2
0,4
0,6
0,8
1,0
1,2
1,4
1,6
1,8
2,0
jan/
02 fev
mar ab
rm
ai jun jul
ago
set
out
nov
dez
jan/
03 fev
mar ab
rm
ai jun jul
ago
set
out
nov
dez
jan/
04 fev
mar ab
rm
ai jun jul
ago
set
out
nov
dez
jan/
05 fev
mar ab
rm
ai jun jul
ago
set
out
nov
dez
jan/
06fe
v/06
mar
/06
abr/0
6
(*) Preço máximo do álcool em função das diferenças de eficiência energética entre álcool e gasolina (75% gasolina).Elaboração: MB Agro.
0
10
20
30
40
50
60
70
80Estímulo Produção Álcool
Álcool: Preço Equivalente*/Custo de Produção
Preço do Petróleo WTI (US$/barril)
Ethanol: Price equivalent to production costs
Oil Prices WTI (US$/bbl)
Incentive to ethanol production
Source: MB Agro

Ethanol in Brazil: Oil economy and environmental benefits
Source: Ministry of Mines and Energy - Brazilian Energy Balance – 2006and Laura Tetti – USP – 2002
106 BEP
FUEL DEMAND FOR LIGHT VEHICLES IN BRAZIL
0
20
40
60
80
100
120
140
160
180
1970 1975 1980 1985 1990 1995 2000 2005
YEAR
TOTAL DEMAND FOR LIGHT VEHICLES (GNV INCLUDED)
GASOLINE PRODUCTIONGASOLINE CONSUMPTION
TOTAL DEMAND FOR LIGHT VEHICLES (WITHOUT GNV)
This curve shows how much gasoline would be necessary to satisfy the fuel demand for light vehicles supposing the non-existence of the
Brazilian Ethanol Program
Total economy of 778 million boeor 15 months of the present Brazilian
petroleum production.
Accumulated economy of 7 years and 9 months of pure gasoline consumption.
US$ 61billions
IN THIS PERIOD, WITH THE ETHANOL USAGE, THE EMISSION OF 644 MILLION TONNES OF CO2 WAS AVOIDED
+ US$ 16billions

Ethanol Perspectives: Aviation Industry
• Brazilian Aviation Industry sells the first 100% ethanol aircraft, the Ipanema (EMB-202) a single-seat agricultural utility .
• Embraer, in partnership with an Italian company, announces the development of the first aircraft with Flex-Fuel technology.
The EMB-202 was awarded with the prizes
"Flight International Aerospace Industry
Award" General Aviation category (June /2005) in Paris and The Scientific
American 50 (December/2005) as one of the best inventions of
the year in the world.

BIODIESEL

0
10
20
30
40
50
60
70
80
1970
1972
1974
1976
1978
1980
1982
1984
1986
1988
1990
1992
1994
1996
1998
2000
2002
2004
JAN-
JUL/
06
US$
/ ba
rrel
Oil - Brent Dated
Biodiesel versus Ethanol: Different ReasonsEthanol (1975): basically economics. Reasons for biodiesel (today):
Economic: high crude oil prices again, but Brazilian dependence is now very low
Social: needs for jobs and permanent settlement of families in countryside
Environmental: to introduce another renewable and friendly fuel
1975: Pro-Alcohol is launched
Crude Oil Prices
2003: Biodiesel Program

First bus using Biodiesel – October 1980

Law 11.097/2005: Establishes minimum percentages to mix biodiesel to diesel, besides the monitoring on the introduction of this new fuel into the market.
Biodiesel: Regulatory Framework
2005to
2007
Authorized
Potential Market: 840 million Liters/year
2%
2008to
2012
Mandatory
Sound Market:1 billion Liters/year
2%
From 2013on
Mandatory
Sound Market:2,4 billion Liters/year
5%

Castor Beans Sunflower Palm Oil CottonSoy
Average Agriculture Productivity1.500 kg/ha 1.500 kg/ha 3.000 kg/ha 20.000 kg/ha 3.000 kg/ha
Percentage of Vegetable Oil
47% 42% 18% 20% 15%
Vegetable Oil Production (kg/ha)
705 630 540 4.000 450
Brazilian Production in 2005 m3/year90.000 23.000 5.600.000 151.000 315.000
Raw material diversity for production of Biodiesel

Biokerosene for Aviation Use
• Biokerosene Conception – 1980• Application Tests in Brazil – 1981 to 1984• First Flight (São José dos Campos – Brasília), in a airplane
EMBRAER (Bandeirante) on 23 October 2004 (“Aviator’s Day”)
• International launching of biokerosene in na event promoted by United Nations in China – December 2005
• Tests for international homologation started – August 2006. Homologation foreseen by 2008.

MME/SPG2006MME/SPG2006
BIODIESEL: Producers in Commercial Operation and Projects Forecast (As of Dec/2007)
(*) Elaborated with obtained information of producing potentials and investors. ANP: National Petroleum AgencySRF: IRS (Internal Revenue Service)
Legend:
Under Construction or Project
In Commercial Operation
New Project Intentions
In Authorization Process (ANP / SRF)
Number of Plants
Installed Capacity (MM L/year)
• IN COMMERCIAL OPERATION 7 123
• IN AUTHORIZATION PROCESS (ANP / SRF) 14 466
• UNDER CONSTRUCTION OR PROJECT 16 1,150
• NEW PROJECTS 20 842TOTAL 57 2,581

Industrial Biodiesel plant in Floriano, PiauíOperating with 120,000 l/d castor beans oil
or 180,000 l/d when operating with soya or cotton
Owner Company:
Brasil Ecodiesel – Deutsch Bank

H-BIO: A NEW BRAZILIAN TECHNOLOGY

Diesel oil production process that uses vegetable oils as raw materials in a petroleum refinery.
H-Bio = Hydrogenation of the mixture: diesel fractions + vegetable oil.
H-BIO AND BIODIESEL: COMPLEMENTARY PROCESSES

BiodieselBiodiesel
Glycerin Glycerin OthersOthers
Refinery
Hydrogen Fractions of diesel
Gas Station
Distributors
Agribusiness
Plantation Oil Crushing
Grains
RefinedOil
DieselDiesel
H-BIO
B2 or B5mixture
DieselOR
TransesterificationUnitEthanol Ethanol
or
MethanolMethanol
OROR
BIOFUELS PRODUCTION

BIOFUELS FORUM
• Big producers and big consumers• Brazil, China, European Union, India, South Africa,
United States • Working to transform biofuels into international
commodities• Business like initiative: informal, short term, oriented to
concrete results• Sustainable development • Improving the standard of living of poor countries

Main areas
• Transforming ethanol and biodiesel into international commodities
• Standards• Regulations• Infrastructure• Research and Development

Second Semester 2007
INTERNATIONAL CONFERENCE ON BIOFUELS IN BRAZIL