Population by Country of Birth and Nationality, Report
11
Population by Country of Birth and Nationality, Scotland, July 2019 to June 2020 14 January 2021 This report provides statistics on the number of non-UK born and non-British nationals living in Scotland and each council area, using data from the Annual Population Survey.
-
Upload
khangminh22 -
Category
Documents
-
view
0 -
download
0
Transcript of Population by Country of Birth and Nationality, Report
Population by Country of Birth and Nationality, Scotland,
July 2019 to June 2020 14 January 2021
This report provides statistics on the number of non-UK born and non-British nationals living in Scotland and each council area, using data from the Annual Population Survey.
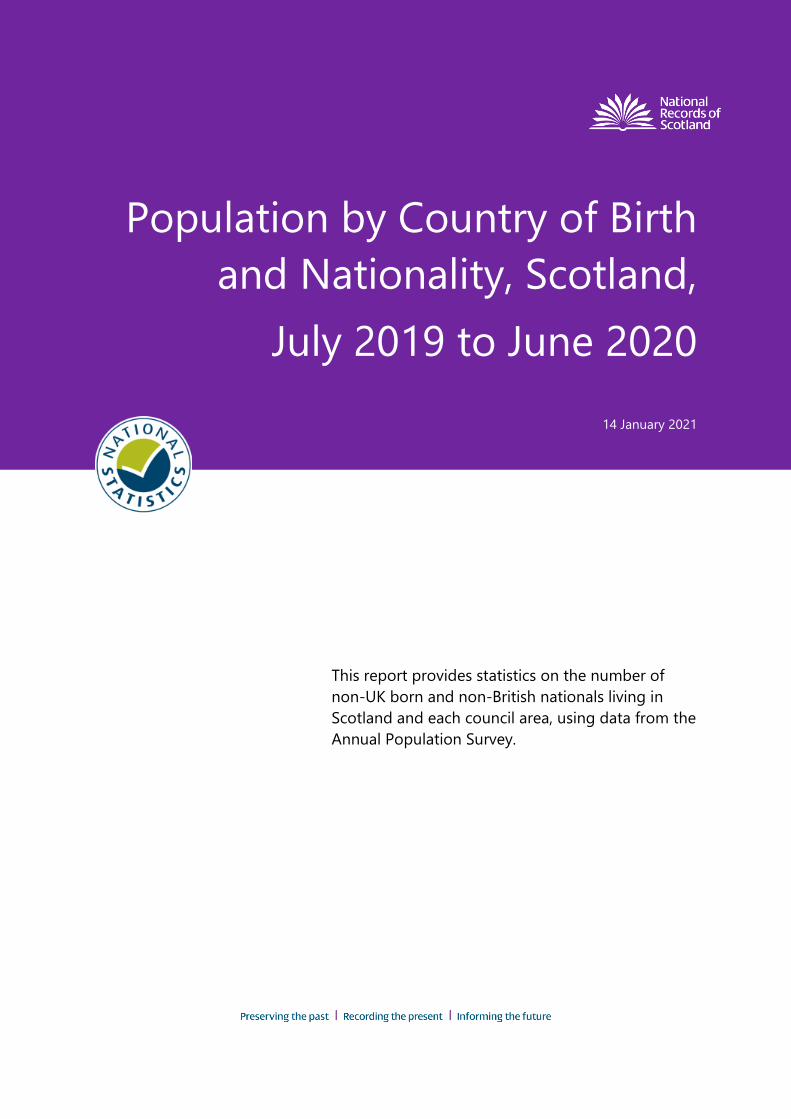
In the year ending June 2020, there were around 409,000 non-British nationals living in Scotland
This was an increase of 36,000 people over the latest year and was mainly driven by the increase in non-EU nationals.
EU nationals made up 56% of Scotland's non-British population
In the year ending June 2020, there were 231,000 EU nationals living in Scotland. Over half of these people were from EU8 countries.
There were 178,000 non-EU nationals. This was 44% of the non-British population.
Polish remained the most common non-British nationality
Polish was the most common non-British nationality, with 88,000 people in the year to June 2020.
The second most common non-British nationality was Indian, with 22,000 people.
Number of non-British nationals
Number of non-British nationals, 2019-20
Most common non-British nationalities in Scotland, 2019-20
Estimate ( ) and 95% confidence interval ( )
EU2(13,000)
EU Other(4,000)
EU8(127,000)
EU14(87,000)
Rest ofWorld
(91,000)
Asia(80,000)
OtherEurope(6,000)
EUNon-EU
200,000
136,000
231,000EU
178,000Non-EU
Estimate for EU ( ) and non-EU ( ) and 95% confidence interval ( )
2015-16 2016-17 2017-18 2018-19 2019-20
Czech Republic, Estonia, Hungary, Latvia, Lithuania, Poland, Slovakia and Slovenia.
EU8
Austria, Belgium, Denmark, Finland, France, Germany, Greece, Italy, Luxembourg, Netherlands, Portugal, Republic of Ireland, Spain and Sweden.
EU14
Bulgaria and Romania.EU2
Croatia, Cyprus and Malta.EU Other
Pakistan
India
0 25,000 50,000 75,000 100,000
Poland
Republic of Ireland
Nigeria
Source: Annual Population Survey, July 2019 to June 2020, ONSwww.nrscotland.gov.uk
Population by Country of Birth and Nationality, 2019-20 Summary
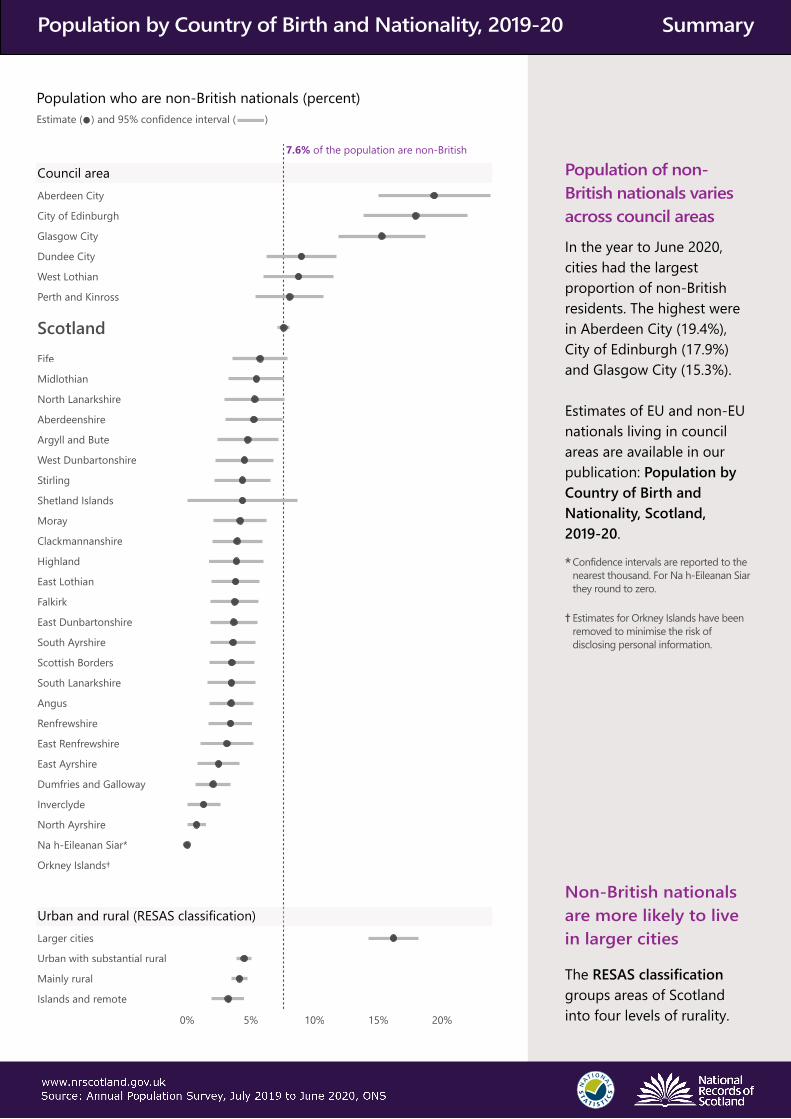
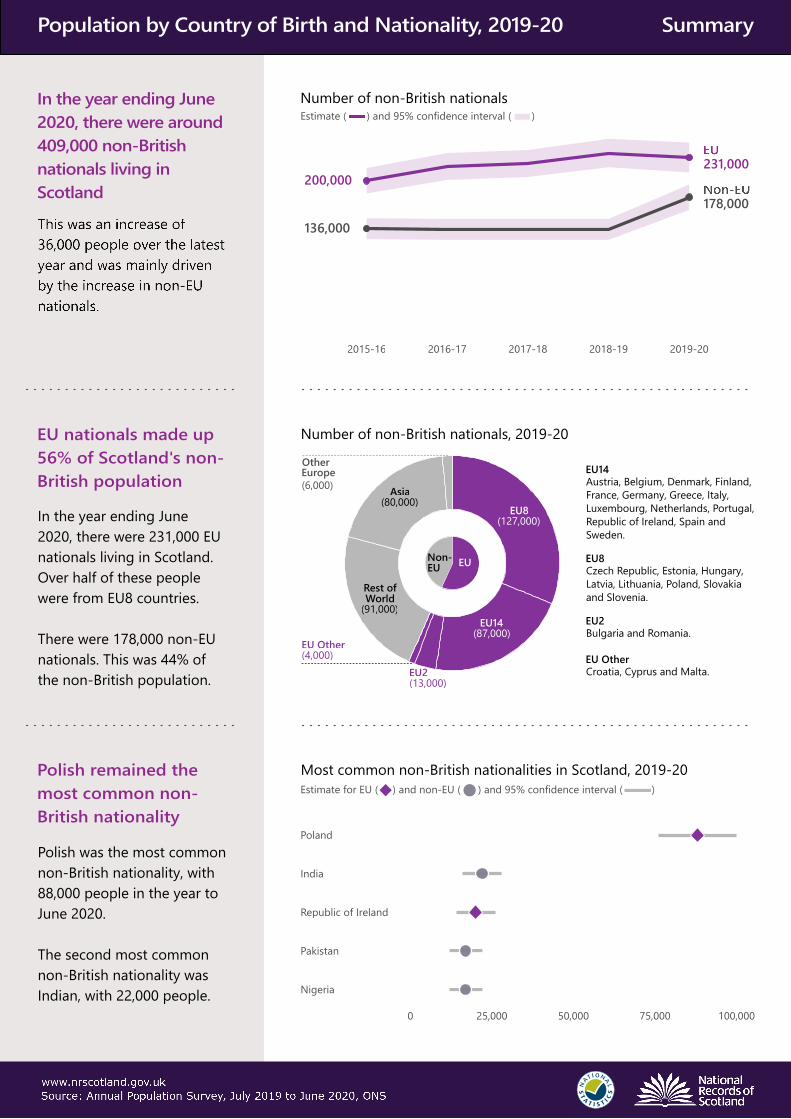
Population of non-British nationals varies across council areas
Population who are non-British nationals (percent)
7.6% of the population are non-British
Council area
The RESAS classification groups areas of Scotland into four levels of rurality.
Non-British nationals are more likely to live in larger cities
In the year to June 2020, cities had the largest proportion of non-British residents. The highest were in Aberdeen City (19.4%), City of Edinburgh (17.9%) and Glasgow City (15.3%).
Estimates of EU and non-EU nationals living in council areas are available in our publication: Population by Country of Birth and Nationality, Scotland,2019-20.
Confidence intervals are reported to the nearest thousand. For Na h-Eileanan Siar they round to zero.
*
Estimates for Orkney Islands have been removed to minimise the risk of disclosing personal information.
†
Estimate ( ) and 95% confidence interval ( )
Orkney Islands†
Na h-Eileanan Siar*
North Ayrshire
Inverclyde
Dumfries and Galloway
East Ayrshire
East Renfrewshire
Renfrewshire
Angus
South Lanarkshire
Scottish Borders
South Ayrshire
East Dunbartonshire
Falkirk
East Lothian
Highland
Clackmannanshire
Moray
Shetland Islands
Stirling
West Dunbartonshire
Argyll and Bute
Aberdeenshire
North Lanarkshire
Midlothian
Fife
Scotland
Perth and Kinross
West Lothian
Dundee City
Glasgow City
City of Edinburgh
Aberdeen City
Urban and rural (RESAS classification)
Islands and remote
Mainly rural
Urban with substantial rural
Larger cities
0% 5% 10% 15% 20%
Source: Annual Population Survey, July 2019 to June 2020, ONSwww.nrscotland.gov.uk
Population by Country of Birth and Nationality, 2019-20 Summary
4
© Crown Copyright 2021
Contents
1. Population by nationality ..................................................................................... 5
2. Population by country of birth ............................................................................ 6
3. Background information ...................................................................................... 7
4. Links to related statistics .................................................................................... 9
5. Notes on statistical publications ...................................................................... 10
Do these statistics take into account the effect of the coronavirus pandemic (COVID-19) on our population?
The numbers in this release come from the Annual Population Survey (APS) and cover the year ending June 2020; they therefore only cover part of the period of the coronavirus pandemic. However, the APS data collection has been impacted by COVID-19. More information on this can be found in the Background Information section.
It is important to note that the APS estimates the number of non-British nationals and non-UK born living in the UK at a particular point in time, regardless of when they moved to the UK.

5
© Crown Copyright 2021
1. Population by nationality
• In the year to June 2020, there were estimated to be 409,000 non-Britishnationals living in Scotland. This accounted for about1 in 13 people living in Scotland, and was a statistically significant increase of 36,000 people from the previous year.
• The increase in non-British nationals living in Scotlandwas mainly due to the increase in nationals of the Rest of the World (TheAmericas, Africa, and Oceania) and Asia. A breakdown by nationality group isshown below in
The population of non-British nationals living in Scotland increased over the latest year
Table 1; significant changes are marked with an asterisk.
Table 1: Population by nationality in Scotland, year ending June 2020
Nationality 2018-19 2019-20 Change
over year
Percentage of non-British population
(2019-20)
All 5,374,000 5,395,000 21,000 - British 5,000,000 4,982,000 -18,000 - Non-British 373,000 409,000 36,000* -
EU (total) 237,000 231,000 -6,000 56% EU14 78,000 87,000 9,000 21% EU8 135,000 127,000 -8,000 31% EU2 22,000 13,000 -9,000* 3% EU Other 2,000 4,000 2,000 1%
Non-EU (total) 135,000 178,000 43,000* 44% Other Europe 9,000 6,000 -3,000 1% Asia 64,000 80,000 16,000* 20% Rest of the World 63,000 91,000 28,000* 22% Source: Annual Population Survey (APS), Office for National Statistics (ONS) Notes: All estimates rounded to the nearest thousand. Totals may not add exactly due to this rounding. More information on which countries are part of each EU group can be found in the Background Information section. * Statistically significant change at the 95% level
• Of all non-British nationals over half (56%) were EU nationals (231,000), and44% were non-EU nationals (178,000).
• Polish remained the most common non-British nationality in Scotland in the yearto June 2020 with 88,000 nationals (22% of the total non-British population),followed by Indian with 22,000 nationals.
• The council areas with the largest proportion of residents with a non-Britishnationality were Aberdeen City (19%), City of Edinburgh (18%) and Glasgow City(15%).

6
© Crown Copyright 2021
2. Population by country of birth
• In the year to June 2020, there were estimated to be 528,000 people living inScotland who were born outside the UK. This was about 10% of thepopulation. The number of people born outside of the UK living in Scotlandincreased by 45,000 over the year. This was a statistically significant increasedriven by the increase in people born outside the EU. A breakdown of the non-UKborn population by country groupings is shown in Table 2.
Table 2: Population by country of birth in Scotland, year ending June 2020
Country of birth 2018-19 2019-20 Change
over year
Percentage of non-UK born
population (2019-20)
All 5,374,000 5,395,000 21,000 - UK 4,890,000 4,863,000 -27,000 - Non-UK 483,000 528,000 45,000* -
EU (total) 238,000 240,000 2,000 45% EU14 91,000 105,000 14,000 20% EU8 123,000 114,000 -9,000 22% EU2 20,000 14,000 -6,000 3% EU Other 5,000 7,000 2,000 1%
Non-EU (total) 245,000 289,000 44,000* 55% Other Europe 19,000 15,000 -4,000 3% Asia 115,000 138,000 23,000* 26% Rest of the World 111,000 136,000 25,000* 26% Source: Annual Population Survey (APS), Office for National Statistics (ONS) Note: All estimates rounded to the nearest thousand. Totals may not add exactly due to this rounding. More information on which countries are part of each EU group can be found in the Background Information section. * Statistically significant change at the 95% level
• Of those who were born outside the UK, 240,000 (45%) were born in an EUcountry, and 289,000 (55%) were born elsewhere in the world.
• Poland remained the most common non-UK country of birth in Scotland, witharound 1 in 7 people (77,000) born outside the UK being born there. The secondmost common non-UK country of birth was India (35,000).
• The council areas with the largest proportion of residents born outside of the UKwere Aberdeen City (25%), City of Edinburgh (21%) and Glasgow City (18%).
The population estimates by country of birth and nationality are available for Scotland’s council areas and can be accessed on the National Records of Scotland (NRS) website.

7
© Crown Copyright 2021
3. Background information
All the latest statistics in this report come from the Annual Population Survey (APS), carried out by the Office for National Statistics (ONS), covering the period July 2019 to June 2020. The APS is the Labour Force Survey (LFS) plus a number of sample boosts. The boost for Scotland is funded by the Scottish Government. The APS had a sample size of around 244,000 respondents in the whole of the UK, and is the largest household survey in the UK (other than the Census and Census coverage survey). In the year to June 2020, the sample size for Scotland was around 31,000 people.
How has the APS been impacted by the coronavirus pandemic?
Due to the coronavirus pandemic (COVID-19), the APS data collection had to change rapidly from March 2020 as it was no longer possible to carry out face to face interviews at people’s homes. All interviews therefore had to be done over the phone which affected the types of households responding. Compared to before the pandemic, more owner occupiers and fewer people renting responded. As a result, the APS datasets had to be reweighted to take into account the change in the mode of data collection and to ensure the types of people responding remained representative. To allow sufficient time for the reweighting exercise, this publication has been delayed from 26 November 2020.
More information on the impact of COVID-19 and the APS reweighting can be found in ONS’ blog post as well as their Population of the UK by country of birth and nationality: July 2019 to June 2020 release.
Why are the estimates from the APS different from the mid-year population estimates (MYE)?
• The APS is a household survey, so does not include most communalestablishment (i.e., care homes, prisons and student halls of residence); thismeans that the population totals from the APS will be different from the officialmid-year population estimates, which cover the entire population.
• The MYE also provide estimates of the population by sex and age while theAPS can be used to provide estimates by country of birth and nationality.
Can changes in migrant stocks be compared against changes in migration flows?
Changes in the number of people living in Scotland who are non-UK born/non-British nationals are not directly comparable with estimates of long-term international migration (such as the estimates of migration used in the mid-year population estimates). There are a few reasons for this:
8
© Crown Copyright 2021
• Non-UK born/non-British nationals could move to Scotland from other parts of the UK, and not be included in estimates of long-term international migration (but will instead be included in cross border migration).
o
• There are definitional differences between the International Passenger Survey (which is used to estimate long-term international migration) and the APS:
o The APS is a survey of residential addresses and does not include most communal establishments, whereas the International Passenger Survey includes people who may live in communal establishments. The APS measures the total resident population (‘stock’) so captures people who may have moved to Scotland many years ago, whereas the long-term international migration estimates (‘flows’) measure people moving over a specific period.
What is the difference between country of birth and nationality?
• Country of birth refers to the country a person was born in. This cannot change.
• Nationality refers to the nationality the person stated when they were interviewed. This can change, for example, someone may later apply to become a British national.
What is ‘statistical significance’?
All estimates produced from the Annual Population Survey (APS) are subject to sampling variability and depending on which sample we choose, the estimate can vary slightly. Confidence intervals are used as a measure of the precision of the estimate and to show the range in which the true data value is likely to fall. Most commonly, 95% confidence intervals are used.
When two estimates are very close, sometimes their confidence intervals overlap and it’s hard to say if there is a real difference. For example, the difference may be due to sampling error or has occurred simply by chance. In this case, the difference between the numbers is not statistically significant. Statistical tests are also used to confirm this.
When the confidence intervals for two estimates do not overlap, the difference between these numbers is statistically significant. In other words, when a difference is said to be statistically significant it reflects a real difference and has not occurred simply by chance.

9
© Crown Copyright 2021
Which countries are in the EU and each country grouping?
EU14 Austria, Belgium, Denmark, Finland, France, Germany, Greece, Republic of Ireland, Italy, Luxembourg, the Netherlands, Portugal, Spain, Sweden
EU8 Czech Republic, Estonia, Hungary, Latvia, Lithuania, Poland, Slovakia, Slovenia
EU2 Bulgaria, Romania
EU Other Cyprus, Malta, Croatia
4. Links to related statistics Other statistical publications that use the Annual Population Survey (APS), and other publications about population and migration in Scotland, can be found at the links below.
Population by country of birth and nationality, UK (ONS) – uses data from the APS to estimate the non-British national and non-UK born populations of the UK as a whole. This also includes individual country data for Scotland and the UK.
Non-UK nationals in Scotland’s Workforce (Scottish Government) – uses data from the APS to provide insight into labour market characteristics of non-British nationals
Mid-Year Population Estimates, Scotland (NRS) – headline population and migration statistics for Scotland, as at mid-year (30 June)
Migration flows, Scotland (NRS) – measure the number of people moving to and from an area over a specific period of time
Migration Statistics Quarterly Summary (NRS) – a summary of the latest migration statistics for Scotland, bringing together data from a range of sources to give an overview of key migration trends in Scotland, presented alongside UK-level data for comparison

10
© Crown Copyright 2021
5. Notes on statistical publications National Statistics The United Kingdom Statistics Authority (UKSA) has designated these statistics as National Statistics, in line with the Statistics and Registration Service Act 2007 and signifying compliance with the Code of Practice for Official Statistics (available on the UKSA website).
National Statistics status means that official statistics meet the highest standards of trustworthiness, quality and public value. All official statistics should comply with all aspects of the Code of Practice for Official Statistics. They are awarded National Statistics status following an assessment by the Authority’s regulatory arm. The Authority considers whether the statistics meet the highest standards of Code compliance, including the value they add to public decisions and debate. It is National Records of Scotland’s responsibility to maintain compliance with the standards expected of National Statistics. If we become concerned about whether these statistics are still meeting the appropriate standards, we will discuss any concerns with the Authority promptly. National Statistics status can be removed at any point when the highest standards are not maintained, and reinstated when standards are restored. Information on background and source data Further details on data source(s), timeframe of data and timeliness, continuity of data, accuracy, etc. can be found in the ‘Metadata’ document that is published alongside this publication on the NRS website. National Records of Scotland We, the National Records of Scotland, are a non-ministerial department of the devolved Scottish Administration. Our aim is to provide relevant and reliable information, analysis and advice that meets the needs of government, business and the people of Scotland. We do this as follows: Preserving the past – We look after Scotland’s national archives so that they are available for current and future generations, and we make available important information for family history. Recording the present – At our network of local offices, we register births, marriages, civil partnerships, deaths, divorces and adoptions in Scotland. Informing the future – We are responsible for the Census of Population in Scotland which we use, with other sources of information, to produce statistics on the population and households.

11
© Crown Copyright 2021
You can get other detailed statistics that we have produced from the Statistics section of our website. Scottish Census statistics are available on the Scotland’s Census website.
We also provide information about future publications on our website. If you would like us to tell you about future statistical publications, you can register your interest on the Scottish Government ScotStat website.
You can also follow us on twitter @NatRecordsScot
Enquiries and suggestions
Please contact our Statistics Customer Services if you need any further information. Email: [email protected]
If you have comments or suggestions that would help us improve our standards of service, please contact:
Alan Ferrier Senior Statistician, National Records of Scotland Email: [email protected]