Dreher Migration im Wettbewerbsstaat (Migration in the Competition State)
Upload
khangminh22Category
view
1download
0
114
Population and Migration in Thimphu Thromde
Sangay Chophel*
Abstract
As a developing country, Bhutan is on the upward trajectory of urbanization. While it has benefits it also exerts pressures. Within Bhutan, Thimphu thromde has the largest urban population, which exhibit many forms of urbanization. Using the data from 2017 Population and Housing Census of Bhutan, the paper projects the population of Thimphu city till 2027 due to lack of its population projection. The cohort-component method is used for projection. The net-migration from 2005 to 2017 is calculated using residual method. Further, employing probit regression, the determinants of migration to Thimphu thromde is examined. Age, marriage, unemployment, land, household composition, household income and education are significant determinants of migration.
Introduction
Urbanization in Bhutan has continued apace. The urban population has increased from 30.9% in 2005 to 37.8% in 2017, and largest share of the overall population reside in Thimphu thromde (city) at 15.8%1 where most of the government offices are based. The other three cities are Phuntsholing, Samdrup Jongkhar and Gelephu thromdes. There are relatively smaller urban areas in each of the 20 districts.
The annual growth rate of Thimphu thromde (3.72%) has
* Senior Research Officer, Centre for Bhutan & GNH Studies. Email: [email protected], [email protected] See the report of the first census conducted in 2005, Population and Housing Census of Bhutan 2005, and the second census conducted in 2017, 2017 Population and Housing Census of Bhutan.

Population and Migration in Thimphu Thromde
115
outpaced the national population growth rate (1.3%) as it is evident from the last two censuses. The population increase in Thimphu city is largely contributed by migration. Notwithstanding the economic opportunities brought about by urbanization, the growth in population has exerted pressures on infrastructure, environment and social fabric. Soaring house rent, pollution, gridlocks, accelerating waste generation, water shortage, substance abuse by youth are some of the issues Thimphu city face. On the other hand, there are empty households, fallow lands and uncared elderly in rural areas.
Despite having planning documents, strategies and rules, such as Thimphu Structure Plan 2002, Bhutan National Urbanization Strategy (2008), Bhutan Building Rules 2002, Land Pooling Rules 2009, Land Pooling and Readjustments Regulations 2018, the Rural Construction Rules 2013, and the Thromde Act of Bhutan 2007, the aforementioned challenges could not be addressed. To compound the issues there were cases of non-compliance and deviations from planning rules in Thimphu city planning process (Bajaj, 2014). National Human Settlements Policy 2019 has been approved and Spatial Planning Act is being drafted by the Ministry of Works and Human Settlement with the hope of addressing these challenges.
This paper is motivated by 1) the absence of the population projection of Thimphu thromde and 2) to identify and analyze the determinants of migration to Thimphu thromde. National Statistics Bureau (2019) has projected the population of 20 districts of Bhutan up to 2047 but left out population projection for Thimphu thromde and the other three thromdes. Thromde is a city within a district. The population of Thimphu district is 138,736 as of 2017. Out of this total Thimphu population, Thimphu thromde comprises of 114,551, which is a very large share of 82.5%. Therefore, it merits an understanding of population growth and projection of Thimphu thromde. In studying urbanization, priority has been given to urban concentrations, which refers to the degree of concentration of a country’s urban population in one or two major cities (Hofmann

Journal of Bhutan Studies, Vol.41, Winter 2019
116
and Wan, 2013; Henderson, 2003).
Literature review on migration
Migration is simply the change of residence away from the usual place of residence. According to United Nations, long-term migrants are individuals who changes his or her place of usual residence for at least one year. This paper will define migrant as a person who has moved away from his/her previous residence for at least one year. The geographical unit in this paper refers to gewog (county)/town. This definition will exclude short-term and seasonal migrants, visitors and students but could include return migrants. As the focus of this paper is on internal migration, foreign (non-Bhutanese) migrants are excluded from the analysis.
Perhaps the first formal theory of migration was proposed by Todaro (1969) in his model of labour migration in developing countries. In this model, the decision to migrate from rural to urban areas are influenced by two factors: the urban-rural real income differential and the probability of finding an urban job. Todaro’s model was further expanded by Harris and Todaro (1970) in the context of aggregate and inter-sectoral welfare implications. Both Todaro (1969) and Harris and Todaro (1970) highlight higher productivity urban job (which results in higher wage) as the factor inducing migration to urban areas. Recent extension of rural-urban migration has been developed by Kanbur, Christiaensen and Weerdt (2019) to the case of migration from rural areas to secondary towns and big city, and conclude that investing in secondary towns is more poverty reducing than investing in big cities by showing various mechanisms at play.
There are other theories of migration that considers political factors and mainly concerns with international migration which is of little relevance to Bhutan. International (non-Bhutanese) population constitutes of only 6.25% as of 2017 in Bhutan. Stark (1991, cited in Arango, 2000) consider migration to be more of household decision than individual decision, Piore (1979)
Population and Migration in Thimphu Thromde
117
places attention mainly on the receiving end of migration in the context of international migration, and others have approached international migration using world system theory.
There are extensive studies on the determinants of migration in literature. Migration push factors include lack of employment opportunities, poverty, hunger, land scarcity, unsustainable livelihood, lack of market access for agricultural products, limited services and infrastructure, discrimination, climate change, disasters and insecure environment. On the other hand, pull factors include higher income and employment opportunities, better educational, health, and other facilities, technological advancement in urban areas and family reunification.
The Ministry of Agriculture of Bhutan has conducted research on internal rural-urban migration first in 2005 and then a larger one in 2013 but have used inconsistent definition of migration. In the former, migrants were defined as those who have lived away from their gewog of birth for five years or more and in the latter, it is defined as those who are resident of a current dzongkhag (place of enumeration) other than the dzongkhag where they have census (civil registration). Definition of migration having civil registration as a criterion is at odds with many other international studies. Chand (2017) conducted a study on migration in Thimphu in 2010 albeit at a small sample size of 251, without performing any multivariate analysis. The Ministry of Agriculture also did not conduct any multivariate analysis on its study conducted in 2005 and 2013.
Thimphu thromde population projection
The purpose of this section is to project the population of Thimphu thromde using cohort-component method. Using 2005 and 2017 census data, the population of Thimphu thromde will be projected 10 years forward using constant fertility and death rates. It can be projected to any number of years but the deviation of the parameters from it true value will be higher when the projection is done over longer horizons. For instance,

Journal of Bhutan Studies, Vol.41, Winter 2019
118
the fertility rate of Thimphu city is 1.7 which is unlikely to vary much in the next five years or 10 years but will do so in the next 15 years and above.
For population projection, it is useful to refer to population balancing equation, which states that the population at current period is given by the sum of population at previous period, number of intervening births and net migrants, minus number of intervening deaths.
Information on current population, birth and death is readily available from census data but it is not straight forward to find information on net migration between intercensal periods. The calculation of net migration involves a number of steps using residual method, which is generally used for extrapolation. Another factor to consider is sex ratio at birth. Sex ratio at birth was 1.05 or 105 male births for every 100 female births in 2005.
To find the net migration between 2005 and 2017, first the population of Thimphu thromde should be projected from 2005 to 2017 using 2005 census data to estimate its population in 2017. The estimated population in 2017 should then be subtracted from the actual 2017 population which is available from 2017 census. The difference is the net migration between the two-census periods. The net migration rate per year can then be calculated for male and female by age groups. The net migration rate per year for age group 75 and above can be split into three equal parts for age groups 75-79, 80-84 and 85 and above. This net migration rate per year will be used to project population from 2017 to 2027. The essential elements of net migration rate are given below in Table 1. The detailed calculation of estimated 2017 Thimphu thromde population is given in Appendix Table A1.

Population and Migration in Thimphu Thromde
119
Table
1.
Mig
rati
on in
Th
imph
u t
hro
md
e bet
wee
n 2
00
5 a
nd
20
17
Age
Act
ual 2005
pop
ula
tion
E
stim
ate
d 2
017
pop
ula
tion
Act
ual 2017
pop
ula
tion
M
igra
tion
re
sidu
al 2005-
2017
Male
net
m
igra
tion
ra
te p
er
year
Fem
ale
net
m
igra
tion
ra
te p
er
year
Male
Fem
ale
Male
Fem
ale
Male
F
emale
Male
Fem
ale
0-4
3971
3808
4525
4304
4758
4477
233
173
0.0
043
0.0
033
5-9
3723
3692
3931
3723
4699
4554
768
831
0.0
163
0.0
186
10-1
44115
4489
3618
3447
4400
4349
782
902
0.0
180
0.0
218
15-1
94452
5033
3635
3586
4615
5161
980
1575
0.0
225
0.0
366
20-2
47554
5425
3897
4131
7868
7458
3971
3327
0.0
849
0.0
671
25-2
95249
3957
4259
4773
8635
7983
4376
3210
0.0
856
0.0
560
30-3
43539
2760
6194
5216
6750
5988
556
772
0.0
075
0.0
123
35-3
93208
2211
6004
4477
5168
4578
-836
101
-0.0
116
0.0
019
40-4
42014
1465
4060
3147
3465
2757
-595
-390
-0.0
122
-0.0
103
45-4
91570
1126
3164
2295
2792
2221
-372
-74
-0.0
098
-0.0
027
50-5
41116
713
2310
1600
1922
1620
-388
20
-0.0
140
0.0
011
55-5
9599
503
1548
1069
1176
1182
-372
113
-0.0
200
0.0
088
60-6
4461
477
1083
687
909
976
-174
289
-0.0
134
0.0
351
65-6
9354
363
623
421
629
660
6239
0.0
008
0.0
472
70-7
4265
304
349
337
438
610
89
273
0.0
213
0.0
676
75+
275
394
322
629
772
981
450
352
0.1
162
0.0
466
Tot
al
42465
36720
49521
43842
58996
55555
9475
11713

Journal of Bhutan Studies, Vol.41, Winter 2019
120
As shown in Table 1, 21188 people have migrated to Thimphu thromde between 2005 and 2017 with higher proportion of women than men. The largest chunk of the migrants are between 15-29 age bracket for both men and women. The estimated population of Thimphu city in 2017 is 93363 without migrants. Using the estimated 2017 population and 2005 population, the natural growth rate of Thimphu thromde comes to 1.49%. Subtracting 1.49% (the natural growth rate) from 3.72% (the annual growth rate of Thimphu thromde) yields the growth rate of migration at 2.23%. Therefore, the growth of Thimphu thromde population is driven more by migration than its rate of natural increase.
Since the number of migrants between 2005 and 2017 has been estimated, the population projection of Thimphu thromde till 2027 will now be proceeded. The mortality by age and gender is given in Table 2. The live birth rate by sex of child and age of mother for Thimphu thromde is available in 2017 PHCB, Table A4.8, p. 158.
Table 2. Mortality in Thimphu thromde, 2017
Gender Age No. of death
Popul-ation
Gender Age No. of death
Popul-ation
Female <1 5 1008 Male <1 7 1079
Female 1-4 5 3469 Male 1-4 7 3679
Female 5-9 4 4554 Male 5-9 4 4699
Female 10-14 3 4349 Male 10-14 1 4400
Female 15-19 3 5161 Male 15-19 6 4615
Female 20-24 4 7458 Male 20-24 8 7868
Female 25-29 6 7983 Male 25-29 11 8635
Female 30-34 10 5988 Male 30-34 23 6750
Female 35-39 10 4578 Male 35-39 22 5168
Female 40-44 11 2757 Male 40-44 23 3465
Female 45-49 11 2221 Male 45-49 18 2792
Female 50-54 16 1620 Male 50-54 24 1922
Female 55-59 21 1182 Male 55-59 19 1176

Population and Migration in Thimphu Thromde
121
Gender Age No. of death
Popul-ation
Gender Age No. of death
Popul-ation
Female 60-64 18 976 Male 60-64 25 909
Female 65-69 17 660 Male 65-69 20 629
Female 70-74 24 610 Male 70-74 32 438
Female 75-79 27 439 Male 75-79 26 350
Female 80-84 29 300 Male 80-84 30 236
Female 85+ 36 242 Male 85+ 33 186
Projecting the Thimphu thromde population from 2017 to 2022 involves a number of calculations. First, using mortality data from Table 2, survival rates are calculated as shown in Table A2. And similarly, number of births for the next five years, from 2017-2022, is calculated using fertility rates of child bearing women. Adding surviving population and number of births gives the natural population in 2022. The total number of migrants from 2017 to 2022 is calculated using migration rate. Therefore, adding the migrants to the natural population gives the total population in Thimphu thromde in 2022. Repeating the steps for the next five years from 2022 gives the projected population of Thimphu thromde in 2027. Table A2 shows the details of population projection.
5975503851004889
653211179
89016251
47503188
25141624
1012794592358284226
5257481650285127
68739522
84435994
42942666
21781609
12701099
775538344311
15000 10000 5000 0 5000 10000 15000
0-45-9
10-1415-1920-2425-2930-3435-3940-4445-4950-5455-5960-6465-6970-7475-7980-84
85+
Thimphu thromde projected population 2022
Female Male
Figure 1. Thimphu thromde projected population pyramid in 2022

Journal of Bhutan Studies, Vol.41, Winter 2019
122
The population of Thimphu thromde is projected to increase to 135354 in 2022, with 66146 females and 69208 males. The number of migrants is projected to increase by 12572 in 2022 from 2017.
61526661
54755723
807584688360
74565703
44142790
20301441
951816
508283266
5,3886,034
5,3436,172
7,2228,009
8,3248,036
5,2674,320
2,6642,243
1,90414501308
548420371
10000 8000 6000 4000 2000 0 2000 4000 6000 8000 10000
0-45-9
10-1415-1920-2425-2930-3435-3940-4445-4950-5455-5960-6465-6970-7475-7980-84
85+
Thimphu thromde projected population 2027
Female Male
Figure 2. Thimphu thromde projected population pyramid in 2027
In 2027, the population of Thimphu thromde is projected to increase to 150595 (which is 31.5% percentage increase from 2017), with 75021 females and 75574 males. The number of migrants is projected to increase by 19998 in 2027 from 2017. The share of the young population, below 15 years, will slightly fall from 23.8% in 2017 to 23.3% in 2027 during to declining fertility, whereas elderly population, 65 and above, will increase by 1% to 4.6% in 2027 from 2017. The share of youth, 15-24, will fall by 3.8% to 18.1% during this decade.

Population and Migration in Thimphu Thromde
123
Migration
Net-migrants in Thimphu thromde
For determining the net-migrants in Thimphu thromde, missing values of previous residence, non-Bhutanese and misreporting of duration of stay in the current gewog/town greater than age are excluded from analysis. The source of data is 2017 PHCB. As mentioned before, migration in this paper refers to change of residence away from his/her previous residence for at least one year. By this definition, there were 59,040 in-migrants (constituting 64.53% of the Thimphu thromde population) while there were 29,158 out-migrants resulting in 29,882 net-migrants in Thimphu thromde. Of those who migrated to Thimphu thromde, 69.5% were from rural areas whereas 30.5% were from urban areas, as shown in Table 3; by sex, 52.06% were females against 47.94% males.
Table 3. Previous residence of migrants to Thimphu thromde, 2017
Area of previous residence Frequency Percent
Urban 18007 30.5
Rural 41033 69.5
Total 59040 100
The migrants mostly comprise of younger age groups among those who migrated to Thimphu thromde. The maximum is found at age group 25-29 at 16.66%. 62.5% of the migrants are between 15-39 years (see Figure 3).

Journal of Bhutan Studies, Vol.41, Winter 2019
124
84
0 2,1
52 3,1
58 4
,29
7
7,6
44
9,8
35
8,4
15
6,6
82
4,3
00
3,5
75
2,4
72
1,6
39
1,2
85
88
9
70
5
51
2
36
7
27
3
1.42
3.64
5.35
7.28
12.95
16.66
14.25
11.32
7.28
6.06
4.19
2.782.18
1.51 1.19 0.87 0.62 0.46
0
2
4
6
8
10
12
14
16
18
0
2000
4000
6000
8000
10000
12000
0-4
5-9
10-1
415
-19
20-2
425
-29
30-3
435
-39
40-4
445
-49
50-5
455
-59
60-6
465
-69
70-7
475
-79
80-8
485
+
% o
f age
gro
up
No.
of m
igra
nts
Number of migrants % of age group
Figure 3. Migrants to Thimphu thromde by age group, 2017
Determinants of migration to Thimphu thromde
For regression analysis, those below 15 years and foreign (non-Bhutanese) migrants in Thimphu thromde are excluded. The foreign migrants constitute a negligible proportion (879 migrants or 1.47% of the total migrants). Missing values of the variables used in the regression are also dropped. This reduces the observation to 50,491. Probit model is used since the dependent variable is a binary variable, taking the value of one for those who are migrants and zero otherwise.
Summary statistics
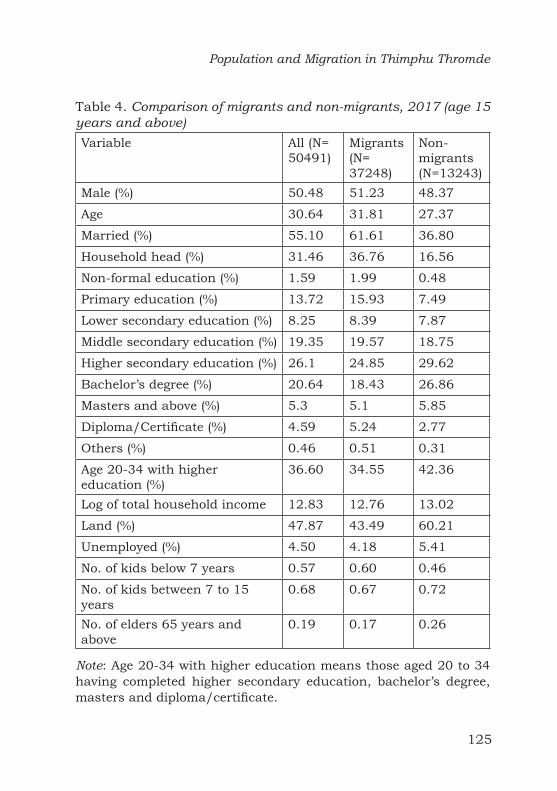
Table 4 shows the summary statistics of the variables, separating out the migrants and non-migrants characteristics. 73.77% were migrants out of 50,491 people.
Population and Migration in Thimphu Thromde
125
Table 4. Comparison of migrants and non-migrants, 2017 (age 15 years and above)
Variable All (N= 50491)
Migrants (N= 37248)
Non-migrants (N=13243)
Male (%) 50.48 51.23 48.37
Age 30.64 31.81 27.37
Married (%) 55.10 61.61 36.80
Household head (%) 31.46 36.76 16.56
Non-formal education (%) 1.59 1.99 0.48
Primary education (%) 13.72 15.93 7.49
Lower secondary education (%) 8.25 8.39 7.87
Middle secondary education (%) 19.35 19.57 18.75
Higher secondary education (%) 26.1 24.85 29.62
Bachelor’s degree (%) 20.64 18.43 26.86
Masters and above (%) 5.3 5.1 5.85
Diploma/Certificate (%) 4.59 5.24 2.77
Others (%) 0.46 0.51 0.31
Age 20-34 with higher education (%)
36.60 34.55 42.36
Log of total household income 12.83 12.76 13.02
Land (%) 47.87 43.49 60.21
Unemployed (%) 4.50 4.18 5.41
No. of kids below 7 years 0.57 0.60 0.46
No. of kids between 7 to 15 years
0.68 0.67 0.72
No. of elders 65 years and above
0.19 0.17 0.26
Note: Age 20-34 with higher education means those aged 20 to 34 having completed higher secondary education, bachelor’s degree, masters and diploma/certificate.

Journal of Bhutan Studies, Vol.41, Winter 2019
126
Compared with non-migrants, migrants are slightly more male (51.23% vs. 48.37%), mostly married (61.61% vs. 36.8%) and household heads (36.76% vs. 16.56%). Although young the average age of migrants is slightly higher than non-migrants. As for education, migrants are mostly from middle secondary education, higher secondary education and bachelor’s degree groups. However, when compared with non-migrants, there are comparatively more migrants from primary education (15.93% vs. 7.49%) and less migrants from bachelor’s degree educational group (18.43% vs. 26.86%). In general, migrants tend to have higher education than non-migrants. To capture the tendency that migrants are mostly young with higher education, a variable was generated for those aged 20 to 34 years having higher education (i.e. those with higher secondary education/12th grade, bachelor’s degree, masters and diploma/certificate). And yet the proportion of migrants aged 20 to 34 years with higher education is lower than its non-migrant counterparts (34.55% vs. 42.36%). Migrants are less likely to have land; the difference is quite large (43.49% vs. 60.21%). There is not much difference between migrants and non-migrants in terms of unemployment, household income, number of children below 7 years, number of children between 7 to 15 years and number of elders 65 years and above.
Regression analysis
The dependent variable being binary probit model is used. It takes the value of one for those who are migrants to Thimphu thromde and zero otherwise. The result of the regression is shown in Table 5. Both the coefficients and marginal effects are reported. The regression has been checked for multicollinearity; VIF are all below 1.85.

Population and Migration in Thimphu Thromde
127
Table 5. Probit model of migration decision
Coefficient Marginal effect
Male -0.0240 -0.0071
(0.0132)
Age 0.0451*** 0.0132
(0.00304)
Age squared -0.000401*** -0.0001
(0.0000382)
Married 0.259*** 0.0781
(0.0171)
Non-formal education 0.377*** 0.0837
(0.0686)
Lower secondary education -0.187*** -0.0518
(0.0296)
Middle secondary education -0.124*** -0.0336
(0.0248)
Higher secondary education -0.187*** -0.0519
(0.0259)
Bachelor’s degree -0.430*** -0.1285
(0.0276)
Masters and above -0.415*** -0.1234
(0.0341)
Diploma/Certificate -0.00865 -0.0023
(0.0389)
Others 0.0371 0.0095
(0.102)
Age 20-34 with higher education 0.0453** 0.0133
(0.0189)
Log of total household income -0.0783*** -0.0229

Journal of Bhutan Studies, Vol.41, Winter 2019
128
(0.00607)
Household head 0.279*** 0.0802
(0.0174)
Land -0.297*** -0.0886
(0.0136)
Unemployed 0.145*** 0.0408
(0.0297)
No. of kids below 7 years 0.0912*** 0.0268
(0.00915)
No. of kids between 7 to 15 years -0.0234*** -0.0069
(0.00724)
No. of elders 65 years and above -0.147*** -0.0431
(0.0131)
Intercept 0.840***
(0.0907)
N 50491
Pseudo R-sq 0.097
Note: Standard errors in parentheses** p<0.05, *** p<0.01The reference group for educational level is primary education. As shown in Table 5, gender is not a significant factor of migration when all factors are considered together (i.e. holding all other factors fixed). Age is a significant factor: as age increase the probability of migration increases but at a declining rate, consistent with the earlier finding (see Figure 3) that most migrants are between the ages 20-34. Marriage significantly increases the probability of migration by 7.8%. Marriages are mostly held when people are young. Household heads are more likely to migrate; the probability of migration increases by 8% when the migrant is a household head. It is highly likely that when the household head migrates other members follow.

Population and Migration in Thimphu Thromde
129
The effect of education on migration is quite unexpected. With reference group as primary education, those with non-formal education are more likely to migrate. However, those with lower secondary, middle secondary and higher secondary education and bachelor’s degree and masters are less likely to migrate to Thimphu thromde compared with those with primary education. This implies that migration to Thimphu thromde is driven largely by low level jobs, which does not require high qualifications. Thimphu thromde do face severe shortage of construction labourers, and hence some are employed as daily wage construction workers. Those with low qualifications works as parking fee collectors, security guards, tailors, and drayang (entertainment centres) performers, among others, in towns and cities. Moreover, there are some cases of educated lot (grade 12 and bachelor’s degree) who have taken up commercial farming in rural areas. As mentioned before, a variable was generated to examine the effect of those who are young (aged 20-34) with higher education (i.e. those with higher secondary education, bachelor’s degree, masters and diploma/certificate). The effect of this variable on the probability of migration is positive and significant although the magnitude of the effect is small at 1.33%. Therefore, it supports the general observation that those who are young and educated tend to migrate to cities. It thus suggest that those who are not young, that is 35 years and above, even if they have higher education, are less likely to migrate to Thimphu thromde. This could be because the returns on human capital declines with the increase in age after crossing a certain point.
An increase in household income by 1% reduces the probability of migration by 2.3%. In other words, those from poor households are more likely to migrate. Those who are unemployed are more likely to migrate than those who are employed. Unemployment increase the probability of migration by 4.1%. Unemployed people migrate to Thimphu city with the expectation of finding jobs, especially high paying productive jobs. Those who do not own any land are more likely to migrate; the probability of migration increases by 8.9%. Land is the main source of rural livelihood and income without which people could be forced to

Journal of Bhutan Studies, Vol.41, Winter 2019
130
migrate to urban areas. Household income, unemployment and land variables are all significant at 1% level.
With regard to household composition, while all the variables are significant, having more children under 7 years does not deter migration. On the contrary it increases the migration probability by 2.7%. However, an increase in school going children between 7 to 15 years does deter migration albeit by a very small proportion. One more kid in this age range decreases the probability of migration by 0.7%. The presence of elderly in the household deters migration by a relatively higher magnitude (one more elderly in the household decreases the migration probability by 4.3%), indicating that family members feels obliged to take care of their older parents and relatives.
Conclusion
Given the significance of Thimphu thromde as the major city in Bhutan and lack of its projection, its population was projected till 2027 using constant fertility and death rates for planning and other uses. The rural areas of Thimphu district do not feature in this study. In the process of projection, the paper showed that the net-migration of Thimphu thromde between 2005 and 2017 stood at 21188, with higher proportion of women than men and young ones dominating the population. It also showed that population growth of Thimphu thromde was driven more by migration than its natural increase. The population of Thimphu thromde is projected to increase to 135,354 in 2022 and 150,595 in 2027, and the number of migrants is projected to increase by 1998 in 2027. The proportion of population below 15 years will slightly decrease to 23.3% while those above 65 years will increase to 4.6% by 2027.
As expected a majority has migrated from rural areas to Thimphu thromde. Migrants to Thimphu thromde are more likely to be young, married, household head, unemployed, landless and from low income background. Among these factors, being landless has the largest effect followed by being head of household, marriage

Population and Migration in Thimphu Thromde
131
and unemployment. An increase in school going children between 7 to 15 years and elderly in the household deters migration; however, an increase in children under 7 years does not deter migration. At higher levels of education, probability of migration decreases compared with primary education whereas those with non-formal education are comparatively more likely to migrate. When an interaction term of age 20-34 and higher education (higher secondary education, bachelor’s degree, masters and diploma/certificate) was included in the regression, the effect was positive and small but significant, indicating that young and educated are somewhat more likely to migrate to Thimphu thromde. It has to be noted that there could be policy variables, such as access to credit, that could influence migration but the census data do not allow to test this in the model. The determinants of migration to Thimphu thromde give an idea about controlling the flows of migration.
References
Arango, J. (2000). Explaining Migration: A Critical Review. International Social Science Journal, 52 (165), pp. 283–296.
Bajaj, M. (2014). Thimphu’s Growing Pains: Challenges of Implementing the City Plan Thimphu: CBS
Chand, R. (2017). Social ecology of immigrant population and changing urban landscape of Thimphu, Bhutan. Journal of Urban and Regional Studies on Contemporary India, 4(1), pp. 1–12.
Harris, J.R. & Todaro, M.P. (1970). Migration, unemployment and development: A two-sector analysis. The American Economic Review, 60(1), pp. 126-142.
Henderson, V. (2003). The urbanization process and economic growth: The so-what question. Journal of Economic Growth, 8, pp. 47-71.

Journal of Bhutan Studies, Vol.41, Winter 2019
132
Hofmann, A. & Wan, G. (2013). Determinants of urbanization. ADB Economics Working Paper Series. No. 355.
Kanbur, R., Christiaensen, L. & De Weerdt, J. (2019). Where to create jobs to reduce poverty: cities or towns? The Journal of Economic Inequality, 17, pp. 543–564
Ministry of Agriculture (2005). Rural-Urban migration in Bhutan. Thimphu: MoA
Ministry of Agriculture and Forests (2013). Migration in Bhutan: Its extent, causes and effects. Thimphu: MoAF
Ministry of Works and Human Settlement (2008). Bhutan National Urbanization Strategy. Thimphu: MoWHS
National Statistics Bureau (2018). 2017 Population & Housing Census of Bhutan. Thimphu: NSB
National Statistics Bureau (2019). Population projections Bhutan 2017-2047. Thimphu: NSB
Piore, M. J. (1979). Birds of Passage: Migrant Labor and Industrial Societies. Cambridge: Cambridge University Press.
Todaro, M.P. (1969). A Model of Labor Migration and Urban Unemployment in Less Developed Countries. The American Economic Review, 59 (1), pp. 138-148.
United Nations, Department of Economic and Social Affairs, Population Division (2015). International Migration Flows to and from Selected Countries: The 2015 Revision (POP/DB/MIG/Flow/Rev.2015)
United Nations, Department of Economic and Social Affairs, Population Division (2019). World Population Prospects 2019: Methodology of the United Nations Population Estimates and Projections.

Population and Migration in Thimphu Thromde
133
Appen
dix
Table
A1.
Est
ima
ted
20
17
pop
ula
tion
of
Th
imp
hu
th
rom
de
Age
2005 p
opu
lati
on
Su
rviv
al ra
tes
2005
fert
ilit
y ra
te
Bir
ths
2005-
2010
2010 p
opu
lati
on
B
irth
s 2010-
2015
2015 p
opu
lati
on
Su
rviv
al ra
tes
Bir
ths
2015-
2017
Est
imate
d
2017 p
opu
lati
on
M
ale
Fem
ale
Male
Fem
ale
Male
Fem
ale
M
ale
Fem
ale
Male
Fem
ale
M
ale
F
emale
0-4
3971
3808
0.9
34
0.9
20
3875
3700
4565
4359
0.9
73
0.9
66
4525
4304
5-9
3723
3692
0.9
81
0.9
96
3709
3502
3619
3402
0.9
92
0.9
98
3931
3723
10-1
44115
4489
0.9
98
0.9
96
3654
3677
3639
3487
0.9
99
0.9
98
3618
3447
15-1
94452
5033
0.9
93
0.9
97
0.0
217
545
4105
4469
484
3645
3661
0.9
97
0.9
99
159
3635
3586
20-2
47554
5425
0.9
96
0.9
95
0.0
986
2675
4422
5018
2474
4077
4456
0.9
98
0.9
98
879
3897
4131
25-2
95249
3957
0.9
89
0.9
97
0.1
395
2760
7524
5400
3767
4405
4995
0.9
95
0.9
99
1394
4259
4773
30-3
43539
2760
0.9
87
0.9
91
0.0
717
990
5189
3947
1416
7438
5386
0.9
95
0.9
96
773
6194
5216
35-3
93208
2211
0.9
75
0.9
82
0.0
384
425
3494
2735
526
5124
3911
0.9
90
0.9
93
301
6004
4477
40-4
42014
1465
0.9
83
0.9
73
0.0
191
140
3129
2171
207
3408
2686
0.9
93
0.9
89
103
4060
3147
45-4
91570
1126
0.9
53
0.9
31
0.0
071
40
1979
1425
51
3075
2113
0.9
81
0.9
72
30
3164
2295
50-5
41116
713
0.9
39
0.9
45
1496
1048
1886
1327
0.9
75
0.9
78
2310
1600
55-5
9599
503
0.9
11
0.8
25
1048
674
1405
991
0.9
64
0.9
26
1548
1069
60-6
4461
477
0.8
67
0.8
99
546
415
955
556
0.9
44
0.9
59
1083
687
65-6
9354
363
0.8
17
0.8
33
400
429
473
373
0.9
22
0.9
30
623
421
70-7
4265
304
0.7
47
0.8
18
289
302
327
358
0.8
90
0.9
23
349
337
75+
275
394
0.3
43
0.6
64
292
510
316
586
0.6
52
0.8
49
322
629
Tot
al
42465
36720
7575
8924
48357
42647
3637
49521
43842
Sou
rce:
Au
thor
’s c
alc
ula
tion
usi
ng
data
fro
m 2
017 P
HC
B

Jou
rna
l of
Bh
uta
n S
tud
ies,
Vol
.41
, W
inte
r 2
01
9
134
Table
A2.
Pop
ula
tion
pro
ject
ion
of
Th
imp
hu
th
rom
de
Age
2017 p
opu
lati
on
Su
rviv
al ra
tes
2017
fert
ilit
y ra
te
Bir
ths
2017-
2022
2022
pop
ula
tion
Mig
rati
on 2
022
2022 p
op.
wit
h
mig
rati
on
Bir
ths
2022-
2027
2027 p
opu
lati
on
Mig
rati
on 2
027
2027 p
op. w
ith
m
igra
tion
M
ale
Fem
ale
Male
Fem
ale
Male
Fem
ale
Male
Fem
ale
Male
Fem
ale
M
ale
Fem
ale
Male
Fem
ale
Male
F
emale
0-4
4758
4477
0.9
79
0.9
84
5850
5170
125
87
5975
5257
5899
5213
253
175
6152
5388
5-9
4699
4554
0.9
96
0.9
96
4659
4406
379
410
5038
4816
5729
5088
932
946
6661
6034
10-1
44400
4349
0.9
99
0.9
97
4679
4534
421
494
5100
5028
4639
4387
835
956
5475
5343
15-1
94615
5161
0.9
94
0.9
97
0.0
081
210
4395
4334
494
793
4889
5127
176
4674
4518
1050
1653
5723
6172
20-2
47868
7458
0.9
95
0.9
97
0.0
653
2435
4585
5146
1947
1727
6532
6873
1680
4367
4321
3709
2900
8075
7222
25-2
98635
7983
0.9
94
0.9
96
0.1
193
4760
7828
7438
3351
2084
11179
9522
4435
4562
5132
3906
2876
8468
8009
30-3
46750
5988
0.9
83
0.9
92
0.0
850
2545
8580
7953
321
490
8901
8443
3380
7778
7410
582
914
8360
8324
35-3
95168
4578
0.9
79
0.9
89
0.0
374
855
6636
5938
-385
56
6251
5994
1109
8435
7887
-979
149
7456
8036
40-4
43465
2757
0.9
67
0.9
80
0.0
120
165
5059
4528
-309
-234
4750
4294
271
6496
5874
-793
-607
5703
5267
45-4
92792
2221
0.9
68
0.9
75
0.0
045
50
3352
2702
-164
-36
3188
2666
61
4893
4439
-479
-118
4414
4320
50-5
41922
1620
0.9
39
0.9
52
2703
2167
-189
11
2514
2178
3245
2636
-454
28
2790
2664
55-5
91176
1182
0.9
22
0.9
14
1805
1542
-181
68
1624
1609
2539
2062
-508
181
2030
2243
60-6
4909
976
0.8
70
0.9
11
1084
1081
-72
190
1012
1270
1664
1409
-222
495
1441
1904
65-6
9629
660
0.8
51
0.8
78
791
889
3210
794
1099
943
985
8465
951
1450
70-7
4438
610
0.6
84
0.8
18
535
579
57
196
592
775
673
780
143
528
816
1308
75-7
9350
439
0.6
80
0.7
28
300
499
58
39
358
538
366
474
142
74
508
548
80-8
4236
300
0.5
07
0.6
02
238
320
46
25
284
344
204
363
79
56
283
420
85+
186
242
0.3
77
0.4
47
190
289
37
22
226
311
192
321
74
50
266
371
Tot
al
58996
55555
11020
5940
6632
69208
66146
11113
67296
63300
8277
11721
75574
75021
Sou
rce:
Au
thor
’s c
alc
ula
tion
usi
ng
data
fro
m 2
017 P
HC
B
Copyright © 2022 FDOKUMEN