Pollinator dependence of Argentinean agriculture: Current status and temporal analysis
11
Received: 3 August, 2009. Accepted: 10 December, 2010. Original Research Paper The Americas Journal of Plant Science and Biotechnology ©2010 Global Science Books Pollinator Dependence of Argentinean Agriculture: Current Status and Temporal Analysis Natacha P. Chacoff 1* • Carolina L. Morales 2 • Lucas A. Garibaldi 2,3 • Lorena Ashworth 4 • Marcelo A. Aizen 2 1 Instituto Argentino de Investigaciones de las Zonas Áridas, CONICET, CC 507, (5500) Mendoza, Argentina 2 Laboratorio Ecotono, Instituto de Investigaciones en Biodiversidad y Medio Ambiente, CONICET-UNCOMA, Pasaje Gutiérrez 1125, (8400) Bariloche, Río Negro, Argentina 3 Departamento de Métodos Cuantitativos y Sistemas de Información, Facultad de Agronomía, Universidad de Buenos Aires, Av. San Martín 4453, (1417) Ciudad Autónoma de Buenos Aires, Argentina 4 Instituto Multidisciplinario de Biología Vegetal, CONICET-UNC, C.C. 495 (5000) Córdoba, Argentina Corresponding author: * [email protected] ABSTRACT A sizable proportion of agricultural production depends directly or indirectly on animal pollination but estimation of the size of this dependence is missing for most countries, even for some of the most important food producers. Here, we evaluate the current status and temporal trends (1961-2007) in pollinator dependency of Argentinean agriculture. We classified crops in categories according to their pollinator dependence, and estimated their harvested area, production, economic and nutritional values. We also estimated the expected production deficit in the absence of pollinators, the extra area needed to cope with this deficit, and trends in honeybee stocks. From a total of 68 crops, animal pollination increased directly production in 37 and indirectly in 13. More than half of the harvested area and total agricultural production corresponded to pollinator dependent crops, a trend highly influenced by the inclusion of soybean as a modestly dependent crop. Highly pollinator-dependent crops produced 2-4 times more income per hectare than any other crop, and modestly dependent crops bear on average the highest protein and fat content. During the study period the production deficit increased three-fold, reaching 12% in 2007, whereas the area needed to compensate for these deficiencies attained 24%. Regarding pollination services, indicators are mixed; whereas Argentinean honey-bee stock triplicates from 1961 to 2007, native forest area, a source of pollinator diversity, shrank to more than half since 1940’s. Experiments testing the degree of pollinator dependency on the quality and quantity of crop production for soybean varieties cultivated in Argentina are urgently needed. Our estimations depict an agriculture that is becoming more dependent on pollinators, but native forests and other native terrestrial habitats, which host most of the country’s pollinator diversity, are decreasing at an alarming rate. _____________________________________________________________________________________________________________ Keywords: crop pollination, pollination service, productivity, soybean, yield Abbreviations: Ha, hectare; Mt, metric ton; U$S, United States Dollars INTRODUCTION In the face of current rapid degradation of terrestrial eco- systems worldwide, there is an increasing need for the study, valuation, and conservation of ecosystem services (Cons- tanza et al. 1997; Chapin et al. 2000; Balvanera et al. 2006). Animal pollination is a key ecosystem service because most of the plants rely to some extent on animal pollination for sexual reproduction (Bawa 1995), including many of the crops that feed us (Free 1993; Roubik 1995). A range of animals that includes bees, bats, birds, beetles, butterflies, flies, moths and wasps are the responsible of the service of animal pollination, thus they provide a high economic and ecological benefits to humans. However bees are the world’s dominant pollinators, as the approximately 17,000 known bee species (Michener 2000) depend on flowers for their survivor. There is growing evidence and concern that pollination services provided by natural or managed pol- linators may increasingly limit crop production (Cane and Tepedino 2001; Biesmeijer et al. 2006; Oldroyd 2007; Ricketts et al. 2008; Aizen et al. 2009a; Aizen and Harder 2009, but see Ghazoul and Koh 2010). Thus, the assessment of the so-called “pollination service” has became a prime topic of applied research in different agro-ecosystems con- texts (Aizen et al. 2009a). This assessment involves esti- mations of both agriculture demand for animal pollination and pollinator availability (Kremen et al. 2004; Aizen and Harder 2009). Despite the importance of animal pollination for agri- culture, it has not been until recently that researchers started conducting detailed studies on how much crop yield depend on pollinator abundance and diversity including studies on watermelon (Kremen et al. 2002), coffee (Roubik 2002; Klein et al. 2003a), atemoya (Blanche and Cunningham 2005), canola (Morandin and Winston 2005), macadamia (Blanche et al. 2006), grapefruit (Chacoff and Aizen 2007; Chacoff et al. 2008), and raspberry (Morales 2009). A recent review reported that pollinating insects increase fruit or seed quantity and/or quality (i.e., fruit or seed weight) of 39 of the 57 major crops worldwide (Klein et al. 2007), concluding that 35% of global food production (in metric tons) comes from crops that depend to some degree on pol- linators (Klein et al. 2007). The pollinator dependence of specific crops could be particularly critical for national or regional economies (e.g., coffee for Colombia, or cacao for some regions in Brazil), see also Ghazoul and Koh (2010). Recently, an economic- ally-focused study estimated that, on average, 9.5% of the value of the world agricultural production used for human food relies directly on animal pollination (Gallai et al. 2009). However, there is large variation in the economical importance of pollinators within and among world regions. Pollinators are particularly important in the agriculture of many countries from Asia, South America and southern Europe (Gallai et al. 2009). Particularly, the value of animal pollination represents a sizable percent of the Gross Natio- ®
Transcript of Pollinator dependence of Argentinean agriculture: Current status and temporal analysis

Received: 3 August, 2009. Accepted: 10 December, 2010. Original Research Paper
The Americas Journal of Plant Science and Biotechnology ©2010 Global Science Books
Pollinator Dependence of Argentinean Agriculture:
Current Status and Temporal Analysis
Natacha P. Chacoff1* • Carolina L. Morales2 • Lucas A. Garibaldi2,3 • Lorena Ashworth4 • Marcelo A. Aizen2
1 Instituto Argentino de Investigaciones de las Zonas Áridas, CONICET, CC 507, (5500) Mendoza, Argentina
2 Laboratorio Ecotono, Instituto de Investigaciones en Biodiversidad y Medio Ambiente, CONICET-UNCOMA, Pasaje Gutiérrez 1125, (8400) Bariloche, Río Negro, Argentina 3 Departamento de Métodos Cuantitativos y Sistemas de Información, Facultad de Agronomía, Universidad de Buenos Aires, Av. San Martín 4453, (1417)
Ciudad Autónoma de Buenos Aires, Argentina 4 Instituto Multidisciplinario de Biología Vegetal, CONICET-UNC, C.C. 495 (5000) Córdoba, Argentina
Corresponding author: * [email protected]
ABSTRACT A sizable proportion of agricultural production depends directly or indirectly on animal pollination but estimation of the size of this dependence is missing for most countries, even for some of the most important food producers. Here, we evaluate the current status and temporal trends (1961-2007) in pollinator dependency of Argentinean agriculture. We classified crops in categories according to their pollinator dependence, and estimated their harvested area, production, economic and nutritional values. We also estimated the expected production deficit in the absence of pollinators, the extra area needed to cope with this deficit, and trends in honeybee stocks. From a total of 68 crops, animal pollination increased directly production in 37 and indirectly in 13. More than half of the harvested area and total agricultural production corresponded to pollinator dependent crops, a trend highly influenced by the inclusion of soybean as a modestly dependent crop. Highly pollinator-dependent crops produced 2-4 times more income per hectare than any other crop, and modestly dependent crops bear on average the highest protein and fat content. During the study period the production deficit increased three-fold, reaching 12% in 2007, whereas the area needed to compensate for these deficiencies attained 24%. Regarding pollination services, indicators are mixed; whereas Argentinean honey-bee stock triplicates from 1961 to 2007, native forest area, a source of pollinator diversity, shrank to more than half since 1940’s. Experiments testing the degree of pollinator dependency on the quality and quantity of crop production for soybean varieties cultivated in Argentina are urgently needed. Our estimations depict an agriculture that is becoming more dependent on pollinators, but native forests and other native terrestrial habitats, which host most of the country’s pollinator diversity, are decreasing at an alarming rate. _____________________________________________________________________________________________________________ Keywords: crop pollination, pollination service, productivity, soybean, yield Abbreviations: Ha, hectare; Mt, metric ton; U$S, United States Dollars INTRODUCTION In the face of current rapid degradation of terrestrial eco-systems worldwide, there is an increasing need for the study, valuation, and conservation of ecosystem services (Cons-tanza et al. 1997; Chapin et al. 2000; Balvanera et al. 2006). Animal pollination is a key ecosystem service because most of the plants rely to some extent on animal pollination for sexual reproduction (Bawa 1995), including many of the crops that feed us (Free 1993; Roubik 1995). A range of animals that includes bees, bats, birds, beetles, butterflies, flies, moths and wasps are the responsible of the service of animal pollination, thus they provide a high economic and ecological benefits to humans. However bees are the world’s dominant pollinators, as the approximately 17,000 known bee species (Michener 2000) depend on flowers for their survivor. There is growing evidence and concern that pollination services provided by natural or managed pol-linators may increasingly limit crop production (Cane and Tepedino 2001; Biesmeijer et al. 2006; Oldroyd 2007; Ricketts et al. 2008; Aizen et al. 2009a; Aizen and Harder 2009, but see Ghazoul and Koh 2010). Thus, the assessment of the so-called “pollination service” has became a prime topic of applied research in different agro-ecosystems con-texts (Aizen et al. 2009a). This assessment involves esti-mations of both agriculture demand for animal pollination and pollinator availability (Kremen et al. 2004; Aizen and Harder 2009).
Despite the importance of animal pollination for agri-culture, it has not been until recently that researchers started conducting detailed studies on how much crop yield depend on pollinator abundance and diversity including studies on watermelon (Kremen et al. 2002), coffee (Roubik 2002; Klein et al. 2003a), atemoya (Blanche and Cunningham 2005), canola (Morandin and Winston 2005), macadamia (Blanche et al. 2006), grapefruit (Chacoff and Aizen 2007; Chacoff et al. 2008), and raspberry (Morales 2009). A recent review reported that pollinating insects increase fruit or seed quantity and/or quality (i.e., fruit or seed weight) of 39 of the 57 major crops worldwide (Klein et al. 2007), concluding that 35% of global food production (in metric tons) comes from crops that depend to some degree on pol-linators (Klein et al. 2007).
The pollinator dependence of specific crops could be particularly critical for national or regional economies (e.g., coffee for Colombia, or cacao for some regions in Brazil), see also Ghazoul and Koh (2010). Recently, an economic-ally-focused study estimated that, on average, 9.5% of the value of the world agricultural production used for human food relies directly on animal pollination (Gallai et al. 2009). However, there is large variation in the economical importance of pollinators within and among world regions. Pollinators are particularly important in the agriculture of many countries from Asia, South America and southern Europe (Gallai et al. 2009). Particularly, the value of animal pollination represents a sizable percent of the Gross Natio-
®

The Americas Journal of Plant Science and Biotechnology 3 (Special Issue 1), 106-116 ©2010 Global Science Books
nal Product for major food-producing countries with an agriculture-based economy such us Argentina.
Beyond their importance in agriculture production, ani-mal pollinators may play an important role at increasing food diversity and for the supply of vital nutrients for human health (Ashworth et al. 2009; Gallai et al. 2009), which is not necessarily reflected in market prizes of crops and food. Although all these potential benefits of animal pollination have been invoked, we are still largely ignorant of the nutritional contribution (proteins, fats and carbohyd-rates) of pollinator dependent crops for human nourishment (Steffan-Dewenter et al. 2005). Despite fragmentary know-ledge, all these different aspects should be contemplated in a thorough evaluation of the role of pollinators in agricul-ture.
Nowadays there are estimations of agriculture depen-dence on pollinators at a global scale (Klein et al. 2007; Gallai et al. 2009), but few estimations are at the country scale (Ashworth et al. 2009). This is important because the national scale is the one at which most decisions regarding agricultural policies are made. Whereas crop commodities in Argentina account for 56% of the per capita gross domes-tic product (FAO-Statistics 2007), no estimations of the im-portance of animal pollination exist for this country. Agri-culture in Argentina is represented by a wide diversity of crops (Appendix 1). Nevertheless, soybean (Glycine max) has become the most important crop in terms of area and total production since the last decade (Paruelo et al. 2005). A temporal analysis revealed that total cultivated area in-creased by about 45% from 1990 to 2006; which reflected the expansion of soybean and resulted in a trend towards homogenization of Argentina’s agricultural landscape (Aizen et al. 2009b). In addition, vast areas of native forest have been fragmented or directly cut down and converted to agriculture (Zak et al. 2004; Gasparri and Grau 2009), prob-ably reducing the abundance and diversity of wild pol-linators (Aguilar et al. 2006; Winfree et al. 2009). Thus, despite the profound changes experienced in the last dec-ades by both agricultural and natural landscapes, we know neither the current level of animal pollination dependence of Argentina’s agriculture nor its temporal dynamics.
In this study, we assess the historical and current impor-tance of pollinators for Argentinean agriculture. Our evalu-ation will help to understand the vulnerability of the coun-try’s economy and, more directly, of food provisioning under a potential scenario of pollinators decline. We apply methods proposed by Aizen et al. (2009a) that had been used at a global level, and also incorporate other dimen-sions to evaluate pollinator importance such us nutritional value of pollinator dependent crops. Specifically, we (a) compared crops with varying degrees of pollinator depen-dence in terms of harvested area (ha), production (Mt), yield (Mt/ha), yield value (U$S/ha), prize (U$S/Mt), and nutritional value (total estimated fat, proteins and total car-bohydrates); (b) evaluated the temporal change in pollinator dependence in terms of total harvested area (ha), and yield value (U$S/ha), (c) estimated the potential production defi-cit in absence of pollinators as well as the area compensa-tion needed to compensate with this deficit and (d) assessed how the pollinator service provided by managed and wild pollinator accommodates to changes in the demand im-posed by pollinator-dependent crops.
METHODS Dataset The Food and Agriculture Organization of the United Nations (FAO) has gathered information on crop cultivation from question-naires sent annually to member countries from which we extracted the information. However, not all the cultivated crops in Argentina are reported by the FAO. For instance, information on non-tradi-tional crops like raspberries and blueberries was not available des-pite they have experienced substantial growth during the last years (Bruzone 2004). Crops or varieties cultivated on a local scale (e.g.
local races of potatoes and maize), that are irrelevant for the eco-nomy at the country scale, are not reported to the FAO either. However, these crops can be important locally, for the welfare and subsistence of local communities. In addition, some agriculture items were discarded from the data set because information on pollinator dependence was not available, or because that item could not be assigned to an identifiable single crop (e.g. groups of crops pooled within a single entry like “vegetable fresh”). Our dataset, therefore, yielded a total of 68 crops that accounted for >99% of the total Argentinean production reported by the FAO.
From the FAO dataset (FAOSTAT 2009), we compiled annual data from 1961 to 2007 on harvested area (ha), production (Mt) and from 1991 to 2006 on producer prize (U$S/Mt). Nutritional values for the cultivated species were obtained from FAO informa-tion for Latin America (FAO-LATINFOODS 2002). FAO tables provide information on 24 different nutritional components. Among them we selected proteins, fat, and carbohydrates (all in units of grams per 100 g of edible part), because they constitute the basic components of the daily human consumption (WHO 1990). Mine-rals, fiber and vitamins are also fundamental in a healthy diet (WHO 1990); however, they were not regularly reported as the components listed above. Nutritional composition of a given food item is reported by each country producing that item, therefore reflecting the actual nutritional value of the food cultivated in that country. When information was not available for an Argentinean product, we used the data reported by the nearest neighbor country in America (Chile, Uruguay, Brazil, Bolivia, Peru or Mexico) pro-ducing that crop.
Information on the degree of dependence of animal pollina-tion for fruit or seed production for each crop was obtained from Klein et al. (2007). When this information was not available, we further obtained pollination dependence data from other sources (see Appendix 1). Crops were classified into two broad pollinator dependence categories, based on whether or not pollinators in-crease production: (a) “dependent” on animal pollination if pol-linators increased to any extent the production of the fruits or seeds for which they are cultivated, (b) “nondependent” if animal pollination does not directly increase the production, either because they produce parthenocarpic fruits (e.g. bananas, pine-apples), are pollinated abiotically (e.g. cereals), autogamously (e.g. lentils) or because they are cultivated for vegetative parts like leaves, steams, tubers (e.g. tea, potatoes) (see Fig. 1). Next, pol-linator-dependent crops were further classified in four sub-cate-gories that better reflect the importance of pollination for yield in-crease. This classification follows Klein et al. (2007) and is based on the magnitude of the reduction in production when pollinators are experimentally excluded from flowers: (a) little (>0-10% production reduction), (b) modest (>10-40%), (c) high (>40-90% reduction) and (d) essential (>90% reduction without pollinators) (see Fig. 1).
Among nondependent crops (i.e., those for which the magni-tude of production reduction in the absence of pollinators is zero), animal pollination might still be important for producing the seeds necessary to cultivation, propagation or for breeding programs; therefore pollinators can indirectly increase or improve the pro-duction in the mid or long term. Thus, nondependent crops were further classified into three classes also following Klein et al. (2007): (a) crops that do not depend on pollinators at all; (b) crops that depend on pollinators only for seed production, and (c) crops that depend on pollinators for breeding (Appendix 1, Fig. 1). Nevertheless, since this study is focused on the direct contribution of pollinators to crop production, non-dependent crops are treated as a single category in most analyses, regardless of the contribu-tion of pollinators for seed propagation and breeding.
Information on stocks of domestic honey bee (Apis mellifera) was also gathered from the FAO database (FAOSTAT 2009). We compiled yearly data on the number of honey bee hives for the period 1961-2006. Finally, official statistics on deforestation in Argentina for the period (1937-2007), were obtained from the Sec-retariat of Environment and Sustainable Development (Secretaría de Ambiente y Desarrollo Sustentable de Argentina 2007: http://www.ambiente.gov.ar/).
107

Pollinator dependence of Argentinean agriculture. Chacoff et al.
Data analysis 1. Current dependence We compared total harvested area (ha), production (Mt), yield (Mt/ha), yield value (U$S/ha), prize (U$S/Mt) and nutritional con-tent (proteins, fat and carbohydrates) between the five different categories of crop pollinator dependence, from essential dependent to the broad nondependent pollinator dependence category (inclu-ding also as non-dependent those crops that depend indirectly on pollinators). To estimate approximate current dependence, we used values of each variable averaged across the last three years for which data were available (2005-2007). As soybean represents the dominant crop in terms of cultivated area in Argentina (see above), we did all the comparisons with and without soybean, which was classified as a modestly dependent crop (Klein et al. 2007). We also estimated the expected nutritional deficit in the absence of pollinators for Argentina. For each year (2005-2007), we calcu-lated the expected percent decrease in nutritional contents (i.e., nutritional deficit of proteins, carbohydrates or fat) in the absence of animal pollination as ND = 100. (� Nit - Nit´) / Nit, where Nit is the nutritional content of crop i multiplied by the crop total pro-duction during year t, and Nit´ = Nit (1-di). The coefficient di ranges from 0 for crops that do not depend on pollinators to 1 for crops that depend fully on pollinators for production. 2. Temporal trends We used data on total harvested area (ha) and total crop production (Mt) to estimate different indices of agricultural pollinator depen-dency for Argentina, considering the magnitude of reduction of production in the absence of pollinators. For each year, we esti-mated the expected percent decrease in agricultural production (i.e., production deficit) in the absence of animal pollination as PD = 100. (� Pit - Pit´) / Pit, where Pit is the production (Mt) of crop i during year t, and Pit´ = Pit (1-di). The coefficient di ranges from 0 for crops that do not depend on pollinators to 1 for crops that depend fully on pollinators for production. For each year, we also calculated the total percent increase in cultivated area needed to balance the production deficit of each crop (i.e., area compensa-tion) as AC = 100. (� Ait - Ait´) / Ait, where Ait is the area (in ha) cultivated with crop i during year t and Ait´ = Ait / (1-di) (i.e., the area needed to produce Pit in the absence of animal pollination).
To see more information on the statistical procedure see Aizen et al. (2009a) and Aizen and Harder (2009). Again, temporal analy-ses were done with and without soybean. RESULTS AND DISCUSSION The group of 68 crops with known pollinator dependence status reported for Argentina in the FAO database includes crops used directly for human food (i.e., cultivated for their edible parts), indirectly for human food (i.e., to feed live-stock) as well as industrial crops (Appendix 1). Out of these 68 crops, 50 (73.5%) depended on pollinators, either directly to increase production (37 crops; i.e. 54.5% of the total) or indirectly to increase propagation or improve breeding (13 crops, 19%). Production of the remaining 18 crops (26.5%) was fully independent of pollinators. The percentage of crops cultivated in Argentina that depend either directly or indirectly on pollinators is similar to that reported for the global scale (74%, Klein et al. 2007) and slightly lower than that for Mexico (80%, Ashworth et al. 2009). However, most pollinator dependent crops are only partially dependent on animal pollination, thus the amount of production directly attributable to animals is much lower than this estimation.
Crops cultivated in Argentina encompassed a variety of categories that includes cereals, pulses (legumes), oil-seed crops, roots and tubers, stimulants, sugar crops, fruits, vege-tables, nuts and spices (Appendix 2). Most fruits, vege-tables and oil-bearing crops, which together represented 58% of the total cultivated crops, depended directly or indi-rectly on pollinators (Appendix 2). At the other extreme, cereals and sugar crops (14.5%) were totally independent on pollinators, while tuber and root crops depended on pol-linators for breeding (Appendix 2). Crops for which the ab-sence of pollinators might cause more than 40% reduction in the production (i.e., those classified in the “high” and “essential” categories) include pumpkins, peaches, pears, plums, watermelons, almonds, apples, mangos and avocados. Crops with modest dependence include soybean, sunflower and rapeseed, while crops with little dependence included oranges and tangerines (Appendix 1).
NON DEPENDENT CROPS:
Pollinators do not increase production, because they are autogamous, wind-pollinated or
cultivated for vegetative parts
DEPENDENT CROPS:
Pollinators increase production of fruits or seeds for which they are cultivated
Totally independent of
pollinators18 crops
Pollinators increase seed-production
needed for cultivation
6 crops
Crops that indirectly depend on pollinators
Pollinators increase seed-production
needed for breeding programs7 crops
Little(>0-10%)14 crops Modest
(>10-40%)9 crops
High(>40-90%)10 crops
Essential(>90-100%)
4 crops
Fig. 1 Pollinator dependence categories used in this study. Between parenthesis, magnitude of reduction of production in the absence of pollinators.
108
The Americas Journal of Plant Science and Biotechnology 3 (Special Issue 1), 106-116 ©2010 Global Science Books
Current dependence (2005-2007) Crops that do not depend on pollinators for production rep-resented 36% of the harvested area, whereas 64% cor-responded to crops with different levels of dependence on animal pollination. However, the harvested area was not homogeneously distributed among the different pollinator-dependence categories. Crops with essential and high de-pendence occupied together only 0.6% of the total harves-ted area, crops with modest dependence others than soybean occupied 9.4% whereas soybean alone occupied 52% (Table 1A). When taking into account only those crops cul-tivated for their seeds or fruits, the percent of area with pollinator dependent crops after removing soybean was 27%, which is slightly lower than that reported for Mexico (33%, Ashworth et al. 2009, Table 1). Finally, the area oc-cupied by non dependent crops mostly reflected the culti-vation of cereals like wheat and corn.
Considering production, we observed the opposite pat-tern. More than half (55.5%) of the total country’s produc-tion (Mt) came from nondependent crops. Only 6.3% bel-onged to crops with high, essential and little dependency, and 38.2% corresponded to modest dependent crops (Table 1A), which was mainly the result of soybean production (34.7%). Despite essential, high and little dependent crops were on average slightly more productive (in Mt/ha) than nondependent crops (Table 1B), and almost five times more productive than soybean (i.e., one hectare cultivated with a essential, highly or little dependent crops produce almost five times the yield of an hectare cultivated with soybean) they contribute very little to the total production, because the area they occupy was orders of magnitude lower than that devoted to non-dependent crops or soybean.
Economically, pollinator dependent crops contributed together with 63% of the economic income derived from agriculture (Table 1A). Soybean alone represented the most valuable crop (39.7%), which was associated to the vast area occupied by this crop (Table 1A). Interestingly, high dependent crops had the highest production value (U$S/Mt), and yield value (U$S/ha) of all crop categories, either con-sidering or not soybean (Table 1B). One hectare cultivated with a high pollinator dependent crop generated 2-4 times the income of one hectare cultivated with any other crop. These results agree with a recent economic valuation of pol-lination service to global agriculture that reported that on average, the value of a Mt of pollinator dependent crops was five times higher than a Mt of nondependent crops (Gallai et al. 2009).
In terms of nutritional contents, dependent crops had aggregately a larger nutritional content, in terms of proteins (80.2%) and fats (95.8%), while nondependent crops at-
tained the majority of the carbohydrates (78.8%, Table 1A). When soybean is excluded, however, nondependent crops (in particular maize and wheat) followed by modestly de-pendent crops (specifically sunflower) are the major protein sources (75.6 and 18%, respectively). The exclusion of soy-bean for the fat sources, lead that modestly dependent crops accounted for 69.3% (mainly due to sunflower), followed 19.5% from non dependent crops (wheat, maize and oats, Table 1A, Appendix 1). Thus, because of the strong area dominance of two modestly dependent crops (soybean and sunflower) with high protein and fat contents, our results only partly agree with the generalization that the major caloric inputs in the human diet comes from a few staple foods with large world production for which animal pollina-tion is irrelevant (Ghazoul 2005). This study represents a first step toward quantifying the quantitative contribution of pollinator dependent crops to nutrients provisioning. Future studies should refine this estimation by taking into account the proportion of total production that is converted to food for each crop.
On average, modestly dependent crops, including soy-bean bear the highest protein and fat content (Table 1B). The five top crops in terms of protein content were depen-dent crops (modestly dependent soybean and sunflower, little dependent groundnut and dry bean, and highly depen-dent almond). The crop with the highest fat content was the non dependent walnut, followed by five dependent crops (modestly dependent soybean and sunflower, little depen-dent ground nut, and highly dependent almond and avo-cado). Accordingly, the expected nutritional deficit in the absence of pollinators was higher for fat production (25%), followed by proteins (20%). Thus pollinators seem to be important to human nutrition (Steffan-Dewenter et al. 2005) by contributing to crops that in the case of Argentina are high in fat and protein content. Although our analysis is missing many other nutritional components like minerals, fiber and vitamins, to our knowledge this work represents the first attempt to take into account the nutritional quality of crops that rely in some extent on pollinators. Temporal trend analysis Overall, the total harvested area in Argentina has increased 2.2 times between 1961 and 2007. This increase has oc-curred mostly due to cultivation of crops with modest dependence on pollinators (Fig. 2A), whose expansion accelerated since the early nineties. This increase in relative and absolute harvested area of crops with modest pollinator dependence can be explained by the rapid expansion of the area devoted to soybean cultivation, whereas other crops did not change substantially during the same period (Fig.
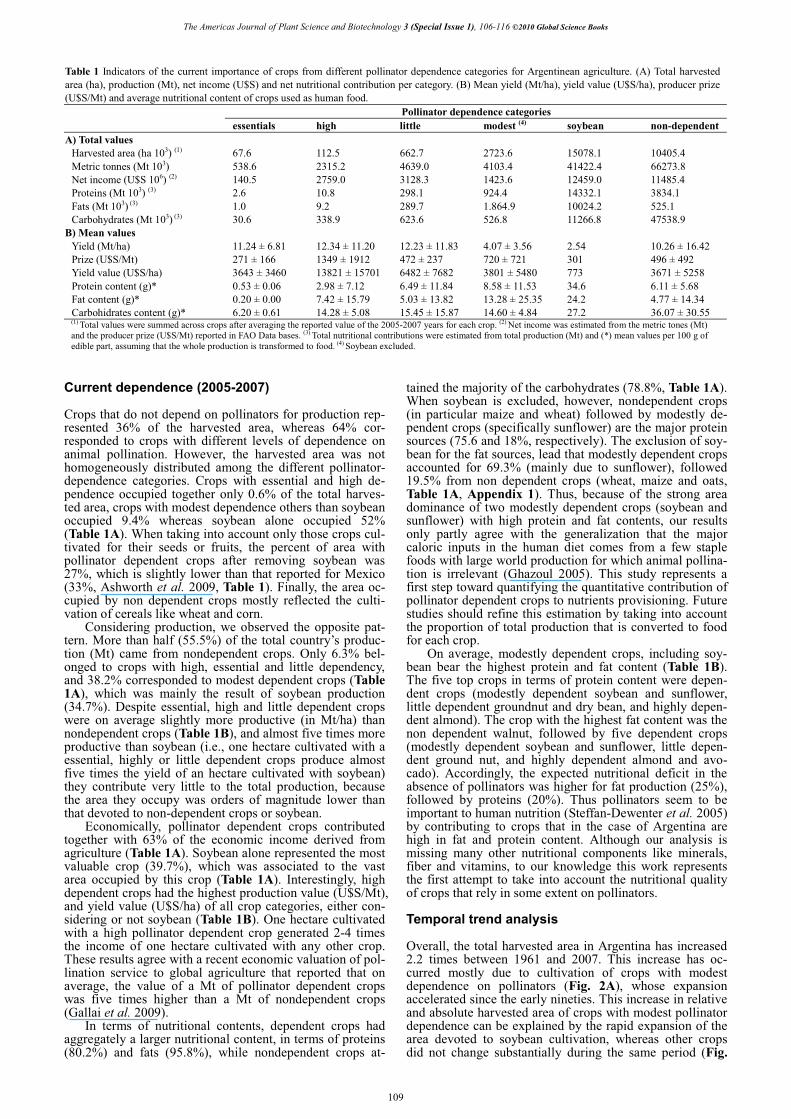
Table 1 Indicators of the current importance of crops from different pollinator dependence categories for Argentinean agriculture. (A) Total harvested area (ha), production (Mt), net income (U$S) and net nutritional contribution per category. (B) Mean yield (Mt/ha), yield value (U$S/ha), producer prize (U$S/Mt) and average nutritional content of crops used as human food.
Pollinator dependence categories essentials high little modest (4) soybean non-dependent
A) Total values Harvested area (ha 103) (1) 67.6 112.5 662.7 2723.6 15078.1 10405.4 Metric tonnes (Mt 103) 538.6 2315.2 4639.0 4103.4 41422.4 66273.8 Net income (U$S 106) (2) 140.5 2759.0 3128.3 1423.6 12459.0 11485.4 Proteins (Mt 103) (3) 2.6 10.8 298.1 924.4 14332.1 3834.1 Fats (Mt 103) (3) 1.0 9.2 289.7 1.864.9 10024.2 525.1 Carbohydrates (Mt 103) (3) 30.6 338.9 623.6 526.8 11266.8 47538.9
B) Mean values Yield (Mt/ha) 11.24 ± 6.81 12.34 ± 11.20 12.23 ± 11.83 4.07 ± 3.56 2.54 10.26 ± 16.42 Prize (U$S/Mt) 271 ± 166 1349 ± 1912 472 ± 237 720 ± 721 301 496 ± 492 Yield value (U$S/ha) 3643 ± 3460 13821 ± 15701 6482 ± 7682 3801 ± 5480 773 3671 ± 5258 Protein content (g)* 0.53 ± 0.06 2.98 ± 7.12 6.49 ± 11.84 8.58 ± 11.53 34.6 6.11 ± 5.68 Fat content (g)* 0.20 ± 0.00 7.42 ± 15.79 5.03 ± 13.82 13.28 ± 25.35 24.2 4.77 ± 14.34 Carbohidrates content (g)* 6.20 ± 0.61 14.28 ± 5.08 15.45 ± 15.87 14.60 ± 4.84 27.2 36.07 ± 30.55 (1) Total values were summed across crops after averaging the reported value of the 2005-2007 years for each crop. (2) Net income was estimated from the metric tones (Mt) and the producer prize (U$S/Mt) reported in FAO Data bases. (3) Total nutritional contributions were estimated from total production (Mt) and (*) mean values per 100 g of edible part, assuming that the whole production is transformed to food. (4) Soybean excluded.
109

Pollinator dependence of Argentinean agriculture. Chacoff et al.
2B). Crops in all dependence categories showed fluctuations
in yield value since 1991; however, there is a constant in-crease in yield value since 2001-2002. This increase is con-siderable stronger for highly dependent crops than for the remaining categories (Fig. 3A, 3B). On the other hand, nondependent crops had low and stable yield values, which can be attributed to stable prizes for cereals (Appendix 1). The greatest value, among highly dependent crops, was achieved by pears, cherries and apples (Appendix 1).
During the study period the production deficit increased by a factor of three, from nearly 4% in 1961 to 12% in 2007 (Fig. 4A), which follows a more global trend of increasing pollinator dependency in agriculture. This figure is in ac-cordance to the predicted production deficit for the deve-loping countries for the last years of the first decade of the 2000, which was nearly 8% (Aizen et al. 2009a). This trend,
however, can be mostly attributed to the soybean expansion because the exclusion of soybean resulted in a more or less constant mean of 4% of production deficit over the entire period (Fig. 4A).
The area to compensate for this production deficit also increased since 1970 (from 16 to 24%) albeit fluctuations (Fig. 4B). However, when soybean was excluded from the analysis, the opposite temporal trend emerges; between 1980 and 1990 the area of compensation increases from 16 to 20%, falling since then onward. Beyond the soybean effect, our results show that crop production will suffer sub-stantial deficits in case of pollination shortage as a con-sequence of increasing dependence of Argentinean agricul-ture on pollinators, which, as proposed by Aizen et al. (2009a) will intensify the demand for agricultural land.
Regarding domesticated pollinators, the Argentinean stock of honey bees triplicated since 1961. Despite the per-
A. All crops
1960 1970 1980 1990 2000 20100
1.0×10⁷
2.0×10⁷
3.0×10⁷
Year
B. Without soybean
1960 1970 1980 1990 2000 20100
1.0×10⁷
2.0×10⁷
3.0×10⁷
Year
Har
vest
ed a
rea
(Ha)
None
Little
Modest
High
Essential
Fig. 2 Temporal trends in harvested area from 1961 to 2007 in Argentina, as reported by the FAO. Trends consider all crops (A) and excluding soybean, the crop that currently occupies the greatest area (B). Crops were grouped according to its pollinator dependence level (gray scale), based on the magnitude of the reduction in yield in the absence of pollinators.
A. All crops
1990 1995 2000 20050
5000
10000
15000
20000
Year
B. Without soybean
1990 1995 2000 20050
5000
10000
15000
20000
Year
Yiel
d va
lue
(U$S
/ H
a)
NoneLittleModestHighEssential
Fig. 3 Temporal trends in yield value (U$S/ha) from 1991 to 2006. Yield values are averaged among crops within each pollinator dependence category, considering all crops (A) and without soybean (B).
1960 1970 1980 1990 2000 20100
10
20
30
Year
Are
a co
mpe
nsat
ion
(%)
1960 1970 1980 1990 2000 20100
5
10
15
Year
Prod
uctio
n de
ficit
(%) A B
All cropsWithout Soybean
Fig. 4 Temporal trends in pollinator dependence of Argentinean agriculture. Trends estimated as production deficits in the absence of animal pollination (A), and surplus cultivated land required to compensate the deficits in crop production (B) for Argentina during 1961-2007. Area compensation was estimated assuming that the pollinator dependence of individual crops was represented by the mid-value of the range defining its dependence class (average-area compensation) and by the lower limit of the range (minimum-area compensation). Black lines show all crops, while gray lines represent all crops excluding soybean and considering soybean as non dependent (ND).
110

The Americas Journal of Plant Science and Biotechnology 3 (Special Issue 1), 106-116 ©2010 Global Science Books
manent growth of the honeybee stock, which suffered only three minor drops (1982, 1986 and 1997), the more pro-nounced increase occurred between 1998 and 2001 (Fig. 5A). This exponential increase can not be interpreted as a response to an increasing demand of pollination services, because the only crop that increased in harvested area in a similar way during that time period was soybean, which in Argentina is produced without the use of managed honey-bee colonies. The constant increase in the number of honey bees may be associated with an increase in the world-demand for honey (Aizen and Harder 2009). Argentina is today the second world honey producer (Bradbear 2008), and most of its honey production is exported. Additionally, honey-bee managing for pollination is not a common prac-tice in the country.
On the other hand, at the country scale, native forests have retracted nearly 9 .109 hectares from 1937 to 2007 (Fig. 5B). Native forests are the habitat of many pollinator spe-cies important for crops, as reflected by the augmented pol-lination of grapefruits in proximity of forest in NW Argen-tina (Chacoff et al. 2008). Therefore, this reduction might indicate a decline in wild pollinators population and in the availability of free pollinator services, in particular in sub-tropical regions of Argentina, where deforestation has been more pronounced (Gasparri and Grau 2009), in parallel with the expansion of soybean cultivation. These results support the findings of studies in several world regions reporting declines in the abundance and diversity of wild pollinators due to habitat destruction and environmental degradation (Ricketts et al. 2008; Winfree et al. 2009). CONCLUSIONS In Argentina, where agriculture represents the main income source for the country, there are many crops that benefit to different extent from animal pollination. Animal pollination is expected to improve yield of 72.5% of all cultivated crops. In terms of area, pollinator dependent crops occupy 64% of the total cultivated area and 45% of total production measured in metric tons. However, because most crops are not entirely dependent on animal pollination, the amount of production directly attributable to pollinators is smaller than the total estimations (Fig. 4A). In addition, these patterns are mostly driven by the strong dominance of soybean in Argentine agriculture.
On the other hand, the proportion of land occupied by high dependent crops in Argentina is remarkable low. An economic valuation of this situation would make us revise our policies, since these type of crops are, by far, those which produce the highest income per area. Given the high environmental heterogeneity existing in Argentina, active policies promoting cultivation of a diversity of valuable pollinator dependent crops is not only feasible but also desi-rable, particularly considering the pervasive expansion and increasing reliance on soybean.
Our current trend analysis suggests that agriculture is
becoming more dependent on animal pollination, which implies that in the absence of pollinators there would be a 12% of deficit in production and an increase in 25% more cultivated area to cope with this deficit. This would prob-ably increase the pressure to transform vast areas of forest, to produce crops, or import them from other areas (Deutsch and Folke 2005). The absence of pollinators might also change the composition of different nutrients in our diets, represented by a deficit of 20% in protein and 25% in fat; however, since a significant proportion of agriculture pro-duction is exported, or is not directly used as human food, it is difficult to estimate a realistic nutritional deficit.
Given the overall dominance of soybean for all study variables, many of the results, are highly influenced by the category of pollinator dependence assigned to soybean. Since the pollinator dependence might vary among different varieties cultivated in Argentina, we need more detailed estimations on the actual area cultivated and the degree of pollinator dependence of each variety to better understand the importance of pollinators for this currently dominant crop, to obtain a more accurate picture of the pollinator dependence of Argentinean agriculture.
Argentina has been losing original native forests at an alarming high rate, reaching one of the highest deforestation rates in South America (PNUMA-GEO 2003; Montenegro et al. 2004), mostly possibly due to the soybean crop expan-sion during the last decades. A recent National Forestry Law (Law 26331 Ley de Presupuestos mínimos de protect-ción ambiental de los Bosques Nativos) is precisely aimed at restricting deforestation in the long run. Therefore, management strategies for maintaining and/or enhancing crop yield should be oriented to ensure efficient and predic-table pollination services. Several studies have demons-trated that the efficiency and stability of pollination services are directly related to pollinator diversity (Klein et al. 2003b; Kremen 2004; Greenleaf and Kremen 2006) and, thus, are indirectly related to preserving the area, structure, and composition of natural habitats. ACKNOWLEDGEMENTS We thank Adalberto Hugo Di Benedetto for his invitation to do this work. NP Chacoff, CL Morales, L Ashworth and MA Aizen are career researchers and L Garibaldi has a doctoral fellow with CONICET. Research was funded through grants from CONICET (PIP 112 200801 02781 and PIP 0430) and FONCYT (PICT 2007-01471). REFERENCES * In Spanish ** In Spanish with English abstract Aguilar R, Ashworth L, Galetto L, Aizen MA (2006) Plant reproductive sus-
ceptibility to habitat fragmentation: Review and synthesis through a meta-analysis. Ecology Letters 9, 968-980
Aizen MA, Garibaldi LA, Cunningham SA, Klein AM (2009a) How much
1960 1970 1980 1990 2000 20100
1.0×10⁶
2.0×10⁶
3.0×10⁶
Year
Bee
hive
s (n
º)
1930 1950 1970 1990 20102.5×1010
3.0×10¹⁰
3.5×10¹⁰
4.0×10¹⁰
Year
Fore
st a
rea
(ha)
A B
Fig. 5 Commercial beehives and deforestation trends in Argentina. (A) Number of commercial beehives in Argentina from 1961 to 2007, as reported by the FAO. (B) Deforestation levels from 1937 to 2008, adapted from the 2007 Report on Deforestation in Argentina. Source: Secretariat of Environment and Sustainable Development of Argentina.
111

Pollinator dependence of Argentinean agriculture. Chacoff et al.
does agriculture depend on pollinators? Lessons from long-term trends in crop production. Annals of Botany 103, 1579-1589
Aizen MA, Garibaldi LA, Dondo M (2009b) Expansión de la soja y diversi-dad de la agricultura argentina. Ecología Austral 19, 45-54**
Aizen MA, Harder LD (2009) The global stock of domesticated honey bees is growing slower than agricultural demand for pollination. Current Biology 19, 1-4
Ashworth L, Quesada M, Casas A, Aguilar R, Oyama K (2009) Pollinator-dependent food production in Mexico. Biological Conservation 142, 1050-1057
Balvanera P, Pfisterer AB, Buchmann N, He JS, Nakashizuka T, Raffaelli D, Schmid B (2006) Quantifying the evidence for biodiversity effects on eco-system functioning and services. Ecology Letters 9, 1146-1156
Bawa KS (1995) Pollination, seed dispersal and diversification of angiosperms. Trends in Ecology and Evolution 10, 311-312
Biesmeijer JC, Roberts SPM, Reemer M, Ohlemuller R, Edwards M, Peeters T, Schaffers AP, Potts SG, Kleukers R, Thomas CD, Settele J, Kunin WE (2006) Parallel declines in pollinators and insect-pollinated plants in Britain and the Netherlands. Science 313, 351-354
Blanche KR, Ludwig JA, Cunningham SA (2006) Proximity to rainforest enhances pollination and fruit set in orchards. Journal of Applied Ecology 43, 1182-1187
Blanche R, Cunningham SA (2005) Rain forest provides pollinating beetles for atemoya crops. Journal of Economic Entomology 98, 1193-1201
Bradbear N (2008) Honey marketing and international trade. In: Bees and their Role in Forest Livelihoods, Food and Agriculture Organization of the United Nations, Rome. Available online:
ftp://ftp.fao.org/docrep/fao/012/i0842e/i0842e16.pdf Bruzone A (2004) Frutas finas en los valles cordilleranos patagónicos. In:
Dirección Nacional de Alimentación. Available online: http://www.alimentosargentinos.gov.ar/0-3/revistas/r_24/Frutas_finas.htm *
Cane J, Tepedino V (2001) Causes and extent of declines among native North American invertebrate pollinators: Detection, evidence, and consequences. Conservation Ecology 5, 1
Chacoff NP, Aizen MA (2007) Pollination requirements of pigmented grape-fruit (Citrus paradisi Macf.) from Northwestern Argentina. Crop Science 47, 1143-1150
Chacoff NP, Aizen MA, Aschero V (2008) Proximity to forest edge does not affect crop production despite pollen limitation. Proceedings of the Royal Society B: Biological Sciences 275, 907-913
Chapin FS, Zavaleta ES, Eviner VT, Naylor RL, Vitousek PM, Reynolds HL, Hooper DU, Lavorel S, Sala OE, Hobbie SE, Mack MC, Diaz S (2000) Consequences of changing biodiversity. Nature 405, 234
Constanza R, d'Arge R, Groot R, Farber S, Grasso M, Hannon B, Limburg K, O'Neill RV, Paruelo J, Raskin RG, Sutton P, van der Belt M (1997) The value of the world's ecosystem services and natural capital. Nature 387, 253-260
Deutsch L, Folke C (2005) Ecosystem subsidies to Swedish food consumption from 1962 to 1994. Ecosystems 8, 512-528
FAO-LATINFOODS (2002) Tabla de Composición de Alimentos de América Latina. FAO, http://www.rlc.fao.org/bases/alimento
FAO-Statistics (2007) FAO Statistical Yearbook: Country Profiles (2005-2006 Edn), FAO FS Division. Available online:
http://www.fao.org/ES/ess/yearbook/vol_1_2/pdf/Argentina.pdf FAOSTAT (2009) Available online: http://faostat.fao.org/site/526/default.aspx Free JB (1993) Insects Pollination of Crops, Academic Press, New York, 768
pp Gallai N, Salles JM, Setteled J, Vaissière BE (2009) Economic valuation of
the vulnerability of world agriculture confronted with pollinator decline Eco-logical Economics 68, 810-821
Gasparri NI, Grau HR (2009) Deforestation and fragmentation of Chaco dry forest in NW Argentina (1972–2007). Forest Ecology and Management 258, 913-921
Ghazoul J (2005) Buzziness as usual? Questioning the global pollination crisis. Trends in Ecology and Evolution 20, 367
Ghazoul J, Koh LP (2010) Food security not (yet) threatened by declining pol-lination. Frontiers in Ecology 8, 9-10
Greenleaf SS, Kremen C (2006) Wild bee species increase tomato production and respond differently to surrounding land use in Northern California. Bio-logical Conservation 133, 81-87
Klein A, Vaissiere B, Cane J, Steffan-Dewenter I, Cunningham S, Kremen C, Tscharntke T (2007) Importance of pollinators in changing landscapes for world crops. Proceedings of the Royal Society B: Biological Sciences 274, 303-313
Klein AM, Steffan-Dewenter I, Tscharntke T (2003a) Bee pollination and fruit set of Coffea arabica and C. canephora (Rubiaceae). American Journal of Botany 90, 153-157
Klein AM, Steffan-Dewenter I, Tscharntke T (2003b) Fruit set of highland coffee increases with the diversity of pollinating bees. Proceedings of the Royal Society of London B 270, 955-961
Kremen C (2004) Pollination services and community composition: Does it depend on diversity, abundance, biomass, or species traits? In: Freitas B, Pereira JOP (Eds) Proceedings of the International Workshop on Solitary Bees and their Role in Pollination, 26-29 April, Beberibe, Ceará, Brazil, pp 115-124
Kremen C, Williams NM, Bugg RL, Fay JP, Thorp RW (2004) The area re-quirements of an ecosystem service: Crop pollination by native bee com-munities in California. Ecology Letters 7, 1109-1119
Kremen C, Williams NM, Thorp RW (2002) Crop pollination from native bees at risk from agricultural intensification. Proceedings of the National Academy of Sciences USA 99, 16812-16816
Michener CD (2000) Bees of the World, The Johns Hopkins University Press, Baltimore, USA and London, UK, 913 pp
Montenegro C, Gasparri I, Manghi E, Strada M, Bono J, Parmuchi MG (2004) Informe sobre deforestación en Argentina. Unidad de Manejo del Sistema de Evaluación Forestal. Dirección de Bosques. Secretaría de Ambi-ente y Desarrollo Sustentable. Ministerio de Salud y Ambiente. Argentina, 8 pp*
Morales CL (2009) Pollination requirements of Raspberry in SW Argentina. Prelimary Results. The International Journal of Plant Reproductive Biology 1, 195-198
Morandin LA, Winston ML (2005) Wild bee abundance and seed production in conventional, organic, and genetically modified canola. Ecological Ap-plications 15, 871-881
Oldroyd BP (2007) What's killing American honey bees? PLoS Biology 5, e168 Paruelo JM, Guerschman JP, Verón SR (2005) La transformación de la agri-
cultura Argentina. Ciencia Hoy 15, 14-23* PNUMA-GEO (2003) America Latina y el Caribe: Perspectivas del Medio
Ambiente, San José de Costa Rica, 281 pp* Ricketts TH, Regetz J, Steffan-Dewenter I, Cunningham SA, Kremen C,
Bogdanski A, Gemmill-Herren B, Greenleaf SS, Klein AM, Mayfield MM, Morandin LA, Ochieng' A, Viana BF (2008) Landscape effects on crop pollination services: are there general patterns? Ecology Letters 11, 499-515
Roubik DW (1995) Pollination of Cultivated Plants in the Tropics, FAO Agri-cultural services bulletin, Rome, 198 pp
Roubik DW (2002) Feral African bees augment neotropical coffee yield. In: Kevan P, Imperatriz-Fonseca V (Eds) Pollinating Bees: The Conservation Link between Agriculture and Nature, Ministry of Environment: Secretariat for Biodiversity and Forests, Brasilia, Brazil, pp 255-266
Steffan-Dewenter I, Potts SG, Packer L (2005) Pollinator diversity and crop pollination services are at risk. Trends in Ecology and Evolution 20, 651
WHO (1990) Diet, nutrition and the prevention of chronic diseases. TR Series. Geneva: World Health Organization
Winfree R, Aguilar R, Vázquez DP, LeBuhn G, Aizen MA (2009) A meta-analysis of bees’ responses to anthropogenic disturbance. Ecology 90, 2068-2076
Zak MR, Cabido M, Hodgson JG (2004) Do subtropical seasonal forests in the Gran Chaco, Argentina, have a future? Biological Conservation 120, 589-598
112

The Americas Journal of Plant Science and Biotechnology 3 (Special Issue 1), 106-116 ©2010 Global Science Books
Appendix 1 List of crops classified according to pollinator dependency and FAO category. For each crop we reported the nutritional content, harvested area (ha), production (Mt), yield (Mt/ha), producer prize (U$S/Mt) and income (U$S/ha). Crop species Commodity FAO Pollinator
dependence Dependence level
FAO crop categories
mean harvested area (ha 103, 2005-2007)
mean Mt/ha (2005-2007)
Aleurites fordii (1) Tung nuts increase essential oil bearing crop 33.00 1.09 Amygdalus communis (syn. P. dulcis) Almonds, with shell increase high nut 0.26 1.85 Arachis hypogaea Groundnuts, with shell increase little pulses 195.23 3.04 Brassica napus Oilseeds, Nes increase modest oil bearing crop � � Brassica napus Rapeseed increase modest oil bearing crop 10.72 2.43 Capsicum annuum, C. fructescens, Pimenta dioica (syn. P. officinalis, P. dioica)
Chillies and peppers, green
increase little spice 7.00 17.86
Carica papaya Papayas increase little fruit 0.16 13.21 Carthamus tinctorius Safflower seed increase little oil bearing crop 33.18 1.54 Citrullus lanatus Watermelons increase essential vegetable 9.16 13.72 Citrus aurantifolia, C. aurantium, C. bergamia, C. grandis, C. limetta, C. limon, C. maxima, C. medica (var. cedrata), C. myrtifolia, C. paradisi, C. reticulata, C. sinensis, C. unshiu, Fortunella japonica
Grapefruit (incl. pomelos)
increase little fruit 14.23 19.16
Citrus aurantifolia, C. aurantium, C. bergamia, C. grandis, C. limetta, C. limon, C. maxima, C. medica (var. cedrata), C. myrtifolia, C. paradisi, C. reticulata, C. sinensis, C. unshiu, Fortunella japonica
Lemons and limes increase little fruit 47.00 31.88
Citrus aurantifolia, C. aurantium, C. bergamia, C. grandis, C. limetta, C. limon, C. maxima, C. medica (var. cedrata), C. myrtifolia, C. paradisi, C. reticulata, C. sinensis, C. unshiu, Fortunella japonica
Oranges increase little fruit 61.33 14.44
Citrus aurantifolia, C. aurantium, C. bergamia, C. grandis, C. limetta, C. limon, C. maxima, C. medica (var. cedrata), C. myrtifolia, C. paradisi, C. reticulata, C. sinensis, C. unshiu, Fortunella japonica
Tangerines, mandarins, clementines
increase little fruit 31.00 14.52
Cucumis melo Other melons (incl. cantaloupes)
increase essential vegetable 5.10 15.59
Cucurbita maxima, C. mixta, C. moschata, C. pepo
Pumpkins, squash and gourds
increase essential vegetable 20.33 14.56
Cydonia oblonga (2) Quinces increase high fruit 3.16 8.12 Ficus carica Figs increase modest fruit 0.26 3.30 Fragaria ssp. Strawberries increase modest fruit 0.94 9.38 Glycine max, G. soja Soybeans increase modest pulses 15,078.13 2.54 Gossypium hirsutum, G. barbadense, G. arboreum, G. herbaceum
Seed cotton increase modest oil bearing crop 327.63 1.37
Helianthus annuus Sunflower seed increase modest oil bearing crop 2,382.33 1.60 Linum usitatissimum Flax fibre and tow increase little oil bearing crop 2.80 0.68 Linum usitatissimum Linseed increase little oil bearing crop 37.56 0.96 Lupinus angustifolius (3) Lupins increase modest pulses 0.09 1.41 Lycopersicon esculentum Tomatoes increase little vegetable 17.44 38.69 Malus domestica Apples increase high fruit 43.67 27.62 Mangifera indica Mangoes,
mangosteens, guavasincrease high fruit 0.25 7.44
Persea americana Avocados increase high fruit 0.55 6.23 Phaseolus spp. (P. vulgaris, P. lunatus, P. angularis, P. aureus, P. mungo, P. coccineus, P. calcaratus, P. aconitifolius, P. acutifolius
String beans increase little vegetable 5.43 8.28
Prunus armeniaca Apricots increase high fruit 2.30 10.87 Prunus avium, Prunus cerasus Cherries increase high fruit 1.36 4.92 Prunus domestica, P. spinosa Plums and sloes increase high fruit 15.29 8.34 Prunus persica, Persica laevis Peaches and
nectarines increase high fruit 25.67 10.62
Pyrus communis Pears increase high fruit 20.00 37.44 Vicia faba Broad beans, horse
beans, dry increase modest pulses 1.67 8.98
Vigna spp., V. unguiculata, V. subterranea (syn. Voandzeia subterranea), Phaseolus spp.
Beans, green increase little vegetable 0.66 6.20
Allium cepa, A. ascalonicum, A. fistulosum Onions, dry increase - seed production
no increase vegetable 24.67 31.00
Allium sativum Garlic increase - breeding no increase vegetable 15.03 7.75 Ananas comosus Pineapples increase - breeding no increase fruit 0.17 18.61 Asparagus officinalis Asparagus increase - seed
production no increase vegetable 1.79 3.91
113

Pollinator dependence of Argentinean agriculture. Chacoff et al.
Appendix 1 (Cont.) Crop species Commodity FAO Pollinator
dependence Dependence level
FAO crop categories
mean harvested area (ha 103, 2005-2007)
mean Mt/ha (2005-2007)
Avena spp., mainly Avena sativa Oats no increase no increase cereal 171.75 1.32 Camellia sinensis (1) Tea increase - seed
production no increase stimulant 37.45 1.81
Cicer arietinum Chick peas no increase no increase pulses 1.47 1.02 Cynara sp. (1) Artichokes increase - breeding no increase vegetable 4.63 18.99 Daucus carota Carrots and turnips increase -seed
production no increase vegetable 9.60 23.96
Eleusine coracana, Eragrostis abyssinica, Panicum miliaceum, Paspalum scrobiculatum, Pennisetum glaucum, Setaria italica
Millet no increase no increase cereal 9.79 1.66
Hordeum distichon, H. hexastichon, H. vulgare Barley no increase no increase cereal 347.86 2.57 Humulus lupulus (1) Hops no increase no increase stimulant 0.24 1.20 Ilex paraguayensis (4) Mate increase - seed
production no increase stimulant 154.00 1.72
Ipomoea batatas Sweet potatoes increase - breeding no increase roots and tuber 23.87 15.92 Juglans regia (1) Walnuts, with shell no increase no increase nut 3.65 2.47 Lens esculenta Lentils no increase no increase pulses 1.60 1.56 Manihot esculenta, syn. M. utilissima, M. palmata
Cassava increase - breeding no increase roots and tuber 71.57 2.52
Musa sapientum, M. cavendishii, M. nana, M. paradisiaca
Bananas increase - breeding no increase fruit 8.60 20.93
Nicotiana tabacum (1) Tobacco leaves increase - seed production
no increase stimulant 90.67 1.80
Olea europaea Olives no increase no increase oil bearing crop 39.00 3.97 Oryza ssp. (mainly O. sativa) Rice, paddy no increase no increase cereal 164.00 5.83 Phalaris canariensis (*) Canary seed no increase no increase cereal 12.41 1.33 Pisum sativum, P. arvense Peas, dry no increase no increase pulses 24.67 1.26 Pisum sativum, P. arvense Peas, green no increase no increase vegetable 12.61 2.02 Saccharum officinarum Sugar cane no increase no increase sugar crop 286.55 85.15 Secale cereale Rye no increase no increase cereal 35.48 2.59 Solanum tuberosum Potatoes increase - breeding no increase roots and tuber 66.33 26.96 Sorghum guineense, S. vulgare, S. durra Sorghum no increase no increase cereal 555.20 5.21 Triticum spp. (mainly T. aestivum, T. durum, T. spelta)
Wheat no increase no increase cereal 5,324.24 2.36
Vitis vinifera Grapes no increase no increase fruit 216.94 13.04 Zea mays Maize no increase no increase cereal 2,689.56 7.62
* Wind pollinated cereal * average values per 100 g of edible part Sources of pollinator dependence data: (1) Crane E, Walker P (1984) Pollination directory of World crops. International Bee Research Association. UK. (2) Benedek P, Szabó T, Nyéki J (2001) New results on the bee pollination of quince (Cydonia oblonga Mill.). Acta Horticulturae 561, 243-248. (3) Manning R (2006) Honeybee pollination: Technical data for potential honeybee-pollinated crops and orchards in Western Australia. In Dept. of Agriculture of West Australia, http://www.agric.wa.gov.au/content/aap/hbh/bulletin4298_index.htm. South Perth: Research Officer, Animal Research and Development Services. (4) Dolce NR, Rey HY (2006) Cultivo in vitro de ápice de Ilex paraguariensis: efecto del pretratamiento con medios líquidos sobre la brotación. In: Comunicaciones Científicas y Tecnológicas, http://www.unne.edu.ar/Web/cyt/cyt2006/05-Agrarias/2006-A-026.pdf. Corrientes: Universidad Nacional de Corrientes. Data on the remaining crops was obtained from Klein A, Vaissiere B, Cane J, Steffan-Dewenter I, Cunningham S, Kremen C, Tscharntke T (2007) Importance of pollinators in changing landscapes for world crops. Proceedings of the Royal Society B: Biological Sciences 274, 303-313.
114

The Americas Journal of Plant Science and Biotechnology 3 (Special Issue 1), 106-116 ©2010 Global Science Books
Appendix 1 (Cont.) Crop species mean Mt
103 (2005-2007)
mean U$S/Mt (2004-2006)
mean U$S/ha (2004-2006)
Net income (U$S)
Proteins (g)**
Fats (g)**
Carbo-hydrates (g)**
Aleurites fordii (1) 36.00 144.12 96.22 5.19 � � � Amygdalus communis (syn. P. dulcis) 0.49 914.76 1,743.97 0.45 23.20 45.8 22.8 Arachis hypogaea 601.15 528.09 1,484.84 317.46 33.20 44.3 11.1 Brassica napus 0.00 135.45 � � � � � Brassica napus 15.46 315.57 453.69 4.88 � � � Capsicum annuum, C. fructescens, Pimenta dioica (syn. P. officinalis, P. dioica)
126.00 516.72 8,702.83 65.11 1.50 0.5 7.7
Carica papaya 2.20 471.48 6,398.61 1.04 0.50 0.1 12.8 Carthamus tinctorius 28.90 300.94 239.49 8.70 � � � Citrullus lanatus 125.79 193.94 2,667.03 24.40 0.50 0.2 6.9 Citrus aurantifolia, C. aurantium, C. bergamia, C. grandis, C. limetta, C. limon, C. maxima, C. medica (var. cedrata), C. myrtifolia, C. paradisi, C. reticulata, C. sinensis, C. unshiu, Fortunella japonica
207.90 318.11 4,699.66 66.14 0.80 0.2 12.2
Citrus aurantifolia, C. aurantium, C. bergamia, C. grandis, C. limetta, C. limon, C. maxima, C. medica (var. cedrata), C. myrtifolia, C. paradisi, C. reticulata, C. sinensis, C. unshiu, Fortunella japonica
1,336.14 781.03 22,500.05 1,043.56 0.90 0.6 8.7
Citrus aurantifolia, C. aurantium, C. bergamia, C. grandis, C. limetta, C. limon, C. maxima, C. medica (var. cedrata), C. myrtifolia, C. paradisi, C. reticulata, C. sinensis, C. unshiu, Fortunella japonica
805.62 981.96 12,978.22 791.09 0.80 0.2 13.5
Citrus aurantifolia, C. aurantium, C. bergamia, C. grandis, C. limetta, C. limon, C. maxima, C. medica (var. cedrata), C. myrtifolia, C. paradisi, C. reticulata, C. sinensis, C. unshiu, Fortunella japonica
490.00 481.61 7,446.60 235.99 0.90 0.4 21.2
Cucumis melo 81.50 511.71 8,369.28 41.70 0.60 0.2 5.9 Cucurbita maxima, C. mixta, C. moschata, C. pepo 295.33 234.20 3,440.50 69.17 0.50 0.2 5.8 Cydonia oblonga (2) 26.22 313.65 2,576.99 8.22 0.30 0.1 13.9 Ficus carica 0.87 2,078.03 6,988.20 1.81 1.40 0.4 19.6 Fragaria ssp. 8.84 1,598.42 15,044.37 14.13 0.80 0.6 8.1 Glycine max, G. soja 41,422.37 300.78 772.75 12,458.88 34.60 24.2 27.2 Gossypium hirsutum, G. barbadense, G. arboreum, G. herbaceum 427.86 712.34 933.88 304.78 � � � Helianthus annuus 3,635.00 301.08 484.01 1,094.44 25.40 51.3 14.4 Linum usitatissimum 2.00 223.17 157.95 0.45 � � � Linum usitatissimum 41.26 361.06 378.44 14.90 � � � Lupinus angustifolius (3) 0.14 391.69 586.13 0.05 � � � Lycopersicon esculentum 675.00 558.10 21,834.38 376.72 0.90 0.4 4.6 Malus domestica 1,262.07 1,590.67 47,197.88 2,007.54 0.30 0.4 14.9 Mangifera indica 2.02 509.85 4,082.80 1.03 0.30 0.2 19.5 Persea americana 3.49 509.85 3,250.69 1.78 1.70 26.4 3.3 Phaseolus spp. (P. vulgaris, P. lunatus, P. angularis, P. aureus, P. mungo, P. coccineus, P. calcaratus, P. aconitifolius, P. acutifolius
45.25 299.91 2,501.86 13.57 1.50 0.8 4.3
Prunus armeniaca 25.23 1,149.76 12,884.22 29.01 1.00 0.1 12.9 Prunus avium, Prunus cerasus 6.75 6,682.54 33,519.99 45.11 1.10 0.5 14.8 Prunus domestica, P. spinosa 128.50 490.27 4,196.07 63.00 0.70 0.2 12.9 Prunus persica, Persica laevis 267.50 565.16 5,906.16 151.18 0.50 0.1 12 Pyrus communis 592.91 761.90 22,856.08 451.74 0.70 0.4 15.8 Vicia faba 15.23 232.52 2,119.39 3.54 6.70 0.8 16.3 Vigna spp., V. unguiculata, V. subterranea (syn. Voandzeia subterranea), Phaseolus spp.
4.15 81.32 523.86 0.34 � � �
Allium cepa, A. ascalonicum, A. fistulosum 720.77 186.39 5,388.87 134.35 0.70 0.2 12.4 Allium sativum 130.65 1,410.03 12,621.39 184.22 4.40 0.2 20 Ananas comosus 3.23 471.48 9,078.32 1.52 0.40 0.2 13.7 Asparagus officinalis 7.10 1,732.11 6,826.60 12.30 2.20 0.2 3.9 Avena spp., mainly Avena sativa 281.62 325.18 552.37 91.58 15.60 7.8 62.5 Camellia sinensis (1) 70.67 77.44 146.59 5.47 8.00 4 71.4 Cicer arietinum 1.47 181.75 181.75 0.27 6.10 2.2 20.2 Cynara sp. (1) 88.67 1,270.79 24,310.66 112.68 2.80 0.2 12.4 Daucus carota 230.37 137.21 3,309.86 31.61 0.60 0.5 9.2 Eleusine coracana, Eragrostis abyssinica, Panicum miliaceum, Paspalum scrobiculatum, Pennisetum glaucum, Setaria italica
15.43 186.55 305.31 2.88 � � �
Hordeum distichon, H. hexastichon, H. vulgare 1,187.40 194.85 657.68 231.36 10.20 1.5 74.9 Humulus lupulus (1) 0.29 275.98 332.57 0.08 � � � Ilex paraguayensis (4) 265.06 63.48 108.70 16.83 � � � Ipomoea batatas 350.00 253.74 3,818.99 88.81 1.10 � 19.8 Juglans regia (1) 9.50 967.49 2,493.57 9.19 13.90 67.4 13.2 Lens esculenta 2.32 859.28 1,326.18 1.99 20.80 0.8 64.8 Manihot esculenta, syn. M. utilissima, M. palmata 175.67 � � � 0.50 0.1 27.7 Musa sapientum, M. cavendishii, M. nana, M. paradisiaca 181.00 341.52 7,191.45 61.82 1.20 0.2 23 Nicotiana tabacum (1) 166.18 1,649.98 2,996.07 274.19 � � � Olea europaea 121.67 942.98 2,943.58 114.73 1.50 13.5 4 Oryza ssp. (mainly O. sativa) 1,074.84 234.94 1,523.14 252.53 6.90 0.2 79.2 Phalaris canariensis (*) 13.38 689.10 750.28 9.22 � � �
115

Pollinator dependence of Argentinean agriculture. Chacoff et al.
Appendix 1 (Cont.) Crop species mean Mt
103 (2005-2007)
mean U$S/Mt (2004-2006)
mean U$S/ha (2004-2006)
Net income (U$S)
Proteins (g)**
Fats (g)**
Carbohydrates (g)**
Pisum sativum, P. arvense 28.67 181.15 208.21 5.19 6.40 0.4 11.2 Pisum sativum, P. arvense 25.90 294.60 607.82 7.63 6.40 0.4 11.2 Saccharum officinarum 20,866.67 33.16 2,500.48 691.87 � � 99.9 Secale cereale 47.50 323.23 391.25 15.35 12.10 1.7 73.4 Solanum tuberosum 1,894.10 174.61 4,993.59 330.74 2.70 � 18.8 Sorghum guineense, S. vulgare, S. durra 2,840.71 109.07 526.20 309.85 � � � Triticum spp. (mainly T. aestivum, T. durum, T. spelta) 13,708.22 236.18 613.99 3,237.61 12.40 2 69.8 Vitis vinifera 2,870.21 954.54 12,569.68 2,739.74 0.30 0.3 10.2 Zea mays 18,894.49 132.83 869.74 2,509.82 9.50 0.9 74.9
* Wind pollinated cereal * average values per 100 g of edible part Sources of pollinator dependence data: (1) Crane E, Walker P (1984) Pollination directory of World crops. International Bee Research Association. UK. (2) Benedek P, Szabó T, Nyéki J (2001) New results on the bee pollination of quince (Cydonia oblonga Mill.). Acta Horticulturae 561, 243-248. (3) Manning R (2006) Honeybee pollination: Technical data for potential honeybee-pollinated crops and orchards in Western Australia. In Dept. of Agriculture of West Australia, http://www.agric.wa.gov.au/content/aap/hbh/bulletin4298_index.htm. South Perth: Research Officer, Animal Research and Development Services. (4) Dolce NR, Rey HY (2006) Cultivo in vitro de ápice de Ilex paraguariensis: efecto del pretratamiento con medios líquidos sobre la brotación. In: Comunicaciones Científicas y Tecnológicas, http://www.unne.edu.ar/Web/cyt/cyt2006/05-Agrarias/2006-A-026.pdf. Corrientes: Universidad Nacional de Corrientes. Data on the remaining crops was obtained from Klein A, Vaissiere B, Cane J, Steffan-Dewenter I, Cunningham S, Kremen C, Tscharntke T (2007) Importance of pollinators in changing landscapes for world crops. Proceedings of the Royal Society B: Biological Sciences 274, 303-313.
Appendix 2 Number of crops by pollinator dependency and FAO categories. FAO crop category Pollinator dependence
category* Cereal Roots, tuber
Stimulant Sugar crop
Spice Nut Pulses Oil-bearing crop
Vegetable Fruit Total
Essential 1 2 1 4 High 1 9 10 Modest 3 4 2 9 Little 1 2 3 3 5 14 Increase - breeding 3 2 2 Increase - seed production 3 3 No increase 9 1 1 1 3 1 1 1 32 Total 9 3 4 1 1 2 8 9 11 20 68†
* Classes “no increase”, “increase - breeding” and “increase - seed production” = pollinators do not increase production; “little”= production reduction >0 but <10% without pollinators; “modest”= 10-40% reduction; “high”= 40-90% reduction; and “essential”= reduction >90%. †Accumulated number of crops cultivated in Argentina between 1961 and 2007 following FAO data base.
116