Polk County, Wisconsin Annual Operating and Capital Budget ...
288
Polk County, Wisconsin Annual Operating and Capital Budget Calendar Year 2016 Adopted by the Polk County Board of Supervisors November 10, 2015
-
Upload
khangminh22 -
Category
Documents
-
view
1 -
download
0
Transcript of Polk County, Wisconsin Annual Operating and Capital Budget ...

Polk County, WisconsinAnnual Operating and Capital Budget
Calendar Year 2016
Adopted by the Polk County Board of Supervisors November 10, 2015

dana.frey
Typewritten Text
dana.frey
Typewritten Text
dana.frey
Typewritten Text
dana.frey
Typewritten Text
About the cover: The horses pictured are owned by Polk County Land and Water Department’s Patti Jo Andersen, who provides riding-based therapy for children at her farm, Quarter Moon Acres. The picture is by Brett Hart Imagery, used with permission.
dana.frey
Typewritten Text
dana.frey
Typewritten Text

2016OperatingandCapitalBudget
PolkCountyWisconsin
Polk County Board of Supervisors
District Supervisor District Supervisor
1. William F. Johnson IV 9. Kim A. O'Connell 2. Patricia M. Schmidt 10. Larry Jepsen 3. Dean K. Johansen 11. Jay Luke 4. Josh Hallberg 12. Warren Nelson 5. Craig Moriak 13. Russell E. Arcand 6. Ken Sample 14. John Bonneprise 7. Marvin Caspersen 15. Joseph Demulling 8. James S. Edgell Dana Frey, County Administrator

i
TableofContents
Section Page Section Page Introduction 1 Corporation Counsel/Child Support 106 About Polk County 2 County Clerk 114 Citizens’ Guide to the 2016 Budget 4 District Attorney/Victim Witness 122 Budget Summary 8 UW Extension 128 Revenues 12 Employee Relations 134 Expenditures 15 Golden Age Manor (Nursing Home and Rehabilitation) 142 Debt 19 Highway 149 Strategic Goals and Strategy 25 Human Services 154 Measuring performance 28 Information Technology 162 Budget Process 30 Land Information 170 Budget Calendar 32 Land and Water 176 Organizational Chart 34 Law Enforcement – Sheriff’s Department 185 Department Organization 35 Lime Quarry 193 How to Use this Document 37 Medical Examiner 195 Explanation of Fund Structure and Basis of Accounting 40 Public Health 197 2016 Budget Summary Tables 43 Register of Deeds 220 By Economic Classification 44 Treasurer 224 By Functional Classification 45 Veterans Service Office 230 By Fund 47 Annex A: Selected demographic and economic statistics 236 Change in Fund Balance by Fund 49 Annex B: How to read a logical framework 237 By Department 50 Annex C: Financial policies 239 2016 Capital Budget 62 Annex D: 2016 approved budget resolution 249 Department Budgets 64 Annex E: 2016 – 2020 Annotated Capital Improvement Plan 256 Administration 65 Annex F: Debt service obligations and payment schedules 275 Aging and Disability Resource Center 82 Annex G: Asset fund revenues, expenditures and balance 276 Buildings, Parks and Solid Waste 91 Annex H: Revenue estimation methodology 277 Clerk of Court 99 Annex I: Glossary 279

Introduction January 2016 To the Polk County Board of Supervisors and the Citizens of Polk County: We are pleased to provide you the third comprehensive budget document in the history of Polk County. This document is designed to give you detailed budget information in an accessible format and all in one location. Polk County endeavors to follow the Code of Good Practices on Fiscal Transparency as developed by the International Monetary Fund. Two relevant sections of that code are public availability of information and open budget preparation, execution and reporting. This document, in addition to the Citizens Guide to the 2016 budget (included) and information available on the County’s website (under fiscal transparency on the home page, www.co.polk.wi.us) is designed to meet these requirements. This document is organized in two basic sections. The first provides a summary and overview of the budget process and budget as well as information on the organization of the county and assistance in interpreting the second section, the detailed budget information itself. These data are prepared wherever possible following the Uniform Chart of Accounts recommended by the State of Wisconsin Department of Revenue to help ensure consistency of financial information across departments. The format used in this budget similar to that used in the budget execution reports provided to the County Board and posted on the County’s website on a quarterly basis to facilitate comparisons. Greater detail is of course always available for any category as desired. Similarly, the allocation of full‐time equivalent (FTE) staffing follows those categories established by the U.S. Equal Employment Opportunity Commission. I would also like to extend my appreciation to those Polk County staff who have contributed to this document, especially our Finance Department team, as well as the department heads and others who have made this budget process a success. Sincerely, Dana Frey County Administrator
1

AboutPolkCounty
Located in north‐west Wisconsin, Polk County was first incorporated in 1858. The county has a land area of 914 square miles and a population of about 43,500 according to the most recent estimates by the State of Wisconsin and the U.S. Census Bureau. Of
note is the rural character of the county: despite a population of over 44,000 there are no communities within Polk County with a population greater than 3,000. Although the county grew rapidly before the last recession (2007‐2009), the population has since stabilized, with a small natural population growth (births over deaths).
Easily accessible from a major metropolitan area, Polk County benefits greatly from tourism and from the value added by its seasonal residents, both from their patronage of local businesses and from their investment in lakeshore and recreational property. Over three‐fourths of the county’s equalized property value is in residential real estate and
tourism accounts for a significant share of the county’s economy. Polk County also has a strong agricultural economy, and has become a regional center for health care, with education and health employment estimated at 2,800 jobs. Despite its rural nature, Polk County is also a manufacturing hub: manufacturing accounts for over one out of every five jobs, or a total of 5,600 jobs.
Polk County has a wealth of natural resources with over 400 lakes, the oldest State park in Wisconsin, Interstate State Park, and the newest, Straight Lake State Park, rolling hills, productive farmland, forests and streams, and is bordered on the west by a Federally‐designated wild and scenic river. We are a county of libraries, with 10 separate municipal library systems and 302,000 library visits in 2014, and a county of schools, with eight local school districts offering full K through 12 education opportunities. Higher education is close by as well, with Indianhead Technical College providing vocational education at several satellite locations nearby and several four‐year colleges a reasonable commute away from most parts of Polk County.
Along the St. Croix River, Polk County
2

Although a rural county, Polk County does have a relatively youthful population, as Figure 1 shows, with a median age of 42.8 years old according to the 2010 census. Educational attainment is fairly high as well, with census data again showing 92.9% of all residents over age 25 having a high school diploma and nearly thirty percent a college degree (Exhibit 1). Finally, the County also has a very high ratio of owner‐occupied homes, at nearly 79 percent, and, although the County’s overall housing vacancy rate appears high – 25 percent – nearly 80 percent of those are seasonal property such as lake cabins that are not occupied year‐around. Annex A contains additional demographic and economic data for Polk County.
With respect to the county government itself, Polk County is overseen by 15 elected members of the Board of Supervisors, elected to two year terms beginning in April, 2014 and each representing a specific geographical area. In addition to these elected officials, Wisconsin statutes also provide for six elected department heads: the Sheriff, Clerk of Circuit Court, County Treasurer, Register of Deeds, and County Clerk. Polk County is organized as an administrator form of government,
with a chief administrative officer appointed by the County Board and
charged with implementation of federal and state law and county ordinances, appointment and supervision of department heads, and preparation and submission of the annual budget. Polk County government provides a full range of standard County services including public health and human services programs; tax assessment and collection; judicial, law enforcement and jail services; the construction and maintenance of highways and infrastructure; recreational facilities; cultural events; and general administrative services. The County also owns and operates a nursing home, Golden Age Manor located in Amery, a Lime Quarry in the County’s southwest, a recycling center located in St. Croix Falls, is the major partner in an information center at the County’s eastern border designed to facilitate tourism and participates in the County museum located in the original courthouse in Balsam Lake.
Exhibit 1
Educational Attainment of Polk County Residents
Less than 9th grade 2.7%
9th to 12th grade, no diploma 5.4%
High school graduate (includes equivalency) 39.7%
Some college, no degree 22.6%
Associate's degree 10.2%
Bachelor's degree 13.1%
Graduate or professional degree 6.3%
Figure 1
3
dana.frey
Typewritten Text

Quick facts:
Land area: 956 square miles
Number of lakes: 437
Population (2015 estimate): 44,259
Real GDP 2015 (‘09 dollars: $1.5 billion
Per capita personal income: (2014) $38,907
Unemployment rate (Oct. 2015): 3.7%
Located in northwestern Wisconsin, Polk County contains an incredible variety of natural beauty in its lakes and rivers, small towns, rolling hills, farms and forests. The county is bordered on the west by the St. Croix River, a federally designated wild and scenic river, with the magnificent St. Croix dalles forming the heart of Interstate State Park. Peacefully rural in nature, the county has no city with a population over 3,000.
Polk County was organized in 1853, and over the past decade has been one of the fastest-growing counties in Wisconsin. It has a diverse economy with a mix of agriculture, tour-ism, manufacturing, and services. Its proximity to a large metropolitan area has served to provide a ready market for goods produced here as well as a demand for recreational ac-tivities including boating, fishing, hunting, snowmobiling, hiking, biking and skiing.
About Polk County
Polk County provides services to its citizens in law enforcement, child support collec-tion and child protection, transportation and nutrition for older citizens, maintains a 515 mile highway system, provides public health services including immunization and restau-rant inspections, works to protect our natural resources including our groundwater and lakes, ensures orderly development through planning and zoning, operates the county detention center and court system, provides assistance to veterans, the elderly and dis-abled, operates a long-term care and rehabilitation facility, 6 county parks, a recycling center, and manages 17,144 acres of county forest. The county does so through the efforts of 561 employees organized into 23 departments and funded by a $52 million annual budget.
County Organization and Services
A report on county performance
2
The 2016 budget 2-3
Challenges and op-portunities
4
Contact us 4
Contents:
Calendar Year 2016
Mission: To serve and represent the public with integrity
Vision: Improved quality of life for all who live, work, and play in Polk County
Strategic Priorities: Foster a diverse economic
base
Promote quality education for all
Design good land use prac-tices that recognize distinc-tions
Preserve and enhance the environment
Maintain a responsive transportation system
A Citizen’s Guide to the Polk County Budget
Polk County D.D. Kennedy Park
4

Selected Key Performance Indicators:
Area Goal Indicator 2015 actual 2016 plan
Economic development
Promote the agricultural industry
Demand for agricul-tural lime products, dollar
592,000 657,000
Encourage and develop tourism and local business
Sales tax collections in Polk County
$2.91m $2.95m
Quality edu-cation
Provide educational op-portunities to preserve links to the past
Schools participating in the Polk County Mu-seum program
5 of 8 5 of 8
Land use practices
Support land uses that grow a strong economy
Percentage of parcel map completed
86% 95%
Environ-mental pro-
Safeguard public and en-vironmental health
Number of public beaches monitored
5 5
Transporta-tion
Recreational trail develop-ment and maintenance
Miles of recreational trails
488 488
Maintain and improve the road system
Pavement quality index (7 = isolated cracks)
7.0 7.0
Safeguard public and en-vironmental health
High school students who smoke
12.0% 11.6%
Quality long-term care at Golden Age Manor
Occupancy rate 92% 92%
Quality of life
2015 plan
621,000
$2.90m
5 of 8
95%
5
488
7.0
12.0%
94%
The 2016 Budget: Where Your Tax Dollar Goes
How Have We Progressed?
Did you know? Polk County maintains 343 miles of snowmobile trails, 32 miles of ATV trails, and 41 miles of bi-cycle trails?
Page 2 Polk County Cit izen’s Guide to the Budget
The measures reported on this page are based on input from the citizens of the county. What measures would you like to see reported? Let us know by contacting us at the address on the last page.
5

An independent audit is conducted every year, resulting in a clean audit opinion. These results, and additional financial information, may be found on our website: http://www.co.polk.wi.us/Admin/budget-reports.asp
Revenues 2015 Prelim 2016 Budget
General Property Tax 21,170,122 21,468,017 Other Taxes 3,336,170 3,646,145 State Aids 10,150,596 10,450,239 Public Charge for Services 12,085,067 12,141,088 Intergovernmental Revenue 2,787,832 3,005,901 Other Revenue 1,099,167 1,054,476 Other Financing Sources 2,632,719 573,168 Total Resources 53,261,673 52,339,034
Expenditures 2015 Prelim 2016 Budget Personnel 29,793,958 30,276,642 Professional Services 7,704,099 8,454,570 Supplies & Expenses 5,764,346 5,965,915 Fixed Charges 1,522,423 1,577,191
Other 2,834,418 1,536,562 Total Expenditures 54,428,581 52,342,021
Debt Service 5,551,651 3,327,152 Capital Outlay 1,257,687 1,203,989
Budget in Brief: Revenues and Expenditures
Page 3 Polk County Cit izens’ Guide to the Budget
Did you know? In 2015, the Polk County Highway Department logged 5,504 hours on snow and ice control.– that’s almost three person/years!
Examples of Resources: Other Taxes: Sales tax
State Aids: State general revenue sharing funds and grants Public Charge for Services: Permit fees
Other Revenue: Interest income Other Financing Sources: Internal fund transfers
Examples of Expenditures:
Professional Services: Medical services for clients
Supplies & Expenses: Road salt, gasoline for patrol cars
Fixed Charges: Insurance premiums
Debt Service: Bond repayments
Capital Outlay: Road grader for Highway Department
Other: Grants, cost reallocations
Note: 2015 expenditures were artificially higher due to an early payoff of a bond issue; revenues and expenditures also adjusted to avoid double-counting health insurance costs.
6

Questions? Comments? See: www.co.polk.wi.us or email [email protected] Administration, 100 Polk Plaza Suite 220, Balsam Lake WI 54810 (p)715-485-8848
Page 4
Polk County enjoys a strong competitive advantage due to its location adjacent to a major metropolitan area, skilled workforce, and natural resources. The local economy continues to show substantial improvement: in housing values, retail sales and employment. Health care has become a major and growing industry in Polk County, now accounting for over one-fourth of the total payroll and one-fifth of total employment, up from one-sixth just a few years ago. How-ever, manufacturing continues to dominate the County’s economy, accounting for 33 percent of total payroll.
Like much of rural America, the greatest demographic challenge the county faces is the rapid aging of its population and the need to assure adequate services are avail-able to them. Our rural character makes this a more difficult as most of our resi-dents live outside of our cities and villages, many around one of our 400 lakes. Our lakes themselves, a key to our tourist industry and quality of life, are also an increasing priority due to invasive species and protection of water quality. Limited revenues will force reprioritization of county services to meet these challenges.
Despite these issues, Polk County has and will continue to be financially responsi-ble, with balanced budgets and realistic reserves. We are in the midst of a conscious transition to a smaller, more flexi-ble and efficient government, one planning its own future. Citizen participation in helping our government determine priorities is essential; this document is intended to be both a source of information and a request for input. Let us know what you think!
Looking To The Future
Polk County Ci t izens ’ Guide To The Budget
Did you know?
According to the US Census Bu-reau, Polk County ranked eighth
highest among Wisconsin counties in in per capita personal income
increase for 2014
Polk County is proud to have received a Certificate of Excellence in Citizen-centric Reporting from the Association of Govern-ment Accountants.
Polk County Board of Supervisors District Supervisor District Supervisor 1. William F. Johnson IV 9. Kim A. O'Connell 2. Patricia M. Schmidt 10. Larry Jepsen 3. Dean K. Johansen 11. Jay Luke 4. Josh Hallberg 12. Warren Nelson 5. Craig Moriak 13. Russell E. Arcand 6. Ken Sample 14. John Bonneprise 7. Marvin Caspersen 15. Joseph Demulling 8. James S. Edgell Dana Frey, County Administrator
Polk County Age-Sex Pyramid 2010 and 2040
7

BudgetSummary
As prescribed by the budget preparation and execution policy, the 2016 budget (covering the period January 1 through December 31 of 2016) is balanced both in current year terms and structurally over time, is transparent in its incorporation of all funds and assignment of responsibility for all expenditures, contains improved performance information, and follows and implements the policy set by the Polk County Board of Supervisors (County Board). The budget also follows the direction in public financial management set by the County Board: financial restraint in expenditures, a solid budget reserve, adequate funding for capital investments and protection of the infrastructure, and of course at the same time maintaining quality service delivery.
Budget process goals and objectives
A budget process has three basic goals: to improve fiscal discipline and budget transparency, to allocate funds in accord with citizen priorities as set by the County Board, and to improve the effectiveness and efficiency of public expenditures. This budget continues to make progress towards all three goals. Fiscal discipline is improved through assurances of future sustainability and conservative, realistic revenue and expenditure estimates with a detailed line item budget that increasingly follows the State of Wisconsin Uniform Chart of Accounts.1 In 2016 and for the first time Polk County is using a three‐year budget, with the forward years serving as budget ceilings for each department. Fiscal transparency is enhanced through public information and an open process as well as through the incorporation of all funds in a single budget document, provision of a comprehensive fee schedule, and an annual review and reauthorization of any dedicated accounts or funds. To the greatest extent possible, every dollar is budgeted, incorporated in this budget document, and authorized by the attached annual budget resolution.
1 Annex E contains a standard measure of fiscal discipline, the Public Expenditure and Financial Accountability Public Financial Management assessment. This assessment was developed in 2001 by the World Bank, International Monetary Fund, the European Commission and several national development agencies. Although initially intended for use in developing countries, it provides valuable insights on system performance, and its use has spread to a number of industrialized nations including Norway and Switzerland.
Budget process goals:
Do only what we can afford: maintain a structurally balanced budget
Do the right things: follow citizen priorities as set by the County Board
Do things right: measure and improve effectiveness and efficiency
8

BudgetSummary
The second objective, following citizen priorities as set by the County Board, is addressed by first identifying those strategic priorities and then linking programs them, as discussed in the section on prioritization immediately following this summary. This also requires a basic program budget, tying expenditures to their purpose, which is provided in the department narratives following. The third objective, efficiency and effectiveness, is addressed through program restructuring and a reduction in staffing needs and by specific initiatives to improve resource utilization in certain areas, generally information and communication technology. In addition, all programs are matched with performance indicators and, for selected programs, an international standard logical framework was prepared showing how program activities link to results sought by the County Board and how progress towards those results can be measured.
The budget process
This budget was developed through a process that began in early 2015. A budget calendar (page 32) was distributed in January and the first set of budget instructions was distributed the following month. A budget ceiling was set for every department equal to their adjusted 2015 amount, that computed by reducing the 2015 base for staffing changes increasing for personnel and other cost increases. Any discretionary increase above that ceiling was to be submitted as a request for additional resources on a standard form, and each department was also asked to assess the impact of a five percent reduction in resources. Departments submitted an initial budget to administration in June and July; following, administration met with every department at least once to determine potential opportunities for savings above and beyond the baseline amount. Assumptions were then made concerning personnel costs, and departments were requested to reconfigure their budget submissions to incorporate these costs as possible. Following, administration met again with every larger department to consider alternatives and as needed locate offsetting revenue. Every department was also asked to review their fee schedules so as to ensure fees covered the cost of providing the service; where they did not, they were asked to prepare an amendment to the fee schedule for consideration by their governing committee and the full County Board. This fee schedule was presented to the County Board at their September 2015 meeting and approved for submission as part of the 2016 budget.
The budget process is designed to provide the maximum opportunity possible for County Board
What is a program? Why does it matter?
A program is a related set of activities undertaken by a government aimed at a single issue or set of issues, usually in response to a problem and with a common set of clients. A program budget lists all expenditures directed towards that problem. For example, snowplowing is a program, as is zoning administration, parks and lake protection. It is important because taxpayers can see what the priorities of government are, and how much is spent in response to each issue. This can then be combined with measures of effectiveness and efficiency so taxpayers can see how good a job the government is doing in addressing this problem.
9

BudgetSummary
20,000
20,500
21,000
21,500
22,000
22,500
23,000
23,500
Jan‐07
Jul‐0
7
Jan‐08
Jul‐0
8
Jan‐09
Jul‐0
9
Jan‐10
Jul‐1
0
Jan‐11
Jul‐1
1
Jan‐12
Jul‐1
2
Jan‐13
Jul‐1
3
Jan‐14
Jul‐1
4
Jan‐15
Jul‐1
5
Polk County EmploymentSeasonally Adjusted Trend
consideration. A strength of county government in Wisconsin is its committee system, a system that can allow for greater review of the policy aspects of budgets than would be possible in full County Board meetings. To facilitate this review, prior to the budget preparation governing committees were asked to review strategic plans for relevant departments to identify issues to be addressed in this or future budgets and each department discussed budget issues with their respective committee in July or August. In September and early October administration presented the final budget recommendation to each committee and the entire County Board. Governing committees either recommended that the relevant department budgets be approved as submitted or recommended amendments to these budgets for consideration by the full County Board at its October or November meetings; these amendments were also reviewed by the general government committee.
Strategic outlook
The 2016 budget was adopted in a period characterized by an improving economy as the effects of the last recession continue to diminish. Polk County is located on the edge of a major metropolitan area, and based on experience in the last few recessions, appears to be affected somewhat more severely than truly rural counties but also to recover more quickly. This is likely a function of the employment mix, with a heavy reliance on construction and light manufacturing. As Figure 2 shows, the loss in employment was substantial during and immediately following the recession, but recovery appears to be quite dramatic as well, with employment passing the pre‐recession total in mid‐2014.
The County Board has identified a number of strategic issues that are linked to perceived opportunities and threats, issues that affected the 2016 budget. A significant opportunity for the County is from increased revenue and growth from tourism; the County hit an all‐time record in 2015 in sales tax collections in part because of tourism. To address that opportunity, the County has supported a significant tourism promotion initiative with outreach, publications, and a fully functional, fully staffed information center. By the same token, with increased tourism comes increased threat to the County’s lakes and rivers
Figure 2
10

BudgetSummary
from pollution or invasive species. This also was a priority for 2015 and 2016, with the funding of a sophisticated topographical mapping program to enable a more precise identification of nonpoint pollution sources.
Opportunities have also arisen due to the construction of the new St. Croix River bridge just south of the County’s border. This bridge effectively will connect West Central Wisconsin to the Minneapolis‐St. Paul metropolitan area freeway system, greatly shortening the commute for residents in the southwestern part of the County. The aforementioned topographical mapping program will also facilitate that development as well as any County roadwork necessary to accommodate it. as well as a significant reorganization of the Public Health and Human Services Departments.
Another threat to County operations results from the high proportion of employees that are eligible to retire, combined with impending recruitment difficulties due to the rural nature of the County. In addition to ongoing succession planning, the 2016 budget also incorporates revisions to the new compensation and classification system that follows best practices in attracting, retaining and motivating high quality employees.
Summary of the 2016 Budget
For the first time in several years, the 2016 budget was developed in an economic environment characterized by greatly improving employment and incomes, although still recovering from historically large declines in the latter. The real estate market has also been very slow to recover, with a very small increase estimated in equalized (taxable) value as determined by the Wisconsin Department of Revenue for 2015, the value on which 2016 taxes are calculated. As a consequence, the County Board has continued its policy of limiting property tax increases on existing property; the 2016 increase was less than the estimated percentage increase in tax base.
Overall economic recovery has affected the labor market and wage rates, and the County’s benefit consultant has advised us that wages will increase by about 2.7 percent in 2016, meaning that additional funding would be needed in the County budget. Further, although the County
Note on historical data
Polk County continues to complete a multi‐year effort to improve the quality of financial reports, implementing the Uniform Chart of Accounts as prescribed by the Wisconsin Department of Revenue. In past years, although totals were accurate many expenditures were not budgeted or reported correctly, instead lumped into a category called Operating – 000. In addition, the manner in which employee health care costs were reported resulted in double‐counting of those costs. Although they have been adjusted in this report, past reports are not directly comparable for that reason.
11

BudgetSummary
Proprerty tax$21.5
State aid$10.5 Fees & Fines
$0.5
Charge for Services$12.3
Inter‐governmental
$3.0
Sales Tax$2.9
All other$1.6
Figure 3Revenues by Source
has enjoyed a relatively slow rate of growth in health insurance costs, a large component of the overall budget, estimates are for that cost to increase in the future, with some additional revenues incorporated into the 2016 budget along with cost‐containment measures.
In mid 2015 the Wisconsin Legislature adopted the biennial budget which contains a number of provisions of significance to county government this year. Notably, there was no general increase in shared revenue or significant relaxation of the levy cap; however, there was some additional funding for mental health that will be of benefit to county finances. There was also a reduction in funding for recycling that increased County costs. Finally there was a significant increase in county transportation funding that fell, in part, in 2015 and was continued through this year, improving overall funding funding. As well as state aid, the County has also contracted with some town governments to perform winter highway maintenance, improving revenues further. There are also a few new regulatory changes effective in January, notably some employer‐related provisions of the Affordable Care Act and the continued costs of compliance with HIPAA and HITECH, which regulate the safekeeping of patient health records.
Those short‐term factors that had the greatest influence on the 2016 budget were the aforementioned modest increase in general compensation and an increase in costs for health care and a need to upgrade some of the County’s IT infrastructure for behavioral health. Offsetting these cost increases or limitations were ongoing savings due to attrition, especially the savings from retirement and hiring new employees at a lower starting salary, and a fall in the County’s debt service. The department narratives, following, also list major factors affecting the 2016 budget for individual departments.
Revenues
Polk County budgets and reports using a system of modified accrual, meaning that costs generally are reported when incurred and revenues reported when due and measureable, not necessarily when actually received as required by State law. This is intended to provide a clearer picture of actual financial condition to both the public and to policy makers. Most of the adjustments required are relatively minor but, of note,
12

BudgetSummary
17.0% 18.0% 19.1% 20.1% 19.7% 19.7%
2013 2014 2015 2016 2017 2018
Figure 5State Aid as a Percent of Total County Revenues
$‐
$10.0
$20.0
$30.0
$40.0
$50.0
$60.0
2013 2014 2015 2016 2017 2018
Figure 4Change in Polk County Revenues, 2009 ‐ 2015
Property Tax Charge for Service Intergovernmental
All Other Other Financing State Aid
sales tax received in early 2017 from sales occurring in late 2016 are reported in 2016 and charges for services performed by the County in 2016 but received within the first three months of 2016 are considered 2017 revenue. This is the same basis of accounting used in all County financial reports, including the quarterly financial reports provided the public and County Board, and County’s financial statements and the County’s audited comprehensive annual financial report and single audit (see page 40 for more details).
Polk County receives most of its revenue from five sources: general property taxes, aid from the State of Wisconsin (including Federal pass‐through funding such as Medical Assistance), public charge for services (the bulk of which is nursing home revenue including Medicaid and Medicare), sales taxes2 and intergovernmental revenue. All together, these sources account
for about $50.0 million of the $52.3 million in total revenue or about 96 percent (see Figure 3). Note that revenue and expenditure data are distorted slightly for 2015 due to a decision to use cash balances to pay a debt issue two years early rather than refinance. This budget is also the first to be adjusted to prevent double‐counting health insurance premiums, meaning past budget documents are not directly comparable.
Although property taxes remain a relatively fixed share of total revenues, 2016 does show a minor increase in a few areas, including State aid, which increased from $10.2 to $10.5 million, intergovernmental revenue, which shows an modest increase due to increased contract work with towns by the Highway Department, and sales
2 Note there is a difference in how sales tax collections are presented in the Guide versus the annual budget. In the Guide, these are included as other tax revenue to avoid confusion but, following the chart of accounts, in the budget they are included as other financing sources.
13

BudgetSummary
tax (a component of Other Financing Sources) which increased from $2.6 to $2.9 million. Figure 5 shows State aid as a share of total revenues for the period 2013 through 2018. See Annex G for an explanation of revenue estimation.
The last dollar levy principle in the budget preparation and execution policy (Annex C) requires that the property tax levy amount follow the assignment of all revenues, effectively making it the resource of last resort in preparing a budget. Once a minimum level of expenditures had been determined, resources were identified to partially fill the resultant gap; the final figure derived is therefore property tax levy. The 2016 levy was so determined to be $21,468,017, a slight increase from the 2015 property tax levy. (None of the figures include the levy for Library Act 150 or Highway Bridge Aid, as these are pass‐through funds outside of the control of the County Board. See the glossary for definitions.) New construction increased the County’s equalized value by 0.2% (this small increase due to correction of an error in a prior year’s valuation).
Although change in the amount in the county share of the tax is impossible to predict for any individual taxpayer, it is possible to predict that the average taxpayer will see a small reduction in his or her county tax due to the effect of new construction. Because of the overall decline in the County’s equalized value the County’s tax rate will remain almost flat, at $5.27 per $1,000, but as this tax rate is applied against a lower value, the County’s tax on the average property will actually decrease very slightly. Further, as the county levy only accounts for about 20 percent of the total, change in school district and town/village/city levies have a far greater impact on the total tax bill.
Total revenues are estimated to be $52,339,033, a 2.3% reduction from the 2015 budget amount. This reduction is largely attributable to the early retirement of a debt issue in 2015 that overstated revenues that year. Detail on total revenues and on revenues by source is contained in the summary tables that follow this section (pages 43 through 48).
Budget Priorities and Budget Actions
In 2013, the County Board identified the ten highest‐priority County programs. The 2016 budget continues to address these priorities (listed in order):
1. Financial Management: Funding set aside for service consolidation
2. Election Administration: Full funding for election administration
3. Board Support: Personnel restructuring to provide more support
4. Child support: Departmental reorganization to improve service coordination
5. Emergency communications: Current funding level; major equipment investment funded for 2017
6, Veterans Service: Increased outreach funding
7. Corporation Counsel: Funding for new electronic filing system
8. District Attorney: New funding for Mental Health Court
9. Buildings: Funding for lighting efficiency improvement
10. Law enforcement: Funding for Justice Center security
14

BudgetSummary
General Fund$19.1
Debt Service$5.6
Special Revenue Funds$13.1
Enterprise Funds$8.8
Internal Service Funds$13.8
Capital Project$0.1
Figure 7 Expenditures by Fund
($ millions)
$‐
$10
$20
$30
$40
$50
$60
2013 2014 2015 2016 2017 2018
Figure 6Total Expenditures by Year
Expenditures
Total expenditures are budgeted for 2016 at $52,342,021, $2,086,560 or 3.8 percent below the 2015 budget amount. This reduction is largely due to the early payoff of a bond issue that overstated expenditures in 2015. Expenditure increases included funding for a full‐time Sheriff’s deputy to provide security at the Justice Center ($110,000) and funding for a mental health court; one‐time or capital expenditures included early payoff of an equipment lease ($140,000) and funding for behavioral health software ($250,000). Table 2 shows all changes from the baseline budget for 2016.
Staffing level declined by a 1.08 full‐time equivalent employees (FTE). Changes of over 0.2 FTE were:
Decrease of 0.22 FTE in Public Health due to reduced grant funding; Increase 1.0 FTE in Law Enforcement to provide security in the Justice
Center; Decrease of Human Services down 1.2 FTE in Human Services due to
position reallocation and reorganization; and Increase 0.4 FTE in Administration due to position reallocation.
Each individual department budget in Section 3 contains a history of staffing levels.
The 2016 budget apportions 33 funds in addition to the General Fund which, at $19.3 million or 36 percent of total expenditures, is the largest fund. All fund designations follow the State of Wisconsin Uniform Chart of Accounts; Polk County is also in compliance with GASB (Government Accounting Standards Board) Statement 54, which classifies fund balances as to whether they are restricted, committed, assigned, or unassigned. Unless the County Board rules otherwise or State law prevents, all fund balances are transferred to the General
$ million
15

BudgetSummary
Personnel$30.2
Services$10.1
Supples$6.1
Debt service$3.3
Capital outlay$1.2
Transfers & Charges$2.0
Other$2.7
Figure 8Expenditures by Economic Classification
Dollars in millions
Fund at the close of the year and, by policy, reauthorization of every fund committed or assigned by the County Board must be reviewed every year and reauthorized in the annual budget resolution. Figure 7 shows allocation of expenditures by fund; these same data are also presented in Table 5 on page 47. For a more thorough explanation of the County’s fund structure and basis of accounting please refer to the section on this topic beginning on page 40.
In addition to expenditures by economic classification, or what goods and services are purchased (Figure 8), and by fund it is considered a good practice to present expenditures by department, function (Figure 11) and program.3 Expenditures by department are covered in considerable detail in the balance of this document and summarized in Tables 7 and 8, following (page 50). The largest departments by total expenditure are
Human Services ($9.2million), Golden Age Manor ($8.2), Law Enforcement ($7.7) and Highway ($7.3); by property tax revenue they are Law Enforcement ($7.3 million), Human Services ($3.8) and Highway ($3.1).
Expenditures by function (following the State of Wisconsin Uniform Chart of Accounts) are summarized in Figure 11 and in Table 4 (page 45). The County’s comprehensive annual financial report also includes data on expenditures by functional classification. Historical comparisons are unfortunately affected by past years’ data; see text box to the right. Presenting expenditures by program is more problematic, as Polk County implements a large number of relatively small programs (program is defined as a related set of activities with a common objective and, usually, a common clientele). Further, expenditures by program are far more difficult to determine than by economic classification: some may span more than one department and often expenditures such as staffing costs are applied to more than one program. Without a detailed accounting it is difficult to precisely estimate costs by program.
Until such detailed estimates are available, departments were asked to estimate the share of total expenditures attributable to each program. Each department narrative, following, contains a table of programs implemented by that department that, among other things, estimates the share of total expenditures for each program. In most cases these allocations are somewhat subjective, but should still be indicative of relative 3 The Organization for Economic Cooperation and Development (OECD) recommends expenditure classification by function, organization, fund, economic category, object or line‐item, and program. A line item budget is available from the Department of Administration for any department
16

BudgetSummary
General government
$7.4
Public safety$7.5
Public works$7.6
Health & human services$21.5
Debt service$5.5
All other$3.3
Figure 9Expenditures by Function
share of overall costs: to determine estimated expenditure amount for a given program, simply multiply the total expenditure on the budget that follows by that percentage. Table 1, below, lists every program implemented by the County with a cost estimated to exceed $1 million annually. There are ten programs that meet this criterion implemented by four departments: Golden Age Manor, Human Services, Law Enforcement and Highway. Please see the individual department narratives for further information including goal of the program and related performance measures. We have also prepared an initial logical framework for all programs exceeding $1 million in cost; these frameworks are intended to help identify new performance measures and to indicate how current performance measures integrate with overall program logic. Where possible, these indicators are linked to current
measures and, to the extent possible, result and impact measures are incorporated in the program listing table. As this is only the second year that such information has been available, most measures are still activity or output measures but, for the longer term, the intent is that result and impact measures also be refined and included. As Polk County has an administrator form of government, County Board committees are responsible for policy oversight of programs administered by the various departments and do not have a direct management responsibility under State law. As a result, the 2015 reorganization of the County Board committees was along functional
Table 1 Largest Programs Implemented by Polk County Government
($ millions)
Department Program 2016 Budget Golden Age Manor Long term care $ 5.3
Law Enforcement Field services $ 4.0
Highway Construction and reconstruction $ 4.1
Human Services Behavioral health $ 4.3
Human Services Children and Family Services $ 3.3
Highway Maintenance and repair $ 3.1
Law Enforcement Corrections $ 2.7
Golden Age Manor Rehabilitation $ 1.6
Human Services Economic Support $ 1.4
Golden Age Manor Dementia care $ 1.2
Dollars in millions
17

BudgetSummary
assignment, not necessarily department. Figure 11 on page 46 illustrates the entire County budget by functional area. Note that the size of the rectangles are proportional.
Unlike 2015 there were some major appropriations from the asset protection and internal investment fund. These appropriations were $250,000 behavioral health clinic software and another $75,000 for transitional management of that clinic, $17,000 for Government Center LED lighting, $5,000 for wall lighting at the Justice Center and $25,000 for the highway building study. All of these expenditures are to be repaid over the next five or fewer years.
Table 2 Change from Baseline (Current Policy) Budgets Approved by County Board
Amendments
Description Recurrent Expenditure
Capital/One‐time Expenditure
Justice Center security 110,100
Equipment lease payoff 139,751
Document management software 28,500
Highway facility study 25,000
Mental health court 25,000
Courtroom teleconferencing 55,610
Veterans’ transportation 8,500
Behavioral health clinic software 250,000
Behavioral health clinic management 75,000
Government and Justice Center lighting 22,000
Museum improvements 5,000
Reduce building permit fees 15,100
Highway building study 25,000
18

BudgetSummary
$‐
$1.0
$2.0
$3.0
$4.0
$5.0
$6.0
2007
2008
2009
2010
2011
2012
2013
2014
2015
2016
2017
2018
2019
2020
2021
2022
Figure 10
Polk County Debt Service by Year(millions)
There are only four areas where it was necessary to significantly increase support from general property tax revenues. One was Human Services, at about $274,000, that due to increased child placement costs. The others were Buildings by about $121,000 for equipment replacement, $110,100 for Justice Center security (extra deputy) and Information Technology, by about $73,000, to reflect equipment upgrades including videoconferencing at the Justice Center.
It is not anticipated that the 2016 budget will result in significant impacts on service levels in 2016 other than increased security in the Justice Center. However, it is anticipated that the 2016 budget will initiate a process of service improvement and streamlining that will begin in 2016‐17 in Public Health and Human Services, as well as improved geographical information through the LiDAR project that will be fully implemented this year. Increase in service level is projected to occur in Golden Age Manor due to increased demand.
Debt
At the beginning of 2016, Polk County’s outstanding General Obligation debt equaled $11,330,000 (excluding interest payable), an amount equal to 0.3% of adjusted equalized value. The Wisconsin Constitution limits county debt to five percent of adjusted equalized value, or $4,073,722,200 in the case of Polk County, meaning that the county is at less than eight percent of its constitutional debt limit. Interest payable is another $1,630,385 over the expected life of these obligations, bringing Polk County’s total General Obligation liability to $12,960,385. Polk County also has outstanding obligations in the form of lease payments, capital and operating, that totals $396,453, raising the total long‐term obligation total for the County to $13,356,838, including interest. Polk County has not issued any new debt or entered into any new lease agreements of significance since 2007 (other than a refinancing of existing debt in 2012 that reduced costs by approximately $30,000 in 2013 and 2014).
The largest component of this debt is an $18.5 million advanced refunding bond issued in 2005, that obligation refunding two prior issues, one a $17.3 million issue in 2001 to construct a new Justice Center containing a jail, the sheriff’s department and court related activities and an adult development center, and the second a $12.1 million issue in 2002 to cover additional construction costs for the Justice Center and the Adult Development Center as well as a new Human Services/Public Health annex to the Government
19

BudgetSummary
Center. As of January 1, 2016, $11,330,000 in principal and $1,630,385 in interest remains payable on that obligation.
County debt service in 2016 is $3,327,152, a substantial reduction from the record high in 2015 (that due in part to the early payoff of a 2007 capital note. All of the County’s existing debt is scheduled to be repaid by the end of 2021, although it is very likely new capital investments that require bonding will be made before then. Please see the note on the preceding page concerning comparability with prior years’ data and Annex E, on debt service by obligation by year. This schedule also includes internal loans from the Asset Protection and Internal Investment Fund.
Polk County Unassigned Fund Balance by Year
2009 2010 2011 2012 2013 2014 2015 Budget 2016 BudgetBeginning Fund Balance
$2,987,002 $2,878,036 $6,635,325 $7,254,080 $6,739,432 $7,304,853 $8,444,384 $8,844,000
Additions (Subtractions)
(108,966) 3,757, 289 618,755 (514,648)* 565,421 $1,139,531 400,000 200,000
Ending Fund Balance 2,878,036 6,635,325 7,254,080 6,739,432 7,304,853 $8,444,384 8,844,000 9,044,000Percent of General Fund Expenditures
12.3% 29.4% 31.1% 29.3% 30.3% 36.5% 36% 36%
* Reflects transfer to asset, retirement and contingency funds
The high level of debt service that has characterized the past several years, with debt service levy over 20 percent of the total levy, has had some restriction on the County’s ability to fund current operations, especially higher‐cost capital equipment where purchase was not critical. Beginning in 2016, however, with the fall of debt service to a level that historically is more reasonable (about 15 percent of levy) and more sustainable for the long term even with new bonding in 2017 and thereafter. This should allow for an increase in capital expenditures beginning in 2017, and the current capital improvement plan calls for such increases.
General Fund unassigned balance
This budget again complies with the County Board’s directive that the general fund undesignated fund balance equal at least 20 percent of general fund expenditures, again with a recommendation that the unassigned fund balance be held at above 30 percent of general fund expenditures, consistent with the auditor’s general recommendation. Another recession, or lengthening of the current already slow recovery, will also affect State and Federal collections; this, along with the state of Federal finances, makes future reductions in county aid inevitable.
20
BudgetSummary
Some of these reductions may come without adequate notice for the County to respond, meaning that use of a reserve may prove necessary to avoid major service disruptions or costly layoffs.
The above table summarizes unassigned fund balance by year, with 2009 – 2012 amounts actual audited balance and 2015 ‐ 2016 projections. Note also that the County does not explicitly budget for savings from attrition or other savings due to lapses, or savings in expenditures from budgeted amounts. As a result, the expected gap between revenues and expenditures in a budget is greater than the actual gap expected after the annual audit.
Capital improvements
The 2016 budget process also incorporates the County’s capital improvement planning process, in part linked to the asset protection and internal investment fund. The amounts for 2015 were incorporated in the budget directly and constitute the capital budget, separately identified in a capital improvement plan for those items over $25,000 and in the capital budget for items over $5,000.4 The five‐year capital improvement plan was released as a separate document along with the full budget presentation to the County Board; year one is the capital budget.
All told, capital expenditures are expected to be $1,203,989 in 2016 (excluding the Highway Department; see notes in Annex E), just below the 2015 amount. As noted in past reports, 2016 expenditures reflected the County Board’s decision in 2011 to create a revolving loan fund for such expenditures where return on investment is adequate to repay such a loan in a relatively short period of time as discussed above; Annex G provides a repayment schedule. If the Highway Department is included, total capital expenditures are $3,603,239, the single largest group of expenditures for highway construction or reconstruction, at $1.9 million. The second largest object of expenditure is vehicles, including plow trucks, $919,000, and third building improvements of $341,000, with much of this expended at Golden Age Manor. Table 9 on page 62 and Annex E provide details of the 2016 capital budget, including its impact on the
4 A $5,000 threshold for inclusion is lower than common practice, as is including vehicles that are routinely replaced (squad cars). This is to facilitate orderly scheduling of the procurement of these large cost items as this is a time‐consuming process with limited staffing resources.
What is a capital improvement?
A capital improvement must meet one of three criteria to be included in the capital budget:
New construction, expansion, renovation, or replacement with a total cost of at least $5,000 over the life of the project.
Major equipment costing $5,000 or more with a useful life of at least 3 years
A major maintenance or rehabilitation project with a cost of $5,000 or more and an economic life of at least 5 years.
Note that the capital improvement plan has a threshold of $25,000 for inclusion.
21
BudgetSummary
current operating budget, and Annex E contains the County’s five year capital improvement plan along with the estimated impact of these expenditures on the County’s current and future operating budgets.
Future budget implications
The 2016 budget completes the transition to a full multi‐year budget, containing rolling forward estimates for 2017 and 2018 based on objective forecasts of all revenues and costs. In other words, at the time this budget was adopted the 2017 and 2018 revenues and expenditures were the best estimates of the full cost of implementing all current policy. As a consequence, 2017 expenditure estimates for each department serve as the ceiling for their budget submissions. Any requested increase above that amount, either due to new policy or perceived shortfall in resources, must be justified through a new spending request. In preparing the annual budget, the county administrator may recommend increases due to the cost of implementing current policy; spending requests that would result from policy changes are sent to the county board without recommendation (albeit with evaluation). Similarly, each department is directed to submit an optional expenditure reduction that would result in a savings of five percent in general revenue support; these savings options are also sent to the county board generally without recommendation (but again with evaluation). Following final county board action, a table will be prepared that shows all changes from the initial budget ceilings by department.
Forecasting in current conditions has become a bit more certain than in the past, and the estimates are deemed to be relatively reliable. Actual personnel costs were estimated using a modest but reasonable increase in compensation and benefit costs. Cost of supplies and materials were increased by inflation using the latest projections from the State of Wisconsin. For planning purposes, debt service was frozen at $3.2 million in anticipation of infrastructure investments in 2017 and thereafter.
Property tax revenues were increased by the estimated growth in the levy cap, and sales tax by the estimated increase in personal consumption expenditures. We do not expect any significant change in State aid. 2016 is the first year in a decade where debt service levy will decrease. Finally, we do expect that repayments to the asset and investment loan fund will allow for funding additional investments to assist in reducing future costs. We do not expect any significant relaxation of the levy cap or increase in levy in the foreseeable future.
For the very long term, the financial outlook for the County remains positive with a resumption in growth in tax base, expansion in population and employment, and vibrant tourism, manufacturing, retail and medical sectors. The levy cap, if it continues, will constrain expenditure growth, especially if State aid also remains frozen, meaning county government will need to continue to transition to a smaller, more efficient government, one more flexible and responsive in service provision, more competitive in the market for talent, and altogether better at providing the services citizens want and are willing to pay for. This transition must also occur within an environment of changing demand for services: like
22

BudgetSummary
all rural or semi‐rural counties, Polk County’s population is rapidly aging, meaning increased demand for services such as medical transportation, public health, and many social services. Population growth and development will also increase pressure on the County’s highway system, both in construction and in maintenance, and on law enforcement. Finally, the disruptive effect of technology as noted above is both a long term opportunity to improve service provision and reduce costs and a potential financial threat in funding the cost of systems replacement, as was the case this year with the Sheriff’s data terminals. The County has a substantial investment in equipment and infrastructure, some of which will doubtlessly be rendered obsolete in the future.
As always, more information on the annual budget, both its preparation and execution, is available from the Department of Administration and on the County’s website (www.co.polk.wi.us – click on fiscal transparency).
Selected Indicators, Polk County
Population Unemployment Rate (percent)
Per Capita Personal Income
Taxable Retail Sales ($ millions)
2008 44,331 5.8 32,226 472.2 2009 44,376 10.5 32,625 443.5 2010 44,153 9.8 33,243 456.2 2011 43,954 8.4 35,699 476.7 2012 43,565 8.0 37,553 482.9 2013 43,476 7.3 37,702 503.1 2014 43,484 5.9 39,716 564.4 2015 44,259 4.9 41,213 578.6
23

The Government Finance Officers Association of the United States and Canada (GFOA) presented a Distinguished Budget Presentation Award to Polk County, Wisconsin for its annual budget for the fiscal year beginning January 1, 2015. In order to receive this award, a governmental unit must publish budget documents that meet program criteria as a policy document, as an operations guide, as a financial plan, and as a communications device. This award is valid for a period of one year only. We believe our current budget continues to conform to program requirements, and we are submitting it to GFOA to determine its eligibility for another award.
24

StrategicGoalsandStrategies:Doingtherightthings
The annual budget is the main method through which a local government sets its policy priorities for the coming year and beyond. As former U.S. Senate Budget Committee Chair Pete Domenici once said, “Budgeting is governing.” By State law, the Polk County Board of Supervisors is charged with setting the strategic direction for Polk County government, in large part through the annual budget. To provide direction in preparation of the budget, the County Board initiated a strategic planning process in 2007 establishing the mission of the County “To serve and represent the public with integrity” and a vision of “an improved quality of life for all who live, work, and play in Polk County.” From this mission and vision, a set of strategic directions were developed that act to guide departments in long term strategy. These are summarized in the text box to the right.
In late 2009 the County Board adopted a comprehensive plan for the period 2009‐2029 following a lengthy series of public meetings and hearings. This plan set direction for the County in a number of areas including land use; economic development; agricultural, natural, and cultural resources; utilities and community facilities; transportation; energy and sustainability; housing; and intergovernmental cooperation. A copy of this plan may be obtained from the County’s website (www.co.polk.wi.us/landinfo/PlanningCompPlan.asp). At a special meeting of the Board of Supervisors in 2011 the County Board was asked again to prioritize among these disparate objectives in order to provide direction for development of expenditure priorities for 2014 and beyond. The results of this prioritization are also included in the text box to the right; those that duplicated the strategic direction set earlier are not included. Additionally, every governing committee was asked to review the strategic plan for their departments prior to the budget submission, and every department was asked to incorporate that review in their submission.
The 2016 budget addresses these strategic goals through both ongoing programs and new initiatives. Environmental protection and preservation of natural resources rank
County Board Priorities and Directives
Mission: To serve and represent the public with integrity.
Vision: An improved quality of life for all who live, work, and play in Polk County.
Strategic Directions: Foster a diverse economic base Promote quality education for all Good land use practices that recognize
distinctions Preserve and enhance the environment Maintain a responsive transportation
system
Strategic priorities, comprehensive plan (unduplicated):
Growth and policies that preserve natural resources
Maintain the rural character and agricultural resources within the county
Promote energy efficiency and alternative energy
Preserve our cultural heritage
25

SettingPriorities
high on the list of priorities, and the 2016 budget continues the County’s efforts in water quality through the Land and Water Department to preserve the County’s lakes and rivers and protect against detrimental effects of development. In addition, the budget also funds a new LiDAR contour mapping program which, once completed, will provide precise information on runoff and nonpoint sources of pollution, further assisting protection of the County’s lakes and rivers.
Additional funding was also provided for energy efficiency through the installation of more energy‐efficient lighting at the Justice Center, and Economic diversity was addressed through continuing County support of the Economic Development Authority and continued support for the County’s Tourist Information Center. Polk County receives a great benefit from tourism, and is one of very few local governments to operate a fully‐staffed Information Center. Support for agriculture continues within the County through the County’s Lime Quarry, which, by selling lime at cost, directly and significantly benefits the County’s farmers. Preservation of cultural heritage was addressed through increased funding for the County’s museum facility. The County has also addressed education though its support of University of Wisconsin Extension, a program that provides training and education for residents on diverse areas ranging from animal husbandry to parent education. Finally, support of transportation remains high, with funding at a level to maintain all of the County’s roads at an average pavement quality of seven on a scale of one to 10, a level which requires only minor maintenance.
Two other courses separate courses of action were followed to operationalize these priorities. First, a comprehensive list of programs was prepared by departments including a brief descriptor of the program, whether the program is mandated by state or federal law and the relevant statutory cite, stakeholder information, number of full time equivalent staff (FTEs), and revenue sources. This information was coupled with performance indicators developed for that purpose and the County Board was asked to rank programs based on their constituents’ perception of each program’s importance. This program prioritization was completed in the spring of 2013, and is scheduled to be repeated early in 2016 following the election of a new County Board. The consequent rating, especially for the highest scoring programs, entered directly into the budget preparation process under the direction of the county administrator.
A broader means of operationalizing priorities as set by the County Board was the requirement by the county administrator that every county program be linked to the County’s mission statement, vision statement, strategic goals and/or comprehensive plan. Every section therefore contains a statement or statement tying that department to these priorities and, further, the goals established for each program may be evaluated in the context of how progress toward those goals furthers these priorities.
Figure 8, below, illustrates the policy cycle as applied in Polk County Government. It begins with the strategic direction set by the County Board and follows into issue definition as the Board sets its priorities. County staff then develop alternatives to address these issues and present them
26

SettingPriorities
Set strategic direction
Define issues
Develop alternatives
Present alternatives
Select alternative
Implement
Evaluate
to the Board, who selects alternatives to be implemented by County staff and evaluated, with results again returning to the County Board. This evaluation occurs within the committee structure, as committees have oversight responsibility for programs in their functional areas.
Figure 8 Polk County Policy Development Cycle
Legend:
●County Board ●Administration and department heads
27

Input Activity Output Result
DoingThingsRight:Efficiency,EffectivenessandValueforMoney
The Value for Money (VFM) concept is a means of demonstrating that public expenditures are made efficiently and effectively, that they achieve results that people want – and are willing to pay for. Although no substitute for a detailed program evaluation, performance measures linked to efficiency and effectiveness can provide an insight into well a program is doing in reaching those goals set by (or derived from) the strategic direction set by the County Board. Over time, appropriate measures if tracked – and compared to prior year projections – can also improve accountability to the County Board and to the public (especially when coupled with assumptions and risk). For example, a good measure for an anti‐smoking program would be percentage of high school students who have smoked cigarettes in the last 30 days, with a principal risk being an increase in the availability of cigarettes to juveniles. If the smoking rate does not decline and there is no increase in availability then it would be reasonable to question the overall value of the program.
For 2015, every department was required to identify programs, or groups of expenditures by common objective, to identify that objective, and to develop or refine performance measures to indicate the degree to which these objectives are being met. There are four types of indicators in these LogFrames: activity (day‐to‐day operations), output (goods and services produced by the activities), result (resultant near term economic or social change, also a measure of effectiveness) and impact (long term economic or social change). The latter are sometimes called outcome measures. This year, an additional indicator was used for several programs, a measure of efficiency or cost per unit of program output. The diagram below shows overall program logic and the place for measurement.
As in many governments (or other organizations) it is difficult to measure results due to lack of data or inability to account for outside factors.
Economy Effectiveness
Efficiency
Economy: Are inputs reasonably priced and obtained competitively?
Efficiency: How efficiently does a County department convert inputs into outputs?
Effectiveness: How effective are these outputs in obtaining the results citizens want?
28

SettingPriorities
As a result, many of the indicators are of activities or outputs, which are goods and services produced by these activities. Such indicators – activities and outputs – can tell the reader what is happening in a program, but they cannot tell the reader whether this is successful. Given this imperfect substitution, to further program logic and measurement of results administration developed a simple logical framework for those programs in excess of $1 million. This model, developed by the Department of Defense in the late 1960s but dormant in the U.S. since then (although now a standard in the European Union and British Commonwealth), neatly ties activities, outputs, outcomes and impact to performance measures, their source, and inherent risks and assumptions so as to enable the County Board and the public to better evaluate these large programs. Annex C contains instructions on how to interpret a logical framework.
Selected Performance Measures
Highway pavement quality index: 7.0 or better PASER rating (7.0 = good, requiring only crack sealing)
Unassigned fund balance as a percent of General Fund expenditures: 36.5%
Percentage of 11 to 18 year olds completing the HPV vaccination series: 23%
Court cases assigned to District Attorney:1,545
Pounds of phosphorous reduction to lakes and streams from runoff management: 425
29

SettingPriorities
Multi‐YearBudgeting
The 2016 budget completes a transition begun several years ago to a full program performance budgeting process with rolling forward estimates. For the last several years, departments have estimated their expenditures by program, usually using a simplified activity based costing process with a subjective assessment of percentage of resources allocated to each program. This year, these subjective assessments are assigned to programs in dollar terms and costs projected forward based on estimated inflation and growth in personnel costs (note that as this programmatic allocation is still somewhat subjective it is anticipated that it will take a few cycles before very accurate costs by program can be determined). This new process is linked directly to revised annual reports that contain actual costs per program and, where available, per unit or service. The performance component of the budget is a requirement that every program list at least one output (productivity) and one outcome (effectiveness) measure. These measures are also included in the aforementioned annual reports along with other indicators as available.
The multiyear budget is designed to enhance predictability and transparency through the use of the forward year amounts as budget ceilings. Over the past several years, Polk County has refined estimates of the cost of implementation of policy as set by the County Board; these estimates can therefore be projected forward with some degree of confidence. The 2017 budget amount contained in this document is the ceiling for each department for that year; only changes to that ceiling will be subject to detailed scrutiny and evaluation (both increases and decreases). For 2017 and beyond, a table will be publicly provided that shows any adjustment to these ceilings; these adjustments will be presented to the County Board for their consideration. If an adjustment is deemed to be function of the cost of administration of current policy, that adjustment will be part of the county administrator’s budget recommendation. If a request for new resources is considered to be a policy change, that request will be sent directly to the County Board without recommendation from the county administrator for their consideration. Along with these new spending requests, departments will also prepare program savings options equal to five percent of their general revenues (those revenues amenable to reassignment). The County Board will also receive a listing of these savings options for their consideration.
30

BudgetProcessFlowchart
31

APRIL S M T W T F S 1 2 3 4 5 6 7 8 9 10 1112 13 14 15 16 17 1819 20 21 22 23 24 2526 27 28 29 30
MAY
S M T W T F S 1 2 3 4 5 6 7 8 9 10 11 12 13 14 15 1617 18 19 20 21 22 2324 25 26 27 28 29 3031
JUNE
S M T W T F S 1 2 3 4 5 6
7 8 9 10 11 12 1314 15 16 17 18 19 2021 22 23 24 25 26 2728 29 30
2 0 1 5 D A T E S F O R
P R E P A R A T I O N O F T H E
2 0 1 6 B U D G E T Jan – May: Evaluations of selected programs
Jan – May: Review of department strategic plans in committees
Feb 9: Department head meeting, discussion of budget parameters
May 1: Second set of budget instructions released
Feb 9 – Mar 31: Briefing for departments as needed
June: Annual reports submitted to committees
March 16: Initial budget instructions released
June 12: Budget requests due including fee revisions
March 17: Budget calendar provided to the County Board
Jun 16: Board discussion on fiscal parameters and policy direction
June 22 – July 17: Administration budget hearings
Polk County Budget Calendar
JANUARY S M T W T F S 1 2 3 4 5 6 7 8 9 10 11 12 13 14 15 16 17 18 19 20 21 22 23 24 25 26 27 28 29 30 31
FEBRUARY
S M T W T F S 1 2 3 4 5 6 7 8 9 10 11 12 13 14 15 16 17 18 19 20 21 22 23 24 25 26 27 28
MARCH
S M T W T F S 1 2 3 4 5 6 7 8 9 10 11 12 13 14 15 16 17 18 19 20 21 22 23 24 25 26 27 28 29 30 31
32

JULY S M T W T F S 1 2 3 4 5 6 7 8 9 10 11 12 13 14 15 16 17 18 19 20 21 22 23 24 25 26 27 28 29 30 31
AUGUST S M T W T F S 1 2 3 4 5 6 7 8 9 10 11 12 13 14 15
16 17 18 19 20 21 22 23 24 25 26 27 28 29 30 31
SEPTEMBER
S M T W T F S 1 2 3 4 5 6 7 8 9 10 11 12
13 14 15 16 17 18 19 20 21 22 23 24 25 26 27 28 29 30
OCTOBER S M T W T F S 1 2 3 4 5 6 7 8 9 1011 12 13 14 15 16 17
18 19 20 21 22 23 2425 26 27 28 29 30 31
NOVEMBER
S M T W T F S 1 2 3 4 5 6 7
8 9 10 11 12 13 1415 16 17 18 19 20 2122 23 24 25 26 27 2829 30
DECEMBER
S M T W T F S 1 2 3 4 5 6 7 8 9 10 11 1213 14 15 16 17 18 1920 21 22 23 24 25 2627 28 29 30 31
K E Y D A T E S Jul - Aug: Governing committees review budget submissions and fee schedule
July 21: Board discussion of policy issues (as needed)
July 24: Department budget revisions due
Oct 20: Board consideration of amendments; budget for publication
Oct 21 – Nov 10: Committee consideration of additional amendments
Aug 18: Board approves fee schedule for submission
Aug 21: Final deadline for revisions from departments and capital improvement plan
Nov 10: Board approves final budget
Sep 15: Administration budget recommendation and introduction of draft resolution
September-October: Committee consideration of budget amendments
33
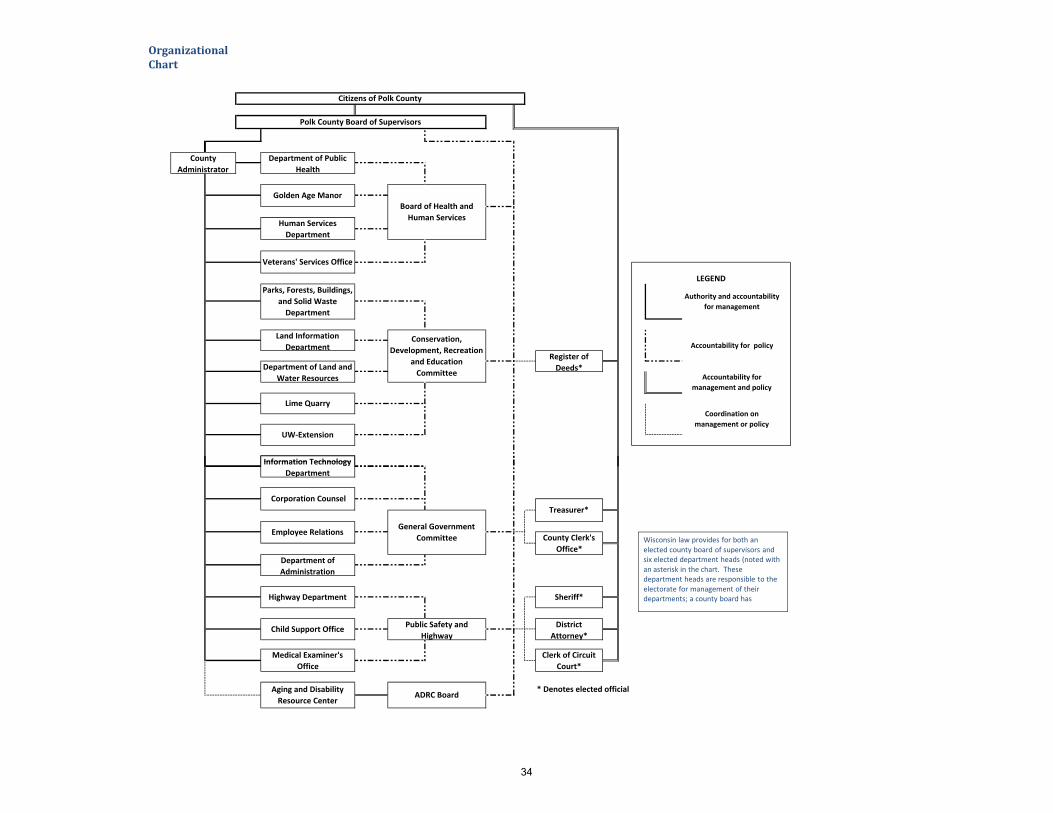
OrganizationalChart
Department of Public Health
County Administrator
UW‐Extension
Veterans' Services Office
Lime Quarry
Parks, Forests, Buildings, and Solid Waste Department
Land Information Department
Citizens of Polk County
Department of Land and Water Resources
Information Technology
Golden Age Manor
Human Services Department
Polk County Board of Supervisors
Conservation, Development, Recreation
and Education Committee
Authority and accountability for management
Accountability for policy
Accountability for management and policy
Coordination on management or policy
Board of Health and Human Services
LEGEND
Register of Deeds*
Public Safety and Highway
Aging and Disability Resource Center
* Denotes elected official
Employee Relations
Clerk of Circuit Court*
Medical Examiner's Office
Sheriff*
District Attorney*
Treasurer*
Information Technology Department
County Clerk's Office*
Corporation Counsel
ADRC Board
Department of Administration
Highway Department
General Government Committee
Child Support Office
Wisconsin law provides for both an elected county board of supervisors and six elected department heads (noted with an asterisk in the chart. These department heads are responsible to the electorate for management of their departments; a county board has
34

PolkCountyDepartmentalOrganizationandContactInformation
Department of Administration Dana Frey, Administrator [email protected] 100 Polk Plaza, Suite 220 715‐485‐9286
Aging and Disability ResourceCenter Laura Neve, Director [email protected] 100 Polk Plaza, Suite 60 715‐485‐8449 Toll Free 877‐485‐2372
Corporation Counsel/Child SupportJeff Fuge, Corporation Counsel [email protected] 1005 W Main St, Suite 100 715‐485‐9210
County ClerkCarole Wondra, County Clerk [email protected] 100 Polk County Plaza, Suite 110 715‐485‐9226
Clerk of Circuit Court Jobie Bainbridge, Clerk of Court jobie.bainbridge @wicourts.gov 1005 W Main Street, Suite 300 715‐485‐9241
District AttorneyDaniel P. Steffen, District Attorney [email protected] 1005 W Main Street, Suite 700 715‐485‐9231
Employee Relations DepartmentAndrea Jerrick, Director [email protected] 100 Polk County Plaza, Suite 229 715‐485‐9270
UW ‐ Extension Charles Prissel and Gail Peavey, Co‐department heads [email protected] [email protected] 100 Polk County Plaza, Suite 210 715‐485‐8600
Golden Age Manor Dana Reese, Administrator [email protected] 220 Scholl Ct., Amery, WI 54001 715‐268‐7107
Health Department Gretchen Sampson, Director [email protected] 100 Polk County Plaza, Suite 50 715‐485‐8500
Highway Department Steve Warndahl, Commissioner [email protected] 518 Main Street 715‐485‐8700
Human ServicesGretchen Sampson, Director [email protected] 100 Polk County Plaza, Suite 50 715‐485‐8500
Information Technology Todd A. Demers, Director [email protected] 100 Polk County Plaza, Suite 205 715‐485‐9220
Land Information Sara McCurdy [email protected] 100 Polk County Plaza, Suite 130 715‐485‐9170
Land & Water Resources Tim Ritten, Director [email protected] 100 Polk County Plaza, Suite 120 715‐485‐8699
Lime Quarry David Peterson Manager [email protected] 2023 50th Avenue Osceola, WI 54020 715‐294‐2351
All addresses are Balsam Lake, WI 54810 unless otherwise noted
35

PolkCountyDepartmentalOrganizationandContactInformation Medical Examiner Jonn B. Dinnies, ABMDI [email protected] 1005 W Main Street, Suite 700 715‐485‐9218
Parks, Buildings, & Solid Waste Debra Peterson, Director [email protected] 100 Polk County Plaza, Suite 10 715‐485‐9294
Register of Deeds Laurie Anderson, Register of Deeds [email protected] 100 Polk County Plaza, Suite 160 715‐485‐9240
County TreasurerAmanda Nissen, Treasurer [email protected] 100 Polk County Plaza, Suite 150 715‐485‐9255
Veterans Service Office Richard Gates, VSO [email protected] 100 Polk County Plaza, Suite 70 715‐485‐9243
Polk County Sheriff's OfficeSheriff Peter M. Johnson [email protected] 715‐485‐8300 1005 W Main Street, Suite 900
All addresses are Balsam Lake, WI 54810 unless otherwise noted
36

Howtousethisdocument
In the following document, information on each department is provided in a standardized format, beginning with the department narrative and followed by the financial data for each department. Some departments have several pages of financial data, either because they have several funds (e.g. Public Health) or because of the policy that every fund be assigned to a specific department head and committee for oversight purposes (e.g. Land Information).
The department narrative provides the name of the department head, a brief description of the department, followed by the mission statement, link to the County’s mission statement, vision statement, strategic goals and/or comprehensive plan, a program listing, and a statement of any significant factors affecting the department budget for 2015. The organizing principles for each narrative are to provide answers to the following four key questions:
1. Why does a department exist? 2. What does a department do? What goods or services does it produce? 3. What does it cost to produce those goods or services? 4. How can you tell if a program is succeeding?
The first question, the reason for a department’s existence, is addressed in its mission statement. The second, what it does, is addressed in its program listing. The third question, cost, is now calculated directly in the program budgets. The final question, measuring success, is addressed through the performance measure assigned each program.
The individual budget pages provide information on revenues and expenditures by category for a five year period: actual data for the three years preceding the year in which the budget was adopted, the current budget for the year in which the budget was adopted, as actual results are not available until the following year, and the budget year itself, in this case 2015. Information is also provided for employment for each department by type of employee.
The following diagram explains the budget documents, itself followed by definitions of the terms used in the summary.
37

Howtousethisdocument
Samplebudgetpage
Current year
budget
Category of revenue – see definitions following
Category of expenditures from uniform chart of accounts
Full‐time equivalent employees*
Type of employee
* FTE is full time equivalent, meaning that two half time employees equate to one FTE. Number of employees may be higher than the FTE figure provided, but can never be lower.
Audited financial results Adopted budget
Preliminary budget ceilings
38

Howtousethisdocument
BudgetpagedefinitionsRevenue categories5
General property tax: Tax revenues received or scheduled to be received by the county, including general sales tax and property tax collections.
Other taxes: Transfer taxes, forest crop tax, and principally interest on delinquent taxes
State aids: Funding received from the State of Wisconsin in the form of grants, annual aid allocation such as transportation aid, or pass‐through Federal funding such as Medical Assistance.
License and fees: Revenue collected from the public other than for optional services provided. Includes fine revenue, revenue from building permits and similar, dog licenses, and similar.
Public charge for services: Direct payment for services rendered to members of the public such as nursing home revenues, home care charges, sale of timber, restaurant inspection charges, and similar.
Interest: Income received from investment of funds.
Intergovernmental: Reimbursement from a city, town or village services rendered, e.g. engineering services.
Donations: Gifts to an agency or department from the public.
Other financing sources: Use of carryover funds, transfer from other funds and use of fund balance.
Miscellaneous: Revenue that had not been assigned to the appropriate revenue category.
Expenditure categories Personnel: Salaries, wages, employee benefits, and per diems.
Operating ‐ 000: Expenditures for other than personnel costs that had not been assigned to the appropriate expenditure category.
Professional services: Contractual services, utilities, repair and maintenance charges paid outside agencies.
Supplies and expenses: Office supplies, publications, dues, travel, repair and maintenance supplies, highway construction material.
Fixed charges: Insurance, rents and leases, depreciation, amortization, investment charges.
Debt service: Payment of principal and interest on obligations.
Other grants contributions: Direct relief to indigents, awards and indemnities, grants and donations, and losses.
Capital outlay: Purchase of capital equipment or capital improvements.
Transfers: Payments from an agency to another fund.
FTE categories Officials/Administration: Head of the department or agency
Professionals: Positions that require a college degree or equivalent experience, e.g. a registered nurse.
Technicians/Para‐Professionals: Positions that require a two‐year degree or equivalent experience, e.g. a licensed practical nurse.
Protective Service workers: Licensed law enforcement personnel
Administrative support: Employees whose duties are principally clerical or secretarial in nature
Skilled craft/service maintenance: Equipment operators and maintenance workers
5 Revenue and expenditure categories from the Wisconsin Uniform Chart of Accounts, FTE categories from the Equal Opportunity Employment Commission
39

ExplanationofFundStructureandBasisofAccounting Polk County’s governmental funds are organized according to the Uniform Chart of Accounts for Wisconsin Municipalities as developed by the Wisconsin Department of Revenue and standards as set by the Government Accounting Standards Bureau. Each fund is considered to be a separate accounting entity and is accounted for through a separate budget and in the County’s annual audit. Governmental funds incorporated in the annual budget are: General Fund ‐ The General Fund is the primary operating fund. It is used to account for all financial resources of the General Government, except those required to be accounted for in another fund. Debt Service Fund ‐ The Debt Service Fund is used to account for the payment of principal and interest payments on long‐term debt which is financed by property tax revenue restricted through bond documents. Special Revenue Funds are used to account for the proceeds of specific revenue sources that are legally restricted for specific purposes or activities other than capital assets. Polk County has 24 special revenue funds:
Human Services Fund ‐ The Human Services Special Revenue Fund is used to account for economic assistance and community social services programs. These programs are funded primarily by property taxes, committed through the Board approved levy, and restricted intergovernmental revenues. Public Health Special Revenue Funds ‐ Ten separate funds including Bioterrorism Consortium, Birth to Tree (children’s’ health), WIC (women and infant children nutrition), Prenatal Care (formerly Health Screening), Tobacco Coalition, Reproductive Health (formerly Family Planning), Immunization, Consolidated Grant Fund (public health awareness), Radon Grant Fund, and Environmental Health Fund (chiefly restaurant inspections). ADRC – Used to account for the operations of the Aging and Disability Resource Center and (beginning in 2012) the former Aging Department Snowmobile/ATV Trails ‐ Operations relating to the maintenance of snowmobile and ATV (all‐terrain vehicle) trails Other special revenue funds are Jail Assessment Fees (funding for jail operations), Family Court Counseling (court‐ordered counseling), Dog License (animal control), Drivers Improvement (court ordered), Park Dedication and Lake Improvement (park projects), State Aided Forestry Fund, Sanitary Systems Grants, Community Development Block Grant and County Sales Tax Fund (used to account for annual sales tax receipts).
Enterprise Funds are used to account for activities and organizations which are similar to private business enterprises with costs recovered through user charges. Polk County has two enterprise funds:
Nursing Home Fund ‐ This fund accounts for the operations of the County's nursing home. Lime Fund ‐ This fund is used to account for the County's lime quarry operations.
40

FundStructureandBasisofAccounting
Internal Service Funds are established to account for services performed by a department or agency of a municipality for other departments or agencies of the municipality or other governments: Polk County has four internal service funds:
Highway Fund – Operations of the Polk County Highway Department Health Insurance Fund – Operations of the County’s self‐funded health insurance program Retirement Account – Revenue and expenditures for payout of unused sick leave at retirement (new) Asset Protection and Internal Investment – Internal revolving loan fund for capital projects and other investments, funded through long‐term budget savings (new) Fleet Management – funding for the operation of the County’s vehicle fleet (other than Highway and Law Enforcement)
The 2015 budget does contain a Capital Project Fund for the first time in several years, used to account for the LiDAR contour mapping process funded through a number of sources. The budget does not include any fund (other than by reference) that has no revenues or expenditures for 2015. However, if these funds have any fund balance that balance will be incorporated in the annual audit. The 2015 budget also does not include any Agency Funds which are used to account for assets held by the County in a trustee capacity or as an agent for individuals, private organizations and/or other governmental units as these funds are not budgeted by the County Board. These funds are included in the annual audit and, according the last audit there are five such funds with the largest being the Tax Agency, property taxes collected by the County on behalf of and distributed to the towns, villages, cities and school districts in the County.
BasisofAccountingPolk County prepares and reports the annual budget, including the preceding and following tables, and the annual audit using the modified accrual basis of accounting. Revenues, expenses, gains, losses, assets and liabilities resulting from exchange and exchange‐like transactions are recognized when the exchange takes place. Non‐exchange transactions, in which the County gives or receives value without directly receiving or giving equal value in exchange, include property taxes, grants, entitlements and donations. Property taxes are recognized as revenues in the year for which they are levied. Taxes receivable for the following year are recorded as receivables and deferred revenue. Grants and similar items are recognized as revenue as soon as all eligibility requirements imposed by the provider are met. Polk County does not carry depreciation on its general ledger or use encumbrances.
41
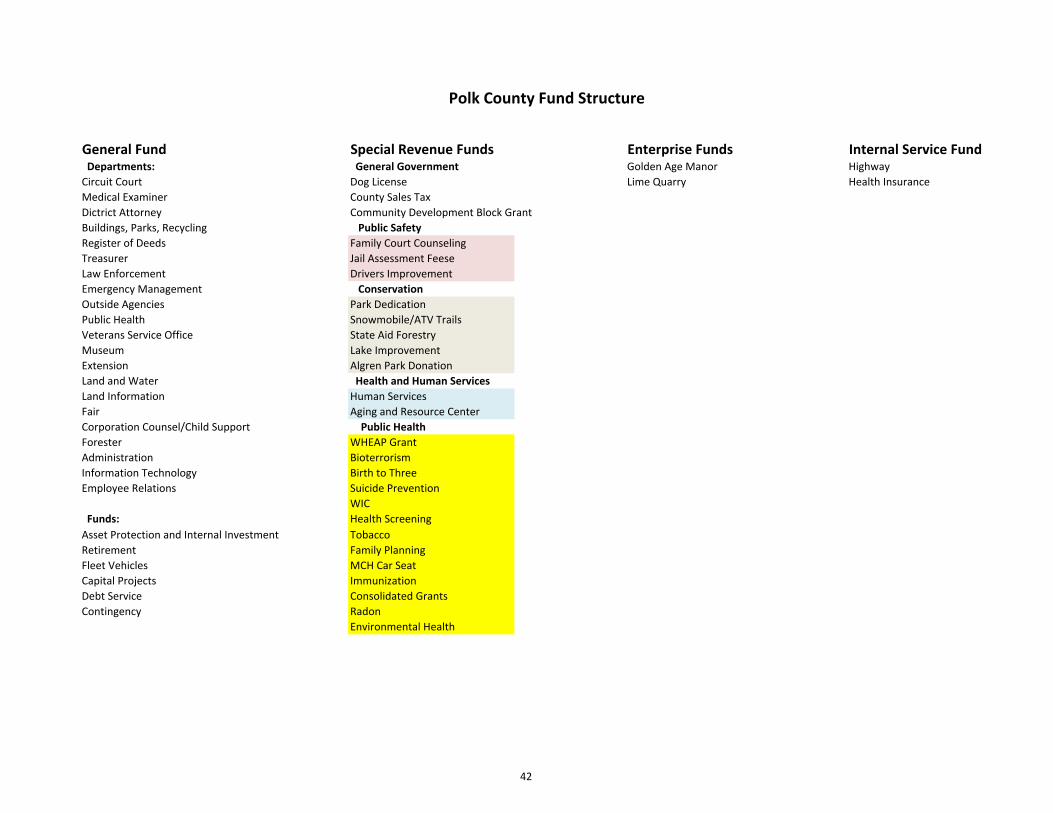
General Fund Special Revenue Funds Enterprise Funds Internal Service Fund Departments: General Government Golden Age Manor HighwayCircuit Court Dog License Lime Quarry Health InsuranceMedical Examiner County Sales TaxDictrict Attorney Community Development Block GrantBuildings, Parks, Recycling Public SafetyRegister of Deeds Family Court CounselingTreasurer Jail Assessment FeeseLaw Enforcement Drivers ImprovementEmergency Management ConservationOutside Agencies Park DedicationPublic Health Snowmobile/ATV TrailsVeterans Service Office State Aid ForestryMuseum Lake ImprovementExtension Algren Park DonationLand and Water Health and Human ServicesLand Information Human ServicesFair Aging and Resource CenterCorporation Counsel/Child Support Public HealthForester WHEAP GrantAdministration BioterrorismInformation Technology Birth to ThreeEmployee Relations Suicide Prevention
WIC Funds: Health Screening
TobaccoRetirement Family PlanningFleet Vehicles MCH Car SeatCapital Projects ImmunizationDebt Service Consolidated GrantsContingency Radon
Environmental Health
Asset Protection and Internal Investment
Polk County Fund Structure
42

2016BudgetSummaryTables
43

2016 2015 2014Actual Budget Budget Budget Budget
SUMMARY BY ECONOMIC CLASSIFICATION
2017SUMMARYActual
TABLE 3
-
2018 2013
2013 2018
Revenue 20,964,004 21,682,699 General Property Tax Minus Act 150/Bridge 21,899,526 20,989,554 21,170,122 21,468,017
819,159 696,145 Other Taxes Minus 203 sales tax 646,145 825,136 736,170 746,145
9,420,290 10,365,104 State Aids 10,410,274 8,833,334 10,150,596 10,450,239
315,832 315,985 License & Fees 314,485 290,942 324,842 315,941
218,080 219,050 Fine and Forfeitures 219,050 249,154 235,900 219,050
13,244,856 12,288,583 Public Charge for Services 12,302,903 13,758,950 12,085,067 12,141,088
3,137,255 3,008,188 Intergovernmental Revenue 3,009,558 2,873,361 2,787,832 3,005,901
833,495 525,823 Misc Revenue 530,861 813,541 538,425 519,485
3,359,849 3,549,766 Other Financing Sources 3,602,568 3,114,763 5,232,719 3,473,168
52,312,822 52,651,343 Total Income 52,935,370 51,748,734 53,261,673 52,339,033
Expense 28,990,318 30,847,337 Personnel Services 31,488,125 29,096,981 29,793,958 30,276,642
1,835,168 1,878,336 Operating - 000 Minus Bridge Aid 1,878,336 2,725,735 1,863,067 1,769,311
7,785,245 8,306,065 Contractual Services 8,372,797 7,135,075 7,704,099 8,454,570
3,729,377 4,165,757 Supplies & Expenses 4,227,728 3,133,551 3,901,279 4,196,604
1,445,698 1,602,199 Fixed Charges 1,602,199 1,462,200 1,522,423 1,577,191
4,206,502 3,200,000 Debt Service 3,200,000 4,215,600 5,551,651 3,327,152
1,749,968 760,603 Grants, Contributions, Indem Minus Act 150 760,603 1,724,775 703,053 760,603
286,711 1,176,950 Capital Outlay 746,950 522,863 1,257,687 1,203,989
1,177,094 681,736 Cost Reallocation Minus 203 sales tax 649,538 1,033,534 2,131,365 775,959
51,206,081 52,618,983 Total Expense 52,926,275 51,050,314 54,428,581 52,342,021
Net Revenue and Expenditures 1,106,741 32,360 9,095 698,420 (1,166,908) (2,988)
FTE 2017
BudgetBudgetBudgetBudgetActual
2014 2015 2016
Actual
2018 2013
Professionals 91.11 86.76 90.41 89.10 89.10 89.64
Technicians/Para-Professionals 73.33 72.73 68.65 55.70 55.70 55.70
Administrative Support 68.95 67.62 66.18 77.40 77.40 77.40
Skilled Craft/Service Maintenance 120.99 119.70 120.99 123.45 123.45 123.45
Protective Service Workers 54.45 55.46 54.94 55.44 55.44 55.44
Officials/Administrators 20.85 21.60 21.60 20.60 20.60 20.60
Total 429.68 423.87 422.77 421.69 421.69 422.23
44

SUMMARY BY FUNCTIONAL CLASSIFICATION
2016 2015 2014 2013
Actual Budget Budget Budget BudgetActual
SUMMARY
TABLE 4
- 2013 2018
2017 2018
Revenue
20,989,554 20,964,004 21,468,017 General Property Tax Minus Act 150/Bridge 21,170,122 21,899,526 21,682,699
825,136 819,159 746,145 Other Taxes Minus 203 sales tax 736,170 646,145 696,145
8,833,334 9,420,290 10,450,239 State Aids 10,150,596 10,410,274 10,365,104
290,942 315,832 315,941 License & Fees 324,842 314,485 315,985
249,154 218,080 219,050 Fine and Forfeitures 235,900 219,050 219,050
13,758,950 13,244,856 12,141,088 Public Charge for Services 12,085,067 12,302,903 12,288,583
2,873,361 3,137,255 3,005,901 Intergovernmental Revenue 2,787,832 3,009,558 3,008,188
813,541 833,495 519,485 Misc Revenue 538,425 530,861 525,823
3,114,763 3,359,849 3,473,168 Other Financing Sources 5,232,719 3,602,568 3,549,766
51,748,734 52,312,822 52,339,033 Total Income 53,261,673 52,651,343 52,935,370
Expense
6,443,089 6,063,643 7,386,019 General Government 6,859,346 7,298,927 7,591,833
7,640,004 7,671,423 7,990,082 Public Safety Minus Bridge Aid 8,074,774 8,364,036 8,176,559
7,213,039 7,729,405 8,014,127 Public Works 7,600,946 8,190,718 8,048,765
21,900,160 21,782,543 21,960,936 Health & Human Services 21,361,164 22,388,592 22,148,006
640,842 621,386 624,475 Culture, Recreation, EntertainmentMinus Act 150 594,981 625,156 614,489
2,243,445 2,249,698 2,440,104 Conservation & Development 2,431,295 2,386,141 2,334,428
4,238,587 4,257,799 3,327,152 Debt Service 5,555,651 3,200,000 3,200,000
731,148 830,184 599,126 Transfers Minus 203 sales tax 1,950,424 472,705 504,903
51,050,314 51,206,081 52,342,021 Total Expense 54,428,581 52,618,983 52,926,275
Net Revenue and Expenditures 698,420 1,106,741 (2,988)(1,166,908) 32,360 9,095
45

Figure 11Expenditures by Functional Classification
Health & Human Services$21,960,936
Transfers $599,126
Highway
Public Safety $7,990,082
General Government
Debt Service $3,327,152
Conservation & Development $2,440,104 Culture &
Recreation $624,475
2016 BUDGET
Highway $8,014,127
General Government $7,386,019
46

Budget and Levy by FundTABLE 5
2016Fund Total Revenues Non-Levy Revenues Total Expenitures Difference
Property Tax Levy
2016
General Fund
101 8,771,122 19,314,188 (19,121) 19,295,067 GENERAL 10,523,945
(19,121) 8,771,122 19,314,188 19,295,067 Total General Fund 10,523,945
Other General Fund
102 0 0 150,000 150,000 Contingency 150,000
110 251,033 533,416 (120,967) 412,449 Asset Protection and Investment 161,416
140 167,393 167,393 0 167,393 Vehicle Fleet Fund 0
29,033 418,426 700,809 729,842 Total Other General Fund 311,416
Debt Service Fund
301 40,000 3,327,152 0 3,327,152 Debt Service 3,287,152
0 40,000 3,327,152 3,327,152 Total Debt Service Fund 3,287,152
Special Revenue Funds
201 40,000 65,000 (25,000) 40,000 Jail Assesment 0
202 9,000 9,000 0 9,000 Family Court Service 0
204 40,000 40,000 0 40,000 Driver's Improvement 0
206 5,000 5,000 0 5,000 CDBG 0
208 199,338 199,338 0 199,338 WHEPP 0
209 166,369 166,369 0 166,369 Bioterrorism/Local Preparedness 0
211 5,326,364 9,211,909 0 9,211,909 Human Services 3,885,545
212 1,459,432 1,557,841 12,376 1,570,217 ADRC 110,785
218 143,087 265,454 0 265,454 Birth to Three 122,367
221 213,494 213,494 0 213,494 WIC 0
222 64,834 64,834 0 64,834 Prenatal Care Coordination 0
223 158,566 158,566 0 158,566 Tobacco 0
224 168,036 168,036 0 168,036 Family Planning 0
226 51,900 51,900 0 51,900 Immunization 0
227 108,311 108,311 0 108,311 Consolidated Contract Grants 0
228 194,626 194,626 0 194,626 Environmental 0
229 9,135 9,135 0 9,135 Radon 0 47

Fund Total Revenues Non-Levy Revenues Total Expenitures Difference
Property Tax Levy
2016
241 8,227 8,227 0 8,227 Forestry 0
243 111,290 111,290 0 111,290 Trails 0
805 23,850 23,850 0 23,850 Dog License 0
806 10,000 10,000 0 10,000 Septic System 0
807 0 15,000 (15,000) 0 Lakes Improvement 0
808 0 38,000 (38,000) 0 Sub-Division - Park Dedication 0
(65,624) 8,510,860 12,695,180 12,629,557 Total Special Revenue Funds 4,118,697
Capital Project Fund
457 60,000 141,939 0 141,939 LIDAR PROJECT 2015-16 81,939
0 60,000 141,939 141,939 Total Capital Project Fund 81,939
Enterprise Funds
601 8,236,720 8,227,410 9,310 8,236,720 Golden Age manor 0
602 664,100 629,536 34,564 664,100 Lime 0
43,874 8,900,820 8,856,946 8,900,820 Total Enterprise Funds 0
Internal Service Funds
701 4,169,789 7,305,807 8,850 7,314,657 HIGHWAY 3,144,868
8,850 4,169,789 7,305,807 7,314,657 Total Internal Service Funds 3,144,868
Total, All Funds 52,342,021 30,871,016 52,339,033 (2,988) 21,468,017
48
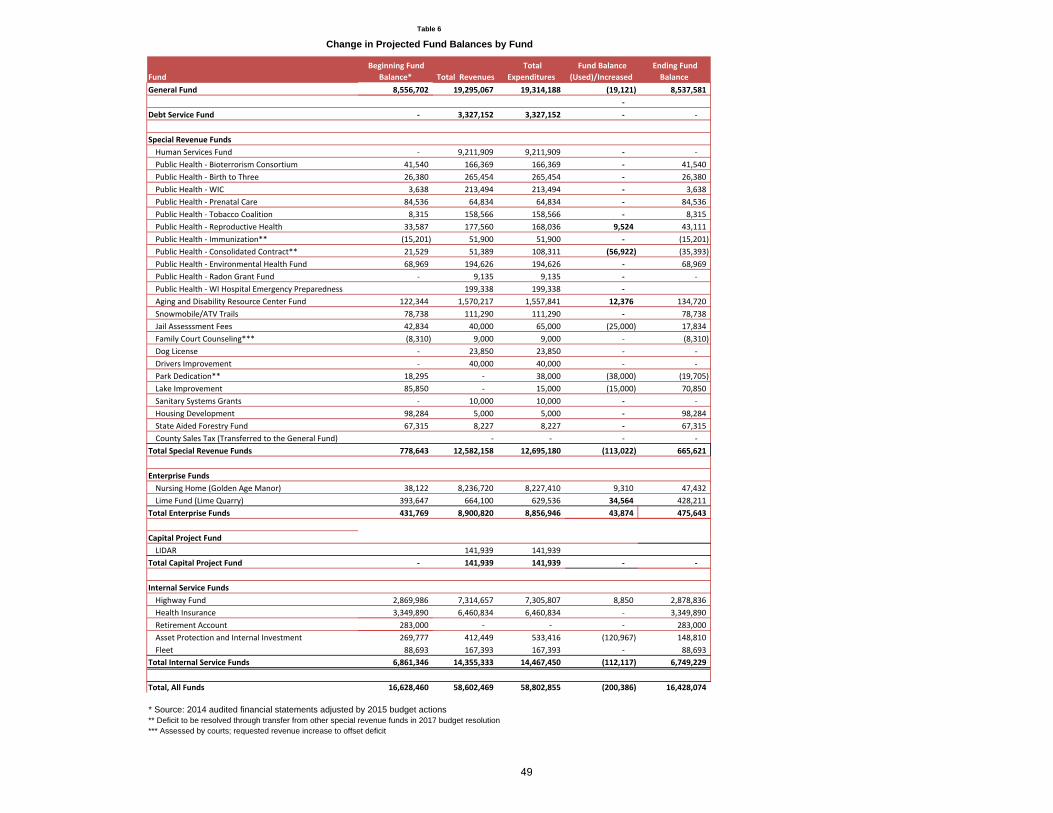
General Fund 8,556,702 19,295,067 19,314,188 (19,121) 8,537,581 ‐
Debt Service Fund ‐ 3,327,152 3,327,152 ‐ ‐
Special Revenue FundsHuman Services Fund ‐ 9,211,909 9,211,909 ‐ ‐ Public Health ‐ Bioterrorism Consortium 41,540 166,369 166,369 ‐ 41,540 Public Health ‐ Birth to Three 26,380 265,454 265,454 ‐ 26,380 Public Health ‐ WIC 3,638 213,494 213,494 ‐ 3,638 Public Health ‐ Prenatal Care 84,536 64,834 64,834 ‐ 84,536 Public Health ‐ Tobacco Coalition 8,315 158,566 158,566 ‐ 8,315 Public Health ‐ Reproductive Health 33,587 177,560 168,036 9,524 43,111 Public Health ‐ Immunization** (15,201) 51,900 51,900 ‐ (15,201) Public Health ‐ Consolidated Contract** 21,529 51,389 108,311 (56,922) (35,393) Public Health ‐ Environmental Health Fund 68,969 194,626 194,626 ‐ 68,969 Public Health ‐ Radon Grant Fund ‐ 9,135 9,135 ‐ ‐ Public Health ‐ WI Hospital Emergency Preparedness 199,338 199,338 ‐ Aging and Disability Resource Center Fund 122,344 1,570,217 1,557,841 12,376 134,720 Snowmobile/ATV Trails 78,738 111,290 111,290 ‐ 78,738 Jail Assesssment Fees 42,834 40,000 65,000 (25,000) 17,834 Family Court Counseling*** (8,310) 9,000 9,000 ‐ (8,310) Dog License ‐ 23,850 23,850 ‐ ‐ Drivers Improvement ‐ 40,000 40,000 ‐ ‐ Park Dedication** 18,295 ‐ 38,000 (38,000) (19,705) Lake Improvement 85,850 ‐ 15,000 (15,000) 70,850 Sanitary Systems Grants ‐ 10,000 10,000 ‐ ‐ Housing Development 98,284 5,000 5,000 ‐ 98,284 State Aided Forestry Fund 67,315 8,227 8,227 ‐ 67,315 County Sales Tax (Transferred to the General Fund) ‐ ‐ ‐ ‐
Total Special Revenue Funds 778,643 12,582,158 12,695,180 (113,022) 665,621
Enterprise FundsNursing Home (Golden Age Manor) 38,122 8,236,720 8,227,410 9,310 47,432 Lime Fund (Lime Quarry) 393,647 664,100 629,536 34,564 428,211
Total Enterprise Funds 431,769 8,900,820 8,856,946 43,874 475,643
Capital Project FundLIDAR 141,939 141,939
Total Capital Project Fund ‐ 141,939 141,939 ‐ ‐
Internal Service FundsHighway Fund 2,869,986 7,314,657 7,305,807 8,850 2,878,836 Health Insurance 3,349,890 6,460,834 6,460,834 ‐ 3,349,890 Retirement Account 283,000 ‐ ‐ ‐ 283,000 Asset Protection and Internal Investment 269,777 412,449 533,416 (120,967) 148,810 Fleet 88,693 167,393 167,393 ‐ 88,693
Total Internal Service Funds 6,861,346 14,355,333 14,467,450 (112,117) 6,749,229
Total, All Funds 16,628,460 58,602,469 58,802,855 (200,386) 16,428,074
** Deficit to be resolved through transfer from other special revenue funds in 2017 budget resolution*** Assessed by courts; requested revenue increase to offset deficit
Table 6
* Source: 2014 audited financial statements adjusted by 2015 budget actions
Change in Projected Fund Balances by Fund
Ending Fund Balance
Fund Balance (Used)/Increased
Total Expenditures Total Revenues
Beginning Fund Balance* Fund
49

Table 7
Summary of All Funds by Department
SUMMARY Circuit Court Jail Assmt Fam Court Drivers Imp Med Exam DA Clerk Dog License Buildings Fleet02-101 02-201 02-202 02-204 04-101 05-101 06-101 06-805 07-101 07-140
RevenuesGeneral Property Tax 648,680 - - - 103,128 394,897 363,709 - 1,648,606 - Other Taxes - - - - - - - - - - State Aids 174,705 - - - - 65,791 - - 144,224 - License & Fees - - - 38,332 - 400 23,850 - - Fines & Forfeitures 105,000 40,000 - 40,000 - 2,050 - - - - Public Charge for Services 165,000 - 9,000 - - 36,455 26,100 - 290,500 - Intergovernmental Revenue - - - - - - 34,500 - 20,000 167,392Miscellaneous Revenue - - - - - - - - - Other Financing Sources - - - - - - - - 10,463 - Total Income 1,093,385 40,000 9,000 40,000 141,460 499,194 424,709 23,850 2,113,793 167,392
ExpendituresPersonnel 772,627 - - - 90,854 439,411 273,003 - 878,220 18,876 Operating - 000 - - - - - - - - - - Professional Services 237,208 - 9,000 - 42,306 23,680 73,406 1,800 746,655 7,000 Supplies & Expenses 33,550 - - - 8,300 35,303 76,600 1,150 191,505 40,000 Fixed Charges - - - - - 800 1,700 400 - 101,516Debt Service - - - - - - - - - - Other Grants Contributions 50,000 - - - - - - 20,500 82,000 - Capital Outlay - - - - - - - - 204,950 - Transfers - 65,000 40,000 - - - - 10,463 - Total Expenditures 1,093,385 65,000 9,000 40,000 141,460 499,194 424,709 23,850 2,113,793 167,392Net Revenue and Expenditures 0 (25,000) - - - - - - - -
FTE Circuit Court Jail Assmt Fam Court Drivers Imp Med Exam DA Clerk Dog License Buildings Fleet02-101 02-201 02-202 02-204 04-101 05-101 06-101 06-805 07-101 07-140
Officials/Administration 1.00 - - - 0.60 - 1.00 - 1.00 - First/Mid Level Officials & Mngrs - - - - - 1.00 - - - - Professionals 1.00 - - - 0.11 - - - - - Technicians/Para-Professionals - - - - - 2.00 - - 3.00 - Administrative Support 10.00 - - - - 4.00 1.45 - 0.90 0.10 Skilled Craft/Service Maintenance - - - - - - - - 11.69 0.16 Protective Service Workers - - - - - - - - - - Total 12.00 - - - 0.71 7.00 2.45 - 16.59 0.26
50

Table 7
Summary of All Funds by Department
SUMMARY Snowmobile Lakes Imp Park Ded ROD Treas Law Enf Emg Mngt Outside Ag PH PH - WHEPP PH - Bio Birth to 307-243 07-807 07-808 08-101 09-101 11-101 12-101 13-101 14-101 14-208 14-209 14-218
RevenuesGeneral Property Tax - - - (33,466) 37,352 7,310,883 49,211 136,046 735,643 - - 122,367Other Taxes - - - 80,000 25 - - - - - - - State Aids 111,290 - - - 103,000 50,192 82,043 - 3,682 199,338 161,996 88,837 License & Fees - - - - - - - - - - - - Fines & Forfeitures - - - - 32,000 - - - - - - - Public Charge for Services - - - 240,000 175 273,850 - - 139,764 - - 54,250 Intergovernmental Revenue - - - - - 57,100 - - - - 4,373 - Miscellaneous Revenue - - - - 100,000 39,500 - - - - - - Other Financing Sources - - - 70,000 - 25,000 - - - - - - Total Income 111,290 - - 356,534 272,552 7,756,525 131,254 136,046 879,089 199,338 166,369 265,454
ExpendituresPersonnel - - - 276,238 209,060 6,377,667 100,045 - 818,777 - 135,398 163,104Operating - 000 - - - - - - - - - - 7,740 - Professional Services 98,640 - 38,000 81,946 16,752 686,464 24,549 - 34,541 133,050 3,009 95,028 Supplies & Expenses 10,900 15,000 - 8,350 43,460 428,156 6,060 - 24,571 66,136 19,602 5,395 Fixed Charges 1,750 - - - 2,880 3,460 600 - 900 152 620 1,927 Debt Service - - - - - - - - - - - - Other Grants Contributions - - - - 400 2,750 - 136,046 300 - - - Capital Outlay - - - - - 186,000 - - - - - - Transfers - - - 10,000 - 72,028 - - - - - - Total Expenditures 111,290 15,000 38,000 376,534 272,552 7,756,525 131,254 136,046 879,089 199,338 166,369 265,454Net Revenue and Expenditures - (15,000) (38,000) (20,000) - - - - - - -
FTE Snowmobile Lakes Imp Park Ded ROD Treas Law Enf Emg Mngt Reg Plan PH PH - WHEPP PH - Bio Birth to 307-243 07-807 07-808 08-101 09-101 11-101 12-101 13-101 14-101 14-208 14-209 14-218
Officials/Administration - - - 1.00 1.00 1.00 1.00 - 1.00 - - - First/Mid Level Officials & Mngrs - - - - - 4.00 - - 1.00 - - - Professionals - - - - - - - - 4.85 - 1.35 1.00 Technicians/Para-Professionals - - - - - 11.65 - - 0.20 - - - Administrative Support - - - 3.00 2.00 5.00 - - 3.00 - - 1.00 Skilled Craft/Service Maintenance - - - - - - - - - - - - Protective Service Workers - - - - - 55.44 - - - - - - Total - - - 4.00 3.00 77.09 1.00 - 10.05 - 1.35 2.00
51

Table 7
Summary of All Funds by Department
SUMMARY WIC Prenatal Tobacco Repro Health Immun Consolid Enviro Radon GAM HS Vets14-221 14-222 14-223 14-224 14-226 14-227 14-228 14-229 15-601 16-211 18-101
RevenuesGeneral Property Tax - - - - - - - - - 3,885,545 159,294Other Taxes - - - - - - - - - - - State Aids 213,494 - 150,554 45,537 - 108,311 - 9,135 - 4,159,942 14,000 License & Fees - - - - - - - - - - - Fines & Forfeitures - - - - - - - - - - - Public Charge for Services - 64,834 - 122,499 51,900 - 194,626 - 8,236,720 1,126,422 - Intergovernmental Revenue - - 8,012 - - - - - - - - Miscellaneous Revenue - - - - - - - - - - - Other Financing Sources - - - - - - - - - 40,000 - Total Income 213,494 64,834 158,566 168,036 51,900 108,311 194,626 9,135 8,236,720 9,211,909 173,294
ExpendituresPersonnel 185,018 62,906 149,353 136,930 18,613 81,636 150,614 5,519 6,054,977 5,121,530 136,361Operating - 000 - - - - - - - - 1,751,571 - - Professional Services 17,849 154 5,718 3,612 2,737 5,200 9,158 1,205 44,240 3,618,918 3,131 Supplies & Expenses 8,497 1,394 2,248 24,495 30,149 17,123 24,214 2,346 2,823 177,336 16,802 Fixed Charges 2,130 380 1,247 3,000 400 1,352 10,640 65 43,117 294,125 - Debt Service - - - - - - - - - - - Other Grants Contributions - - - - - 3,000 - - - - 17,000 Capital Outlay - - - - - - - - 200,000 - - Transfers - - - - - - - - 130,682 - - Total Expenditures 213,494 64,834 158,566 168,036 51,900 108,311 194,626 9,135 8,227,410 9,211,909 173,294Net Revenue and Expenditures - - - - - - - - 9,310 - -
FTE WIC Prenatal Tobacco Repro Health Immun Consolid Enviro Radon GAM HS Vets14-221 14-222 14-223 14-224 14-226 14-227 14-228 14-229 15-601 16-211 18-101
Officials/Administration - - - - - - - - 1.00 1.00 1.00 First/Mid Level Officials & Mngrs - - - - - - - - - 4.00 - Professionals 1.20 0.70 1.80 1.00 0.20 1.00 0.94 0.06 9.00 33.00 - Technicians/Para-Professionals 0.25 - - - - - - - 21.60 1.00 - Administrative Support 1.10 0.05 - 0.80 - - 1.00 - 4.20 25.00 1.00 Skilled Craft/Service Maintenance - - - - - - - - 74.05 2.00 - Protective Service Workers - - - - - - - - - - - Total 2.55 0.75 1.80 1.80 0.20 1.00 1.94 0.06 109.85 66.00 2.00
52

Table 7
Summary of All Funds by Department
SUMMARY Museum Extension LWRD Lime Land Info Housing WI Septic Fair Corp Counsel Forester Forester20-101 21-101 22-101 23-602 24-101 24-206 24-806 26-101 27-101 28-101 28-241
RevenuesGeneral Property Tax 38,133 266,447 352,325 - 380,646 - - 22,748 282,502 (73,845) - Other Taxes - - - - - - - - - - - State Aids - 6,753 248,534 - 25,000 - 10,000 - 520,170 52,302 8,227 License & Fees - 10 21,600 - 231,749 - - - - - - Fines & Forfeitures - - - - - - - - - - - Public Charge for Services - 6,050 41,300 664,100 125,000 - - - 3,710 151,032 - Intergovernmental Revenue - - 16,500 - 5,000 - - - - - Miscellaneous Revenue - - 2,500 - - 5,000 - - - - - Other Financing Sources - - - - 20,000 - - - - - Total Income 38,133 279,260 682,759 664,100 787,395 5,000 10,000 22,748 806,382 129,489 8,227
ExpendituresPersonnel - 96,994 553,791 277,309 731,144 - - - 718,871 98,205 - Operating - 000 - - - - - - - - - - Professional Services 22,533 154,163 53,268 125,103 29,331 2,500 - 11,748 33,718 4,126 - Supplies & Expenses - 28,103 60,600 80,524 26,600 - - - 25,093 27,159 8,227 Fixed Charges - - - 6,600 320 - - - 200 - - Debt Service - - - - - - - - - - - Other Grants Contributions - - 100 - - 2,500 10,000 11,000 - - - Capital Outlay 15,600 - 15,000 40,000 - - - - 28,500 - - Transfers - - - 100,000 - - - - - - - Total Expenditures 38,133 279,260 682,759 629,536 787,395 5,000 10,000 22,748 806,382 129,489 8,227 Net Revenue and Expenditures - - - 34,564 - - - - - - -
FTE Museum Extension LWRD Lime Land Info Housing WI Septic Fair Corp Counsel Forester Forester20-101 21-101 22-101 23-602 24-101 24-206 24-806 26-101 27-101 28-101 28-241
Officials/Administration - - 1.00 1.00 1.00 - - - 1.00 - - First/Mid Level Officials & Mngrs - - - - 1.00 - - - 2.00 - - Professionals - - 3.00 - 3.00 - - - - 1.00 - Technicians/Para-Professionals - - 2.00 - 3.00 - - - 5.00 - - Administrative Support - 1.80 1.00 - 1.00 - - - 1.00 - - Skilled Craft/Service Maintenance - - - 3.00 - - - - - - - Protective Service Workers - - - - - - - - - - - Total - 1.80 7.00 4.00 9.00 - - - 9.00 1.00 -
53

Table 7
Summary of All Funds by Department
SUMMARY Highway Admin Admin-Cont Admin-Asset Admin-Retire Admin - Debt Admin - Lidar Info Tech29-701 30-101 30-102 30-110 30-120 30-301 30-457 32-101
RevenuesGeneral Property Tax 3,144,868 (3,310,268) 150,000 161,416 - 3,287,152 81,939 627,537 Other Taxes - 666,120 - - - - - - State Aids 1,698,913 598,436 - - - - 50,000 - License & Fees - - - - - - - - Fines & Forfeitures - - - - - - - - Public Charge for Services - 4,000 - - - - - - Intergovernmental Revenue 2,421,676 - - - - - - 271,347 Miscellaneous Revenue 49,200 322,685 - - - - - - Other Financing Sources - 2,984,995 - 251,033 - 40,000 10,000 - Total Income 7,314,657 1,265,968 150,000 412,449 - 3,327,152 141,939 898,884
ExpendituresPersonnel 2,819,353 641,035 - - - - - 505,992 Operating - 000 10,000 - - - - - - - Professional Services 1,260,785 235,204 - - - - 365,842 Supplies & Expenses 2,330,709 14,250 - - - - - 27,050 Fixed Charges 708,590 360,600 - - - - - - Debt Service - - - - - 3,327,152 - - Other Grants Contributions - 4,000 - - - - - - Capital Outlay - - - 372,000 - - 141,939 - Transfers 176,370 10,000 - 161,416 - - - - Total Expenditures 7,305,807 1,265,089 - 533,416 - 3,327,152 141,939 898,884 Net Revenue and Expenditures 8,850 879 150,000 (120,967) - - - -
FTE Highway Admin Admin-Cont Admin-Asset Admin-Retire Admin-Debt Admin- Lidar Info Tech29-701 30-101 30-102 30-110 30-120 30-301 30-457 32-101
Officials/Administration 1.00 1.00 - - - - - 1.00 First/Mid Level Officials & Mngrs 3.00 1.00 - - - - - - Professionals - - - - - - - 1.00 Technicians/Para-Professionals 3.00 - - - - - - 3.00 Administrative Support 1.00 3.00 - - - - - - Skilled Craft/Service Maintenance 29.45 - - - - - - - Protective Service Workers - - - - - - - - Total 37.45 5.00 - - - - - 5.00
54

Table 7
Summary of All Funds by Department
SUMMARY Emp Relations ADRC Totals34-101 36-212
RevenuesGeneral Property Tax 383,737 110,785 21,468,018 Other Taxes - - 746,145 State Aids - 1,345,832 10,450,239 License & Fees - - 315,941 Fines & Forfeitures - - 219,050 Public Charge for Services 800 113,000 12,141,088 Intergovernmental Revenue - - 3,005,900 Miscellaneous Revenue - 600 519,485 Other Financing Sources 21,677 - 3,473,168 Total Income 406,214 1,570,217 52,339,034
ExpendituresPersonnel 368,972 808,238 30,276,642 Operating - 000 - - 1,769,311 Professional Services 29,267 62,026 8,454,570 Supplies & Expenses 7,975 238,850 4,196,605 Fixed Charges - 27,720 1,577,191 Debt Service - - 3,327,152 Other Grants Contributions - 421,007 760,603 Capital Outlay - - 1,203,989 Transfers - - 775,959 Total Expenditures 406,214 1,557,841 52,342,022 Net Revenue and Expenditures - 12,376 (2,988)
FTE Emp Relations ADRC Totals34-101 36-212
Officials/Administration 1.00 1.00 20.60 First/Mid Level Officials & Mngrs 1.00 1.00 19.00 Professionals - 4.89 70.10 Technicians/Para-Professionals - - 55.70 Administrative Support 2.00 3.00 77.40 Skilled Craft/Service Maintenance - 3.10 123.45 Protective Service Workers - - 55.44 Total 4.00 12.99 421.69
55

SUMMARIES BY FUND AND BY FUNCTION
2016 2015 2014 2013Actual Budget Budget Budget Budget
101 General
Actual
TABLE 8
2017 2018
Revenue
9,819,443 9,848,332 10,523,945 General Property Tax Minus Act 150/Bridge 10,297,399 10,742,548 10,978,036
802,149 767,862 746,145 Other Taxes Minus 203 sales tax 736,170 696,145 646,145
2,081,502 2,215,141 2,088,833 State Aids 2,090,044 2,120,190 2,120,533
271,537 297,241 292,091 License & Fees 300,842 292,091 292,091
166,804 147,811 139,050 Fine and Forfeitures 155,900 139,050 139,050
2,135,087 1,768,672 1,503,736 Public Charge for Services 1,539,684 1,512,936 1,512,936
299,629 302,979 404,447 Intergovernmental Revenue 383,493 404,953 404,953
627,754 746,788 464,685 Misc Revenue 487,485 470,985 475,985
2,481,525 2,640,342 3,132,135 Other Financing Sources 2,821,824 3,122,140 3,207,140
18,685,430 18,735,168 19,295,067 Total Income 18,812,841 19,501,039 19,776,869
Expense
5,798,371 5,903,151 6,837,627 General Government 6,487,044 6,838,171 6,973,972
7,416,905 7,503,416 7,815,751 Public Safety Minus Bridge 7,898,218 7,998,493 8,183,777
607,817 636,222 728,320 Public Works 651,601 684,795 697,304
2,273,746 1,574,477 1,644,876 Health & Human Services 1,573,221 1,688,033 1,730,926
464,017 409,098 475,185 Culture, Recreation, Entertainment Minus Act 150 453,831 463,556 472,556
1,732,213 1,661,339 1,730,402 Conservation & Development 1,685,925 1,755,964 1,796,751
342,828 552,206 82,028 Transfers Minus 203 sales tax 562,747 72,026 72,028
0 0 0 57xxx 0 0 0
18,635,897 18,239,910 19,314,188 Total Expense 19,312,587 19,501,039 19,927,314
(19,121) 495,258 49,532 Net Revenue and Expenditures (499,746) 0 (150,445)
56

SUMMARIES BY FUND AND BY FUNCTION
2016 2015 2014 2013Actual Budget Budget Budget Budget
211 Human Services
Actual
TABLE 8
2017 2018
Revenue
3,663,520 3,614,763 3,885,545 General Property Tax Minus Act 150/Bridge 3,611,103 3,975,556 4,113,691
2,675,827 3,183,487 4,159,942 State Aids 4,159,942 4,159,942 4,159,942
2,731,114 2,282,145 1,126,422 Public Charge for Services 1,126,422 1,126,422 1,126,422
0 0 0 Intergovernmental Revenue 0 0 0
0 0 0 Misc Revenue 0 0 0
39,410 440,679 40,000 Other Financing Sources 40,000 40,000 40,000
9,109,871 9,521,074 9,211,909 Total Income 8,937,467 9,301,920 9,440,055
Expense
9,060,672 9,473,074 9,211,909 Health & Human Services 8,889,467 9,231,920 9,370,055
49,199 48,000 0 Transfers Minus 203 sales tax 48,000 70,000 70,000
9,109,871 9,521,074 9,211,909 Total Expense 8,937,467 9,301,920 9,440,055
0 0 (1)Net Revenue and Expenditures 0 0 0
57

SUMMARIES BY FUND AND BY FUNCTION
2016 2015 2014 2013Actual Budget Budget Budget Budget
301 Debt Service
Actual
TABLE 8
2017 2018
Revenue
4,176,439 4,167,976 3,287,152 General Property Tax Minus Act 150/Bridge 3,861,651 3,160,000 3,160,000
0 0 0 Misc Revenue 0 0 0
40,000 40,000 40,000 Other Financing Sources 1,694,000 40,000 40,000
4,216,439 4,207,976 3,327,152 Total Income 5,555,651 3,200,000 3,200,000
Expense
4,215,600 4,206,502 3,327,152 Debt Service 5,555,651 2,258,255 2,337,575
4,215,600 4,206,502 3,327,152 Total Expense 5,555,651 2,258,255 2,337,575
0 1,474 839 Net Revenue and Expenditures 0 941,745 862,425
58

SUMMARIES BY FUND AND BY FUNCTION
2016 2015 2014 2013Actual Budget Budget Budget Budget
601 Golden Age manor
Actual
TABLE 8
2017 2018
Revenue
0 0 0 General Property Tax Minus Act 150/Bridge 0 0 0
7,715,391 7,996,110 8,236,720 Public Charge for Services 8,164,924 8,362,136 8,362,852
0 0 0 Misc Revenue 0 0 0
0 0 0 Other Financing Sources 0 0 0
7,715,391 7,996,110 8,236,720 Total Income 8,164,924 8,362,136 8,362,852
Expense
7,617,711 7,965,298 8,096,728 Health & Human Services 8,121,386 8,206,459 8,207,175
21,677 21,677 130,682 Transfers Minus 203 sales tax 21,677 155,677 155,677
7,639,388 7,986,975 8,227,410 Total Expense 8,143,063 8,362,136 8,362,852
9,310 9,136 76,003 Net Revenue and Expenditures 21,861 0 0
59

SUMMARIES BY FUND AND BY FUNCTION
2016 2015 2014 2013Actual Budget Budget Budget Budget
701 Highway
Actual
TABLE 8
2017 2018
Revenue
3,095,771 3,098,771 3,144,868 General Property Tax Minus Act 150/Bridge 3,086,675 3,273,676 3,403,120
1,412,229 1,627,319 1,698,913 State Aids 1,648,654 1,648,268 1,648,268
2,566,563 2,620,986 2,421,676 Intergovernmental Revenue 2,226,200 2,421,676 2,421,676
64,269 63,209 49,200 Misc Revenue 45,190 49,200 49,200
0 0 0 Other Financing Sources 0 0 0
7,138,831 7,410,286 7,314,657 Total Income 7,006,719 7,392,820 7,522,264
Expense
6,605,222 7,093,182 7,285,807 Public Works 6,949,345 7,363,970 7,493,414
0 0 20,000 Transfers Minus 203 sales tax 0 20,000 20,000
6,605,222 7,093,182 7,305,807 Total Expense 6,949,345 7,383,970 7,513,414
8,850 317,103 533,609 Net Revenue and Expenditures 57,374 8,850 8,850
60

SUMMARIES BY FUND AND BY FUNCTION
2016 2015 2014 2013Actual Budget Budget Budget Budget
All other Funds
Actual
TABLE 8
2017 2018
Revenue
234,381 234,162 626,507 General Property Tax Minus Act 150/Bridge 313,294 530,919 244,679
22,987 51,298 0 Other Taxes Minus 203 sales tax 0 0 0
2,663,777 2,394,343 2,502,551 State Aids 2,251,956 2,436,704 2,481,531
19,405 18,591 23,850 License & Fees 24,000 23,894 22,394
82,349 70,270 80,000 Fine and Forfeitures 80,000 80,000 80,000
1,177,358 1,197,929 1,274,210 Public Charge for Services 1,254,037 1,287,089 1,300,693
7,170 213,290 179,778 Intergovernmental Revenue 178,139 181,559 182,929
121,518 23,498 5,600 Misc Revenue 5,750 5,638 5,676
553,828 238,828 261,033 Other Financing Sources 676,895 347,626 315,428
4,882,773 4,442,208 4,953,528 Total Income 4,784,071 4,893,429 4,633,330
Expense
644,718 160,493 548,393 General Government 372,302 753,662 324,955
223,099 168,007 174,331 Public Safety Minus Bridge 176,556 178,067 180,258
2,948,031 2,769,693 3,007,423 Health & Human Services 2,777,090 3,021,594 3,080,436
176,824 212,287 149,290 Culture, Recreation, Entertainment Minus Act 150 141,150 150,933 152,601
511,232 588,359 709,702 Conservation & Development 745,370 578,463 589,390
22,987 51,298 0 Debt Service 0 0 0
317,444 208,301 366,416 Transfers Minus 203 sales tax 1,318,000 187,200 155,000
4,844,335 4,158,438 4,955,555 Total Expense 5,530,468 4,869,919 4,482,640
(2,027) 283,770 38,437 Net Revenue and Expenditures (746,397) 23,510 150,690
61

Table 9
2016 CAPITAL BUDGETADMINISTRATION
LED PARKING LIGHTING/WALL PACKS 22,000 Efficient lighting and energy conservation
BEHAVIORIAL HEALTH SOFTWARE 250,000 Software for efficient patient treatment
CLINIC RESTRUCTURING 75,000 Restructure for effectiveness
HIGHWAY BUILDINGS STUDY 25,000 Updating the 2008 study
TOTAL ADMINISTRATION 372,000
BLDG, PARKS, RECYCLING
MUSEUM ROOF 15,000 Building repairs
RECYCLING TRUCK 80,000 Equipment replacement
PARKING LOT IMPROVEMENTS 35,000 Pavement improvement
ROOF AT SCHOOL GYM 17,000 Building repairs
UPDATE IDENTIPASS 42,000 Update identifications
NEW RESTROOMS PARKS 25,000 Upgrade existing facility
TOTAL BLDG, PARKS, RECYCLING 214,000
CORPORATION COUNSEL
SOFTWARE 28,500 Electronic case management software
TOTAL CORPORATION COUNSEL 28,500
GOLDEN AGE MANOR
FACILITY IMPROVEMENTS 200,000 Room upgrades
TOTAL GOLDEN AGE MANOR 200,000
LAND AND WATER
SURVEY EQUIPMENT 15,000 Equipment replacement
TOTAL LAND AND WATER 15,000
LAW ENFORCEMENT
VEHICLES OUTLAY 186,000 Regular replacement of squad cars
TOTAL LAW ENFORCEMENT VEHICLES 186,000
LIDAR PROJECT
DIGITAL DATA 141,939 Digitalization of property
TOTAL LIDAR PROJECT 141,939
LIME
IMPACT HAMMER 40,000 Equipment replacement
TOTAL LIME 40,000
GENERAL FUND TOTAL 1,197,439
Note: Excludes Highway Construction projects: see following table.Discrepency in total is due to small (<$5,000) projects.
62

Effectof2016CapitalExpenditureson2016andFutureOperatingBudgets
Polk County has budgeted $1,197,439 for capital projects over $25,000 in 2015 (previous page) outside of Highway. None of these expenditures will result in any increase in operating expenditures in 2016; it is anticipated, however, that several will result in expenditure savings in 2016 and thereafter, and these savings have been incorporated in these budgets. Those capital investments and estimated savings are:
Estimated Savings Amount
Department and Investment Capital
Investment General Fund
Highway Fund
Human Services Fund Savings source
Buildings Vehicle 80,000 375 Fuel efficiency savings Lighting projects 57,000 11,400 Utility savings
Highway Department Highway Vehicles 504,000 2,200 Fuel efficiency savings
Human Services Behavioral Health Software 250,000 25,000 Improved scheduling and increased billing
Land Information LiDAR 141,939 5,000 Increased revenue from fees
Law Enforcement Squad cars 186,000 1,000 Fuel efficiency savings TOTAL 17,775 2,200 25,000
There are likely other savings from the LiDAR (topographical mapping) program in reduced future survey costs, efficiency in runoff mitigation, and so forth. These are impossible to calculate at this point, but will be incorporated in future budgets.
Note that there are no savings listed from reduced maintenance and repair costs. The County budgets a fixed amount each year for these expenses, with the understanding that vehicles, etc., will be replaced on a regular schedule. As the Capital Improvement Plan itself notes (pages 256‐274) delay in replacement would result in an increased expense.
63

2016BudgetsbyDepartment
64

2014 Actual 2015 Budget 2016 Budget2017 Forward
Estimate 2018 Forward EstimateRevenueGeneral Property Tax 1,637,579 1,507,183 1,041,628 147,103 (318,440)Other Taxes 3,504,602 3,266,120 3,566,120 3,591,120 3,616,120 State Aids 601,596 647,283 648,436 597,556 597,556 Public Charge for Services 4,369 4,000 4,000 4,000 4,000 Misc Revenue 330,025 350,035 322,685 328,985 333,985 Other Financing Sources 2,858,493 5,665,621 3,286,028 3,432,626 3,485,428 Total Revenue 8,936,664 11,440,242 8,868,897 8,101,390 7,718,649
ExpensePersonnel Services 584,568 784,675 641,035 633,907 647,073 Contractual Services 139,406 228,844 235,204 238,732 242,313 Supplies & Expenses 8,826 13,315 14,250 14,464 14,681 Fixed Charges 164,362 291,600 360,600 385,600 385,600 Debt Service 4,206,502 5,551,651 3,327,152 3,200,000 3,200,000 Grants, Contributions, Indem 600,207 657,826 675,389 4,000 4,000 Capital Outlay 14,898 386,000 513,939 580,000 150,000 Cost Reallocation 2,990,378 5,270,581 3,071,416 2,985,000 3,060,000 Total Expenditures 8,709,147 13,184,492 8,838,985 8,041,703 7,703,666 Net Revenue and Expenditures 227,517 (1,744,250) 29,912 59,687 14,983
Strategic Priorities:To significantly improve the efficiency and effectiveness of programs administered by Polk CountyTo restructure the County's long term debt obligations in a sustainable and transparent manner in preparation for future capital investmentTo provide the County Board greater opportunity for policymaking throught the budget process
DEPARTMENT OF ADMINISTRATION Maggie Wickre, Finance DirectorSECTION 1: DEPARTMENT SUMMARY
Department Description and Mission:The Department of Administration provides financial, operational, and policy support to all county agencies under the direction of the Board of SupervisorsLink to County Board Strategic Goals:To serve and represent the public with integrity
DEPARTMENT REVENUE AND EXPENDITURES BY ECONOMIC CLASSIFICATION
65

2014 Actual 2015 Budget 2016 Budget 2017 Budget 2018 BudgetFTE EmployeesOfficials/Administrators 1 1 1 1 1Professionals 2 2 1 1 1Administrative Support 1.6 1.6 3 3 3First/Mid Level Officials and ManagersTotal 4.6 4.6 5 5 5
Program 2014 Actual 2015 Budget 2016 Budget2017 Forward
Estimate 2018 Forward EstimatePublic Financial Management 494,844 809,600 442,781 450,346 456,283 Recruitment, selection, and supervision of department heads
141,384 231,314 126,509 128,670 130,367
Preparation of materials for Board review and action 212,076 346,972 189,763 193,005 195,550 Policy implementation and oversight 282,768 462,629 253,018 257,341 260,733 Risk Management & Insurance Coverage 282,768 462,629 253,018 257,341 260,733 Contingency 14,000 ‐ ‐ ‐ ‐ Act 150 559,908 653,826 671,389 ‐ ‐ Asset Fund 14,898 862,581 533,416 580,000 150,000 Retirement Fund ‐ 109,290 ‐ ‐ ‐ Sales Tax 2,500,000 3,550,000 2,900,000 2,975,000 3,050,000 Debt Service 4,206,502 5,555,651 3,327,152 3,200,000 3,200,000 Lidar ‐ 140,000 141,939 ‐ ‐ Total 8,709,147 13,184,492 8,838,985 8,041,703 7,703,666
EMPLOYMENT BY JOB CLASSIFICATION
PROGRAM SUMMARYPROGRAM EXPENDITURES
66
Department of Administration

Program name:Program number:
Program objective:
2014 Actual 2015 Budget 2016 Budget2017 Forward
Estimate 2018 Forward EstimateRevenueGeneral Property Tax (1,081,607) (1,080,903) (1,158,594) (1,156,735) (1,217,454)Other Revenues 1,461,696 1,719,907 1,601,683 1,607,081 1,621,081 Total Revenue 380,090 639,004 443,089 450,346 403,627
Recurrent Expenditure 494,844 809,600 442,781 450,346 456,283 Capital/One‐time ExpenditureTotal Expenditure 494,844 809,600 442,781 450,346 456,283 Net Revenue and Expenditures (114,754) (170,597) 308 ‐ (52,656)
Maintain financial discipline and transparency and allocate funds as effectively as possible following priorities set by the County Board
PROGRAM REVENUES AND EXPENDITURES
PROGRAM PERFORMANCE INFORMATIONKEY PROGRAM STRATEGIES FOR 2015 ACTUAL RESULTS FOR 2015
Audits continue to be recognized by national organization Recipient of GFOA award
Annual Operating and Capital Budget for Calendar Year 2015 publication recognized
Further improvements in multi‐year estimates for 2017‐2018 budgets.
Program 30‐01 continued onto next page
Recipient of GFOA awardUnassigned fund balance as percentage of general fund expenditures increased
SECTION 2: PROGRAM SUMMARY
30‐01Public Financial Management
Increased to 36.5%Citizen's Guide to the Budget recognized by national organization Received AGA award
KEY PROGRAM STRATEGIES 2016Continued improvement in the budget document with gradual shift of responsibility to Administration staff for purposes of sustainability.
Continue to move away from paper processes and to paperless in Polk County Departments.
67
Department of Administration

Output indicators 2014 Actual 2015 Planned 2016 Planned 2017 Estimate 2018 EstimateComprehensive Annual Financial Report Published Due June 30, 2016 Due June 30, 2017 Due June 30, 2016 Due June 30, 2016Annual Operating and Capital Budget for Calendar Year 2015
Published Due February, 2016 Due February, 2017 Due February, 2016 Due February, 2016
Citizen Guide to the Budget 2015 Published Due February, 2016 Due February, 2016 Due February, 2016 Due February, 2016
Outcome indicators 2014 Actual 2015 Planned 2016 Planned 2017 Estimate 2018 EstimateUnassigned General Fund Balance 36.51% 37% 38% 33% 33%Number of national awards for financial management excellence
3 3 3 3 3
KEY PERFORMANCE INDICATORS
Assumptions and factors affecting program performance:Presumes some share of fund balance will be used for capital projects
Continuation of program 30‐01 Public Financial Management
68
Department of Administration

Program name:Program number:Program objective:
2014 Actual 2015 Budget 2016 Budget2017 Forward
Estimate 2018 Forward EstimateRevenueGeneral Property Tax (309,031) (308,829) (331,027) (330,496) (347,844)Other Revenues 417,628 491,402 457,624 459,166 463,166 Total Revenue 108,597 182,573 126,597 128,670 115,322
Recurrent Expenditure 141,384 231,314 126,509 128,670 130,367 Capital/One‐time ExpenditureTotal Expenditure 141,384 231,314 126,509 128,670 130,367 Net Revenue and Expenditures (32,787) (48,742) 88 ‐ (15,045)
30‐02Recruitment, selection, and supervision of department heads
To maintain the high standards of professionalism and competence of senior staff as well as to help staff improve
PROGRAM PERFORMANCE INFORMATIONKEY PROGRAM STRATEGIES FOR 2015 ACTUAL RESULTS FOR 2015
Develop a process to fill key positions expeditiouslyImprove employee appreciation system
KEY PROGRAM STRATEGIES 2016A plan for career paths for existing Polk County Employees.Full implementation of the evaluation system with links to County Board goals.Ongoing training program including leadership, development, conflict resolution, coaching and mentoring, and others as developed.
PROGRAM REVENUES AND EXPENDITURES
Review staffing needs as part of citizen‐centered government reform.
Formal Training program for managers and department headsImplement a new evaluation system concentrating on improved performance.
Maintain a stable workforce without the disruptive and costly turnover experienced by many other local governments.Program 30‐02 continued on next page
Process developed and in operationRetiree appreciation certificates; Annual picnic, other Leadership workgroup developed four training sessionsDesigned and implemented by Employee Relations
69
Department of Administration

Output indicators 2014 Actual 2015 Planned 2016 Planned 2017 Estimate 2018 EstimateNumber of management training sessions 3 4 4 4 4
Other management training opportunities 0 2 3 4 4
Outcome indicators 2014 Actual 2015 Planned 2016 Planned 2017 Estimate 2018 EstimateTurnover rate (excluding retirements)Department head recruitments requiring reopening within the first two years
0 0 0 0 0
KEY PERFORMANCE INDICATORS
Assumptions and factors affecting program performance:
Continuation of program 30‐02 Recruitment, selection and supervision of department heads
70
Department of Administration

Program name:Program number:Program objective:
2014 Actual 2015 Budget 2016 Budget2017 Forward
Estimate 2018 Forward EstimateRevenueGeneral Property Tax (463546) (463244) (496540) (495744) (521766)Other Revenues 626,441 737,103 686,435 688,749 694,749 Total Revenue 162,896 273,859 189,895 193,005 172,983
Recurrent Expenditure 212,076 346,972 189,763 193,005 195,550 Capital/One‐time ExpenditureTotal Expenditure 212,076 346,972 189,763 193,005 195,550 Net Revenue and Expenditures (49,180) (73,113) 132 ‐ (22,567)
Output indicators 2014 Actual 2015 Planned 2016 Planned 2017 Estimate 2018 EstimateNumber of resolutions reviewed 49 49 50 50 50Number of appointments of public members to committees or commissions made
10 11 11 11 11
Outcome indicators 2014 Actual 2015 Planned 2016 Planned 2017 Estimate 2018 EstimateAppointments requiring readvertising 4 4 3 3 3Error corrections to resolutions needed 0 0 0 0 0
KEY PROGRAM STRATEGIES 2016
Ensure adequate time for consideration of the annual budget and information
Increased planning and permanency by improved strategic planning and consideration for customer service, organizational structure, and potential plan for service consolidation and initial implementation.Improve the quality of departmental monthly reports and incorporate performance data. Continued work with the committees to improve their role in policymaking and budgetary analysis
Develop comprehensive Annual Report on the Condition of Polk County and County Streamline and make available quarterly financial reportsA three year budget has been presented to the County Board in November, 2015. The 2016 budget was adopted accompanied by budgets for 2017 and 2018 budgets for each department which allows forecasting for future operating and capital expenditures.
KEY PERFORMANCE INDICATORS
Assumptions and factors affecting program performance:
PROGRAM REVENUES AND EXPENDITURES
30‐03Preparation of materials for Board review and action
The Board receives adequate information to support its decision making in a timely and orderly manner
PROGRAM PERFORMANCE INFORMATIONKEY PROGRAM STRATEGIES FOR 2015
Budget is approved at the November County Board MeetingFirst such report presented to the County Board in August, 20152015 reports available to County Board Members and public
71
Department of Administration

Program name:Program number:Program objective:
2014 Actual 2015 Budget 2016 Budget2017 Forward
Estimate 2018 Forward EstimateRevenueGeneral Property Tax (618061) (617659) (662054) (660992) (695688)Other Revenues 835,255 982,804 915,247 918,332 926,332 Total Revenue 217,194 365,145 253,194 257,341 230,644
Recurrent Expenditure 282,768 462,629 253,018 257,341 260,733 Capital/One‐time ExpenditureTotal Expenditure 282,768 462,629 253,018 257,341 260,733 Net Revenue and Expenditures (65,574) (97,484) 176 ‐ (30,089)
Output indicators 2014 Actual 2015 Planned 2016 Planned 2017 Estimate 2018 EstimateChapters of administrative code prepared 1 2 2 2 2
Number of obsolete policies or resolutions repealed
0 0 110 20 20
Outcome indicators 2014 Actual 2015 Planned 2016 Planned 2017 Estimate 2018 EstimateChapters of administrative code adopted 0 0 2 2 2
Number of policies serving as a model for other counties
2 2 3 3 3
Develop additional opportunities for interdepartmental resource sharing. Development of the first property inventory in County history to enable better management of County‐owned real estate.
30‐04All Board policies, state and federal laws enforced
PROGRAM REVENUES AND EXPENDITURES
PROGRAM PERFORMANCE INFORMATIONKEY PROGRAM STRATEGIES FOR 2015 ACTUAL RESULTS FOR 2015
Number of policies rewritten and adopted; 2015 is progress towards acomprehensive administrative code
Administrative Financial Code will be presented to the County Board for preliminary consideration in January, 2016.Develop a grant management database to review and oversee implementation of our Federal, State, and local grants. Financial, personnel and general section of the complete General Code for Polk County will be developed in 2016.
KEY PROGRAM STRATEGIES 2016
KEY PERFORMANCE INDICATORS
Assumptions and factors affecting program performance:
Policy implementation and oversight
First comprehensive draft of the financial policies will be presented to the County Board in 2016 for their review.
72
Department of Administration
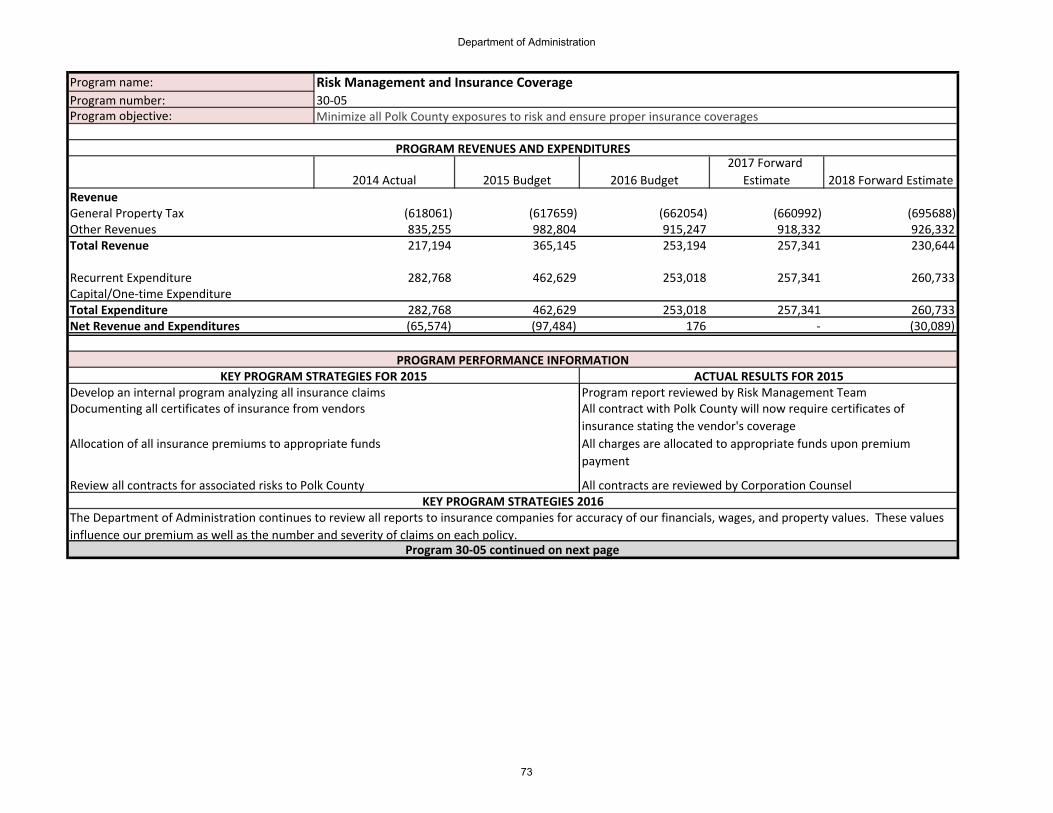
Program name:Program number:Program objective:
2014 Actual 2015 Budget 2016 Budget2017 Forward
Estimate 2018 Forward EstimateRevenueGeneral Property Tax (618061) (617659) (662054) (660992) (695688)Other Revenues 835,255 982,804 915,247 918,332 926,332 Total Revenue 217,194 365,145 253,194 257,341 230,644
Recurrent Expenditure 282,768 462,629 253,018 257,341 260,733 Capital/One‐time ExpenditureTotal Expenditure 282,768 462,629 253,018 257,341 260,733 Net Revenue and Expenditures (65,574) (97,484) 176 ‐ (30,089)
Develop an internal program analyzing all insurance claims Documenting all certificates of insurance from vendors
30‐05Risk Management and Insurance Coverage
Minimize all Polk County exposures to risk and ensure proper insurance coverages
PROGRAM REVENUES AND EXPENDITURES
PROGRAM PERFORMANCE INFORMATIONKEY PROGRAM STRATEGIES FOR 2015 ACTUAL RESULTS FOR 2015
Allocation of all insurance premiums to appropriate funds
Review all contracts for associated risks to Polk CountyKEY PROGRAM STRATEGIES 2016
The Department of Administration continues to review all reports to insurance companies for accuracy of our financials, wages, and property values. These values influence our premium as well as the number and severity of claims on each policy.
Program 30‐05 continued on next page
Program report reviewed by Risk Management TeamAll contract with Polk County will now require certificates of insurance stating the vendor's coverage All charges are allocated to appropriate funds upon premium payment
All contracts are reviewed by Corporation Counsel
73
Department of Administration

Output indicators 2014 Actual 2015 Planned 2016 Planned 2017 Estimate 2018 EstimateLiability Insurance Premium 291,298 270,526 267,498 Liability Dividend (15,819) (15,761) due Dec, 2016 due Dec, 2017 due Dec, 2018Property Insurance Premium 93,950 96,404 due 4/1/2016 due 4/1/2017 due 4/1/2018Worker's Compensation Premium 420,106 473,287 due 4/1/2016 due 4/1/2017 due 4/1/2018Worker's Compensation Dividend (12,756) (17,364) due June, 2016 due June, 2017 due June, 2018Outcome indicators 2014 Actual 2015 Planned 2016 Planned 2017 Estimate 2018 EstimateWorker's Compensation MOD Rate 0.87 0.76 0.65 0.69 0.69
Assumptions and factors affecting program performance:In 2016 the property insurance company ‐ Local Government Insurance Property Fund is expected to double our rates. In 2017 this insurancecompany will dissolve. This means that in 2016 we will have to go out for bids on a new property insurance company. We have been told that to expect ourthat our property valuations will increase with any new company selected for property insurance coverage which means that our rates for property insurance in the near future can go up 48%.
Contiuation of program 30‐05 Risk Management and Insurance CoverageKEY PERFORMANCE INDICATORS
74
Department of Administration

Program name:Program number:Program objective:
2014 Actual 2015 Budget 2016 Budget2017 Forward
Estimate 2018 Forward EstimateRevenueGeneral Property Tax 0 0 150,000 0 0Other RevenuesTotal Revenue ‐ ‐ 150,000 ‐ ‐
Recurrent Expenditure 14,000 ‐ ‐ ‐ ‐ Capital/One‐time ExpenditureTotal Expenditure 14,000 ‐ ‐ ‐ ‐ Net Revenue and Expenditures (14,000) ‐ 150,000 ‐ ‐
Contingency30‐06Accounting for contingency (emergency) fund
PROGRAM REVENUES AND EXPENDITURES
75
Department of Administration

Program name:Program number:Program objective:
2014 Actual 2015 Budget 2016 Budget2017 Forward
Estimate 2018 Forward EstimateRevenueGeneral Property Tax 559,908 653,826 671,389 n/a n/aOther RevenuesTotal Revenue 559,908 653,826 671,389 ‐ ‐
Recurrent Expenditure 559,908 653,826 671,389 n/a n/aCapital/One‐time ExpenditureTotal Expenditure 559,908 653,826 671,389 ‐ ‐ Net Revenue and Expenditures (0) ‐ ‐ ‐ ‐
Act 15030‐07Accounting for pass‐through funding for libraries
PROGRAM REVENUES AND EXPENDITURES
76
Department of Administration

Program name:Program number:Program objective:
2014 Actual 2015 Budget 2016 Budget2017 Forward
Estimate 2018 Forward EstimateRevenueGeneral Property Tax ‐ ‐ 161,416 292,061 ‐ Other Revenues 173,828 665,040 251,033 347,626 315,428 Total Revenue 173,828 665,040 412,449 639,687 315,428
Recurrent Expenditure 14,898 862,581 533,416 580,000 150,000 Capital/One‐time ExpenditureTotal Expenditure 14,898 862,581 533,416 580,000 150,000 Net Revenue and Expenditures 158,930 (197,541) (120,967) 59,687 165,428
Asset Fund
Accounting for internal loan fund
PROGRAM REVENUES AND EXPENDITURES
30‐08
77
Department of Administration

Program name:Program number:Program objective:
2014 Actual 2015 Budget 2016 Budget2017 Forward
Estimate 2018 Forward EstimateRevenueGeneral Property TaxOther Revenues 65,000 ‐ ‐ ‐ ‐ Total Revenue 65,000 ‐ ‐ ‐ ‐
Recurrent Expenditure 109,290 ‐ ‐ ‐ Capital/One‐time ExpenditureTotal Expenditure ‐ 109,290 ‐ ‐ ‐ Net Revenue and Expenditures 65,000 (109,290) ‐ ‐ ‐
Retirement Fund30‐09Accounting for sick leave payouts
PROGRAM REVENUES AND EXPENDITURES
78
Department of Administration

Program name:Program number:Program objective:
2014 Actual 2015 Budget 2016 Budget2017 Forward
Estimate 2018 Forward EstimateRevenueGeneral Property TaxOther Revenues 2,843,982 2,600,000 2,900,000 2,975,000 3,050,000 Total Revenue 2,843,982 2,600,000 2,900,000 2,975,000 3,050,000
Recurrent Expenditure 2,500,000 3,550,000 2,900,000 2,975,000 3,050,000 Capital/One‐time ExpenditureTotal Expenditure 2,500,000 3,550,000 2,900,000 2,975,000 3,050,000 Net Revenue and Expenditures 343,982 (950,000) ‐ ‐ ‐
PROGRAM REVENUES AND EXPENDITURES
Sales Tax30‐10Accounting for sales tax receipts
79
Department of Administration
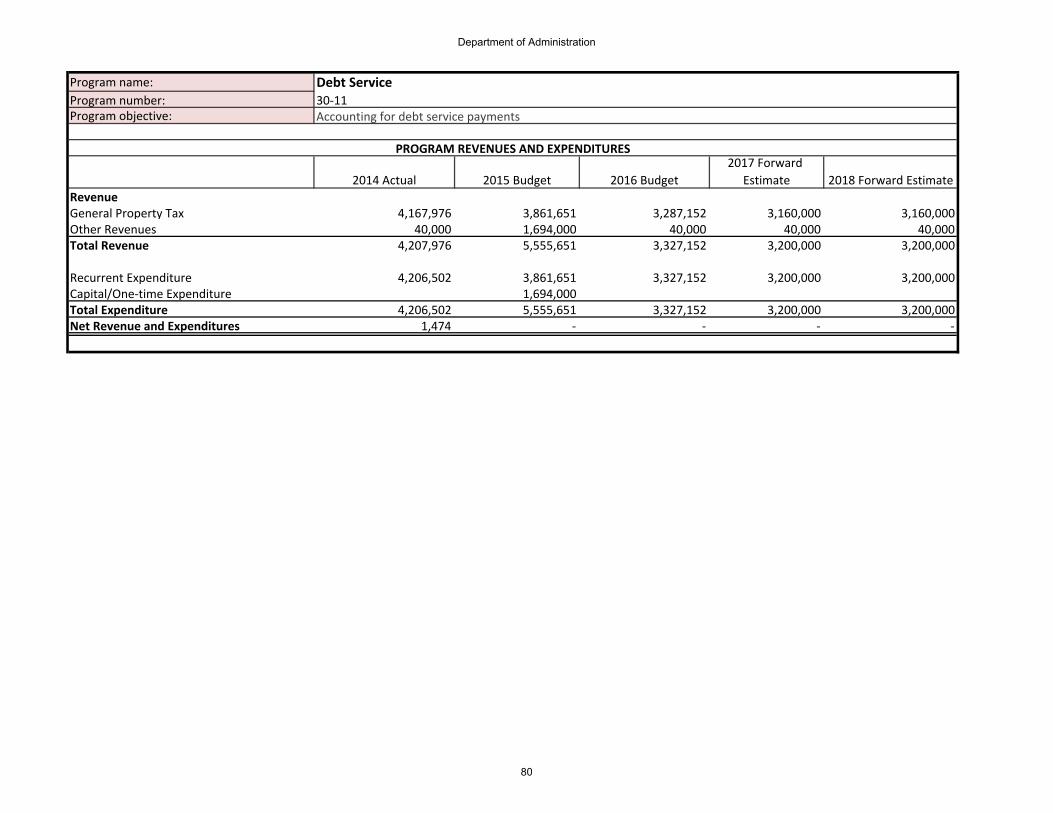
Program name:Program number:Program objective:
2014 Actual 2015 Budget 2016 Budget2017 Forward
Estimate 2018 Forward EstimateRevenueGeneral Property Tax 4,167,976 3,861,651 3,287,152 3,160,000 3,160,000 Other Revenues 40,000 1,694,000 40,000 40,000 40,000 Total Revenue 4,207,976 5,555,651 3,327,152 3,200,000 3,200,000
Recurrent Expenditure 4,206,502 3,861,651 3,327,152 3,200,000 3,200,000 Capital/One‐time Expenditure 1,694,000 Total Expenditure 4,206,502 5,555,651 3,327,152 3,200,000 3,200,000 Net Revenue and Expenditures 1,474 ‐ ‐ ‐ ‐
Debt Service30‐11Accounting for debt service payments
PROGRAM REVENUES AND EXPENDITURES
80
Department of Administration

Program name:Program number:Program objective:
2014 Actual 2015 Budget 2016 Budget2017 Forward
Estimate 2018 Forward EstimateRevenueGeneral Property Tax 0 80,000 81,939 0 0Other Revenues 60,000 60,000 Total Revenue ‐ 140,000 141,939 ‐ ‐
Recurrent Expenditure ‐ 140,000 141,939 ‐ ‐ Capital/One‐time ExpenditureTotal Expenditure ‐ 140,000 141,939 ‐ ‐ Net Revenue and Expenditures ‐ ‐ ‐ ‐ ‐
Lidar30‐12Project account for LiDAR topographical mapping program
PROGRAM REVENUES AND EXPENDITURES
81
Department of Administration

2014 Actual 2015 Budget 2016 Budget2017 Forward
Estimate2018 Forward
EstimateRevenueGeneral Property Tax 111,653 110,785 110,785 110,785 110,785 State Aids 1,371,806 1,297,247 1,345,832 1,361,219 1,385,706 Public Charge for Services 124,995 113,000 113,000 114,338 116,468 Misc Revenue 268 750 600 600 600 Total Revenue 1,608,722 1,521,782 1,570,217 1,586,942 1,613,559
ExpensePersonnel Services 709,680 815,249 808,238 832,826 854,862 Contractual Services 46,277 57,029 62,026 62,956 63,901 Supplies & Expenses 239,853 220,499 238,850 242,433 246,070 Fixed Charges 32,978 34,540 27,720 27,720 27,720 Grants, Contributions, Indem 522,623 394,465 421,007 421,007 421,007 Total Expenditures 1,551,411 1,521,782 1,557,841 1,586,942 1,613,559 Net Revenue and Expenditure 57,311 ‐ 12,376 0 (0)
To improve the quality of life for all who live in Polk County and to serve and represent the public with integrity.
Strategic Priorities:To serve the community by meeting their needs of information and assistance (related to aging, disabilities and caregiving) as efficiently as possible with great customer service.
ADRC: AGING AND DISABILITY RESOURCE CENTER Laura Neve, DirectorSECTION 1: DEPARTMENT SUMMARY
Department Description and Mission:The ADRC provides information to and oversees the provision of services to seniors, those with disabilities and their families, including nutrition and transportation programs for the elderly.
The mission of the Aging and Disability Resource Center is to empower and support seniors, people with disabilities and their families by providing useful information and finding the help people seek. The ADRC is a central source of information, assistance and access to community resources.The vision of the aging programs within the ADRC is to provide advocacy, information and services that help older people remain independent in their homes and active in their communities.
Link to County Board Strategic Goals:
DEPARTMENT REVENUE AND EXPENDITURES BY ECONOMIC CLASSIFICATION
82

2014 Actual 2015 Budget 2016 Budget 2017 Budget 2018 BudgetFTE EmployeesOfficials/Administrators 1 1 1 1 1Professionals 6 4.91 5.89 5.89 5.89Technicians/Para‐Professionals 1Administrative Support 3 3 3 3 3Skilled Craft/Service Maintenance 2.8 3.1 3.1 3.1 3.1Total 12.8 13.01 12.99 12.99 12.99
2014 Actual 2015 Budget 2016 Budget2017 Forward
Estimate2018 Forward
EstimateADRC Programs Information & Assistance 636,079 623,931 638,715 650,646 661,559
Disability Benefit Specialist 232,712 228,267 233,676 238,041 242,034 Elder Benefit Specialist 108,599 106,525 109,049 111,086 112,949 Community Education 15,514 15,218 15,578 15,869 16,136 Caregivers Support 15,514 15,218 15,578 15,869 16,136 Nutrition Program 387,853 380,446 389,460 396,735 403,390 Transportation Services 155,141 152,178 155,784 158,694 161,356 Total 1,551,411 1,521,782 1,557,841 1,586,942 1,613,559
EMPLOYMENT BY JOB CLASSIFICATION
PROGRAM SUMMARYPROGRAM EXPENDITURES
83
Aging and Disability Resource Center

Program name:Program number:
Program objective:
2014 Actual 2015 Budget 2016 Budget Estimate EstimateRevenueGeneral Property Tax 45,778 45,422 45,422 45,422 45,422 Other Revenues 659,576 623,931 643,789 650,646 661,559 Total Revenue 659,576 623,931 643,789 650,646 661,559
Recurrent Expenditure 636,079 623,931 638,715 650,646 661,559 Capital/One‐time Expenditure ‐ ‐ ‐ ‐ ‐ Total Expenditure 636,079 623,931 638,715 650,646 661,559 Net Revenue and Expenditures 23,497 ‐ 5,074 0 (0)
Output indicators 2014 Actual 2015 Planned 2016 Planned 2017 Estimate 2018 EstimateNumber of unduplicated callers per month 77 56 60 60 60
Outcome indicators 2014 Actual 2015 Planned 2016 Planned 2017 Estimate 2018 EstimateIndividuals understand the options available to them to meet their needs.
100% 100% 100% 100% 100%
36‐01ADRC Programs Information & Assistance
Serve as single entry point for un‐biased community resource information. Also to assist with enrollment into publicly funded long term care programs.
PROGRAM REVENUES AND EXPENDITURES
SECTION 2: PROGRAM DATA
KEY PERFORMANCE INDICATORS
Assumptions and factors affecting program performance:In 2015 there have been changes in the states guidelines in reporting calls. We continue to work with the staff in reporting consistency.
KEY PROGRAM STRATEGIES 2016Utilize the higher level support staff position (instead of the professional level) to assist with some consumer contact such as collectingdata, follow up calling and reporting.
PROGRAM PERFORMANCE INFORMATIONKEY PROGRAM STRATEGIES FOR 2015
Listen to customers, evaluate their needs, provide information on public/private resources and assistance as needed to making the necessary connections.Follow up and advocacy are provided where needed to make the outcomes successful.
The Office of Resource Center Development (State office)surveys customers served for satisfaction and utility of the information provided. The results for 2015 have not been released as of yet however, no complaints have been received.
We receive MA pull down funds based on the spending in the program and which activities. We have not received our maximum state allocation ofADRC funds.
84
Aging and Disability Resource Center

Program name:Program number:
Program objective:
2014 Actual 2015 Budget 2016 Budget2017 Forward
Estimate2018 Forward
EstimateRevenueGeneral Property Tax 16,748 16,618 16,618 16,618 16,618 Other Revenues 241,308 228,267 235,533 238,041 242,034 Total Revenue 241,308 228,267 235,533 238,041 242,034
Recurrent Expenditure 232,712 228,267 233,676 238,041 242,034 Capital/One‐time ExpenditureTotal Expenditure 232,712 228,267 233,676 238,041 242,034 Net Revenue and Expenditures 8,597 ‐ 1,856 0 (0)
Output indicators 2014 Actual 2015 Planned 2016 Planned 2017 Estimate 2018 EstimateNumber of Customers served 376 400 425 425 425Outcome indicators 2014 Actual 2015 Planned 2016 Planned 2017 Estimate 2018 EstimateMonetary impact 1,155,025 1,500,000 1,700,000 1,700,000 1,700,000(determined value of benefits obtainedthrough involvement of Benefit Spec.)
with disabilities transitioning to adulthood.
The funding includes the entire service area (Polk & Burnett Co.) we currently have 1.6 positions serving the program's clientele.
rights grievance and appeal process help guide through
Evaluate the service area of this position along with the Burnett Co. position due to the increase in work load. Potentially may need to increase the amount of hours for this position (currently at .6).
KEY PROGRAM STRATEGIES 2016
PROGRAM PERFORMANCE INFORMATIONKEY PROGRAM STRATEGIES FOR 2015
Accurate and current info on private and public benefitsassistance on how to access such benefits
36‐02Disability Benefit Specialist
To advocate for and assist the disabled adults ( 17 1/2 ‐ 59 y.o.) of Polk Co. through benefit assessments, applications and appeal processes.
PROGRAM REVENUES AND EXPENDITURES
KEY PERFORMANCE INDICATORS
Assumptions and factors affecting program performance:
We receive MA pull down funds based on the spending in the program and which activities. We have not maxed out our state allocation ofADRC funds.
The amount of consumers we assist continue to grow.Developed an outreach program to the schools for kids
85
Aging and Disability Resource Center
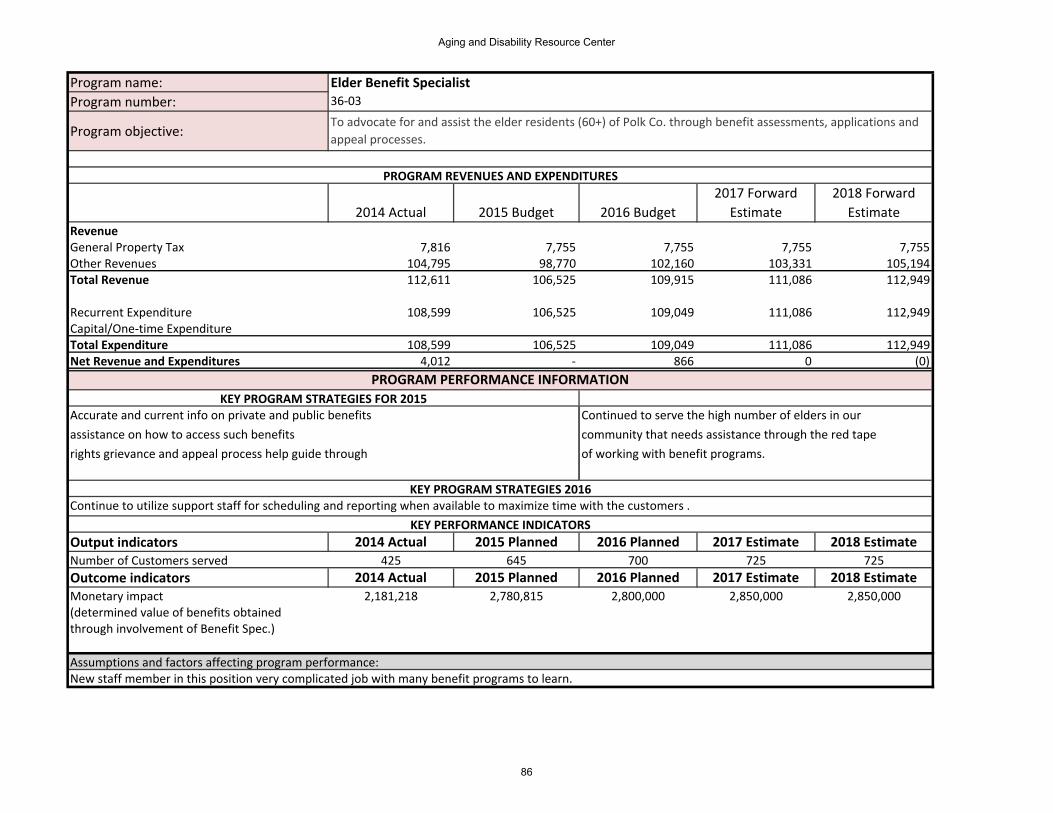
Program name:Program number:
Program objective:
2014 Actual 2015 Budget 2016 Budget2017 Forward
Estimate2018 Forward
EstimateRevenueGeneral Property Tax 7,816 7,755 7,755 7,755 7,755 Other Revenues 104,795 98,770 102,160 103,331 105,194 Total Revenue 112,611 106,525 109,915 111,086 112,949
Recurrent Expenditure 108,599 106,525 109,049 111,086 112,949 Capital/One‐time ExpenditureTotal Expenditure 108,599 106,525 109,049 111,086 112,949 Net Revenue and Expenditures 4,012 ‐ 866 0 (0)
Output indicators 2014 Actual 2015 Planned 2016 Planned 2017 Estimate 2018 EstimateNumber of Customers served 425 645 700 725 725Outcome indicators 2014 Actual 2015 Planned 2016 Planned 2017 Estimate 2018 EstimateMonetary impact 2,181,218 2,780,815 2,800,000 2,850,000 2,850,000(determined value of benefits obtainedthrough involvement of Benefit Spec.)
Continued to serve the high number of elders in ourcommunity that needs assistance through the red tapeof working with benefit programs.
To advocate for and assist the elder residents (60+) of Polk Co. through benefit assessments, applications and appeal processes.
PROGRAM REVENUES AND EXPENDITURES
36‐03Elder Benefit Specialist
KEY PROGRAM STRATEGIES 2016Continue to utilize support staff for scheduling and reporting when available to maximize time with the customers .
KEY PERFORMANCE INDICATORS
PROGRAM PERFORMANCE INFORMATIONKEY PROGRAM STRATEGIES FOR 2015
Accurate and current info on private and public benefitsassistance on how to access such benefitsrights grievance and appeal process help guide through
Assumptions and factors affecting program performance:New staff member in this position very complicated job with many benefit programs to learn.
86
Aging and Disability Resource Center

Program name:Program number:Program objective:
2014 Actual 2015 Budget 2016 Budget2017 Forward
Estimate2018 Forward
EstimateRevenueGeneral Property Tax 1,117 1,108 1,108 1,108 1,108 Other Revenues 14,971 14,110 14,594 14,762 15,028 Total Revenue 16,087 15,218 15,702 15,869 16,136
Recurrent Expenditure 15,514 15,218 15,578 15,869 16,136 Capital/One‐time ExpenditureTotal Expenditure 15,514 15,218 15,578 15,869 16,136 Net Revenue and Expenditures 573 ‐ 124 0 (0)
Output indicators 2014 Actual 2015 Planned 2016 Planned 2017 Estimate 2018 EstimateNumber of attendants 27 95 110 125 125
Outcome indicators 2014 Actual 2015 Planned 2016 Planned 2017 Estimate 2018 EstimateIndividuals responding to post 100% 100% 100% 100% 100%surveys will indicate information and education provided met or exceededtheir expectations.
Final affairs was held in September and well attended.NO programs were cancelled due to poor registration.Took a lead roll in hosting community education
PROGRAM REVENUES AND EXPENDITURES
PROGRAM PERFORMANCE INFORMATIONKEY PROGRAM STRATEGIES FOR 2015
Re‐introduce the Final Affairs Conference in partnership with UWEx.Increase marketing of the prevention programming/health education.
36‐04Community Education
To provide information and programming to enhance the quality of life of our citizens.
Assumptions and factors affecting program performance:
Increase the number of events our agency's booth appears.
KEY PERFORMANCE INDICATORS
KEY PROGRAM STRATEGIES 2016
programming for the Polk County Fair.
87
Aging and Disability Resource Center

Program name:Program number:Program objective:
2014 Actual 2015 Budget 2016 Budget2017 Forward
Estimate2018 Forward
EstimateRevenueGeneral Property Tax 1,117 1,108 1,108 1,108 1,108 Other Revenues 14,971 14,110 14,594 14,762 15,028 Total Revenue 16,087 15,218 15,702 15,869 16,136
Recurrent Expenditure 15,514 15,218 15,578 15,869 16,136 Capital/One‐time ExpenditureTotal Expenditure 15,514 15,218 15,578 15,869 16,136 Net Revenue and Expenditures 573 ‐ 124 0 (0)
Output indicators 2014 Actual 2015 Planned 2016 Planned 2017 Estimate 2018 EstimateNumber of people served 168 87 95 95 95
Outcome indicators 2014 Actual 2015 Planned 2016 Planned 2017 Estimate 2018 EstimatePositive satisfaction rating N/A 90% 95% 100% 100%
36‐05To provide programs and services to ease the stress for care giving of their loved ones.
PROGRAM REVENUES AND EXPENDITURES
Add a second caregiver support group in the Northern part of the service area.
KEY PROGRAM STRATEGIES 2016
PROGRAM PERFORMANCE INFORMATIONKEY PROGRAM STRATEGIES FOR 2015
Partner with Interfaith Caregivers to provide assistance in the homes.
Develop/implement a more strategic way of providing homemaker/chore/respite services to those in need.
Interfaith provided reports on the number of individualsthey were able to help with the added financial support.
KEY PERFORMANCE INDICATORS
Assumptions and factors affecting program performance:2014 information included one time funding for a special event. 2015 will show a drop in numbers but should balance out.
Caregivers Support
88
Aging and Disability Resource Center

Program name:Program number:Program objective:
2014 Actual 2015 Budget 2016 Budget2017 Forward
Estimate2018 Forward
EstimateRevenueGeneral Property Tax 27,913 27,696 27,696 27,696 27,696 Other Revenues 374,267 352,749 364,858 369,039 375,694 Total Revenue 402,180 380,446 392,554 396,736 403,390
Recurrent Expenditure 387,853 380,446 389,460 396,735 403,390 Capital/One‐time ExpenditureTotal Expenditure 387,853 380,446 389,460 396,735 403,390 Net Revenue and Expenditures 14,328 ‐ 3,094 0 (0)
Output indicators 2014 Actual 2015 Planned 2016 Planned 2017 Estimate 2018 EstimateNumber of meals served 61,353 59,500 60,000 62,000 62,000in service area
Outcome indicators 2014 Actual 2015 Planned 2016 Planned 2017 Estimate 2018 EstimatePercentage of meal requests which 98% 100% 100% 100% 100%are filled within 48 hrs of request
36‐06Nutrition Program
To provide a nutritious meal, daily checks, nutrition education and opportunities to volunteer.
PROGRAM REVENUES AND EXPENDITURES
PROGRAM PERFORMANCE INFORMATION
KEY PROGRAM STRATEGIES 2016
KEY PROGRAM STRATEGIES FOR 2015Work on ways to improve the quality of the meals for our recipients
Implement centralized the dispatch of the home delivered meals from the jail site instead of congregate sites.Re‐evaluate the location of the meal sites and how to efficiently provide meals for smaller congregate crowds.
Plan to change the delivery to reduce the number of cooldowns/warm ups of the food which leads to loss of nutritional value along with texture and flavor.
KEY PERFORMANCE INDICATORS
Assumptions and factors affecting program performance:History of reports of poor quality of meals. We continue to work with the catering service however we are limited in actions we can taketo ensure improvements as our employees are not making the meals.Can't control food costs.
89
Aging and Disability Resource Center

Program name:Program number:Program objective:
2014 Actual 2015 Budget 2016 Budget2017 Forward
Estimate2018 Forward
EstimateRevenueGeneral Property Tax 11,165 11,079 11,079 11,079 11,079 Other Revenues 149,707 141,100 145,943 147,616 150,277 Total Revenue 160,872 152,178 157,022 158,694 161,356
Recurrent Expenditure 155,141 152,178 155,784 158,694 161,356 Capital/One‐time ExpenditureTotal Expenditure 155,141 152,178 155,784 158,694 161,356 Net Revenue and Expenditures 5,731 ‐ 1,238 0 (0)
Output indicators 2014 Actual 2015 Planned 2016 Planned 2017 Estimate 2018 EstimateNumber of passengers served 192 167 222 250 250Number of miles driven 100,772 74,165 95,000 98,000 98,000
Outcome indicators 2014 Actual 2015 Planned 2016 Planned 2017 Estimate 2018 EstimateThe number of missed rides 8 total 5 2 0 0(the lower the better) 7 rider error 5 rider error 2 rider error
1 driver error
36‐07To provide rides for elderly and disabled residents who have no other means of transportation.
Increase programming to include lift van services for non‐medical needs.Develop a paperless dispatch/invoicing system for the volunteer driver program to increase efficiency.
PROGRAM REVENUES AND EXPENDITURES
Van purchase at end of year without using operating funds.
Assumptions and factors affecting program performance:Unspent DOT funds go into a trust acct for future capitol purchases, they cannot go towards services or programs.
Transportation Services
These changes will increase the expense of these programs however, the funds are currently being under‐utilized to meet the intentof the programming and the state funds.
KEY PROGRAM STRATEGIES 2016
KEY PERFORMANCE INDICATORS
PROGRAM PERFORMANCE INFORMATIONKEY PROGRAM STRATEGIES FOR 2015
Utilize the state approved trust acct from carry‐over and bus sales topurchase lift van for added service to our transportation services consumers
90
Aging and Disability Resource Center

To improve the quality of life for those who live, work, and play in Polk County
2014 Actual 2015 Budget 2016 Budget2017 Forward
Estimate2018 Forward
EstimateRevenueGeneral Property Tax 1,456,698 1,501,080 1,635,642 1,591,490 1,633,783 Other Taxes 51,298 State Aids 437,584 338,494 316,043 349,709 351,503 Public Charge for Services 463,389 439,529 441,532 441,532 441,532 Intergovernmental Revenue 232,383 174,012 187,393 184,527 185,683 Misc Revenue 14,020 10,463 10,463 10,463 Total Revenue 2,655,372 2,453,114 2,591,073 2,577,721 2,622,964
ExpensePersonnel Services 971,680 1,020,310 995,301 1,019,097 1,046,625 Contractual Services 970,872 902,104 928,702 936,988 950,473 Supplies & Expenses 238,116 258,259 292,790 296,957 301,187 Fixed Charges 96,507 98,291 103,266 103,266 103,266 Grants, Contributions, Indem 143,193 86,000 93,000 93,000 93,000 Capital Outlay 91,521 126,900 220,550 170,950 170,951 Cost Reallocation 4,000 10,463 10,463 10,463 Total Expenditures 2,511,890 2,495,864 2,644,073 2,630,721 2,675,963 Net Revenue and Expenditures 143,482 (42,750) (53,000) (53,000) (53,000)
DEPARTMENT REVENUE AND EXPENDITURES BY ECONOMIC CLASSIFICATION
Strategic Priorities:
To develop, maintain and preserve our parks, lake accesses, and trail systems, that will meet the needs of our citizens and future generations; preserve and protect the county’s open space, water, historical, natural and economic resources to provide recreation and tourism opportunities that are designed to enhance Polk County residents quality of life.
Buildings, Parks, Forestry, Solid Waste, Museum, and Fair Debbie Peterson, DirectorSECTION 1: DEPARTMENT SUMMARY
Department Description and Mission:This department consists of three divisions: Parks and Forestry, Buildings and Property, and Solid Waste and Recycling. The first division, parks and forestry, is responsible for maintenance and improvement of the County’s park system, public forests and recreational trails. The second division, buildings and property, is responsible for maintenance and improvement of county facilities and, beginning in 2013, vehicles other than highway and public safety. The third division, waste and recycling, is responsible for management of solid waste and operation of the County’s recycling facility.
Link to County Board Strategic Goals:
To preserve and enhance the environment
91

2014 Actual 2015 Budget 2016 Budget 2017 Budget 2018 BudgetFTE EmployeesProfessionals 1 1 1 1 1Officials/Administrators 1 1 1 1 1Technicians/Para‐Professionals 3 3 3 3 3Administrative Support 1 1 1 1 1Skilled Craft/Service Maintenance 11.67 11.9 11.85 11.85 11.85Total 17.67 17.9 17.85 17.85 17.85
2014 Actual 2015 Budget 2016 Budget 2017 Budget 2018 BudgetParks and lake access 316,914 267,366 312,247 317,179 322,059 Building and Property 1,339,100 1,400,375 1,404,909 1,447,137 1,471,304 Solid Waste and Recycling 636,222 651,601 728,320 684,795 697,304 Forestry 178,578 123,774 137,716 140,889 144,129 Museum 19,043 30,000 38,133 17,796 18,063 Fair 22,033 22,748 22,748 22,924 23,103 Total 2,511,890 2,495,864 2,644,073 2,630,721 2,675,963
EMPLOYMENT BY JOB CLASSIFICATION
PROGRAM SUMMARYPROGRAM EXPENDITURES
92
Buildings Parks Forestry Solid Waste

Program name:Program number:Program objective:
2014 Actual 2015 Budget 2016 Budget2017 Forward
Estimate2018 Forward
EstimateRevenueGeneral Property Tax 120,390 113,016 127,044 130,333 133,546Other Revenues 198,986 115,600 132,203 133,846 135,514 Total Revenue 319,376 228,616 259,247 264,179 269,060
Recurrent Expenditure 316,914 267,366 312,247 317,179 322,059 Capital/One‐time ExpenditureTotal Expenditure 316,914 267,366 312,247 317,179 322,059 Net Revenue and Expenditures 2,462 (38,750) (53,000) (53,000) (53,000)
Output indicators 2014 Actual 2015 Planned 2016 Planned 2017 Estimate 2018 EstimatePark acreage maintained 260 440 440 440 440Miles of trails maintained 463 463 463 463 463Outcome indicators 2014 Actual 2015 Planned 2016 Planned 2017 Estimate 2018 EstimateRevenue from campsite and shelter 1800 2000 2200 2300 2400
KEY PERFORMANCE INDICATORS
Assumptions and factors affecting program performance:Meeting the needs of changing populationCoping with aging facilities and infrastructure Making use of technology
PROGRAM PERFORMANCE INFORMATIONKEY PROGRAM STRATEGIES FOR 2015
Maintain parks and improve lake accessto keep all trails well maintained and groomed
Improve the road for the campsitesPlan strategically to sustain and enhance the park, recreation opportunities in Polk countyManage and protect natural resource on a sustainable basis for ecological, economic needs
increase participation for residents and tourismpreserve and improve public lands through conservation
KEY PROGRAM STRATEGIES 2016
revenue from campsite and shelteradvertizing in the amount of dollarstrail pass revenuesuccessful grant applications
PROGRAM REVENUES AND EXPENDITURES
SECTION 2: PROGRAM SUMMARY
07‐1Parks and Lake Access
Maintain parks and improve lake access
93
Buildings Parks Forestry Solid Waste

Program name:Program number:
Program objective:
2014 Actual 2015 Budget 2016 Budget2017 Forward
Estimate2018 Forward
EstimateRevenueGeneral Property Tax 1,218,218 1,222,363 1,217,517 1,262,611 1,285,621Other Revenues 232,383 174,012 187,393 184,527 185,683 Total Revenue 1,450,601 1,396,375 1,404,909 1,447,138 1,471,304
Recurrent Expenditure 1,339,100 1,400,375 1,404,909 1,447,137 1,471,304 Capital/One‐time ExpenditureTotal Expenditure 1,339,100 1,400,375 1,404,909 1,447,137 1,471,304 Net Revenue and Expenditures 111,501 (4,000) ‐ 0 0
Output indicators 2014 Actual 2015 Planned 2016 Planned 2017 Estimate 2018 EstimateWork orders completed 1065 1065 1065 1065 1065Fleet tips managed 2887 trip/11 per day 2700 trips 2700 trips 2700 trips 2700 trips
Outcome indicators 2014 Actual 2015 Planned 2016 Planned 2017 Estimate 2018 EstimateMaintenance cost per sq foot $2.10 $2.09 $2.05 $2.05 $2.05Avg no of cars available per day 2 of 14 2 of 14 2 of 14 1 of 14 1 of 14
KEY PERFORMANCE INDICATORS
Assumptions and factors affecting program performance:evaluate the needs of the government center and determine changesfleet vehicles not coming back on time
PROGRAM PERFORMANCE INFORMATIONKEY PROGRAM STRATEGIES FOR 2015
Energy efficient lighting parking lot at Justice Center
Staying current with new technologies allowing us to do our job more efficientlyCreation of a business centerOrganize a buildings committeeProviding a quality preventive maintenance program to extend the life of county assets
KEY PROGRAM STRATEGIES 2016Completed
07‐02Building and Property
Increase energy efficiencyMaintain current facilitiesImprove selected facilitiesImprove utilization of County‐owned vehicles
PROGRAM REVENUES AND EXPENDITURES
94
Buildings Parks Forestry Solid Waste

Program name:Program number:
Program objective:
2014 Actual 2015 Budget 2016 Budget2017 Forward
Estimate2018 Forward
EstimateRevenueGeneral Property Tax 168,530 191,927 304,046 228,621 241,130 Other Revenues 497,131 459,674 424,274 456,174 456,174 Total Revenue 665,661 651,601 728,320 684,795 697,304
Recurrent Expenditure 636,222 651,601 728,320 684,795 697,304 Capital/One‐time ExpenditureTotal Expenditure 636,222 651,601 728,320 684,795 697,304 Net Revenue and Expenditures 29,439 ‐ ‐ ‐ ‐
Output indicators 2014 Actual 2015 Planned 2016 Planned 2017 Estimate 2018 EstimateTonnage of recyclables 2770 2770 2800 2800 2800Solid waste revenue $22,000.00 $27,000.00 $30,000.00 $30,000.00 $30,000.00Outcome indicators 2014 Actual 2015 Planned 2016 Planned 2017 Estimate 2018 Estimaterevenues recycling $283,623.00 $259,000.00 $259,000.00 $259,000.00 $259,000.00revenues solid waste $37,759.00 $38,738.00 $38,738.00 $38,738.00 $38,738.00
aging facilities with increasing maintenance costs
KEY PERFORMANCE INDICATORS
Assumptions and factors affecting program performance:soft markets for recycling materialsreduction is state grant
PROGRAM PERFORMANCE INFORMATIONKEY PROGRAM STRATEGIES FOR 2015
reduce landfill utilizationreduce environmental impacts by recycling
help residents discover ways to reduce wasteproviding a quality preventive maintenance program to extend the life of county assetsensure all staff are customer focused
KEY PROGRAM STRATEGIES 2016
Revenue from solid waste items brought intonnage of recycling
07‐03Solid Waste and Recycling
To reduce landfill utilizationReduce environmental impacts by recycling materialsPrevent hazardous materials from affecting the environment
PROGRAM REVENUES AND EXPENDITURES
95
Buildings Parks Forestry Solid Waste

Program name:Program number:
Program objective:
2014 Actual 2015 Budget 2016 Budget2017 Forward
Estimate2018 Forward
EstimateRevenueGeneral Property Tax (90,721) (78,974) (73,845) (70,796) (67,681)Other Revenues 256,173 202,748 211,561 211,684 211,810 Total Revenue 165,452 123,774 137,716 140,889 144,130
Recurrent Expenditure 178,578 123,774 137,716 140,889 144,129 Capital/One‐time ExpenditureTotal Expenditure 178,578 123,774 137,716 140,889 144,129 Net Revenue and Expenditures (13,125) 0 0 (0) 0
Output indicators 2014 Actual 2015 Planned 2016 Planned 2017 Estimate 2018 Estimatetimber sale revenue $132,893 $143,028 $145,000 $145,000 $150,000acres established/reviewed 472 456 465 TBD TBDOutcome indicators 2014 Actual 2015 Planned 2016 Planned 2017 Estimate 2018 Estimatetimber sales completed 13 10 10‐Aug 10‐Aug 10‐Aug
KEY PERFORMANCE INDICATORS
Assumptions and factors affecting program performance:The forestry program is highly dependent on current and future weather patterns, both locally (ie growing trees) and elsewhere (ie hurricanes in the south cause rebuilding efforts and increase demand on forest products). Also, in order to conduct active forest management, we are very reliant on wood markets and the economy. A catastrophic event on our county forest can negatively affect habitat and timber value for years and possibly decades. Forest management planning is a very fluid and organic planning process.
PROGRAM PERFORMANCE INFORMATIONKEY PROGRAM STRATEGIES FOR 2015
Special spring deer hunt to help combat deer browse of seedlingsImprove county forest roads
Service efficiency would be improved for the public (acquiring firewood permits, maps, places to hunt, etc…) if there was someone who could always answer the phone. The forestry office is a field office and the caller doesn't get a 'live person' to pick up the phone as often as is preferred by the public.
Increase public awareness of county forest and forest managementKEY PROGRAM STRATEGIES 2016
Seedling browse percentage slightly improvedimproved 2 intersectionsnewspaper articles, engage in 'outside' committees
07‐04Forestry
Improve wildlife habitat and public accessMaintain 7.61 miles of roads Comply with County Forest Law (state statute S 28.11)
PROGRAM REVENUES AND EXPENDITURES
96
Buildings Parks Forestry Solid Waste

Program name:Program number:
Program objective:
2014 Actual 2015 Budget 2016 Budget2017 Forward
Estimate2018 Forward
EstimateRevenueGeneral Property Tax 17,533 30,000 38,133 17,796 18,063 Other Revenues 14,000 ‐ ‐ ‐ ‐ Total Revenue 31,533 30,000 38,133 17,796 18,063
Recurrent Expenditure 19,043 30,000 38,133 17,796 18,063 Capital/One‐time ExpenditureTotal Expenditure 19,043 30,000 38,133 17,796 18,063 Net Revenue and Expenditures 12,490 ‐ ‐ ‐ ‐
Give Big St. Croix Valley Promotion
Output indicators 2014 Actual 2015 Planned 2016 Planned 2017 Estimate 2018 Estimateattendance 1,600 1,600 1,700 1,700 1,700
Outcome indicators 2014 Actual 2015 Planned 2016 Planned 2017 Estimate 2018 EstimateGood will donation planned for 2016revenue $1,840 $1,840 $2,000 $2,000 $2,000Assumptions and factors affecting program performance:attendance
Partner with Unity Community Ed with Logging ClassesKEY PROGRAM STRATEGIES 2016
KEY PERFORMANCE INDICATORS
KEY PROGRAM STRATEGIES FOR 2015National Scenic RiverwayFree will offering to gain more revenue
These are program strategies for 2016 Results will be available next year
07‐05
MISSION STATEMENT: Preserving the past for future generations by establishing a unique and enduring collection of Polk County history, shared with the public through education programs and exhibits.
PROGRAM REVENUES AND EXPENDITURES
PROGRAM PERFORMANCE INFORMATION
Museum
97
Buildings Parks Forestry Solid Waste

Program name:Program number:
Program objective:
2014 Actual 2015 Budget 2016 Budget2017 Forward
Estimate2018 Forward
EstimateRevenueGeneral Property Tax 22,748 22,748 22,748 22,924 23,103 Other RevenuesTotal Revenue 22,748 22,748 22,748 22,924 23,103
Recurrent Expenditure 22,033 22,748 22,748 22,924 23,103 Capital/One‐time ExpenditureTotal Expenditure 22,033 22,748 22,748 22,924 23,103 Net Revenue and Expenditures 715 ‐ ‐ 0 ‐
Output indicators 2014 Actual 2015 Planned 2016 Planned 2017 Estimate 2018 Estimatecontinue the cement walkway thru the barns for increased ADA attendance
Outcome indicators 2014 Actual 2015 Planned 2016 Planned 2017 Estimate 2018 EstimateAttendance 33,905 34,856 35,000 35,000 35,000
KEY PROGRAM STRATEGIES 2016
New bleachers, 2017; small animal barnKEY PERFORMANCE INDICATORS
Assumptions and factors affecting program performance:weather, attendance
New bleachers 2017small animal barn
Retaining the Historical architecture design and Fair Heritage
PROGRAM REVENUES AND EXPENDITURES
PROGRAM PERFORMANCE INFORMATIONKEY PROGRAM STRATEGIES FOR 2015
Fair07‐06MISSION STATEMENT: The future enhanced needed educational programs for the benefit of the people of Polk County.
98
Buildings Parks Forestry Solid Waste

2014 Actual 2015 Budget 2016 Budget2017 Forward
Estimate2018 Forward
EstimateRevenueGeneral Property Tax 510,586 580,514 648,680 671,116 695,087 State Aids 167,040 167,040 174,705 174,705 174,705 Fine and Forfeitures 187,772 195,000 185,000 185,000 185,000 Public Charge for Services 166,879 169,000 174,000 174,135 174,272 Misc Revenue 238 Total Revenue 1,032,515 1,111,554 1,182,385 1,204,956 1,229,064
ExpensePersonnel Services 692,947 778,879 772,627 791,001 810,850 Contractual Services 310,820 195,159 246,208 249,901 253,650 Supplies & Expenses 35,552 32,516 33,550 34,053 34,564 Fixed Charges 45 Grants, Contributions, Indem 25,000 50,000 50,000 50,000 Cost Reallocation 94,301 105,000 105,000 105,000 105,000 Total Expenditures 1,133,665 1,136,554 1,207,385 1,229,956 1,254,064
Strategic Priorities:
DEPARTMENT REVENUE AND EXPENDITURES BY ECONOMIC CLASSIFICATION
CIRCUIT COURT Jobie Bainbridge, Clerk of Circuit CourtSECTION 1: DEPARTMENT SUMMARY
Department Description and Mission:To follow all Guidelines with the Wisconsin statutes; Perform administrative duties for the court, including jury management, Court financial management, Court record management, collections and enforcement of all Court ordered financial obligations. Disseminate information to the public on procedures to file small claims, domestic abuse/harassment/child abuse/restraining orders, civil matters and other related activity.Record keeping, monitoring and scheduling of Court cases including but not limited to small claims, civil, criminal, traffic, appeals, collections of fines and court fees also recording liens and judgments. A Court Commissioner is appointed in each County by the Judge(s), a Court Commissioner is a judicial officer who has powers similar to a Judge. Those powers, duties and responsibilities are set by State Statute and Wisconsin Supreme Court. The Court Commissioner handles a variety of civil, family, traffic/forfeitures, criminal and probate matters.MISSION: To assist our Circuit Court and customers in the most efficient and complete manner in accordance with State statute and County policy. As local Court administrative personnel, Clerks of Circuit Court are at the center of a wide variety of activities and work daily with several agencies and customers. Law Enforcement, the legal community, local, State and Federal agencies, businesses and the general public depend upon the Office of the Circuit Court to assist in a wide range of administrative tasks. Link to County Board Strategic Goals:To serve the Court and the public with integrity and professionalism.
99

Net Revenue and Expenditures (101,150) (25,000) (25,000) (25,000) (25,000)
2014 Actual 2015 Budget 2016 Budget 2017 Budget 2018 BudgetFTE EmployeesOfficials/Administrators 1 1 1 1 1Professionals 1 1 1 1 1Administrative Support 10 10 10 10 10Total 12 12 12 12 12
2014 Actual 2015 Budget 2016 Budget Estimate EstimateCase filing and management 850,249 852,416 905,539 922,467 940,548 Management of Jury 113,366 113,655 120,739 122,996 125,406 Collections and accounting of fees and fine revenue
113,366 113,655 120,739 122,996 125,406
Filing of oaths of office 56,683 56,828 60,369 61,498 62,703 Total 1,133,665 1,136,554 1,207,385 1,229,956 1,254,064
EMPLOYMENT BY JOB CLASSIFICATION
PROGRAM SUMMARYPROGRAM EXPENDITURES
100
Clerk of Court

Program name:Program number:Program objective:
2014 Actual 2015 Budget 2016 Budget2017 Forward
Estimate2018 Forward
EstimateRevenueGeneral Property Tax 382,940 435,386 486,510 503,337 521,315Other Revenues 391,447 398,280 400,279 400,380 400,483 Total Revenue 774,386 833,666 886,789 903,717 921,798
Recurrent Expenditure 850,249 852,416 905,539 922,467 940,548 Capital/One‐time ExpenditureTotal Expenditure 850,249 852,416 905,539 922,467 940,548 Net Revenue and Expenditures (75,862) (18,750) (18,750) (18,750) (18,750)
Scanning of old files and purge old files. Continue collections on owed monies along with continuation of tax intercept.
Desktop scanners for all desksPublic viewing of documents
KEY PROGRAM STRATEGIES 2016
Scanning all 2014 and 2015 filesAs of August, 2015 public is able to view their own documents
Program 02‐01 Case filing and management continued on next page
PROGRAM PERFORMANCE INFORMATIONKEY PROGRAM STRATEGIES FOR 2015
E‐filing of Small ClaimsTax intercept of owed moniesUnclaimed Funds
E‐filing for all types of cases.
Went live in May, 2015 to accept e‐filings for small claimsHave turned all past due monies to tax interceptHave completed the unclaimed funds procedure
SECTION 2: PROGRAM SUMMARY
02‐01Case filing and management
Prompt and accurate filing of all information necessary for the functioning of the court.
PROGRAM REVENUES AND EXPENDITURES
101
Clerk of Court

Output indicators 2014 Actual 2015 Planned 2016 Planned 2017 Estimate 2018 EstimateNumber of case files 6,809 6,203 5,529 5,457 5,448Family 253 249 245 243 241Civil 468 447 426 424 423Criminal (CM, CF, CT) 1,195 1,079 999 975 973Paternity 11 14 11 10 10Juvenile 135 184 135 135 135Small Claims 965 927 889 875 873Traffic 3,782 3,303 2,824 2,795 2,793
Outcome indicators 2014 Actual 2015 Planned 2016 Planned 2017 Estimate 2018 EstimateNumber of Re‐opened cases due to Clerk error
0 0 0 0 0
Number of calls received yearly on case filings
14,700 14,700 14,700 14,700 14,700
KEY PERFORMANCE INDICATORS
Assumptions and factors affecting program performance:The Clerk of Court Office can not control the amount of incoming cases, criminal activity or State mandated costs. The Clerk of Court Office can not predict how many Jury Trials are going to happen in a years time.
Continuation of Program 02‐01 Case filing and management
102
Clerk of Court

Program name:Program number:Program objective:
2014 Actual 2015 Budget 2016 Budget2017 Forward
Estimate2018 Forward
EstimateRevenueGeneral Property Tax 51,059 58,051 64,868 67,112 69,509Other Revenues 52,193 53,104 53,371 53,384 53,398 Total Revenue 103,252 111,155 118,239 120,496 122,906
Recurrent Expenditure 113,366 113,655 120,739 122,996 125,406 Capital/One‐time ExpenditureTotal Expenditure 113,366 113,655 120,739 122,996 125,406 Net Revenue and Expenditures (10,115) (2,500) (2,500) (2,500) (2,500)
Output indicators 2014 Actual 2015 Planned 2016 Planned 2017 Estimate 2018 EstimateNumber of juries emplaneled 21 29 27 21 21
Outcome indicators 2014 Actual 2015 Planned 2016 Planned 2017 Estimate 2018 EstimateNumber of Complaints from Jurors 0 0 0 0 0
KEY PERFORMANCE INDICATORS
Assumptions and factors affecting program performance:There is approximately 1,200 jurors per year that utilize the Juror call in line to report for jury duty.
KEY PROGRAM STRATEGIES 2016Maintain accurate recordsInsure timely juror notification
Juries to be appropriately trained and managed thoroughly and professionally.
PROGRAM REVENUES AND EXPENDITURES
PROGRAM PERFORMANCE INFORMATIONKEY PROGRAM STRATEGIES FOR 2015
Improve our contact with potential jurors to simplify the process for them.Courteous and friendly service to actual jurors
No logged complaints from jurors
02‐02Management of Jury
103
Clerk of Court

Program name:Program number:Program objective:
2014 Actual 2015 Budget 2016 Budget2017 Forward
Estimate2018 Forward
EstimateRevenueGeneral Property Tax 51,059 58,051 64,868 67,112 69,509Other Revenues 52,193 53,104 53,371 53,384 53,398 Total Revenue 103,252 111,155 118,239 120,496 122,906
Recurrent Expenditure 113,366 113,655 120,739 122,996 125,406 Capital/One‐time ExpenditureTotal Expenditure 113,366 113,655 120,739 122,996 125,406 Net Revenue and Expenditures (10,115) (2,500) (2,500) (2,500) (2,500)
Output indicators 2014 Actual 2015 Planned 2016 Planned 2017 Estimate 2018 EstimateAmount of fee and fine revenue $2,494,121.55 $2,188,874.17 $1,872,358.88 $1,732,639.58 $1,653,232.46Amount Assessed $1,753,581.68 $1,641,828.04 $1,532,600.00 $1,386,111.66 $1,322,585.97Amount Collected $740,539.87 $547,046.13 $339,758.88 $346,527.92 $330,646.49
Outcome indicators 2014 Actual 2015 Planned 2016 Planned 2017 Estimate 2018 EstimateCollections as a percent of total 29.7% 25.0% 18.1% 20.0% 20.0%
KEY PERFORMANCE INDICATORS
Assumptions and factors affecting program performance:The amount assessed and the amount collected reflect all case types and all statutory fees and fines.
KEY PROGRAM STRATEGIES 2016Continue to explore new methods of fine recoveries both with collection and implementing a system that is user friendly.
KEY PROGRAM STRATEGIES FOR 2015Stated to use the Tax Intercept process to recover fines.
02‐03Collections and accounting of fees and fine revenue
Revenues to be promptly collected and appropriately accounted.
PROGRAM REVENUES AND EXPENDITURES
Successfully implemented
PROGRAM PERFORMANCE INFORMATION
104
Clerk of Court

Program name:Program number:Program objective:
2014 Actual 2015 Budget 2016 Budget2017 Forward
Estimate2018 Forward
EstimateRevenueGeneral Property Tax 25,529 29,026 32,434 33,556 34,754Other Revenues 26,096 26,552 26,685 26,692 26,699 Total Revenue 51,626 55,578 59,119 60,248 61,453
Recurrent Expenditure 56,683 56,828 60,369 61,498 62,703 Capital/One‐time ExpenditureTotal Expenditure 56,683 56,828 60,369 61,498 62,703 Net Revenue and Expenditures (5,057) (1,250) (1,250) (1,250) (1,250)
Output indicators 2014 Actual 2015 Planned 2016 Planned 2017 Estimate 2018 EstimateNumber of oaths 7 18 4 3 3
Outcome indicators 2014 Actual 2015 Planned 2016 Planned 2017 Estimate 2018 EstimateInaccurate of filings 0 0 0 0 0
KEY PROGRAM STRATEGIES 2016Continue to make Oath of Office a pleasant and efficient event for our newly elected officials.
Fast and efficient Oaths with accurate maintained of Oath of Office Records
KEY PERFORMANCE INDICATORS
Assumptions and factors affecting program performance:The filing of oaths in 2015 was high due to the fact that staff had to be re‐deputized due to the elected office. Said oaths were successfully filed with 100% accuracy.
Process of Oath of Office has become very simple and easy.
PROGRAM REVENUES AND EXPENDITURES
PROGRAM PERFORMANCE INFORMATIONKEY PROGRAM STRATEGIES FOR 2015
02‐04Filing of oaths of office
All records maintained timely and accurately.
105
Clerk of Court

2014 Actual 2015 Budget 2016 Budget2017 Forward
Estimate2018 Forward
EstimateRevenueGeneral Property Tax 243,096 233,766 282,502 274,374 294,742 State Aids 539,730 522,425 520,170 520,170 520,170 Public Charge for Services 1,360 3,260 3,710 3,710 3,710 Total Revenue 784,186 759,451 806,382 798,254 818,622
ExpensePersonnel Services 683,315 700,755 718,871 738,361 757,834 Contractual Services 25,138 32,016 33,718 34,224 34,737 Supplies & Expenses 22,133 26,480 25,093 25,469 25,851 Fixed Charges 416 200 200 200 200 Capital Outlay 0 0 28,500 0 0Total Expenditures 731,001 759,451 806,382 798,254 818,622 Net Revenue and Expenditures 53,184 ‐ 0 ‐ ‐
Strategic Priorities:Provide Professional, Responsive and Cost‐Effective Legal Services to the County Provide Child Support Services Through Establishment and Enforcement of Child Support Orders and the Establishment of Paternity
CORPORATION COUNSEL/CHILD SUPPORT AGENCY Jeff Fuge, Corporation Counsel Malia Malone, Child Support Director
SECTION 1: DEPARTMENT SUMMARYDepartment Description and Mission:The Office of Corporation Counsel provides a full range of legal services to the County Board, County Administrator, County departments, committees, boards, commissions, supervisors, elected and appointed county officials and employees in respect to their official duties including rendering legal opinions and advice, drafting and reviewing contracts, ordinances, resolutions and other legal proceedings. The office prosecutes various civil proceedings including account collections for departments, tax foreclosures, mental commitments, guardianships, protective placements, termination of parental rights, and county ordinance enforcements, especially land use/zoning ordinances. The office administers the Wisconsin Child Support Program on behalf of the County and represents the State of Wisconsin in child support cases.
MISSION: The mission of the Corporation Counsel is to serve and represent the public with integrity by providing professional, responsive and effective legal services to the County, its boards, commissions, committees, departments, officials and employees.Link to County Board Strategic Goals:To serve the public with integrity through the provision of legal services to the County and child support services to families of Polk County
DEPARTMENT REVENUE AND EXPENDITURES BY ECONOMIC CLASSIFICATION
106

2014 Actual 2015 Budget 2016 Budget 2017 Budget 2018 BudgetFTE EmployeesOfficials/Administrators 2 1 1 1 1Professionals 1 2 2 2 2Technicians/Para‐Professionals 5 5 5 5 5Administrative Support 1 1 1 1 1First/Mid Level Officials and ManagersTotal 9 9 9 9 9
Program 2014 Actual 2015 Budget 2016 Budget2017 Forward
Estimate2018 Forward
EstimateOrganizational Legal Services 53,912 69,858 74,861 66,571 68,296 Human Services Cases 46,211 59,879 64,167 57,061 58,539 Ordinance Enforcement and Administration 30,807 39,919 42,778 38,041 39,026
Litigation and Collection Services 23,105 29,939 32,083 28,531 29,270 Delivery of Child Support Services 576,966 559,856 592,493 608,050 623,491 Total 731,001 759,451 806,382 798,254 818,622
EMPLOYMENT BY JOB CLASSIFICATION
PROGRAM SUMMARYPROGRAM EXPENDITURES
107
Corporation Counsel and Child Support

Program name:Program number:Program objective:
2014 Actual 2015 Budget 2016 Budget2017 Forward
Estimate2018 Forward
EstimateRevenueGeneral Property Tax 38,425 36,888 43,088 34,798 36,523 Other Revenues 34,102 32,970 31,773 31,773 31,773 Total Revenue 72,527 69,858 74,861 66,571 68,296
Recurrent Expenditure 53,912 69,858 64,886 66,571 68,296 Capital/One‐time Expenditure 9,975 Total Expenditure 53,912 69,858 74,861 66,571 68,296 Net Revenue and Expenditures 18,615 ‐ (0) ‐ ‐
Output indicators 2014 Actual 2015 Planned 2016 Planned 2017 Estimate 2018 EstimateUnits of Legal Services 160 175 175 175 175
Outcome indicators 2014 Actual 2015 Planned 2016 Planned 2017 Estimate 2018 EstimateComplete and Timely Review 100.00% 100% 100% 100% 100%Comprehensive and Timely Issuance of Legal Opinions
99% 99% 100% 100% 100%
To maintain County Legal Compliance
PROGRAM REVENUES AND EXPENDITURES
KEY PERFORMANCE INDICATORS
Untimely Request or Failure to Request Legal Services Inhibits County Compliance and Avoidance of Litigation And Increases Legal Services Costs
To Continue to Provide Legal Services With Professionalism and Responsiveness With Additional Demands for Legal Services
KEY PROGRAM STRATEGIES 2016
PROGRAM PERFORMANCE INFORMATIONKEY PROGRAM STRATEGIES FOR 2015
SECTION 2: PROGRAM SUMMARY
27‐01Organizational Legal Services
Promote County Organizational Compliance, Efficiency and Effectiveness Avoid Litigation Through Professional, Responsive Legal Counsel
Upgrade Antiquated Computer System and Adapt Case Management from Manual Process to Automated Process
Assumptions and factors affecting program performance/inhibit or promote professional, responsive and cost effective legal services:
*Units are contracts, resolutions, ordinances reviewed; legal opinions issued; and consultations provided.
108
Corporation Counsel and Child Support

Program name:Program number:Program objective:
2014 Actual 2015 Budget 2016 Budget2017 Forward
Estimate2018 Forward
EstimateRevenueGeneral Property Tax 32,935 31,619 36,933 29,827 31,305 Other Revenues 29,231 28,260 27,234 27,234 27,234 Total Revenue 62,166 59,879 64,167 57,061 58,539
Recurrent Expenditure 46,211 59,879 55,617 57,061 58,539 Capital/One‐time Expenditure 8,550 Total Expenditure 46,211 59,879 64,167 57,061 58,539 Net Revenue and Expenditures 15,955 ‐ 0 ‐ ‐
Output indicators 2014 Actual 2015 Planned 2016 Planned 2017 Estimate 2018 EstimateCases Reaching Disposition 222 275* 275* 275* 275*
Outcome indicators 2014 Actual 2015 Planned 2016 Planned 2017 Estimate 2018 EstimateCase Initiation and Conclusion are 100.00% 100% 100% 100% 100%within statutory timeframes
Human Services Cases
To provide professional and responsive legal support for cases referred by Human Services
PROGRAM REVENUES AND EXPENDITURES
Standardize HSD referral of case process to increase level of responsiveness on CHIPS cases equivalent to that of other HSD case types
KEY PROGRAM STRATEGIES 2016
PROGRAM PERFORMANCE INFORMATIONKEY PROGRAM STRATEGIES FOR 2015
Initiate and Complete Mandated Legal Services within Statutory Time Frames
Through coordination and consultation, smoothly transition CHIPS case load, received September 1, 2015 from District Attorney
27‐02
All Legal Services Provided within Statutory Timeframes
KEY PERFORMANCE INDICATORS
Assumptions and factors affecting program performance/inhibit or promote professional, responsive and cost effective legal services:Changes in Human Services Organization Slow to Adapt Human Services Organization Lessens Responsiveness in the Provision of Legal Services on CHIPS type cases.
* Reflects all cases referred regardless of type
109
Corporation Counsel and Child Support

Program name:Program number:
Program objective:
2014 Actual 2015 Budget 2016 Budget2017 Forward
Estimate2018 Forward
EstimateRevenueGeneral Property Tax 21956.93 21079.09 24621.87 19884.83 20870.16Other Revenues 19,487 18,840 18,156 18,156 18,156 Total Revenue 41,444 39,919 42,778 38,041 39,026
Recurrent Expenditure 30,807 39,919 37,078 38,041 39,026 Capital/One‐time Expenditure 5,700 Total Expenditure 30,807 39,919 42,778 38,041 39,026 Net Revenue and Expenditures 10,637 ‐ ‐ ‐ ‐
Output indicators 2014 Actual 2015 Planned 2016 Planned 2017 Estimate 2018 EstimateOrdinance Cases Processed 4500.00% 5000% 5500% 5500% 6000%
Outcome indicators 2014 Actual 2015 Planned 2016 Planned 2017 Estimate 2018 EstimateMonthly Review of Zoning Cases 100.00% 100% 100% 100% 100%Timely Initiation of Ordinance Cases 1 1 1 1 1
27‐03Ordinance Enforcement and Administration
To provide professional and efficient legal services to County departments and committees that are responsible for designing good land use practices, preserving and enhancing the environment and protecting and improving public health.
PROGRAM REVENUES AND EXPENDITURES
Provide Legal Clarification of Existing Ordinances In application of 2015 State Statute Amendments
KEY PROGRAM STRATEGIES 2016
PROGRAM PERFORMANCE INFORMATIONKEY PROGRAM STRATEGIES FOR 2015
Development of Legally Conforming Zoning Ordinance
Timely Steer Town Approval Process of Comprehensive Revised Ordinance
KEY PERFORMANCE INDICATORS
Assumptions and factors affecting program performance//inhibit or promote professional, responsive and cost effective legal services:Ever Changing State Legislative Process Presents Uncertainty in Zoning Ordinance Administration and Enforcement Town Autonomy Creates Uncertainty in Need for Legal Services Applicable to Adoption of comprehensive Revised OrdinanceLack of Awareness of Planning Responsibility of Zoning Committee
Comprehensive Revision Adopted
110
Corporation Counsel and Child Support

Program name:Program number:
Program objective:
2014 Actual 2015 Budget 2016 Budget2017 Forward
Estimate2018 Forward
EstimateRevenueGeneral Property Tax 16467.7 15809.32 18466.4 14913.62 15652.62Other Revenues 14,615 14,130 13,617 13,617 13,617 Total Revenue 31,083 29,939 32,083 28,531 29,270
Recurrent Expenditure 23,105 29,939 27,808 28,531 29,270 Capital/One‐time Expenditure 4,275 Total Expenditure 23,105 29,939 32,083 28,531 29,270 Net Revenue and Expenditures 7,978 ‐ ‐ ‐ ‐
Output indicators 2014 Actual 2015 Planned 2016 Planned 2017 Estimate 2018 EstimateAccounts and Claims Processed 3700.00% 4000% 1500% 1500% 1500%
Outcome indicators 2014 Actual 2015 Planned 2016 Planned 2017 Estimate 2018 EstimateTimely Initiation and Conclusion 100.00% 100% 100% 100% 100%Monthly Review 1 1 1 1 1
Services Provided Pursuant to Standard of ResponsivenessJudgment Executions In Pending Status
Lessen Review Time of Accounts Receivable through Implementation of Accounts Write Off ProcessKEY PROGRAM STRATEGIES 2016
PROGRAM PERFORMANCE INFORMATIONKEY PROGRAM STRATEGIES FOR 2015
Timely Process and Review Claims and Accounts Receivables
27‐04Litigation and Collection Services
To preserve and to protect the interests of Polk County; to minimize liability against the County; and to timely secure and obtain payment on those accounts that are due to Polk County.
PROGRAM REVENUES AND EXPENDITURES
Encourage Usage of State Tax Certification, Wherever FeasibleKEY PERFORMANCE INDICATORS
Assumptions and factors affecting program performance:Timely Write‐Off of Uncollectible Accounts Expedites Review Process and Increases Cost‐EffectivenessCounty will be Engaged in no Unexpected Litigation
Liquidate Judgments In Favor of County
111
Corporation Counsel and Child Support

Program name:Program number:Program objective:
2014 Actual 2015 Budget 2016 Budget2017 Forward
Estimate2018 Forward
EstimateRevenueGeneral Property Tax 133311.36 128370.53 159392.59 174950.27 190391.38Other Revenues 443,654 431,485 433,100 433,100 433,100 Total Revenue 576,966 559,856 592,493 608,050 623,491
Recurrent Expenditure 576,966 559,856 592,493 608,050 623,491 Capital/One‐time ExpenditureTotal Expenditure 576,966 559,856 592,493 608,050 623,491 Net Revenue and Expenditures ‐ ‐ ‐ ‐ ‐ PROGRAM PERFORMANCE INFORMATION
Court‐Ordered Establishment ‐ 91.14%Current Support Collection Rate ‐ 78.83%Paternity Establishment ‐ 100%Arrears Collection Rate ‐ 76.15%Cost Effectiveness Rate ‐ $6.85
27‐05Delivery of Child Support Services
To maintain federal and state funding by meeting or exceeding baseline performance measures.
PROGRAM REVENUES AND EXPENDITURES
Program 27‐05 continued onto next page
PROGRAM PERFORMANCE INFORMATIONKEY PROGRAM STRATEGIES FOR 2015
KEY PROGRAM STRATEGIES 2016
Implement Strong Succession Planning of PersonnelIncrease Participation In State Program Policy Development
Maintain and Exceed Performance Measures and Increase Federal and State Allocations to County Program Through Strong Succession Planning Increased Involvement in State Program Policy Development
Meet Or Exceed Performance Indicators and Cost Effectiveness
112
Corporation Counsel and Child Support

Output indicators 2014 Actual 2015 Planned 2016 Planned 2017 Estimate 2018 EstimateCases Processed 1,600 1,650 1,700 1,750 1,800 Constituents Served 4,600 4,650 4,670 4,700 5,000
Outcome indicators 2014 Actual 2015 Planned 2016 Planned 2017 Estimate 2018 EstimateCourt‐Ordered Establishment Rate 90.07% 90% 90% 90% 90%Current Support Collection Rate 73.38% 70% 70% 70% 70%Paternity Establishment Rate 1 1 1 1 1Arrears Collection Rate 0.7681 0.75 0.75 0.75 0.75Cost Effectiveness per Program Dollar 5.72 5.5 5.5 5.5 5.5
Continuation of program 27‐05‐Delivery of Child Support ServicesKEY PERFORMANCE INDICATORS
Assumptions and factors affecting program performance/inhibit or promote high level and cost efficiency of child support services:Personnel Changes are likely. Strength in selection/succession process minimizes a lag in performance. Receptiveness and Investment in State of the Art County Computer System Would Ensure Performance and Cost Effectiveness Additional Need For Child Support Services Commensurate with Population Growth Forecasts
113
Corporation Counsel and Child Support

2014 Actual 2015 Budget 2016 Budget 2017 Forward 2018 Forward RevenueGeneral Property Tax 320,899 334,388 363,709 368,486 375,408 License & Fees 18,991 24,400 24,250 24,294 22,794 Public Charge for Services 25,171 26,000 26,100 26,100 26,100 Intergovernmental Revenue 26,151 19,000 34,500 34,500 34,500 Total Revenue 391,212 403,788 448,559 453,380 458,802
ExpensePersonnel Services 258,153 266,704 273,003 275,530 280,168 Contractual Services 52,964 44,976 75,206 76,334 75,934 Supplies & Expenses 62,019 72,125 77,750 78,916 80,100 Fixed Charges 4,803 5,560 2,100 2,100 2,100 Grants, Contributions, Indem 16,282 21,000 20,500 20,500 20,500 Total Expenditures 394,221 410,365 448,559 453,381 458,802 Net Revenue and Expenditures (3,009) (6,577) ‐ (0) 0
COUNTY CLERK Carole Wondra, Polk County ClerkSECTION 1: DEPARTMENT SUMMARY
Department Description and Mission:The duties of this office include preparing and keeping committees and board proceedings for the County Supervisors. The office is responsible for administering all federal, state, county and local elections and in addition we are licensing agent for marriages, motor vehicle, passports and timber cutting permits.
MISSION: Provide efficient services to the public and perform those duties as assigned by Wisconsin State Statutes and County Policy.
Link to County Board Strategic Goals:To serve the public with integrityStrategic Priorities:Continue support and open communications with 36 municipalities and the residents of Polk County within the guidelines of the state statutes.
DEPARTMENT REVENUE AND EXPENDITURES BY ECONOMIC CLASSIFICATION
114

2014 Actual 2015 Budget 2016 Budget 2017 Budget 2018 BudgetFTE EmployeesOfficials/Administrators 1 1 1 1 1Administrative Support 1.43 1.45 1.45 1.45 1.45Total 2.43 2.45 2.45 2.45 2.45
2014 Actual 2015 Budget 2016 Budget2017 Forward
Estimate2018 Forward
EstimateMarriage and domestic partnership licensing
35,480 36,933 40,370 40,804 41,292
Administration of elections 181,341 188,768 206,337 208,555 211,049 Support services for the County Board 90,671 94,384 103,169 104,278 105,524
Dog licensing 15,769 16,415 17,942 18,135 18,352 Passport agent 35,480 36,933 40,370 40,804 41,292 Motor vehicle licensing agent 35,480 36,933 40,370 40,804 41,292 Total 394,221 410,365 448,559 453,381 458,802
PROGRAM SUMMARYPROGRAM EXPENDITURES
EMPLOYMENT BY JOB CLASSIFICATION
115
County Clerk

Program name:Program number:Program objective:
2014 Actual 2015 Budget 2016 Budget2017 Forward
Estimate2018 Forward
EstimateRevenueGeneral Property Tax 28,881 30,095 32,734 33,164 33,787Other Revenues 6,328 6,246 7,637 7,640 7,505 Total Revenue 35,209 36,341 40,370 40,804 41,292
Recurrent Expenditure 35,480 36,933 40,370 40,804 41,292 Capital/One‐time ExpenditureTotal Expenditure 35,480 36,933 40,370 40,804 41,292 Net Revenue and Expenditures (271) (592) ‐ (0) 0
Output indicators 2014 Actual 2015 Planned 2016 Planned 2017 Estimate 2018 EstimateNumber of marriage applications applied for on a yearly basis. This can vary greatly.
251 250 250 250 250
Outcome indicators 2014 Actual 2015 Planned 2016 Planned 2017 Estimate 2018 EstimateAs stated above. 251 250 250 250 250
It has streamlined the process and improved our ability to work with the Register of Deeds Office
Issue error free, worry free marriage licenses
KEY PROGRAM STRATEGIES 2016Continued training of the marriage program and the rules and regulations as they apply to allow for a better application experience
KEY PERFORMANCE INDICATORS
Assumptions and factors affecting program performance:This program is state mandated. And with the new state run program there are very few risks involved in issuing licenses.
New state wide program has allowed for a much cleaner and easier way to issue the marriage licenses.
SECTION 2: PROGRAM SUMMARY
06‐01Marriage and domestic partnership licensing
Rapid, error free issuance of required documents as required by the state statutes
PROGRAM REVENUES AND EXPENDITURES
PROGRAM PERFORMANCE INFORMATIONKEY PROGRAM STRATEGIES FOR 2015
116
County Clerk

Program name:Program number:Program objective:
2014 Actual 2015 Budget 2016 Budget2017 Forward
Estimate2018 Forward
EstimateRevenueGeneral Property Tax 147,614 153,818 167,306 169,504 172,688Other Revenues 32,344 31,924 39,031 39,051 38,361 Total Revenue 179,957 185,742 206,337 208,555 211,049
Recurrent Expenditure 181,341 188,768 206,337 208,555 211,049 Capital/One‐time ExpenditureTotal Expenditure 181,341 188,768 206,337 208,555 211,049 Net Revenue and Expenditures (1,384) (3,025) ‐ (0) 0
Output indicators 2014 Actual 2015 Planned 2016 Planned 2017 Estimate 2018 EstimateNumber of elections per year (expected) 4 2 4 2 4Outcome indicators 2014 Actual 2015 Planned 2016 Planned 2017 Estimate 2018 EstimateChallenges due to errors in tally 0 0 0 0 0
Very busy year in elections. 4 large elections including School board and County Board Supervisors in the Spring and election of several County Constitutional Officers, state legislative offices and Presidential electionsThis will require a team effort to administer those elections. Along with the new state program ‐ could be challenging
KEY PERFORMANCE INDICATORS
Assumptions and factors affecting program performance:The state will be implementing an entirely new statewide voter registration system in the fall of 2015 to be fully operational 2016. This is sure to have an sure to have an affect on the clerk's office as well as the 36 municipalities.
06‐02
KEY PROGRAM STRATEGIES FOR 2015
KEY PROGRAM STRATEGIES 2016
PROGRAM PERFORMANCE INFORMATION
Administration of elections
To conduct accurate, smooth, and well‐run elections
PROGRAM REVENUES AND EXPENDITURES
Slow election year only 1 small spring election and one upcoming special election for Unity school referendum
No issues. All went well and expected to continueA new web based program will go into effect by year‐end.
117
County Clerk

Program name:Program number:Program objective:
2014 Actual 2015 Budget 2016 Budget2017 Forward
Estimate2018 Forward
EstimateRevenueGeneral Property Tax 73,807 76,909 83,653 84,752 86,344Other Revenues 16,172 15,962 19,516 19,526 19,181 Total Revenue 89,979 92,871 103,169 104,277 105,525
Recurrent Expenditure 90,671 94,384 103,169 104,278 105,524 Capital/One‐time ExpenditureTotal Expenditure 90,671 94,384 103,169 104,278 105,524 Net Revenue and Expenditures (692) (1,513) ‐ (0) 0
Output indicators 2014 Actual 2015 Planned 2016 Planned 2017 Estimate 2018 EstimateNumber of regular County Board meetings held
11 11 11 11 11
Outcome indicators 2014 Actual 2015 Planned 2016 Planned 2017 Estimate 2018 EstimateFailure to give notice 0 0 0 0 0
06‐03Support services for the County Board
To coordinate communications between the county Board, departments and the public
PROGRAM REVENUES AND EXPENDITURES
PROGRAM PERFORMANCE INFORMATIONKEY PROGRAM STRATEGIES FOR 2015
To keep up with the ever evolving board and county committeestructure
KEY PROGRAM STRATEGIES 2016Continue to improve the working relationships between departments, the board and the residents of Polk County Improved technology and the new website should make that easier
KEY PERFORMANCE INDICATORS
Assumptions and factors affecting program performance:A change in Supervisor personnel, and chair persons can certainly affect the office as well as limited staff during really busy times canpossibly have a negative affect on our ability to provide our best service
Improve working relationships with county departmentsSupervisors and Polk County Residents
118
County Clerk

Program name:Program number:Program objective:
2014 Actual 2015 Budget 2016 Budget2017 Forward
Estimate2018 Forward
EstimateRevenueGeneral Property Tax 12,836 13,376 14,548 14,739 15,016Other Revenues 2,813 2,776 3,394 3,396 3,336 Total Revenue 15,648 16,152 17,942 18,135 18,352
Recurrent Expenditure 15,769 16,415 17,942 18,135 18,352 Capital/One‐time ExpenditureTotal Expenditure 15,769 16,415 17,942 18,135 18,352 Net Revenue and Expenditures (120) (263) ‐ (0) 0
Output indicators 2014 Actual 2015 Planned 2016 Planned 2017 Estimate 2018 EstimateNumber of tags sold 4750 4500 4600 4700 4800Outcome indicators 2014 Actual 2015 Planned 2016 Planned 2017 Estimate 2018 EstimateRevenue from sale of dog tags 18500 18000 18500 19000 20000
of the sale of dog tags and reporting to the stateKEY PROGRAM STRATEGIES 2016
Continue to work closely with the local municipalities to hopefully increase the numbers of licensed dogs KEY PERFORMANCE INDICATORS
Assumptions and factors affecting program performance:Numbers for dog collections have been somewhat lower in recent years and efforts are being made to bring the numbers back up as thedollars collected serve the county for rabies vaccinations, control of licensed dogs, provide funds for reimbursements for dog damages and provide much needed funds for the humane society.
and properly cared for in Polk County
06‐04Provide funding for state and local animal control efforts
PROGRAM REVENUES AND EXPENDITURES
PROGRAM PERFORMANCE INFORMATIONKEY PROGRAM STRATEGIES FOR 2015
work closely with the local treasurers to insure accurate accounting of the It should result in having more dogs vaccinated and
Dog licensing
119
County Clerk

Program name:Program number:Program objective:
2014 Actual 2015 Budget 2016 Budget2017 Forward
Estimate2018 Forward
EstimateRevenueGeneral Property Tax 28,881 30,095 32,734 33,164 33,787Other Revenues 6,328 6,246 7,637 7,640 7,505 Total Revenue 35,209 36,341 40,370 40,804 41,292
Recurrent Expenditure 35,480 36,933 40,370 40,804 41,292 Capital/One‐time ExpenditureTotal Expenditure 35,480 36,933 40,370 40,804 41,292 Net Revenue and Expenditures (271) (592) ‐ (0) 0
Output indicators 2014 Actual 2015 Planned 2016 Planned 2017 Estimate 2018 Estimatenumbers of passport applications processed thru our office
281 380 375 375 375
Outcome indicators 2014 Actual 2015 Planned 2016 Planned 2017 Estimate 2018 EstimateRevenue collected $7,025 $9,500 $9,375 $9,375 $9,375
for passportsKEY PROGRAM STRATEGIES 2016
continue to stay aware of changes and keep up the training necessary to be a qualified passport agent
KEY PERFORMANCE INDICATORS
Assumptions and factors affecting program performance:We have not encountered any risk involved in the issuing of passports. The service proves to be one that is well received and appreciated.
06‐05Passport agent
Provide rapid and convenient services to citizens
PROGRAM REVENUES AND EXPENDITURES
PROGRAM PERFORMANCE INFORMATIONKEY PROGRAM STRATEGIES FOR 2015
maintain the great level of service for those persons wishing to apply keep the errors to a minimum
120
County Clerk

Program name:Program number:Program objective:
2014 Actual 2015 Budget 2016 Budget2017 Forward
Estimate2018 Forward
EstimateRevenueGeneral Property Tax 28,881 30,095 32,734 33,164 33,787Other Revenues 6,328 6,246 7,637 7,640 7,505 Total Revenue 35,209 36,341 40,370 40,804 41,292
Recurrent Expenditure 35,480 36,933 40,370 40,804 41,292 Capital/One‐time ExpenditureTotal Expenditure 35,480 36,933 40,370 40,804 41,292 Net Revenue and Expenditures (271) (592) ‐ (0) 0
Output indicators 2014 Actual 2015 Planned 2016 Planned 2017 Estimate 2018 EstimateNumbers of title transfers and plate and tab purchases
722 690 700 675 675
Temp & TriVin Services combinedOutcome indicators 2014 Actual 2015 Planned 2016 Planned 2017 Estimate 2018 Estimaterevenue gained by providing services $2,920 $3,650 $3,500 $3,600 $3,700
plates for their vehicles
Assumptions and factors affecting program performance:
KEY PROGRAM STRATEGIES 2016We have been informed that the DOT will be offering some of the same services that we currently offer at some of their satellite offices, thiscould affect our numbers.
KEY PERFORMANCE INDICATORS
With on‐line services becoming more popular along with the increased services at DOT's, we may see a drop in volume of titles processed. Also, there is a risk of bouncing checks for payments in TriVin related transactions. All checks that originally bounced were collected promptly.
revenue to the office
06‐06Motor vehicle licensing agent
Provide rapid and convenient services to citizens
PROGRAM REVENUES AND EXPENDITURES
PROGRAM PERFORMANCE INFORMATIONKEY PROGRAM STRATEGIES FOR 2015
continue efficient accurate service for those persons needing titles & Our numbers remain steady and it brings in some
121
County Clerk

2014 Actual 2015 Budget 2016 Budget 2017 Forward Estimate 2018 Forward EstimateRevenueGeneral Property Tax 372,281 367,897 394,897 407,651 420,217 State Aids 69,054 68,343 65,791 65,791 65,791 Fine and Forfeitures 2,918 2,900 2,050 2,050 2,050 Public Charge for Services 35,170 31,065 36,455 36,455 36,455 Total Revenue 479,423 470,205 499,193 511,948 524,513
ExpensePersonnel Services 397,608 412,168 439,411 451,280 462,948 Contractual Services 19,201 22,468 23,680 24,035 24,396 Supplies & Expenses 32,582 34,569 35,303 35,833 36,370 Fixed Charges 1,612 1,000 800 800 800 Total Expenditures 451,003 470,205 499,194 511,948 524,514 Net Revenue and Expenditures 28,420 ‐ (0) ‐ (0)
2014 Actual 2015 Budget 2016 Budget 2017 Budget 2018 BudgetFTE EmployeesOfficials/Administrators 3.94 4 4 4 4Professionals 1 1 1 1 1Technicians/Para‐Professionals 2 2 2 2 2Total 6.94 7 7 7 7
Strategic Priorities:To serve and represent the public with integrity.
DEPARTMENT REVENUE AND EXPENDITURES BY ECONOMIC CLASSIFICATION
DISTRICT ATTORNEY AND VICTIM/WITNESS SERVICES Dan Steffen, District AttorneySECTION 1: DEPARTMENT SUMMARY
Department Description and Mission:This department prosecutes criminal, assists in the administration of justice, and delivers victim rights through two divisions: The District Attorney's Office and Victim/Witness Services.
MISSION: To administer justice while delivering high quality public service to all citizens in a ineffective, professional, and efficient manner.
Link to County Board Strategic Goals:To strengthen law enforcement's relations with the public; enhancing the quality of life for the citizens of Polk County. Ensure crime victims are treated with sensitivity, fairness, compassion, and respect.
EMPLOYMENT BY JOB CLASSIFICATION
122

2014 Actual 2015 Budget 2016 Budget 2017 Forward Estimate 2018 Forward EstimateDistrict Attorney Criminal Prosecution 181,070 187,439 207,384 212,540 217,679 District Attorney Criminal file recording and maintenance
131,687 136,320 150,825 154,574 158,312
District Attorney ‐ Payment Management 16,461 17,040 18,853 19,322 19,789 Victim/Witness Services 121,785 129,406 122,132 125,512 128,733 Total 451,003 470,205 499,194 511,948 524,514
PROGRAM SUMMARYPROGRAM EXPENDITURES
123
District Attorney

Program name:Program number:
Program objective:
2014 Actual 2015 Budget 2016 Budget 2017 Forward Estimate 2018 Forward EstimateRevenueGeneral Property Tax 170,130 168,759 186,206 191,362 196,501Other Revenues 20,948 18,681 21,178 21,178 21,178 Total Revenue 191,078 187,439 207,384 212,540 217,679
Recurrent Expenditure 181,070 187,439 207,384 212,540 217,679 Capital/One‐time ExpenditureTotal Expenditure 181,070 187,439 207,384 212,540 217,679 Net Revenue and Expenditures 10,008 ‐ (0) 0 ‐
Output indicators 2014 Actual 2015 Actual 2016 Planned 2017 Estimate 2018 EstimateNumber of Cases Referred 1,995 1,944 1,905 1,867 1,661(DA Case List Summary)
Outcome indicators 2014 Actual 2015 Actual 2016 Planned 2017 Estimate 2018 EstimateCourt Cases Assigned 1,963 1,737 1,545 1,376 1,225(DA Case List Summary)
SECTION 2: PROGRAM SUMMARY
05‐01District Attorney Criminal Prosecution
To work with local law enforcement agencies to ensure uniform enforcement of the criminal laws and the administration of justice throughout the county.
PROGRAM REVENUES AND EXPENDITURES
PROGRAM PERFORMANCE INFORMATIONKEY PROGRAM STRATEGIES FOR 2015
Advocate for Justice Center Security OfficerEstablish Drug Endangered Children ProgramImplement Diversion Program
Establish Mental Heath Court
Position starting January 2016Certified in July 2015First Class held in May 2015
Heroin TrainingLobby legislature for additional ADA position and pay progression for ADA'sDevelop and grow Intoxicated Driver Improvement Program (IDIP)
CHIPS cases transfer to Corporate CounselSafe Exchange Program through CCR
KEY PROGRAM STRATEGIES 2016
Transferred September 2015Began September 2015
KEY PERFORMANCE INDICATORS
Assumptions and factors affecting program performance:As caseloads continue to increase, major cases such as homicide make it nearly impossible to stay on top of day to day events. In addition, the legislature continues to create new crimes legislature continues to create new laws while refusing to adequately staff our offices or fund pay progression for ADA's.
124
District Attorney

Program name:Program number:
Program objective:
2014 Actual 2015 Budget 2016 Budget 2017 Forward Estimate 2018 Forward EstimateRevenueGeneral Property Tax 123,731 122,734 135,423 139,172 142,910Other Revenues 15,235 13,586 15,402 15,402 15,402 Total Revenue 138,966 136,320 150,825 154,574 158,312
Recurrent Expenditure 131,687 136,320 150,825 154,574 158,312 Capital/One‐time ExpenditureTotal Expenditure 131,687 136,320 150,825 154,574 158,312 Net Revenue and Expenditures 7,279 ‐ ‐ 0 ‐
Output indicators 2014 Actual 2015 Planned 2016 Planned 2017 Estimate 2018 EstimateCases Filed and Managed 1,960 2,029 2,069 2,111 2,153
Outcome indicators 2014 Actual 2015 Actual 2016 Planned 2017 Estimate 2018 EstimateCases Disposed 1,700 987 1,500 2,000 2,200
05‐02District Attorney Criminal file recording and maintenance
To deliver high quality service to all local law enforcement agencies, defense attorneys, and public citizens in an effective, professional, and efficient manner.
PROGRAM REVENUES AND EXPENDITURES
Cross train employees in DA Office. Staff trainings in Protect Webinar.Work with State IT to develop better ways Protect displays information for paperless counties.
KEY PROGRAM STRATEGIES 2016
PROGRAM PERFORMANCE INFORMATIONKEY PROGRAM STRATEGIES FOR 2015
Paperless DiscoveryLabeling documents in ProtectProcedure for Sentencing printouts
More timely E‐filing procedures with Sheriff Department.
Offered September 2015Uniform labeling as of February 2015Preparation of DOC‐31's before sentencing for judge's signature
KEY PERFORMANCE INDICATORS
Assumptions and factors affecting program performance:Response from Sheriff's Department will reflect in the proficiency of the DA Office preparing reports for DA review. We will boost employee moral and emphasize the importance of cross training to make their workday more interesting.Protect trainings will be emphasized more. Oral communication through these training to IT trainer what would benefit paperless Protect.
125
District Attorney

Program name:Program number:Program objective:
2014 Actual 2015 Budget 2016 Budget 2017 Forward Estimate 2018 Forward EstimateRevenueGeneral Property Tax 15,466 15,342 16,928 17,397 17,864Other Revenues 1,904 1,698 1,925 1,925 1,925 Total Revenue 17,371 17,040 18,853 19,322 19,789
Recurrent Expenditure 16,461 17,040 18,853 19,322 19,789 Capital/One‐time ExpenditureTotal Expenditure 16,461 17,040 18,853 19,322 19,789 Net Revenue and Expenditures 910 ‐ ‐ 0 ‐
Output indicators 2014 Actual 2015 Actual 2016 Planned 2017 Estimate 2018 EstimateFees collected 18,025 16,965 19,596 20,576 21,605 Surcharges collected 2,918 2,900 2,050 3,608 3,860
Outcome indicators 2014 Actual 2015 Actual 2016 Planned 2017 Estimate 2018 EstimateRestitution Paid through DA Office $88,973.86 $95,380.18 $92,000.00 $94,000.00 $96,500.00
05‐03District Attorney ‐ Payment Management
To track fees, restitution, and surcharges and send restitution to victims in a timely manner.
PROGRAM REVENUES AND EXPENDITURES
KEY PROGRAM STRATEGIES 2016
PROGRAM PERFORMANCE INFORMATIONKEY PROGRAM STRATEGIES FOR 2015
Track 10% surchargeNew billing form for discovery feesOrdering restitution for payout
Lobby legislature for restitution payable before DOC agent fees.
An account in QuickBooks tracksBilled and tracked through QuickBooksSpoke with judges on the wording of restitution in court
KEY PERFORMANCE INDICATORS
Assumptions and factors affecting program performance:Restitution will be based on restitution ordered and ability to pay. Surcharges based on restitution ordered.Fees collected are based on case discovery sent to defense attorneys.
126
District Attorney

Program name:Program number:Program objective:
2014 Actual 2015 Budget 2016 Budget 2017 Forward Estimate 2018 Forward EstimateRevenueGeneral Property Tax 62,954 61,063 56,340 59,721 62,942Other Revenues 69,054 68,343 65,791 65,791 65,791 Total Revenue 132,008 129,406 122,132 125,512 128,733
Recurrent Expenditure 121,785 129,406 122,132 125,512 128,733 Capital/One‐time ExpenditureTotal Expenditure 121,785 129,406 122,132 125,512 128,733 Net Revenue and Expenditures 10,223 ‐ ‐ ‐ ‐
Output indicators 2014 Actual 2015 Planned 2016 Planned 2017 Estimate 2018 EstimateIndividuals Assisted 869 912 958 1005 1056
Outcome indicators 2014 Actual 2015 Planned 2016 Planned 2017 Estimate 2018 EstimateRestitution Received through DA Office $89,540.72 $91,452.17 $93,281.22 $95,146.85 $97,049.79
05‐04Victim/Witness Services
Ensure each and every victim has the opportunity to exercise their rights.
PROGRAM REVENUES AND EXPENDITURES
PROGRAM PERFORMANCE INFORMATIONKEY PROGRAM STRATEGIES FOR 2015
Drug Endangered Children CertificationProcess to remit restitution more timelyPartnering with CRA
Do most victim notification via email instead of postal mail; update all forms and brochures; update and better victim witness room for more
Certified in July 2015Procedure implemented with COC and probation in Feb 2015Meetings scheduled bi‐weekly
KEY PERFORMANCE INDICATORS
Assumptions and factors affecting program performance:
comfort; training on Polk County programs (visit); train victims on Crime Victim Compensation and VineLink online
Update forms and brochures
KEY PROGRAM STRATEGIES 2016
Main forms updated
127
District Attorney
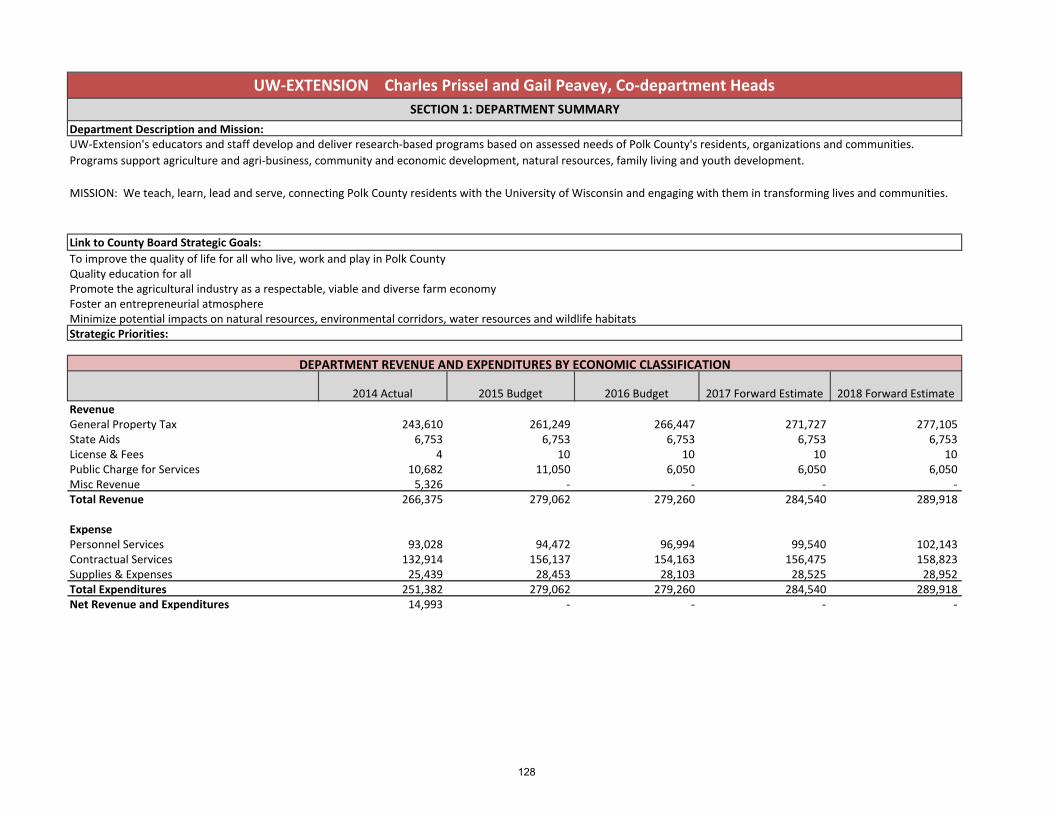
2014 Actual 2015 Budget 2016 Budget 2017 Forward Estimate 2018 Forward EstimateRevenueGeneral Property Tax 243,610 261,249 266,447 271,727 277,105 State Aids 6,753 6,753 6,753 6,753 6,753 License & Fees 4 10 10 10 10 Public Charge for Services 10,682 11,050 6,050 6,050 6,050 Misc Revenue 5,326 ‐ ‐ ‐ ‐ Total Revenue 266,375 279,062 279,260 284,540 289,918
ExpensePersonnel Services 93,028 94,472 96,994 99,540 102,143 Contractual Services 132,914 156,137 154,163 156,475 158,823 Supplies & Expenses 25,439 28,453 28,103 28,525 28,952 Total Expenditures 251,382 279,062 279,260 284,540 289,918 Net Revenue and Expenditures 14,993 ‐ ‐ ‐ ‐
Quality education for allPromote the agricultural industry as a respectable, viable and diverse farm economyFoster an entrepreneurial atmosphereMinimize potential impacts on natural resources, environmental corridors, water resources and wildlife habitatsStrategic Priorities:
UW‐EXTENSION Charles Prissel and Gail Peavey, Co‐department HeadsSECTION 1: DEPARTMENT SUMMARY
Department Description and Mission:UW‐Extension's educators and staff develop and deliver research‐based programs based on assessed needs of Polk County's residents, organizations and communities. Programs support agriculture and agri‐business, community and economic development, natural resources, family living and youth development.
MISSION: We teach, learn, lead and serve, connecting Polk County residents with the University of Wisconsin and engaging with them in transforming lives and communities.
Link to County Board Strategic Goals:To improve the quality of life for all who live, work and play in Polk County
DEPARTMENT REVENUE AND EXPENDITURES BY ECONOMIC CLASSIFICATION
128

2014 Actual 2015 Budget 2016 Budget 2017 Budget 2018 BudgetFTE Employees*Administrative Support 1.8 1.8 1.8 1.8 1.8Total 1.8 1.8 1.8 1.8 1.8
Program 2014 Actual 2015 Budget 2016 Budget 2017 Forward Estimate 2018 Forward EstimateFamily Living Programs 62,845 69,766 69,815 71,135 72,480 Community, Natural Resource and Economic Development Program
62,845 69,766 69,815 71,135 72,480
Agriculture and Natural Resources Education 62,845 69,766 69,815 71,135 72,480 4‐H Youth Development 62,845 69,766 69,815 71,135 72,480 Total 251,382 279,062 279,260 284,540 289,918
EMPLOYMENT BY JOB CLASSIFICATION
* UW Extension professional staff are contractual employees partially funded by the state
PROGRAM SUMMARYPROGRAM EXPENDITURES
129
UW Extension

Program name:Program number:
Program objective:
2014 Actual 2015 Budget 2016 Budget 2017 Forward Estimate 2018 Forward EstimateRevenueGeneral Property Tax 60,903 65,312 66,612 67,932 69,276 Other Revenues 5,691 4,453 3,203 3,203 3,203 Total Revenue 66,594 69,766 69,815 71,135 72,480
Recurrent Expenditure 62,845 69,766 69,815 71,135 72,480 Capital/One‐time ExpenditureTotal Expenditure 62,845 69,766 69,815 71,135 72,480 Net Revenue and Expenditures 3,748 ‐ ‐ ‐ ‐
Output indicators 2014 Actual 2015 Planned 2016 Planned 2017 Estimate 2018 EstimateMeasure attendance 138 140 140 140 140Outcome indicators 2014 Actual 2015 Planned 2016 Planned 2017 Estimate 2018 Estimate# coparents keep child out of middle 120 125 125 125 125Learn about end‐of‐life issues 0 100 100 100 100Increase # of parents utilizing eparent 0 500 500 500 500Increase networking among directors 80 150 150 150 150Reduce stress among caregivers 0 95 95 95 95
KEY PERFORMANCE INDICATORS
Assumptions and factors affecting program performance:Program performance dependent upon people in attendance and accessing programs. Evaluations will be conducted and results vary upon attendees.
KEY PROGRAM STRATEGIES 2016Promote programs to wider audiences and continue to improve quality of programmingDevelop 2 hour modules and facilitate monthly requested topics from Child Protection/Drug court to at‐risk audiences
KEY PROGRAM STRATEGIES FOR 2015Improve co‐parenting behaviors
Family Living Programs
PROGRAM REVENUES AND EXPENDITURES
PROGRAM PERFORMANCE INFORMATION
Create strong families that serve as the foundation for community life by enhancing family relationships, parenting, child development and financial management
SECTION 2: PROGRAM SUMMARY
21‐1
Increase knowledge about end‐of‐life issuesPromote eparenting blogs to adolescent parents through schoolsProvide education, support and networking to child care directorsHelp caregivers better care for loved one
93.23% (129 parents) stated co‐parenting class improved skills98% (68) of participants reported gaining knowledgeFour middle school administrators reported positive resultsArea child care directors valued monthly meetingsNine attended six week class reported improved care giving
130
UW Extension

Program name:Program number:
Program objective:
2014 Actual 2015 Budget 2016 Budget 2017 Forward Estimate 2018 Forward EstimateRevenueGeneral Property Tax 60,903 65,312 66,612 67,932 69,276 Other Revenues 5,691 4,453 3,203 3,203 3,203 Total Revenue 66,594 69,766 69,815 71,135 72,480
Recurrent Expenditure 62,845 69,766 69,815 71,135 72,480 Capital/One‐time ExpenditureTotal Expenditure 62,845 69,766 69,815 71,135 72,480 Net Revenue and Expenditures 3,748 ‐ ‐ ‐ ‐
Output indicators 2014 Actual 2015 Planned 2016 Planned 2017 Estimate 2018 Estimate# Leadership program participants N/A N/A 50 50 50# Organizations assisted N/A N/A 10 10 10# Business education participants N/A N/A 20 20 20# Workshops/programs provided N/A N/A 24 24 24Outcome indicators 2014 Actual 2015 Planned 2016 Planned 2017 Estimate 2018 EstimatePeople learn and use leadership skills N/A N/A 50 50 50Organizations equipped for future N/A N/A 10 10 10Elected officials participate in planning N/A N/A 20 20 20People plan for business development N/A N/A 10 10 10
21‐2
KEY PROGRAM STRATEGIES 2016
PROGRAM PERFORMANCE INFORMATIONKEY PROGRAM STRATEGIES FOR 2015
Economic development educationHire and onboard a new CNRED educator
Community, Natural Resource and Economic Development Program
Engage citizens in improving Polk County communities through leadership training, organizational development, and economic and natural resources education.
PROGRAM REVENUES AND EXPENDITURES
Information provided through web and print mediaEducator started in position on Sept. 1
KEY PERFORMANCE INDICATORS
Assumptions and factors affecting program performance:Factor affecting performance: Position was vacant from Jan. 1 to Sept. 1, 2015
Develop and deliver leadership training opportunitiesProvide economic development education opportunitiesDevelop and deliver organizational development education and servicesFacilitate strategic planning process for Polk County Board of Supervisors
131
UW Extension

Program name:Program number:
Program objective:
2014 Actual 2015 Budget 2016 Budget 2017 Forward Estimate 2018 Forward EstimateRevenueGeneral Property Tax 60,903 65,312 66,612 67,932 69,276 Other Revenues 5,691 4,453 3,203 3,203 3,203 Total Revenue 66,594 69,766 69,815 71,135 72,480
Recurrent Expenditure 62,845 69,766 69,815 71,135 72,480 Capital/One‐time ExpenditureTotal Expenditure 62,845 69,766 69,815 71,135 72,480 Net Revenue and Expenditures 3,748 ‐ ‐ ‐ ‐
Output indicators 2014 Actual 2015 Planned 2016 Planned 2017 Estimate 2018 Estimate#Master Gardeners volunteering N/A 27 27 30 35#Pesticide Applicators Trained N/A 30 30 30 30Outcome indicators 2014 Actual 2015 Planned 2016 Planned 2017 Estimate 2018 EstimateEstimated volunteer hours of Master Gardeners N/A 972 972 1,080 1,080
Educational contacts with agribusiness N/A N/A 200 300 300
21‐03Agriculture and Natural Resources Education
Increase the profitability and viability of Polk County farms and agricultural enterprises, while educating consumers and protecting the environment.
PROGRAM REVENUES AND EXPENDITURES
Provide agriculture education and programming on select topics.
DHIA Scholarships will be offered to youth to further Ag educationKEY PROGRAM STRATEGIES 2016
PROGRAM PERFORMANCE INFORMATIONKEY PROGRAM STRATEGIES FOR 2015
Hire an Agriculture Educator for Polk CountyMaster Gardener Volunteers will provide education and be a resource for Polk County Residents.Working with area Ag Educators, producers will have access to training and resources
Provide resources and educational assistance as requested by Polk County agribusinesses.
Failed search‐ hiring an .40 FTE to provide base level services during Provided training for eleven new membersPesticide Applicator Training provided to producersEleven scholarships awarded
KEY PERFORMANCE INDICATORS
Assumptions and factors affecting program performance:From September 2014‐present there has not been an Ag Educator, and minimal services were provided through surrounding county ag educators.
132
UW Extension

Program name:Program number:
Program objective:
2014 Actual 2015 Budget 2016 Budget 2017 Forward Estimate 2018 Forward EstimateRevenueGeneral Property Tax 60,903 65,312 66,612 67,932 69,276 Other Revenues 5,691 4,453 3,203 3,203 3,203 Total Revenue 66,594 69,766 69,815 71,135 72,480
Recurrent Expenditure 62,845 69,766 69,815 71,135 72,480 Capital/One‐time ExpenditureTotal Expenditure 62,845 69,766 69,815 71,135 72,480 Net Revenue and Expenditures 3,748 ‐ ‐ ‐ ‐
Output indicators 2014 Actual 2015 Planned 2016 Planned 2017 Estimate 2018 Estimate#4‐H Community Clubs 23 24 23 23 23#4‐H membership 630 663 675 695 705#Adult Volunteers 275 281 285 287 290#Project enrollment 3,200 3,185 3,150 3,150 3,150Outcome indicators 2014 Actual 2015 Planned 2016 Planned 2017 Estimate 2018 EstimateIncreased work force preparedness skills 500 500 500 510 520Increased Leadership and citizenship skills 275 275 275 300 300Participants in educational workshops and trips 350 350 350 370 370
Earned post‐secondary scholarship awards 15 15 15 15 15
PROGRAM REVENUES AND EXPENDITURES
21‐044‐H Youth Development
To teach youth life and work force preparedness skill in a non‐formal educational environment working cooperatively with a core of trained adult volunteers.
KEY PERFORMANCE INDICATORS
Annual Volunteer Training for continuing volunteers focused on improving 4‐H Community ClubService Learning opportunities for 4‐H Ambassadors ‐ Teen public relations corpScience Saturday and other youth STEM focused programs including Robotics workshops to train adult and teen volunteers
STEM; Science Technology Engineering and applied Math experiences‐ youth participantsKEY PROGRAM STRATEGIES 2016
PROGRAM PERFORMANCE INFORMATIONKEY PROGRAM STRATEGIES FOR 2015
4‐H Community Club will be vehicle for educational programsPartner with schools to enhance educational opportunities for youthVolunteers will maximize educational experiences for youth
663 4‐H Youth enrolled in 3,185 projects, trips and events475 non‐4‐H youth participated in educational experiences281 trained volunteers taught and mentored 4‐H youth265 youth participants
133
UW Extension

2014 Actual 2015 Budget 2016 Budget 2017 Forward Estimate 2018 Forward EstimateRevenueGeneral Property Tax 385,417 364,596 383,737 394,983 405,669 Public Charge for Services 940 1,600 800 ‐ ‐ Intergovernmental Revenue 5,997,204 6,511,727 6,076,760 6,076,760 6,076,760 Misc Revenue 363,051 387,076 384,075 384,075 384,075 Other Financing Sources 21,677 26,824 21,677 21,677 21,677 Total Revenue 6,768,289 7,291,823 6,867,048 6,877,495 6,888,180
ExpensePersonnel Services 302,484 355,626 368,972 378,860 388,978 Contractual Services 24,613 29,078 69,267 69,706 70,152 Supplies & Expenses 6,376 8,038 7,975 8,095 8,216 Fixed Charges 5,157,245 6,899,081 6,420,834 6,420,834 6,420,834 Grants, Contributions, Indem 39 ‐ ‐ ‐ ‐ Total Expenditures 5,490,757 7,291,823 6,867,048 6,877,495 6,888,180 Net Revenue and Expenditures 1,277,532 ‐ (0) ‐ ‐
Strategic Priorities:Align the County's position and compensation structure to provide for clear career progression opportunities and fair and equitable compensationExpansion of Wellness Program to promote enhanced wellness options and improve the overall health of County employees.Promote personal development through provision of continuing education to employees and management in performance, technical skills and other related areas
EMPLOYEE RELATIONS DEPARTMENT Andrea Jerrick, DirectorSECTION 1: DEPARTMENT SUMMARY
Department Description and Mission:The Employee Relations Department performs the personnel administrative functions for the County in the areas of employment, recruitment, and position development, labor relations, employee safety and wellness, compensation and benefit program administration, employee performance program administration, training and development, and assistance in policy development and implementation.Link to County Board Strategic Goals:To serve the public with integrity
DEPARTMENT REVENUE AND EXPENDITURES BY ECONOMIC CLASSIFICATION
134
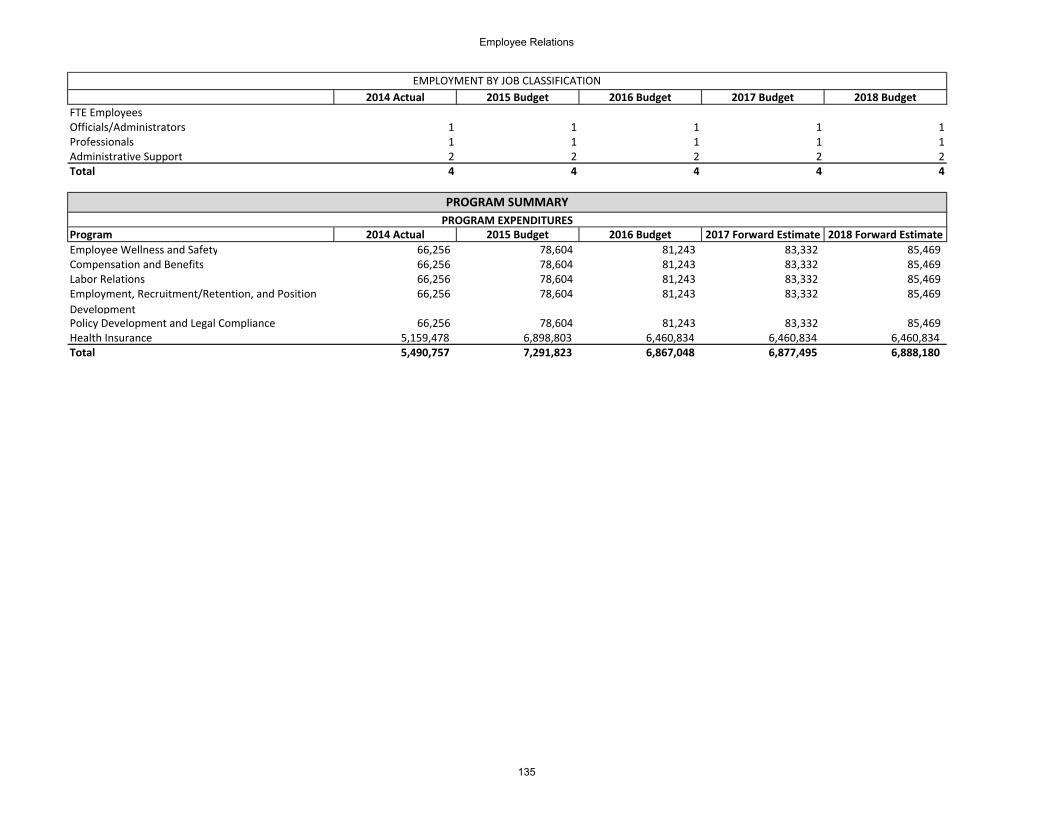
2014 Actual 2015 Budget 2016 Budget 2017 Budget 2018 BudgetFTE EmployeesOfficials/Administrators 1 1 1 1 1Professionals 1 1 1 1 1Administrative Support 2 2 2 2 2Total 4 4 4 4 4
Program 2014 Actual 2015 Budget 2016 Budget 2017 Forward Estimate 2018 Forward EstimateEmployee Wellness and Safety 66,256 78,604 81,243 83,332 85,469 Compensation and Benefits 66,256 78,604 81,243 83,332 85,469 Labor Relations 66,256 78,604 81,243 83,332 85,469 Employment, Recruitment/Retention, and Position Development
66,256 78,604 81,243 83,332 85,469
Policy Development and Legal Compliance 66,256 78,604 81,243 83,332 85,469 Health Insurance 5,159,478 6,898,803 6,460,834 6,460,834 6,460,834 Total 5,490,757 7,291,823 6,867,048 6,877,495 6,888,180
EMPLOYMENT BY JOB CLASSIFICATION
PROGRAM SUMMARYPROGRAM EXPENDITURES
135
Employee Relations

Program name:Program number:
Program objective:
2014 Actual 2015 Budget 2016 Budget 2017 Forward Estimate 2018 Forward EstimateRevenueGeneral Property Tax 73,083 72,919 76,747 78,997 81,134Other Revenues 4,523 5,685 4,495 4,335 4,335 Total Revenue 77,607 78,604 81,243 83,332 85,469
Recurrent Expenditure 66,256 78,604 81,243 83,332 85,469 Capital/One‐time ExpenditureTotal Expenditure 66,256 78,604 81,243 83,332 85,469 Net Revenue and Expenditures 11,351 ‐ 0 ‐ ‐
Output indicators 2014 Actual 2015 Planned 2016 Planned 2017 Estimate 2018 EstimateNumber of wellness engagement options offered 12 15 20 20 20Percent participation in online wellness tracking system
N/A 0.6 0.7 0.75 0.8
Number of reportable work comp incidentsOutcome indicators 2014 Actual 2015 Planned 2016 Planned 2017 Estimate 2018 EstimateReduced absenteeism (year/year) ‐1% ‐1% ‐1% ‐1% ‐1%Health insurance cost increasing less than industry standard
‐1% ‐1% ‐1% ‐1% ‐2%
Workers Comp Mod Factor Rating 0.69 0.67 0.67 0.67 0.67
SECTION 2: PROGRAM SUMMARY
34‐01Employee Wellness and Safety
Ensure the health and safety of employees by providing them with the knowledge and awareness necessary to promote personal wellbeing in the workplace and beyond.
PROGRAM REVENUES AND EXPENDITURES
KEY PROGRAM STRATEGIES 2016
PROGRAM PERFORMANCE INFORMATIONKEY PROGRAM STRATEGIES FOR 2015 ACTUAL RESULTS
Creation of strategic plan for wellness initiativesOffer increased wellness program activity options for employeesImplementation of formal wellness measurement program for employees
Vary type and number of wellness activity options provided to employees
KEY PERFORMANCE INDICATORS
Assumptions and factors affecting program performance:Factors such as personal and family health issues, management/employee relations, workplace safety at the department level and other workplace issues do not counteract positive effects of the safety and wellness programs.
Increase engagement and participation in formal online wellness tracking system
Basic plan outline completedIncreased number of program activity options providedCountywide implementation of formal online tracking program through
136
Employee Relations

Program name:Program number:Program objective:
2014 Actual 2015 Budget 2016 Budget 2017 Forward Estimate 2018 Forward EstimateRevenueGeneral Property Tax 73,083 72,919 76,747 78,997 81,134Other Revenues 4,523 5,685 4,495 4,335 4,335 Total Revenue 77,607 78,604 81,243 83,332 85,469
Recurrent Expenditure 66,256 78,604 81,243 83,332 85,469 Capital/One‐time ExpenditureTotal Expenditure 66,256 78,604 81,243 83,332 85,469 Net Revenue and Expenditures 11,351 ‐ ‐ ‐ ‐
Output indicators 2014 Actual 2015 Planned 2016 Planned 2017 Estimate 2018 EstimateTotal rewards visible to all current employees 80% 100% 100% 100% 100%Total rewards promoted and visible to all potential employment candidates
65% 100% 100% 100% 100%
Outcome indicators 2014 Actual 2015 Planned 2016 Planned 2017 Estimate 2018 EstimateEmployee satisfaction with compensation and benefits package
N/A 85% 90% 90% 90%
34‐02Compensation and Benefits
Leverage the County's total rewards package to attract and retain highly qualified employees.
PROGRAM REVENUES AND EXPENDITURES
PROGRAM PERFORMANCE INFORMATIONKEY PROGRAM STRATEGIES FOR 2015 ACTUAL RESULTS
Visibility of total rewards system for both potential and current employeesIncreased flexibility of total rewards system
Educate employees and managers on total rewards program options and the relation of the program to their daily work.KEY PROGRAM STRATEGIES 2016
KEY PERFORMANCE INDICATORS
Assumptions and factors affecting program performance:Resources available to support total rewards program.
Electronic access to all aspects of employee benefit programIntroduced two new levels of health insurance for employees
137
Employee Relations

Program name:Program number:
Program objective:
2014 Actual 2015 Budget 2016 Budget 2017 Forward Estimate 2018 Forward EstimateRevenueGeneral Property Tax 73,083 72,919 76,747 78,997 81,134Other Revenues 4,523 5,685 4,495 4,335 4,335 Total Revenue 77,607 78,604 81,243 83,332 85,469
Recurrent Expenditure 66,256 78,604 81,243 83,332 85,469 Capital/One‐time ExpenditureTotal Expenditure 66,256 78,604 81,243 83,332 85,469 Net Revenue and Expenditures 11,351 ‐ ‐ ‐ ‐
Output indicators 2014 Actual 2015 Planned 2016 Planned 2017 Estimate 2018 EstimateNumber of disputes requiring ER intervention 3 2 2 2 2Number of conflict‐related trainings provided to employees and management
2 3 4 4 4
Outcome indicators 2014 Actual 2015 Planned 2016 Planned 2017 Estimate 2018 EstimateConflict resulting in employment hearing under the County's workplace safety and discipline appeals policy
0% 0% 0% 0% 0%
Employees terminated for disciplinary reasons 1 0 0 0 0
34‐03Labor Relations
Maintaining and improving employee relationships through communication and facilitation of labor dispute resolution.
PROGRAM REVENUES AND EXPENDITURES
PROGRAM PERFORMANCE INFORMATIONKEY PROGRAM STRATEGIES FOR 2015 ACTUAL RESULTS
Resolving labor‐related disputes concerning employees at the employee levelEmployee and manager training in coaching and conflict resolution
Continued education related to coaching and employee development including focus on conflict resolution.KEY PROGRAM STRATEGIES 2016
KEY PERFORMANCE INDICATORS
Assumptions and factors affecting program performance:Ability of managers to effectively coach employees in performance‐related issues.Employee's coach ability and receipt of redirection.
Less than 5 issues required ER staff interventionMultiple trainings conducted
138
Employee Relations

Program name:Program number:
Program objective:
2014 Actual 2015 Budget 2016 Budget 2017 Forward Estimate 2018 Forward EstimateRevenueGeneral Property Tax 73,083 72,919 76,747 78,997 81,134Other Revenues 4,523 5,685 4,495 4,335 4,335 Total Revenue 77,607 78,604 81,243 83,332 85,469
Recurrent Expenditure 66,256 78,604 81,243 83,332 85,469 Capital/One‐time ExpenditureTotal Expenditure 66,256 78,604 81,243 83,332 85,469 Net Revenue and Expenditures 11,351 ‐ ‐ ‐ ‐
Output indicators 2014 Actual 2015 Planned 2016 Planned 2017 Estimate 2018 EstimatePositions filled utilizing behavioral interviewing format
55% 90% 100% 100% 100%
Position descriptions revised to align with career progression structure and reflecting competency format
5% 15% 75% 90% 100%
Outcome indicators 2014 Actual 2015 Planned 2016 Planned 2017 Estimate 2018 EstimateNew hire retention rate (New hires still employed after 1 year of service)
78% 85% 90% 90% 90%
KEY PROGRAM STRATEGIES 2016
PROGRAM PERFORMANCE INFORMATIONKEY PROGRAM STRATEGIES FOR 2015
34‐04Employment, Recruitment/Retention, and Position Development
Recruit, retain and develop high quality employees through strategic position development, succession planning and career planning initiatives.
PROGRAM REVENUES AND EXPENDITURES
Identify key competencies for each position during vacancy/recruitment
Scope behavioral interview questions for each interview process
Develop clear career path opportunities through identification and alignment of like jobs and job characteristics throughout the organizationKEY PERFORMANCE INDICATORS
Managers coaching current staff towards promotional opportunities.Assumptions and factors affecting program performance:
Each vacant position description revised to include job competencies
Majority of interviews conducted under behavioral interviewing format
139
Employee Relations

Program name:Program number:
Program objective:
2014 Actual 2015 Budget 2016 Budget 2017 Forward Estimate 2018 Forward EstimateRevenueGeneral Property Tax 73,083 72,919 76,747 78,997 81,134Other Revenues 4,523 5,685 4,495 4,335 4,335 Total Revenue 77,607 78,604 81,243 83,332 85,469
Recurrent Expenditure 66,256 78,604 81,243 83,332 85,469 Capital/One‐time ExpenditureTotal Expenditure 66,256 78,604 81,243 83,332 85,469 Net Revenue and Expenditures 11,351 ‐ ‐ ‐ ‐
Output indicators 2014 Actual 2015 Planned 2016 Planned 2017 Estimate 2018 EstimateCompletion of updates 100% 100% 100% 100% 100%Trainings conducted for employees on policy‐specific issues
2 2 3 4 4
Outcome indicators 2014 Actual 2015 Planned 2016 Planned 2017 Estimate 2018 EstimateChallenges of County's workplace rules and regulations
0% 0% 0% 0% 0%
KEY PROGRAM STRATEGIES FOR 2015 ACTUAL RESULTS
KEY PROGRAM STRATEGIES 2016
Assumptions and factors affecting program performance:
34‐05Policy Development and Legal Compliance
Ensure workplace employment‐related policies and procedures are in compliance with local, state and federal laws and guidelines and communicated to all employees.
PROGRAM REVENUES AND EXPENDITURES
Update handbook and recommend supporting policy changes to comply with Affordable Care Act Ensure policies and procedures are accessible to all employees
Update handbook with 2015‐2016 County‐wide codification of personnel policies.Provide training on changes and refresher for all employees.
KEY PERFORMANCE INDICATORS
PROGRAM PERFORMANCE INFORMATION
Employee's initiative to know and understand workplace policies and procedures.Management enforcement of workplace policies and procedures.
Handbook updated to comply with ACAHandbook and policies accessible through employee's personal County worksite portal
140
Employee Relations
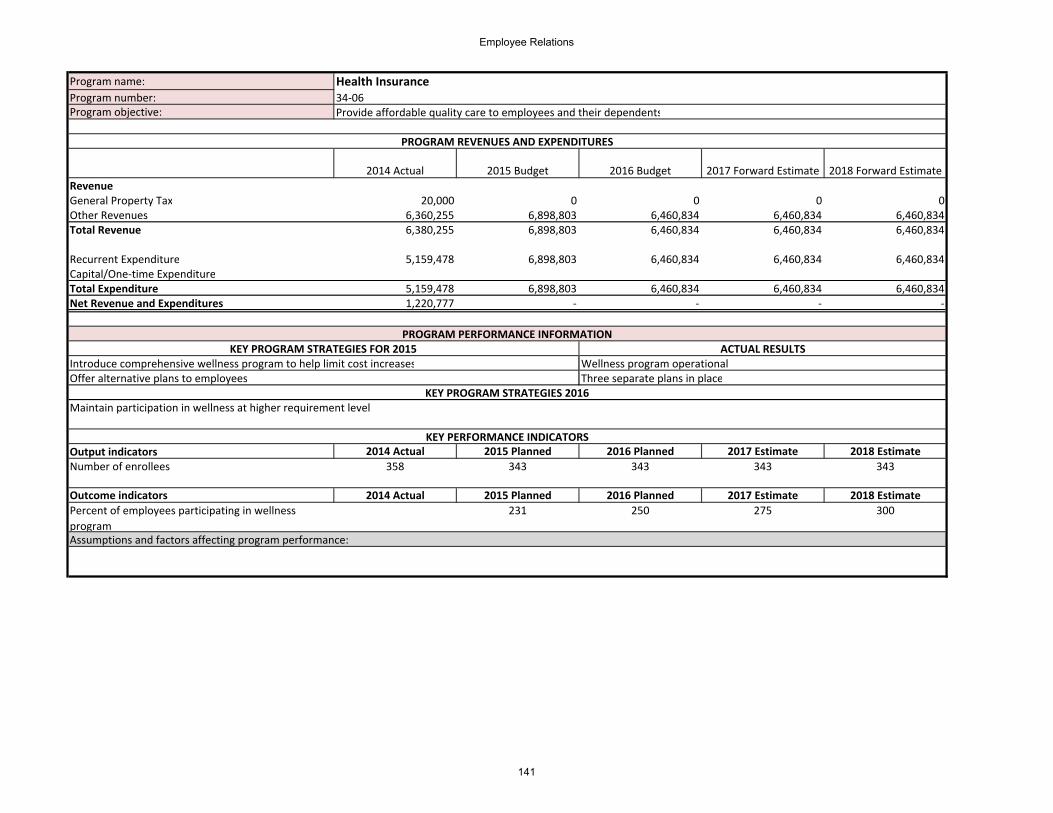
Program name:Program number:Program objective:
2014 Actual 2015 Budget 2016 Budget 2017 Forward Estimate 2018 Forward EstimateRevenueGeneral Property Tax 20,000 0 0 0 0Other Revenues 6,360,255 6,898,803 6,460,834 6,460,834 6,460,834 Total Revenue 6,380,255 6,898,803 6,460,834 6,460,834 6,460,834
Recurrent Expenditure 5,159,478 6,898,803 6,460,834 6,460,834 6,460,834 Capital/One‐time ExpenditureTotal Expenditure 5,159,478 6,898,803 6,460,834 6,460,834 6,460,834 Net Revenue and Expenditures 1,220,777 ‐ ‐ ‐ ‐
Output indicators 2014 Actual 2015 Planned 2016 Planned 2017 Estimate 2018 EstimateNumber of enrollees 358 343 343 343 343
Outcome indicators 2014 Actual 2015 Planned 2016 Planned 2017 Estimate 2018 EstimatePercent of employees participating in wellness program
231 250 275 300
Maintain participation in wellness at higher requirement level
Health Insurance34‐06Provide affordable quality care to employees and their dependents
PROGRAM REVENUES AND EXPENDITURES
KEY PERFORMANCE INDICATORS
Assumptions and factors affecting program performance:
Wellness program operationalThree separate plans in place
PROGRAM PERFORMANCE INFORMATIONKEY PROGRAM STRATEGIES FOR 2015 ACTUAL RESULTS
Introduce comprehensive wellness program to help limit cost increasesOffer alternative plans to employees
KEY PROGRAM STRATEGIES 2016
141
Employee Relations

2014 Actual 2015 Budget 2016 Budget2017 Forward
Estimate2018 Forward
EstimateRevenuePublic Charge for Services 7,996,110 8,164,924 8,236,720 8,362,136 8,362,852 Total Revenue 7,996,110 8,164,924 8,236,720 8,362,136 8,362,852
ExpenseOperating Expenses 1,852,802 1,844,631 1,751,571 1,860,596 1,860,596 Personnel Services 6,053,679 5,974,407 6,054,977 6,054,977 6,054,977 Contractual Services 12,875 57,240 44,240 44,904 45,577 Supplies & Expenses 2,822 4,500 2,823 2,865 2,908 Fixed Charges 43,119 40,608 43,117 43,117 43,117 Capital Outlay ‐ 200,000 200,000 200,000 200,000 Cost Reallocation 21,677 21,677 130,682 155,677 155,677 Total Expenditures 7,986,975 8,143,063 8,227,410 8,362,136 8,362,852 Net Revenue and Expenditures 9,136 21,861 9,310 0 (0)
GOLDEN AGE MANOR Dana Reese, AdministratorSECTION 1: DEPARTMENT SUMMARY
Department Description and Mission:Golden Age Manor is proud to provide long term care and short term rehabilitation to residents of Polk County and surrounding areas. Beyond offering skilled nursing care, in house physical, occupational and speech therapies are also available. Golden Age Manor has 114 beds, 17 of which have been designated to a special secured Alzheimer's care unit known as Judy's cottage. All 114 beds are Medicaid and Medicare certified.
MISSION: Provide high quality long term care and short term rehabilitation services to residents of Polk County and surrounding areas utilizing a team approach. We strive to care for each of our residents in a professional, compassionate and supportive manner while promoting the highest quality of life and individualized personal care.Link to County Board Strategic Goals:To improve the quality of life for all who live, work, and play in Polk County
Strategic Priorities:To provide high quality long term and short term care to residents of Polk County and surrounding areas.
DEPARTMENT REVENUE AND EXPENDITURES BY ECONOMIC CLASSIFICATION
142

2014 Actual 2015 Budget 2016 Budget 2017 Budget 2018 BudgetFTE EmployeesOfficials/Administrators 1 1 1 1 1Professionals 9 9 9 9 9Technicians/Para‐Professionals 21.6 21.6 21.6 21.6 21.6Administrative Support 4 4.2 4.2 4.2 4.2Skilled Craft/Service Maintenance 74.05 74.05 74.05 74.05 74.05Total 109.65 109.85 109.85 109.85 109.85
Program 2014 Actual 2015 Budget 2016 Budget2017 Forward
Estimate2018 Forward
EstimateLong term care 5,191,534 5,292,991 5,347,817 5,435,388 5,435,854 Short term rehabilitation‐Medicare Part A 1,597,395 1,628,613 1,645,482 1,672,427 1,672,570 Dementia care 1,198,046 1,221,459 1,234,112 1,254,320 1,254,428 Total 7,986,975 8,143,063 8,227,410 8,362,136 8,362,852
EMPLOYMENT BY JOB CLASSIFICATION
PROGRAM SUMMARYPROGRAM EXPENDITURES
143
Golden Age Manor

Program name:Program number:Program objective:
2014 Actual 2015 Budget 2016 Budget2017 Forward
Estimate2018 Forward
EstimateRevenueGeneral Property Tax 0 0 0 0 0Other Revenues 5,197,472 5,307,201 5,353,868 5,435,388 5,435,854 Total Revenue 5,197,472 5,307,201 5,353,868 5,435,388 5,435,854
Recurrent Expenditure 5,191,534 5,292,991 5,347,817 5,435,388 5,435,854 Capital/One‐time ExpenditureTotal Expenditure 5,191,534 5,292,991 5,347,817 5,435,388 5,435,854 Net Revenue and Expenditures 5,938 14,210 6,052 0 (0)
Output indicators 2014 Actual 2015 Planned 2016 Planned 2017 Estimate 2018 EstimateCensus 93.70% 92% 92% 92% 92%
Outcome indicators 2014 Actual 2015 Planned 2016 Planned 2017 Estimate 2018 EstimateCensus 93.70% 92% 92% 92% 92%
PROGRAM REVENUES AND EXPENDITURES
SECTION 2: PROGRAM SUMMARY
15‐01Long term care
To provide high quality care to persons needing long term skilled nursing care.
PROGRAM PERFORMANCE INFORMATIONKEY PROGRAM STRATEGIES FOR 2015
To achieve census above 92% Tracking to meet this goal
Continue to improve by utilizing our quality assurance committee and tools that are available through the state of Wisconsin. KEY PROGRAM STRATEGIES 2016
KEY PERFORMANCE INDICATORS
Assumptions and factors affecting program performance:
144
Golden Age Manor
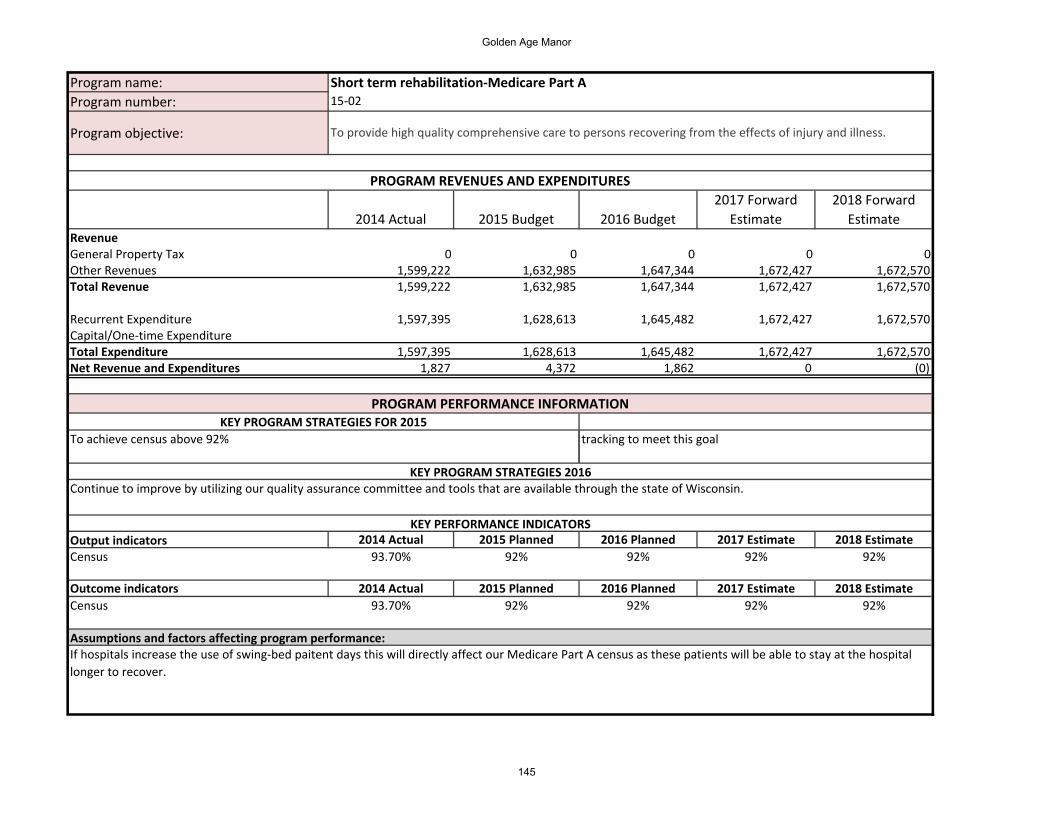
Program name:Program number:
Program objective:
2014 Actual 2015 Budget 2016 Budget2017 Forward
Estimate2018 Forward
EstimateRevenueGeneral Property Tax 0 0 0 0 0Other Revenues 1,599,222 1,632,985 1,647,344 1,672,427 1,672,570 Total Revenue 1,599,222 1,632,985 1,647,344 1,672,427 1,672,570
Recurrent Expenditure 1,597,395 1,628,613 1,645,482 1,672,427 1,672,570 Capital/One‐time ExpenditureTotal Expenditure 1,597,395 1,628,613 1,645,482 1,672,427 1,672,570 Net Revenue and Expenditures 1,827 4,372 1,862 0 (0)
Output indicators 2014 Actual 2015 Planned 2016 Planned 2017 Estimate 2018 EstimateCensus 93.70% 92% 92% 92% 92%
Outcome indicators 2014 Actual 2015 Planned 2016 Planned 2017 Estimate 2018 EstimateCensus 93.70% 92% 92% 92% 92%
PROGRAM PERFORMANCE INFORMATIONKEY PROGRAM STRATEGIES FOR 2015
PROGRAM REVENUES AND EXPENDITURES
15‐02Short term rehabilitation‐Medicare Part A
To provide high quality comprehensive care to persons recovering from the effects of injury and illness.
To achieve census above 92%
Continue to improve by utilizing our quality assurance committee and tools that are available through the state of Wisconsin.
tracking to meet this goal
KEY PROGRAM STRATEGIES 2016
KEY PERFORMANCE INDICATORS
Assumptions and factors affecting program performance:If hospitals increase the use of swing‐bed paitent days this will directly affect our Medicare Part A census as these patients will be able to stay at the hospital longer to recover.
145
Golden Age Manor

Program name:Program number:Program objective:
2014 Actual 2015 Budget 2016 Budget2017 Forward
Estimate2018 Forward
EstimateRevenueGeneral Property Tax 0 0 0 0 0Other Revenues 1,199,417 1,224,739 1,235,508 1,254,320 1,254,428 Total Revenue 1,199,417 1,224,739 1,235,508 1,254,320 1,254,428
Recurrent Expenditure 1,198,046 1,221,459 1,234,112 1,254,320 1,254,428 Capital/One‐time ExpenditureTotal Expenditure 1,198,046 1,221,459 1,234,112 1,254,320 1,254,428 Net Revenue and Expenditures 1,370 3,279 1,397 0 (0)
Output indicators 2014 Actual 2015 Planned 2016 Planned 2017 Estimate 2018 EstimateCensus 93.70% 92% 92% 92% 92%
Outcome indicators 2014 Actual 2015 Planned 2016 Planned 2017 Estimate 2018 Estimatecensus 93.70% 92% 92% 92% 92%
PROGRAM REVENUES AND EXPENDITURES
15‐03Dementia care
To provide safe and secure quality care to persons needing memory care and nursing care.
PROGRAM PERFORMANCE INFORMATIONKEY PROGRAM STRATEGIES FOR 2015
To achieve census above 92% Tracking to meet this goal.
KEY PERFORMANCE INDICATORS
Assumptions and factors affecting program performance:
Continue to improve by utilizing our quality assurance committee and tools that are available through the state of Wisconsin. KEY PROGRAM STRATEGIES 2016
146
Golden Age Manor

Logical Frameworks, Golden Age Manor Programs Long Term Care ($5.3 million in expenditures)
Narrative summary Performance Indicators Monitoring & Evaluation Assumptions/Risk
Impact Improved quality of life for residents and families
Occupancy rate Internal records
Results Residents are comfortable, engaged and those able to return to independent living do so
Resident satisfaction survey Internal records Families and residents understand and are accepting of circumstances
Outputs Quality care in a safe and comfortable environment
Number and severity of any State survey citations
State of Wisconsin Department of Health Services
No significant external disruptive events such as a disease outbreak
Activities 1. Appropriate nursing care provided
2. Social assistance to residents and families
3. Activities for residents
4. Quality meals provided
1. Hours of care per patient meet standards
2. Regular care meetings held with families and with residents
3. Quantity and quality of activities provided
4. Meals meeting standards
Internal records Standards are appropriate; families and residents participate in activities, care meetings, and residents eat regular meals
Rehabilitation ($1.6 million in expenditures)
Narrative summary Performance Indicators Monitoring & Evaluation Assumptions/Risk Impact An improved quality of life for
participants Short term readmission rate Hospital and internal records
Results Participants are able to return to independent living
Release percentage Internal records Adequate transitional housing opportunities are available
Outputs Effective rehabilitation services are provided to participants
Number of patient days Internal records Participants respond to rehabilitation and therapy; no significant external events
Activities 1. Rehabilitation and therapyprograms
2. Nursing care provided 3. Social assistance to residents 4. Activities for residents 5. Quality meals provided
1. Hours of rehabilitation or therapy per week
2. – 5. See measures above
Internal records Rehabilitation and therapy programs are appropriate; participants are fully engaged
147
Golden Age Manor

Dementia Care ($1.2 million in expenditures)
Narrative summary Performance Indicators Monitoring & Evaluation Assumptions/Risk Impact An improved quality of life for
participants Survey of families and visitors Internal records
Results Residents are healthy, safe and comfortable
Accident rate for residents Internal records Families and residents understand and are accepting of the circumstances
Outputs Quality care in a safe and comfortable environment
Number and severity of any State survey citations
State of Wisconsin Department of Health Services
No significant external disruptive events such as a disease outbreak
Activities 1. Nursing care 2. Provision of dietary 3. Maintain equipment 1. Dietary
See measures above Internal records Standards are appropriate; families and residents participate in activities, care meetings, and residents eat regular meals
148
Golden Age Manor
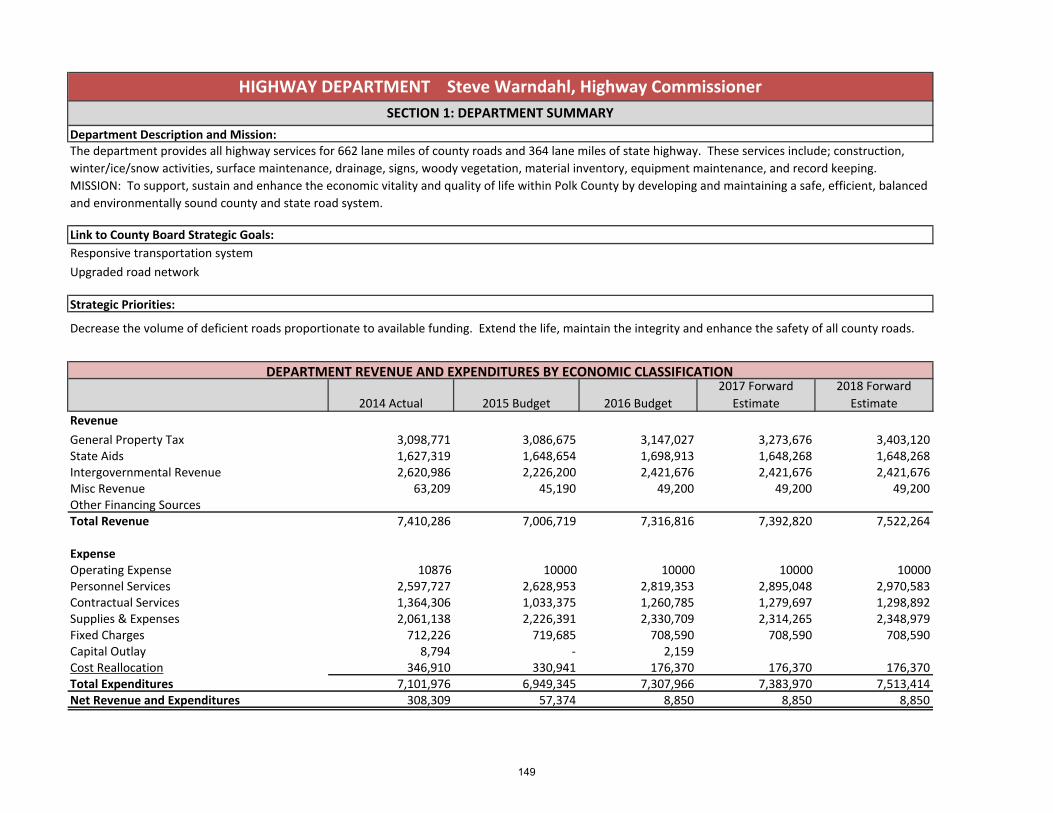
2014 Actual 2015 Budget 2016 Budget2017 Forward
Estimate2018 Forward
EstimateRevenueGeneral Property Tax 3,098,771 3,086,675 3,147,027 3,273,676 3,403,120 State Aids 1,627,319 1,648,654 1,698,913 1,648,268 1,648,268 Intergovernmental Revenue 2,620,986 2,226,200 2,421,676 2,421,676 2,421,676 Misc Revenue 63,209 45,190 49,200 49,200 49,200 Other Financing SourcesTotal Revenue 7,410,286 7,006,719 7,316,816 7,392,820 7,522,264
ExpenseOperating Expense 10876 10000 10000 10000 10000Personnel Services 2,597,727 2,628,953 2,819,353 2,895,048 2,970,583 Contractual Services 1,364,306 1,033,375 1,260,785 1,279,697 1,298,892 Supplies & Expenses 2,061,138 2,226,391 2,330,709 2,314,265 2,348,979 Fixed Charges 712,226 719,685 708,590 708,590 708,590 Capital Outlay 8,794 ‐ 2,159 Cost Reallocation 346,910 330,941 176,370 176,370 176,370 Total Expenditures 7,101,976 6,949,345 7,307,966 7,383,970 7,513,414 Net Revenue and Expenditures 308,309 57,374 8,850 8,850 8,850
Responsive transportation system
DEPARTMENT REVENUE AND EXPENDITURES BY ECONOMIC CLASSIFICATION
Upgraded road network
Strategic Priorities:
Decrease the volume of deficient roads proportionate to available funding. Extend the life, maintain the integrity and enhance the safety of all county roads.
HIGHWAY DEPARTMENT Steve Warndahl, Highway CommissionerSECTION 1: DEPARTMENT SUMMARY
Department Description and Mission:The department provides all highway services for 662 lane miles of county roads and 364 lane miles of state highway. These services include; construction, winter/ice/snow activities, surface maintenance, drainage, signs, woody vegetation, material inventory, equipment maintenance, and record keeping.MISSION: To support, sustain and enhance the economic vitality and quality of life within Polk County by developing and maintaining a safe, efficient, balanced and environmentally sound county and state road system.
Link to County Board Strategic Goals:
149

2014 Actual 2015 Budget 2016 Budget 2017 Budget 2018 BudgetFTE EmployeesOfficials/Administrators 1 1 1 1 1Professionals 4 3 3 3 3Technicians/Para‐Professionals 2 3 3 3 3Administrative Support 1 1 1 1 1Skilled Craft/Service Maintenance 29.16 29.45 29.45 29.45 29.45Total 37.16 37.45 37.45 37.45 37.45
2014 Actual 2015 Budget 2016 Budget 2017 Budget 2018 BudgetConstruction and reconstruction of county roads 3,053,850 2,988,218 3,142,425 3,175,107 3,230,768 Road maintenance and repair 4,048,127 3,961,127 4,165,541 4,208,863 4,282,646 Total 7,101,976 6,949,345 7,307,966 7,383,970 7,513,414
EMPLOYMENT BY JOB CLASSIFICATION
PROGRAM SUMMARYPROGRAM EXPENDITURES
150
Highway Department

Program name:Program number:
Program objective:
2014 Actual 2015 Budget 2016 Budget 2017 Forward 2018 Forward RevenueGeneral Property Tax 1332471.53 1327270.25 1353221.61 1407680.624 1463341.561Other Revenues 1,853,951 1,685,619 1,793,009 1,771,232 1,771,232 Total Revenue 3,186,423 3,012,889 3,146,231 3,178,913 3,234,573
Recurrent Expenditure 3,053,850 2,988,218 3,142,425 3,175,107 3,230,768 Capital/One‐time ExpenditureTotal Expenditure 3,053,850 2,988,218 3,142,425 3,175,107 3,230,768 Net Revenue and Expenditures 132,573 24,671 3,806 3,806 3,806
Output indicators 2014 Actual 2015 Planned 2016 Planned 2017 Estimate 2018 EstimateMiles overlaid, reclaimed , chipsealed and prep for construction
28.44 29.21 31.49 37.84 30.6
Outcome indicators 2014 Actual 2015 Planned 2016 Planned 2017 Estimate 2018 EstimatePaser rating 7.0 7.0 7.0 6.9 6.8
PROGRAM REVENUES AND EXPENDITURES
KEY PERFORMANCE INDICATORS
Assumptions and factors affecting program performance:
SECTION 2: PROGRAM SUMMARY
29‐01Construction and reconstruction of county roads
Decrease the volume of deficient roads proportionate to available funding; To maintain the integrity of the highway infrastructure and to enhance safety by maintaining pavement quality.
Paser rating for road quality (from 1 for failed to 10 for excellent) ‐ 7 is considered good, requiring only crack sealing
KEY PROGRAM STRATEGIES 2016
Average Paser rating remained at 7
PROGRAM PERFORMANCE INFORMATIONKEY PROGRAM STRATEGIES FOR 2015
Continue to effectively use improved processes and technology to improve the transportation system with the available budget funding
With current funding levels and anticipated minor increases in budgets, current maintenance levels cannot be maintained, affecting Highway's goal of a 7 Paser rating.
151
Highway Department
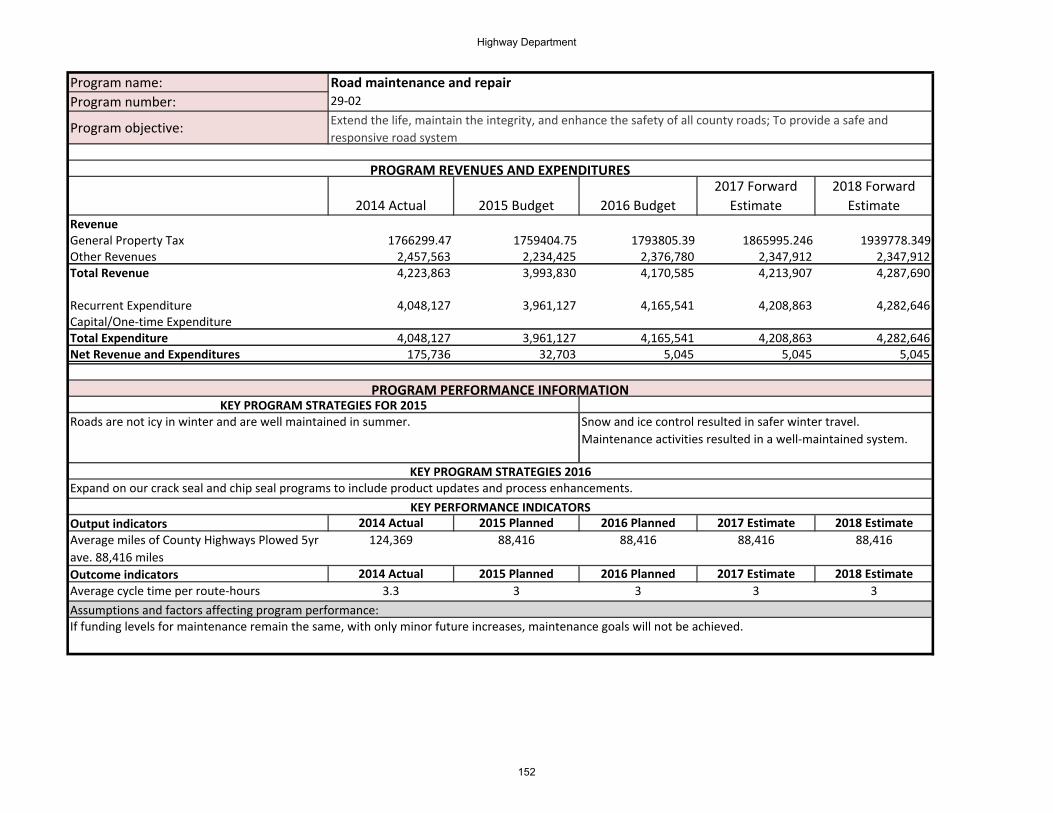
Program name:Program number:
Program objective:
2014 Actual 2015 Budget 2016 Budget2017 Forward
Estimate2018 Forward
EstimateRevenueGeneral Property Tax 1766299.47 1759404.75 1793805.39 1865995.246 1939778.349Other Revenues 2,457,563 2,234,425 2,376,780 2,347,912 2,347,912 Total Revenue 4,223,863 3,993,830 4,170,585 4,213,907 4,287,690
Recurrent Expenditure 4,048,127 3,961,127 4,165,541 4,208,863 4,282,646 Capital/One‐time ExpenditureTotal Expenditure 4,048,127 3,961,127 4,165,541 4,208,863 4,282,646 Net Revenue and Expenditures 175,736 32,703 5,045 5,045 5,045
Output indicators 2014 Actual 2015 Planned 2016 Planned 2017 Estimate 2018 EstimateAverage miles of County Highways Plowed 5yr ave. 88,416 miles
124,369 88,416 88,416 88,416 88,416
Outcome indicators 2014 Actual 2015 Planned 2016 Planned 2017 Estimate 2018 EstimateAverage cycle time per route‐hours 3.3 3 3 3 3
Road maintenance and repair
If funding levels for maintenance remain the same, with only minor future increases, maintenance goals will not be achieved.
KEY PERFORMANCE INDICATORS
Assumptions and factors affecting program performance:
Expand on our crack seal and chip seal programs to include product updates and process enhancements.KEY PROGRAM STRATEGIES 2016
KEY PROGRAM STRATEGIES FOR 2015Roads are not icy in winter and are well maintained in summer.
PROGRAM REVENUES AND EXPENDITURES
Snow and ice control resulted in safer winter travel. Maintenance activities resulted in a well‐maintained system.
PROGRAM PERFORMANCE INFORMATION
Extend the life, maintain the integrity, and enhance the safety of all county roads; To provide a safe and responsive road system
29‐02
152
Highway Department

Logical Frameworks, Highway Programs Construction and Reconstruction of County Roads
$4.2 million in expenditures
Narrative summary Performance Indicators Monitoring & Evaluation Assumptions/Risk
Impact A safe and responsive transportation system
Accidents attributable to road design issues or pavement flaws on County roads
Police records
Results Pavement quality is maintained PASER road quality rating Internal records No substantial increase in traffic or other factors undermining road safety
Outputs Roads are built or rebuilt Miles of road construction or reconstruction
Internal records No increased damage from external sources (e.g. frac sand mining)
Activities 1. Construct sections of road2. Maintain equipment 3. Keep accurate and adequate
records
1. Dollars spent on road construction2. Down time due to equipment
failure 3. Number of audit adjustments
Internal records Adequate funding for construction program
Road Maintenance $3.1 million in expenditures
Narrative summary Performance Indicators Monitoring & Evaluation Assumptions/Risk Impact A safe and responsive
transportation system Public satisfaction with County road system
Citizen survey
Results Roads are not icy in winter and are well maintained in summer
Accidents attributable to County road condition
Internal records No substantial increase in traffic or other factors undermining safety
Outputs Roads are plowed Storm or weather damage is repaired
Measurement of clear lane‐miles Internal records Average number of snow and ice storms and extreme weather events
Activities 1. Plow truck operations 2. Road patching and
maintenance 3. Maintain equipment
1. Number of person/hours of snowplowing
2. Hours of road maintenance 3. Down time due to equipment
failure
Internal records Adequate funding for plowing and maintenance
153
Highway Department

2014 Actual 2015 Budget 2016 Budget2017 Forward
Estimate2018 Forward
EstimateRevenueGeneral Property Tax 3,614,763 3,611,103 3,885,545 3,975,556 4,113,691 State Aids 3,183,487 4,159,942 4,159,942 4,159,942 4,159,942 Public Charge for Services 2,282,145 1,126,422 1,126,422 1,126,422 1,126,422 Other Financing Sources 440,679 40,000 40,000 40,000 40,000 Total Revenue 9,521,074 8,937,467 9,211,909 9,301,920 9,440,055
ExpensePersonnel Services 4,827,370 5,040,820 5,121,530 5,221,541 5,359,677 Contractual Services 3,336,418 3,377,186 3,618,918 3,536,258 3,533,557 Supplies & Expenses 169,680 177,336 177,336 179,996 182,696 Fixed Charges 240,852 294,125 294,125 294,125 294,125 Grants, Contributions, Indem 898,755 Cost Reallocation 48,000 48,000 ‐ 70,000 70,000 Total Expenditures 9,521,074 8,937,467 9,211,909 9,301,920 9,440,055 Net Revenue and Expenditures (0) ‐ ‐ ‐ ‐
DEPARTMENT REVENUE AND EXPENDITURES BY ECONOMIC CLASSIFICATION
Strategic Priorities:NOTE: The Human Services Department is undergoing a significant reorganization and restructuring as part of the creation of a new Community Services Division, consolidating this department, the Public Health Department, and the Medical Examiner. Budget data for 2016 and forward years are indicative only and will be reallocated early in 2016. Please review the Polk County website for the latest financial information.
HUMAN SERVICES Gretchen Sampson, Community Services DirectorSECTION 1: DEPARTMENT SUMMARY
Department Description and Mission:Polk County Department of Human Services provides the following summary of services for the County. Economic Support (eligibility for state and federal benefits; Behavioral Health (Mental Health/Substance Abuse Clinic, residential/institutional services; community support for vulnerable adults, adult protections abuse/neglect investigations, 24 hour emergency/crisis response); Children and Family Services (abuse/neglect investigations, in‐home and out‐of‐home support services, foster care, children's waiver programs, adjudicated and at‐risk juvenile services, residential and treatment care, 24 hour emergency/crisis response).MISSION: To assist, empower, and build upon the strengths of the children, youth, and adults in Polk County to achieve positive outcomes.
Link to County Board Strategic Goals:Improve the quality of life for all who live, work and play in Polk County
154
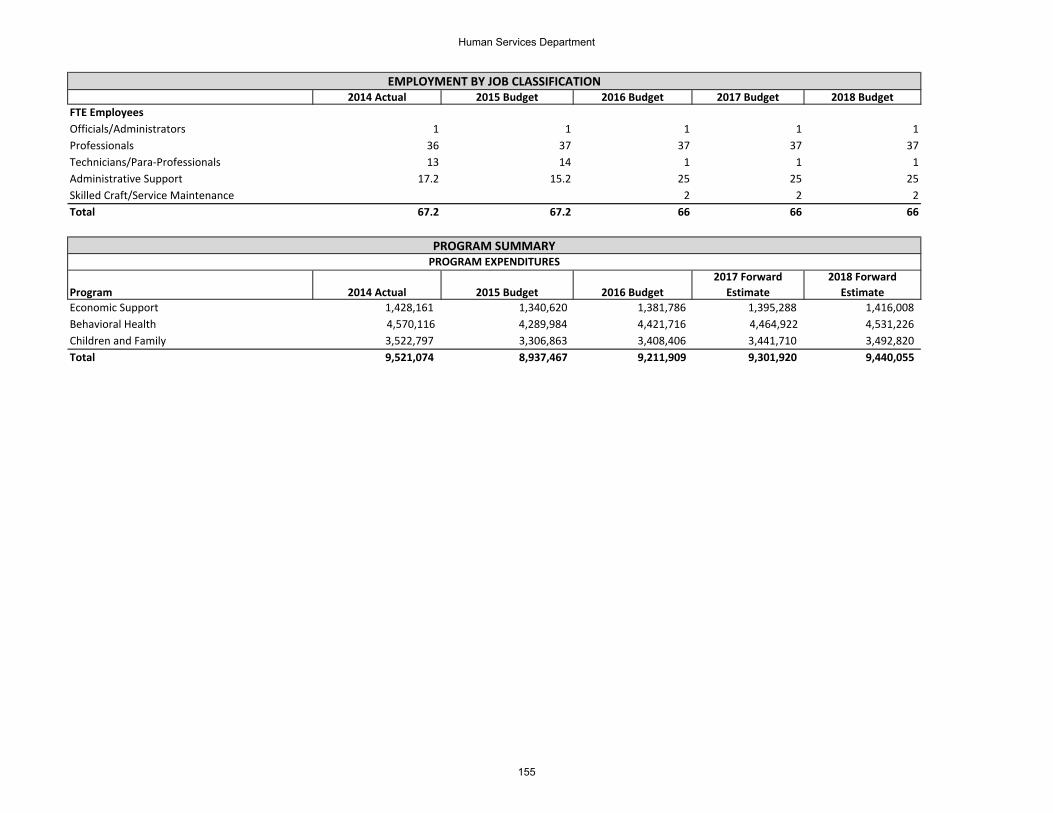
2014 Actual 2015 Budget 2016 Budget 2017 Budget 2018 BudgetFTE EmployeesOfficials/Administrators 1 1 1 1 1Professionals 36 37 37 37 37Technicians/Para‐Professionals 13 14 1 1 1Administrative Support 17.2 15.2 25 25 25Skilled Craft/Service Maintenance 2 2 2Total 67.2 67.2 66 66 66
Program 2014 Actual 2015 Budget 2016 Budget2017 Forward
Estimate2018 Forward
EstimateEconomic Support 1,428,161 1,340,620 1,381,786 1,395,288 1,416,008 Behavioral Health 4,570,116 4,289,984 4,421,716 4,464,922 4,531,226 Children and Family 3,522,797 3,306,863 3,408,406 3,441,710 3,492,820 Total 9,521,074 8,937,467 9,211,909 9,301,920 9,440,055
EMPLOYMENT BY JOB CLASSIFICATION
PROGRAM SUMMARYPROGRAM EXPENDITURES
155
Human Services Department

Program name:Program number:
Program objective:
2014 Actual 2015 Budget 2016 Budget2017 Forward
Estimate2018 Forward
EstimateRevenueGeneral Property Tax 542,214 541,665 582,832 596,333 617,054Other Revenues 885,947 798,955 798,955 798,955 798,955 Total Revenue 1,428,161 1,340,620 1,381,786 1,395,288 1,416,008
Recurrent Expenditure 1,428,161 1,340,620 1,381,786 1,395,288 1,416,008 Capital/One‐time ExpenditureTotal Expenditure 1,428,161 1,340,620 1,381,786 1,395,288 1,416,008 Net Revenue and Expenditures (0) ‐ ‐ ‐ ‐
Staffed GRC call center as required
Output indicators 2014 Actual 2015 Actual 2016 Planned 2017 Estimate 2018 EstimateApplications Processed Timely 98% 98%Fraud Investigation Success Rate 47.65% 60%
Outcome indicators 2014 Actual 2015 Planned 2016 Planned 2017 Estimate 2018 EstimateChildcare applications processed w/in 30 days 75%
KEY PERFORMANCE INDICATORS
Assumptions and factors affecting program performance:Call center work is very stressful for staffResponse time is limited by customer information provided
Implement childcare team concept to meet DCF performance standards
KEY PROGRAM STRATEGIES 2016
Presented Update on Great Rivers Consortium activities to Board of Health/Human Svcs
Implemented Time Study for IM staff
Adapt program policies and procedures based on results of pilot project on Great Rivers Consortium restructureImplement lobby services for income maintenance services
PROGRAM PERFORMANCE INFORMATIONKEY PROGRAM STRATEGIES FOR 2015
Participated in regional Consortium meetings All strategies were successfully implemented
SECTION 2: PROGRAM SUMMARY
16‐01
Participate in the restructure the Great Rivers Consortium model to meet recommendations from the state's 2015 Income Maintenance Operational Analysis. Create a consortium child care team to more effectively serve customer's child care needs in a more efficient manner and work towards meeting DCF performance standards for 2016.
PROGRAM REVENUES AND EXPENDITURES
Economic Support
156
Human Services Department

Program name:Program number:Program objective:
2014 Actual 2015 Budget 2016 Budget2017 Forward
Estimate2018 Forward
EstimateRevenueGeneral Property Tax 1,735,086 1,733,329 1,865,062 1,908,267 1,974,572Other Revenues 2,835,029 2,556,655 2,556,655 2,556,655 2,556,655 Total Revenue 4,570,116 4,289,984 4,421,716 4,464,922 4,531,226
Recurrent Expenditure 4,570,116 4,289,984 4,421,716 4,464,922 4,531,226 Capital/One‐time ExpenditureTotal Expenditure 4,570,116 4,289,984 4,421,716 4,464,922 4,531,226 Net Revenue and Expenditures (0) ‐ ‐ ‐ ‐
Output indicators 2014 Actual 2015 Planned 2016 Planned 2017 Estimate 2018 EstimateClient satisfaction surveys completed 90%Electronic Health Record implemented 100%CCS program expansion ‐ numbers served increases
10%
All Billable activity captured 90%Outcome indicators 2014 Actual 2015 Planned 2016 Planned 2017 Estimate 2018 Estimate% of people who attended intake assessments in 2016 who were not placed on an Emergency Detention
90%
4) The lack of an Electronic Health Records System is a barrier in that current systems are inefficient and do not provide usable data for program evaluation.
KEY PERFORMANCE INDICATORS
Assumptions and factors affecting program performance:1) The current intake process does not meet clinical needs.2) Extensive wait times for outpatient therapy intake appointments due to current staffing pattern.3) Extensive wait times for psychiatry due to lack of access to psychiatric services in Northwestern Wisconsin.
Participated in Valley Coop meetings
1) Implement an Electronic Health Records System2) 95% of clients seen in the clinic will indicate they are very or mostly satisfied with the services they received, per customer satisfaction surveys3) Expand CCS services
KEY PROGRAM STRATEGIES 2016
Provided Polk County data to be used in assessing need for additional regional inpatient mental health services
PROGRAM PERFORMANCE INFORMATIONKEY PROGRAM STRATEGIES FOR 2015
Participated in Behavioral Health program organizational assessment Beginning to implement assessment report recommendations.
Assure Quality Service to Polk County residents in need of Mental Health, Chemical Dependency and Vulnerable Adult
PROGRAM REVENUES AND EXPENDITURES
16‐02Behavioral Health
157
Human Services Department

Program name:Program number:Program objective:
2014 Actual 2015 Budget 2016 Budget2017 Forward
Estimate2018 Forward
EstimateRevenueGeneral Property Tax 1,337,462 1,336,108 1,437,652 1,470,956 1,522,066Other Revenues 2,185,335 1,970,755 1,970,755 1,970,755 1,970,755 Total Revenue 3,522,797 3,306,863 3,408,406 3,441,710 3,492,820
Recurrent Expenditure 3,522,797 3,306,863 3,408,406 3,441,710 3,492,820 Capital/One‐time ExpenditureTotal Expenditure 3,522,797 3,306,863 3,408,406 3,441,710 3,492,820 Net Revenue and Expenditures (0) ‐ ‐ ‐ ‐
Output indicators 2014 Actual 2015 Planned 2016 Planned 2017 Estimate 2018 EstimateEstablishment of outputs for every DCF program 100%
Program managers have understanding of their budgets
100%
Outcome indicators 2014 Actual 2015 Actual 2016 Planned 2017 Estimate 2018 EstimatePercent of programs with data system for measurement of performance
75%
Supervisor to staff ratio meets statewide average Aligned
Children in placement with timely face to face caseworker contacts
99.47% 100%
New management team agency wideInefficient data systems need replacement
KEY PROGRAM STRATEGIES 2016
KEY PERFORMANCE INDICATORS
Assumptions and factors affecting program performance:
Strengthen Department infrastructure Implement performance management system
PROGRAM PERFORMANCE INFORMATIONKEY PROGRAM STRATEGIES FOR 2015
Participated in organizational assessment
16‐03Children and Family
Provide protection and resources to the children and families in Polk County
PROGRAM REVENUES AND EXPENDITURES
Began implementing assessment report recommendations.
158
Human Services Department

Logical Frameworks, Highest Cost Human Services Programs
Family and Children’s Services ($3.4 million) Child Protective Services
Narrative summary Performance Indicators Monitoring & Evaluation Assumptions/Risk
Impact Children become healthy, productive adults
Employment rate of former clients
Survey of former participants
Results Children are safe and cared forappropriately
Progress noted and measured Internal records Biological parents able to provide adequate support; children respond to assistance
Outputs Families are reunited or children are permanently placed elsewhere
Ongoing case plans with face‐to‐face development with family members
Internal records Adequate opportunity, time, and resources for placement decisions
Activities Investigate reported cases of child abuse/neglect and implement child safety plans
CPS investigations completed and approved within established timelines
Internal records Investigation is able to determine proper course of action
159
Human Services Department

Juvenile Justice Services
Narrative summary Performance Indicators Monitoring & Evaluation Assumptions/Risk Impact Juveniles become healthy,
productive adults Adult recidivism rate Court records
Results Juveniles are cared for and issues resolved
Juvenile recidivism rate Internal records Juveniles can develop abilities for making appropriate decisions
Outputs Juveniles are supported in an environment conducive to improvement
Support services/behaviorassessments
Internal records Adequate opportunity, time, and resources available to provide necessary support
Activities Respond to incidents of inappropriate actions by juveniles and implement change plans
Initial response and follow‐up plans implemented within establish timelines
Internal records Time and resources are sufficient to implement plan
Behavioral Health Services ($4.4 million)
Narrative summary Performance Indicators Monitoring & Evaluation Assumptions/Risk Impact Quality of life improved for clients
and their families Relapse rate Internal records
Results Clients or former clients able to participate in society
Employment rate of employable clients and former clients
Internal records Resources adequate to allow independent living
Outputs Behavioral health issues are controlled or eliminated
Success rate of treatment plans Internal records No major economic crisis affecting employment
Activities Counseling, community support and psychiatric services to residents in need of these services
Number of individuals provided assistance
Internal records Time and resources are sufficient to implement plan and individual clients respond to treatment
160
Human Services Department

Economic Support ($1.4 million)
Narrative summary Performance Indicators Monitoring & Evaluation Assumptions/Risk Impact Quality of life improved for
clients, families and the community
Poverty rate in Polk CountyEmployment rate of employable clients and former clients
U.S. Census Bureau
Results Clients are able to live independently and as possible seek employment
Share of clients seeking work Internal records No major economic crisis affecting employment
Outputs Clients receiving appropriate assistance
Beneficiaries receiving benefits within 30 days of contact
Internal records Programs are adequately funded
Activities Ascertaining eligibility for State or Federal assistance and enrolling clients in programs
Number of individuals provided assistance
Internal records Individual clients fully cooperate
161
Human Services Department

2014 Actual 2015 Budget 2016 Budget2017 Forward
Estimate2018 Forward
EstimateRevenueGeneral Property Tax 583,301 554,254 627,537 590,325 609,107 Intergovernmental Revenue 146,716 265,893 271,347 271,853 271,853 Total Revenue 730,017 820,147 898,884 862,178 880,960
ExpensePersonnel Services 478,965 489,974 505,992 519,323 532,962 Contractual Services 221,460 301,873 365,842 315,399 320,130 Supplies & Expenses 24,775 28,300 27,050 27,456 27,868 Cost Reallocation 4,000 Total Expenditures 729,200 820,147 898,884 862,178 880,960 Net Revenue and Expenditures 817 ‐ 0 ‐ ‐
2014 Actual 2015 Budget 2016 Budget 2017 Budget 2018 BudgetFTE EmployeesOfficials/Administrators 1 1 1 1 1Professionals 1 1 1 1 1Technicians/Para‐Professionals 3 3 3 3 3Total 5 5 5 5 5
Strategic Priorities:First and foremost is the security of the county's information system and citizen data, specifically the confidentiality, integrity and availability; then, it is vitally important to offer stellar technical support while balancing advanced technologies with network performance and working collaboratively with all departments to supply and support citizen services.
INFORMATION TECHNOLOGY Todd Demers, DirectorSECTION 1: DEPARTMENT SUMMARY
Department Description and Mission:Provides technology support and management for all departments of Polk County government.
MISSION: To serve the public with integrityLink to County Board Strategic Goals:To serve the public with integrity.
DEPARTMENT REVENUE AND EXPENDITURES BY ECONOMIC CLASSIFICATION
EMPLOYMENT BY JOB CLASSIFICATION
162

Program 2014 Actual 2015 Budget 2016 Budget2017 Forward
Estimate2018 Forward
EstimateNetwork Security 218,760 246,044 269,665 258,653 264,288 Technical Support 218,760 246,044 269,665 258,653 264,288 Network administration 218,760 246,044 269,665 258,653 264,288 Programming & Analysis 72,920 82,015 89,888 86,218 88,096 Total 729,200 820,147 898,884 862,178 880,960
PROGRAM SUMMARYPROGRAM EXPENDITURES
163
Information Technology

Program name:Program number:
Program objective:
2014 Actual 2015 Budget 2016 Budget2017 Forward
Estimate2018 Forward
EstimateRevenueGeneral Property Tax 174,990 166,276 188,261 177,097 182,732Other Revenues 44,015 79,768 81,404 81,556 81,556 Total Revenue 219,005 246,044 269,665 258,653 264,288
Recurrent Expenditure 218,760 246,044 269,665 258,653 264,288 Capital/One‐time ExpenditureTotal Expenditure 218,760 246,044 269,665 258,653 264,288 Net Revenue and Expenditures 245 ‐ 0 ‐ ‐
PROGRAM PERFORMANCE INFORMATIONKEY PROGRAM STRATEGIES FOR 2015
PROGRAM REVENUES AND EXPENDITURES
SECTION 2: PROGRAM SUMMARY
32‐01Network Security
Ensure the confidentiality, integrity and availability of citizen and employee information is managed consistent with state and federal guidelines and to create an environment where literally hundreds of employees can work and interact with the citizens they serve and to mitigate the threats that could compromise the confidentiality, integrity and availability of citizen information.
Update all county network diagrams to reflect technology changes; from the desktop, to the server
Upgrade Windows Operating systems from Windows XP to Windows 7. In addition, Windows Server 3003 and Exchange 2003 were no longer supported by Microsoft as well. All these devices would be come extremely vulnerable to outside threats, without the support of Microsoft (Security patches and fixes)
This was a HIPAA requirement; to have updated diagrams in order to properly analyze administrative, technical and physical safeguards. Completed the upgrade of 28 pages of network and application assembly designs.
WinXP was no longer supported and needed replacement. The I.T. department has upgraded approximately 81 computers to Windows 7. We also upgraded our Exchange Server to 2010 and also upgrade 11 servers to Windows Server 2008+
Completed the preliminary draft of Polk County's new Information Security Manual, which is the compilation of the county's 51 HIPAA policies and consists of 182 pages
Create a security manual for all of Polk County's information systems
Program 32‐01 Continued on next page
164
Information Technology

Program name:Program number:
Output indicators 2014 Actual 2015 Planned 2016 Planned 2017 Estimate 2018 EstimateIncrease the percent of county‐owned mobile devices that are encrypted 75% 90% 95% 97% 99%
Replace our 7 firewalls with advanced IDS/IPS firewall countywide
0 0 7 ‐‐ ‐‐
Increase the percent of county employees who participate in security awareness training 0 60% 85% 92% 95%
Outcome indicators 2014 Actual 2015 Planned 2016 Planned 2017 Estimate 2018 EstimateReduce the percent of threat of data compromises from lost / stolen equipment 60% 80% 90% 95% 98%
Faster response time to threats on the workstation and / or network
3‐5 days 2 ‐3 days ½ ‐ 1 day ½ day or less 2 hours
Increase the percent of employees who conduct themselves and their activities in a security‐minded fashion
50% 60% 85% 92% 98%
KEY PERFORMANCE INDICATORS
Assumptions and factors affecting program performance:There is no real system or technology that can absolutely guarantee that compromises can't happen. Within the scope of our resources (people, time and money), we will prioritize the threat levels on our organizations and mitigate those threats from highest to the lowest.
With the advent of increased outsourcing of departmental applications, Polk County must initiate advanced security technology at the perimeter of its networks. We need an advanced early detection system with proactive alert notification mechanisms. In addition, we need better reporting for user activities both inside and outside our firewalls.
Network Security Continued32‐01
Continuation of program 32‐01 Network Security
165
Information Technology

Program name:Program number:
Program objective:
2014 Actual 2015 Budget 2016 Budget2017 Forward
Estimate2018 Forward
EstimateRevenueGeneral Property Tax 174,990 166,276 188,261 177,097 182,732Other Revenues 44,015 79,768 81,404 81,556 81,556 Total Revenue 219,005 246,044 269,665 258,653 264,288
Recurrent Expenditure 218,760 246,044 269,665 258,653 264,288 Capital/One‐time ExpenditureTotal Expenditure 218,760 246,044 269,665 258,653 264,288 Net Revenue and Expenditures 245 ‐ 0 ‐ ‐
32‐02Technical Support
Provide professional technical support to all departments and work to reduce the cost of equipment and energy; work collaboratively with department to successfully implement projects; manage technology inventories to assure standardization, compatibility and high performance.
PROGRAM REVENUES AND EXPENDITURES
Upgrade our Support Source tech support desk software to include project management functionality. This will assist in monitoring the status of our projects for budget and /or timeline overruns.
KEY PROGRAM STRATEGIES 2016
PROGRAM PERFORMANCE INFORMATIONKEY PROGRAM STRATEGIES FOR 2015
Assist Sheriff's Department in New World upgrade, which increase application performance and speed from dispatch to patrol.
Create a Event Log management system to monitor and alert I.T. of any security or policy threats on the workstations and network.
Replaced 32 mobile data terminals and docking stations in squads; upgrade New World to version 10, and assisted 5 local municipalities connect to our mobile networkThis sets the stage for users to be able to telework; it also helped Child Support bring their office network data into the courts during petition hearings and child support issues via laptop and virtual private networking.Newly created and has successfully completed the proof‐of‐concept phase. This is ground work for a 2016 project management assessment tools of I.T.
Enhance our ability to respond to technical requests by use of internally advanced tools or purchased remote access support softwareAs we migrate to a more projects‐oriented environment, our need to monitor those projects is apparent as well as the need to upgrade our project support technologies
Microsoft has released Microsoft 10 operating system and we must begin researching its features and functionality for county useProgram 32‐02 Continued on next page
166
Information Technology

Program name:
Program number:
Output indicators 2014 Actual 2015 Planned 2016 Planned 2017 Estimate 2018 EstimateUpgrade Support Source to include Project management functionality ‐‐ 15% 75% 95% 100%
Upgrade MS Config Manager to enable remote support for a larger volume of county computers, virtual desktops and mobile devices 250 300 360 400 400
Outcome indicators 2014 Actual 2015 Planned 2016 Planned 2017 Estimate 2018 EstimateIncrease the number of projects we will be able to monitor in order to keep them on time and within budgets
0 2 8 12 15
Decrease the average time it takes to complete work orders, by having the ability to connect remotely and solve problems and push out patches
2.25 hours 1.75 hours 1.25 hours 1 hour .75 hours
KEY PERFORMANCE INDICATORS
Assumptions and factors affecting program performance:It is assumed as we move toward outsourcing departmental applications, the volume of support hours may decrease and the level of project deployment will increase.
Technical Support Continued32‐02
Continuation of program 32‐02 Technical Support
167
Information Technology

Program name:Program number:Program objective:
2014 Actual 2015 Budget 2016 Budget2017 Forward
Estimate2018 Forward
EstimateRevenueGeneral Property Tax 174,990 166,276 188,261 177,097 182,732Other Revenues 44,015 79,768 81,404 81,556 81,556 Total Revenue 219,005 246,044 269,665 258,653 264,288
Recurrent Expenditure 218,760 246,044 269,665 258,653 264,288 Capital/One‐time ExpenditureTotal Expenditure 218,760 246,044 269,665 258,653 264,288 Net Revenue and Expenditures 245 ‐ 0 ‐ ‐
Output indicators 2014 Actual 2015 Planned 2016 Planned 2017 Estimate 2018 Estimate
Outcome indicators 2014 Actual 2015 Planned 2016 Planned 2017 Estimate 2018 Estimate
32‐03Network administration
Provide a high‐speed and secure network to meet new demands.
PROGRAM REVENUES AND EXPENDITURES
KEY PROGRAM STRATEGIES 2016
PROGRAM PERFORMANCE INFORMATIONKEY PROGRAM STRATEGIES FOR 2015
KEY PERFORMANCE INDICATORS
Assumptions and factors affecting program performance:
Set up the functionality to all telecommuting for county staff to increase the level of service to county residents and working from home for county staff
Work collaboratively with other departments to create an internal training library in order to enhance the personal and professional skill of county staff
168
Information Technology

Program name:Program number:
Program objective:
2014 Actual 2015 Budget 2016 Budget2017 Forward
Estimate2018 Forward
EstimateRevenueGeneral Property Tax 58,330 55,425 62,754 59,032 60,911Other Revenues 14,672 26,589 27,135 27,185 27,185 Total Revenue 73,002 82,015 89,888 86,218 88,096
Recurrent Expenditure 72,920 82,015 89,888 86,218 88,096 Capital/One‐time ExpenditureTotal Expenditure 72,920 82,015 89,888 86,218 88,096 Net Revenue and Expenditures 82 ‐ 0 ‐ ‐
Output indicators 2014 Actual 2015 Planned 2016 Planned 2017 Estimate 2018 Estimate
2 2 3 5 5
Outcome indicators 2014 Actual 2015 Planned 2016 Planned 2017 Estimate 2018 EstimateComplete complex programs that service automate processes and increase staff productivity
2 2 3 5 5
32‐04Programming & Analysis
Improve efficiency and effectiveness of government through software solutions; analyze users' activities and build applications that help to automate manual processes and / or create interfaces between disparate systems.
PROGRAM REVENUES AND EXPENDITURES
PROGRAM PERFORMANCE INFORMATIONKEY PROGRAM STRATEGIES FOR 2015
Upgrade MS Exchange Server from 2003 (unsupported) to 2010 100% Complete within time and budget
Upgrade global applications to improve functionality and productivity for nearly all users
Create budget reports for DOA KEY PROGRAM STRATEGIES 2016
Upgrade MS SQL Server 2005 (unsupported) to SQL 2012R2 100% Complete within time and budget100% Complete per interdepartmental strategies for 2015
KEY PERFORMANCE INDICATORS
Assumptions and factors affecting program performance:
Design and implement complex programs to automate processes for county staff (Kronos 10, Web Invoicing, Exchange 2013)
169
Information Technology

2014 Actual 2015 Budget 2016 Budget 2017 Forward Estimate 2018 Forward EstimateRevenueGeneral Property Tax 359,756 350,027 380,646 401,452 422,508 Other TaxesState Aids 16,000 35,000 35,000 35,000 35,000 License & Fees 234,112 241,500 231,749 231,749 231,749 Fine and ForfeituresPublic Charge for Services 82,828 125,000 125,000 125,000 125,000 Intergovernmental Revenue 12,750 10,000 5,000 5,000 5,000 Misc Revenue 23,120 5,000 5,000 5,038 5,076 Other Financing Sources ‐ 20,000 20,000 20,000 20,000 Total Revenue 728,566 786,527 802,395 823,239 844,333
ExpensePersonnel Services 701,923 716,103 731,144 751,111 771,315 Contractual Services 44,284 36,654 31,831 32,309 32,793 Supplies & Expenses 28,792 20,550 26,600 26,999 27,404 Fixed Charges ‐ 720 320 320 320 Debt ServiceGrants, Contributions, Indem 605 12,500 12,500 12,500 12,500 Capital OutlayCost Reallocation ‐ Total Expenditures 775,604 786,527 802,395 823,239 844,332 Net Revenue and Expenditures (47,038) ‐ 0 ‐ 0
LAND INFORMATION Sara M. McCurdy, DirectorSECTION 1: DEPARTMENT SUMMARY
Department Description and Mission:Provides services to the public, businesses, and other government agencies in zoning, planning, survey, real property listing, and geographic information systems.
MISSION: To provide high quality, efficient service to the general public as well as other county departments and agencies in the areas of zoning, planning, survey, real property listing, and land information, maintaining and enhancing the countywide geographic information system.
Link to County Board Strategic Goals:To serve the public with integrity
Implement goals set by County Board with solid internal and external services.
DEPARTMENT REVENUE AND EXPENDITURES BY ECONOMIC CLASSIFICATION
To support growth and policies that preserve the natural resources of Polk CountyTo maintain rural character of Polk CountyTo regulate land use balancing individual property rights with community interestsTo provide adequate infrastructure to support desired types of economic developmentStrategic Priorities:
170

2014 Actual 2015 Budget 2016 Budget 2017 Budget 2018 BudgetFTE EmployeesOfficials/Administrators 1 1 1 1 1Professionals 3 4 4 4 4Technicians/Para‐Professionals 4 3 3 3 3Administrative Support 1 1 1 1 1Total 9 9 9 9 9
Program 2014 Actual 2015 Budget 2016 Budget 2017 Forward Estimate 2018 Forward EstimateZoning 310,242 314,611 320,958 329,296 337,733 Survey 232,681 235,958 240,718 246,972 253,300 Planning 116,341 117,979 120,359 123,486 126,650 Geographic Information Systems 116,341 117,979 120,359 123,486 126,650 Total 775,604 786,527 802,395 823,239 844,332
PROGRAM SUMMARYPROGRAM EXPENDITURES
EMPLOYMENT BY JOB CLASSIFICATION
171
Land Information

Program name:Program number:
Program objective:
2014 Actual 2015 Budget 2016 Budget 2017 Forward Estimate 2018 Forward EstimateRevenueGeneral Property Tax 143,902 140,011 152,258 160,581 169,003Other Revenues 147,524 174,600 168,700 168,715 168,730 Total Revenue 291,426 314,611 320,958 329,296 337,733
Recurrent Expenditure 310,242 314,611 320,958 329,296 337,733 Capital/One‐time ExpenditureTotal Expenditure 310,242 314,611 320,958 329,296 337,733 Net Revenue and Expenditures (18,815) ‐ 0 ‐ 0
Output indicators 2014 Actual 2015 Actual 2016 Planned 2017 Estimate 2018 EstimatePermit Data:Sanitary Permits 189 222 250 260 280Land Use Permits 645 739 800 820 840
Outcome indicators 2014 Estimate 2015 Estimate 2016 Planned 2017 Estimate 2018 EstimateSelf Reported Dollars of New Construction: $17,158,000 $20,179,000 $ 21,000,000 $ 22,000,000 $ 23,000,000
Zoning
Assure compliance with ordinances through fair and sound administration. Create fair land use policy to include local input. Preserve and enhance environment.
PROGRAM REVENUES AND EXPENDITURES
PROGRAM PERFORMANCE INFORMATION
SECTION 2: PROGRAM SUMMARY
24‐01
KEY PROGRAM STRATEGIES FOR 2015Administer rural address numbering system, and the following ordinances: Issued all permits and conducted public hearings for variances,Comprehensive Land Use, Shoreland Protection, Floodplain, Lower St Croix Riverway, Sanitary, Subdivision, Telecommunications Towers, Small Wind Energy Systems, and Uniform Citation.
KEY PROGRAM STRATEGIES 2016
special exceptions, and district changes as a part of administering the land use ordinances.
Continue to Administer programs and policies set forth by the Polk County Board of Supervisors
KEY PERFORMANCE INDICATORS
Assumptions and factors affecting program performance:Economy sustains continued growth in housing market.
172
Land Information

Program name:Program number:
Program objective:
2014 Actual 2015 Budget 2016 Budget 2017 Forward Estimate 2018 Forward EstimateRevenueGeneral Property Tax 107,927 105,008 114,194 120,436 126,752Other Revenues 110,643 130,950 126,525 126,536 126,548 Total Revenue 218,570 235,958 240,719 246,972 253,300
Recurrent Expenditure 232,681 235,958 240,718 246,972 253,300 Capital/One‐time ExpenditureTotal Expenditure 232,681 235,958 240,718 246,972 253,300 Net Revenue and Expenditures (14,112) ‐ 0 ‐ 0
Output indicators 2014 Actual 2015 Planned 2016 Planned 2017 Estimate 2018 Estimate
Number of Surveys Reviewed: 45 68 80 100 125Number of PLSS remonumented: 48 50 the 8 remaining Maintenance MaintenanceParcels Completed: 2,000 2,500 Complete Maintenance Maintenance
Outcome indicators 2014 Actual 2015 Planned 2016 Planned 2017 Estimate 2018 EstimatePercentage (%) of County PLSS 95% 98% 100% 100% 100%Percentage (%) of County Parcels complete 95% 97% 100% 100% 100%Assessors obtain Tax Roll Digitally 80% 90% 100% 100% 100%
24‐02Survey
Complete the remonumentation of the Public Land Survey System infrastructure.Complete base parcel mapping and maintain existing maps and digital land records file.Maintain all real estate property tax assessment records for the County and ensure quality.
PROGRAM REVENUES AND EXPENDITURES
PROGRAM PERFORMANCE INFORMATIONKEY PROGRAM STRATEGIES FOR 2015
Carry out the requirements of the Surveyor’s office as specified in Chapter 59 of the Wisconsin Statutes; Division is responsible for parcel mapping development and PLSS maintenance; Division is responsible for the Real Property listing duties as defined by
Continue to carry out the requirements specified by statute and the policies set forth by the Polk County Board of Supervisors
Reviewed all incoming Certified Survey maps, advanced the PLSSrestoration project, and the overall parcel map for Polk County.Assessment database maintained and improved with addition of physical address.Section 70.09 of the Wisconsin Statutes.
KEY PROGRAM STRATEGIES 2016
KEY PERFORMANCE INDICATORS
Assumptions and factors affecting program performance:
173
Land Information

Program name:Program number:
Program objective:
2014 Actual 2015 Budget 2016 Budget 2017 Forward Estimate 2018 Forward EstimateRevenueGeneral Property Tax 53,963 52,504 57,097 60,218 63,376Other Revenues 55,321 65,475 63,262 63,268 63,274 Total Revenue 109,285 117,979 120,359 123,486 126,650
Recurrent Expenditure 116,341 117,979 120,359 123,486 126,650 Capital/One‐time ExpenditureTotal Expenditure 116,341 117,979 120,359 123,486 126,650 Net Revenue and Expenditures (7,056) ‐ 0 ‐ 0
Output indicators 2014 Actual 2015 Planned 2016 Planned 2017 Estimate 2018 EstimateCompleted Plans Farmland Preservation Comp. Land Use Subdivision Other Ordinances or
PlansOther Ordinances or
Plans
Outcome indicators 2014 Actual 2015 Planned 2016 Planned 2017 Estimate 2018 EstimateNumber of Towns participating in County Zoning: 17 17 17 17 17
24‐03Planning
Implement the new County Land Use Ordinances with coordinated efforts through the Towns.
Design good land use practice, foster a diverse economic base, while preserving and enhancing the environment.
PROGRAM REVENUES AND EXPENDITURES
Farmland preservation plan, Comprehensive Land Use Ordinances, other various County Plans and strategies.
KEY PROGRAM STRATEGIES 2016
PROGRAM PERFORMANCE INFORMATIONKEY PROGRAM STRATEGIES FOR 2015
Promote and encourage orderly land use development by facilitating the county landuse ordinance, and assist in the many planning activities that Polk County demands.
KEY PERFORMANCE INDICATORS
Assumptions and factors affecting program performance:Pressumes no policy disagreements between the Town and The County Plan / Ordinance; may be other factors causing a Town to opt out.
174
Land Information

Program name:Program number:
Program objective:
2014 Actual 2015 Budget 2016 Budget 2017 Forward Estimate 2018 Forward EstimateRevenueGeneral Property Tax 53,963 52,504 57,097 60,218 63,376Other Revenues 55,321 65,475 63,262 63,268 63,274 Total Revenue 109,285 117,979 120,359 123,486 126,650
Recurrent Expenditure 116,341 117,979 120,359 123,486 126,650 Capital/One‐time ExpenditureTotal Expenditure 116,341 117,979 120,359 123,486 126,650 Net Revenue and Expenditures (7,056) ‐ 0 ‐ 0
Output indicators 2014 Actual 2015 Planned 2016 Planned 2017 Estimate 2018 EstimateGIS datasets maintained and enhanced Recreation Viewer online
mapZoning datasets Hydro Layer using LiDAR
tech.E911 data E911 Data
Emergency Atlas
Outcome indicators 2014 Actual 2015 Planned 2016 Planned 2017 Estimate 2018 Estimate
GIS website sessions (month of October) 11,469 11,810 12,000 12,200 12,400
PROGRAM PERFORMANCE INFORMATIONKEY PROGRAM STRATEGIES FOR 2015
Geographic data sets loaded into the County Enterprise GIS: http://polkcowi.wgxtreme.com/
Geographic data sets loaded into the dispatch emergencyprogram, the County Enterprise GIS online.
24‐04Geographic Information Systems
Maintain and enhance the County GIS Enterprise along with providing high quality data support to other departments.
PROGRAM REVENUES AND EXPENDITURES
KEY PERFORMANCE INDICATORS
Assumptions and factors affecting program performance:Technical infrastructure is maintained.
Continue to coordinate Geographic Information programs and policies set forth by the Polk County Board of Supervisors, including the use of LiDAR technology.KEY PROGRAM STRATEGIES 2016
175
Land Information
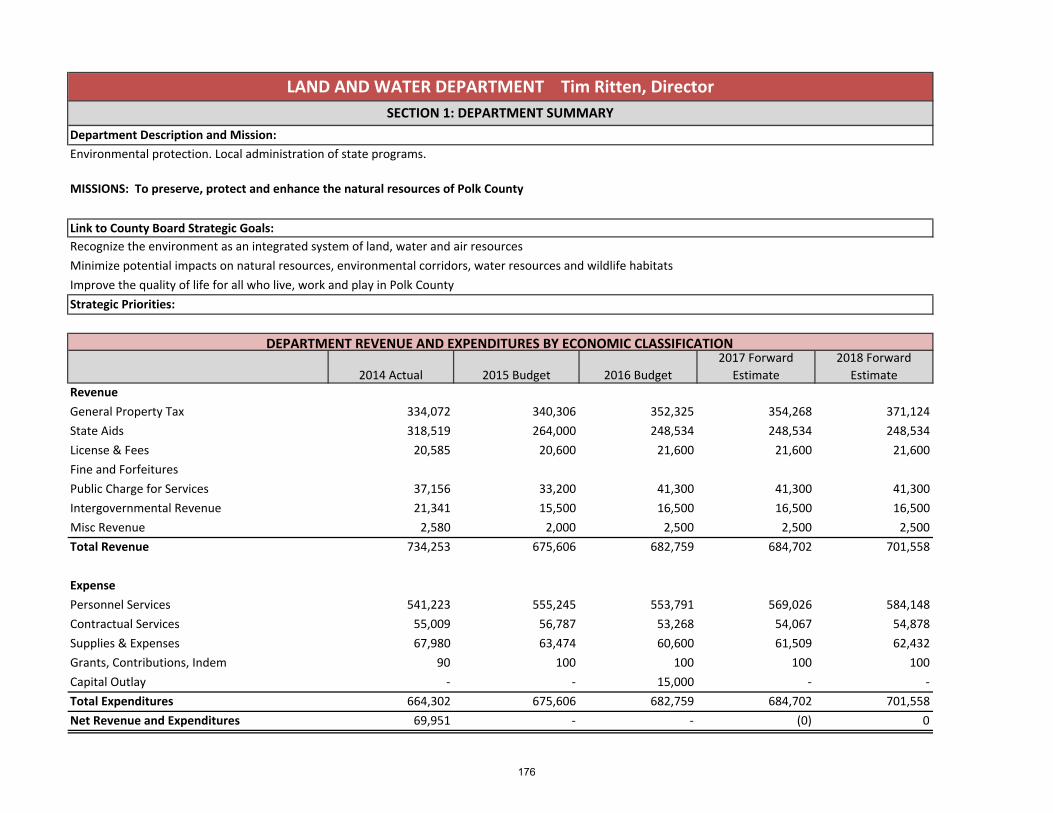
2014 Actual 2015 Budget 2016 Budget2017 Forward
Estimate2018 Forward
EstimateRevenueGeneral Property Tax 334,072 340,306 352,325 354,268 371,124 State Aids 318,519 264,000 248,534 248,534 248,534 License & Fees 20,585 20,600 21,600 21,600 21,600 Fine and ForfeituresPublic Charge for Services 37,156 33,200 41,300 41,300 41,300 Intergovernmental Revenue 21,341 15,500 16,500 16,500 16,500 Misc Revenue 2,580 2,000 2,500 2,500 2,500 Total Revenue 734,253 675,606 682,759 684,702 701,558
ExpensePersonnel Services 541,223 555,245 553,791 569,026 584,148 Contractual Services 55,009 56,787 53,268 54,067 54,878 Supplies & Expenses 67,980 63,474 60,600 61,509 62,432 Grants, Contributions, Indem 90 100 100 100 100 Capital Outlay ‐ ‐ 15,000 ‐ ‐ Total Expenditures 664,302 675,606 682,759 684,702 701,558 Net Revenue and Expenditures 69,951 ‐ ‐ (0) 0
DEPARTMENT REVENUE AND EXPENDITURES BY ECONOMIC CLASSIFICATION
Minimize potential impacts on natural resources, environmental corridors, water resources and wildlife habitatsImprove the quality of life for all who live, work and play in Polk CountyStrategic Priorities:
LAND AND WATER DEPARTMENT Tim Ritten, DirectorSECTION 1: DEPARTMENT SUMMARY
Department Description and Mission:Environmental protection. Local administration of state programs.
MISSIONS: To preserve, protect and enhance the natural resources of Polk County
Link to County Board Strategic Goals:Recognize the environment as an integrated system of land, water and air resources
176

2014 Actual 2015 Budget 2016 Budget 2017 Budget 2018 BudgetFTE EmployeesOfficials/Administrators 1 1 1 1 1Professionals 0 5 3 3 3Technicians/Para‐Professionals 5 0 2 2 2Administrative Support 1 1 1 1 1Total 7 7 7 7 7
Program 2014 Actual 2015 Budget 2016 Budget2017 Forward
Estimate2018 Forward
EstimateNR151 Runoff Management, ATCP50 Soil & Water Resource Management
139,095 139,250 142,790 142,977 146,674
Ch. 92 Soil & Water Conservation and Animal Waste Management, Administration
245,072 245,346 251,583 251,912 258,425
NR190 Lake Management/Protection & NR40 Invasive Species Prevention/Control NR115 Shoreland Protection
152,342 152,512 156,390 156,594 160,643
NR135 Nonmetallic Mine Reclamation 19,871 19,893 20,399 20,425 20,953 Contracted Services Work for Lake Districts, Municipalities, etc.
33,118 33,155 33,998 34,042 34,922
Tree program and conservation materials 16,266 15,450 17,400 17,648 17,922 Wildlife Damage Abatement Claims Program 58,539 70,000 60,200 61,103 62,019
Total 664,302 675,606 682,759 684,702 701,558
EMPLOYMENT BY JOB CLASSIFICATION
PROGRAM SUMMARYPROGRAM EXPENDITURES
177
Land and Water Department

Program name:Program number:
Program objective:
2014 Actual 2015 Budget 2016 Budget2017 Forward
Estimate2018 Forward
EstimateRevenueGeneral Property Tax 86,611 88,227 91,344 91,847 96,217 Other Revenues 68,071 50,970 49,631 49,631 49,631 Total Revenue 154,682 139,198 140,975 141,478 145,848
Recurrent Expenditure 139,095 139,250 142,790 142,977 146,674 Capital/One‐time ExpenditureTotal Expenditure 139,095 139,250 142,790 142,977 146,674 Net Revenue and Expenditures 15,588 (52) (1,816) (1,499) (825)
Output indicators 2014 Actual 2015 Planned 2016 Planned 2017 Estimate 2018 EstimateWrite/review nutrient mgmt plans 15 plans 10 plans 10 plans 11 plans 12 plansClose idle/failing manure pits 2 pits 2 pits 2 pits 2 pits 2 pitsFPP reviews/certifications 10, 10 10, 15 10, 15 10, 15 10, 15Stormwater/erosion control 7 permits 6 permits 7 permits 8 permits 8 permitsOutcome indicators 2014 Actual 2015 Planned 2016 Planned 2017 Estimate 2018 EstimateEstimated lbs Phosphorus reduction 417 420 425 440 450
KEY PERFORMANCE INDICATORS
Assumptions and factors affecting program performance:Landowner/operator participation and cooperationCost share money availabilityA useful GIS based P reduction tracking tool is needed to adequately track progress
PROGRAM PERFORMANCE INFORMATIONKEY PROGRAM STRATEGIES FOR 2015
Reduce runoff from croplandReduce runoff from feedlotsClose idle manure storage facilities
Plan to increase cropland and feedlot runoff reduction by restructuring off staff duties and 2nd CCA certified staff member
Mitigate urban runoffKEY PROGRAM STRATEGIES 2016
Watershed council increased cover crops, incentivesOne problem investigated, samples takenTwo idle/failing manure storage facilities closedMaintained admin of Stormwater/Erosion Control Ordinance
SECTION 2: PROGRAM SUMMARY
22‐01NR151 Runoff Management, ATCP50 Soil & Water Resource Management
Reduce runoff from farm fields through erosion control and nutrient management, reduce runoff from feedlots, mitigate runoff from urban development and construction sites.
PROGRAM REVENUES AND EXPENDITURES
178
Land and Water Department

Program name:Program number:
Program objective:
2014 Actual 2015 Budget 2016 Budget2017 Forward
Estimate2018 Forward
EstimateRevenueGeneral Property Tax 152,601 155,448 160,939 161,826 169,526 Other Revenues 119,935 89,805 87,445 87,445 87,445 Total Revenue 272,536 245,253 248,384 249,271 256,971
Recurrent Expenditure 245,072 245,346 251,583 251,912 258,425 Capital/One‐time ExpenditureTotal Expenditure 245,072 245,346 251,583 251,912 258,425 Net Revenue and Expenditures 27,464 (92) (3,199) (2,641) (1,454)
Output indicators 2014 Actual 2015 Planned 2016 Planned 2017 Estimate 2018 EstimateAdmin cost share programs 2 1 2 2 2Admin 4 ordinances 4 4 4 4 4Address manure complaints 2 4 4 4 4Inventory/certify livestock ops 1 0 1 1 1Outcome indicators 2014 Actual 2015 Planned 2016 Planned 2017 Estimate 2018 EstimateCost share dollars obtained 53,000 53,000 53,000 54,000 55,000Ordinances administered 4 4 4 4 4
KEY PERFORMANCE INDICATORS
Assumptions and factors affecting program performance:State funding for cost share and grant $ always somewhat uncertainDegree of landowner cooperation
PROGRAM PERFORMANCE INFORMATIONKEY PROGRAM STRATEGIES FOR 2015
Improve dept ability to develop conservation and nutrient mgmt plansContinue strong administration/advancement of DNR lake grants
Employ LIDAR for watershed analysis, structural conservation practice designCodification of Polk County Manure and Water Quality Management Ordinance
KEY PROGRAM STRATEGIES 2016
2nd staffing person obtaining CCA certificationGrant obligations fulfilled
22‐02Ch. 92 Soil & Water Conservation & Animal Waste Management, Administration
Administer conservation programs, ordinances, budgets, staffing plans, reports and records.
PROGRAM REVENUES AND EXPENDITURES
179
Land and Water Department

Program name:
Program number:
Program objective:
2014 Actual 2015 Budget 2016 Budget2017 Forward
Estimate2018 Forward
EstimateRevenueGeneral Property Tax 94,860 96,630 100,043 100,595 105,381 Other Revenues 74,554 55,825 54,358 54,358 54,358 Total Revenue 169,414 152,455 154,401 154,952 159,739
Recurrent Expenditure 152,342 152,512 156,390 156,594 160,643 Capital/One‐time ExpenditureTotal Expenditure 152,342 152,512 156,390 156,594 160,643 Net Revenue and Expenditures 17,072 (57) (1,989) (1,642) (904)
Output indicators 2014 Actual 2015 Planned 2016 Planned 2017 Estimate 2018 EstimateAssist with lake mgmt plans 8 plans 4 plans 5 plans 5 plans 5 plansCounty AIS strategic plan 0 plans 1 plan plan review plan review plan reviewOutcome indicators 2014 Actual 2015 Planned 2016 Planned 2017 Estimate 2018 EstimateLake mgmt plans approved by DNR 4 plans 0 plans 2 plans 2 plans 2 plansCounty AIS strategic plan review 0 1 1 1 1
Attempt to obtain georeference software for watershed and lakeshore inventoriesEmploy LIDAR data for watershed delineation and runoff analysis
KEY PROGRAM STRATEGIES 2016
KEY PERFORMANCE INDICATORS
Assumptions and factors affecting program performance:DNR grants dependent on funding, scoring, and level of competition; Participation by lake groups voluntary; AIS problems difficult to predict
PROGRAM PERFORMANCE INFORMATIONKEY PROGRAM STRATEGIES FOR 2015
Prevent or control AISWatershed management for water quality improvementShoreland runoff mitigation
Strengthen partnerships with local lake and river protection groups
AIS protocol conducted on 6 lakesCollected data for 5 lake management plans22 shoreland runoff mitigation plans/projects reviewed
22‐03
NR190 Lake Management/Protection & NR40 Invasive Species Prevention/Control NR115 Shoreland Protection
Inlake, near shore, and watershed management for water quality improvement, prevent or control aquatic invasive species (AIS)
PROGRAM REVENUES AND EXPENDITURES
180
Land and Water Department

Program name:Program number:Program objective:
2014 Actual 2015 Budget 2016 Budget2017 Forward
Estimate2018 Forward
EstimateRevenueGeneral Property TaxOther Revenues (44357) 20,585 20,000 21,000 21,000 21,000 Total Revenue 20,585 20,000 21,000 21,000 21,000
Recurrent Expenditure 19,871 19,893 20,399 20,425 20,953 Capital/One‐time ExpenditureTotal Expenditure 19,871 19,893 20,399 20,425 20,953 Net Revenue and Expenditures 714 107 601 575 47
Output indicators 2014 Actual 2015 Planned 2016 Planned 2017 Estimate 2018 EstimateMines in compliance with permits 64 mines 64 mines 65 mines 65 mines 66 mines
Outcome indicators 2014 Actual 2015 Planned 2016 Planned 2017 Estimate 2018 EstimateReclaimed mine areas 1 mine 1 area 1 area 2 areas 2 areas
KEY PERFORMANCE INDICATORS
Assumptions and factors affecting program performance:New employee continues to administer program in compliance with NR135
PROGRAM PERFORMANCE INFORMATIONKEY PROGRAM STRATEGIES FOR 2015
Restructure staff workload and maintain compliance with NR135
Administer program using GPS technology to measure active acres in mines
KEY PROGRAM STRATEGIES 2016New staff person trained, compliance with NR135
22‐04NR135 Nonmetallic Mine Reclamation
Reclaim mine sites
PROGRAM REVENUES AND EXPENDITURES
181
Land and Water Department

Program name:Program number:Program objective:
2014 Actual 2015 Budget 2016 Budget2017 Forward
Estimate2018 Forward
EstimateRevenueGeneral Property TaxOther Revenues 38,778 27,500 36,500 36,500 36,500 Total Revenue 38,778 27,500 36,500 36,500 36,500 revenues 46821 47380 47382 37435Recurrent Expenditure 33,118 33,155 33,998 34,042 34,922 Capital/One‐time ExpenditureTotal Expenditure 33,118 33,155 33,998 34,042 34,922 Net Revenue and Expenditures 5,660 (5,655) 2,502 2,458 1,578
Output indicators 2014 Actual 2015 Planned 2016 Planned 2017 Estimate 2018 EstimateRevenue from other counties 8,900 5,000 5,000 5,000 5,000Rev from lake districts, muni's 31,350 22,500 23,000 23,500 24,000
Maintain revenues while pursuing goal of Land & Water Res Mgmt Plan
Maintain revenues while increasing coordination with Land & Water Resource Management Plan goalsKEY PROGRAM STRATEGIES 2016
KEY PERFORMANCE INDICATORS
Assumptions and factors affecting program performance:Demand for contracted services is difficult to predict from year to year, and is dependent on economic conditions.Revenues derived from contracted services is dependent on staff time availability, as dictated by other program needs.
Tracking to meet or exceed revenue goal
Water quality improvement, wildlife habitat, revenue for staff support
PROGRAM REVENUES AND EXPENDITURES
PROGRAM PERFORMANCE INFORMATIONKEY PROGRAM STRATEGIES FOR 2015
22‐05Contracted Services Work for Lake Districts, Municipalities, etc.
182
Land and Water Department

Program name:Program number:Program objective:
2014 Actual 2015 Budget 2016 Budget 2017 Estimate 2018 EstimateRevenueGeneral Property TaxOther Revenues 19,719 21,200 21,300 21,300 21,300 Total Revenue 19,719 21,200 21,300 21,300 21,300 revenue 46812 46813Recurrent Expenditure 56112,56143 16,266 15,450 17,400 17,648 17,922 Capital/One‐time ExpenditureTotal Expenditure 16,266 15,450 17,400 17,648 17,922 Net Revenue and Expenditures 3,453 5,750 3,900 3,652 3,378
Output indicators 2014 Actual 2015 Planned 2016 Planned 2017 Estimate 2018 EstimateNumber of trees sold 12,000 12,600 12,500 12,500 12,500Tree sale gross revenue 16,300 17,000 17,250 17,500 17,750Tree sales net revenue 800 400 600 650 700
Outcome indicators 2014 Actual 2015 Planned 2016 Planned 2017 Estimate 2018 EstimateTrees sold 12,000 12,600 12,500 12,500 12,500Posters received 35 60 65 70 75Teams participating 4 4 4 5 5
KEY PERFORMANCE INDICATORS
Assumptions and factors affecting program performance:We use surveys to gauge customer satisfaction and future species to sell, but sales revenues are not certainTeacher class schedules are also not certain and could change student participation numbers in both contests
PROGRAM PERFORMANCE INFORMATIONKEY PROGRAM STRATEGIES FOR 2015
Maintain tree sales to generate adequate revenuePromote student poster contestPromote student soil judging contest
We will be the host county and hope to get the food donated to hold costs down.KEY PROGRAM STRATEGIES 2016
Sold 12,500 trees and generated $40035 students participated23 students participated
22‐06Tree program and conservation materials
Promote conservation education and installation of conservation practices
PROGRAM REVENUES AND EXPENDITURES
183
Land and Water Department

Program name:Program number:Program objective:
2014 Actual 2015 Budget 2016 Budget2017 Forward
Estimate2018 Forward
EstimateRevenueGeneral Property TaxOther Revenues 43583 58,539 70,000 60,200 60,200 60,200 Total Revenue 58,539 70,000 60,200 60,200 60,200
Recurrent Expenditure 56130 58,539 70,000 60,200 61,103 62,019 Capital/One‐time ExpenditureTotal Expenditure 58,539 70,000 60,200 61,103 62,019 Net Revenue and Expenditures ‐ ‐ ‐ (903) (1,819)
Output indicators 2014 Actual 2015 Planned 2016 Planned 2017 Estimate 2018 EstimateNumber of claims 28 28 28 28 28Program admin cost 58,500 48,000 49,000 50,000 51,000
Outcome indicators 2014 Actual 2015 Planned 2016 Planned 2017 Estimate 2018 EstimateValue of claims after deductible 65,300 62,000 60,000 60,000 61,000
Wildlife population levels, impacted by DNR estimates, management and weather factorsHunter participation and success rate
PROGRAM PERFORMANCE INFORMATIONKEY PROGRAM STRATEGIES FOR 2015
Reduce program costs through new technical service provider
Continue program cost reductions through stronger abatement initiatives, also resulting in less damage losses for farmersKEY PROGRAM STRATEGIES 2016
KEY PERFORMANCE INDICATORS
Assumptions and factors affecting program performance:
Costs appear to be trending lower
22‐07Wildlife Damage Abatement Claims Program
Provide farmers help with wildlife damage losses and abatement measures
PROGRAM REVENUES AND EXPENDITURES
184
Land and Water Department

2014 Actual 2015 Budget 2016 Budget Estimate EstimateRevenueGeneral Property Tax 6,972,407 7,401,059 7,360,094 7,542,496 7,727,440 State Aids 138,669 98,897 132,235 132,573 132,915 Public Charge for Services 477,420 322,040 273,850 273,850 273,850 Intergovernmental Revenue 75,428 57,100 57,100 57,100 57,100 Misc Revenue 84,359 35,450 39,500 39,500 39,500 Other Financing Sources 25,000 55,000 25,000 25,000 25,000 Total Revenue 7,773,283 7,969,546 7,887,779 8,070,519 8,255,805
ExpensePersonnel Services 6,336,237 6,363,401 6,477,712 6,643,440 6,811,456 Contractual Services 618,489 681,588 711,013 721,678 732,503 Supplies & Expenses 363,311 402,798 434,216 440,564 447,008 Fixed Charges 941 3,844 4,060 4,060 4,060 Grants, Contributions, Indem 3,806 3,500 2,750 2,750 2,750 Capital Outlay 180,292 443,087 186,000 186,000 186,000 Cost Reallocation 71,828 71,328 72,028 72,026 72,028 Total Expenditures 7,574,904 7,969,546 7,887,779 8,070,519 8,255,805 Net Revenue and Expenditures 198,379 ‐ ‐ ‐ ‐
DEPARTMENT REVENUE AND EXPENDITURES BY ECONOMIC CLASSIFICATION
LAW ENFORCEMENT: Peter M. Johnson, SheriffSECTION 1: DEPARTMENT SUMMARY
Department Description and Mission:To provide law enforcement services, emergency 911 communication services, jail facilities and emergency management services to the entire county population.MISSION:To provide professional, ethical and respectful law enforcement services to the citizens and visitors of Polk County.We believe that the best way to achieve a safe environment is through a cooperative partnership with our community.We , the men and women of the Polk County Sheriff's Department, pledge to serve our community with integrity, honor and courage.Link to County Board Strategic Goals:Promoting safe communities provides an attractive enforcement for economic development and business growthLaw enforcement presence in primary schools promotes higher quality educational environmentStrong law enforcement presence promotes voluntary compliance with traffic laws resulting in safer communitiesStrategic Priorities:
185

2014 Actual 2015 Budget 2016 Budget 2017 Budget 2018 BudgetFTE EmployeesOfficials/Administrators 2 3 2 2 2Professionals 4 3 4 4 4Technicians/Para‐Professionals 11.7 11.65 11.65 11.65 11.65First/Mid Level Officials and ManagersAdministrative Support 4.8 5 5 5 5Skilled Craft/Service Maintenance 0.5Protective Service Workers 55.46 54.94 55.44 55.44 55.44Total 77.96 78.09 78.09 78.09 78.09
2014 Actual 2015 Budget 2016 Budget Estimate EstimateLaw Enforcement and public safety, Field Services Division
3,920,507 4,195,731 4,058,812 4,145,795 4,234,608
Emergency Communication Division 921,293 1,012,425 1,004,610 1,030,687 1,057,121 Emergency Management Division 108,092 105,975 131,254 134,347 137,507 Jail Division 2,625,012 2,655,415 2,693,104 2,759,690 2,826,569 Total 7,574,904 7,969,546 7,887,779 8,070,519 8,255,805
EMPLOYMENT BY JOB CLASSIFICATION
PROGRAM SUMMARYPROGRAM EXPENDITURES
186
Law Enforcement

Program name:Program number:
Program objective:
2014 Actual 2015 Budget 2016 Budget2017 Forward
Estimate2018 Forward
EstimateRevenueGeneral Property Tax 3,594,822 3,927,871 3,802,520 3,889,165 3,977,636Other Revenues 322,071 267,860 256,292 256,630 256,972 Total Revenue 3,916,893 4,195,731 4,058,812 4,145,795 4,234,608
Recurrent Expenditure 3,920,507 4,195,731 4,058,812 4,145,795 4,234,608 Capital/One‐time ExpenditureTotal Expenditure 3,920,507 4,195,731 4,058,812 4,145,795 4,234,608 Net Revenue and Expenditures (3,614) 0 0 ‐ 0
Output indicators 2014 Actual 2015 Planned 2016 Planned 2017 Estimate 2018 EstimateCase files (investigatory files) 2,923 2,950 2,979 3,009 3,039Emergency response safety 100% 100% 100% 100% 100%Outcome indicators 2014 Actual 2015 Planned 2016 Planned 2017 Estimate 2018 EstimateUnresolved performance complaints New indicator 0 0 0 0
Violent crime arrest per occurrence New indicator New indicator 100% 100% 100%
KEY PERFORMANCE INDICATORS
Assumptions and factors affecting program performance:Generally, the department can call in off duty deputies sufficient to handle most high‐risk, low‐frequency situations. The possibility existhowever that major incident or natural disaster would exhaust local resources.
Update recreational safety programsReplace K‐9 unit
Develop firearms and use of force training facility in response to loss of borrowed facility. Develop and coordinate mental health critical incident training to staff of all divisions
KEY PROGRAM STRATEGIES 2016
partial completioncompletion
PROGRAM PERFORMANCE INFORMATIONKEY PROGRAM STRATEGIES FOR 2015
Participate in alcohol/impaired driver enforcement program full compliance and program management
PROGRAM REVENUES AND EXPENDITURES
SECTION 2: PROGRAM SUMMARY
11‐01Law Enforcement and public safety, Field Services Division
To provide the safest enforcement possible by providing professional, respectful law enforcement services
187
Law Enforcement
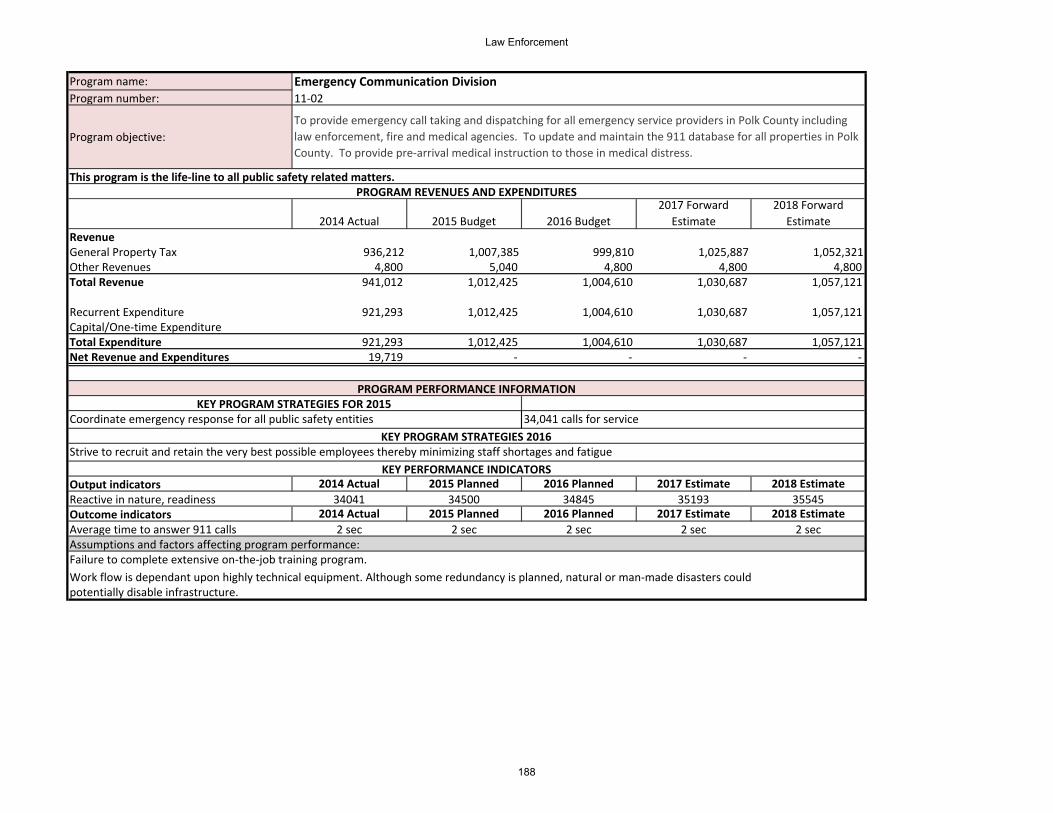
Program name:Program number:
Program objective:
2014 Actual 2015 Budget 2016 Budget2017 Forward
Estimate2018 Forward
EstimateRevenueGeneral Property Tax 936,212 1,007,385 999,810 1,025,887 1,052,321Other Revenues 4,800 5,040 4,800 4,800 4,800 Total Revenue 941,012 1,012,425 1,004,610 1,030,687 1,057,121
Recurrent Expenditure 921,293 1,012,425 1,004,610 1,030,687 1,057,121 Capital/One‐time ExpenditureTotal Expenditure 921,293 1,012,425 1,004,610 1,030,687 1,057,121 Net Revenue and Expenditures 19,719 ‐ ‐ ‐ ‐
Output indicators 2014 Actual 2015 Planned 2016 Planned 2017 Estimate 2018 EstimateReactive in nature, readiness 34041 34500 34845 35193 35545Outcome indicators 2014 Actual 2015 Planned 2016 Planned 2017 Estimate 2018 EstimateAverage time to answer 911 calls 2 sec 2 sec 2 sec 2 sec 2 sec
KEY PERFORMANCE INDICATORS
Assumptions and factors affecting program performance:Failure to complete extensive on‐the‐job training program. Work flow is dependant upon highly technical equipment. Although some redundancy is planned, natural or man‐made disasters could potentially disable infrastructure.
KEY PROGRAM STRATEGIES FOR 2015Coordinate emergency response for all public safety entities
Strive to recruit and retain the very best possible employees thereby minimizing staff shortages and fatigueKEY PROGRAM STRATEGIES 2016
34,041 calls for service
PROGRAM PERFORMANCE INFORMATION
11‐02Emergency Communication Division
To provide emergency call taking and dispatching for all emergency service providers in Polk County including law enforcement, fire and medical agencies. To update and maintain the 911 database for all properties in Polk County. To provide pre‐arrival medical instruction to those in medical distress.
This program is the life‐line to all public safety related matters. PROGRAM REVENUES AND EXPENDITURES
188
Law Enforcement
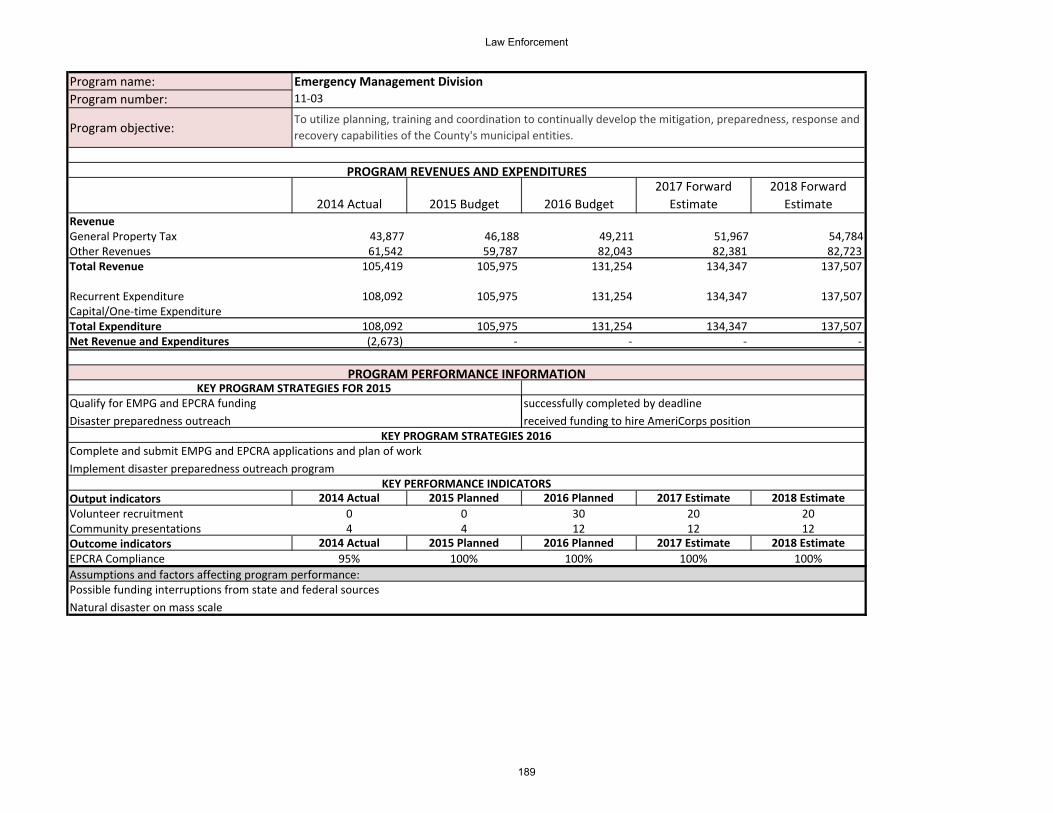
Program name:Program number:
Program objective:
2014 Actual 2015 Budget 2016 Budget2017 Forward
Estimate2018 Forward
EstimateRevenueGeneral Property Tax 43,877 46,188 49,211 51,967 54,784Other Revenues 61,542 59,787 82,043 82,381 82,723 Total Revenue 105,419 105,975 131,254 134,347 137,507
Recurrent Expenditure 108,092 105,975 131,254 134,347 137,507 Capital/One‐time ExpenditureTotal Expenditure 108,092 105,975 131,254 134,347 137,507 Net Revenue and Expenditures (2,673) ‐ ‐ ‐ ‐
Output indicators 2014 Actual 2015 Planned 2016 Planned 2017 Estimate 2018 EstimateVolunteer recruitment 0 0 30 20 20Community presentations 4 4 12 12 12Outcome indicators 2014 Actual 2015 Planned 2016 Planned 2017 Estimate 2018 EstimateEPCRA Compliance 95% 100% 100% 100% 100%
Disaster preparedness outreach
Complete and submit EMPG and EPCRA applications and plan of workImplement disaster preparedness outreach program
KEY PROGRAM STRATEGIES 2016
KEY PERFORMANCE INDICATORS
Assumptions and factors affecting program performance:Possible funding interruptions from state and federal sourcesNatural disaster on mass scale
PROGRAM PERFORMANCE INFORMATIONKEY PROGRAM STRATEGIES FOR 2015
Qualify for EMPG and EPCRA funding successfully completed by deadline
11‐03Emergency Management Division
To utilize planning, training and coordination to continually develop the mitigation, preparedness, response and recovery capabilities of the County's municipal entities.
PROGRAM REVENUES AND EXPENDITURES
received funding to hire AmeriCorps position
189
Law Enforcement

Program name:Program number:
Program objective:
2014 Actual 2015 Budget 2016 Budget2017 Forward
Estimate2018 Forward
EstimateRevenueGeneral Property Tax 2,397,496 2,419,615 2,486,054 2,552,640 2,619,519Other Revenues 412,463 235,800 207,050 207,050 207,050 Total Revenue 2,809,959 2,655,415 2,693,104 2,759,690 2,826,569
Recurrent Expenditure 2,625,012 2,655,415 2,693,104 2,759,690 2,826,569 Capital/One‐time ExpenditureTotal Expenditure 2,625,012 2,655,415 2,693,104 2,759,690 2,826,569 Net Revenue and Expenditures 184,948 ‐ ‐ ‐ ‐
Output indicators 2014 Actual 2015 Planned 2016 Planned 2017 Estimate 2018 EstimateCost per inmate day $80.77 $81.57 $82.39 $83.21 $84.04 Intra‐department training hours 24 24 24 28 28Mental Health critical incident train 0 0 8 hrs 8 hrs 8 hrsOutcome indicators 2014 Actual 2015 Planned 2016 Planned 2017 Estimate 2018 EstimateAnnual state inspection compliance minor violations Full compliance Full compliance Full compliance Full compliance
KEY PERFORMANCE INDICATORS
Assumptions and factors affecting program performance:Dependant upon ability to recruit and retain qualified staff Trends and programs seeking alternatives to incarcerationCost per inmate day can fluctuate greatly depending upon sentencing and criminal trends
Develop and implement educational programs for inmates
Expand self help video library programmingCommunity Service programHuber compliance monitor program
KEY PROGRAM STRATEGIES 2016
PROGRAM PERFORMANCE INFORMATIONKEY PROGRAM STRATEGIES FOR 2015
11‐04Jail Division
To provide a secure and safe environment for pre‐trial and convicted inmate under the direction of the courts.
PROGRAM REVENUES AND EXPENDITURES
Establish/maintain library several faith based programs ‐ optional
190
Law Enforcement

Logical Frameworks, Law Enforcement Field Services ($4.1million in expenditures)
Narrative summary Performance Indicators Monitoring & Evaluation Assumptions/Risk
Impact Improved quality of life: public safety
Perception of crime and highway safety
Survey of residents (TBD)
Results Reduced traffic and criminal law violations in areas under County jurisdiction
1. Property crimes2. Traffic accidents
1. State of Wisconsin Office of Justice Assistance
2. Wisconsin Department of Transportation
No significant increase in traffic or population shifts
Outputs Law enforcement within the County
Number of arrests State of Wisconsin Office of Justice Assistance
Other jurisdictions within the County do not cut law enforcement No significant traffic growth or influx of new violators Average number of adverse weather events
Activities 1. Road patrols 2. Crime investigation 3. Accident investigation 4. Public safety activities
Person‐hours of activities Internal records Adequate funding for needed activities
Corrections ($2.7 million in expenditures)
Narrative summary Performance Indicators Monitoring & Evaluation Assumptions/Risk Impact An improved quality of life: public
safety Perception of crime Survey (TBD)
Results Reduction in recidivism Recidivism rate Internal records No major increase in overall crime rate
Outputs Safe and secure detention for all inmates
1. Findings of non‐compliance in jail inspection report
2. Hours of activities provided per week
1. State of Wisconsin Department of Corrections
2. Internal records
Appropriate legal and correctional activities occur
Activities 1. Guarding jail population2. Providing food and exercise 3. Transporting prisoners
Jail population Internal records No large increase in number of inmates or increase in potentially violent inmates
191
Law Enforcement

Emergency Communications ($1.0 million in expenditures)
Narrative summary Performance Indicators Monitoring & Evaluation Assumptions/Risk Impact An improved quality of life: public
safety Perception of emergency response
Survey (TBD)
Results Reduced loss of life, injury severity and damage to property
Accidental death rate Medical examiner records No increase in accident severity; no major catastrophic event
Outputs Appropriate emergency response resources delivered promptly
Average response time Internal records Emergency responders are adequately trained and equipped; emergency medical care availability remains at current level
Activities 2. Answer calls 3. Ascertain level of medical
emergency 4. Dispatch emergency
responders
Annual training level for dispatchers
Internal records No change in level of emergency response assets
192
Law Enforcement

2014 Actual 2015 Budget 2016 Budget2017 Forward
Estimate2018 Forward
EstimateRevenueGeneral Property Tax ‐ ‐ ‐ ‐ ‐ Public Charge for Services 560,099 651,000 664,100 664,100 664,100 Total Revenue 560,099 651,000 664,100 664,100 664,100
ExpenseOperating Expense (41,046) ‐ ‐ ‐ ‐ Personnel Services 271,388 269,395 277,309 284,764 292,397 Contractual Services 101,671 125,782 125,103 126,980 128,884 Supplies & Expenses 102,080 80,470 80,524 81,732 82,958 Fixed Charges 114,749 6,500 6,600 6,600 6,600 Capital Outlay ‐ 100,000 40,000 40,000 40,000 Cost Reallocation 100,000 113,000 100,000 82,200 50,000 Total Expenditures 648,843 695,147 629,536 622,275 600,839 Net Revenue and Expenditures (88,744) (44,147) 34,564 41,825 63,261
2014 Actual 2015 Budget 2016 Budget 2017 Budget 2018 BudgetFTE EmployeesOfficials/Administrators 1 1 1 1 1Technicians/Para‐Professionals 1 1Skilled Craft/Service Maintenance 1.99 1.99 3 3 3Total 3.99 3.99 4 4 4
DEPARTMENT REVENUE AND EXPENDITURES BY ECONOMIC CLASSIFICATION
EMPLOYMENT BY JOB CLASSIFICATION
Design good land use practices that recognize distinctionsPreserve and enhance the environmentStrategic Priorities:To continue to assist the agricultural industry through the provision of high‐quality, affordable lime products
Promote the agricultural industry though a respectable, viable and diverse farm economy
LIME QUARRY Dave Peterson, DirectorSECTION 1: DEPARTMENT SUMMARY
Department Description and Mission:Limestone aggregate and agricultural lime mining, production and sales
To serve the farmers, contractors, municipalities, county departments and public by selling lime and limestone products.Link to County Board Strategic Goals:
193

Program name:Program number:Program objective:
2014 Actual 2015 Budget 2016 Budget2017 Forward
Estimate2018 Forward
EstimateRevenueGeneral Property Tax 0 0 0 0 0Other Revenues 560,099 651,000 664,100 664,100 664,100 Total Revenue 560,099 651,000 664,100 664,100 664,100
Recurrent Expenditure 648,843 695,147 629,536 622,275 600,839 Capital/One‐time ExpenditureTotal Expenditure 648,843 695,147 629,536 622,275 600,839 Net Revenue and Expenditures (88,744) (44,147) 34,564 41,825 63,261
Output indicators 2014 Actual 2015 Planned 2016 Planned 2017 Estimate 2018 EstimateTonage sales 64,912 64,000 66,000 68,000 70,000Outcome indicators 2014 Actual 2015 Planned 2016 Planned 2017 Estimate 2018 EstimateRevenue $560,099 $651,000 $664,100 $675,000 $700,000Expenses $648,843 $695,147 $629,536 $630,000 $601,000
KEY PERFORMANCE INDICATORS
Assumptions and factors affecting program performance:1. Sales of ag lime are very dependant on the farming economy. When crop prices are good, more ag lime will be applied to the rented ground. When commodity prices are low, only maintenance lime is added to producer owned land.
2. Sale of all other products are dependent on construction. More gravel and landscape rock will be used when construction is high.
1. Purchase a hammer impact for our trackhoe which will allow us to reduce rocks that are to big to be used in crushing operation. This will also allow leveling outcropping before the drilling process. Saving added expences for drilling on even ground.
2.Reclaim area in south pit that must be deeded back
KEY PROGRAM STRATEGIES 2016
PROGRAM PERFORMANCE INFORMATIONKEY PROGRAM STRATEGIES FOR 2015
1. Purchase a replacement loader before trade in values drop off.2. Improvements to increase ag‐lime productivity.
3. Logged off forested area to recieve a value for the wood.
In July we purchased a Volvo loader, under budgeted costsUpgraded screening design and ceramic crusher shoes to reduce maintenance down time.In cooperation with the County Forester, we clear‐cut the area for mining and received a value for these trees.
PROGRAM REVENUES AND EXPENDITURES
SECTION 2: PROGRAM SUMMARY
23‐01Lime production and sales
To continue to increase the sale of quality lime products
194
Lime Quarry

2014 Actual 2015 Budget 2016 Budget2017 Forward
Estimate2018 Forward
EstimateRevenueGeneral Property Tax 101,610 101,538 103,128 106,336 109,614 License & Fees 42,140 38,332 38,332 38,332 38,332 Total Revenue 143,750 139,870 141,460 144,668 147,946
ExpensePersonnel Services 87,112 88,626 90,854 93,302 95,811 Contractual Services 41,192 42,444 42,306 42,940 43,584 Supplies & Expenses 3,747 8,800 8,300 8,426 8,551 Total Expenditures 132,051 139,870 141,460 144,668 147,946 Net Revenue and Expenditures 11,699 ‐ ‐ ‐ ‐
2014 Actual 2015 Budget 2016 Budget 2017 Budget 2018 BudgetFTE EmployeesOfficials/Administrators 0.6 0.6 0.6 0.6 0.6Professionals 0.11 0.11 0.11 0.11Technicians/Para‐Professionals 0.18Total 0.78 0.71 0.71 0.71 0.71
DEPARTMENT REVENUE AND EXPENDITURES BY ECONOMIC CLASSIFICATION
EMPLOYMENT BY JOB CLASSIFICATION
MEDICAL EXAMINER John B Dinnies, Chief Medical ExaminerSECTION 1: DEPARTMENT SUMMARY
Department Description and Mission:The department undertakes death investigations in unexplained circumstances, homicide, suicide, poisoning or accidents as well as when cremation has been requested.
MISSION: To provide death investigation services that honor those who have died by providing scientific, consistent and compassionate investigation into the circumstances of death.Link to County Board Strategic Goals:To serve the Court and the public with integrity.Strategic Priorities:
195

Program name:Program number:Program objective:
2014 Actual 2015 Budget 2016 Budget2017 Forward
Estimate2018 Forward
EstimateRevenueGeneral Property Tax 101610 101538 103128 106336 109614Other Revenues 42,140 38,332 38,332 38,332 38,332 Total Revenue 143,750 139,870 141,460 144,668 147,946
Recurrent Expenditure 132,051 139,870 141,460 144,668 147,946 Capital/One‐time ExpenditureTotal Expenditure 132,051 139,870 141,460 144,668 147,946 Net Revenue and Expenditures 11,699 ‐ ‐ ‐ ‐
Output indicators 2014 Actual 2015 Planned 2016 Planned 2017 Estimate 2018 EstimateNumber of cases investigated 338 345 350 355 360Outcome indicators 2014 Actual 2015 Planned 2016 Planned 2017 Estimate 2018 EstimateRevenue from services 42,140 38,332 38,332 38,332 38,332
KEY PERFORMANCE INDICATORS
Assumptions and factors affecting program performance:Deputy Medical Examiners compensation remains adequate. Note that the Wisconsin Legislature froze fees for 2015 and 2016, allowing an increase only for inflation.
PROGRAM REVENUES AND EXPENDITURES
I'd like to get even more high tech with the ability to accept credit card payment for cremation permits that we issue. I'd like to be able to purchase portable scanners for myself and my deputies to document personal items and property. I'd love to see dispatch get the technology to send texts to me and my deputies instead of calling on the phone.
KEY PROGRAM STRATEGIES 2016
PROGRAM PERFORMANCE INFORMATIONKEY PROGRAM STRATEGIES FOR 2015
Collection of fees related to the officeElectronic death certification
We've achieved our goal of nearly 96% collectioncompleted successfully
SECTION 2: PROGRAM SUMMARY
04‐01Medical Examiner
To provide scientific, consistent and compassionate investigations
196
Medical Examiner

2014 Actual 2015 Budget 2016 Budget 2017 Forward Estimate 2018 Forward EstimateRevenueGeneral Property Tax 848,464 828,108 858,010 887,461 916,790 State Aids 817,754 786,018 980,884 947,884 966,430 Public Charge for Services 688,674 623,828 627,874 639,280 650,617 Intergovernmental Revenue 1,500 20,127 12,385 17,032 17,246 Other Financing Sources ‐ 1,855 ‐ ‐ ‐ Total Revenue 2,356,393 2,259,936 2,479,153 2,491,657 2,551,083
ExpenseOperating Expense 12,536 8,336 7,740 7,740 7,740Personnel Services 1,803,618 1,833,280 1,907,869 1,959,935 2,011,892 Contractual Services 215,383 261,382 311,261 310,176 314,829 Supplies & Expenses 145,972 129,604 226,170 187,686 190,502 Fixed Charges 30,015 22,591 22,813 22,821 22,821 Grants, Contributions, Indem 2,264 3,042 3,300 3,300 3,300 Capital Outlay ‐ 1,700 ‐ ‐ ‐ Total Expenditures 2,209,788 2,259,936 2,479,153 2,491,658 2,551,083 Net Revenue and Expenditures 146,605 (0) ‐ (1) 0
Strategic Priorities:To track and investigate health problems and hazard in the communityTo prepare for and respond to public health emergencies
To develop, apply and enforce policies, laws and regulations that improve health and ensure safety
POLK COUNTY HEALTH DEPARTMENT Gretchen Sampson, Director/Health OfficerSECTION 1: DEPARTMENT SUMMARY
Department Mission: Promoting, Protecting, and Preserving Health Through Partnerships with People and CommunitiesLink to County Board Strategic Goals:To Serve the public with integrity; To preserve and enhance the environment
To lead efforts to mobilize communities around important health issuesTo link people to needed health services
DEPARTMENT REVENUE AND EXPENDITURES BY ECONOMIC CLASSIFICATION
To achieve excellence in public health practice through a trained workforce, evaluation , and evidenced based programs
197

2014 Actual 2015 Budget 2016 Budget 2017 Budget 2018 BudgetFTE EmployeesOfficials/Administrators 1 1 1 1 1Professionals 16.76 15.39 15.1 15.1 15.64Technicians/Para‐Professionals 1.25 0.4 0.45 0.45 0.45Administrative Support 6.85 6.93 6.95 6.95 6.95Skilled Craft/Service Maintenance 0.03 0 0 0 0Total 25.89 23.72 23.5 23.5 24.04
2014 Actual 2015 Budget 2016 Budget 2017 Forward Estimate 2018 Forward EstimatePublic Health 840,619 852,072 879,089 902,834 926,341 WHEPP (WI Hospital Emergency Preparedness Program) 8,628 102,145 157,500 159,860 162,256 Western Wisconsin Public Health Readiness Consortium & Local Preparedness Planning
150,875 152,556 166,369 170,422 174,461
Birth to 3 262,539 246,846 265,454 271,160 276,981 Suicide Prevention 33,683 ‐ ‐ ‐ ‐ WIC (Women, Infant and Children Nutrition Program) 204,560 203,441 213,494 216,103 221,441 Prenatal Care Coordination (PNCC) 63,509 66,058 64,834 66,675 68,442 MJC Tobacco 174,988 149,623 158,566 162,742 167,017 Reproductive Health (RHS) 183,056 177,560 168,036 172,271 176,400 MCH Car Seat 123 ‐ ‐ ‐ ‐ Immunization 38,208 60,322 51,900 52,876 53,871 Consolidated Contract 59,233 51,389 108,311 108,390 110,901 Environmental Health 182,121 188,989 194,626 198,981 203,427 Radon Information Center 7,646 8,935 9,135 9,343 9,544 RTAC ‐ ‐ 41,838 ‐ ‐ Total 2,209,788 2,259,936 2,437,315 2,491,658 2,551,083
EMPLOYMENT BY JOB CLASSIFICATION
PROGRAM SUMMARYPROGRAM EXPENDITURES
198
Public Health

Program name:
Program number:
Program objective:
2014 Actual 2015 Budget 2016 Budget 2017 Forward Estimate 2018 Forward EstimateRevenueGeneral Property Tax 725,955 705,599 735,643 759,388 782,895 Other Revenues 199,367 146,473 143,446 143,446 143,446 Total Revenue 925,322 852,072 879,089 902,834 926,342
Recurrent Expenditure 840,619 852,072 879,089 902,834 926,341 Capital/One‐time ExpenditureTotal Expenditure 840,619 852,072 879,089 902,834 926,341 Net Revenue and Expenditures 84,702 ‐ ‐ 0 0
Work with partners to conduct an updated community health needs assessment (CHA)Assess progress of Community Health Improvement Plan (CHIP) and update community
14‐01
To improve the health of the community, assure access to care for Polk County inmates, assure access to healthcare financing for Polk County residents, maintain standards for ongoing national accreditation, and to become nationally accredited by Public Health Accreditation Board.
Public Health
KEY PROGRAM STRATEGIES 2016
Program 14‐01 continued onto next page
SECTION 2: PROGRAM DATA
Maintain standards for ongoing national accreditationUpdate staff public health core competency assessments and training plans
PROGRAM REVENUES AND EXPENDITURES
PROGRAM PERFORMANCE INFORMATIONKEY PROGRAM STRATEGIES FOR 2015
Update 2014 CHIP based on results of 2015 CHAAssure smooth leadership transition for Health Officer positionMaintain standards for ongoing national accreditationContinue to facilitate CHIP workgroups addressing CHIP implementationExplore electronic application (app) for health department services
CHA process completed by end of yearCHIP update completed August, 2015Staff competency assessments and training plans completed Annual accreditation report to PHAB approved
199
Public Health
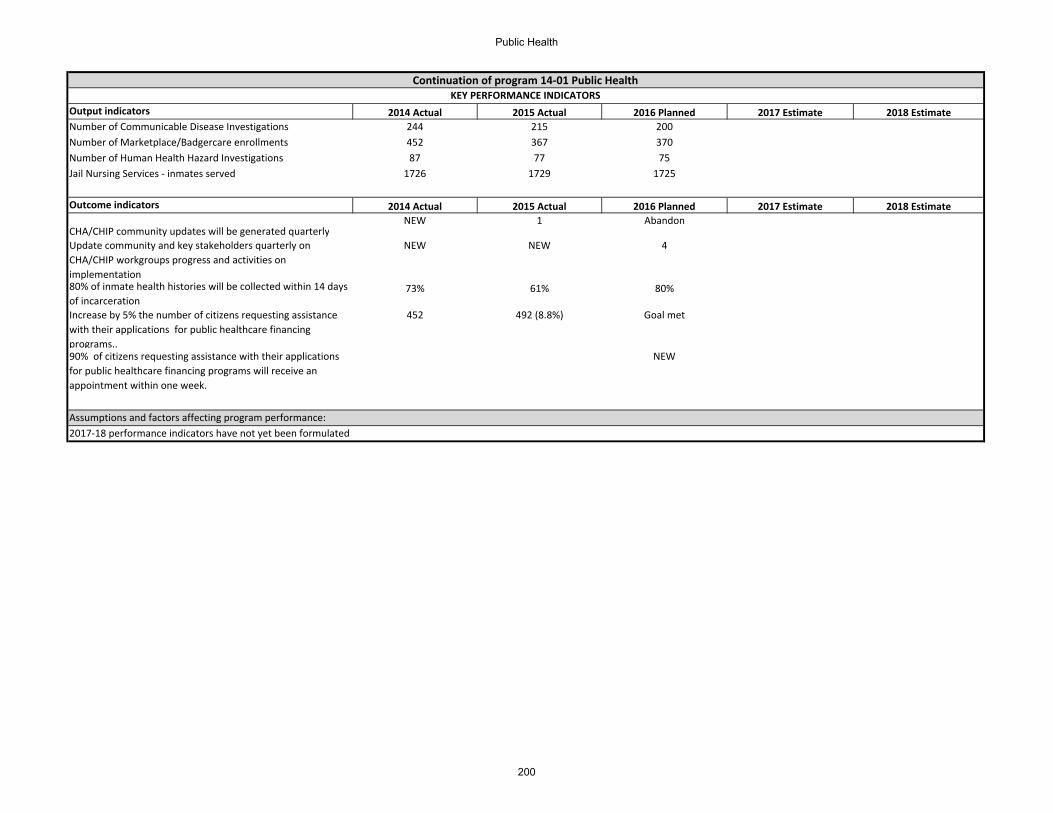
Output indicators 2014 Actual 2015 Actual 2016 Planned 2017 Estimate 2018 EstimateNumber of Communicable Disease Investigations 244 215 200Number of Marketplace/Badgercare enrollments 452 367 370Number of Human Health Hazard Investigations 87 77 75Jail Nursing Services ‐ inmates served 1726 1729 1725
Outcome indicators 2014 Actual 2015 Actual 2016 Planned 2017 Estimate 2018 Estimate
CHA/CHIP community updates will be generated quarterlyNEW 1 Abandon
Update community and key stakeholders quarterly on CHA/CHIP workgroups progress and activities on implementation
NEW NEW 4
80% of inmate health histories will be collected within 14 days of incarceration
73% 61% 80%
Increase by 5% the number of citizens requesting assistance with their applications for public healthcare financing programs..
452 492 (8.8%) Goal met
90% of citizens requesting assistance with their applications for public healthcare financing programs will receive an appointment within one week.
NEW
Continuation of program 14‐01 Public HealthKEY PERFORMANCE INDICATORS
Assumptions and factors affecting program performance:2017‐18 performance indicators have not yet been formulated
200
Public Health

Program name:Program number:Program objective:
2014 Actual 2015 Budget 2016 Budget 2017 Forward Estimate 2018 Forward EstimateRevenueGeneral Property TaxOther Revenues 25,536 102,145 157,500 159,860 162,256 Total Revenue 25,536 102,145 157,500 159,860 162,256
Recurrent Expenditure 8,628 102,145 157,500 159,860 162,256 Capital/One‐time ExpenditureTotal Expenditure 8,628 102,145 157,500 159,860 162,256 Net Revenue and Expenditures 16,908 ‐ ‐ (0) 0
Output indicators 2014 Actual 2015 Planned 2016 Planned 2017 Estimate 2018 EstimatePercent of WWIHCC expense claims successfully processed 100% 100% 100%
Outcome indicators 2014 Actual 2015 Actual 2016 Planned 2017 Estimate 2018 EstimateBudget developed in concert with NWWiHCC Coordinator and Board
Completed Completed Goal Met
Fiscal reporting conducted according to DHS guidance Completed Completed Goal Met
14‐02WHEPP (WI Hospital Emergency Preparedness Program)
PROGRAM PERFORMANCE INFORMATIONKEY PROGRAM STRATEGIES FOR 2015
Maintain fiscal agent status for the NWWiHCC
Continue as Fiscal Agent.KEY PROGRAM STRATEGIES 2016
To act as fiscal agent for Northwestern WI Health Care Coalition
PROGRAM REVENUES AND EXPENDITURES
KEY PERFORMANCE INDICATORS
Assumptions and factors affecting program performance:The transition from WHEPP to the healthcare coalitions has gone smoothly. DHS has hired staff on a contractual basis. Staff are working well with fiscal agent.The Public Health Preparedness Director has been elected to the NWWiHCC Board.
WHEPP has successfully transitioned to a regional healthcare coalition model. Staff are now DHS employees; new bylaws and a board of directors has been established. PCHD is fiscal agent for staff and coalition member expenses and special projects.
201
Public Health

Program name:
Program number:
Program objective:
2014 Actual 2015 Budget 2016 Budget 2017 Forward Estimate 2018 Forward EstimateRevenueGeneral Property TaxOther Revenues 131,921 152,556 166,369 170,422 174,461 Total Revenue 131,921 152,556 166,369 170,422 174,461
Recurrent Expenditure 150,875 152,556 166,369 170,422 174,461 Capital/One‐time ExpenditureTotal Expenditure 150,875 152,556 166,369 170,422 174,461 Net Revenue and Expenditures (18,954) ‐ ‐ (0) 0
Assure staff trained in PPE, NIMS and ICS Participate in a regional exercise
14‐03
To prepare Consortium local health departments to plan for and respond to public health emergencies.To prepare PCHD to plan for and respond to public health emergencies.
PROGRAM REVENUES AND EXPENDITURES
Western Wisconsin Public Health Readiness Consortium & Local Preparedness Planning
Complete a local or regional mass fatality planComplete administrative requirements (budget, PCA portal contacts, PODs update, technology update)
KEY PROGRAM STRATEGIES 2016
Program 14‐03 continued onto next page
PROGRAM PERFORMANCE INFORMATIONKEY PROGRAM STRATEGIES FOR 2015
Complete online CPG assessments/surveys and identify/address gaps in top 3 of 3 CPG areas
Participate in a regional exercise and post AAR to PCA portalComplete a local mass fatality plan; address capability gaps and target improvementsParticipate in regional WI‐Trac trainingUpdate the local Hazard Vulnerability Assessment
All deliverables met; Fatality management work extended to 2015‐16 grant yearextended to 2015‐16 grant year.
202
Public Health

Output indicators 2014 Actual 2015 Actual 2016 Planned 2017 Estimate 2018 EstimateConsortium sponsored trainings attended by Department Staff 100% 100%
Outcome indicators 2014 Actual 2015 Actual 2016 Planned 2017 Estimate 2018 EstimatePercent of WWPHRC member agencies will have a completed Fatality Management Plan
20% 90% Goal met
Primary community services division emergency staff will annually participate in at least 4 preparedness capability or PHEP related trainings per year
2 3 4
Continuation of program 14‐03 Western WI Public Health Readiness Consortium & Local Preparedness Planning
KEY PERFORMANCE INDICATORS
Assumptions and factors affecting program performance:Activities are prescribed by DHS according to grant guidance
203
Public Health

Program name:Program number:
Program objective:
2014 Actual 2015 Budget 2016 Budget 2017 Forward Estimate 2018 Forward EstimateRevenueGeneral Property Tax 122,509 122,509 122,367 128,073 133,894 Other Revenues 139,811 124,337 143,087 143,087 143,087 Total Revenue 262,320 246,846 265,454 271,160 276,981
Recurrent Expenditure 262,539 246,846 265,454 271,160 276,981 Capital/One‐time ExpenditureTotal Expenditure 262,539 246,846 265,454 271,160 276,981 Net Revenue and Expenditures (219) (0) ‐ ‐ ‐
Output indicators 2014 Actual 2015 Planned 2016 Planned 2017 Estimate 2018 EstimateNumber of children served 90 96 90Number of children transitioned to other services at age 3 39 39 35
Number of Therapy visits 1535 1178 1175Number of Service Coordination visits 340 386 350
PROGRAM REVENUES AND EXPENDITURES
Continue to strengthen coaching model of service provision with one team serving all of Polk CountyContinue to outreach families to assure eligible children receive services
New model of service implemented and functioning well
KEY PERFORMANCE INDICATORS
KEY PROGRAM STRATEGIES 2016
PROGRAM PERFORMANCE INFORMATIONKEY PROGRAM STRATEGIES FOR 2015
Continuation of coaching model of service provision with one team serving all of Polk County
14‐04Birth to 3
To provide early intervention services to families with children with disabilities or developmental delays.
Program 14‐04 continued onto next page
204
Public Health

Outcome indicators 2014 Actual 2015 Actual 2016 Planned 2017 Estimate 2018 EstimateThe program will continue the transition to the primary coaching model of service by completing a Self‐Assessment of the Implementation Process
NEW COMPLETE
100% of children exiting the Birth to 3 Program at age 3 will receive timely transition to the Local Education Agency (LEA)
NEW
Assumptions and factors affecting program performance:2017 ‐18 performance indicators not yet establishedFamilies are very complex with many social and behavioral health related problems. Many are dually served by Behavioral Health & Dept. of Children/Families
Continuation of program 14‐04 Birth to 3
205
Public Health

Program name:Program number:Program objective:
2014 Actual 2015 Budget 2016 Budget 2017 Forward Estimate 2018 Forward EstimateRevenueGeneral Property TaxOther Revenues 33,919 ‐ ‐ ‐ ‐ Total Revenue 33,919 ‐ ‐ ‐ ‐
Recurrent Expenditure 33,683 ‐ ‐ ‐ ‐ Capital/One‐time ExpenditureTotal Expenditure 33,683 ‐ ‐ ‐ ‐ Net Revenue and Expenditures 236 ‐ ‐ ‐ ‐
Output indicators 2014 Actual 2015 Planned 2016 Planned 2017 Estimate 2018 EstimateN/AOutcome indicators 2014 Actual 2015 Planned 2016 Planned 2017 Estimate 2018 EstimateN/A
Grant over.KEY PROGRAM STRATEGIES 2016
PROGRAM PERFORMANCE INFORMATIONKEY PROGRAM STRATEGIES FOR 2015
PCHD was fiscal agent only. This grant is now ended.
KEY PERFORMANCE INDICATORS
Assumptions and factors affecting program performance:
Successful fiscal management of the Suicide Prevention Grant.
14‐05Suicide Prevention
PROGRAM REVENUES AND EXPENDITURES
206
Public Health

Program name:Program number:
Program objective:
2014 Actual 2015 Budget 2016 Budget 2017 Forward Estimate 2018 Forward EstimateRevenueGeneral Property TaxOther Revenues 206,301 203,441 213,494 216,103 221,441 Total Revenue 206,301 203,441 213,494 216,103 221,441
Recurrent Expenditure 204,560 203,441 213,494 216,103 221,441 Capital/One‐time ExpenditureTotal Expenditure 204,560 203,441 213,494 216,103 221,441 Net Revenue and Expenditures 1,741 ‐ ‐ (0) (0)
Output indicators 2014 Actual 2015 Actual 2016 Planned 2017 Estimate 2018 EstimateNumber of unduplicated WIC participants 1239 Not available 1240Average Monthly caseload 731 718 730Support calls made to breastfeeding moms 102 48 50Number of families enrolled in Fit Families Program 62 57 50
14‐06WIC (Women, Infant and Children Nutrition Program)
To promote and maintain the health and well‐being of nutritionally at‐risk pregnant, breastfeeding and postpartum women, infants and children.
PROGRAM REVENUES AND EXPENDITURES
Expand outreach to increase program participationKEY PROGRAM STRATEGIES 2016
PROGRAM PERFORMANCE INFORMATIONKEY PROGRAM STRATEGIES FOR 2015
Implement eWIC Continue to strengthen Fit Families Program based on program evaluation report
KEY PERFORMANCE INDICATORS
Program 14‐06 continued onto next page
Successful implementation of eWICFit Families Program has strong participationBreastfeeding rates are exceeding statewide comparison but still less than state WIC but less that state WIC program goals
207
Public Health
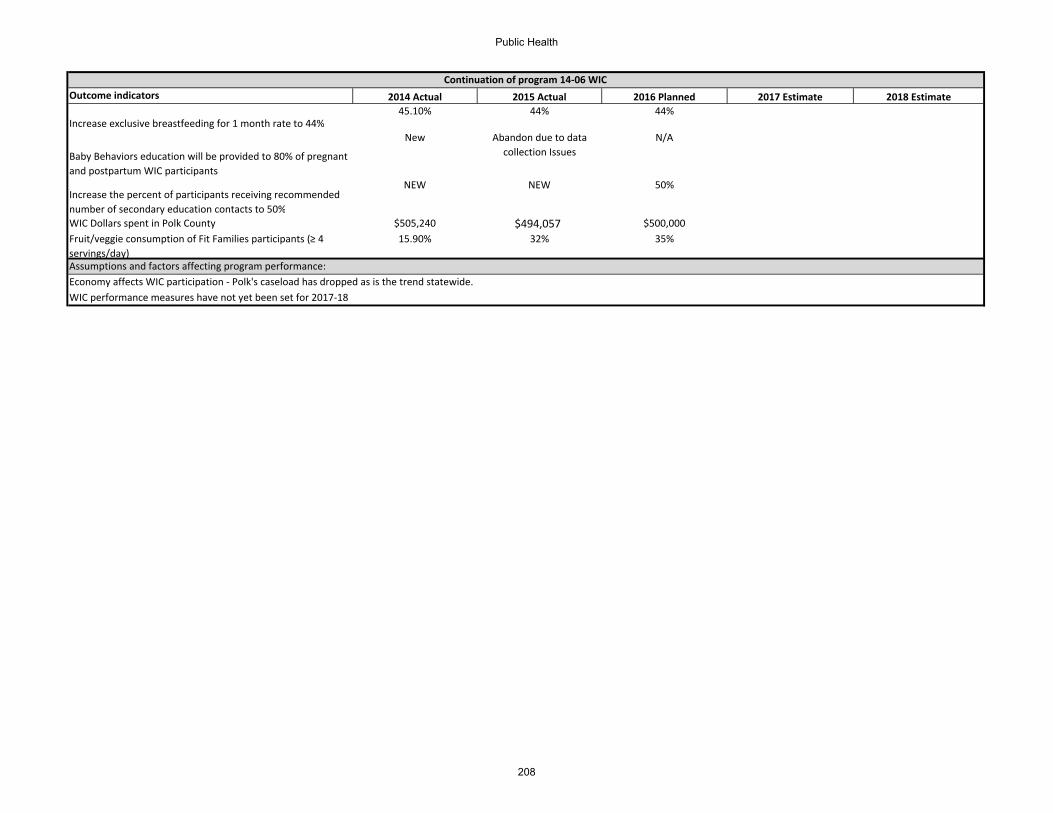
Outcome indicators 2014 Actual 2015 Actual 2016 Planned 2017 Estimate 2018 Estimate
Increase exclusive breastfeeding for 1 month rate to 44%45.10% 44% 44%
Baby Behaviors education will be provided to 80% of pregnant and postpartum WIC participants
New Abandon due to data collection Issues
N/A
Increase the percent of participants receiving recommended number of secondary education contacts to 50%
NEW NEW 50%
WIC Dollars spent in Polk County $505,240 $494,057 $500,000Fruit/veggie consumption of Fit Families participants (≥ 4 servings/day)
15.90% 32% 35%
Assumptions and factors affecting program performance:Economy affects WIC participation ‐ Polk's caseload has dropped as is the trend statewide.WIC performance measures have not yet been set for 2017‐18
Continuation of program 14‐06 WIC
208
Public Health

Program name:Program number:
Program objective:
2014 Actual 2015 Budget 2016 Budget 2017 Forward Estimate 2018 Forward EstimateRevenueGeneral Property TaxOther Revenues 88,500 66,058 64,834 66,675 68,442 Total Revenue 88,500 66,058 64,834 66,675 68,442
Recurrent Expenditure 63,509 66,058 64,834 66,675 68,442 Capital/One‐time ExpenditureTotal Expenditure 63,509 66,058 64,834 66,675 68,442 Net Revenue and Expenditures 24,991 ‐ ‐ (0) (0)
Output indicators 2014 Actual 2015 Actual 2016 Planned 2017 Estimate 2018 EstimateNumber of women enrolled 171 167Number of Nursing/RD visits 1666 1735
Outcome indicators 2014 Actual 2015 Actual 2016 Planned 2017 Estimate 2018 EstimateQuarterly reports on PNCC outcome measures will be created, analyzed and shared
NEW 2 Complete
Increase by 10 percent the number of eligible PNCC women enrolling in the First Breath Program.
37 29 Abandon
Of the PNCC women enrolled in First Breaths 60% will quit and remain smoke‐free postpartum
NEW NEW 60%
14‐07Prenatal Care Coordination (PNCC)
To promote optimal birth outcomes for low income women participating in PNCC.To create custom data collection tool in EHR to assess PNCC outcome measures. To promote optimal birth outcomes for low income women participating PNCC.
PROGRAM REVENUES AND EXPENDITURES
Tweaks in program service delivery will be made based on Medicaid audit results.KEY PROGRAM STRATEGIES 2016
PROGRAM PERFORMANCE INFORMATIONKEY PROGRAM STRATEGIES FOR 2015
Participate in Medicaid audit of PNCC programMeasure outcomes of PHN services to program participants
KEY PERFORMANCE INDICATORS
Assumptions and factors affecting program performance:Program participation influenced by WIC enrollment of pregnant women as this program interfaces with WIC2017‐18 performance measures not yet identified
Submitted all requested information. Waiting for responseReport created in EMR software
209
Public Health

Program name:Program number:Program objective:
2014 Actual 2015 Budget 2016 Budget 2017 Forward Estimate 2018 Forward EstimateRevenueGeneral Property TaxOther Revenues 182,077 149,623 158,566 162,742 167,017 Total Revenue 182,077 149,623 158,566 162,742 167,017
Recurrent Expenditure 174,988 149,623 158,566 162,742 167,017 Capital/One‐time ExpenditureTotal Expenditure 174,988 149,623 158,566 162,742 167,017 Net Revenue and Expenditures 7,089 ‐ ‐ (0) (0)
Output indicators 2014 Actual 2015 Actual 2016 Planned 2017 Estimate 2018 EstimateNumber of other tobacco product presentations in MJC area 20 7 6
Number of environmental scan for tobacco products in MJC area
29 15 15
Number of press releases about tobacco products in MJC area 24 12 12
Number of meetings with state leaders on tobacco issues 5 5 8
14‐08MJC Tobacco
To provide tobacco prevention and control activities in a 5 county jurisdiction
PROGRAM REVENUES AND EXPENDITURES
PROGRAM PERFORMANCE INFORMATIONKEY PROGRAM STRATEGIES FOR 2015
Smoke free multi‐unit housingPresentations on ecigarettes Local policy work on ecigarettes and key stakeholder education
All contract deliverables were met
Sustainability of tobacco prevention and control programmatic workSmoke free multi‐unit housingElectronic cigarette related policy workWisconsin WINS tobacco compliance investigationsYouth tobacco prevention and advocacy
Wisconsin WINS tobacco compliance investigationsYouth tobacco prevention and advocacy
KEY PROGRAM STRATEGIES 2016
KEY PERFORMANCE INDICATORS
Program 14‐08 continued onto next page
210
Public Health

Outcome indicators 2014 Actual 2015 Actual 2016 Planned 2017 Estimate 2018 EstimateDecrease rate of tobacco use for adults to 15% 19% 19% AbandonDecrease rate of high school students who have smoked cigarettes in the past 30 days to 13%
12.80% 12% Complete
Reduce the percent of retailers selling tobacco products to minors during WINS compliance investigations to 10%
12.80% 9% 10%
5% of students in 7th and 8th grade in the Amery School District will participate in FACT.
NEW NEW 5%
Assumptions and factors affecting program performance:This is a state grant funded program with prescriptive contract deliverables from DHS.2017‐18 outcome indicators not yet selected.
Continuation of program 14‐08 MJC Tobacco
211
Public Health

Program name:Program number:Program objective:
2014 Actual 2015 Budget 2016 Budget 2017 Forward Estimate 2018 Forward EstimateRevenueGeneral Property TaxOther Revenues 184,056 177,560 168,036 172,271 176,400 Total Revenue 184,056 177,560 168,036 172,271 176,400
Recurrent Expenditure 183,056 177,560 168,036 172,271 176,400 Capital/One‐time ExpenditureTotal Expenditure 183,056 177,560 168,036 172,271 176,400 Net Revenue and Expenditures 1,000 ‐ ‐ (0) 0
Output indicators 2014 Actual 2015 Actual 2016 Planned 2017 Estimate 2018 EstimateNumber of unduplicated clients 502 481 500Number of women enrolled in Badger Care Family Planning Only Services
449 312 350
Doses of emergency contraception provided in advance of actual need
277 408 350
Number of cases of Chlamydia identified 17 16 15Outcome indicators 2014 Actual 2015 Actual 2016 Planned 2017 Estimate 2018 Estimate90% of all negative pregnancy test clients not intending pregnancy will receive a prescription method and supplies the same day
89% 81% 90%
50% of contraceptive supply visit clients will be screened for STI risk factors
100% 100% Goal Met
80% of new clients will receive a standard Dual Protection Kit52% 75% 80%
Increase outreach to women in child bearing years for women's health services.KEY PROGRAM STRATEGIES 2016
PROGRAM PERFORMANCE INFORMATIONKEY PROGRAM STRATEGIES FOR 2015
Educate legislators about 340B drug pricing program and advocate for appropriate reimbursement. Conduct client satisfaction survey. Complete cost report as required by DHS.
340 B issue was addressed by legislature with Health Department current billing unchanged. A client satisfaction survey was completed and results indicate a high level of satisfaction with program services. The annual cost report was completed and sent to DHS.
14‐09Reproductive Health (RHS)
To increase the proportion of women at risk of unintended pregnancy who use contraception
PROGRAM REVENUES AND EXPENDITURES
KEY PERFORMANCE INDICATORS
Assumptions and factors affecting program performance:
212
Public Health

Program name:Program number:Program objective:
2014 Actual 2015 Budget 2016 Budget 2017 Forward Estimate 2018 Forward EstimateRevenueGeneral Property TaxOther Revenues 75 Total Revenue 75 ‐ ‐ ‐ ‐
Recurrent Expenditure 123 Capital/One‐time ExpenditureTotal Expenditure 123 ‐ ‐ ‐ ‐ Net Revenue and Expenditures (48) ‐ ‐ ‐ ‐
Output indicators 2014 Actual 2015 Planned 2016 Planned 2017 Estimate 2018 EstimateN/AOutcome indicators 2014 Actual 2015 Planned 2016 Planned 2017 Estimate 2018 EstimateN/A
14‐10MCH Car Seat
PROGRAM REVENUES AND EXPENDITURES
KEY PROGRAM STRATEGIES 2016
PROGRAM PERFORMANCE INFORMATIONKEY PROGRAM STRATEGIES FOR 2015
This is account used only for donations and not utilized for specific program work. N/A
KEY PERFORMANCE INDICATORS
Assumptions and factors affecting program performance:
N/A
213
Public Health

Program name:Program number:
Program objective:
2014 Actual 2015 Budget 2016 Budget 2017 Forward Estimate 2018 Forward EstimateRevenueGeneral Property TaxOther Revenues 38,368 60,322 51,900 52,876 53,871 Total Revenue 38,368 60,322 51,900 52,876 53,871
Recurrent Expenditure 38,208 60,322 51,900 52,876 53,871 Capital/One‐time ExpenditureTotal Expenditure 38,208 60,322 51,900 52,876 53,871 Net Revenue and Expenditures 159 ‐ ‐ (0) 0
Output indicators 2014 Actual 2015 Actual 2016 Planned 2017 Estimate 2018 EstimateNumber of vaccines to prevent infectious diseases given 178 274 200
TB skin tests administered 93 135 110Outcome indicators 2014 Actual 2015 Actual 2016 Planned 2017 Estimate 2018 EstimateIncrease influenza vaccine given in Polk County schools by 5% from the 2013 level
1409 doses 1653 Goal met
Increase the percent of 11 to 18 year olds that complete the HPV vaccine series to 23%
15% 19% 23%
75% of school newsletters will publish articles on the importance of influenza vaccination and the schedule school influenza vaccination clinics
NEW
PROGRAM PERFORMANCE INFORMATIONKEY PROGRAM STRATEGIES FOR 2015
Influenza Clinics in all 8 Polk County School Districts Vaccine supply not as problematic in 2015 so school clinics were implemented without difficulty.
14‐11Immunization
To prevent vaccine preventable disease.To improve compliance of Polk's preschoolers to benchmark immunizations recommended by the Advisory Committee on Immunization Practices.
PROGRAM REVENUES AND EXPENDITURES
KEY PERFORMANCE INDICATORS
Assumptions and factors affecting program performance:Flu vaccine production and distribution is a recurring problem. In 2015, flu vaccine was ordered from several suppliers to address this problem. Performance measures for 2017‐18 have not yet been identified.
Continue to offer influenza vaccine in the school setting.KEY PROGRAM STRATEGIES 2016
214
Public Health

Program name:Program number:
Program objective:
2014 Actual 2015 Budget 2016 Budget 2017 Forward Estimate 2018 Forward EstimateRevenueGeneral Property TaxOther Revenues 70,522 51,389 108,311 108,390 110,901 Total Revenue 70,522 51,389 108,311 108,390 110,901
Recurrent Expenditure 59,233 51,389 108,311 108,390 110,901 Capital/One‐time ExpenditureTotal Expenditure 59,233 51,389 108,311 108,390 110,901 Net Revenue and Expenditures 11,289 ‐ ‐ (0) 0
Prevent lead poisoning of childrenPromote early identification and treatment of breast and cervical cancer; Transition to regional model of service
All DHS consolidated contract deliverables have been met.
14‐12Consolidated Contract
To decrease rates of children exposed to smoking in the household.To prevent lead poisoning among preschool children.To assure access to breast and cervical cancer screening and treatment for low income women aged 35‐64 years.To improve compliance of Polk's preschoolers to benchmark immunizations recommended by the Advisory Committee on Immunization Practices.
PROGRAM REVENUES AND EXPENDITURES
All programs excluding MCH have the same objectives for 2016. MCH will focus reduction of childhood exposure to household smoke.
Promote optimal vaccination rates of 2 year oldsCollaborate with community partners to implement the CHIP relating to unhealthy alcohol use.
KEY PROGRAM STRATEGIES 2016
PROGRAM PERFORMANCE INFORMATIONKEY PROGRAM STRATEGIES FOR 2015
Build a strong network of allied health and human services partners to improve the health of families throughout the life course
Program 14‐12 continued on next page
215
Public Health

Output indicators 2014 Actual 2015 Actual 2016 Planned 2017 Estimate 2018 EstimateNumber of children tested for lead in Polk County 360 361 360Number of women enrolled in Well Woman Program (2015 is 07/01‐12/31/15 data)
76 43 60
Quarterly meetings of the CHIP Alcohol group 2 9 4Outcome indicators 2014 Actual 2015 Actual 2016 Planned 2017 Estimate 2018 EstimatePercent of WIC 2 year olds meeting immunization benchmarks 68.30% 58% 65%
Well Woman Program will be transitioned to regional model by year end
N/A Complete
Increase the number of lead tests done for WIC eligible 2‐4 year olds by 5% from 2014 levels
104 109 115
KEY PERFORMANCE INDICATORS
Assumptions and factors affecting program performance:
Continuation of program 14‐12 Consolidated Contract
216
Public Health

Program name:Program number:
Program objective:
2014 Actual 2015 Budget 2016 Budget 2017 Forward Estimate 2018 Forward EstimateRevenueGeneral Property TaxOther Revenues 199,841 188,989 194,626 198,981 203,427 Total Revenue 199,841 188,989 194,626 198,981 203,427
Recurrent Expenditure 182,121 188,989 194,626 198,981 203,427 Capital/One‐time ExpenditureTotal Expenditure 182,121 188,989 194,626 198,981 203,427 Net Revenue and Expenditures 17,720 ‐ 0 0 0
Output indicators 2014 Actual 2016 Actual 2016 Planned 2017 Estimate 2018 EstimateNumber of establishments licensed 366 370 370Number of inspections 392 427 425Number of persons receiving Certified Food Manager Training 80 78 75
Number of establishments with water tested Polk county 159 166 160
Outcome indicators 2014 Actual 2015 Actual 2016 Planned 2017 Estimate 2018 Estimate95% of all restaurant inspections will be documented in Healthspace
N/A 100% Goal met
Reduce the number of wells with uncorrected deficiencies by 50%
18 9 50%
14‐13Environmental Health
To assure food, lodging, campground, and body art facilities are safe and in compliance with state regulations.To assure safe drinking water in facilities serving water to the public.To implement electronic documentation of all inspections in Health space software.
PROGRAM REVENUES AND EXPENDITURES
KEY PROGRAM STRATEGIES 2016
PROGRAM PERFORMANCE INFORMATIONKEY PROGRAM STRATEGIES FOR 2015
Implement Healthspace electronic record keeping systemContinue to offer ServSafe Certified Food Manager trainingContinue to provide AGENT services for DHS and DNR
Both DHS and DNR Agent programs implementedwithout problems. No food borne outbreaks in PolkCounty in 2015.
KEY PERFORMANCE INDICATORS
Assumptions and factors affecting program performance:Performance measures not identified for 2017‐18 at this time.
Work with DHS for smooth transition of food safety program to DATCAP and Agent for Ag status for PCHD.
217
Public Health

Program name:Program number:Program objective:
2014 Actual 2015 Budget 2016 Budget 2017 Forward Estimate 2018 Forward EstimateRevenueGeneral Property TaxOther Revenues 7,635 8,935 9,135 9,343 9,544 Total Revenue 7,635 8,935 9,135 9,343 9,544
Recurrent Expenditure 7,646 8,935 9,135 9,343 9,544 Capital/One‐time ExpenditureTotal Expenditure 7,646 8,935 9,135 9,343 9,544 Net Revenue and Expenditures (11) ‐ ‐ 0 (0)
Output indicators 2014 Actual 2015 Actual 2016 Planned 2017 Estimate 2018 EstimateNumber of test kits sold 208 229 225Outcome indicators 2014 Actual 2015 Actual 2016 Planned 2017 Estimate 2018 EstimateIncrease the percentage of sold radon test kits that were activated to 60%
58% 73% 70%
Percent of elevated test results: BurnettBurnett 0% 14%Polk 51% 39%Washburn 50% 42%Douglas 25% 11%
Maintain Radon Information Center for Douglas, Burnett, Washburn and Polk Counties Program implemented as required by DHS.
14‐14Radon Information Center
To reduce exposure of homeowners to indoor radon in 4 counties
PROGRAM REVENUES AND EXPENDITURES
KEY PERFORMANCE INDICATORS
Assumptions and factors affecting program performance:Grant funding is stable for 2016.Performance measure for 2017‐18 not yet identified.
Continue outreach about the importance of radon testing.KEY PROGRAM STRATEGIES 2016
PROGRAM PERFORMANCE INFORMATIONKEY PROGRAM STRATEGIES FOR 2015
218
Public Health

Program name:Program number:Program objective:
2014 Actual 2015 Budget 2016 Budget 2017 Forward Estimate 2018 Forward EstimateRevenueGeneral Property TaxOther Revenues ‐ ‐ 41,838 ‐ ‐ Total Revenue ‐ ‐ 41,838 ‐ ‐
Recurrent Expenditure 41,838 Capital/One‐time ExpenditureTotal Expenditure ‐ ‐ 41,838 ‐ ‐ Net Revenue and Expenditures ‐ ‐ ‐ ‐ ‐
Output indicators 2014 Actual 2015 Actual 2016 Planned 2017 Estimate 2018 EstimateFiscal Agent onlyOutcome indicators 2014 Actual 2015 Actual 2016 Planned 2017 Estimate 2018 EstimateFiscal Agent onlyAssumptions and factors affecting program performance:
KEY PROGRAM STRATEGIES 2016
PROGRAM PERFORMANCE INFORMATIONKEY PROGRAM STRATEGIES FOR 2015
Restructure RTAC to mirror the new Healthcare Coalition regions. Fiscal agent duties were carried out per DHS contract.
Continue as Fiscal Agent for RTAC.Develop guidance document for RTAC related expenses and reimbursements.
KEY PERFORMANCE INDICATORS
RTAC14‐15To carry out fiscal agent responsibilities for the Regional Trauma Advisory Council
PROGRAM REVENUES AND EXPENDITURES
219
Public Health

2014 Actual 2015 Budget 2016 Budget2017 Forward
Estimate2018 Forward
EstimateRevenueGeneral Property Tax (31,278) (30,626) (33,466) (27,952) (20,271)Other Taxes 107,220 70,000 80,000 80,000 80,000 Public Charge for Services 285,544 240,000 240,000 250,000 250,000 Other Financing Sources ‐ 40,000 70,000 ‐ ‐ Total Revenue 361,486 319,374 356,534 302,048 309,729
ExpensePersonnel Services 262,535 269,280 276,238 281,448 288,820 Contractual Services 40,829 42,494 81,946 12,125 12,307 Supplies & Expenses 7,059 7,600 8,350 8,475 8,602 Cost Reallocation ‐ 10,000 ‐ ‐ Total Expenditures 310,423 319,374 376,534 302,048 309,729 Net Revenue and Expenditure 51,064 ‐ (20,000) ‐ ‐
Preservation of the public record through technology; commitment to service.
REGISTER OF DEEDS Laurie Anderson, Register of DeedsSECTION 1: DEPARTMENT SUMMARY
Department Description and Mission:The Register of Deeds is an elective office that is responsible for a number of public records retained at the county levelMISSION:To provide and protect the official county repository for:Real Estate records; real property related Financing Statements; Vital Records.To provide safe archival storage and convenient access to these public records.To implement statutory changes, system modernization, program and procedure evaluation, and staff development to assure a high level timely service for our citizens/customers.Link to County Board Strategic Goals:
Strategic Priorities:Provide access of real estate and vital records.Maintain and preserve the records as required statutorily.
DEPARTMENT REVENUE AND EXPENDITURES BY ECONOMIC CLASSIFICATION
220

2014 Actual 2015 Budget 2016 Budget 2017 Budget 2018 BudgetFTE EmployeesOfficials/Administrators 1 1 1 1 1Administrative Support 3 3 3 3 3Total 4 4 4 4 4
2014 Actual 2015 Budget 2016 Budget2017 Forward
Estimate2018 Forward
EstimateRecording and filling documents 248,338 255,499 301,227 241,639 247,783 Vital Records 62,085 63,875 75,307 60,410 61,946 Total 310,423 319,374 376,534 302,048 309,729
EMPLOYMENT BY JOB CLASSIFICATION
PROGRAM SUMMARYPROGRAM EXPENDITURES
221
Register of Deeds

Program name:Program number:
Program objective:
2014 Actual 2015 Budget 2016 Budget2017 Forward
Estimate2018 Forward
EstimateRevenueGeneral Property Tax (25,022) (24,501) (26,773) (22,361) (16,217)Other Revenues 314,211 280,000 312,000 264,000 264,000 Total Revenue 289,189 255,499 285,227 241,639 247,783
Recurrent Expenditure 248,338 255,499 301,227 241,639 247,783 Capital/One‐time ExpenditureTotal Expenditure 248,338 255,499 301,227 241,639 247,783 Net Revenue and Expenditures 40,851 ‐ (16,000) ‐ ‐
Output indicators 2014 Actual 2015 Planned 2016 Planned 2017 Estimate 2018 EstimateNumber of R. E. documents recorded 9,778 10,000 10,000 10,000 10,000Outcome indicators 2014 Actual 2015 Planned 2016 Planned 2017 Estimate 2018 EstimateNumber of R.E. documents 100% 100% 100% 100% 100%completed per WI statutory requirements.
PROGRAM REVENUES AND EXPENDITURES
SECTION 2: PROGRAM SUMMARY
08‐01Recording and filling documents
Maintain a grantor/grantee index and tract index by recording all real estate documents that meet statutory recording requirements. To provide Polk County with quality service, and to serve and represent the public with integrity. Digitize real estate records currently in the format of micro‐fiche, and aperture cards. Incorporate digitized documents into the computerized index and imaging system. Redaction of social
KEY PROGRAM STRATEGIES 2016
PROGRAM PERFORMANCE INFORMATIONKEY PROGRAM STRATEGIES FOR 2015
Digitize paper real estate records, redact all social security numbers.Index all documents into the computerized real estate system, and thentransfer to our on‐line system.
Documents digitized, and redacted.Continue to index documents into the computer system astime allows.
Obtain a new on‐line system for real estate records, due to unforeseen changes in the current system.Continue to index digitized documents and populate the on‐line system with those documents.
KEY PERFORMANCE INDICATORS
Assumptions and factors affecting program performance:Cannot accurately project the number of documents to be presented for recording.Staying current with statutory changes that affect the ROD office.Staying current with technology.
222
Register of Deeds

Program name:Program number:
Program objective:
2014 Actual 2015 Budget 2016 Budget2017 Forward
Estimate2018 Forward
EstimateRevenueGeneral Property Tax (6,256) (6,125) (6,693) (5,590) (4,054)Other Revenues 78,553 70,000 78,000 66,000 66,000 Total Revenue 72,297 63,875 71,307 60,410 61,946
Recurrent Expenditure 62,085 63,875 75,307 60,410 61,946 Capital/One‐time ExpenditureTotal Expenditure 62,085 63,875 75,307 60,410 61,946 Net Revenue and Expenditures 10,213 ‐ (4,000) ‐ ‐
Output indicators 2014 Actual 2015 Planned 2016 Planned 2017 Estimate 2018 EstimateVital Records issued/processed 923 1000 1000 1000 1000in a timely manner.Outcome indicators 2014 Actual 2015 Planned 2016 Planned 2017 Estimate 2018 EstimateApplications processed without error 100% 100% 100% 100% 100%
08‐02Vital Records
Maintain all birth, and death records. File Marriage, Domestic Partnership and Termination of Domestic Partnership records. Issue upon request by qualified applicants, certified copies of those records.
Staying current with technology.
KEY PROGRAM STRATEGIES 2016Continued training of staff to reflect changes and updates in the SIVRIS system.
PROGRAM REVENUES AND EXPENDITURES
PROGRAM PERFORMANCE INFORMATIONKEY PROGRAM STRATEGIES FOR 2015
Implementation of the State Vital Record Information System (SIVRIS) to include birth, include birth, death and marriage records.
KEY PERFORMANCE INDICATORS
Assumptions and factors affecting program performance:
Training of ROD staff members regarding acceptance andissuance of vital records through SIVRIS.
Increasing changes in the SIVRIS system. Inability to know what those changes might be for the Local Vital Record Office (LVRO).Increased demand on staff due to changes.
223
Register of Deeds

2014 Actual 2015 Budget 2016 Budget2017 Forward
Estimate2018 Forward
EstimateRevenueGeneral Property Tax 99,760 36,206 37,352 42,171 48,908 Other Taxes 21 50 25 25 25 State Aids 110,331 97,000 103,000 103,000 103,000 Fine and Forfeitures 27,390 38,000 32,000 32,000 32,000 Public Charge for Services 1,924 150 175 175 175 Misc Revenue 324,239 100,000 100,000 100,000 100,000 Total Revenue 563,666 271,406 272,552 277,371 284,108
ExpenseOperating Expenses 100Personnel Services 196,358 202,608 209,060 212,976 218,797 Contractual Services 11,669 16,308 16,752 17,003 17,258 Supplies & Expenses 36,368 48,460 43,460 44,112 44,774 Fixed Charges 2,577 2,880 2,880 2,880 2,880 Grants, Contributions, Indem 296 1,050 400 400 400 Total Expenditures 247,269 271,406 272,552 277,371 284,108 Net Revenue and Expenditures 316,397 ‐ ‐ ‐ ‐
DEPARTMENT REVENUE AND EXPENDITURES BY ECONOMIC CLASSIFICATION
Strategic Priorities:Continue to work with our customers, both external and internal, to provide them with the information they request in a timely manner
COUNTY TREASURER Amanda Nissen, Polk County TreasurerSECTION 1: DEPARTMENT SUMMARY
Department Description and Mission:The department calculates taxes, determine and distributes funds to the various taxing districts, receipts in all County funds from other departments, oversees all bank accounts and balances main bank accounts for the County. The Department also assists internal and external customers with tax questions and requests.MISSION: To assist our customers in the most efficient and complete manner in accordance with State statute and county policy.
Link to County Board Strategic Goals:To serve the public with integrity
224
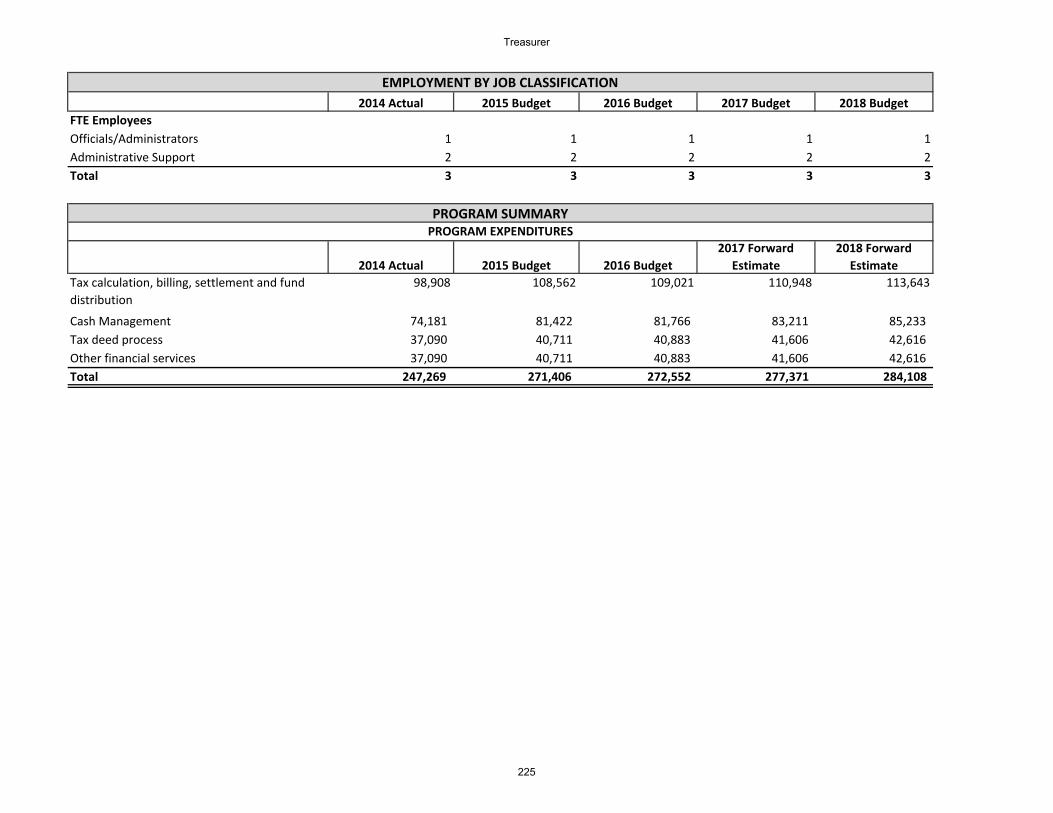
2014 Actual 2015 Budget 2016 Budget 2017 Budget 2018 BudgetFTE EmployeesOfficials/Administrators 1 1 1 1 1Administrative Support 2 2 2 2 2Total 3 3 3 3 3
2014 Actual 2015 Budget 2016 Budget2017 Forward
Estimate2018 Forward
EstimateTax calculation, billing, settlement and fund distribution
98,908 108,562 109,021 110,948 113,643
Cash Management 74,181 81,422 81,766 83,211 85,233 Tax deed process 37,090 40,711 40,883 41,606 42,616 Other financial services 37,090 40,711 40,883 41,606 42,616 Total 247,269 271,406 272,552 277,371 284,108
EMPLOYMENT BY JOB CLASSIFICATION
PROGRAM SUMMARYPROGRAM EXPENDITURES
225
Treasurer

Program name:Program number:
Program objective:
2014 Actual 2015 Budget 2016 Budget2017 Forward
Estimate2018 Forward
EstimateRevenueGeneral Property Tax 39,904 14,482 14,941 16,868 19,563Other Revenues 185,563 94,080 94,080 94,080 94,080 Total Revenue 225,467 108,562 109,021 110,948 113,643
Recurrent Expenditure 98,908 108,562 109,021 110,948 113,643 Capital/One‐time ExpenditureTotal Expenditure 98,908 108,562 109,021 110,948 113,643 Net Revenue and Expenditures 126,559 ‐ ‐ ‐ ‐
Output indicators 2014 Actual 2015 Planned 2016 Planned 2017 Estimate 2018 EstimateSettlement Errors 0 0 0 0 0Tax Calc Errors 0 0 0 0 0
Outcome indicators 2014 Actual 2015 Planned/Actual 2016 Planned 2017 Estimate 2018 EstimateSettlement Errors 0 1 0 0 0Tax Calc Errors 0 0 0 0 0
KEY PERFORMANCE INDICATORS
Assumptions and factors affecting program performance:Tax calculation errors is limited to errors made by this office based on the information received from the various taxing districts in Polk County.
Move all municipalities to off site tax bill printing. Saves County resources as outsource more cost efficient and time efficientTransition to ACH payment of municipal settlement in April and August
KEY PROGRAM STRATEGIES 2016
PROGRAM PERFORMANCE INFORMATIONKEY PROGRAM STRATEGIES FOR 2015
Encourage municipalities to choose off site tax bill printingError free settlementsError free tax calculation
Pending ‐ tax bill printing in late Nov/early December1 error out of 54 settlements (98.148% accurate)Pending ‐ tax bill printing in late Nov/early December
PROGRAM REVENUES AND EXPENDITURES
SECTION 2: PROGRAM SUMMARY
09‐01Tax calculation, billing, settlement and fund distribution
Accurate calculation of taxes, collections receipted in a timely manner, disbursement of taxes by statutory deadlines.
226
Treasurer

Program name:Program number:
Program objective:
2014 Actual 2015 Budget 2016 Budget2017 Forward
Estimate2018 Forward
EstimateRevenueGeneral Property Tax 29,928 10,862 11,206 12,651 14,673Other Revenues 139,172 70,560 70,560 70,560 70,560 Total Revenue 169,100 81,422 81,766 83,211 85,233
Recurrent Expenditure 74,181 81,422 81,766 83,211 85,233 Capital/One‐time ExpenditureTotal Expenditure 74,181 81,422 81,766 83,211 85,233 Net Revenue and Expenditures 94,919 ‐ ‐ ‐ ‐
Output indicators 2014 Actual 2015 Planned 2016 Planned 2017 Estimate 2018 EstimateAmount of disbursements 8534 8977 8900 8800 8700Outcome indicators 2014 Actual 2015 Planned 2016 Planned 2017 Estimate 2018 EstimateErrors in disbursements 0 0 0 0 0
KEY PERFORMANCE INDICATORS
Assumptions and factors affecting program performance:Limited staffing levels hampers what we can do to change some of the processes, especially from the front counter perspective. We have been looking "outside the box" to see how we can assist our customers, but intern and external, in a fast and efficient manner while still streamliningour processes and evolving with the new technological options available.
Continue to update the Reconciliation and front counter processes. Discuss with Department of Admin and other Counties new and improvedmethods of using the existing software and staff to continue to improve processes.
KEY PROGRAM STRATEGIES 2016
PROGRAM PERFORMANCE INFORMATIONKEY PROGRAM STRATEGIES FOR 2015
Update Reconciliation ProcessUpdate Front Counter Processes
In process, 80% completeProcess updated
09‐02Cash Management
Accurate disbursement and receipt of all funds going in and out of the county; maintaining current investments in conjunction with other county staff.
PROGRAM REVENUES AND EXPENDITURES
227
Treasurer

Program name:Program number:Program objective:
2014 Actual 2015 Budget 2016 Budget2017 Forward
Estimate2018 Forward
EstimateRevenueGeneral Property Tax 14,964 5,431 5,603 6,326 7,336Other Revenues 69,586 35,280 35,280 35,280 35,280 Total Revenue 84,550 40,711 40,883 41,606 42,616
Recurrent Expenditure 37,090 40,711 40,883 41,606 42,616 Capital/One‐time ExpenditureTotal Expenditure 37,090 40,711 40,883 41,606 42,616 Net Revenue and Expenditures 47,460 ‐ ‐ ‐ ‐
Output indicators 2014 Actual 2015 Planned 2016 Planned 2017 Estimate 2018 EstimateHow many properties go into tax foreclosure in October
166 150 150 150 150
Outcome indicators 2014 Actual 2015 Planned 2016 Planned 2017 Estimate 2018 EstimateHow many properties are takes after process is completed.
16 10 10 8 8
KEY PERFORMANCE INDICATORS
Assumptions and factors affecting program performance:The amount we take is ultimately dependant on the owner of record. Many factors exert outside influences on payment of property tax that ouroffice cannot work around. Recession, job loss, ect all exert influence over what people can pay.
Contact taxpayers in July and September to work out payment plans and optionsDifferent options to avoid taxpayers losing their property while also assisting them to work out a plan to catch up on taxes
KEY PROGRAM STRATEGIES 2016
PROGRAM PERFORMANCE INFORMATIONKEY PROGRAM STRATEGIES FOR 2015
To try to do early intervention to help taxpayers avoid tax foreclosure Process pending. Tax foreclosure starts in Sept/Oct each year
09‐03Tax deed process
To collect delinquent taxes or foreclose on the property per statutes if collection impossible.
PROGRAM REVENUES AND EXPENDITURES
228
Treasurer

Program name:Program number:
Program objective:
2014 Actual 2015 Budget 2016 Budget2017 Forward
Estimate2018 Forward
EstimateRevenueGeneral Property Tax 14,964 5,431 5,603 6,326 7,336Other Revenues 69,586 35,280 35,280 35,280 35,280 Total Revenue 84,550 40,711 40,883 41,606 42,616
Recurrent Expenditure 37,090 40,711 40,883 41,606 42,616 Capital/One‐time ExpenditureTotal Expenditure 37,090 40,711 40,883 41,606 42,616 Net Revenue and Expenditures 47,460 ‐ ‐ ‐ ‐
Output indicators 2014 Actual 2015 Planned 2016 Planned 2017 Estimate 2018 EstimateYears of property tax information available in digital format
14 15 16 17 18
Outcome indicators 2014 Actual 2015 Planned 2016 Planned 2017 Estimate 2018 EstimateCompliance with statutory guidelines 100% 100% 100% 100% 100%
Continue to remain current in all information provisionKEY PROGRAM STRATEGIES 2016
KEY PERFORMANCE INDICATORS
Assumptions and factors affecting program performance:As information becomes available in other formats, we work to get a link to that information on our web site. More people are expecting and look‐ing for information available online and available 24 hours, even if it is not something our office produces they want a link. We are working to ensure that information that may be useful is available to our customers.
Mill Rate available on out web site for outside customers
09‐04Other financial services
To assist internal and external customers by publication of unclaimed funds, providing tax information, and assisting municipalities with taxes and settlements
PROGRAM REVENUES AND EXPENDITURES
PROGRAM PERFORMANCE INFORMATIONKEY PROGRAM STRATEGIES FOR 2015
Current list of unclaimed funds from WI DOA available in office We keep an updated list on our front counterMill rates for 5+ years available online
229
Treasurer

2014 Actual 2015 Budget 2016 Budget2017 Forward
Estimate2018 Forward
EstimateRevenueGeneral Property Tax 145,421 147,794 159,294 163,149 167,093 State Aids 14,647 13,500 14,000 14,000 14,000 Other Financing SourcesTotal Revenue 160,068 161,294 173,294 177,149 181,093
ExpensePersonnel Services 130,814 133,027 136,361 140,043 143,811 Contractual Services 2,185 3,175 3,131 3,178 3,226 Supplies & Expenses 5,950 8,742 16,802 16,928 17,056 Grants, Contributions, Indem 17,944 16,350 17,000 17,000 17,000 Cost ReallocationTotal Expenditures 156,892 161,294 173,294 177,149 181,093 Net Revenue and Expenditures 3,176 ‐ (0) ‐ ‐
DEPARTMENT REVENUE AND EXPENDITURES BY ECONOMIC CLASSIFICATION
Improved quality of life
Strategic Priorities:Maintain highest level of office efficiency and effectiveness, complete conversion of department to "paperless work environment," maintain professional accreditation of DH and staff, and continue to provide strong community presence. Position department for best practices in future Veteran Affairs claims/benefits process.
VETERANS SERVICE OFFICE Rick Gates, Polk County Veteran OfficerSECTION 1: DEPARTMENT SUMMARY
Department Description and Mission:To assist veterans, dependents and survivors in obtaining all available federal, state and local veteran benefits. Serve as the veteran's advocate in all matters in accordance with State statute and county policy.Link to County Board Strategic Goals:To serve the public with integrity
230

2014 Actual 2015 Budget 2016 Budget 2017 Budget 2018 BudgetFTE EmployeesOfficials/Administrators 1 1 1 1 1Administrative Support 1 1 1 1 1Total 2 2 2 2 2
2014 Actual 2015 Budget 2016 Budget2017 Forward
Estimate2018 Forward
EstimateFederal Veteran Benefits 133,358 137,100 147,300 150,577 153,929 State Veteran Benefits 15,689 16,129 17,329 17,715 18,109 County Veteran Benefits 7,845 8,065 8,665 8,857 9,055 Total 156,892 161,294 173,294 177,149 181,093
EMPLOYMENT BY JOB CLASSIFICATION
PROGRAM SUMMARYPROGRAM EXPENDITURES
231
Veterans Service Office

Program name:Program number:
Program objective:
2014 Actual 2015 Budget 2016 Budget2017 Forward
Estimate2018 Forward
EstimateRevenueGeneral Property Tax 123,608 125,625 135,400 138,677 142,029 Other Revenues 12,450 11,475 11,900 11,900 11,900 Total Revenue 136,058 137,100 147,300 150,577 153,929
Recurrent Expenditure 133,358 137,100 147,300 150,577 153,929 Capital/One‐time ExpenditureTotal Expenditure 133,358 137,100 147,300 150,577 153,929 Net Revenue and Expenditures 2,699 ‐ (0) ‐ ‐
Transform office to "Paperless"
Output indicators 2014 Actual 2015 Planned 2016 Planned 2017 Estimate 2018 EstimateMaintain level of claims at or above 200 per annum.
187 200 200 200 200
Work actions re claims handling 88 90 90 90 90Miscellaneous actions (letters/apps) 153 160 160 160 160VA Medical Enrollments 107 110 110 110 110Outcome indicators 2014 Actual 2015 Planned 2016 Planned 2017 Estimate 2018 EstimateVA Comp/Pension/DIC to County $11,208,000 $11,000,000 $11,000,000 $11,000,000 $11,000,000 VA Medical Care for County Vets $11,327,000 $11,200,000 $11,200,000 $11,200,000 $11,200,000
VA changed to Fully Developed Claims process whereby number of support letters reduced dramatically in regular claims handling.
PROGRAM PERFORMANCE INFORMATIONKEY PROGRAM STRATEGIES FOR 2015
Maintain positive community presence Continued radio spots and public outreach
SECTION 2: PROGRAM DATA
18‐01Federal Veteran Benefits
Purpose of this program is to provide assistance to veterans, their families and survivors in obtaining Federal benefits to which they are entitled.
PROGRAM REVENUES AND EXPENDITURES
Reduced file cabinets by 4VSO attended National CVSO Conference
Conduct more public outreachGenerate more Public Service Announcements (PSA's)Possible rental of HWY 8 roadside Sign with WDVA grant funds.
Improve trainingKEY PROGRAM STRATEGIES 2016
KEY PERFORMANCE INDICATORS
Assumptions and factors affecting program performance:
232
Veterans Service Office

Program name:Program number:
Program objective:
2014 Actual 2015 Budget 2016 Budget2017 Forward
Estimate2018 Forward
EstimateRevenueGeneral Property Tax 14,542 14,779 15,929 16,315 16,709 Other Revenues 1,465 1,350 1,400 1,400 1,400 Total Revenue 16,007 16,129 17,329 17,715 18,109
Recurrent Expenditure 15,689 16,129 17,329 17,715 18,109 Capital/One‐time ExpenditureTotal Expenditure 15,689 16,129 17,329 17,715 18,109 Net Revenue and Expenditures 318 ‐ (0) ‐ ‐
Output indicators 2014 Actual 2015 Planned 2016 Planned 2017 Estimate 2018 EstimateAid to Needy Vet Grants (ANV) 9 10 10 10 10State Cemetery Applications 3 5 5 5 5Homeless Shelter referrals 3 5 5 5 5Outcome indicators 2014 Actual 2015 Planned 2016 Planned 2017 Estimate 2018 EstimateANV Financial Support $6,816 $6,000 $6,000 $6,000 $6,000 CVSO Grant $10,000 $10,000 $5,000 $5,000 $5,000
KEY PERFORMANCE INDICATORS
Assumptions and factors affecting program performance:Unsure as to status of CVSO Grant in 2016 forward; grant changed from regular to reimbursement. Limited uses per WDVA.
Promote WDVA ANV GrantsSign up veterans for state eligibility
Continue pushing State benefits, despite reduction in same…Develop procedures regarding new Annual CVSO Grant procedures
Apply for State funding Grants (Transportation and annual CVSO Grants)KEY PROGRAM STRATEGIES 2016
PROGRAM PERFORMANCE INFORMATIONKEY PROGRAM STRATEGIES FOR 2015
Accomplished due to PSA's, speaking and radio spotsMade additional effort to "capture" more vet eligibilityReceived all appropriate grants.
18‐02State Veteran Benefits
Purpose of this program is to provide assistance to veterans, their families and survivors in obtaining State benefits to which they are entitled.
PROGRAM REVENUES AND EXPENDITURES
233
Veterans Service Office

Program name:Program number:
Program objective:
2014 Actual 2015 Budget 2016 Budget 2017 Estimate 2018 EstimateRevenueGeneral Property Tax 7,271 7,390 7,965 8,157 8,355 Other Revenues 732 675 700 700 700 Total Revenue 8,003 8,065 8,665 8,857 9,055
Recurrent Expenditure 7,845 8,065 8,665 8,857 9,055 Capital/One‐time ExpenditureTotal Expenditure 7,845 8,065 8,665 8,857 9,055 Net Revenue and Expenditures 159 ‐ (0) ‐ ‐
Output indicators 2014 Actual 2015 Planned 2016 Planned 2017 Estimate 2018 EstimateVeteran Transportation Miles 75,848 75,000 73,000 71,000 70,000VSC Grants Applied for 14 10 10 10 10Cemetery Aid Applications 16 16 18 18 18Outcome indicators 2014 Actual 2015 Planned 2016 Planned 2017 Estimate 2018 EstimateWDVA Transportation Grant Amt. $ $4,647 $4,700 $4,500 $4,500 $4,300 Cemetery aid Applications for Assist $1,778 $2,000 $2,000 $2,000 $2,000 Amount of Emergency aid provided $2,025 $1,800 $1,800 $1,800 $1,800
KEY PERFORMANCE INDICATORS
Assumptions and factors affecting program performance:We assume a static $1800.00 per annum by County for Emergency Relief (VSC) use. All donations to VSO are also placed into this non‐lapsing account. Something new and in process at this time is change in WDVA grant procedures whereby annual CVSO Grant now a reimbursement grant. As such, some of "typical" VSC grants will be reimbursed by State of WI. This will mean more funds available.
Continue as above, with greater reliance on new State funding for emergency relief (i.e. VORP, SSVF, Bremer Grant, etc.)Publicize eligibility for grave support among cemetery associations.Work closely with ADRC regarding new funding requirements (i.e. WDVA CVSO Grant)
Providing care of veteran graves.KEY PROGRAM STRATEGIES 2016
PROGRAM PERFORMANCE INFORMATIONKEY PROGRAM STRATEGIES FOR 2015
Proactive approach to emergency assistance (VSC Funds)Publicizing local assistance available to vets and their familiesProviding veteran transportation to and from VA medical care
Continue to expend funds per VSC directionPSA's, Radio spots (WXCE/WPCA) and event participationProgram in fine shape; highly effectiveContinue to fund non‐perpetual care graves
18‐03County Veteran Benefits
Purpose of this program is to provide assistance to veterans, their families and survivors in obtaining County benefits to which they are entitled.
PROGRAM REVENUES AND EXPENDITURES
234
Veterans Service Office

SupplementaryMaterials
235

AnnexA:Selectedeconomicanddemographicindicators,PolkCounty,Wisconsin
Population Number of Households Employment
Unemployment Rate (percent)
Personal Income ($ millions)
Per Capita Personal Income
Taxable Retail Sales ($ millions)
2005 44,014 23,522 22,729 5.2 1,263,932 28,717 437.3 2006 44,367 23,980 22,929 5.7 1,299,832 29,297 472.1 2007 44,318 24,334 22,810 6.1 1,376,266 31,054 468.8 2008 44,331 24,298 22,631 5.8 1,428,606 32,226 472.2 2009 44,376 24,642 21,840 10.5 1,447,759 32,625 443.5 2010 44,153 24,248 21,434 9.8 1,471,837 33,243 456.2 2011 43,954 24,303 21,750 8.4 1,569,093 35,699 476.7 2012 43,565 24,331 21,880 8.0 1,636,098 37,553 482.9 2013 43,476 24,362 22,110 7.3 1,639,115 37,702 503.1 2014 43,484 24,409 22,846 5.9 1,729,100 39,716 564.4 2015 44,259 24,464 23,246 4.9 1,824,025 41,213 578.6
Sources: Population estimates are from the U.S. Department of Commerce, Bureau of the Census. The 2015 projection is based on population growth from the State of Wisconsin Department of Administration.
Household estimates are from the State of Wisconsin Department of Administration.
Employment estimates are from the State of Wisconsin Department of Workforce development. The 2015 employment projection uses data for the first 10 months, extrapolated.
Personal Income estimates are from the U.S. Department of Commerce, Bureau of Economic Analysis. 2015 projections assume the same rate of increase as from 2013 to 2014.
Taxable retail sales are calculated based on Polk County sales tax receipts (the County levies a one‐half percent sales tax piggybacked on the State sales tax). 2013 projections are made using the County’s time series analysis model.
236

AnnexB:Howtointerpretalogicalframework
A logical framework, or logframe, is a means of illustrating program logic in a simple table. It is similar to the logic model endorsed by UW Extension, the Kellogg Foundation, and others in its factoring a program into activities, outputs, results, and impact, but differs in its incorporation of performance indicators, sources, assumptions and risk. Although designed by the U.S. Government in the early 1970s as a project evaluation tool (a project differing from a program in a finite beginning and ending date and limited resources), its use had fallen out of favor in the United States but is being reintroduced. The following is based on the European Union standard project management cycle, similar to that used in British Commonwealth countries. Although developed as a project evaluation tool, it can naturally be extended to program evaluation due to its efficiency in illustrating logic.
The following is a logframe presented earlier in this document under Human Service for the child protection program.
Narrative summary Performance Indicators Monitoring & Evaluation Assumptions/Risk
Impact Children become healthy, productive adults
Employment rate of former clients
Survey of former participants
Results Children are safe and cared for
Progress noted in Parent Education Journals
Internal records Children respond to assistance
Outputs Children are placed or families are reunited
Ongoing case plans with face‐to‐face development with family members
Internal records Adequate opportunity for ongoing monitoring
Activities Investigate reported cases of child abuse and make recommendations for placement or action
CPS investigations completed and approved
Internal records Investigation is able to determine proper course of action
The top row, impact, is the reason for the existence of the program, why a policy‐making body established that program. The second row, results, gives the near‐term effect of the program on its recipients. Outputs are what the program provides or produces, and activities are what the program does to provide or produce them. Each level is accompanied by a performance measure in the third column, e.g. the number of books supplied, to enable review of effectiveness, and the source of the data in the fourth column to confirm the performance measure is also
237

Howtointerpretalogicalframework
included in the table. The final column, assumptions and risk, are considered to be those factors outside of the control of the agency implementing a program that could affect the achievement of the desired output, result or impact.
To interpret the program logic in a logframe, it should be read from the bottom up using an “IF – AND – THEN” syntax that incorporates the narrative summary and the assumptions and risk, as follows in the example of the child protection program and as illustrated below:
IF child protection investigations are completed AND the investigation is able to determine a course of action THEN children will be placed or families reunited. Next, IF children are placed or families reunited AND there is adequate opportunity for ongoing monitoring THEN children will be safe and cared for. Finally, IF children are safe and cared for AND respond to assistance THEN children will grow to become healthy, productive adults. Thus, beginning with the activities, investigations, working through the program logic, the impact of children becoming healthy, productive results should be realized if all assumptions are met. The purpose of the performance indicators are to demonstrate that effectiveness, the monitoring and evaluation to provide the source of the data.6
6 For more information on logframes, see the European Commission’s Project Cycle Management Guidelines, available on their website (ec.europa.eu), the World Bank’s LogFrame Handbook (www.worldbank.org), AusAid’s The Logical Framework Approach (www.ausaid.gov.au) or DfID’s Guidance on Using the Revised Logical Framework (www.dfid.gov.uk).
IF AND
THEN
238
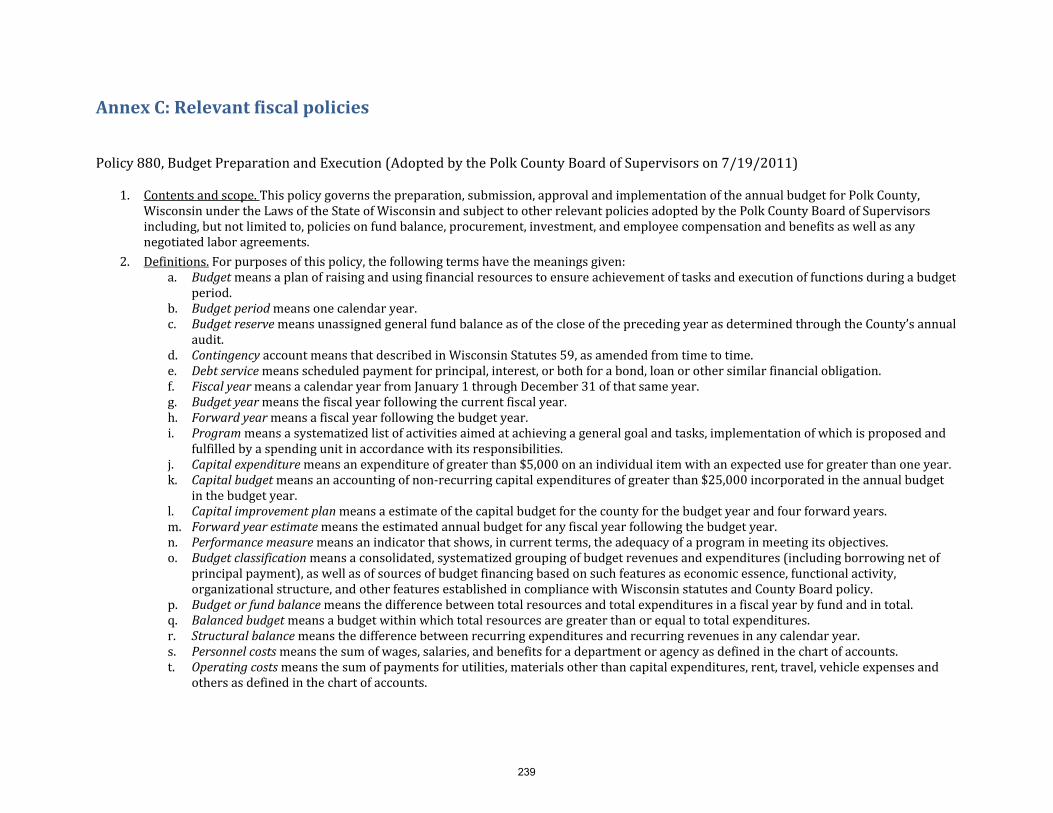
AnnexC:Relevantfiscalpolicies
Policy880,BudgetPreparationandExecution(AdoptedbythePolkCountyBoardofSupervisorson7/19/2011)
1. Contentsandscope.Thispolicygovernsthepreparation,submission,approvalandimplementationoftheannualbudgetforPolkCounty,WisconsinundertheLawsoftheStateofWisconsinandsubjecttootherrelevantpoliciesadoptedbythePolkCountyBoardofSupervisorsincluding,butnotlimitedto,policiesonfundbalance,procurement,investment,andemployeecompensationandbenefitsaswellasanynegotiatedlaboragreements.
2. Definitions.Forpurposesofthispolicy,thefollowingtermshavethemeaningsgiven:a. Budgetmeansaplanofraisingandusingfinancialresourcestoensureachievementoftasksandexecutionoffunctionsduringabudget
period.b. Budgetperiodmeansonecalendaryear.c. BudgetreservemeansunassignedgeneralfundbalanceasofthecloseoftheprecedingyearasdeterminedthroughtheCounty’sannual
audit.d. ContingencyaccountmeansthatdescribedinWisconsinStatutes59,asamendedfromtimetotime.e. Debtservicemeansscheduledpaymentforprincipal,interest,orbothforabond,loanorothersimilarfinancialobligation.f. FiscalyearmeansacalendaryearfromJanuary1throughDecember31ofthatsameyear.g. Budgetyearmeansthefiscalyearfollowingthecurrentfiscalyear.h. Forwardyearmeansafiscalyearfollowingthebudgetyear.i. Programmeansasystematizedlistofactivitiesaimedatachievingageneralgoalandtasks,implementationofwhichisproposedand
fulfilledbyaspendingunitinaccordancewithitsresponsibilities.j. Capitalexpendituremeansanexpenditureofgreaterthan$5,000onanindividualitemwithanexpecteduseforgreaterthanoneyear.k. Capitalbudgetmeansanaccountingofnon‐recurringcapitalexpendituresofgreaterthan$25,000incorporatedintheannualbudget
inthebudgetyear.l. Capitalimprovementplanmeansaestimateofthecapitalbudgetforthecountyforthebudgetyearandfourforwardyears.m. Forwardyearestimatemeanstheestimatedannualbudgetforanyfiscalyearfollowingthebudgetyear.n. Performancemeasuremeansanindicatorthatshows,incurrentterms,theadequacyofaprograminmeetingitsobjectives.o. Budgetclassificationmeansaconsolidated,systematizedgroupingofbudgetrevenuesandexpenditures(includingborrowingnetof
principalpayment),aswellasofsourcesofbudgetfinancingbasedonsuchfeaturesaseconomicessence,functionalactivity,organizationalstructure,andotherfeaturesestablishedincompliancewithWisconsinstatutesandCountyBoardpolicy.
p. Budgetorfundbalancemeansthedifferencebetweentotalresourcesandtotalexpendituresinafiscalyearbyfundandintotal.q. Balancedbudgetmeansabudgetwithinwhichtotalresourcesaregreaterthanorequaltototalexpenditures.r. Structuralbalancemeansthedifferencebetweenrecurringexpendituresandrecurringrevenuesinanycalendaryear.s. Personnelcostsmeansthesumofwages,salaries,andbenefitsforadepartmentoragencyasdefinedinthechartofaccounts.t. Operatingcostsmeansthesumofpaymentsforutilities,materialsotherthancapitalexpenditures,rent,travel,vehicleexpensesand
othersasdefinedinthechartofaccounts.
239

Relevantfiscalpolicies
u. Professionalservicesmeansthecostofoutsideconsultantsorprovisionofservicesbyoutsideagenciesasdefinedinthechartofaccounts.
v. GASBmeanstheGovernmentAccountingStandardsBoard.3. Budgetfunds.Thedraftandfinalbudgetsmustbereportedusingthefollowingfundstructure:
a. Generalfundi. Contents.TothegreatestextentpermittedbyStateandFederallaw,accountingstandards,fundingagreements,CountyBoard
policyandpracticality,allrevenuesandexpendituresmustbeincorporatedinthegeneralfund.ii. Categorizationofrevenuesandexpenditures.Generalfundrevenuesandexpenditureswillbereportedinthedraftandfinal
budgetandinsubsequentfinancialreportsusingtheclassificationsprescribedinWisconsinstatutessection65.90asamendedfromtimetotime.
b. Contingencyfund.i. ThecountyadministratormustrecommendafundinglevelandsourceforacontingencyfundpursuanttoWisconsinstatutes
aspartoftheannualbudgetrecommendation,includinganycarryoverofprioryearunusedresources.c. Allotherfunds.
i. FundsthatarerequiredtobeseparatebyStateorFederallaw,accountingstandards,fundingagreements,CountyBoardpolicyorpracticalitymustbecombinedtotheextentpossibleandreportedusingthesamecategorizationofexpendituresasisrequiredfortheGeneralFund.
4. Consolidatedbudget.Inadditiontoindividualbudgetfundsasspecifiedinthissection,thecountyadministratormustprepareaconsolidated,orallfunds,budgetcombiningallrevenuesandallexpendituresfollowingadoptionoftheannualbudget.
5. Budgetrevenues.BudgetrevenuesmustbereportedusingallcategoriesasrequiredbyStatelawandaccountingpractices,includingbutnotlimitedtopropertytaxlevy,fees,charges,interestincome,interestondelinquenttaxes,grants,stateaid,federalaid,andfines.
6. Budgetexpenditures.BudgetexpendituresmustbereportedusingallcategoriesasrequiredbyStatelawandaccountingpractices,includingbutnotlimitedtopersonnelcosts,operatingexpenses,professionalservices,suppliesandexpenses,fixedcharges,debtservice,grantcontribution,capitaloutlayandtransfers.
7. Componentsofbudgetlegislation.BudgetlegislationconsistsofthelawsoftheUnitedStatesofAmerica,oftheStateofWisconsin,thispolicy,andotherfinancialpoliciesadoptedbythePolkCountyBoardofSupervisors.
Section2:Preparationandadoptionoftheannualbudget
1. Classificationandlevelofdetail.ProposedandfinalbudgetsmustbepreparedinaccordancewithWisconsinStatutes,specificallysection65.90asamendedfromtimetotimeintermsofclassification,formanddetail.Inaddition,budgetsmustalsobepreparedlistingexpendituresbyprogramaspossible.Revenuesandexpendituresmustbeseparatelyreportedand,unlessspecificallypermittedbythecountyadministratorandidentifiedintheproposedbudget,revenuesmaynotbeusedtooffsetexpenditures.
2. Budgetcalendar.ThecountyadministratormustdistributeabudgetcalendartoallagenciesonorbeforeFebruary1ofeachyear.Thebudgetcalendarmustsetoutdatesforthesubmissionandreviewofbudgetdocumentationandsubmissionsbythecountyadministrator,thegoverningcommittees,thefinanceandpersonnelcommittees,andtheboardofsupervisors.
240

Relevantfiscalpolicies
3. Developmentofthedraftbudget.Thefollowingindividualsorcommitteeshaveassignedresponsibilitiesforthedevelopmentofthedraftbudget.
a. Countyadministration.InaccordancewithWisconsinStatutessection59.18,asamendedfromtimetotime,thecountyadministratorisresponsibleforthepreparationandsubmissionoftheannualbudget.
b. Governingcommittees.Eachgoverningcommitteeisresponsibleforthereviewandapprovalofbudgetarygoalsandobjectivesforeachprogramadministeredbyeachdepartmentundertheirjurisdiction.Eachcommitteemustalsoreviewthebudgetrequestassubmittedbythedepartmentandmakerecommendationstothecountyadministratoronthatbudgetrequest.
c. Departmentheads.Eachdepartmentheadisresponsibleforthepreparationofthebudgetnarrativeandbudgetrequestfortheirdepartmentaswellasanyanalysisasrequestedbythecountyadministrator,governingcommittee,orcountyboard.
d. Financecommittee.Thefinancecommitteeisresponsibleforreviewingtheoverallbudgetcontextandadvisingthecountyadministratoronoverallbudgetsizeandresources.
e. Personnelcommittee.Thepersonnelcommitteeisresponsibleforreviewofoverallemployeebenefitsandwages,withrecommendationtothecountyadministrator.
4. Feeschedule.TheCountyBoardmustannuallyadoptafeeschedulepreparedbythecountyadministrator.Thisscheduleincorporatesanylocalfeesorcharges,includingfeesforservice,overwhichthecountyboardhasdiscretion.
a. Contents.Thefeeschedulemustincludepastyearfeerate,currentyearfeerate,proposedrate,pastyearactualrevenues,currentyearprojectedrevenuesandforwardyearestimatedrevenue.Wherepossible,theschedulemustalsoincludeanestimateoftheactualcostofprovidingtheservicetowhichthefeerelates.Thecountyadministratorisresponsibleforprescribingtheformofthisreport.
b. Adoption.DepartmentheadsmustsubmitsectionsofthefeeschedulefortheirdepartmentsonorbeforeJuly15.ThecountyadministratormustreviewandmakearecommendationontheproposedfeeschedulepriortotheAugustregularmeetingofthecountyboard.Onceadopted,projectedrevenuesfromthesefeesandchargesmustbeincorporatedintheannualbudgetproposal.
c. Amendment.Feesandchargesmaybeamendedaspartoftheconsiderationoftheannualbudget.Followingadoptionoftheannualbudget,anyamendmenttothefeeschedulemustbemadeinthesamemannerasanyamendmenttotheannualbudget.
5. Budgetsubmission.InadditiontothoserequirementssetoutinWisconsinStatutes,theproposedbudgetsubmittedbythecountyadministratormustprovideadditionalinformationforconsiderationbytheboardandmeetadditionalrequirementswherepossible.Theseinclude:
a. Contents.Thisrequiredfinancialinformationandfinancialinformationonprioryear,currentyear,budgetyear,andoneormoreforwardyearestimates.
b. Proposedbudgetbalance.Thebudgetsubmittedbythecountyadministratormustbebalancedandmustbestructurallybalancedorincorporateaplantoregainastructuralbalanceshouldtheadministratordeemitexpedienttodeferfromastructuralbalanceforaperiodoftime.
c. “Lastdollar”levy.Forpurposesofbudgetpreparationandadoption,allotherrevenuesmustbeincorporatedtooffsetexpenditurespriortotheinclusionofanypropertytaxlevyrevenues.
d. Commitmentandassignmentoffunds.Anyfundstobecarriedoverfromthecurrenttothebudgetyearmustbeexpresslyidentifiedinthebudgetproposal.
e. Grantfunds.Thebudgetmustincludeallgrantfundstotheextentpossible.Thedepartmentheadmustalsohaveavailable,onrequest,supportingdocumentationastothepermitteduseofthesefunds.
f. Resolutionformat.Theproposedbudgetresolutionmustcontainenablinglanguageforanygrantorotherrevenuerecommendedto
241

Relevantfiscalpolicies
beincorporatedintheannualbudgetandfortherecommendedcontinuationofanyfundsassignedorcommittedbypastCountyBoardaction.
6. Publicavailabilityandfiscaltransparency.Thecountyadministrator’sbudgetrecommendationincludingbudgetnarratives,aletteroftransmittal,andabudgetsummarymustbemadepubliclyavailableonsubmissionoftheannualbudget.
7. Capitalimprovementplan.Thecountyadministratormustannuallysubmitacapitalimprovementplanforalldepartmentsalongwiththeannualbudget.Thecapitalimprovementplanmustprovideinformationastospecificitemstobepurchased,theirpriorityinaccordwiththeprioritysetbythecountyboard,alternativesshouldthepurchasenotoccuroroccuratalaterdate,financingoptions,andassociatedperformancemeasures.
8. Budgetreviewandadoption.Thefollowingcommitteeshavetheresponsibilityassignedthemintheadoptionoftheannualbudget.a. Governingcommittees.Theannualbudgetforeachdepartmentmustbepreparedandpresentedtoeachrespectivegoverning
committeeatthefirstmeetingfollowingitssubmissionbythecountyadministrator.Anygoverningcommitteemay,bymajorityvote,recommendanamendmenttothedraftbudgetforconsiderationbythefinancecommitteeandtheCountyBoard.Theserecommendationsincludethoseonanyamendmentrecommendedbythefinancecommittee.
b. Personnelcommittee.Theannualbudgetmustbepresentedtothepersonnelcommitteeatitsfirstmeetingfollowingitssubmission.ThepersonnelcommitteemustmakearecommendationtothefinancecommitteeandtheCountyBoardonwageandbenefitamountswherenotprescribedbynegotiatedlaboragreements.
c. Financecommittee.Theannualbudgetmustbepresentedtothefinancecommitteeattheirfirstmeetingfollowingitssubmission.Thefinancecommitteemustreviewtherecommendedbudgetandmakearecommendationtothecountyboardastooverallamountofthebudgetintotalandbyfundandsourcesoffinancing.Thisrecommendationmustbeintheformofanamendmentreducingorincreasingexpendituresoramendingoverallrevenuecompositionprovidedtheproposedbudgetwouldremainbalanced.AmendmentsaffectingexpenditureamountsforindividualdepartmentsmustbereferredtotheappropriategoverningcommitteefortheirrecommendationaspossiblepriortoconsiderationbytheCountyBoard.ThefinancecommitteemustalsoreviewamendmentsrecommendedbygoverningcommitteesforcompliancewiththeoverallbudgetrecommendationandpriortotheconsiderationofanyamendmentbythefullCountyBoard.
d. CountyBoard.TheCountyBoardmustconsidertherecommendationofthefinancecommitteeastooverallbudgetamountandrevenuecompositionandeveryamendmentproposedbygoverningcommitteesorthefinancecommittee.
9. Budgetadoptionandreporting.PursuanttoWisconsinstatutes,theCountyBoardisresponsiblefortheadoptionoftheannualbudget.InadditiontothereportsrequiredbyWisconsinstatutes,theannualbudgetreport,whichmustbecompletedwithinthreemonthsfollowingadoption,mustcontainexpendituresbyprogram,performancemeasuresandhistory,andasummaryandexplanationofthebudgetinsimplifiedtermsincludingmajorfactorsaffectingtheannualbudget.
242
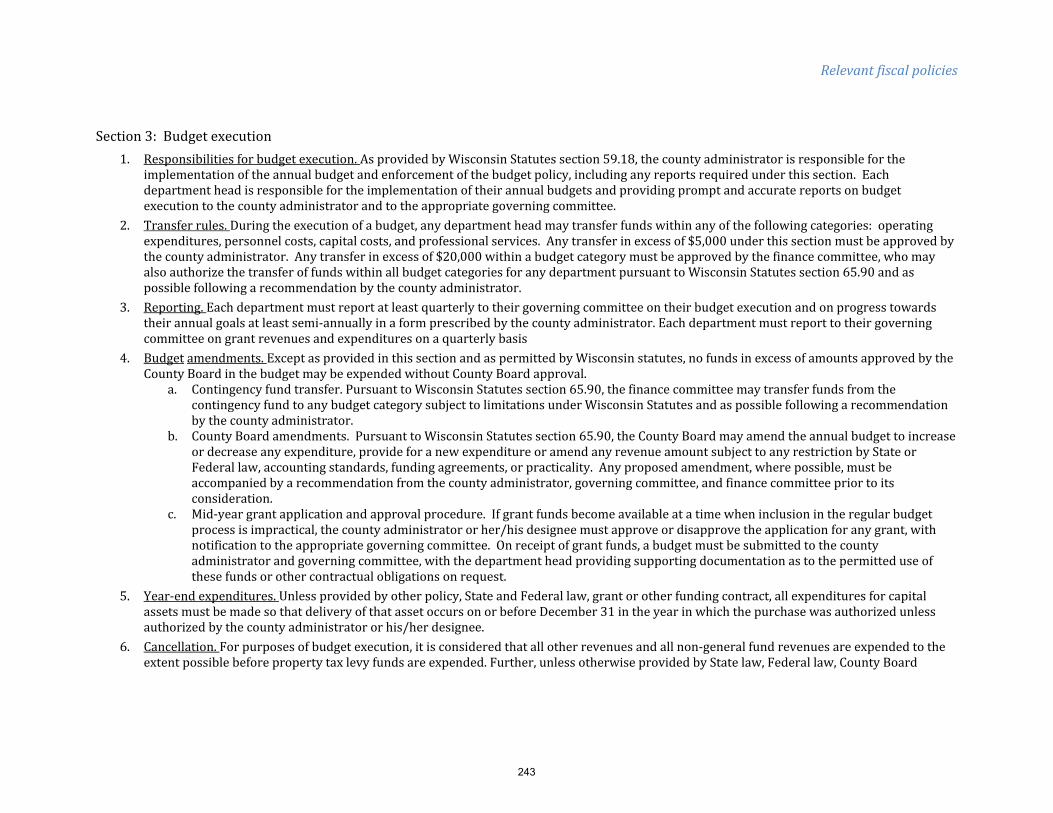
Relevantfiscalpolicies
Section3:Budgetexecution1. Responsibilitiesforbudgetexecution.AsprovidedbyWisconsinStatutessection59.18,thecountyadministratorisresponsibleforthe
implementationoftheannualbudgetandenforcementofthebudgetpolicy,includinganyreportsrequiredunderthissection.Eachdepartmentheadisresponsiblefortheimplementationoftheirannualbudgetsandprovidingpromptandaccuratereportsonbudgetexecutiontothecountyadministratorandtotheappropriategoverningcommittee.
2. Transferrules.Duringtheexecutionofabudget,anydepartmentheadmaytransferfundswithinanyofthefollowingcategories:operatingexpenditures,personnelcosts,capitalcosts,andprofessionalservices.Anytransferinexcessof$5,000underthissectionmustbeapprovedbythecountyadministrator.Anytransferinexcessof$20,000withinabudgetcategorymustbeapprovedbythefinancecommittee,whomayalsoauthorizethetransferoffundswithinallbudgetcategoriesforanydepartmentpursuanttoWisconsinStatutessection65.90andaspossiblefollowingarecommendationbythecountyadministrator.
3. Reporting.Eachdepartmentmustreportatleastquarterlytotheirgoverningcommitteeontheirbudgetexecutionandonprogresstowardstheirannualgoalsatleastsemi‐annuallyinaformprescribedbythecountyadministrator.Eachdepartmentmustreporttotheirgoverningcommitteeongrantrevenuesandexpendituresonaquarterlybasis
4. Budgetamendments.ExceptasprovidedinthissectionandaspermittedbyWisconsinstatutes,nofundsinexcessofamountsapprovedbytheCountyBoardinthebudgetmaybeexpendedwithoutCountyBoardapproval.
a. Contingencyfundtransfer.PursuanttoWisconsinStatutessection65.90,thefinancecommitteemaytransferfundsfromthecontingencyfundtoanybudgetcategorysubjecttolimitationsunderWisconsinStatutesandaspossiblefollowingarecommendationbythecountyadministrator.
b. CountyBoardamendments.PursuanttoWisconsinStatutessection65.90,theCountyBoardmayamendtheannualbudgettoincreaseordecreaseanyexpenditure,provideforanewexpenditureoramendanyrevenueamountsubjecttoanyrestrictionbyStateorFederallaw,accountingstandards,fundingagreements,orpracticality.Anyproposedamendment,wherepossible,mustbeaccompaniedbyarecommendationfromthecountyadministrator,governingcommittee,andfinancecommitteepriortoitsconsideration.
c. Mid‐yeargrantapplicationandapprovalprocedure.Ifgrantfundsbecomeavailableatatimewheninclusionintheregularbudgetprocessisimpractical,thecountyadministratororher/hisdesigneemustapproveordisapprovetheapplicationforanygrant,withnotificationtotheappropriategoverningcommittee.Onreceiptofgrantfunds,abudgetmustbesubmittedtothecountyadministratorandgoverningcommittee,withthedepartmentheadprovidingsupportingdocumentationastothepermitteduseofthesefundsorothercontractualobligationsonrequest.
5. Year‐endexpenditures.Unlessprovidedbyotherpolicy,StateandFederallaw,grantorotherfundingcontract,allexpendituresforcapitalassetsmustbemadesothatdeliveryofthatassetoccursonorbeforeDecember31intheyearinwhichthepurchasewasauthorizedunlessauthorizedbythecountyadministratororhis/herdesignee.
6. Cancellation.Forpurposesofbudgetexecution,itisconsideredthatallotherrevenuesandallnon‐generalfundrevenuesareexpendedtotheextentpossiblebeforepropertytaxlevyfundsareexpended.Further,unlessotherwiseprovidedbyStatelaw,Federallaw,CountyBoard
243
Relevantfiscalpolicies
action,oraconditionoffundingpursuanttoGASBregulations,allunspentappropriationscanceltothegeneralfundatthecloseofthefiscalyear.
Policy 912, Debt Management (Adopted 5/22/2012)
Section1:Introduction1. ContentsandscopeThispolicygovernstheissuanceandmanagementofdebtbyPolkCountyoritsagencies,subjecttootherrelevantpolicies
adoptedbythePolkCountyBoardofSupervisorsincluding,butnotlimitedto,policiesonfundbalance,procurement,investment,andbudgetpreparationandexecution.ThispolicyisalsosubordinatetoanyrelevantStateorFederallaworregulation.
2. Definitions.Forpurposesofthispolicy,thefollowingtermshavethemeaningsgiven:a. CountymeansPolkCounty,Wisconsin;b. DebtmeansasumofmoneydueathirdpartyatanexpressfuturedatethroughlegalagreementorcontractenteredintobyPolkCountyorits
constituentagencies;c. Directdebtmeansdebtpayablefromgeneralrevenues,includingcapitalleases;d. Revenuedebtmeansdebtpayablefromaspecificpledgedrevenuesource;e. Advancerefundingmeansissuingdebtobligationsinadvanceofacalldateforanobligationtoobtainainterestratesavings;f. ConduitdebtmeansdebtpayablebythirdpartiesforwhichPolkCountydoesnotprovidecreditorsecurity;g. CountyBoardmeansthePolkCountyBoardofSupervisors;andh. GFOAmeanstheGovernmentFinanceOfficersAssociationoftheUnitedStatesandCanada.
Section2:Longtermplanningofcountyindebtedness
1. Debtaffordabilitystudya. Financemanager.ThefinancemanagermustannuallyprepareadebtaffordabilityreportfortheCountyBoardonallexistingCountydebtand,
priortorecommendingissuanceorrefinancing,berevisedtoincorporateanynewproposedCountydebt.ThisreportmustincludeanassessmentoftheCounty’sabilitytogenerateandpaydebtandincludearecommendationastotheongoingaffordabilityofthatdebtandofanynewpotentialissuance.Thisreportmustincludemeasuresofdebtcapacityandrelativedebtpositioncompared,wherepossible,toothercounties,ratingagencystandardsandPolkCounty’shistoricalratiostodeterminedebtaffordability.
b. Financecommittee.ThefinancecommitteemustannuallyreviewthedebtaffordabilityreportpreparedbythefinancemanagerandmakearecommendationtotheCountyBoardpriortotheapprovalofissuanceofanynewdebt.ThefinancecommitteemustalsoreviewthecapitalimprovementplanannuallyasprovidedinthebudgetpreparationandexecutionpolicyandmakerecommendationsastoitsmodificationtotheCountyBoardtomaintaindebtaffordability.
2. Capitalimprovementplan.Asprovidedinthebudgetpreparationandexecutionpolicy,thecountyadministratormustannuallysubmitafiveyearcapitalimprovementplanforalldepartmentsalongwiththeannualbudgetincorporatingthatyear’scapitalbudget.Thecapitalimprovementplanmustprovideinformationastospecificitemstobepurchased,theirpriorityinaccordwiththeprioritysetbytheCountyBoard,alternativesshouldthepurchasenotoccuroroccuratalaterdate,financingoptions,andassociatedperformancemeasures.Inproposingtheuseofdebtissuancefor
244

Relevantfiscalpolicies
capitalimprovementstobeincorporatedintheannualcapitalbudget,theadministratormustdemonstratewhyotherfinancingsourcesareunavailableorinappropriate.
Section3:Debtissuance
1. Responsibilities.Inissuanceofnewdebt,thefollowingagentshavetheresponsibilitieshereinprovidedtheminadditiontoanyotherresponsibilityassignedbyStateorFederallaworregulation:a. Financemanager.Thefinancemanagermustoverseeandcoordinatethetiming,issuanceprocessandmarketingoftheCounty’sborrowing
andcapitalfundingactivitiesrequiredinsupportofthecapitalimprovementplan.TheInrecommendingsuchanissuance,thefinancemanagermustreportonhowthisissuanceresultsinstabledebtservicesoastoallowforaconsistentlylowaverageinterestrateoverthelongterm.
b. Financingteam.Thefinancingteamiscomprisedofoutsidefinancialspecialistswhoassistitindevelopingadebtissuancestrategy,preparingbonddocumentsandmarketingbondstoinvestors.Themembersofthisteamincludeitsfinancialadvisor,bondcounsel,underwriterandCountyrepresentatives(thefinancemanager,corporationcounselandtreasurer,withthecountyadministratorservingasanex‐officiomember).Otheroutsidefirms,suchasthoseprovidingpayingagent/registrar,trustee,creditenhancement,verification,escrow,auditing,orprintingservices,mayberetainedasrequired.ThefinancingteammustreviewtheoverallfinancingstrategyoftheCountyandmakerecommendationstothecountyadministratorandCountyBoardpriortotheissuanceofanydebt.
c. Countyadministrator.ThecountyadministratorisresponsibleforoverseeingtheworkofthefinancemanagerindebtissuanceandmakingarecommendationtothefinancecommitteeandCountyBoardbasedontherecommendationofthefinancingteam.Thecountyadministratorisalsoresponsibleforincorporatingdebtservicecostsintheannualbudgetandassuringthatadequatefundswillbeavailableinfutureyearbudgetstopaydebtservicecosts.
d. Financecommittee.Thefinancecommitteemustreviewthereportreceivedfromthefinancingteamandrecommendationbythecountyadministratorpriortotheissuanceofanynewdebt.Basedonthisinformation,thefinancecommitteemustmakearecommendationtotheCountyBoardastotheamountofissuance,repaymentstructure,purchaseofinsurance,andotherrelevantfactors.
e. CountyBoard.TheCountyBoardhasoverallresponsibilityfortheissuanceofanydebtpursuanttoStateandFederallawandregulations.2. Purposes.Thecountyadministratormayrecommendtheuseofdebtbytypeforthefollowingpurposes:
a. Directdebt.TheuseofdirectdebtmaybeproposedonlytofinancecapitalimprovementswithaprobableusefullifeofatleastfiveyearsandwhichdirectlybenefitCountygovernmentoperations;
b. Revenuedebt.Theuseofrevenuedebtmaybeproposedonlywhentherelationshipbetweentherevenuesourceandthedebtincurredisclearanddirect,whenthecapitalimprovementhasaprobableusefullifeofatleastfiveyears,whentheimprovementdirectlybenefitsCountygovernmentoperations,andwhentheuseofthisfinancingmethodcanbedemonstratedtohavenonegativeimpactontheCounty’screditratingorinterestratetobepaidonanyfutureobligations;
c. Conduitdebt.TheapprovalofconduitdebtmaybeproposedonlywhenthedebtservesapublicpurposeofbenefittothecitizensofPolkCounty,hasnodirectorindirectnegativeimpactontheCounty’screditratingorinterestratetobepaidonanyfutureobligations,andwhereadequateassurancescanbeprovidedastotheborrower’screditworthiness;
d. Staterevolvingloanfunds.LoansfromtheStateofWisconsinmaybeproposedwhenfinancingtermsaremorefavorablethanotheroptions,includingcostsofissuance,andallotherconsiderationswithrespecttodirectdebtaremet;and
e. Interfundborrowing.Interfundborrowingmaybeproposedintheannualbudgetrecommendationforpurposesofshort‐termcashflowneedsor,inthecaseofenterprisefunds,wherethereisreasontobelievethatanybudgetaryshortfallmayberesolvedinthenexttwoyears.
245

Relevantfiscalpolicies
f. Constructionnotes.Constructionnotesmaybeproposedaspartofacomprehensivefinancingplanthatprovidesfortheirrepaymentfromotherborrowingsources.
3. Termofdebtrepayment.BorrowingsbytheCountymustmatureoveratermthatdoesnotexceed75percentoftheeconomiclifeoftheimprovementstheyfinanceandusuallynolongerthan20years,unlessspecialstructuringelementsrequireaspecificmaximumtermtomaturity.TheCountymustfinanceimprovementswithaprobableusefullifelessthanfiveyearsusingsourcesotherthanborrowing.Bondssoldforthepurchaseofequipmentwithaprobableusefullifeexceedingfiveyearsmustberepaidoveratermthatdoesnotexceedsuchusefullife.
4. Legalborrowinglimitations.TheCountymustbeincompliancewithallapplicableStateandFederallawsrelatingtodebtissuanceandmanagementincluding,butnotlimitedtolawsrestrictingtheamountofissuance,arbitragerules,restrictionsonuseofbondproceeds,disclosureandfilingrequirements.
5. Debtfeatures.a. Originalissuediscountorpremium.TheCounty’sbondsmaybesoldatadiscountorpremium,inordertoachieveeffectivemarketing,achieve
interestcostsavingsormeetotherfinancingobjectives.ThemaximumpermitteddiscountisstatedintheNoticeofSaleaccompanyingtheCounty’spreliminaryofficialstatementontheBondPurchaseAgreement,asapplicable.
b. Debtservicestructureandleveldebtservice.TheCountymustprimarilyfinanceitslong‐livedmunicipalimprovementsovera20‐yeartermorless,onaleveldebtservicebasis,tominimizetheimpactontheannualbudget.
c. Callprovisions.Inpreparationfortheissuanceofnewdebt,thefinancemanagermustevaluatethecostofearlycallsandincludesuchdocumentationinthereportpreparedforconsiderationbythefinancecommitteeandCountyBoard,withanaccompanyingrecommendationbythecountyadministrator.Suchoptionsmusttakeintoaccountanypremiumforanearlycall,theoverallabilityoftheCountytorefinancenewandexistingobligationsshouldinterestratesfallorforotherreasonsshoulditbecomeadvantageousfortheCountytorestructure,defease,orpayoffobligations.
d. Interestrates.TheCountymustfirstconsidertheuseoffixed‐ratedebttofinanceitcapitalneeds,exceptforshort‐termneeds(suchasshort‐livedassets)thatwillberepaidorrefinancedinthenearterm;andmayconsidervariableratedebtunderfavorableconditions.
5. Methodofsale.Thecountyadministratormustrecommendamethodofsalethatisthemostappropriateinlightoffinancial,market,transaction‐specificandCounty‐relatedconditions,andexplaintherationaleforthisrecommendationtothefinancecommitteeandCountyBoard.a. Competitivesales.Therecommendationbythecountyadministratormustbebasedonacompetitivesaleunlessexplicitreasonsfornotso
doingareprovided.Therecommendationmustincorporatetermsofsalethatencourageasmanybiddersaspracticalandthatwouldassistinobtainingthelowestpossibleinterestratesonitsbonds.
b. Negotiatedsales.WhencertainconditionsfavorableforacompetitivesaledonotexistandwhenanegotiatedsalewillprovidesignificantbenefitstotheCountythatwouldnotbeachievedthroughacompetitivesale,thecountyadministratormayrecommendthatthedebtobligationsbesoldthroughaprivateplacementornegotiatedsale.Suchdeterminationmustbemadeonanissue‐by‐issuebasis,foraseriesofissues,orforpartorallofaspecificfinancingprogram.Suchsalesmustalsobeaccompaniedbyfulldisclosureofallfinancialaspectsincludingcleardemonstrationofcostsavingsthroughusingthismethod.
Section4:Refinancingofoutstandingdebt.
1. Conditions.Thecountyadministratormayrecommendrefinancingofoutstandingdebtunderthefollowingcircumstances:a. Debtservicesavings.Thecountyadministratormayrecommendtherefinancingofoutstandinglong‐termdebtwhensuchrefinancingallows
theCountytorealizesignificantdebtservicesavingsofatleasttwopercentoftheremainingobligationwithoutlengtheningthetermof
246

Relevantfiscalpolicies
refinanceddebtandwithoutincreasingdebtserviceinanysubsequentfiscalyear.ThecountyadministratormayalsorecommenddebtrefinancingwhenaprimaryobjectivewouldbetheeliminationofrestrictivecovenantsthatlimitCountyoperations;.
b. Defeasance.TheCountymayrefinanceoutstandingdebt,eitherbyadvancerefundingtothefirstcallorbydefeasancetomaturity,whenthepublicpolicybenefitsofreplacingsuchdebtoutweighthecostsassociatedwithnewissuanceaswellasanyincreaseinannualdebtservice.
2. Advancerefunding.Thecountyadministratormayproposeadvancerefundingofanyobligationwhenoverallsavings,includingthecostofissuanceandothercosts,resultsinsignificantdebtservicesavingsofatleastthreepercentoftheremainingobligation,thelengthofthetermofrefinanceddebtdoesnotexceedtheoverallterm,andanyextensionofcalldatedoesnotinterferewiththeabilitytomanageCountydebtservice.
Section5.Managementpractices
1. Creditratingagencyrelationships.ThefinancemanagerisresponsibleformaintainingrelationshipswiththeratingagenciesthatassignratingstotheCounty’svariousdebtobligations.ThiseffortincludesprovidingperiodicupdatesontheCounty’sgeneralfinancialconditionalongwithcoordinatingmeetingsandpresentationsinconjunctionwithanewdebtissuance.Thefinancemangermustrequestratingspriortothesaleofsecuritiesfromatleastoneofthemajorratingagenciesformunicipalbondpublicissues.CurrentlytheseagenciesareMoody’sInvestorsServiceandStandard&Poor’sCorporation.Thefinancemanagerorcountyadministratormustprovideawrittenand/ororalpresentationtotheratingagency(ies)toassistintheirevaluations.ThefinancemanagermustmakeeveryreasonableefforttomaintainorimprovetheCounty’sgeneralobligationbondcreditratingsanddemonstratesuchinhis/herreporttothecountyadministratorforincorporationintothereporttothefinancecommitteeandCountyBoard.
2. Formalfiscalpolicies.ThecountyadministratormustannuallyreviewtheCounty’sformalfiscalpoliciesincludingtheInvestmentPolicy,GeneralFundReservePolicy,BudgetPolicy,PurchasingPolicy,andthisDebtManagementPolicy.
3. Rebatereportingandcovenantcompliance.Thefinancemanagerisresponsibleformaintainingasystemofrecordkeepingandreportingtomeetthearbitragerebatecompliancerequirementsofthefederaltaxcodeand/orcontractingforsuchservice.Thiseffortincludestrackinginvestmentearningsondebtproceeds,calculatingrebatepaymentsincompliancewithtaxlaw,andremittinganyrebatableearningstothefederalgovernmentinatimelymannerinordertopreservethetax‐exemptstatusoftheCounty’soutstandingdebtissues.Additionally,thefinancemanagermustmonitorgeneralfinancialreportingandcertificationrequirementsembodiedinbondcovenantstoensurethatallcovenantsarecompliedwith.
4. ReportingPractices.ThecountyadministratormustensurethattheCountyisincompliancewiththestandardsoftheGovernmentFinanceOfficersAssociationforfinancialreportingandbudgetpresentationandthedisclosurerequirementsoftheSecuritiesandExchangeCommission.
Policy 920, Fund Balance (Adopted 5/20/2008)
PurposeandScopeThepurposeofthispolicyistoestablishaframeworkfortheunreservedfundbalance,bothdesignatedandundesignated,inthegeneralfund.Thispolicyistoimprovethecounty’sfinancialstabilitybymaintainingappropriatereservestowithstandeconomicdownturns,emergenciesornaturaldisasters,short‐termcapitalimprovementsandoperatingcashflowneeds.PolicyThesepolicyguidelineswillprovidedirectionduringthebudgetprocessanddemonstrateacommitmenttomaintainadequatefinancialreservesforlong‐termfinancialplanning.
A.Thecountywillmanageitsfundbalancewithinthefollowingparameters:
247

Relevantfiscalpolicies
a.Thecountywillmaintainanunreservedfundbalanceofnotlessthan20%basedonthebudgetedoperatingexpenditures,asmeasuredonDecember31stofeachyear.
b.Thecountymaydecidetomaintainatargetlevelofnolessthanfourmonthsofthecurrentyearsbudgetedoperatingexpendituresinthefundbalance.
c.TheparametersshouldbereviewedbytheFinanceCommitteeannuallyormoreoftenifconditionschange.B.Thecountywillmaintainappropriatelevelsoffundbalanceby:
a.Allowingfortheplanneduseoffundbalancefordefinedpurposes,includingpropertytaxreliefandfundingformajorcapitalprojectsortime‐limitedprojects;
b.Designatingfundbalanceforfutureexpenditures,carryover,cashflowandincurredbutnotrecognizeditems,budgetstabilization,long‐termpersonnelobligations,and
c.Usingfundbalancetomitigatetheeffectsoffluctuationsinstateaid.C.Ifanyplanneduseoffundbalanceorifthefundbalancefallsbelow20%7thereshallbeanaccompaniedplantorestorethefundbalancetotheminimumtargetedlevel.
MonitoringandReportingTheFinanceDirectorwillestimatethesurplusordeficitforthecurrentyearandprepareaprojectionoftheyear‐endunreservedfundbalancetotheFinanceCommittee,aspartoftheannualbudgetprocess.
7 Interpreted by the Finance Committee as unassigned General Fund balance as a percentage of General Fund expenditures as reported in the annual audit
248

AnnexD:2015ApprovedBudgetResolution
Resolution No. 48‐ 2015
Resolution to Adopt the Polk County Operating and Capital Budget for the Calendar Year 2016 and To Set the 2016 Tax Levy
TO THE HONORABLE CHAIRPERSON AND MEMBERS OF THE POLK COUNTY BOARD OF SUPERVISORS: Ladies and Gentlemen:
WHEREAS, it is the responsibility of the Polk County Board of Supervisors to adopt a budget for the operation and fiscal management of the County of Polk for the year commencing January 1, 2016; and
WHEREAS, pursuant to Wisconsin Statute Section 59.18(5) and Policy 880, Budget Preparation and Execution, the County Administrator did prepare, submit and offer for review proposed 2016 budget by the County Board at its meeting of September 15, 2015; and
WHEREAS, as part of the proposed 2016 budget, the County Administrator did submit a staffing plan with respect to each county department in accordance with Polk County Policy No. 881, Staffing and Position Administration; and
WHEREAS, each county board standing committee has reviewed the proposed budget for every department and forwarded that budget with any recommendations to the General Government Committee; and
WHEREAS, the Polk County Board of Supervisors did consider amendments to the budget at its meeting of October 16, 2015; and
WHEREAS, on October 21, 2015, the Polk County Board of Supervisors did publish for public review a summary of the proposed 2016 budget and did notice and conduct a public hearing on the proposed 2016 budget in conformity with the laws of the State of Wisconsin; and
WHEREAS the Wisconsin Department of Revenue delivers the Statistical Report on Equalized Value of Polk County for 2016 and the Polk County Board of Supervisors accepted the report on November 10, 2015, which sets the Equalized Value of Polk County for taxing purposes at $4,073,722,200 exclusive of value in Tax Increment Districts; and
249

CapitalImprovementPlan
WHEREAS, for purposes of satisfying the requirements of the state imposed county tax levy rate limit formula, the budget for 2016 is in compliance with Wisconsin Statute Sections 59.605 and 66.0602; and
WHEREAS, the Polk County Budget for the Calendar Year 2016 is a financial plan for the operational needs of the County and was developed in accordance with the Uniform Chart of Accounts for Wisconsin Municipalities and the pronouncements of the Governmental Accounting Standards Board(GASB); and
WHEREAS, this resolution constitutes Polk County Operating and Capital Budget for the Calendar Year 2016 and is defined as the County Budget pursuant to Wisconsin Statute Section 65.90.
NOW, THEREFORE, BE IT RESOLVED that in accordance with Wisconsin Statute Section 65.90, the Polk County Board of Supervisors does hereby adopt the 2016 Operating and Capital Budget of the County of Polk, in the amount of $58,710,373 including departmental appropriations and revenues and use of fund balance as amended following the public hearing as set forth in the attached document entitled Adopted 2016 Operating and Capital Budget of the County of Polk, incorporated herein.
BE IT FURTHER RESOLVED that the Polk County Board of Supervisors does authorize and appropriate such revenues and expenditures for calendar year 2016 as designated in the Operating and Capital Budget for calendar year 2016.
BE IT FURTHER RESOLVED that the Polk County Board of Supervisors directs that all appropriations for 2015 shall lapse to the general fund as undesignated fund balance at the end of calendar year 2015 and that any other fund balance determined to exist at the end of 2015 shall be transferred to general fund balance to the extent said appropriation has not been expended or appropriation or other fund balance been determined by the County Administrator to be nonspendable, restricted, committed, or assigned as defined by GASB Rule 54.
BE IT FURTHER RESOLVED that the Polk County Board of Supervisors affirms the existence of the committed or assigned fund balances in the attached documentation.
BE IT FURTHER RESOLVED that, notwithstanding any other policy to the contrary, the Polk County Board of Supervisors adopts the submitted departmental staffing plans and authorizes for calendar year 2016 those positions and the corresponding expenditures identified in said staffing plans and that any position not so identified will be considered eliminated from the 2016 department budget.
BE IT FURTHER RESOLVED that the 2016 fee schedule as incorporated in the 2016 budget is hereby adopted, including rentals for the use of County‐owned property.
250

CapitalImprovementPlan
BE IT FURTHER RESOLVED that Wisconsin State taxes, in conformity with and as provided in Wisconsin Statute Section 70.58, be levied in the amount of $717,808 for State Forestation on taxable property of Polk County.
BE IT FURTHER RESOLVED that the Polk County Board of Supervisors levies against all real property within Polk County for 2016, as follows:
A. County Levy:
1. General County Operations: $ _18,180,866 2. Debt Levy: $ __3,287,152 Total 2016 County Levy $ _21,468,018
B. State Required Levy on Behalf of Other Agencies 3. Town Bridge Construction: $ 2,159 4. Library Support – Act 150: $ __671,388
Total 2016 Levy, All Purposes: $_22,141,565
BE IT FURTHER RESOLVED that the County Administrator is authorized to make any technical corrections to the budget that are necessary for the County Budget to comply with all state law and regulations.
BE IT FURTHER RESOLVED that a portion of the unassigned fund balance as of December 31, 2015, be allocated as follows:
1. $20,000 assigned to Redaction Fees
BE IT FURTHER RESOLVED that the department heads of the various County departments are authorized to enter into and to execute on behalf of the respective County department intra‐county cooperative agreements and service agreements that are authorized and necessary under federal and state programs to provide services to other County departments and to secure and to account for reimbursements for those expenses that incurred by other County departments in the performance of services required by those cooperative agreements or service agreements.
BE IT FURTHER RESOLVED that notwithstanding any policy to the contrary, with the adoption of this resolution the Polk County Board of Supervisors authorizes departments to apply for and accept any grant incorporated in this budget and identified on the grant schedule attached hereto and incorporated herein or any revenue incorporated in this budget and to accept, with the concurrence of the County Administrator, any contract with the State of Wisconsin whose revenues and expenditures are incorporated in this budget.
251

CapitalImprovementPlan
BE IT FURTHER RESOLVED that Polk County Board of Supervisors authorizes the Parks, Buildings and Solid Waste Director to act on its behalf to submit an application to the Department of Natural Resources for financial assistance under Wisconsin Statutes sec. 287.23 and Wisconsin Administrative Code chapters NR 542, 544 and 549, to sign necessary documents and to submit a final report.
BE IT FURTHER RESOLVED that the Polk County Board of Supervisors authorizes the Parks, Buildings and Solid Waste Director or her/his designee to act on behalf of the County of Polk to submit an application to the State of Wisconsin Department of Natural Resources for any financial aid that may be available and incorporated in this budget, to submit reimbursement claims along with necessary supporting documentation within six months of project completion date, to submit necessary signed documents and to take necessary action to undertake, direct and complete the approved project.
BE IT FURTHER RESOLVED that the County of Polk will comply with state or federal rules for the programs to the general public during reasonable hours consistent with the type of facility; and will obtain from the State of Wisconsin Department of Natural Resources or the National Park Service, as appropriate, approval in writing before any change is made in the use of the project site.
BE IT FURTHER RESOLVED that the Polk County Board of Supervisors authorizes and directs the Director of Polk County Land and Water Resources Department to act on behalf of the County of to submit requests and applications for grants funding or financial assistance from the Wisconsin Department of Natural Resources with respect to the specific grant and or financial assistance program, as follows:
1. The Aquatic Invasive Species Control Grant Program; 2. The Lake Management Grant Program; and 3. The Lake Protection and Classification Grant Program.
BE IT BE IT FURTHER RESOLVED that the Polk County Board of Supervisors approves and authorizes on behalf of the County of Polk an application for grant funding or financial assistance under each respective identified program.
BE IT FURTHER RESOLVED that the Polk County Board of Supervisors authorizes the Director of the Polk County Land and Water Resources Department to act on behalf of the County of Polk as grant administrator to sign and submit an application to the State of Wisconsin for financial aid for aquatic invasive species control purposes, lake planning purposes, and lake protection purposes; to sign a grant agreement between the county and the DNR as well as other necessary documents; to take necessary action to undertake, direct, and complete an approved aquatic invasive species control grant, an approved lake planning grant, and an approved lake protection grant; to submit quarterly and/or final reports to the DNR to satisfy the grant agreement; and to submit reimbursement claims along with necessary supporting documentation within six months of project completion date.
252

CapitalImprovementPlan
BE IT FURTHER RESOLVED that the Polk County Board of Supervisors affirms that Polk County will meet the obligations under any aquatic invasive species control grant, lake planning grant, and lake protection grant including timely publication of the results, compliance with state rules for the program, and will meet the financial obligations under the grant including the prompt payment of the required County’s commitment to the project costs of 25 to 33 percent depending on the program.
BE IT FURTHER RESOLVED that the Polk County Land and Water Resources Department desires to receive grant funding from the Wisconsin Department of Natural Resources (WDNR) –Target Runoff Management (TRM) program pursuant to ss. 281.65 or 281.66, Wis. Stats., and chs. NR151, 153, and 155, Wis. Adm. Code, for the purpose of implementing measures to control nonpoint source water pollution and the Landowner agrees to contribute the local share (also called the “match”) needed for projects that are ultimately grant‐funded by the WDNR.
BE IT FURTHER RESOLVED the Polk County Board of Supervisors authorizes the Polk County Conservationist to submit a signed grant application to the WDNR; to submit a signed Environmental Hazard Assessment form to the WDNR, if applicable; to sign a grant agreement between Polk County and the WDNR; to submit signed quarterly and final report forms to the WDNR; and to submit signed grant reimbursement requests to the WDNR.
BE IT FURTHER RESOLVED that Polk County Board of Supervisors authorizes and delegates the discretion to the Golden Age Manor Administrator to, after consultation with the County Administrator, to provide for and to implement a compensation increase or bonus for 2015, should projections indicate that the ending balance, after receipts of all state aid, exceeds $50,000.
BE IT FURTHER RESOLVED that, effective December 1, 2015, the Polk County Board of Supervisors renames the Polk County Human Services Department the Polk County Department of Children and Families.
BE IT FURTHER RESOLVED that, effective December 1, 2015, pursuant to Sections 46.23(3), 59.03 and 59.51, the Polk County Board of Supervisors establishes the Community Services Division for the purpose of delivering on a coordinated and integrated basis those services and programs administered in the county departments of Polk County Department of Children and Families, the Polk County Health Department and the Office of Medical Examiner.
BE IT FURTHER RESOLVED that, effective December 1, 2015, the Polk County Board of Supervisors establishes the county office of Community Services Division Director, which office shall perform those duties and responsibilities of the Human Services Director as enumerated in statute, administrative regulation or county ordinance and resolution; and those duties and responsibilities of Public Health Director, with exception of those duties and responsibilities transferred to the Polk County Health Officer, as established herein below.
BE IT FURTHER RESOLVED that the Community Services Division Director shall also have the authority to oversee the functions administered in the county departments within the Community Services Division; to exercise the powers of the County Administrator, enumerated in Section 59.18(2)(b), upon delegation
253

CapitalImprovementPlan
and transfer of such powers by the County Administrator, with respect to those appointive positions of departments within the Community Services Division; and to administer the appropriations, allocations and authorized expenditures and staff of the departments within the division so as to effect this consolidation.
BE IT FURTHER RESOLVED that the Polk County Board of Supervisors acknowledges that pursuant to Wisconsin Statute Section 251.04(9), the County Administrator has assumed the powers and duties enumerated in Section 251.04, Wisconsin Statutes of the Health and Human Services Board and that the County Administrator has delegated such powers and duties to the Community Services Division Director.
BE IT FURTHER RESOLVED that the Polk County Board of Supervisors restructures the county office of Public Health Director/Health Officer into two separate county offices, the Community Services Division Director, as established above, and the county office of Polk County Health Officer, which such office shall be established, effective December 1, 2015, possess the qualifications, duties and responsibilities of a Level III local health officer as provided in Wisconsin Statute Section 251.06(1) and (3) and county ordinance and resolution, and be appointed and supervised by the Community Services Division Director pursuant to Wisconsin Statute Section 251.04.
BE IT FURTHER RESOLVED that the Polk County Board of Supervisors establishes the following appointed offices within the Community Services Division, reporting to the Community Services Director and superseding any and all interim appointments by the County Administrator or the Human Services Director, to be implemented at the discretion of the Community Services Director:
1. Children and Family Services Director 2. Business and Operations Manager 3. Economic Support Manager 4. Behavioral Health Department Director
BE IT FURTHER RESOLVED that the Polk County Board of Supervisors authorizes the Community Services Director to re‐allocate any appropriation and authorized expenditure to effect this restructuring, provided that the overall budget amount and authorized staffing level for the Department of Human Services, Public Health Department, and Medical Examiner for 2016 is not exceeded.
BE IT FURTHER RESOLVED that the Polk County Board of Supervisors establishes the appointed county office of Deputy County Administrator.
BE IT FURTHER RESOLVED that Deputy County Administrator shall carry out those duties and responsibilities of the County Administrator during such times in which the incumbent County Administrator assigns to the Deputy County Administrator said responsibilities or in the event that the County Administrator is, due to incapacity, unable to perform the duties of such office.
254

CapitalImprovementPlan
BE IT FURTHER RESOLVED that, pursuant to Wisconsin Statute Section 59.52(1)(b), the Polk County Board of Supervisors establishes the appointed county office of Director of Department of Administration.
BE IT FURTHER RESOLVED that the Director of the Department of Administration will have the responsibility to administer all of the functions assigned to the Department of Administration and carry‐out those duties and responsibilities previously assigned to the Finance Manager, including, but not limited to, those of the County Auditor, as enumerated in Wisconsin Statute Section 59.47 and respective county policy and to specifically oversee all financial practices in all departments or agencies, including reporting and software, not otherwise prescribed by Wisconsin Statutes.
BE IT FURTHER RESOLVED that the complete budget, as adopted, be placed on file in the office of the County Clerk and County Administrator.
At its annual business meeting on November 10, 2015, the Polk County Board of Supervisors did, pursuant to Section 65.90 and after public hearing on the same, adopt the above‐entitled resolution, Resolution No. 48‐ 2015: Resolution to Adopt the Polk County Operating and Capital Budget for the Calendar Year 2016 and To Set the 2016 Tax Levy, by a majority vote of 15 in favor and 0 against.
255

AnnexE:Annotated2016–2020CapitalImprovementPlan
Introduction and Purpose
As part of the annual budget process, Polk County prepares a five‐year capital improvement plan (CIP). The first year of that CIP – projects and funding – is incorporated in the annual budget as a capital budget; the remaining years are planning estimates that will be incorporated in subsequent budgets.
The CIP identifies Polk County’s priority projects that exceed $25,000 in cost and have a life expectancy greater than three years. In addition, these are capital projects, the purchase of a tangible asset such as roads, large computer equipment and software packages, and so forth. The ordinary replacement of vehicles and similar are not included in the CIP but in individual annual operating budgets (although a separate procurement schedule for capital purchases above $5,000 is incorporated within the budget documentation).
A separate CIP is important for financial planning for Polk County, as most of these items are very expensive, warranting a level of planning above and beyond that available through a single year budget process. Major road and bridge construction or new/substantially renovated buildings are long‐lived assets, the consequences of which will affect county services and operating budgets for years into the future. In addition, larger capital projects are commonly financed through debt, and therefore a well‐designed CIP can help maintain a good credit rating as well as avoid sudden changes in debt service needs. A well‐designed CIP process is also necessary to keep the public and other stakeholders informed about capital needs and projects, allowing for citizen input and for coordination between other public and private capital projects. The latter is especially important as public infrastructure investment is an essential component of economic development. Finally, orderly maintenance and replacement of facilities, including roads and buildings, is essential to the preservation of public investment in these facilities.
256

CapitalImprovementPlan
The CIP process
In preparing their annual budget submission, Polk County departments are asked to forecast major capital needs in their respective areas, building upon the prior year’s CIP. Departments are encouraged to consult with their Governing Committees and other stakeholders in developing these proposals. These requests are transmitted to the Department of Administration for incorporation into the revised CIP and the annual capital budget. In developing the CIP, the Department of Administration uses a basic set of criteria to determine whether to incorporate these requests in the CIP. These criteria include:
o The degree to which the proposed project meets the goals and objectives as set by the County Board and the relevant Governing Committee;
o The project’s role and effect in preserving public infrastructure investment;
o The effect of the project on the county budget in reducing or increasing operating costs;
o Any role or effect on improving the public safety of health of Polk County residents, economic development or tax base growth or other clearly demonstrable public benefit; and
o Whether the project is mandated by the federal or state government or will help Polk County meet its mandates.
In each case, that evaluation includes a review of alternative methods of achieving the same goal, including an evaluation of the effect of not undertaking the project.
The next stage of the process is a determination of financing options and feasibility. As funding is of course limited, projects have to compete one with another. A preliminary cost‐benefit analysis is undertaken for each as well as a financing analysis including the degree to which the project can help leverage non‐County funds or financing options other than through the property tax. Timing of that financing is also a consideration, of course. Also note that the revenues listed as “unfunded” indicate solely that no specific funding source has been determined. The individual years’ capital budgets would be balanced by using new revenues from a variety of sources, reductions in operating expenses, or deferral or cancellation of other capital projects.
257

CapitalImprovementPlan
$‐
$1.0
$2.0
$3.0
$4.0
$5.0
$6.0
2007
2008
2009
2010
2011
2012
2013
2014
2015
2016
2017
2018
2019
2020
2021
2022
Figure 11
Polk County Debt Service by Year(millions)
The resultant recommendations are, for the first year, incorporated in the Department of Administration’s budget recommendation to the County Board. Subsequent recommendations are incorporated in CIP submitted along with the final budget.
CIP Outlook
For the first time in a number of years, Polk County is looking at the opportunity to undertake a significant increase in capital investments without increasing the property tax levy. Within the period covered by this CIP, debt service will fall from $3.3 million in 2016 to $2.4 million in 2019 (Figure 11), providing future County Boards with the opportunity to fund capital projects either directly from the levy or through bonding. As the County has not issued any new debt since 2007 and as the CIP itself indicates, this will be opportune time to consider some larger projects to maintain the value of the investments the County has made in its infrastructure. In addition, the scheduled payback to the County’s internal revolving loan fund will also provide funding for internal investments; some of these are included in this CIP.
CIP Format
This document is allocated by department, with an initial summary sheet, and by year. The first year’s amount is included in the 2016 budget; subsequent years will be evaluated for potential inclusion at the appropriate time. Each department’s capital budget is available in detail from the department of administration. Note that financial constraints have clearly limited the items for inclusion, and no significant expansion in investment is anticipated until perhaps 2017, anticipating a reduction in the County’s levy for debt service beginning that year. The 2017 CIP for the Highway Department incorporates either a major rebuilding of the existing highway facility, with a cost of perhaps $5 million, or building a new facility at a cost of perhaps $10 million, funded through
258

CapitalImprovementPlan
a debt issuance and internal borrowing; the 2017 CIP for Law Enforcement incorporates the implementation of new emergency communications equipment totaling nearly $500,000. All of these decisions, of course, will be made by future County Boards.
For each section, following, revenues are listed by source (including unfunded, or to be determined) and expenditures by category, divided into the following groups:
A) IT Items, or Information Technology purchases such as software systems or Geographic Information System (GIS) equipment;
B) Vehicles, or trucks and cars licensed to operate on public highways;
C) Other Capital Equipment, or heavy machinery not licensed to operate on public highways;
D) Road Construction / Repairs by the Highway Department; and E) Facilities, Furniture & Equipment, or buildings and other improvements to real estate, including machinery permanently affixed to real
estate.
For each department, a separate paragraph discusses the estimated impact of these capital expenditures on future operating budgets. For the current year, of course, these impacts are reflected in the actual current year operating budget.
259

2016 2017 2018 2019 2020 TotalRevenues
Fund Balance 10,000 ‐ ‐ ‐ ‐ 10,000 Asset Replacement Fund 250,000 ‐ ‐ 250,000 ‐ 500,000 Levy (Property Tax) 1,682,039 2,306,500 1,653,500 2,088,500 2,201,300 9,931,839 State Transportation Aids 1,100,000 1,200,000 1,200,000 1,200,000 1,200,000 5,900,000 GAM Revenues 200,000 200,000 200,000 200,000 200,000 1,000,000 Unfunded 88,200 10,899,232 1,202,000 183,600 702,200 13,075,232 Grants 208,000 ‐ ‐ ‐ ‐ 208,000 Lime Revenues 40,000 45,000 45,000 50,000 25,000 205,000 Park and Lake Funds 25,000 40,000 30,000 12,000 25,000 132,000
Total Revenue 3,603,239$ 14,690,732$ 4,330,500$ 3,984,100$ 4,353,500$ 30,962,071$
ExpendituresA) IT Items 391,939 100,000 400,000 - - 641,939 B) Vehicles 777,500 734,000 729,000 873,000 884,000 3,997,500 C) Other Capital Equipment 188,000 781,032 517,000 522,000 656,000 2,664,032 D) Road Construction / Repairs 1,864,200 3,451,200 1,975,000 1,760,600 1,745,200 10,796,200 E) Facilities, Furniture & Equipment 341,000 9,076,500 679,500 816,500 1,043,300 11,956,800 F) Parks, Museum, Fair 40,600 548,000 30,000 12,000 25,000 655,600
Total Expenditures 3,603,239$ 14,690,732$ 4,330,500$ 3,984,100$ 4,353,500$ 30,712,071$
Future operating budget impacts:See sections for each individual department and summary table, following
Polk County 5 Year Capital Improvement Plan Summary
260

Department and InvestmentCapital
InvestmentGeneral Fund
Highway Fund
Human Services Fund Note
BuildingsVehicle 80,000 375 Fuel efficiency savingsLighting projects 57,000 11,400 Energy savings
Higway DepartmentHighway Vehicles 504,000 2,200 Fuel efficiency savings
Human ServicesBehavioral Health Software 250,000 25,000 Improved scheduling and increased billing
Land InformationLiDAR 141,939 5,000 Increased revenue from fees
Law EnforcementSquad cars 186,000 1,000 Fuel efficiency savings
TOTAL 17,775 2,200 25,000
Savings from Capital Investments Incorporated in the 2016‐18 Operating Budget
Estimated Savings Amount
Note: These savings have been incorporated in the 2016 (and following) budgets. There are no additional operating costs accruing from capital investments made in 2016.
261
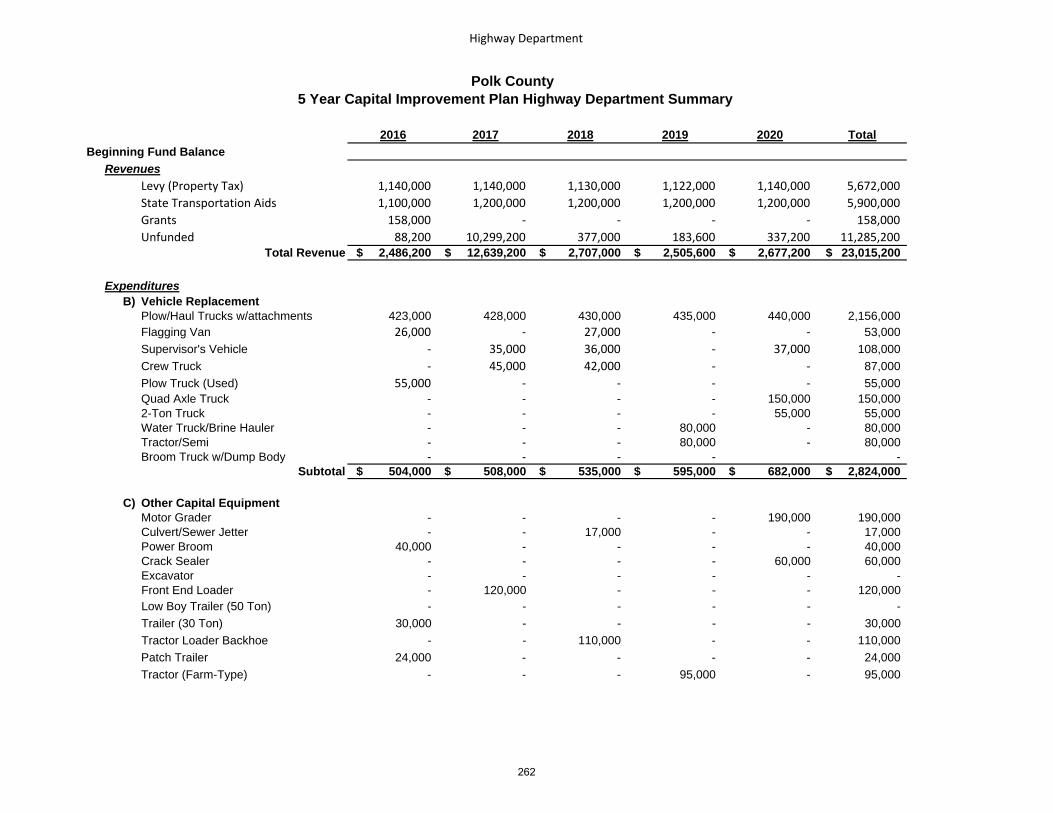
Highway Department
2016 2017 2018 2019 2020 TotalBeginning Fund Balance
RevenuesLevy (Property Tax) 1,140,000 1,140,000 1,130,000 1,122,000 1,140,000 5,672,000 State Transportation Aids 1,100,000 1,200,000 1,200,000 1,200,000 1,200,000 5,900,000 Grants 158,000 ‐ ‐ ‐ ‐ 158,000 Unfunded 88,200 10,299,200 377,000 183,600 337,200 11,285,200
Total Revenue 2,486,200$ 12,639,200$ 2,707,000$ 2,505,600$ 2,677,200$ 23,015,200$
ExpendituresB) Vehicle Replacement
Plow/Haul Trucks w/attachments 423,000 428,000 430,000 435,000 440,000 2,156,000 Flagging Van 26,000 ‐ 27,000 ‐ ‐ 53,000 Supervisor's Vehicle ‐ 35,000 36,000 ‐ 37,000 108,000 Crew Truck ‐ 45,000 42,000 ‐ ‐ 87,000 Plow Truck (Used) 55,000 ‐ ‐ ‐ ‐ 55,000 Quad Axle Truck - - - - 150,000 150,000 2-Ton Truck - - - - 55,000 55,000 Water Truck/Brine Hauler - - - 80,000 - 80,000 Tractor/Semi - - - 80,000 - 80,000 Broom Truck w/Dump Body - - - - -
Subtotal 504,000$ 508,000$ 535,000$ 595,000$ 682,000$ 2,824,000$
C) Other Capital EquipmentMotor Grader - - - - 190,000 190,000 Culvert/Sewer Jetter - - 17,000 - - 17,000 Power Broom 40,000 - - - - 40,000 Crack Sealer - - - - 60,000 60,000 Excavator - - - - - - Front End Loader - 120,000 - - - 120,000 Low Boy Trailer (50 Ton) - - - - - - Trailer (30 Ton) 30,000 - - - - 30,000 Tractor Loader Backhoe - - 110,000 - - 110,000 Patch Trailer 24,000 - - - - 24,000 Tractor (Farm-Type) - - - 95,000 - 95,000
Polk County 5 Year Capital Improvement Plan Highway Department Summary
262

Highway Department
2016 2017 2018 2019 2020 TotalMowers - - - 55,000 - 55,000 Message Board - - - - - - Spray Patcher - 60,000 - - - 60,000 Attenuator 24,000 - - - - 24,000 Forestry Truck - - 70,000 - - 70,000
Subtotal 118,000$ 180,000$ 197,000$ 150,000$ 250,000$ 895,000$
D) Road ProjectsCTH P1/P2-Chipseal 121,200 - - - - 121,200 CTH F2/F3-Chipseal 125,200 - - - - 125,200 CTH D2-(Part 2) Prep Work 65,000 - - - - 65,000 CTH K2/K2.1-Prep Work 65,000 - - - - 65,000 CTH K2/K2.1-3" Overlay 724,800 - - - - 724,800 CTH C3-Ultra-Thin Overlay 703,000 - - - - 703,000 CTH J1-Bridge 48-0006 Engineering 60,000 - - - - 60,000 CTH D2-Pulverize/Pave - 1,800,000 - - - 1,800,000 CTH J1X1/CC2-Chip Seals - 223,200 - - - 223,200 CTH JJ3-Prep Work - 75,000 - - - 75,000 CTH W2-Thin Overlay (2") - 816,000 - - - 816,000 CTH G4 & G4.1-Mill/Overlay - 217,000 - - - 217,000 CTH G6-Thin Overlay - 320,000 - - - 320,000 CTH K1-Culverts/Prep Work - - 125,000 - - 125,000 CTH N1/Y2-Chip Seals - - 198,000 - - 198,000 CTH JJ3-2.5" Overlay - - 700,000 - - 700,000 CTH W3-Thin Overlay - - 462,000 - - 462,000 CTH J1-Bridge 48-0006 ROW - - 30,000 - - 30,000 CTH JJ1/A1.2/F1/D1.1 - Micro Surface - - 100,000 - - 100,000 CTH E5 - Overlay - - 360,000 - - 360,000 CTH V1 - Culverts/Ditching - - - 178,000 - 178,000 CTH I1/M2/M3 - Chip Seal - - - 240,000 - 240,000 CTH A2/A3 - Chip Seal - - - 179,600 - 179,600 CTH H2 - Chip Seal - - - 113,000 - 113,000 CTH W4-Chip Seal - - - 124,000 - 124,000 CTH G5-Thin Overlay (1.5") - - - 835,000 - 835,000
263

Highway Department
2016 2017 2018 2019 2020 TotalCTH Z1 - Prep Work - - - 91,000 - 91,000 CTH Z1 - Pulverize/Pave - - - - 547,000 547,000 CTH W1/E1-Chip Seal - - - - 201,200 201,200 CTH J1-Bridge 48-0006 Replacement - - - - 150,000 150,000 CTH K1-Pulverize & Pave - - - - 737,000 737,000 CTH N1-Overlay West End - - - - 110,000 110,000 CTH Z1 - Prep Work - - - - - -
Subtotal 1,864,200$ 3,451,200$ 1,975,000$ 1,760,600$ 1,745,200$ 10,796,200$
E) Facility ImprovementsBuilding Needs - 8,500,000 - - - 8,500,000
Subtotal $ - 8,500,000$ -$ -$ -$ $ 8,500,000
Total 2,486,200$ 12,639,200$ 2,707,000$ 2,505,600$ 2,677,200$ 23,015,200$
* Road Projects Costs are only reflective of the County's portion only.
Current and future operating budget impacts:Vehicle (B) and equipment (C) are timed to prevent an increase in repair costs and operational issues due to equipment down time. Deferral of these expenditures could result in repair costs, rental costs, and increased fuel consumption due to energy efficiency improvements in newer vehicle models.
Road projects (D) are budgeted so as to maintain the current quality of the County's road system, with a PASER rating of 7.0, considered to be "good" condition. Deferral of such expenditures would result in a deterioration of the County's highway system with eventually higher future costs for repair or reconstruction. The amount of construction is consistent with the capacity of the County work crews; acceleration or delay of projects will result in higher overtime or idle workers, respectively.
Facility improvements (E) reflect a major reconstruction or rebuilding of the central Highway Department facility; a new or modernized facility will reduce operating budgets through energy efficiency, proper storage and increased life expectency for equipment along with lower repair costs, improved storage and access to repair parts and improved equipment leading to lower downtime, and increased operational efficiencies. Deferral of this project would result in escalating building repair costs, continued high maintenance costs and increased potential for significant structural failure.
264

2016 2017 2018 2019 2020 TotalBeginning Fund Balance
RevenuesAsset Replacement Fund 250,000 ‐ ‐ ‐ ‐ 250,000
Total Revenue 250,000$ -$ -$ -$ -$ 250,000$
ExpendituresA) IT Items
Behavioral Health Software 250,000 ‐ ‐ ‐ ‐ 250,000 Subtotal 250,000$ -$ -$ -$ -$ 250,000$
Total 250,000$ -$ -$ -$ -$ 250,000$
Current and future operating budget impacts:
Polk County 5 Year Capital Improvement Plan Human Services Department Summary
IT equipment (A) is a electronic medical records and billing software package. It is estimated that this package will have a five year payback due to improved scheduling and billing.
265

2016 2017 2018 2019 2020 TotalBeginning Fund Balance
RevenuesFund Balance 10,000 ‐ ‐ ‐ ‐ 10,000 Levy (Property Tax) 81,939 ‐ ‐ ‐ ‐ 81,939 Grants 50,000 ‐ ‐ ‐ ‐ 50,000 Unfunded ‐ 100,000 ‐ ‐ ‐ 100,000
Total Revenue 141,939$ 100,000$ -$ -$ -$ 241,939$
ExpendituresZoningA) IT Items
GPS Equipment ‐ 100,000 ‐ ‐ ‐ 100,000 LiDAR 141,939 ‐ ‐ ‐ ‐ 141,939
Subtotal 141,939$ 100,000$ -$ -$ -$ 241,939$
Total 141,939$ 100,000$ -$ -$ -$ 241,939$
Current and future operating budget impacts:
Polk County 5 Year Capital Improvement Plan Land Information Department Summary
IT equipment (A) includes more precise GPS equipment and improved aerial mapping of the County. These expenditures will reduce operating budgets by increasing the productivity of the County's surveying program, including savings in other departments such as the Highway Department and Parks. Deferral of these expenditures will delay these savings; acceleration of these projects will allow these savings to occur earlier.
266

2016 2017 2018 2019 2020 TotalBeginning Fund Balance
RevenuesAsset Replacement Fund ‐ ‐ ‐ 250,000 ‐ 250,000 Lime Revenues 40,000 45,000 45,000 50,000 25,000 205,000
Total Revenue 40,000$ 45,000$ 45,000$ 300,000$ 25,000$ 455,000$
ExpendituresC) Other Capital Equipment
Purchase Impact Hammer 40,000 ‐ ‐ ‐ ‐ 40,000 Replace JD Loader ‐ ‐ ‐ 300,000 ‐ 300,000 2 ‐ Radial Stacker ‐ 45,000 ‐ ‐ ‐ 45,000 Building Repairs ‐ ‐ 15,000 ‐ ‐ 15,000 Replace Rock Conveyor ‐ ‐ 30,000 ‐ ‐ 30,000 Replace Water Truck ‐ ‐ ‐ ‐ 25,000 25,000
Subtotal 40,000$ 45,000$ 45,000$ 300,000$ 25,000$ 455,000$
Total 40,000$ 45,000$ 45,000$ 300,000$ 25,000$ 455,000$
Current and future operating budget impacts:
Polk County 5 Year Capital Improvement Plan Lime Quarry Summary
Equipment (C) purchases are timed to maximize trade-in value (front-end loader) and prevent an increase in repair costs and operational issues due to equipment down time (lag screens and stacker). Deferral of these expenditures could increase repair costs and reduce revenue due to down time and inability to produce product.
267

Buildings Department
2016 2017 2018 2019 2020 TotalRevenues
Property Tax (Levy) 259,100 976,500 329,500 702,500 859,300 3,126,900 Park and Lake Funds 25,000 40,000 30,000 12,000 25,000 132,000 Unfunded ‐ 8,000 ‐ ‐ ‐ 8,000
Total Revenue Available 284,100$ 1,024,500$ 359,500$ 714,500$ 884,300$ 3,266,900$
ExpendituresB) Vehicles
Recycling truck 80,000 ‐ ‐ 80,000 ‐ 160,000 Truck Dump with plow ‐ 36,000 ‐ ‐ ‐ 36,000 Plow 7,500 ‐ ‐ ‐ ‐ 7,500
Subtotal Vehicles 87,500$ 36,000$ -$ 80,000$ -$ 203,500$
C) Other EquipmentSkid Steer recycling ‐ 25,000 ‐ ‐ ‐ 25,000 Skid Steer Bldgs ‐ ‐ 28,000 ‐ ‐ 28,000 Forklift ‐ ‐ 25,000 ‐ ‐ 25,000 Snowmobile ‐ 12,000 ‐ ‐ ‐ 12,000 ATV Forester ‐ ‐ 7,000 ‐ ‐ 7,000 Gator ‐ 12,000 ‐ ‐ ‐ 12,000 Lawnmower Riding 9,000 ‐ 10,000 ‐ 10,000 29,000 Janitorial Equipment 6,000 ‐ ‐ ‐ 6,000 12,000 Open top Recycling Bin ‐ 5,000 ‐ ‐ ‐ 5,000 Flail Mower ‐ 10,000 ‐ ‐ ‐ 10,000 Trailer ‐ ‐ ‐ 6,000 ‐ 6,000 Tractor ‐ ‐ 35,000 ‐ ‐ 35,000
Subtotal Equipment 15,000$ 64,000$ 105,000$ 6,000$ 16,000$ 206,000$
Polk County 5 Year Capital Improvement Parks & Forestry, Buildings& Solid Waste Department Plan Summary
268

Buildings Department
2016 2017 2018 2019 2020 TotalE) Facility Improvements
Remodel of Gov Center ‐ ‐ ‐ 500,000 500,000 1,000,000 Parking Lots JC/ADC ‐ ‐ ‐ ‐ ‐ - Gov't Center 35,000 35,000 ‐ 35,000 ‐ 105,000 Justice Center ‐ 40,000 ‐ 40,000 ‐ 80,000 ADC ‐ ‐ 25,000 ‐ ‐ 25,000 School ‐ 15,000 ‐ ‐ ‐ 15,000 Recycling Center ‐ ‐ 25,000 ‐ ‐ 25,000 Sidewalk/Entrances 7,500 ‐ 15,000 ‐ ‐ 22,500 Update Metsys ‐ ‐ 7,000 ‐ ‐ 7,000 Heat Exchanger Pool 6,000 ‐ ‐ ‐ ‐ 6,000 Cameras Replacement 5,500 5,500 5,500 5,500 5,500 27,500 Laundry Jail Equipment ‐ 6,000 ‐ 6,000 ‐ 12,000 Jail Kitchen Equipment ‐ ‐ 7,500 ‐ 7,800 15,300 Roof at School Main ‐ ‐ 32,000 ‐ ‐ 32,000 Roof at School Gym 17,000 ‐ ‐ ‐ ‐ 17,000 Roof at Gov't Center Pent House ‐ 18,000 ‐ ‐ ‐ 18,000 Roof at Recycling ‐ 11,000 ‐ ‐ ‐ 11,000 Recycling Air handler ‐ ‐ 22,000 ‐ ‐ 22,000 Recycling Air Cond & Furnace sortin ‐ ‐ 14,500 ‐ ‐ 14,500 Magnet ‐ 15,000 ‐ ‐ ‐ 15,000 Bailer at Recycling ‐ ‐ ‐ ‐ 200,000 200,000 Conveyer at Recycling ‐ 50,000 ‐ ‐ ‐ 50,000 Conveyer at Recycling Comingle ‐ ‐ 65,000 ‐ ‐ 65,000 Update Phone System 1 Phase ‐ 125,000 ‐ ‐ ‐ 125,000 Recycling Garage Doors 6,000 ‐ 6,000 ‐ ‐ 12,000 Update Identipass 42,000 ‐ ‐ ‐ ‐ 42,000 Caulking ‐ 28,000 ‐ 30,000 ‐ 58,000 Elevator Gov't Center ‐ ‐ ‐ ‐ 100,000 100,000 Boiler for Pool ‐ ‐ ‐ ‐ 30,000 30,000 Pool Mechanical Paint Tile Etc. ‐ 10,000 ‐ ‐ ‐ 10,000
269
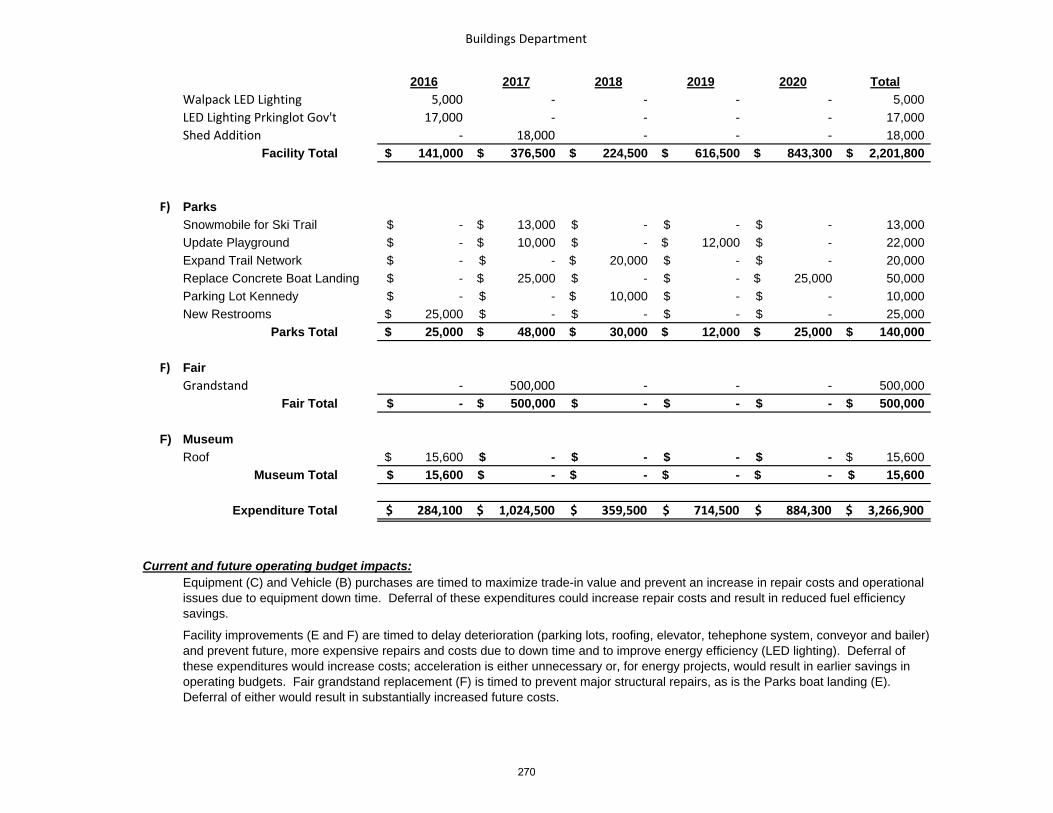
Buildings Department
2016 2017 2018 2019 2020 TotalWalpack LED Lighting 5,000 ‐ ‐ ‐ ‐ 5,000 LED Lighting Prkinglot Gov't 17,000 ‐ ‐ ‐ ‐ 17,000 Shed Addition ‐ 18,000 ‐ ‐ ‐ 18,000
Facility Total 141,000$ 376,500$ 224,500$ 616,500$ 843,300$ 2,201,800$
F) ParksSnowmobile for Ski Trail -$ 13,000$ -$ -$ -$ 13,000 Update Playground -$ 10,000$ -$ 12,000$ -$ 22,000 Expand Trail Network -$ -$ 20,000$ -$ -$ 20,000 Replace Concrete Boat Landing -$ 25,000$ -$ -$ 25,000$ 50,000 Parking Lot Kennedy -$ -$ 10,000$ -$ -$ 10,000 New Restrooms 25,000$ -$ -$ -$ -$ 25,000
Parks Total 25,000$ 48,000$ 30,000$ 12,000$ 25,000$ 140,000$
F) FairGrandstand ‐ 500,000 ‐ ‐ ‐ 500,000
Fair Total -$ 500,000$ -$ -$ -$ 500,000$
F) Museum Roof 15,600$ -$ -$ -$ -$ 15,600$
Museum Total 15,600$ -$ -$ -$ -$ 15,600$
Expenditure Total 284,100$ 1,024,500$ 359,500$ 714,500$ 884,300$ 3,266,900$
Current and future operating budget impacts:Equipment (C) and Vehicle (B) purchases are timed to maximize trade-in value and prevent an increase in repair costs and operational issues due to equipment down time. Deferral of these expenditures could increase repair costs and result in reduced fuel efficiency savings.
Facility improvements (E and F) are timed to delay deterioration (parking lots, roofing, elevator, tehephone system, conveyor and bailer) and prevent future, more expensive repairs and costs due to down time and to improve energy efficiency (LED lighting). Deferral of these expenditures would increase costs; acceleration is either unnecessary or, for energy projects, would result in earlier savings in operating budgets. Fair grandstand replacement (F) is timed to prevent major structural repairs, as is the Parks boat landing (E). Deferral of either would result in substantially increased future costs.
270

2016 2017 2018 2019 2020 TotalRevenues
Levy (Property Tax) 186,000 190,000 194,000 264,000 202,000 1,036,000 Unfunded ‐ 492,032 170,000 ‐ 365,000 1,027,032
Total Revenue 186,000$ 682,032$ 364,000$ 264,000$ 567,000$ 2,063,032$
ExpendituresB) Vehicles
Squad Cars 186,000 190,000 194,000 198,000 202,000 970,000 Subtotal 186,000$ 190,000$ 194,000$ 198,000$ 202,000$ 970,000$
C) Other Equipment911 System & Service ‐ 263,243 ‐ ‐ ‐ 263,243 Communications Project ‐ 228,789 ‐ ‐ ‐ 228,789 Microwave Equipment Replace 365,000 365,000 Apex Upgrade 170,000 170,000 Interview Rooms Equip & update 66,000 ‐ 66,000
Subtotal -$ 492,032$ 170,000$ 66,000$ 365,000$ 1,093,032$
Total 186,000$ 682,032$ 364,000$ 264,000$ 567,000$ 2,063,032$
Current and future operating budget impacts:
Polk County 5 Year Capital Improvement Plan Law Enforcement Department Summary
Vehicle (B) purchases are timed to maximize trade-in value and prevent an increase in repair costs and operational issues due to equipment down time. Deferral of these expenditures could increase repair costs and overall fleet costs.
Other equipment (C) expenditures are scheduled to improve services as quickly as possible and increase efficiencies (next generation 911 and improved data transfer to field offices); their deferral would delay efficiency improvments and so increase operating budget costs.
271

2016 2017 2018 2019 2020 TotalRevenues
GAM Revenues 200,000 200,000 200,000 200,000 200,000 1,000,000 Unfunded ‐ ‐ 255,000 ‐ ‐ 255,000
Total Revenue 200,000$ 200,000$ 455,000$ 200,000$ 200,000$ 1,255,000$
ExpendituresE) Facility Improvements
Room Upgrade 30,000 30,000 30,000 30,000 30,000 150,000 Parking Lot 20,000 ‐ ‐ ‐ ‐ 20,000 Make up air unit kitchen 50,000 ‐ ‐ ‐ ‐ 50,000 Remodel Nurses Stations ‐ ‐ ‐ 40,000 20,000 60,000 Roof ‐ ‐ 60,000 ‐ ‐ 60,000 Boiler upgrade ‐ ‐ 365,000 ‐ ‐ 365,000 Nurses Call Station ‐ 60,000 ‐ 60,000 ‐ 120,000 Corridor Remodel ‐ ‐ ‐ 40,000 60,000 100,000 Flooring 40,000 20,000 ‐ 20,000 50,000 130,000 Patient Lifts 20,000 12,000 ‐ ‐ 20,000 52,000 Sidewalks 20,000 10,000 ‐ ‐ ‐ 30,000 Kitchen Equipment 20,000 ‐ ‐ ‐ 20,000 40,000 AC units for offices ‐ 50,000 ‐ ‐ ‐ 50,000 Laundry Equipment ‐ 10,000 ‐ 10,000 ‐ 20,000 Lawnmower w/snow blower ‐ 8,000 ‐ ‐ ‐ 8,000
Subtotal 200,000$ 200,000$ 455,000$ 200,000$ 200,000$ 1,255,000$
Total 200,000$ 200,000$ 455,000$ 200,000$ 200,000$ $1,255,000
Current and future operating budget impacts:
Polk County 5 Year Capital Improvement Plan Golden Age Manor Summary
Facility improvements (E) reflect the ongoing capital expendures needed to maintain the physical quality of the nursing home as an attractive location for residents. Deferral of these improvements could result in lower occupancy due to competition from other providers. The roof investment, make up air unit and boiler upgrades also increase energy efficiency; their deferral would prevent these savings.
272

2016 2017 2018 2019 2020 TotalRevenues
Unfunded ‐ 400,000 ‐ ‐ 400,000 Total Revenue -$ -$ 400,000$ -$ -$ 400,000$
Expenditures
A) IT ItemsFinancial Software ‐ ‐ 400,000 ‐ ‐ 400,000 Citizen Service Software ‐ ‐ ‐ ‐ ‐ ‐ Single Intake Software ‐ ‐ ‐ ‐ ‐ ‐
Subtotal -$ -$ 400,000 - - 400,000$
E) Building ImprovementsCitizen Service Center and Intake ‐ ‐ ‐ ‐ ‐ ‐
Subtotal -$ -$ -$ -$ -$ -$
Total -$ -$ 400,000$ -$ -$ 400,000$
Future operating budget impacts:
Polk County 5 Year Capital Improvement Plan Department of Administration Summary
IT items (A) is a new financial information system for the County, replacing the current financial accounting software and various other financial packages and programs used throughout the County. Implementation of this software will likely temporarily increase operating budgets in 2017 and 2018 due to increased training and the potential need for temprorary help; ongoing this software will reduce staffing needs and allow for better budgetary tracking. Deferral would delay these savings. Building improvements (E) are related to service centralization for the public, reducing the need for receptionists and allowing for greater productivity while improving service delivery. Deferral would delay these savings as well. Cost is yet to be determined.
273
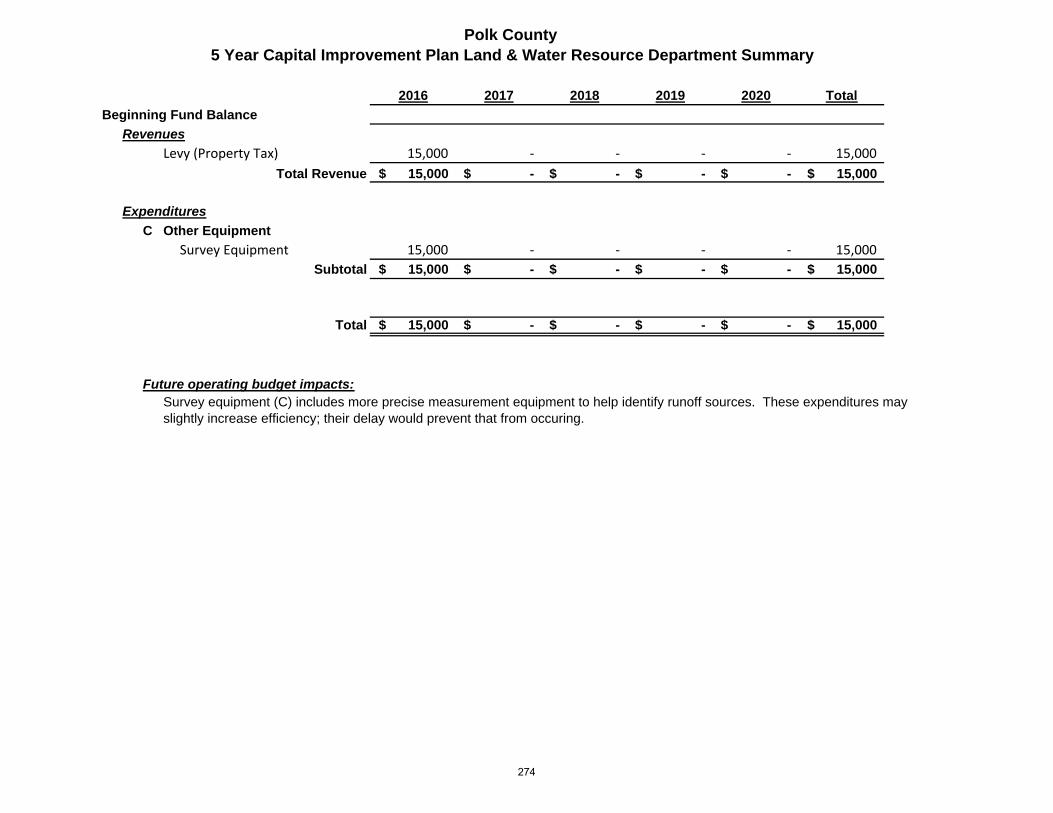
2016 2017 2018 2019 2020 TotalBeginning Fund Balance
RevenuesLevy (Property Tax) 15,000 ‐ ‐ ‐ ‐ 15,000
Total Revenue 15,000$ -$ -$ -$ -$ 15,000$
ExpendituresC Other Equipment
Survey Equipment 15,000 ‐ ‐ ‐ ‐ 15,000 Subtotal 15,000$ -$ -$ -$ -$ 15,000$
Total 15,000$ -$ -$ -$ -$ 15,000$
Future operating budget impacts:
Polk County 5 Year Capital Improvement Plan Land & Water Resource Department Summary
Survey equipment (C) includes more precise measurement equipment to help identify runoff sources. These expenditures may slightly increase efficiency; their delay would prevent that from occuring.
274

Annex F
LONG‐TERM OBLIGATIONS, POLK COUNTY WISCONSIN
Governmental Activities year Principal Interest total
General Obligation Refunding Bonds. 2016 2,620,000 527,055 3,147,055 $18,500,000 issued 3/15/05, Due 12/1/21 2017 1,860,000 396,055 2,256,055
2018 2,010,000 325,375 2,335,375 Interest at 3.00% ‐ 5.00% 2019 2,140,000 229,900 2,369,900
2020‐2021 2,700,000 152,000 2,852,000 Total GO Debt outstanding 1/1/2016 11,330,000 1,630,385 12,960,385
Operating LeasesLeases for use of various equipment and 2016 60,390 vehicles, minimum lease payments 2017 52,494
2018 53,000 165,884
Capital LeasesEnergy conseration equipment, final 2016 169,676 8,221 177,897 lease payment 2020. Early payoff in 2016
Total Leases 343,781
1 Refunded two obligations: (1) $17.3 million 2/1/2001 bond to construct and equip a justice center ($14.8m) and an adult development center ($1.6m), (2) $12.1 milllion bond for justice center ($4.2m) and adult development center ($0.5) additional costs and a new human service/public health office (7.3m)
275

Annex G
YearDepartment Item Rationale Transactions 2012 2013 2014 2015 2016 2017 2018 2019 2020 2021 Total
Loan amount 339,138 339,138 Payment 67,828 67,828 67,828 67,828 67,826 339,138Ending balance 271,310 203,482 135,654 67,826 ‐
Loan amount 113,000 113,000 Payment 50,000 50,000 13,000 113,000Ending balance 63,000 13,000 ‐
Loan amount 134,000 ‐ ‐ ‐ ‐ ‐ 134,000 Payment 48,000 48,000 38,000 134,000Ending balance 86,000 38,000 ‐ ‐ ‐ ‐ ‐
Loan amount ‐ ‐ Payment ‐ ‐ Ending balance ‐ ‐ ‐ ‐
Loan amount ‐ 21,000 ‐ ‐ ‐ 21,000 Payment ‐ 4,200 4,200 4,200 4,200 4,200 21,000 Ending balance ‐ 21,000 16,800 12,600 8,400 4,200 ‐
Loan amount 14,898 ‐ 14,898 Payment 8,000 6,898 14,898 Ending balance 6,898 ‐
Loan amount 616,581 616,581 Payment 75,212 109,005 134,000 134,000 134,000 30,364 616,581Ending balance 541,369 432,364 298,364 164,364 30,364 ‐
Loan amount 132,200 132,200 Payment 50,000 50,000 32,200 132,200Ending balance 82,200 32,200 ‐
Loan amount 17,790 17,790 Payment 17,790 17,790 Ending balance ‐ ‐ ‐ ‐ ‐
Loan amount 100,000 100,000 Payment 20,000 20,000 20,000 20,000 20,000 100,000Ending balance 100,000 80,000 60,000 40,000 20,000 ‐
Loan amount 5,000 5,000 Payment 1,000 1,000 1,000 1,000 1,000 5,000 Ending balance 5,000 4,000 3,000 2,000 1,000 ‐
Loan amount 17,000 17,000 Payment 3,400 3,400 3,400 3,400 3,400 17,000 Ending balance 17,000 13,600 10,200 6,800 3,400 ‐
Loan amount 250,000 250,000 Payment 50,000 50,000 50,000 50,000 50,000 250,000Ending balance 250,000 200,000 150,000 100,000 50,000 ‐
Loan amount 75,000 75,000 Payment 15,000 15,000 15,000 15,000 15,000 75,000 Ending balance 75,000 60,000 45,000 30,000 15,000 ‐
Loan amount 25,000 25,000 Payment ‐ ‐ ‐ ‐ ‐ ‐ Ending balance ‐ ‐ ‐ ‐ ‐
2012 2013 2014 2015 2016 2017 2018 2019 2020 2021Beginning balance ‐ 600,000 329,690 488,620 269,777 310,226 637,852 865,452 1,093,052 1,217,016General Fund transfers 600,000 150,000 ‐ 400,000 161,416 ‐ ‐ ‐ ‐ ‐ Repayments ‐ 165,828 173,828 268,728 251,033 327,626 227,600 227,600 123,964 69,400 Total resources 600,000 915,828 503,518 1,157,348 682,226 637,852 865,452 1,093,052 1,217,016 1,286,416 Less: Expenditures ‐ 586,138 14,898 887,571 372,000 ‐ ‐ ‐ ‐ ‐ Ending balance 600,000 329,690 488,620 269,777 310,226 637,852 865,452 1,093,052 1,217,016 1,286,416
Refinancing
Highway Purchase Gravel Pit 2015
Savings in owning our gravel supply
Highway Expenses
Highway Highway Building Stuch 2016
Feasibility study
Behaviorial Health Clinic
Financial/Records Software 2016
Mandated records requirements
Increased billing opportunities
Behaviorial Health Clinic
Clinic Restructuring & Interim Management 2016
Improve efficiency and services
Increased billing opportunities
Buildings Justice Center LED Wall Packs 2016
Improved efficiency and energy savings
Buildings utility costs
Buildings Government Center LED Parking Lot Lightning 2016
Improved efficiency and energy savings
Buildings utility costs
Improved billing and lower staffing
Patrol boat State DNR funding
Maintenance agreement for towers
Prepayment savings Operating budget
Front‐end loader Capital replacement need
Quarry revenues
Software update Operating budget reductions
Asset protection and internal investment fund financial status
Asset Protection and Internal Investment Fund Loan Repayment Schedule
Repayment source
Clerk of Court Transportation and telephone costs (in IT)
Savings in transportation and telephone costs
Videoconference equipment
Capital need and state aid reimbursement
Law Enforcement
Lime Quarry
Human Services
Highway
Law Enforcement
Building study Bond proceeds
Uniform payments
Quarry revenues
Administration Citizen Service Center
Improved efficiency and customer service
Staffing savings
Golden Age Manor
Lime Quarry
Bond refinancing
Front‐end loader Capital replacement need
Refinancing savings; level debt service
276

AnnexH:Revenueestimationmethodology
Polk County forecasts revenue using methods specific to each source. The property tax levy is set annually as a fixed dollar amount. However, the entire amount is not collected due to delinquencies and, under Wisconsin’s system of public finance, county governments serve as the collection agency for such taxes, meaning that other local governments receive the full amount of their levy and the county bills for delinquent taxes with, ultimately, the power to seize and sell such property should the taxes go unpaid for a number of years. The amount of arrears are therefore considered a nonspendable fund balance, converted to assigned fund balance once paid; as part of the budget process change in delinquent taxes therefore must be estimated to determine unassigned fund balance.
The stock of arrears in delinquent property taxes has been very high in historical terms. Prior to the 2007‐09 recession, the stock of arrears in delinquent taxes was approximately $2.5 million in any given year; that jumped to about $4.5 million in 2010‐11. With the recovery of the housing market, this amount is beginning to decline, and it is predicted that it will again return to just over $2.5 in the next two to three years based on 2015 repayment rates. This will have the effect of substantially increasing unassigned fund balance (as shown in Table 3) with consequences especially for future budgeting.
Public charge for services, the second‐largest revenue source, consists of a variety of revenues, with the largest share, about three fourths of the total, revenue received by the County’s nursing home, Golden Age Manor. That revenue itself is a mixture of Medical Assistance, Medicare, insurance and private payments. This revenue, along with similar revenue received by other health care programs, is estimated based on current case loads and case mix, reimbursement rates, and historical trends and patterns such as seasonal change in demand and overall trend in demand. (This is also the methodology used to estimate state aids where these aids are reimbursement for services provided to citizens.) The remainder of public charges are typically payments for goods and services, such as the sale of lime by the Lime Quarry, revenue from the boarding of prisoners from other counties, sale of recycling materials or sale of trees. These are estimated based on a multi‐year trend, with the greatest weight given to the most recent year.
State aids are estimated based either on actual certifications for fixed amounts or, where this is not known, prior year actual payments. In cases where state aids are a variable, such as aid in reimbursement for services like medical assistance paid to the nursing home or the mental health clinic, as noted above a forecast is prepared based on current case load and case mix and historical trends and patterns. Typically, the State of Wisconsin does an excellent job of notifying local governments of state aid amounts relatively early in the budget process, and there is usually a high degree of certainty that such payments will be made in full.
277

Revenueestimation
$‐$50,000 $100,000 $150,000 $200,000 $250,000 $300,000 $350,000
Jan‐02
Oct‐02
Jul‐0
3Ap
r‐04
Jan‐05
Oct‐05
Jul‐0
6Ap
r‐07
Jan‐08
Oct‐08
Jul‐0
9Ap
r‐10
Jan‐11
Oct‐11
Jul‐1
2Ap
r‐13
Jan‐14
Oct‐14
Jul‐1
5Ap
r‐16
Figure 12Polk County Monthly Sales Tax Collections
History and Forecast
History Forecast
Intergovernmental revenue, the fourth‐largest revenue source, consists of health insurance premiums, both those paid by the County on behalf of employees and those paid by the employees themselves and state payments for highway maintenance. The health insurance estimates are based on current mix of employees and premium rate; as employment and enrollment/coverage type are relatively stable, this forecast tends to be quite accurate. State payments for maintenance of state highways are also quite predictable, and vary according to need meaning that the exposure of the County for any cost overrun is negligible.
The sales tax is the only other single revenue exceeding $1 million. This revenue is forecast using the County’s own time‐series analysis model run using the Census Bureau’s X‐13 seasonal adjustment model. This model analyzes seasonal patterns and both short and long term trends to estimate collections over the next year8; the results are compared to forecasts from outside agencies such as the Wisconsin Counties Association and University of Wisconsin – Extension for plausibility. Figure 12 shows history and forecast for collections; note the extreme seasonality.
All minor revenues such as interest earnings, fines and other taxes are estimated based on trends in collections with the heaviest weight given to the most current year and adjusted for policy changes, e.g. rate increases, where necessary.
8 Technically, the model is an autoregressive integrated moving average [ARIMA], or Box‐Jenkins model of the form (0 1 1) (0 1 1) (or more technically still, an IMA model as there is no autoregressive component). Note that, although the series appears to possibly be non‐stationary, tests for stationarity were successful.
278

AnnexI:Glossary 2011 ACTUAL ‐ This entry reflects the actual County expenditures and personnel complement for that year.
2012 BUDGET ‐ This entry on the budget pages details the budget and personnel complement as approved by the County Board on November 15, 2011 (year end “Actual” numbers are not yet available).
2013 BUDGET ‐ This entry on the budget pages details the budget and personnel complement as approved by the County Board on December 13, 2012.
ACTIVITY – Day‐to‐day operations of a program linked towards an output such as meeting with clients, providing training sessions, patrolling highways or plowing snow.
APPROPRIATION ‐ A specific amount of money authorized by the County Board, generally during adoption of the annual budget, to be used to make expenditures for specific purposes. Authorizations are generally granted for a one‐year period.
BASIS OF ACCOUNTING ‐ This refers to the time at which revenues and expenditures are recognized in accounts and reported. The basis of accounting includes:
Accrual ‐‐ Basis of accounting whereby revenues are recorded when they are earned (whether or not cash is received) and expenditures are recorded when goods and services are received (whether or not cash disbursements are made at that time or not);
Cash ‐‐ Basis of accounting under which revenues are recorded when received and expenditures are recorded when paid. Modified Accrual ‐‐ The basis of accounting whereby expenditures other than accrued interest on general long‐term debt are recorded
at the time liabilities are incurred and revenues are recorded when received in cash except for material and/or available revenues, which should be accrued to reflect properly the taxes received and revenues earned.
CAPITAL EXPENDITURE – A non‐recurring expenditure of over $25,000 on a fixed asset or improvement to a fixed asset with an expected useful life of at least three years.
CAPITAL IMPROVEMENT PROGRAM ‐ A five year plan for capital expenditures; the 2013 amount is incorporated in the annual budget.
CASH FLOW ‐ A projection of the cash receipts and disbursements anticipated during a given time period.
CDBG – The U.S. Department of Housing and Urban Development’s Community Development Block Grant.
279

Glossary
CLASSIFICATION – How expenditures are reported. Major classification types include:
Line item ‐‐ Classification of expenditures by department or agency and by specific purchase such as telephone, subscriptions, wages, pension contribution, and so forth. Necessary for budgetary control.
Economic ‐‐ Expenditures are reported according to goods or services purchased, e.g. personnel costs or wages and benefits, supplies and expenses, capital outlay, and so forth by department and for the entity as a whole. Compiled from line item data, they are useful for policy makers, helpful for budget monitoring and provide a framework for implementation of virement rules. Budget execution reports are provided using economic classification.
Functional ‐‐ Government expenditures are reported according to their major purpose (e.g. education, transportation, public safety) and independent of departmental structure. This classification is also used in the annual audit and provides insight into what broad services are provided and how a government prioritizes among them.
Administrative ‐‐ Governmental expenditures are reported by department or agency in order to identify responsibilities for budget execution and financial management.
Program ‐‐ Government expenditures are reported by program, defined below as a related set of activities towards a common objective. Program classification is used to identify specific objectives sought and allow for measurement of effectiveness through performance measures. Program budgeting when linked to outcome measures is often called performance budgeting or budgeting for results.
DEBT SERVICE ‐ Payment of principal and interest on specific obligations which result from the issuance of bonds.
DEPARTMENT ‐ The basic organizational unit of county government, responsible for carrying out a specific set of functions identified in the department’s mission statement.
DEPRECIATION ‐ A term used to account for: (1) expiration in the service life of capital assets attributed to use, deterioration, action of physical elements and (2) portion of the cost of a capital asset which is charged as an expense during a period.
EFFECTIVENESS MEASURE – A performance measure showing the link between outputs, or what a program produces, and results, or what occurs in the community (or, for internal service departments, outside of that department) as a consequence of these outputs.
EFFICIENCY MEASURE – A performance measure that shows the cost per unit of output produced by a program.
EQUALIZED VALUE ‐ A valuation placed upon real and personal property within the County. The valuation reflects a number of factors including appraisals, new construction, and comparative sales data.
EXPENDITURE ‐ Cost of goods and services obtained, including debt service and capital outlay.
280
Glossary
MILL RATE ‐ Rates used in calculating taxes based upon the levies established by the County, cities, townships and special taxing districts.
FISCAL YEAR – A calendar year from January 1 through December 31 of that same year.
FUND BALANCE ‐ The difference between fund assets and fund liabilities of governmental and trust funds. Following the Government Accounting Standards Board (GASB) Rule 54, Polk County fund balances are categorized as restricted, committed, assigned and unassigned.
GASB – Government Accounting Standards Board, an independent agency that establishes and improves accounting standards for U.S. state and local governments.
GENERALLY ACCEPTED ACCOUNTING PRINCIPLES (GAAP) ‐ Detailed accounting standards and practices for state and local governments as prescribed by GASB.
GENERAL OBLIGATION BONDS ‐ Bonds backed by the full faith and credit of government (a pledge of the general taxing power for the payment of the debt obligation).
GOAL ‐ desired objective toward which a program’s activities are directed.
GOLDEN AGE MANOR – the County’s nursing home and rehabilitation center located in Amery, Wisconsin.
GRANTS ‐ Contributions or gifts of cash or other assets from another government to be used or expended for a specific purpose, activity or facility.
HIGHWAY BRIDGE AID – A State‐mandated levy collected by a county to provide funding for town bridges. Not considered part of the general Polk County levy.
HIPAA – Federal Health Insurance Portability and Accountability Act which, among other things, regulates the safekeeping of medical records
HITECH – Federal Health Information Technology for Economic and Clinical Health Act which, among other things, regulates the security of electronic medical records
IMPACT – The long‐term social or economic effect in society reached as a consequence of a program (and that program achieving its short‐term results. An impact is the reason for the existence of a program.
LEVY ‐ The total amount of property taxes, specialized assessments or service charges imposed by a government.
LIBRARY ACT 150 – A State‐mandated property tax levied in jurisdictions that do not contain a public library as required by Wisconsin law to reimburse public libraries for costs Not considered part of the general Polk County levy.
281

Glossary
LIABILITIES ‐ Debt or other legal obligations arising out of transactions in the past which must be liquidated, renewed or refunded at some future date.
LOGICAL FRAMEWORK OR LOGFRAME – A method of identifying program logic and related performance measures. See Annex B.
MAJOR ACCOUNT SERIES – Eight of the nine classifications of expenditures made by the County are based on the Wisconsin Uniform Chart of Accounts (numbers in parentheses are account series; note that Operating 000 is not a series):
Personnel ‐ Salaries, wages, employee benefits, and per diems (100). Operating – 000 ‐ Expenditures for other than personnel costs that had not been assigned to the appropriate expenditure category. Professional services ‐ Contractual services, utilities, repair and maintenance charges paid outside agencies (200). Supplies and expenses ‐ Office supplies, publications, dues, travel, repair and maintenance supplies, highway construction material (300). Fixed charges ‐ Insurance, rents and leases, depreciation, amortization, investment charges (500). Debt service ‐ Payment of principal and interest on obligations (600). Other grants contributions ‐ Direct relief to indigents, awards and indemnities, grants and donations, and losses (700). Capital outlay ‐ Purchase of capital equipment or capital improvements (800). Transfers ‐ Payments from an agency to another fund (900).
MISSION ‐ a description of the reason for existence of a department, what it is to achieve.
OBJECTIVE ‐ A clearly described target for achievement within a specified time span, representing measured progress toward a goal.
OPERATING BUDGET ‐ The financial plan for the fiscal year which authorizes proposed personnel complements, expenditures and the revenues to finance them.
OUTCOME – A result or impact (See results and impact for definitions).
OUTPUT – The goods and services produced directly by a program as a result of its activities such as trained clients, arrests, cleared highways, and so forth.
PASER RATING ‐ Pavement Surface Evaluation and Rating – a program developed by the University of Wisconsin to measure the quality of roads. Ratings range from 1 (failed, needing reconstruction) through 10 (new, requiring no maintenance).
PEFA – Public Expenditure and Financial Accountability Secretariat, an agency funded by international development agencies that among other activities developed and maintains a public financial management (PFM) assessment tool.
282

Glossary
PERFORMANCE MEASURE – A measure of the effectiveness of a program or another indication of program performance linked to its activity, output, result or impact. The latter two are sometimes called outcome measures.
PERSONNEL CATEGORIES ‐ The classifications for employment in the County are based on the definitions as prescribed by the U.S. Equal Employment Opportunity Commission for local governments:
Officials/Administration ‐ Head of the department or agency Professionals ‐ Positions that require a college degree or equivalent experience, e.g. a registered nurse. Technicians/Para‐Professionals ‐ Positions that require a two‐year degree or equivalent experience, e.g. a licensed practical nurse. Protective Service workers ‐ Licensed law enforcement personnel Administrative support ‐ Employees whose duties are principally clerical or secretarial in nature Skilled craft/service maintenance ‐ Equipment operators and maintenance workers
PFM – Public financial management.
POLICY – Anything a government chooses to do, usually in response to a problem.
PROGRAM – A related set of activities undertaken by a department towards a common objective and usually directed at a common group of clients.
REIMBURSEMENT ‐ Repayment to a specific fund for expenditures incurred or services performed by that fund to or for the benefit of another fund.
RESULTS – The near‐term economic or social changes within the community brought about by a program. Note that this is not under the direct control of the agency but a result of its outputs.
REVENUES ‐ All amounts of money received from external sources such as property taxes, federal and state aids, fees, fines, forfeitures, service charges, etc.
TAX RATE – Determined by dividing the levy by total equalized value, this rate (adjusted for level of assement) is multiplied times the market value of a property determined by the assessor to determine that property’s tax. Often expressed in dollars per $1,000 of value.
UNIFORM CHART OF ACCOUNTS – A procedure for reporting on revenues and expenditures for county governments in Wisconsin as developed by the Wisconsin Department of Revenue.
VALUE FOR MONEY – The optimal use of resources to achieve intended outcomes, as demonstrated by efficiency and effectiveness indicators.
283
Glossary
VIREMENT RULES – Those rules that govern how resources may be transferred between expenditure categories during budget execution. Generally, it is permissible to transfer within major categories of expenditures as listed, but not between categories such as personnel costs or capital expenditures.
WIC – Women and Infant Children, a Federal early childhood nutrition program implemented by the County’s Public Health Department.
284