“Political and International Environment in Egypt'' Submitted to ...
392
A GLOBAL COUNTRY STUDY REPORT ON “Political and International Environment in Egypt’’ Submitted to K.P.PATEL SCHOOL OF MANAGEMENT AND COMPUTER STUDIES, KAPDWANJ IN PARTTICAL FULFILLMENT OF THE REQUIREMENT OF THE AWARD FOR THE DEGREE OF MASTER OF BUSINESS ADMINISTRATION IN Gujarat Technological University Submitted by Faculty Guide Mr. Jignesh Gondaliya Assistant Professor MBA SEMESTER III K.P.PATEL SCHOOL OF MANAGEMENT AND COMPUTER STUDIES, KAPDWANJ Affiliated Gujarat Technological University Ahmedabad 2012 - 2013 Mistry Mahammadirfan. A. 117240592008 Patel Tejaskumar. N. 117240592013 Patel Dhariniben. K. 117240592009 Patel Namrataben. D. 117240592016 Patel Pinkalkumar. D. 117240592021 Patel Bhavikaben .P 117240592022
-
Upload
khangminh22 -
Category
Documents
-
view
0 -
download
0
Transcript of “Political and International Environment in Egypt'' Submitted to ...

A
GLOBAL COUNTRY STUDY REPORT
ON
“Political and International Environment in Egypt’’
Submitted to
K.P.PATEL SCHOOL OF MANAGEMENT AND COMPUTER
STUDIES, KAPDWANJ
IN PARTTICAL FULFILLMENT OF THE REQUIREMENT
OF THE AWARD FOR THE DEGREE OF
MASTER OF BUSINESS ADMINISTRATION
IN
Gujarat Technological University
Submitted by Faculty Guide
Mr. Jignesh Gondaliya
Assistant Professor
MBA SEMESTER III
K.P.PATEL SCHOOL OF MANAGEMENT AND COMPUTER
STUDIES, KAPDWANJ
Affiliated Gujarat Technological University Ahmedabad
2012 - 2013
Mistry Mahammadirfan. A. 117240592008
Patel Tejaskumar. N. 117240592013
Patel Dhariniben. K. 117240592009
Patel Namrataben. D. 117240592016
Patel Pinkalkumar. D. 117240592021
Patel Bhavikaben .P 117240592022

STUDENT’S DECLARATION
We Irfan, Tejas, Namrata, Dharini, Pinkal, Bhavika, hereby declare that the report
for Global / Country report entitled “ political & international environment in Egypt
’’ is a result of our own work and our indebtedness to other work publications
references if any have been duly acknowledged.
Place: KAPADWANJ (signature)
Date: Mistry Mahammadirfan
Patel Tejas
Patel Namrata
Patel Dharini
Patel Pinkal
Patel Bhavika
I.

PREFACE
Being an M.B.A student, it is necessary to prepare a global country report. Their
object of practical training & knowledge is to develop atmosphere and all other
business practices.
The preparation of the whole report was a great opportunity for us to explore
ourselves to the practical field. All analysis done by us regarding the EGYPT
country could make us all confident enough & prove ourselves. We could come
out of the bookish knowledge.
Preparation of such type of report calls intellectual nourishment professional help
and encouragement. Due to report, we are exposed to the method and practices
being use in the field of applications.
II.

ACKNOWLEDGEMENT
Every student owes a great deal to others and we are no exception because
learning is a process which entails give and take, exchange of ideas and value
addition through discussions. So it gives us immense pleasure to be able to
express our gratitude to one and all who have contributed to the successful
completion of our project with a great learning.
First and foremost we would like to thank our project guide Mr. Jignesh
Gondaliya. He gave us an in-depth knowledge of the working of the GCSR report
and enhanced our understanding on its various aspects.
His invaluable and significant guidelines improved our outlook and contributed in
making our project a real learning experience. He also encouraged us to put in
our best efforts and bring out the beat of our abilities.
III.

EXECUTIVE SUMMARY
Egypt was the home of one of the most significant civilizations of the early Middle
East and was of one of the earliest urban and educated societies. However, he is
also severely criticize by others who point to his dogmatic style of law and the
damage that the collective system cause to Egypt’s long-term development
forecast.
Many Egyptians hope to see a more self-governing political agreement emerge
but severe economic difficulty mean that a more self-governing future any time
quickly is not very likely. Islam is the officer religion of Egypt. About 88% of
Egyptians are Muslims and in general Egyptians are quite secular.
Despite unrest in recent years, Egypt's political state today is stable and a
completely self-governing state is likely within the near future. Egypt was ruled by
many countries before establish self-government and today it is run by a multi-
party semi-presidential system where the executive power is divided between the
leader and the prime minister, although in practice the president tends to hold a
greater share of the power.
Egypt was the first Arab state to establish political relations with the state of Israel, after
the sign of the Egypt-Israel Peace Treaty. Egypt is a major power between other Arab
states and has always played a significant role as a mediator in resolve disputes between
various Arab nations as well as in the Israeli-Palestinian dispute. Egypt’s government,
under President Umbrae, has work hard over the last three years to pick up the pace with
regard to reform which aim to boost higher financial growth and reduce being without a
job.

The Egyptian Constitution provides for a strong executive. Authority is vested in
an elected president who can appoint one or more vice presidents a prime
minister and a cabinet. The president's term runs for 6 years. Egypt's legislative
body the People's Assembly has 454 members--444 popularly elected and 10
appointed by the president. The constitution reserves 50% of the assembly seats
for "workers and peasants."
In March 2007 Umbra introduced several constitutional amendments that would
increase presidential powers and more significantly ban any political parties
based on religion race or ethnicity. The amendments were put to a popular
referendum and despite low voter turnout and boycotts by opposition groups
passed with 75.9% approval. Political factors data such as tax policy, labor law,
environmental law, trade restrictions, and tariffs.
A country’s tax system has a significant impact on business activities conducted
in the country. These tax incentives in the form of a special tax treatment
otherwise included in domestic tax law or purpose designed law (e.g. investment
laws).Since 1971, Egypt has been providing investors, with many tax incentives
regardless of the legal form of their business activities (i.e. corporate or
unincorporated). In this structure of Egyptian tax system is direct versus indirect
taxes, and investments tax incentives, particularly corporate tax incentives.
Main changes to corporate income tax for Egypt:
The corporate tax base by eliminating provisions for special tax treatment
and introducing world wide income tax for residents;
Specific rules incorporated of calculation asset depreciation for new law,
over allowable depreciation claims there by increasing transparency and
reducing the discretionary powers of tax officials;

Establishment introduced to improve the certainty of tax rules governing
foreign companies market ;
Main changes in personal income tax for Egypt:
The top marginal tax rate reduced from 32% to 20% of egypt;
A personal annual allowance independent of social status and
The personal tax base for broadened by introducing residence-based on
foreign tax credits.
In Egypt, Tax revenue collected by central government and tax payable by
businesses structure. In this data for last years can be given that, in this data is
different country for the India and Egypt. Egypt country camper on % of GDP in
two years for the same and camper on India is lower GDP. Taxes payable by
businesses in total tax rate is Egypt 43.6 and India 61.8.In this condition for this
two country in more tax payable on India and Egypt is lower tax payable of
central government.
The Egypt labor law no. 12 from 2003 is the one who regulate the labor market of
Egypt. This new labor law has 257 articles regarding the legal aspects that
regular the Egypt’s labor market condition. The contracts of employment must be
in on paper in the Arab language and in 3 copies. Each of the copies must be
kept by the employee, the social insurance and the employer. The Egypt labor
law obliges the employers from the private sector to employ 5% from the total
number of people with disabilities at the Manpower Offices` offer.
A fixed contract has a period of maximum 5 years; in case that the owner and the
worker want a longer period of service, the worker has the right of terminate the
contract later then the 5 years but with no getting return. But the owner must be
notified with the most 3 months before. The labor contract must specify the trial
period; no employee must be kept in the try-out period more than maximum 3

months. In this charts data can be a Egypt labor force. Egypt labor force data
years to years change their. Labor force in Egypt country can be in increase firm
of their.
Environmental issues in Egypt are governed by Law No. 4 of 1994. This law
provide for the formation of an agency for the security and help of the
environment, the Environment Affairs Agency (EEAA).
Ships of any people off shore platform and any other company or agencies
official to look at or use natural marine resources are permissible to discharge
into the protective sea of Egypt any polluting substance resulting in harm to the
water environment. The Egyptian government has developed a five-year
environmental action plan (1997/98-2001/02) for violent the country's solid waste,
air and water pollution problems.
The stock of U.S. strange direct investment (FDI) in Egypt at the end of 1999 was
$2.2 billion, an increase of 8.7 percent from 1998. U.S. FDI in Egypt is strong
largely in the oil, developed, and banking sectors. Egypt has margins for most
services sectors in which it has made General Agreement on Trade in Services.
These margins place a 49 percent limit on foreign equity in structure and
transport services.
Foreign firms may own up to 100 percent of Egypt private insurance firms.
Investors acquire more than a 10 percent stake in an insurance company require
support from the Egyptian Insurance managerial Authority (EISA). A 2008
change to the insurance law made EISA more self-governing and strengthen its
role from organizational regulator to a risk-based and market-sensitive controller.

No foreign bank seeking to set up a new bank in Egypt has been able to get a
license in the past 20 years, and in November 2009, the Central Bank Governor
reaffirmed that no new banks would be given license. However, efforts to reform
the long-term three state-owned banks have been mixed, and the Central Bank
rejected privatization for the three banks in 2009 on the grounds that market
situation were not right. The banking reforms in the past five years have succeed
in notably falling the share of non-performing loans.
Despite the way of a February 2003 law to allow for new telecommunications
company in accords with Egypt's WTO commitment, Telecom Egypt continue to
hold a de facto control since additional fixed-line licenses have not been issued
by the National Telecommunications dogmatic Authority (NTRA).
The government is liberalizing naval and air transportation services. The United
States remains involved in replace the restrictive 1964 union with an Open sky
air services agreement. Egypt is working with the U.S. on transport security
issues at seaports and airports, and a joint note of sympathetic on the jug
Security idea is expected soon.
About 85 percent of lively pharmaceutical ingredients in Egypt are imported. In
2004 the government compact customs duties on most imports of
pharmaceutical inputs and products from 10 percent to 2 percent. Health system
influences on Egypt country per 1000 people in 2005- 2010 to compeer on Indian
country. But Egypt country is 1000 people in 2005-2010 for a 1.7 % health
system influences and Indian country is 0.9% health system influence.
A major customs tariff change took place in September 2004, basically reform
the Egyptian tariff organization within the environment of a full customs reform.
Tariff bands and items have been largely reduced, managerial and WTO-
incompatible ad-valor service fees eliminate and the average tariff rate has been
largely reduced (from 14.6% to 9.1%).

New laws presidential and ministerial decrees have been enacted meant at
developing the educational system in general by the most central law set up
over the past five years has been law 155/2007 concerning the teachers’
framework. This law improved teachers’ incentive by raising their salaries by
amounts up to 50% of the basic salary as well as introduce official approval
incentives up to 150% of basic salary.
In addition, a professional college for teachers was recognized with the objective
of initiate an assisting body to work on the execution of the national strategic plan
for the 2007-2012 pre-university reform. Egypt ensures the self-government of
university. Each university has its own nature and a private budget. Both the
board and its own chairman direct each university.
Even if a lot leftovers to be done, current infrastructure is already greatly
industrial and relatively capable. Infrastructure is critical to the development of
tourism and the appeal of new and foreign investors. Egypt has an excellent ICT
services which are key to a modern project base.
Waiting lists for fixed-line telecoms have almost left and Egypt has one of the
best subscriber growth rates for mobile phones in the county. Government can
be influence in railways, roads, water and wastewater, urban transport their all
influence by government in Egypt country. The Financial Times paper reported
in late 2008 that Egypt's public infrastructure—including schools, hospital and
public moving system--was in poor state.
A challenge in most low and middle income country remains finding ways to
allow the many actors in the health sector to address these basic health needs
more efficiently. A range of chapters examine by means of regular reviews
quantitative and qualitative analyses of existing data and country studies.
Approaches that ask hard questions use in order cleverly and engage key
stakeholders and institution is critical to “knowledge and responsibility” practice
that motivate successful execution of health services.
Egypt's calcified politics has long been judged an asset in a confused region but
as leader Hosing Umbra ages in office with no clear descendant investors are
wonder if it might be a liability Egypt's economy is still buoyant in spite of
ambiguity about whether the 81-year-old president will seek a sixth term in 2011
or lever his son into power or whether a dark-horse military or other candidate
will emerge.
Egypt's bourse is among the region's best performers the economy has grown at
nearly 5 percent through the global downturn and while foreign investment
curved in in the crisis, it still flows but there are signs of fear. An Egyptian banker,
when asked what IPO deal flow would look like in 2011, would not remark until
pressed to say, in private, that it was too hard to predict with a presidential
election looming.
Mr. Mubarak said overnight that he had asked the government to resign after him
compulsory a curfew and prepared troops to back up police as they struggle to
control crowds who busy the streets to demand that he step down.The Tunisian
upheaval began with anger over increasing food prices, high redundancy and
anger at official vice problems which have also left many people Egypt emotion
upset and angry of their leadership.
Egypt is in the midst of a run of major political, security, and economic transition
that will open out for years to come. The 2012 presidential elections set to end
later this month in a final run-off election mark the end of one age in this transfer.

But Egypt faces a long road ahead, counting drafting a new creation setting
checks and balances in the new political system, and finishing trials for former
leaders in before governments.
The changes in the formal structures and internal balance of power in Egypt’s
government alongside the social and economic transformation Egyptians carry
on to experience, will be some of the most important strategic dynamics reshape
the Middle East. The changes happening in Egypt could spark its greatest
relocation since the 1970s, when it turned away from the Soviet sphere of sway
and toward the joint States and signed a peace treaty with Israel.
The days when the United States could prioritize regional safety over hold for
Egypt’s political and economic transitions are over. This political vagueness has
damaged Egypt’s economy, leave-taking endemic problems of high
unemployment, growing public debt, corruption, and rising pressures on Egypt’s
strange cash reserves—without a logical economic policy reply from the interim
government. This family economic and political volatility could lead to more
problems in the safety power.
The United States must also take into account the economic and political blow of
support to Egypt’s armed in a new, complete U.S. approach to Egypt. The strong
role that Egypt’s security organization plays in the economy counting the
inefficiencies this has created makes it a critical area for both economic and
political reform in Egypt. The leverage and influence that the United States has
on Egypt will become more and more incomplete by several factors, counting
more assertive and self-governing political leaders in Egypt general anti-
Americanism and financial and political constraint inside the United States.

Everyone as a member of society has the economic, social, and cultural rights
enumerated below whose fulfillment should be made possible by the State
separately or by international collaboration." The end result accepted by all but
the Soviet bloc representatives was Article 22 which introduces the social,
economic and cultural rights and which by describing them as "indispensable"
for human dignity links them to the traditional political and civil rights.
Technology transfer between states is one more future activity for addition in the
group, including Costa Rica and Norway, consider that each technology transfer
“constitute a possible for distraction or abuse,” and as a result that the treaty
must include technology transport. Egypt and India talking for a vocal alternative
of states believed it should not be regulated. Some part States want to protect
the idea of free skill transfer. In the March 2011 Prep Com, the Islamic Republic
of Iran stated the must protect the unchallengeable rights of States and
information transfer was the future point of the report.
Some Member States have argued that financial contact between states as they
apply to conformist guns should be keeping pace. Some European states have
argued that finance is out of control by state parties, and the United Kingdom and
Indian delegations argued that the should not include a finance section. Some
Member state and civil society organizations have called for the inclusion of the
financial section in an effort to make sure that any action that promote the
increase of arms in a divide country, whether through trade, aid, thinker property
rights or loans is keeping pace in the.

TABLE OF CONTAIN
SR.NO PARTICULAR PAGE.NO
DECLARATION I.
PREFFACE II.
ACKNOWLEDGEMENT III.
EXECUTIVE SUMMARY IV.
1 Political factors in Egypt 5
1.1 Tax Policy 8
1.2 Labor low 11
1.3 Environmental low 14
1.4 Trade on Egypt 16
1.5 Tariffs 20
2 Government have great influence in Egypt 22
2.1 Education in influence by government 22
2.2 Infrastructure influence 27
2.3 Health 29
2.4 Fiscal federalism of merits and demerits 31
3 Political & international environment in Egypt 33
3.1 Political stability 33
3.2 International influence of Egypt 36
3.3 International treaties where India & Egypt are members
39
4 Conclusion 40
5 Reference V.

1
Egypt general information
Basic Facts
Size: 385,229 square miles (about two times the size of the State of California)
Capital: Cairo
Population: 70 Million
Per capita income: About $1,200
Religion: Muslim (88%); Coptic Christian (12%)
Language: Arabic
President: Mohamed Hosni Mubarak
History
Egypt was the home of one of the most significant civilizations of the early Middle
East and was of one of the earliest urban and educated societies. Another
defining minute in Egypt‘s history came in 642 A.D. when the state was occupied
by the Arabs and Egypt became part of growing Islamic Empire that would
stretch across North Africa and into Spain up to Southeastern Europe and
Eastward all the way to modern-day Afghanistan. In 1517 Egypt formally became
a part of the expanding Ottoma Empire but this control was intervallic by a
French attack in 1798 led by Napoleon. The French were required out of Egypt
only three years afterward and in turn they were barred by Mohamed ‗Ali an
Albanian lieutenant in the Ottoman army. In 1869 the Suez Canal was built
making Egypt an even more high-quality and contested part of real-estate.

2
The Suez Canal made travel and trade from Europe to Asia much cheaper but
the designed geographic location in the end made the militarily better European
power much extra keen to regain control of the country. Crippling general debt
gave the British the pretext to occupy Egypt in 1882 and to formally declare it a
protectorate in 1914. Egypt participates in the first and second world wars on the
side of the British and the allied powers.
Egypt also participated in the 1948 war in Palestine, where Arab forces were
unable to block the creation of the state of Israel on land historically occupied by
Arabs. This union only lasted until 1961. However, Arab self-rule continues to be
an important rallying cry for Egyptians and others who appeal to ordinary bonds
of language and history. Promise to a common Arab cause made many
Egyptians understanding to the plight of Palestinians who had lost their homes in
the 1948 war that created the state of Israel. Following months of heighten
tension Israel attack Egypt in 1967 beginning the Six Day War. Israel destroyed
the Egyptian air force captured Sinai and closed the Suez Canal. The 1967 war
was a disastrous defeat for the Egypt and for Nasser‘s leadership.
In the financial sphere, Nasser was accountable for broken up Egypt towards
collectivism through nationalize industry instituting sweeping land reform and
making the state the main supplier of goods and services to citizens. Nasser is
still valued by many today for his leadership of Arab nationalism and the program
that he institute to provide for the reduced. However, he is also severely criticize
by others who point to his dogmatic style of law and the damage that the
collective system cause to Egypt‘s long-term development forecast
After Nasser‘s death in 1970 vice president Anwar Sadat took over. On 6
October 1973 Egypt launches a shock attack on Israel in order to regain
manages of the Suez Canal.

3
Hosni Mubarak Sadat's vice president was sworn in after Sadat‘s murder and he
has been the president of Egypt ever since. Mubarak nonstop many of Sadat‘s
political legacies. He has privileged the peace treaty with Israel and he nonstop
economic reform that were begin under Sadat. He has also maintained close
relatives with Western governments mainly the United States. This was illustrate
by Egypt‘s contribution in a 35,000 strong force in the 1991 Persian Gulf War
next to Iraq. Despite this close enterprise with the United States Mubarak has
manage to uphold political control from side to side unskilled means.
The government can be classify as a one-party strict state where the government
engage in election fraud intimidation, torture, and political treatment to maintain
its manage. Many Egyptians hope to see a more self-governing political
agreement emerge but severe economic difficulty mean that a more self-
governing future any time quickly is not very likely.
The People and Culture
Islam is the officer religion of Egypt. About 88% of Egyptians are Muslims and in
general Egyptians are quite secular. Islam recognize all of the same prophet as
in Judaism and Christianity however Islam also recognize the forecaster
Mohammed as the last in a line of prophet. The mosque plays a central role in
the lives of the majority Egyptians and it engages in many of the same program
of charity that we are recognizable with in Churches in the West. The other
twelve percent of the Egyptian residents is Christian. Egypt is a poor country with
an standard per person income of about $1,200 per year. Like many other less
urbanized country Egypt has a high rate of people growth which puts a important
strain on the country. Also similar to most rising countries there is a wonderful
gap between the rich and the poor.

4
The top ten percent of the country are accustomed to relaxed lives and a living
normal much like our own in the joint States but the mass of the population in
both urban and rural areas has an very hard time creation ends meet. These
harsh economic conditions are reflected in a relatively high rate of child death low
rates of literacy and chronic shortage for much of the residents. Egyptian culture
is an intensely social one. Comprehensive families are still very close and
friendships made during early days last throughout ones lifetime. Most public
activities revolve around gathering of friends and family whether at the home to
share a meal or out of the house at a local russet shop or eating place.

5
Political factor
Despite unrest in recent years, Egypt's political state today is stable and a
completely self-governing state is likely within the near future. This bodes well for
the country as a whole and puts Egypt resolutely back onto the traveler map.
Egypt was ruled by many countries before establish self-government and today it
is run by a multi-party semi-presidential system where the executive power is
divided between the leader and the prime minister, although in practice the
president tends to hold a greater share of the power.
President Mohamed Hosing Umbra has been in office since 14 October 1981
and he is at present serving his fifth term in office after re-election in September
2005. He is the leader of the ruling National self-governing Party, while Prime
Minister Dr Ahmed Nazi was sworn in as Prime preacher on 9 July 2004.
Egypt was the first Arab state to establish political relations with the state of
Israel, after the sign of the Egypt-Israel Peace Treaty. Egypt is a major power
between other Arab states and has always played a significant role as a mediator
in resolve disputes between various Arab nations, as well as in the Israeli-
Palestinian dispute. Egypt's political system at present receives much needed
monetary support from the US which is helping to project the country into a new
era of hopefulness.
Egypt‘s government, under President Umbrae, has work hard over the last three
years to pick up the pace with regard to reform which aim to boost higher
financial growth and reduce being without a job. Wide spectrums of a reform
whose goal was the modernization of the government and promote private sector
action were implementing Egypt country for political factors.
6
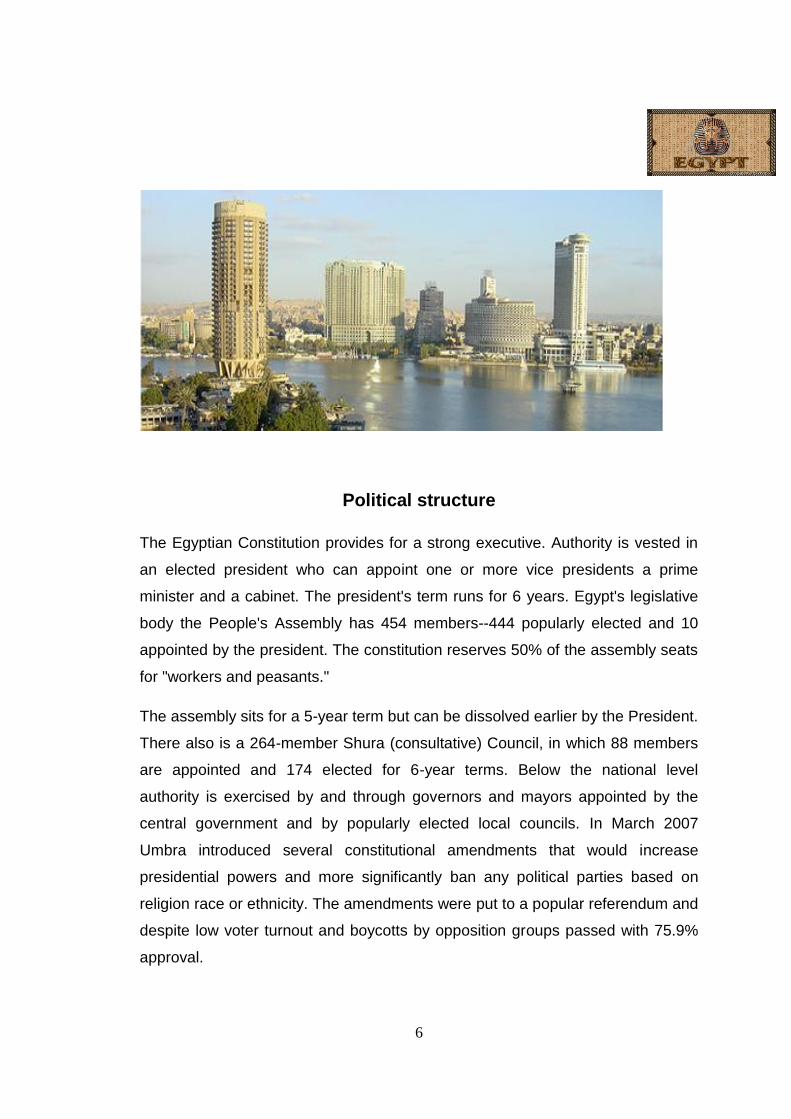
Political structure
The Egyptian Constitution provides for a strong executive. Authority is vested in
an elected president who can appoint one or more vice presidents a prime
minister and a cabinet. The president's term runs for 6 years. Egypt's legislative
body the People's Assembly has 454 members--444 popularly elected and 10
appointed by the president. The constitution reserves 50% of the assembly seats
for "workers and peasants."
The assembly sits for a 5-year term but can be dissolved earlier by the President.
There also is a 264-member Shura (consultative) Council, in which 88 members
are appointed and 174 elected for 6-year terms. Below the national level
authority is exercised by and through governors and mayors appointed by the
central government and by popularly elected local councils. In March 2007
Umbra introduced several constitutional amendments that would increase
presidential powers and more significantly ban any political parties based on
religion race or ethnicity. The amendments were put to a popular referendum and
despite low voter turnout and boycotts by opposition groups passed with 75.9%
approval.

7
Main political parties
The multi-party system was restored in 1976 by the then president Sedate.
However in practice it is the ruling National Democratic Party (NDP) which
completely dominates the political arena. The Muslim brothers a brotherhood
created in 1928 by Hassan El Banna is the main opposition party of the country.
They were banned but in spite of it they were able to win 88 seats in the People's
Assembly in the 2005 elections.
Political factors data such as tax policy, labor law, environmental law, trade
restrictions, and tariffs.

8
1.1 Tax policy
Introduction
A country‘s tax system has a significant impact on business activities conducted
in the country. Many countries use tax laws as a mechanism for the
encouragement of investments. These tax incentives in the form of a special tax
treatment otherwise included in domestic tax law or purpose designed law (e.g.
investment laws).
Since 1971, Egypt has been providing investors, with many tax incentives
regardless of the legal form of their business activities (i.e. corporate or
unincorporated). In this structure of Egyptian tax system is direct versus indirect
taxes, and investments tax incentives, particularly corporate tax incentives.
Egypt Tax System
Indirect Taxes
Direct Taxes
Customs duties
Stamp duties
General sales tax
Agricultural Land Tax
Building Tax
Income tax

9
Tax Policy Reform Highlights
It began reforming income tax for June 2005 Parliament approval Law in
91/2005, which become effective in July 2005 for personal income tax and
January 2006 for corporate income taxation began reforming.
Main changes to corporate income tax for Egypt:
Simplified by consolidating all income tax legislation in to one law.
The corporate tax base by eliminating provisions for special tax treatment
and introducing world wide income tax for residents;
Specific rules incorporated of calculation asset depreciation for new law,
over allowable depreciation claims there by increasing transparency and
reducing the discretionary powers of tax officials;
Establishment introduced to improve the certainty of tax rules governing
foreign companies market ;
Main changes in personal income tax for Egypt:
Income tax into three categories brackets restructured;
The top marginal tax rate reduced from 32% to 20% of egypt;
A personal annual allowance independent of social status and
The personal tax base for broadened by introducing residence-based on
foreign tax credits.

10
In Egypt, Tax revenue collected by central government and tax payable by
businesses structure.
Tax revenue collected by
central government
Taxes payable by businesses
% of
GDP
Number
of
Payments
Time to
prepare
file and
pay tax
Hours
Profit
tax
Labor
tax and
contributions
Other
Tax
Total
tax
rate
2005 2010 June
2011
June
2011
June
2011
June
2011
June
2011
June
2011
Egypt 14.1 14.1 29 433 13.0 27.1 3.6 43.6
India 9.9 9.5 33 254 24.7 18.2 19.0 61.8
In this data for last years can be given that, in this data is different country for the
India and Egypt. Egypt country camper on % of GDP in two years for the same
and camper on India is lower GDP. Taxes payable by businesses in total tax rate
is Egypt 43.6 and India 61.8.In this condition for this two country in more tax
payable on India and Egypt is lower tax payable of central government.

11
1.2 Labor Law
The Egypt labor law no. 12 from 2003 is the one who regulate the labor market of
Egypt. The labor law wants to increase the attachment of the private sector
market in the same time with the attainment of the stability rights for the
employees and the ones of the employers. This new labor law has 257 articles
regarding the legal aspects that regular the Egypt‘s labor market condition. The
employer` s true to fire employees is among the law‘s most important points.
Other point is representing by the conditions regarding the right; the law also
specifies the employees` right to strike.
The contracts of employment must be in on paper in the Arab language and in 3
copies. Each of the copies must be kept by the employee, the social insurance
and the employer. The employment contract must include some clear-cut
information, according to the labor law. The characteristic contract must include:
the employer‘s name and the work places address, the employees address,
name, occupation and experience, the employees social insurance number as
well as the documents that prove his/her identity, the kind and nature of work that
makes the contract` s subject, the time and method of payment.
The Egypt labor law obliges the employers from the private sector to employ 5%
from the total number of people with disabilities at the Manpower Offices` offer. It
refers to the employers that have an employee number of 50 or less. The
employer can also start a scheduled time with the disabled people he/she want s
to hire, to check the registry certificate that proves the disability. The employer
who wants to hire a disabled person must send one registered mail letter that
contains the delivery confirmation at the in charge manpower office in the first 50
days of the disabled peoples employment.

12
In organization that employee foreign people are thankful by the ministry to make
a specific record in order to have a control of the foreigner` employees. The
record must have mane and the surname of the foreigner, the date of birth, the
qualifications of the foreign person, the title of the job with a exact explanation of
the job, the employment permit` s number and date and the number and the date
of the employment certify wages.
A fixed contract has a period of maximum 5 years; in case that the owner and the
worker want a longer period of service, the worker has the right of terminate the
contract later then the 5 years but with no getting return. But the owner must be
notified with the most 3 months before. The labor contract must specify the trial
period; no employee must be kept in the try-out period more than maximum 3
months.
Years Egypt labor force
1999 1,90,00,000
2000 1,99,00,000
2001 2,06,00,000
2003 2,01,90,000
2004 2,07,10,000
2005 2,13,40,000
2006 2,18,00,000
2007 2,21,00,000
2008 2,46,00,000
2009 2,54,00,000
2010 2,61,00,000
2011 2,77,40,000

13
egypt labor force
1990
1995
2000
2005
2010
2015
yea
rs
In this charts data can be a Egypt labor force. Egypt labor force data years to
years change their. Labor force in Egypt country can be in increase firm of their.

14
1.3 Environmental Law
Environmental issues in Egypt are governed by Law No. 4 of 1994. This law
provide for the formation of an agency for the security and help of the
environment, the Environment Affairs Agency (EEAA). The EEAA is destined to
formulate the general policy and to prepare the basic plans for the safety and
help of the environment. It should also follow up the achievement of such plans.
The law provides for a mandatory environmental review, to be undertaken by the
capable managerial authority according to EEAA's instructions, as part of the
support process for all proposed projects.
The law forbids the usage of risky substances and wastes or the construction of
any establishment for treat such substances without a license from the
competent administrative authority. It is also forbidden to import hazardous waste
or to allow its entrance into or passage through Egyptian territory. It is mandatory
for all those who produce or handle dangerous materials to take safety measures
to ensure that no environmental break shall occur.
All establishments are requisite to ensure that while practicing their activities no
leaked or emitted air pollutants (caused by the burning of fuel, etc.) shall exceed
the maximum allowable levels. It is also barred to incinerate, to dispose of or to
treat garbage and solid wastes as well as to spray pesticides or any other
chemical mix unless it is done according to the setting and safety measures
specified in the Executive Regulations of the law.
Ships of any people off shore platform and any other company or agencies
official to look at or use natural marine resources are permissible to discharge
into the protective sea of Egypt any polluting substance resulting in harm to the
water environment. The law further provides for a system of incentive to be

15
offered to those who implement environmental safety activities or projects and
sets penalties for those who are in infringement of its provisions.
The Egyptian government has developed a five-year environmental action plan
(1997/98-2001/02) for violent the country's solid waste, air and water pollution
problems. The plan's priority include: preparing viability studies for planned
development projects influence companies to work toward ISO 14000
environmental standards certification and urging the use of scientific
management techniques and waste recycle to preserve normal resources.
Egypt is a participant to various convention environment protection, among which
are: the Environmental Modification Convention; the African meeting on the
protection of Nature and Natural Resources; the Vienna gathering for the
Protection of the Ozone Layer; the conference for the Prevention of Pollution
from Ships; the Barcelona Convention for the Protection of the Mediterranean
Sea against Pollution; the Brussels principle on Civil legal responsibility for Oil
Pollution Damage and the Moscow Treaty exclusion Nuclear Weapon Tests in
the feeling.

16
1.4 Trade on Egypt
The U.S. trade balance with Egypt in 2000 was $2.4 billion, based on U.S.
Government data, $33 million higher than in 1999. While the joint trade balance
was in effect unaffected, the value of trade increased in 2000. U.S. stock exports
to Egypt totaled $3.3 billion, up from $3 billion in 1999. U.S. imports from Egypt
were $888 million, and raise over the prior year‘s $617 million. The stock of U.S.
strange direct investment (FDI) in Egypt at the end of 1999 was $2.2 billion, an
increase of 8.7 percent from 1998. U.S. FDI in Egypt is strong largely in the oil,
developed, and banking sectors.
Trade Barriers of Egypt
Services barriers
General Agreement on Trade in Services
Egypt has margins for most services sectors in which it has made General
Agreement on Trade in Services. These margins place a 49 percent limit on
foreign equity in structure and transport services. In the computer services sector
larger help of foreign equity may be allowable such as when the Ministry of
Communication and Information Technology determine that such services are a
basic part of a larger business model and will benefit the country.
Insurance
Foreign firms may own up to 100 percent of Egypt private insurance firms.
Investors acquire more than a 10 percent stake in an insurance company require
support from the Egyptian Insurance managerial Authority (EISA). A 2008
change to the insurance law made EISA more self-governing and strengthen its
role from organizational regulator to a risk-based and market-sensitive controller.
17
Banking
No foreign bank seeking to set up a new bank in Egypt has been able to get a
license in the past 20 years, and in November 2009, the Central Bank Governor
reaffirmed that no new banks would be given license. More information at
banking improvement begin in 2004, the government has divest itself from many
joint venture banks, and privatized the fully government-owned Bank of
Alexandria in 2006. However, efforts to reform the long-term three state-owned
banks have been mixed, and the Central Bank rejected privatization for the three
banks in 2009 on the grounds that market situation were not right. The banking
reforms in the past five years have succeed in notably falling the share of non-
performing loans.
Telecommunications
Despite the way of a February 2003 law to allow for new telecommunications
company in accords with Egypt's WTO commitment, Telecom Egypt continue to
hold a de facto control since additional fixed-line licenses have not been issued
by the National Telecommunications dogmatic Authority (NTRA). The NTRA
delayed a plan to issue a second license in mid-2008, citing a lack of interest in
the global markets for fixed-line service. However, in October 2009, the NTRA
began accepting local and global bids for license to establish so-called "triple
play" services of data, voice, and video in private residences, for which greater
global market interest exists. The licenses for "triple-play" services are slated to
be issued in 2010. Compare to fixed-line service and mobile phone service in
Egypt is a more aggressive sector, and three major private company – Ethicality,
Mob nil, and Vodafone – control the market.

18
Transportation
The government is liberalizing naval and air transportation services. The United
States remains involved in replace the restrictive 1964 union with an Open sky
air services agreement. In June 2008, Delta Air Lines resume process of non-
stop service between Cairo global Airport and New York‘s John F. Kennedy
Airport. Egypt Air joined the Star Alliance in July of 2008 and has entered into a
code share contract with United Airlines. Egypt is working with the U.S. on
transport security issues at seaports and airports, and a joint note of sympathetic
on the jug Security idea is expected soon.
INVESTMENT BARRIERS
Under the 1986 United States-Egypt joint Investment Treaty (BIT) Egypt is loyal
to maintain an open investment regime. The BIT requires Egypt to accord state
and Most-Favored Nation (MFN) treatment (with certain exceptions) to U.S.
investors to permit investors to make financial transfers without control and
promptly and to adhere to international standards for expropriation and
compensation. The BIT also provides for binding international arbitration of

19
positive disputes. Based on a review of Egypt‘s speculation policies the OECD
has invite Egypt to adhere to the OECD statement on global Investment and
international Enterprises. Egypt signed the Declaration in 2007 beautiful the first
Arab and first African country to join. During this process Egypt decided to review
the limits on investors identified in the OECD‘s 2007 Investment Policy Review of
Egypt such as certain limits in the tourism sector as well as the biased action of
foreign investors in courier services.
ELECTRONIC COMMERCE
Egypt's Electronic Signature Law 15 of 2004 established the Information
Technology Industry Development Agency (ITIDA) to act as the e-signature rigid
power and to further develop the in order knowledge sector in Egypt. The
Ministry of State for Administrative Development (MSAD) is implement an e-
government initiative to add to government efficiency decrease services condition
time establish new service release models reduce government operating cost
and encourage e-procurement.
OTHER BARRIERS
Pharmaceutical Price Controls
The Egyptian government controls prices in the pharmaceutical sector to make
sure that drugs are reasonable to the public. The government does not have a
translucent mechanism for pharmaceutical price. The Pharmaceutical group in
the Ministry of Health and Population reviews prices of various pharmaceutical
products and negotiate with company to adjust prices based on a cost-plus
method. This method however does not allow price increases to pay off for
inflation and the pricing policy has failed to keep pace with the increasing cost of
raw materials. About 85 percent of lively pharmaceutical ingredients in Egypt are
imported. In 2004 the government compact customs duties on most imports of
pharmaceutical inputs and products from 10 percent to 2 percent.

20
1.5. Tariffs
A major customs tariff change took place in September 2004, basically reform
the Egyptian tariff organization within the environment of a full customs reform.
Tariff bands and items have been largely reduced, managerial and WTO-
incompatible ad-valor service fees eliminate and the average tariff rate has been
largely reduced (from 14.6% to 9.1%). This latest tariff reform reduced the
number of tariff bands and tariff rates. It included cuts on most imports fees and
surcharges, including processed foods, undeveloped goods, paper products, and
some strong domestic goods among others.
Exchange Rate: 1 EUR = 7.00 Egyptian Pounds (piaster)
Customs Tariffs:
1. only for long-term residence and for immigrants (not for Egyptians)
ITEM Customs estimated
value in Egypt pounds
(LE)
Tariff rate % VAT%
CARS
Up to 1000 cc Purchase price* 40 15
1000-1300 cc Purchase price* 40 15
1300-2000 cc Purchase price* 40 15
1600-2000 cc Purchase price* 135 30
More than 2000 cc Purchase price* 135 45
Car must have the same year of construction as the export to Egypt.

21
2. Only for tourist visa (foreign nations and Egyptians) with a maximum of 6
months.
ITEM Customs estimated
value in Egypt
pounds (LE)
1st – 3rd
Month
4th – 6th
Month
CARS
Up to 1000 cc - 250* 250
1000-1300 cc - 250 250
1300-2000 cc - 250 250
1600-2000 cc - 500 500
More than 2000 cc - 1000 2000
Egypt with a maximum of 6 months fixed price remains same.
3. Only for Egyptians who worked and lived in Germany and leave the country for
good.
ITEM Customs estimated
value in Egypt
pounds (LE)
Tariff rate % VAT%
CARS
Up to 1000 cc Purchase price* 40 15
1000-1300 cc Purchase price* 40 15
1300-2000 cc Purchase price* 40 15
1600-2000 cc Purchase price* 135 30
More than 2000 cc Purchase price* 135 45
Cars with a maximum age of 5 years!

22
Governments Have Great Influence in Egypt
Egypt global country governments have great influence on the health, education,
and infrastructure of a nation data can be given.
2.1 Education in influence by government
The Egypt government has urban an overall structure to improve human
development and established its commitment to recover access to and quality of
education from pre-school to tertiary levels. The Egyptian government has
developed an idea of Egyptian Education for the 21st Century, which is the basis
for the educational sector‘s 20-year planned framework. Education is the liability
of two ministries within the structure of the Egyptian government, the Ministry of

23
Education accountable for all primary and secondary schools in Egypt and the
ministry of Higher Education in charge for university education.
The Egyptian government identify the growth of the educational sector both pre-
University education and higher education as well as skill development as being
gravely significant to ensure adequate and balanced social growth in Egypt. The
development of the educational system is critical to ensuring the competitiveness
of the Egypt labor force in the globalizing economy. Reforms in the instructive
system have been introduced with the aim of civilizing the system as a whole and
the quality of education in exacting. Educational legislations, which specified the
general structure leading the main features of the educational policy, have
witness several amendment since 2004.
New laws presidential and ministerial decrees have been enacted meant at
developing the educational system in general by the most central law set up
over the past five years has been law 155/2007 concerning the teachers‘
framework. This law improved teachers‘ incentive by raising their salaries by
amounts up to 50% of the basic salary as well as introduce official approval
incentives up to 150% of basic salary.
In addition, a professional college for teachers was recognized with the objective
of initiate an assisting body to work on the execution of the national strategic plan
for the 2007-2012 pre-university reform. The main objectives of the planned plan
include:
Achieve quality in friendship with the national education principles in Egypt
by working on the growth of schools;
Rising effective management systems, monitor and evaluating
performance inside the system; and

24
Providing equitable access, civilizing quality for all by behind equal
educational opportunity for all children in Egypt.
The rising population has led to severe and basic impacts on the educational
trail. These issues include:
Greater than before right of entry ratio for children inside the required
education age group is more 90% of those children.
The severe lack in the number of teachers needed in Egyptian schools to
cope with the rising numbers of pupils, taking into deliberation the
worldwide rate.
This general rate is a teacher for every 20 pupils.
University and Higher Education
The office of higher education supervises university and high education. In
addition, there are aphanites establishment which take on the same educational
steps and the same curriculum in addition to Islamic studies. Egypt ensures the
self-government of university. Each university has its own nature and a private
budget. Both the board and its own chairman direct each university. University
has a best council that includes in its membership, heads of university and a
number of public and experienced individuals.
In 2002, ministerial decision No. 1067 was issued for the organization of the
highest Council on Higher Education. The highest Council plans the general
policy of university education, scientific research, co-ordination among university
regarding various activities, and the agreement of students‘ admittance and
numbers. The Egyptian government also confident the creation of private
universities with the aim of improvement education levels and relieving some
burden on public universities. As mention above, 15 private university comprise
51 faculties currently operate in the country.

25
Egypt‘s education system is in need of structural reform, counting greater than
before flexibility and good organization in power and institutional management.
The last set of planned education sector reforms to get better the quality of
educational services and knowledge outcomes, and the effective management of
public spending in education) - supported by the EU through a EUR 140 million
sector budget support programmed - were late by one year. Progress in other
areas slowed, counting the review of required education in Egypt and the reform
of minor education (including the access to university) slowed down.
Education inputs
Primary
Public
expenditure
per student
% of GDP
per capita
Secondary
Tertiary
Public
expenditure
on education
Trained
Teachers
in
Primary
Education
Primary
school
pupil–
Teacher
ratio
1999 2010 1999 2010 1999 2010 % of
GDP
2010
% of total
government
Expenditure
2010
% of total
2010
pupils
per
Teacher
Egypt - - - - - - 3.8 11.9 - 27
India 11.9 - 24.7 - 95.0 - - - - -

26
Participation in Education
Gross enrollment
ratio
Net enrollment rate
Primary
Adjusted
net
enrollment
rate
Children out of
School
% of relevant age
group
Preprimary
Primary
Gross
enrollment
Ratio
Secondary
Tertiary
% of
relevant
Primary
Age group
Secondary
% of primary
school–
age children
Male/
Female
Thousand
primary school–
age children
Male Female
2010 2010 2010 2010 1991 2010 1999 2010 2010 2010 2010 2010
Egypt 24 106 - 30 - 96 77 - 100 96 15 184
India 54 118 60 16 - 92 - - - - - -
This two data can be given for education inputs and participation on education for
data given that.

27
2.2 Infrastructure influence
Even if a lot leftovers to be done, current infrastructure is already greatly
industrial and relatively capable. Infrastructure is critical to the development of
tourism and the appeal of new and foreign investors. It also serve as much-
needed maintain for exporters. Private sector contribution (under concession,
BOOT, private management) is attracting personal operators.
The personal sector‘s efficiency is obvious in the Aim Sokhna port where
customs consent time is two days as compare to 28 days in other ports. The
administration is slowly bearing in mind more private sector contribution in
communications development. Egypt has also recognized very well equipped
free zones with excellent location, most of them with a port. Egypt has an
excellent ICT services which are key to a modern project base.

28
Waiting lists for fixed-line telecoms have almost left and Egypt has one of the
best subscriber growth rates for mobile phones in the county. Government can
be influence in railways, roads, water and wastewater, urban transport their all
influence by government in Egypt country. The Financial Times paper reported
in late 2008 that Egypt's public infrastructure—including schools, hospital and
public moving system--was in poor state.

29
2.3 Health systems influences
In new years, as decision makers have become more conscious of their health
sector evils and the interdependence of health and expansion higher right of way
has been given to deliver health services and gathering the health needs of the
poor. Increase health services are documented as a main concern for countries
to be able to meet the basic health needs of their people particularly for poor and
weak populations.
A challenge in most low and middle income country remains finding ways to
allow the many actors in the health sector to address these basic health needs
more efficiently. Yet decision makers have little proof to guide their decisions
about how to most successfully, fairly, and affordably give health services. The
aim of this book is to bring jointly a wide range of proof that is not limited to a
particular outcome measure or single set of methodologies.
A range of chapters examine by means of regular reviews quantitative and
qualitative analyses of existing data and country studies. The proof on what
strategies work to make stronger health services and how they implementing in
real situations. That may include civil society organizations, nongovernmental
organizations as well as associations of professionals and other service
providers and private companies.

30
The planning also includes the degree to which the health services are hostile or helpful
in their relations with each other. But not nearly sufficient attention has been paid to
representing how to pick up services for the poor. Approaches that ask hard questions use
in order cleverly and engage key stakeholders and institution is critical to “knowledge
and responsibility” practice that motivate successful execution of health services.
Health system of Egypt country influence
Health
Expenditure
Health workers Hospital
Beds Per
capital
Total
% of
GDP
2010
Publi
c
% of
total
2010
Out
of
pock
et
% of
total
2010
External
resourc
es
% of
total
2010
$
201
0
PP
P $
201
0
Physici
ans
2005-
2010
Physicians
Nurses
and
Midwives
2005-2010
Communit
y
health
workers
2005-
2010
per
1,000
people
2005 -
2010
Egypt 4.7 37.4 61.2 0.6 123 289 2.8 3.5 - 1.7
India 4.1 29.2 61.2 1.2 54 132 0.6 1.0 0.0 0.9

31
2.4 Fiscal Federalism: merits and demerits
Merits
Optimum use of resources and development growth
The central constitution assigns the central and the state governments to decide
their income sources and area of expenditures. And the fiscal devolution of the
same permits the local state and central managerial agency to collect revenues
and spend them. In doing so it makes a successful and proper system to design
and apply the methods of financial 27 operations developmental encumber
expeditiously in a way that satisfy the beneficiary. In turn outcome in the over
total growth of the country.
Job opportunity to professionals and workers
The devolution of fiscal power to different tiers of management and the need to
keep the financial machineries consistence with the dynamics of the area from
side to side time and technology quests many professional and skilled workers.
To cope up with local needs the diversities of peoples such as working
languages of the federal and the states where ethnic federalism is implement
based on language stress of specific professionals. This urges the governments
to train professionals and workers and run by them with the required skills
therefore.
Decrease central bureaucracy and corruption:
The power division in federalism enhances the local decision in their financial
matter in ways that satisfies the need of the area and prevent decision making as
of becoming overfull in the middle rule. Thus, it avoids incompetence and
government and technical chaos. Budget auditing and reporting at different level
and inter different level are some of the mechanisms to achieve these effects.

32
Demerits
Mobility and Migration of workers and professionals
The other disadvantage of fiscal federalism is mobility and relocation of expert
and skillful persons due to difference of payment for the same professions in
unlike states and in between the central or state governments. The richer
governments tend to pay better salary and give wage increase according to the
pace of their growth where as the poor strive to satisfy public services than
person payment in their financial presentation and growth strategies. However,
having the necessary skill or profession does not suffice to work in one state or in
the central government where the working language of the central and each state
is not the same like Ethiopia. Thus language requirement in addition to
profession minimize the migration of the same professional to the region of better
payment.
Spillover property
In spending and revenue appraisal after budget allocation of a fiscal year
overflow effects may be shown. More urban part of regions next to less urban
part of other region also faces the same problem. The overflow effects which are
caused by the ―flow‖ from one region to another would be in one trail while in
other places it would be in opposite directions and such event is termed as offset
effects.

33
Political & International Environment in Egypt
3.1 Political stability
Egypt's calcified politics has long been judged an asset in a confused region but
as leader Hosing Umbra ages in office with no clear descendant investors are
wonder if it might be a liability Egypt's economy is still buoyant in spite of
ambiguity about whether the 81-year-old president will seek a sixth term in 2011
or lever his son into power or whether a dark-horse military or other candidate
will emerge. But bankers score analysts and brokers are asking more question
about who will rule after Embark concerns that may bring stress for higher
returns from Egypt investments compare to rival markets and can confine Egypt
debt ratings. Worries about Mubarak's health in power since 1981 and who has
not picked a vice president, have in the past rattled Egypt's markets.
"The stable political outlook has obviously long been something that has been
identified as an advantage for Egypt," Control Risks analyst Wolfram Lecher said.
"Now, as the presidential succession is approaching, there has been obviously
more improbability and this uncertain political outlook has turned into somewhat
of a weakness." title figures do not reflect investor care. Egypt's bourse is among
the region's best performers the economy has grown at nearly 5 percent through
the global downturn and while foreign investment curved in in the crisis, it still
flows but there are signs of fear. An Egyptian banker, when asked what IPO deal
flow would look like in 2011, would not remark until pressed to say, in private,
that it was too hard to predict with a presidential election looming.

34
Davis 2011: Calls for stability in Egypt
Tens of thousands took part in the protest in Cairo and other city Japan's Prime
Minister Naoto Kan desires Egyptian President Hosing Mubarak to start a
dialogue with his people in the wake of ongoing protests. "I hope the government
of Egypt will reinstate security and peace," Mr. Kan said in a language to the
World Economic Forum in Davis. The unrest in Egypt has now turned out to be
one of the major topics of conversation amongst the leaders at the gathering. In
the meantime Tunisia has told Davis the country is "open for business" once
more. 'Tourism disrupted'
He said people were chronic to work public services were working, and that the
financial and banking system was investment steady, as was liquidity and the
exchange rate. "Visibly tourism has been disrupted but we hope this will be a
fleeting problem, and tourism will come back to usual levels," he said.

35
Start Quote
Anything that threaten development is a worry for us‖ Angel Gerri OECD
secretary general Mr. Nabli also criticized the agency that downgraded Tunisia's
credit rating after the unrest. He called the reaction "a little bit weird" as the
political changes would get better the business setting and "root out cronyism".
The reduce would probably make it more exclusive to use on the open markets
the central bank director said.
Mr. Mubarak said overnight that he had asked the government to resign after him
compulsory a curfew and prepared troops to back up police as they struggle to
control crowds who busy the streets to demand that he step down.
The Tunisian upheaval began with anger over increasing food prices, high
redundancy and anger at official vice problems which have also left many people
Egypt emotion upset and angry of their leadership.

36
3.2 International influence of Egypt
Egypt is in the midst of a run of major political, security, and economic transition
that will open out for years to come. The 2012 presidential elections set to end
later this month in a final run-off election mark the end of one age in this transfer.
But Egypt faces a long road ahead, counting drafting a new creation setting
checks and balances in the new political system, and finishing trials for former
leaders in before governments.
Most likely Egypt will carve out its own path with its transition shaped by multiple
centers of power—some that have emerged since the popular rising in 2011 and
others that have exist for decades. The path Egypt takes will have major
implication for the rest of the region. The changes in the formal structures and
internal balance of power in Egypt‘s government alongside the social and
economic transformation Egyptians carry on to experience, will be some of the
most important strategic dynamics reshape the Middle East.
The changes happening in Egypt could spark its greatest relocation since the
1970s, when it turned away from the Soviet sphere of sway and toward the joint
States and signed a peace treaty with Israel. The days when the United States
could prioritize regional safety over hold for Egypt‘s political and economic
transitions are over. This political vagueness has damaged Egypt‘s economy,
leave-taking endemic problems of high unemployment, growing public debt,
corruption, and rising pressures on Egypt‘s strange cash reserves—without a
logical economic policy reply from the interim government. This family economic
and political volatility could lead to more problems in the safety power.
The new Egyptian government needs U.S. support for this try now. since it
continues to shift its emphasis towards economic growth and job creation the
United States should make democratic governance reform anticorruption

37
measures and support to public society organizations working for political reform
a priority.
The United States must also take into account the economic and political blow of
support to Egypt‘s armed in a new, complete U.S. approach to Egypt. The strong
role that Egypt‘s security organization plays in the economy counting the
inefficiencies this has created makes it a critical area for both economic and
political reform in Egypt. The security establishment‘s efforts to shield itself from
mistake from the civilian government will have a major blow on the route of
political reform. Throughout this process, the United States needs to uphold
sensible opportunity.
The leverage and influence that the United States has on Egypt will become
more and more incomplete by several factors, counting more assertive and self-
governing political leaders in Egypt general anti-Americanism and financial and
political constraint inside the United States. It will not be able to dictate outcome
in Egypt, but by running with Egyptian associates and other local and global
powers the joint States can help influence trends.
Commissioners from Egypt and India for their part balked at endorsing any claim
that social and economic rights were fundamental. They pointed out that
governments of poor countries could not possibly put these rights into effect in
the near future.
The language that Mali drafted met with general approval, and ultimately it
became the Declaration's Article 28 ("Everyone is entitled to a social and
international order in which the rights and freedoms set forth in this Declaration
can be fully realized.") But it did not resolve the impasse over the role of the
state.
Everyone as a member of society has the economic, social, and cultural rights
enumerated below whose fulfillment should be made possible by the State

38
separately or by international collaboration." The Egyptian representative Omar
Louie then proposed an amendment to make clear that the state was not the only
institution through which these rights might be promoted, and that the rights in
question could be implemented gradually.
The end result accepted by all but the Soviet bloc representatives was Article 22
which introduces the social, economic and cultural rights and which by
describing them as "indispensable" for human dignity links them to the traditional
political and civil rights.
The reference in the chapeau to the "organization" of each State was key,
because it left room for choice among a range of means of striving toward the
common social and economic goals—governmental programs and policies,
international initiatives, market dynamics, voluntary action, or various
combinations of these approaches.

39
3.3 International treaties where India & Egypt are members
Technology Transfer
Technology transfer between states is one more future activity for addition in the
group, including Costa Rica and Norway, consider that each technology transfer
―constitute a possible for distraction or abuse,‖ and as a result that the treaty
must include technology transport. Egypt and India talking for a vocal alternative
of states believed it should not be regulated.
India argued against its addition in the treaty on the basis of the difficulty to apply
such regulations and the likelihood of inconsistent application of rule while Egypt
supposed that technology transfers were a tool of development and ―should be
encouraged, not restricted by the one more concern is technology transfer, which
includes cross-border data and technology distribution. Some part States want to
protect the idea of free skill transfer. In the March 2011 Prep Com, the Islamic
Republic of Iran stated the must protect the unchallengeable rights of States and
information transfer was the future point of the report.
Financing
Some Member States have argued that financial contact between states as they
apply to conformist guns should be keeping pace. Some European states have
argued that finance is out of control by state parties, and the United Kingdom and
Indian delegations argued that the should not include a finance section. Some
Member state and civil society organizations have called for the inclusion of the
financial section in an effort to make sure that any action that promote the
increase of arms in a divide country, whether through trade, aid, thinker property
rights or loans is keeping pace in the.

40
Conclusion
Egypt country tax can be change for personal income tax and corporate income
tax. But personal income marginal tax rate reduced from 32% to 20% of Egypt.
Egypt country in taxes payable by businesses for an Indian country is more tax
payable and Egypt country low tax rate payable of that.
The Egypt labor laws oblige the employers from the private sector to employ 5%
from the total number of people with disabilities at the Manpower Offices` offer.
Global country may own up to 100 percent of Egypt private insurance firms.
Investors acquire more than a 10 percent stake in an insurance company
requires support from the Egyptian Insurance managerial Authority (EISA).
Education inputs in Egypt for % of GDP 2010 for 3.8 and Indian country for no %
of GDP in this condition Egypt country are better than Indian country for % of
GDP.
The Financial Times paper reported in late 2008 that Egypt's public
infrastructure—including schools, hospital and public moving system--was in
poor state.
Health system influences on Egypt country per 1000 people in 2005- 2010 to
compeer on Indian country. But Egypt country is 1000 people in 2005-2010 for a
1.7 % health system influences and Indian country is 0.9% health system
influence.
2012 presidential elections set to end later this month in a final run-off election
mark the end of one age in this transfer. But Egypt faces a long road ahead,
counting drafting a new creation, setting checks and balances in the new political
system, and finishing trials for former leaders in before governments.

Reference
httpwww.ier.hit-u.ac.jp~kitamuraPDFA115.pdf
httpwww.oecd.orgdafprivatesectordevelopment46340489.pdf
httpwww.egypt-cairo.comegypt_labor_law.html
httpwww.infoprod.co.ilcountryegypt2i.htm
httpwww.globaltrade.netfbusinesstextEgyptTrade-Policy-Trade-Barriers-in-
Egypt.html
httpwww.ustr.govarchiveassetsDocument_LibraryReports_Publications20012001
_NTE_Reportasset_upload_file903_6565.pdf
httpwww.ustr.govarchiveassetsDocument_LibraryReports_Publications20012001
_NTE_Reportasset_upload_file903_6565.pdf
httpdata.worldbank.orgsitesdefaultfileswdi-2012-ebook.pdf
httpwww.enrecahealth.dknewse-learningImproving_Health_Service_
httpwww.hinduwisdom.infoIndia_and_Egypt.htmDelivery.pdf

A
GLOBAL COUNTRY STUDY REPORT
ON
“Textile Engineering Industry in Egypt’’
Submitted to
K.P.PATEL SCHOOL OF MANAGEMENT AND COMPUTER
STUDIES, KAPADWANJ
IN PARTIAL FULFILLMENT OF THE REQUIREMENT
OF THE AWARD FOR THE DEGREE OF
MASTER OF BUSINESS ADMINISTRATION
IN
Gujarat Technological University
Submitted by Faculty Guide
Mr. Amit Bachani
(Assistant Professor)
MBA SEMESTER III
K.P.PATEL SCHOOL OF MANAGEMENT AND COMPUTER STUDIES,
KAPADWANJ
Affiliated Gujarat Technological University Ahmedabad
2012 - 2013
Mistry MahammadIrfan. A. 117240592008
Patel Tejaskumar. N. 117240592013
Patel Dhariniben. K. 117240592009
Patel Namrataben. D. 117240592016
Patel Pinkalkumar. D. 117240592021
Patel Bhavikaben .P 117240592022


STUDENT’S DECLARATION
We Irfan, Tejas, Namrata, Dharini, Pinkal, Bhavika, hereby declare that the report for
Global / Country report entitled “Textile Engineering Industry in Egypt ’’ is a result of
our own work and our indebtedness to other work publications references if any have
been duly acknowledged.
Place: KAPADWANJ (Signature)
Date: Mistry Mahammadirfan
Patel Tejas
Patel Namrata
Patel Dharini
Patel Pinkal
Patel Bhavika
I.

PREFACE
Being an M.B.A student, it is necessary to prepare a global country report. Their object of
practical training & knowledge is to develop atmosphere and all other business practices.
The preparation of the whole report was a great opportunity for us to explore ourselves to
the practical field. All analysis done by us regarding the EGYPT country could make us
all confident enough & prove ourselves. We could come out of the bookish knowledge.
Preparation of such type of report calls intellectual nourishment professional help and
encouragement. Due to report, we are exposed to the method and practices being use in
the field of applications.
II.

ACKNOWLEDGEMENT
Every student owes a great deal to others and we are no exception because learning is a
process which entails give and take, exchange of ideas and value addition through
discussions. So it gives us immense pleasure to be able to express our gratitude to one
and all who have contributed to the successful completion of our project with a great
learning.
First and foremost we would like to thank our project guide Mr. Amit Bachani. He gave
us an in-depth knowledge of the working of the GCSR report and enhanced our
understanding on its various aspects.
His invaluable and significant guidelines improved our outlook and contributed in
making our project a real learning experience. He also encouraged us to put in our best
efforts and bring out the beat of our abilities.
III.

EXECUTIVE SUMMARY
The textile industry is one of the oldest in the world. The industry was primarily a family
and household one until the early part of the 1500 when the first plant system was
established. Today the textile part in Egypt consists of well over 3000 company range
from the very small (employing less than 8 laborers) to the very large (greater than 20000
laborers). These are both public and private sector companies.
Egypt produces 25-30% of the world cotton though there is strong competition from
USA, China, India and Israel. Egypt also produces the some of the maximum quality
additional Fine cotton in the world has a 35% of the world market. Commonly used raw
materials include: Natural fiber based on cellulose (e.g. cotton, flax, jute, hemp etc.) or
protein (e.g. wool, and silk).
A number of the company in Egypt caters to the export market and these exported goods
can be classified as:
Fibers: medical cotton
Yarns: cotton yarns, rayon yarns, flax yarns, wool or acrylic yarns, hanks
Sewing thread
Cotton and blend fabrics : grey and dyed, written and complete
Woolen and blend fabrics
Ready-made fashion
The early and most primal arts were moved by nature and were developed through the
usual resources of the country and the primitive tools and materials. In the warm
countries, greater attention was given to the weaving of linen, silk, and cotton fabrics.
IV.
Linen possibly was the first textile to be manufactured. It was made by the India and
Egypt as early as 2800 B.C. in fact it is hard to conclude whether textiles had their origin
in Egypt or in the adjust. Silk after linen was the next industry of the textile trade to be
developed. Aristotle speaks of silk as being bring over from China from side to side India
to a small commercial colony in Asia Minor and there is also old story of the Greek
monks who return from China carrying a goodly number of silkworms out of sight in
their stays thus from all these countries, American textile manufacturing has developed
into a more or less modified and almost always ugly type of machine made fabrics.
The Indian textiles industry plays a significant role in the country’s economic growth.
The industry is important in conditions of output foreign exchange income and
employment with rising interest in the Indian textiles and clothes sector a number of
buyers opened their source/liaison office in India. The recent couple of years were testing
for the Indian textiles industry as a result of the global monetary slowdown.
The textiles sector in India comprise both organized and unorganized segment. More than
70 textile and clothes cluster account for about 80% of total manufacture in the country.
Major sub-sectors of the textiles sector are organized cotton/man-made fiber textiles
mills, man-made fiber/filament yarn, wool and woolen textiles, sericulture and silk
textiles, handlooms, handicrafts, jute and jute textiles and textiles exports.
In this manner industry should be able to believe political and legal aspects so as to show
that they value the policies and regulations of the government in any of the business
operation.
Tax policy
Employment laws
Political stability
Environmental system
Trade and tariff margins

The economic situation of world can also affect the industry as rising inflation rate make
the cost of manufacture high and thus reduce the profit margin of the industry.
Economic strength
Economic expansion
Interest rates
Inflation rates
Exchange rates
The change in the way of life of the people affects the growing demand of the apparels.
The change in the way of life and needs in different demographics also affect the demand
of the consumers.
Population expansion rate
Age division
Career attitude
Consumer behavior
Religion and society itself
Technological progress in all the sectors of the country has changed the entire socio-
economic situation. Particularly in the textile sector there is a lot of technological
development.
Distribution and communication channels
Technology incentive
Rate of technological change
Environmental and natural aspect
Barriers to entry
Production level
Outsourcing decision

Broadly define the textile industry includes the spinning, knitting and weaving of natural
and man-made fibers the opening of textiles and the production of ready-made clothes
The most common sectors in the Egypt textile industry are cotton fabrics, wool fabrics,
man-made fabrics, synthetic fabrics and blended fabrics.
The Union of Industries and the Ministry of Industry had urged the Finance Ministry to
launch measures to maintain the domestic industry. He stated that all contact relating to
raw inputs required for production would be closely monitor to avert these goods from
incoming the black market.
Ministry of Trade & Industry and Cotton adjudication and Testing General Organization
(CATGO) announce that International Cotton Training Center (ICTC) will ways a
training program on Fiber Technology Spinning and Textile Industry. It will be held for
the period of the period from 3 July till 28 July 2011.
Modification of existing processes/tools or the purchase and system of new equipment
may be considered to reduce the utilization of process chemicals energy and water.
Foam technology: where water is replaced by air in the form of foam in chemical recipes
and formulations. This helps to save power, decrease chemical costs, increase
manufacture and minimize effluents and pollution. Foam technology can be useful in
sizing, dyeing, printing and finishing processes.
Spray technique: where sprays of strong solutions are applied to the goods to achieve
treatment such as dyeing and finishing. The use of electrostatic systems was introduced
by Sandoz to improve consistency and distribution. Vacuity extractors can also be used
to lower the wetness content of a textile material before it enters the dryer. These are
most efficient on fairly porous artificial materials. In this technique radio-frequency
(RF), e.g. micro-wave and Infra Red are use for freshening loose stock letters and hanks
that have been given opening or dyeing treatments.

This method is a commercial reality with verifiable cost energy and time savings.
Computer control and other forms of mechanization can be introduce to dyeing
processes in order to allow greater reproducibility and optimized use of dyes and
additives in dyeing formulations. Use of solar energy as an option for the conventional
energy is a hopeful approach for reducing energy use needed for heating at process
water.
The Egyptian Prime Minister Dr. Ahmed Nazif opened the New Textile Technology
Centre situated in the campus of the Faculty of Engineering Cairo University in Sheikh
Zayed City on 27 of May 2008. This is the latest knowledge center in this sector at a state
level. The response was attended by Mr. John Yates Medibtikar Programmed Manager.
The centre is set up to provide the best utilization of factories equipments for spinning,
weaving and dyeing which were donate by the Ministry of Housing to Cairo University
as a division of the new property of the Faculty of Engineering in Sheikh Zayed City.
These equipments value is beyond 5 million Dollars. This technical center represent a
unique partnership between academic institution and government agencies and self-
governing and private sector where it is administer by the Governing Council attended by
the industrial leaders in both private and public in the textile sector.
The Center’s activities can be classified into main two sectors primary sector which is the
technology sector and the secondary sector which is the testing and value control for the
technical sector sections of textile spinning, weaving and dyeing. The testing and quality
control sector has a globally accredited laboratory which contains many devices that is
capable of performing arts the required tests for the fashion and textiles export.
Egypt Textile engineering industry (TEI) is afraid the condition improved during 2010-11
with a better performance set up by the textile industry. As per the survey of the Textiles
working group during 2008-09 the estimated annual install capacity of TEI was Rs. 5065
Crores. The total permanent production of textile machinery parts & accessories during

2010-2011 recorded a raise of 35 per cent at Rs. 3563 crores as next to Rs. 2000 crores
achieved during the earlier year.
Imports of textile machinery have rise from Rs. 3000 crores during 2009-10 to Rs. 3500
crores (approximate) during 2010-11.Exports during 2010-11 had been approximate at
Rs. 450 crores against Rs. 400 crores achieve during 2009-10. With the overall
development of the industry exports are expected to develop in the coming years.
The welcome gush in demand from the textile industry during 2004-2007 had confident
TEI to develop and expand the machinery developed capacity. This was mostly so in the
spinning machinery sector. At present demand is again looking up and it is our earnest
attempt to meet the demand in quantum quality and show coupled with effective after-
sales service.
Even today the preference of a great section of the textile industry to imported second-
hand/used machinery is touching the growth of domestic machinery manufacturing.TEI
needs full support from the Government so that it has a level in performance field and
becomes aggressive enough to supply the latest technology machines to the textile
industry.
Compared to public companies many private companies are very dynamic they put
together new technologies develop a network of retail businesses counting abroad and
achieve excellent export results. Besides the creation of distant companies (India,
Chinese.) in many free zones, the strong domestic bazaar and the state supported
Research and Development activities are among the other factors that help expand the
sector. Earlier Nassir’s completion of “socialist” statist policies made Egypt firms
mutually respectful overstaffed and with poorly skilled workers state industry have been
slow in adapting to technological changes including the completion of computers and
software.
The private firms that do exist are too trivial to make up for the weaknesses of the public
sector and have not done a improved job than the public sector industry in implement and
updating technologies which suggests that privatization might not always be the magic
answer at least when not accompany by more radical political reform. There are many
projects to develop essentials of the improvement system.
The country’s global profile has better hence hopeful foreign investments, the possibility
of repatriating invest capital and profits, tariff cuts, corporate tax reform, support of
exports, creation of special fiscal free trade zones and protection of academic property. It
is hoped that additional privatisation will lead to a further add to in foreign investment in
Egypt. Expansion of new manufacturing areas and IT focus offers room for growth.
Operator characterizes Egypt as a much stopped market. For example Spanish operator
describes the Egyptian market as being as closed as the Pakistani and Indian markets (in
interview). Operators characterize India as one of the most limited market for their
exports.
Textile and clothing sector is of high significance for Egyptian economy and service.
Employ of the sector covers about 1 Mio personnel and accounts for 30% of Egypt total
manufacturing labor force 44. In addition there are thousands of small factories and
workshops. Also the sector employs unaccounted in official workers. Textile companies
had to fulfill government supplies and to provide low price products for domestic
consumption. For years the industries was affected by this production process and suffer
from lack of technological innovation. From the 1980’s the Egypt textile industry was
progressively privatized but still suffer from trade limits on textile imports and machinery.
Garments are the main product imported by both the EU and the US though the EU had
13% of its imports in yarns as opposite to 3% for the US and 5% in fabrics as opposed to
2% for the US explanation the turn down in the exports of yarns and fabrics (reviewed
later in the report) in light of the decrease in the European textile industry.

Vision of India to build world class, state-of-the-art, developed capacity and achieve a
main global standing in produce and export of textiles and clothing. to enable Small &
Medium enterprise (SMEs) to achieve competitiveness to face the global situation with
confidence. To provide a conducive policy setting which will give confidence innovation,
augment R&D efforts, and improve output through the up gradation of technology
manufacturing process and the development of human resources. To set up the Indian
textiles industry as a creator of globally competitive value added products.
To have sustainable growth and progress of Textiles Sector in the country. To improve
output across the entire textiles value chain. To achieve comprehensive growth by
improving productivity in handlooms, handicrafts and sericulture and by ensuring
interests of weavers and handicrafts artisans. To ensure included development and
support of jute sector. Jute production to grow at 3.6% per year.
To Be the Hub in Textiles teaching and Technology Transfer for Global Competitiveness.
To equip the textile industry to endure the pressure of import access and maintain
dominance of the rising domestic market.
Objectives
Demand Based progressing Education and particular Training.
Establish Industry Linked credited Testing/Analysis Lab.
Create expertise Transfer Focal Point Based on Needs.
Unite consult Services from FECU and capital in Unique combined Project.
Network Domestic and global Expertise to Serve the Industry
Egypt President visited India in 1982, in 1983 to attend the NAM Summit and in
November 2008 on a two-sided visit during which the follow documents were signed
exile Treaty conformity on elimination of visa obligation for holders of diplomatic
special and official/service passports MoU on Cooperation in the ground of Health &
Medicine MoU on collaboration in the examination and Use of Outer Space for Peaceful

Purposes MoU on Trade & technological collaboration.
In fact some Indian company started in 2011 new production services in Egypt. Egypt
investment in India is about USD 30 million by El Sewed group an Egyptian company
manufacturing Electric meters in India.
Out of the 50 Indian companies operating in Egypt approximately 25 companies are joint
ventures and wholly owned Indian subsidiary. The rest of the Indian companies are in
service in Egypt through their delegate offices and executing various projects for
Government of Egypt and Governmental organizations. The Indian companies are in
service in almost all fields like textiles and garments, power, chemicals including
specialty chemical, adhesives, pharmaceuticals, information technology, paints,
consumer goods, healthcare, PVC, caustic soda, PET Resin, plastics, paper, packaging.
The principal Indian export items comprise crude oil, LNG, raw cotton, rock phosphate,
coke and semi-coke of coal. The top Indian exports during 2011-12 were, cuts of
boneless bovine frozen meat, diesel fuel, two & three wheelers, cotton/artificial yarn,
carbon electrodes.
Egypt's economy was particularly hard hit with slowing production and a decrease in
exports amid the unrest that followed the passive revolution and a sharp fall in tourism
revenue which is a main source of foreign currency for Egypt. The Egyptian financial
system grew 2.2 per cent in the previous 2011/12 fiscal year.
India and Egypt are two of the world's ancient civilizations with a history of close
contact. Egypt has traditionally been one of India's most important trading partners in the
African continent. Since FY 2005-06, India has been among the top five importers of
Egyptian products. This is mainly on account of import of oil and gas from Egypt.

India has emerged as one of Egypt’s largest deal partners. Nearly 95% of Egypt’s exports
to India comprise oil and gas. Cooking gas raw cotton, rock phosphate, and marble
comprise the other import items. The two-way trade between India and Egypt has
exposed significant growth in new years. The relationship between the two countries has
evolved into a significant joint venture in the economic and commercial sphere. At the
same time Indians have emerge as important investors in the Egypt and India as an
important export destination for the Egypt manufactured goods.

TABLE OF CONTAIN
SR.NO PARTICULAR PAGE.NO
DECLARATION I.
PREFFACE II.
ACKNOWLEDGEMENT III.
EXECUTIVE SUMMARY IV.
1 Egypt Textile Industry
1.1 Introduction 1
1.2 History of Textiles 3
1.3 History of Indian textile industry 8
1.4 PEST Analysis of Textile Industry in Egypt 10
1.5 SWOT Analysis of textile industry in Egypt 12
1.6 Technology used in textile industry 14
1.7 Egyptian Government to Introduce Steps to Protect
Textile Industry
16
1.8 Training program on Fiber Technology Spinning &
Textile Industry
17
1.9 Technology Change and Modification 20
1.1 New technology centre for the faculty of engineering 23
1.11 Egypt Textile Machinery Industry: Current scenario and future
Outlook
24
2 Company Analysis
2.1 Textile Manufacturing Companies 26
2.2 Top companies in Textile industry in India: 28
3 Comparison of India and Egypt textile
industry
3.1 Weaknesses and Opportunities of Egypt and India 32 -34
3.2 General features of the access to the Egypt and Indian
market
35
3.3 Domestic structure of the textile and clothing industry
in Egypt and India
36
3.4 Egypt and India Textile Imports and Exports 37 & 38

3.5 Vision and objectives of an Indian textile industry 39 & 40
4 Relations of India-Egypt
4.1 Relations of India-Egypt 41
4.2 India and Egypt Economy Relations 43
5 Conclusion 47
6 Reference v.

Page 1
1. Egypt Textile Industry
1.1 Introduction
The textile industry is one of the oldest in the world. The oldest known textiles which
date reverse to regarding 5000 BC are leftovers of linen cloth found in Egypt caves. The
industry was primarily a family and household one until the early part of the 1500 when
the first plant system was established. Today the textile part in Egypt consists of well
over 3000 company range from the very small (employing less than 8 laborers) to the very
large (greater than 20000 laborers). These are both public and private sector companies.
The textiles industry is the fifth largest source of foreign earnings after oil, remittance,
visiting the attractions and earnings from the Suez Canal. It is the second leading
manufacturing sector in Egypt after food processing and represents 25% of total work
output (excluding petroleum products). Egypt produces 25-30% of the world cotton
though there is strong competition from USA, China, India and Israel. Egypt also
produces the some of the maximum quality additional Fine cotton in the world has a
35% of the world market.
Production in the sector:
Commonly used raw materials include:
Natural fiber based on cellulose (e.g. cotton, flax, jute, hemp etc.) or protein (e.g.
wool, and silk).
Man-made fibers (e.g. viscose rayon and cellulose acetate) Synthetic fibers (e.g.
polyester, polyamide, polyacrylic, polypropylene, etc.) of the natural fibers cotton
is the largest crop produced and processed in the textile industry.
Flax represents the second biggest source of fiber for the textile industry is refined
in Egypt mainly for the production of linen and seed oil.

Page 2
Locally produced wool is used for runner manufacturing with the maximum
quality wool being import and dew axed in Miser Beida Dyers Alexandria.
Viscose polyester and polyamide fiber are created locally in Miser Rayon of
Kafr-El-Dawar.
There are very few home manufacturers of the chemicals necessary for the production of
artificial and real fibers in Egypt. The best part of the chemicals therefore has to be
import or procure from multinational chemical company with a presence in Egypt
making it hard to adopt a CP approach.
A number of the company in Egypt caters to the export market and these exported goods
can be classified as:
Fibers: medical cotton
Yarns: cotton yarns, rayon yarns, flax yarns, wool or acrylic yarns, hanks
Sewing thread
Cotton and blend fabrics : grey and dyed, written and complete
Woolen and blend fabrics
Ready-made fashion

Page 3
1.2 History of Textiles
The early and most primal arts were moved by nature and were developed through the
usual resources of the country and the primitive tools and materials. The stimulation to
create and design sprang from the people‟s simple needs and requirements hence the first
known arts were pure and original and there were no foreign authority to help them.
As the arts of past ages untouched from period to period the arts of nations and peoples
spoken themselves through nature and spirit in forms, lines, ornaments, and colorings.
Through all the centuries still the immutable laws of work and proportion remain in spite
of changing styles and revolutions. The progress and development of all the arts, style,
painting, design, textiles, and costumes, may easily be traced from the earliest Egyptian
Babylonian and Assyrian countries through Greece and southern Italy from side to side
Asian minor to Bagdad and Byzantium to the mogul courts to Italy, France, and England.
All primal as well s Egypt designs and ornamentation were simple in structure they were
delegate and attractive and geometrically arranged with only a few lines. The Egypt use
color conventionally and though their painting were in flat tints they still conveyed
clearly the objects they desired to stand for. Red, blue, or yellow, with black or write,
gave division and clearness to their color designs. The lotus papyrus and palm kindling
growing on the banks of the Nile and the well-known asp and beetle were the main
motifs.
The plants which the Egypt used in their festivals to decorate the capitals of their pillar
were taken possibly from the full-blown lotus flowers or the rushes or reeds used to bind
stalks at top and bottom of their primal houses or possibly their temples lashed to a point
at the top. In their tents the fiber used for the covers were often plaited and woven a
custom which most likely moved them to carry out the idea of the square painted design
for their temple ceiling.

Page 4
It is not known positively when the textile industry originates. It is definite however that
it is older than design that fabrics preceded paintings and that “when the first people of
the earth took refuge in caves or under interlace boughs they were clothed in common
cloths or skins and that when the first hut was built they were somewhat well dressed” In
the warm countries, greater attention was given to the weaving of linen, silk, and cotton
fabrics.
LINEN AND WOOL
Linen possibly was the first textile to be manufactured. It was made by the India and
Egypt as early as 2800 B.C. in fact it is hard to conclude whether textiles had their origin
in Egypt or in the adjust. The tombs of Egypt of 2800 B.C. illustrate weavers at work.
The Japanese unstated the weaving of linen, gold, silver, and silk into rare papers, while
the Europeans were still writing on pieces of bark and as evolution spread from East to
West the ways of spinning and weaving were passed on to Europe to Italy and Spain, to
France, then to Germany, and finally to England.
It was from India that the information of block printing came to Europe. By sea it came
direct to France from one of her colonies. There are pictures of like textile to be found on
the walls of the place of worship of Beni Hassan, built 2100 B.C., and Egyptian and
Syrian monument of 2400 B.C. show wall pictures of the manufacture of rugs and
fabrics. Also pictures of looms indicate that drawn-work and nettings were of early
origin.
The Egyptians used wool, hemp or flax for this early woven stuff. In 400 A.D. were
woven Egypt and Roman tapestries. In 600 A.D. northern Egypt and Sicily were
developed silks. The Greeks were ignorant with cotton until it came from India and not
until the time of Alexander the Great was it recognized in Europe. Besides linen mummy
cloths, woven a thousand years previous to Christ there were also those made of woolen
stuffs. In addition cloth of gold tissue of which we read in the Bible was life form made
before the time of Moses. It was crudely produced by pounding or flattening the gold into

Page 5
linen or cotton cloths by means of wooden mallets and because the Egypt unlike the
Orientals did not know of gold wire they used the softest gold leaf in the making of these
great mummy cloths.
Rugs were first woven by the Assyrians but if the Babylonians and Egypt had not
exposed and valued the art and if later the Greeks and Romans has not soften the walls
and floors of their costly palaces with these textiles it is unsure whether we should now
know of the Oriental rug. Pliny speaks of the greater skill of the Assyrians in the weaving
and in the color combination of rugs Homer and Herodotus tells of the weavers of the Far
East and the Bible refers many times to the runner and its uses.
The Oriental rug was first made for religious purpose and later to take the place of wall
streamer. In Europe the weave of wool reach its rightness during the tenth century in
Flanders. In 1066 the Angles and Saxons were weaving wool and create became
extensive in 1331 in the reign of Edward III. Toward her colonies however England
maintain a policy intended to limit any produce of woolen goods and all known textiles
though a report of Alexander Hamilton in 1791 mentions a mill for the produce of cloths
and cassimere‟s in operation at Hartford Connecticut.
SILK
Silk after linen was the next industry of the textile trade to be developed. Five thousand
years ago it was life form made in southern China and it was only a hundred years later
that the secret of it was only a hundred years later that the secret of its making was
dispersal across to the East and finally to Europe. Aristotle speaks of silk as being bring
over from China from side to side India to a small commercial colony in Asia Minor and
there is also old story of the Greek monks who return from China carrying a goodly
number of silkworms out of sight in their stays Silk, then, was usually woven in China
but not until 500 A.D in the time of Justinian was it woven in Europe.

Page 6
Moreover two centuries onwards before any real development was made in silk
manufacture there though at the present time Europe produces one hundred and fifty
million pound of cocoons annually and Italy and France carries the biggest quantity of
that amount. This Country of Europe has always been the homes of the best weavers of
silk, velvet, lace, and tapestry.
TAPESTRY
The weave of tapestry was known early in society date back to the Egypt period. Possibly
it was on loan from the Orientals. In Europe it was first skillful toward the end of the
twelfth century in Flanders where it flourish in the rich and wealthy town of arras
Flemish weavers began to produce wool tapestry at arras, Lille, and Brussels in 1477. In
France tapestry produce began in 1466 at Lyons. Later factory were establish by the
kings for this produce. The Gobelin plant for instance was started in 1539 by Francis I
and here artists such as refuel made designs for the tapestry.
In 1619 this factory became the royal property of France. In the twelfth century the
weave of minster vestments was an important although the Germans were far after in
other kinds of weave fragrance was famous for her religious textiles known as periphery
web. With this exemption German designs were heavier and their cloths coarse than those
of the French. In 1480 needlepoint lace work began in Italy. In 1500 Italy manufactured
cloths silk, satin, clam ask and plain and cut velvets.
In 1531 Corte bring silk to Mexico whence it finally came to the United States where its
manufacture easy slow at first. In 1619 it was cultivated in Virginia and it thrived
moderately until 1666 when it proved a complete failure. Despite this tardiness however
silk cultivation is now permanent and ever growing industry in the United States as is the
manufacture of cotton and linen cloths. Thus from all these countries, American textile
manufacturing has developed into a more or less modified and almost always ugly type of
machine made fabrics.

Page 7
The good color and simple designs of the simple clothes counterpanes and samplers of
our grandmothers of colonial times are the majority outstanding hand wrought examples
of the American textile; and today perhaps the best textile weaving are dyed, design,
copied and woven by individual weavers, arts and crafts society and by certain interior
decorate shops of new York which have import French weavers and their dyes their
looms and method. Pamphlet of the chemical properties of dyes and cloths and tests for
textile may be obtaining upon request from the home finances departments of American
college and universities.

Page 8
1.3 History of Indian Textile Industry
The Indian textiles industry plays a significant role in the country‟s economic growth.
The industry is important in conditions of output foreign exchange income and
employment. It contributes around 14% to industrial production, 4% to GDP and 10.6%
to the country‟s export salary.
One of the key trends witness in liberalize post-quota time is that India emerged as a
major source purpose for new players. With rising interest in the Indian textiles and
clothes sector a number of buyers opened their source/liaison office in India. The recent
couple of years were testing for the Indian textiles industry as a result of the global
monetary slowdown. Back home the industry faced challenge of strong demand side
pressure due to inflationary trends and instability in service prices.
Size and structure of the industry
The Indian textile industry is continuous with only a few large players and many small
and medium-size companies. The industry‟s size is expected at US$ 55 bn with 64% of
the companies catering to home demand.
The textiles industry provides direct employment to more than 35 mn people and indirect
service to 47 mn people. In addition the industry generates important employment
through forward and backward linkage both in traditional (production of cotton and other
natural fibres) and modern activities (textile design, etc). In fact the textiles industry is
the second-largest employment producer after agriculture.
Industry structure
The textiles sector in India comprise both organized and unorganized segment. More than
70 textile and clothes cluster account for about 80% of total manufacture in the country.
There are nearly 40 power loom cluster in the country. Major states with a figure of

Page 9
clusters are Maharashtra, Tamil Nadu, Andhra Pradesh, Karnataka, Kerala and Uttar
Pradesh. The textiles industry is much diversified with hand-spun and hand-woven
sectors at one end and the capital-intensive complicated mill sector at the other. The de-
centralized power loom/hosiery and knitting sectors form the largest section of the
textiles industry.
Major sub-sectors of the textiles sector are organized cotton/man-made fiber textiles
mills, man-made fiber/filament yarn, wool and woolen textiles, sericulture and silk
textiles, handlooms, handicrafts, jute and jute textiles and textiles exports.

Page 10
1.4 PEST Analysis of Textile Industry in Egypt
Political (Legal) Aspects
An Industry will not be able to gain success good standing and trust if it will not believe
legal and political sector as part of their strategy. Political and legal sectors include the
needs of the company to follow the given policies and system of the government in order
to be careful as legal and official business company. In this manner industry should be
able to believe political and legal aspects so as to show that they value the policies and
regulations of the government in any of the business operation.
Tax policy
Employment laws
Political stability
Environmental system
Trade and tariff margins
Economic Aspects
The economic situation of world can also affect the industry as rising inflation rate make
the cost of manufacture high and thus reduce the profit margin of the industry.
Economic strength
Economic expansion
Interest rates
Inflation rates
Exchange rates

Page 11
Social Aspects
The change in the way of life of the people affects the growing demand of the apparels.
The change in the way of life and needs in different demographics also affect the demand
of the consumers.
Population expansion rate
Age division
Career attitude
Consumer behavior
Religion and society itself
Technological Aspects
Technological progress in all the sectors of the country has changed the entire socio-
economic situation. Particularly in the textile sector there is a lot of technological
development.
Distribution and communication channels
Technology incentive
Computerization
Rate of technological change
Environmental and natural aspect
Barriers to entry
Production level
Outsourcing decision

Page 12
1.5 SWOT Analysis of textile industry in Egypt
Strengths:
Egypt's competitive advantage in having rich labor. The privatization strategy of
Egypt is causal to sustainable expansion in industry since governments have other
jobs rather than management of developed production. The privatization
procedure is progressing though other countries (e.g. Germany) have stopped up
this file in much shorter time.
The institution of new industrial cities has been a practical option to curb the
pollution problems of the old cities. This not only decrease problems in the over
packed areas but also helps to spread urbanization in the new cities that have
sufficient land space. The idea of industrial cities aims at boost the initiative of
cleaner production in the industrial establishment.
The domestic agreements signed by Egypt particularly that with the EU. Egypt‟s
special geographic location which gives it a relative advantage in exporting.
The relative abundance of natural gas which constitute a source of energy for
industrialization in spite of its high costs. Egypt has always been creative and all
they require is motivation.
Labor-intensive textiles in which Egypt has had rich knowledge and the relative
advantage of cotton farming length of staple and skilled low-priced labor.
Weaknesses:
Fine export product and market base. Some degree of domestic production of
middle inputs and components.
Limited payment of the FDI.
Weak capital goods industry.
No technological deepen.
Limited natural capital.
High figure of population.

Page 13
Low quality of education and low R&D.
Lack of promotion and advertising skills.
Opportunities:
Slow decrease of the protectionism and subsidy according to the ERSAP which
implies the occupation in only the resourceful products.
International agreements Egypt has signed with other country especially the EU.
Egypt tends to better recognize the concept of marketing and sales and has
recently introduced it in its universities which provide the domestic goods the
opportunity to be better marketed abroad.
Threats:
Contest in the export markets from lower cost manufacturers.
Threat of de-industrialization because of fast import liberalization.
Continual trade deficit in the manufactures sector which constitute stress of the
Balance of Payments.
Current broad import prohibitions may give confidence inefficient high-cost
production in developed industries.

Page 14
1.6 Technology used in textile industry
Textile Manufacturing Processes
Broadly define the textile industry includes the spinning, knitting and weaving of natural
and man-made fibres the opening of textiles and the production of ready-made clothes
The most common sectors in the Egypt textile industry are cotton fabrics, wool fabrics,
man-made fabrics, synthetic fabrics and blended fabrics.
Processing of Cotton Based Textiles
Cottons and cotton-based textiles are process through three main stages, comprise
spinning, knitting or weaving and wet processing.
Spinning
Spinning is the process which converts raw fiber into yarn or cotton. The fibres are ready
and then drawn out and perverse to form the yarn which is then wound onto a reel or
cone. The spinning process is entirely dry even though some yarns maybe dyed and
finished as a final customer product.
Knitting
Knitting is approved out by interlock a series of yarn loops usually using sophisticated
high speed machinery. This process is almost totally dry though some oils may be applied
during the process for lubrication. These are removed by following processing and enter
the wastewater stream.
Weaving
Weaving is the most general method used for producing fabrics. The process is carried
out on a loom (of which frequent varieties exist) which interlace lengthwise yarns (warp
yarns) with widthwise ones. Prior to weaving the warp clothes are coated with a size to
increase their tensile strength and smoothness.

Page 15
Natural starches are the most frequently used sizes although compound such as polyvinyl
alcohol (PVA), resins, alkali-soluble fiber derivative, and gelatin glue have been use. The
sizing mix is dried on the threads and leftovers a part of the cloth until it is removed in
the following processes. Other chemicals, such as lubricants, agents, and fillers, are often
extra to impart added properties to a fabric. This process regularly adds on about 10-15
to the woven goods.
Wet Processing
The stages of wet processing of cotton textiles, both woven and knitted, are shown in
Figure 3.3 as follows:
(a) Wet Processing of Knitted Cotton Fabrics
(b) Wet Processing of Woven Cotton Fabrics
Knitted
Fabric Bleaching
Dyeing and /
Or printing
and / or
Finishing Finished
Fabric
Mercerizing
Pre-treatment
(Desiring-scouring- bleaching)
Singeing Woven fabric
Dyeing and / or printing
Finishing
Finished fabric

Page 16
1.7 Egyptian Government to Introduce Steps to Protect Textile
Industry
The Government of Egypt will soon begin steps to protect its local textile industry. For
the purpose the Customs Duty ability will meet this week and consider review of taxes
and duties on textile goods the authority‟s Director Ahmed Seedy has announce.
The Union of Industries and the Ministry of Industry had urged the Finance Ministry to
launch measures to maintain the domestic industry. Mr. Seedy listed some such actions
which include revising the volumes of import fabrics which have been exempt from
customs for the time being to bring them in lines with the actual requirements of the
units.
He also optional curtail the grace period for re-selling the fabrics before they become
likely to customs duty from two to one year. He stated that all contact relating to raw
inputs required for production would be closely monitor to avert these goods from
incoming the black market.
Further he exposed that no rise in duties would be announced earlier in order to exclude
the dealers from stockpile the commodities for selling the same at upper prices in future.
The current Government actions:
The Egypt government will pay out LE 280 million to support 120 local spinning
and weaving factories.
Textiles will be exempt from customs duty until 31 March 2011.
Subsidy to the textile exporters who use local raw material will be raised by 50%.

Page 17
1.8 Training program on Fiber Technology Spinning & Textile
Industry
Ministry of Trade & Industry and Cotton adjudication and Testing General Organization
(CATGO) announce that International Cotton Training Center (ICTC) will ways a
training program on Fiber Technology Spinning and Textile Industry. It will be held for
the period of the period from 3 July till 28 July 2011.
Lectures
Global Production & Consumption of Cotton and its relation to fake fiber.
Cotton handling stages opening from picking till baling.
Cotton harvest methods (Manual – Mechanical) and its result on the quality.
Organization of cotton filament.
Ginning manufacturing (Roller – Saw) and the effect of each on yarn & end-
product quality.
Standard procedures for model & prepare samples for testing.
International standards for testing and issuing a recognized certificate.
The effects of physical cotton fiber property on handing out stages and yarn
quality.
Maximizing the quality and reducing costs in turning & textile industry.
Pollution in cotton and its effect on the processing stages – How to get cotton free
of contamination.
The effect of wetness on cotton fiber properties, methods of testing, drawing
samples and damp testing certificate.
The required data to compare between two results
Reasons of difference between tests results.
Commercial Standardization of Instrumental Testing of Cotton (CSITC).

Page 18
Guide lines for comparing between different instrumental results
Compare between sample result with "Standard Reference Sample
High ground cotton categorization.
The effect of global cotton prices on the created yarn prices.
Conservative & Modern Spinning Systems – the most updates development in
spinning & textile industry.
Quality control & quality control chart and how to use it in avoid some
dispensation problems.
Technical terms & accurate concepts related to turning and textile technology.
The effect of wetness on cotton fiber property processing and its effect on the
class of end-product.
Adjusting wetness contents in turning and textile mills.
Testing textile properties in regular atmosphere.
The modern measure methods of wetness regain in textiles.
Recent trends in prepare cotton blend.
Field Visits
Visiting a Ginning mill.
Mena El-Bassal Cotton Exchange:
1. Methods of drawing samples for wetness testing and adjudication stages of arbitration.
2. Procedures of prepare cotton standard boxes.
3. Recognizing working procedures in the imperative mills.
Cotton Research foundation Agriculture Research Center at Giza.
Textiles merge Fund.
Visit to a modern company for spinning and weaving.
Visiting Cotton Museum.

Page 19
Practical Training
Hand pulls staple length.
Egypt Extra Long & Long Staple variety.
Practical training on cotton categorization.
Upland cotton arrangement.
Relationship between the Egyptian cotton & upland cotton.
Estimating ginning out turn.
Recognizing Egyptian cotton grades.
Methods of measuring cotton fiber properties using usual instruments.
The commercial lab for filament testing.
Contamination Testing Labs.
Wetness Testing Lab.

Page 20
1.9 Technology Change and Modification
Modification of existing processes/tools or the purchase and system of new equipment
may be considered to reduce the utilization of process chemicals energy and water. As a
result of work approved out in the SEAM Project the option outlined in the following
sections are mostly suitable for Egyptian textile mills.
Shortening the Processing Time
Replacement of conventional jigger dye by pad-develop process for dyeing when
possible.
Elimination of middle drying (e.g. after dyeing of artificial component) in dyeing of
polyester/cellulose blend textile.
Carbonization of disperse-printed and fixed goods frankly without middle washing
and drying.
Use of one class of dyestuff for coloration of both machinery of p/c blends
fabrics.
Combination of Separate Processes
Single-stage bleaching: when conservative pre-treatment processes (e.g. desiring,
scouring and bleaching) are joint together to save energy (about 60%), chemicals,
water and time.
Combination of optical brightness and heat setting operation for artificial fibre-
fabrics. Combination of dyeing and finishing in one step where the finishing bath
comprise both the finishing agent (e.g. reactant resins), certain types of dyestuffs
(soluble vat, direct, reactive, pigment), additives (wetting agent and softener) along
with a appropriate catalyst. This in turn is reflecting on declining the pollution
load as well as total production cost.
Combination of finishing and transfer printing in one step for cotton/polyester
blends: when the dry heat of printing is utilized in curing the resin.

Page 21
Lower Temperature Dyeing, Printing or Finishing
Some of the textile processes can be approved out at lower temperature than are
conservatively used with useful usage of the process chemicals. These results in
reducing procedure of both the energy and process chemicals thereby lower the
pollution load. For example the following technique can be performed:
Use of red ox system (e.g. hydrogen peroxide/glucose, ammonium
persulphate/glucose) in combination with some dyes (e.g. acid, direct, basic) can
effect dyeing of certain substrates, such as wool, viscose, nylon, cotton, silk, etc.
at lower hotness than conservative dyeing.
Use of fast acting catalysts enables the fixation of stain prints at lower temperature
around 110o -115o C against 140o -150o C for conservative printing). Use of
highly active means systems (such as MgCl2.6H2O / citric acid) has a substantial
economy in operational and energy costs of resin finishing.
Low Wet Pick-up Technology
Low wet pick-up techniques are good-looking alternatives to conservative
processing methods in textile wet processing due to the high possible savings in
both energy and water. Many approaches are suggested for low wet pick-up
technique a selection of which follows:
Foam technology: where water is replaced by air in the form of foam in chemical
recipes and formulations. This helps to save power, decrease chemical costs,
increase manufacture and minimize effluents and pollution. Foam technology can
be useful in sizing, dyeing, printing and finishing processes. By suitable
combination of foam agents stabilizer and process chemicals the behavior process
can be easily achieved.
Spray technique: where sprays of strong solutions are applied to the goods to
achieve treatment such as dyeing and finishing. The use of electrostatic systems
was introduced by Sandoz to improve consistency and distribution.

Page 22
Use of high performance squeezers: to lower the wet-pick-up on the material or
yarns. These squeezers can be useful in sizing dye and finishing.
Vacuity extractors can also be used to lower the wetness content of a textile
material before it enters the dryer. These are most efficient on fairly porous
artificial materials.
Use of Heat Exchangers
Heat exchangers should be used mainly since reduction in water use means an increase in
overflow high temperature. The textile industry also needs to practice heat recovery to
avoid thermal shock to handling plants caused by hot wastewater effluent.
Radio Frequency Technique
In this technique radio-frequency (RF), e.g. micro-wave and Infra Red are use for
freshening loose stock letters and hanks that have been given opening or dyeing
treatments. This method is a commercial reality with verifiable cost energy and time
savings.
Computer Technology
Computer control and other forms of mechanization can be introduce to dyeing
processes in order to allow greater reproducibility and optimized use of dyes and
additives in dyeing formulations. The expansion of the necessary computerized control
systems will be costly but it has been report that it can be money-making within a
realistic time provided that the staffs are well trained and capable of increasing the
systems.
Solar Energy
Use of solar energy as an option for the conventional energy is a hopeful approach for
reducing energy use needed for heating at process water.

Page 23
1.10 New technology centre for the faculty of engineering
The Egyptian Prime Minister Dr. Ahmed Nazif opened the New Textile Technology
Centre situated in the campus of the Faculty of Engineering Cairo University in Sheikh
Zayed City on the 27th of May 2008. This is the latest knowledge center in this sector at
a national level. The response was attended by Mr. John Yates Medibtikar Programmed
Manager.
The centre is set up to provide the best utilization of factories equipments for spinning,
weaving and dyeing which were donate by the Ministry of Housing to Cairo University
as a part of the new property of the Faculty of Engineering in Sheikh Zayed City. These
equipments value is beyond 5 million Dollars.
During July 2006 an agreement was signed for collaboration with the Ministry of Trade
and Industry and the Industry Modernization Center. Through this agreement the
sufficient funds have been to be paid for the treatment of these labs and the international
adoption of their tests and training programmers to serve the Egypt industry and raise its
competitiveness.
This technical center represent a unique partnership between academic institution and
government agencies and self-governing and private sector where it is administer by the
Governing Council attended by the industrial leaders in both private and public in the
textile sector.
The Center‟s activities can be classified into main two sectors primary sector which is the
technology sector and the secondary sector which is the testing and value control for the
technical sector sections of textile spinning, weaving and dyeing. The testing and quality
control sector has a globally accredited laboratory which contains many devices that is
capable of performing arts the required tests for the fashion and textiles export.

Page 24
1.11. Egypt Textile Machinery Industry: Current scenario and future
Outlook
Egypt Textile engineering industry (TEI) is afraid the condition improved during 2010-11
with a better performance set up by the textile industry.
Capacity utilization TEI
As per the survey of the Textiles working group during 2008-09 the estimated annual
install capacity of TEI was Rs. 5065 crores. The total permanent production of textile
machinery parts & accessories during 2010-2011 recorded a raise of 35 per cent at Rs.
3563 crores as next to Rs. 2000 crores achieved during the earlier year.
Capacity deployment increased to 51 per cent in 2010-11 compared to 23 per cent in the
preceding year. Demand depression faced by the industry had severely affected capacity
utilization during the previous years. Capacity utilization might develop further during
2011-12.
Imports of textile machinery have rise from Rs. 3000 crores during 2009-10 to Rs. 35000
crores (approximate) during 2010-11.
Exports during 2010-11 had been approximate at Rs. 450 crores against Rs. 400 crores
achieve during 2009-10. With the overall development of the industry exports are
expected to develop in the coming years.
The welcome gush in demand from the textile industry during 2004-2007 had confident
TEI to develop and expand the machinery developed capacity. This was mostly so in the
spinning machinery sector. Units in the industry had been determined hard to step up
production and lengthen the delivery period. Due to the recessionary pressure in the
subsequent years the delivery periods were wiped out. At present demand is again

Page 25
looking up and it is our earnest attempt to meet the demand in quantum quality and show
coupled with effective after-sales service.
Current situation
The Government policy of encouraging composite mills during the 1960s, 1970s and
1980s and thereby relegating the weaving and processing industry to the decentralized
sector was a de facto support for low technology machinery. Further the earlier condition
policy of the Government in hosiery and garment industries resulted in creation of
small/low tech units, and also units were confident to undertake large-scale second-hand
machinery imports.
Even today the preference of a great section of the textile industry to imported second-
hand/used machinery is touching the growth of domestic machinery manufacturing.TEI
needs full support from the Government so that it has a level in performance field and
becomes aggressive enough to supply the latest technology machines to the textile
industry.

Page 26
2. Company Analysis
2.1 Textile Manufacturing Companies
Geographic Distribution of Companies in the Textile Sector
Spinning and
Weaving
Wool, Natural
and Synthetic
Dyeing,
Printing and
Tricot Ready-
Made
Governorate Manufacturin
g
Manufacturing Finishing Manufacturing garment
s
Cairo 132 21 35 301 277
Alexandria 4 10 17 151 72
El-Kaliobia 305 8 16 11 29
El-Gharbeya 128 18 3 15 11
Assyut 2 - - 2 1
El-Bohaira 19 3 2 - -
Beni-Suef 2 - - - -
Port Said 1 1 - 1 2
Giza 6 1 1 19 54
El-Dakahleya 21 - - 27 5
Dumyat 3 - - - 1
Sohag 2 1 - - -
El-Suez 1 - - - -
El-Sharkeya 2 5 2 3 7
Menofeya 3 3 1 1 1
The Egyptian textile industry is subject by 31 large public enterprises. The mass of these
are primarily occupied in spinning and weaving although many also carry out dyeing,
knitting, finishing and the manufacture of ready-made garments. These public companies
account for 100 of spinning, 70% of weaving, 40% of knitting and 30% of the complete
goods. They also control in terms of labor volume of production and owned capital. For
occurrence Misr for Spinning and Weaving is the largest venture in the country and
generate more than 25%.
Page 27
There are over 2300 private sector factory which are members of the Egypt Textile
manufacturer Federation (ETMF). There are also many small factory and workshops
who are not ETMF member as well as informal workers which are not integrated in any of
these groups. The private sector at present dominates the market in terms of knitted fabric
and ready-made goods. This incorporate information on the number of spindles,
number of looms, number of workers and the main products artificial at these companies.

Page 28
2.2 Top companies in Textile industry in India:
Bombay Dyeing
Fabindia
Grasim Industries
JCT Limited
Lakshmi Mills
Mysore Silk Factory
Arvind Mills
Raymond‟s
Reliance Textiles
Some details regarding these top players in the textile industry in India is given below:
Bombay Dyeing:
Bombay Dyeing came into continuation in the year 1879 as a small company trade with
Indian spun cotton yarn dip-dyed by hand and now the company has grown-up into one
among the top textile company in India. They are one of the trust and valued brand name
in the textile industry and some of the products artificial by them are:
Sports wear
Kids‟ wear
Women‟s wear
Men‟s wear
Home furnishing like sofa covers and screen clothes
Bath towels
Bed spreads and sheets

Page 29
Fabindia:
Fabindia is operating from its control center in Delhi and they are popular for their
customary techniques and hand-based processes. They are acting as a link between craft-
based rural producer and modern urban markets which in turn create a wide range of rural
service thereby preserving the custom of India. Their textile products are reasonably
priced, fashionable, craft-based and natural.
Grasim Industries:
Grasim Industries is a supplementary of the popular Adyta Birla Group and they are one
among the major private sector companies in India. The company began its journey as a
textile company in the year 1948 and now they are commerce with different products like
cement and chemical in calculation to textiles.
JCT Limited:
JCT Limited is one among the important manufacturers of filament yarn and textiles in
India and they are the supplementary of Taper Group. Some of their best features like
high normal of performance, work ethic and values have made this company to arrive at
this height.
Lakshmi Mills:
Lakshmi Mills came into survival in the year 1910 and this company has contributed to
the development of Textile Industry in Tamil Nadu in general and to the region of
Coimbatore in Tamil Nadu. Right from their beginning they are working towards their
prime objectives of customer approval and quality production and because of this they
have reach this height. The company is looked with great respect since it not only urban
itself but has also let ways for other company to develop in this sector.

Page 30
Mysore Silk Factory:
Mysore Silk Factory is located in the city of Mysore in Karnataka and they are commerce
with the production of quality silk textiles for end-user use. Different high end machines
are being used by them for the production of value silk clothes. The company began its
drive in the year 1930 with just 10 looms and now they have 159 looms, pirn machines,
warping machinery and several other preliminary machines as well.
Arvind Mills:
Arvind Mills is acting as trendsetting company in different styles of textiles and they are
now acting as the same of a wide range of life-style goods. The company has carved out
of a forceful strategy to develop their current strategy by setting up world scale
garmenting offering and facilities.
Raymond’s:
Raymond‟s group came into continuation in the year 1925 and within a short period of
their organization they have emerged as a global name in the textile industry. A number
of Group Company is operating under Raymond‟s and some of their accepted brands are:
Color Plus
Park Avenue
Manzoni
Raymond Premium Apparel
Reliance Textiles:
As we all know, Reliance is a big name in a number of industry in India and they have
made their mark in the textile industry as well. Their flagship Vimal, which was re-
launched in the year 2007-08, is one among the trust brand name in the textile industry.
They are acting as one among the top modern textile complex in the whole of Asia and
they are trying out new product plan which includes the following products:

Page 31
Production of Mosquito revolting nets according to the normal laid by World
Health Organization
Auto-textiles & home furniture
Water-repellent and fire-retardant tent fabric to help out police and security
service
These top groups of actors in the textile industry add a great to the development of the
country‟s economy by contribution to the export industry of the country and by
contribution wide range of employment opportunities.

Page 32
3. Comparison of India and Egypt textile industry
3.1 Weaknesses and Opportunities of Egypt
Compared to public companies many private companies are very dynamic they put
together new technologies develop a network of retail businesses counting abroad and
achieve excellent export results.
The special agreement with Europe and QIZs Agreement with the United States are
significant factors that support the exports. Besides the creation of distant companies
(India, Chinese.) in many free zones, the strong domestic bazaar and the state supported
Research and Development activities are among the other factors that help expand the
sector.
However the industry faces many confront due primarily to the comparatively new
renaissance witness by the sector on the one hand which require the formation of the
necessary means to take action to its expansion needs in terms of training and technical
help in order to increase productivity and to the relatively nonexistent rivalry in the
public sector on the other hand.
The main problems though facing Egypt textiles are more internal and structural than
external. Earlier Nassir‟s completion of “socialist” statist policies made Egypt firms
mutually respectful overstaffed and with poorly skilled workers state industry have been
slow in adapting to technological changes including the completion of computers and
software.
The result of these structural weaknesses is that despite Egypt‟s low wages the state
industry outputs prices have remain relatively high. The private firms that do exist are too
trivial to make up for the weaknesses of the public sector and have not done a improved
job than the public sector industry in implement and updating technologies which

Page 33
Suggests that privatization might not always be the magic answer at least when not
accompany by more radical political reform.
Industry is subject by family enterprise structure. There are many projects to develop
essentials of the improvement system. However, they have been slow to take-off and they
look to be subjugated by „real-estate‟ logic.
The country‟s global profile has better hence hopeful foreign investments, the possibility
of repatriating invest capital and profits, tariff cuts, corporate tax reform, support of
exports, creation of special fiscal free trade zones and protection of academic property. It
is hoped that additional privatisation will lead to a further add to in foreign investment in
Egypt.
Some companies such as ORASCOM are very big and are forcefully increasing on a
global basis in the region. Expansion of new manufacturing areas and IT focus offers
room for growth.

Page 34
Weakness and Opportunities of India
Knitted clothes manufacturing has remain as an extremely fragmented industry. Global
players would favor to source their entire responsibility from two or three vendors and
the Indian garment units find it tricky to meet the capacity necessities.
Industry still plagued with some past regulations such as knit garments still remaining as
a SSI domain. Labor force giving low output as compared to other competing countries
Technology obsolescence despite measures such as TUFS, Low bargain power in a
customer-ruled market.
India gravely lacks in trade pact memberships which lead to limited access to the other
major markets. Indian labor laws are relatively adverse to the trades and there is an urgent
need for labor reforms in India.
Low per-capita domestic consumption of textile representative important potential
growth Domestic market very sensitive to fashion fads and this has resulted in the
development of a reactive garment industry.
India's global share is just 3% while China controls about 15%. In post-2005 China is
expected to capture 43% of global textile trade. Company need to think on new product
developments. Increased use of CAD to develop scheming capabilities and for rising
greater options.
The textile industry is undergo a most important reorientation towards non-clothing
application of textiles known as technological textiles like thermal defense and blood-
absorbing materials seatbelts paste tape and multiple other particular products and
applications. These technological textiles are an emerging industry with a possible to
reach a size of US $ 127 billion in 2010 and hold a great assure for Indian textiles
industry.

Page 35
3.2 General features of the access to the Egypt and Indian
market
Operator characterizes Egypt as a much stopped market. For example Spanish operator
describes the Egyptian market as being as closed as the Pakistani and Indian markets (in
interview). Few barrier are mention but they are complex and important some operators
stress their inability to export to Egypt (embargo or intolerable tariff barrier) while others
who do export are facing important technological barriers which also hamper (or stop)
their exports (labeling and production necessities for import). As a Mediterranean partner
of the EU Egypt is in a specific position.
Operators characterize India as one of the most limited market for their exports. Given
the low level of current exports their information on the trade barriers is quite limited.
The assignment in India established the subsistence and impact on the following trade
events high customs duties and additional import taxes onerous clearance official
procedure. However the SIL licensing system was found to be less warning than
operators claimed. In adding the realization of marking rules which are warning does not
come into view for the time being as a trade barrier.

Page 36
3.3 Domestic structure of the textile and clothing industry in
Egypt and India
Textile and clothing sector is of high significance for Egyptian economy and service.
Employ of the sector covers about 1 Mio personnel and accounts for 30% of Egypt total
manufacturing labor force 44. The sector is composed of 31 public enterprise and about
2356 private enterprises registered and members of the Egypt Textile Manufacturers
Association. In addition there are thousands of small factories and workshops.
Most of the domestic productions distributed on the domestic market even if exports have
continuously increased. Since the early 60‟s textile sector was limited to public
companies. Textile companies had to fulfill government supplies and to provide low price
products for domestic consumption. For years the industries was affected by this
production process and suffer from lack of technological innovation. From the 1980‟s the
Egypt textile industry was progressively privatized but still suffer from trade limits on
textile imports and machinery.
In the 1990‟s the textile sector was mainly affected by the General restructuration plan of
the economy (ERSAP) as well as other unsettled problems such as high level of
smuggling and increased price of energy. Public companies were not able to adjust. They
currently suffer from increases in their debts decline of their financial status deficiency in
their current accounts and low investment. Privatization is still under way and must be
achieve by the year 2000.
The textile and clothing sector is of vital significance for the Indian economy employment
and exports. It is based mostly on two raw materials cotton and jute. About Mio Workers
are employed in the sector. The textile industry urbanized significantly over the last 15
years in terms of capacity yarn produce and cloth output. Indian industry is facing some
problems.

Page 37
3.4 Egyptian Textile Imports and Exports
Exports
In 2009 Egypt‟s total exports were EGP 6.87 bn1 or US$ 1.2 by 75% (US$ 0.98) of
exports leaving to garments. Approximately 45% of total exports went to the US and
45% to the EU. Garments are the main product imported by both the EU and the US
though the EU had 13% of its imports in yarns as opposite to 3% for the US and 5% in
fabrics as opposed to 2% for the US explanation the turn down in the exports of yarns
and fabrics (reviewed later in the report) in light of the decrease in the European textile
industry. With 90% of exports going to the EU and the US Egypt is barely benefit from
its regional trade agreement and nearby markets intense both raw materials (yarns and
fabrics) and finished products. Home textiles which are mainly put on from Egyptian
cotton characterize 12% of total exports confirm the fact that Egyptian cotton is yet to be
capitalized on in Egypt‟s plans for increase
Imports
In the period from 2005 to 2009 total textile imports greater than before by 1.7 folds.
Problem and temporary admission imports stood at EGP 0.85 bn in 2009 presentation an
increase of 15% from 2008. Several comments have been made by the manufacturing
concerning informal imports, however by scheming per capita use of affirmed fibers
which is equal to 4.7 kg/person and the average per capita consumption of comparable
75%
12%
8%2% 3%
Garments
Home Textiles
Cotton Yarns
Cotton Fabrics
Textiles
Page 38
countries (Africa Middle/East and Asia) 3.5 – 4.5kg/person, it is possible that the
problem of illegal imports is not as important as is commonly believed. Having said that,
extra research is being undertaken to verify these conclusion and further understand the
actual size of smuggling difficulty.
Indian Textile Imports and Exports
Exports
The target for textiles exports for 2012-13 at first set at USD 38 billion have been
revised upwards to USD 40.50 billion following the Foreign Trade Policy Annual
addition in June 2012. The export Council-wise targets are (i) Apparel Export Promotion
Council (AEPC) ± USD 18.00 billion (ii) The Cotton Textiles Export Promotion Council
(Texprocil) & The Power loom Development Export Promotion Council (PDEXCIL) ±
USD 9.00 billion (iii) The Synthetic & Rayon Textiles Export Promotion Council
(SRTEPC) ± USD 7.00 billion (iv) Export Promotion Council for Handicrafts
(EPCH) ± USD 3.30 billion (v) Handloom Export Promotion Council (HEPC) 0.40
billion (vi) Wool & Woolens Export Promotion Council (W&WEPC) ± 0.75 billion
(vii) National Jute Board (NJB) ± 0.50 billion (viii) Carpet Export Promotion
Council (CEPC) ± 1.05 billion (ix) Indian Silk Export Promotion Council (ISEPC) 0.50
billion.
Imports
The total imports of T&C products by India reach US$ 4.94 billion during the
almanac year 2011 Man-made filament was the biggest import between T&C items,
with a share of USD 0.78 billion followed by impregnate amongst T&C items with a
share of USD 0.78 billion followed by impregnate textile fabric (USD 0.74 billion) and
man-made staple fiber with a share of USD 0.54 billion. The imports have greater than
before by 26.08% during the calendar year 2011 in dollar terms over the matching period
in calendar year 2010.

Page 39
3.5 Vision and objectives of an Indian textile industry
(2007-2012)
To build world class, state-of-the-art, developed capacity and achieve a main global
standing in produce and export of textiles and clothing.
To ensure the growth of the Indian textile industry at 16 percent per annum in value
terms, to US$ 115 billion by the end of the Eleventh Five Year Plan.
To secure a 7 percent share in worldwide textile trade by the end of the Eleventh Five
Year Plan. To equip the textile industry to endure the pressures of import diffusion
and maintain supremacy of the growing domestic market.
To enable Small & Medium enterprise (SMEs) to achieve competitiveness to face the
global situation with confidence. To provide a conducive policy setting which will
give confidence innovation, augment R&D efforts, and improve output through the
up gradation of technology manufacturing process and the development of human
resources. To set up the Indian textiles industry as a creator of globally competitive
value added products.
OBJECTIVES
To have sustainable growth and progress of Textiles Sector in the country.
Overall capacity adding in the Textile Industry to be greater than before by 10% per
year. Aim at overall fibre manufacture growth rate of seven percent per year. Get
overall cloth production growth rate of 9% per year.
Achieve textiles and attire developed growth rate 10% per year. To achieve textiles
and apparel export expansion rate of 15% per year.
To improve output across the entire textiles value chain.
To achieve comprehensive growth by improving productivity in handlooms,
handicrafts and sericulture and by ensuring interests of weavers and handicrafts
artisans.

Page 40
To ensure included development and support of jute sector. Jute production to grow
at 3.6% per year.
To expand Sericulture & Silk Sector.
Raw silk production targeted to grow at an annual average rate of 4.5% during 2010-
15
To promote Growth and expansion of technical textiles in India.
Production of technical textile to grow at 11% per year till 2012-13 and thereafter at
6-8% per year till 2020.
To expand Wool & Woollen Textiles Sector. Wool production to grow 1% per year.
To develop and change the decentralized Power looms Sector. Power loom cloth
manufacture under attack to grow at 10% per year.
Vision and objectives of an Egypt textile industry (2007-2012)
Vision Be the Hub in Textiles teaching and Technology Transfer for Global
Competitiveness. To equip the textile industry to endure the pressure of import
access and maintain dominance of the rising domestic market.
Objectives
Demand Based progressing Education and particular Training.
Establish Industry Linked credited Testing/Analysis Lab.
Create expertise Transfer Focal Point Based on Needs.
Unite consult Services from FECU and capital in Unique combined Project.
Network Domestic and global Expertise to Serve the Industry

Page 41
4.1 Relations of India-Egypt
India and Egypt are two of the world's very old civilization with a history of close
contact. India and Egypt enjoyed a very close relationship during the Nehru-Nasser era
and signed a Friendship Treaty in 1955. The birth of the Non-Aligned group was inter
alia the result of this association. Since the 1980s, there have been four Prime Ministerial
visits from India to Egypt: Sheri Rajiv Gandhi (1985); Shri P. V. Narasimha Rao (1995);
Sheri I. K. Gujral (1997); and Dr Manmohan Singh (2009). Prime Minister Dr
Manmohan Singh participated in the XV NAM meeting held in Sharm EI-Sheikh in July
2009.
Egypt President visited India in 1982, in 1983 to attend the NAM Summit and in
November 2008 on a two-sided visit during which the follow documents were signed
exile Treaty conformity on elimination of visa obligation for holders of diplomatic
special and official/service passports MoU on Cooperation in the ground of Health &
Medicine MoU on collaboration in the examination and Use of Outer Space for Peaceful
Purposes MoU on Trade & technological collaboration.
High level exchanges with Egypt continued after the Egyptian Revolution and the
Egyptian Government under the Supreme Council of Armed Forces showed keen interest
to continue close relations with India; since March 2011 three Ministerial visits have
been exchanged with Egypt. Since 2006, several high-level visits have been exchange
between India and Egypt. From the Egypt side Minister of State for Military Production
Minister of infrastructure and IT Minister of State for Administrative Development and
the overseas Minister (2006) the Minister of Social commonality and Minister of
Tourism(2007) Minister of Trade & manufacturing Minister of Agriculture & Land
recovery and Minister for global Cooperation (2008) a allocation from the High Election
charge Minister Trade & Industry to add in the WTO Ministerial Meeting and Minister of
power & Energy (2009) and Foreign Minister (2011).

Page 42
Egypt has usually been one of India's most important trading partners in the African
continent. The India-Egypt Bilateral Trade union has been in operation since March 1978
and is based on the Most Favored Nation clause. Two-sided trade has grown significantly
in past five years. Since FY 2006-07 India has been in the middle of the top five
importers of Egypt products.
This is mostly on account of import of oil and gas from Egypt. Exports from India to
Egypt greater than before from USD 0.43 billion in FY 2006-07 to USD 1.49 billion in
FY 2010-2011. Indian imports from Egypt greater than before from USD 1.53 billion in
FY 2006-07 to USD 1.65 billion in FY 2010-11. The Bilateral Investment Protection
Agreement between India and Egypt entered into force in November 2000. India has a
total investment of approximately USD 2.5 billion in about 50 companies/ projects. More
importantly Indian speculation in Egypt has not been unfavorably affected by the Egypt
Revolution.
In fact some Indian company started in 2011 new production services in Egypt. Egypt
investment in India is about USD 30 million by El Sewed group an Egyptian company
manufacturing Electric meters in India.
Out of the 50 Indian companies operating in Egypt approximately 25 companies are joint
ventures and wholly owned Indian subsidiary. The rest of the Indian companies are in
service in Egypt through their delegate offices and executing various projects for
Government of Egypt and Governmental organizations. The Indian companies are in
service in almost all fields like textiles and garments, power, chemicals including
specialty chemical, adhesives, pharmaceuticals, information technology, paints,
consumer goods, healthcare, PVC, caustic soda, PET Resin, plastics, paper, packaging.
Indian company is providing direct and indirect service to approximately 35000
Egyptians. The direct employment generate by Indian companies is more than 21200 and
not direct employment more than 13500.

Page 43
4.2 India and Egypt Economy Relations
Occupy the northeast corner of the African continent Egypt is bisecting by the highly
fertile Nile valley where most financial activity takes place. Egypt's economy was highly
central during the rule of former President Gamal Abdel NASSER but has opened up
significantly under former President Anwar EL-SADAT and current President Mohamed
Hosni MUBARAK. Cairo from 2004 to 2008 aggressively pursued economic reforms to
draw foreign investment and facilitate GDP growth, which averaged about 7% per year.
The global financial crisis slows the reform efforts.
The budget deficit climb to over 8% of GDP and Egypt's GDP growth slowed to 4.6% in
2009, predominately due to summary growth in export-oriented sectors including
developed and sightseeing and Suez Canal revenues. Egypt's economy was particularly
hard hit with slowing production and a decrease in exports amid the unrest that followed
the passive revolution and a sharp fall in tourism revenue which is a main source of
foreign currency for Egypt. The Egyptian financial system grew 2.2 per cent in the
previous 2011/12 fiscal year.
The World Bank has predicted the economy will get bigger by 2.6 per cent in 2012/13. In
2013 however the IMF estimates Egypt‟s economy will produce by 3.3 percent. Egypt‟s
rise however, is seen to oppose the inflation trend of its neighbors rise is projected to
surge to 12.1 percent in 2013 up from 11.1 percent in 2011.
Bilateral Relations
India and Egypt are two of the world's ancient civilizations with a history of close
contact. Egypt has traditionally been one of India's most important trading partners in the
African continent. The India-Egypt Bilateral Trade Agreement has been in operation
since March 1978 and is based on the Most Favored Nation clause. Bilateral trade has
grown significantly in past five years. Since FY 2005-06, India has been among the top
five importers of Egyptian products.

Page 44
India has emerged as one of Egypt‟s largest deal partners. Nearly 95% of Egypt‟s exports
to India comprise oil and gas. Coking coal raw cotton, rock phosphate, and marble
comprise the other import items. The detailed trade figures on our trade with Egypt
(given below) give an idea of the scope that exists in this market. The two-way trade
between India and Egypt has exposed significant growth in new years. In fact, it has
grown more than 60 percent during the last five years from US$ 3384.35 million in 2007-
08 to US$ 5430.05 million in 2011-12.
India‟s exports to Egypt have full-grown almost 80% from about US$ 1398.83 million in
2007-08 to US$ 2421.89 million in 2011-12. Egypt's exports to India throughout these
years have grown approximately 50% in last 5 years to US$ 3008.16 million in 2011-12.
The trade balance continue to be in Egypt‟s favor though India‟s exports are also rising as
well
.
Financial
Year
Total Exports
to Egypt
US $ Million
Total Imports
from Egypt
US $ Million
Total
Trade
US $ Million
2007-08 1398.83 1985.52 3384.35
2008-09 1699.86 2121.33 3821.19
2009-10 1403.88 1692.36 3096.23
2010-11 1982.43 1354.56 3336.99
2011-12 2421.89 3008.16 5430.05
India and Egypt are making robust efforts to renew and strengthen the bilateral economic
and trade relations. The relationship between the two countries has evolved into a
significant partnership in the economic and commercial sphere. At the same time, Indians
have emerged as important investors in the Egypt, and India as an important export
destination for the Egypt manufactured goods.
Page 45
Trade in the current year
During the current financial year i.e. April-Sep, 2012-13, exports are to the tune of US$
1414.61 million whereas the imports from Egypt are to the tune of US$ 1391.39 million.
The total trade is US $ 2806 million.
Top items of Exports from India:
The principal Indian export items include crude oil, LNG, raw cotton, rock phosphate,
coke and semi-coke of coal.
Top 5 items of Imports by India:
The top Indian imports during 2011-12 were, cuts of boneless bovine frozen meat, diesel
fuel, two & three wheelers, cotton/synthetic yarn, carbon electrodes.
Indian Companies in Egypt
1. Alexandria Carbon Black
2. Alexandria Fiber Co.
3. TCI Sanmar
4. SCIB Chemicals (Asian Paints)
5. Oberoi Hotels
6. Egyptian Indian Polyester Company (EIPET),
7. Flex P Films(Egypt) SAE
8. Dabur Egypt Limited
9. Galaxy Chemicals(Egypt) SAE
10. Essel Propack Egypt
11. Kishco & Khodeir Paper Mill
12. Auto Tek Valves
13. WIPRO Information Technology (Egypt) SAE
14. Kirloskar Egypt
Page 46
15. Egypt Global Silicates
16. Nile Tex
17. Amereya For Plasticizers
18. Ranbaxy Egypt Limited
19. Marico Egypt
20. MEL Consumer Care, (Marico)
21. Egyptian Carton Manufacturing Co.
22. Indo-Med Company for Garments
23. Velocity Apparelz
24. Pidilite Industries Egypt
25. Klac Creations Garments Factory
26. Misr Hytech Seeds
27. Britlodge Holdings Ltd.
28. Ashok Leyland
29. Gujarat State Petroleum Corporation Ltd (GSPC) Egypt
30. Allied Exports
31. Essar Global Limited
32. Joher International
33. Forbes Marshall
34. Sutherland Global Services
35. State Bank of India
36. Air India
37. Bavarian Auto
38. TATA Motors
39. Kernex Microsystems
Page 47
Conclusion
The textile industry is one of the oldest in the world. Today the textile part in Egypt
consists of well over 3000 company range from the very small (employing less than 8
laborers) to the very large (greater than 20000 laborers). These are both public and private
sector companies.
Commonly used raw materials include: Natural fiber based on cellulose (e.g. cotton,
flax, jute, hemp etc.) or protein (e.g. wool, and silk).
Technological progress in all the sectors of the country has changed the entire socio-
economic situation. Particularly in the textile sector there is a lot of technological
development on Distribution and communication channels, Technology incentive,
Computerization, Rate of technological change, Environmental and natural aspect,
Barriers to entry, Production level and Outsourcing decision.
The Government of Egypt will soon begin steps to protect its local textile industry
there are better performance in textile industry.
The Egyptian Prime Minister Dr. Ahmed Nazif opened the New Textile Technology
Centre situated in the campus of the Faculty of Engineering Cairo University in
Sheikh Zayed City on the 27th of May 2008. This textile technology centre campus
established better performance of next year to year working condition.
Egypt Textile engineering industry (TEI) is the condition improved during 2010-11
with a better performance set up by the textile industry.

Page 48
To build world class, state-of-the-art, developed capacity and achieve a main global
standing in produce and export of textiles and clothing industry.
To equip the textile industry to endure the pressure of import access and maintain
dominance of the rising domestic market.
India‟s exports to Egypt have full-grown almost 80% from about US$ 1398.83 million
in 2007-08 to US$ 2421.89 million in 2011-12. Egypt's exports to India throughout
these years have grown approximately 50% in last 5 years to US$ 3008.16 million in
2011-12. The trade balance continues to be in Egypt‟s favor though India‟s exports are
also rising as well.
Operator characterizes Egypt as a much stopped market and Operators characterize
India as one of the most limited market for their exports.
Textile and clothing sector is of high significance for Egyptian economy, service and
the textile and clothing sector is of vital significance for the Indian economy
employment exports.

Reference
httpwww.indiantextilemagazine.inuncategorizedindian-textile-machinery-industry-
current-scenario-and-future-outlook
httpwww. http://www.tmmaindia.net/report/c-strategy-
httpwww.unido.orgwhat-we-docross-cutting-issuessouth-south-cooperationinitiative-on-
cottonegypt.html
egyptian govt to introduce steps to protect textile industry document in word file to
online source used
httpimages.library.wisc.eduHumanEcolEFacsMillineryBooksMBEllsworthTextilesrefere
ncehumanecol.mbellsworthtextiles.i0009.pdf
httpwww.ripecap.netUploads463.pdf
httpwww.Training program on Fiber Technolog.pdf
http://www.ficci.com/international/75182/Project_docs/India-Egypt-Economic-
Relations.pdf
http://www.mea.gov.in/Portal/ForeignRelation/Egypt-January-2012.pdf
www.egypt.com
www.india.com
http://texmin.nic.in
www.egyptministry.com
v.

A
Global Country Study Report
On
“The Role of Economical & Technological Environment of Egypt”
In the Partial Fulfillment of the Requirement
Of the Award of the Degree of
Master of Business Administration
In
Gujarat Technological University
Semester III (2011 – 2013)
Submitted By:-
Name Enrollment No.
Atish S. Shah 117240592003
Jacky P. Shah 117240592007
Harshit B. Shah 117240592011
Guided By:-
Dr. Hiteshkumar Shah
Asst. Prof. KSMCS
Submitted To:-
K. P. Patel School of Management & Computer Studies
Jeevanshilp Campus, Kapadwanj.
Affiliated To
Gujarat Technological University
I
Students’ Declaration
We Atish Shah, Jacky Shah & Harshit Shah hereby declare that the report for
Global Country Study Report entitled “The Role of Economical & Technological
Environment in Egypt” is a result of our own work & our indebtedness to other work
publications, references, if any have been duly acknowledged.
Place: - Kapadwanj
Signature:-
Date: - 19th Nov. 2012.
Atish S. Shah
Jacky P. Shah
Harshit B. Shah

II
Preface
“Experience is the best teacher.” This saying has played a guiding role in
including as a part of the curriculum of the M.B.A Programs of the Gujarat
Technological University. Quite frequently these days’ people talk of practical
knowledge, both in academic institutions and outside. At each and every aspect in life we
require some sort of theoretical and practical knowledge. It means only classroom lecture
may not be enough to get the proper knowledge either in the business field or social life. This
global country report on various PESTAL Analysis of Egypt in Semester -3 would allow us to
know the various environmental factors study and how to interlink that county or to interpret
the study in our countries context, and it allow the student study real Business Environments.
We know that Project is for the development and enhancement of the
knowledge in this particular field. It can never be possible to make a mark in
today’s competitive era only with theoretical knowledge when industries are developing
at global level, practical knowledge of administration and management of business is
very important. Hence, such kind of platform is of great importance for a student and full
efforts should be made to capitalize on it.
With a view to expand the boundaries of thinking, we have undergone Global
Country Study Report (GCSR) in second year of MBA (sem-3) .We have made deliberate to
collect the required information and fulfill project objective.

III
Acknowledgement
Any work accomplishment is seldom on person achievement there are usually
many people behind it who contribute to its goodness in form or the other. To
acknowledge is very great way to show your gratitude towards the people who have
contributed in your success in one or other way.
We find words inadequate to express our gratitude to Mr. Hitesh Shah (Asst.
Professor) for providing us an opportunity to carry out our Global Country Study Report
(GCSR) for his continuous guidance and supervision and support during the project. We
sincerely thank him, despite his tight schedule spared time for discussions and gave basic
ground rules and directions, without which completion of this project would have been
impossible.
We are highly grateful to the management of K. P. PATEL SCHOOL OF
MANAGEMENT for giving us the opportunity to work on this Project and in the process
enriches ourselves with immense learning on all aspects.
At last but not the least we also express our feeling of gratefulness to all those who
directly or indirectly have inspired us and helped us to prepare this report.

IV
Executive Summary
Egypt's Economical & Technological system here refers to the economical &
technological structure, GDP, inflation rate, consumer index, technological changes &
diffusions that are implemented in Egypt's mainland and regulate the state power,
government, and the relationships between the state and society in the People's of Egypt since
its founding. This report contains both economical and technological situation in Egypt
country the objective was to find the opportunity of business & most successful sector of
Egypt. The aim was to go through this report how the different business of different
sectors runs in Egypt and what government policy and political situation are benefited to
Indian country. As per the report the economical & technological situation is having well
for Indian business. Project work helps to deal with the real government policy and party of
different country like Egypt. Project report consists of the brief description of an Egyptian
economical tradition, different technological principal in Egypt, and also constitutional frame
work of Egypt section which provide the overview and background information about the
country different aspects, other section of the report like different economical condition the
market for science and technology and different trade business of Egypt. The graph provides
different information like GDP, CPI, Inflation rate, government budget and annual
growth rate on central government these are very useful to assume or forecast how the
Egyptian economical and technological situation are strong for developing the business
opportunities for India any developed sector.
Macro economics enriches our knowledge of the functioning of an economy by
studying the behavior of national income, productivity, investment, savings and
consumption. Furthermore, it throws much light in solving the problems of joblessness,
inflation, economic instability and economic growth. The concept of stock and flow are
mainly used in the macro economics or in the theory of income, productivity and
employment. Lastly, both the concepts of stock ad flow variables are very significant in
modern theories of income, interest rate, business cycles etc.
In 2009, the globe found itself in the most horrible economic recession while the
2nd
World War, with GDP growth dropping to a negative 1.9% after the 4.0% in 2007 and
2008 respectively. The key reason in this decline was the vice-chief meltdown and
associated credit crunch which originated in the USA, but then spread to the rest of the
world. This resulted in a loss of confidence, tight credit, declining demand, reduced
spending and investment, declining property prices and significant job losses worldwide.
The impact of the recession was felt most acutely in the advanced economies of
the world, despite unprecedented fiscal and monetary stimulus measures instituted by
governments to ameliorate the consequences of the credit crisis.

V
During the fourth quarter of 2009, the Egypt economy started emerging from the
recession that had started in the same period a year earlier. In this quarter the year-on-year
decline in economic activity of advanced economies was only 0.7%, compared to 4.6% in
the first quarter. It is expected that positive growth will be recorded from the first quarter of
2010, with most major developed economies participating in this turnaround. However,
recovery will be slow – economic growth of about 2.0% is expected in this economic
grouping in 2010.
Although not impervious to conditions in advanced economies, emerging
economies fared significantly better in 2009. Egypt and India did particularly well, with the
latter recording a GDP growth rate of 4.6% in 2009 & 5.1% in 2010.
Commodity demand depended increasingly on economic growth in Egypt and, to
a lesser extent, other emerging economies in 2009. Expansion in Egypt slowed only from
9.6% in 2008 to 8.7% in 2009, mainly from decreasing international trade. In line with
developed countries, Egypt also injected massive stimulus into the economy in the form of
fiscal, monetary and fixed investment measures to arrest the decline in economic activity.
These measures proved very effective, with GDP growth accelerating from 6.2% in the first
quarter of 2009 to 10.7% in the fourth.
In the world as a whole economic growth is forecast to recover to 3.2% in 2010,
compared to a trend growth rate of 3.5% to 4.0% in the period preceding the recession. The
key risks to the global economy in 2010 are viewed as further weakness in consumer demand
due to high unemployment, premature tightening of fiscal and monetary policy, a sharp rise
in oil and other commodity prices, and further failures of large financial institutions. At the
same time, the impact of stimulus measures will start waning. A combination of some of
these factors could cause renewed negative global growth, leading to a w-shaped growth
profile. The latter prospect is viewed as an uncomfortably high risk by many analysts. The
possibility that pervasively low short-term interest rates could lead to the development of
more asset bubbles, particularly in emerging economies, is also viewed as a risk.
Due to declining economic activity, infrastructure bottlenecks in terms of electricity
supplies and transport and harbor capacities, as well as the shortage of skilled and
experienced human resources, eased temporarily in 2009. Increasing economic activity in
2010 will put renewed pressure on these infrastructure components. With regard to export
logistics through the Richards Bay Coal Terminal, rail capacity remained a serious problem
even during the recession.
Egypt’s inflation rate fell in September to the lowest level in at least two years as the
economy struggles to rebound from the uprising that ousted President Hosni Mubarak last
year.

VI
Inflation in urban areas, the gauge monitored by the central bank, slowed to 6.2
percent from 6.5 percent in August, the official statistics agency said. It was the lowest
inflation rate since Aug. 2010 when Bloomberg started to track the current series. Consumer
prices rose 1.2 percent from the previous month.
“This confirms that the level of private spending is reduced, and is outweighing the
impact of higher oil prices.” Mona Mansour, co-head of research at Cairo-based investment
bank CI Capital Holding, said by phone.
The inflation rate was less than CI Capital’s 6.7 percent forecast.
Clothing and footwear prices rose 2.9 percent from the year-ago month. Housing and
utility prices rose 2.7 percent, that’s less than half August’s 6.7 percent. Food and beverage
prices, the biggest component of the consumer price index, increased 9.3 percent from a year
earlier after gaining 8.2 percent in August.
Oil prices have gained 10 percent this year. The U.S. benchmark oil, West Texas
Intermediate, slipped 36 cents to $92.03 a barrel on the New York Mercantile at 8:21 a.m. in
London.
Economic growth in Egypt fell to 1.8 percent in 2011, a 19- year low, and a median
estimate of 13 analysts compiled by Bloomberg shows gross domestic product is expected to
expand 2 percent this year. International reserves have fallen to $15 billion, or more than 50
percent below their levels in the month before the start of the January 2011 uprising.
Egypt is facing the Middle East’s widest budget deficit, and officials have said they
are seeking to secure a $4.8 billion International Monetary Fund loan this year.
Thus from the whole study we can summarise as Egypt’s Economy ranked 27th
in the
world economies having the currency as the Egyptian pound (EGP).
According to WTO statistics, the Egypt’s some Economic data for 2012 are as
follows:-
GDP: $525.6 billion (2011 est.).
GDP growth: 1.8% (2011).
GDP per capita: $6,200 (PPP) (2010 est.).
GDP by sector: Agriculture: 13.5%; Industry: 37.9%; Services: 48.6% (2010 est.).
Inflation (CPI): 12.8% (2010 est.).
Population: below poverty line 20% (2005 est.).

VII
Gini coefficient: 34.4 (2001).
Labour force: 26.1 million (2010 est.).
Labour force by occupation: Agriculture (32%), Industry (17%), Services (51%) (2001
est.).
Unemployment: 11.9% (2010 est.).
Main industries: Textiles, Food Processing, Tourism, Chemicals, Pharmaceuticals,
Hydrocarbons, Construction, Cement, Metals, Light Manufactures.
Ease of Doing Business Rank: 110th.
External Exports: $25.34 billion (61st; 2010 est.).
Export goods: Crude oil and Petroleum products, Cotton, Textiles, Metal Products,
Chemicals, Agricultural goods.
Main export partners: United States 7.95%, Italy 7.26%, Spain 6.78%, India 6.69%, Saudi
Arabia 5.53%, Syria 5.3%, France 4.39%, South Korea 4.27% (2009).
Imports: $46.52 billion (47th; 2010 est.).
Import goods: Machinery and Equipment, Foodstuffs, Chemicals, Wood products, Fuels.
Main import partners: United States 9.92%, China 9.63%, Germany 6.98%, Italy 6.88%,
Turkey 4.94% (2009).
FDI stock: $72.41 billion (31 December 2010 est.).
Gross external debt: $30.61 billion (31 December 2010 est.).
Public finances: Public debt: 83.4% of GDP (2011 est.).
Revenues: $46.82 billion (2010 est.).
Expenses: $64.19 billion (2010 est.).
Credit rating: B+ (Domestic), B+ (Foreign), B+ (T&C Assessment Standard & Poor's).
Foreign reserves: US$18.300 billion (December 2011).
Main data source: CIA World Fact Book
All values, unless otherwise stated, are in US dollars

VIII
Thus, The economy of Egypt was highly centralized under President Gamal Abdel
Nasser. In the 1990s, a series of International Monetary Fund arrangements, coupled with
massive external debt relief resulting from Egypt's participation in the Gulf War coalition,
helped Egypt improve its macroeconomic performance. Since 2000, the pace of structural
reforms, including fiscal, monetary policies, privatization and new business legislations,
helped Egypt move towards a more market-oriented economy and prompted increased
foreign investment. The reforms and policies have strengthened macroeconomic annual
growth results which averaged 5% annually but the government largely failed to equitably
share the wealth and the benefits of growth have failed to trickle down to improve economic
conditions for the broader population, especially with the growing problem of unemployment
and underemployment among youth under the age of 30 years. A youth protest demanding
more political freedoms, fighting corruption and delivering improved living standards forced
President Mubarak to step down on 11 February 2011. After the revolution Egypt’s foreign
exchange reserves fell from $36 billion in December 2010 to only $16.3 billion in January
2012, also in February 2012 Standard & Poor’s rating agency lowered the Egypt’s credit
rating from B+ to B in the long term.
The most emerging sector now - a - days in the Egyptian economic is ICT Sector as
the following lines so, the Egyptian information and communications technology sector has
been growing significantly since it was separated from the transportation sector. The market
for telecommunications market was officially deregulated since the beginning of 2006
according to the WTO agreement.
The government established ITIDA through Law 15 of the year 2004 as
governmental entity. This agency aims at paving the way for the diffusion of the e-business
services in Egypt capitalizing on different mandates of the authority as activating the
Egyptian e-signature law and supporting an export-oriented IT sector in Egypt.
The cellular phone market was a duopoly with prices artificially high but witnessed in
the past couple of years the traditional price war between the incumbents Mobinil and
Vodafone. A 500 minutes outbound local and long distance calling plan currently costs
approximately US$30 as compared to approximately US$ 90 in 2005. While the current price
is not so expensive, it is still above the international price as plans never allow "unlimited
night & weekend minutes."
A third GSM 3.5G license was awarded in April 2006 for US$3 billion to a
consortium led by the UAE company Eitesalat (66%), Egypt Post (20%), the National Bank
of Egypt(NBE) (10%), and the NBE's Commercial International Bank (4%), thus moving the
market from duopoly to oligopoly.
Thus, in the next sem. i.e., in 4th
Semester we can took the ICT sector as the main
subject of the our detailed GCSR study on the Egypt. However, there are some other sectors
also so we can throw light on them also.

IX
In light of the above, we can conclude that Egypt's trade performance has been
modest. Despite commitment to the GATT, Egypt is still leaping on the road to regional and
global integration. In spite of the increase in per capita export manufactures, Egypt continues
to specialize in traditional areas of comparative advantage: namely petroleum and cotton. Of
particular interest is the fact that Egypt's major export market, namely the United States and
the EEC countries, alone include about two thirds of Internet users in the world. A similar
argument also applies to tourism: Western and South Europe is the major source of tourists
coming to Egypt. The potential offered to Egypt by the Internet in this context, therefore,
cannot be overlooked.
Thus from the whole study we can derive the relations of Egypt & India as,
bilateral relations between Egypt and India. Modern Egypt–India relations go back to the
contacts between Saad Zaghloul and Mohandas Gandhi on the common goals of their
respective movements of independence. Major Egyptian exports to India include raw cotton,
raw and manufactured fertilizers, oil and oil products, organic and non-organic chemicals,
leather and iron products. Major imports into Egypt from India are cotton yarn, sesame,
coffee, herbs, tobacco and lentils. The Egyptian Ministry of Petroleum is also currently
negotiating the establishment of a natural gas-operated fertilizer plant with another Indian
company. In 2004 the Gas Authority of India Limited, bought 15% of Egypt Natural Gas
distribution and marketing company.
Economic relations: India is the fourth largest trade partner of Egypt after the US, Italy and
Saudi Arabia.
Oil: In 2003, Indian giant Reliance signed a contract with the Egyptian General Petroleum
Corporation (EGPC) to import 8 shipments of raw oil in 2003. Two years preceding the
contract, they had imported shipments from Egypt. In August 2004, the Indian company
GAIL procured 15% of the Egyptian Company Natural Gas which deals with marketing and
distributing natural gas in Egypt. Egyptian and Indian ministers of petroleum met in 2004 in
Egypt to discuss the prospect of investment and purchase of oil and gas from Egypt.
Investments: In 2011, Egyptian investment in India was at about USD 30 million. El Sewedy
group, an Egyptian company, manufactures Electric meters in India. Another Egyptian
company, Orascom Telecom, used to have 10% stake in the then Hutchinson-Essar which has
since been bought by Vodafone.
The current Indian investment in Egypt stands at $2.5 billion in about 45
projects. Alexandria Carbon Black, the Alexandria Fibre Co., Dabur India's production
facility for its cosmetics line, Niletex, Auto Tech Engineering, Marico's acquisition of two
hair care brands and the Sanmar Group's acquisition of a unit of Trust Chemicals of Egypt
represent some of the main Indian investments in Egypt. GAIL has equity and management
stake in two gas distribution ventures in Fayoum and Cairo as well as in Natgas. In April
2007, OVL and its partner IPR Red Sea Inc. announced a significant oil field discovery in the
North Ramadan Concession in the Gulf of Suez and reported a second discovery in

X
November 2008, though these deposits were later found to be commercially unviable. Satyam
Computers and Wipro have set up global delivery centers in Cairo. The Oberoi Group has
been managing a hotel and Nile cruises; Kirloskar Brothers assemble diesel engines and
irrigation pump sets in Egypt; Ranbaxy has an Egyptian subsidiary for manufacturing
pharmaceutical formulations; Ashok Leyland, Tata Motors, Maruti Suzuki and Mahindra &
Mahindra are marketing their vehicles in Egypt, and Bajaj Auto dominated the three-wheelers
market.
http://www.economywatch.com/world_economy/egypt/indo-egypt-trade-relation.html
According to the department of commerce and Industry in India, Indian exports to
Egypt have touched $ 423.68 million in 2004 which is up by 15.29% and the imports from
Egypt have reached $ 137.27 million in the same year which is up by 39.77%.
The main exportable items from India were Iron and steel, Jute yarn, Plastic and rubber,
Chemicals and engineering goods.
It is seen that making business in Egypt offers a large domestic market, a better
infrastructure base, skilled main power etc. The general authority of foreign investments in
Egypt, India is the 12th largest investor in Egypt and it is predicted that in the end of the year
2005,the total investment of India in Egypt will cross $ 450 million in 43 business ventures.
The Gas Authority of India Limited (GAIL) has planned to make an investment over $6
million in the gas distribution ventures in Fayoum and Cairo. The important sectors where the
cooperation has increased are Information technology, Pharmaceuticals, chemicals,
Fertilizers, Steel, Energy and agricultural equipments.
Indian companies have given a very good step in exploiting the business
environment in Egypt. The oberoi group operates hotels in Egypt. The companies like Tata
motors, Asian Paints, Ranbaxy, Ashok Leyland, NIIT, GAIL, HDFC, Dabur India Ltd, Unit
trust of India, Kirloskar Brothers, Thappar Group and others are considered as the major
investors in the land of Egypt.
From the Whole Study we can Conclude that:-
As India is our home instead of Egypt we would...
Have 87.52% more chance of dying in infancy……The number of deaths of infants under
one year old in a given year per 1,000 live births in India is 49.13 while in Egypt it is
26.20.
Consume 74.3% less oil…..India consumes 0.0956 gallons of oil per day per capita while
Egypt consumes 0.3720.
Use 62.57% less electricity…..The per capita consumption of electricity in India is
484kWh while in Egypt it is 1,294kWh.
Make 48.33% less money…..The GDP per capita in India is $3,100 while in Egypt it is
$6,000.

XI
Spend 73.13% less money on health care….Per capita public and private health
expenditures combined in India are $86 USD while Egypt spends $320 USD.
Die 5.94 years sooner….The life expectancy at birth in India is 66.46 while in Egypt it is
72.40.
Have 10.31% more chance of being unemployed….India has an unemployment rate of
10.70% while Egypt has 9.70%.
Experience 6.98% more of a class divide…..The GINI index measures the degree of
inequality in the distribution of family income. In India are 36.80 while in Egypt it is
34.40.
Source: CIA World Fact book
We have picked up some Strength & Weaknesses through this study:-
From the whole report we have picked up some of the strengths & weaknesses for
Egypt to conduct and establish a bounded business relations and to strengthen it for our
country so they are as follows:-
STRENGTHS
• The business climate has benefited from an active reform program and a regional
economic boom.
• Egypt boasts diversified sources of foreign exchange (the Suez Canal, tourism, private
transfers, and oil and gas exports).
• Foreign exchange reserves are high.
• The country enjoys the political and financial support of Western countries.
WEAKNESSES
• The interest on public debt and the cost of subsidies weighs on public finances
limiting the capacity for infrastructure development.
• The banking system is not yet capable of meeting the economy's needs.
• The tourism sector, whose revenues are of fundamental importance to the current
account balance and economic growth, remains vulnerable to the terrorist menace.
At the last, we can conclude that India has a very good opportunity to establish &
strengthen their economical – business relations with Egypt as there are many supporting
factor.
At last we feel great pleasure to present our study & to conclude it here.

XII
Table of Content
Sr. No. Content Page No. 1. Executive Summary IV
2. Economical Environment 1
3. Technological Environment 24
4. Comparison of Egypt - India 34
5. References XIII
List of Graphs & Tables
Sr. No. Content Page No. 1. GDP Graph 3
2. GDP Growth Rate Graph & Table 4
3. Consumer Price Index Graph & Table 6
4. Inflation Rate Graph & Table 8
5. Interest Rate Graph & Table 9
6. Balance of Trade Graph & Table 10
7. Summarised Economic Factors Table 13
8. Comparison with other Countries Table 14
9. List of Main Companies Table 21
10. Internet Hosting Graph 28
11. R & D Expenditure Graph 28
12. Egypt Vs. India Table 32

1

2
The Role of Economical Environment in Egypt:-
Introduction:-
Occupying the northeast corner of the Afr ican cont inent, Egypt is
bisected by the highly fert ile Nile valley, where most economic act ivity takes
place. Egypt 's economy was highly centralized during the rule of former
President Gamal Abdel NASSER but opened up considerably under former
Presidents Anwar EL-SADAT and Mohamed Hosni MUBARAK. Cairo from
2004 to 2008 aggressively pursued economic reforms to attract foreign
investment and facilitate GDP growth. Despite the relat ively high levels of
economic growth in recent years, living condit ions for the average Egypt ian
remained poor and contributed to public unhappiness. After unrest exploded in
January 2011, the Egypt ian Government drast ically increased social spending
to address public dissat isfact ion, but polit ical uncertainty at the same t ime
caused economic growth to slow significant ly, reducing the government 's
revenues. Tourism, manufacturing, and construct ion are among the hardest hit
sectors of the Egypt ian economy, and economic growth is likely to remain slow
at least through 2012. The government is ut ilizing foreign exchange reserves to
support the Egypt ian pound and Egypt may seek a loan from the Internat ional
Monetary Fund.
Egypt's economic stabilization programme, initiated in 1990/91, has produced
significant results in most macroeconomic areas. Strict fiscal and monetary policy resulted in
a halving of the rate of inflation between 1991/92 and 1993/94; economic growth, after
declining initially, picked up in 1993/94 and has been maintained, despite external shocks, at
a real rate of around 5%; and unemployment has fallen since 1993/94. Growth has been
mainly driven by increased domestic demand, with export growth playing a smaller role. The
Government's goal is to meet the challenge of a rapidly growing labour force with GDP
growth of some 8% a year.
Higher export growth, at some 10% a year, and increased private investment, is
expected to support future GDP growth. There is considerable evidence that private
investment has risen; much of this is taking place in the non-tradeable sectors, where reform
has been concentrated. With declining foreign exchange revenues from traditional but volatile
sources, particularly tourism, workers‘ remittances, the Suez Canal, and petroleum, there is a
perceived need to expand Egypt's exports; growth since 1991/92 has been irregular and
closely dependent on the performance of petroleum exports. There is also a need for
significant deepening of the reform programme, particularly to address the lack of external
competitiveness especially in traditional sectors such as textiles and clothing, in order to
move the economy to a higher growth route.
3
The national currency is the Egyptian pound (LE). Egypt currently has a managed
floating system, with no pre-announced path for the exchange rate. The Central Bank of
Egypt (CBE) is responsible for formulating monetary and exchange rate policy, and for
control the banking system. Valuable from 2nd
Jan.2005, Egypt has accepted Article VIII,
Sections - 2, 3 & 4, of the IMF Agreement.
Source: Information provided by the Central Bank of Egypt.

4
GDP:
The Gross Domestic Product (GDP) or gross domestic income (GDI) is one of the
measures of national income and output for a known country's economy. It is equal to the
total expenditures for all final goods and services produced within the country in a fixed
period of time (usually a 365-day year).
Egypt GDP:-
The GDP in Egypt was worth 229.53 billion US dollars in 2011, according to a report
available by the World Bank. The GDP value of Egypt is roughly equal to 0.37% of the
world economy. Historically, from 1960 until 2011, Egypt GDP averaged 50.81 Billion USD
reaching an all time high of 229.53 Billion USD in December of 2011 and a record low of
4.00 Billion USD in December of 1962.
Chart of Egypt GDP:-
Indian GDP:-
The GDP in India was worth 1847.98 billion US dollars in 2011, according to a
report published by the World Bank. The GDP value of India is roughly equal to 2.98% of
the world economy. Historically, from 1960 until 2011, India GDP averaged 368.84 Billion
USD reaching an all time high of 1847.98 Billion USD in December of 2011 and a record
low of 36.61 Billion USD in December of 1960.
Interpretation:-
From the above information we can interpret that the GDP of Egypt is around the 12.47%
of the Indian GDP in the latest information of upto 2011.
The Indian GDP is the highest in history in that year so it implies good economic growth
in India while the highest GDP in Egypt was recorded earlier so it implies the fluctuating
growth of Egypt than India.
So from the GDP point of view the Egypt is far behind from Indian economy.

5
GDP Growth Rate:-
The GDP growth rate measures the increase in value of the goods and services
produced by an economy. Economic growth is usually calculated in real terms or inflation-
adjusted terms, in order to net out the effect of changes on the price of the goods and services
produced. The real GDP per capita of an economy is often used as an indicator of the average
standard of living of individuals in that country, and economic growth is therefore often seen
as indicating an increase in the average standard of living. However, there are some problems
in using growth in GDP per capita to measure the general well-being of a country´s
population.
Egypt GDP Growth Rate:-
The GDP in Egypt expanded 3.3% in the second quarter of 2012 over the same
quarter, previous year. Historically, from 1992 until 2012, Egypt GDP Growth Rate averaged
4.10% reaching an all time high of 7.30% in March of 2008 and a record low of -4.20% in
March of 2011. Egypt has one of the most developed and diversified economies in the Middle
East. Agriculture (cotton, corn, sugarcane, fruit and vegetables, fodder, and rice), industry
(textiles and clothing, chemicals, steel, consumer electronics and home appliances) and
services (tourism) represent almost equal rates in national production. However, despite high
levels of economic growth over the past few years, living conditions for the average Egyptian
remain poor.
Egyptian GDP Growth Data Table:-
Year Mar Jun Sep Dec
2012 5.20 3.30
2011 -4.20 0.40 0.20 0.40
2010 5.80 5.10 5.50 3.80
2009 4.30 4.50 4.60 5.00
2008 7.30 7.10 5.70 4.10
Indian GDP Growth Rate:-
The GDP in India expanded 0.8% in the second quarter of 2012 over the previous
quarter. Historically, from 1996 until 2012, India GDP Growth Rate averaged 1.65%
reaching an all time high of 6.10% in March of 2010 and a record low of -1.50% in March of
2004. India's diverse economy encompasses traditional village farming, modern agriculture,
handicrafts, a wide range of modern industries, and a huge number of services. Services are
the major source of economic growth, accounting for more than half of India's output with
less than 1/3rd
of its labor force. The economy has posted an average growth rate of more than
7% in the decade since 1997, reducing poverty by about 10% points.

6
GDP Per CAPITA:-
The GDP dollar estimates given here are adjusted for inflation. The GDP per capita
is the value of all final goods and services produced within a nation in a given year divided
by the average (or mid-year) population for the same year.
Egyptian GDP Per Capita:-
The GDP per capita in Egypt was last reported at 1976.62 US dollars in 2011,
according to a report published by the World Bank. The GDP per Capita in Egypt is
equivalent to 16% of the world's average. Historically, from 1960 until 2011, Egypt GDP per
capita averaged 1039.96 USD reaching an all time high of 1976.62 USD in December of
2011 and a record low of 431.99 USD in December of 1960.
Year Value
2011 1976.62
2010 1975.55
2009 1911.96
2008 1858.86
Indian GDP Per Capita:-
The GDP per capita in India was last reported at 837.75 US dollars in 2011,
according to a report published by the World Bank. The GDP per Capita in India is
equivalent to 7% of the world's average. Historically, from 1960 until 2011, India GDP per
capita averaged 344.72 USD reaching an all time high of 837.75 USD in December of 2011
and a record low of 180.86 USD in December of 1960.
Thus, from this we can also interpret that the Indian economy is far developed from that
of Egyptian so by this we can generate best opportunity of business with Egypt at lower cost.

7
Consumer Price Index:-
The Consumer Price Index or CPI measures changes in the prices paid by
consumers for a basket of goods and services.
Egyptian Consumer price Index:-
Consumer Price Index (CPI) in Egypt increased to 124.70 Index Points in August
of 2012 from 123.30 Index Points in July of 2012, according to a report released by the
Capmas, Egypt. Historically, from 1957 until 2012, Egypt CPI averaged 25.65 Index Points
reaching an all time high of 124.70 Index Points in August of 2012 and a record low of 1.20
Index Points in June of 1962.
Year Jan Feb Mar Apr May Jun Jul Aug Sep Oct Nov Dec
2012 120.3 121.1 122.6 123.8 123.5 122.8 123.3 124.7
2011 110.8 110.9 113.4 113.8 114 114.5 115.9 117.2 118.8 119.2 120.4 120.1
2010 100 100.2 100.8 101.5 101.9 102.4 105 108 109.8 111.3 110.4 109.7
2009 88.8 89.7 90.8 92.3 93.5 93.8 95.9 97.4 99 100.3 100.2 99.2
2008 77.6 79 81 82.6 84.8 85.3 87.2 89.3 89.6 89.5 89.5 88.3
Indian Consumer Price Index:-
Consumer Price Index (CPI) in India increased to 214 Index Points in August of
2012 from 212 Index Points in July of 2012, according to a report released by the Labour
Bureau, Government of India. Historically, from 1960 until 2012, India CPI averaged 52.89
Index Points reaching an all time high of 214 Index Points in August of 2012 and a record
low of 4.32 Index Points in April of 1960.
Interpretation:-
From the above information we can conclude that the CPI is almost nearer to the double
of the CPI of Egypt in India.
In month of August it increases than the month of July so, we can expect more growth in
that in the coming months in Egypt & it indicate good sign of economy & also for India
to conduct a good business relations with Egypt in future.

8
Inflation Rate:-
Inflation refers to a general rise in prices measured against a standard level of
purchasing power. Earlier the term was used to refer to an increase in the money supply,
which is now referred to as expansionary monetary policy or monetary inflation. Inflation is
measured by comparing two sets of goods at two points in time, and computing the increase
in cost not reflected by an increase in quality. The most well known measures of Inflation
rate are the CPI, and the GDP deflator, which measures inflation in the whole of the domestic
economy. The current view in normal economics is that inflation is caused by the interaction
of the supply of money with output and interest rates.
Egyptian Inflation Rate:-
The inflation rate in Egypt was recorded at 6.30% in September of 2012.
Historically, from 2001 until 2012, Egypt Inflation Rate averaged 8.98% reaching an all time
high of 23.60% in August of 2008 and a record low of 2.20% in May of 2001. The following
graph represents the Egypt‘s inflation rate upto Sept. 2012.
The following table shows the data for inflation rate of Egypt for various months in 2012 &
previous years:-
Year Jan Feb Mar Apr May Jun Jul Aug Sep Oct Nov Dec
2012 9.2 9.9 9.5 9.3 8.6 7.4 6.3 6.3 6.3
2011 11 11 12.2 12.1 11.8 11.8 10.36 8.49 8.21 7.5 10 10.4
2010 13.6 12.6 12 10.9 10 10.1 10.4 10.9 11 11 10.2 10.3
2009 14.3 13.5 12.1 11.7 10.2 9.9 9.9 9 10.8 13.3 13.3 13.5
2008 10.5 12.1 14.4 16.4 19.7 20.2 22 23.6 21.5 20.2 20.3 18.3
Indian Inflation Rate:-
The inflation rate in India was recorded at 7.81% in September of 2012.
Historically, from 1969 until 2012, India Inflation Rate averaged 7.75% reaching an all time
high of 34.68% in September of 1974 and a record low of -11.31% in May of 1976.
Thus, there is no far difference in the inflation rate as compared to India it is lesser
in Egypt so we expect the lesser cost as things are cheaper than India so, it is good to import
some goods from Egypt at lesser cost than India.

9
Interest Rate:-
The interest rate term structure is the relation between the interest rate and the time
to maturity of the debt for a given borrower in a given currency.
Egyptian Interest Rate:-
The benchmark interest rate in Egypt was last reported at 9.25%. Historically, from
1991 until 2012, Egypt Interest Rate averaged 11.76% reaching an all time high of 21.40% in
October of 1991 and a record low of 8.25% in September of 2009. In Egypt, decisions on
interest rates are made by the Central Bank of Egypt (CBE). The Central Bank of Egypt
official interest rate is the overnight deposit rate. The CBE is committed to achieving, over
the medium term, low rates of inflation which it believes are essential for maintaining
confidence and for sustaining high rates of investment and economic growth. The graph for
the historical data of Egypt Interest Rate is as follows.
Year Jan Feb Mar Apr May Jun Jul Aug Sep Oct Nov Dec
2012 9.25 9.25 9.25 9.25 9.25 9.25 9.25 9.25 9.25 9.25
2011 8.25 8.25 8.25 8.25 8.25 8.25 8.25 8.25 8.25 8.25 9.25 9.25
2010 8.25 8.25 8.25 8.25 8.25 8.25 8.25 8.25 8.25 8.25 8.25 8.25
2009 11.5 10.5 10 10 9.5 9 9 8.5 8.25 8.25 8.25 8.25
2008 9 9 9 9 9 10 10 11 11.5 11.5 11.5 11.5
Indian Interest Rate:-
The benchmark interest rate in India was last reported at 8.00%. Historically, from
2000 until 2012, India Interest Rate averaged 6.52% reaching an all time high of 14.50% in
August of 2000 and a record low of 4.25% in April of 2009. In India, interest rate decisions
are taken by the Reserve Bank of India's Central Board of Directors. The official interest rate
is the benchmark repurchase rate. This page includes a chart with historical data for India
Interest Rate.
The Effects of Interest Rate:-
The current U.S. dollar interest rates paid on U.S. Treasury securities for various
maturities are closely watched by many traders, and are commonly plotted on a graph such as
the one on the right which is informally called "the yield curve." Yield curves are usually
upward sloping asymptotically; the longer the maturity, the higher the yield, with diminishing
marginal growth. There are two common explanations for this phenomenon. First, it may be

10
that the market is anticipating a rise in the risk-free rate. If investors hold off investing now,
they may receive a better rate in the future. Therefore, under the arbitrage pricing theory,
investors who are willing to lock their money in now need to be compensated for the
anticipated rise in rates — thus the higher interest rate on long-term investments. However,
interest rates can fall just as they can rise. Another explanation is that longer maturities entail
greater risks for the investor (i.e. the lender). Risk premium should be paid, since with longer
maturities, more catastrophic events might occur that impact the investment. This explanation
depends on the notion that the economy faces more uncertainties in the distant future than in
the near term, and the risk of future adverse events is higher than the chance of future positive
events. This effect is referred to as the liquidity spread. If the market expects more volatility
in the future, even if interest rates are anticipated to decline, the increase in the risk premium
can influence the spread and cause an increasing yield.
Balance of Trade:-
The balance of trade is the difference between the monetary value of exports and
imports in an economy over a certain period of time. A positive balance of trade is known as
a trade surplus and consists of exporting more than is imported; a negative balance of trade is
known as a trade deficit or, informally, a trade gap. The balance of trade forms part of the
current account, which also includes other transactions such as income from the international
investment position as well as international aid. If the current account is in surplus, the
country's net international asset position increases correspondingly. Equally, a deficit
decreases the net international asset position. The Balance of Trade is identical to the
difference between a country's output and its domestic demand - the difference between what
goods a country produces and how many goods it buys from abroad; this does not include
money respect on foreign stocks, nor does it factor the concept of importing goods to produce
for the domestic market.
Egyptian Balance of Trade:-
Egypt reported a trade deficit equivalent to 8.1 Billion USD in the second quarter
of 2012. Historically, from 2001 until 2012, Egypt BoT averaged a deficit equivalent to
4230.50 Million USD reaching the best deficit at 1274.30 Million USD in March of 2003 and
the worst deficit at 8171.10 Million USD in June of 2012.
Egypt is net exporter of raw oil. Other major exports include: agricultural products:-citrus
fruits, rice and dried onion, chemicals, metals and its products; cotton, textiles and
clothes.
Egypt main exports partners are: United States, Italy, China and United Kingdom.
Egypt imports mostly: fuels, foodstuff, cereals, chemicals, machinery and electric
equipment.
Main imports partners are: United States, Switzerland, Germany and United Kingdom.
Indian Balance of Trade:-
India reported a trade deficit equivalent to 18080 Million USD in September of
2012. Historically, from 1994 until 2012, India BoT averaged a deficit equivalent to 4001.78

11
Million USD reaching the best surplus at 491.28 Million USD in November of 2001 and the
worst deficit at 19644.00 Million USD in October of 2011.
India is leading exporter of gems and jewelry, textiles, engineering goods, chemicals,
leather manufactures and services.
India is poor in oil resources and is currently heavily dependent on coal and foreign oil
imports for its energy needs.
Other imported products are: machinery, gems, fertilizers and chemicals.
Main trading partners are European Union, The United States, China and UAE.
The graphs representing BoT historically for both countries are as follows:-
The following is the table showing quarterly BoT historical data for Egypt:-
Conclusion:-
From this we can conclude that as India is poor in oil so they have to build up relations of
trade with Egypt for the same as they are main exporter of the same. It is good opportunity
for India to develop good business relations with Egypt.
Year Mar Jun Sep Dec
2012 -7929.0 -8171.1
2011 -5092.5 -5369.3 -7823.0 -7775.0
2010 -6607.8 -6583.0 -7134.0 -6691.9
2009 -4865.8 -5680.0 -5675.2
2008 -5520.9 -6625.6 -7000.0 -7627.5
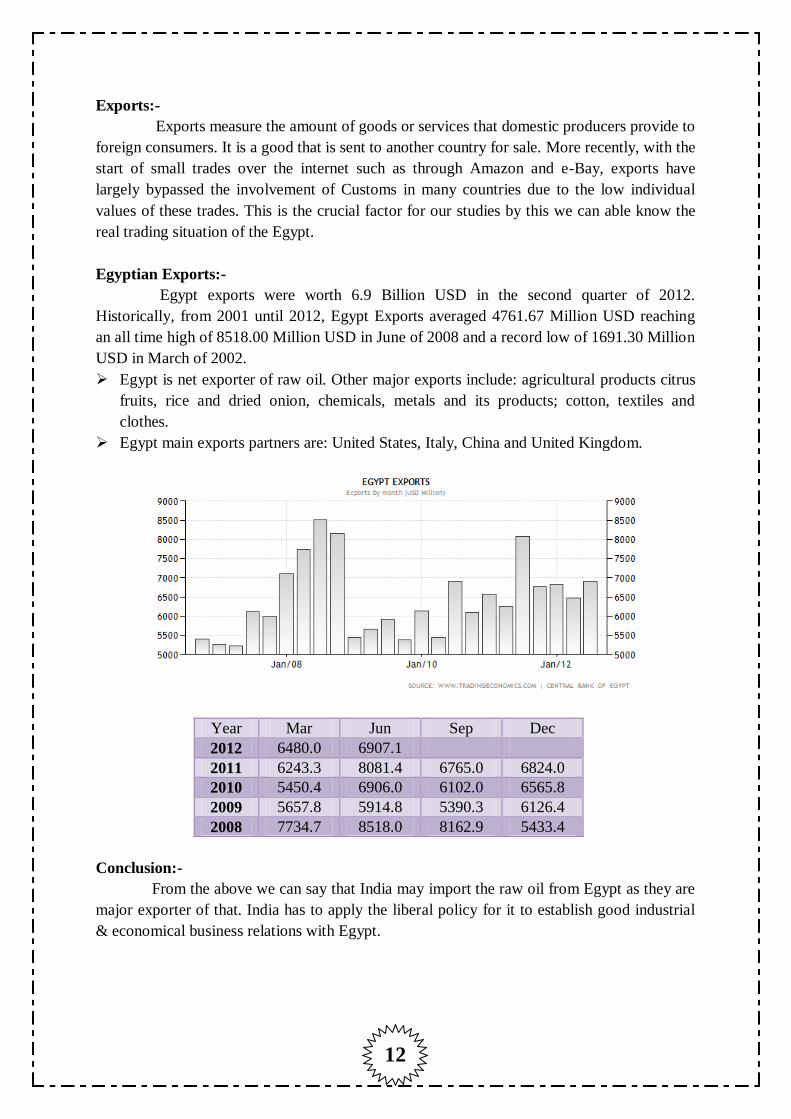
12
Exports:-
Exports measure the amount of goods or services that domestic producers provide to
foreign consumers. It is a good that is sent to another country for sale. More recently, with the
start of small trades over the internet such as through Amazon and e-Bay, exports have
largely bypassed the involvement of Customs in many countries due to the low individual
values of these trades. This is the crucial factor for our studies by this we can able know the
real trading situation of the Egypt.
Egyptian Exports:-
Egypt exports were worth 6.9 Billion USD in the second quarter of 2012.
Historically, from 2001 until 2012, Egypt Exports averaged 4761.67 Million USD reaching
an all time high of 8518.00 Million USD in June of 2008 and a record low of 1691.30 Million
USD in March of 2002.
Egypt is net exporter of raw oil. Other major exports include: agricultural products citrus
fruits, rice and dried onion, chemicals, metals and its products; cotton, textiles and
clothes.
Egypt main exports partners are: United States, Italy, China and United Kingdom.
Year Mar Jun Sep Dec
2012 6480.0 6907.1
2011 6243.3 8081.4 6765.0 6824.0
2010 5450.4 6906.0 6102.0 6565.8
2009 5657.8 5914.8 5390.3 6126.4
2008 7734.7 8518.0 8162.9 5433.4
Conclusion:-
From the above we can say that India may import the raw oil from Egypt as they are
major exporter of that. India has to apply the liberal policy for it to establish good industrial
& economical business relations with Egypt.

13
Imports:-
An import is any good or service brought into one country from another country in
a legal way, naturally for use in trade. Import goods or services are provided to home
consumers by overseas producers. An import in the receiving country is an export to the
sending country. When the "imports" are the set of goods and services imported, "Imports"
also means the economic value of all goods and services that are imported. This is same
important for our study as that of exports as to know which products India can sold to Egypt
at what level & price.
Egyptian Imports:-
Egypt imports were worth 15 Billion USD in the second quarter of 2012.
Historically, from 2001 until 2012, Egypt Imports averaged 9037.14 Million USD reaching
an all time high of 15162.90 Million USD in September of 2008 and a record low of 3206.80
Million USD in March of 2002.
Egypt imports mostly: fuels, foodstuff, cereals, chemicals, machinery and electric
equipment.
Main imports partners are: United States, Switzerland, Germany and United Kingdom.
Year Mar Jun Sep Dec
2012 14409.0 15078.0
2011 11335.8 13450.7 14588.0 14599.0
2010 12058.2 13489.0 13236.0 13257.7
2009 10523.6 11594.8 11644.3 11801.6
2008 13255.6 15143.6 15162.9 13060.9
Conclusion:-
From the above we can conclude that India has good opportunity to export
foodstuffs, chemicals, & Machinery to Egypt as they are major importer of that and India is
keen in producing such products. India can boost up the good relations with Egypt by selling
the various foodstuffs.

14
Government Budget:-
A government budget is a legal document that is often passed by the legislature,
and approved by the chief executive-or president. The two basic elements of any budget are
the revenues and expenses. Budgets have an economic, political and technical basis. Unlike a
pure economic budget, they are not entirely designed to allocate scarce resources for the best
economic use. The technical element is the forecast of the likely levels of revenues and
expenses.
Egypt Government Budget:-
Egypt reported a Government Budget deficit equal to 7.90 percent of the country's
Gross Domestic Product in 2011. Historically, from 2002 until 2011, Egypt Government
Budget averaged -8.49 Percent of GDP reaching an all time high of -6.60 Percent of GDP in
June of 2009 and a record low of -10.50 Percent of GDP in June of 2003.
Conclusion:-
This factor is taken in our study to know the Egypt Govt. budget predicting as their
expenditures & incomes, revenues and others so we can able to forecast and learn the
opportunities for creating a well manner trade environment between India & Egypt.
The Summarised Table of Figures of Various Economic Factors of the Egypt:-
ACTUAL PREVIOUS HIGHEST LOWEST UNIT
Markets
Currency 6.11 6.07 6.35 4.59
Stock Market 5893.31 5821.82 7210.41 3586.55 Index points
Exchange Rate 6.11 6.07 6.35 4.59
GDP
GDP per capita 1976.62 1975.55 1976.62 431.99 USD
GDP per capita PPP 6324.02 6152.57 6324.02 1147.64 USD
GDP 229.53 218.91 229.53 4.00 USD Billion
GDP Growth Rate 3.30 5.20 7.30 -4.20 Percent
GDP Annual Growth Rate 3.30 5.20 7.30 -4.20 Percent
Labour
Population 82.54 81.12 82.54 27.90 Million
Unemployed Persons 3395.00 3383.00 3395.00 2022.00 Thousand
Persons
Year Jun
2011 -7.90
2010 -8.10
2009 -6.60
2008 -6.80

15
Unemployment Rate 12.60 12.60 12.60 8.10 Percent
Prices
Inflation Rate 6.30 6.30 23.60 2.20 Percent
Consumer Price Index 124.70 123.30 124.70 1.20 Index Points
Money
Money Supply M0 256701.00 256230.00 263668.00 68043.00 EGP Million
Money Supply M2 1101873.0 1094408.00 1101873.00 161125.00 EGP Million
Foreign Exchange Reserves 15149.00 14444.00 36038.00 14253.00 USD Million
Interest Rate 9.25 9.25 21.40 8.25 Percent
Trade
Imports 15078.00 14409.00 15162.90 3206.80 USD Million
Exports 6907.10 6480.00 8518.00 1691.30 USD Million
External Debt 34384.50 33422.10 34992.50 26132.50 USD Million
Current Account to GDP -1.20 -2.00 8.70 -8.50 Percent
Balance of Trade -8171.10 -7929.00 -1274.30 -8171.10 USD Million
Current Account -1535.70 -2339.00 1927.80 -2339.00 USD Million
Government
Government Debt To GDP 76.40 73.20 103.30 70.20 Percent
Government External Debt 33422.10 33692.70 34992.50 26132.50 USD Million
Government Spending 155000.00 134700.00 155000.00 2580.00 EGP Million
Government Budget -7.90 -8.10 -6.60 -10.50 Percent of GDP
Business
Industrial Production -2.90 -2.90 24.70 -16.30 Percent
Changes in Inventories 22000.00 5400.00 22000.00 -1200.00 EGP Million
Consumer
Consumer Spending 1035900.0 899800.00 1035900.00 11410.00 EGP Million
The Table Showing the Comparison with India & Such Other Countries:-
Country Continent GDP GDP
Growth
Exchange
Rate
Interest
Rate
Inflation
Rate
Current
Account
Unemployment
Rate
Government
Budget
Egypt Africa 230 3.30 6.1091 9.25 6.30 -1536 12.60 -7.90
India Asia 1848 0.80 53.9650 8.00 7.81 -16 3.80 -4.60
South
Africa
Africa 408 3.20 8.6445 5.00 5.50 -152600 25.50 -4.80
United
Arab
Emirates
Asia 360 4.20 3.6732 1.00 1.05 113 4.60 2.90
United
Kingdom
Europe 2432 1.00 1.6024 0.50 2.20 -20767 7.90 -7.80
United
States
America 15094 2.00 119.8900 0.25 2.00 -117 7.90 -8.70

16
Economy of Egypt a Full Study with Fiscal Policy:-
The economy of Egypt was highly centralized under President Gamal Abdel
Nasser. In the 1990s, a series of International Monetary Fund arrangements, coupled with
massive external debt relief resulting from Egypt's participation in the Gulf War coalition,
helped Egypt improve its macroeconomic performance. Since 2000, the pace of structural
reforms, including fiscal, monetary policies, privatization and new business legislations,
helped Egypt move towards a more market-oriented economy and prompted increased
foreign investment. The reforms and policies have strengthened macroeconomic annual
growth results which averaged 5% annually but the government largely failed to equitably
share the wealth and the benefits of growth have failed to trickle down to improve economic
conditions for the broader population, especially with the growing problem of unemployment
and underemployment among youth under the age of 30 years. A youth protest demanding
more political freedoms, fighting corruption and delivering improved living standards forced
President Mubarak to step down on 11 February 2011. After the revolution Egypt‘s foreign
exchange reserves fell from$36 billion in December 2010 to only $16.3 billion in January
2012, also in February 2012 Standard & Poor‘s rating agency lowered the Egypt‘s credit
rating from B+ to B in the long term.
Macroeconomic Trends
Egypt has a stable economy enjoying continuous growth, averaging 4%–5% in the
past quarter-century. The economy embarked on various stages of development during which
the public and private sectors played roles varying in relative importance as follows:
First Republic: 1952-2012,
Import substitution and nationalization, 1952–1966,
Openness Euphoria, 1974–1982 during which policies were introduced to encourage
Arab and foreign investment through a series of incentives and liberalizing trade and
payment;
External Debt Crisis, 1982–1990,
Economic Reform, 1991–2007, reform policies were introduced to meet the terms of
international institutions, lenders and donors, including wider incentives to the role of
the private sector in all economic activities.
The Post Global Financial Crisis, 2008-2011, soaring food prices, especially for
grains, led to calls for the government to provide more immediate assistance to the
population of more than 40% in the "poverty tunnel" and to strike a "new deal" on
agriculture policy and reform.
The Second Republic: 2012 -, Egypt need to strengthen the economy to exogenous
shocks, improve productivity, competition, get out of the "informality trap," invest in
human capital via social protection from a human right-based approach to correct for
market failures and build good trust in governance.

17
Reform Era:-
Under complete economic reforms initiated in 1991, Egypt has relaxed many price
controls, reduced subsidies, reduced inflation, cut taxes, and partially liberalized trade
and investment. Manufacturing had become less subject by the public sector, especially in
heavy industries. A process of public sector reform and privatization has begun to enhance
opportunities for the private sector. Agriculture, mainly in private hands, has been largely
deregulated, with the exception of cotton and sugar production. Construction, non-financial
services, and domestic wholesale and retail trades are largely private. This has promoted a
steady increase of GDP and the annual growth rate.
According to the World Bank Country Classification, Egypt has been promoted
from the low income category to lower middle income category. Mean wages were $2.45 per
man-hour in 2009.
The reform programme is a work in progress. Noteworthy that the reform record
has substantially improved since Nazif government came to power.
The rise of the World Global Financial Crisis led to a set of fiscal-monetary policy
measures to face its repercussions on the national economy, including reducing the overnight
lending and deposit rates by 1% on 12 February 2009. The rates currently stand at 10.5% and
12.5%, respectively.
Reform of energy and food subsidies, privatization of the state-owned Bank of
Cairo, and inflation targeting are perhaps the most controversial economic issues in
2007/2008 and 2008/2009.
External trade and remittances
Egypt's main exports consist of natural gas, and non-petroleum products such as
ready-made clothes, cotton textiles, medical and petrochemical products, citrus fruits, rice
and dried onion, and more recently cement, steel, and ceramics. Egypt's main imports consist
of pharmaceuticals and non-petroleum products such as wheat, maize, cars and car spare
parts. Italy and the USA are the top export markets for Egyptian goods and services. In
the Arab world, Egypt has the largest non-oil GDP as of 2005.
According to the International Organization for Migration, an estimated 2.7
million Egyptians abroad contribute actively to the development of their country
through remittance inflows, circulation of human and social capital, as well as investment.
Monetary policy
There have been several favorable conditions that allowed the Central Bank of
Egypt to accumulate net international reserves, which increased from US$ 20 billion in
FY2005, to US$23 billion in FY2006, and to US$30 billion FY2007 contributing to growth
in together reserve money and in broad money (M2).

18
Credit expanded to the private sector in Egypt declined significantly reaching about
EGP 5 billion in FY2005. This credit crisis is due to the non-performing loans extended by
the banks to business tycoons and top govt. officials.
Lending criteria have been tensed tracking the transitory of Money Laundry Law
80 in 2002 and Banking Law 88 in 2003. Interest rates are no longer the dominant factor in
banks' lending decisions. In fact, both the inefficiency and absence of the role of the Central
Bank of Egypt in qualitative and quantitative control as well as implementing banking
procedures and standards was almost entirely responsible for the non-performing loans crisis.
The era of inflation targeting—i.e. maintaining inflation within a band—has perhaps
begun in Egypt more recently. Country experiences show that inflation targeting is a best-
practice strategy for monetary policy.
Exchange rate policy
The exchange rate has been linked to the US dollar since the 1950s. Several rules
were adopted including initially the conventional bolt in the sixties, regular crawling bolt in
the seventies and the eighties and crawling bands in the nineties. Over that time period, there
were several exchange rate markets including black market, parallel market and the official
market. With the turn of the new millennium, Egypt introduced a managed float regime and
successfully unified the Pound exchange rate vis-à-vis foreign currencies.
In the fiscal year 2004 and over most of the fiscal year 2005, the pound depreciated
against the US Dollar. Since the second half of the fiscal year 2006 until the end of the fiscal
year 2007, the pound gradually appreciated to EGP 5.69 per USD. While it was likely to
continue appreciating in the short-term, given the skyrocketing oil prices and the weakening
US economy, the advent of the global Economic crisis of 2008, and resulting behavior of
foreign investors exiting from the stock market in Egypt increased the dollar exchange rate
against the Egyptian pound, which rose by more than 4% since Lehman Brothers
declared Bankruptcy.
Main Economic Sectors:-
Agricultural sector
During the 1970s, despite significant investment in land reclamation, agriculture lost
its position as the leading economic sector. Agricultural
exports, which were 87% of all merchandise export by value
in 1960, fell to 35% in 1974 and to 11% by 2001. In 2000,
agriculture accounted for 17% of Gross Domestic Production
and 34% of total employment. Cotton has been the staple
crop, but it is no longer vital as an export. Production in 1999
was 243,000 tons. Egypt is also a substantial producer

19
of wheat, corn, sugarcane, fruit and vegetables, fodder, and rice; substantial quantities of
wheat are also imported, especially from the United States of America and Russia, despite
increases in yield since 1970, and significant quantities of rice are exported. Citrus, dates, and
grapes are the main fruits by acreage. Agricultural output in tons in 1999 included corn,
9,350,000; wheat, 6,347,000; rice, 5,816,000; potatoes, 1,900,000; and oranges, 1,525,000.
The government exercises a strong degree of control over agriculture, not only to ensure the
best use of irrigation water but also to confine the planting of cotton in favor of food grains.
Egyptian Strawberry exports stood for 52 million dollars in 2009. Egypt's fertile area totals
about 3.3 million hectares, about one-quarter of which is land reclaimed from the desert.
However, the reclaimed lands only add 7 percent to the total value of agricultural production.
Even though only 3 percent of the land is arable, it is extremely productive and can be
cropped two or even three times annually. Most land is cropped at least twice a year, but
agricultural productivity is limited by salinity, which afflicts an estimation of 35% of
cultivated land, and drainage issues.
Industrial sector
Automobiles manufacturing
El Nasr Automotive Manufacturing Company is Egypt's state owned automobile
company, founded in 1960 in Helwan, Egypt. Established in 1977, the company
manufactures various vehicles under license from Daimler AG, Kia, and Peugeot. Their
current lineup consists of the Jeep Cherokee; the open-top, Wrangler-based Jeep AAV TJL;
the Kia Spectra; the Peugeot 405; and the Peugeot 406.
Other manufacturers such as AAV - Arab American Vehicles, the Ghabbour Group,
WAMCO - the Watania Automotive Manufacturing Company, and MCV Egypt –
Manufacturing Commercial Vehicles, produce automobiles in Egypt. MCV Egypt was
established in 1994 to represent Mercedes-Benz in the commercial vehicle sector in Egypt,
producing a range of buses and trucks for domestic sale and for export throughout the Arab
World, Africa, and Eastern Europe. Also there is Russian AutoVAZ manufacturing 'Lada'.
Chemicals
Abu Qir Fertilizers Company (AFC) is one of the largest producers
of nitrogen fertilizers in Egypt and the Middle East. It produces about 50% of the Egyptian
Nitrogen Fertilizers.
Consumer electronics and home appliances
Olympic Group is the largest Egyptian group of companies operating mainly in the
field of domestic appliances. The main products it manufactures are washing machines,
refrigerators, electric water heaters and gas cookers. It also operates in the fields of IT and
real estate.
Bahgat Group is a leading company in the fields of electronics and electrical home
appliances, industries, constructions, internet service providing, and T.V. stations. The group
is composed of the following companies: Egy Aircon, International Electronics Products,

20
Electrical Home appliances, General Electronics and Trading, Goldi Trading, Goldi
Servicing, Egy Medical, Egyptian Plastic Industry, Egy House, Egy Speakers, Egy Marble,
Dreamland and Dream TV.
Steel industries
EZDK is the largest steel company in Egypt and the Middle East. It is ranked at the
65th place in the world biggest steel producers as per the World Steel Institute with total
production of 4.5 Million Tons per year representing about three quarters of Egypt total
annual production (6 Million Tons).
Textiles and clothing
Textiles and clothing is one of the largest manufacturing and exporting processes in
the country and a huge employment absorber. The Egyptian apparel industry is attractive for
two reasons. Firstly, its proximity to European markets, whose rapidly changing fashions
require quick replenishment. Egypt‘s geographical proximity to style-conscious Europe is a
logistical advantage. Secondly, the production of garments is a low-capital and high-labor
intensive industry, and the local population of 66 million provides a ready workforce as well
as a natural local consumer market that acts as a springboard for exports.
Construction and contracting sector
Orascom Construction Industries headquarters is at the
south tower. The Fairmont Hotel lies in-between the two towers
Orascom Construction Industries is a leading Egyptian EPC
contractor, based in Cairo, Egypt and active in more than 20
countries. OCI was established in Egypt in 1950 and owned by
Onsi Sawiris. The company is the first multinational Egyptian
corporation, and is one of the core Orascom Group companies. As
a cement producer, OCI owned and operated cement plants in
Egypt, Algeria, Turkey, Pakistan, northern Iraq and Spain, which
had a combined annual production capacity of 21 million tonnes.
The Talaat Moustafa Group (TMG), one of the largest conglomerates in Egypt, was
founded by the former Talaat Moustafa and is headed by his son, Tarek Talaat Moustafa.
Services sector
Banking & insurance
The banking sector has gone through many stages since the establishment of the
first bank in 1856, followed by the emergence of private sector and joint venture banks
during the period of the Open Door Policy in the 1970s. Moreover, the Egyptian banking
sector has been undergoing reforms, privatization, and mergers and acquisitions from 1991
up to today.
The banking system comprises 57 state owned commercial banks. This includes 28
commercial banks, four of which are state-owned, 26 investment banks (11 joint venture
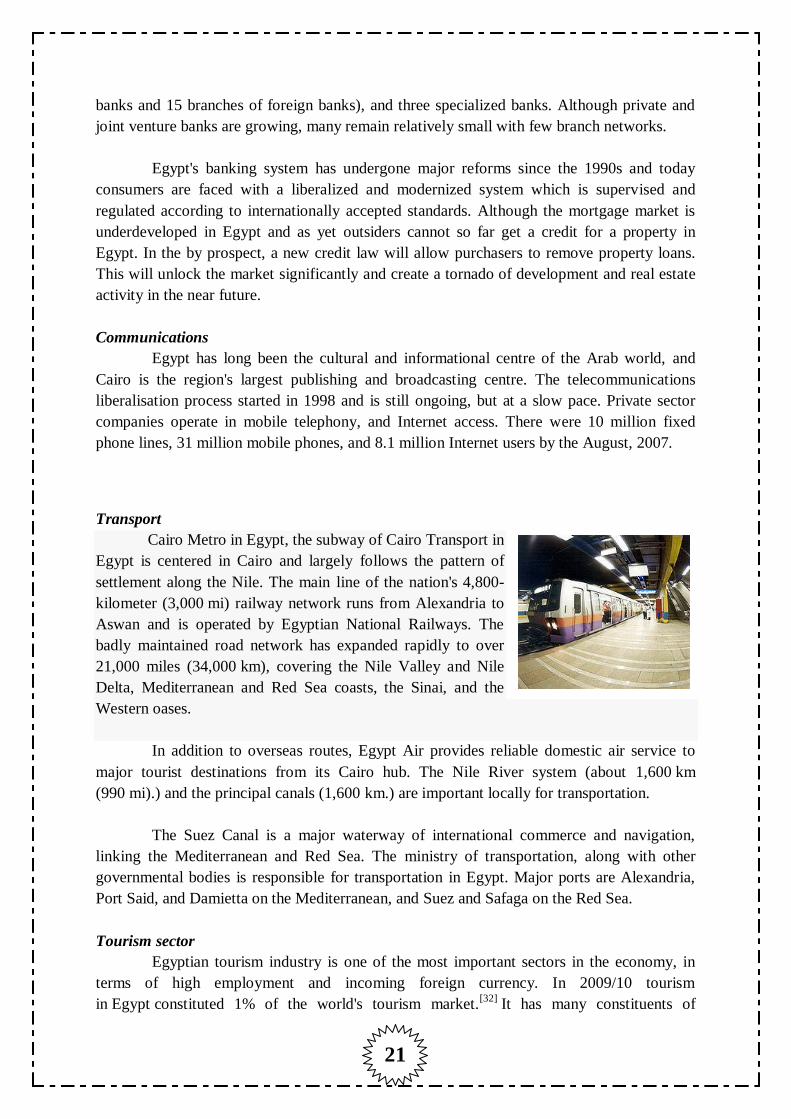
21
banks and 15 branches of foreign banks), and three specialized banks. Although private and
joint venture banks are growing, many remain relatively small with few branch networks.
Egypt's banking system has undergone major reforms since the 1990s and today
consumers are faced with a liberalized and modernized system which is supervised and
regulated according to internationally accepted standards. Although the mortgage market is
underdeveloped in Egypt and as yet outsiders cannot so far get a credit for a property in
Egypt. In the by prospect, a new credit law will allow purchasers to remove property loans.
This will unlock the market significantly and create a tornado of development and real estate
activity in the near future.
Communications
Egypt has long been the cultural and informational centre of the Arab world, and
Cairo is the region's largest publishing and broadcasting centre. The telecommunications
liberalisation process started in 1998 and is still ongoing, but at a slow pace. Private sector
companies operate in mobile telephony, and Internet access. There were 10 million fixed
phone lines, 31 million mobile phones, and 8.1 million Internet users by the August, 2007.
Transport
Cairo Metro in Egypt, the subway of Cairo Transport in
Egypt is centered in Cairo and largely follows the pattern of
settlement along the Nile. The main line of the nation's 4,800-
kilometer (3,000 mi) railway network runs from Alexandria to
Aswan and is operated by Egyptian National Railways. The
badly maintained road network has expanded rapidly to over
21,000 miles (34,000 km), covering the Nile Valley and Nile
Delta, Mediterranean and Red Sea coasts, the Sinai, and the
Western oases.
In addition to overseas routes, Egypt Air provides reliable domestic air service to
major tourist destinations from its Cairo hub. The Nile River system (about 1,600 km
(990 mi).) and the principal canals (1,600 km.) are important locally for transportation.
The Suez Canal is a major waterway of international commerce and navigation,
linking the Mediterranean and Red Sea. The ministry of transportation, along with other
governmental bodies is responsible for transportation in Egypt. Major ports are Alexandria,
Port Said, and Damietta on the Mediterranean, and Suez and Safaga on the Red Sea.
Tourism sector
Egyptian tourism industry is one of the most important sectors in the economy, in
terms of high employment and incoming foreign currency. In 2009/10 tourism
in Egypt constituted 1% of the world's tourism market.[32]
It has many constituents of
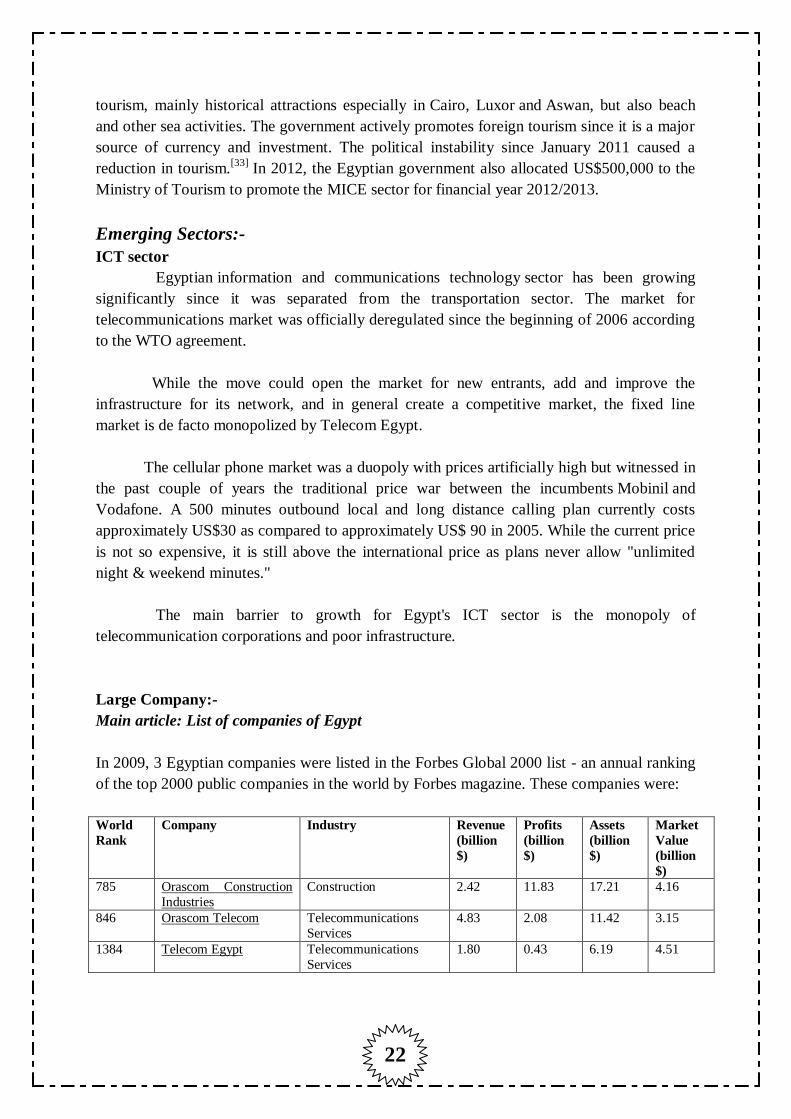
22
tourism, mainly historical attractions especially in Cairo, Luxor and Aswan, but also beach
and other sea activities. The government actively promotes foreign tourism since it is a major
source of currency and investment. The political instability since January 2011 caused a
reduction in tourism.[33]
In 2012, the Egyptian government also allocated US$500,000 to the
Ministry of Tourism to promote the MICE sector for financial year 2012/2013.
Emerging Sectors:-
ICT sector
Egyptian information and communications technology sector has been growing
significantly since it was separated from the transportation sector. The market for
telecommunications market was officially deregulated since the beginning of 2006 according
to the WTO agreement.
While the move could open the market for new entrants, add and improve the
infrastructure for its network, and in general create a competitive market, the fixed line
market is de facto monopolized by Telecom Egypt.
The cellular phone market was a duopoly with prices artificially high but witnessed in
the past couple of years the traditional price war between the incumbents Mobinil and
Vodafone. A 500 minutes outbound local and long distance calling plan currently costs
approximately US$30 as compared to approximately US$ 90 in 2005. While the current price
is not so expensive, it is still above the international price as plans never allow "unlimited
night & weekend minutes."
The main barrier to growth for Egypt's ICT sector is the monopoly of
telecommunication corporations and poor infrastructure.
Large Company:-
Main article: List of companies of Egypt
In 2009, 3 Egyptian companies were listed in the Forbes Global 2000 list - an annual ranking
of the top 2000 public companies in the world by Forbes magazine. These companies were:
World
Rank
Company Industry Revenue
(billion
$)
Profits
(billion
$)
Assets
(billion
$)
Market
Value
(billion
$)
785 Orascom Construction
Industries
Construction 2.42 11.83 17.21 4.16
846 Orascom Telecom Telecommunications
Services
4.83 2.08 11.42 3.15
1384 Telecom Egypt Telecommunications
Services
1.80 0.43 6.19 4.51
23
Investment climate
The Egyptian equity market is one of the most developed in the region with more
than 633 listed companies. Market capitalization on the exchange doubled in 2005 from USD
47.2 billion to USD 93.5 billion, with turnover surging from USD 1.16 billion in January
2005 to USD 6 billion in January 2006.
The major industries include textiles, hydrocarbon and chemical production, and
generic pharmaceutical production. Unemployment is high at about 10.5%. Until 2003, the
Egyptian economy suffered from shortages in foreign currency and excessively elevated
interest rates. A series of budget reforms were conducted in order to redress weaknesses in
Egypt's economic environment and to boost private sector involvement and confidence in the
economy.
Major fiscal reforms were introduced in 2005 in order to tackle the informal
sector which according to estimates represents somewhere between 30% to 60% of GDP.
Significant tax cuts for corporations were introduced for the first time in Egyptian history.
The new Income tax Law No 91 for 2005 reduced the tax rate from 40% to 20%. According
to government figures, tax filing by individuals and corporations increased by 100%.
Given the large number of amendments to laws and regulations, Egypt has
succeeded to a certain extent in conforming to international standards. Very recently
the Cairo & Alexandria Stock Exchange (CASE) was welcomed with full membership into
the World Federation of Exchanges (WFE)—the first Arab country to be invited.

24

25
Technological Environment of Egypt:-
Egypt's IT spending is expected to increase from US$1.3bn in 2010 to US$2.1bn by
2014 and the Egyptian IT market growth is forecasted to remain below pre-economic crisis
levels in 2010, but economic recovery, tenders delayed from 2009 and higher incomes
boosted by pay raises for civil servants and other groups should help to keep sales on an
upwards trajectory.
A number of policies have been implemented to attract foreign investment in IT
outsourcing, including local employment subsidies, lower corporate taxes and deductions for
training costs. The Egyptian minister of state for administrative development has said that
200 government services will soon be available online through a new e-government portal.
The portal will offer 70 services in both English and Arabic. According to the Ministry for
Administrative Development, more than 20 government agencies currently offer services and
licenses online.
Egypt's computer hardware sales are projected at US$821mn in 2010 and are
forecast to reach around US$1.3bn in 2014.Egypt's IT market will stay hardware dominated,
with spending on PCs sustained by initiatives like the 'Computer for Every Student' and 'PC
for Every Home' programs. Hardware accounted for an estimated 62% of Egypt's IT spending
last year. Households account for 20-25% of unit sales, with almost 1-1.5mn households said
to possess a computer at present.
Overall spending on software remains rather low, which reflects the relative
immaturity of Egypt's IT market. One market driver has been a significant fall in software
piracy, with the illegal software usage rate, as measured by the Business Software
Association, falling a further 1% to 59% in 2008. While large corporations have long
understood the business case for deploying technology, small and medium-sized enterprises
is increasingly beginning to see such investments as important if they are to avoid being
overtaken by more tech-competent competitors.
In 2008, Egypt continued liberalization of the telecoms market, with the award of
a second national fixed license. This development, which followed the award of 3G licenses
to three mobile telecoms service providers in 2007, is likely to drive new opportunities for IT
vendors. As well as generating additional spending on IT products and services from the
telecoms sector, the spread of internet should provide a boost to the PC market over the next
few years.
The Egyptian IT services market is dominated by demand from government,
finance and telecoms sectors, which account for more than 25% of Egypt's total spending.

26
In Ancient Egypt: - The Geographical & Historical Setting:-
In the course of a period that lasted for several millenniums, Egypt, an ‗island
squeezed into the hollow of the Nile Valley, and bordered on the north by the Mediterranean
Sea, by deserts on the east and west, and by the infinity of the black world on the south,
created a civilization out of nothing. Behind her lay the immense empty stretch of prehistory,
in which the slightest technological achievement had required hundreds and perhaps thousand
of years of development. And then, relatively suddenly it seems, the invention of a novel
device unlocked new possibilities. This tool was probably the hafted hammer or miners pick
which, by performing as an addition of the power of the hand, without doubt instated the age
of the use of building stone and the working of quarries and mines. From then on, inventions
followed in quick succession.
This period of gestation seems to have begun in the predynastic age (fifth
millennium B.C.), and to have ended with the Thinite kings (toward 3,300 B.C.). By the time
of the first Memphite dynasties (Old Kingdom, 2778 to 2420 B.C.), when the pyramids were
built, Egyptian technology had reached complete development. Then, as if exhausted by this
great effort, which had spanned three millenniums, it made little further progress. From then
on, the same mallets, the same copper or bronze gravers, the same methods of stonecutting
and woodcutting, continued to be used. This end of progress must undoubtedly be attributed
to social life. Starting as a force of innovation by virtue of the needs it creates, society very
often becomes a hindrance to progress through tradition, routine, and the development of
misleading customs that lead to dead ends.
Egypt owes the elements of her comfort to the oily land of the Nile, with which
the Egyptians molded bricks to be used in the construction of buildings. This type of
construction could have continued indefinitely but for the chance discovery of a new need:
the desire for eternal life. Then Egypt energetically set to work to create the components of
eternity. The perishable architecture of mud, reeds, and wood was monumentalized by
transposing the same elements into stone. Pharaonic Egypt remained
faithful, however, to alluvium for her private dwellings and even for the
palaces of her kings, which continued to be built of dried brick. But her
gods and her houses of eternity had to be constructed of permanent
materials. No material was sufficiently permanent neither sandstone nor
the granite of Aswan nor the diorite from the desert. Egypt invented
techniques that still amaze us: The people of the Old Kingdom succeeded
in sculpturing with great suppleness of modeling the famous diorite statues of Chefren that
are the pride of the Cairo Museum; they raised the stones of the Great Pyramids; they lighted
the depths of the mines they exploited without being smothered by the fumes of combustion
gas from the torches. With their scanty stone or copper tools, they succeeded in piercing
cornelian beads, in carving statues of gigantic proportions from granite.
Ancient Egyptians don‘t seem very advanced compared to civilization in the
21st century, but you have to realize we are in a much more advanced time than they were.
We have had a lot more time to develop this far into computers, televisions, video games, and

27
medical knowledge. They had a shorter amount of time to develop a water clock, sundial,
pyramids and the tools to build them, and a time system.
Mummification:-
A mummy is one of the most
recognizable legacies of ancient Egypt. It has
fascinated people throughout history because it
reveals humanity — one can clearly see that this is a
human being — and yet appears to conceal identity:
its entire body, including its face, is hidden from view.
The mummy pictured below is on loan from the Carlos Museum in Atlanta,
Georgia, and can currently be seen on site at the Museum of Science, Boston. The Beth Israel
Deaconess Medical Center made available to us some of the most advanced CAT scan
imaging technology available in the Northeast, allowing us to generate about 2500 images of
the mummy to be used for the advanced 3D imaging. Mummification was an important step
to ensuring one's afterlife in Ancient Egypt — the body had to be preserved so that one's ba
— or soul — could re-enter the body for eternity. Mummification was a very effective way of
preserving a person after death and making sure that the ba would have a place to return to
for a long time to come.
Clocks
Egyptians clocks were much different from ours as well. There were two types of
clocks in Ancient Egypt—a water clock and a sundial. A water clock sounds very
complicated, but really it‘s not. It is a little stand with a pot on the top of the
stand and a pot at the bottom of the stand. The pot at the top of the stand had a
hole drilled in the side. This pot was then filled with water and the water would
flow out of the top pot down to the bottom pot. When the water was at a certain
level, it was a certain time. The only disadvantage to the water clock was that you had to keep
refilling it.
The sundial was basically a circle with numbers written around it with a little stick
in the middle. When the stick‘s shadow fell at a certain number, it was that time.
One big advantage the water clock had over the sundial was you couldn‘t use the
sundial at night and the water clock you could.
Technology in Modern Egypt
The information technology (IT) market has grown
rapidly in the last few years. The formation of a dynamic and
ambitious Ministry of Communications and Information
Technology (MCIT) in 1999 gave this sector a visible and much-
needed boost. The IT sector is growing at more than 10%

28
annually. MCIT continues to implement its ambitious plans to increase software exports,
which reached $150 million in 2003 compared to $50 million in 2000. Other national
objectives: train more skilled engineers, support E-government and E-commerce, and
increase IT awareness among the population.
Egypt's Smart Village (ESV)
The construction of the Egypt's Smart Village is an initiative designed to provide a
high tech environment necessary to attract IT companies to set up offices in Egypt. It is
located on a 300-acre park just 20 minutes away from downtown Cairo, 10km from the
pyramids and is also easily accessible from Cairo International Airport. The Smart Village
provides a state-of-the-art infrastructure catering to every company's business needs.
Upon completion of all the phases there will be 58 office plots, accommodating
approximately 30,000 employees within a total office area of 1,336,000 square meters. Any
company in the IT and Telecommunications sector can rent office spare or buy land and build
their own offices in the Smart Village.
Academy of Scientific Research and Technology of Egypt (ASRT)
Egyptian academy offering trainings, projects and seminars about scientific
research and technology. The main functions of ASRT, which was founded in 1948, are to
support research directed towards solving critical national issues; support application of up to
date technology; prepare policies to make stronger linkages involving science and technology
institutes; promote basic research and support research institutions; and progress international
affairs in science and technology. Since 1986, the Academy has been with the Minister of
State for Scientific Research, the official spokesman for ASRT activities before the political
and legislative authorities.
Abu-Ghazaleh Intellectual Property (AGIP)
On 20 April 2000 a memorandum of understanding has been electronically signed
between the Egyptian Academy of Scientific Research & Technology, and the GCC Patent
Office. The memorandum was signed by Dr. Mohammed Yousry, Head of the Academy and
by Mr. Mohammed Al-Ali Al-Rasheed, General Director of the Patents Office.
Dr. Fawzi El-Rafi, Deputy to the Head of the Academy for Technological
Development and Scientific Services, announced that this memorandum provides that the
Egyptian Center examines patents for the GCC whether they are Arab, Egyptian or Foreign
Egyptian Academy will also participate in training and the creation of technical cadres as
well as exchange views on various issues relating to industrial property in the light of
international changes and new supposed to provide general guide to this subject, with the
availability of data Avenue, which have positive impacts on decision-making process for the
countries in the world Granting a patent to prove the seriousness with which is one of the
conditions for granting patents .

29
National Research Center (NRC)
President: Prof. Dr. Hany El Nazer
Address: El Buhoth St.., Dokki, Cairo, Egypt.
Tel.: (+202) 33371362 /433/615/933/449
Fax: (+202) 33370931
Postal Code: 12311
Email: [email protected]
Web: www.nrc.sci.eg
NRC was established as an independent public organization in 1956, with the aim
‖to foster basic and applied scientific research, particularly in industry, agriculture, public
health and other sectors of national economy‖. It is the largest of all institutions affiliated to
the ministry of Scientific Research and employs about 60% of all scientists working in these
institutions.
Between the 6os and 80s of the last century six divisions of NRC developed into
independent research institutes:
The national Institute of standards.
Petroleum research institute.
Central metallurgical research institute.
Theodore Bilharz institute.
Northern Coast Technology Valley (NCTV) (Under development)
This proposed techno pole is still at the study stage. The project is being
considered by Alexandria Governorate, the Ministry of Higher Education, and the Ministry of
State for Scientific Research and the Social Fund for Development.
Technologies for Agriculture (TECA) FAO
TECA is an FAO initiative that aims at improving access to information and
knowledge about available proven technologies in order to enhance their adoption in
agriculture, livestock, fisheries and forestry thus contributing to food security, poverty
alleviation and sustainable development.
Fishing Technologies from FIGIS
Fish capture technology encompasses the process of catching any aquatic animal,
using any kind of fishing methods including artisanal fisheries, normally operated from a
vessel.
Biotechnologies in Use in Developing Countries (FAO-BioDeC)
Meant to gather, store, organize and disseminate, updated baseline information on
the state-of-the-art of crop biotechnology products and techniques, which are in use, or in the
pipeline in developing countries.

30
Space technology centre
The Centre develops systems for autonomous spacecraft piloting and the
management of spacecraft data both onboard and on the ground.
http://spacetech.computing.dundee.ac.uk/
The Nuclear Research Center (NRC)
One of four research centers under the Atomic
Energy Authority (AEA) is the oldest and the biggest
research institute in the AEA. Its activities are directed
towards the basic nuclear sciences, the front end of the
nuclear fuel cycle, the reactors and the applications of
radioisotopes in medicine, industry, and agriculture. The
center houses research and service facilities,
including: National Center for Radiation Research&
Technology (NCRRT), National Research Institute of
Astronomy and Geophysics (NRIAG), Centre for Remote
Sensing.
Satellite
Egypt and Italy to Build Deserts at Egypt is signing an agreement with Italy to
build and launch an environmental satellite. The Italian Space Agency and Egypt's National
Authority for Remote Sensing and Space Sciences will jointly develop and launch Deserts at.
The spacecraft will be used to monitor coastal erosion, desertification, and agricultural and
water resources. No timeline was provided.
The satellite will use the Microsatellite Italiano di Technologia Avanzata (MITA)
platform, which weighs about 50 kg and can accommodate payloads of 100 to 300 kg. The
platform is reported to cost about 5 million Euros.
The project will be conducted in four stages: training of Egyptian engineers and
technicians, design, satellite production, and launch. The program may include the
construction of a land station for receiving and processing satellite images.

31
Research & Development Expenditure (% of GDP) in Egypt:-
The Research and development expenditure (% of GDP) in Egypt was 0.21 in
2009, according to a World Bank report, published in 2010. Expenditures for research and
development are current and capital expenditures (both public and private) on creative work
undertaken systematically to increase knowledge, including knowledge of humanity, culture,
and society, and the use of knowledge for new applications. R&D covers basic research,
applied research, and experimental development. The graph showing this as follows:-
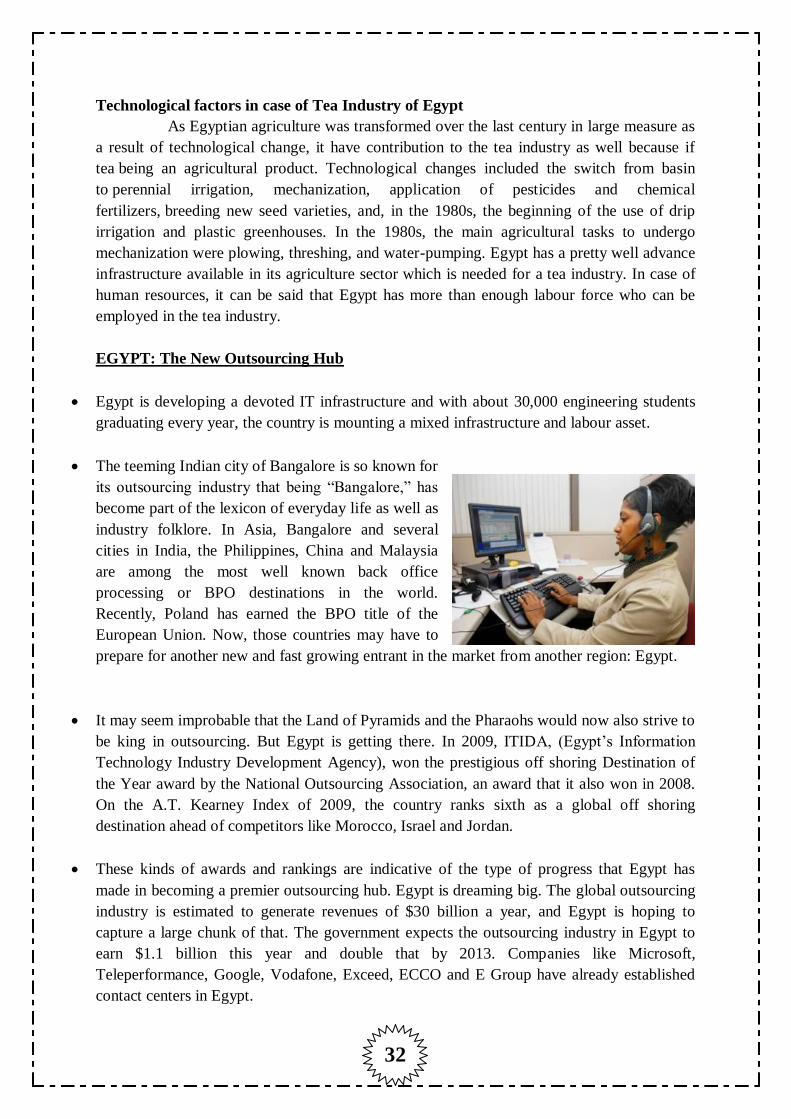
32
Technological factors in case of Tea Industry of Egypt
As Egyptian agriculture was transformed over the last century in large measure as
a result of technological change, it have contribution to the tea industry as well because if
tea being an agricultural product. Technological changes included the switch from basin
to perennial irrigation, mechanization, application of pesticides and chemical
fertilizers, breeding new seed varieties, and, in the 1980s, the beginning of the use of drip
irrigation and plastic greenhouses. In the 1980s, the main agricultural tasks to undergo
mechanization were plowing, threshing, and water-pumping. Egypt has a pretty well advance
infrastructure available in its agriculture sector which is needed for a tea industry. In case of
human resources, it can be said that Egypt has more than enough labour force who can be
employed in the tea industry.
EGYPT: The New Outsourcing Hub
Egypt is developing a devoted IT infrastructure and with about 30,000 engineering students
graduating every year, the country is mounting a mixed infrastructure and labour asset.
The teeming Indian city of Bangalore is so known for
its outsourcing industry that being ―Bangalore,‖ has
become part of the lexicon of everyday life as well as
industry folklore. In Asia, Bangalore and several
cities in India, the Philippines, China and Malaysia
are among the most well known back office
processing or BPO destinations in the world.
Recently, Poland has earned the BPO title of the
European Union. Now, those countries may have to
prepare for another new and fast growing entrant in the market from another region: Egypt.
It may seem improbable that the Land of Pyramids and the Pharaohs would now also strive to
be king in outsourcing. But Egypt is getting there. In 2009, ITIDA, (Egypt‘s Information
Technology Industry Development Agency), won the prestigious off shoring Destination of
the Year award by the National Outsourcing Association, an award that it also won in 2008.
On the A.T. Kearney Index of 2009, the country ranks sixth as a global off shoring
destination ahead of competitors like Morocco, Israel and Jordan.
These kinds of awards and rankings are indicative of the type of progress that Egypt has
made in becoming a premier outsourcing hub. Egypt is dreaming big. The global outsourcing
industry is estimated to generate revenues of $30 billion a year, and Egypt is hoping to
capture a large chunk of that. The government expects the outsourcing industry in Egypt to
earn $1.1 billion this year and double that by 2013. Companies like Microsoft,
Teleperformance, Google, Vodafone, Exceed, ECCO and E Group have already established
contact centers in Egypt.

33
And the Egyptian government is playing its part. ITIDA, which is affiliated with Egypt‘s
Ministry of Communications and Information Technology, has been aggressive in promoting
Egypt as an outsourcing destination. Not only does it train 3,000 students every year as call
centre representatives, but ITIDA is offering to match the difference if any other market
offers lower costs. Egypt is also rapidly developing its information infrastructure. High-tech
business parks like the Smart Village, set up in 2003 on the outskirts of Cairo, can employ
nearly 35,000 workers. Also coming up is the Maadi Contact Centre Park, which can seat
60,000 workers.
So why has Egypt become a hot BPO destination? The advantages are many. Egypt has
proved that it can make costs just as competitive as those, for example, in India or the
Philippines. In addition, it boasts of a multi-lingual workforce fluent in Arabic, English,
German, Spanish and Italian. As well, the country is just four hours away by flight to many
places in Europe, and its time zone overlaps European business hours better than India or the
Philippines. What‘s more, Egypt works on Saturdays and Sundays, offering quality
outsourcing even on those traditionally weaker days. (Egypt‘s ‗weekend‘ falls on Thursday
and Friday). These are the sort of competitive advantages that should be giving governments
in India and the Philippines sleepless nights.
Of late, the Middle East seems to be popping up with surprises. Now, Egypt is giving India a
run for its money. With extensive government backing, it may not be too long before
‗Cairoed‖ becomes part of the outsourcing lexicon.

34

35
Economy Stats: Egypt Vs. India:-
Egyptian Economy stats
Indian Economy
stats
Leader
President: Mohammed Mursi
President: Pranab Mukherjee
Aid as % of GDP
1.3% Ranked 79th. 3 times more than India
0.3% Ranked 113rd.
Economic freedom
1.65 Ranked 112nd. 10% more than India
1.5 Ranked 123rd.
Exports to US
$356,100,000.00 Ranked 61st.
$3,233,200,000.00 Ranked 19th. 8 times more than
Egypt
GDP
$334,400,000,000.00 Ranked 33rd in 2006.
$4,164,000,000,000.00 Ranked 5th in 2006. 11 times more than Egypt
GDP growth > annual %
4.94 annual % Ranked 84th in 2005.
9.23 annual % Ranked 14th in 2005. 87% more than Egypt
GDP (per capita)
$4,435.20 per capita Ranked 116th in 2006. 18% more than India
$3,751.99 per capita Ranked 121st in 2006.
GDP per capita in 1900
$509.00 Ranked 40th.
$625.00 Ranked 38th. 23% more than
Egypt
GDP per capita in 1950
$517.00 Ranked 52nd.
$597.00 Ranked 49th. 15% more than
Egypt
GDP per capita in 1973
$947.00 Ranked 49th. 11% more than India
$853.00 Ranked 50th.
GDP > PPP
$282,026,000,000.00 Ranked 30th.
$3,362,960,000,000.00 Ranked 4th. 11 times more than Egypt
Gross national income >
constant LCU
472780500000 28322300000000
Human Development
Index
0.659 Ranked 120th. 9% more than India
0.602 Ranked 128th.
Income distribution >
Poorest 10%
4.4% Ranked 5th. 26% more than India
3.5% Ranked 22nd.
Income distribution >
Richest 10%
25% Ranked 91st.
33.5% Ranked 38th. 34% more than
Egypt
Population under $1 a day
3.1 Ranked 51st.
44.2 Ranked 11th. 13 times more than
Egypt
Poverty > Share of all poor
people
0.18 % of world's poor Ranked 33rd.
41.01 % of world's poor Ranked 1st. 227 times more than
Egypt
Research and development
spending
1.9% Ranked 13th. 2 times more than India
0.6% Ranked 39th.
Technological achievement
0.24 Ranked 51st. 20% more than India
0.2 Ranked 59th.
Wealthier Person Nassef Sawiris ($3.1bn US) Mukesh Ambani ($19.5bn US)
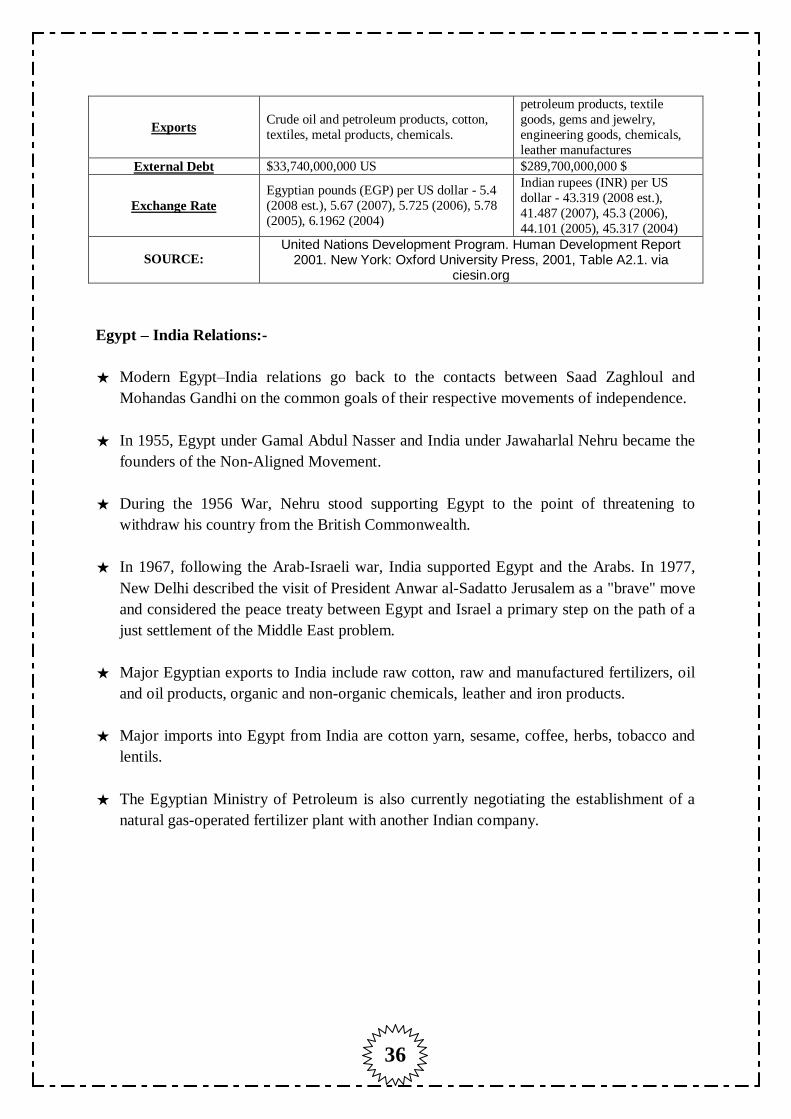
36
Exports Crude oil and petroleum products, cotton,
textiles, metal products, chemicals.
petroleum products, textile
goods, gems and jewelry,
engineering goods, chemicals,
leather manufactures
External Debt $33,740,000,000 US $289,700,000,000 $
Exchange Rate
Egyptian pounds (EGP) per US dollar - 5.4
(2008 est.), 5.67 (2007), 5.725 (2006), 5.78
(2005), 6.1962 (2004)
Indian rupees (INR) per US
dollar - 43.319 (2008 est.),
41.487 (2007), 45.3 (2006),
44.101 (2005), 45.317 (2004)
SOURCE: United Nations Development Program. Human Development Report
2001. New York: Oxford University Press, 2001, Table A2.1. via ciesin.org
Egypt – India Relations:-
* Modern Egypt–India relations go back to the contacts between Saad Zaghloul and
Mohandas Gandhi on the common goals of their respective movements of independence.
* In 1955, Egypt under Gamal Abdul Nasser and India under Jawaharlal Nehru became the
founders of the Non-Aligned Movement.
* During the 1956 War, Nehru stood supporting Egypt to the point of threatening to
withdraw his country from the British Commonwealth.
* In 1967, following the Arab-Israeli war, India supported Egypt and the Arabs. In 1977,
New Delhi described the visit of President Anwar al-Sadatto Jerusalem as a "brave" move
and considered the peace treaty between Egypt and Israel a primary step on the path of a
just settlement of the Middle East problem.
* Major Egyptian exports to India include raw cotton, raw and manufactured fertilizers, oil
and oil products, organic and non-organic chemicals, leather and iron products.
* Major imports into Egypt from India are cotton yarn, sesame, coffee, herbs, tobacco and
lentils.
* The Egyptian Ministry of Petroleum is also currently negotiating the establishment of a
natural gas-operated fertilizer plant with another Indian company.

37
Economic Relations
India is the 4th largest trade partner of Egypt after the US, Italy & Saudi Arabia.
Oil:-
In 2003, Indian giant Reliance signed a contract with the Egyptian General Petroleum
Corporation (EGPC) to import 8 shipments of raw oil in 2003. Two years preceding the
contract, they had imported shipments from Egypt. In August 2004, the Indian company
GAIL procured 15% of the Egyptian Company Nat Gas which deals with marketing and
distributing natural gas in Egypt. Egyptian and Indian ministers of petroleum met in 2004 in
Egypt to discuss the prospect of investment and purchase of oil and gas from Egypt. In 2003,
Indian giant Reliance signed a contract.
Power:-
In 2008, India's KEC International Limited, received its largest order worth 636 crore
(US$120.2 million) from Egyptian Electricity Transmission Company. The order was funded
through the European Investment Bank and the Egyptian National Bank. The order included
design, supply and construction of power transmission towers and laying of 196 km of
transmission lines in Egypt. It was completed on a turnkey basis within a period 24 months.
This, however, was not the first time. KEC International has been laying power transmission
lines in Egypt for more than 40 years. Recently, KEC International was engaged in a 60 crore
(US$11.34 million) contract for supply of overhead transmission towers for the Egypt-Jordan
Transmission Line.
Investments:-
In 2011, Egyptian investment in India was at about USD 30 million. El Sewedy
group, an Egyptian company, manufactures Electric meters in India. Another Egyptian
company, Orascom Telecom, used to have 10% stake in the then Hutchinson-Essar which has
since been bought by Vodafone.
The current Indian investment in Egypt stands at $2.5 billion in about 45 projects.
Alexandria Carbon Black, the Alexandria Fibre Co., Dabur India's production facility for its
cosmetics line, Niletex, Auto Tech Engineering, Marico's acquisition of two hair care brands
and the Sanmar Group's acquisition of a unit of Trust Chemicals of Egypt represent some of
the main Indian investments in Egypt. GAIL has equity and management stake in two gas
distribution ventures in Fayoum and Cairo as well as in Natgas. In March 2008, Gujarat State
Petroleum Corporation Ltd (GSPC) signed a Concession Agreement for two oil and gas
exploration blocks in Egypt. GSPC subsequently acquired three more exploration blocks in
the Red Sea region in 2010. Satyam Computers and Wipro have set up global delivery centers
in Cairo. The Oberoi Group has been managing a hotel and Nile cruises; Kirloskar Brothers
assemble diesel engines and irrigation pump sets in Egypt; Ranbaxy has an Egyptian
subsidiary for manufacturing pharmaceutical formulations; Ashok Leyland, Tata Motors,
Maruti Suzuki and Mahindra & Mahindra are marketing their vehicles in Egypt, and Bajaj
Auto dominated the three-wheelers market.

XIII

XIV
WEBSITES:-
http://www.mop.gov.eg/MOP_META/nsdp.htm
http://knowledgepipe.blogspot.in/2010/05/egypt-pest-analysis.html
http://www.egypttravelsearch.com/egytec.html
http://www.scribd.com
http://www.nationmaster.com/compare/Egypt/India/Economy
http://www.ifitweremyhome.com/compare/EG/IN
http://www.aneki.com/comparison.php?country_1=India&country_2=Egypt
http://www.economywatch.com/world_economy/egypt/indo-egypt-trade-relation.html
http://www.tradingeconomics.com
http://www.wiki.eg

A
Global Country Study Report
On
“The Jute Industry of Egypt”
In the Partial Fulfillment of the Requirement
Of the Award of the Degree of
Master of Business Administration
In
Gujarat Technological University
Semester IV (2011 – 2013)
Submitted By:-
Name Enrollment
No.
Atish S. Shah 117240592003
Jacky P. Shah 117240592007
Harshit B. Shah 117240592011
Trushal B. Ka. Patel 107240592054
Guided By:-
Dr. Hitesh Kumar Shah
Asst. Prof. KSMCS
Submitted To:-
K. P. Patel School of Management & Computer Studies
Jeevanshilp Campus, Kapadwanj.
Affiliated To
Gujarat Technological University


I
Students’ Declaration
We Atish Shah, Jacky Shah , Harshit Shah and Trushal Ka.Patel hereby declare
that the report for Global Country Study Report entitled “The Jute Industry of Egypt” is a
product of our personal efforts & our thanks to other work, publications, references, if any
have been duly acknowledged.
Place: - Kapadwanj
Signature:-
Date: - 31th March, 2013.
Atish S. Shah
Jacky P. Shah
Harshit B. Shah
Trushal B. Ka.patel

II
Preface
“Experience is the best teacher.” This saying has played a guiding role in
including as a part of the curriculum of the M.B.A Programs of the Gujarat
Technological University. Reasonably often these days’ inhabitants discuss on practical
knowledge, both in academic institutions and outside. At each and every aspect in life we
require some sort of theoretical and practical knowledge. It means only classroom lecture
may not be enough to get the proper knowledge either in the business field or social life. This
global country report on various PESTAL Analysis of different sectors and industries of Egypt
in Semester - 4 would allow us to know the various environmental factors study and how to
interlink that county or to interpret the study in our countries context, and it allow the student
study real Business Environments.
We know that Project is for the development and enhancement of the
knowledge in this particular field. It can never be possible to make a mark in
today’s competitive era only with theoretical knowledge when industries are developing
at global level, practical knowledge of administration and management of business is
very important. Hence, such kind of platform is of great importance for a student and full
efforts should be made to capitalize on it.
With a view to expand the boundaries of thinking, we have undergone Global
Country Study Report (GCSR) in second year of MBA (sem-4) .We have made deliberate
efforts to collect the required information about the Jute Industry of Egypt to fulfill project
objective as to creating an environment or platform for our country to make handy business of
Jute with Egypt.

III
Acknowledgement
Any work accomplishment is seldom on personal achievement there are usually
many people behind it who contribute to its goodness in form or the other. To
acknowledge is very great way to show your gratitude towards the people who have
contributed in your success in one or other way.
We find words inadequate to express our gratitude to Dr. Hitesh Kumar Shah (Asst.
Professor) for providing us an opportunity to carry out our Global Country Study Report
(GCSR) for his continuous guidance and supervision and support during the project. We
sincerely thank him, despite his tight schedule spared time for discussions and gave basic
ground rules and directions, without which completion of this project would have been
impossible.
We are highly grateful to the management of K. P. PATEL SCHOOL OF
MANAGEMENT for giving us the opportunity to work on this Project and in the process
enrich ourselves with immense learning on all aspects.
We take this opportunity to thank our Director Sir – Dr. Hrudanand Misra and all
other faculties for their encouragement and the office staff for providing us all the
facilities for preparing this report more learning oriented.
At last but not the least we also express our feeling of gratefulness to all those who
directly or indirectly have inspired us and helped us to prepare this report.

IV
Executive Summary
Egypt's Economical & Technological system here refers to the economical &
technological structure, GDP, inflation rate, consumer index, technological changes &
diffusions that are implemented in Egypt's mainland and regulate the state power,
government, and the relationships between the state and society in the People's of Egypt since
its founding. This report contains both economical and technological situation and
accordingly the all analytical study of the whole Jute Industry of the Egypt and India the
objective was to find the opportunity of business & to start the business of Jute or to export
the row jute and jute products in the Egypt. The aim was to go through this report how
the different business of different sectors runs in Egypt and what government policy and
political situation are benefited to Indian country. As per the report the economical &
technological situation is having well for Indian business. Project work helps to deal with
the real government policy and party of different country like Egypt. Project report consists of
the brief description of an Egyptian Jute Industry data and tradition, different technological
principal in Egypt, and also constitutional frame work of Egypt section which provide the
overview and background information about the country different aspects, other section of
the report like different export, import and consumption of Jute and Jute Products in the
Egypt and also for the whole world. The tables and graph provides
different information like export, import and consumption, etc. & for us and government,
these data are very useful to assume or forecast how the Egyptian economical and
technological situation are strong for developing the business opportunities for India specially
for the Jute Industry.
Macro economics enriches our knowledge of the functioning of an economy by
studying the behavior of national income, productivity, investment, savings and
consumption. Furthermore, it throws much light in solving the problems of joblessness,
inflation, economic instability and economic growth. The concept of stock and flow are
mainly used in the macro economics or in the theory of income, productivity and
employment. Lastly, both the concepts of stock ad flow variables are very significant in
modern theories of income, interest rate, business cycles etc.
During the fourth quarter of 2009, the Egypt economy started emerging from the
recession that had started in the same period a year earlier. In this quarter the year-on-year
decline in economic activity of advanced economies was only 0.7%, compared to 4.6% in
the first quarter. It is expected that positive growth will be recorded from the first quarter of
2010, with most major developed economies participating in this turnaround. However,
recovery will be slow – economic growth of about 2.0% is expected in this economic
grouping in 2010.
V
Jute Industrial sector is an important segment of Indian economy. Jute has been the
most versatile natural fibre. The jute sector produces products ranging from low value geo-
textile to high end garments, decorative, upholstery etc. A lot of the jute plants are currently
connected in producing jute blended threads. Jute business situation in India have been
changed as of building customary canvas to high end style garments. Jute industry in India
contributes a key role in the economy. The jute export counts to about 1000 crore. The
import of raw jute has been dropped by 66 per cent in 20008-09. The EXIM policy has
announced duty free for import of raw jute. Indian Jute industry may think following idea;
it is the circumstance of the whole world for producing value added products out of jute
material. Marketing and promotion of jute has been a major problem, and so the
government and industry should come forward and take adequate steps in this direction like
highlighting its eco-friendly and biodegradable characteristics. Labour problem is one of
the major troubles faced by the jute industry. For its solution government and industry
should piece of equipment a tri-party agreement between government, mill owners and the
trade unions, so as to overcome loss of work by strikes, lockouts, law off, closure of mill,
etc. The Indian jute industry is having lots of opportunity by its side; it is not only one of
the oldest industries of India but also among the major employer of the nation. There are a
lot of strengths and also much opportunity to grab them but it could only be done if it
overcomes its weaknesses and threats. Jute, the golden fibre, has a potential of reaching the
height where it used to be in the past, but it is only possible through constant efforts by
government and a proper follow-up by the industry. If the government removes all the
hurdles that are stated above then the jute industrial economy will flourish lot although not
impervious to conditions in advanced economies, emerging economies fared significantly
better in 2009. Egypt and India did particularly well, with the latter recording a GDP
growth rate of 4.6% in 2009 & 5.1% in 2010.
Jute Industry Delegates Leave for Egypt:-
The following discussion or points show that why India goes to start the business
of Jute in Egypt and the points are taken from the report of the Business Standard.
Delegates representating the jute industry will leave today for Egypt and Turkey for
promoting business for the golden fibre industry.
The delegation will have representation of Indian Jute Mills Association (Ijma),
Hastings Jute Mill, Howrah Jute Mill, National Jute Manufacturers Corporation
(NJMC) and Jute Manufacturers Development Council (JMDC).
During the programme, government officials and jute industry experts will explore the
business prospects and focus on effective market building in the two countries with
special emphasis on jute yarn and hessian.

VI
The delegation will meet the Egyptian manufacturers for supply of yarn and hessian.
India holds a greater market share for yarn in Egypt than Bangladesh, while for hessian
the latter enjoys a greater share than India.
The team of jute experts will study the market structure and the competitive advantage
enjoyed by Bangladesh in Egypt and Turkey. Accordingly necessary steps will be taken
to promote trade between the concerned countries and India.
The delegation will visit a number of places like Ankara, Adena and Istanbul. In
Turkey, we will concentrate on hessian, yarn and odour free bags devoid of
hydrocarbon, said S Bhattacharya, secretary of JMDC who is a part of the delegation.
The odour free bags have been specially manufactured with Indian technology.
The export of jute goods from India to Turkey stands at 15,000 tonnes. of which 10,000
tonnes are yarn. Turkey is a growing market for jute yarn. Half the total exports of jute
goods from India to Turkey is jute yarn.
The jute industry has been expanding really fast spanning from a wide range of life
style consumer products, with all courtesy to the versatility of Jute. Innovative ways of
bleaching, dyeing and finishing processes –the jute industry now provides finished jute
products that are softer, have a luster and also an aesthetic appeal.
Changing Scenario of Jute industry:
At present, jute has been defined as an eco-friendly natural fiber with utmost
versatility ranging from low value geo-textiles to high value carpet, apparel, composites,
decorative, upholstery furnishings etc.
In future, a number of jute mills and mini-jute plants have been seen to be engaged in
jute products and jute blended yarns. We all know that the uses of jute are manifold, with the
traditional usage pattern remaining constricted to packing, hessian and carpet backing.
The jute sector in India engages a key role in the Indian economy, providing direct
employment to about 0.26 million workers, and supporting the lives of around 4.0 million
farm families. Around 0.14 million people are believed to be engaged in the tertiary sector,
that supports the jute industry. Currently it also contributes to exports to the tune of about `
1000 crore.
India is the largest producer of jute goods in the world, while Bangladesh is the
largest cultivator of raw jute. The cultivation of Jute in India is mainly confined to the
eastern region states - West Bengal, Bihar, Assam, Tripura, Meghalaya, Orissa and Uttar
Pradesh. Nearly 50 percent of total raw jute production in India alone figures in West
Bengal.

VII
In India 4000,000 families are involved in the cultivation of raw jute. There are 76
jute mills in India and nearly 1,37,679(Oct.2001) people are employed in these mills. Several
thousand other people are engaged in several jute related diversified goods. India is also self
sufficient in the jute seed production. More than 90 percent of seeds are produced by the
state seed corporation of Andhra Pradesh and Maharashtra.
Jute, as a natural fibre, has many inherent advantages like lusture, high tensile
strength, low extensibility, moderate heat and fire resistance and long staple lengths. It is a
biodegradable and eco-friendly. It has much advantage over synthetics and protects the
environment and maintains the ecological balance.
Due to declining economic activity, infrastructure bottlenecks in terms of electricity
supplies and transport and harbor capacities, as well as the shortage of skilled and
experienced human resources, eased temporarily in 2009. Increasing economic activity in
2010 will put renewed pressure on these infrastructure components. With regard to export
logistics through the Richards Bay Coal Terminal, rail capacity remained a serious problem
even during the recession.
Future Scenario for Jute Industry:-
From the whole study and report we can forecast about the future scenario of Indian
Jute Industry and how we can develop or maintain the relations with other countries such as
Egypt, Thailand, etc. as follows:-
The protection given to the jute growers as well as jute industry is unique specially
after the promulgation of the Jute Packaging Materials (obligatory utilize in packing supplies)
Act 1987 (JPM Act 1987) whereby 30-40 percent of the production of the jute industry is
absorbed by Food Corporation of India and other State Government agencies. The jute
industry will have to take a view on such continued protection and subsidies and take
alternative steps to ensure the continuity and growth of this sector.
In spite of a number of Plan schemes, protection to the industry in the form of the
JPM Act, assistance through UNDP and CCF schemes in the past the jute industry has not
been able to maintain a steady growth pattern. During the Eighth Plan Period the average
annual production was to the tune of 14.04 lakh MT and, in the Ninth Plan period, the
corresponding figure was 16.18 lakh M.T representing an increase of 15.25 percent. During
the last two decades this difference represents the only significant growth in production of
jute goods.
The Jute Technology Mission which will be formally launched in this Plan Period
aims at a holistic improvement of this sector and is a golden opportunity for the industry in
sustaining itself independently in the years to come. Moreover, the National Jute Policy
announced in April 2005 is also unique in the 150 years of the jute industry. The following
table shows the target of India for Jute Industry.

VIII
Table: Eleventh Five Year Plan targets at a glance: Item Target for 2012-13
Production of raw jute & Mesta 129 lakh bales
Production of jute goods 20 lakh MT
Domestic consumption of jute goods 15.5 lakh MT
Export of jute goods 4.5 lakh MT, Traditional 3 lakh MT &
JDPs 1.5 lakh MT
Import of raw jute 95,000 MT annually
Import of jute goods 25,000 MT annually
Suggestions to Achieve the Targets:-
The VAT of 12.5 percent imposed on all jute goods except sacks, bags and yarn needs to
be reviewed and brought down to a lower slab. In particular, this will help in promotion
of diversified jute goods.
Under Mini Mission IV of the Jute Technology Mission, there is a separate scheme for
setting up of jute parks. The jute parks are supposed to have assured power supply,
exhibition/ marketing halls, warehousing, testing laboratories for yarn, fabric dyeing,
bleaching plants besides providing common facilities like roads, effluent treatment plants,
sanitation, sewerage, drainage systems, and state-of-the-art telecommunication facilities.
Branches of commercial banks, Office of the Custom & Excise Department as well as
Sales Tax Department would be there to ensure quick clearance of shipment.
There is a need to set up new JRMBs in states, which have not been covered.
A newsletter could be brought out in regional languages containing information about
opportunities and latest developments in the jute sector. This material could be circulated
among all beneficiaries of various programmes.
To prevent highly active and successful NGOs from migrating to other areas they could
be oriented to explore the export market. NCJD can assist by providing information on
future overseas marketing events besides documentation etc.
Standardization of product quality by dissemination of detailed designs can help in
getting better market value.

IX
Comparison of the Egypt and Other countries for Jute:
Top 10 countries in the world World share for Egypt
Egypt is #11 in the world ranking. Egypt has a world share of 0,1%.
Thus the above graph show the jute data for Egypt and India and the blue line is for
Egyptian Jute Industry and Orange line for the Indian Jute Industry which far above than the
Blue line so, it is good for the Indian context.
Thus from the whole study we can summarise as Egypt’s Economy ranked 27th
in the
world economies having the currency as the Egyptian pound (EGP) and in Jute 11th
rank.
Thus from the whole study we can derive the relations of Egypt & India as, bilateral
relations between Egypt and India. Modern Egypt–India relations go back to the contacts
between Saad Zaghloul and Mohandas Gandhi on the common goals of their respective
movements of independence. Major Egyptian exports to India include raw cotton, raw and
manufactured fertilizers, oil and oil products, organic and non-organic chemicals, leather and
iron products. Major imports into Egypt from India are cotton yarn, sesame, coffee, herbs,
tobacco and lentils.
Economic relations: India is the fourth largest trade partner of Egypt after the US, Italy and
Saudi Arabia. Thus India can export the row jute in Egypt.
According to the department of commerce and Industry in India, Indian exports to
Egypt have touched $ 423.68 million in 2004 which is up by 15.29% and the imports from
Egypt have reached $ 137.27 million in the same year which is up by 39.77%.
The main exportable items from India were Iron and steel, Jute yarn, Plastic and
rubber, Chemicals and engineering goods.
Currently, the global market is concerned about sustainability issues to cope with the
climate change and global warming. Consumers’ preferences switch to eco-friendly products
and services. This change in consumer orientation synergizes with the ecological advantages

X
of jute products. The benefits of jute-made products are durable, recyclable, termite resistant,
and ultraviolet resistant. These eco-friendly characteristics are key for the future jute market.
These inherent attributes of jute can fulfill the demand of green products. In the ambience of
climate change threats with corresponding demand for green and recyclable products, jute-
made bags, jute handbags, jute home decorative, and footwear and jute coverings provide
sustainability solutions and open new opportunities for the jute market.
Porter’s five force model analysis is purely explain us that India has great opportunity
for exploring the trade of Jute in the Egypt as the Egypt is far behind as compared to India
and thus according to above discussion the Indian Jute Org. can establish the Jute industry in
the Egypt and it can be the greatest opportunity by considering the above five forces into
consideration. As:
1. Threat of New Entrances (Low)
2. Bargaining Power of Buyers (High)
3. Bargaining Power of Suppliers (High)
4. Threat of Substitute Products (High)
5. Rivalry Among Existing Competitors (Low)
We have picked up some Points of SWOT Analysis through this study:-
From the whole report we have picked up some of the strengths & weaknesses for
Egypt to conduct and establish a bounded business relations and to strengthen it for our
country so they are as follows:-
Strengths:
Advancement of jute-fiber technology and bio technology. India also has the national
research center of jute and kenaf.
India is normally the largest producer of jute products.
Business form of joint venture will support the cost reduction in investment in Egypt.
Weaknesses:
Quality certificate for jute products from India may not be accepted in Southeast Asian -
African nations.
Lack of cooperation between jute related organizations and governments in India.
Environmental problems.
Opportunity:
Raising demand of green products in Markets across the world and Egypt.
Market in Egypt means a market for foreigners, because Egypt is one of the most
attractive tourist countries.
Threats:
Market perception is still thinking that jute products are belonged to traditional market,
for example sacks.
XI
Thus from the above SWOT Analysis we can conclude that the India has the
dominating position in the world in the Jute Industry as it is the highest manufacturers and
producers of Jute and Jute Products and so it is the strongest point for us to start the business
with any country and this strength will eat out the other weaknesses and threats and thus,
India has the greatest opportunity to start the business of the Jute in Egypt as it is far behind
from the India.
Thus, Indians can enter into Egyptian Jute Industry by following forms of business:
Sole Proprietorship
Partnership
(1) Unregistered ordinary partnership
(2) A limited partnership
Private Limited Company
Public Limited Company
Regional Offices
Joint Venture
Taking into the consideration the two main trade barriers as:-
(i) Problems of Certification
(ii) Legal Barrier
At last we feel great pleasure to present our study & to conclude it here.
From the Whole Study we can Conclude that:-
In Egypt, the raw materials of home furnishing industry and decorative items are
mulberry paper, water hyacinth, vetiver grass, and screw pine of Egypt. In fact, this is
called value adding to the raw materials. Jute is a kind of crops, which needs the value
adding.
India is the first country who can develop the technology of jute fibers. Traditionally, it
was hard to make the color screen on jute fibers. Also, to dye jute fibers was a
complicated process. But, currently, India has the technology of jute fiber. The fiber
technology of India can soften the jute fabrics. In other words, jute fiber from India can
be smooth, when you touch it, likely to nonwoven fabric.
Jute industry in Egypt has a very little market. Jute will bring a great business
opportunity, if Egyptian people can do a research on this material.
India has good technology in developing jute fiber in to small and delicate fiber unlike
Egyptian jute which is not advance in developing the technology and lack of research
and development.
XII
Joint venture is a future form of business cooperation between Egypt and India. India has
an advancement of fiber technology, while Egypt has a reputation of designers with the
design awards (G-Mark Award) from Japan.
Indian companies and Egyptian companies always focus to sell their products in the
high-end market, such as European market. But, India always presents itself to be the
producer of green products.
The country brand has not been recognized to Egyptian people. It is not famous in Egypt
even though, TATA brand tried to promote brand recognition but it’s still not popular in
Egypt.
The possibility to do the business in Egypt is to provide raw materials to Egypt then
production with Egyptian brand and export to other countries.
India has a lot of Non-Tariff Barrier for example the education tax.
Europe and United State appreciate Egyptian’s products which should be match with
Indian material.

XIII
Table of Content
Sr. No. Content Page No.
1. Executive Summary IV
2. Introduction to Jute & Jute Industry 1
3. Indian Jute Industry : At Glance 10
4. Egyptian Jute Industry : At Glance 14
5. Analytical Study of Egyptian Jute Industry:
Competitive Analysis
PEST Analysis
SWOT Analysis
Market Entry Mode
Trade Barriers
Recommendations From Analysis
26
27
31
33
35
37
38
6. References XIV
List of Graphs & Tables
Sr. No. Content Page No.
1. World Jute Production Table 6
2. Production of Jute in Egypt Table 15
3. Export – Import of Jute & Jute Products in Egypt Tables 16
4. Production of Jute in Egypt Table & Graph 17
5. Consumption of Jute Table 18
6. World Export – Import of Jute Tables 18
7. Domestic Jute Requirement in Egypt Table 28
8. World Jute Production Table 30

1

2
Introduction of Jute:-
Jute is a natural fibre popularly known as the golden fibre. It is one of the cheapest
and the strongest of all natural fibres and considered as fibre of the future. Jute is second only
to cotton in world's production of textile fibres. India, Bangladesh, China and Thailand are
the leading producers of Jute. It is also produced in southwest Asia and Brazil. The jute fibre
is also known as Pat, Kostas, Nalita, Bimli or Mesta (kenaf).
Jute is a natural fibre with golden and silky shine and hence called The Golden
Fibre. It is the cheapest vegetable fibre procured from the bast or skin of the plant's stem and
the second most important vegetable fibre after cotton, in terms of usage, global
consumption, production, and availability. It has high tensile strength, low extensibility, and
ensures better breath ability of fabrics.
Jute fibre is 100% bio-degradable and recyclable and thus environmentally
friendly. It is one of the most versatile natural fibres that have been used in raw materials for
packaging, textiles, non-textile, construction, and agricultural sectors. It helps to make best
quality industrial yarn, fabric, net, and sacks.
Tossa jute (Corchorus olitorius)
Tossa jute is a variety thought to be native to India, and
is also the world's top producer. It is grown for both fibre and
cooking purposes. It is used as an herb in Middle Eastern and
African countries, where the leaves are used as an ingredient in
a mucilaginous potherb called "molokhiya". It is very popular in
some Arab countries such as Egypt, Jordan, and Syria as a
soup-based dish, sometimes with meat over rice or lentils. The Book of Job, in the King
James translation of the Herbrew Bible mentions this vegetable potherb as "Jew's mallow". It
is high in protein, vitamin, beta-carotene, calcium, and iron.
On the other hand, it is used mainly for its fibre in India, in other countries
in Southeast Asia, and the South Pacific. Tossa jute fibre is softer, silkier, and stronger than
white jute. This variety amazingly shows good sustainability in the climate of the Ganges
Delta. Along with white jute, Tossa jute has also been cultivated in the soil of Bengal.
Currently, the Bengal region (West Bengal in India, and Bangladesh) is the largest global
producer of the Tossa jute variety.
History of Jute:
For centuries, jute has been an integral part of the culture of Bengal, in the entire
southwest of Bangladesh and some portions of West Bengal. During the British Raj in the
19th and early 20th centuries, much of the raw jute fibre of Bengal was carried off to
the United Kingdom, where it was then processed in mills concentrated in Dundee. Initially,
due to its texture, it could only be processed by hand until it was discovered in that city that
by treating it with whale oil, it could be treated by machine. The industry reported "jute

3
weaver" was a recognised trade occupation in the 1901 UK census, but this trade had largely
stopped by about 1970 due to the appearance of synthetic fibres.
Margaret Donnelly, a jute mill landowner in Dundee in the 1800s, set up the first jute
mills in Bengal. In the 1950s and 1960s, when nylon and polythene were rarely used, one of
the primary sources of foreign exchange earnings for the Pakistan was the export of jute
products, based on jute grown in the East Bengal, now Bangladesh. Jute has been called the
"Golden Fibre of Bangladesh." However, as the use of polythene and other synthetic
materials as a substitute for jute increasingly captured the market, the jute industry in general
experienced a decline.
During some years in the 1980s, farmers in Bangladesh burnt their jute crops when
an adequate price could not be obtained. Many jute exporters diversified away from jute to
other commodities. Jute-related organisations and government bodies were also forced to
close, change or downsize. The long decline in demand forced the largest jute mill in the
world Adamjee Jute Mills to close in Bangladesh.
Jute has entered many diverse sectors of industry, where natural fibres are slowly
becoming better substitutes. Among these industries are paper, celluloid products (films), non
– woven textiles, composites, and geo textiles. In 2006, the General Assembly of the United
Nations announced 2009 to be the International Year of Natural Fibres, so as to raise the
profile of jute and other natural fibres.
Jute Producing Countries:-
The top ten Jute Producers are: - India, Bangladesh, China, Thailand, Myanmar, Brazil,
Uzbekistan, Nepal, and Vietnam.
Jute Trade:-
The jute trade is centered on the Indian subcontinent. The major producing countries
of jute are: Bangladesh, India, China, Egypt, Thailand, and Myanmar. Bangladesh is the
largest exporter of raw jute, and India is the largest producer as well as largest consumer of
jute products in the world. Therefore, the local price of raw jute in Bangladesh is the
international price. Again, the local price of jute goods in India is the international price.
As an input to the jute manufacturing (goods) industry, the demand for jute is derived
in demand. Nearly 75% of jute goods are used as packaging materials, burlap, and sacks.
Carpet Backing Cloth, the third major jute outlet, is fast growing in importance. Currently, it
consists of roughly 15% of the world's jute goods consumption. The remaining products are
carpet yarn, cordage, felts, padding, twine, ropes, decorative fabrics, and miscellaneous items
for industrial use.

4
Jute has entered the non-woven industry as it is one of the most cost effective high
tensile vegetable fibres. Therefore, the demand for jute has made its way into the automotive
industry. Jute is now being used to manufacture more eco-friendly interiors for cars
and automobiles.
Properties of Jute:-
Jute includes good insulat ing and ant istat ic propert ies, as well as having
low thermal conduct ivity and moderate moisture regain. It includes acoust ic
insulat ing propert ies and manufacture with no skin irritat ions. Jute has the
abilit y to be blended with o ther fibres, both synthet ic and natural, and accepts
cellulosic dye classes such as natural, basic, vat, sulphur, react ive, and pigment
dyes.
Jute can also be blended with wool. By treat ing jute with caust ic soda,
crimp, softness, pliabilit y, and appearance is improved, aiding in its ability to
be spun with wool. Liquid ammonia has a similar effect on jute, as well as the
added characterist ic of improving flame resistance when treated with flame
proofing agents.
Cultivation:
Jute needs a plain alluvial soil and standing water. The appropriate weather in favor
of breeding jute (warm and wet) is accessible through the heavy rain atmosphere, during the
monsoon season. Temperatures from 20˚C to 40˚C and virtual humidity of 70%–80% are
encouraging for victorious cultivation. Jute needs 5–8 cm of rainfall weekly, and added
throughout the sowing period.
Production:
Jute is a rain-fed crop with little need for fertilizer or pesticides, in contrast to cotton's
heavy requirements. Production is concentrated in India and some in mainly Bengal. The jute
fibre arrives as of the stem and ribbon (outer skin) of the jute plant. The fibres are first
removed by retting. The retting process consists of bundling jute stems together and
immersing them in slow running water. There are two types of retting: stem and ribbon. After
the retting process, stripping begins; women and children usually do this job. In the stripping
process, non-fibrous matter is scraped off, and then the workers mine in and grab the fibres
from within the jute stem. India, Pakistan, and China are the large buyers of local jute while
the UK, Spain, Germany and Brazil also import raw jute from Bangladesh. India is the
world's largest jute growing country. The following table shows the data of Jute Production in
the word latest by the year 2012:-

5
The Jute Production Process Chart:
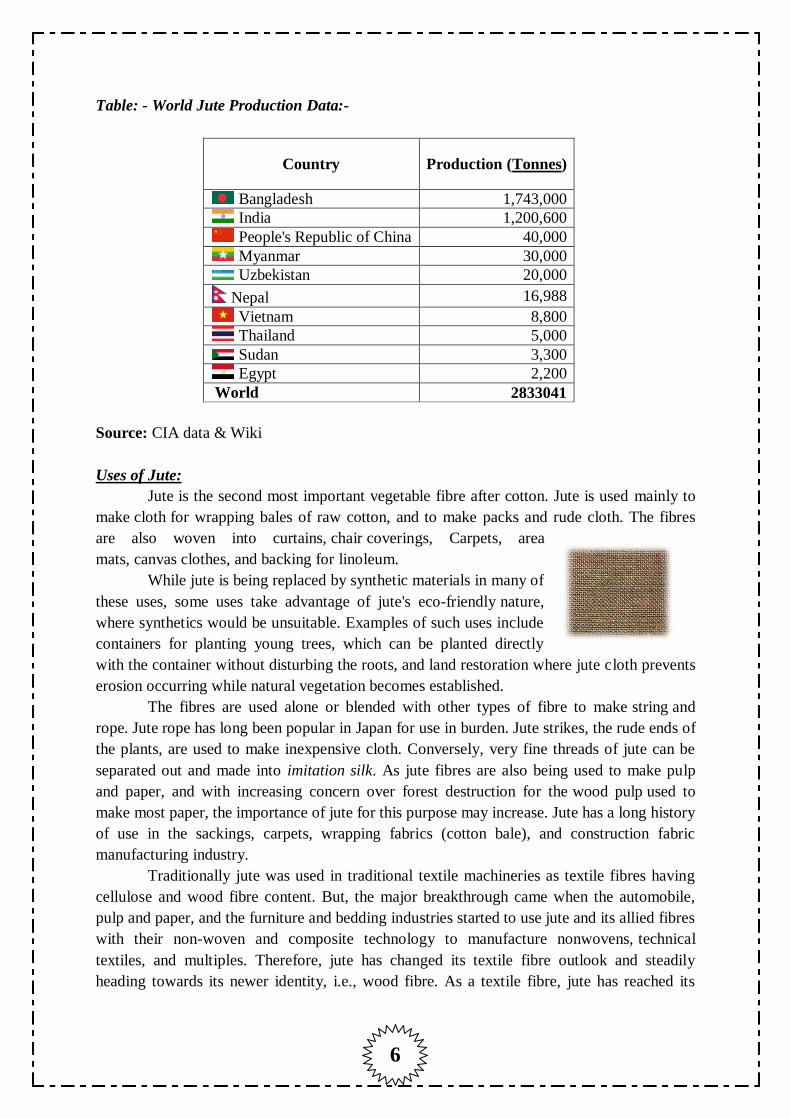
6
Table: - World Jute Production Data:-
Country Production (Tonnes)
Bangladesh 1,743,000
India 1,200,600
People's Republic of China 40,000
Myanmar 30,000
Uzbekistan 20,000
Nepal 16,988
Vietnam 8,800
Thailand 5,000
Sudan 3,300
Egypt 2,200
World 2833041
Source: CIA data & Wiki
Uses of Jute:
Jute is the second most important vegetable fibre after cotton. Jute is used mainly to
make cloth for wrapping bales of raw cotton, and to make packs and rude cloth. The fibres
are also woven into curtains, chair coverings, Carpets, area
mats, canvas clothes, and backing for linoleum.
While jute is being replaced by synthetic materials in many of
these uses, some uses take advantage of jute's eco-friendly nature,
where synthetics would be unsuitable. Examples of such uses include
containers for planting young trees, which can be planted directly
with the container without disturbing the roots, and land restoration where jute cloth prevents
erosion occurring while natural vegetation becomes established.
The fibres are used alone or blended with other types of fibre to make string and
rope. Jute rope has long been popular in Japan for use in burden. Jute strikes, the rude ends of
the plants, are used to make inexpensive cloth. Conversely, very fine threads of jute can be
separated out and made into imitation silk. As jute fibres are also being used to make pulp
and paper, and with increasing concern over forest destruction for the wood pulp used to
make most paper, the importance of jute for this purpose may increase. Jute has a long history
of use in the sackings, carpets, wrapping fabrics (cotton bale), and construction fabric
manufacturing industry.
Traditionally jute was used in traditional textile machineries as textile fibres having
cellulose and wood fibre content. But, the major breakthrough came when the automobile,
pulp and paper, and the furniture and bedding industries started to use jute and its allied fibres
with their non-woven and composite technology to manufacture nonwovens, technical
textiles, and multiples. Therefore, jute has changed its textile fibre outlook and steadily
heading towards its newer identity, i.e., wood fibre. As a textile fibre, jute has reached its

7
peak from where there is no hope of progress, but as a wood fibre jute has many promising
features.
Jute is used in the manufacture of a number of fabrics such as hessian clothes,
sacking, scrim, carpet backing cloth (CBC), and canvas. Hessian, lighter than sacking, is used
for bags, wrappers, wall-coverings, upholstery, and home furnishings. Sacking, a fabric made
of heavy jute fibres, has its use in the name. CBC made of jute comes in two types. Primary
CBC provides a tufting surface, while secondary CBC is bonded against the primary backing
for an overlay. Jute packaging is used as an eco-friendly substitute.
Diversified jute products are becoming more and more valuable to the consumer
today. Among these are espadrilles, soft sweaters and cardigans, floor coverings, home
textiles, high performance technical textiles, Geo textiles, composites, and more.
Jute floor coverings consist of woven and tufted and piled carpets. Jute Mats and
matting with 5 / 6 mts width and of continuous length are easily being woven in Southern
parts of India, in solid and fancy shades, and in different weaves like, Boucle, Panama,
Herringbone, etc. Jute Mats & Rugs are made both through Power loom & Handloom, in
large volume from Kerala, India. The traditional Satranji mat is becoming very popular in
home decor. Jute non-woven and composites can be used for underlay, linoleum substrate,
and more.
Jute has many advantages as a home textile, either replacing cotton or blending with
it. It is a strong, durable, color and light-fast fibre. Its UV protection, sound and heat
insulation, low thermal conduction and anti-static properties make it a wise choice in home
decor. Also, fabrics made of jute fibres are carbon-dioxide neutral and naturally
decomposable. These properties are also why jute can be used in high performance technical
textiles.
Moreover, jute can be grown in 4-6 months with a huge amount of cellulose being
produced from the jute hurd (inner woody core or parenchyma of the jute stem) that can meet
most of the wood needs of the world. Jute is the major crop among others that is able to
protect deforestation by industrialisation.
Thus, jute is the most environment-friendly fibre starting from the seed to expired
fibre, as the expired fibres can be recycled more than once. Jute is also used to make ghillie
suits, which are used as mask and look like grasses or brush.
Another diversified jute product is Geo textiles, which made this agricultural
commodity more popular in the agricultural sector. It is a lightly woven fabric made from
natural fibres that is used for soil erosion control, seed protection, weed control, and many
other agricultural and landscaping uses. The Geo textiles can be used more than a year and
the bio-degradable jute Geo textile left to rot on the ground keeps the ground cool and is able
to make the land more fertile. Methods such as this could be used to transfer the fertility of
the Ganges Delta to the deserts of Sahara or Australia.
Other Uses of Jute:-
Jute tails are being dried under the sun, later they will be used as fuel. Diversified
byproducts from jute can be used in cosmetics, medicine, paints, and other products
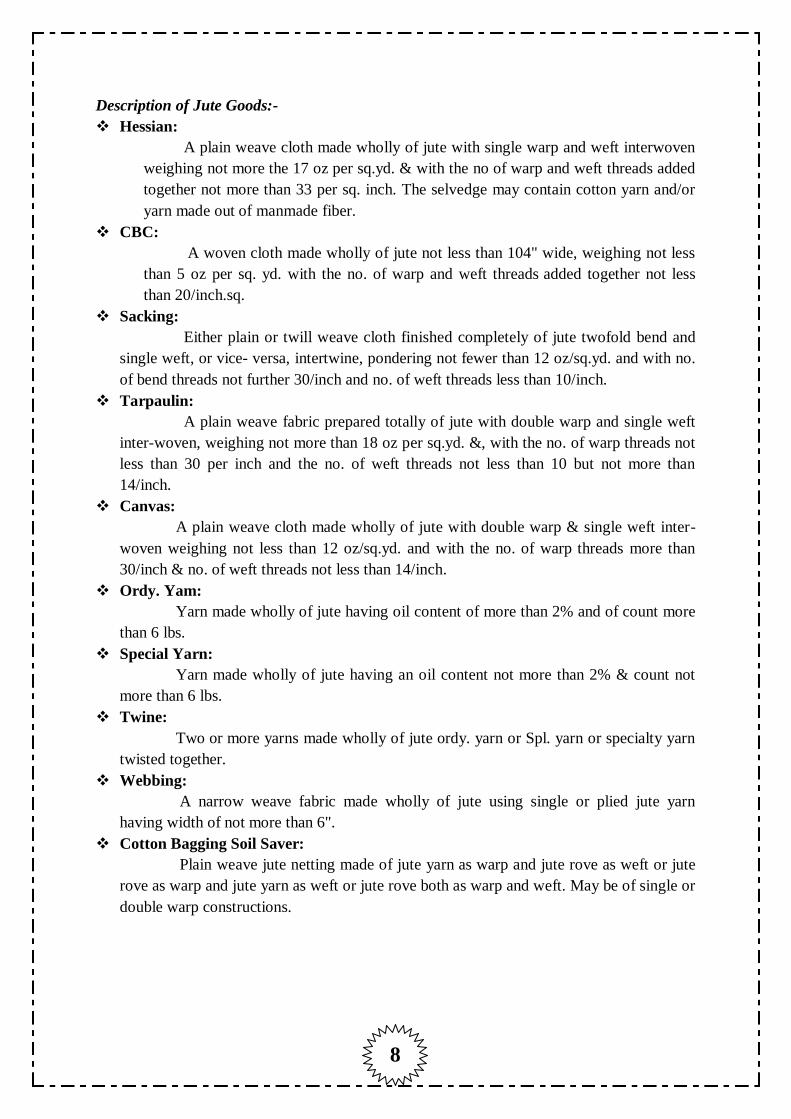
8
Description of Jute Goods:-
Hessian:
A plain weave cloth made wholly of jute with single warp and weft interwoven
weighing not more the 17 oz per sq.yd. & with the no of warp and weft threads added
together not more than 33 per sq. inch. The selvedge may contain cotton yarn and/or
yarn made out of manmade fiber.
CBC:
A woven cloth made wholly of jute not less than 104" wide, weighing not less
than 5 oz per sq. yd. with the no. of warp and weft threads added together not less
than 20/inch.sq.
Sacking:
Either plain or twill weave cloth finished completely of jute twofold bend and
single weft, or vice- versa, intertwine, pondering not fewer than 12 oz/sq.yd. and with no.
of bend threads not further 30/inch and no. of weft threads less than 10/inch.
Tarpaulin:
A plain weave fabric prepared totally of jute with double warp and single weft
inter-woven, weighing not more than 18 oz per sq.yd. &, with the no. of warp threads not
less than 30 per inch and the no. of weft threads not less than 10 but not more than
14/inch.
Canvas:
A plain weave cloth made wholly of jute with double warp & single weft inter-
woven weighing not less than 12 oz/sq.yd. and with the no. of warp threads more than
30/inch & no. of weft threads not less than 14/inch.
Ordy. Yam:
Yarn made wholly of jute having oil content of more than 2% and of count more
than 6 lbs.
Special Yarn:
Yarn made wholly of jute having an oil content not more than 2% & count not
more than 6 lbs.
Twine:
Two or more yarns made wholly of jute ordy. yarn or Spl. yarn or specialty yarn
twisted together.
Webbing:
A narrow weave fabric made wholly of jute using single or plied jute yarn
having width of not more than 6".
Cotton Bagging Soil Saver:
Plain weave jute netting made of jute yarn as warp and jute rove as weft or jute
rove as warp and jute yarn as weft or jute rove both as warp and weft. May be of single or
double warp constructions.

9
Features:
The following is the Picture of cutting lower part of the long jute fibre, the lower part
is hard fibre, which is called jute cuttings in Bangladesh and India (commonly called jute
butts or jute tops elsewhere). Jute cuttings are lower in quality, but have commercial value for
the paper, carded yarn, and other fibre processing industries. Jute fibres are kept in bundles in
the background in a warehouse in Bangladesh.
Jute fibre is 100% bio-degradable and recyclable and thus
environmentally friendly.
Jute has low pesticide and fertilizer needs.
It is a natural fibre with golden and silky shine and hence
called The Golden Fibre.
It is the cheapest vegetable fibre procured from the bast or
skin of the plant's stem.
It is the second most important vegetable fibre after cotton,
in terms of usage, global consumption, production, and
availability.
It has high tensile strength, low extensibility, and ensures
better breathability of fabrics. Therefore, jute is very suitable in agricultural commodity bulk
packaging.
It helps to make best quality industrial yarn, fabric, net, and sacks. It is one of the most
versatile natural fibres that have been used in raw materials for packaging, textiles, non-
textile, construction, and agricultural sectors. Bulking of yarn results in a reduced breaking
firmness and an increased breaking extensibility when blended as a ternary blend.
The best source of jute in the world is the Bengal Delta Plain in the Ganges Delta, most of
which is occupied by Bangladesh.
Advantages of jute include good insulating and antistatic properties, as well as having
low thermal conductivity and a moderate moisture regain. Other advantages of jute
include acoustic insulating properties and manufacture with no skin irritations.
Jute has the ability to be blended with other fibres, both synthetic and natural, and accepts
cellulosic dye classes such as natural, basic, vat, sulfured, reactive, and pigment dyes. As the
demand for natural comfort fibres increases, the demand for jute and other natural fibres that
can be blended with cotton will increase. The resulting jute/cotton yarns will produce fabrics
with a reduced cost of wet processing treatments. Jute can also be blended with wool. By
treating jute with caustic soda, crimp, softness, flexibility, and appearance is improved,
aiding in its ability to be spun with wool. Liquid ammonia has a similar effect on jute, as well
as the added characteristic of improving flame resistance when treated with flame
proofing agents.
Some noted disadvantages include poor drapability and wrinkle resistance, brittleness, fibre
shedding, and yellowing in sunlight. Jute has a decreased strength when wet, and also
becomes subject to microbial attack in humid climates.

10

11
Indian Jute Industry:
The following table gives brief overview about the Indian Jute Industry.
Source: Indian Mirror
History of Indian Jute Industry:
The Jute industry occupies significant place in the Indian economy. The Indian Jute
Industry is a very old & predominant in the eastern part of India. The Government of India
has included the Jute Industry for special attention in its National Common Minimum
Programme. It forms an integral part of the Indian Textile Industry. Further, the
Jute industry contributes to the national exchequer from exports & taxes.
From 17th
to 20th century, the jute industry in India was delegated by the
British East India Company which was the first jute trader. During 20th century.
The Indian Jute industry has been expanding really fast spanning from a wide range of life
style consumer products, with courtesy to the versatility of Jute. Innovative ways of
bleaching, dyeing and finished goods processes - the jute industry now provides finished jute
products that are softer, have a lustre with aesthetic appeal. Today Jute has been defined as
eco-friendly natural fiber with utmost versatility ranging from low value geo-textiles to high
value carpets, decoratives, apparels, composites, upholstery furnishings, etc.
The Indian Jute Industry plays a key role in the Indian economy, providing direct
employment to about 0.26 million workers, and supporting the lives of around 4.0 million
farm families. Around 0.14 million people are engaged in the tertiary sector, that supports the
jute industry. Currently it contributes to exports about
Rs. 1000 crore.
Size of Indian Jute Industry:-
The India Jute Industry constitutes total mills
from central government which owns 6 jute mills, the
state government owns 4.2 are under cooperatives, and
64 jute milss are under private ownerships. India today
has around 78 jute mills and the state of West Bengal alone has around 61 jute mills. Andhra
Pradesh has 7 jute mills, 3 Uttar Pradesh abd Bihar, Odisha, Assam, Tripura, and Madhya
Pradesh has 1 jute mills each.
Size of the Industry
India today has around 78 jute mills
Geographical distribution
Jute mills are located in West Bengal, Andhra Pradesh, Assam, Odisha, Uttar Pradesh, Bihar, Tripura and Chhattisgarh
Output per annum
The Indian Jute Industry today accounts for a turnover of Rs 6,500 crore annually, contributing to exports to the tune of nearly Rs.1000 crore.

12
Leading Jute Companies:-
National Centre for Jute Diversification, Kolkata.
Jute Manufacturers Development Council, Kolkata.
National Jute Manufacturers Corporation.
Jute Corporation of India Ltd., Kolkata.
Birds Jute & Exports Ltd.
Institute of Jute Technology, Kolkata.
Indian Jute Industries Research Association, Kolkata.
Lovson Exports.
Jaikishan Dass Mall Jute Products (P) Ltd.
Eco Jute Pvt. Ltd.
Boom Buying Pvt. Ltd.
Anad Jute Industries.
Empolyment Opportunities:-
Providing direct empolyment to about 0.26 million workers and around 4.0 million
workers indirectly.
Latest Development in India:-
The Govt. of India have commenced the “Jute Technology Mission” charge in view
the mounting 7involvement of the Jute industry to Indian Economy. This will benefit jute
producers, the workers engaged in the production, jute entrepreneurs and others employed in
related activities. It will also play a vital role in modernising the jute industry and help the
country to reap the benefits with enhanced levels of jute diversification.
For greater growth and development of the Jute Industry, Govt. of India launched
National Jute policy in 2005 with the following objectives:-
Achieving a Compound Annual Growth Rate (CAGR) of 16% p.a.
Improving the quality of jute fibre.
Value addition through diversified products.
Ensuring remuneration prices to the jute farmers.
To enhance the yield per hectare from 2200kg/hec. to 2700kg/hec. in 2010 – 11.
Indian Jute Industry at Glance in Year 2011 – 12:-
Jute production in the country is expected to decline by 12% to 90 lakh bales in the
2012-13 crop year due to poor rains in the growing states,
according to the National Jute Board of India. The
country had produced 102 lakh bales of jute last year. As
per the Agriculture Ministry data, area sown under jute is
lower at 8.40 lakh hectare so far in the ongoing Kharif
season, against 8.92 lakh hectare in the year-ago period.
Jute is cultivated in seven states" West Bengal, Bihar,
Odisha, Assam, Tripura, Meghalaya and Andhra
Pradesh.In fact sowing of most kharif crops, both food and cash crops, are lagging behind due
to poor rains. Monsoon rains were deficient by 20 per cent till July this year.

13
Jute is normally cultivated as an inter-crop between the two main agricultural seasons,
kharif and rabi in India. About 5-6% of the total production is used for making 1.6 million
tonnes of jute goods every year. Farmers use the remaining fibre for manure and fuel. The
jute industry, which employs about 4 million people directly and indirectly, has been mainly
focusing on making gunny bags.

14

15
Jute Products and Home-Furnishing situation in Egypt
Market Overview:-
Jute-made products are not popular in Egypt. That is mainly due to production
processes in Egypt that cannot produce the soft and smooth jute fabric necessary for furniture
or home furnishings. Currently, rice sacks are the only jute-made products in Egypt. In other
words, the market of jute products in Egypt is still traditional or classical market. In fact, jute
and kenaf are one of the economic plants, which are grown in the central region of Egypt.
In contrast to the lack of market development on jute products in Egypt, the strength
of Egyptian handicraft market is the design. Therefore, it may be a great opportunity for
Egyptian companies to access the technology necessary to process the jute fibers in order to
produce quality home-furnishing products, or handicrafts.
But, still, the opportunity in jute industry is the trend of green products is emerged in
everywhere across this world, including Egypt. Therefore, the jute-made products still have a
bright future in Egyptian market, but the advanced development of jute market is needed.
Production:-
Jute has excellent prospects to produce Egyptian handicrafts by as stand-alone
products or blended with other raw materials to add the value and variety leading to product
differentiation. In the context of Egypt, there is a lack of jute availability in Egypt. This
creates the opportunity to import from other countries.
There are three types of factory relevant to Handicrafts/Jute Products and Home
Furnishings:
Type 1: The factory that has total machine power ranging between 5 –
20 HP (horse power) and/or has workers numbering 7 - 20 workers. They can be
tooled up to commence operations immediately. They comply with the government
regulations. If the factory causes pollution, it is classified into Type 3.
Type 2: The factory that has total machine capacity of 20 - 50 HP and/or has the
number of workers between 20 - 50. They too can be operational immediately. If the factory
causes pollution, it is classified into Type 3.
Type 3: In case the factory has potential to cause pollution and have machines over 50
HP and/or employs more than 50 workers, they must seek permission from authorities to
operate the business.
Production of jute in Egypt:
Year MT 2007 1915 2008 1656 2009 1665 2010 2200

16
Jute Industry
About 97 percent of the Jute produce in Egypt are for agricultural sector usage. Of
this, 40 percent go for jute bags and 60 percent for jute products such as ropes, thread, and
burlap.
The trend of the production of jute bags for use in Egypt is decreasing. These are
substituted by plastics and related innovations.
In Egypt, most plantations of Jute areas are located in the North East provinces of the
country such as Cairo, Suez, Alexandria, Luxor, etc. They cover approximately 25,000
hectares during the period of 1988 – 1990 with a production of 5000 tons. The plantation area
during 1998 – 2000 decreased to 23,157 hectares and projected to be 10,000 hectares. This
amounts to a decrease 20.2 and 6.7 percent with production of 2200 and 1500 tons
respectively. This decrease in plantation area and production is expected to result from the
declining global demand for jute fiber due to the substitute goods such as artificial plastic
bags over and above deteriorating price incentives.
Consumption:-
According to a portfolio from Bangladesh Jute Mills Corporation (2007), it appears
that jute fibers can be processed in order to produce hand bags, shopping bags, jewelry box,
mats, canvas, floor covering, scrim cloth, carpet, tapestries, and wall covering. Jute-made
products are restricted to sacks for packaging rice, maize, sugar, tapioca and related
agricultural produce. Therefore, the jute industry is still a traditional market with niche
market potential.
Substitute for jute bags, such as polypropylene bags or synthetic bags are mainly
causing the decline of jute-made products in Egypt. Such substitutes are widely used in
agricultural sectors, particularly as a packaging bag for rice. In Egypt, rice wrapped by
polypropylene bag can be sold cheaper than rice wrapped by hessian bags.
In comparison to the other countries, the jute production in Egypt is declining. Thus,
consumption of jute products in Egypt declined from 8000 tons in 1980s to 3500 tons in
1990s. This caused the decline of prices of jute-made products in Egypt. Table below
indicates this declining trend of consumption of jute products and the resultant decline of the
export price of jute products from Egypt.
Export of Products of Jute, Kenaf and Allied Fibres from Egypt:
(Thousand tones)
2008 1.6 2009 2.0 2010 0.1
Import of Raw Jute, Kenaf and Allied fibres
(Thousand tones)
2008 0.8 2009 0.4 2010 0.2

17
Import of products of Jute, Kenaf and Allied fibres
(Thousand tones)
2008 19.5 2009 8.7 2010 21.8
Production Quantity of Jute in Egypt - 1961-2009:-
The table and graph data comes from the FAOSTAT database produced by the Food
and Agriculture Organization of the United Nations (FAO). The data is displayed with the
express written permission of UN/FAO and was downloaded from FAOSTAT on
07/17/2011.
Table:
Year 2001 2002 2003 2004 2005 2006 2007 2008 2009
Amount 2,589 2,134 1,992 2,516 2,309 1,978 1,915 1,656 1,665
Chart:
Source: www.factfish.com
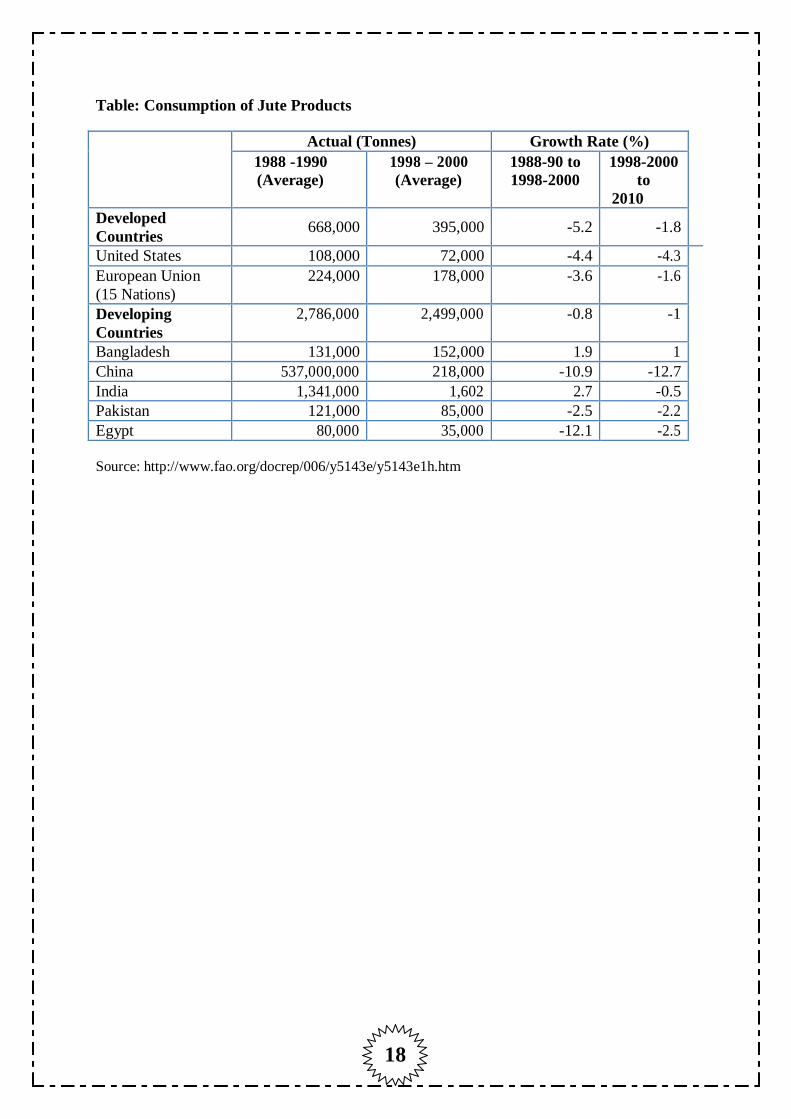
18
Table: Consumption of Jute Products
Actual (Tonnes) Growth Rate (%)
1988 -1990
(Average)
1998 – 2000
(Average)
1988-90 to
1998-2000
1998-2000
to
2010
Developed
Countries 668,000 395,000 -5.2 -1.8
United States 108,000 72,000 -4.4 -4.3
European Union
(15 Nations)
224,000 178,000 -3.6 -1.6
Developing
Countries
2,786,000 2,499,000 -0.8 -1
Bangladesh 131,000 152,000 1.9 1
China 537,000,000 218,000 -10.9 -12.7
India 1,341,000 1,602 2.7 -0.5
Pakistan 121,000 85,000 -2.5 -2.2
Egypt 80,000 35,000 -12.1 -2.5
Source: http://www.fao.org/docrep/006/y5143e/y5143e1h.htm

19
Table: World Export of Product of Jute, Kenaf and Allied Fibres from 2005 to 2009
In ‘000 tons (1 tons = 1000 Kg)
2005 2006 2007 2008 2009
World 800.3 774.1 832.7 773 767.7
Developing 740.8 729.3 787.4 747.6 744.3
Africa 2.6 3 3 3 3
Latin America 0.5 0.5 0.5 0.5 1.1
Near East 7.7 5.3 6.5 11.7 10.1
Egypt 0 0 0 0.2 0.1
Saudi Arabia 1 0.4 0.2 0.2 0.2
Syria 0.1 0.1 0.1 5.9 5
Turkey 6.4 4.3 5.7 5.1 4.4
Far East 729.9 720.5 777.4 732.4 730.1
Bangladesh 476 478.9 549.7 491.5 508.7
China 7.6 18.5 21.1 12.6 16.8
India 208.1 189.5 175.6 207.6 135
Nepal 13 13 13 13 17.4
Pakistan 18.9 17.1 15.1 6.1 10
Thailand 6.3 3.4 2.8 1.5 0.9
Developed 59.5 44.8 45.3 25.4 23.4
North America 1.8 1.2 2 2.1 3.6
USA 1.6 1.2 1.9 1.8 3.4
Europe 55.6 42.2 41.4 21.1 17.6
Belgium-Lux 27.2 19.6 22.2 11.1 10.3
France 1.3 0.5 0.5 0.2 0.3
Germany 6 6.4 4.9 3.7 1.9
Netherlands 5.6 4.3 4.1 2 1
UK 6.6 4.3 3 1.7 1.4
Other EU 2.4 1 0.8 0.6 0.5
Former USSR 0.2 0.2 0.7 1.1 1
Oceania 0.2 0.2 0.1 0.1 0.1
Australia 0.2 0.2 0.1 0.1 0.1
Other Developed 1.8 1 1 0.5 0.5
Japan 1.8 1 1 0.5 0.5
Source: http://www.jute.org
Globally, exports of jute kenaf and allied fibers product, declined by a small margin
during year 2005 to 2009 by about 4.07 percent, that is it reduced from 800.3 thousand tons
to 767.7 thousand tons. In the case of Egypt, exports of jute kenaf and allied fiber products
declined by 85.71 percent. Thus, form the above table we can conclude that India has the
great opportunity to expand the business of Jute specially in Egypt as the Egypt is far so far
behind in this context.

20
Table: Export of Jute Products by type from Egypt
In ‘000 tons (1 tons = 1000 Kg)
Year Yarn & Twine Manufactures
Fabrics Gunny Bags Total
2003-2004 3.19 0.18 1.79 7.03
2002-2003 3.95 0.32 1.69 8.26
2001-2002 2.96 0.23 1.93 7.33
2000-2001 3.86 0.17 2.77 7.46
1999-2000 5.67 0.32 2.23 8.22
1998-1999 5.06 0.57 3.3 8.9
1997-1998 6.21 0.41 3.19 9.81
1996-1997 8.57 0.64 2.52 11.73
1995-1996 20.64 1 3.06 24.7
1994-1995 37.55 1.56 4.6 44.24
1993-1994 51.04 0.91 2.84 54.79
1992-1993 47.77 1.39 6.11 55.27
1991-1992 59.51 0.91 8.58 69
Source: http://www.jute.org
Table shows the type of jute products of Egypt that export to other countries. Yarn
and Twine products steadily decreased from 59.51 thousand tons to 3.19 thousand tons
during the period 1991 to 2004. For fabrics, export volume remained unchanged from 0.91
thousand tons to 0.18 thousand tons from 1991 to 2004 respectively. The peak export volume
was in 1994-1995 with 1.56 thousand tons. For gunny bags, the export volumes dropped from
8.58 thousand tons to 1.79 thousand tons from 1991 to 2004. Thus, from the above table we
can say that the exports of the Jute products is at the decreasing rate so as the production of
the jute is at the bottom in Egypt so, as the opportunity point of view India can export row
jute in Egypt and can also start business by establishing the joint ventures in Egypt.

21
Table: World Import of raw Jute, Kenaf and Allied Fibres from 2001 to 2011
In „000 tonnes (1 tonne = 1000 Kg)
Source: Food and Agriculture Organization (FAO)
Year => 2003 2004 2005 2006 2007 2008 2009 2010 2011
World 385.5 331.3 351.8 355.1 508.3 436.1 376.8 477.1 471.3
Developing 357.1 306.7 328.5 335.5 473.0 395.0 354.7 456.4 446.9
Africa 22.6 13.4 24.5 17.7 13.0 20.2 14.5 22.3 13.1
Cote d'Ivoire 15.2 6.9 12.9 12 7.5 12.7 6.7 17.6 2.3
Ethiopia 5.4 5.0 10.0 3.8 3.0 5.6 3.7 3.5 4.6
Latin America 17.8 5.9 4.2 6.3 4.0 20.0 5.7 15.3 13.9
Brazil 13.8 1.9 0.2 2.1 0.2 15.9 1.8 10.9 8.3
Near East 4.7 5 4.7 3.9 3.5 3.9 3.0 2.9 2.7
Egypt 1 1.7 1.5 1.6 0.3 0.8 0.4 0.2 0.3
Iran 1.8 1.3 1.0 1.0 1.1 1.0 1.0 1.0 0.1
Saudi Arabia 1.8 1.9 1.9 0.8 1.0 0.9 1.1 1.0 2.0
Far East 312 282.4 295.2 307.6 452.6 350.9 331.5 415.9 417.2
China 34.3 65.1 82.2 88.6 125.7 114.2 95.7 104.1 109.6
India 144.2 62.3 66.8 79.8 162.5 70.5 56.6 145.5 128.8
Indonesia 2.2 2.4 2.2 2.2 2.6 5.5 2.2 0.5 2.1
Pakistan 89.2 129.4 128.5 111.8 126.5 128.8 128.6 98.5 106.0
Thailand 36.7 17.6 6.3 15.6 23.3 8.2 15.8 0.9 3.9
Developed 28.4 24.5 23.3 19.6 35.3 41.1 22.1 20.7 24.4
North America 0.4 1 2.6 1.6 3.7 3.7 1.8 2.7 2.2
United States 0.3 0.9 2.5 1.6 3.6 3.5 1.7 2.4 2.2
Europe 19.1 16.6 14.4 12.4 20.1 22.6 15.3 13.9 15.2
UK 2.8 0.3 1.8 2.0 5.4 11.2 4.5 1.9 2.6
Other EU 1 0.8 4.4 4.1 6.1 5.4 5.7 5.4 5.3
Other Europe 1.5 1.5 1.6 1.6 1.7 1.7 1.3 1.3 1.4
Former USSR 5.6 4.2 3.4 3.2 9.0 11.7 2.6 2.8 5.4
Oceania 2.1 1.5 2.3 1.5 1.5 1.4 1.5 0.8 0.8
Australia 2.1 1.5 2.3 1.5 1.5 1.4 1.5 0.8 0.8
Other Developed 1.2 1.3 0.7 0.9 1.0 1.7 0.9 0.5 0.8

22
Table: World Import of Products of Jute, Kenaf and Allied Fibres from 2003-2011
In „000 tonnes (1 tonne = 1000 Kg)
Year => 2003 2004 2005 2006 2007 2008 2009 2010 2011
World 608.7 587.6 596.6 617.5 615.1 619.9 502.6 601.3 663.2
Developing 313.1 310.5 321.8 370.4 372.0 386.2 336.9 416.3 489.4
Africa 34.5 44.2 36.4 57.0 56.7 48.2 44.9 45.0 71.5
Algeria 5.4 8.7 5.7 5.1 7.2 5.9 5.8 7.7 8.6
Cameroon 2.4 2.3 1.6 1.6 2.3 1.4 1.9 2.0 2.0
Ghana 10.3 14.6 4.7 19.8 14.2 12.8 12.0 6.9 24.3
Kenya 3.5 2.9 2.6 4.8 4.3 2.7 5.1 3.0 3.5
Latin America 10.5 9.2 12.9 15.4 16.8 17.0 10.4 12.3 18.7
Argentina 2.5 2.6 2.8 2.8 3.2 1.5 1.2 1.2 1.2
Brazil 2 2.4 2.7 3.9 4.1 5.6 3.1 4.1 9.9
Near East 248.1 235.8 248.5 270.5 267.8 278.6 245.0 301.3 299.3
Egypt 4 3.8 5.5 5.4 4.6 19.5 8.8 21.8 15.8
Iran 63.1 68.2 75.1 59.1 74.0 57.5 56.4 66.1 61.5
Saudi Arabia 15.2 16.5 18.7 18.9 19.3 16.0 4.8 16.4 17.0
Sudan 3.7 3.9 3.0 3.2 2.1 1.0 1.0 1.0 1.0
Syria 80 30.8 42.3 53.7 39.7 33.4 32.0 32.3 34.0
Turkey 78.1 108.5 101.2 127.9 125.1 148.3 136.9 160.0 165.0
Far East 20 21.3 24.0 27.5 30.7 42.4 36.6 57.7 99.9
China 4.3 3.5 4.0 4.5 4.7 5.4 7.9 14.3 54.3
Indonesia 4.5 6 7.1 8.8 11.1 13.0 10.7 23.0 22.6
Malaysia 1.1 1.7 1.4 1.8 2.0 2.7 3.7 1.6 1.6
Pakistan 0.2 0.2 0.2 0.4 1.7 8.2 4.2 9.4 1.3
Sri Lanka 2.3 2.2 3.2 2.5 2.9 2.6 2.5 3.0 2.4
Thailand 0.9 1.7 0.4 0.6 0.5 2.9 1.0 0.5 10.7
Developed 295.6 277.1 274.8 247.1 243.0 233.7 165.7 185.0 173.8
North America 56.7 60.1 59.3 50.0 46.9 40.8 28.4 33.8 35.1
United States 51.9 55.4 54.7 46.5 42.4 37.2 25.1 30.9 31.6
Europe 175.6 155.2 150.9 136.5 133.4 128.9 86.2 99.9 89.6
EU(27) 173.9 154.3 149.2 134.4 131.3 126.8 84.7 98.2 88.0
EU(15) 168.9 149.9
United Kingdom 26.2 23.1 17.3 15.2 13.7 10.2 7.4 8.4 7.4
Other EU 5 4.4 1.7 2.1 2.1 2.1 1.5 1.7 1.6
Former USSR 5.6 8.3 7.7 12.9 17.4 19.3 12.8 15.2 15.0
Russian Federation 4.1 5.9 6.3 10.8 15.0 17.4 10.5 12.7 15.0
Oceania 34.4 31.1 35.9 28.6 27.8 27.3 21.8 20.6 23.9
Australia 28 25.4 28.7 23.7 24.0 23.3 18.6 17.4 20.3
Other Developed 23.3 22.4 21.1 19.1 17.6 17.3 16.5 15.6 10.3
Japan 19.1 17.8 17.3 14.5 13.6 14.3 14.2 13 8.0
South Africa 4.2 4.6 3.7 3.5 3.3 2.3 1.7 1.9 1.9
Source: Food and Agriculture Organization (FAO)

23
Jute Industries and Traders:
1. NORTH AMERICA TRADE AND IMPORTS
Contact Person: MR. Mohamed Elkazaz
Product: Jute & jute product
24 Elharbey Street-Damietta
Zip: 34724
Country: Egypt.
2. El-Deek
Buyer of: jute yarn, hessian cloth, wood.
Contact Person: Essam Ghena
Location: Egypt – Dumyat.
3. Alex group int
Contact Person: Mr. said f.
Product/Service: Flax Fiber, Charcoal, Raw Wool, Scotched Flax: Hackled Flax: short
flax fiber.
Address: 1 / F el Nasser, 13 el Nasser Road, el anshia, Alexandria, Egypt.
Telephone: 20-012-3845075.
Fax: 20-03-4835097.
4. Egyptian flax company
Product/Service: Flax products: Flax fiber, flax woo, flax sliver and flax yarn.
Contact Person: Mr. Hossam Ali.
Zip Code: 02
Website: http://www.gmdu.net/corp-7389.html
Address: 3 Makram Abid Street - Office 901, Cairo, Egypt.
Telephone: 20-02-6711125.
Fax: 20-02-6711128.

24
Govt. Department/Ministry Dealing with Jute:
Ministry of Trade and Industry Arab Republic of Egypt.
2 Latin America, Garden City, Cairo.
E-Mail: [email protected]
Telephone: +202-27921178.
Fax: +202-27957487.
Ministry of Foreign Affairs, Egypt
Tel: 25796334 - 25746872 - 25746871 - 25796338 – 25796342.
Foreigners and Legalization Affairs: [email protected]
Fax: 25767967.
Web: ww.mfa.gov.eg
Ministry of Foreign Trade and Industry, Egypt
Web: www.mfti.gov.eg
Ministry of Environment - Environmental Affairs Agency, Egypt
Web: www.eeaa.gov.eg

25
Trends and Developments:-
Currently, the global market is concerned about sustainability issues to cope with the
climate change and global warming. Consumers‟ preferences switch to eco-friendly products
and services. This change in consumer orientation synergizes with the ecological advantages
of jute products. The benefits of jute-made products are durable, recyclable, termite resistant,
and ultraviolet resistant. These eco-friendly characteristics are key for the future jute market.
These inherent attributes of jute can fulfill the demand of green products. In the ambience of
climate change threats with corresponding demand for green and recyclable products, jute-
made bags, jute handbags, jute home decorative, and footwear and jute coverings provide
sustainability solutions and open new opportunities for the jute market.
In terms of development, three main strategic tracks need to be applied into jute
processes. These are textile technology, agribusiness management and designing. Textile
technology will improve the fiber quality of jute to be softer for industrial processes, while
the designing will improve the marketing strategy of jute products. This is relevant as the
Egyptian jute market is currently a traditional market. Therefore, if the jute-made products
are entering to the Egyptian market, it will need the sustainable marketing strategies to
reshape the perception of Egyptian consumers.
Besides technology and designing, agribusiness management is important to the jute
farmers. The research related agribusiness management will support farmers to learn about
the cost reduction of jute farming, the efficient productivity and the increase of fiber yield. If
jute farmers learn how to make profits from efficient farming, the price of jute will be more
reasonable. Thus, this market will have a sustainable future.
In short, the Egyptian is the traditional jute industry as they are no using more
technology for the jute so, India can introduce the latest technology and developmental ways
to increase and develop the jute industry in the Egypt.

26

27
Competitive Analysis
Five Forces Analysis:-
The following is the figure showing the Porter‟s five forces model, which we have
analysed in detail below for Indo – Egyptian trade relation in the Jute Industry.
Now we will use the some table and data for the detailed study of the five forces of
Porters for the Jute Industry of Egypt and to develop and find the opportunity to enhance the
business relationship between India and Egypt especially for the Jute so, the whole study and
the analysis is detailed in the next context.

28
Table: Jute/Kenaf Estimated Supplies, Domestic Requirements, Exports and Imports in
Major Producing Countries in ‘000 tons (1 ton = 1000 Kg)
Egypt 2004/2005 2005/2006 2006/2007 2007/2008 2008/2009 2009/2010
Opening Stocks 268.8 270.4 266.3 206.5 182.7 152.7
Production 35.7 36 36 2.2 2.9 1.8
Imports 15 5 12 18 11 17.5
Total Supply 319.5 311.4 314.3 226.7 196.7 171.9
Mill
Consumption 44 44 44 44 44 44
Village
Consumption 0 0 0 0 0 0
Loss/Damage 0 0 0 0 0 0
Closing Stocks 274.4 266.3 269.3 182.7 152.7 127.9
Total Domestic
Requirements 318.4 310.3 313.3 226.7 196.7 171.9
Exports 1 1.1 1.1 0 0 0
Source: www.jute.org
1. Threat of New Entrances (Low):
The investment environment is enabling and there are hardly any barriers for new
comers. Characteristically the quantum of investment in jute products is not too high and the
profitability is low. There is space for new entrants to the business. The key barrier in this
business is with respect to the labor. It is rather difficult to find and maintain productive
skilled labor. Furthermore, raw jute is insufficient for the intended scale of production in
Egypt as the growers switch to grow other crops.
Even though, it is not difficult to conduct the business in jute products but it‟s also not
easy to run the business smoothly due to the overall decline of the market. Moreover, the
production in Egypt is for domestic consumption only and not for export to other countries
since 2007 onwards.
2. Bargaining Power of Buyers (High):
The buyers‟ power is collectively significant. Mostly the price of jute is set depending
on the demand. As the consumption rate of jute products in Egypt has progressively declined
along with the influx of substitute products in the market therefore, the buyers have limited
ability to maneuver with the price charged to the customers. There is no switching cost to
consumers for changing their consumption behavior to consume more in substitute products
such as plastic. Therefore, the bargaining power of buyers is high.
29
3. Bargaining Power of Suppliers (High):
The bargaining power of suppliers in term of middlemen is high because mostly
suppliers of raw jute are middlemen. They play a major role of being a link between the
grower and the manufacturing mills. In addition to purchasing and selling the raw jute, these
middlemen often perform such essential functions as assembling and storing the crop,
conveying it to the inferior market, and financing the various transactions.
The bargaining power of suppliers in term of growers/farmers of jute raw is low in
comparison to the manufacturing mills but high with respect to the middlemen. This is due to
the fact that they can switch to other crops which give them more productivity substituting
jute at no switching cost. It might result in a drop in productivity if the growers/farmers
turned to other alternative crops.
4. Threat of Substitute Products (High):
The threat of substitute products is high because there are numerous substitute
products such as synthetic plastic, nylon, and other manmade fibers. They have preference
due to the durability and lower cost. For example for jute bags, the substitute products are
plastic bags, leather bags, and cloth bags. Amongst them plastic is cheaper and more
economical. The latter two are more durable even though the cost is high. In case of
packaging products, the substitute products are boxes, and aluminum which is more
waterproof suits grain product better than jute.
5. Rivalry Among Existing Competitors (Low):
The competition in domestic is low because there is little competition in Egypt. There
are only three key players in jute mill industry which are as follow:
El Deek Jute Co. Ltd.
El Reda Alex Group Int.
Egyptian Flax Co. Ltd.
On the other hand, the competition in the international market is high as there are
many countries competing through production and supply for domestic as well as for exports
for global consumption. The big key players in international market are Bangladesh, India
and China.
Bangladesh is the largest exporter of raw jute, and India is the largest producer as well
as largest consumer of jute products in the world. Therefore, the local price of raw jute in
Bangladesh is defector the international price. Also, the local price of jute products in India is
deemed to be the international price.

30
Table: World production of Jute, Kenaf, and Allied Fibres from 2005/2006 to 2009/2010
In '000 Ton (1 ton = 1000 Kg)
Total Jute, Kenaf
& Allied Fibres: 2005/2006 2006/2007 2007/2008 2008/2009 2009/2010
World 2724.13 3021.1 2997.32 2596.6 2883.9
Developing
Countries 2717.13 3014.1 2990.32 2589.6 2876.9
Far East 2660.87 2957.21 2934.26 2534.2 2821.4
Bangladesh 965 990 990 931 1080
China 82.82 86.8 86.8 80 80
India 1530 1800 1782 1476 1620
Cambodia 0.8 0.6 0.3 0.3 0.3
Indonesia 7 3.1 4 3.8 3.8
Myanmar 36.89 43.6 19.1 12.9 8
Nepal 17.66 17.1 16.8 2.9 1.8
Egypt 4.6 3.6 2.2 2.9 1.8
Vietnam 15 10.6 31 8.8 9
Other 2.41 2.36 1.8 1.8 1.8
Latin America
and Caribbean 39.37 39.91 39.07 38.5 38.5
Africa 13.19 13.29 13.29 13.3 13.3
Near East 3.7 3.7 3.7 3.7 3.7
Developed
Countries 7 7 7 7 7
Source: http://www.jute.org
Thus, these two table and above Porter‟s five force model analysis is purely explain us
that India has great opportunity for exploring the trade of Jute in the Egypt as the Egypt is far
behind as compared to India and thus according to above discussion the Indian Jute Org. can
establish the Jute industry in the Egypt and it can be the greatest opportunity by considering
the above five forces into consideration.

31
Environmental Scanning (PEST Analysis):-
Political Factors:
Jute is normally a part of the agro-economic policy of Egypt and features in the export
list. A recent report stated that farmers in Egypt grew jute in the non-irrigated areas between
1990 and 1997. At the same period of time, jute farming was costly and not profitable to jute
farmers. Thus, the production of jute started declining. Before 1997, in the crop year
1995/1996, Egyptian government launched two regulations. The first regulation was the price
floor of bleached jute at the price of 6.30 Egyptian Dollar per kilogram. The second
regulation was that Egyptian government allowed the sack manufacturers to import jute from
international market.
Therefore, Egyptian government mentioned its mission to support jute farmers in the
6th Social and Economic Development Plan of Egypt. It stated that Egyptian government
should provide irrigation to the planted areas of jute. Also, Egyptian government would
distribute the new breeding of jutes to jute framers for free of charge.
Mainly, Egyptian jute farmers have retted and bleached jutes in the natural sources of
water. However, it was also hard for them to find a sufficient amount of water to ret and
bleach jute, particularly the farmers in the northeast of Egypt. Therefore, Egyptian
government decided to encourage jute farmers to use a method of tank retting. Also, the size
of retting tank should be extended. That will help the farmers to save water.
However, after the market needs a recyclable product to replace plastic bags, jute
product may be an alternative to response to this problem of Egyptian government.
Apparently, in 2007, Egyptian government declared its intention to combat against the
climate change, as a key issue in the draft of Egypt's Five-Year Strategies on Climate Change
(2008-2012). Egyptian government had planned to decrease the use of plastic bags in Cairo
since the midst of 2010.
Economic Factors:
In fact, jute is one of key cash crops in Egypt. Nowadays, the demand and supply of
jute are declined. The decline from demand side and supply side has a negative impact of
jute. Also, the farming of jute is declined. These factors push Egypt to import jute from
foreign nations.
From 1990 to 1995, according to the statistics from the Bureau of Agricultural
Economic Research, under the administration of the Egypt‟s Ministry of Agriculture and
Cooperatives, it showed that the planted areas of jute had been decreasing in every crop
years. The planted areas of jute declined from 1.4 million square kilometer in crop year
1990/1991 to 0.85 million square kilometer in crop year 1994/1995, equally to 39.28 percent
within 5 years.
In Egypt, a key factor behind the decline of jute farming also comes from the agro-
economic reason. The jute farmers found that the planting cost of jute was higher over the
time. Thus, this factor raised the price of jute in the domestic market as a time pass by.
In the demand side, mainly, jute becomes a raw material in woven sack industry and
pulp industry in Egypt. When the domestic production of raw jute is declined, Egyptian

32
government decided to import the bleached jute from the foreign market. The imported jute
would supply the demand from sack industry. However, over the time, jutes played a lesser
important role in pulp industry. Thus, the demand of jute in Egypt declined further.
By contrast, when the demand of jute declined, the demand of polypropylene fibers (a
synthetic fiber from petroleum) increased. This changed the sector of packaging industry in
Egypt. At present, in Southeast Asia, Egypt was the largest producer of polyvinyl chloride.
However, one weakness of polypropylene fibers is the price of oil. If the price of oil
rises, the production of polypropylene fiber will be raised. Thus, this also brings a new
opportunity to the diversification of jute products in Egypt, because normally, Egypt needs to
import petroleum.
Social Factors:
Farming behavior also causes the decline of jute production in Egypt in 1990s.
Mainly, jute is grown in the central region and the northeast region of Egypt. However, the
key factor brought the decline of jute in Egypt was that the jute farmers cultivated jute in the
non-irrigated areas. This is not an appropriate way of jute farming, because the production of
jute fibers needs a certain amount of water to ret and bleach jutes.
A survey report done in 1999 shows that 97.68 percent of planted areas of jutes was
harvested from non-irrigated areas. Therefore, growing jute in the non-irrigated areas will not
make any benefits to the farmers, while the planting cost was climbing. Also the number of
farmers was declined over the time. These factors did not motivate many jute farmers to
continue their jute farming. Later, they replaced jutes with other cash crops such as tapioca,
sugarcane or maize, because these cash crops can make more income.
Besides the problem about water supply for jute farming, the new breeding of jute
also is expensive for the jute farmers who wanted to sell the higher-qualified jute.
In addition, the introduction of new material from petrochemical complex caused the
decline of the use of jute sacks.
Technological Factors:
Normally, jute in Egypt is still belonged to the traditional market. In other words, it
lacks the diversification of jute products. At the same time, the plastic-fiber technology was
introduced to market in early 1980s. That is called “polypropylene fiber”, a synthetic fiber
made from petroleum. After polypropylene fiber entered to Egyptian market, the Egyptian
woven sack industry preferred to use polypropylene bags for fertilizers, rice, tapioca and
other agricultural products.
In other words, in Egypt, technology of oil refinery brought the advancement of
synthetic fiber, while the technology of jute fiber lost its technological competition. This
means that Egypt needs the technology of jute fiber in order to diversify into jute-made
products.

33
SWOT Analysis
A SWOT analysis is a tool, used in management and strategy formulation. It can
help to identify the Strengths, Weaknesses, Opportunities and Threats of a particular
company. Strengths and weaknesses are internal factors that create value or destroy value.
They can include assets, skills, or resources that a company has at its disposal, compared to
its competitors. They can be measured using internal assessments or external benchmarking.
Opportunities and threats are external factors that create value or destroy value. A company
cannot control them. But they emerge from either the competitive dynamics of the industry /
Market or from demographic, economic, political, technical, social, legal or cultural factors
(PEST). The following diagram is clearly explained the SWOT analysis.
Strengths:
Advancement of jute-fiber technology
and bio technology. India also has the
national research center of jute and kenaf.
India is normally the largest producer of
jute products.
Business form of joint venture will
support the cost reduction in investment
in Egypt.
Jute industry of India had a turnover of
1.625 billion US dollar (65 billion Indian
rupees) annually.
In case, Egypt has not a sufficient amount
of jute production. Indian firms can
import raw jute or bleached jute from its
manufactures in India.
Easy availability of low cost of labor.
Weaknesses:
Quality certificate for jute products from
India may not be accepted in Southeast
Asian - African nations.
The image of many Indian firms does not
have a good recognition in Egyptian
market, except automobile firms from
India.
Lack of cooperation between jute related
organizations and governments in India.
Environmental problems.
Low level of labor productivity due to
inadequate formal training / unskilled
labor
Little brand image.

34
Opportunities:
Raising demand of green products in
Markets across the world and Egypt.
Market in Egypt means a market for
foreigners, because Egypt is one of the
most attractive tourist countries.
India and Egypt have set up FTA. So,
there are no barriers of the move of raw
jutes.
Egypt had a great potential to produce
jutes more than it does now. Also, Egypt
is producing jute for domestic
consuming.
Price of jute products in Egypt is
cheaper over time.
Egypt has a geo-strategic location,
because it is located in the center of
Africa. This will support logistic and
product distribution.
Threats:
Market perception is still thinking that
jute products are belonged to traditional
market, for example sacks.
Competition from the potential rival,
likely to Bangladesh, because they have a
longer experience in the product
diversification of jute. Also, Bangladesh
is the largest exporter of jute products to
the world.
It may be hard to expand the area of jute
farm, because jute farms are a competitor
of cassava farms in Egypt.
Polypropylene woven bags (PP bags) are
allowed to trade freely in Egypt.
Jute products in Egypt lacked of product
diversification.
Thus from the above SWOT Analytical table we can conclude that the India has the
dominating position in the world in the Jute Industry as it is the highest manufacturers and
producers of Jute and Jute Products and so it is the strongest point for us to start the business
with any country and this strength will eat out the other weaknesses and threats and thus,
India has the greatest opportunity to start the business of the Jute in Egypt as it is far behind
from the India.

35
Market Entry Mode:-
Forms of Corporate Structuring:
As prevalent in any industrial country, Egypt has many forms of corporate structuring
that have different consequences from both a legal and tax perspective. These corporate
forms including:
Sole Proprietorship:
Sole proprietorship is an enterprise owned by a single natural person. This type of
structure has unlimited liability for the proprietor. Generally, a sole proprietorship can engage
in any business not prohibited by law. There are some taxes advantages to Egyptian sole
proprietorship because the proprietor can choose to either be taxed as a natural person based
upon the gross receipts of the business. The Egyptian sole proprietorship is generally
restricted to foreign nationals living in Egypt.
Partnership:
This can be separated into 2 categories as follows:
(1) Unregistered ordinary partnership:
Unregistered ordinary partnership refers to all the partners in the company that are
jointly liable without any limitation on the partnership‟s total obligations. If a new partner
joins the unregistered partnership, he immediately becomes liable for all the obligations
incurred even prior to him joining the partnership. A partnership like this is not considered a
legal entity under Egypt investment law and it is subjected to tax as if it were an individual
(2) A limited partnership:
A limited partnership means a partnership where the partners‟ individual liabilities are
limited to their respective contributions to the partnership, and one or more partners are
jointly liable without any limitation on all the obligations of the partnership. This type of
partnership is treated as a corporate entity for income tax purpose.
Private Limited Company:
A private limited company in Egypt can be owned wholly by foreigners. However, in
business activities reserved for Egyptian nationals, foreigners can participate up to 49
percent. In a private limited company the liability of the shareholders is limited to value of
the authorized capital. However, the liability of the directors may be unlimited if the same is
provided in the company‟s memorandum of association or in the articles of incorporation.
Usually a limited company is managed by a board of directors according to the company‟s
charter and by-laws.

36
Public Limited Company:
The provisions of the Limited Public Company Act of 1992 allow a private company
to become a public company. A private company cannot offer shares to the public while a
public company can. If the public company was incorporated in a foreign country then it can
establish a branch office in Egypt to do business and this branch office is required to maintain
only those accounts which are related to its activities in Egypt.
Regional Offices:
According to the Foreign Business Act of Egypt, the activities of Egyptian Regional
Offices are considered service oriented. Egyptian Regional Offices may be created by multi-
jurisdictional companies in those nations in which the Corporate Head Office is not
incorporated. The law regarding Egyptian Regional Offices does not require that the Non-
Egyptian Corporate Head Office have recognition as a legal entity in the foreign country in
which they are also doing business.
Joint Venture:
In the general sense, Joint venture basically covers any task undertaken by two or
more natural or legal entities for the purpose of creating a profit thereby. The law treats most
joint ventures as a contract matter and with the exception of filing for licenses and/or tax
certificates. The parties in the joint venture remain separate entities in the eyes of the law.
Another way of creating a joint venture is to have two companies or individuals engage in
business as either a different legal Egyptian company or limited partnership respectively.
By using the above discussed area as the legal one the Indian companies and
Government can start the business of jute in Egypt.

37
Trade Barriers
Trade Barrier between Egypt and India:
The issue of trade barriers between Egypt and India can be divided into two
categories:
(i) Problems of Certification
(ii) Legal Barrier, elaborated as follows:
Problems of Certification:
Saqib and Taneja (2005) summarizes that the jute-made products from India may face
difficulties about certification and testing procedure, when the products were exported to
ASEAN market. Most of the importers require the certificate or the tests of products, even if
the test does not charge the towering outlay for Indian exporters.
The jute-made products certified by IJIRA (Indian Jute Industries Research
Association) is accredited and accepted. The IJIRA tests jute characteristics such as strength,
twist, imperfection, grist and knots / 100 yards.
Legal Barrier:
The Foreign Business Act of Egypt does not allow the foreign investors to get any
business involvement with any industry related to Egyptian culture. Due to the law, the
handicraft industry in Egypt falls into this category. Thus, the possible investment in jute
products in Egypt should be in the form of joint venture.
Thus, these are the barriers coming into the ways to start the smooth and enhancing
business of the Jute in the Egypt for the India so by taking it into the considerations and
making the strategies according to it to overcome that barriers, there will be the great trade
relations between the India and Egypt especially for the developing the Jute industry in Egypt
as well as in India.

38
Recommendations by the Analysis:
The consumption of jute products in Egypt is decreasing and not popular due to the
presence of other substitute products which are more durable such as synthetic plastic, and
lack of raw materials is another problem because the grower was turned to grow other crop
which gain more yield than growing jute. Another problem is the production of jute product
of Egypt cannot produce the soft and smooth jute fabric therefore it is not suitable to produce
the furniture or home furnishing with jute made. Moreover, the raw jute in Egypt can be
produced for domestic consumption only not for exporting and Egypt still needs to import
raw jute from other countries.
Even though, Egypt is not specializing in jute industry but the strength of Egypt is
about the design. Egypt received the G-Mark award (Good Design Award) from Japan. This
would be guaranteed that Egyptian‟s design is more acknowledge to the worldwide.
The possibility for Indian‟s jute products to gain entry as finished goods to Egypt is
quite difficult. This is so as the brand accepted in Egypt is not popular enough and moreover
the design of the products does not match to Egyptian style. The best way to enter the
Egyptian market is to export a part of raw material to be processed into finished goods in
Egypt then export to the third countries such as Japan, Korea, and Australia and others.
Moreover, India needs to enhance Indian brand recognition and Brand India image as
a precursor to exports of the finished products to Egypt. This would enable Egyptian
consumers to know more about Indian products. This would etch with the tag of
sustainability and the theme of green products in the attitude space of Egyptian people who
are already sensitized to such eco-friendly orientations.

XIV

XV
WEBSITES:-
http://www.indianmirror.com/indian-industries/jute.html
http://www.worldjute.com/jute_prices/minsuprta.html
http://www.jute.org/wjp/cp_egypt.htm
http://www.jute.org/wjp/cp_egypt.htm
ww.mfa.gov.eg
www.mfti.gov.eg
www.eeaa.gov.eg
http://www.factfish.com/egytec.html
http://www.nationmaster.com/compare/Egypt/India/Economy
http://www.ifitweremyhome.com/compare/EG/IN
http://www.aneki.com/comparison.php?country_1=India&country_2=Egypt
http://www.economywatch.com/world_economy/egypt/indo-egypt-trade-relation.html
http://www.tradingeconomics.com
http://www.wiki.eg

K.P.PATEL SCHOOL OF MANAGEMENT
AFFILIATED TO GUJARAT TECHNOLOGICAL UNIVERSITY
MBA PROGRAMME (2011-2013)
A Global Country Study Report On Egypt
(Social Analysis)
SSSuuubbbmmmiiitttttteeeddd bbbyyy MMMBBBAAA SSSEEEMMMEEESSSTTTEEERRR IIIIIIIII(((KKKSSSMMMCCCSSS)))
(((BBBaaatttccchhh ::: 222000111111---111333)))
KKKiiinnnjjjaaalll SSShhhaaahhh ::: 111111777222444000555999222000000111
RRRaaahhhuuulll SSShhhaaahhh ::: 111111777222444000555999222000000222
RRRiiittteeessshhh SSShhhaaahhh ::: 111111777222444000555999222000000444
VVViiipppuuulll PPPaaattteeelll ::: 111111777222444000555999222000000666
HHHiiitttiiixxxaaa GGGooorrr ::: 111111777222444000555999222000111000
PPPaaarrrttthhh SSShhhaaahhh ::: 111111777222444000555999222000111999
SSSuuubbbmmmiiitttttteeeddd tttooo (((KKKSSSMMMCCCSSS)))
IIINNN PPPAAARRRTTTIIIAAALLL FFFUUULLLFFFIIILLLLLLMMMEEENNNTTT OOOFFF TTTHHHEEE
RRREEEQQQUUUIIIRRREEEMMMEEENNNTTT OOOFFF TTTHHHEEE AAAWWWAAARRRDDD FFFOOORRR TTTHHHEEE DDDEEEGGGRRREEEEEE OOOFFF
MMMAAASSSTTTEEERRR OOOFFF BBBUUUSSSIIINNNEEESSSSSS AAASSSMMMIIINNNIIISSSTTTRRRAAATTTIIIOOONNN
IIInnn
GGGuuujjjaaarrraaattt TTTeeeccchhhnnnooolllooogggiiicccaaalll UUUnnniiivvveeerrrsssiiitttyyy
UUUNNNDDDEEERRR TTTHHHEEE GGGUUUIIIDDDAAANNNCCCEEE OOOFFF
FFFaaacccuuullltttyyy GGGuuuiiidddeee
AAAjjjaaayyy TTTrrriiivvveeedddiii

i | P a g e
STUDENTS’ DECLARATION
We hereby declare that the report for Global/ Country Study Report entitled
“SOCIAL ANALYSIS OF EGYPT” is a result of our own work and our indebtedness to
other work publications, references, if any, have been duly acknowledged.
Place: KAPADWANJ
Date:
(Signature)
KINJAL SHAH.
RAHUL SHAH.
RITESH SHAH.
VIPUL PATEL.
HITIXA GOR.
PARTH SHAH.

ii | P a g e
PREFACE
This is the global country study report for the year 2012-13. It is very essential for on
MBA students because after the completion of their MBA studies they may undergo in the
practical corporate world for management and in that only class discussions and presentations
are not enough for understanding any job. The practical knowledge about the corporate world
is essential. The topic selected by us is Egypt society.
For this purpose we have received a great support from our college professors and
classmates. The objective of this report in MBA is to give the real knowledge of practical
world in future. This Report about “Social analysis of Egypt” will help to understand what
the job is and also be helpful to take major decisions. The aim of our study was to prepare
report to improve our knowledge, ability and skill on job undertaking in tourism area.

iii | P a g e
ACKNOWLEDGEMENT
Guidance, cooperation and inspiration are the important factors in accomplishment of
the project.
No endeavour is complete without giving thanks to people who are helpful in making
that successful. We extend our sincere thanks to KSMCS for providing us the opportunity
and scope for this report. We also thank our guide professor Ajay Trivedi for his support and
guidance.
Finally, we are sincerely thankful to others who have directly or indirectly help us in the
completion of the project.

TABLE OF CONTENTS
Sr.No. Particular Page No.
Preface Ii
Acknowledgement Iii
1 Introduction Of Egypt 1
2 Profile Of Egypt 3
Genenral Profile Of Egypt 3
Geographic Profile Of Egypt 3
Demographic Profile Of Egypt 4
Business Profile Of Egypt 4
3 Socio Cultural Environment 5
Cultural Aspects 5
Festivals Of Egypt 7
Mentality Of Egypt 10
Health Care 10
Education 12
National Life Style Habits 13
Career Attitudes 15
Economic Status 16
4 Social Issues In Egypt 17
5 Conclusion 21

1 | P a g e
INTRODUCTION OF EGYPT
Egypt is known as mother land of the world. It is also known as “Land of
Civilizations”. It has “The Greatest Power in Human History”. We study about its
environment of country and about the future scope of its Business progress. So our
basic area of study is Socio-cultural environment, health consciousness and mentality
of the people.
The Egyptian economy is going through a critical period as the country changes
to democracy. While the shift from authoritarianism is certainly welcome, it has
inevitably encouraged instability unknown to Egypt for the past thirty years. The
implementation of economic reform accompanied by this uncertainty is particularly
challenging as political demands take precedence.
Population According to a survey conducted in July 2007, is estimated to be around
80,335,036. The estimated rate of growth of population in Egypt is 1.721%. Egypt is
considered to be one of the populous countries in Africa.
The sex ratio of Egypt population is 1.017 males per female.
Rural population (% of total population) (2010) 57.2
Mortality rate, infant (per 1,000 live births) (2010) 18.6
Mortality rate, under-5 (per 1,000) (2010) 21.8
Life expectancy at birth, total (years) (2009) 72.7
Year 2004 2005 2006 2007 2008 2009 2010 2011 2012
Population(in Millions) 77.50 78.88 78.88 80.33 81.71 83.08 80.47 82.07 83.68

2 | P a g e
PROFILE OF EGYPT
GENENRAL PROFILE OF EGYPT
Full Name Arab Republic of Egypt
Capital Cairo
Languages Captic, Arabic, French, English
Currency Egyptian Pound
Government Republic
GEOGRAPHIC PROFILE OF EGYPT
Business Profile of Egypt
Natural resources Petroleum, natural gas, iron ore,
phosphates, manganese, limestone,
gypsum, talc, asbestos, lead, rare
earth elements, zinc
Main Exports Petroleum, petroleum products,
cotton, Textile, Metal product and
Chemicals.
Area 1million sq km contains
land: 995,450 sq km & water: 6,000 sq km
Location Egypt (northeastern Africa), bordering the Mediterranean
Sea, between Libya and the Gaza Strip, and the Red Sea
north of Sudan, and includes the Asian Sinai Peninsula
Climate desert; hot, dry summers with moderate winters
Time Zone Egypt is + 2 hours GMT

3 | P a g e
DEMOGRAPHIC PROFILE OF EGYPT
Population 82,536,770(2011 est.)
Source: World Bank
Annual population growth rate 1.922% (2012 est.)
Nationality Egyptian
Ethnic groups Islam (Sunni Muslim); Coptic
Christian; other Christian
denominations
Ethnic Make-up: Eastern Hamitic
stock (Egyptians, Bedouins, and
Berbers) 99%, Greek, Nubian,
Armenian, other European
(primarily Italian and French) 1%
Age Structure 0:14 years: 32.7% (male
13,725,282/female 13,112,157)
15:64 years: 62.8% (male
26,187,921/female 25,353,947)
65 years and over: 4.5% (male
1,669,313/female 2,031,016) (2011
est.)
Median Age total: 24.3 years
male: 24 years
Female: 24.6 years (2011 est.)
Birth Rate 24.63 births/1,000 population (2011
est.)
Death rate 4.82 deaths/1,000 population (July
2011 est.)

4 | P a g e
SOCIO CULTURAL ENVIRONMENT
In this global report, we have done social analysis of Egypt. So we have found out
the various social factors which are affected the environment of Egypt and causes the
social issues like poverty and over population. These factors are:
Cultural Aspects (religion, family, ethnicity)
Mentality of the people
Health Consciousness and safety measures
Career Attitudes
National Life Style Habits
Education
Economic Status (Income and Earning Patterns)
Locality
Cultural Aspects
Family Structure
In the Egyptian family the father was liable for providing for his family. The
mother stayed home and raised the children. Small children and other female relatives
lived in a special part of the house. Much of the children's time was spent in training for
their adulthood.
Natural Appearance
Ancient Egyptians usually had black hair and dark eyes. Their skin was tanned.
Religion
Egyptians believed in many Gods. They believed that many things held power.
They worshiped Gods of the stars, stones and water. Egypt hosts two major religious
institutions one is Islam and other is Christianity.
Islam
Egypt is a predominantly Sunni Muslim country with
Islam as its state religion. The percentage of the adherents of
various religions is a controversial topic in Egypt. Around 90%
are Muslim. Islam plays a central role in the lives of most
Egyptian Muslims. Islam arrived in the 7th century, and Egypt
emerged as a center of politics and culture in the Muslim world.

5 | P a g e
Christianity
There is a significant Christian minority in Egypt, who
make up around 15% of the population Over 90% of
Egyptian Christians belong to the native Coptic
Orthodox Church of Alexandria, an Oriental Orthodox
Church.
Children Egyptians played with dolls, balls, tops, animal toys, and board games which were
similar to checkers. All toys were handmade Toddlers used pull toys similar to the toys
that children play with today. They were tied with string and painted. Children of the
wealthy between the ages of 4 and 14 went to school
Food
Egyptians ate two large meals each day. They ate lots of cereal, vegetables, and fruits.
Some of the most common foods were barley, wheat, lentils, cucumbers, beans, leeks,
onions, dates, figs, and grapes. Other fruits included apples, melons, pomegranates and
the occasional coconut. Beef was the Egyptians' favourite meat, but they also ate lamb,
gazelle, wild goat, ox, pork, fish, duck,
and goose.
Bread was an everyday food of both the
commoner and the wealthy. This is why
the teeth of royalty showed serious
abrasion. Wealthy Egyptians sweetened
their bread with honey and stuffed it
with fruit.
A common meal for a peasant might be
boiled or roasted beef, assorted
vegetables, fruit (usually figs and grapes), a slice of bread, and beer. The wealthy ate on
bronze, silver, or gold plates while the commoners ate on clay dishes. People ate with
the tips of their fingers. Everyone was given a small bowl of water to clean their hands
after the meal.
Festivals Of Egypt:-
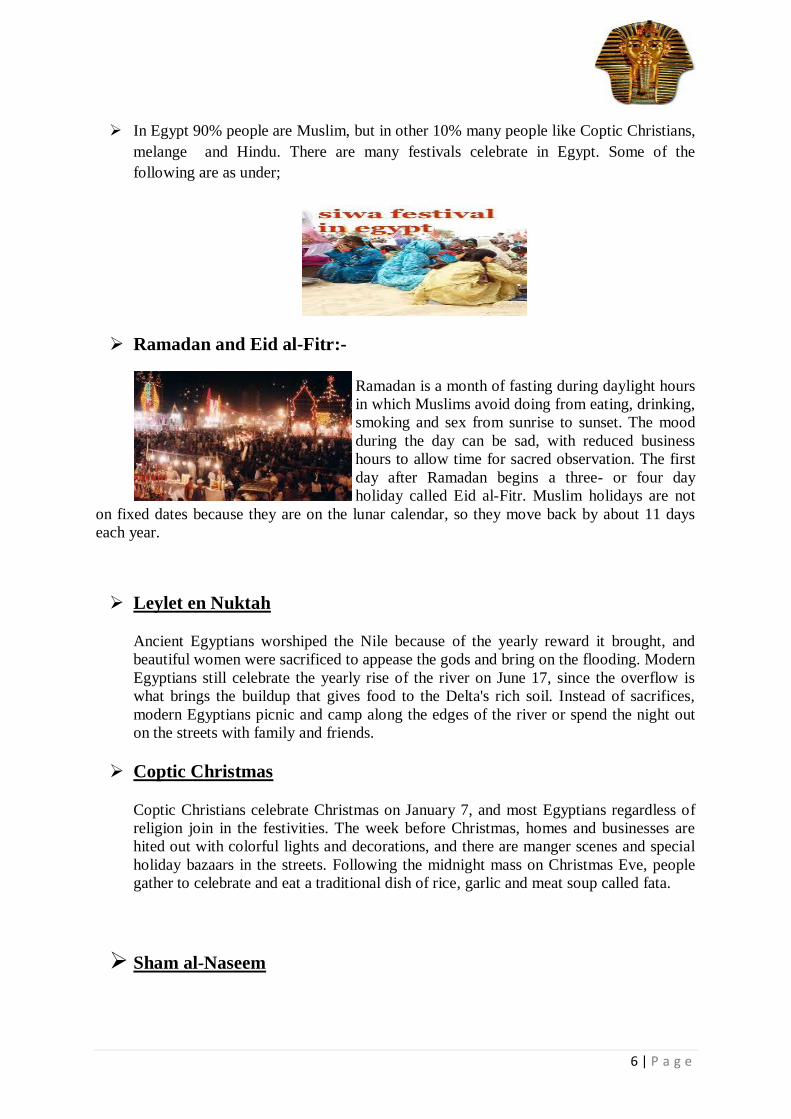
6 | P a g e
In Egypt 90% people are Muslim, but in other 10% many people like Coptic Christians,
melange and Hindu. There are many festivals celebrate in Egypt. Some of the
following are as under;
Ramadan and Eid al-Fitr:-
Ramadan is a month of fasting during daylight hours
in which Muslims avoid doing from eating, drinking,
smoking and sex from sunrise to sunset. The mood
during the day can be sad, with reduced business
hours to allow time for sacred observation. The first
day after Ramadan begins a three- or four day
holiday called Eid al-Fitr. Muslim holidays are not
on fixed dates because they are on the lunar calendar, so they move back by about 11 days
each year.
Leylet en Nuktah
Ancient Egyptians worshiped the Nile because of the yearly reward it brought, and
beautiful women were sacrificed to appease the gods and bring on the flooding. Modern
Egyptians still celebrate the yearly rise of the river on June 17, since the overflow is
what brings the buildup that gives food to the Delta's rich soil. Instead of sacrifices,
modern Egyptians picnic and camp along the edges of the river or spend the night out
on the streets with family and friends.
Coptic Christmas
Coptic Christians celebrate Christmas on January 7, and most Egyptians regardless of
religion join in the festivities. The week before Christmas, homes and businesses are
hited out with colorful lights and decorations, and there are manger scenes and special
holiday bazaars in the streets. Following the midnight mass on Christmas Eve, people
gather to celebrate and eat a traditional dish of rice, garlic and meat soup called fata.
Sham al-Naseem
7 | P a g e
“Sham al-Naseem” means “sniffing the breeze.” Egyptians of all religions celebrate this
ancient holiday to mark the coming of spring on March 21 by spending the day in the
countryside or in parks for picnics; some have their picnic on a boat trip on the Nile.
The picnic baskets are loaded with the traditional foods of this holiday, including dried
or pickled fish and dishes made with midamis or foul (kidney beans). Food vendors,
dancers and musicians also fill the streets to entertain the public on this festive day.
Moulid an-Nabi
Moulid an-Nabi is a major Islamic festival that marks the birth of the prophet
Mohammed. Most cities host parades and processions on this day, and the streets are
filled with dancers, acrobats, drummers and musicians. Families join together to greet
each other and exchange gifts before heading out to explore the street fairs. Traditional
sweets like halawet el-moulid and candy dolls called are sold from roadside stands as
well as hummus the traditional food of Moulid an-Nabi.
Other Festivals in Egypt :-
Beautiful festival of Egypt
This festival-related article is a stub.
This article about Egyptology or subjects relating to Ancient Egypt is a stub.

8 | P a g e
Sports Festival:-
Food Festival:-
Film Festival :-
Mentality of Egypt
Egyptians, who just agree on what goes on whether it is for their sake or not.
If you ask an Egyptian about his life, the typical answer would be that it is going OK but not in
the way he imagined and he would also say that he is happy and satisfied with his life. People
just accept the life they get and they don't try to work to achieve something useful for them and
their community.
9 | P a g e
Health care
Health care system
As a developing country with vast human resources and a rapidly-growing economy,
reforming Egypt's health care sector is a top priority for the national social development
agenda.
Ten work streams already demonstrate the defined dimensions of the Egyptian health
reform program, the most crucial of which include providing high quality care through
financially-sustainable health insurance, spreading the coverage of primary care
services, enhancing family planning services at a national level, institutionalizing and
strengthening consumer protection, in addition to encouraging public-private
partnerships.
Nearly all Egyptians have access to health care. Between 1982 and 1987 (during the
first five-year plan), the government established 14 public and central hospitals, 115
rural health units, and 39 rural hospitals. The total number of beds increased by 9,257
during this period (to a total in 1985 of 96,700). In 1987, 190 general and central
hospitals were established (26,200 beds), as well as 2,082 rural health units, and 78
village hospitals. In 2000, 95% of the population had access to safe drinking water and
94% had adequate sanitation.
Disease
With less than 1 percent of the population estimated to be HIV-positive, Egypt is a low-HIV-prevalence country. According to the National AIDS Program (NAP), there were 1,155 people
living with HIV/AIDS (PLWHA) in Egypt by the end of 2007. UNAIDS estimates for 2005
were higher, putting the number of HIV-positive Egyptians at 5,300.
Serious diseases in Egypt include schistosomiasis, malaria, hookworm, trachoma,
tuberculosis, dysentery, beriberi, and typhus. Although malaria and polio cases were
small in number, nearly 1,444 measles cases were reported in 1994. In 1999, Egypt
vaccinated children up to one year old against tuberculosis; diphtheria, pertussis, and
tetanus (94%); polio; and measles (95%). Of children under age five, 4% were
malnourished as of 2000.
The country's fertility rate was 3.3 in 1999. As of 2000, 56% of reproductive-age
women practiced contraception. Abortion is legal only for medical reasons. The overall
death rate was estimated at 7, 6 per 1,000 inhabitants in 2002 and the infant mortality
rate in 2000 were 42 per 1,000 live births. Life expectancy in 2000 was 67 years.
A full 80% of all Egyptian women undergo female genital mutilation. There are no
specific laws against this practice.
Egypt planned to expand its health insurance, with the target of covering 75% of the
population. As of 1999 total health care expenditure was estimated at 3.8% of GDP.
There were 129 cases of AIDS in 1996.

10 | P a g e
Common Disease in Egypt
Food and waterborne diseases - the number one cause of illness in travelers
travelers' diarrhea
Escherichia coli diarrhea
hepatitis A / very common
hepatitis B
hepatitis C - highest prevalence in world
schistosomiasis - found in fresh water including Nile river
typhoid fever
Insect borne diseases
parasitic diseases
filariasis
leishmaniasis
Rift valley fever / rare
amebiasis
diptheria - endemic to the region
West Nile fever
Challenges
Compared to a country like Swaziland, Egypt is almost HIV-free. Egypt has a very low
HIV/AIDS adult prevalence rate less than 0.1% which is far better than in most
countries around the world. Just around 11,000 people were living with HIV/AIDS in
2009 with less than 500 deaths recorded within the same year. Egypt is also spared
when it comes to the deadly malaria which continues to tear most sub-Saharan African
countries into pieces. However, Egypt is not spared at all when it comes to
Schistosomiasis (sleeping sickness), bacterial diarrhea, hepatitis A, Rift Valley and
typhoid fever.
Another major health problem facing Egypt today is Obesity. In 2006, more than 30%
of Egyptian adults were overweight according to World Health Organization. Egypt is
the 8th most Obese country in the world today. Meanwhile, about 6.8% of Egyptian
children under the age 5 were underweight in 2008.
Education
The Egyptian educational system is highly centralized,
and is divided into three stages:
Basic Education
o Primary Stage
o Preparatory Stage
Secondary Education
Post-Secondary education
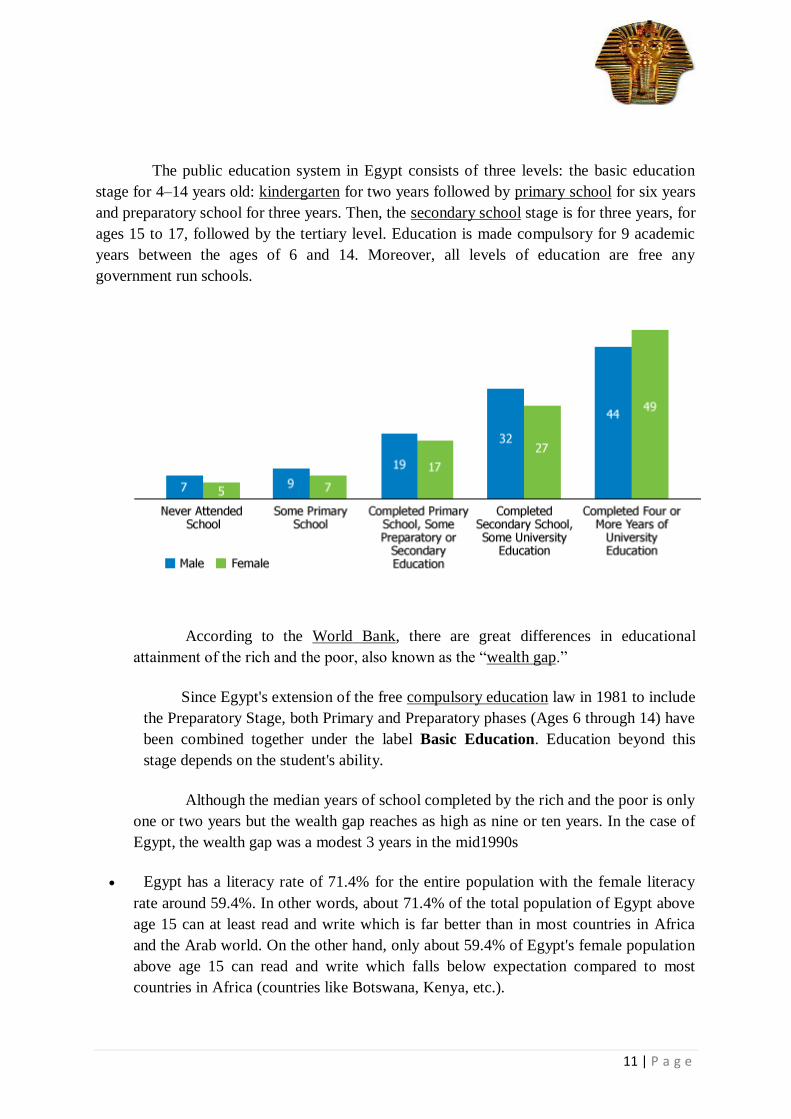
11 | P a g e
The public education system in Egypt consists of three levels: the basic education
stage for 4–14 years old: kindergarten for two years followed by primary school for six years
and preparatory school for three years. Then, the secondary school stage is for three years, for
ages 15 to 17, followed by the tertiary level. Education is made compulsory for 9 academic
years between the ages of 6 and 14. Moreover, all levels of education are free any
government run schools.
According to the World Bank, there are great differences in educational
attainment of the rich and the poor, also known as the “wealth gap.”
Since Egypt's extension of the free compulsory education law in 1981 to include
the Preparatory Stage, both Primary and Preparatory phases (Ages 6 through 14) have
been combined together under the label Basic Education. Education beyond this
stage depends on the student's ability.
Although the median years of school completed by the rich and the poor is only
one or two years but the wealth gap reaches as high as nine or ten years. In the case of
Egypt, the wealth gap was a modest 3 years in the mid1990s
Egypt has a literacy rate of 71.4% for the entire population with the female literacy
rate around 59.4%. In other words, about 71.4% of the total population of Egypt above
age 15 can at least read and write which is far better than in most countries in Africa
and the Arab world. On the other hand, only about 59.4% of Egypt's female population
above age 15 can read and write which falls below expectation compared to most
countries in Africa (countries like Botswana, Kenya, etc.).

12 | P a g e
Challenges
Although significant progress has been made to increase human capital base through
improved education system, still the quality of education experience is low and unequally
distributed. Due to lack of good quality education at the basic and secondary levels, there has
been a mushrooming market for private tutoring. Now to take private tuition has become more
of an obligation than a remedial activity.
A study conducted by UNESCO on educational equity in world‟s 16 most
populous countries placed Egypt in the middle range in terms of equity of primary and
secondary enrollments across governorates in Egypt. But when the wealth component is
added to education attainment, the results are not very encouraging. There are
significantly higher enrollment rates in wealthier regions at both the primary and
secondary levels. This confirms that more efforts are needed to reduce the wealth gap in
educational attainment.
National Life Style Habits.
Clothing
The Egyptians wore very simple clothing. The clothes were made of linen. Linen was
made from the flax that grew in the fields. It was woven into cloth. The rich wore finely
woven linen while the workers wore a more durable material. Male peasants wore
loincloths. They hung from their waists to their knees. Many times they wore no
clothing. Men in the upper class wore skirts or kilts. The women wore simple, tight-
fitting dresses. They came up to their chests and were held up on the shoulders by
straps. Children wore no clothing until they were in their teens.
Jewellery
One common likeness on Egyptian jewellery was the scarab or beetle. Egyptians
believed the scarab to be the symbol of resurrection or life after death. Both men and
women wore earrings and bracelets on their upper and lower arms. They also wore
rings, necklaces, and pectorals. Pectorals were wide necklaces that hung on the chest.
The jewellery was usually made from gold which was mined in the Eastern Desert. The
jewellery was often decorated with semiprecious stones like carnelian, feldspar, and
amethyst. Turquoise and lapis lazuli were imported from the Sinai Peninsula to add to
the jewellery as well. The jewellery often contained good luck charms called amulets.
Hair Styles
The boys shaved their heads except for one braided lock until the age of 12. This was a
protection from fleas and lice. Girls wore their hair long. It was often worn in pig tails.
The women wore their hair loose or in braids. The wealthy wore wigs. For parties
Egyptians wore wigs or braided their hair.

13 | P a g e
Pets
Most families had pets. Cats were a favourite. Other pets included monkeys, geese,
goats, and birds. The rich had dogs. They used them for hunting.
Hunting
Hunting was a sport enjoyed not only by the peasants,
but by noblemen as well. In the desert the men dug
camouflaged ditches and used arrows to catch lions or
hyenas. Hunters used bows and arrows or boomerangs.
They used daggers or spears once the animal had
fallen. These weapons were made from wood, bronze,
and copper.
Homes
Egyptian homes were made from bricks. Bricks
were made of sun dried mud. Mud bricks lasted a
long time in the hot country which had little rainfall. The homes had low arched
doorways. Some had windows with wooden shutters. The floor was dirt.
Entertainment
The Egyptians loved music, and played instruments such as the lute, harp, and lyre.
Festivals held in Ancient Egypt were usually holidays in honour of the gods. The
Egyptians loved their children and encouraged them to play and have fun. Some games
they played were leap frog and tug o' war. Egyptians liked board games. One called
Senet was similar to checkers. Another board game was called Snake. The board was
shaped like a curled snake with its head in the centre. The snake's body was divided
into squares, half of which were hollowed out. Six pieces shaped like lions and
lionesses and many marbles were needed to play this game. Unfortunately the rules to
this game were not written down.
Marriage
Peasant boys married by the age of 15. Girls were only 12 when they married. Girls
from more wealthy families married a little older. Many marriages were arranged by
parents. The life expectancy of an Egyptian was only around age 40

14 | P a g e
Career Attitudes
Women and work
Egypt is more liberal compared to many other Arab countries, especially those
in the Gulf region, conservative positions are expected to hold. It is expected that males
will have more conservative attitudes towards the work of women.
Egypt is quick in importing innovations in technologies and consumables; he is far more
reluctant in terms of importing ideas and lifestyles.
Egypt has more than three million of its citizens working abroad (Zohry, 2006). The World
Bank statistics estimated the number of Egyptians working abroad in 2005 at around 2.4
million.
The social fabric of Egyptian society is strong with great emphasis accorded to the family unit
and religious values. Although Egypt has high uncertainty avoidance, this propensity is lower
than in other countries in the region (Parnell and Hatem, 1999).
The work ethic reflects the belief that work is good in itself and that success results
from hard work (Buchholz, 1978).
Pertaining to the attitudes of the Egyptian respondents to the work of women, there
were significant differences between males and females. In general, male respondents
expressed agreement or neutrality to statements such as „Women are happier in
traditional roles” or neutrality to such statements as “women are not suited to work
outside the home”
The role of women in society and the significant gender differences in the way
women‟s work is valued and perceived are also congruent with those of the GLOBE
study.
Economic Status (income and earning patterns)
In Egypt the definition of income is more complete, including income received in
kind as well as in cash. In Egypt a money value was imputed to receipts in kind,
household consumption of crops and crop by-products, and home-consumed livestock.

15 | P a g e
Social issues in Egypt
There are mainly two social issues in Egypt.
1) Poverty
2) Overpopulation
One of Egypt's biggest problems is poverty. The growth of slums has caused an
increase in crime, violence, and religious militancy (forceful expression of religious
beliefs). Pickpockets and purse snatchers are common all over Cairo. There is white-
collar crime including embezzlement, tax evasion, and bribes to officials. Another
major problem is the illegal use of drugs.
Egyptian prisons are overcrowded. International human rights organizations, such as
Human Rights Watch and Amnesty International, have criticized the Egyptian
government's handling of strong opponents of its policies. The major criticism is that
not only violent opponents, but also nonviolent political opponents, are being denied
their political and civil rights in the government's attempt to maintain control.
Poverty Although the incidence of poverty is decreasing overall in Egypt, the number of poor people
continues to increase as the population grows. Egypt has about 10.7 million poor people, and
70 per cent of them live in rural areas.
Who are Egypt's poor people?
Rural poor people typically include:
tenant farmers and small-scale farmers
landless labourers
unemployed youth
women
Why are rural people poor?
Almost two thirds of the people in Upper Egypt are poor. They depend on
agriculture for their livelihood, and agriculture in this area does not provide them with
sufficient food security and income. Farmers in this part of the country have very small
landholdings, compared to those in Lower Egypt. They cultivate crops that have a low
market value and generate limited income. They are unable to finance the higher costs
and greater risks of growing non-traditional crops. Small farmers, microenterprises and

16 | P a g e
rural women do not have access to a microfinance system that responds to their needs.
Alternative employment opportunities are lacking because of the limited development
of small enterprises and microenterprises. Local markets are underdeveloped and
marketing infrastructure, such as transport, storage and grading facilities, is poor.
Producers' associations are not well organized.
The relation between education and poverty is an inverse relation – usually
poverty decreases with higher levels of education. The relation between education and
poverty is an inverse relation – usually poverty decreases with higher levels of
education. It is noted that poor women are usually illiterate. However, in Sudan, it is
noted that households headed by individuals with intermediate and primary education
were better off in terms of total household income, than those households headed by
individuals with higher educational qualifications. This may be attributed to
engagement of those with intermediate or primary education in the informal sector
and/or performing more than one job.
Egypt's poverty profile reveals that the poor are usually either occupied in
marginal activities and low-wage work or unemployed. Most of them are illiterate or of
low educational level. Although there has been some progress, these improvements are
not satisfactory, either because the pace of development is very slow.
The case of women in poverty is of major significance not only because of their
intensely restricted life chances, but more because of the increasing number of female-
headed households that reached 12.6% and the extension of their poverty to their
children. Child labor is familiar in Egypt because of poverty. In very poor areas 50% to
70% of poor families depend on children income. Children work at 8 years old and
their wages are less than those of men by 25% to 33%. Working hours for children are
7-9 hours a day and in some cases it is extended to 12 hours a day.
Overpopulation
Egypt, like many other countries, is battling overpopulation. Egypt is suffering from too
many people living on a small piece of land. Egypt is the sixteenth largest country in
terms of population Egyptians cannot live in the desert where there is no water and no
way of sustaining themselves. The majority of Egypt is covered in desert and Egyptians
need to live along the Nile River and Nile River Delta where there is water and other
necessities that the desert does not have. Overpopulation causes many problems
including, but not limited to: pollution, rapid spread of disease, and unemployment.
Where is it happening?
Egypt is not the first country you think of when it comes to overpopulation. You think
of China, India, of Bangladesh. But Egypt too, is suffering from overpopulation. The

17 | P a g e
population growth rate is two percent higher than that of the United States and this is
one of the main contributing factors of overpopulation. Most of the major cities in
Egypt are around the Nile River. This population crisis affects people living in cities.
Most of Egypt is uninhabitable at this point in time because it is mostly desert and not
safe for humans to live in. This just makes the overpopulation problem seem worse
because everyone lives in crowded cities. Cairo, the capital of Egypt, is the most
populated city in Egypt at about 8,000 people per square mile. The population problem
in Egypt is severe and needs to be curtailed before it is as bad as China's population
problem.
Egypt faces huge problems of overpopulation, poverty
In Cairo, Egypt's capital and the seat of the citizens' revolution, some districts hold
more than 41,000 people per square kilometer, or 100,000 per square mile. Manhattan,
by comparison, has about 27,000 people per square kilometer.
More than 15 million Egyptians live on less than $1 a day, a key factor driving last
month's protests. The divide in Egypt between rich and poor, where resistance to birth
control is high, is startling.
Even though Egypt has severely limited resources, especially fertile land and water
(only 3 inches of rain falls annually), the numbers of poor steadily increases.
In past years, the Egyptian government mounted an aggressive but unsuccessful
advertising campaign to limit new births. One motto: "Before you add another baby,
make sure his needs are secured."
Despite Egypt's progress in reducing its total fertility rate, currently estimated by the
Population Reference Bureau at 3.0, that total is still unsustainably high. As long as
Egypt's base population increases, no meaningful headway on critical social issues like
education can occur.
Egypt offers free education and well-established literacy programs. But the numbers of
Egyptian illiterates, one in every four or nearly 17 million, remains unchanged over the
last two decades. Ghada Gholam, and UNESCO Egypt literacy specialist, said: "There
are lots of successful efforts, but with the increase in the population growth it is really
difficult to decrease the number of illiterates."
Population statistics reveal the grim story. Educators must teach 1.4 million Egyptians
to read and write annually simply to keep up with the country's population growth. And
for every 700, 000 who learn to read, the literacy rate is only reduced by one percent.

18 | P a g e
Other variables that limit access to education include the high post-puberty dropout rate
for teenage girls and the inability of poor parents to pay for transportation or the
textbooks. Nearly 70 percent of women, Egypt's mothers and future mothers, are
illiterate.
Each year, Egypt's population swells by approximately 1.5 million. The United Nations
projects that Egypt will grow from 95.6 million in 2026 to 114.8 million in 2065 when
it will finally stabilize.
Egyptian high fertility has imposed costly socioeconomic burdens on the nation.
Economic development is stalled and quality of life eroded because of reduced access
to jobs, education, water and food.
Little wonder Egyptians took to the streets. But too many decades ignoring an
exploding population have left Egypt with few options for future improvement.
Unemployment and Poverty in Egypt
According to CNN, the current turmoil in Egypt is driven by a lack of jobs and
the high levels of poverty in the country. Statistics show that 50% of men and 90% of
women are still without employment two years after leaving college. It is also telling
that 19.3% of the population live on less that $2 a day. All this despite the boom in the
price of oil.
.

19 | P a g e
CONCLUSION
From time to time two quite opposite views concerning the causes of
overpopulation in „developing‟; countries are rehearsed in politico-descriptive terms
rather than by way of complex statistical analyses of past trends and future projections.
Theory 1 argues that poverty is sustained or exacerbated by too high a population at a
given period of time, and is therefore an effect of it, in particular when birth rates
remain high and mortality rates are decreasing rapidly. Theory 2 contends that poverty
itself is the cause of high birth rates, largely because of inequitable access to natural
resources, notably in the form of land, and that the result is a population and
environmental crisis. (See, for instance, Commons without Tragedy: Protecting the
Environment from Overpopulation - a New Approach. R V Anderson (Ed.) 1991.)
For practical reasons, such assertions cannot usefully be made about the world
as a whole or even to large continents, but can only apply to more limited geographical
areas or countries. A recent visit to the Arab Republic of Egypt, a country which, by
general agreement, is both overpopulated and poor, prompted an examination of these
somewhat contradictory theories. It would seem that Egypt remains very poor because
of rapid population increase, despite the land reforms of the 1950s and early 1960s, as
well as newly available resources of energy and of modern technology; income per
capita is actually continuing to fall. The population has doubled in the last 30 years to
over 55 million. While the birthrate has fallen from 46 per 1,000 to about 34 per 1,000
during that period, the death rate has fallen even faster and is now not much above
European levels. Half of all females are aged 15 - 49 and half the population is under
the age of 25. Medical services are good overall. Birth control is promoted, albeit rather
half-hearted in some parts of the country, but is available if requested. Average family
sizes vary from 5 to 8 children, being highest in the Nubian villages in Upper
(southern) Egypt. Highly educated professionals in the state sector such as doctors are
extremely poorly paid by western standards and have fewer children.
It seems that here, as in many other „„developing‟‟ countries, the slowness in the
rate of change in cultural and religious attitudes among women, and perhaps more
importantly among men, combines with much more rapid change in technology and
medicine. In Egypt certainly, the crisis of overpopulation is not the effect of sustained
or increasing poverty.
K.P.PATEL SCHOOL OF MANAGEMENT
AND
COMPUTER STUDIES
AFFILIATED TO GUJARAT TECHNOLOGICAL UNIVERSITY
MBA PROGRAMME (2011-2013)
A Global Country Study Report On
(Cotton Industry of EGYPT)
SSSuuubbbmmmiiitttttteeeddd bbbyyy MMMBBBAAA SSSEEEMMMEEESSSTTTEEERRR IIIVVV(((KKKSSSMMMCCCSSS)))
(((BBBaaatttccchhh ::: 222000111111---111333)))
KKKiiinnnjjjaaalll SSShhhaaahhh ::: 111111777222444000555999222000000111
RRRaaahhhuuulll SSShhhaaahhh ::: 111111777222444000555999222000000222
RRRiiittteeessshhh SSShhhaaahhh ::: 111111777222444000555999222000000444
VVViiipppuuulll PPPaaattteeelll ::: 111111777222444000555999222000000666
HHHiiitttiiixxxaaa GGGooorrr ::: 111111777222444000555999222000111000
PPPaaarrrttthhh SSShhhaaahhh ::: 111111777222444000555999222000111999
SSSuuubbbmmmiiitttttteeeddd tttooo (((KKKSSSMMMCCCSSS)))
IIINNN PPPAAARRRTTTIIIAAALLL FFFUUULLLFFFIIILLLLLLMMMEEENNNTTT OOOFFF TTTHHHEEE
RRREEEQQQUUUIIIRRREEEMMMEEENNNTTT OOOFFF TTTHHHEEE AAAWWWAAARRRDDD FFFOOORRR TTTHHHEEE DDDEEEGGGRRREEEEEE OOOFFF
MMMAAASSSTTTEEERRR OOOFFF BBBUUUSSSIIINNNEEESSSSSS AAADDDMMMIIINNNIIISSSTTTRRRAAATTTIIIOOONNN
IIInnn
GGGuuujjjaaarrraaattt TTTeeeccchhhnnnooolllooogggiiicccaaalll UUUnnniiivvveeerrrsssiiitttyyy
UUUNNNDDDEEERRR TTTHHHEEE GGGUUUIIIDDDAAANNNCCCEEE OOOFFF
FFFaaacccuuullltttyyy GGGuuuiiidddeee
DDDrrr... AAAjjjaaayyy TTTrrriiivvveeedddiii

i | P a g e
STUDENTS’ DECLARATION
We hereby declare that the report for Global/ Country Study Report entitled
“Cotton Industry OF EGYPT” is a result of our own work and our indebtedness to
other work publications, references, if any, have been duly acknowledged.
Place: KAPADWANJ
Date:
(Signature)
KINJAL SHAH.
RAHUL SHAH.
RITESH SHAH.
VIPUL PATEL.
HITIXA GOR.
PARTH SHAH.

ii | P a g e
PREFACE
This is the global country study report for the year 2012-13. It is very essential for on
MBA students because after the completion of their MBA studies they may undergo in the
practical corporate world for management and in that only class discussions and presentations
are not enough for understanding any job. The practical knowledge about the corporate world
is essential. The topic selected by us is Egypt society.
For this purpose we have received a great support from our college professors and
classmates. The objective of this report in MBA is to give the real knowledge of practical
world in future. This Report about “Cotton Industry of EGYPT” will help to understand what
the job is and also be helpful to take major decisions on the basis of national and international
level of study report. The aim of our study was to prepare report to improve our knowledge,
ability and skill on job undertaking in tourism area.
Through this collaboration, the team that was assembled to undertake the work was
broader and more experienced than either unit could have fielded individually. The effort was
truly a collaboration among the members of the team, the sponsoring units, and most
importantly, the government records, data and report the cotton experts who made his report
and gave their time and shared valuable insights and information about the factors affecting
the final quality of Egyptian cotton.
It is the hope of all who worked on the study or supported it that continuing
improvements in the Egypt’s cotton industry and it’s comparison with Indian cotton industry
and both countries role in improvement of cotton sector. The control systems in Egypt will
preserve the unique properties of Egyptian cotton for all who wish to enjoy them.

iii | P a g e
ACKNOWLEDGEMENT
Cotton is one of Egypt’s landmarks recognized in international markets for its
superior quality. During the past decade, the Government of Egypt has actively worked on
liberalization and privatization of the Egyptian cotton industry to allow the private sector to
play a more important role in the marketing, ginning, spinning and weaving of cotton. As a
result, the Egyptian cotton industry has become more competitive and Egyptian cotton has
regained much of its world market share.
Without question, the most valuable contributions to this study came from the many
people in the Egyptian cotton industry and the foreign spinners who use Egyptian cotton who
participated in the marketing survey. These people contributed a sizable amount of time and
provided invaluable information, insights and understanding of the Egyptian cotton markets
and the cotton quality issue in Egypt. This study would not have been possible without their
cooperation.
Cotton is one of the most important and widely cultivated cash crops across the world.
It is also one of the most important commercial crops cultivated in India. Cotton is the most
important commercial crop of India. It is generally regarded as King of Textile Fibers which
has made significant contribution to the National economy. It provides sustainable
livelihoods for millions of rural population. The textile industry is nourished by cotton for
over a century .Today, the textile industry has grown to be the largest industry in India
Guidance, cooperation and inspiration are the important factors in accomplishment of
the project.
No endeavour is complete without giving thanks to people who are helpful in making
that successful. We extend our sincere thanks to KSMCS for providing us the opportunity
and scope for this report. We also thank our guide Professor Mr. Ajay Trivedi for his
support and guidance.
Finally, we are sincerely thankful to others who have directly or indirectly help us in the
completion of the project.

iv | P a g e
EXECUTIVE SUMMARY The objectives of this report were to assess the cotton quality and grading systems in
Egypt and to recommend improvements. The main objective of this report is to compare the
cotton industry of Egypt and India and evaluate the performance that is achieved by both.
Egypt is one of the 11 countries in COMESA, EAC and SADC countries targeted for the
regional baseline study on cotton and textile. Together these countries account for over 90% of
traded cotton and textile.
As one of the most influential nations in the Middle East, Egypt has encountered
mixed success in transitioning from an economy driven by natural resources to one with a
healthy amalgam of industry and services over the past 50 years. Although it has successfully
diversified its economy, Egypt remains one of the poorest of its regional neighbors on the
basis of per-capita income, and a succession of unstable governments have left the nation
with inconsistent political institutions, weakening social infrastructure, and a legacy of
corruption. Long-term national competitiveness will require a clear economic strategy and
continuity of effort.
Egyptian cotton is recognized globally for its unmatched quality, fueling a textile
cluster that has historically been an important component of the national economy. Bolstered
by superb endowments and several advantageous related industries, the textile cluster faces
new challenges as falling structural barriers to trade boost the intensity of global competition.
To maintain sustainable competitive advantage and upgrade textile cluster performance,
Egypt should privatize key SOEs in the spinning sector and partner with multinationals and
clusters in developed nations to upgrade the skills of its textile labor force.
Cotton area and production in 2009/2010 is forecasted to decline by 17 percent to 110,000 Hectares.
Exports in 2009/08 are expected to decline sharply from the previous year. This is mainly due to the
declining profit margins for cotton compared with other crops such as rice and corn. Exports for
2008/09 are expected to decline dramatically to 100,000 bales as a result of lost price
competitiveness coupled with the world recession. Imports are forecasted to increase by about eight
percent.

v | P a g e
Egyptian cotton is of the species Gossypium barbadense, longer staple cotton
characterized by higher quality. The majority of the cotton is grown in the Nile Delta with
around 1 million employed in Production, but still mostly dominated by smallholder farmers.
Yields in Egypt are significantly higher than the rest of Africa, reaching 2000 kg/ha.
This is due to more advanced production techniques, specifically the use of irrigation. The
cotton industry has been gradually more liberalized since 1994/95, and now there exists 62
traders buying cotton (17 public and 45 private) and 5 ginning companies (2 private and 3
public).Egypt also has a significant domestic textile industry that typically utilizes about half
of the total cotton production. The unusually high world price of cotton lint in 2010 though
prompted a greater export of unmanufactured cotton than typically expected. Egypt has 15
major ports for the export of goods, of which Alexandria is the largest.
It is neutral supervising cotton organization that serves the cotton sector s dealing
with seed cotton and lint cotton. Some of CATGO services are insuring the purity of
Egyptian cotton varieties and its international reputation, classing and evaluating cotton crop
and supervising it throughout all handling procedures right from picking until baling,
determining the moisture content of cotton, supervising their weights, issuing international
authorized certificates, determining the trash level "contamination", preparing official
standard boxes representing the standard grades for all Commercial varieties and applying the
arbitration in its different stages (arbitration, appeal and counter appeal).
The Egyptian Ministry of Trade and Industry and ALCOTEXA registered a trademark
for Egyptian cotton, to help consumers recognize the quality of Egyptian cotton products by
identifying those goods bearing the logo, and protect them from misleading labels. The Trade
mark is registered in 26 countries and others still in process. A licensing program and
monitoring mechanism are also enforced.
The political and economic upheaval that has occurred since the beginning of 2011
has complicated an already difficult market outlook for Egypt’s cotton production and has
required the payment of government subsidy to textile mills, so as to absorb some of the
domestic supply and achieve the political imperative of supporting the price received by the
farmer.
Egypt shows some linkages indicative of a cluster-based economy, with particular
strength in transportation and logistics and a robust tourism cluster. But enforcement of input

vi | P a g e
quality standards remains lax and availability of some support services is poor despite
increases in FDI flows which might have encouraged cooperation between firms.
Cotton subsector participants often state that the quality of Egyptian cotton has
deteriorated overtime. A variety of causes are mentioned. The views differ depending upon
the participant. Some claim that the grading system has deteriorated under the supervision of
CATGO. It is some times stated that the graders, or cotton classers, are poorly trained, or that
they are not as well experienced as those in some bygone era. Some say that the need for
grading every sack of seed cotton is an overwhelming task and clogs the system. Others
report that the bulk of the cotton that is exported is at a low grade.
Some say that the grading system, including the number of grades and the
terminology is far too complex and also may overwhelm the system. Others blame the current
problems on the nationalization of the cotton subsector that began in about 1962-63 and
contend that all will be well as soon as the entire subsector again becomes a free market.
Perhaps liberalization will solve all the problems of the subsector but in case it doesn't, or if
liberalization is several years still in coming, then what can the GOE do in the mean time to
help to preserve, maintain, and improve the international reputation of Egyptian cotton?.
Regardless of the speed or final outcome of liberalization of the cotton markets, the GOE will
continue to have an impact on the cotton subsector. The MALR will continue to play a large
role in cotton breeding. All cotton producing countries, even those that are considered to have
a completely free market, have regulations about seed production and the varieties that can be
planted. Most governments also operate the grading and testing organizations, they provide
official statistics on the crop, and they operate the market news services. The entire Egyptian
cotton subsector will only operate well when the public sector and the private sector are each
making their unique and valuable contributions.
A major assignment in this study was to interview foreign importers of Egyptian
cotton. The sample included some thirty mills using Egyptian cotton in various markets
including Japan, East Asia, and Europe. These interviews were conducted to learn of their
appraisals of the spinnability of Egyptian cotton, their opinions regarding the Egyptian
grading system, and regarding the pricing of Egyptian cotton, particularly on the price

vii | P a g e
differentials between grades (See Annex II for the questionnaire used for this assignment, and
Annex III for a list of foreign spinners who responded to this questionnaire and annex IV for
a summary of the responses).
Accordingly, the Government set forth a strategy to develop cotton-dependent
industries on a step by step basis, from “seed to skin”, starting with ginning, spinning,
weaving, dying and finishing industries, followed by the apparel and home furnishing
industries and finally marketing and promotion to achieve high levels of growth for the
Egyptian economy.
The Egyptian government’s newly adopted strategy will assure the availability of
Egyptian cotton for the international market, and local spinners will also have an ability to
import cotton to accommodate their growing capacities. The government has also made a
commitment to modernize spinning, dying and finishing industries to utilize their maximum
capacities and to become attractive for foreign investments, contributing to growth in
employment.
Egypt has a diversified economy. It has extensive natural and human resources. Key
industries include tourism, petroleum, agriculture, manufacturing and the services sector. The
government is implementing economic reforms designed to encourage private sector
investment as the engine of sustainable economic growth and rising incomes.
With its reputation as the world’s finest in terms of quality, softness and strength,
Egyptian cotton is the country’s most important agricultural export. Other top exports include
crude oil and petroleum products, textiles, agriculture, food processed products, furniture,
metal products, building material and chemicals.
Since the 1990s, Egypt has embarked on a series of structural reforms focused on
economic stability, deregulation, privatization, liberalizing trade and foreign investment
regimes and restructuring the banking system. Economic policy offers investors attractive
incentives, a freely convertible and floating currency and a young, skilled workforce. Egypt
has also worked to transform itself into a leader in information technologies and e-commerce
in the region.

viii | P a g e
Under the exchange rate flotation policy, the Egyptian Pound was allowed to find its
free market rate in relation to other currencies, which resulted in more than 50% devaluation
in two years. This step increased the textile sector’s competitiveness and the demand for its
products.
Located at the crossroads of Europe, the Middle East and Africa, Egypt has for
centuries been a melting pot of races and cultures – with a tradition of tolerance and
hospitality that persists to this day. While modern Egyptians are largely Eastern Hamitic in
origin (Egyptians, Bedouins and Berbers); small percentages of the population are of Greek,
Nubian, Armenian and European descent.
Egypt’s capital, Cairo, combines ancient architecture and a cosmopolitan lifestyle.
Although it maintains its own unique culture, Egypt has embraced Mediterranean, French,
British and even American influences. Today, hundreds of thousands of foreigners live and
work in Cairo, one of the world’s largest and busiest cities.
Regarding the performance, the cotton sector in Egypt has done pretty well. The
production has stayed on the same average level but the yield has increased. Other merits are
increased prices and farmers’ share of the final export price. Also the export is greater today
than what it was before the reform. Egypt has reached both increased competition and been
able to coordinate the market, but still a lot has to be done.
The structure of the Egyptian cotton industry has changed. This can mainly be seen
through the number of players participating on the market and the increased freedom of
choice for the actors. The private sector is fairly well established in all parts of the cotton
production process, from input market to marketing and exporting the cotton. The public
share of the market is decreasing.
A high number of firms often involve higher degree of competition while it
complicates the coordination of quality enhancing measures. It has been shown that there in
some cases exists a trade-off between the coordination and competition, for example when
taking action in order to improve quality.

Sr.No. Particular Page No.
1 Introduction of Cotton 1
a. Egyptian Cotton Industry 3
b. Indian Cotton industry 5
2 Market structure
a. Egyptian Cotton Sector 6
b. Indian Cotton Sector 7
3 Trade, Consumption & Consumption of Cotton 10
4 SWOT Analysis of Cotton Industry
a. Egyptian Cotton Industry 12
b. Indian Cotton Industry 13
5 Porter’s Five Force Model
a. Egyptian Cotton Industry` 15
b. Indian Cotton Industry 17
6 BCG matrix of Egyptian Cotton Industry 21
7 PEST Analysis
a. Egyptian Cotton Industry` 24
b. Indian Cotton Industry 25
8 Competitive Advantage of Egyptian Cotton Industry 29
9. Top Companies of Egyptian Cotton Industry 30
10. Performance and comparison of Cotton Industry of Egypt
& India
31
11. Conclusion 33

Page 1
INTRODUCTION
EGYPTIAN COTTON
BACKGROUND :-
Cotton is one of Egypt‘s landmarks recognized in international markets for its superior
quality. During the past decade, the Government of Egypt has actively worked on liberalization and
privatization of the Egyptian cotton industry to allow the private sector to play a more important role
in the marketing, ginning, spinning and weaving of cotton. As a result, the Egyptian cotton industry
has become more competitive and Egyptian cotton has regained much of its world market share. The
transition has been aided by the operation of the joint Egyptian-German Cotton Sector Promotion
Program.
In 2002, the International Cotton Advisory Committee (ICAC) held its 61st plenary meeting
in Cairo under the Theme: ―The 21st Century Cotton Industry: Growth Through Private
Investment‖. As follow-on to this meeting a conference under the same theme was held in Egypt on
May 15, 2004, organized by the Government of Egypt, the Egyptian-German Cotton Sector
Promotion Program and the ICAC.
HISTORY:-
Egyptian cotton is an extraordinary commodity that has played an important and vital role in
Egypt's economic, social, and political history during the past two centuries. Egypt‘s unique climate
and fertile soil are ideal for agriculture, and especially cotton. From the early 1800s up to the present,
Egyptian cotton has always been synonymous with luxury and quality.
1821 – Egyptian Cotton is Born
A Frenchman cultivated cotton trees in Egypt and produced three bales of extra long staple
cotton, which were sold for a very high price in France. As a result, Egypt‘s ruler, Mohamed Ali

Page 2
Pasha, discovered that Egypt‘s climate combined with the best cotton seeds produced cotton of
higher quality than any other in the world.
1833 – Establishment of the School of Agriculture
Mohamed Ali established the School of Agriculture in Shoubra for the study of modern
agriculture. The aim of the School was to train students to teach modern agriculture in their villages,
creating standardized methods of cotton cultivation throughout the country.
1862 – Heightened Demand for Egyptian Cotton
Cotton planting in Egypt was extended in order to meet the demands of the textile factories in
Europe, as a result of the American Civil War (1861-1865). This expansion coincided with the
increase of cotton prices in the world market. From only 596,000 quintals in 1861, Egypt‘s cotton
exports culminated to 2 million quintals in 1865.
1869 – Trade Expansion
The completion of the Suez Canal enabled ships to travel between Europe and Asia and
beyond without having to circumnavigate the vast African continent, easing and expanding the
Egyptian cotton trade.
1910 – Government Regulation
The Department of Agriculture was established under the Ministry of Public Works. The
Department conducted research on cotton breeding, fertilization and water requirements, and
produced and distributed certified cotton seeds.
1932 – ALCOTEXA Founded
The Alexandria Cotton Exporters‘ Association (ALCOTEXA) was founded to develop the
Egyptian cotton trade and act as an arbitration body among exporters, importers, spinners and other
bodies both inside and outside Egypt.
Cotton Arbitration and Testing General Organization (CATGO)
It is neutral supervising cotton organization that serves the cotton sector s dealing with seed
cotton and lint cotton. Some of CATGO services are insuring the purity of Egyptian cotton varieties
and its international reputation, classing and evaluating cotton crop and supervising it throughout all
handling procedures right from picking until baling, determining the moisture content of cotton,
supervising their weights, issuing international authorized certificates, determining the trash level
"contamination", preparing official standard boxes representing the standard grades for all
Commercial varieties and applying the arbitration in its different stages (arbitration, appeal and
counter appeal).

Page 3
1971 - Cotton Research Institute
Current activities of CRI concentrate on; Breeding of new cotton varieties superior to the
cultivated ones (yield and quality) to fulfill the requirements of cotton farmers, preserving the
genetic basis used for breeding, developing and improving cotton production practices, defining the
most appropriate zones for each variety, strengthening the ties between research and extension to
better transfer knowledge and technology to farmers, establishing, performing and completing
technological information about the fiber and spinning properties of Egyptian cotton for spinners, as
well as improving the grading and ginning practices.
2000 - Egyptian Cotton Logo Introduced
The Egyptian Ministry of Trade and Industry and ALCOTEXA registered a trademark for
Egyptian cotton, to help consumers recognize the quality of Egyptian cotton products by identifying
those goods bearing the logo, and protect them from misleading labels. The Trade mark is registered
in 26 countries and others still in process. A licensing program and monitoring mechanism are also
enforced.
2005 – Establishment of Cotton Egypt Association
The Egyptian Ministry of Trade and Industry and ALCOTEXA established a nonprofit
association representing the entire supply chain of Egyptian cotton to manage, promote, license and
monitor the usage of the Egyptian cotton and its logo around the Globe. www.cottonegypt.net
EGYPTIAN COTTON TEXTILE INDUSTRY
The new beginning of the Egyptian cotton textiles industry was by the end of the 1920s,
when ―Bank Misra (Bank of Egypt)‖established ―Misra Spinning and Weaving Company‖ at
ELMehalla EL-Kubra. The mill started with 22000 spindles and 484 weaving looms and was
concentrating mainly on coarse counts. The first piece of cloth was produced in 1930. The company
is nowadays the largest textile mill in Egypt and probably the largest integrated textile mill in one
location throughout the world. A sister company ―Misra Fine Spinning & Weaving Company‖ was
established few years later at Kafr-EL-Dawar, near Alexandria, and extremely well equipped
technically for the production of medium and fine counts. In 1938, ―misr-Beida Dyers‖ company
was established. Local consumption increased very rapidly, from about 56 thousand Cantars (2.54
thousand tons) during the 1920s, to 177 thousand Cantars (8.02 thousand tons) in the first half of the
1930s and jumped to 513 thousand Cantars (23.24 thousand tons) by the second half of the 1930s, to

Page 4
1 154 thousand Cantars (52.28 thousand tons) by the second half of the 1940s which is equivalent to
16.7% of the total crop. This increase meant that the local industry had become a big client of raw
Egyptian cotton, and thus could relieve export problems if they arose. Also, it altered the
components of the crop available for export (23).
By the end of the Second World War, based on the assumption that there is always a local
market for its products as well as the availability of a local raw material, which sometimes looked as
though it was in burdensome surplus, it ran into troubles. These troubles stemmed mainly from its
obligation to use Egyptian cotton, while a high proportion of its products could be produced, in
competitive countries, from cheaper cottons. The possibility of importing the relatively cheaper
Indian or American cottons for the local mills and export more of the Egyptian cotton has been much
discussed but it was not accepted. The local industry needed tariff protection to be able to compete,
even in its home market, and the government extended this protection.
Page 5
INDIAN COTTON TEXTIL INDUSTRY
Indian Cotton Industry's history of establishment has a rich past. English did gradual
inaugurations of a number of beneficial industries in India and the country was opening its eyes to a
whole new era of mechanization. With 19th century India had successfully established major
production industries, owing to the initiative of the British East India Company. Cotton was an
essential staple fabric, which was needed in almost every work of life in India.
Indian Cotton Industry was the precise industry which fostered a humble beginning, attracting
budding Indian industrialists. In 1854 towards making that dream into a reality, James Landon
established the Broach Cotton Mill, the first successful cotton mill in Bombay. The first steam-
driven cotton mill also went into production in 1856. 79 cotton mills were in operation by 1883, as
Bombay took the industrial lead. Establishment of cotton industry was thus an initiation of a new
history. The first mechanized jute mill began operations in Bengal in 1855. Government of India in
October 1861 issued a waste lands order for the purpose of encouraging the growth of cotton. Hugh
Mason, Chairman of the Board of the Manchester Cotton Company in 1862, sought the
impeachment of Sir Charles Wood (1800-1885), Secretary of State for India. Mason felt the
Government of India was holding to a do-nothing policy regarding the provision of greater supplies
of raw cotton to Manchester`s manufacturers. The Lancashire Cotton Industry had emerged
sufficient pressure on the Secretary of State for India to have the Government of India place a 5%
tariff on Indian cotton manufactures in order to allow British cotton goods to be more marketable in
India. 64 jute mills existed in Bengal, with 36,000 looms employing a total of 225,000 workers in
1913.

Page 6
Market structure
Market structure in the Egyptian cotton sector
The liberalization has changed the structure of the different areas of the cotton sub sector.
Figure 1 presents the institutional structure before the liberalization begun in 1994.
Figure 1: Approximate institutional structure of the cotton sector in Egypt before
Liberalization
Inputs
Seed Cotton
Seed Cotton
Lint Cotton Lint Cotton
Farmers Public Coop & PBDAC
Co-operative Collections Centers (ca 2000)
Public Trading Companies (6)
Public Ginners (5)
Local textile industry Alcotexa registered traders
World cotton market

Page 7
Ginning and other buying companies
Ginning companies in Egypt as of 2002
Company Public Private
Arabia Ginning X
Delta Cotton Ginning X
El Wady Cotton Ginning X
Misr Cotton Ginning X
Nile Ginning X
International trade
The majority of Egyptian exports go to the USA and the EU and this is particularly the case
within the cotton sector. In the late 1990s, thirty per cent of the cotton was exported to the EU.
The spinning industry
The spinning industry has during the liberalization process started to purchase seed cotton
instead of only lint cotton. The Egyptian cotton is expensive for the domestic spinners to use. In
some cases price discrimination has been used as a measure, meaning lower price on lint cotton for
domestic spinners compared to the price offered to export firms.
Market structure in the Indian Cotton sector
This unique industry structure is primarily a legacy of government policies that have promoted labor
intensive, small-scale operations and discriminated against larger scale firms:
• Cotton farming and harvesting. Cotton is grown in tropical as well as sub tropical area in
India. Mostly the cotton grown in India is from dry lands and crops mostly depend on the irrigation
systems available and not only on the rain water.
• Ginning: Ginning is the process where cotton fiber is separated from the cotton seed. The first step
in the ginning process is when the cotton is vacuumed into tubes that carry it to a dryer to reduce
moisture and improve the fiber quality. Then it runs through cleaning equipment to remove leaf
trash, sticks and other foreign matter. Ginning is accomplished by one of two methods. Cotton
varieties with shorter staple or fiber length are ginned with saw gins. This process involves the use
of circular saws that grip the fibers and pull them through narrow slots. Long fiber cottons must be
ginned in a roller gin because saw gins can damage their delicate fibers.

Page 8
• Oil mill: in the operation the oil is extracted from the cotton seeds that are coming from the
ginning process. The cotton seeds coming from the ginning unit are then passed through the pressing
unit and crude cotton oil is produced. The pressed cotton seed oil cake is supplied as the cattle feed.
The crude is further modified as the bio-diesel which could be used as the one of the energy source.
The refined cotton oil is also used as the edible oil but it is proved to be unfit for the human health.
• Spinning. Spinning is the process of converting cotton or manmade fiber into yarn to be used for
weaving and knitting. Largely due to deregulation beginning in the mid-1980s, spinning is the most
consolidated and technically efficient sector in India‘s textile industry. Average plant size remains
small, however, and technology outdated, relative to other major producers. In 2002/03, India‘s
spinning sector consisted of about 1,146 small-scale independent firms and 1,599 larger scale
independent units.
• Weaving and Knitting. Weaving and knitting converts cotton, manmade, or blended yarns into
woven or knitted fabrics. India‘s weaving and knitting sector remains highly fragmented, small-
scale, and labor-intensive. This sector consists of about 3.9 million handlooms, 380,000 ―power
loom‖ enterprises that operate about 1.7 million looms, and just 137,000 looms in the various
composite mills. ―Power looms‖ are small firms, with an average loom capacity of four to five
owned by independent entrepreneurs or weavers.
• Fabric Finishing. Fabric finishing (also referred to as processing), which includes dyeing, printing,
and other cloth preparation prior to the manufacture of clothing, is also dominated by a large number
of independent, small scale enterprises. Overall, about 2,300 processors are operating in India,
including about 2,100 independent units and 200 units that are integrated with spinning, weaving, or
knitting units.
• Clothing. Apparel is produced by about 77,000 small-scale units classified as domestic
manufacturers, manufacturer exporters, and fabricators (subcontractors).
• Composite Mills. Relatively large-scale mills that integrate spinning, weaving and, sometimes,
fabric finishing are common in other major textile-producing countries. In India, however, these
types of mills now account for about only 3 percent of output in the textile sector. About 276
composite mills are now operating in India, most owned by the public sector and many deemed
financially ―sick.‖
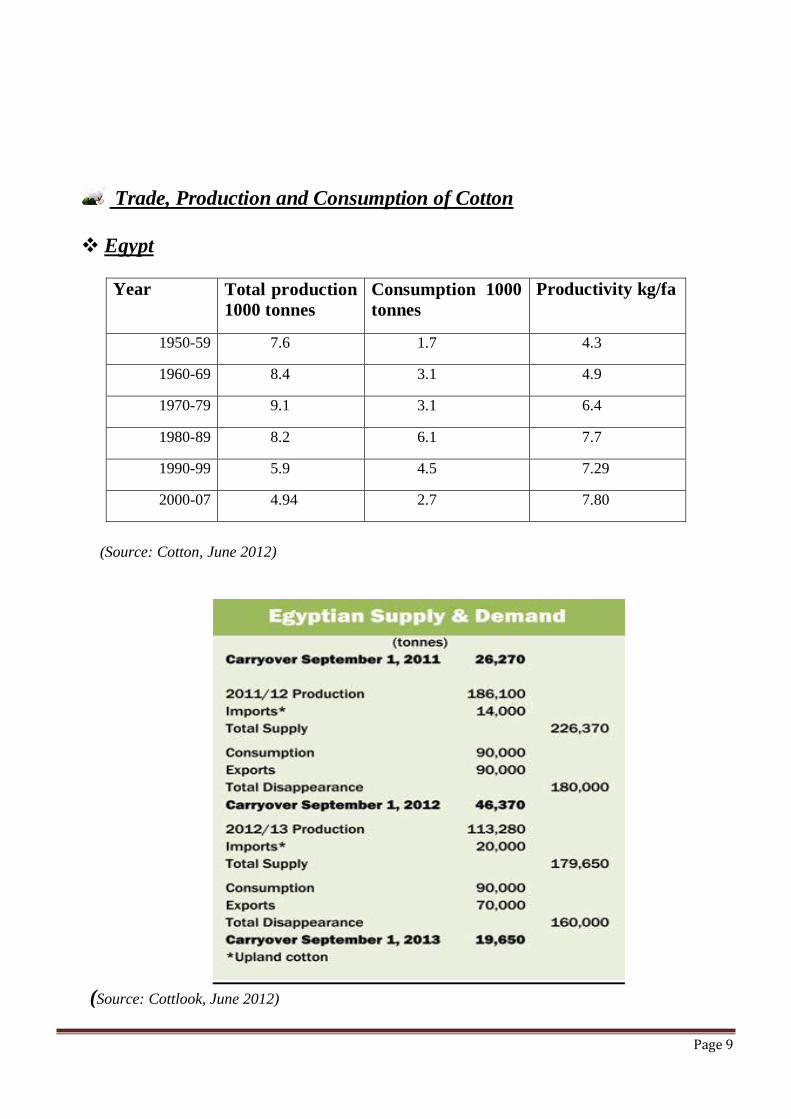
Page 9
Trade, Production and Consumption of Cotton
Egypt
Year Total production
1000 tonnes
Consumption 1000
tonnes
Productivity kg/fa
1950-59 7.6 1.7 4.3
1960-69 8.4 3.1 4.9
1970-79 9.1 3.1 6.4
1980-89 8.2 6.1 7.7
1990-99 5.9 4.5 7.29
2000-07 4.94 2.7 7.80
(Source: Cotton, June 2012)
(Source: Cottlook, June 2012)

Page 10
The political and economic upheaval that has occurred since the beginning of 2011 has
complicated an already difficult market outlook for Egypt‘s cotton production and has required the
payment of government subsidy to textile mills, so as to absorb some of the domestic supply and
achieve the political imperative of supporting the price received by the farmer.
(Source: Cottlook, June 2012)
In 2010/11, the season‘s export sales were virtually completed by the end of February; the
commitments figure having reached an impressive amount of over 110,000 tonnes. 2011/12, by
comparison, commenced at a predictably more pedestrian pace, which only really began to change as
from the beginning of December 2011, as overseas spinners looked to begin replenishing
inventories. The quantity registered by early June 2012 was comfortably over 76,000 tonnes, and
traders expressed the view that the season‘s total exports might reach around 90,000 tonnes.

Page 11
India
Cotton
Year
Area lakh
Hectares
Cotton production Cotton
Yield
Cotton
Consumpt
ion Lakh bales of
170 kg.
In 000 Tonnes
1999-00 87.31 156 2652 304 173.36
2000-01 85.76 140 2380 278 173.03
2001-02 87.30 158 2686 308 171.76
2002-03 76.67 136 2312 302 168.83
2003-04 76.30 179 3043 399 177.10
2004-05 89.20 243 4131 463 194.10
(Source; ICAC)

Page 12
SWOT ANALYSIS OF COTTON INDUSTRY
SWOT Analysis of Cotton Industry in Egypt
Strength
Egypt has an unemployment problem, and cotton industry can contribute much in accomplishing a
solution for the problem and with much fewer investments than other sectors.
Egyptian cotton has a relative advantage among world cottons especially Extra Long Staple cottons. A large extent industrial base in cotton industry
Cost Competitiveness.
Weaknesses
Picture: Loose, Poorly Covered Bales of Lint Cotton of the Type Currently
Produced at the Gins.
Spinning sector lacks modernization and there is a need of introducing new technology.
Processing is the weakest link in the Egyptian Cotton textile value chain, adversely affecting its
ability to compete in exports.
High power costs and long export lead times are eroding India‘s export competitiveness across the
textile chain.
Productivity levels for manufacturing various apparel items are far lower in India in comparison with
its competitors.
Lack of Integration.

Page 13
Opportunities
Companies need to concentrate on new product developments and increase in production level.
To export large amount of raw cotton.
To maximize the economical return of the unit of cultivated land (Feddan) and the unit of irrigation
water (cubic meter), by increasing the value of production (here we stress on using the monetary or
production in dollars per unit cultivated land and irrigation water. Production by Cantar is not valid
because Egyptian cotton varieties vary widely in lint price) and decreasing production cost.
Threats
There has been an increase in seasons per year which has resulted in shortening of the fashion cycle.
Continuous increasing in production cost.
Low competition abilities of the industrial sectors because of the subsidies provided to their
competitors as in India.
High cotton prices as a result of adopting free trade polices since 1994 which increase the prices of
the textile inputs and consequently a successive decreasing in its production and recently the
decision of India and Pakistan to make an export ban to cotton which in turn affected the
international supply.
The mismatch between the agricultural and industrial sectors as the agricultural sector provides a
high quality of cotton and the industrial sector begins to use a low quality with low prices, so it
began to import its needs.
SWOT Analysis of Cotton Industry in India
Strength
• The country is one of the largest producers of natural and man-made fibers.
• It produces almost 16% of the world production of raw cotton.
• Skilled labour is available in plenty.
• Manufacturing capacity present across the entire range and across entire value chain yarn, fabric,
process house and garments.

Page 14
Weaknesses
• Knitted garments manufacturing has remained as an extremely fragmented industry. Global players
would prefer to source their entire requirement from two or three vendors and the Indian garment
units find it difficult to meet the capacity requirements.
• Industry still plagued with some historical regulations such as knitted garments still remaining as a
SSI domain.
• Labour force giving low productivity as compared to other competing countries.
• Technology obsolescence despite measures such as TUFS.
• Low bargaining power in a customer-ruled market.
Opportunity
• Low per-capita domestic consumption of textile indicating significant potential growth.
• Domestic market extremely sensitive to fashion fads and this has resulted in the development of a
responsive garment industry.
• Companies need to concentrate on new product developments.
• Increased use of CAD to develop designing capabilities and for developing greater options.
Threat
• Competition in post-2005 is not just in exports, but is also likely within the country due to cheaper
imports of goods of higher quality at lower costs.
• Standards such as SA-8000 or WARP have resulted in increased pressure on companies for
improvement of their working practices.
• Alternative competitive advantages would continue to be a barrier.
• Due to plenty of labour available human rights may get exploited.

Page 15
Porter’s Five Force Model
Porter's Five Forces include three forces from 'horizontal' competition: threat of substitute products,
the threat of established rivals, and the threat of new entrants; and two forces from 'vertical'
competition: the bargaining power of suppliers, bargaining power of customers.
Porter’s Five Force Model in Egypt

Page 16
Competitive Rivalry In the traditional economic model, competition among rival firms drives profits to zero. But
competition is not perfect and firms are not unsophisticated passive price takers. Rather, firms strive
for a competitive advantage over their rivals. The intensity of rivalry among firms varies across
industries, and strategic analysts are interested in these differences.
Private-sector competition remains constrained in the face of lax anti-monopoly enforcement
(106th of 139 countries) and the persistence of large, inefficient SOEs. Widespread corruption and
legacy labour regulations from the Nasser regime also negatively impact the national business
environment.
The structure is heavily biased to spinning and weaving production which is state owned.
Facilities are almost obsolete, organization over manned and highly inefficient. Quality and delivery
of output erratic and inconsistent.
Bargaining Power of Suppliers
Also described as market of inputs. Suppliers of raw materials, components, and services
(such as expertise) to the firm can be a source of power over the firm. Suppliers may refuse to work
with the firm, or e.g. charge excessively high prices for unique resources.
Egypt shows some linkages indicative of a cluster-based economy, with particular strength in
transportation and logistics and a robust tourism cluster. But enforcement of input quality standards
remains lax and availability of some support services is poor despite increases in FDI flows which
might have encouraged cooperation between firms.
Bargaining Power of Customers
Despite boasting the largest population of the MENA countries and occupying a strategic
location in the heart of the Arab world, sophistication of Egyptian demand is weak and consumer
protections are underdeveloped. Consumer purchasing power is adversely affected by on a GDP-per-
capita basis, Egypt ranked 16th
out of its 19 regional peers in 2010. Egypt has consistently
underperformed its peers in per-capita income growth over the past three decades.
Changing societal composition also negatively impacted national demand condition-diverse
ethnic and religious mix shifted over the past 40 years to an almost-exclusively Arab and Muslim
population. An unstable political environment has impelled the exodus of foreign nationals and
much of the country‘s intellectual class, diminishing the sophistication of the Egyptian consumer
market.
. Threat Of Substitutes
In Porter's model, substitute products refer to products in other industries. To the economist,
a threat of substitutes exists when a product's demand is affected by the price change of a substitute
product. A product's price elasticity is affected by substitute products – as more substitutes become
available, the demand becomes more elastic since customers have more alternatives. A close
substitute product constrains the ability of firms in an industry to raise price.

Page 17
Porter’s Five Force Model in India
The Cotton industry is very dynamic in its nature. Things have changed within this industry
very frequently before. Tries explaining this dynamism with the help of well known Porter‘s model
which will conduct an industry analysis of the industry under the radar. ―The collective strength of
these five competitive forces determines industry profitability because they influence the prices,
costs, and required investment of firms in an industry‖. This model is one of the best tools available
for analytical evaluation the competitive nature of the industry. Porter has further said that ―every
industry is unique and has its own unique structure and this five-force framework allows a firm to
see through the complexity and pinpoint those factors that are critical to competition in its industry,
as well as to identify those strategic innovations that would most improve the industry‘s
profitability‖. Hence we can say that the model will be useful in defining the most important forces
those actually define the nature and amount of competitiveness within the industry and will explain
that the way these forces can be deemed to be interconnected with each other. The figure presents the
Porter analysis on Indian Cotton Industry.
According to this model there are five forces which determine the competitiveness of an industry in
the long-run. The five competitive forces are:

Page 18
1. The bargaining power of buyers
2. The bargaining power of suppliers
3. The threat of substitutes
4. The threat of new entrants
5. The rivalry among existing competitors
The bargaining power of buyers
The demand forces inside the industry can be evaluated with the help of bargaining power
which the buyers of the industry possess. According to a 2007 research done, Texsummit the current
international Cotton Industry stands at a value of 52 billion US Dollars. The dominating markets
which define the trend in the business in textiles and clothing in the international scenario are US
and European markets. It is expected, that in future demand for local made clothing and apparel will
rise at a much increased growth rate since it has achieved a competitive edge over and above its
neighbour nations. But in the global scene China will be the supplier which will see more demand
for its supply with respect to India due to India‘s incompetence related to several aspects like
fragmented structure, technological obsolesce, rigid labor issues, lack of skill and training. But due
to the fact that India is one of the lowest cost producer countries, most of the foreign buyers will try
to hedge their risk factors by the process of outsourcing only from one country
(www.equitymaster.com). But Rao has said in his 2008 work that ―put the situation is about to
change, with the government planning several initiatives to boost production of these textiles, and
industry is also waking up to the potential of the segment‖
The Bargaining Power of Suppliers
The bargaining power of suppliers in an industry tries to evaluate the scene of the supply
market of the Cotton Industry. The main raw material of Cotton Industry is cotton. India has always
been a significant producer of cotton and due to this factor it has played a very important role in the
world‘s market for cotton. The Cotton Industry in India achieves cost advantage in the segment of
apparel as well as home textiles with the help of unending supply of local staple cotton which have
been domestically produced. Further, Indian Government and other policy makers have taken
definitive steps for improving the amount and quality of cotton yield for making sure that higher
productivity can be achieved. India has now bypassed the United States and has become the second
largest producer of cotton in the world in the year 2007. The following fig. 3 shows India‘s growing
cotton trend.
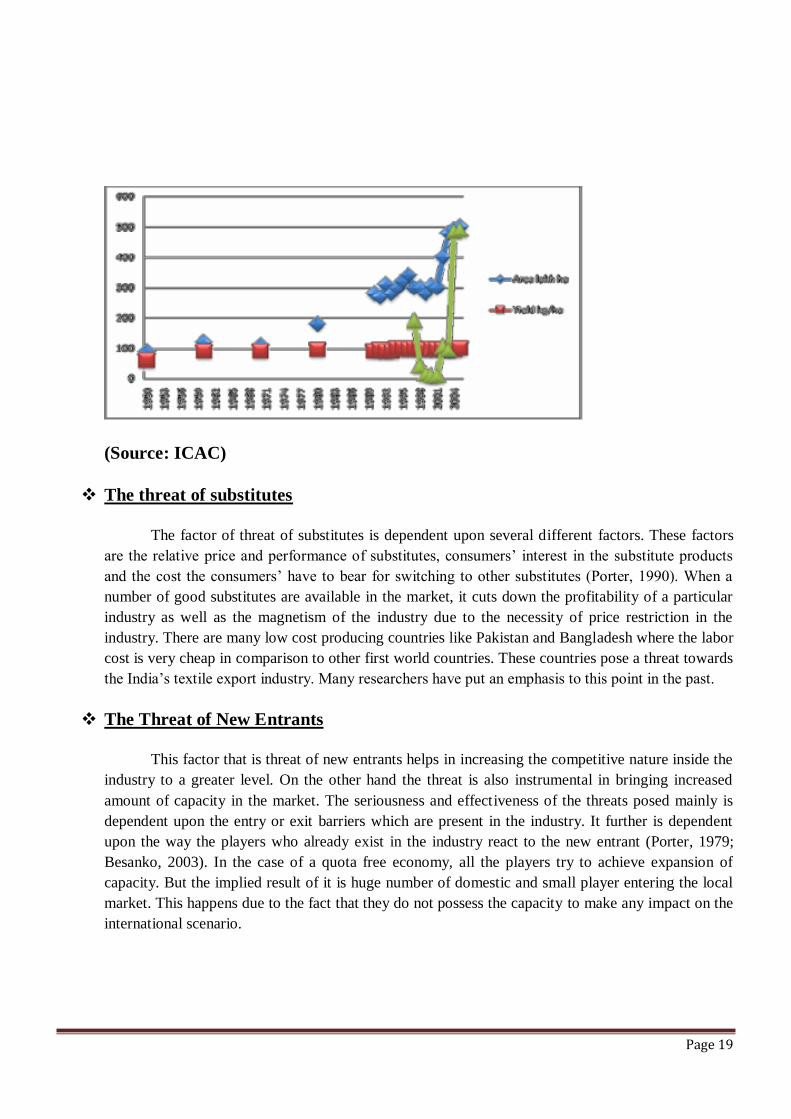
Page 19
(Source: ICAC)
The threat of substitutes
The factor of threat of substitutes is dependent upon several different factors. These factors
are the relative price and performance of substitutes, consumers‘ interest in the substitute products
and the cost the consumers‘ have to bear for switching to other substitutes (Porter, 1990). When a
number of good substitutes are available in the market, it cuts down the profitability of a particular
industry as well as the magnetism of the industry due to the necessity of price restriction in the
industry. There are many low cost producing countries like Pakistan and Bangladesh where the labor
cost is very cheap in comparison to other first world countries. These countries pose a threat towards
the India‘s textile export industry. Many researchers have put an emphasis to this point in the past.
The Threat of New Entrants
This factor that is threat of new entrants helps in increasing the competitive nature inside the
industry to a greater level. On the other hand the threat is also instrumental in bringing increased
amount of capacity in the market. The seriousness and effectiveness of the threats posed mainly is
dependent upon the entry or exit barriers which are present in the industry. It further is dependent
upon the way the players who already exist in the industry react to the new entrant (Porter, 1979;
Besanko, 2003). In the case of a quota free economy, all the players try to achieve expansion of
capacity. But the implied result of it is huge number of domestic and small player entering the local
market. This happens due to the fact that they do not possess the capacity to make any impact on the
international scenario.

Page 20
The rivalry among Existing Competitors
The amount of rivalry within the competitors who already exist in the industry is highly
dependent on the following factors: the structure of competition, the structure of industry costs,
strategic objectives, degree of differentiation, entry and exit barriers, and switching costs (Porter,
1990). The rivalry of Indian Cotton Industry, globally, depends upon various factors like; India‘s
poor logistics, fragmented infrastructure and unskilled labor. These all factors are a major thumbs-
down to Indian economy on the global front.
The analysis which was carried out with respect to Porters model is instrumental in summing
up the works done by Porter on the topic of competitiveness which has been immensely helpful in
understanding the literatures which are relevant on this industry. This has proved that despite the
structural inefficiency, the Indian Cotton Industry has vast potential to successfully compete in the
international business.

Page 21
BOSTON Consulting Group
Boston Consulting Group (BCG) Matrix is a four celled matrix (a 2 * 2 matrix) developed by
BCG. It is the most renowned corporate portfolio analysis tool. It provides a graphic representation
for an organization to examine different businesses in its portfolio on the basis of their related market
share and industry growth rates. It is a two dimensional analysis on management of SBU‘s (Strategic
Business Units). In other words, it is a comparative analysis of business potential and the evaluation
of environment.
According to this matrix, business could be classified as high or low according to their industry
growth rate and relative market share.
Relative Market Share = SBU Sales this year leading competitors sales this year.
Market Growth Rate = Industry sales this year - Industry Sales last year.
The analysis requires that both measures be calculated for each SBU. The dimension of business
strength, relative market share, will measure comparative advantage indicated by market dominance.
The key theory underlying this is existence of an experience curve and that market share is achieved
due to overall cost leadership.
BCG matrix has four cells, with the horizontal axis representing relative market share and the
vertical axis denoting market growth rate. The mid-point of relative market share is set at 1.0. If all
the SBU‘s are in same industry, the average growth rate of the industry is used. While, if all the
SBU‘s are located in different industries, then the mid-point is set at the growth rate for the
economy.
Resources are allocated to the business units according to their situation on the grid. The four cells of
this matrix have been called as stars, cash cows, question marks and dogs. Each of these cells
represents a particular type of business.

Page 22
1. Stars-
Stars represent business units having large market share in a fast growing industry. They may
generate cash but because of fast growing market, stars require huge investments to maintain their
lead. Net cash flow is usually modest. SBU‘s located in this cell are attractive as they are located in a
robust industry and these business units are highly competitive in the industry. If successful, a star
will become a cash cow when the industry matures.
2. Cash Cows-
Cash Cows represent business units having a large market share in a mature, slow growing
industry. Cash cows require little investment and generate cash that can be utilized for investment in
other business units. These SBU‘s are the corporation‘s key source of cash, and are specifically the

Page 23
core business. They are the base of an organization. These businesses usually follow stability
strategies.
3. Question Marks-
Question marks represent business units having low relative market share and located in a
high growth industry. They require huge amount of cash to maintain or gain market share. They
require attention to determine if the venture can be viable. Question marks are generally new goods
and services which have a good commercial prospective. There is no specific strategy which can be
adopted. If the firm thinks it has dominant market share, then it can adopt expansion strategy, else
retrenchment strategy can be adopted. Most businesses start as question marks as the company tries
to enter a high growth market in which there is already a market-share. If ignored, then question
marks may become dogs, while if huge investment is made, and then they have potential of
becoming stars.
4. Dogs-
Dogs represent businesses having weak market shares in low-growth markets. They neither
generate cash nor require huge amount of cash. Due to low market share, these business units face
cost disadvantages. Generally retrenchment strategies are adopted because these firms can gain
market share only at the expense of competitor‘s/rival firms. These business firms have weak market
share because of high costs, poor quality, ineffective marketing, etc. Unless a dog has some other
strategic aim, it should be liquidated if there are fewer prospects for it to gain market share. Number
of dogs should be avoided and minimized in an organization.
Limitations of BCG Matrix
The BCG Matrix produces a framework for allocating resources among different business units and
makes it possible to compare many business units at a glance. But BCG Matrix is not free from
limitations, such as-
1. BCG matrix classifies businesses as low and high, but generally businesses can be medium also.
Thus, the true nature of business may not be reflected.
2. Market is not clearly defined in this model.
3. High market share does not always leads to high profits. There are high costs also involved with high
market share.
4. Growth rate and relative market share are not the only indicators of profitability. This model ignores
and overlooks other indicators of profitability.
5. At times, dogs may help other businesses in gaining competitive advantage. They can earn even
more than cash cows sometimes.
6. This four-celled approach is considered as to be too simplistic.

Page 24
PEST ANALYSIS
PEST Analyses of EGYPT:-
1) POLITICAL:-
Accordingly, the Government set forth a strategy to develop cotton-dependent industries on a
step by step basis, from “seed to skin”, starting with ginning, spinning, weaving, dying and finishing
industries, followed by the apparel and home furnishing industries and finally marketing and
promotion to achieve high levels of growth for the Egyptian economy.
The Egyptian government‘s newly adopted strategy will assure the availability of Egyptian
cotton for the international market, and local spinners will also have an ability to import cotton to
accommodate their growing capacities. The government has also made a commitment to modernize
spinning, dying and finishing industries to utilize their maximum capacities and to become attractive
for foreign investments, contributing to growth in employment.
2) ECONOMICAL
Egypt has a diversified economy. It has extensive natural and human resources. Key
industries include tourism, petroleum, agriculture, manufacturing and the services sector. The
government is implementing economic reforms designed to encourage private sector investment as
the engine of sustainable economic growth and rising incomes.
With its reputation as the world‘s finest in terms of quality, softness and strength, Egyptian
cotton is the country‘s most important agricultural export. Other top exports include crude oil and
petroleum products, textiles, agriculture, food processed products, furniture, metal products, building
material and chemicals.
Since the 1990s, Egypt has embarked on a series of structural reforms focused on economic
stability, deregulation, privatization, liberalizing trade and foreign investment regimes and
restructuring the banking system. Economic policy offers investors attractive incentives, a freely
convertible and floating currency and a young, skilled workforce. Egypt has also worked to
transform itself into a leader in information technologies and e-commerce in the region.
Under the exchange rate flotation policy, the Egyptian Pound was allowed to find its free
market rate in relation to other currencies, which resulted in more than 50% devaluation in two
years. This step increased the textile sector‘s competitiveness and the demand for its products.

Page 25
3) SOCIAL
Located at the crossroads of Europe, the Middle East and Africa, Egypt has for centuries
been a melting pot of races and cultures – with a tradition of tolerance and hospitality that persists to
this day. While modern Egyptians are largely Eastern Hamitic in origin (Egyptians, Bedouins and
Berbers); small percentages of the population are of Greek, Nubian, Armenian and European
descent.
Egypt‘s capital, Cairo, combines ancient architecture and a cosmopolitan lifestyle. Although
it maintains its own unique culture, Egypt has embraced Mediterranean, French, British and even
American influences. Today, hundreds of thousands of foreigners live and work in Cairo, one of the
world‘s largest and busiest cities.
PEST Analysis of India:-
1) Economic issues
Prices of Cotton
The Minimum Support Prices of Kapas (Seed cotton) for fair average quality announced for
the cotton season 2005- 2006 (Oct – Sept), was fixed at last year‘s level (2004-05) i.e. Rs.1760/- per
quintal for medium staple variety (F-414/J-34/H- 777). The support price for H-4 (Long staple
variety) has been fixed at Rs.1980/ - per quintal, an increase of Rs.20/- per quintal over support
price of 2004-05. The MSP fixed for F-414/H-777/J-34 variety of Kapas will be applicable only to
Rajasthan. The price of this variety, grown in Haryana and Punjab has been fixed keeping in view
the respective quality differential, vis-à-vis Rajasthan, obtaining in these States.
The Cotton Corporation of India Ltd. (CCI) undertook massive MSP operations throughout
2004-05 in all the cotton growing states, and procured Kapas equivalent to lint cotton of 27.52 lakh
bales. In 2004-05, due to favourable seasonal conditions, there was a sharp rise in productivity,
which peaked to a record 463 Kg. Lint/hectare, as compared to 399 kg. / Lint per hectare during
2003-04, the cultivated area increased to 89.20 lakh hectares in 2004-05, as compared to 76.30 lakh
hectares in 2003-04, and the production touched 243 lakh bales in 2004-05, as compared to 179.00
lakh bales in 2003-04.

Page 26
2) Social Issues
Gender impact
Rural women in several smallholder contexts provide substantial labour input to most aspects
of cotton production cycle, frequently as unpaid ‗family labour‘ or low-paid day-labourers and
commonly performing some of the most arduous tasks – with over-representation in manual work
such as picking. _Women in many regions face significant difficulties in gaining access to input
credit facilities, due principally to men‘s ownership of land and other assets, and hence struggle to
achieve economic independence through cotton farming. Decision-making within farming families
in many regions is gender-biased and women are often neglected in decision-making process.
Because of the above, and the increased labour requirements of more ecologically sound farming
cultivation methods, the development of such methods may risk an increase in the labour burden on
rural women workers.
Health and safety
Given the nature of cotton farming work, worker/farmer health and safety is a critical issue in
cotton cultivation: the key risks are that workers – family or hired, depending on regional context –
are exposed to harmful toxins, primarily because they are not provided with – or do not wear –
adequate personnel protective equipment (PPE) while spraying chemical pesticides and herbicides.
_Children are particularly vulnerable to arduous work on cotton farms; however, there are few
reports of children working with toxic materials. _In the context of worker health and safety, special
attention should be given to working conditions in ginneries – work characterised by seasonality,
dust pollution, machine danger and long hours, albeit with differences between regions
Child labour
In several regions, children – including young children – contribute labour to cotton growing;
depending on the age of the child and the nature of the activity – particularly whether it affect the
child‘s health and schooling – this may or may not be acceptable under international standards (ILO
conventions provide for light work for over-12s and make exception for children‘s work on family
smallholdings where produce is for local consumption) _Children are primarily involved in cotton
picking, and to a lesser degree in weeding and nutritional activities. _Key issues are children‘s health
and safety, and access to education (though the latter may depend on factors 11 outside the control of
parents, such as availability of local facilities). _Child labour is difficult to assess and monitor as it is
(almost by definition) informal.

Page 27
Forced Labour / Labour Coercion
Forced labour constitutes a violation of a fundamental international human right – freedom of
employment – and there is little cultural relativity in the debate surrounding its continued use. The
underlying factors that contribute to forced labour and bonded labour include the use of labour
intermediaries providing casual labour under conditions which compromise the workers‘ rights,
recruitment agencies with service fees which can be repaid only by continued work, social exclusion,
often connected to caste or tribe, asymmetric information, whereby illiterate workers are not aware
of their rights, labour migration – particularly ‗irregular‘ migrant workers, who are commonly
unaware but also unable to assert their legal labour rights, as non-registered workers, inequitable
loan or credit schemes managed by the employer; in-kind remuneration, which allows employers to
exacerbate dependent relations and hide low wages
3) Environmental Issues
Low Yields in Cotton
The relatively rapid gains in productivity in the predominately rained Central zone since
1990 are due to technological advances that, if combined with a continuation of recent modest
growth in the North and South zones, could lead to a substantial hike in national average yields and
production. While this productivity gap indicates that significant further on farm yield improvements
are possible, a range of technical, economic, and institutional factors prevent realization of the
potential of the varieties cultivated.
Following are the few factors which contribute towards the low yield:
• Delayed Sowing. Late sowing of cotton reduces yields by providing less optimal sunlight
conditions for crop development and, in some areas, by allowing less time for picking the mature
crop before clearing the field for the following crop. Sowing delays are caused either by the late
arrival of seasonal rainfall needed for sowing or by delays in harvesting the preceding crop. Yield
losses associated with late sowing and shortened harvest times may be reduced by new shorter
duration varieties and better management, but crop competition will likely continue to limit yields in
some areas.
• Monsoon Dependence. Erratic monsoon rainfall affects 60-70 percent of cotton area, reducing
yields through moisture stress and creating risk that reduces investment in seed, fertilizer, and
pesticide inputs. Even with improved varieties and management, average yields in the mostly rained
Central and South zones are likely to remain below those achieved in other countries with more
reliable rainfall.
• Poor Seed Quality. Poor seed quality is a pervasive problem in cotton cultivation. Only about 35
percent of cotton area is sown with certified seed with assured varietal purity and germination.

Page 28
Commercially available seeds are often of poor quality, with sale of uncertified, substandard, and
second generation (F2) hybrid seeds not uncommon. Although supplies of certified seed are
generally available, financial constraints lead most farmers to use retained seeds or lower priced
uncertified seeds from the market.
The proliferation of cotton varieties in markets and farmers‘ fields confounds efforts to improve seed
quality, maintain varietal purity, and improve crop management practices. Roughly 100-130 cotton
varieties developed in both the public and private sectors are now cultivated in India. A study by the
Central Institute for Cotton Research (CICR) indicates that the average cotton farmer 12 in the
Central and South zones plants 3-4 varieties on farms averaging about 2 hectares, a practice that
greatly complicates crop and seed management.
• Plant Protection. Insect and disease infestations, including bollworms, white fly, jassids, and leaf
curl virus, are significant problems in India‘s three cotton production zones. Although per hectare
use of pesticides is higher for cotton than for any other crop, effective plant protection is constrained
by poor farm management, pesticide subsidies that encourage indiscriminate use, and problems with
pesticide quality. Improved on farm pest management practices, including appropriate crop rotations,
pest surveillance, pesticide applications, and adoption of Integrated Pest Management (IPM)
practices have proved difficult to implement on small, resource constrained farms.
• Crop Management. Large gaps between average on farm yields and the potential of existing
Varieties also stem from poor management practices, including use of inappropriate varieties, seed
rates, seed spacing, and fertilizer dosages. As in the case of plant protection, improvement of crop
management practices is complicated by the need to extend recommended practices to large numbers
of small, limited-resource farmers.
• Lack of Suitable Varieties. Cotton yields are affected by lack of varieties— or genotypes—
suitable for some agronomic conditions. Indian scientists cite three priorities for plant breeding
efforts: (1) higher yielding, short-duration, and pest-resistant cultivars for the irrigated North zone,
(2) higher yielding varieties for the drought-prone Central zone, and (3) varieties suited for the soils
on rice fallow common in the South zone.
4) Technical Issues
Slowed growth in cotton production during the late 1990s, together with the opportunity created
by the termination of the MFA, raised the priority for addressing factors that constrain cotton production
and quality in India. In 2001, the Government established the high-level Technology Mission on Cotton
(TMC) to direct, coordinate, and fund initiatives to raise the productivity and quality of Indian cotton
and strengthen returns to growers. TMC activities focus on four program areas, including (1) research
and technology generation, (2) transfer of technology to farmers, (3) improvement of marketing
infrastructure, and (4) modernization of gins. Although it is too early to evaluate TMC impacts on
research and extension, progress in improving market facilities and, particularly, cotton gins is evident
in cotton-producing areas.

29 | P a g e
COMPETITIVE ADVANTAGES OF EGYPT :-
Competitiveness and Future Challenges
The Analysis of the competitiveness and challenges facing the industry, its strengths
and weaknesses may be done by considering the competitive structure of the industry,
the characteristics of its factors of production and the nature of government
intervention and support.
On the international level, the Egyptian cotton industry has a potential competitive
advantage and therefore the Ministry of Foreign Trade will be launching soon an
international promotion campaign for its Egyptian Cotton Logo, a trade mark that
guarantees authenticity and quality. The campaign will run under the slogan
“Egyptian Cotton …..feels like nothing else in the world”.
Egyptian Cotton Industry has following competitive advantages:
Preferential Customs Treatment for Egyptian Yarn Exports to the EU, USA, and
Arab Countries.
Free Zones in Egypt Offer Further Advantages in Both the Investment Stage
(Exemption from Sales Tax on Machinery) and the Operating Stage (Simple Clearing
of Incoming and Outgoing Goods).
Easy Access to the World Renowned ELS and LS Egyptian Cotton at relatively low
costs.
- No Special Pressing, Wrapping, Transport and Transaction Costs for Exporting from
Egypt and Clearing in Destination.
Availabilty of Least Cost Labour
- Well Educated, Easily Trainable and Willing to Work Night Shifts Enable
Mills to Run Over 8600 Hours in a Year.
Proximity of Egypt to Final Destinations in Europe

30 | P a g e
TOP COMPANIES IN EGYPT
Aldcroft Cotton Ltd.
Eastern Cotton Company
Benha Cotton Trading Co.
Egycot Co.

31 | P a g e
Performance and Comparison of
Egypt and India India has become a cotton surplus country in the past few years, something which
seems set to continue in the long term. Export volume has risen from the negligible level of
50,000 bales (170 kilos each) in 2000-01, to an estimated 12,500,000/13,000,000 in 2011-12.
The share of production going for export has risen from one percent in 2000-01 to 37% in
2011-12.

32 | P a g e
Share of Cotton Suppliers
Here, this chart indicates that in US there are higher suppliers of cotton about 31%
and in Egypt 24% cotton supplier‘s is high as compare India is 15%. No Special Pressing,
Wrapping, Transport and Transaction Costs for Exporting from Egypt and Clearing in
Destination.

33 | P a g e
Conclusions
The structure of the Egyptian cotton industry has changed. This can mainly be seen
through the number of players participating on the market and the increased freedom
of choice for the actors. The private sector is fairly well established in all parts of the
cotton production process, from input market to marketing and exporting the cotton.
The public share of the market is decreasing. The Egyptian cotton sector could now be
described as something in-between a concentrated market system and one with
numerous small players.
Regarding the performance, the cotton sector in Egypt has done pretty well.
The production has stayed on the same average level but the yield has increased.
Other merits are increased prices and farmers‘ share of the final export price. Also the
export is greater today than what it was before the reform. Egypt has reached both
increased competition and been able to coordinate the market, but still a lot has to be
done. With this new structure that the reform has created, the Egyptian cotton sector
could be more competitive than what it is today. To increase the competition, all the
actors on the Egyptian cotton market have to be aware of the structural changes made
thanks to the liberalization, something that requires effort concerning market
information. To continue the unsuccessful process of privatization is another measure
in order to enhance competition, like to stop the discrimination between private and
public firms.
The quality of Egyptian cotton was not the best during the first years of
liberalization. However both the GOE and private actors have taken good initiatives in
order to improve and maintain the quality of Egyptian cotton and the situation has
improved. To come further in this process even better coordination is demanded.
Since price still is the most important factor deciding about a company‘s or a
country‘s competitiveness Egypt has to work harder in order to have a chance at the
new tougher global market. Quality is their most important attribute of Egyptian
cotton and this is why grading and quality controls must be highly prioritized.
Another step in improving the competitive situation is to privatize the 41
coordination, something that has to be done with caution. Alcotexa is one institution
for which serious changes in coordination must be made.
Conclusively it can be established that Egypt has succeeded in improving both
the competitive situation and the coordination within the sector, even though there
still is a long way to go to be fully liberalized. It has been shown that there in some
cases exists a trade-off between the coordination and competition, for example when
taking action in order to improve quality. A high number of firms often involve higher
degree of competition while it complicates the coordination of quality enhancing
measures. In other cases it seems like competition and coordination actually can go

34 | P a g e
hand in hand, for example when coordinating the number of cotton varieties in order
to increase competition at the gins and in the case of impersonal coordination carried
out by private actors.
India is one of the leading producers of cotton, goatskin and cashmere wool. It
ranks top in goatskin and third in cotton after China and United States. The fabric
industry in India accounts for about 20% of total exports of the country and represent
the largest net foreign exchange earner.
The main cotton producing states are Maharashtra, Gujarat, Andhra Pradesh,
Madhya Pradesh, Punjab, Haryana, Rajasthan, Karnataka and Tamil Nadu. Of these,
Maharashtra alone accounts for 35 % of the total cotton production. Cotton is one of
the major cash crops grown in the country. In 1998-99, it was estimated that the area
under cotton cultivation in India was 92.87 lakh hectares (Ministry of Textiles –
Annual Report 04-05). However, the area under cotton has been decreasing over the
last few years and provisionally it is estimated that it is approximately 89.69 lakh
hectares in 2004-05.
India has progressed substantially in improving both production and
productivity of cotton over the last five years, transforming from a net importer of
cotton, to becoming one of the largest exporters, shipping 5.5 million bales in 2010-
11, second only to the USA.
To meet the current demand as well as address the demand growth in the
future, the value chain of cotton has to be improved. This is possible through
appropriate input management, improved supply chain management, backward
linkages, and standardization of trade practices and achieving economies of scale by
incorporating sustainable agricultural practices.

ix | P a g e
Bibliography
http://www.indianmirror.com/indian-industries/cotton.html
www.cottonegypt.net
http://www.worldcotton.com/cotton_prices/minsuprta.html
http://www.cotton.org/wjp/cp_egypt.htm
http://www.cotton.org/wjp/cp_egypt.htm
ww.mfa.gov.eg
www.mfti.gov.eg
www.eeaa.gov.eg
http://www.factfish.com/egytec.html
http://www.nationmaster.com/compare/Egypt/India/Economy
http://www.ifitweremyhome.com/compare/EG/IN
http://www.aneki.com/comparison.php?country_1=India&country_2=Egypt
http://www.economywatch.com/world_economy/egypt/indo-egypt-trade-relation.html
http://www.tradingeconomics.com
http://www.wiki.egypt
http://www.tradingeconomics.com

A
Global Country Study Report On
ENVIRONMENTAL FACTORS & LEGAL FACTORS OF EGYPT
FOR THE PARTIAL FULFILLMENT OF THE REQUIREMENT
FOR THE AWARD OF
MASTERS OF BUSINESS ADMINISTRATION
GUJARAT TECHONOLOGY UNIVERSITY
2011-2013
DEPARTMENT OF MANAGEMENT
K.P. PATEL SCHOOL OF MANAGEMENT & COMPUTER STUDIES,
Approved with all India council for Technological Education, New Delhi
Affiliated with Gujarat Technological University, MBA Jeevanshilp Campus, Kapadwanj-387620(Gujarat)
SUBMITTED BY: 1.Dhaval Shah (117240592005) 2.Ripal Gadhvi(117140592015) 3.Madhvi Prajapati(117240592020) 4.Bhargavi Patel(117240592014) 5.Nisha Chaudhari(117240592018) 6.Nidhi Patel(117240592012)
GUIDED BY: Ms. Disha Bhagat (Assistant Faculty)

Students’ Declaration
We Dhaval Shah, Ripal Gadhavi, Nidhi Patel, Nisha Chaudhry, Bhargavi Patel, Madhvi Prajapati hereby declare that the report for Global Country Study Report entitle “Environmental Factors & Legal Factors of Egypt” is a result of our own work & our indebtedness to other work publications, references, if any have been duly acknowledged. Place: - Kapadwanj Date: - 19th Nov. 2012.
Dhaval Shah Ripal Gadhavi Nidhi Patel Nisha Chaudhry Bhargavi Patel Madhvi Prajapati

PREFACE
This project report entitled “Global Country Study Report (Egypt)” has
been submitted to Gujarat Technological University, Ahmadabad in partial fulfillment for the
award of degree of Master of Business Administration. We, the undersigned hereby declare that
this report has been completed by us under the guidance of Ms. Disha Bhagat (K.P Patel School
of Management and computer studies. Kapadwanj)
This Project Report is useful to the Academicians, to the Researchers, with
respect to various aspects to find out the very important Results in their fields.
The report is entirely the result of our own efforts and has not been submitted
either in part or whole to any other institute or university for any degree.

ACKNOLEDGEMENT
We would like to express our deep feeling of gratitude to the under mentioned officials for their assistance, guidance and inspiration before and throughout the project. .
We are obliged to her for providing us with a clear basis to start the project and for providing valuable feedback during the course of this project without which the study would not have been possible.
Special thanks to respected Ms. Disha Bhagat, our project coordinator, our project faculty, for
providing us a proper way to walk on, for providing help and guidance throughout the project.
They have always been the source of encouragement. They have ceaselessly guided us in all
aspects of the project, with their abundance amount of experience and finer ideas.
We thank everybody who directly or indirectly helped us in this project to make it successful.

Executive Summary
Egypt having a climate which is warm at day time and cool at a night time.
In the coastal regions, daytime temperatures range between a minimum average of 14
°C (57 °F) in winter and a maximum average of 30 °C (86 °F) in summer.
In desert regions the temperature varies greatly, especially in summer; it may range from 7
°C (44.6 °F) at night, to 40 °C (104.0 °F) during the day. While the winter temperature in deserts
does not fluctuate as wildly, it can be as low as 0 °C (32 °F) at night, and as high as 18
°C (64.4 °F) during the day. Hot and dry Khams in winds blow in the Nile Delta region.
The climate in Egypt is Mediterranean on the Alexandria coast, semi-desert at the latitude of
Cairo, and completely desert in the South. The ideal moment to visit the country is in the
autumn, between September and November, when the weather gets colder in Europe but Egypt
remains warm. Temperatures vary between 25 and 35°C from North to South. The winter is a
good time to visit for people who can not bear temperatures above 30°C but may disappoint
those who expect a sunny stay. During that season, it is careful to take a warm jacket if you are
staying in Cairo as there is almost no heating in the country.
The climate change in Egypt results in three major out comes: 1. Rising sea level
2. Drought and
3. Loss of agriculture land
Effect of climate change on the life of Egyptian
The Egyptian people are spread out in world country. The all Egyptian not having the
fertile land except the small area around the Nile River.
The Nile River is requiring for the survival of the Egyptian people avoided in the country
is a3% of the space.
The Nile is continuously heating and no person is capable to stop it all the people of
Egypt was affected from the ancient of the Egypt .the poor people of low social status
depending on farming to the scribes.
For the protection of heat Egyptian made their houses of big window to catch a all
possible breeze.
In the Egypt the season of winter is slightly cooler than summer. The Egypt’s climate is
totally different.
Egypt has two seasons while in other place there were four season typically. Egypt
experience a mild winter between the months.
A change in a climate condition of Egypt affects the water supply and food between
Egyptian people.
Increase the scare city of water threatening the development of Egyptian people.
The domestic fisheries of Egypt, face increased the risk, Egyptian import more and more
fishes from other nations.As per the recent information and data on the dangers.

Ecosystem means as a community of organism living in a particular environment and the
physical element with they interact. Ecosystem includes the interaction of soil, water
light, inorganic neutrino and weather, plants animals, and micro organism usually
categorized as either producer or consumer and anthropogenic components.
An ecosystem can be small or large. Ecosystem is a required foe the survival of the
human life. It make a human life prospers. Climate is a one of the part of ecosystem.
Climate change is effect a ecosystem. Ecosystem plays an important role in the growth of
human life. The increase and decrease in the population is also affect the ecosystem.
The Egypt is having following wildlife.
Climate change have a significant impact on the human health & life. The some changes
in climate have a positive effect while some changes the dangerous for a human life.
The global worming have a greater impact on the life of human health, from last two
tears there is a impact of global worming on human life.
The global worming cause skin cancer.
vi
The Effect of Global Worming on Human Health
- The global worming have a greater impact on the life of human health, from last two
years there is a impact of global worming on human life.
- The global worming cause skin cancer.
Examples:
The 2003 European heat wave — involving temperatures that were 18°F (10°C) above
the 30-year average, with no relief at night — killed 21,000 to 35,000 people in five
countries. Starting in August 2003, it caused more than 14,800 deaths in France.
Belgium, the Czech Republic, Germany, Italy, Portugal, Spain, Switzerland, the

Netherlands, and the UK all reported excess mortality during the same period, with total
deaths in the range of 35,000. In France, deaths were massively reported for people aged
75 and over (60%).
Heat waves were also reported in 2003 in Andhra Pradesh, India, and caused the deaths
of 3,000 people
In July 1995, a heat wave killed more than 700 people in the Chicago area alone. Studies
based on these types of statistics estimate that in Atlanta, for example, even a warming of
about two degrees (F) would increase heat-related deaths from 78 annually now to
anywhere from 96 to 247 people per year.
Various Infectious Diseases: Like malaria and West Nile virus, dengue fever, which
comes in four strains, is also spread by mosquitoes. However, unlike malaria, dengue fever
is increase by mosquitoes that thrive in urban areas (Nelson, 2009). An infection by one of
four strains will create protection to only that strain, and will sadly increase the chances of
infection by another strain (Ibid). Rodent-borne disease are carried by rats, mice, bats, or
other rodents. There is proof that diseases transmitted by rodents sometimes increase during
heavy rainfall and flooding because of altered patterns of human–pathogen–rodent contact.
Floods are frequently followed by disease clusters: downpours can drive rodents from
burrows, deposit mosquito-breeding sites, foster mushroom growth in houses, and flush
pathogens, nutrients, and chemicals into waterways.
Vector borne disease are infection transmitted by the bite of infected arthropod specs such as
mosquitoes, ticks, thiatomine, buys, sand.
Various strains of hantavirus have become worrisome for Europe, Spain, and Portugal, most
of Italy, Greece, and western Russia. In 1997, over 9,000 people contracted the virus and 34
cases were terminal (Clement, et al. 2009). Nephropathies epidemical (NE), a disease caused
by Hantavirus, has increased from a handful of cases annually in the 1980s to an average of
300 cases per year within the past three years (Weinhold, 2009). Before investigations could
begin, researchers needed to understand why NE rose suddenly in Belgium, Germany,
France, Luxembourg, and Netherlands in 2005 (Dixon, 2009). Several studies associated the

outbreaks with bank voles, but the precise link was uncertain (Dixon, 2009). Clement et al.
(2009) examined the possible link between temperature and precipitation with observed NE
in Belgium.
As mast seed is the staple food of the bank vole, an abundance of mast would mean a large
supply of food for the rodent, thereby increasing the survival rate and encouraging earlier
breeding throughout the winter (Clement, 2009). Seed production had already been linked to
outbreaks of the rodent population. So what was causing high mast production? Mild winters
(Ibid). Clement et al. (2009) exposed a pattern where mild winters caused incidences of high
mast production, which would associate an increase in bank vole population for that winter
and the next spring. Peaks of NE in human populations can be seen in the year following one
with high mast production (Ibid).
Cases of TBE increased by 400% in the last 30 years (Rizzoli, 2009). Transmitted by hard
ticks of the Ixodes ricinus species, the disease requires a relative humidity of 80% to avoid
desiccation (Grey, 2008). In areas of good cover and undergrowth, the soil outside still
remains moist throughout the dry periods, and promotes the endurance of the disease (Ibid).
In Sweden, tick abundance correlates with mild winters and extended spring and autumn
seasons (Ibid).
In northern Europe, forest and nature management has changed; climate conditions have
changed, and there has also been a 2000% and 5000% increase in Roe and Red Deer
populations respectively (Rizzoli, 2009). The study done by Rizzoli et al. (2009) includes
several hypotheses of factors in this amazing population boom, such as the conversion of
coppices (cut woodlands) to high stand forest and the mass of deer to population of ticks.
However, the correlation between deer density and forest composition was irrelevant; in its
place, it may be that small mammals are benefiting from the forest symphony change (Ibid).

Alternative views include the observation that the rise in TBE was really due to the fall of
communalist rule at the end of the 20th century as there was a go down in public health
measures, economic development and land use, international travel and trade, technology
and industry, human demographics and behavior, and microbial edition and change
(Randolph, 2007).
In the Baltic region specifically, although conditions are similar, there were still differences
in the patterns of changes in TBE incidence since the early 1990’s (Randolph, 2007).
Agriculture shifted from large scale to small scale, which meant that conditions were more
livable for rodents. There was also less insect repellent use.
Like most diseases, tick-borne encephalitis is caused by multiple factors. More studies need
to be conducted to decide the specific links between the spread or sharing of TBE and the
close habitat and hosts as related to climate change.
Laws in Egypt The discrimination is to be find in Egypt for social life and other aspects. According to the
Constitution, the President should be the Muslim because the Muslim religion is the foundation
of Egyptian legislation. All the high posts in the military and others are filled only with Muslim.
No Christians can attain high office in tribunals. Consumer Rights is Right to safety and health
upon the abnormal use of the products, Right to obtain correct information, Right of selection of
the favorable products or services from the market, Right to join any council, organization,
association, Right to take legal action against any types of violation, exploitation.
- The law was not successful because the Govt. is not gave his necessary support in
implementation of law.
- This law is not successful in eliminate the discrimination due to lack of Govt. Support
And legal standard necessary for equality.
- The law was not promoted and safeguards the right of women and girls.

- Now women can apply all accordance with international and regional human rights and
standard for justice at all level.
The Consumer Protection Law Privodes by private or public legal persons including Second
hand commodities offered by suppliers.
- Any person who is offered the product or services for personal or familiar satisfaction is
know as consumer.
- The consumer protection agency is to be established by the provision of this law.
- Non-profit organization and association established and declared under this law.
- Consumer Rights;
Right to safety and health upon the abnormal use of the products.
Right to obtain correct information.
Right of selection of the favorable products or services from the market.
Right to join any council, organization, association.
Right to take legal action against any types of violation, exploitation.
On the transaction of the consumer, the supplier should give the proper invoice to
the consumer.
The supplier should give the proper and adequate information which is asked by
the consumer.
The supplier can save the consumer by any types of defect in the goods oe
services by complain to the agency.
The supplier is liable to pay the refund to the consumer for the damage or any
other faults in the products.
- Objectives of the Consumer Protection Agency;
1. Set the work plan to protect the consumer’s rights and the further confirmation.
2. Receive and confirm the complaints made by the consumer and association.
3. Study the suggestions sent to the agency concerning consumer’s rights.
- According to the article 18, all the person who is working for the agency shall be
prohibited from releasing or also disclosing any data or information and also the source
or information or data.
- The data and source of data should not be used for other purpose rather than for which
they were given.
- According to article 19, if any agency violate any provision of this law the agency is
removable within a prescribe limit by this law by the agency’s board of directors.
- According to article 20 of consumer protection law, all agencies have to prepare their
own budget and implement and it come to end as per state fiscal year.
- According to article 21, employee working at the agency should have the right to see all
ledger and documents at any government and non-government entity. They have a right
to take any information and data which is required to inspect the cases referred to agency.
- According to article 22, this article said that the resolution by the agency for the
implementation of the provision of the law will be the final. The resolution passed by the
agency should not the part or subject to the provision of the law no. 7 of 2000 which is
concerning the establishment of the conciliation committee in some disputes which is the
ministry and other public law entity are parties to.
- According to article 23, the association made for the consumer’s should have to work
without any prejudice under the law consumer protection association or the special union

shall prohibited from receiving any type of donation financial aid from the supplier or the
advertiser.
- According to article 24, the person who is violate the article 3, 4, 5, 6, 7, 8, 11, 18, and 23
shall be punished or fined some of not less than 5000 to not more than one hundred
thousand Egyptian pound.
If the sales is to be made in installments than the supplier should give the below information to
the consumer;
1. The entity provided the product by installment.
2. The price of the product if paid totally in cash.
3. The terms of the installments.
4. The entire cost of the sales.
5. The number and value o fetch installments.
6. The sum to be paid in advance if applicable.
Antitrust law adopted by Egypt before the five year with the issuing 3/2005 to maintain the
competition and to remove the monopoly in the market. The problem with the law is protecting
the competition itself is difficult to understand for Egyptian. In the year 2009, the Egyptian
competition authority received eleven complaints and two request that they have to expand
regulation. In the present law the monopolistic practices define only theoretical term which put
the average Egyptian into confusion that hoe to use the law to their benefits.
Employment Law;
if foreigners want to work in Egypt they required to take the permission. The now Egyptian labor
law widely known by law no. 12 of 2003 which is provides that employer should employ the
employee to see its ability for work up-to three months and after that if he find that employee is
suitable for work than a contract is definite or otherwise infinite period of time.

The law prescribed the maximum work in hours is 8 of 24 hrs not included overtime and rest
&meal time and law also said that employee must have to take the rest in every week which must
not less than 24 hrs. The employee also have a right to get twenty one days of annual paid
vacation after that completion of one year of his work and fifty days after ten years of working
on reaching the age of fifty.
Also the law gives right to employee to take early to take leave, and the general rule that they
entitled to six months, six leaves the pay of seventy five to eighty five percent of their normal
wage. The provision for overtime is 35 percent of normal wage for daylight, 70% work at night
and 100% for wage time.
Health & Safety Law provides The organization’s top management has to authorize an OH&S
policy stating the organization’s OH&S objectives and its commitment to continual
improvement. There are other requirements covering, for example, communication and review of
the policy.
Organizations have to have procedures for risk assessment an risk control and use the outputs
from these procedures in setting OH&S objectives. There is also a list of criteria which must be
met by the hazard identification, risk assessment and risk control procedures Organizations must
keep up to date records of the legal and other OH&S requirements which apply to them, and
ensure access to details of these requirements. The requirements must also be communicated to
employees and other relevant interested parties.
Table of Content

Sr.No. Particulars Page 1. Student’s Declaration 2. Prefece I
3. Acknowledge II 4. Executive Summary Environmental and weather condition of Egypt 1
5. Climate Condition on Egept 2 6. The climate change in Egypt results in three major out comes 3 7. Effect of climate change on the life of Egyptian 4
8. Ecosystem & Wildlife 5
9. Human Health 8
10. The Effect of Global Worming on Human Health 8
11. Various Infectious Diseases 9
Laws in Egypt 13
12. Discrimination Law 14 13. The Consumer Protection Law 15 14. Antitrust law 18
15. Employment Law 19 16. Health & Safety Law 20 17. BIBLIGORAPHY Iv

Environmental and weather
condition of Egypt
Egypt having a climate which is warm at day time and cool at a night time.
In the coastal regions, daytime temperatures range between a minimum average of 14
°C (57 °F) in winter and a maximum average of 30 °C (86 °F) in summer.
In desert regions the temperature varies greatly, especially in summer; it may range from 7
°C (44.6 °F) at night, to 40 °C (104.0 °F) during the day. While the winter temperature in deserts

does not fluctuate as wildly, it can be as low as 0 °C (32 °F) at night, and as high as 18
°C (64.4 °F) during the day. Hot and dry Khams in winds blow in the Nile Delta region.
Egypt receives less than 80 mm (3.15 in) of precipitation annually in most areas, although in the
coastal areas it reaches 200 mm. It hardly ever rains during the summer.
Climatic conditions in Egypt
The climate in Egypt is Mediterranean on the Alexandria coast, semi-desert at the latitude of
Cairo, and completely desert in the South. The ideal moment to visit the country is in the
autumn, between September and November, when the weather gets colder in Europe but Egypt
remains warm. Temperatures vary between 25 and 35°C from North to South. The winter is a
good time to visit for people who can not bear temperatures above 30°C but may disappoint
those who expect a sunny stay. During that season, it is careful to take a warm jacket if you are
staying in Cairo as there is almost no heating in the country. Spring occurs rather late (March-
April) and does not really constitute a transition season because summer arrives quickly. It is
usually a windy period, especially with the khamsin (a hot sand wind which blows two or three
times during the season). Temperatures are very high in the summer. You will have to adapt the
program of your days by beginning very early in the morning and making a pause in the middle
of the day.
The climate change in Egypt results in three major out comes: 1. Rising sea level
2. Drought and
3. Loss of agriculture land
The ice making also contribute to increasing the grater level of sea in Antarctic and green
land. If the temperature is increased that will expand the water level of ocean. The

increased level of water affects the law leveling area like Netherlands and Bangladesh.
The million of area is affected by the danger of flooding, so many people loss their home
due to flood.
So many crops due to affected by changes in the climate. The crop of wheat and rice
require to good a high temperature while maize and sugarcane require a cool climate.
The change in climate decides the growth of plants.
In some time the weather change affect the many countries, crops and it lead to that
country not having enough food. Change in climate will also affect the gain of the
countries. In some countries it will be more gain while in other countries it will bring a
less gain.
Climate takes a place in our daily weather also; the climate change will also affect the
animals also.
The change in climate condition of Egypt leads to move the population inland to avoid
the damages from flooding. The Egypt has to decide that how it will manage a climate
change to avoid a damage.
Effect of climate change on the life of Egyptian The Egyptian people are spread out in world country. The all Egyptian not having the
fertile land except the small area around the Nile River.
The Nile River is requiring for the survival of the Egyptian people avoided in the country
is a3% of the space.
The Nile is continuously heating and no person is capable to stop it all the people of
Egypt was affected from the ancient of the Egypt .the poor people of low social status
depending on farming to the scribes.
For the protection of heat Egyptian made their houses of big window to catch a all
possible breeze.

In the Egypt the season of winter is slightly cooler than summer. The Egypt’s climate is
totally different.
Egypt has two seasons while in other place there were four season typically. Egypt
experience a mild winter between the months.
A change in a climate condition of Egypt affects the water supply and food between
Egyptian people.
Increase the scare city of water threatening the development of Egyptian people.
The domestic fisheries of Egypt, face increased the risk, Egyptian import more and more
fishes from other nations.As per the recent information and data on the dangers.
Ecosystem & Wildlife - Ecosystem means as a community of organism living in a particular environment and the
physical element with they interact. Ecosystem includes the interaction of soil, water
light, inorganic neutrino and weather, plants animals, and micro organism usually
categorized as either producer or consumer and anthropogenic components.
- An ecosystem can be small or large. Ecosystem is a required for the survival of the
human life. It make a human life prospers. Climate is a one of the part of ecosystem.
- Climate change is effect a ecosystem. Ecosystem plays an important role in the growth of
human life.
- The increase and decrease in the population is also affect the ecosystem.
- The Egypt is having following wildlife.

Invasive Species and Climate Change
Whales: Even Giants Aren't Safe
Beetle-Battle: A Threat to the World's Forests
Film Sparks Discussion of Penguins' Fate
Climate Change Threatens Reindeer and Arctic People

Will Climate Change Wipe Out the Polar Bear?
Where Will All the Fish Have Gone?
Flying is No Escape: Migratory Birds
Seals and Their Race Against Climate Change

Marine Oases in Collapse
Human Health - Climate change have a significant impact on the human health & life. The some changes
in climate have a positive effect while some changes the dangerous for a human life.
The Effect of Global Worming on Human Health - The global worming have a greater impact on the life of human health, from last two
years there is a impact of global worming on human life.
- The global worming cause skin cancer.
Examples:
The 2003 European heat wave — involving temperatures that were 18°F (10°C) above
the 30-year average, with no relief at night — killed 21,000 to 35,000 people in five
countries. Starting in August 2003, it caused more than 14,800 deaths in France.
Belgium, the Czech Republic, Germany, Italy, Portugal, Spain, Switzerland, the
Netherlands, and the UK all reported excess mortality during the same period, with total

deaths in the range of 35,000. In France, deaths were massively reported for people aged
75 and over (60%).
Heat waves were also reported in 2003 in Andhra Pradesh, India, and caused the deaths
of 3,000 people
In July 1995, a heat wave killed more than 700 people in the Chicago area alone. Studies
based on these types of statistics estimate that in Atlanta, for example, even a warming of
about two degrees (F) would increase heat-related deaths from 78 annually now to
anywhere from 96 to 247 people per year.
Various Infectious Diseases Vector borne Disease
Vector borne disease are infection transmitted by the bite of infected arthropod specs such as
mosquitoes, ticks, thiatomine, buys, sand.

Dengue Fever
Like malaria and West Nile virus, dengue fever, which comes in four strains, is also spread by
mosquitoes. However, unlike malaria, dengue fever is increase by mosquitoes that thrive in
urban areas (Nelson, 2009). An infection by one of four strains will create protection to only that
strain, and will sadly increase the chances of infection by another strain (Ibid).
Rodent-borne Diseases
Rodent-borne disease are carried by rats, mice, bats, or other rodents. There is proof that
diseases transmitted by rodents sometimes increase during heavy rainfall and flooding
because of altered patterns of human–pathogen–rodent contact. Floods are frequently
followed by disease clusters: downpours can drive rodents from burrows, deposit mosquito-
breeding sites, foster mushroom growth in houses, and flush pathogens, nutrients, and
chemicals into waterways.
Hantaviruses
Various strains of hantavirus have become worrisome for Europe, Spain, and Portugal, most
of Italy, Greece, and western Russia. In 1997, over 9,000 people contracted the virus and 34
cases were terminal (Clement, et al. 2009). Nephropathies epidemical (NE), a disease
caused by Hantavirus, has increased from a handful of cases annually in the 1980s to an
average of 300 cases per year within the past three years (Weinhold, 2009). Before
investigations could begin, researchers needed to understand why NE rose suddenly in
Belgium, Germany, France, Luxembourg, and Netherlands in 2005 (Dixon, 2009). Several
studies associated the outbreaks with bank voles, but the precise link was uncertain (Dixon,
2009). Clement et al. (2009) examined the possible link between temperature and
precipitation with observed NE in Belgium.
As mast seed is the staple food of the bank vole, an abundance of mast would mean a large
supply of food for the rodent, thereby increasing the survival rate and encouraging earlier
breeding throughout the winter (Clement, 2009). Seed production had already been linked
to outbreaks of the rodent population. So what was causing high mast production? Mild

winters (Ibid). Clement et al. (2009) exposed a pattern where mild winters caused
incidences of high mast production, which would associate an increase in bank vole
population for that winter and the next spring. Peaks of NE in human populations can be
seen in the year following one with high mast production (Ibid).
From 1985 to 2007, there
were a total of 2,048
registered NE cases. Of the
1,678 cases within a 12 year
period from 1996-2007, 828
or 49.34% occurred in the
last three years
(Clement, 2009).
According to data
from before 1990, low incidences of NE were most likely due to low medical awareness,
but after 1990, 3 year peaks of NE would show, and since 1999, 2 year peaks.
Other factors that cause a higher rate of NE include an increase in human outside activity
that results in closer contact with bank voles (Clement, 2009). For those who live or work
in the forest or cut and handle firewood, risk of contact is also increased (Ibid).
The trends of incidences of NE display that infectious diseases are affected as climate
change alters conditions for disease-carrying organisms, such as the bank vole.
Tick-borne Encephalitis (TBE)
Cases of TBE increased by 400% in the last 30 years (Rizzoli, 2009). Transmitted by hard
ticks of the Ixodes ricinus species, the disease requires a relative humidity of 80% to avoid
desiccation (Grey, 2008). In areas of good cover and undergrowth, the soil outside still
remains moist throughout the dry periods, and promotes the endurance of the disease (Ibid).
In Sweden, tick abundance correlates with mild winters and extended spring and autumn
seasons (Ibid).

The altitude distribution of the disease has changed in past decades (Grey, 2008). In 1957
and 1979-80, ticks were prevalent up to 700 meters above sea level. But in 2001 and 2002,
ticks were found as high as 1100 meters above sea level (Ibid). From 1957-1983,
researchers found that ticks simply couldn’t complete their life cycles at higher altitudes
(Ibid). The distribution previously ranged from France and southwest England to central
Asia and central Europe. Its limits were northern Germany, Poland, and Lithuania, and its
southern limit was the Mediterranean shore (Ibid). In 1976, cases of TBE were reported in 4
out of 3000 sites (Ibid). In 2003, 26 sites were reported, but they were all previously known
for the tick (Ibid). In 2004, 14 sites had reports, but only 2 of the 14 were previously known
for ticks (Ibid). These results suggest an expanded tick habitat range in new areas of
Germany, Hungary, Switzerland, and the Netherlands (Ibid).
In northern Europe, forest and nature management has changed; climate conditions have
changed, and there has also been a 2000% and 5000% increase in Roe and Red Deer
populations respectively (Rizzoli, 2009). The study done by Rizzoli et al. (2009) includes
several hypotheses of factors in this amazing population boom, such as the conversion of
coppices (cut woodlands) to high stand forest and the mass of deer to population of ticks.
However, the correlation between deer density and forest composition was irrelevant; in its
place, it may be that small mammals are benefiting from the forest symphony change (Ibid).
Alternative views include the observation that the rise in TBE was really due to the fall of
communalist rule at the end of the 20th century as there was a go down in public health
measures, economic development and land use, international travel and trade, technology
and industry, human demographics and behavior, and microbial edition and change
(Randolph, 2007).
In the Baltic region specifically, although conditions are similar, there were still differences
in the patterns of changes in TBE incidence since the early 1990’s (Randolph, 2007).
Agriculture shifted from large scale to small scale, which meant that conditions were more
livable for rodents. There was also less insect repellent use.
Like most diseases, tick-borne encephalitis is caused by multiple factors. More studies need
to be conducted to decide the specific links between the spread or sharing of TBE and the
close habitat and hosts as related to climate change.

Laws in Egypt

Discrimination Law
In Egypt, Govt. have been giving equal rights and opportunities to women compared to
men to realize full potentiality of women.
Discrimination in Egypt
The discrimination is to be find in Egypt for social life and other aspects. According to the
Constitution, the President should be the Muslim because the Muslim religion is the foundation
of Egyptian legislation. All the high posts in the military and others are filled only with Muslim.
No Christians can attain high office in tribunals.
- The law was not successful because the Govt. is not gave his necessary support in
implementation of law.
- This law is not successful in eliminate the discrimination due to lack of Govt. Support
And legal standard necessary for equality.
- The law was not promoted and safeguards the right of women and girls.
- Now women can apply all accordance with international and regional human rights and
standard for justice at all level.

The Consumer Protection Law
(On basis of articles of this act)
- Persons;
Natural Persons & Legal Entities Including,
All Companies,
Association,
Unions,
Organizations,
Enterprise,
Financial Groups
- Products;
Provided by private or public legal persons including Second hand commodities
offered by suppliers.
- Any person who is offered the product or services for personal or familiar satisfaction is
know as consumer.
- The consumer protection agency is to be established by the provision of this law.
- Non-profit organization and association established and declared under this law.
- Consumer Rights;
Right to safety and health upon the abnormal use of the products.
Right to obtain correct information.
Right of selection of the favorable products or services from the market.
Right to join any council, organization, association.
Right to take legal action against any types of violation, exploitation.
- On the transaction of the consumer, the supplier should give the proper invoice to the
consumer.
- The supplier should give the proper and adequate information which is asked by the
consumer.
- The supplier can save the consumer by any types of defect in the goods oe services by
complain to the agency.
- The supplier is liable to pay the refund to the consumer for the damage or any other faults
in the products.
- If the sales is to be made in installments than the supplier should give the below
information to the consumer;
7. The entity provided the product by installment.
8. The price of the product if paid totally in cash.
9. The terms of the installments.
10. The entire cost of the sales.
11. The number and value o fetch installments.
12. The sum to be paid in advance if applicable.
- Objectives of the Consumer Protection Agency;
4. Set the work plan to protect the consumer’s rights and the further confirmation.
5. Receive and confirm the complaints made by the consumer and association.
6. Study the suggestions sent to the agency concerning consumer’s rights.
- According to the article 18, all the person who is working for the agency shall be
prohibited from releasing or also disclosing any data or information and also the source
or information or data.
- The data and source of data should not be used for other purpose rather than for which
they were given.
- According to article 19, if any agency violate any provision of this law the agency is
removable within a prescribe limit by this law by the agency’s board of directors.

- According to article 20 of consumer protection law, all agencies have to prepare their
own budget and implement and it come to end as per state fiscal year.
- According to article 21, employee working at the agency should have the right to see all
ledger and documents at any government and non-government entity. They have a right
to take any information and data which is required to inspect the cases referred to agency.
- According to article 22, this article said that the resolution by the agency for the
implementation of the provision of the law will be the final. The resolution passed by the
agency should not the part or subject to the provision of the law no. 7 of 2000 which is
concerning the establishment of the conciliation committee in some disputes which is the
ministry and other public law entity are parties to.
- According to article 23, the association made for the consumer’s should have to work
without any prejudice under the law consumer protection association or the special union
shall prohibited from receiving any type of donation financial aid from the supplier or the
advertiser.
- According to article 24, the person who is violate the article 3, 4, 5, 6, 7, 8, 11, 18, and 23
shall be punished or fined some of not less than 5000 to not more than one hundred
thousand Egyptian pound.

Antitrust law
- Antitrust law adopted by Egypt before the five year with the issuing 3/2005 to maintain
the competition and to remove the monopoly in the market.
- The problem with the law is protecting the competition itself is difficult to understand for
Egyptian.
- In the year 2009, the Egyptian competition authority received eleven complaints and two
request that they have to expand regulation.
- In the present law the monopolistic practices define only theoretical term which put the
average Egyptian into confusion that hoe to use the law to their benefits.
- therefore, the government try to give and explain the guiding principles of antitrust law
and train the lawyer to file complain and law suits

Employment Law - The new Egyptian labor law…..
-
Establishment: the employment law of Egyptian law was established in October
2004, by Khosheni Rashed & Rai.
Overview of Employment Law: if foreigners want to work in Egypt they
required to take the permission. The now Egyptian labor law widely known by
law no. 12 of 2003 which is provides that employer should employ the employee
to see its ability for work up-to three months and after that if he find that
employee is suitable for work than a contract is definite or otherwise infinite
period of time.
The law prescribed the maximum work in hours is 8 of 24 hrs not included
overtime and rest &meal time and law also said that employee must have to take
the rest in every week which must not less than 24 hrs.
The employee also have a right to get twenty one days of annual paid vacation
after that completion of one year of his work and fifty days after ten years of
working on reaching the age of fifty.
Also the law gives right to employee to take early to take leave, and the general
rule that they entitled to six months, six leaves the pay of seventy five to eighty
five percent of their normal wage. The provision for overtime is 35 percent of
normal wage for daylight, 70% work at night and 100% for wage time.
The act also laid down that the employed is legally dismissed if he committed any
serious offences.

Health & Safety Law
1 - General requirements: The organization’s top management has to authorize an OH&S
policy stating the organization’s OH&S objectives and its commitment to continual
improvement. There are other requirements covering, for example, communication and review of
the policy.
2 - Planning: Organizations have to have procedures for risk assessment an risk control and use
the outputs from these procedures in setting OH&S objectives. There is also a list of criteria
which must be met by the hazard identification, risk assessment and risk control procedures
Organizations must keep up to date records of the legal and other OH&S requirements which
apply to them, and ensure access to details of these requirements. The requirements must also be
communicated to employees and other relevant interested parties.

BIBLIGORAPHY
1. WWW.SOOPLE.COM
2. http://www.eeaa.gov.eg/ecc/ClimateBackground.htm
3. http://www.alarabiya.net/articles/2011/08/10/161719.html
4. http://www.hsmemagazine.com/regulation.php?regulation_id=12
5. http://www.legal500.com/c/egypt/developments/2903

A
Report
ON
Global Country Study Report (Wool Industry of Egypt)
FOR THE PARTIAL FULFILLMENT OF THE REQUIREMENT
FOR THE AWARD OF
MASTERS OF BUSINESS ADMINISTRATION
GUJARAT TECHONOLOGY UNIVERSITY
2011-2013
K.P. PATEL SCHOOL OF MANAGEMENT & COMPUTER STUDIES,
Approved with all India council for Technological Education, New Delhi
Affiliated with Gujarat Technological University, MBA
Jeevanshilp Campus, Kapadwanj-387620(Gujarat)
GUIDED BY:
Ms. Disha Bhagat (Assistant Faculty)
()()fsdfsd
SUBMITTED BY:
1.Dhaval Shah (117240592005)
2.Ripal Gadhvi(117140592015)
3.Madhvi Prajapati(117240592020)
4.Bhargavi Patel(117240592014)
5.Nisha Chaudhari(117240592018)
6.Nidhi Patel(117240592012)
Students’ Declaration
We Dhaval Shah, Ripal Gadhavi, Nidhi Patel, Nisha Chaudhry, Bhargavi Patel, Madhvi
Prajapati hereby declare that the report for Global Country Study Report entitled “Wool
Industry of Egypt & Also Comparision with Indian Wool Industry” is a result of our own work
& our indebtedness to other work publications, references, if any have been duly acknowledged.
Place: -
Date: -
Dhaval Shah
Ripal Gadhavi
Nidhi Patel
Nisha Chaudhry
Bhargavi Patel
Madhvi Prajapati

PREFACE
This project report entitled “Global Country Study Report (Egypt)” has been submitted to
Gujarat Technological University, Ahmadabad in partial fulfillment for the award of degree of
Master of Business Administration. We, the undersigned hereby declare that this report has been
completed by us under the guidance of Ms. Disha Bhagat (K.P Patel School of Management and
computer studies. Kapadwanj)
This Project Report is useful to the Academicians, to the Researchers, with respect to various
aspects to find out the very important Results in their fields.
The report is entirely the result of our own efforts and has not been submitted either in part or
completely too any other institute or in university for any degree.

ACKNOLEDGEMENT
We would like to express our deep feeling of gratitude to the under mentioned officials for their
assistance, guidance and inspiration before and throughout the project.
We are obliged to her for providing us with a clear basis to start the project and for providing
valuable feedback during the course of this project without which the study would not have been
possible.
Special thanks to respect Ms. Disha Bhagat, our project coordinator, our project faculty, for
providing us a proper way to walk on, for providing help and guidance throughout the project.
They have always been the source of encouragement. They have ceaselessly guided us in all
aspects of the project, with their abundance amount of experience and finer ideas.
We thank everybody who directly or indirectly helped us in this project to make it successful.
Ms. Disha Bhagat
Name of the Student with Signature/s:
1. Dhaval Shah (117240592005)
2. Ripal Gadhvi (117140592015)
3. Madhvi Prajapati (117240592020)
4. Bhargavi Patel (117240592014)
5. Nisha Chaudhari (117240592018)
6. Nidhi Patel (117240592012)
Date:
Place:

Executive Summary
Here there is overview of the Report of Wool Industry prevailing in Egypt as a whole. There is
many opportunities for development of wool industry in the egypt because there is not so many
companies in the Egypt that produced the wool garments and many others things those are made
by the woolo in the Egypt. So lets take it in some more manner or in details as a overview of the
wool industry.
the woollen sector plays an important role in linking the rural economy with the manufacturing
industry, represented by small, medium and large scale units. The product portfolio is equally
divergent from textile intermediaries to finished textiles, garments, knitwears, blankets, carpets
and an incipient presence in technical textiles. Wool industry is a rural based export oriented
industry and caters to civil and defence requirements for warm clothing. India has the 3rd largest
sheep population country in the world having 6.40 crores sheep producing 43.30 million kg of
raw wool. Out of this about 85% is carpet grade wool, 5% apparel grade and remaining 10%
coarse grade wool for making rough Kambals etc. Average annual yield per sheep in India is 0.9
Kg. against the world average of 2.4 Kg.
A small quantity of specialty fibre is obtained from Pashmina goats and Angora rabbits. The
domestic produce of wool is not adequate, therefore, the industry is dependent on imported raw
material and wool is the only natural fibre in which the country is deficient. The woollen
industry in the country is of the size of Rs. 10,000 Crore and is broadly divided & scattered
between the organized and decentralized sectors. The organized sector consists of: Composite
mills, Combing units, Worsted and Non Worsted spinning units, Kintwears and Woven
Garments units and Machine Made Carpets manufacturing units. The Decentralized Sector
includes Hosiery and knitting, Power-looms, Hand knotted carpets, Druggets, Namadahs and
Independent dyeing, Process houses and Woollen Handloom Sector.
There are around 958 woollen units in the country, majority of which are in the small scale
sector. The industry has the potential to generate employment in far-flung and diverse regions

and at present provides employment in the organised wool sector to about 12 lakh persons, with
an additional 12 lakh persons associated in the sheep rearing and farming sector. Further, there
are 3.2 lakh weavers in the carpet sector. During the XIth Five Year Plan period, the Government
is implementing (i) Integrated Wool Improvement & Development Programme (IWIDP), (ii)
Quality Processing of Wool and Woollen Products and (iii) Social Security Scheme for sheep
breeders in the country for the growth and development of the wool and woollen industry. The
schemes are being implemented by the Central Wool Development Board (CWDB), Jodhpur,
through State Government Organizations/Non-Governmental Organizations.
Wool Industry in India
Traditionally, home run handlooms and skilled artisans have formed the basic back bone of
Textiles Industry in India. Manufacture of fine woolen textile products in India has been strong
point of artisan skills of handloom weaver‟s right from Kashmir in the North to various
manufacturing centers in Rajasthan, Punjab, Uttar Pradesh for centuries. Various kinds of
animal hair obtained from hilly terrain were processed and used to
make fine products like shawls, carpets, rugs etc. During the British government in second half
of the 17th century, large amounts of cotton goods were exported regularly from India. Soon
the modern structure of mechanized Manufacturing of Cotton Textile Industry was
followed by the Woolen Textile Industry successively.
However, establishment of mechanized mill in Woolen Sector was relatively late and possibly
the first mill was „Lallmli‟ of British India Corporation set up in Kanpur.
The modern industry followed growth in center like Thane, Mumbai, Jamnagar, Vadodara in
West and Dhariwal, Amritsar, Panipat, Ludhiana in the North. In the after that part of the 20th
Century saw creation of new facilities in Mysore, Raipur and Nagpur. Other than that new
investment in green ground large projects remain insignificant. Instead the investment in this
sector was more focused on existing sites to modernize and expand.
In the early stage of development, production was confined for path to medium qualities mostly
for the requirement of defence department. Requirement for fine variety of woll and worsted

fabric were met through imports mostly from U.K. Post independence, economics policies led to
rapid growth of woollen textile manufacture in the organized sector and mushrooming of small
to medium sized units all over India producing all kinds of wool products, knitwear, hosiery and
woollen blazer fabrics followed by blankets.
The middle of 20th century eventually saw imports being almost stopped and domestic
production keeping pace with local demand followed by product innovation and introduction of
latest technology for processing of greasy wool from Australia to finished products.
Today in this new century the woolen sector of the Indian Textile Industry has many big brands
names on its horizon. The woolen industry deserves a special mention for creating the concept of
brand marketing on the national scale in the textile field. Some of the brands have been
successful to create a mark even outside Indian boundary.
Employment generator after agriculture. The clothing sector is the final stage of the textiles value
chain, with maximum value addition at this level. It is a low investment and high labour-
intensive industry; an investment of ` 0.1 mn creates 6 to 8 jobs. The industry employs around 5
mn workers, of which, around 2.5 mn are in the export sector. The clothing industry consists
mainly of knitted and woven garment segments. This industry is fragmented and is
predominantly in the small-scale sector.
Apparel clusters in India
The apparel industry is concentrated mainly in eight clusters: Tirupur, Ludhiana, Bengaluru,
Delhi/Noida/Gurgaon, Mumbai, Kolkata, Jaipur and Indore. While Tirupur, Ludhiana and
Kolkata are major centres for knitwear, Bengaluru, Delhi/Noida/Gurgaon, Mumbai, Jaipur and
Indore are major hubs for woven garments.
Industry structure
The textiles sector in India comprises both organised and unorganised segments. More than 70
textile and clothing clusters account for about 80% of total production in the country. There are
nearly 40 powerloom clusters in the country. Major states with a number of clusters are
Maharashtra, Tamil Nadu, Andhra Pradesh, Karnataka, Kerala and Uttar Pradesh. The textiles

industry is extremely diversified with hand-spun and hand-woven sectors at one end and the
capital-intensive, sophisticated mill sector at the other. The de-centralised powerloom/hosiery
and knitting sectors form the largest section of the textiles industry. Major sub-sectors of the
textiles sector are organised cotton/man-made fibre textiles mills, man-made fibre/filament yarn,
wool and woolen textiles, sericulture and silk textiles, handlooms, handicrafts, jute and jute
textiles and textiles exports.
Industry structure
The textiles sector in India comprises both organised and unorganised segments. More than 70
textile and clothing clusters account for about 80% of total production in the country. There are
nearly 40 powerloom clusters in the country. Major states with a number of clusters are
Maharashtra, Tamil Nadu, Andhra Pradesh, Karnataka, Kerala and Uttar Pradesh. The textiles
industry is extremely diversified with hand-spun and hand-woven sectors at one end and the
capital-intensive, sophisticated mill sector at the other. The de-centralised powerloom/hosiery
and knitting sectors form the largest section of the textiles industry. Major sub-sectors of the
textiles sector are organised cotton/man-made fibre textiles mills, man-made fibre/filament yarn,
wool and woolen textiles, sericulture and silk textiles, handlooms, handicrafts, jute and jute
textiles and textiles exports.
PROCESSING - The Woollen industry suffers from inadequate and outdated processing
facilities. The pre-loom and post-loom facilities are required to be modernized for ensuring quality
finished products. Quality finishing of the woollen products will not only increase use of indigenous
wool but will also make the product more competitive in the international market. It will also assist
in procuring better price for wool growers and will make quality raw material available to the Khadi
and Handloom sector.
Owing to overall size of the woollen industry and specialized nature of equipments required for
processing, the industry has been dependent on imported plant and machinery except for few
complimentary equipments from local sources. Machinery required for processing from raw wool
fibre to fabrics followed by knitting and garmenting, is mostly imported from European countries,

USA and Japan. The industry may need an investment of Rs.5,000 crores worth of plant and
equipment in the course of next 5 years for modernization and capacity expansion.
IMPORT - The production of wool in the country is not sufficient to meet the demand of the
wool industry particularly of apparel sector and most of it is being imported from Australia, New
Zealand and many other countries. The present requirement of different segments of Indian woollen
industry is likely to grow further because of higher domestic as well as export need of woollen items.
The country which had strong position in quality carpet wool production is becoming dependent on
import, as requirement is growing at higher pace as compared to growth in production.
There has been a shift from imports of fine quality wool to low quality wool in recent years. This is
on account of consumer preference for hand tufted carpets in the US and other western markets.
Cheap wool import from the Middle East is also constantly growing and is mixed with indigenous
wool to make hand tufted carpets.
RESEARCH & DEVELOPMENT - Research & Development activities should be promoted
in the country to help the wool industry to adopt regular system of quality control and maintain
the quality of products, to render technical and trouble shooting services with reference to
selection of raw material, controlling various adjusting equipments and reducing the cost of
production and improving the quality of product.
Investment in R&D activities would help in following way
- Development of new products based on latest techniques in mechanical and chemical
processing of wool and transfer the knowhow to the industry.
- Study and provide Research & Development facilities for testing of properties of various
products like fiber, yarn and fabric stages including intermediate stages.
- The provision of services in quality assurance and testing to the organized sector.

- The provision of services to the decentralized industry, which uses significant Australian
wool in small enterprises where the sophistication of equipment and machinery is much
lower than that of the “organised” sector.
- Offer technical training and suitable courses to support industry‟s need of
technological/supervisory training for constant upgradation of technical knowhow.
- Organizing regular workshops and seminars with the participation of industry experts
from India as well as overseas in the field of wool technology for the dissemination of the
latest development.
CONSTRAINS FACED BY WOOL SECTOR
1. Raw Wool Production
- Low priority of State Governments in development of wool sector,
- Lack of awareness, traditional management practices, and lack of education and poor
economic conditions of woolgrowers.
- Shortage of pasture land which force breeders to migrate their flock from one area to
another throughout the year.
- Uneconomical return of the produces to sheep breeders i.e. sale of raw wool, live sheep,
manure, milk, mutton, skin etc.
- Lack of motivation for adopting modern methods of sheep management, machine
shearing of sheep, washing & grading of raw wool etc.
- Inadequate production and processing facilities of specialty fibres i.e. Pashmina goat
wool and Angora rabbit wool.
2. Marketing of Raw Wool
- Inadequate marketing facilities and infrastructure,
- Ineffective role of state wool marketing organizations in wool producing States.

- Absence of organized marketing and minimum support price system for ensuring
remunerative return.
- Minimum return earned from sale of wool by wool growers.
3. Processing of Wool
- Inadequate quantity of quality raw wool.
- Out dated and inadequate pre-loom & post-loom processing facilities.
- Inadequate dyeing facilities in wool potential areas.
- Need of designing & diversification of woolen handloom products.
- Dearth of technicians & trained manpower.
- Inadequate testing facilities and quality control measures.
- Transfer of technology is inadequate.
- Lack of operational and technical bench marks.
4. Education, Research & Development, Human Resource Development
- No educational institute for wool technology resulting lack of expertise in wool sector.
- Inadequate database.
- Need of R&D work on blending of raw wool with other fibres & diversification of
woollen products.
- Lack of R&D work for value addition to Deccani wool produced in Southern region.
The growth of Woollen Textile Industry in India - Woolen textile industry is one of the
oldest industries of India. The Aryans knew the use of wool as far back as 5000 B.C.
Woollen textile manufacturing was a handiwork and then a cottage industry run on very small
scale during the historical times. The Indian blankets, lohis, 'nomads', shawls etc. were popular in
different countries in the past. The first woollen mill 'Lalimli' was set up at Kanpur in 1876.
Later in 1881 in Punjab (Dhariwal) another woollen mill was started. Mumbai in 1882 and
Bangalore in 1886 followed suit. The industry developed steadily with the increase in population

in the country. A current survey shows that presently, there are over 625 big and small woollen
mills extend over the different parts of the country. There are thousands of hosiery units in the
country manufacturing a variety of woollens.
The major concentration of the industry is in Punjab, Maharashtra and U.P these states produce
75% of the total output.
Gujarat, Karnataka, West Bengal and J & K also have woollen mills.
Punjab - Punjab is the leader. There are over 250 small woollen mills in Punjab. Dhariwal in
Gurdaspur district, which is an old centre of the industry, is well known. Amritsar and Ludhiana
are other centres. The industry depends upon wool from H.P, J 8c K and Australia. The industry
gets power from Bhalcra Dam. Labour is available in these centres.
Maharashtra. - Maharashtra is another important state of India where woolen mills exist. These
are 31 mills. The majority are in Mumbai. Mumbai being a port, it is easy to import wool from
Australia, U.K., Italy, etc. Superior quality fabrics are manufactured including blended fibre.
U.P. - Kanpur is the most outstanding centre. Mirzapur, Varanasi, Agra, Tanakpur are other
centres. There are nearly 40 woollen mills in the state.
Gujarat . - There are 10 mills in Gujarat, Jamnagar, Ahmadabad and Vadodra are the main
centres.
Haryana. - Panipat, Bhiwani, Faridabad, Gurgaon.
Rajasthan.:- Bikaner, Bhilwara, Alwar, Sikar, Jaipur, Pushkar and Ajmer.
Karnataka. :- Bangalore, Ballery (3 mills).
West Bengal . :- Kolkata and Howrah (6 mills).
J & K. :- Srinagar.
Tamil Nadu. :- Chennai and Salem.
The industry manufactures different types of woollens like Patti, carpets, hosiery goods, cloth,
blankets, lohis, shawls etc. Carpets are made in Mirzapur, Gopiganj, Agra (U.P), Srinagar (J.K.),
Amritsar (Punjab), Panipat (Haryana), Jaipur, Bikancr (Rajasthan), Eluru (A.P), Chennai (T.N.).
Egypt’s Wool Industry
When we think of knitting, or any ability that uses yarn, we think of wool. Wool, by definition, is
the fiber made from the cheat of domestic sheep. relations of the domestic sheep had long hair
and a soft, soft basecoat. Over the years of domesticating the sheep through breeding, feed,
climate and herding, wool was probably the first fiber to be woven into a textile. I've always
found this process exciting especially because it began so long ago. Fragments of wool have
been found in the tombs and ruins of Egypt, Nineveh, and Babylon, and also among relics of the
Peruvians. As near the beginning as 200 BC, the Romans began to improve their flock by
domestication and herding. Today these sheep are known as the famed Spanish Merino Sheep. A
factory at Winchester, established by the Romans, improved the methods by the Britons, who
kept sheep and weave wool long before the Roman attack.
Skilled Flemish weavers were brought in by William the captor. Wool industries were
encouraged by Henry II with his laws, guilds of weavers and cloth fairs. Weavers and skilled
wool laborers were brought in by Edward III. Wool became the staple industry of England and
became the wool–producing country of Europe. In Jamestown, Virginia, one of the American
colonies, sheep raising begin. In an effort to force the colonist to use English cloth, strict English
laws were passed against the exporting of wool which forced the settlers to raise sheep finally
imported by George Washington. He also brought weavers and spinners from England. By
importing Merino sheep in the early 19th century, the existing stock greatly improved. New
England began the first factory of spinning and weaving. As a matter of fact, in 1788 in Hartford,
Connecticut, the first factory using water power to weave wool was established. Not only that,
but was encouraged by tax exemption and a bounty on each yard woven.

The Wool Products Labeling Act of 1939 in the United States states that:
The term “wool” may be applied ONLY to fabrics made entirely of new wool.
The term “reprocessed wool” is ONLY that wool which is recovered from unused articles
and waste.
The term “reused wool” is ONLY that wool from used articles.
Fleece wool is considered to be virgin wool, as salvage wool is considered substandard,
however, salvage wool may be used to add strength to soft new wool or to produce a less
luxurious product.
Today various synthetic fibers have been added as wool imitations and also for blending with
new wool. A substantial amount of wool is produced in the United States today in Texas,
Montana, Wyoming, Utah, Oregon, Idaho, New Mexico, Colorado, California and Ohio. New
England is the center for woolen cloth manufacturing. Australia, Argentina, New Zealand,
Russia, the Republic of South Africa, Uruguay, Great Britain, China and India are other wool
producers.
SWOT Analysis
Strengths
Wool is natural, biodegradable, renewable, low carbon footprint; reduced micron of the wool
clip over time has created the potential for finer, more comfortable products. Merino (wool)
is seen as a luxurious and more comfortable than traditional wool products, and has the
potential to address consumer barriers to consumption,The Woolmark is one of the world‟s
most recognised apparel brand symbols.
Weaknesses
Supply vulnerable to prevailing weather conditions. The flock size has reduced significantly
over the last decade.Other farm activities provide higher and more reliable returns.
Consumers on the whole are ignorant of wool‟s competitive benefits, origins, environmental
credentials.Existing consumer perceptions are dominated by old, unfashionable and

uncomfortable products.Given a long supply chain, wool represents a minor percentage of
final apparel cost, therefore cannot easily impact end consumer price and presentation
Retailers and brands have limited and decreasing knowledge of how to sell wool apparel, and
in many cases how to source fashionable saleable productsThe Woolmark no longer connotes
quality and has lost its connection with consumers and value to some licensees
Opportunities
On farm, there is considerable room for management improvements and greater productivity.
Further progress on predation and infestation will lower costs of production. Natural fibre and
low carbon footprints are relevant competitive benefits for a significant proportion of the market.
Product development and innovation has yielded successes in the challenges facing woven
product consumption. Wool lends itself to greater use in sports and performance apparel, in
particular for its benefits in moisture control, hygiene, temperature regulation and compression.
Brands and retailers are looking for product “stories” and wool has one to tell.Marketing has
changed, with more cost effective targeting now available through digital and some traditional
media. Rebuild perceptions of the Woolmark through attaching relevant fibre and product
information.
Threats
Limited levels of productivity improvement have been evident in wool production, and there is a
need to ensure modern management practices and a market driven perspective are adopted
industry-wide. Labour availability has been restricted and remains under pressure; there is
particular concern for continued availability of shearers and wool classers. Limited early stage
processing in Australia, most now processed in China, with lesser amounts in Eastern Europe
and India. While oil prices have continued to climb, albeit at a slower rate, man made fibres
continue to have a strong price advantage over natural fibres and in particular wool. At less than
2% share of apparel, manufacturers and retailers relegate wool to.niche product offerings.

Transfering Egypt‟s Wool Industry‟s Weaknesses into Indian Wool
Industry‟s Opportunities
Here, by combining the weaknesses of Egypt wool industry and an opportunity of Indian wool
industry we can develop a good business relationship
Egypt not having favorable condition and that prevent the supply of wool, while India having a
favorable demographic condition. So, we can produce wool in India and it will direct send to
Egypt .this is helpful in overcoming the weakness of Egypt wool industry.
In India the malls and retail sector increased so it open an opportunities of new segment for a
woolen clothes.
Indian farmers having a good return in wool sector as other sector of agriculture while in Egypt
the farmers are not getting a good return as other sector of agriculture. so we can use this
weakness of Egypt as opportunity for an India
Egyptian people are dominated by unfathomable and uncomfortable product they are ignorant of
woolen product. so India can use this opportunity by converting unused of wool product in to
user of wool product and create a new segment for a wool product in Egypt. .
Egypt retailer and brand having a less knowledge that how to sell wool and how to source a
fashionable and seasonable product. while India having a good knowledge of generating a
fashionable and seasonable product so we can combine weakness of Egypt and opportunity of
India and develop a good market for a wool product in Egypt.

Table of Content
SR.NO TOPIC PAGE No.
1 Student’s Declaration I
2 Preface II
3 Acknowledgement III
4 Executive Summary IV
5 Introduction 1
5.1 Wool industry in India 4
History 5
Industry structure 7
Processing 9
Import 9
Export 10
Research & Development 11
Constrains faced by wool sector 12
The growth of woolen textile industry in India 14
5.2 Egypt’s wool industry 17
History 18
SWOT analysis 21
PESTEL Analysis 25
Porters Five Forces Model 29
Comparision 33
6 Conclusion XVI
7 Bibliography XVII

1

In Indian the Woollen textiles and clothing industry is relatively small compared to the cotton
and man made fibre based textiles and clothing industry. However, the woollen sector plays an
important role in linking the rural economy with the manufacturing industry, represented by
small, medium and large scale units. The product portfolio is equally divergent from textile
intermediaries to finished textiles, garments, knitwears, blankets, carpets and an incipient
presence in technical textiles. Wool industry is a rural based export oriented industry and caters
to civil and defence requirements for warm clothing.
India has the 3rd largest sheep population country in the world having 6.40 crores sheep
producing 43.30 million kg of raw wool. Out of this about 85% is carpet grade wool, 5% apparel
grade and remaining 10% coarse grade wool for making rough Kambals etc. Average annual
yield per sheep in India is 0.9 Kg. against the world average of 2.4 Kg. A small quantity of
specialty fibre is obtained from Pashmina goats and Angora rabbits. The domestic produce of
wool is not adequate, therefore, the industry is dependent on imported raw material and wool is
the only natural fibre in which the country is deficient.
The woollen industry in the country is of the size of Rs. 10,000 Crore and is broadly divided &
scattered between the organized and decentralized sectors. The organized sector consists of:
Composite mills, Combing units, Worsted and Non Worsted spinning units, Kintwears and
Woven Garments units and Machine Made Carpets manufacturing units. The Decentralized
Sector includes Hosiery and knitting, Power-looms, Hand knotted carpets, Druggets, Namadahs
and Independent dyeing, Process houses and Woollen Handloom Sector.
There are around 958 woollen units in the country, majority of which are in the small scale
sector. The industry has the potential to generate employment in far-flung and diverse regions
and at present provides employment in the organised wool sector to about 12 lakh persons, with
an additional 12 lakh persons associated in the sheep rearing and farming sector. Further, there
are 3.2 lakh weavers in the carpet sector.

During the XIth Five Year Plan period, the Government is implementing (i) Integrated Wool
Improvement & Development Programme (IWIDP), (ii) Quality Processing of Wool and
Woollen Products and (iii) Social Security Scheme for sheep breeders in the country for the
growth and development of the wool and woollen industry. The schemes are being implemented
by the Central Wool Development Board (CWDB), Jodhpur, through State Government
Organizations/Non-Governmental Organizations.


History
India‟s name has always been equal with its Cotton Textile Industry. But few know about the
deep roots of a thriving Woolen Industry way back from the era of Indian Royalty and Mugal
Emperors who have been patrons of Exquisite work of arts ,from finely embroidered,
breathtaking jamavar shawls, to pure wool product, clothes and carpets.
Traditionally, home run handlooms and skilled artisans have formed the basic back bone of
Textiles Industry in India. Manufacture of fine woolen textile products in India has been strong
point of artisan skills of handloom weaver‟s right from Kashmir in the North to various
manufacturing centers in Rajasthan, Punjab, Uttar Pradesh for centuries. Various kinds of
animal hair obtained from hilly terrain were processed and used to
make fine products like shawls, carpets, rugs etc.
During the British government in second half of the 17th century, large amounts of cotton goods
were exported regularly from India. Soon the modern structure of mechanized
Manufacturing of Cotton Textile Industry was followed by the Woolen Textile Industry
successively.
However, establishment of mechanized mill in Woolen Sector was relatively late and possibly
the first mill was „Lallmli‟ of British India Corporation set up in Kanpur.
The modern industry followed growth in center like Thane, Mumbai, Jamnagar, Vadodara in
West and Dhariwal, Amritsar, Panipat, Ludhiana in the North.
In the after that part of the 20th Century saw creation of new facilities in Mysore, Raipur and
Nagpur. Other than that new investment in green ground large projects remain insignificant.
Instead the investment in this sector was more focused on existing sites to modernize and
expand.
In the early stage of development, production was confined for path to medium qualities mostly
for the requirement of defence department. Requirement for fine variety of woll and worsted
fabric were met through imports mostly from U.K.
Post independence, economics policies led to rapid growth of woollen textile manufacture in the
organized sector and mushrooming of small to medium sized units all over India producing all
kinds of wool products, knitwear, hosiery and woollen blazer fabrics followed by blankets.
The middle of 20th century eventually saw imports being almost stopped and domestic
production keeping pace with local demand followed by product innovation and introduction of
latest technology for processing of greasy wool from Australia to finished products.
Today in this new century the woolen sector of the Indian Textile Industry has many big brands
names on its horizon. The woolen industry deserves a special mention for creating the concept of
brand marketing on the national scale in the textile field. Some of the brands have been
successful to create a mark even outside Indian boundary.
Size and structure of the industry
The Indian textile industry is fragmented, with only a few large players and numerous small and
medium-size companies. The industry‟s size is estimated at US$ 55 bn with 64% of the
companies catering to domestic demand. The textiles industry provides direct employment to
more than 35 mn people and indirect employment to 47 mn people. In addition, the industry
generates significant employment through forward and backward linkages, both in traditional
(production of cotton and other natural fibres) and modern activities (textile design, etc). In fact,
the textiles industry is the second-largest.
employment generator after agriculture.
The clothing sector is the final stage of the textiles value chain, with maximum value addition at
this level. It is a low investment and high labour-intensive industry; an investment of ` 0.1 mn
creates 6 to 8 jobs. The industry employs around 5 mn workers, of which, around 2.5 mn are in
the export sector. The clothing industry consists mainly of knitted and woven garment segments.
This industry is fragmented and is predominantly in the small scale sector.
Apparel clusters in India

The apparel industry is concentrated mainly in eight clusters: Tirupur, Ludhiana, Bengaluru,
Delhi/Noida/Gurgaon, Mumbai, Kolkata, Jaipur and Indore. While Tirupur, Ludhiana and
Kolkata are major centres for knitwear, Bengaluru, Delhi/Noida/Gurgaon, Mumbai, Jaipur and
Indore are major hubs for woven garments.
Industry structure
The textiles sector in India comprises both organised and unorganised segments. More than 70
textile and clothing clusters account for about 80% of total production in the country. There are
nearly 40 powerloom clusters in the country. Major states with a number of clusters are
Maharashtra, Tamil Nadu, Andhra Pradesh, Karnataka, Kerala and Uttar Pradesh. The textiles
industry is extremely diversified with hand-spun and hand-woven sectors at one end and the
capital-intensive, sophisticated mill sector at the other. The de-centralised powerloom/hosiery
and knitting sectors form the largest section of the textiles industry. Major sub-sectors of the
textiles sector are organised cotton/man-made fibre textiles mills, man-made fibre/filament yarn,
wool and woolen textiles, sericulture and silk textiles, handlooms, handicrafts, jute and jute
textiles and textiles exports.
WOOL PRODUCTION & CONSUMPTION
The total wool production in India is not enough to meet the total requirement of raw wool
for woolen industry. The bulk of Indian wool is of coarse quality and is used mostly in the
hand-made carpet industry. Since indigenous production of fine quality wool required by the
organized mills and decentralized hosiery sector is very limited, India depends almost
exclusively on import.

Production of
indigenous wool:
Year
Production
Quantity
(in million kg.)
2004-05 44.60 Mn Kg.
2005-06 44.90 Mn Kg.
2006-07 45.10 Mn Kg.
2007-08 44.00 Mn Kg.
2008-09 42.90 Mn Kg.
2009-10 43.20 Mn Kg.
2010-11 43.30 Mn. Kg.
(Source: Ministry of Agriculture, Deptt. of Animal Husbandry)
Top 7 carpet grade wool producing states
SN States Wool Production
(Qty. in 000 Kg.)
1 Rajasthan 12529
2 Jammu &
Kashmir
7300
3 Karnataka 7165
4 Andhara Pradesh 4605
3 Gujarat 2919
4 Maharashtra 1726
5 Himachal
Pradesh
1614
(Source : Animal Husbandry Deptt., Ministry of Agri.)

PROCESSING
The Woollen industry suffers from inadequate and outdated processing facilities. The pre-loom and
post-loom facilities are required to be modernized for ensuring quality finished products. Quality
finishing of the woollen products will not only increase use of indigenous wool but will also make
the product more competitive in the international market. It will also assist in procuring better price
for wool growers and will make quality raw material available to the Khadi and Handloom sector.
Owing to overall size of the woollen industry and specialized nature of equipments required for
processing, the industry has been dependent on imported plant and machinery except for few
complimentary equipments from local sources. Machinery required for processing from raw wool
fibre to fabrics followed by knitting and garmenting, is mostly imported from European countries,
USA and Japan. The industry may need an investment of Rs.5,000 crores worth of plant and
equipment in the course of next 5 years for modernization and capacity expansion.
IMPORT
The production of wool in the country is not sufficient to meet the demand of the wool industry
particularly of apparel sector and most of it is being imported from Australia, New Zealand and many
other countries. The present requirement of different segments of Indian woollen industry is likely to
grow further because of higher domestic as well as export need of woollen items. The country which
had strong position in quality carpet wool production is becoming dependent on import, as
requirement is growing at higher pace as compared to growth in production.
There has been a shift from imports of fine quality wool to low quality wool in recent years. This is
on account of consumer preference for hand tufted carpets in the US and other western markets.

Cheap wool import from the Middle East is also constantly growing and is mixed with indigenous
wool to make hand tufted carpets.
Import of raw wool from Australia, New Zealand and many other countries
are as under:
Year Qty. (in million kgs.) Value (Rs. in crore)
2003-04 84.61 870.61
2004-05 80.47 825.95
2005-06 91.22 885.81
2006-07 99.56 1077.45
2007-08 93.07 1089.51
2008-09 65.73 1031.86
2009-10 68.26 1000.77
2010-11 94.46 1418.93
2011-12 ( Upto
Nov. 2011)
53.08 1282.59
(Source: DGCI&S, Calcutta)
EXPORT
India exports various woollen products like tops, yarn, fabrics, Ready Made Garments and
carpets. Carpets enjoys maximum share of total export. The aggregate export of woollen items
from wool tops to finished products like textiles, clothing, blankets and carpets is currently
estimated around Rs. 7000 Crs.

During the 11th Plan period, the growth was hindered owing to variety of factors. However there
are good opportunities for export growth. Primary sectors which can look forward for export
growth are textiles, woven clothings, knitwears and carpets. In order to build growth tempo, the
action for reform should be expedited which may also attract FDI to reinforce export outlook
through joint ventures for better access to major markets.
Export to major countries Woolen Yarn, Fabrics, Made Ups
SN Country Value in Lakhs
1 United Kingdom 6583.00
2 Italy 5185.00
3 Dominic Rep 2616.40
4 China 2123.17
5 USA 1958.35
RESEARCH & DEVELOPMENT
Research & Development activities should be promoted in the country to help the wool industry
to adopt regular system of quality control and maintain the quality of products, to render
technical and trouble shooting services with reference to selection of raw material, controlling
various adjusting equipments and reducing the cost of production and improving the quality of
product.
Investment in R&D activities would help in following way
Development of new products based on latest techniques in mechanical and chemical processing
of wool and transfer the knowhow to the industry.

Study and provide Research & Development facilities for testing of properties of various
products like fiber, yarn and fabric stages including intermediate stages.
The provision of services in quality assurance and testing to the organized sector.
The provision of services to the decentralized industry, which uses significant Australian wool
in small enterprises where the sophistication of equipment and machinery is much lower than
that of the “organised” sector.
Offer technical training and suitable courses to support industry‟s need of
technological/supervisory training for constant upgradation of technical knowhow.
Organizing regular workshops and seminars with the participation of industry experts from India
as well as overseas in the field of wool technology for the dissemination of the latest
development.
STRENGTHING OF CENTRAL WOOL DEVELOPMENT BOARD
The Central wool Development Board has been assigned the functions of promoting growth and
development of wool and woolen products, market intelligence, marketing of wool & woolens,
price stabilization, standardization of wool and woolen products, quality control, dissemination
of information, product diversification, advise to government on policy matters, coordination etc.
CONSTRAINS FACED BY WOOL SECTOR
1. Raw Wool Production
- Low priority of State Governments in development of wool sector.
- Lack of awareness, traditional management practices, and lack of education and poor
economic conditions of woolgrowers.
- Shortage of pasture land which force breeders to migrate their flock from one area to
another throughout the year.
- Uneconomical return of the produces to sheep breeders i.e. sale of raw wool, live sheep,
manure, milk, mutton, skin etc.
- Lack of motivation for adopting modern methods of sheep management, machine
shearing of sheep, washing & grading of raw wool etc.
- Inadequate production and processing facilities of specialty fibres i.e. Pashmina goat
wool and Angora rabbit wool.
2. Marketing of Raw Wool
- Inadequate marketing facilities and infrastructure.
- Ineffective role of state wool marketing organizations in wool producing States.
- Absence of organized marketing and minimum support price system for ensuring
remunerative return.
- Minimum return earned from sale of wool by wool growers.
3. Processing of Wool
- Inadequate quantity of quality raw wool.
- Out dated and inadequate pre-loom & post-loom processing facilities.
- Inadequate dyeing facilities in wool potential areas.
- Need of designing & diversification of woolen handloom products.
- Dearth of technicians & trained manpower.
- Inadequate testing facilities and quality control measures.
- Transfer of technology is inadequate.
- Lack of operational and technical bench marks.
4. Education, Research & Development, Human Resource Development
- No educational institute for wool technology resulting lack of expertise in wool sector.
- Inadequate database.
- Need of R&D work on blending of raw wool with other fibres & diversification of
woollen products.
- Lack of R&D work for value addition to Deccani wool produced in Southern region.
CENTRAL WOOL DEVELOPMENT BOARD (CWDB), JODHPUR
The Central Wool Development Board, Jodhpur was constituted by the Government of India,
Ministry of Textiles in 1987 with the primary objective of development of wool and woollen
textiles in the country by undertaking programmes to support various wool development
activities. The Board has undertaken various projects mainly in the wool growing States.
For the XIth Five Year Plan, the Board has undertaken following schemes under fully funded
Central Sector Scheme to support different wool development activities and to provide support to
the entire chain from shepherds to the end use of wool :
1. Integrated Wool Improvement and Development Programme (IWIDP) :
- Sheep and Wool Improvement Scheme (SWIS)
- Angora Wool Development Scheme
- Pashmina Wool Development Scheme
- Human Resource Development & Promotional activities.
2. Quality Processing of Wool and Woollen Products :
- Setting up of Common Facility Centre for wool scouring, carbonizing, carding, dying, Spinning
etc. (Pre-loom processing activity)
- Setting up of Woollen Shawl/Carpet Finishing Centre (Post-loom processing activity)
3. Social Security Scheme for Sheep Breeders :
- Sheep Breeders Insurance Scheme (Kendriya Bhed Palak Bima Yojana)

- Sheep Insurance Scheme (Kendriya Bhed Bima Yojana)
The growth of Woollen Textile Industry in India
Woolen textile industry is one of the oldest industries of India. The Aryans knew the use of wool
as far back as 5000 B.C.
Woollen textile manufacturing was a handiwork and then a cottage industry run on very small
scale during the historical times. The Indian blankets, lohis, 'nomads', shawls etc. were popular in
different countries in the past. The first woollen mill 'Lalimli' was set up at Kanpur in 1876.
Later in 1881 in Punjab (Dhariwal) another woollen mill was started. Mumbai in 1882 and
Bangalore in 1886 followed suit. The industry developed steadily with the increase in population
in the country.
A current survey shows that presently, there are over 625 big and small woollen mills extend
over the different parts of the country. There are thousands of hosiery units in the country
manufacturing a variety of woollens.
The major concentration of the industry is in Punjab, Maharashtra and U.P these states produce
75% of the total output.
Gujarat, Karnataka, West Bengal and J & K also have woollen mills.
Punjab .
Punjab is the leader. There are over 250 small woollen mills in Punjab. Dhariwal in Gurdaspur
district, which is an old centre of the industry, is well known. Amritsar and Ludhiana are other
centres. The industry depends upon wool from H.P, J 8c K and Australia. The industry gets
power from Bhalcra Dam. Labour is available in these centres.
Maharashtra.
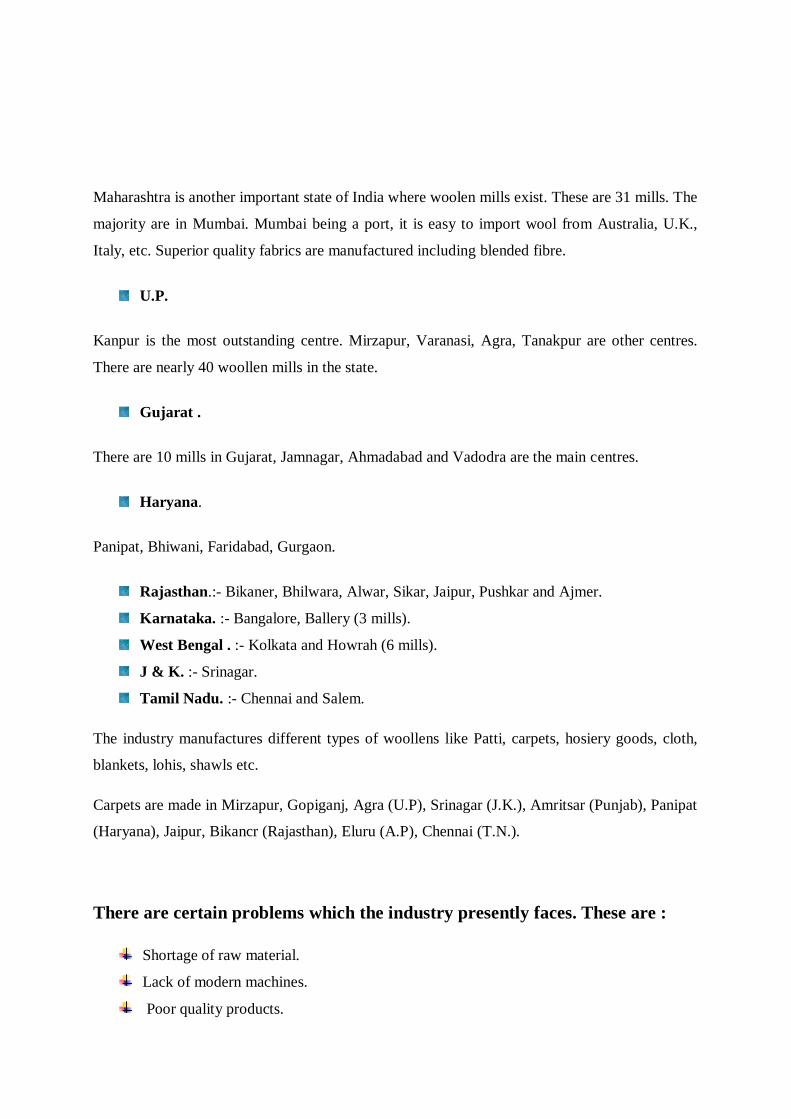
Maharashtra is another important state of India where woolen mills exist. These are 31 mills. The
majority are in Mumbai. Mumbai being a port, it is easy to import wool from Australia, U.K.,
Italy, etc. Superior quality fabrics are manufactured including blended fibre.
U.P.
Kanpur is the most outstanding centre. Mirzapur, Varanasi, Agra, Tanakpur are other centres.
There are nearly 40 woollen mills in the state.
Gujarat .
There are 10 mills in Gujarat, Jamnagar, Ahmadabad and Vadodra are the main centres.
Haryana.
Panipat, Bhiwani, Faridabad, Gurgaon.
Rajasthan.:- Bikaner, Bhilwara, Alwar, Sikar, Jaipur, Pushkar and Ajmer.
Karnataka. :- Bangalore, Ballery (3 mills).
West Bengal . :- Kolkata and Howrah (6 mills).
J & K. :- Srinagar.
Tamil Nadu. :- Chennai and Salem.
The industry manufactures different types of woollens like Patti, carpets, hosiery goods, cloth,
blankets, lohis, shawls etc.
Carpets are made in Mirzapur, Gopiganj, Agra (U.P), Srinagar (J.K.), Amritsar (Punjab), Panipat
(Haryana), Jaipur, Bikancr (Rajasthan), Eluru (A.P), Chennai (T.N.).
There are certain problems which the industry presently faces. These are :
Shortage of raw material.
Lack of modern machines.
Poor quality products.

Lack of market due to tropical and sub-tropical climate of the country.
Low production

History
Did You Know?
The best Cashmere Wool is really from a Cashmere Goat. Most goats produce cashmere fiber to
some degree, however the Cashmere goat has been specially breed to produce a much higher
amount of it.
The Angora goat produces long, curling, lustrous locks of mohair. The complete body of the goat
is covered with mohair. The locks constantly grow and can be four inch or more in length.

Angora wool or Angora fiber refers to the downy coat produced by the Angora rabbit. While
their names are similar, Angora fiber is distinct from mohair, which comes from the Angora
goat. Angora is known for its softness and what knitters refer to as a halo (fluffiness). It is also
known for its silky texture.
A Bit O'History about Wool
When we think of knitting, or any ability that uses yarn, we think of wool. Wool, by definition, is
the fiber made from the cheat of domestic sheep. relations of the domestic sheep had long hair
and a soft, soft basecoat. Over the years of domesticating the sheep through breeding, feed,
climate and herding, wool was probably the first fiber to be woven into a textile. I've always
found this process exciting especially because it began so long ago.
Fragments of wool have been found in the tombs and ruins of Egypt, Nineveh, and Babylon, and
also among relics of the Peruvians. As near the beginning as 200 BC, the Romans began to
improve their flock by domestication and herding. Today these sheep are known as the famed
Spanish Merino Sheep.
A factory at Winchester, established by the Romans, improved the methods by the Britons, who
kept sheep and weave wool long before the Roman attack. Skilled Flemish weavers were brought
in by William the captor. Wool industries were encouraged by Henry II with his laws, guilds of
weavers and cloth fairs. Weavers and skilled wool laborers were brought in by Edward III. Wool
became the staple industry of England and became the wool–producing country of Europe.

In Jamestown, Virginia, one of the American colonies, sheep raising begin. In an effort to force
the colonist to use English cloth, strict English laws were passed against the exporting of wool
which forced the settlers to raise sheep finally imported by George Washington. He also brought
weavers and spinners from England. By importing Merino sheep in the early 19th century, the
existing stock greatly improved. New England began the first factory of spinning and weaving.
As a matter of fact, in 1788 in Hartford, Connecticut, the first factory using water power to
weave wool was established. Not only that, but was encouraged by tax exemption and a bounty
on each yard woven.
The Wool Products Labeling Act of 1939 in the United States states that:
The term “wool” may be applied ONLY to fabrics made entirely of new wool.
The term “reprocessed wool” is ONLY that wool which is recovered from unused articles
and waste.
The term “reused wool” is ONLY that wool from used articles.
Fleece wool is considered to be virgin wool, as salvage wool is considered substandard,
however, salvage wool may be used to add strength to soft new wool or to produce a less
luxurious product.
Today various synthetic fibers have been added as wool imitations and also for blending with
new wool. A substantial amount of wool is produced in the United States today in Texas,
Montana, Wyoming, Utah, Oregon, Idaho, New Mexico, Colorado, California and Ohio.

New England is the center for woolen cloth manufacturing. Australia, Argentina, New Zealand,
Russia, the Republic of South Africa, Uruguay, Great Britain, China and India are other wool
producers.


SWOT Analysis of Wool Industry
Strengths
1. Wool is natural, biodegradable, renewable, low carbon footprint,
2. Reduced micron of the wool clip over time has created the potential for finer, more
comfortable products,
3. Merino (wool) is seen as a luxurious and more comfortable than traditional wool
products, and has the potential to address consumer barriers to consumption,
4. The Woolmark is one of the world‟s most recognised apparel brand symbols.
Weaknesses
1. Supply vulnerable to prevailing weather conditions. The flock size has reduced
significantly over the last decade
2. Other farm activities provide higher and more reliable returns
3. Consumers on the whole are ignorant of wool‟s competitive benefits, origins,
environmental credentials
4. Existing consumer perceptions are dominated by old, unfashionable and uncomfortable
products
5. Given a long supply chain, wool represents a minor percentage of final apparel cost,
therefore cannot easily impact end consumer price and presentation
6. Retailers and brands have limited and decreasing knowledge of how to sell wool apparel,
and in many cases how to source fashionable saleable products
7. The Woolmark no longer connotes quality and has lost its connection with consumers
and value to some licensees

Opportunities
1. On farm, there is considerable room for management improvements and greater
productivity
2. Further progress on predation and infestation will lower costs of production
3. Natural fibre and low carbon footprints are relevant competitive benefits for a significant
proportion of the market
4. Product development and innovation has yielded successes in the challenges facing
woven product consumption
5. Wool lends itself to greater use in sports and performance apparel, in particular for its
benefits in moisture control, hygiene, temperature regulation and compression
6. Brands and retailers are looking for product “stories” and wool has one to tell
7. Marketing has changed, with more cost effective targeting now available through digital
and some traditional media
8. Rebuild perceptions of the Woolmark through attaching relevant fibre and product
information
Threats
1. Limited levels of productivity improvement have been evident in wool production, and
there is a need to ensure modern management practices and a market driven perspective
are adopted industry-wide
2. Labour availability has been restricted and remains under pressure; there is particular
concern for continued availability of shearers and wool classers
3. Limited early stage processing in Australia, most now processed in China, with lesser
amounts in Eastern Europe and India
4. While oil prices have continued to climb, albeit at a slower rate, man made fibres
continue to have a strong price advantage over natural fibres and in particular wool
5. At less than 2% share of apparel, manufacturers and retailers relegate wool to
6. niche product offerings


What is PEST Analysis ?
PEST stands for the analysis of the external factors which is beneficial
when conducting research before beginning a new project or to help
conduct market research. These factors are:
Political – Laws, global issues, legislation and regulations which
may have an effect on your business either immediately or in the
future.
Economic – Taxes, interest rates, inflation, the stock markets and
consumer confidence all need to be taken into account.
Social – The changes in lifestyle and buying trends, media, major
events, ethics, advertising and publicity factors.
Technological – Innovations, access to technology, licencing and
patents, manufacturing, research funding, global communications.
Pest can also be known as PESTLE which includes other factors such
as:
Legal – Legislation which have been proposed and may come into
effect and any passed legislation‟s.
Environmental – Environmental issues either locally or globally
and their social and political factors.
Unlike SWOT this strategy is more directly aimed at the external macro
environmental factors that might be affecting the position of your
business, the reasons behind growth or decline in the market and also
identify new directions for the business as a whole. Creately has some
excellent PEST analysis templates for you to get started instantly.


Understanding the Tool
Five Forces Analysis assumes that there are five important forces that determine competitive
power in a business situation. These are:
1. Supplier Power: Here you assess how easy it is for suppliers to drive up prices. This is
driven by the number of suppliers of each key input, the uniqueness of their product or
service, their strength and control over you, the cost of switching from one to another,
and so on. The fewer the supplier choices you have, and the more you need suppliers'
help, the more powerful your suppliers are.
2. Buyer Power: Here you ask yourself how easy it is for buyers to drive prices down.
Again, this is driven by the number of buyers, the importance of each individual buyer
to your business, the cost to them of switching from your products and services to
those of someone else, and so on. If you deal with few, powerful buyers, then they are
often able to dictate terms to you.
3. Competitive Rivalry: What is important here is the number and capability of your
competitors. If you have many competitors, and they offer equally attractive products
and services, then you'll most likely have little power in the situation, because suppliers
and buyers will go elsewhere if they don't get a good deal from you. On the other hand,
if no-one else can do what you do, then you can often have tremendous strength.
4. Threat of Substitution: This is affected by the ability of your customers to find a
different way of doing what you do – for example, if you supply a unique software
product that automates an important process, people may substitute by doing the
process manually or by outsourcing it. If substitution is easy and substitution is viable,
then this weakens your power.

5. Threat of New Entry: Power is also affected by the ability of people to enter your
market. If it costs little in time or money to enter your market and compete effectively,
if there are few economies of scale in place, or if you have little protection for your key
technologies, then new competitors can quickly enter your market and weaken your
position. If you have strong and durable barriers to entry, then you can preserve a
favorable position and take fair advantage of it.


Comparison of weaknesses of Egypt wool Industry with
opportunities of Indian wool Industry
WEAKNESSES OF EGYPT WOOL INDUSTRY:
Supply vulnerable to prevailing weather conditions. The flock size has reduced
significantly over the last decade
Other farm activities provide higher and more reliable returns
Consumers on the whole are ignorant of wool‟s competitive benefits, origins,
environmental credentials
Existing consumer perceptions are dominated by old, unfashionable and uncomfortable
products
Given a long supply chain, wool represents a minor percentage of final apparel cost,
therefore cannot easily impact end consumer price and presentation
Retailers and brands have limited and decreasing knowledge of how to sell wool apparel,
and in many cases how to source fashionable saleable products
The Wool mark no longer connotes quality and has lost its connection with consumers
and value to some licensees
OPPORTUNITIES OF INDIAN WOOL INDUSTRY
Favorable demographics in the domestic market; increasing young
Population coupled with rising income levels

Emergence of retail industry as a whole and development of various
malls provide huge opportunities for the apparel segments
Opportunities in product diversification (for e.g, Technical Textiles)
Change in consumption pattern, including rising demand for high quality
Premium fabrics and development of various products cater to global needs
Increasing working female population with higher propensity to spend
Compared with home keep
Replacement of the Multi Fiber Agreement (MFA) and integration of the
Textile industry resulting in huge opportunities for exports. Moreover,
Gradual development in the technical side of the industry provides an
Opportunity
Transfering Egypt’s Wool Industry’s Weaknesses into
Indian Wool Industry’s Opportunities
Here, by combining the weaknesses of Egypt wool industry and an opportunity of Indian wool
industry we can develop a good business relationship
Egypt not having favorable condition and that prevent the supply of wool, while India
having a favorable demographic condition. So, we can produce wool in India and it will
direct send to Egypt .this is helpful in overcoming the weakness of Egypt wool industry.
In India the malls and retail sector increased so it open an opportunities of new segment
for a woolen clothes.
Indian farmers having a good return in wool sector as other sector of agriculture while in
Egypt the farmers are not getting a good return as other sector of agriculture. so we can
use this weakness of Egypt as opportunity for an India
Egyptian people are dominated by unfathomable and uncomfortable product they are
ignorant of woolen product. so India can use this opportunity by converting unused of
wool product in to user of wool product and create a new segment for a wool product in
Egypt.
.
Egypt retailer and brand having a less knowledge that how to sell wool and how to source
a fashionable and seasonable product. while India having a good knowledge of
generating a fashionable and seasonable product so we can combine weakness of Egypt
and opportunity of India and develop a good market for a wool product in Egypt.

CONCLUSION
- Egypt not having favorable condition and that prevent the supply of wool, while India
having a favorable demographic condition. So, we can produce wool in India and it will
direct send to Egypt .this is helpful in overcoming the weakness of Egypt wool industry.
- In India the malls and retail sector increased so it open an opportunities of new segment
for a woolen clothes.
- Indian farmers having a good return in wool sector as other sector of agriculture while in
Egypt the farmers are not getting a good return as other sector of agriculture. so we can
use this weakness of Egypt as opportunity for an India
- Egyptian people are dominated by unfathomable and uncomfortable product they are
ignorant of woolen product. so India can use this opportunity by converting unused of
wool product in to user of wool product and create a new segment for a wool product in
Egypt.
- Egypt retailer and brand having a less knowledge that how to sell wool and how to source
a fashionable and seasonable product. while India having a good knowledge of
generating a fashionable and seasonable product so we can combine weakness of Egypt
and opportunity of India and develop a good market for a wool product in Egypt.

BIBLIGORAPHY
1. WWW.SOOPLE.COM
2. http://www.eeaa.gov.eg/ecc/ClimateBackground.htm
3. http://www.alarabiya.net/articles/2011/08/10/161719.html
4. http://www.hsmemagazine.com/regulation.php?regulation_id=12
5. http://www.legal500.com/c/egypt/developments/2903
6. http://www.eeaa.gov.eg
7. https://www.google.co.in/search?q=top+5+company+in+wool+industry+in+india&ie=utf
-8&oe=utf-8&aq=t&rls=org.mozilla:en-US:official&client=firefox-a&safe=on&safe=on
8. Mindtools.com
9. http://www.india-crafts.com/business-reports/indian-textile-industry/woolen-textile-
sector.htm

10. http://www.wikiwealth.com/commodity:wool
11. http://www.wikiwealth.com/swot-analysis:wool