Polarizable Empirical Force Field for Aromatic Compounds Based on the Classical Drude Oscillator
32
Polarizable Empirical Force Field for Aromatic Compounds Based on the Classical Drude Oscillator Pedro E. M. Lopes 1 , Guillaume Lamoureux 2 , Benoit Roux 2 , and Alexander D. MacKerell Jr. 1,* 1 Department of Pharmaceutical Sciences, School of Pharmacy, University of Maryland, Baltimore, Maryland 21201 2 Institute for Molecular Pediatric Sciences, University of Chicago, Chicago, Illinois, 60637 Abstract The polarizable empirical CHARMM force field based on the classical Drude oscillator has been extended to the aromatic compounds benzene and toluene. Parameters were optimized for benzene and then transferred directly to toluene, with parameters for the methyl moiety of toluene taken from the previously published work on the alkanes. Optimization of all parameters was performed against an extensive set of quantum mechanical and experimental data. Ab initio data was used for determination of the electrostatic parameters, the vibrational analysis, and in the optimization of the relative magnitudes of the Lennard-Jones parameters. The absolute values of the Lennard-Jones parameters were determined by comparing computed and experimental heats of vaporization, molecular volumes, free energies of hydration and dielectric constants. The newly developed parameter set was extensively tested against additional experimental data such as vibrational spectra in the condensed phase, diffusion constants, heat capacities at constant pressure and isothermal compressibilities including data as a function of temperature. Moreover, the structure of liquid benzene, liquid toluene and of solutions of each in water were studied. In the case of benzene, the computed and experimental total distribution function were compared, with the developed model shown to be in excellent agreement with experiment. Introduction Aromatic compounds, of which benzene may be considered the parent, play a central role in the chemical industry as well as in biological systems. These include a series of hydrocarbons known as the benzene series, formed by the substitution of methyl groups, CH 3 , for the hydrogen atoms of the benzene molecule. Based on their general importance, aromatic compounds have been subjected to a multitude of studies in all phases: crystalline, liquid and gaseous. The use of spectroscopic methods is ubiquitous, and different techniques ranging from neutron scattering 1–4 , and nuclear spin resonance 5 to both linear 6–9 and non-linear 10–15 spectroscopies have been applied to study this class of compounds. A current trend is the use of spectroscopic techniques in condensed phases, with the spectroscopic intensities, line shapes and widths related to the structure and dynamics of the liquids. 6–15 In fact, in the condensed phase it is these properties, together with the line position, that are particularly sensitive to both the static and dynamic environment of a given molecule. Understanding such properties requires probing the structure and motion of the fluid at a molecular level, information that can typically only be obtained from theoretical approaches. * To whom correspondence should be addressed, [email protected]. NIH Public Access Author Manuscript J Phys Chem B. Author manuscript; available in PMC 2008 August 22. Published in final edited form as: J Phys Chem B. 2007 March 22; 111(11): 2873–2885. NIH-PA Author Manuscript NIH-PA Author Manuscript NIH-PA Author Manuscript
Transcript of Polarizable Empirical Force Field for Aromatic Compounds Based on the Classical Drude Oscillator

Polarizable Empirical Force Field for Aromatic Compounds Basedon the Classical Drude Oscillator
Pedro E. M. Lopes1, Guillaume Lamoureux2, Benoit Roux2, and Alexander D. MacKerell Jr.1,*
1 Department of Pharmaceutical Sciences, School of Pharmacy, University of Maryland, Baltimore, Maryland21201
2 Institute for Molecular Pediatric Sciences, University of Chicago, Chicago, Illinois, 60637
AbstractThe polarizable empirical CHARMM force field based on the classical Drude oscillator has beenextended to the aromatic compounds benzene and toluene. Parameters were optimized for benzeneand then transferred directly to toluene, with parameters for the methyl moiety of toluene taken fromthe previously published work on the alkanes. Optimization of all parameters was performed againstan extensive set of quantum mechanical and experimental data. Ab initio data was used fordetermination of the electrostatic parameters, the vibrational analysis, and in the optimization of therelative magnitudes of the Lennard-Jones parameters. The absolute values of the Lennard-Jonesparameters were determined by comparing computed and experimental heats of vaporization,molecular volumes, free energies of hydration and dielectric constants. The newly developedparameter set was extensively tested against additional experimental data such as vibrational spectrain the condensed phase, diffusion constants, heat capacities at constant pressure and isothermalcompressibilities including data as a function of temperature. Moreover, the structure of liquidbenzene, liquid toluene and of solutions of each in water were studied. In the case of benzene, thecomputed and experimental total distribution function were compared, with the developed modelshown to be in excellent agreement with experiment.
IntroductionAromatic compounds, of which benzene may be considered the parent, play a central role inthe chemical industry as well as in biological systems. These include a series of hydrocarbonsknown as the benzene series, formed by the substitution of methyl groups, CH3, for thehydrogen atoms of the benzene molecule. Based on their general importance, aromaticcompounds have been subjected to a multitude of studies in all phases: crystalline, liquid andgaseous. The use of spectroscopic methods is ubiquitous, and different techniques ranging fromneutron scattering1–4, and nuclear spin resonance5 to both linear6–9 and non-linear10–15spectroscopies have been applied to study this class of compounds.
A current trend is the use of spectroscopic techniques in condensed phases, with thespectroscopic intensities, line shapes and widths related to the structure and dynamics of theliquids.6–15 In fact, in the condensed phase it is these properties, together with the line position,that are particularly sensitive to both the static and dynamic environment of a given molecule.Understanding such properties requires probing the structure and motion of the fluid at amolecular level, information that can typically only be obtained from theoretical approaches.
* To whom correspondence should be addressed, [email protected].
NIH Public AccessAuthor ManuscriptJ Phys Chem B. Author manuscript; available in PMC 2008 August 22.
Published in final edited form as:J Phys Chem B. 2007 March 22; 111(11): 2873–2885.
NIH
-PA Author Manuscript
NIH
-PA Author Manuscript
NIH
-PA Author Manuscript
The availability of information from computational studies may be used retrospectively tointerpret the spectroscopic parameters.
First-principles ab initio calculations16,17 have been extensively used to study both groundand excited state properties in the gas phase. A recent review of the latest developments in abinitio computational studies of aromatic compounds can be found in ref 18. Going beyond gasphase theoretical studies via ab initio methods are a variety of condensed phase simulationstudies of aromatic compounds using molecular dynamics (MD)4,19–29 or Monte-Carlo30,31 methods often based on empirical force fields, typically making use of nonpolarizable oradditive models.27,32–34 These models have proved their usefulness by accuratelyreproducing a variety of experimental observables including phase change properties, freeenergies of solvation, transport properties and structural properties of the fluids or solids.Examples of additive models include the CHARMM,35 GROMOS,36 OPLS,32 andAMBER37 force fields, among others. The majority of these force fields have been optimizedbased on the reproduction of experimental enthalpies of vaporization and densities, aspioneered by Jorgensen.38 Further improvements in additive models have included theincorporation of free energies of hydration in the target data39–41 and MacKerell and co-workers have introduced a protocol for Lennard-Jones (LJ) parameter optimization using acombined ab initio/empirical approach that provides better balanced LJ parameters.39 Suchadvances are expected to further improve the accuracy of additive force fields, although thelimitation associated with the additive approximation in the treatment of electrostatics willhinder significant further development of such models.
Empirical models of aromatic molecules using non-additive, polarizable models are still scarcein the literature and, to date, have not demonstrated any substantial changes in the molecularproperties over the traditional additive force fields.34,42 These studies made use of fluctuatingcharge models to treat the explicit polarizability. Heats of vaporization and molecular volumeswere used for the optimization of those force fields; however, additional validation of themodels using a wider range of condensed phase properties was not performed.
The present study is a continuation of our ongoing effort towards development of a polarizableempirical force field for biological molecules. In the present model electronic polarizability isintroduced via a classical Drude oscillator,43–50 which allows for the nonadditivity to betreated via auxiliary particles attached to the atomic centers of the system. An extendedLagrangian for use in MD simulations using the Drude model has been presented50 and watermodels, referred to as SWM4-DP51 and SWM4-NDP52, have been developed and shown toreproduce a variety of experimental condensed phase properties including the dielectric andself-diffusion constants. In these water models the polarizability is treated via the use of aDrude particle on only the oxygen, laying the groundwork for a force field that includespolarizability only on non-hydrogen atoms. Beyond development of the water models, Drudebased force fields for ethanol53 and alkanes54 have been presented. In addition, a generalmethod for the determination of the partial atomic charges and polarizabilities has beenpresented and applied to develop a preliminary model of DNA that was shown to be stable ina 1 ns MD simulation that included explicit solvent and sodium counterions.55
In the present paper, a novel force field for the aromatic compounds benzene and toluene basedon a polarizable potential energy function in the context of the classical Drude oscillator ispresented. It is shown that a variety of experimental and QM target data are accuratelyreproduced by the force field, including condensed phase properties. In addition, to better putthe present force field in the context of previously published CHARMM additive force fields,results from the CHARMM22 (C22) force field are presented.35
Lopes et al. Page 2
J Phys Chem B. Author manuscript; available in PMC 2008 August 22.
NIH
-PA Author Manuscript
NIH
-PA Author Manuscript
NIH
-PA Author Manuscript

Computational MethodsQM calculations were performed with the Gaussian 03 suite of programs.56 Geometryoptimizations were performed at the MP2(fc)/6-31G(d) level of theory. This level of theoryprovides molecular geometries consistent with available gas phase experimental data (see theSupporting Information) and it has been previously utilized during optimization of the latestversion of the latest all-atom additive CHARMM force field (CHARMM27).57,58 QMcalculations of the molecular electrostatic potentials (ESP) were performed on MP2 optimizedgeometries using the B3LYP hybrid functional59,60,61 and the correlation-consistent double-ζ Dunning aug-cc-pVDZ basis set,62 as previously discussed.54 Single-point energy B3LYPcalculations were performed with the tight convergence criteria producing the target QM ESPmaps. QM calculations on the complexes with rare gas atoms were performed at the MP3/6-311++G(3d,3p) level39 and vibrational analysis was performed at the MP2/6-31G* level followedby scaling of the frequencies by 0.9434.63 Potential energy distributions of the normal modeswere performed as previously published.64
Empirical force field calculations were performed with the program CHARMM.65,66 Thesimple functional form of the potential energy function from the pairwise additive CHARMMall-atom force field66 was used with polarizability introduced using the classical Drudeoscillator model with some modification. In the classical Drude oscillator model thepolarizability is introduced by adding massless charged particles attached to polarizable atoms(e.g., only non-hydrogen atoms in the present model) via a harmonic spring with the forceconstant kD. The partial atomic charge of a polarizable atom q is redistributed between theDrude particle and atomic core. The sign of the charges on Drude particles qD has minimalimpact due to the point dipole approximation; qD is chosen to be negative by analogy with theelectron charge.67 The magnitudes of qD can be unambiguously determined from the atomicpolarizabilities using the relationship α =qD
2/kD. The charge on the atomic core qc is determinedby subtracting the Drude charge from the charge on the atom-Drude pair q, such that eachatom-Drude pair forms a dipole qD·d, where d is the displacement vector going from the atomto its Drude particle. Thus, the electrostatic energy term in the additive potential energy functionwas modified to include interactions between atomic cores and Drude particles, and the termdescribing the self-energy of a polarizable atom via the harmonic term 1/2kD·d2 was added tothe potential energy function.67
All nonbonded electrostatic interactions involving Drude particles are treated in the same wayas electrostatic interactions between real atoms, i.e., via the Coulomb law. For atoms excludedfrom the nonbonded lists (i.e., 1–2 and 1–3 covalent pairs), the electrostatic term is modifiedto allow 1–2 and 1–3 screened dipole-dipole interactions, as suggested by Thole.68 Thescreening is implemented through the smearing of the charge on the Drude particle and realatom. Then the screened dipole-dipole interactions are calculated via interactions between asmeared charge with a Slater distribution (using the screening parameter 2.6 in all ourcalculations) and a point charge.53
Partial atomic charges and atomic polarizabilities for the Drude polarizable force field for thearomatic compounds were determined from restrained fitting to QM response ESP maps, asper previous protocol.67 Briefly, the ESP grid points were located on concentric nonintersecting Connolly surfaces around the molecules. To determine both atomic polarizabilitiesand partial atomic charges from the single fitting procedure, a series of perturbed ESP mapswas generated, representing the electronic response of the molecule in the presence of abackground point charge of magnitude +0.5e placed on Connolly surfaces along chemicalbonds and in the gaps between the initial perturbation charges to achieve nearly equidistantcoverage of the molecular shape. Five alternating Connolly surfaces of perturbation chargesand grid points were generated with size factors 2.2 (charges), 3.0 (grid), 4.0 (charges), 5.0
Lopes et al. Page 3
J Phys Chem B. Author manuscript; available in PMC 2008 August 22.
NIH
-PA Author Manuscript
NIH
-PA Author Manuscript
NIH
-PA Author Manuscript
(grid), and 6.0 (charges), where the size factor multiplied by the vdW radius of thecorresponding atom determines its distance from the corresponding surface. Fitting wasperformed using parabolic restraints to the initial values of both the charges and polarizabilitieswith the weighting factor of 10−5 Å−2. Additionally, a flat well potential with the half-widthof 0.1 was used for atomic polarizabilities. Fitting to the same charge and polarizability valueswas imposed for chemically equivalent atoms.
Molecular dynamics (MD) simulations were performed at 1 atm pressure using the newvelocity Verlet integrator50 implemented in CHARMM. The SWM4-NDP model52 was usedin all calculations involving water. All simulations were performed by default at 298.2 K forboth benzene and toluene. Temperature dependence studies of the enthalpies of vaporizationwere also conducted and the values of the temperatures appear in the text. For thesetemperatures experimental data for the substances in the liquid phase at 1 atm pressure isavailable. A Nosé-Hoover thermostat with a relaxation time of 0.1 ps was applied to all realatoms to control the global temperature of the system. A modified Andersen-Hoover barostatwith a relaxation time of 0.1 ps was used to maintain the system at constant pressure.Condensed-phase MD simulations were performed using periodic boundary conditions andSHAKE to constrain covalent bonds involving hydrogens.69 Electrostatic interactions weretreated using particle-mesh Ewald (PME) summation70 with a coupling parameter 0.34 and a6th order spline for mesh interpolation. Nonbond pair lists were maintained out to 14 Å, and areal space cutoff of 12 Å was used for the electrostatic and Lennard-Jones terms. Long-rangecontributions to the van der Waals terms were corrected for as previously described.71,72 Theextended Lagrangian double-thermostat formalism50 was used in all polarizable MDsimulations where a mass of 0.4 amu was transferred from real atoms to the correspondingDrude particles. The amplitude of their oscillation was controlled with a separate low-temperature thermostat (at T = 0.1 K) to ensure that their time course approximates the SCFregimen.50
Operational parameters for the MD simulations using the extended Lagrangian formalismincluded 1.0 fs time steps and force constants of 500 kcal/(mol·Å2) on the Drude particles.Tests of larger force constants, up to 800 kcal/(mol·Å2) were conducted and yielded virtuallyidentical results. All simulations of the neat fluids requiring periodic boundary conditions wereperformed typically with cubic boxes containing 128 molecules. This is the case of allsimulations leading to computation of densities, enthalpies of vaporization, self-diffusioncoefficient, isothermal compressibilities, specific heat capacities and the dielectric constants.Larger boxes of 256 molecules were used to study the dynamics of the pure liquids in order tobe able to recover the full layered structure of the liquids as required for analysis of radial orspatial distribution functions. Simulations requiring dissolution of benzene or toluene in waterwere conducted in cubic boxes containing 128 water molecules. This was used, for example,in the computational determinations of the free energies of hydration and in the analysis ofhydration through the use of radial or spatial distribution functions. The same protocol wasused for the simulations with the polarizable and C22 force fields, with the TIP3P watermodel73 used in the additive force field calculations. The total length and the number ofsimulations used in the parametrization work varied according to the observable beingsimulated and the stage of the parameterization work. During the optimization stages, inparticular during optimization of LJ parameters using condensed phase simulations, a high rateof turnover was required in order to probe many combinations of LJ parameters. In this casesimulations to compute enthalpies of vaporization were performed with total lengths of 500 or700 ps, of which the final 200 and 400 ps were used for analysis. Free energies of hydrationwere carried out initially with runs of 10ps for equilibration and 30 ps for analysis. Validationof the newly developed parameters made use of longer simulation times, as follows; (a)densities, enthalpies of vaporization, coefficient of self-diffusion, isothermal compressibilities,specific heat capacities and the dielectric constants were obtained from simulations of 1 ns of
Lopes et al. Page 4
J Phys Chem B. Author manuscript; available in PMC 2008 August 22.
NIH
-PA Author Manuscript
NIH
-PA Author Manuscript
NIH
-PA Author Manuscript
which the last 600 ps were taken for analysis. Each property was run multiple times usingdifferent random number seeds to assign the initial velocities, as noted, and the results averaged;(b) simulations for the computation of the free energies of solvation were run for a total of 130ps with the first 30 ps used for equilibration and the final 100 ps for the production run.Coordinates sets from the trajectories were saved every 0.1 ps in the case of the dielectricconstants and every 0.5 ps otherwise when required.
Additional properties as required for both optimization and validation of the presented modelwere calculated as follow. The density (ρ) is the total mass over the current volume averagedover the simulations,
(1)
Experimental densities as a function of temperature were taken from refs 74,75. The error barof ρ equals the corresponding standard deviation.
Heats of vaporization, ΔHvap, were determined from differences of averages of the potentialenergy of the molecules in the condensed phase, <Uliquid>, and the average potential energyof a molecule in the gas phase, <Ugas>. These values were corrected for the different volumesbetween the liquid and gas phases by the term RT.76 The complete expression to compute theheats of vaporization is:
(2)
One assumption of this expression is the equivalence of the sum of the kinetic and vibrationalenergies in the gas and liquid phases.77 Calculation of the gas phase energies, Ugas, was doneusing Langevin dynamics in the SCF approximation. The same Drude force constant andmasses used in the condensed-phase simulations were used along with infinite nonbondedcutoffs. A friction coefficient of 5.0 ps−1 was applied to all atoms except for Drude particles.The gas-phase simulations were performed on one monomer for 2 ns.
Calculation of the self-diffusion coefficient (Ds) requires computation of the mean squaredisplacement (MSD) of the center-of-mass (COM) of all molecules according to the equation,where DPBC is the apparent self-diffusivity for the periodic boundary condition:
(3)
The computed values of Ds were corrected for system size effects using the hydrodynamicmodel of Yeh and Hummer78 of a particle surrounded by a solvent with a viscosity, η,
(4)
Isothermal compressibilities were calculated from
(5)
where V is the volume, ⟨δV2⟩ are volume fluctuations and KB is the Boltzmann’s constant.
The specific heat capacity (Cp) at constant pressure was calculated with five production runsat different temperatures, 293.2, 298.2, 303.2, 308.2 and 313.2. The total energy ⟨Utot⟩ and the
Lopes et al. Page 5
J Phys Chem B. Author manuscript; available in PMC 2008 August 22.
NIH
-PA Author Manuscript
NIH
-PA Author Manuscript
NIH
-PA Author Manuscript
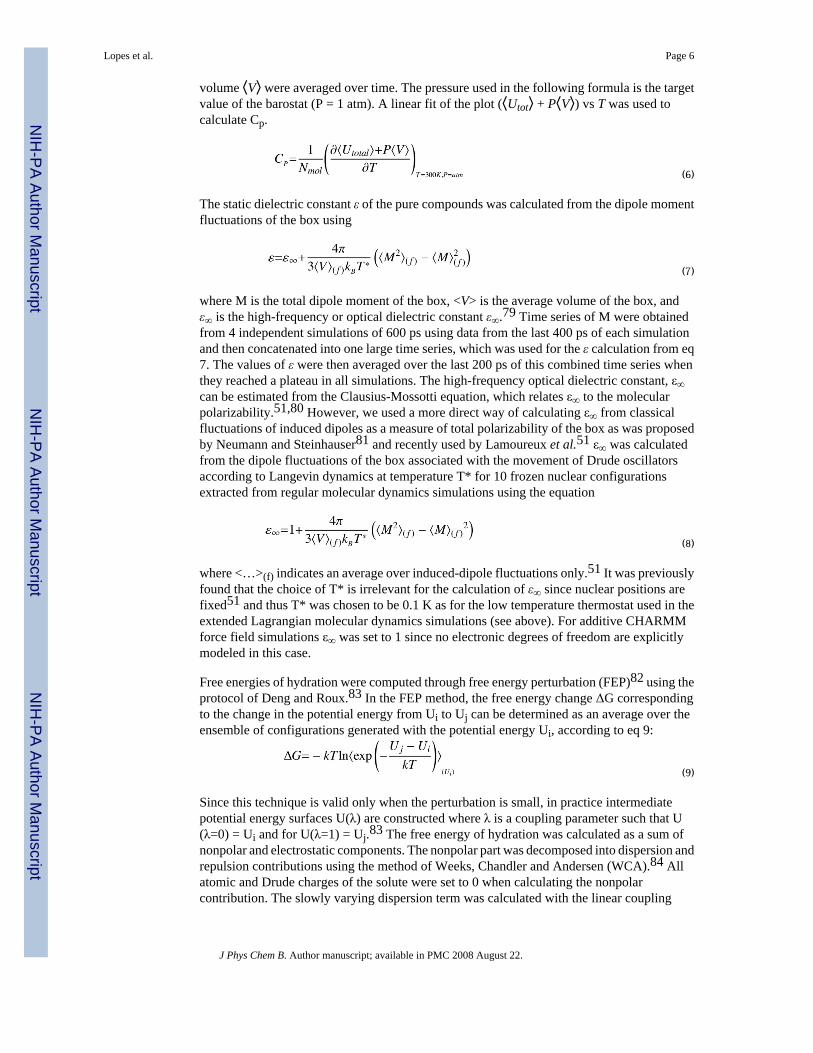
volume ⟨V⟩ were averaged over time. The pressure used in the following formula is the targetvalue of the barostat (P = 1 atm). A linear fit of the plot (⟨Utot⟩ + P⟨V⟩) vs T was used tocalculate Cp.
(6)
The static dielectric constant ε of the pure compounds was calculated from the dipole momentfluctuations of the box using
(7)
where M is the total dipole moment of the box, <V> is the average volume of the box, andε∞ is the high-frequency or optical dielectric constant ε∞.79 Time series of M were obtainedfrom 4 independent simulations of 600 ps using data from the last 400 ps of each simulationand then concatenated into one large time series, which was used for the ε calculation from eq7. The values of ε were then averaged over the last 200 ps of this combined time series whenthey reached a plateau in all simulations. The high-frequency optical dielectric constant, ε∞can be estimated from the Clausius-Mossotti equation, which relates ε∞ to the molecularpolarizability.51,80 However, we used a more direct way of calculating ε∞ from classicalfluctuations of induced dipoles as a measure of total polarizability of the box as was proposedby Neumann and Steinhauser81 and recently used by Lamoureux et al.51 ε∞ was calculatedfrom the dipole fluctuations of the box associated with the movement of Drude oscillatorsaccording to Langevin dynamics at temperature T* for 10 frozen nuclear configurationsextracted from regular molecular dynamics simulations using the equation
(8)
where <…>(f) indicates an average over induced-dipole fluctuations only.51 It was previouslyfound that the choice of T* is irrelevant for the calculation of ε∞ since nuclear positions arefixed51 and thus T* was chosen to be 0.1 K as for the low temperature thermostat used in theextended Lagrangian molecular dynamics simulations (see above). For additive CHARMMforce field simulations ε∞ was set to 1 since no electronic degrees of freedom are explicitlymodeled in this case.
Free energies of hydration were computed through free energy perturbation (FEP)82 using theprotocol of Deng and Roux.83 In the FEP method, the free energy change ΔG correspondingto the change in the potential energy from Ui to Uj can be determined as an average over theensemble of configurations generated with the potential energy Ui, according to eq 9:
(9)
Since this technique is valid only when the perturbation is small, in practice intermediatepotential energy surfaces U(λ) are constructed where λ is a coupling parameter such that U(λ=0) = Ui and for U(λ=1) = Uj.83 The free energy of hydration was calculated as a sum ofnonpolar and electrostatic components. The nonpolar part was decomposed into dispersion andrepulsion contributions using the method of Weeks, Chandler and Andersen (WCA).84 Allatomic and Drude charges of the solute were set to 0 when calculating the nonpolarcontribution. The slowly varying dispersion term was calculated with the linear coupling
Lopes et al. Page 6
J Phys Chem B. Author manuscript; available in PMC 2008 August 22.
NIH
-PA Author Manuscript
NIH
-PA Author Manuscript
NIH
-PA Author Manuscript
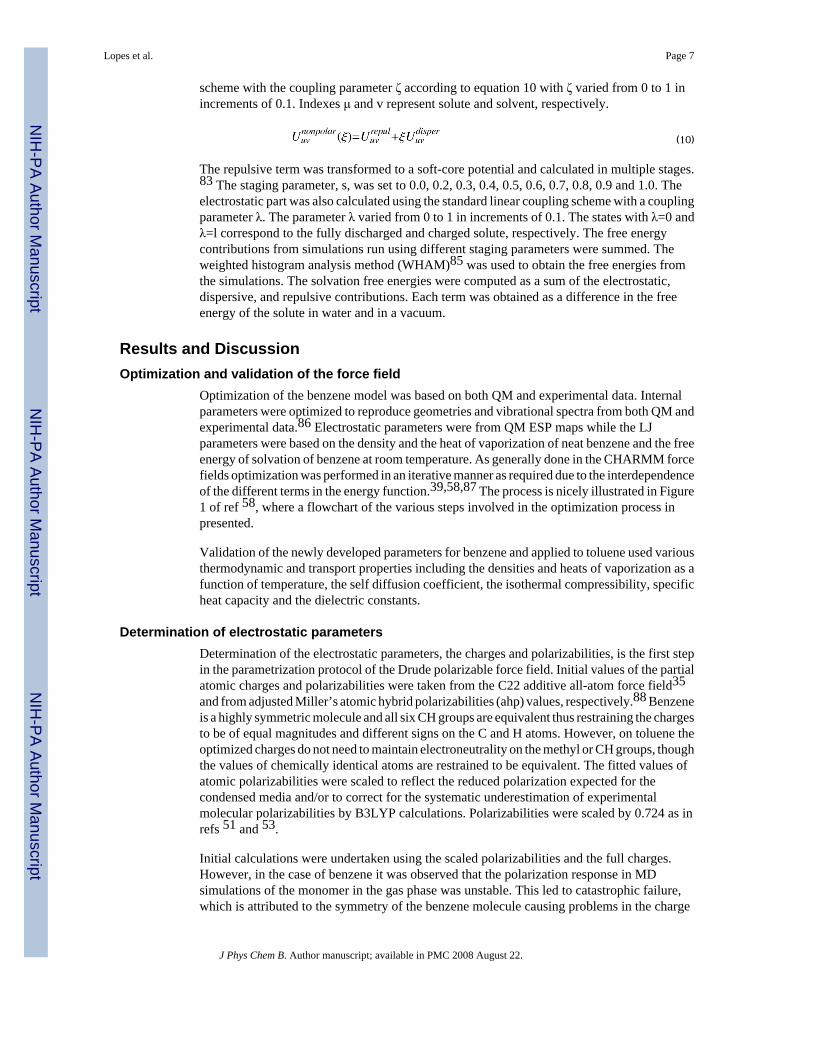
scheme with the coupling parameter ζ according to equation 10 with ζ varied from 0 to 1 inincrements of 0.1. Indexes μ and v represent solute and solvent, respectively.
(10)
The repulsive term was transformed to a soft-core potential and calculated in multiple stages.83 The staging parameter, s, was set to 0.0, 0.2, 0.3, 0.4, 0.5, 0.6, 0.7, 0.8, 0.9 and 1.0. Theelectrostatic part was also calculated using the standard linear coupling scheme with a couplingparameter λ. The parameter λ varied from 0 to 1 in increments of 0.1. The states with λ=0 andλ=l correspond to the fully discharged and charged solute, respectively. The free energycontributions from simulations run using different staging parameters were summed. Theweighted histogram analysis method (WHAM)85 was used to obtain the free energies fromthe simulations. The solvation free energies were computed as a sum of the electrostatic,dispersive, and repulsive contributions. Each term was obtained as a difference in the freeenergy of the solute in water and in a vacuum.
Results and DiscussionOptimization and validation of the force field
Optimization of the benzene model was based on both QM and experimental data. Internalparameters were optimized to reproduce geometries and vibrational spectra from both QM andexperimental data.86 Electrostatic parameters were from QM ESP maps while the LJparameters were based on the density and the heat of vaporization of neat benzene and the freeenergy of solvation of benzene at room temperature. As generally done in the CHARMM forcefields optimization was performed in an iterative manner as required due to the interdependenceof the different terms in the energy function.39,58,87 The process is nicely illustrated in Figure1 of ref 58, where a flowchart of the various steps involved in the optimization process inpresented.
Validation of the newly developed parameters for benzene and applied to toluene used variousthermodynamic and transport properties including the densities and heats of vaporization as afunction of temperature, the self diffusion coefficient, the isothermal compressibility, specificheat capacity and the dielectric constants.
Determination of electrostatic parametersDetermination of the electrostatic parameters, the charges and polarizabilities, is the first stepin the parametrization protocol of the Drude polarizable force field. Initial values of the partialatomic charges and polarizabilities were taken from the C22 additive all-atom force field35and from adjusted Miller’s atomic hybrid polarizabilities (ahp) values, respectively.88 Benzeneis a highly symmetric molecule and all six CH groups are equivalent thus restraining the chargesto be of equal magnitudes and different signs on the C and H atoms. However, on toluene theoptimized charges do not need to maintain electroneutrality on the methyl or CH groups, thoughthe values of chemically identical atoms are restrained to be equivalent. The fitted values ofatomic polarizabilities were scaled to reflect the reduced polarization expected for thecondensed media and/or to correct for the systematic underestimation of experimentalmolecular polarizabilities by B3LYP calculations. Polarizabilities were scaled by 0.724 as inrefs 51 and 53.
Initial calculations were undertaken using the scaled polarizabilities and the full charges.However, in the case of benzene it was observed that the polarization response in MDsimulations of the monomer in the gas phase was unstable. This led to catastrophic failure,which is attributed to the symmetry of the benzene molecule causing problems in the charge
Lopes et al. Page 7
J Phys Chem B. Author manuscript; available in PMC 2008 August 22.
NIH
-PA Author Manuscript
NIH
-PA Author Manuscript
NIH
-PA Author Manuscript
fitting procedure. To overcome this problem it was necessary to scale the partial atomic chargesby 0.7 for benzene, yielding charged comparable to toluene (Table S3 of supportinginformation). No such scaling was performed for toluene. As will be shown below thisadjustment lead to some decreases in the ability of the model to reproduce gas-phase targetdata associated with the benzene dimer and benzene-rare gas interactions; however, the modelwith the scaled charges lead to good agreement with a variety of condensed phase data. Also,as unscaled charges were used with toluene, the application of the force field to other aromaticspecies will be performed using charges directly from the fitting procedure.
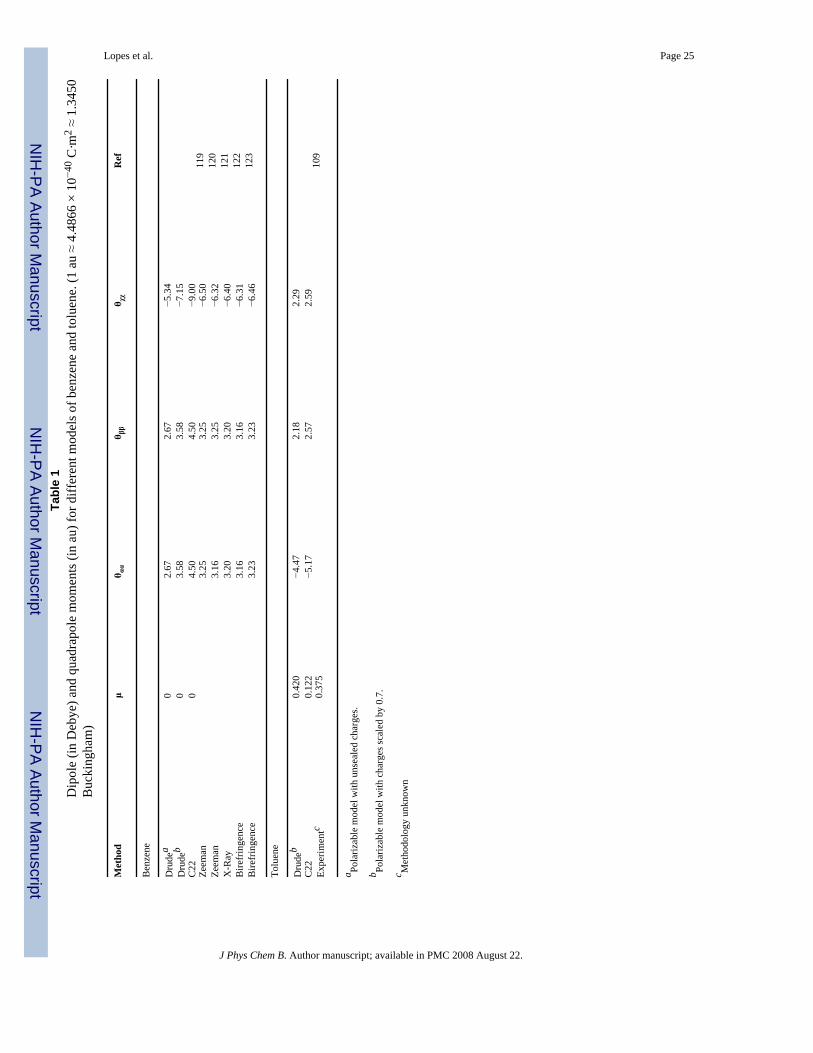
Initial assessment of the quality of the fitted electrostatic parameters was done by comparingcomputed dipole or quadrupole moments and polarizabilities with QM and/or experimentalresults (Table 1). Benzene has a null dipole moment at the equilibrium geometry andcomparison was to the quadrupole moment. Included in Table 1 are results for benzene withoutand with scaling of the charges. Concerning the benzene quadrupole moment, charge scalingof the charges lead to improved agreement with the various target data, with the level ofagreement being significantly better than CHARMM22. The improved agreement of thepolarizable model is expected due to the need to overestimate the quadrupole in the additivemodel as required to reproduce the condensed phase effects. For toluene, the polarizable modeloverestimates the experimental dipole while CHARMM22 significantly underestimates thedipole. The latter result appears to be associated with the charge assignment approach used inthe CHARMM22 force field where standard charges for the aromatic and aliphatic groups areused without further optimization.89
Optimization of Internal ParametersOptimization of the internal parameters was done by reproducing target data on the geometryand vibrational spectra of benzene. Internal parameters for toluene were transferred frombenzene and complemented with previously determined parameters for the methyl group.54Target data for the geometries included the optimized structure of benzene at the MP2/6-31G(d) level along with a survey of the Cambridge Structural Database (CSD),90 with the resultsshown in Table S1 of the Supporting Information. Direct transfer of the internal parametersfrom the additive model was appropriate, since the optimized geometries for both models areequivalent. This is true for all bond, angle and torsion parameters, except one. This is alsoevident from the good agreement with the target experimental86 and scaled MP2/6-31G(d)spectra shown in Table S2 of the Supplementary Information. The list of all parameters usedin this work is shown in Table S3 of the Supplementary Information.
Optimization of Lennard-Jones ParametersLJ parameters were optimized iteratively based on a procedure described in detail in ref 39. Itinvolves two steps: the relative and absolute optimizations. The relative procedure, aimed atyielding parameters in which the relative values of the LJ parameters for different atom types(e.g., carbon and hydrogen in the aromatic ring of benzene) were able to reproduce relative abinitio minimum interaction energies and geometries for different rare gases to model compoundinteractions, was initially applied. Target data for this optimization includes RMS fluctuationsabout average differences or ratios between the QM and empirical models for selectedinteraction orientations between He and Ne. The absolute optimization procedure is includedto ensure that the values of the LJ parameters yield condensed-phase properties, such asenthalpies of vaporization and free energies of solvation, in good agreement with experimentat 298.2 K. The newly developed parameters were validated by comparing computed andexperimental thermodynamic and transport properties at different temperatures.Thermodynamic properties included enthalpies of vaporization, free energies of solvation,isothermal compressibilities and heat capacities at constant pressure. Diffusion coefficientscomputed at several temperatures were the only transport property computed in this work.
Lopes et al. Page 8
J Phys Chem B. Author manuscript; available in PMC 2008 August 22.
NIH
-PA Author Manuscript
NIH
-PA Author Manuscript
NIH
-PA Author Manuscript

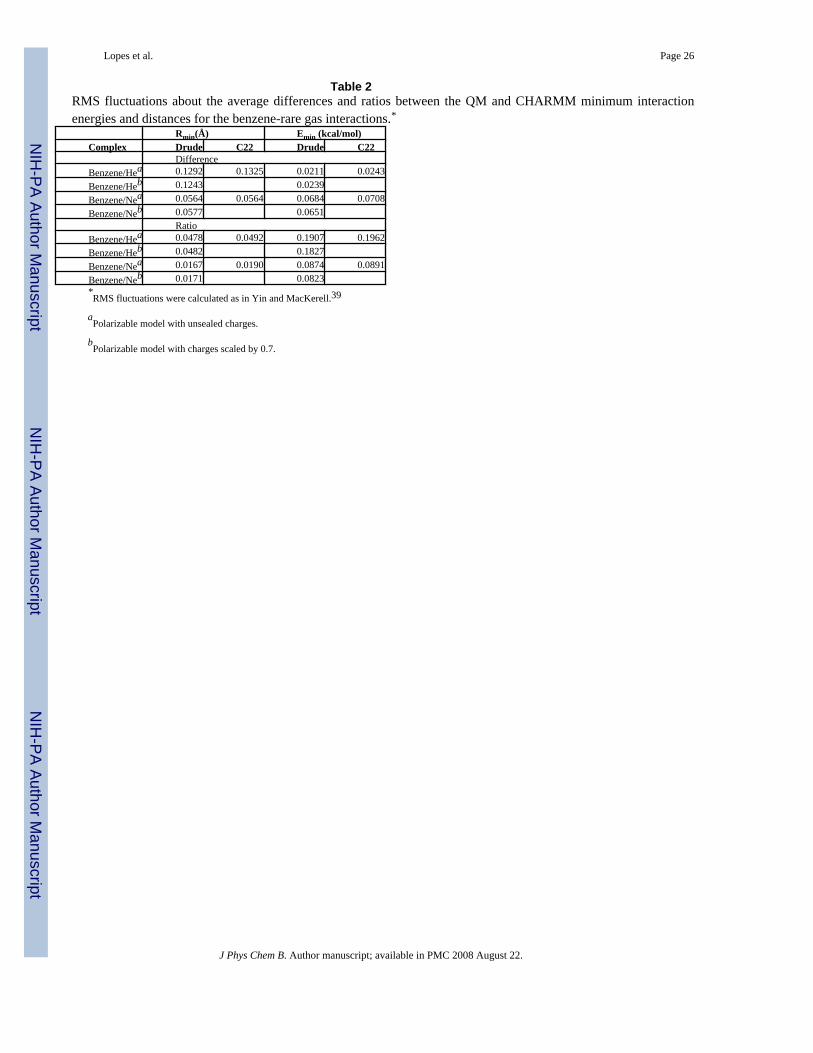
Presented in Table 2 are the RMS fluctuations about the average differences and ratios betweenthe QM and empirical models for the interactions with the rare gases. Data are based on theinteraction orientations shown in Figure 1. In Table S4 of the Supporting Information absolutevalues for the individual interactions are presented. RMS fluctuations of both the ratios anddifferences of the rare gas interactions are generally similar for the polarizable models in whichthe charges are unscaled and scaled. Such a small change is expected given that the use of raregas atoms is designed to primarily probe repulsion/dispersion interactions. Importantly, thefluctuations are systematically improved in the polarizable force field as compared to theadditive model, although by a small margin. This indicates that the use of the improvedelectrostatic model that includes polarizability allows for a better balance of the LJ parametersof carbon and hydrogen, with the relatively small improvement with respect to CHARMM22indicative of the quality of the additive model.
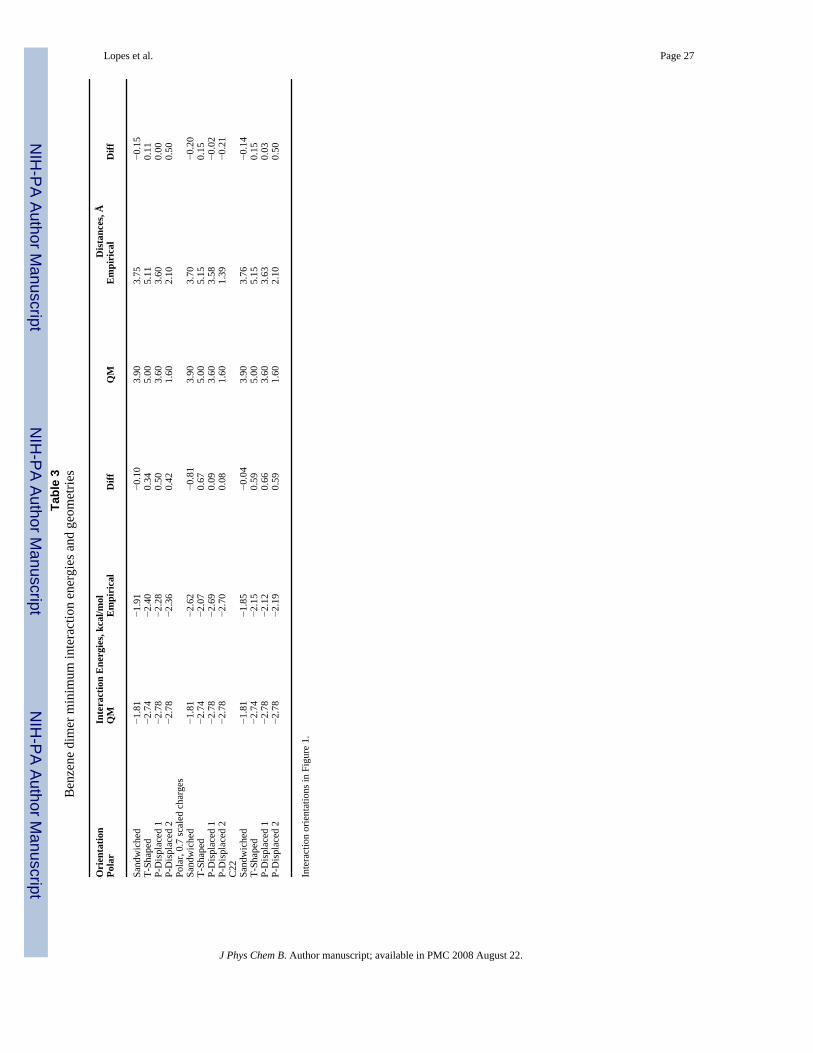
Energies and geometries for the interaction of benzene dimers were also incorporated in theoptimization of the LJ parameters. Calculations of binding energies and geometries of benzenedimers have been actively studied using quantum mechanical methods. In the past five yearsalone 12 studies have been published.91–102 Reference data for the present work was takenfrom CCSD(T) calculations extrapolated to the complete basis set limit by Sinnokrot andSherrill, probably the most accurate study published to date.96 Three geometries wereconsidered in ref 96 namely: staggered, T-shaped and laterally displaced geometries (Figure1). This yields 4 target interaction orientations since the laterally displaced geometry isdescribed by two distances and two geometries with each of the distances being individuallyfrozen during optimization of the dimer. Comparison of the polarizable model with unscaledcharges shows the overall agreement to be satisfactory, with the staggered geometry beingslightly to favorable with the remaining interactions underestimated. Differences in thedistances vary significantly, being to short for the staggered orientation and significantly tolong for the second laterally displaced orientation. The use of scaled charges leads to thebalance of the interaction energies becoming significantly worse, with the staggered and T-shaped orientations significantly overestimated and underestimated, respectively. However,the two displaced orientation interaction energies are in good agreement with the QM andminimum interaction energy differences being better balanced. The CHARMM22 results aresimilar to the unscaled polarizable results, with a reasonable balance of the interaction energiesbut poorer balance of the distances as a function of the interaction orientation.
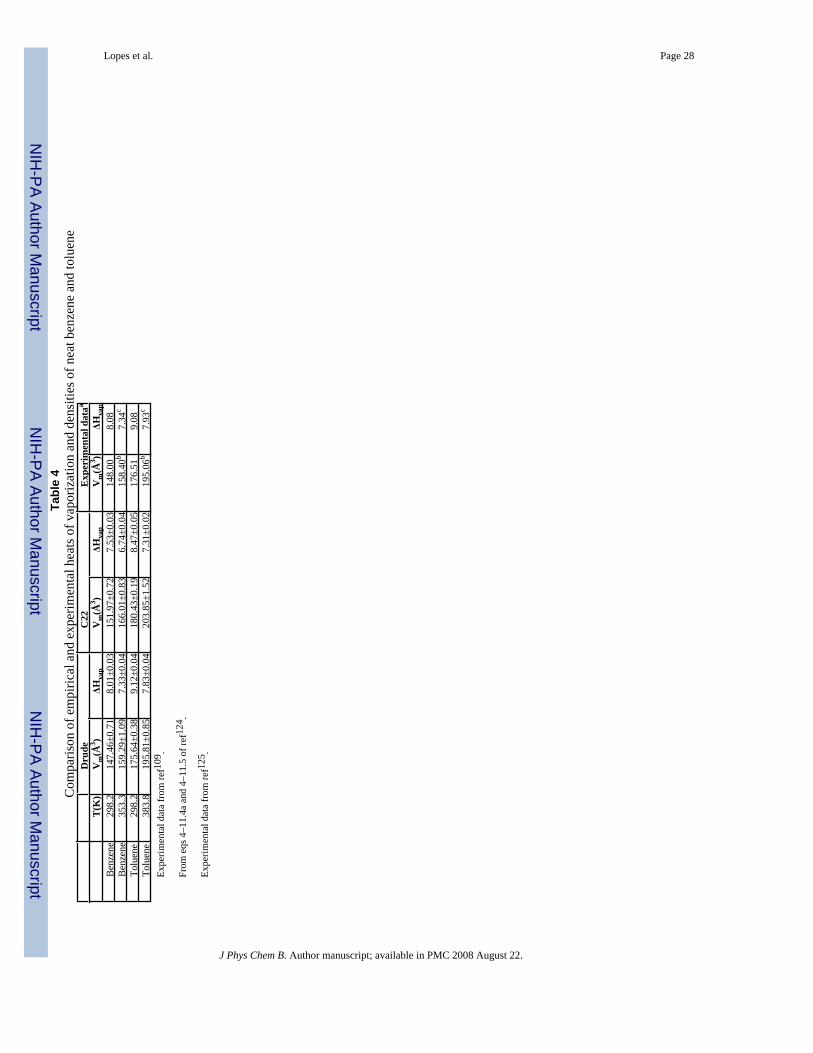
Heats of vaporization and molecular volumes for toluene and benzene are shown in Table 4for both the additive and polarizable models. For both benzene and toluene the Drude modelreproduces the experimental target data within 2% of the experimental value, our targeted limit.Noteworthy is the good agreement observed for toluene since no special optimization of LJ orinternal parameters was performed relative to benzene. Only the electrostatic parameters weredetermined as described above. Transferability of parameters is a key aspect of a force fieldand the current combination of LJ and internal parameters yield satisfactory condensed phaseproperties when applied to toluene. The same set of parameters has been used as the basis ofa polarizable model of heteroaromatic molecules, including pyridine and pyrimidine, andyielded results of the same quality.103 As will be shown below, the model also yields excellentagreement at temperatures above room temperature, which were not considered in theoptimization procedure, highlighting the quality of the Drude model and the developedparameter set.
Free energies of hydration of benzene and toluene for both the polarizable Drude model andC22 are compared with experimental results in Table 5. The results for both force fields aregood, with the polarizable model performing better in the case of benzene and worse fortoluene. Better agreement for benzene is expected due to the free energy of solvation being
Lopes et al. Page 9
J Phys Chem B. Author manuscript; available in PMC 2008 August 22.
NIH
-PA Author Manuscript
NIH
-PA Author Manuscript
NIH
-PA Author Manuscript

considered during parameter optimization; the satisfactory level of agreement for toluenesupports the transferability of the model.
A number of additional pure solvent properties were calculated to validate the model. Dielectricconstants are shown in Table 6. As is evident the agreement of the Drude model with experimentis very good. The basis of this level of agreement are the ε∞ values which are due to the presenceof polarizability in the model. The omission of explicit polarizability in the additive CHARMMforce fields inherently disallows the proper treatment of the dielectric, as previously discussedfor the alkanes.54
Computed and experimental heat capacities are given in Table 6. For both satisfactory resultsare obtained for the polarizable models of both benzene and toluene. For both models theabsolute values of the calculated and experimental heat capacities are somewhat overestimated;however the model is able to reproduce the difference between benzene and toluene with anerror of 2.3 cal·mol−1·K−1.
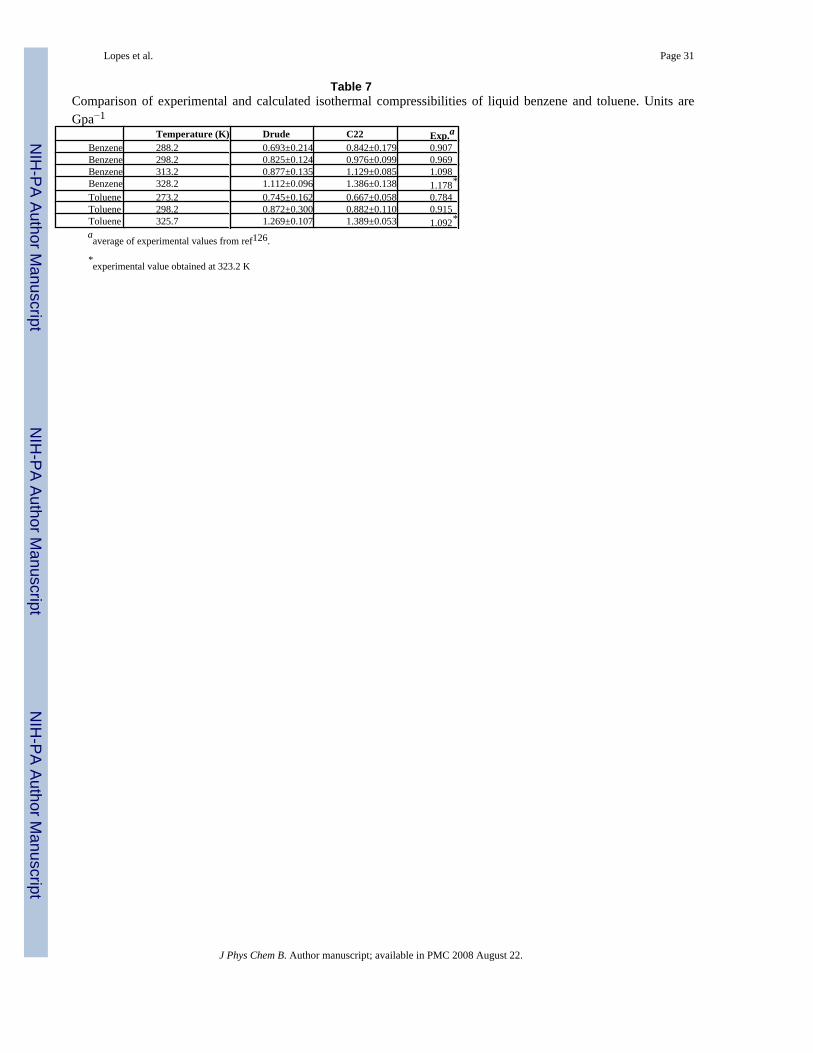
Results for the computed isothermal compressibility of benzene and toluene are shown in Table7. The polarizable model slightly underestimates the experimental values for both benzene andtoluene and the calculated toluene value is slightly higher than benzene in contrast toexperiment, though the precision of the calculated values is larger than the differences in theaverage values. C22 performed better than the Drude model, except at the highest temperatures.The isothermal compressibility is the only property where the additive model clearlyoutperforms the polarizable model.
The performance of the polarizable empirical force field was also validated by computing theself-diffusion coefficients of the pure liquids. The results are shown in Table 8. Both thepolarizable and additive models are in excellent agreement with experiment. This includes thetemperature dependence of the calculated values following the experimental trends for bothmolecules.
Structure of liquid benzene and tolueneA common method of studying the structure of neat liquids and solutions is to calculate radialdistribution functions (RDFs), g(r), between different interaction sites. These quantities,sometimes designated as “pair correlation functions,” can be combined to obtain the probablestructure of dimer configurations and structures of solvation spheres and intermolecularinteractions including hydrogen bonds. RDFs can also be used to calculate coordinationnumbers by integrating over the RDFs in order to obtain an average number of neighbors as afunction of distance. Experimental atom–atom radial distributions are available as Fourier-transformed partially resolved structure factors from neutron or x-ray diffraction studies.104For example, the benzene liquid structure has been determined by Narten105,106 and recentlyTassaing and co-workers have studied the structure of liquid and supercritical benzene byneutron diffraction.107
The total radial distribution function for the polarizable and additive models, denoted asginter as in ref 107 are shown in Figure 2. The curves are nearly identical to the experimentaldata of Cabaço and co-workers4 obtained from incoherent neutron diffraction experiments.Both the polarizable and additive models reproduce the experimental data nearly perfectly.However, previous computer simulations have shown that this is the case with theoverwhelming majority of simulation conditions,108,47–50 suggesting that reproduction ofthis property is relatively trivial.
More detailed comparison of the new polarizable and CHARMM22 models was performedvia comparison of the RDFs for the centers of mass of benzene and toluene, as shown in Figure
Lopes et al. Page 10
J Phys Chem B. Author manuscript; available in PMC 2008 August 22.
NIH
-PA Author Manuscript
NIH
-PA Author Manuscript
NIH
-PA Author Manuscript
3. The RDFs are similar for both the additive and polarizable models, showing long-range orderextending up to the third shell. The distribution of the first neighbors has a maximum at about5.6 Å with a contact distance between molecular centers of mass of about 3.7 Å. However,there are subtle differences in the RDFs with the Drude model having the initial rise in firstpeak at shorter distances than CHARMM22 with the maximum of the first peak at a slightlylarger distance. This suggests the Drude model to have a somewhat softer interaction surfacefor the benzene-benzene interactions as may be expected due to the inclusion of polarizability.
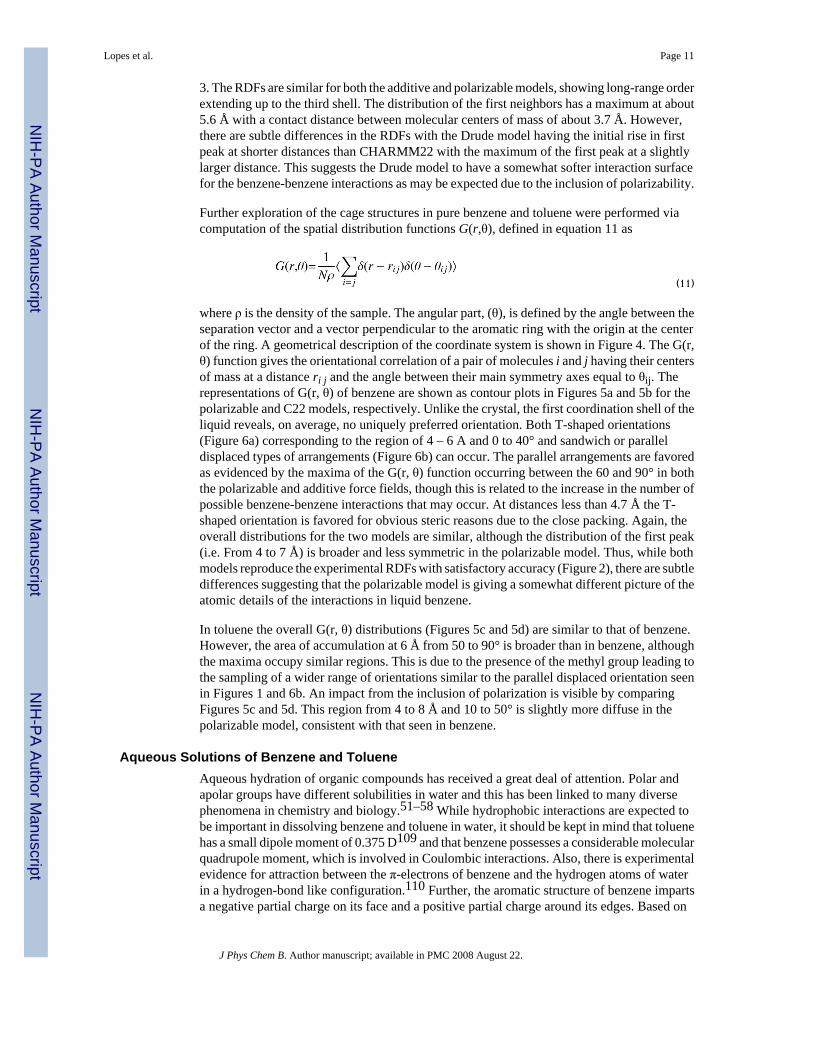
Further exploration of the cage structures in pure benzene and toluene were performed viacomputation of the spatial distribution functions G(r,θ), defined in equation 11 as
(11)
where ρ is the density of the sample. The angular part, (θ), is defined by the angle between theseparation vector and a vector perpendicular to the aromatic ring with the origin at the centerof the ring. A geometrical description of the coordinate system is shown in Figure 4. The G(r,θ) function gives the orientational correlation of a pair of molecules i and j having their centersof mass at a distance ri j and the angle between their main symmetry axes equal to θij. Therepresentations of G(r, θ) of benzene are shown as contour plots in Figures 5a and 5b for thepolarizable and C22 models, respectively. Unlike the crystal, the first coordination shell of theliquid reveals, on average, no uniquely preferred orientation. Both T-shaped orientations(Figure 6a) corresponding to the region of 4 – 6 A and 0 to 40° and sandwich or paralleldisplaced types of arrangements (Figure 6b) can occur. The parallel arrangements are favoredas evidenced by the maxima of the G(r, θ) function occurring between the 60 and 90° in boththe polarizable and additive force fields, though this is related to the increase in the number ofpossible benzene-benzene interactions that may occur. At distances less than 4.7 Å the T-shaped orientation is favored for obvious steric reasons due to the close packing. Again, theoverall distributions for the two models are similar, although the distribution of the first peak(i.e. From 4 to 7 Å) is broader and less symmetric in the polarizable model. Thus, while bothmodels reproduce the experimental RDFs with satisfactory accuracy (Figure 2), there are subtledifferences suggesting that the polarizable model is giving a somewhat different picture of theatomic details of the interactions in liquid benzene.
In toluene the overall G(r, θ) distributions (Figures 5c and 5d) are similar to that of benzene.However, the area of accumulation at 6 Å from 50 to 90° is broader than in benzene, althoughthe maxima occupy similar regions. This is due to the presence of the methyl group leading tothe sampling of a wider range of orientations similar to the parallel displaced orientation seenin Figures 1 and 6b. An impact from the inclusion of polarization is visible by comparingFigures 5c and 5d. This region from 4 to 8 Å and 10 to 50° is slightly more diffuse in thepolarizable model, consistent with that seen in benzene.
Aqueous Solutions of Benzene and TolueneAqueous hydration of organic compounds has received a great deal of attention. Polar andapolar groups have different solubilities in water and this has been linked to many diversephenomena in chemistry and biology.51–58 While hydrophobic interactions are expected tobe important in dissolving benzene and toluene in water, it should be kept in mind that toluenehas a small dipole moment of 0.375 D109 and that benzene possesses a considerable molecularquadrupole moment, which is involved in Coulombic interactions. Also, there is experimentalevidence for attraction between the π-electrons of benzene and the hydrogen atoms of waterin a hydrogen-bond like configuration.110 Further, the aromatic structure of benzene impartsa negative partial charge on its face and a positive partial charge around its edges. Based on
Lopes et al. Page 11
J Phys Chem B. Author manuscript; available in PMC 2008 August 22.
NIH
-PA Author Manuscript
NIH
-PA Author Manuscript
NIH
-PA Author Manuscript
these properties the ability of benzene to act as a hydrogen bond acceptor was predicted in the1980s.111 Since that time, experiments have shown that benzene does indeed form hydrogenbonds with water (see ref 112 and refs therein). In addition, details of the water-benzeneinteraction have been investigated using Monte Carlo113,114 and MD115–117 simulations ofa single benzene molecule in solution. These theoretical studies also show that water moleculesprefer to adopt a hydrogen-bonding interaction with the faces of the benzene ring. In one studya hydration sphere of approximately 23 water molecules around benzene was observed withtwo water molecules found on each side of the benzene plane.118 These results are consistentwith the higher relative solubility of benzene over that of other hydrocarbons.
Figure 7a shows the RDF curves between the center of mass of benzene and the oxygen atomsof the water molecules. Differences between the polarizable and additive models are indicatedby arrows. An interesting feature is a shoulder at the distance of 3.5 Å. This feature is due todirect interactions of the benzene carbon and water hydrogen atoms. The shoulder is higherand more structured in the additive force field versus the polarizable model. This again suggeststhe polarizable model to be somewhat softer than the additive model, yielding a slightlydifferent atomic picture of the interactions of benzene with its environment. There is also asmall shift of the large peak in Figure 7a to smaller separations in the polarizable force field.In addition, the rift separating the peaks at 5.1 and 7.6 Å is more pronounced with thepolarizable force field. These results suggest that while the polarizable model is softer withrespect to contact interactions it also yields a more well defined preference for water moleculesto populate the region associated with the first benzene-water peak as compared to the additivemodel.
In toluene the difference between polarizable and additive force fields is less evident,particularly in the region of the shoulder at 3.5 Å (Figure 7b). However, similar to benzene,the first peak is more structured in the polarizable model and the minima at ~6.5 Å morepronounced. For the remaining distances the structure of water around toluene remains largelyidentical for the two models.
Further insight into the distribution of the water molecules around a single molecule of benzenewas obtained by using combined distribution functions of both the radial and angularcoordinates of the separation vector, as performed above for the pure solvents based on equation11. The coordinate system defining the distributions is shown in Figure 4, with the resultingdistributions presented as contour plots for the polarizable and additive CHARMM calculationsof both benzene (Figure 8a and b) and toluene (Figure 8c and d). Red corresponds to areas ofhigh accessibility to water and white to areas where water is excluded. Looking at the resultsfor benzene the following features are evident:
Water in the immediate vicinity of benzene lay above and below the Ch symmetry plane, asseen in Figure 6c. This region from 3 to 4 Å and from 0 to 30° is seen to be somewhat broaderand slightly more populated in the additive mode. This is consistent with the higher peakobserved at 3.5 Å in Figure 7a. These observations are the result of polarization above themolecular plane, which biases the water molecules to lie above the carbon atoms.
The bulk of water molecules stay in regions approximately parallel to the molecular plane overthe carbon and hydrogen atoms (Figure 6d) and out to an edge-on orientation with the ring.This corresponds to the orange/red areas of Figure 8 from 40 to 90°. Water is somewhat morestructured in the case of the polarizable force field and stays in a narrower area. The increasedstructure of the water molecules observed with the polarizable force field is further indicatedby the area between 6–7 A and 60–90 °, which is more depleted in Figure 8a (yellow arrow).
In the case of toluene the contour plots for the polarizable and additive models (Figure 8c andd) are consistent with the RDF plots of Figure 7b. The contact region from 3 to 4 Å is similar
Lopes et al. Page 12
J Phys Chem B. Author manuscript; available in PMC 2008 August 22.
NIH
-PA Author Manuscript
NIH
-PA Author Manuscript
NIH
-PA Author Manuscript

for the two models, with the population of the highly sampled region directly above the faceof the ring slightly more well-defined in the polarizable model.
ConclusionsPresented is a polarizable model of benzene based on the classical Drude oscillator formalism.The model was optimized to reproduce a variety of gas and condensed phase target data.Transferability of the optimized parameters was tested via their application to toluene, withthe methyl parameters transferred from previously published alkane parameters. The qualityof the resulting toluene model in treating various condensed phase properties supports thetransferability of the parameters. Additional validation of the developed force field wasperformed via calculation of additional condensed phase data, including dielectric constants,self-diffusion coefficients, heat capacities, isothermal compressibilities and radial distributionfunctions. While many of the structural based properties are similar for the presentedpolarizable and additive models, there are differences in the atomic details of the interactionsin the condensed phase. These differences along with the general improvement of thepolarizable model in reproducing condensed phase properties and its ability to reproduce theexperimental dielectric constant, which is not possible in the additive force field, indicates thatthe model will be useful for force field based studies of benzene and related compounds. Inaddition, the availability of aromatic parameters lays the groundwork for the development ofa Drude-based polarizable model for biological molecules.
Supplementary MaterialRefer to Web version on PubMed Central for supplementary material.
Acknowledgements
Financial support is acknowledged from the NIH (GM51501 and GM72558) and the DOD ACS Major SharedResource Computing and PSC Pittsburgh Supercomputing Center are acknowledged for their generous CPUallocations.
References1. Bartsch E, Bertagnolli H, Schulz G, Chieux P. Ber Bunsenges Phys Chem 1985;89:147.2. Felici R, Cilloco F, Bosi P. Mol Phys 1990;70:455.3. Misawa M, Fukunaga T. J Chem Phys 1990;93:3495.4. Cabaco ML, Danten Y, Besnard M, Guissani Y, Guillot B. J Phys Chem B 1997;101:6977.5. Bauer DR, Alms GR, Brauman JI, Pecora R. J Chem Phys 1974;61:2255.6. Griffiths JE, Clerc M, Rentzepis PM. J Chem Phys 1974;60:3824.7. Schomacker KT, Delaney JK, Champion PM. J Chem Phys 1986;85:4240.8. Tanabe K, Jonas J. J Chem Phys 1977;67:4222.9. Fernandezsanchez JM, Montero S. J Chem Phys 1989;90:2909.10. Dugan MA, Melinger JS, Albrecht AC. Chem Phys Lett 1988;147:411.11. Joo TH, Dugan MA, Albrecht AC. Chem Phys Lett 1991;177:4.12. Friedman JS, She CY. J Chem Phys 1993;99:4960.13. Joo T, Albrecht AC. J Chem Phys 1993;99:3244.14. Kirkwood JC, Ulness DJ, Albrecht AC. Chem Phys Lett 1998;293:167.15. Loughnane BJ, Scodinu A, Farrer RA, Fourkas JT, Mohanty U. J Chem Phys 1999;111:2686.16. Hobza P, Selzle HL, Schlag EW. J Phys Chem 1996;100:18790.17. Meijer EJ, Sprik M. J Chem Phys 1996;105:8684.18. Sinnokrot MO, Sherrill CD. J Phys Chem A 2006;110:10656. [PubMed: 16970354]19. Baranyai A, Evans DJ. Mol Phys 1990;70:53.
Lopes et al. Page 13
J Phys Chem B. Author manuscript; available in PMC 2008 August 22.
NIH
-PA Author Manuscript
NIH
-PA Author Manuscript
NIH
-PA Author Manuscript

20. Luo H, Hoheisel C. Ber Bunsen-Ges Phys Chem Chem Phys 1991;95:992.21. Luo H, Hoheisel C. J Chem Phys 1992;96:3173.22. Craven CJ, Hatton PD, Pawley GS. J Chem Phys 1993;98:8244.23. Laaksonen A, Wang J, Boyd RJ. Chem Phys Lett 1995;241:380.24. Nakagawa T, Yamanaka S, Urakawa H, Kajiwara K, Hayashi S. Theochem-J Mol Struct
1999;458:275.25. Witt R, Sturz L, Dolle A, Muller-Plathe F. J Phys Chem A 2000;104:5716.26. Chelli R, Cardini G, Ricci M, Bartolini P, Righini R, Califano S. Phys Chem Chem Phys 2001;3:2803.27. Kaminski GA, Stern HA, Berne BJ, Friesner RA. J Phys Chem A 2004;108:621.28. Jorgensen WL, Tirado-Rives J. Proc Natl Acad Sci U S A 2005;102:6665. [PubMed: 15870211]29. Eike DM, Maginn EJ. J Chem Phys 2006:124.30. Bartell LS, Dulles FJ. J Phys Chem 1995;99:17107.31. Khare AA, Rutledge GC. J Chem Phys 1999;110:3063.32. Jorgensen WL, Maxwell DS, TiradoRives J. J Am Chem Soc 1996;118:11225.33. Sun H. J Phys Chem B 1998;102:7338.34. Patel S, Brooks CL. J Comp Chem 2004;25:1. [PubMed: 14634989]35. MacKerell AD Jr, Bashford D, Bellott M, Dunbrack RL, Evanseck JD, Field MJ, Fischer S, Gao J,
Guo H, Ha S, Joseph-McCarthy D, Kuchnir L, Kuczera K, Lau FTK, Mattos C, Michnick S, Ngo T,Nguyen DT, Prodhom B, Reiher WE, Roux B, Schlenkrich M, Smith JC, Stole R, Straub J, WatanabeM, Wiorkiewicz-Kuczera J, Yin D, Karplus M. J Phys Chem B 1998;102:3586.
36. Scott WRP, Hunenberger PH, Tironi IG, Mark AE, Billeter SR, Fennen J, Torda AE, Huber T, KrugerP, van Gunsteren WF. J Phys Chem A 1999;103:3596.
37. Cornell WD, Cieplak P, Bayly CI, Gould IR, Merz KM, Ferguson DM, Spellmeyer DC, Fox T,Caldwell JW, Kollman PA. J Am Chem Soc 1996;118:2309.
38. Jorgensen WL, Maxwell DS, TiradoRives J. Journal Of The American Chemical Society1996;118:11225.
39. Yin DX, MacKerell AD Jr. Journal Of Computational Chemistry 1998;19:334.40. Chen IJ, Yin DX, MacKerell AD Jr. J Comput Chem 2002;23:199. [PubMed: 11924734]41. Oostenbrink C, Villa A, Mark AE, Van Gunsteren WF. J Comput Chem 2004;25:1656. [PubMed:
15264259]42. Kaminski GA, Stern HA, Berne BJ, Friesner RA. Journal Of Physical Chemistry A 2004;108:621.43. Dick BG, Overhauser AW. Phys Rev 1958;112:90.44. Pratt LR. Mol Phys 1980;40:347.45. Hanlon JE, Lawson AW. Phys Rev 1959;113:472.46. Lindan PJD. Mol Simul 1995;14:303.47. Stuart SJ, Berne BJ. J Phys Chem 1996;100:11934.48. van Maaren PJ, van der Spoel D. J Phys Chem B 2001;105:2618.49. Rick, SW.; Stuart, SJ. Reviews In Computational Chemistry. 18. Wiley-Vch, Inc; New York: 2002.
Potentials and algorithms for incorporating polarizability in computer simulations; p. 8950. Lamoureux G, Roux B. Journal Of Chemical Physics 2003;119:3025.51. Lamoureux G, MacKerell AD Jr, Roux B. J Chem Phys 2003;119:5185.52. Lamoureux G, Harder E, Vorobyov IV, Roux B, MacKerell AD Jr. Chem Phys Lett 2006;418:245.53. Noskov SY, Lamoureux G, Roux B. J Phys Chem B 2005;109:6705. [PubMed: 16851754]54. Vorobyov IV, Anisimov VM, MacKerell AD Jr. J Phys Chem B 2005;109:18988. [PubMed:
16853445]55. Anisimov VM, Vorobyov IV, Lamoureux G, Noskov S, Roux B, MacKerell AD Jr. Biophys J
2004;86:415A.56. Frisch, MJ.; Trucks, GW.; Schlegel, HB.; Scuseria, GE.; Robb, MA.; Cheeseman, JR.; Montgomery,
JJA.; Vreven, T.; Kudin, KN.; Burant, JC.; Millam, JM.; lyengar, SS.; Tomasi, J.; Barone, V.;Mennucci, B.; Cossi, M.; Scalmani, G.; Rega, N.; Petersson, GA.; Nakatsuji, H.; Hada, M.; Ehara,M.; Toyota, K.; Fukuda, R.; Hasegawa, J.; Ishida, M.; Nakajima, T.; Honda, Y.; Kitao, O.; Nakai,
Lopes et al. Page 14
J Phys Chem B. Author manuscript; available in PMC 2008 August 22.
NIH
-PA Author Manuscript
NIH
-PA Author Manuscript
NIH
-PA Author Manuscript
H.; Klene, M.; Li, X.; Knox, JE.; Hratchian, HP.; Cross, JB.; Bakken, V.; Adamo, C.; Jaramillo, J.;Gomperts, R.; Stratmann, RE.; Yazyev, O.; Austin, AJ.; Cammi, R.; Pomelli, C.; Ochterski, JW.;Ayala, PY.; Morokuma, K.; Voth, GA.; Salvador, P.; Dannenberg, JJ.; Zakrzewski, VG.; Dapprich,S.; Daniels, AD.; Strain, MC.; Farkas, O.; Malick, DK.; Rabuck, AD.; Raghavachari, K.; Foresman,JB.; Ortiz, JV.; Cui, Q.; Baboul, AG.; Clifford, S.; Cioslowski, J.; Stefanov, BB.; Liu, G.; Liashenko,A.; Piskorz, P.; Komaromi, I.; Martin, RL.; Fox, DJ.; Keith, T.; Al-Laham, MA.; Peng, CY.;Nanayakkara, A.; Challacombe, M.; Gill, PMW.; Johnson, B.; Chen, W.; Wong, MW.; Gonzalez,C.; Pople, JA. Gaussian 03. Revision C.02. Gaussian, Inc; Wallingford CT: 2004.
57. Foloppe N, MacKerell AD Jr. J Phys Chem B 1998;102:6669.58. Foloppe N, MacKerell AD Jr. J Comp Chem 2000;21:86.59. Becke AD. Physical Review A 1988;38:3098. [PubMed: 9900728]60. Becke AD. Journal Of Chemical Physics 1993;98:5648.61. Lee CT, Yang WT, Parr RG. Theochem-Journal Of Molecular Structure 1988;40:305.62. Dunning TH. Journal Of Chemical Physics 1989;90:1007.63. Scott AP, Radom L. J Phys Chem 1996;100:16502.64. Pulay P, Fogarasi G, Pang F, Boggs JE. J Am Chem Soc 1979;101:2550.65. Brooks BR, Bruccoleri RE, Olafson BD, States DJ, Swaminathan SKM. J Comp Chem 1983;4:187.66. MacKerell, AD., Jr; Brooks, B.; Brooks, CL., III; Nilsson, L.; Roux, B.; Won, Y.; Karplus, M.
CHARMM: The Energy Function and Its Paramerization with an Overview of the Program. In:Schleyer, PvR; Allinger, NL.; Clark, T.; Gasteiger, J.; Kollman, PA.; Schaefer, HF., III; Schreiner,PR., editors. Encyclopedia of Computational Chemistry. 1. John Wiley & Sons; Chichester, UK:1998. p. 271
67. Anisimov VM, Lamoureux G, Vorobyov IV, Huang N, Roux B, MacKerell AD. Journal Of ChemicalTheory And Computation 2005;1:153.
68. Thole BT. Chem Phys 1981;59:341.69. Ryckaert JP, Ciccotti G, Berendsen HJC. Journal of Computational Physics 1977;23:327.70. Darden T, York D, Pedersen L. Journal Of Chemical Physics 1993;98:10089.71. Lague P, Pastor RW, Brooks BR. Journal Of Physical Chemistry B 2004;108:363.72. Allen, MP.; Tildesley, DJ. Computer Simulation of Liquids. Clarendon Press; Oxford: 1994.73. William LJ, Jayaraman C, Jeffry DM, Roger WI, Michael LK. J Chem Phys 1983;79:926.74. McCool MA, Collings AF, Woolf LA. J Chem Soc, Faraday Trans 1 1972;68:1489.75. Harris KR, Alexander JJ, Goscinska T, Malhotra R, Woolf LA, Dymond JH. Molecular Physics
1993;78:235.76. Levine, IN. Physical Chemistry. McGraw-Hill; 2001.77. Daura X, Mark AE, van Gunsteren WF. Journal Of Computational Chemistry 1998;19:535.78. Yeh IC, Hummer G. Journal Of Physical Chemistry B 2004;108:15873.79. Boresch S, Willensdorfer M, Steinhauser O. J Chem Phys 2004;120:3333. [PubMed: 15268487]80. Bonin, KD.; Kresin, VV. Electric-Dipole Polarizabilities of Atoms, Molecules and Clusters. World
Scientific; River Edge, NJ: 1997.81. Neumann M. Chem Phys Letters 1984;106:563.82. Kollman P. Chem Rev 1993;93:2395.83. Deng YQ, Roux B. J Phys Chem B 2004;108:16567.84. Weeks JD, Chandler D, Andersen HC. J Chem Phys 1971;54:5237.85. Kumar S, Bouzida D, Swendsen RH, Kollman PA, Rosenberg JM. Journal of Computational
Chemistry 1992;13:1011.86. Shimanouchi, T. Tables of Molecular Vibrational Frequencies Consolidated. I. National Bureau of
Standards; 1972.87. Feller SE, MacKerell AD Jr. J Phys Chem B 2000;104:7510.88. Anisimov VM, Lamoureux G, Vorobyov IV, Huang N, Roux B, MacKerell AD Jr. J Chem Theory
Comput 2005;1:153.89. MacKerell AD Jr. J Comput Chem 2004;25:1584. [PubMed: 15264253]
Lopes et al. Page 15
J Phys Chem B. Author manuscript; available in PMC 2008 August 22.
NIH
-PA Author Manuscript
NIH
-PA Author Manuscript
NIH
-PA Author Manuscript
90. Allen FH. Acta Crystallographica Section B-Structural. Science 2002;58:380.91. Tsuzuki S, Uchimaru T, Matsumura K, Mikami M, Tanabe K. Chem Phys Lett 2000;319:547.92. Tran F, Weber J, Wesolowski TA. Helv Chim Acta 2001;84:1489.93. Tsuzuki S, Uchimaru T, Sugawara K, Mikami M. J Chem Phys 2002;117:11216.94. Sinnokrot MO, Valeev EF, Sherrill CD. J Am Chem Soc 2002;124:10887. [PubMed: 12207544]95. Tsuzuki S, Honda K, Uchimaru T, Mikami M, Tanabe K. J Am Chem Soc 2002;124:104. [PubMed:
11772067]96. Sinnokrot MO, Sherrill CD. J Phys Chem A 2004;108:10200.97. Cacelli I, Cinacchi G, Prampolini G, Tani A. J Am Chem Soc 2004;126:14278. [PubMed: 15506796]98. Diedrich C, Luchow A, Grimme S. J Chem Phys 2005:123.99. Sato T, Tsuneda T, Hirao K. J Chem Phys 2005:123.100. Zhao Y, Truhlar DG. J Phys Chem A 2005;109:4209. [PubMed: 16833747]101. Zhikol OA, Shishkin OV, Lyssenko KA, Leszczynski J. J Chem Phys 2005:122.102. Podeszwa R, Bukowski R, Szalewicz K. J Phys Chem A 2006;110:10345. [PubMed: 16928128]103. Lopes PEM, MacKerell AD Jr. to be published soon104. Egelstaff, PA. An Introduction to the Liquid State. 2. 7. Oxford University Press; 1994.105. Narten AH. The Journal of Chemical Physics 1968;48:1630.106. Narten AH. The Journal of Chemical Physics 1968;67:2102.107. Tassaing T, Cabaco MI, Danten Y, Besnard M. Journal Of Chemical Physics 2000;113:3757.108. Evans DJ. Molecular Physics 1976;32:93.109. Lide, DR., editor. CRC Handbook of Chemistry and Physics. 84. Taylor and Francis; Boca Raton,
FL: 2003.110. Backx P, Goldman S. J Phys Chem 1998;85:2975.111. Levitt M, Perutz MF. Journal Of Molecular Biology 1988;201:751. [PubMed: 3172202]112. Suzuki S, Green PG, Bumgarner RE, Dasgupta S, Goddard WA, Blake GA. Science 1992;257:942.
[PubMed: 17789637]113. Linse P, Karlstrom G, Jonssont B. J Am Chem Soc 1984;106:4096.114. Ravishanker G, Mehrotra PK, Mezei M, Beveridge DL. J Am Chem Soc 1984;106:4102.115. Linse P. Journal Of The American Chemical Society 1990;112:1744.116. Laaksonen A, Stilbs P, Wasylishen RE. Journal Of Chemical Physics 1998;108:455.117. Raschke TM, Levitt M. Journal Of Physical Chemistry B 2004;108:13492.118. Jorgensen WL, Severance DL. Journal Of The American Chemical Society 1990;112:4768.119. Shoemaker RL, Flygare WH. J Chem Phys 1969;51:2988.120. Stolze WH, Stolze M, Hubner D, Sutter DH. Z Naturforsch A 1982;37:1165.121. Spackman MA. Chem Rev 1992;92:1769.122. Dennis GR, Ritchie GLD. J Phys Chem 1991;95:656.123. Battaglia MR, Buckingham AD, Williams JH. Chem Phys Lett 1981;78:421.124. Poling, BE.; Prausnitz, JM.; O’Connell, JP. The Properties of Gases and Liquids. 5. McGraw-Hill
Companies, Inc; Boston: 2001.125. Linstrom, PJ.; Mallard, WG., editors. NIST Chemistry WebBook, NIST Standard Reference
Database No. 69. National Institute of Standards and Technology; Gaithersburg, MD 20899: 2005.126. Cibulka L, Takagi T. J Chem Eng Data 1999;44:1105.
Lopes et al. Page 16
J Phys Chem B. Author manuscript; available in PMC 2008 August 22.
NIH
-PA Author Manuscript
NIH
-PA Author Manuscript
NIH
-PA Author Manuscript
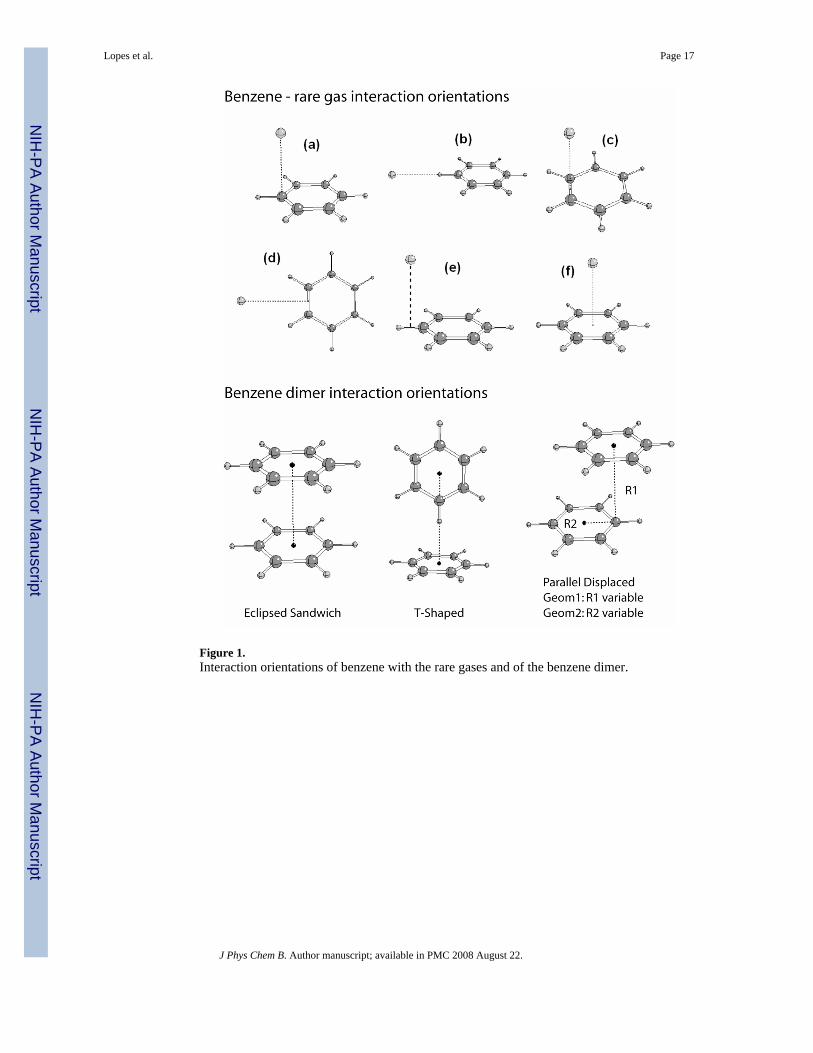
Figure 1.Interaction orientations of benzene with the rare gases and of the benzene dimer.
Lopes et al. Page 17
J Phys Chem B. Author manuscript; available in PMC 2008 August 22.
NIH
-PA Author Manuscript
NIH
-PA Author Manuscript
NIH
-PA Author Manuscript
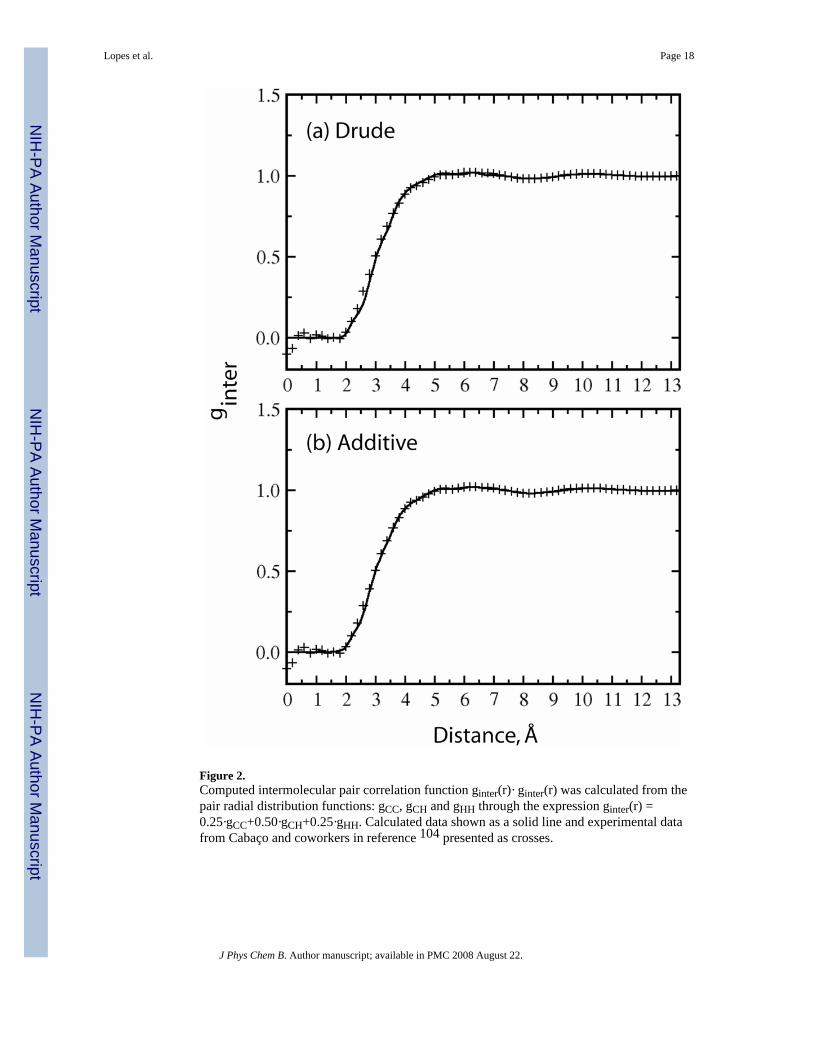
Figure 2.Computed intermolecular pair correlation function ginter(r)· ginter(r) was calculated from thepair radial distribution functions: gCC, gCH and gHH through the expression ginter(r) =0.25·gCC+0.50·gCH+0.25·gHH. Calculated data shown as a solid line and experimental datafrom Cabaço and coworkers in reference 104 presented as crosses.
Lopes et al. Page 18
J Phys Chem B. Author manuscript; available in PMC 2008 August 22.
NIH
-PA Author Manuscript
NIH
-PA Author Manuscript
NIH
-PA Author Manuscript
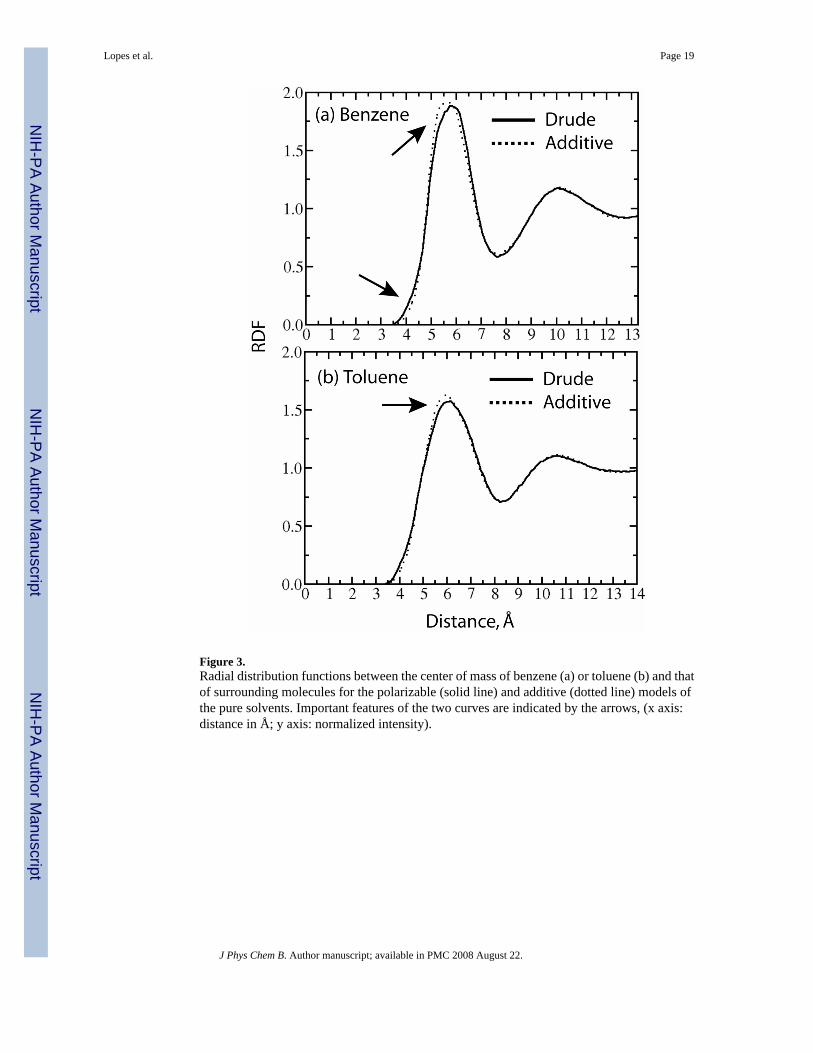
Figure 3.Radial distribution functions between the center of mass of benzene (a) or toluene (b) and thatof surrounding molecules for the polarizable (solid line) and additive (dotted line) models ofthe pure solvents. Important features of the two curves are indicated by the arrows, (x axis:distance in Å; y axis: normalized intensity).
Lopes et al. Page 19
J Phys Chem B. Author manuscript; available in PMC 2008 August 22.
NIH
-PA Author Manuscript
NIH
-PA Author Manuscript
NIH
-PA Author Manuscript
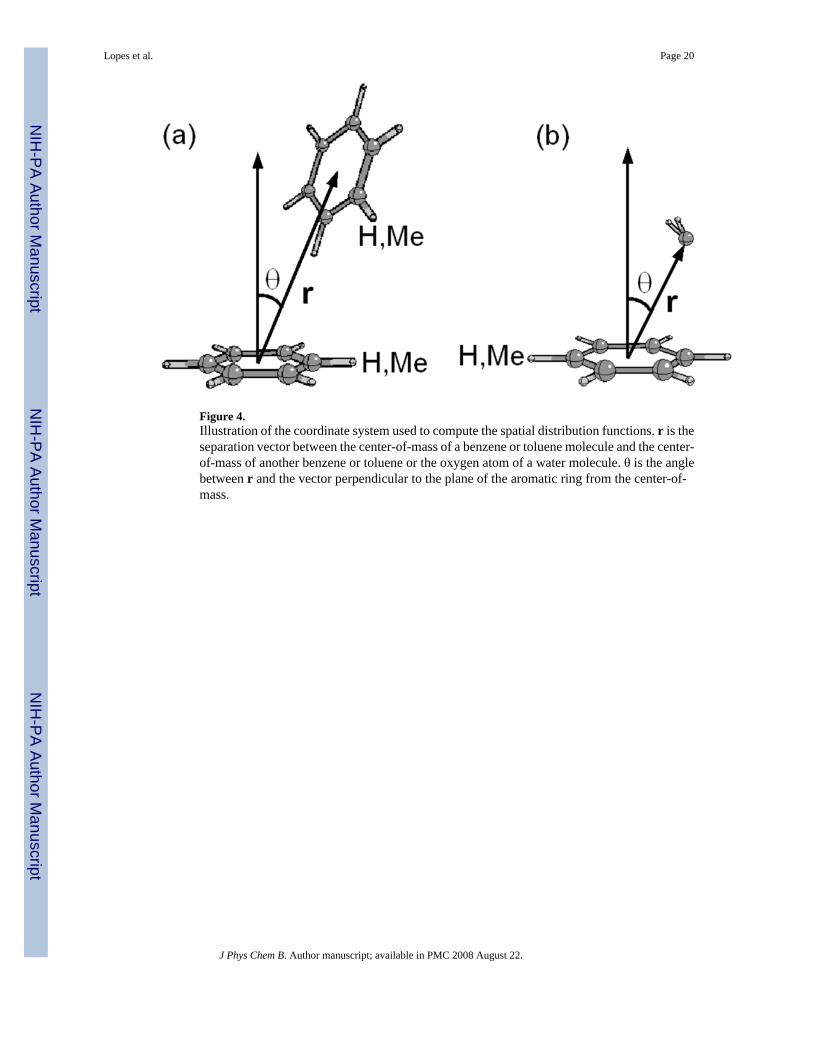
Figure 4.Illustration of the coordinate system used to compute the spatial distribution functions. r is theseparation vector between the center-of-mass of a benzene or toluene molecule and the center-of-mass of another benzene or toluene or the oxygen atom of a water molecule. θ is the anglebetween r and the vector perpendicular to the plane of the aromatic ring from the center-of-mass.
Lopes et al. Page 20
J Phys Chem B. Author manuscript; available in PMC 2008 August 22.
NIH
-PA Author Manuscript
NIH
-PA Author Manuscript
NIH
-PA Author Manuscript
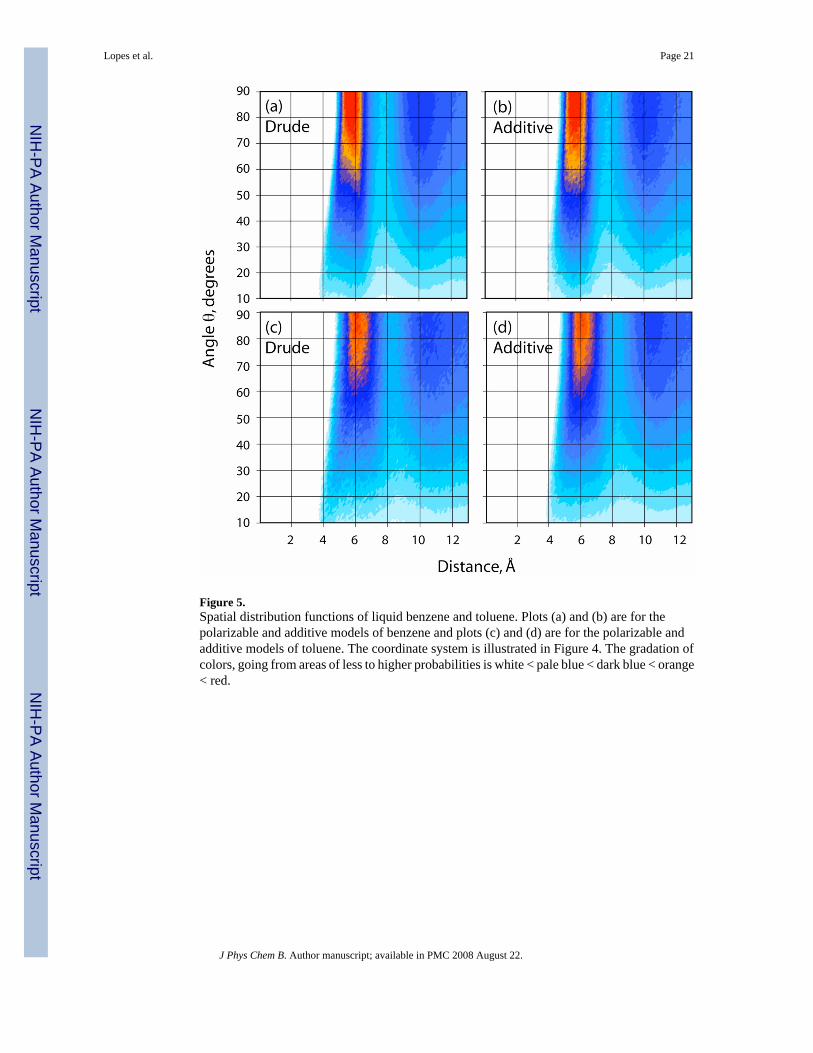
Figure 5.Spatial distribution functions of liquid benzene and toluene. Plots (a) and (b) are for thepolarizable and additive models of benzene and plots (c) and (d) are for the polarizable andadditive models of toluene. The coordinate system is illustrated in Figure 4. The gradation ofcolors, going from areas of less to higher probabilities is white < pale blue < dark blue < orange< red.
Lopes et al. Page 21
J Phys Chem B. Author manuscript; available in PMC 2008 August 22.
NIH
-PA Author Manuscript
NIH
-PA Author Manuscript
NIH
-PA Author Manuscript

Figure 6.Illustration of typical interactions occurring between benzene molecules (panels a and b) andbetween benzene and water (panels c and d). Panel (a) represents benzene-benzene T-shapedtype of interaction (Figure 1) and (b) shows benzene-benzene interactions similar the eclipsedsandwich and parallel displaced orientations from the polarizable pure benzene simulation.Panel (c) represents a water interacting with the centroid of the benzene ring corresponding tothe region of 3.3 Å and 10 – 20° in Figure 8 and (d) shows typical interactions of water aroundthe edge of the benzene ring corresponding to the region of 4 – 6 Å and 40 to 90° in Figure 8from the polarizable benzene-water simulation.
Lopes et al. Page 22
J Phys Chem B. Author manuscript; available in PMC 2008 August 22.
NIH
-PA Author Manuscript
NIH
-PA Author Manuscript
NIH
-PA Author Manuscript
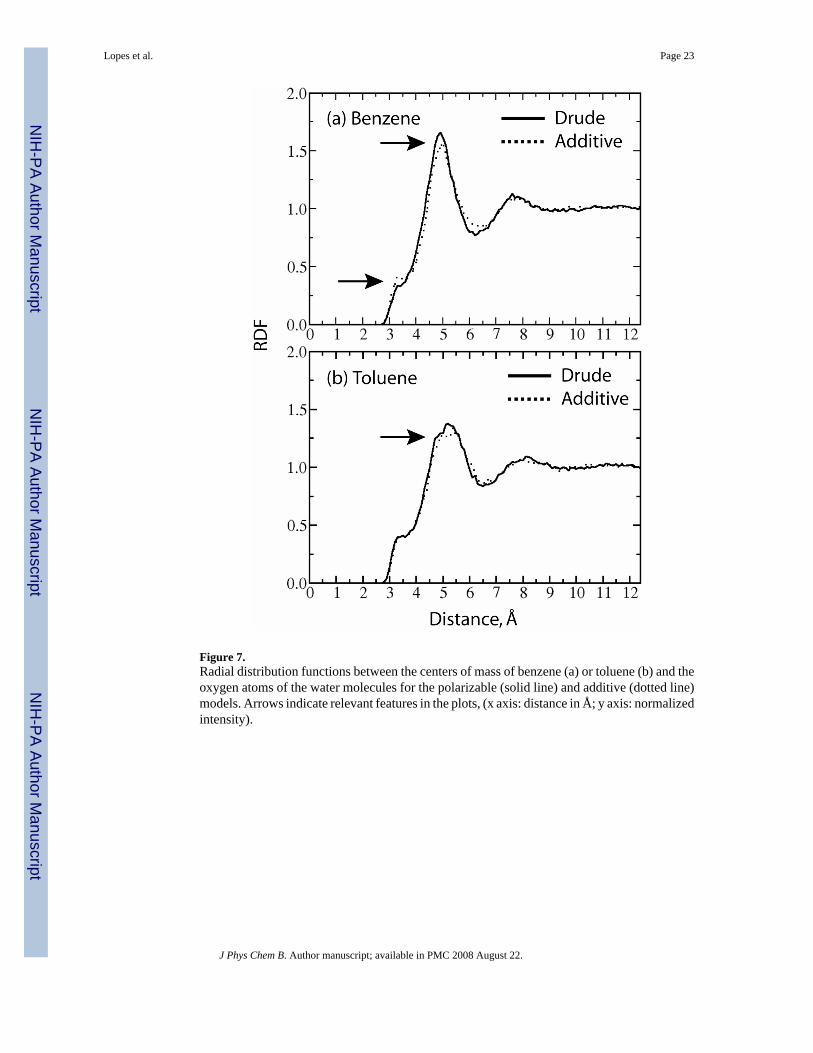
Figure 7.Radial distribution functions between the centers of mass of benzene (a) or toluene (b) and theoxygen atoms of the water molecules for the polarizable (solid line) and additive (dotted line)models. Arrows indicate relevant features in the plots, (x axis: distance in Å; y axis: normalizedintensity).
Lopes et al. Page 23
J Phys Chem B. Author manuscript; available in PMC 2008 August 22.
NIH
-PA Author Manuscript
NIH
-PA Author Manuscript
NIH
-PA Author Manuscript

Figure 8.Spatial distribution functions of aqueous solutions of benzene and toluene. Plots (a) and (b)are for the polarizable and additive models of benzene in water. Plots (c) and (d) are for thepolarizable and additive models of toluene in water. The coordinate system is illustrated inFigure 4. The gradation of colors, going from areas of less to higher probabilities is white <pale blue < dark blue < orange < red.
Lopes et al. Page 24
J Phys Chem B. Author manuscript; available in PMC 2008 August 22.
NIH
-PA Author Manuscript
NIH
-PA Author Manuscript
NIH
-PA Author Manuscript
NIH
-PA Author Manuscript
NIH
-PA Author Manuscript
NIH
-PA Author Manuscript
Lopes et al. Page 25Ta
ble
1D
ipol
e (in
Deb
ye) a
nd q
uadr
apol
e m
omen
ts (i
n au
) for
diff
eren
t mod
els o
f ben
zene
and
tolu
ene.
(1 a
u ≈
4.48
66 ×
10−
40 C
·m2 ≈
1.3
450
Buc
king
ham
)
Met
hod
μθ α
αθ β
βθ χ
χR
ef
Ben
zene
Dru
dea
02.
672.
67−5
.34
Dru
deb
03.
583.
58−7
.15
C22
04.
504.
50−9
.00
Zeem
an3.
253.
25−6
.50
119
Zeem
an3.
163.
25−6
.32
120
X-R
ay3.
203.
20−6
.40
121
Bire
frin
genc
e3.
163.
16−6
.31
122
Bire
frin
genc
e3.
233.
23−6
.46
123
Tolu
ene
Dru
deb
0.42
0−4
.47
2.18
2.29
C22
0.12
2−5
.17
2.57
2.59
Expe
rimen
tc0.
375
109
a Pola
rizab
le m
odel
with
uns
eale
d ch
arge
s.
b Pola
rizab
le m
odel
with
cha
rges
scal
ed b
y 0.
7.
c Met
hodo
logy
unk
now
n
J Phys Chem B. Author manuscript; available in PMC 2008 August 22.
NIH
-PA Author Manuscript
NIH
-PA Author Manuscript
NIH
-PA Author Manuscript
Lopes et al. Page 26
Table 2RMS fluctuations about the average differences and ratios between the QM and CHARMM minimum interactionenergies and distances for the benzene-rare gas interactions.*
Rmin(Å) Emin (kcal/mol)Complex Drude C22 Drude C22
DifferenceBenzene/Hea 0.1292 0.1325 0.0211 0.0243Benzene/Heb 0.1243 0.0239Benzene/Nea 0.0564 0.0564 0.0684 0.0708Benzene/Neb 0.0577 0.0651
RatioBenzene/Hea 0.0478 0.0492 0.1907 0.1962Benzene/Heb 0.0482 0.1827Benzene/Nea 0.0167 0.0190 0.0874 0.0891Benzene/Neb 0.0171 0.0823*RMS fluctuations were calculated as in Yin and MacKerell.39
aPolarizable model with unsealed charges.
bPolarizable model with charges scaled by 0.7.
J Phys Chem B. Author manuscript; available in PMC 2008 August 22.
NIH
-PA Author Manuscript
NIH
-PA Author Manuscript
NIH
-PA Author Manuscript
Lopes et al. Page 27Ta
ble
3B
enze
ne d
imer
min
imum
inte
ract
ion
ener
gies
and
geo
met
ries
Ori
enta
tion
Inte
ract
ion
Ene
rgie
s, kc
al/m
olD
ista
nces
, ÅPo
lar
QM
Em
piri
cal
Diff
QM
Em
piri
cal
Diff
Sand
wic
hed
−1.8
1−1
.91
−0.1
03.
903.
75−0
.15
T-Sh
aped
−2.7
4−2
.40
0.34
5.00
5.11
0.11
P-D
ispl
aced
1−2
.78
−2.2
80.
503.
603.
600.
00P-
Dis
plac
ed 2
−2.7
8−2
.36
0.42
1.60
2.10
0.50
Pola
r, 0.
7 sc
aled
cha
rges
Sand
wic
hed
−1.8
1−2
.62
−0.8
13.
903.
70−0
.20
T-Sh
aped
−2.7
4−2
.07
0.67
5.00
5.15
0.15
P-D
ispl
aced
1−2
.78
−2.6
90.
093.
603.
58−0
.02
P-D
ispl
aced
2−2
.78
−2.7
00.
081.
601.
39−0
.21
C22
Sand
wic
hed
−1.8
1−1
.85
−0.0
43.
903.
76−0
.14
T-Sh
aped
−2.7
4−2
.15
0.59
5.00
5.15
0.15
P-D
ispl
aced
1−2
.78
−2.1
20.
663.
603.
630.
03P-
Dis
plac
ed 2
−2.7
8−2
.19
0.59
1.60
2.10
0.50
Inte
ract
ion
orie
ntat
ions
in F
igur
e 1.
J Phys Chem B. Author manuscript; available in PMC 2008 August 22.
NIH
-PA Author Manuscript
NIH
-PA Author Manuscript
NIH
-PA Author Manuscript
Lopes et al. Page 28Ta
ble
4C
ompa
rison
of e
mpi
rical
and
exp
erim
enta
l hea
ts o
f vap
oriz
atio
n an
d de
nsiti
es o
f nea
t ben
zene
and
tolu
ene
Dru
deC
22E
xper
imen
tal d
ataa
T(K
)V
m(Å
3 )ΔH
vap
Vm
(Å3 )
ΔHva
pV
m(Å
3 )ΔH
vap
Ben
zene
298.
214
7.46
±0.7
18.
01±0
.03
151.
97±0
.72
7.53
±0.0
314
8.00
8.08
Ben
zene
353.
315
9.29
±1.0
97.
33±0
.04
166.
01±0
.83
6.74
±0.0
415
8.40
b7.
34c
Tolu
ene
298.
217
5.64
±0.3
89.
12±0
.04
180.
43±0
.19
8.47
±0.0
517
6.51
9.08
Tolu
ene
383.
819
5.81
±0.8
57.
83±0
.04
203.
85±1
.52
7.31
±0.0
219
5.06
b7.
93c
Expe
rimen
tal d
ata
from
ref1
09.
From
eqs
4–1
1.4a
and
4–1
1.5
of re
f124
.
Expe
rimen
tal d
ata
from
ref1
25.
J Phys Chem B. Author manuscript; available in PMC 2008 August 22.

NIH
-PA Author Manuscript
NIH
-PA Author Manuscript
NIH
-PA Author Manuscript
Lopes et al. Page 29Ta
ble
5C
ompa
rison
of e
xper
imen
tal a
nd c
alcu
late
d fr
ee e
nerg
ies o
f sol
vatio
n in
aqu
eous
solu
tion
for b
enze
ne a
nd to
luen
e
Ben
zene
Tol
uene
Dru
deC
22E
xpt.
Dru
deC
22E
xpt.
ΔGre
p14
.61±
0.11
12.7
3ΔG
rep
17.0
0±0.
2114
.69
Δ G
disp
14.2
4±0.
09−1
2.05
ΔGdi
sp16
.32±
0.07
−13.
82ΔG
np0.
37±0
.20
0.68
ΔGnp
0.68
±0.2
10.
87ΔG
el−1
.43±
0.06
−1.8
0ΔG
el−2
.00±
0.02
−1.6
9ΔG
sol
−1.0
6±0.
22−1
.12
−0.8
6ΔG
sol
−1.3
2±0.
21−0
.83
−0.8
9
J Phys Chem B. Author manuscript; available in PMC 2008 August 22.

NIH
-PA Author Manuscript
NIH
-PA Author Manuscript
NIH
-PA Author Manuscript
Lopes et al. Page 30
Table 6Comparison of experimental and calculated dielectric constant of liquid benzene and toluene
Dielectric constant (a) Heat capacity (cal·mol−1K−1)Benzene toluene benzene toluene
Expt. 2.2825 2.3790 32.49 37.59Drude 2.1369(ε∞)
2.1799 (ε)2.3374 (ε∞)2.5642 (ε)
38.50±0.35 46.38±0.35
C22 1.0247 (ε) 1.0369 (ε) 40.95±0.28 51.84±6.78aExperimental data from ref 109
J Phys Chem B. Author manuscript; available in PMC 2008 August 22.
NIH
-PA Author Manuscript
NIH
-PA Author Manuscript
NIH
-PA Author Manuscript
Lopes et al. Page 31
Table 7Comparison of experimental and calculated isothermal compressibilities of liquid benzene and toluene. Units areGpa−1
Temperature (K) Drude C22 Exp.aBenzene 288.2 0.693±0.214 0.842±0.179 0.907Benzene 298.2 0.825±0.124 0.976±0.099 0.969Benzene 313.2 0.877±0.135 1.129±0.085 1.098Benzene 328.2 1.112±0.096 1.386±0.138 1.178*Toluene 273.2 0.745±0.162 0.667±0.058 0.784Toluene 298.2 0.872±0.300 0.882±0.110 0.915Toluene 325.7 1.269±0.107 1.389±0.053 1.092*aaverage of experimental values from ref126.
*experimental value obtained at 323.2 K
J Phys Chem B. Author manuscript; available in PMC 2008 August 22.

NIH
-PA Author Manuscript
NIH
-PA Author Manuscript
NIH
-PA Author Manuscript
Lopes et al. Page 32
Table 8Comparison of experimental and calculated self-diffusion coefficients of liquid benzene and toluene
Drude C22 ExpT(K) 105·D (cm2·s−1) 105·D (cm2·s−1) 105·D (cm2·s−1)
Benzene 288.2 1.85±0.16 1.85±0.18 1.85a
Benzene 298.2 2.26±0.14 2.17±0.17 2.20Benzene 313.2 2.95±0.41 2.70±0.15 2.79Benzene 328.2 3.45±0.18 3.66±0.52 3.66Toluene 273.3 1.38±0.12 1.35±0.12 1.54Toluene 298.2 1.97±0.17 2.08±0.18 2.28Toluene 325.7 3.35±0.13 3.35±0.11 3.22
J Phys Chem B. Author manuscript; available in PMC 2008 August 22.