Polar front associated variation in prokaryotic community structure in Arctic shelf seafloor
12
ORIGINAL RESEARCH ARTICLE published: 23 January 2015 doi: 10.3389/fmicb.2015.00017 Polar front associated variation in prokaryotic community structure in Arctic shelf seafloor Tan T. Nguyen 1 * and Bjarne Landfald 2 1 Centre for Research-based Innovation on Marine Bioactives and Drug Discovery (MabCent-SFI), UiT The Arctic University of Norway, Tromsø, Norway 2 Faculty of Biosciences, Fisheries and Economics, Norwegian College of Fishery Science, UiT The Arctic University of Norway, Tromsø, Norway Edited by: Jürg Brendan Logue, Lund University, Sweden Reviewed by: Mark Alexander Lever, ETH Zürich, Switzerland Marie-Ève Garneau, University of Zurich, Switzerland *Correspondence: Tan T. Nguyen, Faculty of Biosciences, Fisheries and Economics, Norwegian College of Fishery Science, UiT The Arctic University of Norway, Breivika, N-9037, Tromsø, Norway e-mail: [email protected] Spatial variations in composition of marine microbial communities and its causes have largely been disclosed in studies comprising rather large environmental and spatial differences. In the present study, we explored if a moderate but temporally permanent climatic division within a contiguous arctic shelf seafloor was traceable in the diversity patterns of its bacterial and archaeal communities. Soft bottom sediment samples were collected at 10 geographical locations, spanning spatial distances of up to 640 km, transecting the oceanic polar front in the Barents Sea. The northern sampling sites were generally colder, less saline, shallower, and showed higher concentrations of freshly sedimented phytopigments compared to the southern study locations. Sampling sites depicted low variation in relative abundances of taxa at class level, with persistent numerical dominance by lineages of Gamma- and Deltaproteobacteria (57–66% of bacterial sequence reads). The Archaea, which constituted 0.7–1.8% of 16S rRNA gene copy numbers in the sediment, were overwhelmingly (85.8%) affiliated with the Thaumarchaeota. Beta-diversity analyses showed the environmental variations throughout the sampling range to have a stronger impact on the structuring of both the bacterial and archaeal communities than spatial effects. While bacterial communities were significantly influenced by the combined effect of several weakly selective environmental differences, including temperature, archaeal communities appeared to be more uniquely structured by the level of freshly sedimented phytopigments. Keywords: archaea, bacteria, Barents Sea, beta-diversity, sediment, 16S rRNA gene INTRODUCTION Microbial community similarities tend to show a distance decay relationship, implying that the phylogenetic composition of communities becomes increasingly dissimilar with increasing geographical distance. It is now generally accepted that both contemporary environmental parameters and historical contin- gencies, maintained by dispersal limitation, may contribute to this beta-diversity. Hence, the classical Baas Becking statement “Everything is everywhere, but the environment selects” is ques- tioned as a universal model for explaining the observed variation in microbial community composition (Hedlund and Staley, 2003; Martiny et al., 2006; Hanson et al., 2012). In the conceptual framework of metacommunity ecology (Leibold et al., 2004; Logue and Lindström, 2008) this emphasis on local environmen- tal factors vs. spatial (regional) effects largely coincides with the distinction between species sorting and mass effects as the two models best explaining microbial community assembly dynam- ics (Lindström and Langenheder, 2012). The disentanglement of these different effects is, however, not trivial in many systems due to spatial autocorrelation or co-variations among environmental variables (Horner-Devine et al., 2004; Böer et al., 2009; Zinger et al., 2011; Bienhold et al., 2012; Jacob et al., 2013; Wang et al., 2013). The microbial communities in the upper sediment layers in marine environments show a steeper decay in similarity with distance than assemblies of the pelagic water masses, which may be attributed to more pronounced environmental gradients within the sediments and more restricted dispersal of sediment microorganisms. Additionally, the more heterogeneous environ- ments in coastal areas have been found to generate steeper gradi- ents than such found in the open ocean both in the seawater and sediments (Zinger et al., 2014). The environmental conditions on the continental shelf seafloors may in several respects be char- acterized as intermediate between those of the deep ocean and the shallow coastal areas. Due to the combination of less water depth and frequently much higher primary production than in the open oceans, the shelf sediments will receive higher influxes of sedimentary material (Suess, 1980) that sustain stronger het- erotrophic activity. The bottom-dwelling fauna, including bio- turbating animals (Bertics and Ziebis, 2009) and demersal fishes, contributes to resuspension of sediment particles into the water column, as anthropogenic influences (e.g., from bottom trawl- ing) may do as well. Moreover, because ocean currents, including tidal currents, have often been found to be of great importance at the shelf seafloors, microorganisms are likely dispersed quite effi- ciently, thereby making mass effects a potentially import factor www.frontiersin.org January 2015 | Volume 6 | Article 17 | 1
Transcript of Polar front associated variation in prokaryotic community structure in Arctic shelf seafloor

ORIGINAL RESEARCH ARTICLEpublished: 23 January 2015
doi: 10.3389/fmicb.2015.00017
Polar front associated variation in prokaryotic communitystructure in Arctic shelf seafloorTan T. Nguyen1* and Bjarne Landfald2
1 Centre for Research-based Innovation on Marine Bioactives and Drug Discovery (MabCent-SFI), UiT The Arctic University of Norway, Tromsø, Norway2 Faculty of Biosciences, Fisheries and Economics, Norwegian College of Fishery Science, UiT The Arctic University of Norway, Tromsø, Norway
Edited by:
Jürg Brendan Logue, LundUniversity, Sweden
Reviewed by:
Mark Alexander Lever, ETH Zürich,SwitzerlandMarie-Ève Garneau, University ofZurich, Switzerland
*Correspondence:
Tan T. Nguyen, Faculty ofBiosciences, Fisheries andEconomics, Norwegian College ofFishery Science, UiT The ArcticUniversity of Norway, Breivika,N-9037, Tromsø, Norwaye-mail: [email protected]
Spatial variations in composition of marine microbial communities and its causes havelargely been disclosed in studies comprising rather large environmental and spatialdifferences. In the present study, we explored if a moderate but temporally permanentclimatic division within a contiguous arctic shelf seafloor was traceable in the diversitypatterns of its bacterial and archaeal communities. Soft bottom sediment samples werecollected at 10 geographical locations, spanning spatial distances of up to 640 km,transecting the oceanic polar front in the Barents Sea. The northern sampling sites weregenerally colder, less saline, shallower, and showed higher concentrations of freshlysedimented phytopigments compared to the southern study locations. Sampling sitesdepicted low variation in relative abundances of taxa at class level, with persistentnumerical dominance by lineages of Gamma- and Deltaproteobacteria (57–66% ofbacterial sequence reads). The Archaea, which constituted 0.7–1.8% of 16S rRNAgene copy numbers in the sediment, were overwhelmingly (85.8%) affiliated with theThaumarchaeota. Beta-diversity analyses showed the environmental variations throughoutthe sampling range to have a stronger impact on the structuring of both the bacterial andarchaeal communities than spatial effects. While bacterial communities were significantlyinfluenced by the combined effect of several weakly selective environmental differences,including temperature, archaeal communities appeared to be more uniquely structured bythe level of freshly sedimented phytopigments.
Keywords: archaea, bacteria, Barents Sea, beta-diversity, sediment, 16S rRNA gene
INTRODUCTIONMicrobial community similarities tend to show a distance decayrelationship, implying that the phylogenetic composition ofcommunities becomes increasingly dissimilar with increasinggeographical distance. It is now generally accepted that bothcontemporary environmental parameters and historical contin-gencies, maintained by dispersal limitation, may contribute tothis beta-diversity. Hence, the classical Baas Becking statement“Everything is everywhere, but the environment selects” is ques-tioned as a universal model for explaining the observed variationin microbial community composition (Hedlund and Staley, 2003;Martiny et al., 2006; Hanson et al., 2012). In the conceptualframework of metacommunity ecology (Leibold et al., 2004;Logue and Lindström, 2008) this emphasis on local environmen-tal factors vs. spatial (regional) effects largely coincides with thedistinction between species sorting and mass effects as the twomodels best explaining microbial community assembly dynam-ics (Lindström and Langenheder, 2012). The disentanglement ofthese different effects is, however, not trivial in many systems dueto spatial autocorrelation or co-variations among environmentalvariables (Horner-Devine et al., 2004; Böer et al., 2009; Zingeret al., 2011; Bienhold et al., 2012; Jacob et al., 2013; Wang et al.,2013).
The microbial communities in the upper sediment layers inmarine environments show a steeper decay in similarity withdistance than assemblies of the pelagic water masses, whichmay be attributed to more pronounced environmental gradientswithin the sediments and more restricted dispersal of sedimentmicroorganisms. Additionally, the more heterogeneous environ-ments in coastal areas have been found to generate steeper gradi-ents than such found in the open ocean both in the seawater andsediments (Zinger et al., 2014). The environmental conditions onthe continental shelf seafloors may in several respects be char-acterized as intermediate between those of the deep ocean andthe shallow coastal areas. Due to the combination of less waterdepth and frequently much higher primary production than inthe open oceans, the shelf sediments will receive higher influxesof sedimentary material (Suess, 1980) that sustain stronger het-erotrophic activity. The bottom-dwelling fauna, including bio-turbating animals (Bertics and Ziebis, 2009) and demersal fishes,contributes to resuspension of sediment particles into the watercolumn, as anthropogenic influences (e.g., from bottom trawl-ing) may do as well. Moreover, because ocean currents, includingtidal currents, have often been found to be of great importance atthe shelf seafloors, microorganisms are likely dispersed quite effi-ciently, thereby making mass effects a potentially import factor
www.frontiersin.org January 2015 | Volume 6 | Article 17 | 1

Nguyen and Landfald Prokaryotic diversity in marine sediment
in the establishment of microbial community assemblies in thishabitat type.
The Barents Sea (1.4 mill km2) is part of the circumpolarArctic Continental Shelf. It extends northwards from the north-ern coasts of Norway and Russia to the Arctic Ocean, and isdelimited by the Novaya Zemlya and the Norwegian Sea along theeast-west axis. With an average depth of 230 m, it is the deepest ofthe Arctic shelf seas. It is also characterized by less coastal erosionand river water inflow than other Arctic shelf seas (Vetrov andRomankevich, 2004). The most distinctive oceanographic featureof the Barents Sea is, however, the influx of temperate and saltyAtlantic water from the southwest. These water masses meet andmix with sub-zero, less saline Arctic Ocean water from the north,resulting in a coarse division of the Barents Sea into a northernand a southern region separated by a transition zone named thepolar front (Ingvaldsen and Loeng, 2009). The temperature dif-ferences are most pronounced in the surface waters, resulting inwinter sea ice covering the northern regions, while the southernparts of the Barents Sea are ice-free throughout the entire year.Near the seafloor, the temperature difference is modest, i.e., about2◦C, and it has even shown a diminishing trend in recent years(Lind and Ingvaldsen, 2012). The overall primary production ishighest in the southern parts (Sakshaug et al., 2009) but the depo-sition of organic material shows a more patchy pattern, caused byadditional factors like water depth, bottom topography and localcurrents (Vetrov and Romankevich, 2004).
On this background, the primary aim of present study was toexplore if significant community variations could be detected in asampling area, which encompassed the moderate environmentalvariations of the Barents Sea polar front. And if such variationswere detectable, should they be attributed to environmental orspatial effects, or both. Beta-diversity analyses were based on16S rRNA gene sequence data obtained by 454 pyrosequencing.Additionally, the study provided a comprehensive picture of theprokaryotic alpha-diversities in the upper centimeters of this kindof arctic shelf seafloor.
MATERIALS AND METHODSSAMPLINGSediment samples were taken from 10 locations in the westernBarents Sea separated by up to 640 km. Sampling was carriedout over the course of 3 days from 20th to 23rd May 2009. Thesampling was done along a curved transect that followed the grad-ually more shallow Bear Island – Hopen channel from close to thecontinental slope to east of the Svalbard archipelago (Figure 1).Seawater temperature and salinity, as measured within 10 m of theseafloor by a CTD instrument, were used as proxies for seafloorvalues. The upper 4 cm sediment cores of van Veen grab sam-ples were pressed into sterile plastic tubes. The content of eachcore was homogenized by mixing and stored frozen at -80◦C untilprocessing in the laboratory.
SEDIMENT CHARACTERISTICSGrain size distribution was determined by dry sieving. The sed-iment samples were separated into two grain size classes, i.e.,clay/silt (<63 μm) and sand/gravel (>63 μm). Total organic car-bon (TOC) content was analyzed by a LECO CS-200 Analyzer
FIGURE 1 | The western Barents Sea with geographical positions of
sampling stations. Red color (southern part); blue color (northern part),green color (transition temperature zone).
(LECO Corporation, St. Joseph, MI, USA). Sediment chlorophylla (Chl a) and phaeophytin were determined by a Turner 7000fluorometer (Turner Designs Inc., Synnyvale, CA, USA) fromreadings at 665 nm in ethanol extracts before and after treatmentwith 1 M acetic acid (Pápista et al., 2002).
DNA EXTRACTIONTotal DNA was extracted from duplicate 0.5 g samples of eachsite using the PowerSoil™ DNA Isolation kit (Mo Bio Labs, Inc.,Carlsbad, CA, USA) according to the manufacturer’s instructions.The concentration and quality of extracted DNA were determinedby a NanoDrop ND-1000 spectrophotometer (Thermo Scientific,Wilmington, DE, USA).
BACTERIAL AND ARCHAEAL ABUNDANCESQuantification of 16S ribosomal RNA genes was used for theestimation of prokaryotic cell densities. Quantitative real-timePCR (qPCR) was performed on an ABI 7500Fast real-time PCRsystem (Applied Biosystems, NYSE, Waltham, MA, USA) usingprimers 27F/338R for Bacteria and A571F/915R for Archaea (seeSupplementary Table S1). The environmental DNA samples wererun in duplicate with three dilutions of the primary extract (10−1
to 10−3). Standard curves for threshold cycle (Ct) vs. logarithmof the start concentration of 16S rRNA gene copies, from 106
to 101, were established with Escherichia coli K10 for Bacteriaand Methanoplanus petrolearius DSM11571 for Archaea. This cor-responded to E. coli genomic DNA being serially diluted from0.76 to 0.76 × 10⁻⁵ ng and M. petrolearius diluted from 1.56to 1.56 ×10⁻⁵ ng. Genomic standards were included in eachqPCR run to ensure linearity and expected slope values of theCt/log[gDNA] curves.
Frontiers in Microbiology | Aquatic Microbiology January 2015 | Volume 6 | Article 17 | 2
Nguyen and Landfald Prokaryotic diversity in marine sediment
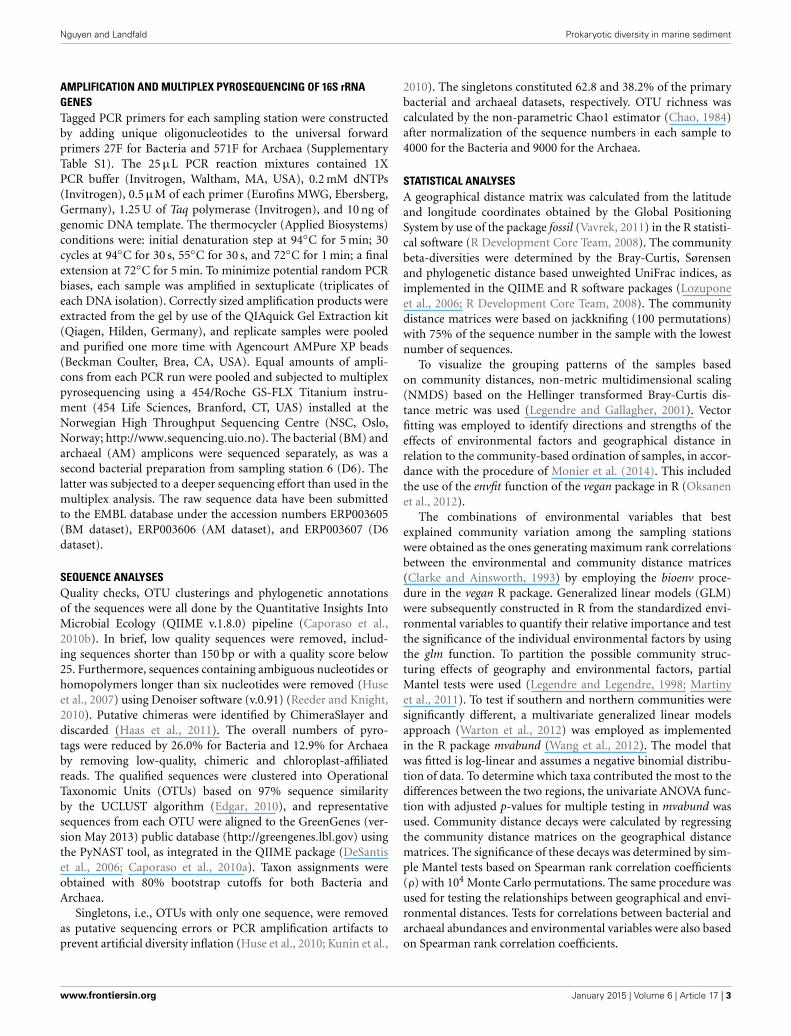
AMPLIFICATION AND MULTIPLEX PYROSEQUENCING OF 16S rRNAGENESTagged PCR primers for each sampling station were constructedby adding unique oligonucleotides to the universal forwardprimers 27F for Bacteria and 571F for Archaea (SupplementaryTable S1). The 25 μL PCR reaction mixtures contained 1XPCR buffer (Invitrogen, Waltham, MA, USA), 0.2 mM dNTPs(Invitrogen), 0.5 μM of each primer (Eurofins MWG, Ebersberg,Germany), 1.25 U of Taq polymerase (Invitrogen), and 10 ng ofgenomic DNA template. The thermocycler (Applied Biosystems)conditions were: initial denaturation step at 94◦C for 5 min; 30cycles at 94◦C for 30 s, 55◦C for 30 s, and 72◦C for 1 min; a finalextension at 72◦C for 5 min. To minimize potential random PCRbiases, each sample was amplified in sextuplicate (triplicates ofeach DNA isolation). Correctly sized amplification products wereextracted from the gel by use of the QIAquick Gel Extraction kit(Qiagen, Hilden, Germany), and replicate samples were pooledand purified one more time with Agencourt AMPure XP beads(Beckman Coulter, Brea, CA, USA). Equal amounts of ampli-cons from each PCR run were pooled and subjected to multiplexpyrosequencing using a 454/Roche GS-FLX Titanium instru-ment (454 Life Sciences, Branford, CT, UAS) installed at theNorwegian High Throughput Sequencing Centre (NSC, Oslo,Norway; http://www.sequencing.uio.no). The bacterial (BM) andarchaeal (AM) amplicons were sequenced separately, as was asecond bacterial preparation from sampling station 6 (D6). Thelatter was subjected to a deeper sequencing effort than used in themultiplex analysis. The raw sequence data have been submittedto the EMBL database under the accession numbers ERP003605(BM dataset), ERP003606 (AM dataset), and ERP003607 (D6dataset).
SEQUENCE ANALYSESQuality checks, OTU clusterings and phylogenetic annotationsof the sequences were all done by the Quantitative Insights IntoMicrobial Ecology (QIIME v.1.8.0) pipeline (Caporaso et al.,2010b). In brief, low quality sequences were removed, includ-ing sequences shorter than 150 bp or with a quality score below25. Furthermore, sequences containing ambiguous nucleotides orhomopolymers longer than six nucleotides were removed (Huseet al., 2007) using Denoiser software (v.0.91) (Reeder and Knight,2010). Putative chimeras were identified by ChimeraSlayer anddiscarded (Haas et al., 2011). The overall numbers of pyro-tags were reduced by 26.0% for Bacteria and 12.9% for Archaeaby removing low-quality, chimeric and chloroplast-affiliatedreads. The qualified sequences were clustered into OperationalTaxonomic Units (OTUs) based on 97% sequence similarityby the UCLUST algorithm (Edgar, 2010), and representativesequences from each OTU were aligned to the GreenGenes (ver-sion May 2013) public database (http://greengenes.lbl.gov) usingthe PyNAST tool, as integrated in the QIIME package (DeSantiset al., 2006; Caporaso et al., 2010a). Taxon assignments wereobtained with 80% bootstrap cutoffs for both Bacteria andArchaea.
Singletons, i.e., OTUs with only one sequence, were removedas putative sequencing errors or PCR amplification artifacts toprevent artificial diversity inflation (Huse et al., 2010; Kunin et al.,
2010). The singletons constituted 62.8 and 38.2% of the primarybacterial and archaeal datasets, respectively. OTU richness wascalculated by the non-parametric Chao1 estimator (Chao, 1984)after normalization of the sequence numbers in each sample to4000 for the Bacteria and 9000 for the Archaea.
STATISTICAL ANALYSESA geographical distance matrix was calculated from the latitudeand longitude coordinates obtained by the Global PositioningSystem by use of the package fossil (Vavrek, 2011) in the R statisti-cal software (R Development Core Team, 2008). The communitybeta-diversities were determined by the Bray-Curtis, Sørensenand phylogenetic distance based unweighted UniFrac indices, asimplemented in the QIIME and R software packages (Lozuponeet al., 2006; R Development Core Team, 2008). The communitydistance matrices were based on jackknifing (100 permutations)with 75% of the sequence number in the sample with the lowestnumber of sequences.
To visualize the grouping patterns of the samples basedon community distances, non-metric multidimensional scaling(NMDS) based on the Hellinger transformed Bray-Curtis dis-tance metric was used (Legendre and Gallagher, 2001). Vectorfitting was employed to identify directions and strengths of theeffects of environmental factors and geographical distance inrelation to the community-based ordination of samples, in accor-dance with the procedure of Monier et al. (2014). This includedthe use of the envfit function of the vegan package in R (Oksanenet al., 2012).
The combinations of environmental variables that bestexplained community variation among the sampling stationswere obtained as the ones generating maximum rank correlationsbetween the environmental and community distance matrices(Clarke and Ainsworth, 1993) by employing the bioenv proce-dure in the vegan R package. Generalized linear models (GLM)were subsequently constructed in R from the standardized envi-ronmental variables to quantify their relative importance and testthe significance of the individual environmental factors by usingthe glm function. To partition the possible community struc-turing effects of geography and environmental factors, partialMantel tests were used (Legendre and Legendre, 1998; Martinyet al., 2011). To test if southern and northern communities weresignificantly different, a multivariate generalized linear modelsapproach (Warton et al., 2012) was employed as implementedin the R package mvabund (Wang et al., 2012). The model thatwas fitted is log-linear and assumes a negative binomial distribu-tion of data. To determine which taxa contributed the most to thedifferences between the two regions, the univariate ANOVA func-tion with adjusted p-values for multiple testing in mvabund wasused. Community distance decays were calculated by regressingthe community distance matrices on the geographical distancematrices. The significance of these decays was determined by sim-ple Mantel tests based on Spearman rank correlation coefficients(ρ) with 104 Monte Carlo permutations. The same procedure wasused for testing the relationships between geographical and envi-ronmental distances. Tests for correlations between bacterial andarchaeal abundances and environmental variables were also basedon Spearman rank correlation coefficients.
www.frontiersin.org January 2015 | Volume 6 | Article 17 | 3
Nguyen and Landfald Prokaryotic diversity in marine sediment
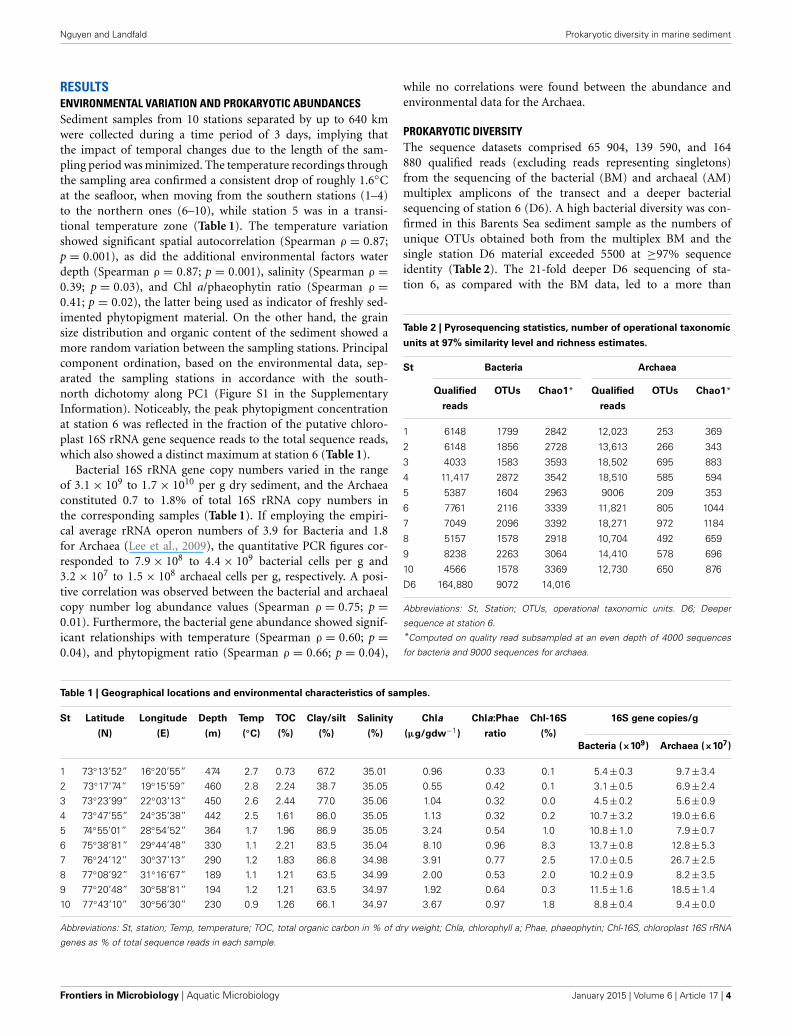
RESULTSENVIRONMENTAL VARIATION AND PROKARYOTIC ABUNDANCESSediment samples from 10 stations separated by up to 640 kmwere collected during a time period of 3 days, implying thatthe impact of temporal changes due to the length of the sam-pling period was minimized. The temperature recordings throughthe sampling area confirmed a consistent drop of roughly 1.6◦Cat the seafloor, when moving from the southern stations (1–4)to the northern ones (6–10), while station 5 was in a transi-tional temperature zone (Table 1). The temperature variationshowed significant spatial autocorrelation (Spearman ρ = 0.87;p = 0.001), as did the additional environmental factors waterdepth (Spearman ρ = 0.87; p = 0.001), salinity (Spearman ρ =0.39; p = 0.03), and Chl a/phaeophytin ratio (Spearman ρ =0.41; p = 0.02), the latter being used as indicator of freshly sed-imented phytopigment material. On the other hand, the grainsize distribution and organic content of the sediment showed amore random variation between the sampling stations. Principalcomponent ordination, based on the environmental data, sep-arated the sampling stations in accordance with the south-north dichotomy along PC1 (Figure S1 in the SupplementaryInformation). Noticeably, the peak phytopigment concentrationat station 6 was reflected in the fraction of the putative chloro-plast 16S rRNA gene sequence reads to the total sequence reads,which also showed a distinct maximum at station 6 (Table 1).
Bacterial 16S rRNA gene copy numbers varied in the rangeof 3.1 × 10⁹ to 1.7 × 10¹⁰ per g dry sediment, and the Archaeaconstituted 0.7 to 1.8% of total 16S rRNA copy numbers inthe corresponding samples (Table 1). If employing the empiri-cal average rRNA operon numbers of 3.9 for Bacteria and 1.8for Archaea (Lee et al., 2009), the quantitative PCR figures cor-responded to 7.9 × 10⁸ to 4.4 × 10⁹ bacterial cells per g and3.2 × 107 to 1.5 × 10⁸ archaeal cells per g, respectively. A posi-tive correlation was observed between the bacterial and archaealcopy number log abundance values (Spearman ρ = 0.75; p =0.01). Furthermore, the bacterial gene abundance showed signif-icant relationships with temperature (Spearman ρ = 0.60; p =0.04), and phytopigment ratio (Spearman ρ = 0.66; p = 0.04),
while no correlations were found between the abundance andenvironmental data for the Archaea.
PROKARYOTIC DIVERSITYThe sequence datasets comprised 65 904, 139 590, and 164880 qualified reads (excluding reads representing singletons)from the sequencing of the bacterial (BM) and archaeal (AM)multiplex amplicons of the transect and a deeper bacterialsequencing of station 6 (D6). A high bacterial diversity was con-firmed in this Barents Sea sediment sample as the numbers ofunique OTUs obtained both from the multiplex BM and thesingle station D6 material exceeded 5500 at ≥97% sequenceidentity (Table 2). The 21-fold deeper D6 sequencing of sta-tion 6, as compared with the BM data, led to a more than
Table 2 | Pyrosequencing statistics, number of operational taxonomic
units at 97% similarity level and richness estimates.
St Bacteria Archaea
Qualified OTUs Chao1* Qualified OTUs Chao1*
reads reads
1 6148 1799 2842 12,023 253 369
2 6148 1856 2728 13,613 266 343
3 4033 1583 3593 18,502 695 883
4 11,417 2872 3542 18,510 585 594
5 5387 1604 2963 9006 209 353
6 7761 2116 3339 11,821 805 1044
7 7049 2096 3392 18,271 972 1184
8 5157 1578 2918 10,704 492 659
9 8238 2263 3064 14,410 578 696
10 4566 1578 3369 12,730 650 876
D6 164,880 9072 14,016
Abbreviations: St, Station; OTUs, operational taxonomic units. D6; Deeper
sequence at station 6.*Computed on quality read subsampled at an even depth of 4000 sequences
for bacteria and 9000 sequences for archaea.
Table 1 | Geographical locations and environmental characteristics of samples.
St Latitude Longitude Depth Temp TOC Clay/silt Salinity Chla Chla:Phae Chl-16S 16S gene copies/g
(N) (E) (m) (◦C) (%) (%) (%) (μg/gdw−1) ratio (%)
Bacteria (×109) Archaea (×107)
1 73◦13’52” 16◦20’55” 474 2.7 0.73 67.2 35.01 0.96 0.33 0.1 5.4 ± 0.3 9.7 ± 3.42 73◦17’74” 19◦15’59” 460 2.8 2.24 38.7 35.05 0.55 0.42 0.1 3.1 ± 0.5 6.9 ± 2.43 73◦23’99” 22◦03’13” 450 2.6 2.44 77.0 35.06 1.04 0.32 0.0 4.5 ± 0.2 5.6 ± 0.94 73◦47’55” 24◦35’38” 442 2.5 1.61 86.0 35.05 1.13 0.32 0.2 10.7 ± 3.2 19.0 ± 6.65 74◦55’01” 28◦54’52” 364 1.7 1.96 86.9 35.05 3.24 0.54 1.0 10.8 ± 1.0 7.9 ± 0.76 75◦38’81” 29◦44’48” 330 1.1 2.21 83.5 35.04 8.10 0.96 8.3 13.7 ± 0.8 12.8 ± 5.37 76◦24’12” 30◦37’13” 290 1.2 1.83 86.8 34.98 3.91 0.77 2.5 17.0 ± 0.5 26.7 ± 2.58 77◦08’92” 31◦16’67” 189 1.1 1.21 63.5 34.99 2.00 0.53 2.0 10.2 ± 0.9 8.2 ± 3.59 77◦20’48” 30◦58’81” 194 1.2 1.21 63.5 34.97 1.92 0.64 0.3 11.5 ± 1.6 18.5 ± 1.410 77◦43’10” 30◦56’30” 230 0.9 1.26 66.1 34.97 3.67 0.97 1.8 8.8 ± 0.4 9.4 ± 0.0
Abbreviations: St, station; Temp, temperature; TOC, total organic carbon in % of dry weight; Chla, chlorophyll a; Phae, phaeophytin; Chl-16S, chloroplast 16S rRNA
genes as % of total sequence reads in each sample.
Frontiers in Microbiology | Aquatic Microbiology January 2015 | Volume 6 | Article 17 | 4

Nguyen and Landfald Prokaryotic diversity in marine sediment
four-fold increase in the OTU richness estimate for this stationby the Chao1 estimator. This suggested that deeper sequenc-ing of all stations would result in corresponding increases inrichness estimates as observed for station 6. Proteobacteria wereshown to be dominant in the Barents Sea seafloor by compris-ing an average of 73.8% of bacterial sequence tags (Figure 2A).Gammaproteobacteria and Deltaproteobacteria accounted for41.1 and 23.2% of the reads, respectively. The taxonomic assign-ment pointed to the Piscirickettsiaceae as the most prominentsub-group of the Gammaproteobacteria (43.6% of sequencereads), while a substantial fraction of the deltaproteobacterialreads (31.9%) were affiliated with the orders Desulfobacteralesand Desulfuromonadales.
Despite the more than two-fold deeper sequencing of theAM than the BM dataset, archaeal OTU numbers were, onaverage, 29% of the bacterial figures for the same stations.The archaeal communities were highly dominated by a fewphylotypes, as the three most prevalent OTUs constituted 60to 89% of total sequence reads in the different samples. Theother striking feature of the archaeal communities was the over-whelming quantitative dominance by the class Thaumarchaeota,which averaged 85.8% of archaeal sequence reads in the samples(Figure 2B). A substantial fraction (33.9%) of the thaumarchaeo-tal reads was affiliated with the marine, ammonia-oxidizing genusNitrosopumilus. Besides the Thaumarchaeota, phylotypes repre-senting the Miscellaneous Crenarchaeotal Group (Inagaki et al.,2003), the Marine benthic group B (Knittel et al., 2005) and thecandidate phylum Parvarchaeota (Rinke et al., 2013; Hedlundet al., 2014) constituted significant groups, while less than 1% ofthe archaeal sequence reads showed euryarchaeotal affiliation.
COMMUNITY STRUCTURE VARIATIONThe overall stable distribution of phylotypes (Figure 2) and con-gruent ranking of abundant OTUs (data not shown) at the
different sampling stations for both the Bacteria and Archaeaweighed against strong community structuring forces within thisrange of arctic seafloor. However, NMDS ordination based onthe complete sequence information (singletons not included)indicated some level of clustering of the prokaryotic commu-nities in accordance with the separation by environmental fac-tors and spatial distance. For both Bacteria and Archaea, thecommunities of stations 1–4 tended to be associated with theslightly warmer, deeper and more saline conditions in the south-ern part of the sampling range, while the communities fromstations 6–10 were associated with the observed higher lev-els of the phytopigment indicators in that region (Figure 3).Statistical comparisons between the southern (1–4) and north-ern (6–10) communities showed significant differences by themultivariate generalized linear models approach for Bacteria andArchaea (ANOVA, p = 0.009 for both groups). The five bacte-rial taxa that generated most explained difference between thetwo regions were the proteobacterial orders Nitrosomonadales(p = 0.006), Rhodospirillales (p = 0.009), Marinicellales (p =0.009), Desulfuromonadales (p = 0.010) and the uncultured pro-teobacterial group Sva0853 (p = 0.010). For the Archaea, just thevariation in the Parvarchaeota (p = 0.001) and Thaumarchaeota(p = 0.021) tag abundances gave significant contributions toexplained regional difference (Supplementary Figures S2, S3).Distance decays of community similarity were confirmed both bythe Bray-Curtis index (Figures 4A,B) and the phylogeny-basedunweighted UniFrac dissimilarity index (ρ = 0.34; p = 0.02 forBacteria; ρ = 0.54; p = 0.01 for Archaea). The zero-distance bac-terial Bray-Curtis index value of 0.65 (Figure 4A) represents thesimilarity between the BM and the D6 sequence pools of station 6.They constituted separate, independently analyzed DNA extractsfrom the same, well-mixed sediment sample material. Hence,the deviation of this value from unity reflects the stochasticbeta-diversity associated with non-exhaustive sequencing within
FIGURE 2 | Distribution of major phylogenetic groups of Bacteria (A)
and Archaea (B) at each sampling station. The analyses of both themultiplex (BM) and the deeper D6 pyrotag datasets are presented forBacteria at station 6. Abbreviations: MCG, Miscellaneous Crenarchaeotal
Group. “Other Crenarchaeota” include Marine benthic group A, Marinebenthic group B and Marine Hydrothermal Vent group. Red color(southern part), blue color (northern part), green color (transitiontemperature zone).
www.frontiersin.org January 2015 | Volume 6 | Article 17 | 5

Nguyen and Landfald Prokaryotic diversity in marine sediment
FIGURE 3 | Non-metric multidimensional scaling based on Bray Curtis
community distances for Bacteria (A) and Archaea (B). Numbersrepresent sampling stations and arrows show vector fitting of theenvironmental variables. Abbreviations: Temp, Temperature; Depth, water
depth; TOC, total organic carbon; Chl a, chlorophyll a; ratio, chlorophylla/phaeophytin ratio; Geo, spatial distance between sampling stations. Redcolor (southern part), blue color (northern part), green color (transitiontemperature zone).
FIGURE 4 | Relationships between community similarity (1-Bray
Curtis index) and spatial distance (A,B) and between community
similarity and environmental distance (C,D) for Bacteria (A,C) and
Archaea (B,D). The beta-diversity of the two bacterial station 6
datasets (filled circle in A) is not included in the regression line orcorrelation analyses. The significance of the correlations were assessedby Mantel tests based on Spearman’s rank correlation with 104 MonteCarlo permutations.
a single community. The |β|coefficients, i.e., the absolute valuesof the linear regression coefficients based on the Sørensen simi-larity index in a double logarithmic plot (Zinger et al., 2014) were0.056 ± 0.013 for the Bacteria and 0.153 ± 0.041 for the Archaea.
Mantel tests showed that the independence of possible influ-ential factors on the community structuring was obscured bothby significant collinearities between several of the individualenvironmental factors, i.e., temperature, depth, salinity and
Frontiers in Microbiology | Aquatic Microbiology January 2015 | Volume 6 | Article 17 | 6

Nguyen and Landfald Prokaryotic diversity in marine sediment
phytopigment ratio (p = 0.001 for all combinations) and byspatial autocorrelations of the same environmental factors (p =0.001). Hence, relationships were optimized between combina-tions of environmental parameters and community variation bythe bioenv procedure, and significant relationships were foundbetween these combinations of environmental factors and com-munity distances (Figures 4C,D). For the Bacteria, the four vari-ables temperature, phytopigment ratio, %silt/clay and TOC weremaintained in the model, while depth, phytopigment ratio andChl a gave positive contributions for the Archaea.
Partial Mantel tests were employed to assess the independenteffects of space and environment on the community structuring.Significant relationships between community and environmen-tal variation were confirmed when controlling for spatial distance(Table 3). For the reciprocal tests, i.e., spatial effects when con-trolling for environmental distance, the null hypothesis couldnot be rejected, but the similar magnitudes of the correlationcoefficients for the two bacterial tests indicated comparable con-tributions to explained variation by environment and space. Toquantitate the relative contributions to explained communityvariation by the different environmental factors, general linearmodels were established. These models retained the indepen-dently varying factors temperature, %silt + clay and TOC asstatistically significant contributors for the Bacteria, while thephytopigment ratio alone showed significance for the Archaea.The contribution to overall community variation explained byenvironmental variables was 42.1% for the bacterial communitiesand 31.0% for the archaeal communities (Table 4).
DISCUSSIONPROKARYOTIC COMMUNITIES IN THE BARENTS SEA SEDIMENTOur data confirmed the initial finding of Torsvik et al. (1996)that upper marine sediments harbor one of nature’s most diversemicrobiotas. High 16S rRNA gene diversity estimates for sedi-ments have previously been obtained from rarefaction analysesof clone libraries (Ravenschlag et al., 2001; Pedrós-Alió, 2006)and, more recently, by massive parallel sequencing efforts (Zingeret al., 2011; Bowen et al., 2012; Hamdan et al., 2013). The four-time increase in the bacterial richness estimate for station 6 whencomparing the one based on the roughly 7700 reads of the BMwith the 21-fold deeper D6 dataset confirmed the strong depen-dency on sequencing depth that has previously been documentedfor the Chao1 estimator (Lemos et al., 2011). As compared withnear full-length amplicons of the bacterial 16S rRNA gene, oursequence reads of the V1–V2 region may have produced up to30% overestimations of OTU richness due to a higher fraction of
hypervariable basepairs than in the complete gene (Youssef et al.,2009).
The bacterial taxa composition of the Barents Sea sampleswas similar to recent reports for marine seafloor upper sedi-ments, i.e., distinctly higher fractions of Deltaproteobacteria, butlower abundances of Alphaproteobacteria than commonly foundin the pelagic bacterial communities. This main feature has beenobserved from deep ocean seabeds with low influx of water-column derived sedimenting material to more shallow coastalareas, where benthic–pelagic coupling likely is strong. It there-fore seems to reflect a universal environmental adaptation of themarine sediment bacterial communities (Li et al., 2009; Teskeet al., 2011; Zinger et al., 2011; Bienhold et al., 2012). Hence, theuppermost centimeters of the sediment appeared to be dominatedby autochtonous bacterial assemblies throughout the samplingarea.
The less than 2% of total 16S rRNA genes affiliated withArchaea seems characteristic of the uppermost layer of marinesediments. Comparably low presence of Archaea have been foundin other Arctic and Antarctic sediments (Sahm and Berninger,1998; Ravenschlag et al., 2001; Bowman and McCuaig, 2003).The archaeal communities showed a noticeable skewness inphylotype distribution, as the three top-ranking OTUs consti-tuted more than two-thirds of total archaeal sequence readsand there was an absolute dominance by representatives of therecently established group Thaumarchaeota (Brochier-Armanetet al., 2008). The Thaumarchaeota comprise the phylotypes
Table 4 | General linear model analyses of the effect of individual
environmental variables on bacterial and archaeal communities.
Coefficient p-Value
BACTERIA
Temperature 0.020 0.009
TOC 0.016 0.016
%(Silt/Clay) 0.014 0.019
Phytopigment 0.007 0.432ARCHAEA
Phytopigment 0.033 0.024
Chl-a 0.014 0.201Depth 0.017 0.199
Statistically significant relationships are indicated by bold letters; TOC, total
organic carbon in % of dry weight; Chl a, chlorophyll a; Phytopigment, chlorophyll
a/phaeophytin ratio. R2 adj = 0.42 for bacteria, R2 adj = 0.31 for archaea.
Table 3 | Partial Mantel tests of Spearman’s rank correlations between prokaryotic community distance and either geographical or
environmental distance.
Correlation between Prokaryotic community and Controlling for Bacteria Archaea
ρ-Value p-Value ρ-Value p-Value
Geographic distance Environmental distance 0.28 0.06 0.1 0.27
Environmental distance Geographic distance 0.3 0.04 0.43 0.005
Statistically significant relationships are indicated by bold letters.
www.frontiersin.org January 2015 | Volume 6 | Article 17 | 7

Nguyen and Landfald Prokaryotic diversity in marine sediment
that were previously classified as Crenarchaeotal Group 1.1a(Schleper and Nicol, 2010), which have been identified asmajor archaeal constituents in marine pelagic waters and sed-iments, including polar and other cold regions (Bano et al.,2004; Galand et al., 2009; Dang et al., 2010; Alonso-Sáez et al.,2011; Durbin and Teske, 2011). In contrast, Hamdan et al.(2013) did not identify Thaumarchaeota in the sediment ofthe Alaska Beaufort Sea shelf. The Thaumarchaeota are associ-ated with an autotrophic ammonia-oxidizing energy metabolismwith the capacity to utilize very low substrate concentrations(Könneke et al., 2005; Herfort et al., 2007; Pester et al., 2011).As established ammonia-oxidizing bacterial phylogenetic groups,like Nitrosomonadales, were very poorly represented among theBacteria, the Thaumarchaeota appeared to be the predominantammonia oxidizers in this cold shelf sediment. With some reser-vations regarding seasonal variations or primer bias in the 16SrRNA gene amplification, the virtual absence of relevant groupsof Euryarchaeota in our material excluded methanogenesis oranaerobic methane oxidation as significant processes in the topcentimeters of this seafloor.
SOURCES OF COMMUNITY VARIATIONThe dissimilarity between spatially separated microbial commu-nities is established in the balance between neutral factors, therate of dispersal of the organisms and the strength of localselective forces (Sloan et al., 2006; Lindström and Langenheder,2012; Wang et al., 2013). The Barents Sea comprises a con-tiguous shelf seafloor, where minor differences in the prokary-otic assemblies were expected due to moderate environmentalvariations in combination with an anticipated substantial dis-persal effected by re-suspension of fine-grained sediment par-ticles. The stability in higher taxa composition throughout thesampling range consolidated this presumption. Additionally,allochtonous influx of microorganisms via particulate pelagicmaterial may have promoted the high community similarity, asthe bacterioplankton is more weakly biogeographically structuredthan the benthic microbiotas across similar distances (Zingeret al., 2014). However, our phylogenetic data gave no basis toconclude that bacterial groups that are associable with sedi-menting planktonic material constituted a significant fractionof the seafloor microbiota. The frequently cultivable, copi-otrophic lineages of Gammaproteobacteria, principally mem-bers of the Alteromonadales, Oceanospirallales, Vibrionales andPseudomonadales, are pointed out as characteristic of particle-bound planktonic Bacteria (Zhang et al., 2007; Lauro et al.,2011; Teske et al., 2011; Crespo et al., 2013; D’Ambrosio et al.,2014). These groups constituted minor proportions of theGammaproteobacteria in our sediment material, while represen-tatives of the dominating Piscirickettsiaceae family have not, toour knowledge, been associated with pelagic particulate material.
A main objective of our study was, however, to eluci-date if even these small environmental differences across themore than 600 km sampling area transecting the Barents Seapolar front, were reflected in non-random community varia-tions if analyzed by a next-generation sequencing approach. TheNMDS ordination patterns of the assemblies of both Bacteriaand Archaea suggested some degree of community structuring
in accordance with the south-north spatial and environmentalseparation of the sampling range. However, estimates of theimportance of the factors that gave rise to this structuringwas complicated both by the extensive collinearity between sev-eral environmental factors, i.e., temperature, phytopigment ratio,water depth and salinity, and the just as strong spatial autocor-relation of the same factors. These phenomena weakened thepossibility to disentangle the contributions by the various fac-tors to the overall beta-diversity and made general linear modelslabile, with coefficient estimates that were sensitive to minorchanges in the data or the optimization criteria (Legendre, 1993;Dormann et al., 2013).
The spatial separations of sampling sites in the present studyvaried from 23 to 640 km, thereby falling into the intermediaterange (10–1200 km) in which Schauer et al. (2010) have founddispersal limitation and contemporary environmental selectiveforces to show comparable contributions to biogeographic pat-terning in deep-sea sediments. We found the impact of spatialeffects to be subordinate to the one of environmental factors,although this ranking was less evident for the Bacteria than theArchaea. Hence, the data did not exclude our initial assumptionthat dispersal is substantial in this kind of shelf sediment, butdispersal was evidently not strong enough to blur the commu-nity structuring effects of the moderate environmental differencesalong the sampling area. The partitioning of the various environ-mental factors that contributed to explained community varia-tion was based on the criterion of Clarke and Ainsworth (1993)of optimized fit between community and environmentally baseddistance matrices, in combination with a general linear model.This approach picked two different, covarying environmentalvariables, i.e., temperature for the Bacteria and phytopigmentratio for the Archaea, as the most influential community struc-turing factors, with some additional contribution to explainedvariation by the independently varying factors organic contentand grain size distribution for the Bacteria. Published studies inthe field or additional data acquired through the present study didnot give robust grounds to conclude whether this difference had atrue ecological basis or rather was a consequence of model labilitycaused by collinearity.
The temperature difference between the southern and north-ern sampling stations constitutes a stable oceanographic featureof the western Barents Sea (Ingvaldsen and Loeng, 2009) but theobserved difference appears to be at best marginal with regardsto leaving a detectable footprint in the prokaryotic assemblies.Previous documentations of temperature effects have largely beenassociated with markedly wider ranges (Fuhrman et al., 2008;Gilbert et al., 2009; Wietz et al., 2010; Agogué et al., 2011), whileHamdan et al. (2013) found no contribution to beta-diversity bya ≤ 2.4◦C temperature variation in arctic marine sediment.
At the time of our sampling effort in late May, winter sea icehad retracted from around sampling stations 5–6 to about sta-tion 8 and was partly disintegrated even further north. The springbloom, which is particularly intensive in the 20–50 km marginalzone south of the ice edge (Sakshaug et al., 2009), was well-under way and sedimentation from this bloom may explain thedistinctly higher phytopigment and chloroplast-associated 16SrRNA gene levels in the northern part of the sampling range. In
Frontiers in Microbiology | Aquatic Microbiology January 2015 | Volume 6 | Article 17 | 8

Nguyen and Landfald Prokaryotic diversity in marine sediment
addition, the greater water depth in the southern part, with lesssedimented material reaching the seafloor, may have contributedin the same direction. Both the Chl a/phaeophytin ratio and theconcentration of Chl a have been used as estimators of fresh-ness of sedimented phytoplanktonic material in e.g., the westernBarents Sea. Positive relationships between the content of sedi-ment phytopigments and bacterial growth and production hasbeen demonstrated (Jørgensen and Boetius, 2007; Morata andRenaud, 2008) and pigment content has been used as a proxyfor available energy to benthic bacteria in arctic marine sediment(Bienhold et al., 2012). The abundance of Thaumarchaeota inpelagic marine waters has also been shown to correlate positivelywith Chl a (Robidart et al., 2012) but in the present study, the can-didate phylum Parvarchaeota rather was the group that showed amarked increase in the northern region. This recently identifiedgroup (Rinke et al., 2013) of very small cells with correspond-ingly small genomes has as yet only been genetically characterizedthrough an acid mine drainage single-cell sequencing project(Hedlund et al., 2014) and these data do not give any hint to itsecological adaptation in marine sediment.
No significant community structuring effects of water depthor salinity were observed. Previous studies documenting effects ofwater depth are founded on substantially wider depth ranges thanthe less than 300 m in the present study. In two studies based onpyrosequence data comprising sampling sites from surface levelto the deep ocean floor, up to 3.0% of the sediment bacterialcommunity variation was found to be explained by water depth(Zinger et al., 2011; Bienhold et al., 2012). Although consistent,the shift in salinity close to the seafloor between the southernand northern parts of the sampling range was below 0.1%, andwe anticipate it generates a negligible structuring effect on theprokaryotic communities.
There is the possibility that unmeasured environmental vari-ables contributed significantly to community variation throughthe sampling range. Possible unaccounted variables include thelevels of inorganic nutrients (Wu et al., 2008; Böer et al., 2009)and the degree of oxygen penetration into the sediment (Durbinand Teske, 2012). However, no variations in abiotic compositionhave been reported along this well-characterized extent of con-tiguous soft bottom seafloor, which will likely overshadow theinfluences by the variables that were included in the study. Inaddition, the moderate variation in the fraction of taxonomicgroups associated with anaerobic sulfur compound metabolisms,e.g., the orders Desulfobacterales and Desulfuromonadales, wasnot indicative of major changes in oxgen profiles within the upper4 cm of the seafloor (data not shown).
Several studies have confirmed microbial community distancedecay relationships in marine habitat types like pelagic water(Monier et al., 2014; Zinger et al., 2014), salt marshes (Horner-Devine et al., 2004; Martiny et al., 2011), and oceanic sediments(Schauer et al., 2010; Zinger et al., 2014). Sapp et al. (2010)represent an exception as they were unable to detect significantspatially induced variation of bacterial and archaeal communitiesin North Sea sediment by a denaturing gradient gel electrophore-sis approach. The actual magnitudes of the distance decays are,however, difficult to compare due to differences in diversityindices, organismal target groups, genetic entity compared, etc.
A recent global sampling study employing an analytical approachhighly similar to the one used by us (Zinger et al., 2014) con-solidates our estimate of 0.056 for the absolute value of thedouble-logarithmic distance decay regression coefficient on shelfseafloor. Our figure was in-between the values of for deep-seaand coastal sediments estimated by Zinger et al. (2014). On theother hand, the corresponding coefficient estimated by Schaueret al. (2010) for South Atlantic deep-sea sediments was just 0.003,i.e., at least an order of magnitude smaller than our shelf seafigure, and the authors associate this low distance decay withhigh dispersal rates and low extinction rates of the vast bac-terial populations in this kind of environment. The archaealcoefficient of 0.15 estimated in our study corresponded to theupper extreme bacterial values recorded by Zinger et al. (2014).Together with the above-mentioned assignment of the explainedarchaeal community variation solely to environmental factors, thearchaeal beta-diversity appeared as more sensitive to environmen-tal variation than the one of the Bacteria in this shelf seafloorenvironment. To our knowledge, this kind of comparative beta-diversity observations between Bacteria and Archaea in the sameenvironment has not previously been reported.
In conclusion, our data consolidated previous findings regard-ing the bacterial alpha-diversities of marine shelf seafloor sed-iments but reinforced the significance of the Thaumarchaeotaas the principal archaeal group in this type of environment.Furthermore, the study confirmed that biogeographical struc-tures are detectable in marine sediment prokaryotic communitiesby deep 16S rRNA gene sequencing, even where high dispersalrates combined with weak environmental filtration counteract thebuild-up of beta-diversity patterns. This may have implicationsfor the practicality of employing such approaches to monitor-ing microbial effects of e.g., the predicted rise in air and watertemperatures in the polar regions, including the Barents Sea, inthe years to come. This climate change is expected to be mani-fested in the microbial communities (Kirchman et al., 2009). Onthe other hand, the study also emphasized the importance of suf-ficient prior knowledge of the environmental variations withinthe sampling area to avoid complications caused by extensiveco-variations among the spatial and environmental variables.
ACKNOWLEDGMENTSWe thank the crew of F/F Helmer Hansen for their technicaland logistic assistance during the sampling cruise. Thanks also toHans Christian Eilertsen and Gunilla Eriksen for assistance in thepigment analyses. We kindly thank the reviewers and editor forconstructive and useful comments.
SUPPLEMENTARY MATERIALThe Supplementary Material for this article can be found onlineat: http://www.frontiersin.org/journal/10.3389/fmicb.2015.
00017/abstract
REFERENCESAgogué, H., Lamy, D., Neal, P. R., Sogin, M. L., and Herndl, G. J. (2011). Water
mass-specificity of bacterial communities in the North Atlantic revealed bymassively parallel sequencing. Mol. Ecol. 20, 258–274. doi: 10.1111/j.1365-294X.2010.04932.x
www.frontiersin.org January 2015 | Volume 6 | Article 17 | 9

Nguyen and Landfald Prokaryotic diversity in marine sediment
Alonso-Sáez, L., Andersson, A., Heinrich, F., and Bertilsson, S. (2011). Higharchaeal diversity in Antarctic circumpolar deep waters. Environ. Microbiol. Rep.3, 689–697. doi: 10.1111/j.1758-2229.2011.00282.x
Bano, N., Ruffin, S., Ransom, B., and Hollibaugh, J. T. (2004). Phylogenetic com-position of Arctic Ocean archaeal assemblages and comparison with Antarcticassemblages. Appl. Environ. Microbiol. 70, 781–789. doi: 10.1128/AEM.70.2.781-789.2004
Bertics, V. J., and Ziebis, W. (2009). Biodiversity of benthic microbial communi-ties in bioturbated coastal sediments is controlled by geochemical microniches.ISME J. 3, 1269–1285. doi: 10.1038/ismej.2009.62
Bienhold, C., Boetius, A., and Ramette, A. (2012). The energy-diversity relation-ship of complex bacterial communities in Arctic deep-sea sediments. ISME J. 6,724–732. doi: 10.1038/ismej.2011.140
Böer, S. I., Hedtkamp, S. I., van Beusekom, J. E., Fuhrman, J. A., Boetius, A., andRamette, A. (2009). Time- and sediment depth-related variations in bacterialdiversity and community structure in subtidal sands. ISME J. 3, 780–791. doi:10.1038/ismej.2009.29
Bowen, J. L., Morrison, H. G., Hobbie, J. E., and Sogin, M. L. (2012). Saltmarsh sediment diversity: a test of the variability of the rare biosphere amongenvironmental replicates. ISME J. 6, 2014–2023. doi: 10.1038/ismej.2012.47
Bowman, J. P., and McCuaig, R. D. (2003). Biodiversity, community structuralshifts, and biogeography of prokaryotes within Antarctic continental shelf sed-iment. Appl. Environ. Microbiol. 69, 2463–2483. doi: 10.1128/AEM.69.5.2463-2483.2003
Brochier-Armanet, C., Boussau, B., Gribaldo, S., and Forterre, P. (2008). Mesophiliccrenarchaeota: proposal for a third archaeal phylum, the Thaumarchaeota. Nat.Rev. Microbiol. 6, 245–252. doi: 10.1038/nrmicro1852
Caporaso, J. G., Bittinger, K., Bushman, F. D., Desantis, T. Z., Andersen, G. L.,and Knight, R. (2010a). PyNAST: a flexible tool for aligning sequences to atemplate alignment. Bioinformatics 26, 266–267. doi: 10.1093/bioinformatics/btp636
Caporaso, J. G., Kuczynski, J., Stombaugh, J., Bittinger, K., Bushman, F. D., Costello,E. K., et al. (2010b). QIIME allows analysis of high-throughput communitysequencing data. Nat. Methods 7, 335–336. doi: 10.1038/nmeth.f.303
Chao, A. (1984). Non-parametric estimation of the number of classes in a popula-tion. Scand. J. Stat. 11, 265–270.
Clarke, K. R., and Ainsworth, M. (1993). A method of linking multivariate com-munity structure to environmental variables. Mar. Ecol. Prog. Ser. 92, 205–219.
Crespo, B. G., Pommier, T., Fernández-Gómez, B., and Pedrós-Alió, C. (2013).Taxonomic composition of the particle-attached and free-living bacterial assem-blages in the Northwest Mediterranean Sea analyzed by pyrosequencing of the16S rRNA. Microbiologyopen 2, 541–552. doi: 10.1002/mbo3.92
D’Ambrosio, L., Ziervogel, K., MacGregor, B., Teske, A., and Arnosti, C.(2014). Composition and enzymatic function of particle-associated and free-living bacteria: a coastal/offshore comparison. ISME J. 8, 2167–2179. doi:10.1038/ismej.2014.67
Dang, H., Luan, X. W., Chen, R., Zhang, X., Guo, L., and Klotz, M. G. (2010).Diversity, abundance and distribution of amoA-encoding archaea in deep-seamethane seep sediments of the Okhotsk Sea. FEMS Microbiol. Ecol. 72, 370–385.doi: 10.1111/j.1574-6941.2010.00870.x
DeSantis, T. Z., Hugenholtz, P., Larsen, N., Rojas, M., Brodie, E. L., Keller, K.,et al. (2006). Greengenes, a chimera-checked 16S rRNA gene database andworkbench compatible with ARB. Appl. Environ. Microbiol. 72, 5069–5072. doi:10.1128/AEM.03006-05
Dormann, C. F., Elith, J., Bacher, S., Buchmann, C., Carl, G., Carré, G., et al.(2013). Collinearity: a review of methods to deal with it and a simulationstudy evaluating their performance. Ecography 36, 27–46. doi: 10.1111/j.1600-0587.2012.07348.x
Durbin, A. M., and Teske, A. (2011). Microbial diversity and stratification ofSouth Pacific abyssal marine sediments. Environ. Microbiol. 13, 3219–3234. doi:10.1111/j.1462-2920.2011.02544.x
Durbin, A. M., and Teske, A. (2012). Archaea in organic-lean and organic-richmarine subsurface sediments: an environmental gradient reflected in distinctphylogenetic lineages. Front. Microbiol. 3:168. doi: 10.3389/fmicb.2012.00168
Edgar, R. C. (2010). Search and clustering orders of magnitude faster than BLAST.Bioinformatics 26, 2460–2461. doi: 10.1093/bioinformatics/btq461
Fuhrman, J. A., Steele, J. A., Hewson, I., Schwalbach, M. S., Brown, M. V., Green, J.L., et al. (2008). A latitudinal diversity gradient in planktonic marine bacteria.Proc. Natl. Acad. Sci. U.S.A. 105, 7774–7778. doi: 10.1073/pnas.0803070105
Galand, P. E., Casamayor, E. O., Kirchman, D. L., Potvin, M., and Lovejoy, C.(2009). Unique archaeal assemblages in the Arctic Ocean unveiled by massivelyparallel tag sequencing. ISME J. 3, 860–869. doi: 10.1038/ismej.2009.23
Gilbert, J. A., Field, D., Swift, P., Newbold, L., Oliver, A., Smyth, T., et al.(2009). The seasonal structure of microbial communities in the Western EnglishChannel. Environ. Microbiol. 11, 3132–3139. doi: 10.1111/j.1462-2920.2009.02017.x
Haas, B. J., Gevers, D., Earl, A. M., Feldgarden, M., Ward, D. V., Giannoukos,G., et al. (2011). Chimeric 16S rRNA sequence formation and detection inSanger and 454-pyrosequenced PCR amplicons. Genome Res. 21, 494–504. doi:10.1101/gr.112730.110
Hamdan, L. J., Coffin, R. B., Sikaroodi, M., Greinert, J., Treude, T., and Gillevet, P.M. (2013). Ocean currents shape the microbiome of Arctic marine sediments.ISME J. 7, 685–696. doi: 10.1038/ismej.2012.143
Hanson, C. A., Fuhrman, J. A., Horner-Devine, M. C., and Martiny, J. B. H. (2012).Beyond biogeographic patterns: processes shaping the microbial landscape. Nat.Rev. Microbiol. 10, 497–506. doi: 10.1038/nrmicro2795
Hedlund, B. P., Dodsworth, J. A., Murugapiran, S. K., Rinke, C., and Woyke, T.(2014). Impact of single-cell genomics and metagenomics on the emergingview of extremophile “microbial dark matter.” Extremophiles 18, 865–875. doi:10.1007/s00792-014-0664-7
Hedlund, B. P., and Staley, J. T. (2003). “Microbial endemism and biogeography,”in Microbial Diversity and Bioprospecting, ed A. T. Bull (Washington, DC: ASMPress), 225–231.
Herfort, L., Schouten, S., Veldhuis, M., Coolen, M. J. L., Stefan, S., Gerhard, J. H.,et al. (2007). Ecology and physiology of marine Archaea in the North Sea. FEMSMicrobiol. Ecol. 62, 242–257. doi: 10.1111/j.1574-6941.2007.00397.x
Horner-Devine, M. C., Lage, M., Hughes, J. B., and Bohannan, B. J. M.(2004). A taxa-area relationship for bacteria. Nature 432, 750–753. doi:10.1038/nature03073
Huse, S. M., Huber, J. A., Morrison, H. G., Sogin, M. L., and Welch, D. M. (2007).Accuracy and quality of massively parallel DNA pyrosequencing. Genome Biol.8:R143. doi: 10.1186/gb-2007-8-7-r143
Huse, S. M., Welch, D. M., Morrison, H. G., and Sogin, M. L. (2010). Ironing outthe wrinkles in the rare biosphere through improved OTU clustering. Environ.Microbiol. 12, 1889–1898. doi: 10.1111/j.1462-2920.2010.02193.x
Inagaki, F., Suzuki, M., Takai, K., Oida, H., Sakamoto, T., Aoki, K., et al. (2003).Microbial communities associated with geological horizons in coastal sub-seafloor sediments from the Sea of Okhotsk. Appl. Environ. Microbiol. 69,7224–7235. doi: 10.1128/AEM.69.12.7224-7235.2003
Ingvaldsen, R., and Loeng, H. (2009). “Physical oceanography,” in EcosystemBarents Sea, eds E. Sakshaug, G. Johnsen, and K. Kovacs (Trondheim: TapirAcademic Press), 33–64.
Jacob, M., Soltwedel, T., Boetius, A., and Ramette, A. (2013). Biogeography ofdeep-sea benthic bacteria at regional scale (LTER HAUSGARTEN, Fram Strait,Arctic). PLoS ONE 8:e72779. doi: 10.1371/journal.pone.0072779
Jørgensen, B. B., and Boetius, A. (2007). Feast and famine—microbial life in thedeep-sea bed. Nat. Rev. Microbiol. 5, 770–781. doi: 10.1038/nrmicro1745
Kirchman, D. L., Moran, X. A. G., and Ducklow, H. (2009). Microbial growth in thepolar oceans-role of temperature and potential impact of climate change. Nat.Rev. Microbiol. 7, 451–459. doi: 10.1038/nrmicro2115
Knittel, K., Lösekann, T., Boetius, A., Kort, R., and Amann, R. (2005). Diversity anddistribution of methanotrophic archaea at cold seeps. Appl. Environ. Microbiol.71, 467–479. doi: 10.1128/AEM.71.1.467-479.2005
Könneke, M., Bernhard, A. E., de la Torre, J. R., Walker, C. B., Waterbury, J. B.,and Stahl, D. A. (2005). Isolation of an autotrophic ammonia-oxidizing marinearchaeon. Nature 437, 543–546. doi: 10.1038/nature03911
Kunin, V., Engelbrektson, A., Ochman, H., and Hugenholtz, P. (2010). Wrinklesin the rare biosphere: pyrosequencing errors can lead to artificial inflationof diversity estimates. Environ. Microbiol. 12, 118–123. doi: 10.1111/j.1462-2920.2009.02051.x
Lauro, F. M., DeMaere, M. Z., Yau, S., Brown, M. V., Ng, C., Wilkins, D., et al.(2011). An integrative study of a meromictic lake ecosystem in Antarctica. ISMEJ. 5, 879–895. doi: 10.1038/ismej.2010.185
Lee, Z. M., Bussema, C. III, and Schmidt, T. M. (2009). rrnDB: documenting thenumber of rRNA and tRNA genes in bacteria and archaea. Nucleic Acids Res. 37,D489–D493. doi: 10.1093/nar/gkn689
Legendre, P. (1993). Spatial autocorrelation: trouble or new paradigm? Ecology 74,1659–1673.
Frontiers in Microbiology | Aquatic Microbiology January 2015 | Volume 6 | Article 17 | 10

Nguyen and Landfald Prokaryotic diversity in marine sediment
Legendre, P., and Gallagher, E. D. (2001). Ecologically meaningful trans-formations for ordination of species data. Oecologia 129, 271–280. doi:10.1007/s004420100716
Legendre, P., and Legendre, L. (1998). Numerical Ecology, 2nd English Edn.Amsterdam: Elsevier Science.
Leibold, M., Holyoak, M., Mouquet, N., Amarasekare, P., Chase, J., Hoopes,M., et al. (2004). The metacommunity concept: a framework for multi scalecommunity ecology. Ecol. Lett, 7, 601–613. doi: 10.1111/j.1461-0248.2004.00608.x
Lemos, L. N., Fulthorpe, R. R., Triplett, E. W., and Roesch, L. F. (2011). Rethinkingmicrobial diversity analysis in the high throughput sequencing era. J. Microbiol.Methods 86, 42–51. doi: 10.1016/j.mimet.2011.03.014
Li, H., Yu, Y., Luo, W., Zeng, Y., and Chen, B. (2009). Bacterial diversity in sur-face sediments from the Pacific Arctic Ocean. Extremophiles 13, 233–246. doi:10.1007/s00792-009-0225-7
Lind, S., and Ingvaldsen, R. B. (2012). Variability and impacts of Atlantic waterentering the Barents Sea from the north. Deep-Sea Res. I 62, 70–88. doi:10.1016/j.dsr.2011.12.007
Lindström, E. S., and Langenheder, S. (2012). Local and regional factors influ-encing bacterial community assembly. Environ. Microbiol. Rep. 4, 1–9. doi:10.1111/j.1758-2229.2011.00257.x
Logue, J. B., and Lindström, E. S. (2008). Biogeography of bacterioplankton ininland waters. Freshwater Rev. 1, 99–114. doi: 10.1608/FRJ-1.1.9
Lozupone, C., Hamady, M., and Knight, R. (2006). UniFrac – an online toolfor comparing microbial community diversity in a phylogenetic context. BMCBioinformatics 7:371. doi: 10.1186/1471-2105-7-371
Martiny, J. B., Bohannan, B. J., Brown, J. H., Colwell, R. K., Fuhrman, J. A., Green, J.L., et al. (2006). Microbial biogeography: putting microorganisms on the map.Nat. Rev. Microbiol. 4, 102–112. doi: 10.1038/nrmicro1341
Martiny, J. B., Eisen, J. A., Penn, K., Allison, S. D., and Horner-Devine, M. C. (2011).Drivers of bacterial beta-diversity depend on spatial scale. Proc. Natl. Acad. Sci.U.S.A. 108, 7850–7854. doi: 10.1073/pnas.1016308108
Monier, A., Comte, J., Babin, M., Forest, A., Matsuoka, A., and Lovejoy, C. (2014).Oceanographic structure drives the assembly processes of microbial eukaryoticcommunities. ISME J. 14, 1751–7362. doi: 10.1038/ismej.2014.197
Morata, N., and Renaud, P. E. (2008). Sedimentary pigments in the western BarentsSea: a reflection of the pelagic-benthic coupling? Deep-Sea Res. II 55, 2381–2389.doi: 10.1016/j.dsr2.2008.05.004
Oksanen, J. F., Blanchet, F. G., Kindt, R., Legendre, P., Minchin, P. R., O’Hara, R. B.,et al. (2012). Package “Vegan”. Available online at: http://cran.r-project.org/
Pápista, É., Ács, É., and Böddi, B. (2002). Chlorophyll-a determination withethanol – a critical test. Hydrobiologia 485, 191–198. doi: 10.1023/A:1021329602685
Pedrós-Alió, C. (2006). Marine microbial diversity: can it be determined? TrendsMicrobiol. 14, 257–263. doi: 10.1016/j.tim.2006.04.007
Pester, M., Schleper, C., and Wagner, M. (2011). The Thaumarchaeota: an emergingview of their phylogeny and ecophysiology. Curr. Opin. Microbiol. 14, 300–306.doi: 10.1016/j.mib.2011.04.007
Ravenschlag, K., Sahm, K., and Amann, R. (2001). Quantitative molec-ular analysis of the microbial community in marine arctic sediments(Svalbard). Appl. Environ. Microbiol. 67, 387–395. doi: 10.1128/AEM.67.1.387-395.2001
R Development Core Team. (2008). R: A Language and Environment for StatisticalComputing. Vienna, Austria: R Foundation for Statistical Computing. Availableonline at: http://www.R-project.org
Reeder, J., and Knight, R. (2010). Rapidly denoising pyrosequencing ampliconreads by exploiting rank-abundance distributions. Nat. Methods 7, 335–336. doi:10.1038/nmeth0910-668b
Rinke, C., Schwientek, P., Sczyrba, A., Ivanova, N. N., Anderson, I. J., Cheng, J. F.,et al. (2013). Insights into the phylogeny and coding potential of microbial darkmatter. Nature 499, 431–437. doi: 10.1038/nature12352
Robidart, J. C., Preston, C. M., Paerl, R. W., Turk, K. A., Mosier, A. C., Francis, C. A.,et al. (2012). Seasonal Synechococcus and Thaumarchaeal population dynamicsexamined with high resolution with remote in situ instrumentation. ISME J. 6,513–523. doi: 10.1038/ismej.2011.127
Sahm, K., and Berninger, U. (1998). Abundance, vertical distribution, and com-munity structure of benthic prokaryotes from permanently cold marinesediments (Svalbard, Arctic Ocean). Mar. Ecol. Prog. Ser. 165, 71–80. doi:10.3354/meps165071
Sakshaug, E., Johnsen, G., Kristiansen, S., von Quillfeldt, C., Slagstad, D., andThingstad, F. (2009). “Phytoplankton and primary production” in EcosystemBarents Sea. eds E. Sakshaug, G. Johnsen, and K. Kovacs (Trondheim: TapirAcademic Press), 33–64.
Sapp, M., Parker, E. R., Teal, L. R., and Schratzberger, M. (2010). Advancing theunderstanding of biogeography-diversity relationships of benthic microorgan-isms in the North Sea. FEMS Microbiol. Ecol. 74, 410–429. doi: 10.1111/j.1574-6941.2010.00957.x
Schauer, R., Bienhold, C., Ramette, A., and Harder, J. (2010). Bacterial diversity andbiogeography in deep-sea surface sediments of the South Atlantic Ocean. ISMEJ. 4, 159–170. doi: 10.1038/ismej.2009.106
Schleper, C., and Nicol, G. W. (2010). Ammonia-oxidising archaea – physiology,ecology and evolution. Adv. Microb. Physiol. 57, 1–41. doi: 10.1016/B978-0-12-381045-8.00001-1
Sloan, W. T., Lunn, M., Woodcock, S., Head, I. M., Nee, S., and Curtis, T. P.(2006). Quantifying the roles of immigration and chance in shaping prokaryotecommunity structure. Environ. Microbiol. 8, 732–740. doi: 10.1111/j.1462-2920.2005.00956.x
Suess, E. (1980). Particulate organic carbon flux in the ocean-surface productivityand oxygen utilization. Nature 288, 260–263.
Teske, A., Durbin, A., Ziervogel, K., Cox, C., and Arnosti, C. (2011). Microbial com-munity composition and function in permanently cold seawater and sedimentsfrom an Arctic fjord of Svalbard. Appl. Environ. Microbiol. 77, 2008–2018. doi:10.1128/AEM.01507-10
Torsvik, V., Sørheim, R., and Goksøyr, J. (1996). Total bacterial diversity in soil andsediment communities – a review. J. Ind. Microbiol. 17, 170–178.
Vavrek, M. J. (2011). Fossil: palaeoecological and palaeogeographi-cal analysis tools. Palaeontol. Electron. 14, 1T. Available online at:http://www.uv.es/pardomv/pe/2011_1/238/238.pdf
Vetrov, A., and Romankevich, E. (2004). “The Barents Sea: distribution, sources,variability and burial of organic carbon,” in The Organic Carbon Cycle in theArctic Ocean, eds R. Stein, and R. W. Macdonald (Berlin: Springer Press),266–278.
Wang, J., Shen, J., Wu, Y., Tu, C., Soininen, J., Stegen, J. C., et al.(2013). Phylogenetic beta diversity in bacterial assemblages across ecosys-tems: deterministic versus stochastic processes. ISME J. 7, 1310–1321. doi:10.1038/ismej.2013.30
Wang, Y., Naumann, U., Wright, S. T., and Warton, D. I. (2012). mvabund:an R package for model-based analysis of multivariate abundancedata. Methods Ecol. Evol. 3, 471–474. doi: 10.1111/j.2041-210X.2012.00190.x
Warton, D. I., Wright, S. T., and Wang, Y. (2012). Distance-based multivariate anal-yses confound location and dispersion effects. Methods Ecol. Evol. 3, 89–101. doi:10.1111/j.2041-210X.2011.00127.x
Wietz, M., Gram, L., Jørgensen, B., and Schramm, A. (2010).Latitudinal patterns in the abundance of major marine bacterio-plankton groups. Aquat. Microb. Ecol. 61, 179–189. doi: 10.3354/ame01443
Wu, L., Liu, X., Schadt, C. W., and Zhou, J. (2008). Microarray-based analysisof subnanogram quantities of microbial community DNAs by using whole-community genome amplification. Appl. Environ. Microbiol. 72, 4931–4941. doi:10.1128/AEM.02738-05
Youssef, N., Sheik, C. S., Krumholz, L. R., Najar, F. Z., Roe, B. A.,and Elshahed, M. S. (2009). Comparison of species richness esti-mates obtained using nearly complete fragments and simulatedpyrosequencing-generated fragments in 16S rRNA gene-based environ-mental surveys. Appl. Environ. Microbiol. 75, 5227–5236. doi: 10.1128/AEM.00592-09
Zhang, R., Liu, B., Lau, S. C., Ki, J.-S., and Qian, P.-Y. (2007). Particle-attached andfree-living bacterial communities in a contrasting marine environment: VictoriaHarbor, Hong Kong. FEMS Microbiol. Ecol. 61, 496–508. doi: 10.1111/j.1574-6941.2007.00353.x
Zinger, L., Amaral-Zettler, L. A., Fuhrman, J. A., Horner-Devine, M. C., Huse,S. M., Welch, D. B., et al. (2011). Global patterns of bacterial beta-diversityin seafloor and seawater ecosystems. PLoS ONE 6:e24570. doi: 10.1371/jour-nal.pone.0024570
Zinger, L., Boetius, A., and Ramette, A. (2014). Bacterial taxa-area and distance-decay relationships in marine environments. Mol. Ecol. 23, 954–964. doi:10.1111/mec.12640
www.frontiersin.org January 2015 | Volume 6 | Article 17 | 11

Nguyen and Landfald Prokaryotic diversity in marine sediment
Conflict of Interest Statement: The authors declare that the research was con-ducted in the absence of any commercial or financial relationships that could beconstrued as a potential conflict of interest.
Received: 27 August 2014; accepted: 07 January 2015; published online: 23 January2015.Citation: Nguyen TT and Landfald B (2015) Polar front associated variation inprokaryotic community structure in Arctic shelf seafloor. Front. Microbiol. 6:17. doi:10.3389/fmicb.2015.00017
This article was submitted to Aquatic Microbiology, a section of the journal Frontiersin Microbiology.Copyright © 2015 Nguyen and Landfald. This is an open-access article dis-tributed under the terms of the Creative Commons Attribution License (CC BY).The use, distribution or reproduction in other forums is permitted, providedthe original author(s) or licensor are credited and that the original publica-tion in this journal is cited, in accordance with accepted academic practice. Nouse, distribution or reproduction is permitted which does not comply with theseterms.
Frontiers in Microbiology | Aquatic Microbiology January 2015 | Volume 6 | Article 17 | 12